Recently Published Bulletin Reports
Agung (Indonesia) Three eruptive events reported in April, May, and December 2022
Tengger Caldera (Indonesia) Minor ash emission in December 2023; persistent weak thermal anomaly in the Bromo crater
Saunders (United Kingdom) Persistent thermal anomalies from the summit crater lava lake during February 2023-January 2024
Shishaldin (United States) New eruption with significant Strombolian explosions, ash plumes, and ashfall
Ioto (Japan) New eruption with discolored water, ejecta, and floating pumice during October-December 2023
Purace (Colombia) Gas-and-ash emission on 16 November 2023
Etna (Italy) Strombolian explosions, lava fountains, and lava flows during July-August 2023
Suwanosejima (Japan) Eruption plumes, crater incandescence, and occasional explosions during July-October 2023
Aira (Japan) Explosions, ash plumes, ash fall, and crater incandescence during July-October 2023
Nishinoshima (Japan) Gray emissions during October 2023
Kilauea (United States) Strong lava fountains, lava flows, and spatter at Halema’uma’u during January-September 2023
Tinakula (Solomon Islands) Continued lava flows and thermal activity during June through November 2023
Agung (Indonesia) — January 2024  Cite this Report
Agung
Indonesia
8.343°S, 115.508°E; summit elev. 2997 m
All times are local (unless otherwise noted)
Three eruptive events reported in April, May, and December 2022
Mount Agung, located on the E end of the island of Bali, Indonesia, rises above the SE rim of the Batur caldera. The summit area extends 1.5 km E-W, with the highest point on the W and a steep-walled 800-m-wide crater on the E. Recorded eruptions date back to the early 19th century. A large and deadly explosive and effusive eruption occurred during 1963-64, which was characterized by voluminous ashfall, pyroclastic flows, and lahars that caused extensive damage and many fatalities. More recent activity was documented during November 2017-June 2019 that consisted of multiple explosions, significant ash plumes, lava flows at the summit crater, and incandescent ejecta. This report covers activity reported during April-May 2022 and December 2022 based on data from the Darwin Volcanic Ash Advisory Center (VAAC).
Activity during 2022 was relatively low and mainly consisted of a few ash plumes during April-May and December. An ash plume on 3 April rising to 3.7 km altitude (700 m above the summit) and drifting N was reported in a Darwin VAAC notice based on a ground report, with ash seen in HIMAWARI-8 visible imagery. Another ash plume was reported at 1120 on 27 May that rose to 5.5 km altitude (2.5 m above the summit); the plume was not visible in satellite or webcam images due to weather clouds. An eruption was reported based on seismic data at 0840 on 13 December, with an estimated plume altitude of 3.7 km; however, no ash was seen using satellite imagery in clear conditions before weather clouds obscured the summit.
Geologic Background. Symmetrical Agung stratovolcano, Bali's highest and most sacred mountain, towers over the eastern end of the island. The volcano, whose name means "Paramount," rises above the SE rim of the Batur caldera, and the northern and southern flanks extend to the coast. The summit area extends 1.5 km E-W, with the high point on the W and a steep-walled 800-m-wide crater on the E. The Pawon cone is located low on the SE flank. Only a few eruptions dating back to the early 19th century have been recorded in historical time. The 1963-64 eruption, one of the largest in the 20th century, produced voluminous ashfall along with devastating pyroclastic flows and lahars that caused extensive damage and many fatalities.
Information Contacts: Darwin Volcanic Ash Advisory Centre (VAAC), Bureau of Meteorology, Northern Territory Regional Office, PO Box 40050, Casuarina, NT 0811, Australia (URL: http://www.bom.gov.au/info/vaac/).
Tengger Caldera (Indonesia) — February 2024 Cite this Report
Tengger Caldera
Indonesia
7.942°S, 112.95°E; summit elev. 2329 m
All times are local (unless otherwise noted)
Minor ash emission in December 2023; persistent weak thermal anomaly in the Bromo crater
Tengger Caldera, located at the N end of a volcanic massif in Indonesia’s East Java, consists of five overlapping stratovolcanoes. The youngest and only active cone in the 16-km-wide caldera is Bromo, which typically produces gas-and-steam plumes, occasional ash plumes and explosions, and weak thermal signals (BGVN 44:05, 47:01). This report covers activity during January 2022-December 2023, consisting of mostly white gas-and-steam emissions and persistent weak thermal anomalies. Information was provided by the Pusat Vulkanologi dan Mitigasi Bencana Geologi (PVMBG, also known as Indonesian Center for Volcanology and Geological Hazard Mitigation, CVGHM) and satellite imagery. The Alert Level remained at 2 (on a scale of 1-4), and visitors were warned to stay at least 1 km from the crater.
Activity was generally low during the reporting period, similar to that in 2021. According to almost daily images from MAGMA Indonesia (a platform developed by PVMBG), white emissions and plumes rose from 50 to 900 m above the main crater during this period (figure 24). During several days in March and June 2022, white plumes reached heights of 1-1.2 km above the crater.
After an increase in activity at 2114 on 3 February 2023, a PVMBG team that was sent to observe white emissions rising as high as 300 m during 9-12 February and heard rumbling noises. A sulfur dioxide odor was also strong near the crater and measurements indicated that levels were above the healthy (non-hazardous) threshold of 5 parts per million; differential optical absorption spectroscopy (DOAS) measurements indicated an average flux of 190 metric tons per day on 11 February. Incandescence originating from a large fumarole in the NNW part of the crater was visible at night. The team observed that vegetation on the E caldera wall was yellow and withered. The seismic network recorded continuous tremor and deep and shallow volcanic earthquakes.
According to a PVMBG press release, activity increased on 13 December 2023 with white, gray, and brown emissions rising as high as 900 m above Bromo’s crater rim and drifting in multiple directions (figure 25). The report noted that tremor was continuous and was accompanied in December by three volcanic earthquakes. Deformation data indicated inflation in December. There was no observable difference in the persistent thermal anomaly in the crater between 11 and 16 December 2023.
All clear views of the Bromo crater throughout this time, using Sentinel-2 infrared satellite images, showed a weak persistent thermal anomaly; none of the anomalies were strong enough to cause MODVOLC Thermal Alerts. A fire in the SE part of the caldera in early September 2023 resulted in a brief period of strong thermal anomalies.
Geologic Background. The 16-km-wide Tengger caldera is located at the northern end of a volcanic massif extending from Semeru volcano. The massive volcanic complex dates back to about 820,000 years ago and consists of five overlapping stratovolcanoes, each truncated by a caldera. Lava domes, pyroclastic cones, and a maar occupy the flanks of the massif. The Ngadisari caldera at the NE end of the complex formed about 150,000 years ago and is now drained through the Sapikerep valley. The most recent of the calderas is the 9 x 10 km wide Sandsea caldera at the SW end of the complex, which formed incrementally during the late Pleistocene and early Holocene. An overlapping cluster of post-caldera cones was constructed on the floor of the Sandsea caldera within the past several thousand years. The youngest of these is Bromo, one of Java's most active and most frequently visited volcanoes.
Information Contacts: Pusat Vulkanologi dan Mitigasi Bencana Geologi (PVMBG, also known as Indonesian Center for Volcanology and Geological Hazard Mitigation, CVGHM), Jalan Diponegoro 57, Bandung 40122, Indonesia (URL: http://www.vsi.esdm.go.id/); MAGMA Indonesia, Kementerian Energi dan Sumber Daya Mineral (URL: https://magma.esdm.go.id/v1); Copernicus Browser, Copernicus Data Space Ecosystem, European Space Agency (URL: https://dataspace.copernicus.eu/browser/); Hawai'i Institute of Geophysics and Planetology (HIGP) - MODVOLC Thermal Alerts System, School of Ocean and Earth Science and Technology (SOEST), Univ. of Hawai'i, 2525 Correa Road, Honolulu, HI 96822, USA (URL: http://modis.higp.hawaii.edu/).
Saunders (United Kingdom) — February 2024 Cite this Report
Saunders
United Kingdom
57.8°S, 26.483°W; summit elev. 843 m
All times are local (unless otherwise noted)
Persistent thermal anomalies from the summit crater lava lake during February 2023-January 2024
Saunders is one of eleven islands that comprise the South Sandwich Islands in the South Atlantic. The active Mount Michael volcano has been in almost continuous eruption since November 2014 (BGVN 48:02). Recent activity has resulted in intermittent thermal anomalies and gas-and-steam emissions (BGVN 47:03, 48:02). Visits are infrequent due to its remote location, and cloud cover often prevents satellite observations. Satellite thermal imagery and visual observation of incandescence during a research expedition in 2019 (BGVN 28:02 and 44:08) and a finding confirmed by a National Geographic Society research team that summited Michael in November 2022 reported the presence of a lava lake.
Although nearly constant cloud cover during February 2023 through January 2024 greatly limited satellite observations, thermal anomalies from the lava lake in the summit crater were detected on clear days, especially around 20-23 August 2023. Anomalies similar to previous years (eg. BGVN 48:02) were seen in both MIROVA (Middle InfraRed Observation of Volcanic Activity) data from MODIS instruments and in Sentinel 2 infrared imagery. The only notable sulfur dioxide plume detected near Saunders was on 25 September 2023, with the TROPOMI instrument aboard the Sentinel-5P satellite.
Geologic Background. Saunders Island consists of a large central volcanic edifice intersected by two seamount chains, as shown by bathymetric mapping (Leat et al., 2013). The young Mount Michael stratovolcano dominates the glacier-covered island, while two submarine plateaus, Harpers Bank and Saunders Bank, extend north. The symmetrical Michael has a 500-m-wide summit crater and a remnant of a somma rim to the SE. Tephra layers visible in ice cliffs surrounding the island are evidence of recent eruptions. Ash clouds were reported from the summit crater in 1819, and an effusive eruption was inferred to have occurred from a N-flank fissure around the end of the 19th century and beginning of the 20th century. A low ice-free lava platform, Blackstone Plain, is located on the north coast, surrounding a group of former sea stacks. A cluster of cones on the SE flank, the Ashen Hills, appear to have been modified since 1820 (LeMasurier and Thomson, 1990). Analysis of satellite imagery available since 1989 (Gray et al., 2019; MODVOLC) suggests frequent eruptive activity (when weather conditions allow), volcanic clouds, steam plumes, and thermal anomalies indicative of a persistent, or at least frequently active, lava lake in the summit crater. Due to this observational bias, there has been a presumption when defining eruptive periods that activity has been ongoing unless there is no evidence for at least 10 months.
Information Contacts: MIROVA (Middle InfraRed Observation of Volcanic Activity), a collaborative project between the Universities of Turin and Florence (Italy) supported by the Centre for Volcanic Risk of the Italian Civil Protection Department (URL: http://www.mirovaweb.it/); NASA Global Sulfur Dioxide Monitoring Page, Atmospheric Chemistry and Dynamics Laboratory, NASA Goddard Space Flight Center (NASA/GSFC), 8800 Greenbelt Road, Goddard MD 20771, USA (URL: https://so2.gsfc.nasa.gov/); Copernicus Browser (URL: https://dataspace.copernicus.eu/browser).
Shishaldin (United States) — December 2023 Cite this Report
Shishaldin
United States
54.756°N, 163.97°W; summit elev. 2857 m
All times are local (unless otherwise noted)
New eruption with significant Strombolian explosions, ash plumes, and ashfall
Shishaldin is located on the eastern half of Unimak Island, one of the Aleutian Islands. Frequent explosive activity, primarily consisting of Strombolian ash eruptions from the small summit crater, but sometimes producing lava flows, has been recorded since the 18th century. The previous eruption ended in May 2020 and was characterized by intermittent thermal activity, increased seismicity and surface temperatures, ash plumes, and ash deposits (BGVN 45:06). This report covers a new eruption during July through November 2023, which consisted of significant explosions, ash plumes, ashfall, and lava fountaining. Information comes from daily, weekly, and special reports from the Alaska Volcano Observatory (AVO) and various satellite data. AVO monitors the volcano using local seismic and infrasound sensors, satellite data, web cameras, and remote infrasound and lightning networks.
AVO reported that intermittent tremor and low-frequency earthquakes had gradually become more regular and consistent during 10-13 July. Strongly elevated surface temperatures at the summit were identified in satellite images during 10-13 July. On 11 July AVO raised the Aviation Color Code (ACC) to Yellow (the second color on a four-color scale) and Volcano Alert Level (VAL) to Advisory (the second level on a four-level scale) at 1439. Later in the day on 11 July summit crater incandescence was observed in webcam images. Observations of the summit suggested that lava was likely present at the crater, which prompted AVO to raise the ACC to Orange (the second highest color on a four-color scale) and the VAL to Watch (the second highest level on a four-level scale). The US Coast Guard conducted an overflight on 12 July and confirmed that lava was erupting from the summit. That same day, sulfur dioxide emissions were detected in satellite images.
A significant explosion began at 0109 on 14 July that produced an ash plume that rose to 9-12 km altitude and drifted S over the Pacific Ocean (figure 43). Webcam images and photos taken around 0700 from a ship SW off Unimak Island showed small lahar deposits, which were the result of the interaction of hot pyroclastic material and snow and ice on the flanks. There was also ashfall on the SW and N flanks. A smaller explosion at 0710 generated an ash plume that rose to 4.5 km altitude. Webcam images and pilot reports showed continued low-level ash emissions during the morning, rising to less than 4.6 km altitude; those emissions included a small ash plume near the summit around 1030 resulting from a small explosion.
Seismic tremor amplitude began increasing at around 1700 on 15 July; strongly elevated surface temperatures were also reported. An ash plume rose to 4.6 km altitude and drifted SSE at 2100, based on a satellite image. A continuous ash plume during 2150 through 2330 rose to 5 km altitude and extended 125 km S. At 2357 AVO raised the ACC to Red (the highest color on a four-color scale) and the VAL to Warning (the highest level on a four-level scale), noting that seismicity remained elevated for more than six hours and explosion signals were frequently detected by regional infrasound (pressure sensor) networks. Explosions generated an ash plume that rose to 4.9 km altitude and drifted as far as 500 km SE. Activity throughout the night declined and by 0735 the ACC was lowered to Orange and the VAL to Watch. High-resolution satellite images taken on 16 July showed pyroclastic deposits extending as far as 3 km from the vent; these deposits generated lahars that extended further down the drainages on the flanks. Ash deposits were mainly observed on the SSE flank and extended to the shore of Unimak Island. During 16-17 July lava continued to erupt at the summit, which caused strongly elevated surface temperatures that were visible in satellite imagery.
Lava effusion increased at 0100 on 18 July, as noted in elevated surface temperatures identified in satellite data, increasing seismic tremor, and activity detected on regional infrasound arrays. A significant ash plume at 0700 rose to 7 km altitude and continued until 0830, eventually reaching 9.1 km altitude and drifting SSE (figure 44). As a result, the ACC was raised to Red and the VAL to Warning. By 0930 the main plume detached, but residual low-level ash emissions continued for several hours, remaining below 3 km altitude and drifting S. The eruption gradually declined and by 1208 the ACC was lowered to Orange and the VAL was lowered to Watch. High-resolution satellite images showed ash deposits on the SW flank and pyroclastic deposits on the N, E, and S flanks, extending as far as 3 km from the vent; lahars triggered by the eruption extended farther down the flanks (figure 45). Lava continued to erupt from the summit crater on 19 July.
Elevated surface temperatures were detected in satellite images during 19-25 July, despite occasional weather cloud cover, which was consistent with increased lava effusion. During 22-23 July satellite observations acquired after the eruption from 18 July showed pyroclastic flow and lahar deposits extending as far as 3 km down the N, NW, and NE flanks and as far as 1.5 km down the S and SE flanks. Ash deposits covered the SW and NE flanks. No lava flows were observed outside the crater. On 22 July a sulfur dioxide plume was detected in satellite data midday that had an estimated mass of 10 kt. In a special notice issued at 1653 on 22 July AVO noted that eruptive activity had intensified over the previous six hours, which was characterized by an hours-long steady increase in seismic tremor, intermittent infrasound signals consistent with small explosions, and an increase in surface temperatures that were visible in satellite data. Pilots first reported low-level ash plumes at around 1900. At 2320 an ash plume had risen to 9 km altitude based on additional pilot reports and satellite images. The ACC was increased to Red and the VAL to Warning at 2343. Satellite images indicated growth of a significantly higher ash plume that rose to 11 km altitude continued until 0030 and drifted NE. During the early morning hours of 23 July ash plumes had declined to 4.6 k altitude. Seismic tremor peaked at 0030 on 23 July and began to rapidly decline at 0109; active ash emissions were no longer visible in satellite data by 0130. The ACC was lowered to Orange and the VAL to Watch at 0418; bursts of increased seismicity were recorded throughout the morning, but seismicity generally remained at low levels. Elevated surface temperatures were visible in satellite data until about 0600. On 24 July pilots reported seeing vigorous gas-and-steam plumes rising to about 3 km altitude; the plumes may have contained minor amounts of ash.
During 24-25 July low level seismicity and volcanic tremor were detected at low levels following the previous explosion on 23 July. Strongly elevated surface temperatures were observed at the summit crater in satellite data. Around 2200 on 25 July seismicity began to increase, followed by infrasound signals of explosions after 0200 on 26 July. An ash plume rose to 3 km altitude at 0500 and drifted ENE, along with an associated sulfur dioxide plume that drifted NE and had an estimated mass of 22 kt. Diffuse ash emissions were visible in satellite data and rose to 6.1-7.6 km altitude and extended 125 km from the volcano starting around 1130. These ash events were preceded by about seven hours of seismic tremor, infrasound detections of explosions, and five hours of increased surface temperatures visible in satellite data. Activity began to decline around 1327, which included low-frequency earthquakes and decreased volcanic tremor, and infrasound data no longer detected significant explosions. Surface temperatures remained elevated through the end of the month.
Seismicity, volcanic tremor, and ash emissions remained at low levels during early August. Satellite images on 1 August showed that some slumping had occurred on the E crater wall due to the recent explosive activity. Elevated surface temperatures continued, which was consistent with cooling lava. On 2 August small explosive events were detected, consistent with low-level Strombolian activity. Some episodes of volcanic tremor were reported, which reflected low-level ash emissions. Those ash emissions rose to less than 3 km altitude and drifted as far as 92.6 km N. Pilots that were located N of the volcano observed an ash plume that rose to 2.7 km altitude. Seismicity began to increase in intensity around 0900 on 3 August. Seismicity continued to increase throughout the day and through the night with strongly elevated surface temperatures, which suggested that lava was active at the surface.
An ash cloud that rose to 7.6-7.9 km altitude and drifted 60-75 km NE was visible in a satellite image at 0520 on 4 August. Pilots saw and reported the plume at 0836 (figure 46). By 0900 the plume had risen to 9.1 km altitude and extended over 100 km NE. AVO raised the ACC to Red and the VAL to Warning as a result. Seismic tremor levels peaked at 1400 and then sharply declined at 1500 to slightly elevated levels; the plume was sustained during the period of high tremor and drifted N and NE. The ACC was lowered to Orange and the VAL to Watch at 2055. During 5-14 August seismicity remained low and surface temperatures were elevated based on satellite data due to cooling lava. On 9 August a small lava flow was observed that extended from the crater rim to the upper NE flank. It had advanced to 55 m in length and appeared in satellite imagery on 11 August. Occasional gas-and-steam plumes were noted in webcam images. At 1827 AVO noted that seismic tremor had steadily increased during the afternoon and erupting lava was visible at the summit in satellite images.
Strong explosion signals were detected at 0200 on 15 August. An ash cloud that was visible in satellite data extended 100 km NE and may have risen as high as 11 km altitude around 0240. By 0335 satellite images showed the ash cloud rising to 7.6 km altitude and drifting NE. Significant seismicity and explosions were detected by the local AVO seismic and infrasound networks, and volcanic lightning was detected by the World Wide Lightning Location Network (WWLLN). A sulfur dioxide plume associated with the eruption drifted over the S Bering Sea and parts of Alaska and western Canada. Seismicity was significantly elevated during the eruption but had declined by 1322. A pilot reported that ash emissions continued, rising as high as 4.9 km altitude. Elevated surface temperatures detected in satellite data were caused by hot, eruptive material (pyroclastic debris and lava) that accumulated around the summit. Eruptive activity declined by 16 August and the associated sulfur dioxide plume had mostly dissipated; remnants continued to be identified in satellite images at least through 18 August. Surface temperatures remained elevated based on satellite images, indicating hot material on the upper parts of the volcano. Small explosions were detected in infrasound data on the morning of 19 August and were consistent with pilot reports of small, short-lived ash plumes that rose to about 4.3 km altitude. Low-level explosive activity was reported during 20-24 August, according to seismic and infrasound data, and weather clouds sometimes prevented views. Elevated surface temperatures were observed in satellite images, which indicated continued hot material on the upper parts of the volcano.
Seismic tremor began to increase at around 0300 on 25 August and was followed by elevated surface temperatures identified in satellite images, consistent with erupting lava. Small explosions were recorded in infrasound data. The ACC was raised to Red and the VAL to Warning at 1204 after a pilot reported an ash plume that rose to 9.1 km altitude. Seismicity peaked at 1630 and began to rapidly decline at around 1730. Ash plumes rose as high as 10 km altitude and drifted as far as 400 km NE. By 2020 the ash plumes had declined to 6.4 km altitude and continued to drift NE. Ash emissions were visible in satellite data until 0000 on 26 August and seismicity was at low levels. AVO lowered the ACC to Orange and the VAL to Watch at 0030. Minor explosive activity within the summit crater was detected during 26-28 August and strongly elevated surface temperatures were still visible in satellite imagery through the rest of the month. An AVO field crew working on Unimak Island observed a mass flow that descended the upper flanks beginning around 1720 on 27 August. The flow produced a short-lived ash cloud that rose to 4.5 km altitude and rapidly dissipated. The mass flow was likely caused by the collapse of spatter that accumulated on the summit crater rim.
Similar variable explosive activity was reported in September, although weather observations sometimes prevented observations. A moderate resolution satellite image from the afternoon of 1 September showed gas-and-steam emissions filling the summit crater and obscuring views of the vent. In addition, hot deposits from the previous 25-26 August explosive event were visible on the NE flank near the summit, based on a 1 September satellite image. On 2 and 4 September seismic and infrasound data showed signals of small, repetitive explosions. Variable gas-and-steam emissions from the summit were visible but there was no evidence of ash. Possible summit crater incandescence was visible in nighttime webcam images during 3-4 September.
Seismicity began to gradually increase at around 0300 on 5 September and activity escalated at around 0830. A pilot reported an ash plume that rose to 7.6 km altitude at 0842 and continued to rise as high as possibly 9.7 km altitude and drifted SSE based on satellite images (figure 47). The ACC was raised to Red and the VAL to Warning at 0900. In addition to strong tremor and sustained explosions, the eruption produced volcanic lightning that was detected by the WWLLN. Around 1100 seismicity decreased and satellite data confirmed that the altitude of the ash emissions had declined to 7.6 km altitude. By 1200 the lower-altitude portion of the ash plume had drifted 125 km E. Significant ash emissions ended by 1330 based on webcam images. The ACC was lowered to Orange and the VAL to Watch at 1440. Satellite images showed extensive pyroclastic debris flows on most of the flanks that extended 1.2-3.3 km from the crater rim.
During 6-13 September elevated surface temperatures continued to be observed in satellite data, seismicity remained elevated with weak but steady tremor, and small, low-frequency earthquakes and small explosions were reported, except on 12 September. On 6 September a low-level ash plume rose to 1.5-1.8 km altitude and drifted SSE. Occasional small and diffuse gas-and-steam emissions at the summit were visible in webcam images. Around 1800 on 13 September seismic tremor amplitudes began to increase, and small explosions were detected in seismic and infrasound data. Incandescent lava at the summit was seen in a webcam image taken at 0134 on 14 September during a period of elevated tremor. No ash emissions were reported during the period of elevated seismicity. Lava fountaining began around 0200, based on webcam images. Satellite-based radar observations showed that the lava fountaining activity led to the growth of a cone in the summit crater, which refilled most of the crater. By 0730 seismicity significantly declined and remained at low levels.
Seismic tremor began to increase around 0900 on 15 September and rapidly intensified. An explosive eruption began at around 1710, which prompted AVO to raise the ACC to Red and the VAL to Warning. Within about 30 minutes ash plumes drifted E below a weather cloud at 8.2 km altitude. The National Weather Service estimated that an ash-rich plume rose as high as 12.8 km altitude and produced volcanic lightning. The upper part of the ash plume detached from the vent around 1830 and drifted E, and was observed over the Gulf of Alaska. Around the same time, seismicity dramatically decreased. Trace ashfall was reported in the community of False Pass (38 km ENE) between 1800-2030 and also in King Cove and nearby marine waters. Activity declined at around 1830 although seismicity remained elevated, ash emissions, and ashfall continued until 2100. Lightning was again detected beginning around 1930, which suggested that ash emissions continued. Ongoing explosions were detected in infrasound data, at a lower level than during the most energetic phase of this event. Lightning was last detected at 2048. By 2124 the intensity of the eruption had decreased, and ash emissions were likely rising to less than 6.7 km altitude. Seismicity returned to pre-eruption levels. On 16 September the ACC was lowered to Orange and the VAL to Watch at 1244; the sulfur dioxide plume that was emitted from the previous eruption event was still visible over the northern Pacific Ocean. Elevated surface temperatures, gas-and-steam emissions from the vent, and new, small lahars were reported on the upper flanks based on satellite and webcam images. Minor deposits were reported on the flanks which were likely the result of collapse of previously accumulated lava near the summit crater.
Elevated seismicity with tremor, small earthquakes, and elevated surface temperatures were detected during 17-23 September. Minor gas-and-steam emissions were visible in webcam images. On 20 September small volcanic debris flows were reported on the upper flanks. On 21 September a small ash deposit was observed on the upper flanks extending to the NE based on webcam images. Seismic tremor increased significantly during 22-23 September. Regional infrasound sensors suggested that low-level eruptive activity was occurring within the summit crater by around 1800 on 23 September. Even though seismicity was at high levels, strongly elevated surface temperatures indicating lava at the surface were absent and no ash emissions were detected; weather clouds at 0.6-4.6 km altitude obscured views. At 0025 on 24 September AVO noted that seismicity continued at high levels and nearly continuous small infrasound signals began, likely from low-level eruptive activity. Strongly elevated surface temperatures were identified in satellite images by 0900 and persisted throughout the day; the higher temperatures along with infrasound and seismic data were consistent with lava erupting at the summit. Around 1700 similarly elevated surface temperatures were detected from the summit in satellite data, which suggested that more vigorous lava fountaining had started. Starting around 1800 low-level ash emissions rose to altitudes less than 4.6 km altitude and quickly dissipated.
Beginning at midnight on 25 September, a series of seismic signals consistent with volcanic flows were recorded on the N side of the volcano. A change in seismicity and infrasound signals occurred around 0535 and at 0540 a significant ash cloud formed and quickly reached 14 km altitude and drifted E along the Alaska Peninsula. The cloud generated at least 150 lightning strokes with thunder that could be heard by people in False Pass. Seismicity rapidly declined to near background levels around 0600. AVO increased the ACC to Red and the VAL to Warning at 0602. The ash cloud detached from the volcano at around 0700, rose to 11.6 km altitude, and drifted ESE. Trace to minor amounts of ashfall were reported by the communities of False Pass, King Cove, Cold Bay, and Sand Point around 0700. Ash emissions continued at lower altitudes of 6-7.6 km altitude at 0820. Small explosions at the vent area continued to be detected in infrasound data and likely represented low-level eruptive activity near the vent. Due to the significant decrease in seismicity and ash emissions the ACC was lowered to Orange and the VAL to Watch at 1234. Radar data showed significant collapses of the crater that occurred on 25 September. Satellite data also showed significant hot, degassing pyroclastic and lahar deposits on all flanks, including more extensive flows on the ENE and WSW sections below two new collapse scarps. Following the significant activity during 24-25 September, only low-level activity was observed. Seismicity decreased notably near the end of the strong activity on 25 September and continued to decrease through the end of the month, though tremor and small earthquakes were still reported. No explosive activity was detected in infrasound data through 2 October. Gas-and-steam emissions rose to 3.7 km altitude, as reported by pilots and seen in satellite images. Satellite data from 26 September showed that significant collapses had occurred at the summit crater and hot, steaming deposits from pyroclastic flows and lahars were present on all the flanks, particularly to the ENE and WSW. A small ash cloud was visible in webcam images on 27 September, likely from a collapse at the summit cone. High elevated surface temperatures were observed in satellite imagery during 27-28 September, which were likely the result of hot deposits on the flanks erupted on 25 September. Minor steaming at the summit crater and from an area on the upper flanks was visible in webcam images on 28 September.
During October, explosion events continued between periods of low activity. Seismicity significantly increased starting at around 2100 on 2 October; around the same time satellite images showed an increase in surface temperatures consistent with lava fountaining. Small, hot avalanches of rock and lava descended an unspecified flank. In addition, a distinct increase in infrasound, seismicity, and lightning detections was followed by an ash plume that rose to 12.2 km altitude and drifted S and E at 0520 on 3 October, based on satellite images. Nighttime webcam images showed incandescence due to lava fountaining at the summit and pyroclastic flows descending the NE flank. AVO reported that a notable explosive eruption started at 0547 and lasted until 0900 on 3 October, which prompted a rise in the ACC to Red and the VAL to Warning. Subsequent ash plumes rose to 6-7.6 km altitude by 0931. At 1036 the ACC was lowered back to Orange and the VAL to Watch since both seismic and infrasound data quieted substantially and were slightly above background levels. Gas-and-steam emissions were observed at the summit, based on webcam images. Trace amounts of ashfall were observed in Cold Bay. Resuspended ash was present at several kilometers altitude near the volcano. During the afternoon, low-level ash plumes were visible at the flanks, which appeared to be largely generated by rock avalanches off the summit crater following the explosive activity. These ash plumes rose to 3 km altitude and drifted W. Trace amounts of ashfall were reported by observers in Cold Bay and Unalaska and flights to these communities were disrupted by the ash cloud. Satellite images taken after the eruption showed evidence of pyroclastic flows and lahar deposits in drainages 2 km down the SW flank and about 3.2 km down the NE flank, and continued erosion of the crater rim. Small explosion craters at the end of the pyroclastic flows on the NE flank were noted for the first time, which may have resulted from gas-and-steam explosions when hot deposits interact with underlying ice.
During 4 October seismicity, including frequent small earthquakes, remained elevated, but was gradually declining. Ash plumes were produced for over eight hours until around 1400 that rose to below 3.7 km altitude. These ash plumes were primarily generated off the sides of the volcano where hot rock avalanches from the crater rim had entered drainages to the SW and NE. Two explosion craters were observed at the base of the NE deposits about 3.2 km from the crater rim. Webcam images showed the explosion craters were a source of persistent ash emissions; occasional collapse events also generated ash. Seismicity remained elevated with sulfur dioxide emissions that had a daily average of more than 1,000 tons per day, and frequent small earthquakes through the end of the month. Frequent elevated surface temperatures were identified in satellite images and gas-and-steam plumes were observed in webcam images, although weather conditions occasionally prevented clear views of the summit. Emissions were robust during 14-16 October and were likely generated by the interaction of hot material and snow and ice. During the afternoon of 21 October a strong gas-and-steam plume rose to 3-4.6 km altitude and extended 40 km WSW, based on satellite images and reports from pilots. On 31 October the ACC was lowered to Yellow and the VAL was lowered to Advisory.
Activity in November was characterized by elevated seismicity with ongoing seismic tremor and small, low-frequency earthquakes, elevated surface temperatures, and gas-and-steam emissions. There was an increase in seismic and infrasound tremor amplitudes starting at 1940 on 2 November. As a result, the ACC was again raised to Orange and the VAL was increased to Watch, although ash was not identified in satellite data. An ash cloud rose to 6.1 km altitude and drifted W according to satellite data at 2000. By 0831 on 3 November ash emissions were no longer visible in satellite images. On 6 and 9 November air pressure sensors detected signals consistent with small explosions. Small explosions were detected in infrasound data consistent with weak Strombolian activity on 19 and 21 November. Seismicity started to decrease on 21 November. On 25 November gas-and-steam emissions were emitted from the vent as well as from a scarp on the NE side of the volcano near the summit. A gas-and-steam plume extended about 50 km SSE and was observed in satellite and webcam images on 26 November. On 28 November small explosions were observed in seismic and local infrasound data and gas-and-steam emissions were visible from the summit and from the upper NE collapse scarp based on webcam images. Possible small explosions were observed in infrasound data on 30 November. Weakly elevated surface temperatures and a persistent gas-and-steam plume from the summit and collapse scarps on the upper flanks. A passing aircraft reported the gas-and-steam plume rose to 3-3.4 km altitude on 30 November, but no significant ash emissions were detected.
Satellite data. MODIS thermal anomaly data provided through MIROVA (Middle InfraRed Observation of Volcanic Activity) showed a strong pulse of thermal activity beginning in July 2023 that continued through November 2023 (figure 48). This strong activity was due to Strombolian explosions and lava fountaining events at the summit crater. According to data from MODVOLC thermal alerts, a total of 101 hotspots were detected near the summit crater in July (11-14, 16-19, 23-24 and 26), August (4, 25-26, and 29), September (5, 12, and 17), and October (3, 4, and 8). Infrared satellite data showed large lava flows descending primarily the northern and SE flanks during the reporting period (figure 49). Sulfur dioxide plumes often exceeded two Dobson Units (DUs) and drifted in different directions throughout the reporting period, based on satellite data from the TROPOMI instrument on the Sentinel-5P satellite (figure 50).
Geologic Background. The symmetrical glacier-covered Shishaldin in the Aleutian Islands is the westernmost of three large stratovolcanoes in the eastern half of Unimak Island. The Aleuts named the volcano Sisquk, meaning "mountain which points the way when I am lost." Constructed atop an older glacially dissected edifice, it is largely basaltic in composition. Remnants of an older edifice are exposed on the W and NE sides at 1,500-1,800 m elevation. There are over two dozen pyroclastic cones on its NW flank, which is covered by massive aa lava flows. Frequent explosive activity, primarily consisting of Strombolian ash eruptions from the small summit crater, but sometimes producing lava flows, has been recorded since the 18th century. A steam plume often rises from the summit crater.
Information Contacts: Alaska Volcano Observatory (AVO), a cooperative program of a) U.S. Geological Survey, 4200 University Drive, Anchorage, AK 99508-4667 USA (URL: https://avo.alaska.edu/), b) Geophysical Institute, University of Alaska, PO Box 757320, Fairbanks, AK 99775-7320, USA, and c) Alaska Division of Geological & Geophysical Surveys, 794 University Ave., Suite 200, Fairbanks, AK 99709, USA (URL: http://dggs.alaska.gov/); MIROVA (Middle InfraRed Observation of Volcanic Activity), a collaborative project between the Universities of Turin and Florence (Italy) supported by the Centre for Volcanic Risk of the Italian Civil Protection Department (URL: http://www.mirovaweb.it/); Hawai'i Institute of Geophysics and Planetology (HIGP) - MODVOLC Thermal Alerts System, School of Ocean and Earth Science and Technology (SOEST), Univ. of Hawai'i, 2525 Correa Road, Honolulu, HI 96822, USA (URL: http://modis.higp.hawaii.edu/); NASA Global Sulfur Dioxide Monitoring Page, Atmospheric Chemistry and Dynamics Laboratory, NASA Goddard Space Flight Center (NASA/GSFC), 8800 Greenbelt Road, Goddard, Maryland, USA (URL: https://so2.gsfc.nasa.gov/); Copernicus Browser, Copernicus Data Space Ecosystem, European Space Agency (URL: https://dataspace.copernicus.eu/browser/).
Ioto
Japan
24.751°N, 141.289°E; summit elev. 169 m
All times are local (unless otherwise noted)
New eruption with discolored water, ejecta, and floating pumice during October-December 2023
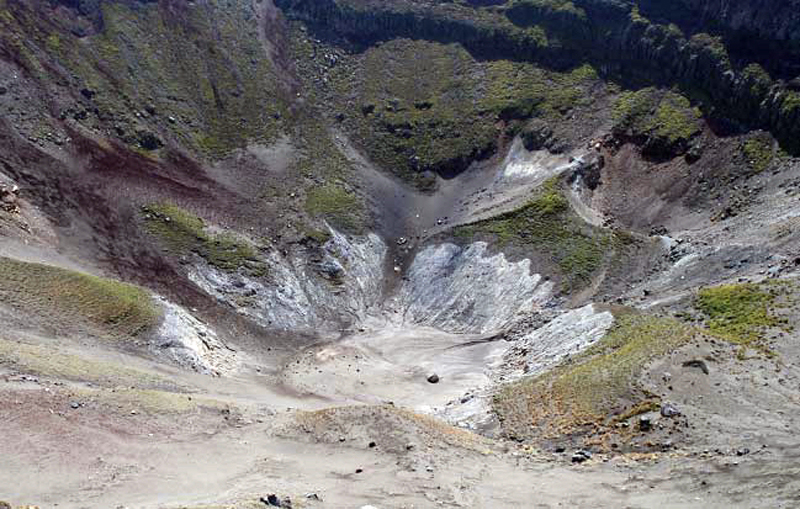
Ioto (Iwo-jima), located about 1,200 km S of Tokyo, lies within a 9-km-wide submarine caldera along the Izu-Bonin-Mariana volcanic arc. Previous eruptions date back to 1889 and have consisted of dominantly phreatic explosions, pumice deposits during 2001, and discolored water. A submarine eruption during July through December 2022 was characterized by discolored water, pumice deposits, and gas emissions (BGVN 48:01). This report covers a new eruption during October through December 2023, which consisted of explosions, black ejecta, discolored water, and floating pumice, based on information from the Japan Meteorological Association (JMA), the Japan Coast Guard (JCG), and satellite data.
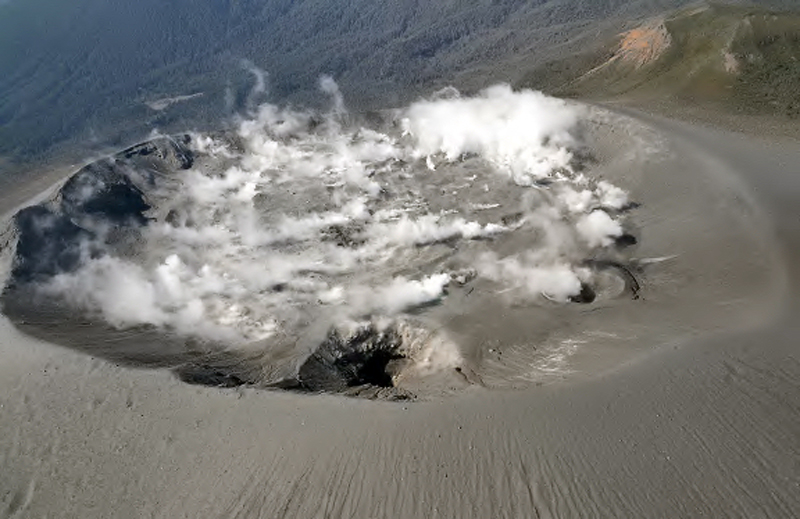
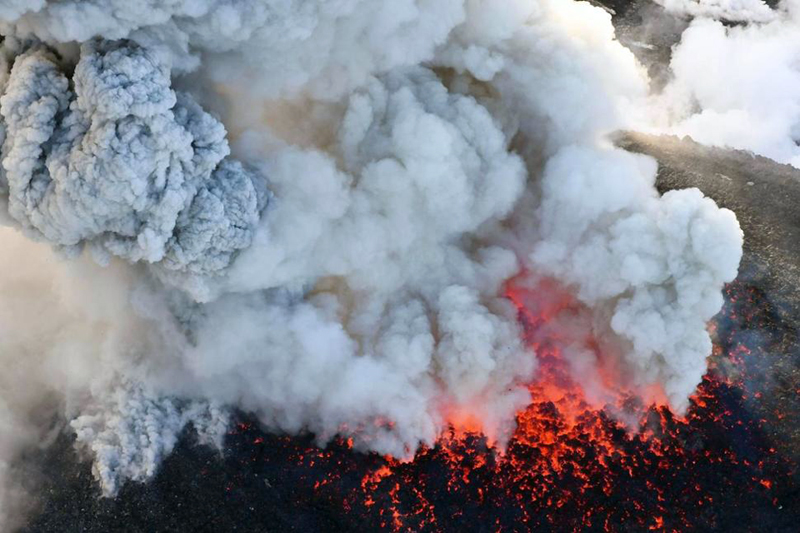
JMA reported that an eruption had been occurring offshore of Okinahama on the SE side of the island since 21 October, which was characterized by volcanic tremor, according to the Japan Maritime Self-Defense Force (JMSDF) Iwo Jima Air Base (figure 22). According to an 18 October satellite image a plume of discolored water at the site of this new eruption extended NE (figure 23). During an overflight conducted on 30 October, a vent was identified about 1 km off the coast of Okinahama. Observers recorded explosions every few minutes that ejected dark material about 20 m above the ocean and as high as 150 m. Ejecta from the vent formed a black-colored island about 100 m in diameter, according to observations conducted from the air by the Earthquake Research Institute of the University of Tokyo in cooperation with the Mainichi newspaper (figure 24). Occasionally, large boulders measuring more than several meters in size were also ejected. Observations from the Advanced Land Observing Satellite Daichi-2 and Sentinel-2 satellite images also confirmed the formation of this island (figure 23). Brown discolored water and floating pumice were present surrounding the island.
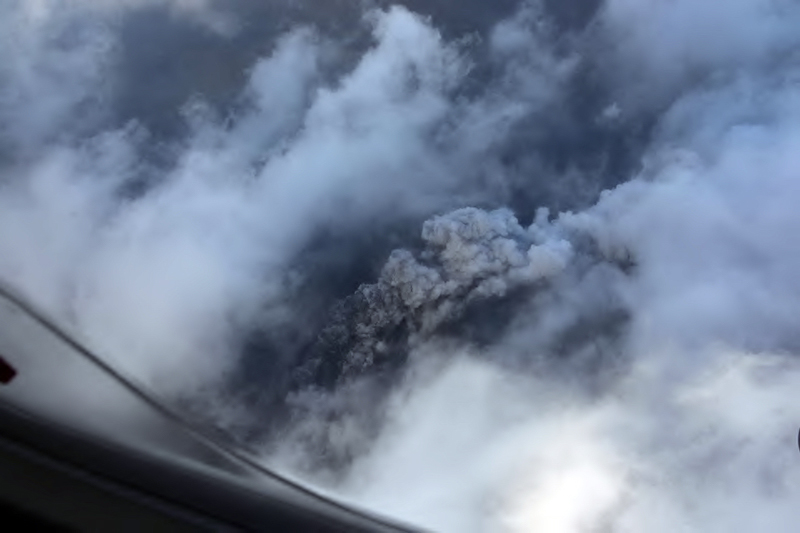
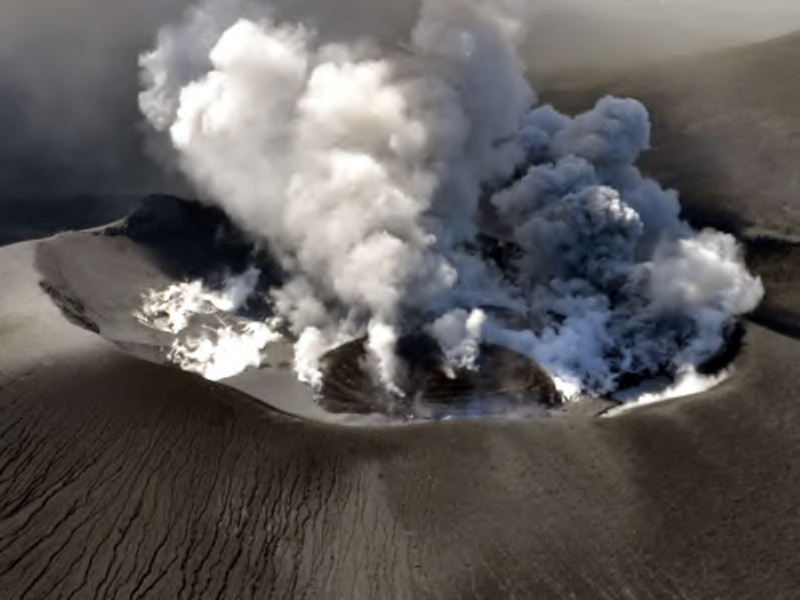
The eruption continued during November. During an overflight on 3 November observers photographed the island and noted that material was ejected 169 m high, according to a news source. Explosions gradually became shorter, and, by the 3rd, they occurred every few seconds; dark and incandescent material were ejected about 800 m above the vent. On 4 November eruptions were accompanied by explosive sounds. Floating, brown-colored pumice was present in the water surrounding the island. There was a brief increase in the number of volcanic earthquakes during 8-14 November and 24-25 November. The eruption temporarily paused during 9-11 November and by 12 November eruptions resumed to the W of the island. On 10 November dark brown-to-dark yellow-green discolored water and a small amount of black floating material was observed (figure 25). A small eruption was reported on 18 November off the NE coast of the island, accompanied by white gas-and-steam plumes (figure 23). Another pause was recorded during 17-19 November, which then resumed on 20 November and continued erupting intermittently. According to a field survey conducted by the National Institute for Disaster Prevention Science and Technology on 19 November, a 30-m diameter crater was visible on the NE coast where landslides, hot water, and gray volcanic ash containing clay have occurred and been distributed previously. Erupted blocks about 10 cm in diameter were distributed about 90-120 m from the crater. JCG made observations during an overflight on 23 November and reported a phreatomagmatic eruption. Explosions at the main vent generated dark gas-and-ash plumes that rose to 200 m altitude and ejected large blocks that landed on the island and in the ocean (figure 26). Discolored water also surrounded the island. The size of the new island had grown to 450 m N-S x 200 m E-W by 23 November, according to JCG.
The eruption continued through 11 December, followed by a brief pause in activity, which then resumed on 31 December, according to JMA. Intermittent explosions produced 100-m-high black plumes at intervals of several minutes to 30 minutes during 1-10 December. Overflights were conducted on 4 and 15 December and reported that the water surrounding the new island was discolored to dark brown-to-dark yellow-green (figure 27). No floating material was reported during this time. In comparison to the observations made on 23 November, the new land had extended N and part of it had eroded away. In addition, analysis by the Geospatial Information Authority of Japan using SAR data from Daichi-2 also confirmed that the area of the new island continued to decrease between 4 and 15 December. Ejected material combined with wave erosion transformed the island into a “J” shape, 500-m-long and with the curved part about 200 m offshore of Ioto. The island was covered with brown ash and blocks, and the surrounding water was discolored to greenish-brown and contained an area of floating pumice. JCG reported from an overflight on 4 December that volcanic ash-like material found around the S vent on the NE part of the island was newly deposited since 10 November (figure 28). By 15 December the N part of the “J” shaped island had separated and migrated N, connecting to the Okinahama coast and the curved part of the “J” had eroded into two smaller islands (figure 27).
References. Ukawa, M., Fujita, E., Kobayashi, T., 2002, Recent volcanic activity of Iwo Jima and the 2001 eruption, Monthly Chikyu, Extra No. 39, 157-164.
Geologic Background. Ioto, in the Volcano Islands of Japan, lies within a 9-km-wide submarine caldera. The volcano is also known as Ogasawara-Iojima to distinguish it from several other "Sulfur Island" volcanoes in Japan. The triangular, low-elevation, 8-km-long island narrows toward its SW tip and has produced trachyandesitic and trachytic rocks that are more alkalic than those of other volcanoes in this arc. The island has undergone uplift for at least the past 700 years, accompanying resurgent doming of the caldera; a shoreline landed upon by Captain Cook's surveying crew in 1779 is now 40 m above sea level. The Motoyama plateau on the NE half of the island consists of submarine tuffs overlain by coral deposits and forms the island's high point. Many fumaroles are oriented along a NE-SW zone cutting through Motoyama. Numerous recorded phreatic eruptions, many from vents on the W and NW sides of the island, have accompanied the uplift.
Information Contacts: Japan Meteorological Agency (JMA), 1-3-4 Otemachi, Chiyoda-ku, Tokyo 100-8122, Japan (URL: http://www.jma.go.jp/jma/indexe.html); Japan Coast Guard (JCG) Volcano Database, Hydrographic and Oceanographic Department, 3-1-1, Kasumigaseki, Chiyoda-ku, Tokyo 100-8932, Japan (URL: https://www1.kaiho.mlit.go.jp/GIJUTSUKOKUSAI/kaiikiDB/kaiyo22-2.htm); Copernicus Browser, Copernicus Data Space Ecosystem, European Space Agency (URL: https://dataspace.copernicus.eu/browser/); Asahi, 5-3-2, Tsukiji, Chuo Ward, Tokyo, 104-8011, Japan (URL: https://www.asahi.com/ajw/articles/15048458).
Purace (Colombia) — December 2023 Cite this Report
Purace
Colombia
2.3095°N, 76.3948°W; summit elev. 4650 m
All times are local (unless otherwise noted)
Gas-and-ash emission on 16 November 2023
Puracé, located in Colombia, is a stratovolcano that contains a 500-m-wide summit crater. It is part of the Los Coconucos volcanic chain that is a NW-SE trending group of seven cones and craters. The most recent eruption occurred during March 2022 that was characterized by frequent seismicity and gas-and-steam emissions (BGVN 47:06). This report covers a brief eruption during November 2023 based on monthly reports from the Popayán Observatory, part of the Servicio Geologico Colombiano (SGC).
Activity during November 2022 through November 2023 primarily consisted of seismicity: VT-type events, LP-type events, HB-type events, and TR-type events (table 4). Maximum sulfur dioxide values were measured weekly and ranged from 259-5,854 tons per day (t/d) during November 2022 through April 2023. White gas-and-steam emissions were also occasionally reported.
SGC issued a report on 25 October that noted a significant increase in the number of earthquakes associated with rock fracturing. These earthquakes were located SE of the crater between Puracé and Piocollo at depths of 1-4 km. There were no reported variations in sulfur dioxide values, but SGC noted high carbon dioxide values, compared to those recorded in the first half of 2023.
SGC reported that at 1929 on 16 November the seismic network detected a signal that was possibly associated with a gas-and-ash emission, though it was not confirmed in webcam images due to limited visibility. On 17 November an observer confirmed ash deposits on the N flank. Webcam images showed an increase in degassing both inside the crater and from the NW flank, rising 700 m above the crater.
Table 4. Seismicity at Puracé during November 2022-November 2023. Volcano-tectonic (VT), long-period (LP), hybrid (HB), and tremor (TR) events are reported each month. Courtesy of SGC.
| Month |
Volcano-tectonic |
Long-period |
Hybrid |
Tremor |
| Nov 2022 |
429 |
2,023 |
5 |
831 |
| Dec 2022 |
423 |
1,390 |
9 |
834 |
| Jan 2023 |
719 |
1,622 |
0 |
957 |
| Feb 2023 |
598 |
1,701 |
2 |
1,124 |
| Mar 2023 |
331 |
2,408 |
147 |
607 |
| Apr 2023 |
614 |
4,427 |
33 |
148 |
| May 2023 |
620 |
3,717 |
170 |
109 |
| Jun 2023 |
467 |
3,293 |
86 |
148 |
| Jul 2023 |
1,116 |
5,809 |
183 |
542 |
| Aug 2023 |
692 |
2,927 |
94 |
321 |
| Sep 2023 |
887 |
1,505 |
82 |
848 |
| Oct 2023 |
2,373 |
2,949 |
135 |
692 |
| Nov 2023 |
1,212 |
2,302 |
69 |
293 |
Geologic Background. Puracé is an active andesitic volcano with a 600-m-diameter summit crater at the NW end of the Los Coconucos Volcanic Chain. This volcanic complex includes nine composite and five monogenetic volcanoes, extending from the Puracé crater more than 6 km SE to the summit of Pan de Azúcar stratovolcano. The dacitic massif which the complex is built on extends about 13 km NW-SE and 10 km NE-SW. Frequent small to moderate explosive eruptions reported since 1816 CE have modified the morphology of the summit crater, with the largest eruptions in 1849, 1869, and 1885.
Information Contacts: Servicio Geologico Colombiano (SGC), Diagonal 53 No. 34-53 - Bogotá D.C., Colombia (URL: https://www.sgc.gov.co/volcanes).
Etna
Italy
37.748°N, 14.999°E; summit elev. 3357 m
All times are local (unless otherwise noted)
Strombolian explosions, lava fountains, and lava flows during July-August 2023
Etna, located on the Italian island of Sicily, has had documented eruptions dating back to 1500 BCE. Activity typically originates from multiple cones at the summit, where several craters have formed and evolved. The currently active craters are Northeast Crater (NEC), Voragine (VOR), and Bocca Nuova (BN), and the Southeast Crater (SEC); VOR and BN were previously referred to as the “Central Crater”. The original Southeast crater formed in 1978, and a second eruptive site that opened on its SE flank in 2011 was named the New Southeast Crater (NSEC). Another eruptive site between the SEC and NSEC developed during early 2017 and was referred to as the "cono della sella" (saddle cone). The current eruption period began in November 2022 and has been characterized by intermittent Strombolian activity, lava flows, and ash plumes (BGVN 48:08). This report updates activity during July through October 2023, which includes primarily gas-and-steam emissions; during July and August Strombolian explosions, lava fountains, and lava flows were reported, based on weekly and special reports by the Osservatorio Etneo (OE), part of the Catania Branch of Italy's Istituo Nazionale di Geofisica e Vulcanologica (INGV) and satellite data.
Variable fumarolic degassing was reported at all summit craters (BN, VOR, NEC, and SEC) throughout the entire reporting period (table 15). The MIROVA (Middle InfraRed Observation of Volcanic Activity) volcano hotspot detection system based on the analysis of MODIS data showed frequent low-to-moderate power thermal anomalies during the reporting period (figure 399). During mid-August there was a pulse in activity that showed an increase in the power of the anomalies due to Strombolian activity, lava fountains, and lava flows. Infrared satellite imagery captured strong thermal anomalies at the central and southeast summit crater areas (figure 400). Accompanying thermal activity were occasional sulfur dioxide plumes that exceeded 2 Dobson Units (DUs) recorded by the TROPOMI instrument on the Sentinel-5P satellite (figure 401).
Table 15. Summary of activity at the four primary crater areas at the summit of Etna during July-October 2023. Information is from INGV weekly reports.
| Month |
Bocca Nuova (BN) |
Voragine (VOR) |
Northeast Crater (NEC) |
Southeast Crater (SEC) |
| Jul 2023 |
Continuous degassing. |
No observations. |
Weak gas emissions. |
Continuous degassing. Sporadic and weak-to-moderate ash emissions. Strombolian explosions. |
| Aug 2023 |
Continuous degassing. |
No observations. |
No observations. |
Continuous degassing. Occasional ash emissions. Strombolian activity, lava fountaining, and lava flows. |
| Sep 2023 |
Variable degassing. Crater incandescence. |
Weak fumarolic activity. |
Weak fumarolic activity. |
Variable degassing. |
| Oct 2023 |
Continuous degassing. |
Weak fumarolic activity. |
Weak fumarolic activity. |
Continuous degassing. |
Activity during July and August was relatively low and mainly consisted of degassing at the summit craters, particularly at SEC and BN. Cloudy weather prevented clear views of the summit during early July. During the night of 2 July some crater incandescence was visible at SEC. Explosive activity resumed at SEC during 9-10 July, which was characterized by sporadic and weak ash emissions that rapidly dispersed in the summit area (figure 402). INGV reported moderate Strombolian activity began at 2034 on 14 July and was confined to the inside of the crater and fed by a vent located in the E part of SEC. An ash emission was detected at 2037. A new vent opened on 15 July in the SE part of BN and began to produce continuous gas-and-steam emissions. During an inspection carried out on 28 July pulsating degassing, along with audible booms, were reported at two active vents in BN. Vigorous gas-and-steam emissions intermittently generated rings. On rare occasions, fine, reddish ash was emitted from BN1 and resuspended by the gas-and-steam emissions.
Around 2000 on 13 August INGV reported a sudden increase in volcanic tremor amplitude. Significant infrasonic activity coincided with the tremor increase. Incandescent flashes were visible through the cloud cover in webcam images of SEC (figure 403). Strombolian activity at SEC began to gradually intensify starting at 2040 as seismicity continued to increase. The Aviation Color Code (ACC) was raised to Yellow (the second lowest-level on a four-color scale) at 2126 and then to Orange (the second highest-level on a four-color scale) at 2129 due to above-background activity. The activity rapidly transitioned from Strombolian activity to lava fountains around 2333 that rose 300-400 m above the crater (figure 403). Activity was initially focused on the E vent of the crater, but then the vent located above the S flank of the cone also became active. A lava flow from this vent traveled SW into the drainage created on 10 February 2022, overlapping with previous flows from 10 and 21 February 2022 and 21 May 2023, moving between Monte Barbagallo and Monte Frumento Supino (figure 404). The lava flow was 350 m long, oriented NNE-SSW, and descended to an elevation of 2.8 km. Flows covered an area of 300,000 m2 and had an estimated volume of 900,000 m3. The ACC was raised to Red at 2241 based on strong explosive activity and ashfall in Rifugio Sapienza-Piano Vetore at 1.7 km elevation on the S flank. INGV reported that pyroclastic flows accompanied this activity.
Activity peaked between 0240 and 0330 on 14 August, when roughly 5-6 vents erupted lava fountains from the E to SW flank of SEC. The easternmost vents produced lava fountains that ejected material strongly to the E, which caused heavy fallout of incandescent pyroclastic material on the underlying flank, triggering small pyroclastic flows. This event was also accompanied by lightning both in the ash column and in the ash clouds that were generated by the pyroclastic flows. A fracture characterized by a series of collapse craters (pit craters) opened on the upper SW flank of SEC. An ash cloud rose a few kilometers above the crater and drifted S, causing ash and lapilli falls in Rifugio Sapienza and expanding toward Nicolosi, Mascalucia, Catania, and up to Syracuse. Ashfall resulted in operational problems at the Catania airport (50 km S), which lasted from 0238 until 2000. By 0420 the volcanic tremor amplitude values declined to background levels. After 0500 activity sharply decreased, although the ash cloud remained for several hours and drifted S. By late morning, activity had completely stopped. The ACC was lowered to Orange as volcanic ash was confined to the summit area. Sporadic, minor ash emissions continued throughout the day. At 1415 the ACC was lowered to Yellow and then to Green at 1417.
During the night of 14-15 August only occasional flashes were observed, which were more intense during avalanches of material inside the eruptive vents. Small explosions were detected at SEC at 2346 on 14 August and at 0900 on 26 August that each produced ash clouds which rapidly dispersed into the atmosphere (figure 405). According to a webcam image, an explosive event detected at 2344 at SEC generated a modest ash cloud that was rapidly dispersed by winds. The ACC was raised to Yellow at 2355 on 14 August due to increasing unrest and was lowered to Green at 0954 on 15 August.
Activity during September and October was relatively low and mainly characterized by variable degassing from BN and SEC. Intense, continuous, and pulsating degassing was accompanied by roaring sounds and flashes of incandescence at BN both from BN1 and the new pit crater that formed during late July (figure 406). The degassing from the new pit crater sometimes emitted vapor rings. Cloudy weather during 6-8 September prevented observations of the summit craters .
Geologic Background. Mount Etna, towering above Catania on the island of Sicily, has one of the world's longest documented records of volcanism, dating back to 1500 BCE. Historical lava flows of basaltic composition cover much of the surface of this massive volcano, whose edifice is the highest and most voluminous in Italy. The Mongibello stratovolcano, truncated by several small calderas, was constructed during the late Pleistocene and Holocene over an older shield volcano. The most prominent morphological feature of Etna is the Valle del Bove, a 5 x 10 km caldera open to the east. Two styles of eruptive activity typically occur, sometimes simultaneously. Persistent explosive eruptions, sometimes with minor lava emissions, take place from one or more summit craters. Flank vents, typically with higher effusion rates, are less frequently active and originate from fissures that open progressively downward from near the summit (usually accompanied by Strombolian eruptions at the upper end). Cinder cones are commonly constructed over the vents of lower-flank lava flows. Lava flows extend to the foot of the volcano on all sides and have reached the sea over a broad area on the SE flank.
Information Contacts: Sezione di Catania - Osservatorio Etneo, Istituto Nazionale di Geofisica e Vulcanologia (INGV), Sezione di Catania, Piazza Roma 2, 95123 Catania, Italy (URL: http://www.ct.ingv.it/it/); MIROVA (Middle InfraRed Observation of Volcanic Activity), a collaborative project between the Universities of Turin and Florence (Italy) supported by the Centre for Volcanic Risk of the Italian Civil Protection Department (URL: http://www.mirovaweb.it/); NASA Global Sulfur Dioxide Monitoring Page, Atmospheric Chemistry and Dynamics Laboratory, NASA Goddard Space Flight Center (NASA/GSFC), 8800 Greenbelt Road, Goddard MD 20771, USA (URL: https://so2.gsfc.nasa.gov/); Copernicus Browser, Copernicus Data Space Ecosystem, European Space Agency (URL: https://dataspace.copernicus.eu/browser/).
Suwanosejima (Japan) — December 2023 Cite this Report
Suwanosejima
Japan
29.638°N, 129.714°E; summit elev. 796 m
All times are local (unless otherwise noted)
Eruption plumes, crater incandescence, and occasional explosions during July-October 2023
Suwanosejima is an 8-km-long island that consists of a stratovolcano and two active summit craters, located in the northern Ryukyu Islands, Japan. Volcanism over the past century has been characterized by Strombolian explosions, ash plumes, and ashfall. The current eruption began in October 2004 and has more recently consisted of frequent eruption plumes, explosions, and incandescent ejecta (BGVN 48:07). This report covers similar activity of ash plumes, explosions, and crater incandescence during July through October 2023 using monthly reports from the Japan Meteorological Agency (JMA) and satellite data.
Thermal activity during the reporting period was relatively low; only one low-power thermal anomaly was detected during mid-July and one during early August, based on a MIROVA (Middle InfraRed Observation of Volcanic Activity) Log Radiative Power graph of the MODIS thermal anomaly data. On two clear weather days, a thermal anomaly was visible in infrared satellite images (figure 81).
Low-level activity was reported at the Otake crater during July and no explosions were detected. Eruption plumes rose as high as 1.8 km above the crater. On 13 July an ash plume rose 1.7 km above the crater rim, based on a webcam image. During the night of the 28th crater incandescence was visible in a webcam image. An eruptive event reported on 31 July produced an eruption plume that rose 2.1 km above the crater. Seismicity consisted of 11 volcanic earthquakes on the W flank, the number of which had decreased compared to June (28) and 68 volcanic earthquakes near the Otake crater, which had decreased from 722 in the previous month. According to observations conducted by the University of Tokyo Graduate School of Science, Kyoto University Disaster Prevention Research Institute, Toshima Village, and JMA, the amount of sulfur dioxide emissions released during the month was 400-800 tons per day (t/d).
Eruptive activity in the Otake crater continued during August and no explosions were reported. An eruptive event produced a plume that rose 1 km above the crater at 1447 on 12 August. Subsequent eruptive events were recorded at 0911 on 16 August, at 1303 on 20 August, and at 0317 on 21 August, which produced ash plumes that rose 1-1.1 km above the crater and drifted SE, SW, and W. On 22 August an ash plume was captured in a webcam image rising 1.4 km above the crater (figure 82). Multiple eruptive events were detected on 25 August at 0544, 0742, 0824, 1424, and 1704, which generated ash plumes that rose 1.1-1.2 km above the crater and drifted NE, W, and SW. On 28 August a small amount of ashfall was observed as far as 1.5 km from the crater. There were 17 volcanic earthquakes recorded on the W flank of the volcano and 79 recorded at the Otake crater during the month. The amount of sulfur dioxide emissions released during the month was 400-800 t/d.
Activity continued at the Otake crater during September. Occasionally, nighttime crater incandescence was observed in webcam images and ashfall was reported. An eruptive event at 1949 on 4 September produced an ash plume that rose 1 km above the crater and drifted SW. On 9 September several eruption events were detected at 0221, 0301, and 0333, which produced ash plumes that rose 1.1-1.4 km above the crater rim and drifted W; continuous ash emissions during 0404-0740 rose to a maximum height of 2 km above the crater rim (figure 83). More eruptive events were reported at 1437 on 10 September, at 0319 on 11 September, and at 0511 and 1228 on 15 September, which generated ash plumes that rose 1-1.8 km above the crater. During 25, 27, and 30 September, ash plumes rose as high as 1.3 km above the crater rim. JMA reported that large blocks were ejected as far as 300 m from the center of the crater. There were 18 volcanic earthquakes detected beneath the W flank and 82 volcanic earthquakes detected near the Otake crater. The amount of sulfur dioxide released during the month ranged from 600 to 1,600 t/d.
Activity during early-to-mid-October consisted of occasional explosions, a total number of 13, and ash plumes that rose as high as 1.9 km above the Otake crater rim on 29 October (figure 84). These explosions are the first to have occurred since June 2023. Continuous ash emissions were reported during 0510-0555 on 1 October. Explosions were recorded at 0304, 2141, and 2359 on 2 October, at 0112 on 3 October, and at 1326 on 6 October, which produced ash plumes that rose as high as 1 km above the crater rim and drifted SW and W. An explosion was noted at 0428 on 3 October, but emission details were unknown. A total of eight explosions were recorded by the seismic network at 1522 on 14 October, at 0337, 0433, 0555, 1008, and 1539 on 15 October, and at 0454 and 0517 on 16 October. Ash plumes from these explosions rose as high as 900 m above the crater and drifted SE. Eruptive events during 25-27 and 29-30 October generated plumes that rose as high as 1.9 km above the crater and drifted SE, S, and SW. Ash was deposited in Toshima village (3.5 km SSW). Eruptive activity occasionally ejected large volcanic blocks as far as 600 m from the crater. Nighttime crater incandescence was visible in webcams. Intermittent ashfall was reported as far as 1.5 km from the crater. There were 43 volcanic earthquakes detected on the W flank during the month, and 184 volcanic earthquakes detected near the Otake crater. The amount of sulfur dioxide emitted ranged between 400 and 900 t/d.
Geologic Background. The 8-km-long island of Suwanosejima in the northern Ryukyu Islands consists of an andesitic stratovolcano with two active summit craters. The summit is truncated by a large breached crater extending to the sea on the E flank that was formed by edifice collapse. One of Japan's most frequently active volcanoes, it was in a state of intermittent Strombolian activity from Otake, the NE summit crater, between 1949 and 1996, after which periods of inactivity lengthened. The largest recorded eruption took place in 1813-14, when thick scoria deposits covered residential areas, and the SW crater produced two lava flows that reached the western coast. At the end of the eruption the summit of Otake collapsed, forming a large debris avalanche and creating an open collapse scarp extending to the eastern coast. The island remained uninhabited for about 70 years after the 1813-1814 eruption. Lava flows reached the eastern coast of the island in 1884. Only about 50 people live on the island.
Information Contacts: Japan Meteorological Agency (JMA), 1-3-4 Otemachi, Chiyoda-ku, Tokyo 100-8122, Japan (URL: http://www.jma.go.jp/jma/indexe.html); MIROVA (Middle InfraRed Observation of Volcanic Activity), a collaborative project between the Universities of Turin and Florence (Italy) supported by the Centre for Volcanic Risk of the Italian Civil Protection Department (URL: http://www.mirovaweb.it/); Hawai'i Institute of Geophysics and Planetology (HIGP) - MODVOLC Thermal Alerts System, School of Ocean and Earth Science and Technology (SOEST), Univ. of Hawai'i, 2525 Correa Road, Honolulu, HI 96822, USA (URL: http://modis.higp.hawaii.edu/); Copernicus Browser, Copernicus Data Space Ecosystem, European Space Agency (URL: https://dataspace.copernicus.eu/browser/).
Aira
Japan
31.5772°N, 130.6589°E; summit elev. 1117 m
All times are local (unless otherwise noted)
Explosions, ash plumes, ash fall, and crater incandescence during July-October 2023
Aira caldera, located in the northern half of Kagoshima Bay, Japan, contains the post-caldera Sakurajima volcano. Eruptions typically originate from the Minamidake crater, and since the 8th century, ash deposits have been recorded in the city of Kagoshima (10 km W), one of Kyushu’s largest cities. The Minamidake summit cone and crater has had persistent activity since 1955; the Showa crater on the E flank has also been intermittently active since 2006. The current eruption period began during March 2017 and has recently been characterized by intermittent explosions, eruption plumes, and ashfall (BGVN 48:07). This report updates activity during July through October 2023 and describes explosive events, ash plumes, nighttime crater incandescence, and ashfall, according to monthly activity reports from the Japan Meteorological Agency (JMA) and satellite data.
Thermal activity remained at low levels during this reporting period, according to the MIROVA (Middle InfraRed Observation of Volcanic Activity) system (figure 149). There was a slight increase in the number of anomalies during September through October. Occasional thermal anomalies were visible in infrared satellite images mainly at the Minamidake crater (Vent A is located to the left and Vent B is located to the right) (figure 150).
Table 30. Number of monthly explosive events, days of ashfall, area of ash covered, and sulfur dioxide emissions from Sakurajima’s Minamidake crater at Aira during July-October 2023. Note that smaller ash events are not listed. Ashfall days were measured at Kagoshima Local Meteorological Observatory and ashfall amounts represent material covering all the Kagoshima Prefecture. Data courtesy of JMA monthly reports.
| Month |
Explosive events |
Days of ashfall |
Ashfall amount (g/m2) |
SO2 emissions (tons/day) |
| Jul 2023 |
3 |
0 |
0 |
1,600-3,200 |
| Aug 2023 |
3 |
10 |
7 |
1,800-3,300 |
| Sep 2023 |
3 |
7 |
3 |
1,600-2,300 |
| Oct 2023 |
33 |
8 |
61 |
2,200-4,200 |
JMA reported that during July, there were eight eruptions, three of which were explosion events in the Showa crater. Large blocks were ejected as far as 600 m from the Showa crater. Very small eruptions were occasionally reported at the Minamidake crater. Nighttime incandescence was observed in both the Showa and Minamidake crater. Explosions were reported on 16 July at 2314 and on 17 July at 1224 and at 1232 (figure 151). Resulting eruption plumes rose 700-2,500 m above the crater and drifted N. On 23 July the number of volcanic earthquakes on the SW flank of the volcano increased. A strong Mw 3.1 volcanic earthquake was detected at 1054 on 26 July. The number of earthquakes recorded throughout the month was 545, which markedly increased from 73 in June. No ashfall was observed at the Kagoshima Regional Meteorological Observatory during July. According to a field survey conducted during the month, the daily amount of sulfur dioxide emissions was 1,600-3,200 tons per day (t/d).
There were three eruptions reported at the Minamidake crater during August, each of which were explosive. The explosions occurred on 9 August at 0345, on 13 August at 2205, and on 31 August at 0640, which generated ash plumes that rose 800-2,000 m above the crater and drifted W. There were two eruptions detected at Showa crater; on 4 August at 2150 ejecta traveled 800 m from the Showa crater and associated eruption plumes rose 2.3 km above the crater. The explosion at 2205 on 13 August generated an ash plume that rose 2 km above the crater and was accompanied by large blocks that were ejected 600 m from the Minamidake crater (figure 152). Nighttime crater incandescence was visible in a high-sensitivity surveillance camera at both craters. Seismicity consisted of 163 volcanic earthquakes, 84 of which were detected on the SW flank. According to the Kagoshima Regional Meteorological Observatory there was a total of 7 g/m2 of ashfall over the course of 10 days during the month. According to a field survey, the daily amount of sulfur dioxide emitted was 1,800-3,300 t/d.
During September, four eruptions were reported, three of which were explosion events. These events occurred at 1512 on 9 September, at 0018 on 11 September, and at 2211 on 13 September. Resulting ash plumes generally rose 800-1,100 m above the crater. An explosion produced an ash plume at 2211 on 13 September that rose as high as 1.7 km above the crater. Large volcanic blocks were ejected 600 m from the Minamidake crater. Smaller eruptions were occasionally observed at the Showa crater. Nighttime crater incandescence was visible at the Minamidake crater. Seismicity was characterized by 68 volcanic earthquakes, 28 of which were detected beneath the SW flank. According to the Kagoshima Regional Meteorological Observatory there was a total of 3 g/m2 of ashfall over the course of seven days during the month. A field survey reported that the daily amount of sulfur dioxide emitted was 1,600-2,300 t/d.
Eruptive activity during October consisted of 69 eruptions, 33 of which were described as explosive. These explosions occurred during 4 and 11-21 October and generated ash plumes that rose 500-3,600 m above the crater and drifted S, E, SE, and N. On 19 October at 1648 an explosion generated an ash plume that rose 3.6 km above the crater (figure 153). No eruptions were reported in the Showa crater; white gas-and-steam emissions rose 100 m above the crater from a vent on the N flank. Nighttime incandescence was observed at the Minamidake crater. On 24 October an eruption was reported from 0346 through 0430, which included an ash plume that rose 3.4 km above the crater. Ejected blocks traveled 1.2 km from the Minamidake crater. Following this eruption, small amounts of ashfall were observed from Arimura (4.5 km SE) and a varying amount in Kurokami (4 km E) (figure 154). The number of recorded volcanic earthquakes during the month was 190, of which 14 were located beneath the SW flank. Approximately 61 g/m2 of ashfall was reported over eight days of the month. According to a field survey, the daily amount of sulfur dioxide emitted was 2,200-4,200 t/d.
Geologic Background. The Aira caldera in the northern half of Kagoshima Bay contains the post-caldera Sakurajima volcano, one of Japan's most active. Eruption of the voluminous Ito pyroclastic flow accompanied formation of the 17 x 23 km caldera about 22,000 years ago. The smaller Wakamiko caldera was formed during the early Holocene in the NE corner of the caldera, along with several post-caldera cones. The construction of Sakurajima began about 13,000 years ago on the southern rim and built an island that was joined to the Osumi Peninsula during the major explosive and effusive eruption of 1914. Activity at the Kitadake summit cone ended about 4,850 years ago, after which eruptions took place at Minamidake. Frequent eruptions since the 8th century have deposited ash on the city of Kagoshima, located across Kagoshima Bay only 8 km from the summit. The largest recorded eruption took place during 1471-76.
Information Contacts: Japan Meteorological Agency (JMA), 1-3-4 Otemachi, Chiyoda-ku, Tokyo 100-8122, Japan (URL: http://www.jma.go.jp/jma/indexe.html); MIROVA (Middle InfraRed Observation of Volcanic Activity), a collaborative project between the Universities of Turin and Florence (Italy) supported by the Centre for Volcanic Risk of the Italian Civil Protection Department (URL: http://www.mirovaweb.it/); Copernicus Browser, Copernicus Data Space Ecosystem, European Space Agency (URL: https://dataspace.copernicus.eu/browser/).
Nishinoshima (Japan) — November 2023 Cite this Report
Nishinoshima
Japan
27.247°N, 140.874°E; summit elev. 100 m
All times are local (unless otherwise noted)
Gray emissions during October 2023
Nishinoshima is a small island in the Ogasawara Arc, about 1,000 km S of Tokyo, Japan. It contains prominent submarine peaks to the S, W, and NE. Recorded eruptions date back to 1973, with the current eruption period beginning in October 2022. Eruption plumes and fumarolic activity characterize recent activity (BGVN 48:10). This report covers the end of the eruption for September through October 2023, based on information from monthly reports of the Japan Meteorological Agency (JMA) monthly reports, and satellite data.
No eruptive activity was reported during September 2023, although JMA noted that the surface temperature was slightly elevated compared to the surrounding area since early March 2023. The Japan Coast Guard (JCG) conducted an overflight on 20 September and reported white gas-and-steam plumes rising 3 km above the central crater of the pyroclastic cone, as well as multiple white gas-and-steam emissions emanating from the N, E, and S flanks of the crater to the coastline. In addition, dark reddish brown-to-green discolored water was distributed around almost the entire circumference of the island.
Similar low-level activity was reported during October. Multiple white gas-and-steam emissions rose from the N, E, and S flanks of the central crater of the pyroclastic cone and along the coastline; these emissions were more intense compared to the previous overflight observations. Dark reddish brown-to-green discolored water remained visible around the circumference of the island. On 4 October aerial observations by JCG showed a small eruption consisting of continuous gas-and-steam emissions emanating from the central crater, with gray emissions rising to 1.5 km altitude (figure 129). According to observations from the marine weather observation vessel Keifu Maru on 26 October, white gas-and-steam emissions persisted from the center of the pyroclastic cone, as well as from the NW, SW, and SE coasts of the island for about five minutes. Slightly discolored water was visible up to about 1 km.
Frequent low-to-moderate power thermal anomalies were recorded in the MIROVA graph (Middle InfraRed Observation of Volcanic Activity) during September (figure 130). Occasional anomalies were detected during October, and fewer during November through December. A thermal anomaly was visible in the crater using infrared satellite imagery on 6, 8, 11, 16, 18, 21, and 23 September and 8, 13, 21, 26, and 28 October (figure 131).
Geologic Background. The small island of Nishinoshima was enlarged when several new islands coalesced during an eruption in 1973-74. Multiple eruptions that began in 2013 completely covered the previous exposed surface and continued to enlarge the island. The island is the summit of a massive submarine volcano that has prominent peaks to the S, W, and NE. The summit of the southern cone rises to within 214 m of the ocean surface 9 km SSE.
Information Contacts: Japan Meteorological Agency (JMA), 1-3-4 Otemachi, Chiyoda-ku, Tokyo 100-8122, Japan (URL: http://www.jma.go.jp/jma/indexe.html); MIROVA (Middle InfraRed Observation of Volcanic Activity), a collaborative project between the Universities of Turin and Florence (Italy) supported by the Centre for Volcanic Risk of the Italian Civil Protection Department (URL: http://www.mirovaweb.it/); Copernicus Browser, Copernicus Data Space Ecosystem, European Space Agency (URL: https://dataspace.copernicus.eu/browser/).
Kilauea (United States) — October 2023 Cite this Report
Kilauea
United States
19.421°N, 155.287°W; summit elev. 1222 m
All times are local (unless otherwise noted)
Strong lava fountains, lava flows, and spatter at Halema’uma’u during January-September 2023
Kīlauea is on the island of Hawai’i and overlaps the E flank of the Mauna Loa volcano. Its East Rift Zone (ERZ) has been intermittently active for at least 2,000 years. An extended eruption period began in January 1983 and was characterized by open lava lakes and lava flows from the summit caldera and the East Rift Zone. During May 2018 magma migrated into the Lower East Rift Zone (LERZ) and opened 24 fissures along a 6-km-long NE-trending fracture zone that produced lava flows traveling in multiple directions. As lava emerged from the fissures, the lava lake at Halema'uma'u drained and explosions sent ash plumes to several kilometers altitude (BGVN 43:10).
The current eruption period started during September 2021 and has been characterized by low-level lava effusions in the active Halema’uma’u lava lake (BGVN 48:01). This report covers three notable eruption periods during February, June, and September 2023 consisting of lava fountaining, lava flows, and spatter during January through September 2023 using information from daily reports, volcanic activity notices, and abundant photo, map, and video data from the US Geological Survey's (USGS) Hawaiian Volcano Observatory (HVO).
Activity during January 2023. Small earthquake swarms were recorded on 2 January 2023; increased seismicity and changes in the pattern of deformation were noted on the morning of 5 January. At around 1500 both the rate of deformation and seismicity drastically increased, which suggested magma movement toward the surface. HVO raised the Volcano Alert Level (VAL) to Watch (the second highest level on a four-level scale) and the Aviation Color Code (ACC) to Orange (the second highest color on a four-color scale) at 1520.
Multiple lava fountains and lava effusions from vents in the central eastern portion of the Halema’uma’u crater began on 5 January around 0434; activity was confined to the eastern half of the crater and within the basin of the western half of the crater, which was the focus of the eruption in 2021-2022 (figure 525). Incandescence was visible in webcam images at 1634 on 5 January, prompting HVO to raise the VAL to Warning (the highest level on a four-level scale) and the ACC to Red (the highest color on a four-color scale). Lava fountains initially rose as high as 50 m above the vent at the onset of the eruption (figure 526) but then declined to a more consistent 5-6 m height in the proceeding days. By 1930 that same day, lava had covered most of the crater floor (an area of about 1,200,000 m2) and the lava lake had a depth of 10 m. A higher-elevation island that formed during the initial phase of the December 2020 eruption remained exposed, appearing darker in images, along with a ring of older lava around the lava lake that was active prior to December 2022. Overnight during 5-6 January the lava fountains continued to rise 5 m high, and the lava effusion rate had slowed.
On 6 January at 0815 HVO lowered the VAL to Watch and the ACC to Orange due to the declining effusion rates. Sulfur dioxide emission rates ranged from 3,000-12,500 tonnes per day (t/d), the highest value of which was recorded on 6 January. Lava continued to erupt from the vents during 6-8 January, although the footprint of the active area had shrunk; a similar progression has been commonly observed during the early stages of recent eruptions at Halema’uma’u. On 9 January HVO reported one dominant lava fountain rising 6-7 m high in the E half of the crater. Lava flows built up the margins of the lake, causing the lake to be perched. On 10 January the eastern lava lake had an area of approximately 120,000 m2 that increased to 250,000 m2 by 17 January. During 13-31 January several small overflows occurred along the margins of the E lake. A smaller area of lava was active within the basin in the W half of the crater that had been the focus of activity during 2021-2022. On 19 January just after 0200 a small ooze-out was observed on the crater’s W edge.
Activity during February 2023. Activity continued in the E part of Halema’uma’u crater, as well as in a smaller basin in the W part of the 2021-2022 lava lake (figure 527). The E lava lake contained a single lava fountain and frequent overflows. HVO reported that during the morning of 1 February the large E lava lake began to cool and crust over in the center of the lake; two smaller areas of lava were observed on the N and S sides by the afternoon. The dominant lava fountain located in the S part of the lava lake paused for roughly 45 minutes at 2315 and resumed by midnight, rising 1-2 m. At 0100 on 2 February lava from the S part was effusing across the entire E lava lake area, covering the crusted over portion in the center of the lake and continuing across the majority of the previously measured 250,000 m2 by 0400. A small lava pond near the E lake produced an overflow around 0716 on 2 February. On 3 February some lava crust began to form against the N and E levees, which defined the 250,000 m2 eastern lava lake. The small S lava fountain remained active, rising 1-6 m high during 3-9 February; around 0400 on 5 February occasional bursts doubled the height of the lava fountain.
A large breakout occurred overnight during 2100 on 4 February to 0900 on 5 February on the N part of the crater floor, equal to or slightly larger in size than the E lava lake. A second, smaller lava fountain appeared in the same area of the E lava lake between 0300 and 0700 on 5 February and was temporarily active. This large breakout continued until 7 February. A small, brief breakout was reported in the S of the E lava lake around midnight on 7 February. In the W lake, as well as the smaller lava pond in the central portion of the crater floor, contained several overflows during 7-10 February and intermittent fountaining. Activity at the S small lava pond and the small S lava fountain within the E lake declined during 9-10 February. The lava pond in the central portion of the crater floor had nearly continuous, expansive flows during 10-13 February; channels from the small central lava pond seemed to flow into the larger E lake. During 13-18 February a small lava fountain was observed in the small lava pond in the central portion of the crater floor. Continuous overflows persisted during this time.
Activity in the eastern and central lakes began to decline in the late afternoon of 17 February. By 18 February HVO reported that the lava effusions had significantly declined, and that the eastern and central lakes were no longer erupting. The W lake in the basin remained active but at a greatly reduced level that continued to decline. HVO reported that this decrease in activity is attributed to notable deflationary tilt that began early on the morning of 17 February and lasted until early 19 February. By 19 February the W lake was mostly crusted over although some weak lava flows remained, which continued through 28 February. The sulfur dioxide emission rates ranged 250-2,800 t/d, the highest value of which was recorded on 6 February.
Activity during March 2023. The summit eruption at Halema’uma’u crater continued at greatly reduced levels compared to the previous two months. The E and central vents stopped effusing lava, and the W lava lake remained active with weak lava flows; the lake was mostly crusted over, although slowly circulating lava intermittently overturned the crust. By 6 March the lava lake in the W basin had stopped because the entire surface was crusted over. The only apparent surface eruptive activity during 5-6 March was minor ooze-outs of lava onto the crater floor, which had stopped by 7 March. Several hornitos on the crater floor still glowed through 12 March according to overnight webcam images, but they did not erupt any lava. A small ooze-out of lava was observed just after 1830 in the W lava lake on 8 March, which diminished overnight. The sulfur dioxide emission rate ranged from 155-321 t/d on 21 March. The VAL was lowered to Advisory, and the ACC was lowered to Yellow (the second lowest on a four-color scale) on 23 March due to a pause in the eruption since 7 March.
Activity during April-May 2023. The eruption at Halema’uma’u crater was paused; no lava effusions were visible on the crater floor. Sulfur dioxide emission rates ranged from 75-185 t/d, the highest of which was measured on 22 April. During May and June summit seismicity was elevated compared to seismicity that preceded the activity during January.
Activity during June 2023. Earthquake activity and changes in the patterns of ground deformation beneath the summit began during the evening of 6 June. The data indicated magma movement toward the surface, prompting HVO to raise the VAL to Watch and the ACC to Orange. At about 0444 on 7 June incandescence in Halema’uma’u crater was visible in webcam images, indicating that a new eruption had begun. HVO raised the VAL to Warning and the ACC to Red (the highest color on a four-color scale). Lava flowed from fissures that had opened on the crater floor. Multiple minor lava fountains were active in the central E portion of the Halema’uma’u crater, and one vent opened on the W wall of the caldera (figure 528). The eruptive vent on the SW wall of the crater continued to effuse into the lava lake in the far SW part of the crater (figure 529). The largest lava fountain consistently rose 15 m high; during the early phase of the eruption, fountain bursts rose as high as 60 m. Lava flows inundated much of the crater floor and added about 6 m depth of new lava within a few hours, covering approximately 10,000 m2. By 0800 on 7 June lava filled the crater floor to a depth of about 10 m. During 0800-0900 the sulfur dioxide emission rate was about 65,000 t/d. Residents of Pahala (30 km downwind of the summit) reported minor deposits of fine, gritty ash and Pele’s hair. A small spatter cone had formed at the vent on the SW wall by midday, and lava from the cone was flowing into the active lava lake. Fountain heights had decreased from the onset of the eruption and were 4-9 m high by 1600, with occasional higher bursts. Inflation switched to deflation and summit earthquake activity greatly diminished shortly after the eruption onset.
At 0837 on 8 June HVO lowered the VAL to Watch and the ACC to Orange because the initial high effusion rates had declined, and no infrastructure was threatened. The surface of the lava lake had dropped by about 2 m, likely due to gas loss by the morning of 8 June. The drop left a wall of cooled lava around the margins of the crater floor. Lava fountain heights decreased during 8-9 June but continued to rise to 10 m high. Active lava and vents covered much of the W half of Halema’uma’u crater in a broad, horseshoe-shape around a central, uplifted area (figure 530). The preliminary average effusion rate for the first 24 hours of the eruption was about 150 cubic meters per second, though the estimate did not account for vesiculated lava and variations in crater floor topography. The effusion rate during the very earliest phases of the eruption appeared significantly higher than the previous three summit eruptions based on the rapid coverage of the entire crater floor. An active lava lake, also referred to as the “western lava lake” was centered within the uplifted area and was fed by a vent in the NE corner. Two small active lava lakes were located just SE from the W lava lake and in the E portion of the crater floor.
During 8-9 June the lava in the central lava lake had a thickness of approximately 1.5 m, based on measurements from a laser rangefinder. During 9-12 June the height of the lava fountains decreased to 9 m high. HVO reported that the previously active lava lake in the E part of the crater appeared stagnant during 10-11 June. The surface of the W lake rose approximately 1 m overnight during 11-12 June, likely due to the construction of a levee around it. Only a few small fountains were active during 12-13 June; the extent of the active lava had retreated so that all activity was concentrated in the SW and central parts of Halema’uma’u crater. Intermittent spattering from the vent on the SW wall was visible in overnight webcam images during 13-18 June. On the morning of 14 June a weak lava effusion originated from near the western eruptive vent, but by 15 June there were no signs of continued activity. HVO reported that other eruptive vents in the SW lava lake had stopped during this time, following several days of waning activity; lava filled the lake by about 0.5 m. Lava circulation continued in the central lake and no active lava was reported in the northern or eastern parts of the crater. Around 0800 on 15 June the top of the SW wall spatter cone collapsed, which was followed by renewed and constant spattering from the top vent and a change in activity from the base vent; several new lava flows effused from the top of the cone, as well as from the pre-existing tube-fed flow from its base. Accumulation of lava on the floor resulted in a drop of the central basin relative to the crater floor, allowing several overflows from the SW lava lake to cascade into the basin during the night of 15 June into the morning of 16 June.
Renewed lava fountaining was reported at the eruptive vent on the SW side of the crater during 16-19 June, which effused lava into the far SW part of the crater. This activity was described as vigorous during midday on 16 June; a group of observatory geologists estimated that the lava was consistently ejected at least 10 m high, with some spatter ejected even higher and farther. Deposits from the fountain further heightened and widened the spatter cone built around the original eruptive vent in the lower section of the crater wall. Multiple lava flows from the base of the cone were fed into the SW lava lake and onto the southwestern-most block from the 2018 collapse within Halema’uma’u on 17 June (figure 531); by 18 June they focused into a single flow feeding into the SW lava lake. On the morning of 19 June a second lava flow from the base of the eruptive cone advanced into the SW lava lake.
Around 1600 on 19 June there was a rapid decline in lava fountaining and effusion at the eruptive vent on the SW side of the crater; vent activity had been vigorous up to that point (figure 532). Circulation in the lava lake also slowed, and the lava lake surface dropped by several meters. Overnight webcam images showed some previously eruptive lava still flowing onto the crater floor, which continued until those flows began to cool. By 21 June no lava was erupting in Halema’uma’u crater. Overnight webcam images during 29-30 June showed some incandescence from previously erupted lava flows as they continued to cool. Seismicity in the crater declined to low levels. Sulfur dioxide emission rates ranged 160-21,000 t/d throughout the month, the highest measurement of which was recorded on 8 June. On 30 June the VAL was lowered to Advisory (the second level on a four-level scale) and the ACC was lowered to Yellow. Gradual inflation was detected at summit tiltmeters during 19-30 June.
Activity during July-August 2023. During July, the eruption paused; no lava was erupting in Halema’uma’u crater. Nighttime webcam images showed some incandescence from previously erupted lava as it continued to cool on the crater floor. During the week of 14 August HVO reported that the rate in seismicity increased, with 467 earthquakes of Mw 3.2 and smaller occurring. Sulfur dioxide emission rates remained low, ranging from 75-86 t/d, the highest of which was recorded on 10 and 15 August. On 15 August beginning at 0730 and lasting for several hours, a swarm of approximately 50 earthquakes were detected at a depth of 2-3 km below the surface and about 2 km long directly S of Halema’uma’u crater. HVO reported that this was likely due to magma movement in the S caldera region. During 0130-0500 and 1700-2100 on 21 August two small earthquake swarms of approximately 20 and 25 earthquakes, respectively, occurred at the same location and at similar depths. Another swarm of 50 earthquakes were recorded during 0430-0830 on 23 August. Elevated seismicity continued in the S area through the end of the month.
Activity during September 2023. Elevated seismicity persisted in the S summit with occasional small, brief seismic swarms. Sulfur dioxide measurements were relatively low and were 70 t/d on 8 September. About 150 earthquakes occurred during 9-10 September, and tiltmeter and Global Positioning System (GPS) data showed inflation in the S portion of the crater.
At 0252 on 10 September HVO raised the VAL to Watch and the ACC to Orange due to increased earthquake activity and changes in ground deformation that indicated magma moving toward the surface. At 1515 the summit eruption resumed in the E part of the caldera based on field reports and webcam images. Fissures opened on the crater floor and produced multiple minor lava fountains and flows (figure 533). The VAL and ACC were raised to Warning and Red, respectively. Gas-and-steam plumes rose from the fissures and drifted downwind. A line of eruptive vents stretched approximately 1.4 km from the E part of the crater into the E wall of the down dropped block by 1900. The lava fountains at the onset of the eruption had an estimated 50 m height, which later rose 20-25 m high. Lava erupted from fissures on the down dropped block and expanded W toward Halema’uma’u crater. Data from a laser rangefinder recorded about 2.5 m thick of new lava added to the W part of the crater. Sulfur dioxide emissions were elevated in the eruptive area during 1600-1500 on 10 September, measuring at least 100,000 t/d.
At 0810 on 11 September HVO lowered the VAL and ACC back to Watch and Orange due to the style of eruption and the fissure location had stabilized. The initial extremely high effusion rates had declined (but remained at high levels) and no infrastructure was threatened. An eruption plume, mainly comprised of sulfur dioxide and particulates, rose as high as 3 km altitude. Several lava fountains were active on the W side of the down dropped block during 11-15 September, while the easternmost vents on the down dropped block and the westernmost vents in the crater became inactive on 11 September (figure 534). The remaining vents spanned approximately 750 m and trended roughly E-W. The fed channelized lava effusions flowed N and W into Halema’uma’u. The E rim of the crater was buried by new lava flows; pahoehoe lava flows covered most of the crater floor except areas of higher elevation in the SW part of the crater. The W part of the crater filled about 5 m since the start of the eruption, according to data from a laser rangefinder during 11-12 September. Lava fountaining continued, rising as high as 15 m by the morning of 12 September. During the morning of 13 September active lava flows were moving on the N and E parts of the crater. The area N of the eruptive vents that had active lava on its surface became perched and was about 3 m higher than the surrounding ground surface. By the morning of 14 September active lava was flowing on the W part of the down dropped block and the NE parts of the crater. The distances of the active flows progressively decreased. Spatter had accumulated on the S (downwind) side of the vents, forming ramparts about 20 m high.
Vigorous spattering was restricted to the westernmost large spatter cone with fountains rising 10-15 m high. Minor spattering occurred within the cone to the E of the main cone, but HVO noted that the fountains remained mostly below the rim of the cone. Lava continued to effuse from these cones and likely from several others as well, traveled N and W, confined to the W part of the down-dropped block and the NE parts of Halema’uma’u. Numerous ooze-outs of lava were visible over other parts of the crater floor at night. Laser range-finder measurements taken of the W part of the crater during 14-15 September showed that lava filled the crater by 10 m since the start of the eruption. Sulfur dioxide emissions remained elevated after the onset of the eruption, ranging 20,000-190,000 t/d during the eruption activity, the highest of which occurred on 10 September.
Field crews observed the eruptive activity on 15 September; they reported a notable decrease or stop in activity at several vents. Webcam images showed little to no fountaining since 0700 on 16 September, though intermittent spattering continued from the westernmost large cone throughout the night of 15-16 September. Thermal images showed that lava continued to flow onto the crater floor. On 16 September HVO reported that the eruption stopped around 1200 and that there was no observable activity anywhere overnight or on the morning of 17 September. HVO field crews reported that active lava was no longer flowing onto Halema’uma’u crater floor and was restricted to a ponded area N of the vents on the down dropped block. They reported that spattering stopped around 1115 on 16 September. Nighttime webcam images showed some incandescence on the crater floor as lava continued to cool. Field observations supported by geophysical data showed that eruptive tremor in the summit region decreased over 15-16 September and returned to pre-eruption levels by 1700 on 16 September. Sulfur dioxide emissions were measured at a rate of 800 t/d on 16 September while the eruption was waning, and 200 t/d on 17 September, which were markedly lower compared to measurements taken the previous week of 20,000-190,000 t/d.
Geologic Background. Kilauea overlaps the E flank of the massive Mauna Loa shield volcano in the island of Hawaii. Eruptions are prominent in Polynesian legends; written documentation since 1820 records frequent summit and flank lava flow eruptions interspersed with periods of long-term lava lake activity at Halemaumau crater in the summit caldera until 1924. The 3 x 5 km caldera was formed in several stages about 1,500 years ago and during the 18th century; eruptions have also originated from the lengthy East and Southwest rift zones, which extend to the ocean in both directions. About 90% of the surface of the basaltic shield volcano is formed of lava flows less than about 1,100 years old; 70% of the surface is younger than 600 years. The long-term eruption from the East rift zone between 1983 and 2018 produced lava flows covering more than 100 km2, destroyed hundreds of houses, and added new coastline.
Information Contacts: Hawaiian Volcano Observatory (HVO), U.S. Geological Survey, PO Box 51, Hawai'i National Park, HI 96718, USA (URL: http://hvo.wr.usgs.gov/).
Tinakula (Solomon Islands) — December 2023 Cite this Report
Tinakula
Solomon Islands
10.386°S, 165.804°E; summit elev. 796 m
All times are local (unless otherwise noted)
Continued lava flows and thermal activity during June through November 2023
Tinakula is a remote 3.5 km-wide island in the Solomon Islands, located 640 km ESE of the capital, Honiara. The current eruption period began in December 2018 and has more recently been characterized by intermittent lava flows and thermal activity (BGVN 48:06). This report covers similar activity during June through November 2023 using satellite data.
During clear weather days (20 July, 23 September, 23 October, and 12 November), infrared satellite imagery showed lava flows that mainly affected the W side of the island and were sometimes accompanied by gas-and-steam emissions (figure 54). The flow appeared more intense during July and September compared to October and November. According to the MODVOLC thermal alerts, there were a total of eight anomalies detected on 19 and 21 July, 28 and 30 October, and 16 November. Infrared MODIS satellite data processed by MIROVA (Middle InfraRed Observation of Volcanic Activity) detected a small cluster of thermal activity occurring during late July, followed by two anomalies during August, two during September, five during October, and five during November (figure 55).
Geologic Background. The small 3.5-km-wide island of Tinakula is the exposed summit of a massive stratovolcano at the NW end of the Santa Cruz islands. It has a breached summit crater that extends from the summit to below sea level. Landslides enlarged this scarp in 1965, creating an embayment on the NW coast. The Mendana cone is located on the SE side. The dominantly andesitic volcano has frequently been observed in eruption since the era of Spanish exploration began in 1595. In about 1840, an explosive eruption apparently produced pyroclastic flows that swept all sides of the island, killing its inhabitants. Recorded eruptions have frequently originated from a cone constructed within the large breached crater. These have left the upper flanks and the steep apron of lava flows and volcaniclastic debris within the breach unvegetated.
Information Contacts: MIROVA (Middle InfraRed Observation of Volcanic Activity), a collaborative project between the Universities of Turin and Florence (Italy) supported by the Centre for Volcanic Risk of the Italian Civil Protection Department (URL: http://www.mirovaweb.it/); Hawai'i Institute of Geophysics and Planetology (HIGP) - MODVOLC Thermal Alerts System, School of Ocean and Earth Science and Technology (SOEST), Univ. of Hawai'i, 2525 Correa Road, Honolulu, HI 96822, USA (URL: http://modis.higp.hawaii.edu/); Copernicus Browser, Copernicus Data Space Ecosystem, European Space Agency (URL: https://dataspace.copernicus.eu/browser/).
Search Bulletin Archive by Publication Date
Select a month and year from the drop-downs and click "Show Issue" to have that issue displayed in this tab.
The default month and year is the latest issue available.
Bulletin of the Global Volcanism Network - Volume 43, Number 06 (June 2018)
Chillan, Nevados de (Chile)
Hundreds of ash-bearing explosions; dome appears in crater in mid-December 2017
Ebeko (Russia)
Ash explosions remained frequent through May 2018, with plumes typically rising more than 1 km
Kirishimayama (Japan)
Ash plumes and lava flows at Shinmoedake starting in March 2018; explosion at Iwo-yama
Langila (Papua New Guinea)
Gradual decline in activity after July 2017, but continuing through May 2018
Marapi (Indonesia)
Two explosions during April-May 2018 cause ashfall to the southeast
Masaya (Nicaragua)
Lava lake persists during July 2017-April 2018
Nyiragongo (DR Congo)
Thermal anomalies show that lava lake remains active through May 2018
Sabancaya (Peru)
Strong, sporadic explosions with ash plumes throughout December 2017-May 2018
San Cristobal (Nicaragua)
Moderate explosion on 22 April 2018
San Miguel (El Salvador)
Intermittent small ash emissions between 14 January and 30 May 2018
Nevados de Chillan (Chile) — June 2018 Cite this Report
Nevados de Chillan
Chile
36.868°S, 71.378°W; summit elev. 3180 m
All times are local (unless otherwise noted)
Hundreds of ash-bearing explosions; dome appears in crater in mid-December 2017
Nevados de Chillán is a complex of late-Pleistocene to Holocene stratovolcanoes constructed in the Chilean Central Andes. The Nuevo and Arrau craters are adjacent vents on the NW flank of the cone of the large stratovolcano referred to as Volcán Viejo. An eruption started with a phreatic explosion and ash emission on 8 January 2016 from a new crater on the E flank of Nuevo. Explosions continued through September 2017 with ash plumes rising several kilometers and Strombolian activity sending ejecta hundreds of meters (BGVN 42:10). This report covers continuing activity from September 2017-May 2018. Information for this report is provided by Chile's Servicio Nacional de Geología y Minería (SERNAGEOMIN)-Observatorio Volcanológico de Los Andes del Sur (OVDAS), Oficina Nacional de Emergencia-Ministerio del Interior (ONEMI), and by the Buenos Aires Volcanic Ash Advisory Center (VAAC).
About 150 ash-bearing explosions were recorded during September and October 2017, with plumes rising almost 2 km above the summit. Activity decreased during the second half of October, and no ash plumes were recorded during November. A significant increase in activity in early December led to over 200 explosions with ash emissions. An overflight on 21 December 2017 produced images of a fissure at the bottom of the new crater. The presence of a growing lava dome in the crater was confirmed in early January 2018. Frequent Strombolian explosions produced nighttime incandescence at the summit and down the flanks. Hundreds of ash-bearing explosions occurred during February 2018; the largest plume rose 2.5 km above the summit, and many smaller pulses produced ash and steam that rose 1.5 km. Sporadic incandescence at night and continued explosions of magmatic gases were typical during March 2018. A large explosion on 31 March coincided with the first appearance of a low-level MODIS thermal anomaly in the MIROVA data, and incandescence from explosions at night indicated that the dome continued to grow during April and May. SERNAGEOMIN reported that the top of the lava dome was visible from the E flank for the first time at the end of May 2018.
Activity during September-December 2017. SERNAGEOMIN reported 117 ash-bearing explosions between 16 and 30 September 2017 (figure 17). The one that released the most energy occurred on 19 September. The plumes of steam and ash rose up to 1,800 m above the crater. The Buenos Aires VAAC observed a narrow plume of ash in satellite imagery moving N at 3.9 km altitude and dissipating rapidly on 15 September, and a similar plume moving SE near the summit on 26 September 2017.
During the first two weeks of October 2017 there were 30 ash-bearing explosions recorded. The Buenos Aires VAAC reported small sporadic puffs of ash on 6 October 2017 that were visible in the webcam (figure 18), but not in satellite data, and a similar dense but short-lived plume on 14 October. SERNAGEOMIN reported a series of pulsating low-energy explosions visible in the webcam that drifted SW on 11 and 12 October 2017, and rose no more than 1 km above the summit.. Only two ash-bearing explosions were recorded during the second half of the month. The volcano was much quieter during November; plumes of steam were observed rising only 100 m above the summit throughout the month, with no ash-bearing plumes reported.
A significant increase in activity in early December 2017 resulted in 245 explosions associated with ash emissions during the first two weeks, some rising as high as 3,000 m above the summit. The Buenos Aires VAAC reported a puff of ash on 1 December that rose to 3.7 km altitude and drifted S, dissipating rapidly. The next day another plume rose slightly higher, to 4.3 km. A dense emission on 4 December rose to 4.9 km and drifted SE before dissipating in a few hours and was not visible in satellite data. On 11 and 14 December, short-lived emissions rose to 4.3 km (figure 19). A yellow cloud of sulfur formed on 11 December within 300 m of the active crater. The webcams also recorded sporadic nighttime incandescence during increased explosions in the early morning of 14 December. Continuous steam emissions with pulses of minor ash were first noted on 16 December; they were visible in satellite imagery the next day at 3.9-4.3 km altitude drifting NE, and by 18 December, consisted only of water vapor.
In a special report released on 19 December, OVDAS-SERNAGEOMIN reported an increase in surface activity over the previous three days, recording minor explosions averaging four per hour, and seismic pulses lasting 5-10 minutes; they also noted harmonic tremor with the increase in explosion frequency. A detailed review of images taken during an overflight on 21 December revealed a fissure 30-40 m long trending NW at the bottom of the crater. Incandescence at night was regularly observed after 20 December (figure 20), and ash emissions rose to 3,000 m above the summit during the second half of the month.
Activity during January-April 2018. SERNAGEOMIN volcanologists identified a growing lava dome within the new crater during two overflights on 9 and 12 January 2018 (figures 21); it was emerging from the fissure first identified on 21 December. During the first two weeks of January SERNAGEOMIN reported 1,027 pulsating explosions associated primarily with magmatic gases, and very little ash that rose up to 1,000 m above the summit. Confirmed ash emissions were reported on 11 January at 4.3 km altitude faintly visible moving SE in satellite imagery, according to the Buenos Aires VAAC. Nighttime incandescence from the growing dome was periodically observed (figure 22). Based on the overflight data and satellite imagery, they calculated a growth rate for the dome of 1,360 m3 per day. They estimated the size at 37,000 m3 by mid-month.
Overflights on 23 and 31 January measured temperatures of 305-480°C over the surface of the dome, with the highest values at the fissure. The growth rate calculated after these overflights was 2,540 m3 per day. The webcam revealed emissions of ash and water vapor during the second half of the month that rose less than 1,000 m above the summit crater.
An explosion on 2 February 2018 sent an ash plume to 2,500 m above the summit (figure 23). Vibrations from the explosion were reported in Las Trancas (10 km) and at the Gran Hotel Termas de Chillan (5 km). SERNAGEOMIN began referring to the active crater as Nicanor, and the dome was named Gil-Cruz. During the first two weeks of February, 840 explosions associated with plumes of magmatic gases were reported. The plumes generally rose as high as 1,500 m above the summit and were often accompanied by incandescence at night. Two overflights on 7 and 14 February recorded temperatures of 500 and 550°C. SERNAGEOMIN determined a dome growth rate of 1,389 m3 per day, and a total volume of 82,500 m3 by mid-month. At least four explosions on 14 February were characterized by two simultaneous plumes, one of white steam and the other darker with a higher ash content according to SERNAGEOMIN. The highest plume that day reached 1,200 m above the summit crater. The Buenos Aires VAAC also reported a small pulse of ash on 14 February that rose to 4.6 km altitude and drifted SE. The dome continued to grow slowly during the rest of February, with a small increase in size noted during a 22 February flyover. Plumes of mostly water vapor with minor ash rose a maximum of 1,080 m above the summit during the hundreds of small explosions that took place.
Sporadic incandescence at night and continued explosions of magmatic gases were typical during March 2018, with plume heights reaching 2,000 m over the Nicanor crater. During an overflight on 11 March, a temperature of 330°C was measured around the Gil-Cruz dome, which had grown to a volume of about 100,000 m3 but still remained below the crater rim. Morphological changes in the still-slowly growing dome included fracture lines and unstable large vertical blocks. A significant decrease in seismic energy was noted beginning on 24 March that ended when two larger explosions occurred on 30 and 31 March (figure 24).
During an overflight on 3 April 2018, scientists observed energetic pulses of steam and minor ash from the central NW-SE trending fissure inside the crater. They noted that lapilli from explosions had been ejected as far as 1 km from the fissure, and that the Gil-Cruz dome had increased in volume since 11 March; they also observed an area of subsidence on the top of the growing dome (figure 25). The dome was expanding toward the E side of the crater, and the top of the dome rose above the crater rim. They measured a maximum temperature of 670°C on the surface of the dome. The decrease in daily seismicity, the larger explosions of the previous days, and the increased size of the dome with greater risk of collapse, pyroclastic flows, and lahars, all led SERNAGEOMIN to raise the alert level at Chillan to Orange on 5 April 2018.
The Buenos Aires VAAC reported continuous emissions of steam and gas with minor ash along with a small pulse of ash on 2 April 2018. Low-altitude plumes of mostly water vapor were common throughout April 2018. Incandescence from explosions was visible on clear nights during the month, and ejecta rose as high as 250 m above the crater and was scattered around the crater rim. Seismicity remained constant at moderate levels related to the repeated explosions and the growth of the dome. A faint ash plume could be seen in visible satellite imagery on 18 April at 3.7 km altitude drifting E.
Observations reported on 1 May 2018 from the previous flyover indicated that the rate of growth of the dome had slowed to about 690 m3 per day, and the estimated volume had grown to about 150,000 m3. Activity remained at similar levels throughout May 2018. Seismic instruments recorded long-period seismicity and tremor episodes similar to previous months that corresponded with surface explosions and the extrusion of the lava dome. Seismic energy levels were moderate but fluctuated at times. Plumes of predominantly water vapor with minor gas rose a few hundred meters above the summit drifting generally S or SE before dissipating. Incandescence was often observed on clear nights, accompanied by ejection of incandescent blocks that were observed generally 100 to 150 m above the active crater. A larger explosive event took place on 7 May. Occasional plumes with minor ash were reported on 11 May. SERNAGEOMIN reported on 24 May 2018 that the top of the lava dome was visible from the E flank.
Geologic Background. The compound volcano of Nevados de Chillán is one of the most active of the Central Andes. Three late-Pleistocene to Holocene stratovolcanoes were constructed along a NNW-SSE line within three nested Pleistocene calderas, which produced ignimbrite sheets extending more than 100 km into the Central Depression of Chile. The dominantly andesitic Cerro Blanco (Volcán Nevado) stratovolcano is located at the NW end of the massif. Volcán Viejo (Volcán Chillán), which was the main active vent during the 17th-19th centuries, occupies the SE end. The Volcán Nuevo lava-dome complex formed during 1906-1945 on the NW flank of Viejo. The Volcán Arrau dome complex was then constructed on the SE side of Volcán Nuevo between 1973 and 1986, and eventually exceeded its height. Smaller domes or cones are present in the 5-km valley between the two major edifices.
Information Contacts: Servicio Nacional de Geología y Minería, (SERNAGEOMIN), Observatorio Volcanológico de Los Andes del Sur (OVDAS), Avda Sta María No. 0104, Santiago, Chile (URL: http://www.sernageomin.cl/); Oficina Nacional de Emergencia - Ministerio del Interior (ONEMI), Beaucheff 1637/1671, Santiago, Chile (URL: http://www.onemi.cl/); Buenos Aires Volcanic Ash Advisory Center (VAAC), Servicio Meteorológico Nacional-Fuerza Aérea Argentina, 25 de mayo 658, Buenos Aires, Argentina (URL: http://www.smn.gov.ar/vaac/buenosaires/inicio.php); MIROVA (Middle InfraRed Observation of Volcanic Activity), a collaborative project between the Universities of Turin and Florence (Italy) supported by the Centre for Volcanic Risk of the Italian Civil Protection Department (URL: http://www.mirovaweb.it/).
Ebeko
Russia
50.686°N, 156.014°E; summit elev. 1103 m
All times are local (unless otherwise noted)
Ash explosions remained frequent through May 2018, with plumes typically rising more than 1 km
The most recent eruption at Ebeko, a remote volcano in the Kuril Islands, began in October 2016 (BGVN 42:08) with explosive eruptions accompanied by ashfall. Frequent ash explosions were observed through November 2017 and the eruption remained ongoing at that time (BGVN 43:03). Activity consisting of explosive eruptions, ash plumes, and ashfalls continued during December 2017 through May 2018 (table 6). Eruptions were observed by residents in Severo-Kurilsk (about 7 km E), by volcanologists, and based on satellite imagery. The Kamchatkan Volcanic Eruption Response Team (KVERT) is responsible for monitoring Ebeko, and is the primary source of information. The Aviation Color Code (ACC) remained at Orange throughout this reporting period. This color is the second highest level of the four color scale.
Table 6. Summary of activity at Ebeko volcano from December 2017 to May 2018. Aviation Color Code (ACC) is a 4-color scale. Data courtesy of KVERT
| Date |
Plume Altitude |
Plume Distance |
Plume Direction |
Other observations |
| 1-4 and 7 Dec 2017 |
2 km |
-- |
-- |
ACC at Orange. Ashfall reported in Severo-Kurilisk. Explosions on 2-4 and 7 Dec. |
| 8, 9, 11 Dec 2017 |
2.3 km |
-- |
-- |
Explosions. |
| 16, 18-19, and 21-22 Dec 2017 |
3.5 km |
16 km |
SSW |
Explosions. Ash plume and weak thermal anomaly on 16 Dec. |
| 25 Dec 2017 |
1.5 km |
-- |
-- |
Explosion. |
| 01-05 Jan 2018 |
-- |
-- |
-- |
No activity noted. |
| 08-10 Jan 2018 |
2.5 km |
-- |
-- |
Explosions. |
| 11-12, 14-16, and 18 Jan 2018 |
3.1 km |
-- |
-- |
Explosion. Minor ashfall reported in Severo-Kurilsk on 15,16, and 18 Jan. |
| 22-23 Jan 2018 |
2 km |
-- |
-- |
Explosions. |
| 26-27 and 29-31 Jan 2018 |
2.5 km |
-- |
-- |
Explosions. Ashfall reported in Severo-Kurilsk on 29 Jan. |
| 05-08 Feb 2018 |
2.4 km |
-- |
-- |
Explosions. Ashfall reported in Severo-Kurilisk on 8 Feb. |
| 09-10 and 14 Feb 2018 |
2.2 km |
-- |
-- |
Explosions. |
| 17-18 and 20-21 Feb 2018 |
2.4 km |
-- |
-- |
Explosions. Ashfall reported in Severo-Kurilisk on 17-18 Feb. |
| 23-25 and 27-28 Feb 2018 |
3.3 km |
-- |
-- |
Explosions. |
| 06 Mar 2018 |
1.7 km |
-- |
-- |
Explosions. |
| 12-13 Mar 2018 |
2.7 km |
-- |
-- |
Explosions. |
| 18 and 21-22 Mar 2018 |
1.8 km |
-- |
-- |
Explosions. Ashfall reported in Severo-Kurilisk on 17 and 21 Mar. |
| 23-25 and 28-29 Mar 2018 |
2.3 km |
-- |
-- |
Explosions. |
| 31 Mar-06 Apr 2018 |
2.7 km |
-- |
-- |
Explosions. |
| 07 and 11-12 Apr 2018 |
1.8 km |
-- |
-- |
Explosions. Ashfall reported in Severo-Kurilisk on 6 Apr. |
| 15 and 17-19 Apr 2018 |
2.6 km |
-- |
-- |
Explosions. |
| 21 and 25 Apr 2018 |
2.5 km |
-- |
-- |
Explosions. |
| 01-03 May 2018 |
2.8 km |
-- |
-- |
Explosions. |
| 04 and 06-10 May 2018 |
2.4 km |
-- |
-- |
Explosions. |
| 12-14 May 2018 |
2.8 km |
21 km |
SW |
Explosions. Ash plume drifted SW on 13 May. |
Minor ash explosions were reported throughout the period from December 2017 through May 2018 (figure 17). Minor amounts of ash fell in Severo-Kurilisk at the end of 2017 and into 2018. Ash was reported on 2-4, and 7 December 2017; 15, 16, 18, and 29 January 2018; 8, 17, and18 February; 17 and 21 March; and 6 April. Ash plume altitudes during this reporting period ranged from 1.5 to 3.5 km (table 6); the summit is at 1.1 km.
Geologic Background. The flat-topped summit of the central cone of Ebeko volcano, one of the most active in the Kuril Islands, occupies the northern end of Paramushir Island. Three summit craters located along a SSW-NNE line form Ebeko volcano proper, at the northern end of a complex of five volcanic cones. Blocky lava flows extend west from Ebeko and SE from the neighboring Nezametnyi cone. The eastern part of the southern crater contains strong solfataras and a large boiling spring. The central crater is filled by a lake about 20 m deep whose shores are lined with steaming solfataras; the northern crater lies across a narrow, low barrier from the central crater and contains a small, cold crescentic lake. Historical activity, recorded since the late-18th century, has been restricted to small-to-moderate explosive eruptions from the summit craters. Intense fumarolic activity occurs in the summit craters, on the outer flanks of the cone, and in lateral explosion craters.
Information Contacts: Kamchatka Volcanic Eruptions Response Team (KVERT), Far Eastern Branch, Russian Academy of Sciences, 9 Piip Blvd., Petropavlovsk-Kamchatsky, 683006, Russia (URL: http://www.kscnet.ru/ivs/kvert/); Institute of Volcanology and Seismology, Far Eastern Branch, Russian Academy of Sciences (IVS FEB RAS), 9 Piip Blvd., Petropavlovsk-Kamchatsky 683006, Russia (URL: http://www.kscnet.ru/ivs/eng/).
Kirishimayama (Japan) — June 2018 Cite this Report
Kirishimayama
Japan
31.934°N, 130.862°E; summit elev. 1700 m
All times are local (unless otherwise noted)
Ash plumes and lava flows at Shinmoedake starting in March 2018; explosion at Iwo-yama
Kirishimayama is a large group of more than 20 Quaternary volcanoes located N of Kagoshima Bay, Japan (figure 22). For the last 1,000 years, repeated eruptions have taken place at two locations in the complex: the Ohachi crater on the W flank of the Takachihomine stratovolcano, and the Shinmoedake stratovolcano 4 km NW of Ohachi. A single eruption was reported in 1768 from the Iwo-yama (Ebino Kogen) dome located on the NW flank of the Karakunidake stratovolcano, about 5 km NW of Shinmoedake.
The last confirmed eruption at the Ohachi crater was in July 1923. Intermittent steam plumes have been observed since then, including in December 2003 (BGVN 33:09), but the Japan Meteorological Agency (JMA) noted that it had been quiet since 1 December 2007. Shinmoedake has been the site of several short-lived eruptive events since 2008. Most of the events were single-day explosions with ash emissions (BGVN 35:12). A more protracted event from January to September 2011 included numerous explosions with ash plumes, which produced ashfall tens of kilometers away, the growth of a lava dome, ejecta of large blocks, and small pyroclastic flows (BGVN 36:07). Shinmoedake remained quiet until seismicity increased on 23 September 2017, followed by several explosions during October 2017 (BGVN 43:01). Seismic unrest was first reported from the area around Iwo-yama in December 2013, and it has been regularly monitored since that time. This report covers activity from November 2017 through May 2018 and includes new explosive events at Shinmoedake during March-May 2018, an explosive event at Iwo-yama in April 2018, and a brief increase in seismicity at Ohachi in February 2018. Information is provided primarily by the JMA and the Tokyo Volcanic Ash Advisory Center (VAAC), with additional satellite data and news media reports.
Summary of activity during November 2017-May 2018. After steam plumes disappeared at Ohachi in mid-2006, only minor intermittent seismicity was reported through 2017. A sudden increase in earthquakes and tremor activity on 9 February 2018 led JMA to raise the 5-level Alert Level system from 1 (potential for increased activity) to 2 (do not approach the crater) for about a month. Activity diminished after the middle of February and Ohachi remained quiet through May 2018, with only a continuing modest thermal anomaly at the crater.
The latest eruptive episode at Shinmoedake, during 11-17 October 2017, generated an SO2 plume recorded by NASA satellites, caused ashfall up to 100 km away, and created a new vent about 80 m in diameter on the E side of the crater. Intermittent earthquakes and tremors along with low-level steam plumes characterized activity during November 2017-February 2018. A new eruptive episode began on 1 March 2018 with near-constant explosive activity that lasted until 10 March. A new lava flow at the summit was first observed by JMA on 6 March and began to overflow the NW rim of the crater on 9 March. The Tokyo VAAC reported ash plumes over 6 km altitude on 10 March. An explosion on 5 April produced the largest ash plume of the period; it rose to 10.1 km altitude, was visible drifting E for 24 hours, and resulted in significant ashfall in the region. The lava flow had ceased advancing down the NW flank by the end of April. Another explosion on 14 May 2018 generated an ash plume that rose to 7.3 km altitude and caused ashfall 30 km S that covered the roadways.
An increase in seismicity at Iwo-yama in December 2013, followed by a 7-minute-period of tremor activity in August 2014 was the first recorded at the site since 1768. Thermal anomalies and weak fumarolic activity first appeared in December 2015. Seismicity, including intermittent tremor events and larger amplitude earthquakes, gradually increased during 2016 and 2017. Intermittent fumarolic activity and temperature anomalies began to increase measurably in mid-2017. Jets of sediment-laden hot water emerged from several vents early in 2017. A further increase in fumarolic activity and the temperature of the thermal anomalies in February 2018 led JMA to raise the Alert Level at Iwo-yama. Large amplitude earthquakes and a tremor event accompanied an ash-bearing explosion on 19 April 2018 from a vent on the S side of Iwo-yama. The following day, a vent opened 500 m to the W and produced vigorous steam emissions. On 26 April 2018 an explosion from the new vent sent ash 200 m high. Jets of hot water continued at the Iwo-yama vents through May 2018.
Activity at Ohachi during 2003-May 2018. JMA reported tremor activity with epicenters near Ohachi in mid-December 2003 (BGVN 33:09) that was followed by fumarolic activity for a few weeks. Intermittent steam plumes were observed during 2004; on 26 March 2004 a tremor event lasted for four hours and a steam plume rose 800 m above the crater (figure 23). A few periods of microtremor were recorded, and intermittent fumarolic activity was observed with webcams until March 2006, after which most activity ceased. JMA lowered the 5-level Alert Level from 2 (Do not approach the crater) to 1 (Potential for increased activity) on 22 May 2006. Fumarolic activity was not observed after July 2006, and no new thermal activity was reported during a field visit in October 2006. Minor seismicity was reported for a few days during July 2007, and small-amplitude, short-duration tremor activity was occasionally recorded during 2008-2014.
Although earthquake activity increased slightly in July 2015, the warning level was not raised, and no surface fumarolic activity was observed during field visits in August and September 2015 (figure 24). Seismic activity remained elevated at Ohachi through February 2016 and then gradually decreased during March. Although tremors were recorded in May and December 2016, there was no change in condition at the site and seismicity continued to decrease; no tremors were recorded during 2017.
Earthquake frequency on the SW side of Ohachi increased during 9-16 February 2018, resulting in 199 seismic events, and tremor activity was also recorded on 9 February. This activity led JMA to increase the Alert Level to 2 on 9 February 2018. In spite of the increased seismic activity, the thermal activity remained unchanged from previous months with continued minor thermal anomalies in the same areas as before (figure 25). Seismicity decreased significantly during March 2018 to only 13 volcanic earthquakes, and no microtremor activity was recorded. Inspections carried out on 11 and 14 March showed no surface changes (figure 26) and resulted in JMA lowering the Alert Level back to 1 on 15 March 2018. Ohachi remained quiet through May 2018.
Activity at Shinmoedake during August 2008-October 2017. An explosion on 22 August 2008 lasted for about six hours and produced ashfall in Kobayashi City (10 km NE) (BGVN 33:09). Seismicity had increased rapidly a few days prior to the explosion, and then decreased gradually for the remainder of 2008. Other than a brief increase in seismicity in May the following year, only steam plumes rising about 100 m from the crater were reported for 2009.
Seven small ash-bearing explosive events were reported during March-July 2010. Small-amplitude tremor activity on 30 March 2010 was accompanied by a plume that rose 400 m above the crater rim; a small amount of ash fell 400 m to the W of the fumarole within the crater. The webcam on the S rim of the crater captured a grayish plume rising 300 m after a small explosion on 17 April 2010. Another small explosion on 27 May produced a grayish-white plume that rose 100 m above the crater rim and resulted in minor ashfall NE in Kobayashi City. Officials noted a new fumarole on the W flank after this event. Two more explosions on 27 and 28 June 2010 resulted in a small amount of ash deposited 10 km E of Shinmoedake. A small explosion was reported on 5 July. On 10 July, a grayish-white plume, observed in the webcam, rose 100 m above the crater rim after an explosion, and a small low-temperature pyroclastic surge flowed 300 m down the SW slope. GPS instruments recorded minor inflation from December 2009 through September 2010.
A new, more substantial, eruption began at Shinmoedake on 19 January 2011. Activity increased on 26 January with an explosion that released a large volume of ash and pumice and included the growth of a new lava dome (BGVN 35:12, 36:07). Thirteen additional explosions occurred through 1 March 2011. Activity became more intermittent after mid-February, and the last emission was reported on 7 September 2011. Seismicity declined significantly in March 2012 and had returned to background levels by May 2012. With no surface changes and very low seismicity, JMA reduced the Alert Level from 3 to 2 on 22 October 2013, and the only reported activity was steam plumes rising 50-200 m above the crater rim during 2013. The lava dome in the crater remained about 600 m in diameter. Inflation had slowed and stopped after December 2011 but began again around December 2013. Shallow, low-level seismicity during 2014 with epicenters near Shinmoedake was distributed within a few kilometers below the summit; there were no surface changes observed at the crater during several overflights conducted by the Japan Maritime Self Defense Force throughout the year.
Occasional steam plumes rising 400 m above the crater rim were reported during 2015. Volcanic earthquakes were intermittent, with brief increases in activity during March-May and October- December with roughly the same number as the previous year. Inflationary deformation that began around December 2013 ceased in January 2015. A very brief tremor on 1 March 2015 was the first recorded since 1 February 2012. During 2016, occasional steam plumes rose 300 m above the crater. In spite of a seismic swarm on 23 February 2016, and a general increase in seismicity throughout the year, no eruptions occurred, and no surface changes were observed. JMA kept the Alert Level at 2 throughout the year. A small tremor event on 17 September was the only recorded during 2016. Very little activity was reported from January to September 2017; occasional steam plumes were reported rising 400 m above the crater rim. JMA lowered the Alert Level from 2 to 1 on 26 May 2017.
A minor increase in seismicity was observed beginning in July 2017, and was followed by a marked increase on 23 September. After a further increase in frequency and amplitude of earthquakes on 4 October, JMA raised the Alert Level to 2 for Shinmoedake on 5 October 2017. This was followed by an eruption that began on 11 October 2017. A new vent was observed on the E side of the crater during an overflight that same day, and ashfall was reported in numerous communities as far as 90 km NE (BGVN 43:01). A significant SO2 plume was measured by the OMI instrument on the Aura satellite the following day (figure 27). After raising the Alert Level to 3 on 11 October, JMA expanded the restricted area radius from 2-3 km during 15-31 October.
Explosions on 14 October 2017 resulted in confirmed ashfall in Kagoshima city (50 km SW), Takahara Town (15 km E), Kobayashi city (25 km NE), Saito city (55 km NE), Hyuga city (90 km NE), and Misato town (75 km NE). Ongoing explosions continued until 17 October, after which persistent steam plumes were observed rising as high as 600 m above the crater. In an overflight conducted on 23 October JMA scientists noted the new vent was about 80 m in diameter, and ejecta from the vent had formed a small cone around the vent. (figure 28).
Activity at Shinmoedake during November 2017-March 2018. After the eruption of 11-17 October 2017 seismicity decreased significantly, and no morphological changes were observed for the remainder of the year. Steam plumes rose 300-500 m above the crater during November and December. Short-duration tremors were detected during 25-29 November, along with a slight increase in the number of volcanic earthquakes. A small earthquake swarm recorded during 2-4 December was the only significant seismic activity that month.
Infrequent, large-amplitude earthquakes were recorded during 15-17 January 2018, along with a few short-duration tremor events, the first since 29 November 2017. The earthquakes were located within a 1 km radius of Shinmoedake, around 2-4 km deep. Steam plumes at the crater rose no more than 100 m most days; occasional plumes rising as high as 200 m were noted. An earthquake swarm on 25 February was the first notable event of the month; the steam plumes remained under 100 m above the crater, except for a 500-m-high plume on 21 February. Thermal imaging surveys in late February indicated a modest increase in heat flow from fractures inside the crater and on the W slope compared with previous measurements.
Earthquakes with shallow epicenters below Shinmoedake increased in number early on 1 March 2018 and a new eruptive episode followed a few hours later, leading JMA to increase the restricted zone to 3 km around the crater (figure 29). SO2 emissions also increased sharply. By the afternoon of 1 March an ash plume rose 1,500 m above the crater, emerging from the vent on the E side and drifting SE. Ashfall was confirmed on 1 March in the area up to 18 km E of the crater. Large blocks of ejecta were observed within the crater on 5 March.
During an overflight on 6 March 2018, JMA witnessed a new lava flow covering a large area on the E side of the crater floor (figure 30). Eighteen explosive eruptions occurred on 6 March and JMA reported that the ash plume rose 2,800 m above the crater (figure 31). Ashfall was confirmed SW of Shinmoedake in Shibushi city (50 km SSE), Tarumizu City (50 km SSW) and Aira City (30 km SW). NASA 's Aqua satellite captured a false color image of the eruption on 6 March showing the ash plume drifting SE and SW from Shinmoedake (figure 32). About 80 flights in and out of nearby Kagoshima airport were canceled.
Tremor events occurred continuously over 1-8 March; forty-seven explosions were recorded between 6 and 8 March; they decreased in frequency after the middle of the month. The OMI instrument on the NASA Aura satellite recorded a significant SO2 plume on 7 March 2018 (figure 33). Geospatial data that had shown a gradual inflation of the Kirishimayama complex since July 2017 showed a sharp deflation during 6-7 March 2018, after which inflation resumed.
During an overflight on 9 March 2018, a staff member from the Geographical Survey Institute observed the lava flow beginning to overflow the NW side of the crater (figure 34). Explosions resulted in ejecta traveling 800 m from the crater on 9 March and an ash plume rising 3,200 m. An increase in the intensity of activity the following day sent ejecta 1,800 m from the vent and generated an ash plume that rose 4,500 m (figure 35); this led JMA to increase the restricted area around the crater to 4 km between 10 and 15 March.
A thermal image taken on 11 March showed that the lava was moving very slowly down the NW flank, advancing only a few tens of meters since 9 March (figure 36). JMA confirmed during an overflight on 14 March that the lava flowing down the NW flank was about 200 m wide. Two explosions on 25 March produced plumes that rose 3,200 and 2,100 m, ejecta that traveled 800 m, and a small pyroclastic flow that advanced about 400 m down the W flank (figure 37). Although analysis of satellite data by Japan's Geographical Survey Institute suggested that the eruption of lava into the crater had ceased by 9 March, it continued to flow slowly down the NW flank for several weeks. The diameter of the flow inside the crater was about 700 m, and it had traveled about 85 m down the NW flank by 28 March (figure 38).
The Tokyo VAAC issued multiple daily reports from 1-15 March 2018, and a few intermittent reports during the rest of the month. JMA usually reports plume heights in meters above the crater and the Tokyo VAAC reports them as altitudes above sea level; conversions are noted where the height or altitude of a plume is exceptional. They reported an ash plume drifting SE on 1 March at 1.5 km altitude; the plume had risen to 2.4 km by the end of the day. The following day a plume was visible in satellite images at 2.1 km altitude drifting E. Continuous emissions drifting NE above 2.4 km altitude were reported on 3 and 4 March. Several explosions generated plumes that were visible in satellite imagery during 5-7 March drifting S, SW, and W at altitudes between 3.0 and 4.6 km. Plumes from larger explosions during 9 and 10 March rose to altitudes between 4.3 and 6.1 km and drifted SE, finally dissipating after about 24 hours. Explosions on 12 and 13 March drifted NE and E at 3.4-4.9 km altitude, with continuous emissions visible in satellite imagery during those days. Two explosions on 24 March produced plumes that drifted SE at 3.7 and 4.9 km altitude, and were visible in satellite imagery until they dissipated the next day.
A strong MIROVA thermal anomaly signal appeared at the beginning of March and slowly tapered off into April. The signal is consistent with the reports of the eruption of lava from the summit of Shinmoedake and its gradual cooling (figure 39). The MODVOLC thermal alert signals also closely match the reports of the eruption of the lava. The first six alerts were issued on 6 March, four each on 9 and 10 March, three each on 11 and 12 March, and one each on 13, 14, 16, 23, and 30 March, matching a gradual cooling pattern for the lava after the main eruptive event.
Activity at Shinmoedake during April and May 2018. A new explosion on 5 April 2018 generated a large ash plume that rose 5,000 m above the crater; a small pyroclastic flow traveled 400 m down the SE flank, and ejecta was thrown 1,100 m from the vent (figure 40). The Tokyo VAAC reported an explosion, and an ash plume at 6.7 km altitude drifting E visible in satellite imagery early in the day. A few hours later, the plume was visible at 10.1 km altitude, or more than 8,000 m above the crater. Incandescent tephra was ejected hundreds of meters high, and lightning was observed within the large ash plume (figures 41 and 42). The plume was observed continuously in satellite images for almost 24 hours before dissipating; a significant SO2 plume was also recorded (figure 43).
A large amount of ashfall was reported in parts of Kobayashi city and Takaharu (15 km E) (figures 44 and 45) on 5 April 2018. Ashfall reports also indicated that a wide area to the N of Shinmoedake including Hitoyoshi City (30 km N), to the NE including Kadogawa Town (95 km NE), and to the E including Miyazaki City (50 km E) were also affected. Another eruption took place the following day, on 6 April, but weather clouds obscured views of the summit. No eruptions were recorded after 6 April for the remainder of the month.
In multiple flyovers, on 19, 20, and 21 April 2018, authorities observed lava continuing to flow down the NW flank (figure 46), along with residual high temperatures in the central part of the lava flow (figure 47). Additionally, fumarolic areas around the fractures on the W slope persisted. By the end of April, the flow on the NW flank of the crater was 150 m long. Seismicity had declined at the end of March, but increased again during the explosive period in early April. Occasional tremors were recorded during 5-14 April. Intermittent spikes of around 100 small earthquakes were also recorded on 14 and 21 April.
Another spike in earthquakes with epicenters within 2 km of Shinmoedake occurred on 2 May 2018 with over 700 events recorded. A substantial explosion on 14 May generated an ash plume that rose 4.5 km above the crater according JMA (figure 48). The Tokyo VAAC reported the ash plume initially at 4.9 km altitude drifting SE based on webcam reports; when the plume appeared in satellite data a short time later it was drifting SE at 7.3 km altitude and was continuously visible in satellite imagery for about 24 hours before dissipating. Ashfall was confirmed in numerous areas of the Miyazaki prefecture to the E, and the Kagoshima prefecture to the S and W. Seismicity increased briefly after the explosion. Enough ash fell in Miyakonojo City (30 km S) that it covered the white lines on the roadways (figure 49). A thermal image taken on 15 May showed a new high-heat flow area on the E side of the new lava flow inside the crater that JMA concluded was likely the result of the explosive event of the previous day (figure 50).
Activity at Iwo-yama during 2014-2017. An increase in seismicity around Iwo-yama, on the NW flank of the Karakunidake stratovolcano (figure 22) beginning in December 2013 was noted by JMA. The epicenters were distributed from 1-6 km below Iwo-yama. Satellite measurements suggested minor inflation in the area around Karakunidake beginning in December 2013, which lasted until January 2015. A 7-minute-long tremor event occurred near Iwo-yama on 20 August 2014. Although inspections of the area by JMA revealed no thermal or fumarolic activity, they listed the Iwo-yama area with an unofficial Alert Level of "Danger around the crater" on 24 October 2014, equivalent to the official Alert Level 2. They modified the warning during May 2015 to "Normal, keep in mind, it is an active volcano," the same as the official Alert Level 1. During the second half of 2015 there were occasional earthquakes and tremors reported in the area, but no surface or thermal activity was recorded (figure 51) until December. Thermal anomalies appeared in the area for the first time during the first week of December 2015; weak fumarolic activity accompanied by H2S odors were first reported during 15-17 December 2015 on the SW side of the Iwo-yama crater (figure 52).
Periods of intermittent microtremor activity occurred once in January, four times in February, and twice in December during 2016, with durations ranging from 40 seconds to 5 minutes. A seismic swarm on 28 February led JMA to raise the unofficial Alert Level to "danger around the crater" for the month of March (equivalent to the official Alert Level 2). A new thermal area with fumarolic activity appeared on 24 March 2016 on the SE side of the crater. Intermittent steam plumes were observed throughout 2016; the highest rose 200 m on 11 October. Thermal anomalies also persisted throughout the year on the S and SW areas of the crater. Alert Level 1 (Note that it is an active volcano) was formally assigned to Iwo-yama on 6 December 2016. The Alert Level was raised to 2 on 12 December after a seismic swarm, tremor, and the observation of inflation in the inclination data in the previous days.
Fumarolic activity decreased in January 2017 after a brief increase at the end of December 2016; JMA lowered the Alert Level back to 1 on 13 January and steam plumes generally rose only 30 m high during the month. The thermal anomalies persisted in the same areas of the SW and W portions of the crater as before, though new fumarolic activity appeared in those areas during February 2017. During March field surveys, observers identified hot water emerging from the fumaroles in the SW and S areas of the crater. The inclinometer detected inflation beginning on 25 April 2017, but it leveled off during August. An increase in the number of fumaroles in the area of the thermal anomaly at the SW side of the crater was confirmed by a JMA field inspection in late April. When the University of Tokyo Earthquake Research Institute visited the site on 8 May 2017, they observed sediment-laden water deposits that had been dispersed on the SW side within the crater, and ejecta around the SW edge. This led JMA to increase the Alert Level to 2.
Fumarolic activity increased during mid-to-late July 2017 and steam plumes were reported at 300 m above the crater for a brief period. On 27 July visitors confirmed dead and discolored plants on the NE side of the crater, and audible fumarolic activity. A new thermal anomaly zone with fumaroles was visible on the SW flank outside the crater during a site visit on 31 August. Low levels of seismicity were intermittent throughout 2017, but no tremor events were recorded. A large amplitude earthquake with its epicenter under Iwo-yama occurred on 5 September 2017; no sudden changes were observed at the site a few days later, although thermal images taken on 9 September revealed an increase in temperature from two years prior (figure 53, compared with figure 52). JMA lowered the warning level to 1 at the end of October. During November and December 2017, steam plumes generally rose 100-200 m above the crater.
Activity at Iwo-yama during January-May 2018. An analysis of nearby hot-spring waters indicated a significant jump in Cl/SO4 ratios characteristic of high-temperature volcanic gas beginning in November 2017. The first tremor since 12 December 2016 was recorded on 19 January 2018 and coincided with a brief period of inflation in the vicinity of Iwo-yama. Regional inflation of the area had begun again in July 2017 and continued into 2018. Low-frequency, small-amplitude earthquakes were intermittent during January 2018 and steam plumes rose 100-200 m. Increases in seismicity, fumarolic activity, and the temperatures of the thermal anomalies during mid-February 2018 prompted JMA to raise the Alert Level on 20 February 2018 at Iwo-yama to 2. Steam plume heights increased to 200-300 m after 20 February. Seismicity decreased during March 2018, however observations from the webcam revealed an increase in fumarolic and thermal activity (figure 54).
The infrared imaging webcam recorded a burst of heat from a vent on the SW side of the crater on 7 April; the amplitude of seismic vibrations also increased. A field visit on 9 April revealed a hot water pool several meters in diameter on the SW side of the crater with sediment-laden water flowing from it and a 10-m-high steam plume. Local inflation recorded at Iwo-yama turned to deflation on 19 April; large-amplitude earthquakes were also reported. A tremor that day was followed by an explosion a few minutes later from a new vent on the S side of Iwo-yama. The plume rose 500 m and ejecta was scattered 200-300 m from the vent to the SE. During an overflight on 19 April JMA noted ash deposits around the vent; ash emission from the vent continued until the following morning (figure 55). The Tokyo VAAC reported a small ash emission on 19 April from Kirishimayama that rose to 1.8 km altitude and drifted E, but it was not visible in satellite imagery. On the evening of 20 April, another new vent with a vigorous steam plume appeared 500 m W of Iwo-yama (figure 56). Sediment-laden water was observed around the vent the following day. Increased seismicity at Iwo-yama lasted for about 20 days; additional tremor activity was reported on 20 and 24 April.
A brief explosion that lasted about ten minutes occurred from this new vent around 1815 on 26 April 2018 sending a plume of ash about 200 m above the vent (figure 57). A small ash emission from Kirishimayama was reported by the Tokyo VAAC on 26 April that rose to 1.5 km altitude. In a site visit on 30 April, JMA noted active fumaroles and small explosions around both vent areas (figure 58). After the explosion of 19 April, steam plumes rose as high as 700 m from the vent on the S side of the crater, and intermittent spouts a few meters high of sediment-laden water were also observed. Steam plumes rose as high as 500 m from the vent located 500 m to the W.
Fumarolic activity continued at Iwo-yama during May 2018, but no new explosions nor ash emissions were reported. Shallow seismic events were intermittent, but significantly decreased from April. No tremors were recorded. JMA lowered the Alert Level on 1 May 2018 from 3 to 2. Steam plumes rose 300-500 m from the vents, and thermal anomalies persisted at the crater and the adjacent new vent to the W throughout the month. Jets of sediment-laden hot water rising several meters continued from the vent on the S side of Iwo-yama (figure 59).
Geologic Background. Kirishimayama is a large group of more than 20 Quaternary volcanoes located north of Kagoshima Bay. The late-Pleistocene to Holocene dominantly andesitic group consists of stratovolcanoes, pyroclastic cones, maars, and underlying shield volcanoes located over an area of 20 x 30 km. The larger stratovolcanoes are scattered throughout the field, with the centrally located Karakunidake being the highest. Onamiike and Miike, the two largest maars, are located SW of Karakunidake and at its far eastern end, respectively. Holocene eruptions have been concentrated along an E-W line of vents from Miike to Ohachi, and at Shinmoedake to the NE. Frequent small-to-moderate explosive eruptions have been recorded since the 8th century.
Information Contacts: Japan Meteorological Agency (JMA), Otemachi, 1-3-4, Chiyoda-ku Tokyo 100-8122, Japan (URL: http://www.jma.go.jp/jma/indexe.html); NASA Goddard Space Flight Center (NASA/GSFC), Global Sulfur Dioxide Monitoring Page, Atmospheric Chemistry and Dynamics Laboratory, 8800 Greenbelt Road, Goddard, Maryland, USA (URL: https://so2.gsfc.nasa.gov/); NASA Earth Observatory, EOS Project Science Office, NASA Goddard Space Flight Center, Goddard, Maryland, USA (URL: http://earthobservatory.nasa.gov/); MIROVA (Middle InfraRed Observation of Volcanic Activity), a collaborative project between the Universities of Turin and Florence (Italy) supported by the Centre for Volcanic Risk of the Italian Civil Protection Department (URL: http://www.mirovaweb.it/); Hawai'i Institute of Geophysics and Planetology (HIGP) - MODVOLC Thermal Alerts System, School of Ocean and Earth Science and Technology (SOEST), Univ. of Hawai'i, 2525 Correa Road, Honolulu, HI 96822, USA (URL: http://modis.higp.hawaii.edu/); Geographical Survey Institute, Geospatial Information Authority of Japan, Ministry of Land, Infrastructure, Transport and Tourism, No. 1 North Town, Tsukuba city, Ibaraki Prefecture 305-0811 Japan Tel: 029-864-1111 (Representative) Fax: 029-864-1807 (URL: http://www.gsi.go.jp/index.html); Kyodo News (URL: https://www.kyodonews.jp/english/); Associated Press (URL: http://www.ap.org/ ); Reuters (http://www.reuters.com/).
Langila (Papua New Guinea) — June 2018 Cite this Report
Langila
Papua New Guinea
5.525°S, 148.42°E; summit elev. 1330 m
All times are local (unless otherwise noted)
Gradual decline in activity after July 2017, but continuing through May 2018
Langila, one of the most active volcanoes of New Britain (figure 7), has been intermittently ejecting ash since April 2016 (BGVN 42:09). Volcanic ash warnings continue to be issued by the Darwin Volcanic Ash Advisory Centre (VAAC). Recent ash plume altitudes (table 5) are in the range of 1.5-2.5 km, but several in mid-April to mid-May 2018 reached up to twice that level. Thermal anomaly data acquired by satellite-based MODIS instruments showed a gradual decrease in power level and occurrence through mid- to late-2017, followed by significantly fewer alerts and anomalies in the first half of 2018. Rabaul Volcano Observatory (RVO) data indicates the activity during 2017 was primarily located in Crater 2 (northern-most crater).
Table 5. Reported data by Darwin Volcanic Ash Advisory Centre (VAAC) on ash plume altitude and drift from Langila based on analyses of satellite imagery and wind model data between 21 June 2017 and 28 May 2018.
| Dates |
Ash Plume Altitude (km) |
Ash Plume Drift |
Other Observations |
| 07 Aug 2017 |
2.1 |
55 km NW |
-- |
| 09 Aug 2017 |
1.8 |
N |
-- |
| 16 Aug 2017 |
2.1 |
NW |
-- |
| 01-02 Sep 2017 |
1.8 |
N, NW |
-- |
| 07-08, 10-12 Sep 2017 |
1.8-2.4 |
NNW, NW, SW |
-- |
| 22-23 Sep 2017 |
2.1 |
NNW |
-- |
| 04 Oct 2017 |
1.8 |
N |
Minor ash emission |
| 11, 15-16 Oct 2017 |
1.8-2.1 |
NE, NNW, NW |
-- |
| 17-18, 20 Oct 2017 |
1.5-1.8 |
NE, NNW, NW |
-- |
| 05 Nov 2017 |
3.7 |
SE, ESE |
-- |
| 15-16 Nov 2017 |
1.8-2.7 |
S, SW |
-- |
| 15 Apr 2018 |
3.7 |
S |
-- |
| 24 Apr 2018 |
4 |
SW |
Ash dissipated in 6 hours |
| 13 May 2018 |
5.5 |
W |
At 0709; ash dissipated in 6 hours |
| 17-18, 21-22 May 2018 |
2.1-2.4 |
WSW, W, WNW |
-- |
| 23, 26-28 May 2018 |
2.4-3 |
WSW, W, NW |
-- |
MIROVA analysis of thermal anomalies measured by MODIS satellite sensors show a gradual decline of radiative power from early June 2017 to the end of the year (figure 8). Sporadic low-power anomalies occurred in January, April, and May 2018.
Thermal alerts from MODVOLC analyses were concentrated between early June 2017 and late September 2017 (figure 9), with only one pixel being measured in 2018 through early June, that alert being on 5 January 2018.
Geologic Background. Langila, one of the most active volcanoes of New Britain, consists of a group of four small overlapping composite basaltic-andesitic cones on the lower E flank of the extinct Talawe volcano in the Cape Gloucester area of NW New Britain. A rectangular, 2.5-km-long crater is breached widely to the SE; Langila was constructed NE of the breached crater of Talawe. An extensive lava field reaches the coast on the N and NE sides of Langila. Frequent mild-to-moderate explosive eruptions, sometimes accompanied by lava flows, have been recorded since the 19th century from three active craters at the summit. The youngest and smallest crater (no. 3 crater) was formed in 1960 and has a diameter of 150 m.
Information Contacts: Darwin Volcanic Ash Advisory Centre (VAAC), Bureau of Meteorology, Northern Territory Regional Office, PO Box 40050, Casuarina, NT 0811, Australia (URL: http://www.bom.gov.au/info/vaac/); Hawai'i Institute of Geophysics and Planetology (HIGP) - MODVOLC Thermal Alerts System, School of Ocean and Earth Science and Technology (SOEST), Univ. of Hawai'i, 2525 Correa Road, Honolulu, HI 96822, USA (URL: http://modis.higp.hawaii.edu/); MIROVA (Middle InfraRed Observation of Volcanic Activity), a collaborative project between the Universities of Turin and Florence (Italy) supported by the Centre for Volcanic Risk of the Italian Civil Protection Department (URL: http://www.mirovaweb.it/); Rabaul Volcano Observatory (RVO), Geohazards Management Division, Department of Mineral Policy and Geohazards Management (DMPGM), PO Box 3386, Kokopo, East New Britain Province, Papua New Guinea.
Marapi
Indonesia
0.38°S, 100.474°E; summit elev. 2885 m
All times are local (unless otherwise noted)
Two explosions during April-May 2018 cause ashfall to the southeast
The Marapi volcano on Sumatra (not to be confused with the better known Merapi volcano on Java) previously erupted on 4 June 2017, generating dense ash-and-steam plumes that rose as high as 700 m above the crater and caused minor ashfall in a nearby district (BGVN 42:10). The volcano is monitored by the Pusat Vulkanologi dan Mitigasi Bencana Geologi (PVMBG, also known as Centre for Volcanology and Geological Hazard Mitigation or CVGHM).
On 27 April 2018, a phreatic explosion produced an ash plume that rose 300 m above the crater rim (figure 8); a thin ash deposit was reported in the Cubadak area (Tanah Datar Regency), about 12 km SE. Another explosion at 0703 on 2 May 2018 (figure 9) produced a voluminous dense gray ash plume that rose 4 km above the crater rim and drifted SE; seismic data recorded by PVMBG indicated that the event lasted just over 8 minutes (485 seconds).
The Alert Level has remained at 2 (on a scale of 1-4), where it has been since August 2011. Residents and visitors have been advised not to enter an area within 3 km of the summit.
Geologic Background. Gunung Marapi, not to be confused with the better-known Merapi volcano on Java, is Sumatra's most active volcano. This massive complex stratovolcano rises 2,000 m above the Bukittinggi Plain in the Padang Highlands. A broad summit contains multiple partially overlapping summit craters constructed within the small 1.4-km-wide Bancah caldera. The summit craters are located along an ENE-WSW line, with volcanism migrating to the west. More than 50 eruptions, typically consisting of small-to-moderate explosive activity, have been recorded since the end of the 18th century; no lava flows outside the summit craters have been reported in historical time.
Information Contacts: Pusat Vulkanologi dan Mitigasi Bencana Geologi (PVMBG, also known as Indonesian Center for Volcanology and Geological Hazard Mitigation, CVGHM), Jalan Diponegoro 57, Bandung 40122, Indonesia (URL: http://www.vsi.esdm.go.id/); Badan Nasional Penanggulangan Bencana (BNPB), National Disaster Management Agency, Graha BNPB - Jl. Scout Kav.38, East Jakarta 13120, Indonesia (URL: http://www.bnpb.go.id/).
Masaya
Nicaragua
11.9844°N, 86.1688°W; summit elev. 594 m
All times are local (unless otherwise noted)
Lava lake persists during July 2017-April 2018
Nicaragua's Volcan Masaya has an intermittent lava lake that has attracted visitors since the time of the Spanish Conquistadores; tephrochronology has dated eruptions back several thousand years. The unusual basaltic caldera has had historical explosive eruptions in addition to lava flows and actively circulating magma at the lava lake. An explosion in 2012 ejected ash to several hundred meters above the volcano, bombs as large as 60 cm fell around the crater, and ash fell to a thickness of 2 mm in some areas of the park. Brief incandescence and thermal anomalies of uncertain origin in April 2013 were followed by very little activity until the reemergence of the lava lake inside Santiago crater was reported in December 2015. By late March 2016 the lava lake had grown and intensified enough to generate a significant thermal anomaly signature (BGVN 41:08, figure 49) which persisted at a constant power level through April 2017 (BGVN 42:09, figure 53) with an increase in the number of thermal anomalies from November 2016 through April 2017. Although the MIROVA thermal anomaly signal decreased slightly in intensity during May 2017, INETER scientists reported continued strong convection at the lava lake. Similar activity continued throughout July 2017-April 2018 and is covered in this report with information provided by the Instituto Nicareguense de Estudios Territoriales (INETER) and satellite thermal data.
A persistent thermal signature in the MIROVA data during July 2017-April 2018 supported the visual observations of the active lava lake at the summit throughout this period (figure 58). MODVOLC thermal alerts were also issued every month, with the number of alerts ranging from a high of 17 in November 2017 to a low of six in April 2018.
INETER made regular visits to the summit most months in coordination with specialists from several universities to gather SO2 data; CO2, H2S and gravity measurements were also taken during specific site visits. Thermal measurements around the lava lake inside Santiago crater taken on 24 February 2018 indicated temperatures ranging from 210-389°C. Seismicity remained very low throughout the period. The lava lake was actively convecting each time it was visited, and Pele's hair was abundant around the summit area (figures 59-64).
Geologic Background. Masaya volcano in Nicaragua has erupted frequently since the time of the Spanish Conquistadors, when an active lava lake prompted attempts to extract the volcano's molten "gold" until it was found to be basalt rock upon cooling. It lies within the massive Pleistocene Las Sierras caldera and is itself a broad, 6 x 11 km basaltic caldera with steep-sided walls up to 300 m high. The caldera is filled on its NW end by more than a dozen vents that erupted along a circular, 4-km-diameter fracture system. The Nindirí and Masaya cones, the source of observed eruptions, were constructed at the southern end of the fracture system and contain multiple summit craters, including the currently active Santiago crater. A major basaltic Plinian tephra erupted from Masaya about 6,500 years ago. Recent lava flows cover much of the caldera floor and there is a lake at the far eastern end. A lava flow from the 1670 eruption overtopped the north caldera rim. Periods of long-term vigorous gas emission at roughly quarter-century intervals have caused health hazards and crop damage.
Information Contacts: Instituto Nicaragüense de Estudios Territoriales (INETER), Apartado Postal 2110, Managua, Nicaragua (URL: http://www.ineter.gob.ni/); MIROVA (Middle InfraRed Observation of Volcanic Activity), a collaborative project between the Universities of Turin and Florence (Italy) supported by the Centre for Volcanic Risk of the Italian Civil Protection Department (URL: http://www.mirovaweb.it/); Hawai'i Institute of Geophysics and Planetology (HIGP) - MODVOLC Thermal Alerts System, School of Ocean and Earth Science and Technology (SOEST), Univ. of Hawai'i, 2525 Correa Road, Honolulu, HI 96822, USA (URL: http://modis.higp.hawaii.edu/); Alexander Schimmeck, flickr (URL: https://www.flickr.com/photos/alschim/), photo used under Creative Commons license Attribution-NonCommercial-NoDerivs 2.0 Generic (CC BY-NC-ND 2.0) (URL: https://creativecommons.org/licenses/by-nc-nd/2.0/); Carsten ten Brink, flickr (URL: https://www.flickr.com/photos/carsten_tb/), photo used under Creative Commons license Attribution-NonCommercial-NoDerivs 2.0 Generic (CC BY-NC-ND 2.0) (URL: https://creativecommons.org/licenses/by-nc-nd/2.0/).
Nyiragongo (DR Congo) — June 2018 Cite this Report
Nyiragongo
DR Congo
1.52°S, 29.25°E; summit elev. 3470 m
All times are local (unless otherwise noted)
Thermal anomalies show that lava lake remains active through May 2018
As has been the case since at least 1971, the active lava lake in the summit crater of Nyiragongo was present during a tourist visit in June 2017, and seismicity was recorded in the crater in October 2017 (BGVN 42:11). Thermal data from satellite-based instruments shows that an open lava lake remained through 23 May 2018. MIROVA analysis of MODIS satellite thermal data (figure 64) shows nearly daily strong thermal anomalies. Similarly, MODVOLC alerts for the same time period shows a consistently frequent number of anomalies (figure 65).
Geologic Background. The Nyiragongo stratovolcano contained a lava lake in its deep summit crater that was active for half a century before draining catastrophically through its outer flanks in 1977. The steep slopes contrast to the low profile of its neighboring shield volcano, Nyamuragira. Benches in the steep-walled, 1.2-km-wide summit crater mark levels of former lava lakes, which have been observed since the late-19th century. Two older stratovolcanoes, Baruta and Shaheru, are partially overlapped by Nyiragongo on the north and south. About 100 cones are located primarily along radial fissures south of Shaheru, east of the summit, and along a NE-SW zone extending as far as Lake Kivu. Many cones are buried by voluminous lava flows that extend long distances down the flanks, which is characterized by the eruption of foiditic rocks. The extremely fluid 1977 lava flows caused many fatalities, as did lava flows that inundated portions of the major city of Goma in January 2002.
Information Contacts: Hawai'i Institute of Geophysics and Planetology (HIGP) - MODVOLC Thermal Alerts System, School of Ocean and Earth Science and Technology (SOEST), Univ. of Hawai'i, 2525 Correa Road, Honolulu, HI 96822, USA (URL: http://modis.higp.hawaii.edu/); MIROVA (Middle InfraRed Observation of Volcanic Activity), a collaborative project between the Universities of Turin and Florence (Italy) supported by the Centre for Volcanic Risk of the Italian Civil Protection Department (URL: http://www.mirovaweb.it/).
Sabancaya
Peru
15.787°S, 71.857°W; summit elev. 5960 m
All times are local (unless otherwise noted)
Strong, sporadic explosions with ash plumes throughout December 2017-May 2018
Although tephrochronology has dated activity at Sabancaya back several thousand years, renewed activity that began in 1986 was the first recorded in over 200 years. Intermittent activity since then has produced significant ashfall deposits, seismic unrest, and fumarolic emissions. A renewed period of explosive activity began in early November 2016 and continued through 2017. It was characterized by continuing pulses of ash emissions with plume heights exceeding 10 km altitude, thermal anomalies, and numerous significant SO2 plumes (BGVN 42:12). Details of the continuing eruptive activity from December 2017 to May 2018 in this report come from the two Peruvian observatories that monitor the volcano: Instituto Geofisico del Peru - Observatoria Vulcanologico del Sur (IGP-OVS), and Observatorio Volcanologico del INGEMMET (Instituto Geológical Minero y Metalúrgico) (OVI-INGEMMET). Aviation notices come from the Buenos Aires Volcanic Ash Advisory Center (VAAC), and satellite data is reported from several sources.
Sabancaya continued with its explosive eruption that began on 6 November 2016 during December 2017-May 2018. Around 100 aviation notices were issued each month by the Buenos Aires VAAC; tens of daily explosions were reported, fluctuating from highs in the 60s per day in December 2017 to lows in the teens per day during February-April 2018. Ash plumes heights varied at 3-5 km above the summit; altitudes mentioned in the VAAC reports were between 7.3 and 8.5 km altitude most days, although plume heights over 9.1 km were observed a number of times. MIROVA thermal anomalies were recorded every week; MODVOLC thermal alerts occurred every month. A significant number of SO2 anomalies greater than two Dobson Units were measured by NASA's Goddard Space Flight Center each month (table 2).
Table 2. Eruptive Activity at Sabancaya, December 2017-May 2018. Compiled using data from IGP-OVS, OVI-INGEMMET, Buenos Aires VAAC, HIGP - MODVOLC Thermal Alerts System, and NASA Goddard Space Flight Center.
| Month |
VAAC Reports |
Avg Daily Explosions by week |
Max Plume Heights (m above crater) |
Plume Drift |
MODVOLC Alerts |
Min Days with SO2 over 2 DU |
| Dec 2017 |
120 |
69, 63, 55, 67, 42 |
2,500-3,300 |
40-50 km, SW, NE, NW, W, N |
2 |
7 |
| Jan 2018 |
101 |
41, 57, 57, 33 |
2,500-3,300 |
50 km, SW, W, NW, N |
2 |
13 |
| Feb 2018 |
94 |
22, 18, 19, 17 |
2,500-4,500 |
30-50 km, SE, S, SW, NW |
1 |
12 |
| Mar 2018 |
115 |
12, 10, 17, 17, 18 |
2,000-5,350 |
30-50 km, S, SW, W, NW, N |
3 |
13 |
| Apr 2018 |
114 |
15, 15, 19, 22 |
2,000-3,200 |
30-40 km, All |
3 |
12 |
| May 2018 |
132 |
25, 27, 30, 35, 28 |
1,900-4,300 |
30-40 km, NW, N, NE, E, SE, S |
4 |
7 |
Activity during December 2017-February 2018. The Buenos Aires VAAC issued 120 aviation alerts during December 2017; webcam and satellite imagery revealed continuous emissions of water vapor and gas, accompanied by sporadic puffs of ash, throughout the month. When visible in satellite imagery, plumes rose to 7.3-8.2 km altitude (figure 46); a few plumes were reported to 9.1 km altitude. According to OVI-INGEMMET, about 1,800 explosions took place in December. During the third week, ashfall was reported in Huambo (28 km WNW). There were two MODVOLC thermal alerts issued, on 3 and 10 December.
The number of explosions reported by OVI-INGEMMET dropped slightly to about 1,400 during January 2018. The number of VAAC reports was similar to December; when weather clouds prevented observations of emissions, seismic activity showed intermittent peaks that suggested puffs of ash. Plume descriptions by the Buenos Aires VAAC ranged from intermittent plumes that rose to 7.0-7.6 km altitude early in the month to persistent puffs of ash that rose to 7.9-8.2 km altitude during the last two weeks of January. The prevailing winds were directed SW and NW, and ash plumes often drifted as far as 50 km. NASA Goddard Space Flight Center recorded at least 13 days with SO2 emissions greater than two Dobson Units (DU) (figure 47). HIGP issued two MODVOLC thermal alerts on 4 and 20 January.
OVI-INGEMMET reported ash plume heights during February 2018 at 2,500-4,500 m above the summit. They also noted that deflation was measured during the middle two weeks of the month. The number of daily explosions decreased significantly from the previous few months, with about 500 total explosions recorded in February. The Buenos Aires VAAC noted that the webcam showed continuous emissions of gases with sporadic puffs of ash every day that the summit was visible. Ash plumes were only visible in satellite imagery a few times during the month; during 8-10 February, intermittent emissions were seen moving SE between 7.9 and 8.5 km altitude. During 17-24 February, weak, thin ash plumes drifted several different directions at 7.3-7.9 km altitude (figure 48), and on 28 February a plume was visible drifting NW at 7.6 km altitude. Only a single MODVOLC thermal alert was issued on 18 February.
Activity during March-May 2018. Three MODVOLC thermal alerts were issued in March 2018, two on 14 March and one on 27 March. Sporadic ash explosions continued, but with the lowest number per day of the reporting period. About 450 explosions were recorded during March. In spite of the smaller number of explosions, some of the tallest ash plumes of the period occurred this month. The Buenos Aires VAAC reported a diffuse ash plume drifting NW in satellite imagery on 2 March at 8.8 km altitude. The following week, several ash plumes were spotted in satellite imagery at altitudes of 7.3-8.2 km drifting either SW or NW. On 11 March, cloudy weather prevented visual satellite imagery observations, but multispectral imagery and the webcam revealed intermittent pulses of ash moving SW at 7.6 km altitude. The following day sporadic strong pulses of ash were observed in the webcam, and there was a pilot report of an ash plume at 9.1 km altitude. During the second half of March, ash plumes were noted in satellite imagery most days at altitudes of 6.4-8.2 km; a few pulses produced short-lived ash plumes that rose over 9.1 km, including on 14, 22, 24, and during 27-30 March (figure 49). The highest plume was observed in visible imagery drifting E on 28 March at 10.1 km altitude. A lahar was also reported on 28 March descending the SE flank, towards the Sallalli River; no damage was reported.
The number of explosions during April 2018 increased slightly from March to about 540. The maximum plume heights ranged from 2,000 to 3,200 m above the summit according to OVI-INGEMMET. The webcam showed continuous emissions of water vapor and gas and sporadic pulses of ash throughout the month. Ashfall was reported during the first week in Achoma (23 km NE), Chivay (33 km NE), and Huanca. During the second week, the prevailing winds brought ashfall to the W and NW to Huambo (28 km W) and Cabanaconde (22 km NW). The Buenos Aires VAAC reported faint ash plumes visible in satellite imagery nearly every day; plume heights consistently ranged from 7.0 to 8.2 km altitude. Three MODVOLC thermal alerts were issued during the month, one on 13 April and two on 17 April.
Activity increased in many ways during May 2018. The Buenos Aires VAAC issued 132 aviation alerts, the most of any month during the period. The numbers of daily explosions increased compared to April, resulting in a monthly total of around 900. OVI-INGEMMET reported plume heights up to 4,300 m above the summit. MODVOLC thermal alerts were issued on 8, 19, 24, and 26 May. In addition to ash plumes visible in satellite imagery every day at altitudes of 7.3-8.2 km altitude (figure 50), a significant number of ash plumes were reported to altitudes greater than 9.1 km during the month, resulting in more VONA's (Volcanic Observatory Notice to Aviation) issued than in previous months. Sporadic strong puffs of ash were observed in the webcam on the days that satellite imagery measurements of ash plume heights exceeded 9.1 km including on 4, 5, 10, 14, 19, 21, 22, 25, 28, and 31 May. The highest plumes reached 10.4 km altitude on 19 May and 10.1 km altitude on 25 May. Hotspots were also reported on 20, 24, and 27 May. As in previous months, the webcam showed constant emissions of steam and gas, with intermittent pulses of volcanic ash throughout the month.
Geologic Background. Sabancaya, located in the saddle NE of Ampato and SE of Hualca Hualca volcanoes, is the youngest of these volcanic centers and the only one to have erupted in historical time. The oldest of the three, Nevado Hualca Hualca, is of probable late-Pliocene to early Pleistocene age. The name Sabancaya (meaning "tongue of fire" in the Quechua language) first appeared in records in 1595 CE, suggesting activity prior to that date. Holocene activity has consisted of Plinian eruptions followed by emission of voluminous andesitic and dacitic lava flows, which form an extensive apron around the volcano on all sides but the south. Records of observed eruptions date back to 1750 CE.
Information Contacts: Observatorio Volcanologico del INGEMMET, (Instituto Geológical Minero y Metalúrgico), Barrio Magisterial Nro. 2 B-16 Umacollo - Yanahuara Arequipa, Peru (URL: http://ovi.ingemmet.gob.pe); Instituto Geofisico del Peru, Observatoria Vulcanologico del Sur (IGP-OVS), Arequipa Regional Office, Urb La Marina B-19, Cayma, Arequipa, Peru (URL: http://ovs.igp.gob.pe/); Buenos Aires Volcanic Ash Advisory Center (VAAC), Servicio Meteorológico Nacional-Fuerza Aérea Argentina, 25 de mayo 658, Buenos Aires, Argentina (URL: http://www.smn.gov.ar/vaac/buenosaires/inicio.php); Hawai'i Institute of Geophysics and Planetology (HIGP) - MODVOLC Thermal Alerts System, School of Ocean and Earth Science and Technology (SOEST), Univ. of Hawai'i, 2525 Correa Road, Honolulu, HI 96822, USA (URL: http://modis.higp.hawaii.edu/); NASA Goddard Space Flight Center (NASA/GSFC), Global Sulfur Dioxide Monitoring Page, Atmospheric Chemistry and Dynamics Laboratory, 8800 Greenbelt Road, Goddard, Maryland, USA (URL: https://so2.gsfc.nasa.gov/).
San Cristobal (Nicaragua) — June 2018 Cite this Report
San Cristobal
Nicaragua
12.702°N, 87.004°W; summit elev. 1745 m
All times are local (unless otherwise noted)
Moderate explosion on 22 April 2018
Activity at the San Cristobal volcano complex during 2017 was characterized by numerous weak ash-and-gas explosions, a succession of strong ash-and-gas explosion on 18 August, and thousands of degassing events (BGVN 43:03). This report covers January through July 2018.
According to the Instituto Nicaragüense de Estudios Territoriales (INETER), at 1320 on 22 April a moderate explosion generated an ash-and-gas plume that rose 500-800 m (figure 38), causing ashfall in the Comarca La Bolsa (8 km SW) and Hacienda Las Rojas (3 km WSW) and Loma Las Brujas (2 km W).
INETER's April bulletin reported that the monthly averages of sulfur dioxide levels at San Cristobal during January through March 2018 ranged from 305-449 metric tons per day. On 22 April, the day of the explosion, levels reached 1903 tons. During the reporting period, MODIS satellite instruments using the MODVOLC algorithm recorded only two questionable thermal anomalies at San Cristobal. The MIROVA (Middle InfraRed Observation of Volcanic Activity) volcano hotspot detection system, also based on analysis of MODIS data, recorded numerous hotspots, but only one within 5 km of the volcano during January through July 2018. The latter one occurred during late March.
Geologic Background. The San Cristóbal volcanic complex, consisting of five principal volcanic edifices, forms the NW end of the Marrabios Range. The symmetrical 1745-m-high youngest cone, named San Cristóbal (also known as El Viejo), is Nicaragua's highest volcano and is capped by a 500 x 600 m wide crater. El Chonco, with several flank lava domes, is located 4 km W of San Cristóbal; it and the eroded Moyotepe volcano, 4 km NE of San Cristóbal, are of Pleistocene age. Volcán Casita, containing an elongated summit crater, lies immediately east of San Cristóbal and was the site of a catastrophic landslide and lahar in 1998. The Plio-Pleistocene La Pelona caldera is located at the eastern end of the complex. Historical eruptions from San Cristóbal, consisting of small-to-moderate explosive activity, have been reported since the 16th century. Some other 16th-century eruptions attributed to Casita volcano are uncertain and may have been from other Marrabios Range volcanoes.
Information Contacts: Instituto Nicaragüense de Estudios Territoriales (INETER), Apartado Postal 2110, Managua, Nicaragua (URL: http://webserver2.ineter.gob.ni/vol/dep-vol.html); Hawai'i Institute of Geophysics and Planetology (HIGP) - MODVOLC Thermal Alerts System, School of Ocean and Earth Science and Technology (SOEST), Univ. of Hawai'i, 2525 Correa Road, Honolulu, HI 96822, USA (URL: http://modis.higp.hawaii.edu/); MIROVA (Middle InfraRed Observation of Volcanic Activity), a collaborative project between the Universities of Turin and Florence (Italy) supported by the Centre for Volcanic Risk of the Italian Civil Protection Department (URL: http://www.mirovaweb.it/).
San Miguel (El Salvador) — June 2018 Cite this Report
San Miguel
El Salvador
13.434°N, 88.269°W; summit elev. 2130 m
All times are local (unless otherwise noted)
Intermittent small ash emissions between 14 January and 30 May 2018
El Salvador's San Miguel, also known as Chaparrastique, had six small ash emission events during January 2015-June 2017 (BGVN 42:07). New activity consisting of intermittent ash emissions began on 14 January and continued until 30 May 2018, reported below based on information provided by El Salvador's Servicio Nacional de Estudios Territoriales (SNET) and special reports from the Ministero de Medio Ambiente y Recursos Naturales (MARN).
SNET and MARN reported that during 14-17 January 2018 there were four gas-and-ash emissions from San Miguel that rose no higher than 300 m above the crater rim, at least one of which dispersed SW. The reports noted that prior to each emission seismicity decreased and then suddenly increased. MARN reported that during 25-26 January seismic tremor levels fluctuated between 75 and 179 RSAM (Real-time Seismic Amplitude Measurement) units per hour on average, slightly above normal (50-150 units).
On 19 February, MARN reported the beginning of sustained gas emissions along with small ash emissions. The plume did not exceed 350 m above and was displaced by winds to the SW. This activity was similar to the activity on 14-15 January 2018.
SNET reported on 2 March that gas plumes rose as high as 400 m above the crater rim during the previous week. Ash appeared in "gas pulse" emissions on 24, 26, and 28 February, and 1 March. RSAM values fluctuated between 70 and 179 units during 1-2 March. At 2200 on 5 March seismic amplitude began to increase, with RSAM values rising to as high as 318 units by 0600 on 6 March. A webcam recorded minor gas emission during 5-6 March. MARN reported that RSAM values fluctuated between 68 and 248 units, with an average of 156 during 8-9 March. Continued volcanic tremor during 9-16 March was noted, along with persistent low-level degassing from the central crater. Volcanic tremor levels during 15-16 March fluctuated between 77 and 203 RSAM units per hour, with an average of 124.
By early April, MARN had noted a decrease in activity. On 3 April it reported that RSAM levels varied between 46 and 87 units, with an average of 55. Activity increased briefly during 7-13 April, and MARN reported that periodic microseisms combined with changes in seismic tremor and gas pulses had increased significantly, reaching maximum values of 400 RSAM units in an average hour (figure 25).
Discrete earthquakes were detected between 13 and 17 April, and discontinuous volcanic tremor during 17-18 April was associated with weak, sporadic degassing from the central crater. Seismicity reached maximum values of 216 RSAM units in an average hour.
MARN reported that during 20-27 April volcanic tremor fluctuated between 37 and 106 RSAM units per average hour. Seismicity was low during 28 April-4 May, with RSAM between 39 and 61 units per hour.
In May MARN reported that the volcanic activity had declined compared to April. As of 18 May there was no change in volcanic activity, despite the seismic swarm that started on the night of 5 May felt in the municipalities of Chirilagua-Intipucá, 30 km SE. Average SO2 emission rates were variable during 1 January-6 May 2018 (figure 26).
SNET reported a significant increase in the number of low- and high-frequency earthquakes beneath the crater beginning on 22 May. RSAM values fluctuated between 142 and 176 units during 30 May-1 June. Webcam images on 30 May showed a small gray gas emission.
Geologic Background. The symmetrical cone of San Miguel, one of the most active volcanoes in El Salvador, rises from near sea level to form one of the country's most prominent landmarks. A broad, deep, crater complex that has been frequently modified by eruptions recorded since the early 16th century caps the truncated unvegetated summit, also known locally as Chaparrastique. Flanks eruptions of the basaltic-andesitic volcano have produced many lava flows, including several during the 17th-19th centuries that extended to the N, NE, and SE. The SE-flank flows are the largest and form broad, sparsely vegetated lava fields crossed by highways and a railroad skirting the base of the volcano. Flank vent locations have migrated higher on the edifice during historical time, and the most recent activity has consisted of minor ash eruptions from the summit crater.
Information Contacts: Servicio Nacional de Estudios Territoriales (SNET), Ministero de Medio Ambiente y Recursos Naturales (MARN), Km. 5½ Carretera a Nueva San Salvador, Avenida las Mercedes, San Salvador, El Salvador (URL: http://www.snet.gob.sv/ver/vulcanologia, http://www.marn.gob.sv/category/avisos/vulcanologia/).