Recently Published Bulletin Reports
Agung (Indonesia) Three eruptive events reported in April, May, and December 2022
Tengger Caldera (Indonesia) Minor ash emission in December 2023; persistent weak thermal anomaly in the Bromo crater
Saunders (United Kingdom) Persistent thermal anomalies from the summit crater lava lake during February 2023-January 2024
Shishaldin (United States) New eruption with significant Strombolian explosions, ash plumes, and ashfall
Ioto (Japan) New eruption with discolored water, ejecta, and floating pumice during October-December 2023
Purace (Colombia) Gas-and-ash emission on 16 November 2023
Etna (Italy) Strombolian explosions, lava fountains, and lava flows during July-August 2023
Suwanosejima (Japan) Eruption plumes, crater incandescence, and occasional explosions during July-October 2023
Aira (Japan) Explosions, ash plumes, ash fall, and crater incandescence during July-October 2023
Nishinoshima (Japan) Gray emissions during October 2023
Kilauea (United States) Strong lava fountains, lava flows, and spatter at Halema’uma’u during January-September 2023
Tinakula (Solomon Islands) Continued lava flows and thermal activity during June through November 2023
Agung (Indonesia) — January 2024  Cite this Report
Agung
Indonesia
8.343°S, 115.508°E; summit elev. 2997 m
All times are local (unless otherwise noted)
Three eruptive events reported in April, May, and December 2022
Mount Agung, located on the E end of the island of Bali, Indonesia, rises above the SE rim of the Batur caldera. The summit area extends 1.5 km E-W, with the highest point on the W and a steep-walled 800-m-wide crater on the E. Recorded eruptions date back to the early 19th century. A large and deadly explosive and effusive eruption occurred during 1963-64, which was characterized by voluminous ashfall, pyroclastic flows, and lahars that caused extensive damage and many fatalities. More recent activity was documented during November 2017-June 2019 that consisted of multiple explosions, significant ash plumes, lava flows at the summit crater, and incandescent ejecta. This report covers activity reported during April-May 2022 and December 2022 based on data from the Darwin Volcanic Ash Advisory Center (VAAC).
Activity during 2022 was relatively low and mainly consisted of a few ash plumes during April-May and December. An ash plume on 3 April rising to 3.7 km altitude (700 m above the summit) and drifting N was reported in a Darwin VAAC notice based on a ground report, with ash seen in HIMAWARI-8 visible imagery. Another ash plume was reported at 1120 on 27 May that rose to 5.5 km altitude (2.5 m above the summit); the plume was not visible in satellite or webcam images due to weather clouds. An eruption was reported based on seismic data at 0840 on 13 December, with an estimated plume altitude of 3.7 km; however, no ash was seen using satellite imagery in clear conditions before weather clouds obscured the summit.
Geologic Background. Symmetrical Agung stratovolcano, Bali's highest and most sacred mountain, towers over the eastern end of the island. The volcano, whose name means "Paramount," rises above the SE rim of the Batur caldera, and the northern and southern flanks extend to the coast. The summit area extends 1.5 km E-W, with the high point on the W and a steep-walled 800-m-wide crater on the E. The Pawon cone is located low on the SE flank. Only a few eruptions dating back to the early 19th century have been recorded in historical time. The 1963-64 eruption, one of the largest in the 20th century, produced voluminous ashfall along with devastating pyroclastic flows and lahars that caused extensive damage and many fatalities.
Information Contacts: Darwin Volcanic Ash Advisory Centre (VAAC), Bureau of Meteorology, Northern Territory Regional Office, PO Box 40050, Casuarina, NT 0811, Australia (URL: http://www.bom.gov.au/info/vaac/).
Tengger Caldera (Indonesia) — February 2024 Cite this Report
Tengger Caldera
Indonesia
7.942°S, 112.95°E; summit elev. 2329 m
All times are local (unless otherwise noted)
Minor ash emission in December 2023; persistent weak thermal anomaly in the Bromo crater
Tengger Caldera, located at the N end of a volcanic massif in Indonesia’s East Java, consists of five overlapping stratovolcanoes. The youngest and only active cone in the 16-km-wide caldera is Bromo, which typically produces gas-and-steam plumes, occasional ash plumes and explosions, and weak thermal signals (BGVN 44:05, 47:01). This report covers activity during January 2022-December 2023, consisting of mostly white gas-and-steam emissions and persistent weak thermal anomalies. Information was provided by the Pusat Vulkanologi dan Mitigasi Bencana Geologi (PVMBG, also known as Indonesian Center for Volcanology and Geological Hazard Mitigation, CVGHM) and satellite imagery. The Alert Level remained at 2 (on a scale of 1-4), and visitors were warned to stay at least 1 km from the crater.
Activity was generally low during the reporting period, similar to that in 2021. According to almost daily images from MAGMA Indonesia (a platform developed by PVMBG), white emissions and plumes rose from 50 to 900 m above the main crater during this period (figure 24). During several days in March and June 2022, white plumes reached heights of 1-1.2 km above the crater.
After an increase in activity at 2114 on 3 February 2023, a PVMBG team that was sent to observe white emissions rising as high as 300 m during 9-12 February and heard rumbling noises. A sulfur dioxide odor was also strong near the crater and measurements indicated that levels were above the healthy (non-hazardous) threshold of 5 parts per million; differential optical absorption spectroscopy (DOAS) measurements indicated an average flux of 190 metric tons per day on 11 February. Incandescence originating from a large fumarole in the NNW part of the crater was visible at night. The team observed that vegetation on the E caldera wall was yellow and withered. The seismic network recorded continuous tremor and deep and shallow volcanic earthquakes.
According to a PVMBG press release, activity increased on 13 December 2023 with white, gray, and brown emissions rising as high as 900 m above Bromo’s crater rim and drifting in multiple directions (figure 25). The report noted that tremor was continuous and was accompanied in December by three volcanic earthquakes. Deformation data indicated inflation in December. There was no observable difference in the persistent thermal anomaly in the crater between 11 and 16 December 2023.
All clear views of the Bromo crater throughout this time, using Sentinel-2 infrared satellite images, showed a weak persistent thermal anomaly; none of the anomalies were strong enough to cause MODVOLC Thermal Alerts. A fire in the SE part of the caldera in early September 2023 resulted in a brief period of strong thermal anomalies.
Geologic Background. The 16-km-wide Tengger caldera is located at the northern end of a volcanic massif extending from Semeru volcano. The massive volcanic complex dates back to about 820,000 years ago and consists of five overlapping stratovolcanoes, each truncated by a caldera. Lava domes, pyroclastic cones, and a maar occupy the flanks of the massif. The Ngadisari caldera at the NE end of the complex formed about 150,000 years ago and is now drained through the Sapikerep valley. The most recent of the calderas is the 9 x 10 km wide Sandsea caldera at the SW end of the complex, which formed incrementally during the late Pleistocene and early Holocene. An overlapping cluster of post-caldera cones was constructed on the floor of the Sandsea caldera within the past several thousand years. The youngest of these is Bromo, one of Java's most active and most frequently visited volcanoes.
Information Contacts: Pusat Vulkanologi dan Mitigasi Bencana Geologi (PVMBG, also known as Indonesian Center for Volcanology and Geological Hazard Mitigation, CVGHM), Jalan Diponegoro 57, Bandung 40122, Indonesia (URL: http://www.vsi.esdm.go.id/); MAGMA Indonesia, Kementerian Energi dan Sumber Daya Mineral (URL: https://magma.esdm.go.id/v1); Copernicus Browser, Copernicus Data Space Ecosystem, European Space Agency (URL: https://dataspace.copernicus.eu/browser/); Hawai'i Institute of Geophysics and Planetology (HIGP) - MODVOLC Thermal Alerts System, School of Ocean and Earth Science and Technology (SOEST), Univ. of Hawai'i, 2525 Correa Road, Honolulu, HI 96822, USA (URL: http://modis.higp.hawaii.edu/).
Saunders (United Kingdom) — February 2024 Cite this Report
Saunders
United Kingdom
57.8°S, 26.483°W; summit elev. 843 m
All times are local (unless otherwise noted)
Persistent thermal anomalies from the summit crater lava lake during February 2023-January 2024
Saunders is one of eleven islands that comprise the South Sandwich Islands in the South Atlantic. The active Mount Michael volcano has been in almost continuous eruption since November 2014 (BGVN 48:02). Recent activity has resulted in intermittent thermal anomalies and gas-and-steam emissions (BGVN 47:03, 48:02). Visits are infrequent due to its remote location, and cloud cover often prevents satellite observations. Satellite thermal imagery and visual observation of incandescence during a research expedition in 2019 (BGVN 28:02 and 44:08) and a finding confirmed by a National Geographic Society research team that summited Michael in November 2022 reported the presence of a lava lake.
Although nearly constant cloud cover during February 2023 through January 2024 greatly limited satellite observations, thermal anomalies from the lava lake in the summit crater were detected on clear days, especially around 20-23 August 2023. Anomalies similar to previous years (eg. BGVN 48:02) were seen in both MIROVA (Middle InfraRed Observation of Volcanic Activity) data from MODIS instruments and in Sentinel 2 infrared imagery. The only notable sulfur dioxide plume detected near Saunders was on 25 September 2023, with the TROPOMI instrument aboard the Sentinel-5P satellite.
Geologic Background. Saunders Island consists of a large central volcanic edifice intersected by two seamount chains, as shown by bathymetric mapping (Leat et al., 2013). The young Mount Michael stratovolcano dominates the glacier-covered island, while two submarine plateaus, Harpers Bank and Saunders Bank, extend north. The symmetrical Michael has a 500-m-wide summit crater and a remnant of a somma rim to the SE. Tephra layers visible in ice cliffs surrounding the island are evidence of recent eruptions. Ash clouds were reported from the summit crater in 1819, and an effusive eruption was inferred to have occurred from a N-flank fissure around the end of the 19th century and beginning of the 20th century. A low ice-free lava platform, Blackstone Plain, is located on the north coast, surrounding a group of former sea stacks. A cluster of cones on the SE flank, the Ashen Hills, appear to have been modified since 1820 (LeMasurier and Thomson, 1990). Analysis of satellite imagery available since 1989 (Gray et al., 2019; MODVOLC) suggests frequent eruptive activity (when weather conditions allow), volcanic clouds, steam plumes, and thermal anomalies indicative of a persistent, or at least frequently active, lava lake in the summit crater. Due to this observational bias, there has been a presumption when defining eruptive periods that activity has been ongoing unless there is no evidence for at least 10 months.
Information Contacts: MIROVA (Middle InfraRed Observation of Volcanic Activity), a collaborative project between the Universities of Turin and Florence (Italy) supported by the Centre for Volcanic Risk of the Italian Civil Protection Department (URL: http://www.mirovaweb.it/); NASA Global Sulfur Dioxide Monitoring Page, Atmospheric Chemistry and Dynamics Laboratory, NASA Goddard Space Flight Center (NASA/GSFC), 8800 Greenbelt Road, Goddard MD 20771, USA (URL: https://so2.gsfc.nasa.gov/); Copernicus Browser (URL: https://dataspace.copernicus.eu/browser).
Shishaldin (United States) — December 2023 Cite this Report
Shishaldin
United States
54.756°N, 163.97°W; summit elev. 2857 m
All times are local (unless otherwise noted)
New eruption with significant Strombolian explosions, ash plumes, and ashfall
Shishaldin is located on the eastern half of Unimak Island, one of the Aleutian Islands. Frequent explosive activity, primarily consisting of Strombolian ash eruptions from the small summit crater, but sometimes producing lava flows, has been recorded since the 18th century. The previous eruption ended in May 2020 and was characterized by intermittent thermal activity, increased seismicity and surface temperatures, ash plumes, and ash deposits (BGVN 45:06). This report covers a new eruption during July through November 2023, which consisted of significant explosions, ash plumes, ashfall, and lava fountaining. Information comes from daily, weekly, and special reports from the Alaska Volcano Observatory (AVO) and various satellite data. AVO monitors the volcano using local seismic and infrasound sensors, satellite data, web cameras, and remote infrasound and lightning networks.
AVO reported that intermittent tremor and low-frequency earthquakes had gradually become more regular and consistent during 10-13 July. Strongly elevated surface temperatures at the summit were identified in satellite images during 10-13 July. On 11 July AVO raised the Aviation Color Code (ACC) to Yellow (the second color on a four-color scale) and Volcano Alert Level (VAL) to Advisory (the second level on a four-level scale) at 1439. Later in the day on 11 July summit crater incandescence was observed in webcam images. Observations of the summit suggested that lava was likely present at the crater, which prompted AVO to raise the ACC to Orange (the second highest color on a four-color scale) and the VAL to Watch (the second highest level on a four-level scale). The US Coast Guard conducted an overflight on 12 July and confirmed that lava was erupting from the summit. That same day, sulfur dioxide emissions were detected in satellite images.
A significant explosion began at 0109 on 14 July that produced an ash plume that rose to 9-12 km altitude and drifted S over the Pacific Ocean (figure 43). Webcam images and photos taken around 0700 from a ship SW off Unimak Island showed small lahar deposits, which were the result of the interaction of hot pyroclastic material and snow and ice on the flanks. There was also ashfall on the SW and N flanks. A smaller explosion at 0710 generated an ash plume that rose to 4.5 km altitude. Webcam images and pilot reports showed continued low-level ash emissions during the morning, rising to less than 4.6 km altitude; those emissions included a small ash plume near the summit around 1030 resulting from a small explosion.
Seismic tremor amplitude began increasing at around 1700 on 15 July; strongly elevated surface temperatures were also reported. An ash plume rose to 4.6 km altitude and drifted SSE at 2100, based on a satellite image. A continuous ash plume during 2150 through 2330 rose to 5 km altitude and extended 125 km S. At 2357 AVO raised the ACC to Red (the highest color on a four-color scale) and the VAL to Warning (the highest level on a four-level scale), noting that seismicity remained elevated for more than six hours and explosion signals were frequently detected by regional infrasound (pressure sensor) networks. Explosions generated an ash plume that rose to 4.9 km altitude and drifted as far as 500 km SE. Activity throughout the night declined and by 0735 the ACC was lowered to Orange and the VAL to Watch. High-resolution satellite images taken on 16 July showed pyroclastic deposits extending as far as 3 km from the vent; these deposits generated lahars that extended further down the drainages on the flanks. Ash deposits were mainly observed on the SSE flank and extended to the shore of Unimak Island. During 16-17 July lava continued to erupt at the summit, which caused strongly elevated surface temperatures that were visible in satellite imagery.
Lava effusion increased at 0100 on 18 July, as noted in elevated surface temperatures identified in satellite data, increasing seismic tremor, and activity detected on regional infrasound arrays. A significant ash plume at 0700 rose to 7 km altitude and continued until 0830, eventually reaching 9.1 km altitude and drifting SSE (figure 44). As a result, the ACC was raised to Red and the VAL to Warning. By 0930 the main plume detached, but residual low-level ash emissions continued for several hours, remaining below 3 km altitude and drifting S. The eruption gradually declined and by 1208 the ACC was lowered to Orange and the VAL was lowered to Watch. High-resolution satellite images showed ash deposits on the SW flank and pyroclastic deposits on the N, E, and S flanks, extending as far as 3 km from the vent; lahars triggered by the eruption extended farther down the flanks (figure 45). Lava continued to erupt from the summit crater on 19 July.
Elevated surface temperatures were detected in satellite images during 19-25 July, despite occasional weather cloud cover, which was consistent with increased lava effusion. During 22-23 July satellite observations acquired after the eruption from 18 July showed pyroclastic flow and lahar deposits extending as far as 3 km down the N, NW, and NE flanks and as far as 1.5 km down the S and SE flanks. Ash deposits covered the SW and NE flanks. No lava flows were observed outside the crater. On 22 July a sulfur dioxide plume was detected in satellite data midday that had an estimated mass of 10 kt. In a special notice issued at 1653 on 22 July AVO noted that eruptive activity had intensified over the previous six hours, which was characterized by an hours-long steady increase in seismic tremor, intermittent infrasound signals consistent with small explosions, and an increase in surface temperatures that were visible in satellite data. Pilots first reported low-level ash plumes at around 1900. At 2320 an ash plume had risen to 9 km altitude based on additional pilot reports and satellite images. The ACC was increased to Red and the VAL to Warning at 2343. Satellite images indicated growth of a significantly higher ash plume that rose to 11 km altitude continued until 0030 and drifted NE. During the early morning hours of 23 July ash plumes had declined to 4.6 k altitude. Seismic tremor peaked at 0030 on 23 July and began to rapidly decline at 0109; active ash emissions were no longer visible in satellite data by 0130. The ACC was lowered to Orange and the VAL to Watch at 0418; bursts of increased seismicity were recorded throughout the morning, but seismicity generally remained at low levels. Elevated surface temperatures were visible in satellite data until about 0600. On 24 July pilots reported seeing vigorous gas-and-steam plumes rising to about 3 km altitude; the plumes may have contained minor amounts of ash.
During 24-25 July low level seismicity and volcanic tremor were detected at low levels following the previous explosion on 23 July. Strongly elevated surface temperatures were observed at the summit crater in satellite data. Around 2200 on 25 July seismicity began to increase, followed by infrasound signals of explosions after 0200 on 26 July. An ash plume rose to 3 km altitude at 0500 and drifted ENE, along with an associated sulfur dioxide plume that drifted NE and had an estimated mass of 22 kt. Diffuse ash emissions were visible in satellite data and rose to 6.1-7.6 km altitude and extended 125 km from the volcano starting around 1130. These ash events were preceded by about seven hours of seismic tremor, infrasound detections of explosions, and five hours of increased surface temperatures visible in satellite data. Activity began to decline around 1327, which included low-frequency earthquakes and decreased volcanic tremor, and infrasound data no longer detected significant explosions. Surface temperatures remained elevated through the end of the month.
Seismicity, volcanic tremor, and ash emissions remained at low levels during early August. Satellite images on 1 August showed that some slumping had occurred on the E crater wall due to the recent explosive activity. Elevated surface temperatures continued, which was consistent with cooling lava. On 2 August small explosive events were detected, consistent with low-level Strombolian activity. Some episodes of volcanic tremor were reported, which reflected low-level ash emissions. Those ash emissions rose to less than 3 km altitude and drifted as far as 92.6 km N. Pilots that were located N of the volcano observed an ash plume that rose to 2.7 km altitude. Seismicity began to increase in intensity around 0900 on 3 August. Seismicity continued to increase throughout the day and through the night with strongly elevated surface temperatures, which suggested that lava was active at the surface.
An ash cloud that rose to 7.6-7.9 km altitude and drifted 60-75 km NE was visible in a satellite image at 0520 on 4 August. Pilots saw and reported the plume at 0836 (figure 46). By 0900 the plume had risen to 9.1 km altitude and extended over 100 km NE. AVO raised the ACC to Red and the VAL to Warning as a result. Seismic tremor levels peaked at 1400 and then sharply declined at 1500 to slightly elevated levels; the plume was sustained during the period of high tremor and drifted N and NE. The ACC was lowered to Orange and the VAL to Watch at 2055. During 5-14 August seismicity remained low and surface temperatures were elevated based on satellite data due to cooling lava. On 9 August a small lava flow was observed that extended from the crater rim to the upper NE flank. It had advanced to 55 m in length and appeared in satellite imagery on 11 August. Occasional gas-and-steam plumes were noted in webcam images. At 1827 AVO noted that seismic tremor had steadily increased during the afternoon and erupting lava was visible at the summit in satellite images.
Strong explosion signals were detected at 0200 on 15 August. An ash cloud that was visible in satellite data extended 100 km NE and may have risen as high as 11 km altitude around 0240. By 0335 satellite images showed the ash cloud rising to 7.6 km altitude and drifting NE. Significant seismicity and explosions were detected by the local AVO seismic and infrasound networks, and volcanic lightning was detected by the World Wide Lightning Location Network (WWLLN). A sulfur dioxide plume associated with the eruption drifted over the S Bering Sea and parts of Alaska and western Canada. Seismicity was significantly elevated during the eruption but had declined by 1322. A pilot reported that ash emissions continued, rising as high as 4.9 km altitude. Elevated surface temperatures detected in satellite data were caused by hot, eruptive material (pyroclastic debris and lava) that accumulated around the summit. Eruptive activity declined by 16 August and the associated sulfur dioxide plume had mostly dissipated; remnants continued to be identified in satellite images at least through 18 August. Surface temperatures remained elevated based on satellite images, indicating hot material on the upper parts of the volcano. Small explosions were detected in infrasound data on the morning of 19 August and were consistent with pilot reports of small, short-lived ash plumes that rose to about 4.3 km altitude. Low-level explosive activity was reported during 20-24 August, according to seismic and infrasound data, and weather clouds sometimes prevented views. Elevated surface temperatures were observed in satellite images, which indicated continued hot material on the upper parts of the volcano.
Seismic tremor began to increase at around 0300 on 25 August and was followed by elevated surface temperatures identified in satellite images, consistent with erupting lava. Small explosions were recorded in infrasound data. The ACC was raised to Red and the VAL to Warning at 1204 after a pilot reported an ash plume that rose to 9.1 km altitude. Seismicity peaked at 1630 and began to rapidly decline at around 1730. Ash plumes rose as high as 10 km altitude and drifted as far as 400 km NE. By 2020 the ash plumes had declined to 6.4 km altitude and continued to drift NE. Ash emissions were visible in satellite data until 0000 on 26 August and seismicity was at low levels. AVO lowered the ACC to Orange and the VAL to Watch at 0030. Minor explosive activity within the summit crater was detected during 26-28 August and strongly elevated surface temperatures were still visible in satellite imagery through the rest of the month. An AVO field crew working on Unimak Island observed a mass flow that descended the upper flanks beginning around 1720 on 27 August. The flow produced a short-lived ash cloud that rose to 4.5 km altitude and rapidly dissipated. The mass flow was likely caused by the collapse of spatter that accumulated on the summit crater rim.
Similar variable explosive activity was reported in September, although weather observations sometimes prevented observations. A moderate resolution satellite image from the afternoon of 1 September showed gas-and-steam emissions filling the summit crater and obscuring views of the vent. In addition, hot deposits from the previous 25-26 August explosive event were visible on the NE flank near the summit, based on a 1 September satellite image. On 2 and 4 September seismic and infrasound data showed signals of small, repetitive explosions. Variable gas-and-steam emissions from the summit were visible but there was no evidence of ash. Possible summit crater incandescence was visible in nighttime webcam images during 3-4 September.
Seismicity began to gradually increase at around 0300 on 5 September and activity escalated at around 0830. A pilot reported an ash plume that rose to 7.6 km altitude at 0842 and continued to rise as high as possibly 9.7 km altitude and drifted SSE based on satellite images (figure 47). The ACC was raised to Red and the VAL to Warning at 0900. In addition to strong tremor and sustained explosions, the eruption produced volcanic lightning that was detected by the WWLLN. Around 1100 seismicity decreased and satellite data confirmed that the altitude of the ash emissions had declined to 7.6 km altitude. By 1200 the lower-altitude portion of the ash plume had drifted 125 km E. Significant ash emissions ended by 1330 based on webcam images. The ACC was lowered to Orange and the VAL to Watch at 1440. Satellite images showed extensive pyroclastic debris flows on most of the flanks that extended 1.2-3.3 km from the crater rim.
During 6-13 September elevated surface temperatures continued to be observed in satellite data, seismicity remained elevated with weak but steady tremor, and small, low-frequency earthquakes and small explosions were reported, except on 12 September. On 6 September a low-level ash plume rose to 1.5-1.8 km altitude and drifted SSE. Occasional small and diffuse gas-and-steam emissions at the summit were visible in webcam images. Around 1800 on 13 September seismic tremor amplitudes began to increase, and small explosions were detected in seismic and infrasound data. Incandescent lava at the summit was seen in a webcam image taken at 0134 on 14 September during a period of elevated tremor. No ash emissions were reported during the period of elevated seismicity. Lava fountaining began around 0200, based on webcam images. Satellite-based radar observations showed that the lava fountaining activity led to the growth of a cone in the summit crater, which refilled most of the crater. By 0730 seismicity significantly declined and remained at low levels.
Seismic tremor began to increase around 0900 on 15 September and rapidly intensified. An explosive eruption began at around 1710, which prompted AVO to raise the ACC to Red and the VAL to Warning. Within about 30 minutes ash plumes drifted E below a weather cloud at 8.2 km altitude. The National Weather Service estimated that an ash-rich plume rose as high as 12.8 km altitude and produced volcanic lightning. The upper part of the ash plume detached from the vent around 1830 and drifted E, and was observed over the Gulf of Alaska. Around the same time, seismicity dramatically decreased. Trace ashfall was reported in the community of False Pass (38 km ENE) between 1800-2030 and also in King Cove and nearby marine waters. Activity declined at around 1830 although seismicity remained elevated, ash emissions, and ashfall continued until 2100. Lightning was again detected beginning around 1930, which suggested that ash emissions continued. Ongoing explosions were detected in infrasound data, at a lower level than during the most energetic phase of this event. Lightning was last detected at 2048. By 2124 the intensity of the eruption had decreased, and ash emissions were likely rising to less than 6.7 km altitude. Seismicity returned to pre-eruption levels. On 16 September the ACC was lowered to Orange and the VAL to Watch at 1244; the sulfur dioxide plume that was emitted from the previous eruption event was still visible over the northern Pacific Ocean. Elevated surface temperatures, gas-and-steam emissions from the vent, and new, small lahars were reported on the upper flanks based on satellite and webcam images. Minor deposits were reported on the flanks which were likely the result of collapse of previously accumulated lava near the summit crater.
Elevated seismicity with tremor, small earthquakes, and elevated surface temperatures were detected during 17-23 September. Minor gas-and-steam emissions were visible in webcam images. On 20 September small volcanic debris flows were reported on the upper flanks. On 21 September a small ash deposit was observed on the upper flanks extending to the NE based on webcam images. Seismic tremor increased significantly during 22-23 September. Regional infrasound sensors suggested that low-level eruptive activity was occurring within the summit crater by around 1800 on 23 September. Even though seismicity was at high levels, strongly elevated surface temperatures indicating lava at the surface were absent and no ash emissions were detected; weather clouds at 0.6-4.6 km altitude obscured views. At 0025 on 24 September AVO noted that seismicity continued at high levels and nearly continuous small infrasound signals began, likely from low-level eruptive activity. Strongly elevated surface temperatures were identified in satellite images by 0900 and persisted throughout the day; the higher temperatures along with infrasound and seismic data were consistent with lava erupting at the summit. Around 1700 similarly elevated surface temperatures were detected from the summit in satellite data, which suggested that more vigorous lava fountaining had started. Starting around 1800 low-level ash emissions rose to altitudes less than 4.6 km altitude and quickly dissipated.
Beginning at midnight on 25 September, a series of seismic signals consistent with volcanic flows were recorded on the N side of the volcano. A change in seismicity and infrasound signals occurred around 0535 and at 0540 a significant ash cloud formed and quickly reached 14 km altitude and drifted E along the Alaska Peninsula. The cloud generated at least 150 lightning strokes with thunder that could be heard by people in False Pass. Seismicity rapidly declined to near background levels around 0600. AVO increased the ACC to Red and the VAL to Warning at 0602. The ash cloud detached from the volcano at around 0700, rose to 11.6 km altitude, and drifted ESE. Trace to minor amounts of ashfall were reported by the communities of False Pass, King Cove, Cold Bay, and Sand Point around 0700. Ash emissions continued at lower altitudes of 6-7.6 km altitude at 0820. Small explosions at the vent area continued to be detected in infrasound data and likely represented low-level eruptive activity near the vent. Due to the significant decrease in seismicity and ash emissions the ACC was lowered to Orange and the VAL to Watch at 1234. Radar data showed significant collapses of the crater that occurred on 25 September. Satellite data also showed significant hot, degassing pyroclastic and lahar deposits on all flanks, including more extensive flows on the ENE and WSW sections below two new collapse scarps. Following the significant activity during 24-25 September, only low-level activity was observed. Seismicity decreased notably near the end of the strong activity on 25 September and continued to decrease through the end of the month, though tremor and small earthquakes were still reported. No explosive activity was detected in infrasound data through 2 October. Gas-and-steam emissions rose to 3.7 km altitude, as reported by pilots and seen in satellite images. Satellite data from 26 September showed that significant collapses had occurred at the summit crater and hot, steaming deposits from pyroclastic flows and lahars were present on all the flanks, particularly to the ENE and WSW. A small ash cloud was visible in webcam images on 27 September, likely from a collapse at the summit cone. High elevated surface temperatures were observed in satellite imagery during 27-28 September, which were likely the result of hot deposits on the flanks erupted on 25 September. Minor steaming at the summit crater and from an area on the upper flanks was visible in webcam images on 28 September.
During October, explosion events continued between periods of low activity. Seismicity significantly increased starting at around 2100 on 2 October; around the same time satellite images showed an increase in surface temperatures consistent with lava fountaining. Small, hot avalanches of rock and lava descended an unspecified flank. In addition, a distinct increase in infrasound, seismicity, and lightning detections was followed by an ash plume that rose to 12.2 km altitude and drifted S and E at 0520 on 3 October, based on satellite images. Nighttime webcam images showed incandescence due to lava fountaining at the summit and pyroclastic flows descending the NE flank. AVO reported that a notable explosive eruption started at 0547 and lasted until 0900 on 3 October, which prompted a rise in the ACC to Red and the VAL to Warning. Subsequent ash plumes rose to 6-7.6 km altitude by 0931. At 1036 the ACC was lowered back to Orange and the VAL to Watch since both seismic and infrasound data quieted substantially and were slightly above background levels. Gas-and-steam emissions were observed at the summit, based on webcam images. Trace amounts of ashfall were observed in Cold Bay. Resuspended ash was present at several kilometers altitude near the volcano. During the afternoon, low-level ash plumes were visible at the flanks, which appeared to be largely generated by rock avalanches off the summit crater following the explosive activity. These ash plumes rose to 3 km altitude and drifted W. Trace amounts of ashfall were reported by observers in Cold Bay and Unalaska and flights to these communities were disrupted by the ash cloud. Satellite images taken after the eruption showed evidence of pyroclastic flows and lahar deposits in drainages 2 km down the SW flank and about 3.2 km down the NE flank, and continued erosion of the crater rim. Small explosion craters at the end of the pyroclastic flows on the NE flank were noted for the first time, which may have resulted from gas-and-steam explosions when hot deposits interact with underlying ice.
During 4 October seismicity, including frequent small earthquakes, remained elevated, but was gradually declining. Ash plumes were produced for over eight hours until around 1400 that rose to below 3.7 km altitude. These ash plumes were primarily generated off the sides of the volcano where hot rock avalanches from the crater rim had entered drainages to the SW and NE. Two explosion craters were observed at the base of the NE deposits about 3.2 km from the crater rim. Webcam images showed the explosion craters were a source of persistent ash emissions; occasional collapse events also generated ash. Seismicity remained elevated with sulfur dioxide emissions that had a daily average of more than 1,000 tons per day, and frequent small earthquakes through the end of the month. Frequent elevated surface temperatures were identified in satellite images and gas-and-steam plumes were observed in webcam images, although weather conditions occasionally prevented clear views of the summit. Emissions were robust during 14-16 October and were likely generated by the interaction of hot material and snow and ice. During the afternoon of 21 October a strong gas-and-steam plume rose to 3-4.6 km altitude and extended 40 km WSW, based on satellite images and reports from pilots. On 31 October the ACC was lowered to Yellow and the VAL was lowered to Advisory.
Activity in November was characterized by elevated seismicity with ongoing seismic tremor and small, low-frequency earthquakes, elevated surface temperatures, and gas-and-steam emissions. There was an increase in seismic and infrasound tremor amplitudes starting at 1940 on 2 November. As a result, the ACC was again raised to Orange and the VAL was increased to Watch, although ash was not identified in satellite data. An ash cloud rose to 6.1 km altitude and drifted W according to satellite data at 2000. By 0831 on 3 November ash emissions were no longer visible in satellite images. On 6 and 9 November air pressure sensors detected signals consistent with small explosions. Small explosions were detected in infrasound data consistent with weak Strombolian activity on 19 and 21 November. Seismicity started to decrease on 21 November. On 25 November gas-and-steam emissions were emitted from the vent as well as from a scarp on the NE side of the volcano near the summit. A gas-and-steam plume extended about 50 km SSE and was observed in satellite and webcam images on 26 November. On 28 November small explosions were observed in seismic and local infrasound data and gas-and-steam emissions were visible from the summit and from the upper NE collapse scarp based on webcam images. Possible small explosions were observed in infrasound data on 30 November. Weakly elevated surface temperatures and a persistent gas-and-steam plume from the summit and collapse scarps on the upper flanks. A passing aircraft reported the gas-and-steam plume rose to 3-3.4 km altitude on 30 November, but no significant ash emissions were detected.
Satellite data. MODIS thermal anomaly data provided through MIROVA (Middle InfraRed Observation of Volcanic Activity) showed a strong pulse of thermal activity beginning in July 2023 that continued through November 2023 (figure 48). This strong activity was due to Strombolian explosions and lava fountaining events at the summit crater. According to data from MODVOLC thermal alerts, a total of 101 hotspots were detected near the summit crater in July (11-14, 16-19, 23-24 and 26), August (4, 25-26, and 29), September (5, 12, and 17), and October (3, 4, and 8). Infrared satellite data showed large lava flows descending primarily the northern and SE flanks during the reporting period (figure 49). Sulfur dioxide plumes often exceeded two Dobson Units (DUs) and drifted in different directions throughout the reporting period, based on satellite data from the TROPOMI instrument on the Sentinel-5P satellite (figure 50).
Geologic Background. The symmetrical glacier-covered Shishaldin in the Aleutian Islands is the westernmost of three large stratovolcanoes in the eastern half of Unimak Island. The Aleuts named the volcano Sisquk, meaning "mountain which points the way when I am lost." Constructed atop an older glacially dissected edifice, it is largely basaltic in composition. Remnants of an older edifice are exposed on the W and NE sides at 1,500-1,800 m elevation. There are over two dozen pyroclastic cones on its NW flank, which is covered by massive aa lava flows. Frequent explosive activity, primarily consisting of Strombolian ash eruptions from the small summit crater, but sometimes producing lava flows, has been recorded since the 18th century. A steam plume often rises from the summit crater.
Information Contacts: Alaska Volcano Observatory (AVO), a cooperative program of a) U.S. Geological Survey, 4200 University Drive, Anchorage, AK 99508-4667 USA (URL: https://avo.alaska.edu/), b) Geophysical Institute, University of Alaska, PO Box 757320, Fairbanks, AK 99775-7320, USA, and c) Alaska Division of Geological & Geophysical Surveys, 794 University Ave., Suite 200, Fairbanks, AK 99709, USA (URL: http://dggs.alaska.gov/); MIROVA (Middle InfraRed Observation of Volcanic Activity), a collaborative project between the Universities of Turin and Florence (Italy) supported by the Centre for Volcanic Risk of the Italian Civil Protection Department (URL: http://www.mirovaweb.it/); Hawai'i Institute of Geophysics and Planetology (HIGP) - MODVOLC Thermal Alerts System, School of Ocean and Earth Science and Technology (SOEST), Univ. of Hawai'i, 2525 Correa Road, Honolulu, HI 96822, USA (URL: http://modis.higp.hawaii.edu/); NASA Global Sulfur Dioxide Monitoring Page, Atmospheric Chemistry and Dynamics Laboratory, NASA Goddard Space Flight Center (NASA/GSFC), 8800 Greenbelt Road, Goddard, Maryland, USA (URL: https://so2.gsfc.nasa.gov/); Copernicus Browser, Copernicus Data Space Ecosystem, European Space Agency (URL: https://dataspace.copernicus.eu/browser/).
Ioto
Japan
24.751°N, 141.289°E; summit elev. 169 m
All times are local (unless otherwise noted)
New eruption with discolored water, ejecta, and floating pumice during October-December 2023
Ioto (Iwo-jima), located about 1,200 km S of Tokyo, lies within a 9-km-wide submarine caldera along the Izu-Bonin-Mariana volcanic arc. Previous eruptions date back to 1889 and have consisted of dominantly phreatic explosions, pumice deposits during 2001, and discolored water. A submarine eruption during July through December 2022 was characterized by discolored water, pumice deposits, and gas emissions (BGVN 48:01). This report covers a new eruption during October through December 2023, which consisted of explosions, black ejecta, discolored water, and floating pumice, based on information from the Japan Meteorological Association (JMA), the Japan Coast Guard (JCG), and satellite data.
JMA reported that an eruption had been occurring offshore of Okinahama on the SE side of the island since 21 October, which was characterized by volcanic tremor, according to the Japan Maritime Self-Defense Force (JMSDF) Iwo Jima Air Base (figure 22). According to an 18 October satellite image a plume of discolored water at the site of this new eruption extended NE (figure 23). During an overflight conducted on 30 October, a vent was identified about 1 km off the coast of Okinahama. Observers recorded explosions every few minutes that ejected dark material about 20 m above the ocean and as high as 150 m. Ejecta from the vent formed a black-colored island about 100 m in diameter, according to observations conducted from the air by the Earthquake Research Institute of the University of Tokyo in cooperation with the Mainichi newspaper (figure 24). Occasionally, large boulders measuring more than several meters in size were also ejected. Observations from the Advanced Land Observing Satellite Daichi-2 and Sentinel-2 satellite images also confirmed the formation of this island (figure 23). Brown discolored water and floating pumice were present surrounding the island.
The eruption continued during November. During an overflight on 3 November observers photographed the island and noted that material was ejected 169 m high, according to a news source. Explosions gradually became shorter, and, by the 3rd, they occurred every few seconds; dark and incandescent material were ejected about 800 m above the vent. On 4 November eruptions were accompanied by explosive sounds. Floating, brown-colored pumice was present in the water surrounding the island. There was a brief increase in the number of volcanic earthquakes during 8-14 November and 24-25 November. The eruption temporarily paused during 9-11 November and by 12 November eruptions resumed to the W of the island. On 10 November dark brown-to-dark yellow-green discolored water and a small amount of black floating material was observed (figure 25). A small eruption was reported on 18 November off the NE coast of the island, accompanied by white gas-and-steam plumes (figure 23). Another pause was recorded during 17-19 November, which then resumed on 20 November and continued erupting intermittently. According to a field survey conducted by the National Institute for Disaster Prevention Science and Technology on 19 November, a 30-m diameter crater was visible on the NE coast where landslides, hot water, and gray volcanic ash containing clay have occurred and been distributed previously. Erupted blocks about 10 cm in diameter were distributed about 90-120 m from the crater. JCG made observations during an overflight on 23 November and reported a phreatomagmatic eruption. Explosions at the main vent generated dark gas-and-ash plumes that rose to 200 m altitude and ejected large blocks that landed on the island and in the ocean (figure 26). Discolored water also surrounded the island. The size of the new island had grown to 450 m N-S x 200 m E-W by 23 November, according to JCG.
The eruption continued through 11 December, followed by a brief pause in activity, which then resumed on 31 December, according to JMA. Intermittent explosions produced 100-m-high black plumes at intervals of several minutes to 30 minutes during 1-10 December. Overflights were conducted on 4 and 15 December and reported that the water surrounding the new island was discolored to dark brown-to-dark yellow-green (figure 27). No floating material was reported during this time. In comparison to the observations made on 23 November, the new land had extended N and part of it had eroded away. In addition, analysis by the Geospatial Information Authority of Japan using SAR data from Daichi-2 also confirmed that the area of the new island continued to decrease between 4 and 15 December. Ejected material combined with wave erosion transformed the island into a “J” shape, 500-m-long and with the curved part about 200 m offshore of Ioto. The island was covered with brown ash and blocks, and the surrounding water was discolored to greenish-brown and contained an area of floating pumice. JCG reported from an overflight on 4 December that volcanic ash-like material found around the S vent on the NE part of the island was newly deposited since 10 November (figure 28). By 15 December the N part of the “J” shaped island had separated and migrated N, connecting to the Okinahama coast and the curved part of the “J” had eroded into two smaller islands (figure 27).
References. Ukawa, M., Fujita, E., Kobayashi, T., 2002, Recent volcanic activity of Iwo Jima and the 2001 eruption, Monthly Chikyu, Extra No. 39, 157-164.
Geologic Background. Ioto, in the Volcano Islands of Japan, lies within a 9-km-wide submarine caldera. The volcano is also known as Ogasawara-Iojima to distinguish it from several other "Sulfur Island" volcanoes in Japan. The triangular, low-elevation, 8-km-long island narrows toward its SW tip and has produced trachyandesitic and trachytic rocks that are more alkalic than those of other volcanoes in this arc. The island has undergone uplift for at least the past 700 years, accompanying resurgent doming of the caldera; a shoreline landed upon by Captain Cook's surveying crew in 1779 is now 40 m above sea level. The Motoyama plateau on the NE half of the island consists of submarine tuffs overlain by coral deposits and forms the island's high point. Many fumaroles are oriented along a NE-SW zone cutting through Motoyama. Numerous recorded phreatic eruptions, many from vents on the W and NW sides of the island, have accompanied the uplift.
Information Contacts: Japan Meteorological Agency (JMA), 1-3-4 Otemachi, Chiyoda-ku, Tokyo 100-8122, Japan (URL: http://www.jma.go.jp/jma/indexe.html); Japan Coast Guard (JCG) Volcano Database, Hydrographic and Oceanographic Department, 3-1-1, Kasumigaseki, Chiyoda-ku, Tokyo 100-8932, Japan (URL: https://www1.kaiho.mlit.go.jp/GIJUTSUKOKUSAI/kaiikiDB/kaiyo22-2.htm); Copernicus Browser, Copernicus Data Space Ecosystem, European Space Agency (URL: https://dataspace.copernicus.eu/browser/); Asahi, 5-3-2, Tsukiji, Chuo Ward, Tokyo, 104-8011, Japan (URL: https://www.asahi.com/ajw/articles/15048458).
Purace (Colombia) — December 2023 Cite this Report
Purace
Colombia
2.3095°N, 76.3948°W; summit elev. 4650 m
All times are local (unless otherwise noted)
Gas-and-ash emission on 16 November 2023
Puracé, located in Colombia, is a stratovolcano that contains a 500-m-wide summit crater. It is part of the Los Coconucos volcanic chain that is a NW-SE trending group of seven cones and craters. The most recent eruption occurred during March 2022 that was characterized by frequent seismicity and gas-and-steam emissions (BGVN 47:06). This report covers a brief eruption during November 2023 based on monthly reports from the Popayán Observatory, part of the Servicio Geologico Colombiano (SGC).
Activity during November 2022 through November 2023 primarily consisted of seismicity: VT-type events, LP-type events, HB-type events, and TR-type events (table 4). Maximum sulfur dioxide values were measured weekly and ranged from 259-5,854 tons per day (t/d) during November 2022 through April 2023. White gas-and-steam emissions were also occasionally reported.
SGC issued a report on 25 October that noted a significant increase in the number of earthquakes associated with rock fracturing. These earthquakes were located SE of the crater between Puracé and Piocollo at depths of 1-4 km. There were no reported variations in sulfur dioxide values, but SGC noted high carbon dioxide values, compared to those recorded in the first half of 2023.
SGC reported that at 1929 on 16 November the seismic network detected a signal that was possibly associated with a gas-and-ash emission, though it was not confirmed in webcam images due to limited visibility. On 17 November an observer confirmed ash deposits on the N flank. Webcam images showed an increase in degassing both inside the crater and from the NW flank, rising 700 m above the crater.
Table 4. Seismicity at Puracé during November 2022-November 2023. Volcano-tectonic (VT), long-period (LP), hybrid (HB), and tremor (TR) events are reported each month. Courtesy of SGC.
| Month |
Volcano-tectonic |
Long-period |
Hybrid |
Tremor |
| Nov 2022 |
429 |
2,023 |
5 |
831 |
| Dec 2022 |
423 |
1,390 |
9 |
834 |
| Jan 2023 |
719 |
1,622 |
0 |
957 |
| Feb 2023 |
598 |
1,701 |
2 |
1,124 |
| Mar 2023 |
331 |
2,408 |
147 |
607 |
| Apr 2023 |
614 |
4,427 |
33 |
148 |
| May 2023 |
620 |
3,717 |
170 |
109 |
| Jun 2023 |
467 |
3,293 |
86 |
148 |
| Jul 2023 |
1,116 |
5,809 |
183 |
542 |
| Aug 2023 |
692 |
2,927 |
94 |
321 |
| Sep 2023 |
887 |
1,505 |
82 |
848 |
| Oct 2023 |
2,373 |
2,949 |
135 |
692 |
| Nov 2023 |
1,212 |
2,302 |
69 |
293 |
Geologic Background. Puracé is an active andesitic volcano with a 600-m-diameter summit crater at the NW end of the Los Coconucos Volcanic Chain. This volcanic complex includes nine composite and five monogenetic volcanoes, extending from the Puracé crater more than 6 km SE to the summit of Pan de Azúcar stratovolcano. The dacitic massif which the complex is built on extends about 13 km NW-SE and 10 km NE-SW. Frequent small to moderate explosive eruptions reported since 1816 CE have modified the morphology of the summit crater, with the largest eruptions in 1849, 1869, and 1885.
Information Contacts: Servicio Geologico Colombiano (SGC), Diagonal 53 No. 34-53 - Bogotá D.C., Colombia (URL: https://www.sgc.gov.co/volcanes).
Etna
Italy
37.748°N, 14.999°E; summit elev. 3357 m
All times are local (unless otherwise noted)
Strombolian explosions, lava fountains, and lava flows during July-August 2023
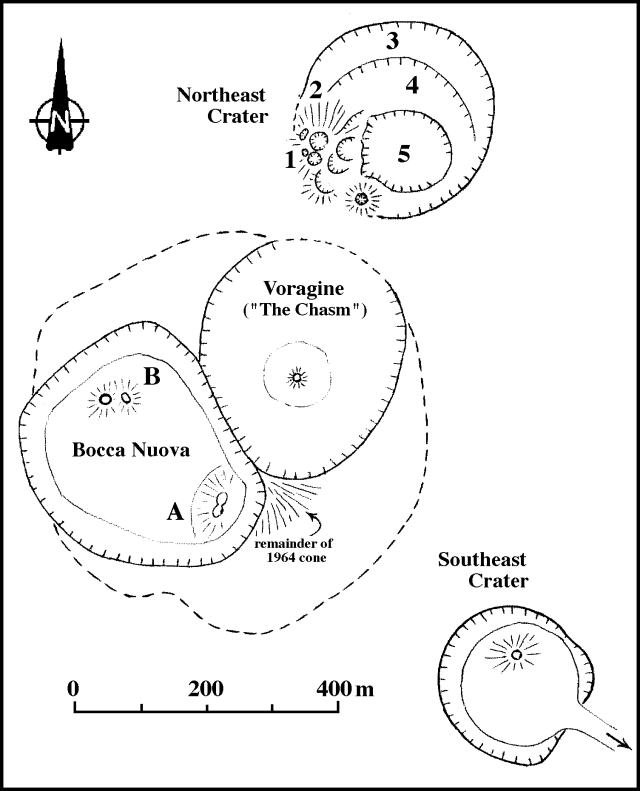
Etna, located on the Italian island of Sicily, has had documented eruptions dating back to 1500 BCE. Activity typically originates from multiple cones at the summit, where several craters have formed and evolved. The currently active craters are Northeast Crater (NEC), Voragine (VOR), and Bocca Nuova (BN), and the Southeast Crater (SEC); VOR and BN were previously referred to as the “Central Crater”. The original Southeast crater formed in 1978, and a second eruptive site that opened on its SE flank in 2011 was named the New Southeast Crater (NSEC). Another eruptive site between the SEC and NSEC developed during early 2017 and was referred to as the "cono della sella" (saddle cone). The current eruption period began in November 2022 and has been characterized by intermittent Strombolian activity, lava flows, and ash plumes (BGVN 48:08). This report updates activity during July through October 2023, which includes primarily gas-and-steam emissions; during July and August Strombolian explosions, lava fountains, and lava flows were reported, based on weekly and special reports by the Osservatorio Etneo (OE), part of the Catania Branch of Italy's Istituo Nazionale di Geofisica e Vulcanologica (INGV) and satellite data.
Variable fumarolic degassing was reported at all summit craters (BN, VOR, NEC, and SEC) throughout the entire reporting period (table 15). The MIROVA (Middle InfraRed Observation of Volcanic Activity) volcano hotspot detection system based on the analysis of MODIS data showed frequent low-to-moderate power thermal anomalies during the reporting period (figure 399). During mid-August there was a pulse in activity that showed an increase in the power of the anomalies due to Strombolian activity, lava fountains, and lava flows. Infrared satellite imagery captured strong thermal anomalies at the central and southeast summit crater areas (figure 400). Accompanying thermal activity were occasional sulfur dioxide plumes that exceeded 2 Dobson Units (DUs) recorded by the TROPOMI instrument on the Sentinel-5P satellite (figure 401).
Table 15. Summary of activity at the four primary crater areas at the summit of Etna during July-October 2023. Information is from INGV weekly reports.
| Month |
Bocca Nuova (BN) |
Voragine (VOR) |
Northeast Crater (NEC) |
Southeast Crater (SEC) |
| Jul 2023 |
Continuous degassing. |
No observations. |
Weak gas emissions. |
Continuous degassing. Sporadic and weak-to-moderate ash emissions. Strombolian explosions. |
| Aug 2023 |
Continuous degassing. |
No observations. |
No observations. |
Continuous degassing. Occasional ash emissions. Strombolian activity, lava fountaining, and lava flows. |
| Sep 2023 |
Variable degassing. Crater incandescence. |
Weak fumarolic activity. |
Weak fumarolic activity. |
Variable degassing. |
| Oct 2023 |
Continuous degassing. |
Weak fumarolic activity. |
Weak fumarolic activity. |
Continuous degassing. |
Activity during July and August was relatively low and mainly consisted of degassing at the summit craters, particularly at SEC and BN. Cloudy weather prevented clear views of the summit during early July. During the night of 2 July some crater incandescence was visible at SEC. Explosive activity resumed at SEC during 9-10 July, which was characterized by sporadic and weak ash emissions that rapidly dispersed in the summit area (figure 402). INGV reported moderate Strombolian activity began at 2034 on 14 July and was confined to the inside of the crater and fed by a vent located in the E part of SEC. An ash emission was detected at 2037. A new vent opened on 15 July in the SE part of BN and began to produce continuous gas-and-steam emissions. During an inspection carried out on 28 July pulsating degassing, along with audible booms, were reported at two active vents in BN. Vigorous gas-and-steam emissions intermittently generated rings. On rare occasions, fine, reddish ash was emitted from BN1 and resuspended by the gas-and-steam emissions.
Around 2000 on 13 August INGV reported a sudden increase in volcanic tremor amplitude. Significant infrasonic activity coincided with the tremor increase. Incandescent flashes were visible through the cloud cover in webcam images of SEC (figure 403). Strombolian activity at SEC began to gradually intensify starting at 2040 as seismicity continued to increase. The Aviation Color Code (ACC) was raised to Yellow (the second lowest-level on a four-color scale) at 2126 and then to Orange (the second highest-level on a four-color scale) at 2129 due to above-background activity. The activity rapidly transitioned from Strombolian activity to lava fountains around 2333 that rose 300-400 m above the crater (figure 403). Activity was initially focused on the E vent of the crater, but then the vent located above the S flank of the cone also became active. A lava flow from this vent traveled SW into the drainage created on 10 February 2022, overlapping with previous flows from 10 and 21 February 2022 and 21 May 2023, moving between Monte Barbagallo and Monte Frumento Supino (figure 404). The lava flow was 350 m long, oriented NNE-SSW, and descended to an elevation of 2.8 km. Flows covered an area of 300,000 m2 and had an estimated volume of 900,000 m3. The ACC was raised to Red at 2241 based on strong explosive activity and ashfall in Rifugio Sapienza-Piano Vetore at 1.7 km elevation on the S flank. INGV reported that pyroclastic flows accompanied this activity.
Activity peaked between 0240 and 0330 on 14 August, when roughly 5-6 vents erupted lava fountains from the E to SW flank of SEC. The easternmost vents produced lava fountains that ejected material strongly to the E, which caused heavy fallout of incandescent pyroclastic material on the underlying flank, triggering small pyroclastic flows. This event was also accompanied by lightning both in the ash column and in the ash clouds that were generated by the pyroclastic flows. A fracture characterized by a series of collapse craters (pit craters) opened on the upper SW flank of SEC. An ash cloud rose a few kilometers above the crater and drifted S, causing ash and lapilli falls in Rifugio Sapienza and expanding toward Nicolosi, Mascalucia, Catania, and up to Syracuse. Ashfall resulted in operational problems at the Catania airport (50 km S), which lasted from 0238 until 2000. By 0420 the volcanic tremor amplitude values declined to background levels. After 0500 activity sharply decreased, although the ash cloud remained for several hours and drifted S. By late morning, activity had completely stopped. The ACC was lowered to Orange as volcanic ash was confined to the summit area. Sporadic, minor ash emissions continued throughout the day. At 1415 the ACC was lowered to Yellow and then to Green at 1417.
During the night of 14-15 August only occasional flashes were observed, which were more intense during avalanches of material inside the eruptive vents. Small explosions were detected at SEC at 2346 on 14 August and at 0900 on 26 August that each produced ash clouds which rapidly dispersed into the atmosphere (figure 405). According to a webcam image, an explosive event detected at 2344 at SEC generated a modest ash cloud that was rapidly dispersed by winds. The ACC was raised to Yellow at 2355 on 14 August due to increasing unrest and was lowered to Green at 0954 on 15 August.
Activity during September and October was relatively low and mainly characterized by variable degassing from BN and SEC. Intense, continuous, and pulsating degassing was accompanied by roaring sounds and flashes of incandescence at BN both from BN1 and the new pit crater that formed during late July (figure 406). The degassing from the new pit crater sometimes emitted vapor rings. Cloudy weather during 6-8 September prevented observations of the summit craters .
Geologic Background. Mount Etna, towering above Catania on the island of Sicily, has one of the world's longest documented records of volcanism, dating back to 1500 BCE. Historical lava flows of basaltic composition cover much of the surface of this massive volcano, whose edifice is the highest and most voluminous in Italy. The Mongibello stratovolcano, truncated by several small calderas, was constructed during the late Pleistocene and Holocene over an older shield volcano. The most prominent morphological feature of Etna is the Valle del Bove, a 5 x 10 km caldera open to the east. Two styles of eruptive activity typically occur, sometimes simultaneously. Persistent explosive eruptions, sometimes with minor lava emissions, take place from one or more summit craters. Flank vents, typically with higher effusion rates, are less frequently active and originate from fissures that open progressively downward from near the summit (usually accompanied by Strombolian eruptions at the upper end). Cinder cones are commonly constructed over the vents of lower-flank lava flows. Lava flows extend to the foot of the volcano on all sides and have reached the sea over a broad area on the SE flank.
Information Contacts: Sezione di Catania - Osservatorio Etneo, Istituto Nazionale di Geofisica e Vulcanologia (INGV), Sezione di Catania, Piazza Roma 2, 95123 Catania, Italy (URL: http://www.ct.ingv.it/it/); MIROVA (Middle InfraRed Observation of Volcanic Activity), a collaborative project between the Universities of Turin and Florence (Italy) supported by the Centre for Volcanic Risk of the Italian Civil Protection Department (URL: http://www.mirovaweb.it/); NASA Global Sulfur Dioxide Monitoring Page, Atmospheric Chemistry and Dynamics Laboratory, NASA Goddard Space Flight Center (NASA/GSFC), 8800 Greenbelt Road, Goddard MD 20771, USA (URL: https://so2.gsfc.nasa.gov/); Copernicus Browser, Copernicus Data Space Ecosystem, European Space Agency (URL: https://dataspace.copernicus.eu/browser/).
Suwanosejima (Japan) — December 2023 Cite this Report
Suwanosejima
Japan
29.638°N, 129.714°E; summit elev. 796 m
All times are local (unless otherwise noted)
Eruption plumes, crater incandescence, and occasional explosions during July-October 2023
Suwanosejima is an 8-km-long island that consists of a stratovolcano and two active summit craters, located in the northern Ryukyu Islands, Japan. Volcanism over the past century has been characterized by Strombolian explosions, ash plumes, and ashfall. The current eruption began in October 2004 and has more recently consisted of frequent eruption plumes, explosions, and incandescent ejecta (BGVN 48:07). This report covers similar activity of ash plumes, explosions, and crater incandescence during July through October 2023 using monthly reports from the Japan Meteorological Agency (JMA) and satellite data.
Thermal activity during the reporting period was relatively low; only one low-power thermal anomaly was detected during mid-July and one during early August, based on a MIROVA (Middle InfraRed Observation of Volcanic Activity) Log Radiative Power graph of the MODIS thermal anomaly data. On two clear weather days, a thermal anomaly was visible in infrared satellite images (figure 81).
Low-level activity was reported at the Otake crater during July and no explosions were detected. Eruption plumes rose as high as 1.8 km above the crater. On 13 July an ash plume rose 1.7 km above the crater rim, based on a webcam image. During the night of the 28th crater incandescence was visible in a webcam image. An eruptive event reported on 31 July produced an eruption plume that rose 2.1 km above the crater. Seismicity consisted of 11 volcanic earthquakes on the W flank, the number of which had decreased compared to June (28) and 68 volcanic earthquakes near the Otake crater, which had decreased from 722 in the previous month. According to observations conducted by the University of Tokyo Graduate School of Science, Kyoto University Disaster Prevention Research Institute, Toshima Village, and JMA, the amount of sulfur dioxide emissions released during the month was 400-800 tons per day (t/d).
Eruptive activity in the Otake crater continued during August and no explosions were reported. An eruptive event produced a plume that rose 1 km above the crater at 1447 on 12 August. Subsequent eruptive events were recorded at 0911 on 16 August, at 1303 on 20 August, and at 0317 on 21 August, which produced ash plumes that rose 1-1.1 km above the crater and drifted SE, SW, and W. On 22 August an ash plume was captured in a webcam image rising 1.4 km above the crater (figure 82). Multiple eruptive events were detected on 25 August at 0544, 0742, 0824, 1424, and 1704, which generated ash plumes that rose 1.1-1.2 km above the crater and drifted NE, W, and SW. On 28 August a small amount of ashfall was observed as far as 1.5 km from the crater. There were 17 volcanic earthquakes recorded on the W flank of the volcano and 79 recorded at the Otake crater during the month. The amount of sulfur dioxide emissions released during the month was 400-800 t/d.
Activity continued at the Otake crater during September. Occasionally, nighttime crater incandescence was observed in webcam images and ashfall was reported. An eruptive event at 1949 on 4 September produced an ash plume that rose 1 km above the crater and drifted SW. On 9 September several eruption events were detected at 0221, 0301, and 0333, which produced ash plumes that rose 1.1-1.4 km above the crater rim and drifted W; continuous ash emissions during 0404-0740 rose to a maximum height of 2 km above the crater rim (figure 83). More eruptive events were reported at 1437 on 10 September, at 0319 on 11 September, and at 0511 and 1228 on 15 September, which generated ash plumes that rose 1-1.8 km above the crater. During 25, 27, and 30 September, ash plumes rose as high as 1.3 km above the crater rim. JMA reported that large blocks were ejected as far as 300 m from the center of the crater. There were 18 volcanic earthquakes detected beneath the W flank and 82 volcanic earthquakes detected near the Otake crater. The amount of sulfur dioxide released during the month ranged from 600 to 1,600 t/d.
Activity during early-to-mid-October consisted of occasional explosions, a total number of 13, and ash plumes that rose as high as 1.9 km above the Otake crater rim on 29 October (figure 84). These explosions are the first to have occurred since June 2023. Continuous ash emissions were reported during 0510-0555 on 1 October. Explosions were recorded at 0304, 2141, and 2359 on 2 October, at 0112 on 3 October, and at 1326 on 6 October, which produced ash plumes that rose as high as 1 km above the crater rim and drifted SW and W. An explosion was noted at 0428 on 3 October, but emission details were unknown. A total of eight explosions were recorded by the seismic network at 1522 on 14 October, at 0337, 0433, 0555, 1008, and 1539 on 15 October, and at 0454 and 0517 on 16 October. Ash plumes from these explosions rose as high as 900 m above the crater and drifted SE. Eruptive events during 25-27 and 29-30 October generated plumes that rose as high as 1.9 km above the crater and drifted SE, S, and SW. Ash was deposited in Toshima village (3.5 km SSW). Eruptive activity occasionally ejected large volcanic blocks as far as 600 m from the crater. Nighttime crater incandescence was visible in webcams. Intermittent ashfall was reported as far as 1.5 km from the crater. There were 43 volcanic earthquakes detected on the W flank during the month, and 184 volcanic earthquakes detected near the Otake crater. The amount of sulfur dioxide emitted ranged between 400 and 900 t/d.
Geologic Background. The 8-km-long island of Suwanosejima in the northern Ryukyu Islands consists of an andesitic stratovolcano with two active summit craters. The summit is truncated by a large breached crater extending to the sea on the E flank that was formed by edifice collapse. One of Japan's most frequently active volcanoes, it was in a state of intermittent Strombolian activity from Otake, the NE summit crater, between 1949 and 1996, after which periods of inactivity lengthened. The largest recorded eruption took place in 1813-14, when thick scoria deposits covered residential areas, and the SW crater produced two lava flows that reached the western coast. At the end of the eruption the summit of Otake collapsed, forming a large debris avalanche and creating an open collapse scarp extending to the eastern coast. The island remained uninhabited for about 70 years after the 1813-1814 eruption. Lava flows reached the eastern coast of the island in 1884. Only about 50 people live on the island.
Information Contacts: Japan Meteorological Agency (JMA), 1-3-4 Otemachi, Chiyoda-ku, Tokyo 100-8122, Japan (URL: http://www.jma.go.jp/jma/indexe.html); MIROVA (Middle InfraRed Observation of Volcanic Activity), a collaborative project between the Universities of Turin and Florence (Italy) supported by the Centre for Volcanic Risk of the Italian Civil Protection Department (URL: http://www.mirovaweb.it/); Hawai'i Institute of Geophysics and Planetology (HIGP) - MODVOLC Thermal Alerts System, School of Ocean and Earth Science and Technology (SOEST), Univ. of Hawai'i, 2525 Correa Road, Honolulu, HI 96822, USA (URL: http://modis.higp.hawaii.edu/); Copernicus Browser, Copernicus Data Space Ecosystem, European Space Agency (URL: https://dataspace.copernicus.eu/browser/).
Aira
Japan
31.5772°N, 130.6589°E; summit elev. 1117 m
All times are local (unless otherwise noted)
Explosions, ash plumes, ash fall, and crater incandescence during July-October 2023
Aira caldera, located in the northern half of Kagoshima Bay, Japan, contains the post-caldera Sakurajima volcano. Eruptions typically originate from the Minamidake crater, and since the 8th century, ash deposits have been recorded in the city of Kagoshima (10 km W), one of Kyushu’s largest cities. The Minamidake summit cone and crater has had persistent activity since 1955; the Showa crater on the E flank has also been intermittently active since 2006. The current eruption period began during March 2017 and has recently been characterized by intermittent explosions, eruption plumes, and ashfall (BGVN 48:07). This report updates activity during July through October 2023 and describes explosive events, ash plumes, nighttime crater incandescence, and ashfall, according to monthly activity reports from the Japan Meteorological Agency (JMA) and satellite data.
Thermal activity remained at low levels during this reporting period, according to the MIROVA (Middle InfraRed Observation of Volcanic Activity) system (figure 149). There was a slight increase in the number of anomalies during September through October. Occasional thermal anomalies were visible in infrared satellite images mainly at the Minamidake crater (Vent A is located to the left and Vent B is located to the right) (figure 150).
Table 30. Number of monthly explosive events, days of ashfall, area of ash covered, and sulfur dioxide emissions from Sakurajima’s Minamidake crater at Aira during July-October 2023. Note that smaller ash events are not listed. Ashfall days were measured at Kagoshima Local Meteorological Observatory and ashfall amounts represent material covering all the Kagoshima Prefecture. Data courtesy of JMA monthly reports.
| Month |
Explosive events |
Days of ashfall |
Ashfall amount (g/m2) |
SO2 emissions (tons/day) |
| Jul 2023 |
3 |
0 |
0 |
1,600-3,200 |
| Aug 2023 |
3 |
10 |
7 |
1,800-3,300 |
| Sep 2023 |
3 |
7 |
3 |
1,600-2,300 |
| Oct 2023 |
33 |
8 |
61 |
2,200-4,200 |
JMA reported that during July, there were eight eruptions, three of which were explosion events in the Showa crater. Large blocks were ejected as far as 600 m from the Showa crater. Very small eruptions were occasionally reported at the Minamidake crater. Nighttime incandescence was observed in both the Showa and Minamidake crater. Explosions were reported on 16 July at 2314 and on 17 July at 1224 and at 1232 (figure 151). Resulting eruption plumes rose 700-2,500 m above the crater and drifted N. On 23 July the number of volcanic earthquakes on the SW flank of the volcano increased. A strong Mw 3.1 volcanic earthquake was detected at 1054 on 26 July. The number of earthquakes recorded throughout the month was 545, which markedly increased from 73 in June. No ashfall was observed at the Kagoshima Regional Meteorological Observatory during July. According to a field survey conducted during the month, the daily amount of sulfur dioxide emissions was 1,600-3,200 tons per day (t/d).
There were three eruptions reported at the Minamidake crater during August, each of which were explosive. The explosions occurred on 9 August at 0345, on 13 August at 2205, and on 31 August at 0640, which generated ash plumes that rose 800-2,000 m above the crater and drifted W. There were two eruptions detected at Showa crater; on 4 August at 2150 ejecta traveled 800 m from the Showa crater and associated eruption plumes rose 2.3 km above the crater. The explosion at 2205 on 13 August generated an ash plume that rose 2 km above the crater and was accompanied by large blocks that were ejected 600 m from the Minamidake crater (figure 152). Nighttime crater incandescence was visible in a high-sensitivity surveillance camera at both craters. Seismicity consisted of 163 volcanic earthquakes, 84 of which were detected on the SW flank. According to the Kagoshima Regional Meteorological Observatory there was a total of 7 g/m2 of ashfall over the course of 10 days during the month. According to a field survey, the daily amount of sulfur dioxide emitted was 1,800-3,300 t/d.
During September, four eruptions were reported, three of which were explosion events. These events occurred at 1512 on 9 September, at 0018 on 11 September, and at 2211 on 13 September. Resulting ash plumes generally rose 800-1,100 m above the crater. An explosion produced an ash plume at 2211 on 13 September that rose as high as 1.7 km above the crater. Large volcanic blocks were ejected 600 m from the Minamidake crater. Smaller eruptions were occasionally observed at the Showa crater. Nighttime crater incandescence was visible at the Minamidake crater. Seismicity was characterized by 68 volcanic earthquakes, 28 of which were detected beneath the SW flank. According to the Kagoshima Regional Meteorological Observatory there was a total of 3 g/m2 of ashfall over the course of seven days during the month. A field survey reported that the daily amount of sulfur dioxide emitted was 1,600-2,300 t/d.
Eruptive activity during October consisted of 69 eruptions, 33 of which were described as explosive. These explosions occurred during 4 and 11-21 October and generated ash plumes that rose 500-3,600 m above the crater and drifted S, E, SE, and N. On 19 October at 1648 an explosion generated an ash plume that rose 3.6 km above the crater (figure 153). No eruptions were reported in the Showa crater; white gas-and-steam emissions rose 100 m above the crater from a vent on the N flank. Nighttime incandescence was observed at the Minamidake crater. On 24 October an eruption was reported from 0346 through 0430, which included an ash plume that rose 3.4 km above the crater. Ejected blocks traveled 1.2 km from the Minamidake crater. Following this eruption, small amounts of ashfall were observed from Arimura (4.5 km SE) and a varying amount in Kurokami (4 km E) (figure 154). The number of recorded volcanic earthquakes during the month was 190, of which 14 were located beneath the SW flank. Approximately 61 g/m2 of ashfall was reported over eight days of the month. According to a field survey, the daily amount of sulfur dioxide emitted was 2,200-4,200 t/d.
Geologic Background. The Aira caldera in the northern half of Kagoshima Bay contains the post-caldera Sakurajima volcano, one of Japan's most active. Eruption of the voluminous Ito pyroclastic flow accompanied formation of the 17 x 23 km caldera about 22,000 years ago. The smaller Wakamiko caldera was formed during the early Holocene in the NE corner of the caldera, along with several post-caldera cones. The construction of Sakurajima began about 13,000 years ago on the southern rim and built an island that was joined to the Osumi Peninsula during the major explosive and effusive eruption of 1914. Activity at the Kitadake summit cone ended about 4,850 years ago, after which eruptions took place at Minamidake. Frequent eruptions since the 8th century have deposited ash on the city of Kagoshima, located across Kagoshima Bay only 8 km from the summit. The largest recorded eruption took place during 1471-76.
Information Contacts: Japan Meteorological Agency (JMA), 1-3-4 Otemachi, Chiyoda-ku, Tokyo 100-8122, Japan (URL: http://www.jma.go.jp/jma/indexe.html); MIROVA (Middle InfraRed Observation of Volcanic Activity), a collaborative project between the Universities of Turin and Florence (Italy) supported by the Centre for Volcanic Risk of the Italian Civil Protection Department (URL: http://www.mirovaweb.it/); Copernicus Browser, Copernicus Data Space Ecosystem, European Space Agency (URL: https://dataspace.copernicus.eu/browser/).
Nishinoshima (Japan) — November 2023 Cite this Report
Nishinoshima
Japan
27.247°N, 140.874°E; summit elev. 100 m
All times are local (unless otherwise noted)
Gray emissions during October 2023
Nishinoshima is a small island in the Ogasawara Arc, about 1,000 km S of Tokyo, Japan. It contains prominent submarine peaks to the S, W, and NE. Recorded eruptions date back to 1973, with the current eruption period beginning in October 2022. Eruption plumes and fumarolic activity characterize recent activity (BGVN 48:10). This report covers the end of the eruption for September through October 2023, based on information from monthly reports of the Japan Meteorological Agency (JMA) monthly reports, and satellite data.
No eruptive activity was reported during September 2023, although JMA noted that the surface temperature was slightly elevated compared to the surrounding area since early March 2023. The Japan Coast Guard (JCG) conducted an overflight on 20 September and reported white gas-and-steam plumes rising 3 km above the central crater of the pyroclastic cone, as well as multiple white gas-and-steam emissions emanating from the N, E, and S flanks of the crater to the coastline. In addition, dark reddish brown-to-green discolored water was distributed around almost the entire circumference of the island.
Similar low-level activity was reported during October. Multiple white gas-and-steam emissions rose from the N, E, and S flanks of the central crater of the pyroclastic cone and along the coastline; these emissions were more intense compared to the previous overflight observations. Dark reddish brown-to-green discolored water remained visible around the circumference of the island. On 4 October aerial observations by JCG showed a small eruption consisting of continuous gas-and-steam emissions emanating from the central crater, with gray emissions rising to 1.5 km altitude (figure 129). According to observations from the marine weather observation vessel Keifu Maru on 26 October, white gas-and-steam emissions persisted from the center of the pyroclastic cone, as well as from the NW, SW, and SE coasts of the island for about five minutes. Slightly discolored water was visible up to about 1 km.
Frequent low-to-moderate power thermal anomalies were recorded in the MIROVA graph (Middle InfraRed Observation of Volcanic Activity) during September (figure 130). Occasional anomalies were detected during October, and fewer during November through December. A thermal anomaly was visible in the crater using infrared satellite imagery on 6, 8, 11, 16, 18, 21, and 23 September and 8, 13, 21, 26, and 28 October (figure 131).
Geologic Background. The small island of Nishinoshima was enlarged when several new islands coalesced during an eruption in 1973-74. Multiple eruptions that began in 2013 completely covered the previous exposed surface and continued to enlarge the island. The island is the summit of a massive submarine volcano that has prominent peaks to the S, W, and NE. The summit of the southern cone rises to within 214 m of the ocean surface 9 km SSE.
Information Contacts: Japan Meteorological Agency (JMA), 1-3-4 Otemachi, Chiyoda-ku, Tokyo 100-8122, Japan (URL: http://www.jma.go.jp/jma/indexe.html); MIROVA (Middle InfraRed Observation of Volcanic Activity), a collaborative project between the Universities of Turin and Florence (Italy) supported by the Centre for Volcanic Risk of the Italian Civil Protection Department (URL: http://www.mirovaweb.it/); Copernicus Browser, Copernicus Data Space Ecosystem, European Space Agency (URL: https://dataspace.copernicus.eu/browser/).
Kilauea (United States) — October 2023 Cite this Report
Kilauea
United States
19.421°N, 155.287°W; summit elev. 1222 m
All times are local (unless otherwise noted)
Strong lava fountains, lava flows, and spatter at Halema’uma’u during January-September 2023
Kīlauea is on the island of Hawai’i and overlaps the E flank of the Mauna Loa volcano. Its East Rift Zone (ERZ) has been intermittently active for at least 2,000 years. An extended eruption period began in January 1983 and was characterized by open lava lakes and lava flows from the summit caldera and the East Rift Zone. During May 2018 magma migrated into the Lower East Rift Zone (LERZ) and opened 24 fissures along a 6-km-long NE-trending fracture zone that produced lava flows traveling in multiple directions. As lava emerged from the fissures, the lava lake at Halema'uma'u drained and explosions sent ash plumes to several kilometers altitude (BGVN 43:10).
The current eruption period started during September 2021 and has been characterized by low-level lava effusions in the active Halema’uma’u lava lake (BGVN 48:01). This report covers three notable eruption periods during February, June, and September 2023 consisting of lava fountaining, lava flows, and spatter during January through September 2023 using information from daily reports, volcanic activity notices, and abundant photo, map, and video data from the US Geological Survey's (USGS) Hawaiian Volcano Observatory (HVO).
Activity during January 2023. Small earthquake swarms were recorded on 2 January 2023; increased seismicity and changes in the pattern of deformation were noted on the morning of 5 January. At around 1500 both the rate of deformation and seismicity drastically increased, which suggested magma movement toward the surface. HVO raised the Volcano Alert Level (VAL) to Watch (the second highest level on a four-level scale) and the Aviation Color Code (ACC) to Orange (the second highest color on a four-color scale) at 1520.
Multiple lava fountains and lava effusions from vents in the central eastern portion of the Halema’uma’u crater began on 5 January around 0434; activity was confined to the eastern half of the crater and within the basin of the western half of the crater, which was the focus of the eruption in 2021-2022 (figure 525). Incandescence was visible in webcam images at 1634 on 5 January, prompting HVO to raise the VAL to Warning (the highest level on a four-level scale) and the ACC to Red (the highest color on a four-color scale). Lava fountains initially rose as high as 50 m above the vent at the onset of the eruption (figure 526) but then declined to a more consistent 5-6 m height in the proceeding days. By 1930 that same day, lava had covered most of the crater floor (an area of about 1,200,000 m2) and the lava lake had a depth of 10 m. A higher-elevation island that formed during the initial phase of the December 2020 eruption remained exposed, appearing darker in images, along with a ring of older lava around the lava lake that was active prior to December 2022. Overnight during 5-6 January the lava fountains continued to rise 5 m high, and the lava effusion rate had slowed.
On 6 January at 0815 HVO lowered the VAL to Watch and the ACC to Orange due to the declining effusion rates. Sulfur dioxide emission rates ranged from 3,000-12,500 tonnes per day (t/d), the highest value of which was recorded on 6 January. Lava continued to erupt from the vents during 6-8 January, although the footprint of the active area had shrunk; a similar progression has been commonly observed during the early stages of recent eruptions at Halema’uma’u. On 9 January HVO reported one dominant lava fountain rising 6-7 m high in the E half of the crater. Lava flows built up the margins of the lake, causing the lake to be perched. On 10 January the eastern lava lake had an area of approximately 120,000 m2 that increased to 250,000 m2 by 17 January. During 13-31 January several small overflows occurred along the margins of the E lake. A smaller area of lava was active within the basin in the W half of the crater that had been the focus of activity during 2021-2022. On 19 January just after 0200 a small ooze-out was observed on the crater’s W edge.
Activity during February 2023. Activity continued in the E part of Halema’uma’u crater, as well as in a smaller basin in the W part of the 2021-2022 lava lake (figure 527). The E lava lake contained a single lava fountain and frequent overflows. HVO reported that during the morning of 1 February the large E lava lake began to cool and crust over in the center of the lake; two smaller areas of lava were observed on the N and S sides by the afternoon. The dominant lava fountain located in the S part of the lava lake paused for roughly 45 minutes at 2315 and resumed by midnight, rising 1-2 m. At 0100 on 2 February lava from the S part was effusing across the entire E lava lake area, covering the crusted over portion in the center of the lake and continuing across the majority of the previously measured 250,000 m2 by 0400. A small lava pond near the E lake produced an overflow around 0716 on 2 February. On 3 February some lava crust began to form against the N and E levees, which defined the 250,000 m2 eastern lava lake. The small S lava fountain remained active, rising 1-6 m high during 3-9 February; around 0400 on 5 February occasional bursts doubled the height of the lava fountain.
A large breakout occurred overnight during 2100 on 4 February to 0900 on 5 February on the N part of the crater floor, equal to or slightly larger in size than the E lava lake. A second, smaller lava fountain appeared in the same area of the E lava lake between 0300 and 0700 on 5 February and was temporarily active. This large breakout continued until 7 February. A small, brief breakout was reported in the S of the E lava lake around midnight on 7 February. In the W lake, as well as the smaller lava pond in the central portion of the crater floor, contained several overflows during 7-10 February and intermittent fountaining. Activity at the S small lava pond and the small S lava fountain within the E lake declined during 9-10 February. The lava pond in the central portion of the crater floor had nearly continuous, expansive flows during 10-13 February; channels from the small central lava pond seemed to flow into the larger E lake. During 13-18 February a small lava fountain was observed in the small lava pond in the central portion of the crater floor. Continuous overflows persisted during this time.
Activity in the eastern and central lakes began to decline in the late afternoon of 17 February. By 18 February HVO reported that the lava effusions had significantly declined, and that the eastern and central lakes were no longer erupting. The W lake in the basin remained active but at a greatly reduced level that continued to decline. HVO reported that this decrease in activity is attributed to notable deflationary tilt that began early on the morning of 17 February and lasted until early 19 February. By 19 February the W lake was mostly crusted over although some weak lava flows remained, which continued through 28 February. The sulfur dioxide emission rates ranged 250-2,800 t/d, the highest value of which was recorded on 6 February.
Activity during March 2023. The summit eruption at Halema’uma’u crater continued at greatly reduced levels compared to the previous two months. The E and central vents stopped effusing lava, and the W lava lake remained active with weak lava flows; the lake was mostly crusted over, although slowly circulating lava intermittently overturned the crust. By 6 March the lava lake in the W basin had stopped because the entire surface was crusted over. The only apparent surface eruptive activity during 5-6 March was minor ooze-outs of lava onto the crater floor, which had stopped by 7 March. Several hornitos on the crater floor still glowed through 12 March according to overnight webcam images, but they did not erupt any lava. A small ooze-out of lava was observed just after 1830 in the W lava lake on 8 March, which diminished overnight. The sulfur dioxide emission rate ranged from 155-321 t/d on 21 March. The VAL was lowered to Advisory, and the ACC was lowered to Yellow (the second lowest on a four-color scale) on 23 March due to a pause in the eruption since 7 March.
Activity during April-May 2023. The eruption at Halema’uma’u crater was paused; no lava effusions were visible on the crater floor. Sulfur dioxide emission rates ranged from 75-185 t/d, the highest of which was measured on 22 April. During May and June summit seismicity was elevated compared to seismicity that preceded the activity during January.
Activity during June 2023. Earthquake activity and changes in the patterns of ground deformation beneath the summit began during the evening of 6 June. The data indicated magma movement toward the surface, prompting HVO to raise the VAL to Watch and the ACC to Orange. At about 0444 on 7 June incandescence in Halema’uma’u crater was visible in webcam images, indicating that a new eruption had begun. HVO raised the VAL to Warning and the ACC to Red (the highest color on a four-color scale). Lava flowed from fissures that had opened on the crater floor. Multiple minor lava fountains were active in the central E portion of the Halema’uma’u crater, and one vent opened on the W wall of the caldera (figure 528). The eruptive vent on the SW wall of the crater continued to effuse into the lava lake in the far SW part of the crater (figure 529). The largest lava fountain consistently rose 15 m high; during the early phase of the eruption, fountain bursts rose as high as 60 m. Lava flows inundated much of the crater floor and added about 6 m depth of new lava within a few hours, covering approximately 10,000 m2. By 0800 on 7 June lava filled the crater floor to a depth of about 10 m. During 0800-0900 the sulfur dioxide emission rate was about 65,000 t/d. Residents of Pahala (30 km downwind of the summit) reported minor deposits of fine, gritty ash and Pele’s hair. A small spatter cone had formed at the vent on the SW wall by midday, and lava from the cone was flowing into the active lava lake. Fountain heights had decreased from the onset of the eruption and were 4-9 m high by 1600, with occasional higher bursts. Inflation switched to deflation and summit earthquake activity greatly diminished shortly after the eruption onset.
At 0837 on 8 June HVO lowered the VAL to Watch and the ACC to Orange because the initial high effusion rates had declined, and no infrastructure was threatened. The surface of the lava lake had dropped by about 2 m, likely due to gas loss by the morning of 8 June. The drop left a wall of cooled lava around the margins of the crater floor. Lava fountain heights decreased during 8-9 June but continued to rise to 10 m high. Active lava and vents covered much of the W half of Halema’uma’u crater in a broad, horseshoe-shape around a central, uplifted area (figure 530). The preliminary average effusion rate for the first 24 hours of the eruption was about 150 cubic meters per second, though the estimate did not account for vesiculated lava and variations in crater floor topography. The effusion rate during the very earliest phases of the eruption appeared significantly higher than the previous three summit eruptions based on the rapid coverage of the entire crater floor. An active lava lake, also referred to as the “western lava lake” was centered within the uplifted area and was fed by a vent in the NE corner. Two small active lava lakes were located just SE from the W lava lake and in the E portion of the crater floor.
During 8-9 June the lava in the central lava lake had a thickness of approximately 1.5 m, based on measurements from a laser rangefinder. During 9-12 June the height of the lava fountains decreased to 9 m high. HVO reported that the previously active lava lake in the E part of the crater appeared stagnant during 10-11 June. The surface of the W lake rose approximately 1 m overnight during 11-12 June, likely due to the construction of a levee around it. Only a few small fountains were active during 12-13 June; the extent of the active lava had retreated so that all activity was concentrated in the SW and central parts of Halema’uma’u crater. Intermittent spattering from the vent on the SW wall was visible in overnight webcam images during 13-18 June. On the morning of 14 June a weak lava effusion originated from near the western eruptive vent, but by 15 June there were no signs of continued activity. HVO reported that other eruptive vents in the SW lava lake had stopped during this time, following several days of waning activity; lava filled the lake by about 0.5 m. Lava circulation continued in the central lake and no active lava was reported in the northern or eastern parts of the crater. Around 0800 on 15 June the top of the SW wall spatter cone collapsed, which was followed by renewed and constant spattering from the top vent and a change in activity from the base vent; several new lava flows effused from the top of the cone, as well as from the pre-existing tube-fed flow from its base. Accumulation of lava on the floor resulted in a drop of the central basin relative to the crater floor, allowing several overflows from the SW lava lake to cascade into the basin during the night of 15 June into the morning of 16 June.
Renewed lava fountaining was reported at the eruptive vent on the SW side of the crater during 16-19 June, which effused lava into the far SW part of the crater. This activity was described as vigorous during midday on 16 June; a group of observatory geologists estimated that the lava was consistently ejected at least 10 m high, with some spatter ejected even higher and farther. Deposits from the fountain further heightened and widened the spatter cone built around the original eruptive vent in the lower section of the crater wall. Multiple lava flows from the base of the cone were fed into the SW lava lake and onto the southwestern-most block from the 2018 collapse within Halema’uma’u on 17 June (figure 531); by 18 June they focused into a single flow feeding into the SW lava lake. On the morning of 19 June a second lava flow from the base of the eruptive cone advanced into the SW lava lake.
Around 1600 on 19 June there was a rapid decline in lava fountaining and effusion at the eruptive vent on the SW side of the crater; vent activity had been vigorous up to that point (figure 532). Circulation in the lava lake also slowed, and the lava lake surface dropped by several meters. Overnight webcam images showed some previously eruptive lava still flowing onto the crater floor, which continued until those flows began to cool. By 21 June no lava was erupting in Halema’uma’u crater. Overnight webcam images during 29-30 June showed some incandescence from previously erupted lava flows as they continued to cool. Seismicity in the crater declined to low levels. Sulfur dioxide emission rates ranged 160-21,000 t/d throughout the month, the highest measurement of which was recorded on 8 June. On 30 June the VAL was lowered to Advisory (the second level on a four-level scale) and the ACC was lowered to Yellow. Gradual inflation was detected at summit tiltmeters during 19-30 June.
Activity during July-August 2023. During July, the eruption paused; no lava was erupting in Halema’uma’u crater. Nighttime webcam images showed some incandescence from previously erupted lava as it continued to cool on the crater floor. During the week of 14 August HVO reported that the rate in seismicity increased, with 467 earthquakes of Mw 3.2 and smaller occurring. Sulfur dioxide emission rates remained low, ranging from 75-86 t/d, the highest of which was recorded on 10 and 15 August. On 15 August beginning at 0730 and lasting for several hours, a swarm of approximately 50 earthquakes were detected at a depth of 2-3 km below the surface and about 2 km long directly S of Halema’uma’u crater. HVO reported that this was likely due to magma movement in the S caldera region. During 0130-0500 and 1700-2100 on 21 August two small earthquake swarms of approximately 20 and 25 earthquakes, respectively, occurred at the same location and at similar depths. Another swarm of 50 earthquakes were recorded during 0430-0830 on 23 August. Elevated seismicity continued in the S area through the end of the month.
Activity during September 2023. Elevated seismicity persisted in the S summit with occasional small, brief seismic swarms. Sulfur dioxide measurements were relatively low and were 70 t/d on 8 September. About 150 earthquakes occurred during 9-10 September, and tiltmeter and Global Positioning System (GPS) data showed inflation in the S portion of the crater.
At 0252 on 10 September HVO raised the VAL to Watch and the ACC to Orange due to increased earthquake activity and changes in ground deformation that indicated magma moving toward the surface. At 1515 the summit eruption resumed in the E part of the caldera based on field reports and webcam images. Fissures opened on the crater floor and produced multiple minor lava fountains and flows (figure 533). The VAL and ACC were raised to Warning and Red, respectively. Gas-and-steam plumes rose from the fissures and drifted downwind. A line of eruptive vents stretched approximately 1.4 km from the E part of the crater into the E wall of the down dropped block by 1900. The lava fountains at the onset of the eruption had an estimated 50 m height, which later rose 20-25 m high. Lava erupted from fissures on the down dropped block and expanded W toward Halema’uma’u crater. Data from a laser rangefinder recorded about 2.5 m thick of new lava added to the W part of the crater. Sulfur dioxide emissions were elevated in the eruptive area during 1600-1500 on 10 September, measuring at least 100,000 t/d.
At 0810 on 11 September HVO lowered the VAL and ACC back to Watch and Orange due to the style of eruption and the fissure location had stabilized. The initial extremely high effusion rates had declined (but remained at high levels) and no infrastructure was threatened. An eruption plume, mainly comprised of sulfur dioxide and particulates, rose as high as 3 km altitude. Several lava fountains were active on the W side of the down dropped block during 11-15 September, while the easternmost vents on the down dropped block and the westernmost vents in the crater became inactive on 11 September (figure 534). The remaining vents spanned approximately 750 m and trended roughly E-W. The fed channelized lava effusions flowed N and W into Halema’uma’u. The E rim of the crater was buried by new lava flows; pahoehoe lava flows covered most of the crater floor except areas of higher elevation in the SW part of the crater. The W part of the crater filled about 5 m since the start of the eruption, according to data from a laser rangefinder during 11-12 September. Lava fountaining continued, rising as high as 15 m by the morning of 12 September. During the morning of 13 September active lava flows were moving on the N and E parts of the crater. The area N of the eruptive vents that had active lava on its surface became perched and was about 3 m higher than the surrounding ground surface. By the morning of 14 September active lava was flowing on the W part of the down dropped block and the NE parts of the crater. The distances of the active flows progressively decreased. Spatter had accumulated on the S (downwind) side of the vents, forming ramparts about 20 m high.
Vigorous spattering was restricted to the westernmost large spatter cone with fountains rising 10-15 m high. Minor spattering occurred within the cone to the E of the main cone, but HVO noted that the fountains remained mostly below the rim of the cone. Lava continued to effuse from these cones and likely from several others as well, traveled N and W, confined to the W part of the down-dropped block and the NE parts of Halema’uma’u. Numerous ooze-outs of lava were visible over other parts of the crater floor at night. Laser range-finder measurements taken of the W part of the crater during 14-15 September showed that lava filled the crater by 10 m since the start of the eruption. Sulfur dioxide emissions remained elevated after the onset of the eruption, ranging 20,000-190,000 t/d during the eruption activity, the highest of which occurred on 10 September.
Field crews observed the eruptive activity on 15 September; they reported a notable decrease or stop in activity at several vents. Webcam images showed little to no fountaining since 0700 on 16 September, though intermittent spattering continued from the westernmost large cone throughout the night of 15-16 September. Thermal images showed that lava continued to flow onto the crater floor. On 16 September HVO reported that the eruption stopped around 1200 and that there was no observable activity anywhere overnight or on the morning of 17 September. HVO field crews reported that active lava was no longer flowing onto Halema’uma’u crater floor and was restricted to a ponded area N of the vents on the down dropped block. They reported that spattering stopped around 1115 on 16 September. Nighttime webcam images showed some incandescence on the crater floor as lava continued to cool. Field observations supported by geophysical data showed that eruptive tremor in the summit region decreased over 15-16 September and returned to pre-eruption levels by 1700 on 16 September. Sulfur dioxide emissions were measured at a rate of 800 t/d on 16 September while the eruption was waning, and 200 t/d on 17 September, which were markedly lower compared to measurements taken the previous week of 20,000-190,000 t/d.
Geologic Background. Kilauea overlaps the E flank of the massive Mauna Loa shield volcano in the island of Hawaii. Eruptions are prominent in Polynesian legends; written documentation since 1820 records frequent summit and flank lava flow eruptions interspersed with periods of long-term lava lake activity at Halemaumau crater in the summit caldera until 1924. The 3 x 5 km caldera was formed in several stages about 1,500 years ago and during the 18th century; eruptions have also originated from the lengthy East and Southwest rift zones, which extend to the ocean in both directions. About 90% of the surface of the basaltic shield volcano is formed of lava flows less than about 1,100 years old; 70% of the surface is younger than 600 years. The long-term eruption from the East rift zone between 1983 and 2018 produced lava flows covering more than 100 km2, destroyed hundreds of houses, and added new coastline.
Information Contacts: Hawaiian Volcano Observatory (HVO), U.S. Geological Survey, PO Box 51, Hawai'i National Park, HI 96718, USA (URL: http://hvo.wr.usgs.gov/).
Tinakula (Solomon Islands) — December 2023 Cite this Report
Tinakula
Solomon Islands
10.386°S, 165.804°E; summit elev. 796 m
All times are local (unless otherwise noted)
Continued lava flows and thermal activity during June through November 2023
Tinakula is a remote 3.5 km-wide island in the Solomon Islands, located 640 km ESE of the capital, Honiara. The current eruption period began in December 2018 and has more recently been characterized by intermittent lava flows and thermal activity (BGVN 48:06). This report covers similar activity during June through November 2023 using satellite data.
During clear weather days (20 July, 23 September, 23 October, and 12 November), infrared satellite imagery showed lava flows that mainly affected the W side of the island and were sometimes accompanied by gas-and-steam emissions (figure 54). The flow appeared more intense during July and September compared to October and November. According to the MODVOLC thermal alerts, there were a total of eight anomalies detected on 19 and 21 July, 28 and 30 October, and 16 November. Infrared MODIS satellite data processed by MIROVA (Middle InfraRed Observation of Volcanic Activity) detected a small cluster of thermal activity occurring during late July, followed by two anomalies during August, two during September, five during October, and five during November (figure 55).
Geologic Background. The small 3.5-km-wide island of Tinakula is the exposed summit of a massive stratovolcano at the NW end of the Santa Cruz islands. It has a breached summit crater that extends from the summit to below sea level. Landslides enlarged this scarp in 1965, creating an embayment on the NW coast. The Mendana cone is located on the SE side. The dominantly andesitic volcano has frequently been observed in eruption since the era of Spanish exploration began in 1595. In about 1840, an explosive eruption apparently produced pyroclastic flows that swept all sides of the island, killing its inhabitants. Recorded eruptions have frequently originated from a cone constructed within the large breached crater. These have left the upper flanks and the steep apron of lava flows and volcaniclastic debris within the breach unvegetated.
Information Contacts: MIROVA (Middle InfraRed Observation of Volcanic Activity), a collaborative project between the Universities of Turin and Florence (Italy) supported by the Centre for Volcanic Risk of the Italian Civil Protection Department (URL: http://www.mirovaweb.it/); Hawai'i Institute of Geophysics and Planetology (HIGP) - MODVOLC Thermal Alerts System, School of Ocean and Earth Science and Technology (SOEST), Univ. of Hawai'i, 2525 Correa Road, Honolulu, HI 96822, USA (URL: http://modis.higp.hawaii.edu/); Copernicus Browser, Copernicus Data Space Ecosystem, European Space Agency (URL: https://dataspace.copernicus.eu/browser/).
Search Bulletin Archive by Publication Date
Select a month and year from the drop-downs and click "Show Issue" to have that issue displayed in this tab.
The default month and year is the latest issue available.
Bulletin of the Global Volcanism Network - Volume 22, Number 08 (August 1997)
Etna (Italy)
Strombolian activity and lava overflows; all four summit craters active
False Reports (Unknown)
Vietnam: News report of alleged volcanic subsidence near "Ham Rong"
False Reports (Unknown)
Philippines: False report of volcanism intended to exclude would-be gold miners
Ijen (Indonesia)
Elevated seismicity during 27 June-11 July; lake-color shifts and odors
Langila (Papua New Guinea)
Gentle low-ash emissions from Crater 2
Manam (Papua New Guinea)
Low-level eruptive activity at Main and Southern craters
Rabaul (Papua New Guinea)
Explosion and lava fountaining on 17 August
Ruapehu (New Zealand)
Elevated seismicity in late July
Semeru (Indonesia)
Frequent explosions and ash plumes; two climbers killed
Soufriere Hills (United Kingdom)
Vigorous dome growth continues in August
Special Announcements (Unknown)
Seismic network installed for the first time in the Galapagos Islands
Villarrica (Chile)
Explosions during March-June; crater glow in August
Yasur (Vanuatu)
Mid-August visit discloses ongoing Strombolian eruptions from six vents
Etna
Italy
37.748°N, 14.999°E; summit elev. 3357 m
All times are local (unless otherwise noted)
Strombolian activity and lava overflows; all four summit craters active
The following report, jointly submitted by scientists from the Università di Catania and the Istituto Internazionale di Vulcanologia, expands on information from the first half of July (BGVN 22:07) and adds observations of activity at each crater through the end of the month. A review of the eruption since July 1995 places the current activity into context. Between 19 and 31 July, moderate eruptive activity continued from the summit craters, including occasional small overflows from Southeast Crater (SEC). Magmatic activity began at the Voragine in mid-July, followed by continuous Strombolian activity from a central pit in Northeast Crater (NEC) at the end of July (after about eight months of relative quiet). A visit on 5 August revealed magmatic activity from all four summit craters (figure 68).
Review of activity since July 1995. Magmatic activity resumed in Etna's summit craters in July 1995, more than two years after the end of the voluminous 1991-93 E-flank eruption in Valle del Bove. Initially this activity was limited to Bocca Nuova (BN), the westernmost of Etna's four summit craters, but it soon extended to nearby NEC. During November 1995-August 1996, NEC was the site of spectacular explosive and effusive activity, including ten episodes of high lava fountaining (BGVN 20:11/12, 21:02, 21:03, 21:06, 21:07, and 21:10), while BN continued to emit pyroclastics and small intracrateral lava flows on a moderate scale. In early November 1996, magmatic activity resumed at SEC, which had been inactive since late 1991 (BGVN 21:10). SEC activity was initially very mild, gradually building a small intracrateral cone. In late January 1997 it began to emit minor lava flows that were confined to the ~200-m-wide crater. Activity at SEC and BN continued through late June 1997 without major modifications. Etna's fourth summit crater, Voragine (also known as The Chasm), has been actively degassing from a pit on its floor without the emission of any juvenile material in past years.
Voragine. The central degassing pit was obstructed by talus on 14 June, with only minor wisps of steam escaping from the pit's rims. Apparently, a lava flow erupted into the Voragine from NEC in July- August 1996 had partially collapsed, covering the pit. On the evening of 13 July 1997 dense gas clouds possibly containing some ash were seen rising from the Voragine for about 15 minutes. On 18 July, the Voragine was found in a state similar to previous years, but the day after, fluid lava had risen to the lip of the central pit. A small cone (~5 m high) began to grow over the former pit on 24 July; this cone was the site of mild but continuous Strombolian activity, throwing incandescent bombs to several tens of meters above the vent. Similar activity continued through 28 July, but a visit to the crater on the following day revealed that eruptive activity had stopped and only weak steaming occurred from the new conelet.
Northeast Crater (NEC). The intense activity of 1995-96 and subsequent collapse completely altered the morphology of NEC, which was a single deep pit until early November 1995. The WSW part of the crater was occupied in July by a cluster of partially overlapping craters and small cones, some being minor collapse features (figure 68, number 1). The northern part of NEC contained an outer platform ~30-50 m wide (figure 68, number 3) of agglutinate that filled the crater in June-July 1996. The W edge of the platform was marked by large craggy slabs of lava (figure 68, number 2), which were tilted upwards as the lava fill subsided. A lower inner platform in the central northern part of NEC (figure 68, number 4) was covered by late lava flows erupted from the cone cluster. In the southern central part of the crater there was a collapse pit (figure 68, number 5) ~100 m across that showed vigorous degassing and possibly deep-seated Strombolian activity. During a 20-minute visit to NEC on 14 June loud roaring noises were followed by pit emissions of dense yellowish gas plumes containing some ash at intervals of 1-2 minutes. On 14 July ash emissions occurred from the crater, a day after similar emissions from the Voragine. During the last week of July, there was a gradual resumption of Strombolian activity, which had become continuous by the 31st. Most of this activity was confined to the pit, but occasional larger explosions ejected incandescent bombs high above the summit of NEC.
Bocca Nuova (BN). Since the resumption of magmatic activity in 1995, two principal eruptive centers have been active in this crater, one at the base of its vertical SE wall (figure 68, location A) and another in the NNW sector of BN (figure 68, location B). Throughout July, Center A consisted of two closely spaced vents that built a large half-cone against the crater wall, ~30 m above the crater floor. While one of the vents at times displayed quasi-continuous small Strombolian bursts, the other produced very violent explosions at intervals ranging from 30 seconds to 5 minutes, often ejecting bombs >150 m above the vent. These explosions were accompanied by detonations that could be heard several kilometers away. During some of the largest explosions bombs fell on the SE rim or outside BN to the S in the area of the former summit crater platform.
Center B had a highly variable number of explosive and effusive vents that formed a complex cone surrounded by a lava field covering almost the entire crater floor. Between early June and about 15 July, Strombolian activity occurred from several closely spaced vents with diameters not exceeding 10 m each while lava issued from vents at some distance from the explosive ones. By 16 July there was one large vent ~30 m across at the top of a broad cone. The vent was filled with vigorously boiling and fountaining lava, with some fountains ejecting spatter as high as the crater rim (~100 m above the vent). By late July, a second cone was growing on the E side of the first one; both exhibited lava splashing and fountaining while lava issued from vents at the base of the cones. The floor of BN underwent repeated and rapid resurfacing during this time and the maximum depth of the crater was 114 m (determined with laser rangefinder) at the end of July.
A 5 August visit revealed four erupting vents, two in the northern eruptive area and two on the half-cone growing in the SE corner of the crater. Bursts of bombs and spatter often rose significantly higher than the crater rim, reaching heights of up to 200 m above the SE vents. Large explosions from these vents at times ejected bombs onto the SE rim of BN and over the S flank of the central cone, making this area very dangerous.
Southeast Crater (SEC). This crater is gradually being filled by the growing intracrateral cone and lava flows, and lava has spilled onto its outer slopes. Explosive and effusive activity occurred at variable intensity from vents varying continuously in size, number, and location. The main focus of activity was at the summit of the cone (~20 m above its N base and ~40 m above its S base) in the central northern part of SEC (figure 69), but effusive activity often took place on the flanks of the cone, either from small hornito-shaped cones or from wedge-shaped purely effusive vents. More rarely, lava flows were directly emitted from the explosive summit vents.
Activity increased in early July, and explosions became visible from Catania (~30 km S) at night. During the following days Strombolian activity was discontinuous, occurring in cycles that lasted 10-15 minutes separated by quieter periods of similar duration. Visits to the crater once or twice per week, and helicopter overflights, documented shifts in eruptive vents and development of lava flows (figure 69). By 11 July the level of the intracrateral lava field had risen to within a few meters of the lowest part of the crater rim (on the SE side of SEC; figure 69a); late on 19 July a small lava tongue spilled over the SE crater rim, advancing ~30 m downslope before stopping. On that evening, the intracrateral cone had three explosive vents; the most vigorous one was the lowest and easternmost (figure 69b). Lava issued in surges from that vent, forming a high lava ridge with several steep-sided pinnacles on the SE flank of the cone. A second minor overflow onto the SE flank occurred on 22 July, forming a second lava lobe on top of the first one, but without reaching farther downslope. During the following days, Strombolian activity became continuous.
On 25 July the intracrateral cone had grown by ~10 m since 19 July, and two explosive vents on its summit ejected bombs ~100 m high. Lava effusion from a hollow-shaped vent fed a flow that advanced towards a low point on the NE crater rim (figure 69c). Effusive activity occurred in pulses coinciding with periods of increased explosive activity at the cone's summit. Larger volumes of lava began to spill onto the outer SE flank of SEC on 27 July, forming a black tongue ~150 m long and 50 m wide. On the 29th, lava effusion occurred both on the NE and SE sides of the cone (figure 69d), but the lava field showed little growth because the flows on the SE flank apparently overlapped rather than extended downslope. Continuous explosive activity from a single summit vent ejected bombs ~200 m above the vent, and pyroclastics fell onto the high W rim of SEC, in the area of a small stone shelter ("Fortino" in figure 69d). During the night of 31 July-1 August, another overflow formed a new lava lobe on the N side of the earlier flows, and advanced some 30 m farther downslope.
Activity at SEC on 5 August continued in the same manner as in previous weeks with vigorous explosions at an intracrater cone and lava effusion from its eastern flank. Several small overflows from the SE rim had spilled onto the cone's flank almost every day in early August, and a small overflow had occurred onto the NE flank.
Geologic Background. Mount Etna, towering above Catania on the island of Sicily, has one of the world's longest documented records of volcanism, dating back to 1500 BCE. Historical lava flows of basaltic composition cover much of the surface of this massive volcano, whose edifice is the highest and most voluminous in Italy. The Mongibello stratovolcano, truncated by several small calderas, was constructed during the late Pleistocene and Holocene over an older shield volcano. The most prominent morphological feature of Etna is the Valle del Bove, a 5 x 10 km caldera open to the east. Two styles of eruptive activity typically occur, sometimes simultaneously. Persistent explosive eruptions, sometimes with minor lava emissions, take place from one or more summit craters. Flank vents, typically with higher effusion rates, are less frequently active and originate from fissures that open progressively downward from near the summit (usually accompanied by Strombolian eruptions at the upper end). Cinder cones are commonly constructed over the vents of lower-flank lava flows. Lava flows extend to the foot of the volcano on all sides and have reached the sea over a broad area on the SE flank.
Information Contacts: Boris Behncke, Istituto di Geologia e Geofisica, Palazzo delle Scienze, Università di Catania, Corso Italia 55, 95129 Catania; Mauro Coltelli and Paola del Carlo, Istituto Internazionale di Vulcanologia, Piazza Roma 2, 95123 Catania, Italy (URL: http://www.ingv.it/en/).
False Reports (Unknown) — August 1997 Cite this Report
False Reports
Unknown
Unknown, Unknown; summit elev. m
All times are local (unless otherwise noted)
Vietnam: News report of alleged volcanic subsidence near "Ham Rong"
A 21 February Reuters news report described land subsidence near Ham Rong (Dragon's Mouth) in Gia Lai province in the central highlands of Vietnam. The report stated that several thousand square meters of cropland had subsided up to 3 m beginning between September and November 1996. The ground around the sunken patches, some of which were kilometers apart, was covered with small cracks. The news report stated that movement of underground gases was being investigated as a possible cause of the ground subsidence and that the spot lies near a volcano that has reportedly been extinct for about 1,000 years.
Attempts to corroborate this story with Vietnamese authorities having failed, we tried to ascertain the location of Ham Rong. To do this, we queried the National Imagery and Mapping Agency GEOnet Names Server, a searchable database of 3.3 million non-US geographic-feature names. No feature by the name "Ham Rong" was listed in the Gia Lai province. However, there is a mountain feature by the name "H?drông" near Pleiku-Bantour, a catalogued volcanic area at 14°N, 108°E. Pleiku-Bantour is an area of extensive basaltic lava containing five calderas and two basaltic lava cones (Whitford-Stark, 1987). A second possibility for the location of the volcanic activity is Toroeng Prong, a basaltic volcano at 14.9°N, 108°E (Whitford-Stark, 1987).
Reference. Whitford-Stark, J.L., 1987, A survey of Cenozoic volcanism in mainland Asia: Geological Society of America Special Paper 213, p. 16-19.
Geologic Background. False or otherwise incorrect reports of volcanic activity.
Information Contacts: Reuters News Service; National Imagery and Mapping Agency (NIMA), General Help Desk (L-52), 3200 South Second St., St. Louis, MO 63118-3399 USA.
False Reports (Unknown) — August 1997 Cite this Report
False Reports
Unknown
Unknown, Unknown; summit elev. m
All times are local (unless otherwise noted)
Philippines: False report of volcanism intended to exclude would-be gold miners
In discussing the week ending on 12 September, "Earthweek" (Newman, 1997) incorrectly claimed that a volcano named "Mount Pinukis" had erupted. Widely read in the US, the dramatic Earthweek report described terrified farmers and a black mushroom cloud that resembled a nuclear explosion. The mountain's location was given as "200 km E of Zamboanga City," a spot well into the sea. The purported eruption had received mention in a Manila Bulletin newspaper report nine days earlier, on 4 September. Their comparatively understated report said that a local police director had disclosed that residents had seen a dormant volcano showing signs of activity.
In response to these news reports Emmanuel Ramos of the Philippine Institute of Volcanology and Seismology (PHIVOLCS) sent a reply on 17 September. PHIVOLCS staff had initially heard that there were some 12 alleged families who fled the mountain and sought shelter in the lowlands. A PHIVOLCS investigation team later found that the reported "families" were actually individuals seeking respite from some politically motivated harassment. The story seems to have stemmed from a local gold rush and an influential politician who wanted to use volcanism as a ploy to exclude residents. PHIVOLCS concluded that no volcanic activity had occurred. They also added that this finding disappointed local politicians but was much welcomed by the residents.
PHIVOLCS spelled the mountain's name as "Pinokis" and from their report it seems that it might be an inactive volcano. There is no known Holocene volcano with a similar name (Simkin and Siebert, 1994). No similar names (Pinokis, Pinukis, Pinakis, etc.) were found listed in the National Imagery and Mapping Agency GEOnet Names Server (http://geonames.nga.mil/gns/html/index.html), a searchable database of 3.3 million non-US geographic-feature names.
The Manila Bulletin report suggested that Pinokis resides on the Zamboanga Peninsula. The Peninsula lies on Mindanao Island's extreme W side where it bounds the Moro Gulf, an arm of the Celebes Sea. The mountainous Peninsula trends NNE-SSW and contains peaks with summit elevations near 1,300 m. Zamboanga City sits at the extreme end of the Peninsula and operates both a major seaport and an international airport.
[Later investigation found that Mt. Pinokis is located in the Lison Valley on the Zamboanga Peninsula, about 170 km NE of Zamboanga City and 30 km NW of Pagadian City. It is adjacent to the two peaks of the Susong Dalaga (Maiden's Breast) and near Mt. Sugarloaf. 7.975°N, 123.23°E; summit elev. 1510 m]
References. Newman, S., 1997, Earthweek, a diary of the planet (week ending 12 September): syndicated newspaper column (URL: http://www.earthweek.com/).
Manila Bulletin, 4 Sept. 1997, Dante's Peak (URL: http://www.mb.com.ph/).
Simkin, T., and Siebert, L., 1994, Volcanoes of the world, 2nd edition: Geoscience Press in association with the Smithsonian Institution Global Volcanism Program, Tucson AZ, 368 p.
Geologic Background. False or otherwise incorrect reports of volcanic activity.
Information Contacts: Emmanuel G. Ramos, Deputy Director, Philippine Institute of Volcanology and Seismology, Department of Science and Technology, PHIVOLCS Building, C. P. Garcia Ave., University of the Philippines, Diliman campus, Quezon City, Philippines.
Ijen
Indonesia
8.058°S, 114.242°E; summit elev. 2769 m
All times are local (unless otherwise noted)
Elevated seismicity during 27 June-11 July; lake-color shifts and odors
The Volcanological Survey of Indonesia (VSI) reported that seismic activity had been on the rise since about 27 June and that the color of the water in Kawah Ijen crater lake had changed (BGVN 22:06). A visiting geologist had also noted lake bubbling and upwelling. The following report provides additional information about the activity during late June-July.
Seismicity remained high during 27 June through about 11 July 1997 (figure 2). This increase, however, was not followed by phreatic eruptions as in 1993 (BGVN 18:07 and 19:05). Still, seismic data indicated that the number of deep A-type and especially shallow B-type volcanic earthquakes sharply increased. The maximum amplitude of volcanic tremor also increased rapidly.
The color of the crater lake changed from light green to whitish (pale) green and a very strong sulfuric odor was noted at the side of the crater lake. However, these changes were not followed by corresponding shifts in the lake's water temperature (figure 3). Because of the increasing activity, VSI warned residents, tourists, and sulfur miners that the crater area was closed until early August 1997.
Ijen Caldera encloses a group of small stratovolcanoes. The active crater at Kawah Ijen is ~700 m across and 200 m deep. Kawah Ijen's noteworthy features include a mineral-rich acid lake and fumarolic sulfur in sufficient abundance to support active mining (see photos in Krafft and Krafft, 1979).
Reference. Krafft, K,. and Krafft, M., 1979, Volcanoes: Earth's Awakening (originally published in French under the title "Volcans"): Hachette/Hammond Inc., ISBN 0-8437-3760-3, plates on p. 142, 156, and 157.
Geologic Background. The Ijen volcano complex at the eastern end of Java consists of a group of small stratovolcanoes constructed within the 20-km-wide Ijen (Kendeng) caldera. The north caldera wall forms a prominent arcuate ridge, but elsewhere the rim was buried by post-caldera volcanoes, including Gunung Merapi, which forms the high point of the complex. Immediately west of the Gunung Merapi stratovolcano is the historically active Kawah Ijen crater, which contains a nearly 1-km-wide, turquoise-colored, acid lake. Kawah Ijen is the site of a labor-intensive mining operation in which baskets of sulfur are hand-carried from the crater floor. Many other post-caldera cones and craters are located within the caldera or along its rim. The largest concentration of cones forms an E-W zone across the southern side of the caldera. Coffee plantations cover much of the caldera floor; nearby waterfalls and hot springs are tourist destinations.
Information Contacts: Isya N. Dana, Jr., Volcanological Survey of Indonesia (VSI), Jalan Diponegoro 57, Bandung 40122, Indonesia.
Langila (Papua New Guinea) — August 1997 Cite this Report
Langila
Papua New Guinea
5.525°S, 148.42°E; summit elev. 1330 m
All times are local (unless otherwise noted)
Gentle low-ash emissions from Crater 2
Throughout the month Crater 2 produced occasional gentle emissions of pale gray to brown ash clouds, generally low in ash content. There were single Vulcanian explosions on 3, 4, 14, and 19 August that were accompanied by forceful emissions of dark gray ash clouds that rose to ~3,000 m above the summit. Ash clouds were blown NW, producing light ashfalls at settlements 11 km from the volcano. Crater 3 remained quiet throughout August. There was no seismic recording during the month.
Geologic Background. Langila, one of the most active volcanoes of New Britain, consists of a group of four small overlapping composite basaltic-andesitic cones on the lower E flank of the extinct Talawe volcano in the Cape Gloucester area of NW New Britain. A rectangular, 2.5-km-long crater is breached widely to the SE; Langila was constructed NE of the breached crater of Talawe. An extensive lava field reaches the coast on the N and NE sides of Langila. Frequent mild-to-moderate explosive eruptions, sometimes accompanied by lava flows, have been recorded since the 19th century from three active craters at the summit. The youngest and smallest crater (no. 3 crater) was formed in 1960 and has a diameter of 150 m.
Information Contacts: Ben Talai, RVO.
Manam (Papua New Guinea) — August 1997 Cite this Report
Manam
Papua New Guinea
4.08°S, 145.037°E; summit elev. 1807 m
All times are local (unless otherwise noted)
Low-level eruptive activity at Main and Southern craters
Low-level eruptive activity continued at Main and Southern craters during August. In the first week of the month Main Crater emitted occasional pale gray ash clouds accompanied by low rumbling sounds. On the 13th, occasional gentle emissions of pale gray ash clouds occurred once more. By 18 August emissions became forceful and darker, richer in ash content, and were accompanied by low roaring sounds. Activity started to decrease on 20 August and by the end of the month only gentle ash emissions were observed. A weak steady red glow was observed around the crater mouth on the 28th.
Southern Crater occasionally emitted gentle pale gray ash clouds with low ash contents in August. Low rumbling sounds occurred only on the 4th and 6th. Continuous weak steady red glow around the crater mouth was noted every night. Small sub-continuous projections of glowing lava fragments were observed at nights during 6-9 August. The emissions rose to ~2,000 m altitude then were blown NW, causing light ashfalls on settlements along the coast.
There was no seismic recording until 15 August. On the 19th four small B-type events were recorded. Seismicity suddenly increased on 21 August with 1,320 events recorded. Seismic activity on the following days remained at moderate levels with 1,000-1,360 events/day. The water-tube tiltmeter at the observatory did not show any significant tilt changes during the month.
Geologic Background. The 10-km-wide island of Manam, lying 13 km off the northern coast of mainland Papua New Guinea, is one of the country's most active volcanoes. Four large radial valleys extend from the unvegetated summit of the conical basaltic-andesitic stratovolcano to its lower flanks. These valleys channel lava flows and pyroclastic avalanches that have sometimes reached the coast. Five small satellitic centers are located near the island's shoreline on the northern, southern, and western sides. Two summit craters are present; both are active, although most observed eruptions have originated from the southern crater, concentrating eruptive products during much of the past century into the SE valley. Frequent eruptions, typically of mild-to-moderate scale, have been recorded since 1616. Occasional larger eruptions have produced pyroclastic flows and lava flows that reached flat-lying coastal areas and entered the sea, sometimes impacting populated areas.
Information Contacts: Ben Talai, RVO.
Rabaul (Papua New Guinea) — August 1997 Cite this Report
Rabaul
Papua New Guinea
4.2459°S, 152.1937°E; summit elev. 688 m
All times are local (unless otherwise noted)
Explosion and lava fountaining on 17 August
Activity in August was restricted to Tavurvur crater while Vulcan cone and the rest of the caldera floor remained quiet. During the first two weeks of the month Tavurvur released continuous gentle weak emissions of white and blue vapors, occasionally accompanied by loud to low roaring. Night glow around the crater mouth occurred on some days.
On 17 August at 0327 a loud explosion was immediately followed by forceful emissions of dark ash-laden clouds rising to ~3 km altitude. Glowing lava fragments were observed within the eruption columns. Eruptive activity increased gradually until it peaked at 0500 with a corresponding Real-time Seismic Amplitude Measurement (RSAM) value of 740. During the 15 minutes of peak activity there was loud sub-continuous lava fountaining. Glowing lava fragments projected ~500 m above the crater rim fell on the S and E slopes of Tavurvur; some fell on the E caldera wall. At 0515 eruptive activity dropped sharply and by 0700 (RSAM = 180) roaring and explosion sounds only occurred ~3 times/minute. The intervals between sounds and ash projections became longer and at about 1300 (RSAM = 64) the eruption stopped. No lava flows were produced during the eruption.
Two vents were active during the eruption, one on the E crater rim and the other just W of the rim. The E vent was the more active of the two. The eruption clouds were pale gray (during daytime) at the height of the eruption but were paler (whitish) as the level of eruption decreased. The emissions rose to ~3,000 m altitude during the eruptive period but dropped to ~400 m when the eruption stopped. The emissions were blown NE and N with continuous light to moderate ash falls in the Matalau area and light ashfall on the E part of Rabaul Town. The eruption was mild, short-lived (~10 hours) and smaller than the last eruption on 11 July (BGVN 22:07). It was the smallest of the last seven Strombolian phases of activity (10-11 May and 4-5 October 1996, 9 January, 14 March, 12-13 April, 1 June, and 11-12 July 1997). The last two eruptions (July and August) were more Strombo- Vulcanian in character.
On 16-17 August there were 173 low-frequency earthquakes recorded associated with explosions at Tavurvur. Only four high-frequency earthquakes were recorded during the month; one was located to the NE (offshore) outside the caldera, and another ~1 km S of Matupit Island. From 18 August until the end of the month Tavurvur returned to its normal gentle white emissions with blue vapors accompanied by occasional (sometimes hours apart) loud to low roaring sounds. The emissions rose as high as 400 m and then were blown N. Steady weak red glow at night around the crater mouth occurred throughout the month.
Electronic tilt at Matupit Island started to show a NW-down tilt beginning on 5 August. This continued until the 13th when the E-W component of the tilt plateaued; the N-S component continued its steady N-down trend until the 17 August eruption, when that component also plateaued. This cessation of ground tilt continued until 24 August when both components simultaneously resumed their steady NW-down tilt. It is thought that this cessation of tilt for 6 days indicated small-scale relaxation of tumescent stress in Greet Harbour caused by the eruption; no deflation occurred and the inflationary trend on the 24th was at the same rate and direction as before the 13th.
Dry tilt around the caldera showed no overall pattern in response to the eruption. The closest regularly occupied dry tilt station to Tavurvur (Transmitter, on Matupit Island) showed a slight inflationary trend in relation to the deformation center in the mouth of Greet Harbour before the 17 August eruption, and a 20 µrad NW offset after the eruption. This offset had not been recovered by the end of the month.
The water-tube tiltmeter at Sulphur Creek (~3.5 km NW of Tavurvur) showed a steady NW-down tilt of ~4 µrad (away from Tavurvur) seven days before eruption happened. One day before the eruption, an increase of 6 µrad was recorded, but deflation (SE-down tilt) with a similar magnitude occurred during the eruption. Sulphur Creek resumed its steady NW-down tilt trend after the eruption. A GPS network along the old Rabaul Airstrip (eight stations) and around the N part of the caldera showed few significant horizontal movements during August, although post-eruption surveys seem to indicate a slight NW movement of most stations (up to 4 cm at some stations at the E end of the runway).
COSPEC measurements showed fluctuations in SO2 emissions during the month. A high SO2 emission level of 1,080 tons was recorded on the 12th. Output dropped on the following two days (to ~500 tons) and was on a slow steady increase when the eruption occurred (at ~800 tons). During the eruption SO2 output continued to rise, reaching a peak on the 19th (at 1,050 tons). It decreased on the 20th to low levels before resuming an upward trend, reaching the highest peak of 1,200 tons on 28 August before it dropped once more.
Geologic Background. The low-lying Rabaul caldera on the tip of the Gazelle Peninsula at the NE end of New Britain forms a broad sheltered harbor utilized by what was the island's largest city prior to a major eruption in 1994. The outer flanks of the asymmetrical shield volcano are formed by thick pyroclastic-flow deposits. The 8 x 14 km caldera is widely breached on the east, where its floor is flooded by Blanche Bay and was formed about 1,400 years ago. An earlier caldera-forming eruption about 7,100 years ago is thought to have originated from Tavui caldera, offshore to the north. Three small stratovolcanoes lie outside the N and NE caldera rims. Post-caldera eruptions built basaltic-to-dacitic pyroclastic cones on the caldera floor near the NE and W caldera walls. Several of these, including Vulcan cone, which was formed during a large eruption in 1878, have produced major explosive activity during historical time. A powerful explosive eruption in 1994 occurred simultaneously from Vulcan and Tavurvur volcanoes and forced the temporary abandonment of Rabaul city.
Information Contacts: Ben Talai, Rabaul Volcano Observatory (RVO), P.O. Box 386, Rabaul, Papua New Guinea.
Ruapehu (New Zealand) — August 1997 Cite this Report
Ruapehu
New Zealand
39.28°S, 175.57°E; summit elev. 2797 m
All times are local (unless otherwise noted)
Elevated seismicity in late July
Volcanic tremor recorded during 26-28 July (figure 24) was the first significant seismic activity at Ruapehu since August 1996 (BGVN 21:11). The tremor started gradually at about 0330 on 26 July and increased to a maximum level at 0530. It stayed at that level, more than twice the usual background level, until 1030 on 27 July. A weaker tremor was recorded between 0220 and 0510 on 28 July. Seismicity returned to background levels during the next few days.
Scientists visited the crater on 30 July and found that the temperature of the water in the crater lake was 64°C, essentially the same temperature as was recorded in mid-June. The lake surface was steaming strongly, and the water was churning and bubbling. Steam vents, recently drowned with the rising lake level, were causing the convection within the lake.
Further enhanced tremor was recorded on 31 July. During 5-8 August volcanic tremor levels fluctuated above typical background values (figure 24). None of the tremor recorded through 8 August was as strong as during 26-27 July. Significant volcanic tremor recommenced again shortly after 0700 on 2 October. Tremor amplitude quickly increased to a level equivalent to that on 25 July and lasted through at least noon. This tremor was similar to that recorded in late July-early August this year, but was weaker than the tremor that preceded the 1996 eruptions.
Geologic Background. Ruapehu, one of New Zealand's most active volcanoes, is a complex stratovolcano constructed during at least four cone-building episodes dating back to about 200,000 years ago. The dominantly andesitic 110 km3 volcanic massif is elongated in a NNE-SSW direction and surrounded by another 100 km3 ring plain of volcaniclastic debris, including the NW-flank Murimoto debris-avalanche deposit. A series of subplinian eruptions took place between about 22,600 and 10,000 years ago, but pyroclastic flows have been infrequent. The broad summait area and flank contain at least six vents active during the Holocene. Frequent mild-to-moderate explosive eruptions have been recorded from the Te Wai a-Moe (Crater Lake) vent, and tephra characteristics suggest that the crater lake may have formed as recently as 3,000 years ago. Lahars resulting from phreatic eruptions at the summit crater lake are a hazard to a ski area on the upper flanks and lower river valleys.
Information Contacts: Brad Scott, Wairakei Research Center, Institute of Geological and Nuclear Sciences (IGNS), Private Bag 2000, Wairakei, New Zealand (URL: https://www.gns.cri.nz/).
Semeru (Indonesia) — August 1997 Cite this Report
Semeru
Indonesia
8.108°S, 112.922°E; summit elev. 3657 m
All times are local (unless otherwise noted)
Frequent explosions and ash plumes; two climbers killed
Activity observed during fieldwork in July 1997 consisted of frequent short-lived Vulcanian explosions. Continuous crater observations were made over more than 5 hours on the morning of 22 July from the Gunung Sawur observatory, 11 km SSE of the volcano. During that time 18 "cannon-like" explosions were each followed by rapidly declining ash emission at intervals of 2-40 minutes with a mean of 18 minutes. Explosion durations ranged from about 1 to 3.5 minutes; plume heights remained low, from a few hundred meters up to 1.5 km maximum. The plumes were blown by the wind as soon as they rose above the crater rim, except for the strongest explosions. Ash sometimes fell at the observatory. Blocks were occasionally seen rolling within the S-SW breach of the crater and glowing pyroclastic material was seen at night. The explosions could be heard 9 km from the crater but not from the observatory. Some explosions were accompanied by base surges, but they were limited to the interior of the crater.
During a 6-hour stay in the summit area on 26 July, 19 explosions were seen. They were separated by intervals of 2-38 minutes with a mean of 15 minutes (or 17 minutes if the last two intervals of 2 and 4 minutes are discarded), suggesting that activity remained stable since 22 July. Most explosions sent only ash plumes above the highest point of the crater rampart. The plumes immediately drifted SE with a strong wind. About 1/3 of the explosions threw blocks well above the N crater rim and some fell on the pyroclastic cone. A brief visit to the rim of the active crater showed that a pyroclastic rampart was being built between the S-SW breach and the active vents. In contrast to the pre-1994 through 1995 eruptions, the bottom of the crater could not be seen from the NE crater rim. No evidence for dome or lava flow emplacement within the present funnel-shaped crater could be seen from the NE crater rim.
Aviation warnings. Volcanic ash advisories for Semeru have been issued frequently since March (BGVN 22:06) At least two such advisories were issued during August after aviators for Qantas Airlines reported ash plumes. On 10 August a Qantas flight flying from Sydney to Singapore reported a plume between 7.6 and 9.1 km (25-30,000 feet) altitude that was drifting S near its base and N at its top. Another plume was seen on 30 August to 8.5 km (28,000 feet) altitude. No evidence of volcanic plumes was seen on either day in satellite imagery.
Two climbers die near crater. According to press reports, two German mountain climbers died near the crater on 2 September after being struck by large ejected ballistics. The two men were part of a group of 17 from a Munich-based climbing club. The victims, together with the group leader, had separated from the group to check the crater when the accident occurred. Warning signs not to approach the crater were posted along the path.
Geologic Background. Semeru, the highest volcano on Java, and one of its most active, lies at the southern end of a volcanic massif extending north to the Tengger caldera. The steep-sided volcano, also referred to as Mahameru (Great Mountain), rises above coastal plains to the south. Gunung Semeru was constructed south of the overlapping Ajek-ajek and Jambangan calderas. A line of lake-filled maars was constructed along a N-S trend cutting through the summit, and cinder cones and lava domes occupy the eastern and NE flanks. Summit topography is complicated by the shifting of craters from NW to SE. Frequent 19th and 20th century eruptions were dominated by small-to-moderate explosions from the summit crater, with occasional lava flows and larger explosive eruptions accompanied by pyroclastic flows that have reached the lower flanks of the volcano.
Information Contacts: Jean-Luc Le Pennec, Laboratoire de Petrologie Magmatique, CEREGE - Universite Aix-Marseille III, BP 80, 13545 Aix-en-Provence 04, France; Alain Gourgaud, Centre de Recherches Volcanologiques, 5 rue Kessler, 63038 Clermont Ferrand, France; Isya N. Dana, Igan Sutawidjaja, and Eddy Mulyadi, Volcanological Survey of Indonesia, Jalan Diponegoro 57, Bandung 40112, Indonesia; Bureau of Meteorology, Northern Territory Regional Office, P.O. Box 735, Darwin NT 0801, Australia; Agence France-Presse, Paris, France.
Soufriere Hills (United Kingdom) — August 1997 Cite this Report
Soufriere Hills
United Kingdom
16.72°N, 62.18°W; summit elev. 915 m
All times are local (unless otherwise noted)
Vigorous dome growth continues in August
Most of the following condenses reports from the Montserrat Volcano Observatory (MVO) for August 1997. Vigorous dome growth continued during August and exhibited cyclical patterns of tilt and seismicity, rockfalls, the growing dome's extruding and falling spines, and abundant pyroclastic flows. In addition, NOAA's Satellite Analysis Branch (SAB) reported numerous ash clouds commonly blowing W to NW for tens to hundreds of kilometers. The clouds appeared in GOES satellite images, which are increasingly accessible on the world-wide web. Sketches of a few of these plume images during mid-1997 appear in figure 30. Given the persisting crisis, it is worth noting that the SAB also broadcasts forecasts of the plume's predicted trajectory after energetic eruptions for the benefit of aviators.
Tilt and seismicity. The period 31 July to 20 August was characterized by elevated levels of seismic activity. During 1-6 August tiltmeter readings revealed a cyclic pattern with a 10- to 14-hour periodicity. During this time, regular deflation and inflation of the volcano corresponded with earthquake swarms and continuous pyroclastic flows, respectively. Continuous and near-continuous tremor of varying frequency was noted during several swarms in this period. This pattern is similar to those reported in BGVN 22:06. In addition, on 2 August several very large hybrid events occurred during a hybrid earthquake swarm; at 0900 the hybrid earthquakes peaked at ~3 events/minute with continuous moderate tremor between events.
The 10- to 14-hour cycle continued until 9 August when the pattern was broken with an explosion at 2051. An eruption comprised of several intense bursts caused heavy ash and pumice fall in Old Towne (Plymouth). A new pattern then emerged during 10 to 16 August in which cyclic activity was dominated by hybrid earthquakes and dome growth. Hybrid earthquakes appeared in swarms that were thought to be associated with extrusion of new dome material; the high level of seismic activity suggested a rapid extrusion rate. By 17 August this pattern had become less regular with longer intervals and higher intensity tremors at the end of swarms. After a 17 August swarm, tremor lasting 90 minutes was followed by 6 minutes of well-defined monochromatic seismicity. During 18- 20 August the cycle of alternating hybrid swarms and dome growth developed an 8-hour period.
Seismicity diminished during 21 to 29 August, an interval when rockfall and pyroclastic flow signals were dominant. The chief cyclical pattern noted during this interval took place during 23-26 August: enhanced seismicity at intervals of 12-15 hours. The cycle's peak coincided with modest ash emissions and rockfalls. On 30 and 31 August, activity was reported to be increasing and a 10-hour cycle had become evident.
Pyroclastic flows and ash plumes. During 1-4 August several new pyroclastic flows were reported on the NW flank in the Gages Valley. At 1800 on 3 August a major N-flank flow reached Gages Village and Port Plymouth, causing fires and damage to buildings. The flow was associated with strongly convecting ash plumes that rose up to ~4.6 km altitude and heavy W-flank ashfalls.
On the afternoon of 4 August a dark gray jet was seen projecting from the N flank at 60 degrees to the horizontal, and extending to a height of 600 m. This was followed by pyroclastic flows into the Gages, Mosquito, and Tar River valleys. A vertical ash cloud rose to over ~7.6 km and fragments of rock and pumice up to 11.5 cm diameter fell at the observatory.
On 5 August two periods of intense activity were followed by violent explosions and energetic pyroclastic flows. MVO field teams saw pyroclastic flows enter the sea at the mouth of the Tar River; they covered ~80% of the delta. Researchers investigated submerged portions of the Tar River fan on 25 August. Many of the 5 August pyroclastic flows were subsequently described as rich in pumice, and in addition to the Tar, they also followed the Tuitts, Mosquito, and Gages valleys. Falling pumice reached 8 cm in length; meter-sized impact craters formed up to 1.5 km S of the dome. After the pyroclastic flows there followed a succession of explosive pulses emitting ash at 20- to 30-second intervals; these pulses coincided with elevated 1-Hz harmonic tremor lasting up to 40 minutes.
From 6 to 9 August there were several explosions followed by ash clouds to altitudes of ~5-7 km. Pumice fall and pyroclastic flows were also reported after the explosions. On 7 August field teams saw an ash plume ascend to 1 km at a maximum rate of 47 m/s. From 11 to 31 August, numerous smaller explosions and flows were reported. Throughout the month ash plumes rose up to ~2.4 km, enhanced steaming was coincident with elevated seismicity, and there were small diffuse pyroclastic flows.
Crater observations and measurement. Although high activity occurred during the first week of August, it was not until 7 August that the summit was visible for the first time since July. On 7 August the dome's top contained a bowl-shaped crater oriented with its lower edge facing Gages Mountain. Also, the Gages Valley had become deeply incised. A deep, oval-shaped scar formed from the several small explosions during 6-9 August; on 10 August observers saw new dome material refilling the scar.
On 11 August, the MVO reported theodolite measurements of the new crater taken during clear conditions around 9 August. The crater's volume was 5-7 million cubic meters; the highest point on the dome was measured at 995 m elevation. EDM measurements were also taken on the line from Lee's Yard to Waterworks on several occasions in August; these revealed slow shortening.
A GPS survey conducted on 12 August indicated that a deformation event has occurred in the last 3 months, shifting sites at Whites and Long Ground by about 3 cm N and NE. The results of the survey also suggested that by the end of the interval this movement had slowed or ceased.
On 12 August, a very large spine was observed in the crater, but by the next day it had broken into thirds. A view on 14 August revealed a new cluster of spines above a steep chute at the head of Gages Valley. By 19 August, an area 150 m in diameter perched above Gages wall. It was composed of a series of tall spines; the top of one measured at 969 m. Six days later, on 25 August, it was noted that the mass of spines above Gages wall was breaking up and pyroclastic flows funneled down the Gages valley.
On 27 August fumaroles, rockfalls, and incandescence were noted on the dome's SE flank, an area that had been lacking in recent activity. A secondary phreatic explosion occurred on 30 August after pyroclastic flows had buried a small pond. By 31 August a deep gully had eroded into the deposits below the dome.
Cronan and others (1997) studied Montserrat's hydrothermal discharges in 1995 at spots a few kilometers N of Plymouth near the coast, both on and offshore. The chemical composition of offshore discharges varied the most; for iron, the extreme example, the offshore compositional variation was 300-fold. Temperature also varied at the offshore springs. The authors made a case for monitoring submarine hydrothermal discharges as a means to help predict future eruptions.
Many news reports in the month of August focused on either the ongoing destruction of Plymouth or the lives of people dislocated by the eruption. Press coverage was further heightened when residents made mid-month protests appealing for more governmental support.
For those readers interested in the history of Soufriere Hills, work by Jaggar (1937a, 1937b) and Perret (1939) dealt with the 1933-37 seismic crisis centered at Gages Soufriere. The crisis included abnormal fumarolic activity, earthquakes centered at Gages, and earthquake counts reaching thousands of events per month. Yet, the crisis did not lead to eruptions. Both reports contained an interesting array of experiments and then-new technologies.
References. Cronan, D.S., Johnson, A.G., and Hodkinson, R.A., 1997, Hydrothermal fluids may offer clues about impending volcanic eruptions: Eos, Transactions, American Geophysical Union, p. 341 and 345.
Perret, F.A., 1939, The volcano-seismic crisis at Montserrat, 1933-1937: Washington, D.C., Carnegie Institution of Washington, 76 p.
Jaggar, T.A., 1937A, Adventures and methods in studying West Indian volcanoes, in The Volcano Letter, no. 437 (July 1936, p. 6-7), compiled and reprinted in 1987, edited by Fiske, R.S. and others: Washington, D.C. [ISSN 0890-1996], Smithsonian Institution Press.
Jaggar, T.A., 1937b, Work of F.A. Perret on Montserrat, in The Volcano Letter, no. 449 (July 1937, p. 1-7), compiled and reprinted in 1987, edited by Fiske, R.S. and others: Washington, D.C. [ISSN 0890- 1996], Smithsonian Institution Press.
Geologic Background. The complex, dominantly andesitic Soufrière Hills volcano occupies the southern half of the island of Montserrat. The summit area consists primarily of a series of lava domes emplaced along an ESE-trending zone. The volcano is flanked by Pleistocene complexes to the north and south. English's Crater, a 1-km-wide crater breached widely to the east by edifice collapse, was formed about 2000 years ago as a result of the youngest of several collapse events producing submarine debris-avalanche deposits. Block-and-ash flow and surge deposits associated with dome growth predominate in flank deposits, including those from an eruption that likely preceded the 1632 CE settlement of the island, allowing cultivation on recently devegetated land to near the summit. Non-eruptive seismic swarms occurred at 30-year intervals in the 20th century, but no historical eruptions were recorded until 1995. Long-term small-to-moderate ash eruptions beginning in that year were later accompanied by lava-dome growth and pyroclastic flows that forced evacuation of the southern half of the island and ultimately destroyed the capital city of Plymouth, causing major social and economic disruption.
Information Contacts: Montserrat Volcano Observatory (MVO), c/o Chief Minister's Office, PO Box 292, Plymouth, Montserrat (URL: http://www.mvo.ms/); NOAA/NESDIS Satellite Analysis Branch (SAB), Room 401, 5200 Auth Road, Camp Spring, MD 20746, USA.
Special Announcements (Unknown) — August 1997 Cite this Report
Special Announcements
Unknown
Unknown, Unknown; summit elev. m
All times are local (unless otherwise noted)
Seismic network installed for the first time in the Galapagos Islands
During 13 to 29 August 1997 the Geophysical Institute of the Escuela Politecnica Nacional (IG-EPN) in Quito, Ecuador, and the Charles Darwin Foundation installed the first seismographic network ever to be established in the Galápagos Islands, site of the well-documented Gal pagos mantle plume with its active volcanism. The network consists of three telemetered seismic stations located at Pta. Espinosa on the NE end of Fernandina Island (Station FERN; 0°16.0'S, 91°26.7'W, elev. 3 m), on the NE corner of Sierra Negra caldera (Volc n Chico) on Isabela Island (Station VCHI; 0°47.5'S, 91°04.0'W, elev. 1,490 m), and at Bartolome Island, at the E end of Santiago Island (station BART; 0°16.9'S, 90°33.1'W, elev. 100 m). The IRIS project is scheduled to install a wide-band station on Santa Cruz Island in the coming weeks. Once the IRIS device is operative, these four permanent stations will effectively constitute an array in the form of a parallelogram that will cover the western center of the archipelago.
The importance of the new network lies in its ability to monitor the active volcanoes of Fernandina, Volcán Chico, and Sullivan Bay, as well as more distant volcanic centers. In addition the new network will detect tectonic activity generated in this mantle-plume setting or associated with the NNW-SSE and ENE-WSW structural lineaments that apparently control the distribution of volcanoes and that were first recognized by Charles Darwin. The data will also provide better hypocenter locations for seismic events related to subduction of the Nazca and Cocos plates along the South American and Central American coasts.
The instrumentation includes vertical 1-Hz seismometers (Mark Products L-4C) set in massive lavas whose responses have attenuations of 12 to 18 dB. State-of-the-art electronics and radio telemetry as well as solar panels complete the systems. The seismic signals are continuously telemetered to the Charles Darwin Scientific Station located at Academy Bay on Santa Cruz Island. Data acquisition is carried out with the IASPEI software and the events sent via email to IG-EPN for processing.
After only a few days of operation, several low-magnitude A-type earthquakes were detected and tentatively located in the southern part of Isabela Island near Volcán Chico. Several medium-size events, well-located on the South American continent by regional and international seismographic networks, were recorded by the new Gal pagos net. Once the IRIS station is functioning, better identification of locations will be possible. It is hoped that in the future, if funding becomes available, two or three more seismic stations will be installed on other active volcanoes.
This project received financial aid and help from the USAID Mission in Quito, the Charles Darwin Foundation, the Escuela Politecnica Nacional, the Galápagos National Park Service, the Ecuadorian Air Force, the Civil Aviation Authority, Banco del Pacifico, the Ecuadorian Institute Electrification, TAME, ORSTOM, and the Charles Darwin Scientific Station.
Geologic Background. Special announcements or information of general interest not linked to any specific volcano.
Information Contacts: Minard L. Hall, Escuela Politecnica Nacional, Casilla 2759, Quito, Ecuador.
Villarrica (Chile) — August 1997 Cite this Report
Villarrica
Chile
39.42°S, 71.93°W; summit elev. 2847 m
All times are local (unless otherwise noted)
Explosions during March-June; crater glow in August
As reported by volcano guides on 17 February, two vents on the NE side of the crater floor had small Strombolian eruptions and extruded incandescent lava onto the crater floor (BGVN 22:04). On 24 February the guides reported that the crater floor had risen by several meters. Residents of Pucon (~17 km N) noted night glow on 2 March following several months of absence. Weak Strombolian explosions continued throughout the remainder of March.
The following describes visual observations made from April through August 1997 by members of the Villarrica Observation Project/Internet (POI) from Pucon. Table 2 presents observations since mid-October 1996.
Table 2. Summary of activity observed at Villarrica during October 1996 through August 1997. Courtesy of Werner Keller.
| Date |
Description of Activity |
| Mid-Oct to mid-Nov 1996 |
Notable rise of the magma column in the central crater pit. |
| Late Nov 1996 |
Subsidence of the magmatic column. |
| Dec 1996-03 Jan 1997 |
Strong vapor emissions. |
| 04 Jan 1997 |
Inner crater pit completely visible without incandescent lava. |
| 15-19 Jan 1997 |
Strong fumarolic activity. |
| 21 Jan 1997 |
Two small ash emissions from the summit crater. |
| 17-24 Feb 1997 |
Small Strombolian eruptions from two crater vents. Lava fountains actively filling the crater, raising the crater floor by several meters. Convection within the lava pond. |
| 02 Mar 1997 |
Reappearance of night glow above the crater. |
| 12 Mar 1997 |
Light dusting of ash seen on the snow-covered NE flank. |
| 15 Mar-Apr 1997 |
Strombolian explosions from a crater vent. |
| Mid-May 1997 |
Incandescent bombs ejected over the crater. |
| 22-31 May 1997 |
Small ash puffs from the summit crater. |
| June 1997 |
Small Strombolian explosions. |
| 10 Jul 1997 |
Nocturnal red glow disappeared. |
| 17-19 Jul 1997 |
No sign of fumarolic activity. |
| 22 Jul 1997 |
Reappearance of weak fumarolic activity. |
| 31 Jul 1997 |
Weak night glow over the summit after 21 days of absence, indicating infilling of the crater floor with incandescent lava. |
| 19 Aug 1997 |
Glow over the summit without degassing. |
| 25-29 Aug 1997 |
Glow and fumarolic activity disappeared. |
The lava pond in the crater interior continued with small Strombolian eruptions throughout April 1997 and could be observed during clear nights as a red glow above the summit crater. The parallel fumarolic activity was moderate and mainly consisted of vapor. In May the activity of the lava pond increased considerably with respect to degassing intensity and frequency. At night incandescent bombs could be seen every 5 minutes. On 22, 23, 24, 30, and 31 May small ash clouds were regularly emitted to ~200 m above the summit.
In June, due to the beginning of winter, few observations of the summit could be executed. Nevertheless short periods of clear weather made possible a view of the activity level of the crater indicating small Strombolian explosions every 2 minutes. On 10 July observers realized that the red nocturnal glow had disappeared, hinting at subsidence of the magma column. Between 17 and 19 July the summit showed no more signs of fumarolic activity. On 22 July small fumarolic emissions were registered again. On 31 July weak night glow reappeared over the summit after an absence of 21 days.
On 19 August the glow reached the same intensity as in June. The crater did not show any explosive activity, indicating slow uplift of basaltic lava with low gas contents. Observers confirmed that the magma column had subsided again on 25 August for the second time this year and that the fumarolic activity was interrupted.
Geologic Background. The glacier-covered Villarrica stratovolcano, in the northern Lakes District of central Chile, is ~15 km south of the city of Pucon. A 2-km-wide caldera that formed about 3,500 years ago is located at the base of the presently active, dominantly basaltic to basaltic andesite cone at the NW margin of a 6-km-wide Pleistocene caldera. More than 30 scoria cones and fissure vents are present on the flanks. Plinian eruptions and pyroclastic flows that have extended up to 20 km from the volcano were produced during the Holocene. Lava flows up to 18 km long have issued from summit and flank vents. Eruptions documented since 1558 CE have consisted largely of mild-to-moderate explosive activity with occasional lava effusion. Glaciers cover 40 km2 of the volcano, and lahars have damaged towns on its flanks.
Information Contacts: Werner Keller, Proyecto de Observación Villarrica/Internet (POVI), Wiesenstr. 8, 86438 Kissing, Germany (URL: https://www.povi.cl/).
Yasur
Vanuatu
19.532°S, 169.447°E; summit elev. 361 m
All times are local (unless otherwise noted)
Mid-August visit discloses ongoing Strombolian eruptions from six vents
On 13 August 1997, Steve O'Meara and Robert Benward climbed Yasur from the NE (the Sulphur Bay side); they camped for two evenings on the volcano's summit at the E lip of the main crater (figures 8, 9, and 10). On 16 and 17 August they hiked on the S side of the volcano up to 150 m from the summit where they watched the eruptions for two hours each night. They shot video footage of dramatic, night-time intracrater activity abundant molten bombs hurling inside the crater, with many sticking to the steep crater walls. Reported explosion heights were determined by timing the fall of a fragment from the apex of its curve and using the equation x = 1/2 gt2.
The interior of the crater sloped sharply inward to a depth of ~70 m, where it intercepted a broad platform of ash punctuated by two roughly equally sized, oval-shaped craters, each ~70 m in diameter and 70 m deep. The craters were aligned N-S, and separated by an E-W trending ridge of ash. Each crater had three erupting vents.
North Crater observations. The active vent on the far E floor continuously spewed lava fragments 10-20 m high with coughing and splashing sounds. Occasionally a web-like bubble of lava rose out of the vent and burst as it expanded. Small puffs of steam and ash accompanied some of the more forceful discharges of gas. Several times during 13-15 August Strombolian explosions shot lava fragments 100-170 m into the air. One of the strongest explosions, on 15 August, directed ENE, showered the summit with volcanic bombs. One football- sized bomb fell ~30 m from the observers who collected it and donated it to the Smithsonian Institution. This explosion was followed by a sequence of blasts at intervals varying between 15 minutes and a few hours. As a qualitative measure of the explosions' intensity the observers reported that some of the strongest ones shook the ground, and they could feel the shock waves pound against their chests.
Two other vents were located on the SE and SW parts of the crater floor. These issued sporadic, small columns of ash rising to heights of ~100 m before dispersing in the high winds at the summit.
On the night of 16 August the N crater was still continuously spattering. The following night two blasts threw fragments ~200 m above the crater.
South Crater observations. This crater produced ash clouds from three vents, (two in the E- central section and one on the W side of the crater's floor). On 13 August the emissions were almost continuous; the central vents appeared to be filled with ash and the eruptions started as a boiling up of ash that sent ripples out from the center. As the ash column formed, a shower of incandescent rocks rose within it to a height of ~15 m before the fragments rained back down into the vent. In general these eruptions were relatively silent, sounding like sand being dumped from a truck, followed by the thudding of rocks as they hit the ground. Distinct snapping sounds occurred ~ 2 seconds after the incandescent rocks began rushing up the ash column, possibly due to static discharge. Within the next 24 hours the W vent became gradually less active, and the two central vents merged into a single larger vent.
During the two observation periods on 16 and 17 August the S crater was extremely active with explosions every 10 to 15 minutes. The sounds rivaled those of the strong Strombolian explosions from the N crater.
Geologic Background. Yasur has exhibited essentially continuous Strombolian and Vulcanian activity at least since Captain Cook observed ash eruptions in 1774. This style of activity may have continued for the past 800 years. Located at the SE tip of Tanna Island in Vanuatu, this pyroclastic cone has a nearly circular, 400-m-wide summit crater. The active cone is largely contained within the small Yenkahe caldera, and is the youngest of a group of Holocene volcanic centers constructed over the down-dropped NE flank of the Pleistocene Tukosmeru volcano. The Yenkahe horst is located within the Siwi ring fracture, a 4-km-wide open feature associated with eruption of the andesitic Siwi pyroclastic sequence. Active tectonism along the Yenkahe horst accompanying eruptions has raised Port Resolution harbor more than 20 m during the past century.
Information Contacts: Stephen O'Meara, Donna O'Meara, and Robert Benward, Volcano Watch International, Nature *Stock, PO Box 218, Volcano, HI 96785, USA.