Recently Published Bulletin Reports
Ambrym (Vanuatu) New effusive eruption during January 2024
Popocatepetl (Mexico) Daily gas-and-ash emissions, ashfall, and occasional explosions during August-November 2023
Reventador (Ecuador) Daily explosions, gas-and-ash emissions, and incandescent avalanches during August-November 2023
Erta Ale (Ethiopia) Strong lava lake activity and lava overflows during June-November 2023
Ubinas (Peru) New eruption with explosions and ash plumes during June-December 2023
Kanaga (United States) Small explosion on 18 December 2023
Klyuchevskoy (Russia) New eruption consisting of Strombolian activity, lava flows and fountains, and ash plumes during June-December 2023
Agung (Indonesia) Three eruptive events reported in April, May, and December 2022
Saunders (United Kingdom) Persistent thermal anomalies from the summit crater lava lake during February 2023-January 2024
Tengger Caldera (Indonesia) Minor ash emission in December 2023; persistent weak thermal anomaly in the Bromo crater
Shishaldin (United States) New eruption with significant Strombolian explosions, ash plumes, and ashfall
Ioto (Japan) New eruption with discolored water, ejecta, and floating pumice during October-December 2023
Ambrym (Vanuatu) — February 2024  Cite this Report
Ambrym
Vanuatu
16.25°S, 168.12°E; summit elev. 1334 m
All times are local (unless otherwise noted)
New effusive eruption during January 2024
Ambrym contains a 12-km-wide caldera and is part of the New Hebrides Arc, located in the Vanuatu archipelago. The two currently active craters within the caldera are Benbow and Marum, both of which have produced lava lakes, explosions, lava flows, and gas-and-ash emissions. The previous eruption occurred during late January 2022 and was characterized by ash plumes, sulfur dioxide plumes, and crater incandescence (BGVN 47:05). This report covers a new, short eruption during January 2024, which consisted of a lava effusion and an explosion. Information comes from the Vanuatu Meteorology and Geohazards Department (VMGD) and satellite data.
VMGD reported that at 2217 on 13 January an eruption began at Benbow Crater, based on webcam and seismic data. The eruption was characterized by a loud explosion, intense crater incandescence (figure 55), and gas-and-steam emissions. As a result, the Volcano Alert Level (VAL) was raised from 1 to 3 (on a scale of 0-5). A lava flow was reported in Benbow Crater, which lasted for four days. Satellite data showed that 1,116 tons of sulfur dioxide per day (t/d) were emitted on 14 January (figure 56). During the morning of 15 January, ground reports noted loud explosions and minor earthquakes. The sulfur dioxide flux on 15 January was 764 t/d. During 15-17 January activity decreased according to webcam images, seismic data, and field observations. No sulfur dioxide emissions were reported after 15 January. Gas-and-ash emissions also decreased, although they continued to be observed through 31 January, and crater incandescence was less intense (figure 57). The VAL was lowered to 2 on 17 January.
Geologic Background. Ambrym is a large basaltic volcano with a 12-km-wide caldera formed during a major Plinian eruption with dacitic pyroclastic flows about 1,900 years ago. A thick, almost exclusively pyroclastic sequence, initially dacitic then basaltic, overlies lava flows of a pre-caldera shield volcano. Post-caldera eruptions, primarily from Marum and Benbow cones, have partially filled the caldera floor and produced lava flows that ponded on the floor or overflowed through gaps in the caldera rim. Post-caldera eruptions have also formed a series of scoria cones and maars along a fissure system oriented ENE-WSW. Eruptions have been frequently reported since 1774, though mostly limited to extra-caldera eruptions that would have affected local populations. Since 1950 observations of eruptive activity from cones within the caldera or from flank vents have occurred almost yearly.
Information Contacts: Geo-Hazards Division, Vanuatu Meteorology and Geo-Hazards Department (VMGD), Ministry of Climate Change Adaptation, Meteorology, Geo-Hazards, Energy, Environment and Disaster Management, Private Mail Bag 9054, Lini Highway, Port Vila, Vanuatu (URL: http://www.vmgd.gov.vu/, https://www.facebook.com/VanuatuGeohazardsObservatory/); Copernicus Browser, Copernicus Data Space Ecosystem, European Space Agency (URL: https://dataspace.copernicus.eu/browser/).
Popocatepetl (Mexico) — January 2024 Cite this Report
Popocatepetl
Mexico
19.023°N, 98.622°W; summit elev. 5393 m
All times are local (unless otherwise noted)
Daily gas-and-ash emissions, ashfall, and occasional explosions during August-November 2023
Popocatépetl, located 70 km SE of Mexica City, Mexico, contains a 400 x 600 m-wide summit crater. Records of activity date back to the 14th century; three Plinian eruptions, the most recent of which took place about 800 CE, have occurred since the mid-Holocene, accompanied by pyroclastic flows and voluminous lahars that swept basins below the volcano. The current eruption period began in January 2005, characterized by numerous episodes of lava dome growth and destruction within the summit crater. Recent activity has been characterized by daily gas-and-ash emissions, ashfall, and explosions (BGVN 48:09). This report covers similar activity during August through November 2023, according to daily reports from Mexico's Centro Nacional de Prevención de Desastres (CENAPRED) and various satellite data.
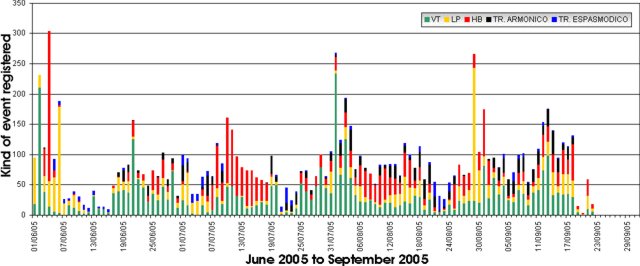
Daily gas-and-steam emissions, containing some amount of ash, continued during August through November 2023. CENAPRED reported the number of low-intensity gas-and-ash emissions or “exhalations” and the minutes of tremor, which sometimes included harmonic tremor in their daily reports (figure 220). A total of 21 volcano-tectonic (VT) tremors were detected throughout the reporting period. The average number of exhalations was 117 per day, with a maximum number of 640 on 25 September. Frequent sulfur dioxide plumes that exceeded two Dobson Units (DU) and drifted in multiple directions were visible in satellite data from the TROPOMI instrument on the Sentinel-5P satellite (figure 221).
Activity during August was relatively low and mainly consisted of occasional explosions, ash emissions, and light ashfall. There were 30 explosions (25 minor explosions and four moderate explosions), and nine VT-type events detected. An average number of 60 exhalations occurred each day, which mostly consisted of water vapor, volcanic gases, and a small amount of ash. On 2 August the National Center for Communications and Civil Protection Operations (CENACOM) reported light ashfall in Ocuituco (22 km SW), Yecapixtla (31 km SW), Cuautla (43 km SW), and Villa de Ayala (47 km SW). On 7 August light ashfall was observed in Atlautla (16 km W). A minor explosion at 0305 on 11 August was accompanied by crater incandescence. Explosions at 0618 on 13 August produced a gas-and-ash plume that rose above the summit, and at 0736 another explosion produced a puff of gas-and-ash (figure 222). Two minor explosions were detected at 0223 and 0230 on 16 August that generated eruptive columns with low ash content rising 800 m and 700 m above the crater, respectively. On 24 August an eruptive event lasted 185 minutes and consisted of light ash emissions that did not exceed 300 m above the crater. According to the Washington VAAC, ash plumes identified in daily satellite images rose to 4.6-7.6 km altitude and drifted in multiple directions, the highest of which occurred on 29 August.
There was an average of 156 exhalations each day during September, a monthly total of seven VT-type events, and 29 explosions, 14 of which were minor and nine of which were moderate. A gas-and-ash plume rose to 2 km above the summit and drifted WSW at 1216 on 1 September. CENACOM reported at 1510 observations of ashfall in Ozumba (18 km W), Atlautla, Tepetlixpa (20 km W), and Ecatzingo (15 km SW), as well as in Morelos in Cuernavaca (65 km WSW), Temixco (67 km WSW), Huitzilac (67 km W), Tepoztlán (49 km W), and Jiutepec (59 km SW). The next day, gas-and-ash plumes rose to 2 km above the summit (figure 223). At 1100 ashfall was reported in Amecameca (15 km NW), Ayapango (24 km WNW), Ozumba, Juchitepec, Tenango del Aire (29 km WNW), Atlautla, and Tlalmanalco (27 km NW). A gas-and-ash plume rose to 1 km above the summit and drifted WNW at 1810. During 5-6, 8-9, 12, 14, 19, and 24-25 September ashfall was reported in Amecameca, Atlautla, Ozumba, Tenango del Aire, Tepetlixpa, Juchitepec, Cuernavaca, Ayala, Valle de Chalco (44 km NW), Ixtapaluca (42 km NW), La Paz (50 km NW), Chimalhuacán, Ecatepec, Nezahualcóyotl (60 km NW), Xochimilco (53 km SE), Huayapan, Tetela del Volcano (20 km SW), Yautepec (50 km WSW), Cuautla (43 km SW), Yecapixtla (30 km SW) and possibly Tlaltizapán (65 km SW), Tlaquiltenango, and Tepalcingo. According to the Washington VAAC, ash plumes identified in daily satellite images rose to 5.8-9.1 km altitude and drifted in multiple directions, the highest of which was identified during 1-2 August.
Activity during October and November was relatively low. An average of 179 exhalations consisting of gas-and-steam and ash emissions were reported during October and 73 during November. Only one VT-type event and two explosions were detected during October and four VT-type events and one explosion during November. A satellite image from 0101 on 14 October showed ash fanning out to the NW at 6.7 km altitude and an image from 0717 showed a continuously emitted ash plume drifting WNW and NW at the same altitude. Ash emissions at 1831 on 14 October were ongoing and visible in webcam images slowly drifting W at an altitude of 6.4 km altitude (figure 224). On 24 October a tremor sequence began at 0310 that generated a gas-and-ash plume that rose 800 m above the summit and drifted W. Another tremor sequence occurred during 1305-1900 on 25 October that consisted of continuous ash emissions. Ash plumes identified in daily satellite images rose to 5.5-8.5 km altitude and drifted in different directions during October, according to the Washington VAAC. The highest ash plume was detected on 23 October. During 10-13 November ash plumes rose to 6.7 km altitude and drifted N, NNW, NE, and NW. On 13 November a M 1.5 VT-type event was detected at 0339 and light ashfall was reported in Amecameca, Cocotitlán (34 km NW), and Tenango del Aire, and Ocuituco. On 14 November ash plumes rose to 6 km altitude and drifted N, NE, and SE and light ashfall was reported in Cuernavaca (64 km W). The Washington VAAC reported frequent ash plumes that rose to 5.8-7.9 km altitude and drifted in several directions; the highest ash plume was recorded on 28 November.
Satellite data. MODIS thermal anomaly data provided through MIROVA (Middle InfraRed Observation of Volcanic Activity) showed frequent low-to-moderate thermal anomalies during the reporting period (figure 225). The intensity of the anomalies was lower compared to previous months. According to data from MODVOLC thermal alerts, a total of ten hotspots were detected at the summit crater on 2 August and 2, 4, 9, 19, and 26 September. Thermal activity in the summit crater was visible in infrared satellite data and was sometimes accompanied by ash plumes, as shown on 17 November (figure 226).
Geologic Background. Volcán Popocatépetl, whose name is the Aztec word for smoking mountain, rises 70 km SE of Mexico City to form North America's 2nd-highest volcano. The glacier-clad stratovolcano contains a steep-walled, 400 x 600 m wide crater. The generally symmetrical volcano is modified by the sharp-peaked Ventorrillo on the NW, a remnant of an earlier volcano. At least three previous major cones were destroyed by gravitational failure during the Pleistocene, producing massive debris-avalanche deposits covering broad areas to the south. The modern volcano was constructed south of the late-Pleistocene to Holocene El Fraile cone. Three major Plinian eruptions, the most recent of which took place about 800 CE, have occurred since the mid-Holocene, accompanied by pyroclastic flows and voluminous lahars that swept basins below the volcano. Frequent historical eruptions, first recorded in Aztec codices, have occurred since Pre-Columbian time.
Information Contacts: Centro Nacional de Prevención de Desastres (CENAPRED), Av. Delfín Madrigal No.665. Coyoacan, México D.F. 04360, México (URL: http://www.cenapred.unam.mx/, Daily Report Archive https://www.gob.mx/cenapred/archivo/articulos); Washington Volcanic Ash Advisory Center (VAAC), Satellite Analysis Branch (SAB), NOAA/NESDIS OSPO, NOAA Science Center Room 401, 5200 Auth Rd, Camp Springs, MD 20746, USA (URL: www.ospo.noaa.gov/Products/atmosphere/vaac, archive at: http://www.ssd.noaa.gov/VAAC/archive.html); MIROVA (Middle InfraRed Observation of Volcanic Activity), a collaborative project between the Universities of Turin and Florence (Italy) supported by the Centre for Volcanic Risk of the Italian Civil Protection Department (URL: http://www.mirovaweb.it/); Hawai'i Institute of Geophysics and Planetology (HIGP) - MODVOLC Thermal Alerts System, School of Ocean and Earth Science and Technology (SOEST), Univ. of Hawai'i, 2525 Correa Road, Honolulu, HI 96822, USA (URL: http://modis.higp.hawaii.edu/); NASA Global Sulfur Dioxide Monitoring Page, Atmospheric Chemistry and Dynamics Laboratory, NASA Goddard Space Flight Center (NASA/GSFC), 8800 Greenbelt Road, Goddard, Maryland, USA (URL: https://so2.gsfc.nasa.gov/); Copernicus Browser, Copernicus Data Space Ecosystem, European Space Agency (URL: https://dataspace.copernicus.eu/browser/).
Reventador (Ecuador) — January 2024 Cite this Report
Reventador
Ecuador
0.077°S, 77.656°W; summit elev. 3562 m
All times are local (unless otherwise noted)
Daily explosions, gas-and-ash emissions, and incandescent avalanches during August-November 2023
Volcán El Reventador, located in Ecuador, is a stratovolcano with a 4-km-wide avalanche scarp open to the E that was formed by edifice collapse. The largest recorded eruption took place in 2002 producing a 17-km-high eruption column, pyroclastic flows that traveled as far as 8 km, and lava flows from summit and flank vents. Recorded eruptions date back to the 16th century and have been characterized by explosive events, lava flows, ash plumes, and lahars. Frequent lahars have built deposits on the scarp slope. The current eruption period began in July 2008 and has recently been characterized daily explosions, gas-and-ash emissions, and block avalanches (BGVN 48:08). This report covers similar activity during August through November 2023 using daily reports from Ecuador's Instituto Geofisico (IG-EPN) and satellite data.
During August through November 2023, IG-EPN reported daily explosions, gas-and-ash plumes that rose as high as 1.3 km above the crater, and frequent crater incandescence, often accompanied by incandescent block avalanches that affected one or multiple flanks. More daily explosions were detected during November, with an average total of 46 per day.
Table 19. Monthly summary of explosions and plume heights recorded at Reventador from August through November 2023. Data could not be collected for 29-30 September 2023 and 6-23 October 2023. Data courtesy of IG-EPN (August-November 2023 daily reports).
| Month |
Average number of explosions per day |
Max plume height above the crater rim (km) |
| Aug 2023 |
32 |
1.3 |
| Sep 2023 |
30 |
1 |
| Oct 2023 |
31 |
1.3 |
| Nov 2023 |
46 |
1.2 |
Activity during August consisted of 6-75 daily explosions, nighttime crater incandescence, and incandescent avalanches of material. Frequent seismicity was mainly characterized by long-period (LP) events, harmonic tremor (TRARM), tremor-type (TRE), and volcano tectonic (VT)-type events. Daily gas-and-ash emissions rose 200-1,300 m above the summit and drifted W, SW, NW, NE, N, and E, based on webcam and satellite images. The Washington VAAC also reported occasional ash plumes that rose 400-1,600 m above the crater and drifted NW. Avalanches of incandescent material were reported during 1-2, 6-7, 9-14, 16-17, 18-21, and 26-29 August, which traveled 500-900 m below the crater and affected multiple flanks (figure 180). During 24-25 August incandescent material was ejected 300 m above the crater.
Gas-and-ash emissions and seismicity characterized by LP, VT, TRARM, and TRE-type events continued during September; data were not available for 29-30 September. Daily gas-and-ash emissions rose 200-1,000 m above the crater and generally drifted W, NW, and SW (figure 181). Near-daily explosions ranged from 16-53 per day, often accompanied by incandescent avalanches, which affected one or multiple flanks and traveled 100-800 m below the crater. During 2-3 September incandescent material was ejected 200 m above the crater and was accompanied by blocks rolling down the flanks. During 16-17 September incandescent material was ejected 100-200 m above the crater and avalanches descended 600 m below the crater. During 21-22 and 24-26 September incandescent material was ejected 100-300 m above the crater. According to the Washington VAAC, ash plumes rose 700 m above the crater and drifted SW, W, and NW on 3, 16, and 20 September, respectfully.
During October, daily explosions, gas-and-ash plumes, and crater incandescence continued, with 16-40 explosions recorded each day (figure 182); data was not available for 6-23 October. Seismicity consisted of LP, TRE, and TRARM-type events. Gas-and-ash emissions rose 200-1,000 m above the crater and drifted W, SW, NW, SSW, NNW, and NE. The Washington VAAC reported that ash plumes rose 1-1.3 km above the crater and drifted W, SW, and NW during 1-5 October. During 30 September-1 October incandescent avalanches descended 700 m below the crater. Ejected material rose 200 m above the crater during 2-5 October and was accompanied by avalanches of material that traveled 250-600 m below the crater rim; incandescent avalanches were also reported during 23-29 October.
Daily explosions, LP, TRARM, VT, and TRE-type events, crater incandescence, and avalanches of material continued during November. There were 26-62 daily explosions detected throughout the month. Gas-and-ash emissions rose 300-1,200 m above the crater and drifted in different directions (figure 183). The Washington VAAC reported that ash plumes rose 700-1,620 m above the crater and drifted NW, W, WNW, SW, E, SE, and ESE. Frequent incandescent avalanches descended 500-1,000 m below the crater. Explosions ejected material 100-300 m above the crater during 4-7, 11-12, and 19-23 November.
Satellite data. MIROVA (Middle InfraRed Observation of Volcanic Activity) analysis of MODIS satellite data showed intermittent thermal anomalies of low-to-moderate power (figure 184). Thermal activity mainly consisted of incandescent avalanches descending the flanks due to the frequently detected explosions. The MODVOLC hotspot system identified a total of ten hotspots on 3 August, 7, 18, 12, 22, and 28 September, and 7, 9, and 19 November.
Geologic Background. Volcán El Reventador is the most frequently active of a chain of Ecuadorian volcanoes in the Cordillera Real, well east of the principal volcanic axis. The forested, dominantly andesitic stratovolcano has 4-km-wide avalanche scarp open to the E formed by edifice collapse. A young, unvegetated, cone rises from the amphitheater floor to a height comparable to the rim. It has been the source of numerous lava flows as well as explosive eruptions visible from Quito, about 90 km ESE. Frequent lahars in this region of heavy rainfall have left extensive deposits on the scarp slope. The largest recorded eruption took place in 2002, producing a 17-km-high eruption column, pyroclastic flows that traveled up to 8 km, and lava flows from summit and flank vents.
Information Contacts: Instituto Geofísico, Escuela Politécnica Nacional (IG-EPN), Casilla 17-01-2759, Quito, Ecuador (URL: http://www.igepn.edu.ec/); MIROVA (Middle InfraRed Observation of Volcanic Activity), a collaborative project between the Universities of Turin and Florence (Italy) supported by the Centre for Volcanic Risk of the Italian Civil Protection Department (URL: http://www.mirovaweb.it/); Hawai'i Institute of Geophysics and Planetology (HIGP) - MODVOLC Thermal Alerts System, School of Ocean and Earth Science and Technology (SOEST), Univ. of Hawai'i, 2525 Correa Road, Honolulu, HI 96822, USA (URL: http://modis.higp.hawaii.edu/).
Erta Ale (Ethiopia) — January 2024 Cite this Report
Erta Ale
Ethiopia
13.601°N, 40.666°E; summit elev. 585 m
All times are local (unless otherwise noted)
Strong lava lake activity and lava overflows during June-November 2023
Erta Ale in Ethiopia has a 50-km-wide edifice that rises more than 600 m from below sea level in the Danakil depression. The summit caldera is 0.7 x 1.6 km and contains at least two pit craters (North and South). Another larger 1.8 x 3.1-km-wide depression is located SE of the summit and is bounded by curvilinear fault scarps on the SE side. Lava flows from fissures have traveled into the caldera and locally overflowed the crater rim. The current eruption has been ongoing since 1967, with at least one long-term active lava lake present in the summit caldera. Recent fissure eruptions from 2017 have occurred on the SE flank (BGVN 42:07). Recent activity has been characterized by minor thermal activity at the S crater and an active lava lake at the N crater (BGVN 48:06). This report covers strong lava lake activity primarily at the N pit crater during June through November 2023 using information from satellite infrared data.
Infrared satellite images generally showed an active lava lake as the N pit crater and variable thermal activity at the S pit crater during the reporting period. On 7 June two strong thermal anomalies were detected at the S pit crater and two weaker anomalies were visible at the N pit crater. Those anomalies persisted throughout the month, although the intensity at each declined. On 2 July a possible lava lake was identified at the S pit crater, filling much of the crater. On 7 July both pit craters contained active lava lakes (figure 120). By 12 July the thermal activity decreased; two smaller anomalies were visible through the rest of the month at the S pit crater while the N pit crater showed evidence of cooling.
Renewed lava lake activity was identified at the N pit crater, based on a satellite image from 11 August, with two smaller anomalies visible at the S pit crater. By 16 August the lava lake in the N pit had begun to cool and only a small thermal anomaly was identified. Activity restarted on 21 August, filling much of the E and SE part of the N pit crater. The thermal activity at the N pit crater intensified on 31 August, particularly in the NW part of the crater. On 5 September lava filled much of the N pit crater, overflowing to the W and SW. During at least 10-20 September thermal activity at both craters were relatively low.
According to a satellite image on 25 September, strong thermal activity resumed when lava overflowed the N pit crater to the S, SW, and NE (figure 120). A satellite image taken on 5 October showed lava flows from the N had spilled into the S and begun to cool, accompanied by two weak thermal anomalies at the S pit crater. On 15 October lava flows again traveled SE and appeared to originate from the S pit crater (figure 120). Following these events, smaller thermal anomalies were visible on the SE rim of the N pit crater and within the S pit crater.
Lava was visible in the NW part of the N pit crater according to a satellite image taken on 4 November. By 9 November the intensity had decreased, and the lava appeared to cool through the rest of the month; young lava flows were visible along the W side of the S pit crater on 24 and 29 November. Lava flows occurred at the N pit crater trending NE-SW and along the E side on 29 November (figure 120).
During the reporting period, the MIROVA (Middle InfraRed Observation of Volcanic Activity) thermal detection system recorded consistent activity during the first half of 2023 (figure 121). Beginning in June 2023, thermal activity increased and remained variable in intensity through the end of the year indicating the presence of an active lava lake and lava flows. The MODVOLC thermal detection system registered a total of 63 anomalies during 7, 8, and 23 July, 10 and 18 August, 3, 5, 16, 23, 24, and 25 September, 15 and 20 October, and 21, 24, 26, 28, and 30 November. Some of these stronger thermal anomalies were also detected in Sentinel-2 infrared satellite images that showed an active lava lake at the N pit crater and subsequent lava overflows from both pit craters (figure 120).
Geologic Background. The Erta Ale basaltic shield volcano in Ethiopia has a 50-km-wide edifice that rises more than 600 m from below sea level in the Danakil depression. The volcano includes a 0.7 x 1.6 km summit crater hosting steep-sided pit craters. Another larger 1.8 x 3.1 km wide depression elongated parallel to the trend of the Erta Ale range is located SE of the summit and is bounded by curvilinear fault scarps on the SE side. Basaltic lava flows from these fissures have poured into the caldera and locally overflowed its rim. The summit caldera usually also holds at least one long-term lava lake that has been active since at least 1967, and possibly since 1906. Recent fissure eruptions have occurred on the N flank.
Information Contacts: MIROVA (Middle InfraRed Observation of Volcanic Activity), a collaborative project between the Universities of Turin and Florence (Italy) supported by the Centre for Volcanic Risk of the Italian Civil Protection Department (URL: http://www.mirovaweb.it/); Hawai'i Institute of Geophysics and Planetology (HIGP) - MODVOLC Thermal Alerts System, School of Ocean and Earth Science and Technology (SOEST), Univ. of Hawai'i, 2525 Correa Road, Honolulu, HI 96822, USA (URL: http://modis.higp.hawaii.edu/); Copernicus Browser, Copernicus Data Space Ecosystem, European Space Agency (URL: https://dataspace.copernicus.eu/browser/).
Ubinas
Peru
16.345°S, 70.8972°W; summit elev. 5608 m
All times are local (unless otherwise noted)
New eruption with explosions and ash plumes during June-December 2023
Ubinas, located in Peru, has had 24 eruptions since 1550, which more recently have been characterized by explosions, ash plumes, and lahars (BGVN 45:03). This report covers a new eruption during June through December 2023 based on reports from Instituto Geofisico del Peru (IGP), Instituto Geológico Minero y Metalúrgico (INGEMMET), and satellite data.
IGP reported that seismic unrest began on 17 May, followed by an increase in seismicity during the second half of the month. There were 168 volcano-tectonic (VT) earthquakes detected, which are associated with rock fracturing processes, and 171 long-period (LP) earthquakes recorded during 16-24 May, which are associated with the movement of volcanic fluid.
Seismicity and fumarolic activity at the crater level continued to increase during June. During 1-18 June there was an average of 631 VT-type earthquakes and 829 LP earthquakes recorded. Webcams showed gas-and-steam emissions rising 500 m above the summit and drifting SE. In addition, the maximum value of emitted sulfur dioxide during this period was 337 tons/day. During 19-22 June an average of 315 VT-type events and 281 LP-type events and tremor were reported. On 20 June the Gobierno Regional de Moquegua raised the Volcano Alert Level (VAL) to Yellow (the second level on a four-color scale), based on recommendations from IGP. Webcam images showed ash emissions rising 1 km above the summit and drifting E at 0011 on 22 June, which IGP reported marked the start of a new eruption. Sporadic and diffuse gas-and-ash emissions continued to rise 800-1,500 m above the summit through the rest of the month and drifted mainly E, N, NW, W, SW, and NE. During 23-25 June there was an average of 402 VT-type earthquakes and 865 LP-type events detected. During 26-28 June the earthquakes associated with ash emissions, which have been observed since 22 June, decreased, indicating the end of the phreatic phase of the eruption, according to IGP. A thermal anomaly was detected in the crater for the first time on 26 June and was periodically visible through 4 July (figure 61). During 29-30 June there was an average of 173 VT-type earthquakes and 351 LP-type events recorded, and sulfur dioxide values ranged between 600 t/d and 1,150 t/d. During this same time, seismicity significantly increased, with 173 VT-type earthquakes, 351 LP-type events, and harmonic tremor which signified rising magma. The Gobierno Regional de Moquegua raised the Alert Level to Orange (the third level on a four-color scale) on 30 June based on the recommendation from IGP and INGEMMET.
Activity during July consisted of continued seismicity and gas-and-ash emissions. Gas-and-ash emissions rose as high as 5 km above the summit and drifted as far as 40 km in different directions during 1, 4-6, 16, 20-23, 26, and 29 July, based on webcam and satellite images. During 1-2 July an average of 72 VT-type earthquakes and 114 LP-type events were detected. In addition, during that time, ashfall was reported in Ubinas (6.5 km SSE) and Querapi (4.5 km SE). During 2-3 July INGEMMET reported gas-and-ash plumes rose 400 m above the summit and drifted SW, causing ashfall in downwind areas as far as 5 km. During 3-4 July there was an average of 69 VT-type earthquakes and 96 LP-type events reported. On 4 July starting around 0316 there were 16 seismic signals associated with explosive activity and ash emissions detected (figure 62). According to INGEMMET an explosion ejected ballistics and generated a gas-and-ash plume that rose 5.5 km above the summit and drifted SW and S. Ashfall was recorded in Querapi, Ubinas, Sacohaya (7 km SSE), Anascapa (11 km SE), San Miguel (10 km SE), Tonohaya (7 km SSE), Huatahua, Huarina, Escacha (9 km SE), and Matalaque (17 km SSE), and was most significant within 5 km of the volcano. IGP noted that ash fell within a radius of 20 km and deposits were 1 mm thick in towns in the district of Ubinas.
During 5-9 July an average of 67 VT-type events and 47 LP-type events were reported. A period of continuous gas-and-ash emissions occurred on 5 July, with plumes drifting more than 10 km SE and E. A total of 11 seismic signals associated with explosions also detected on 6, 16, 17, and 22 July. On 6 July explosions recorded at 0747 and 2330 produced gas-and-ash plumes that rose as high as 3.5 km above the summit and drifted as far as 30 km NW, NE, SE, and S. According to the Washington VAAC the explosion at 0747 produced a gas-and-ash plume that rose to 9.1 km altitude and drifted SW, which gradually dissipated, while a lower-altitude plume rose to 7.6 km altitude and drifted NE. Gobierno Regional de Moquegua declared a state of emergency for districts in the Moquegua region, along with Coalaque Chojata, Icuña, Lloque, Matalaque, Ubinas, and Yunga of the General Sánchez Cerro province, to be in effect for 60 days. On 7 July an ash plume rose to 7.3 km altitude and drifted E at 0320. At 0900 and 1520 gas-and-steam plumes with diffuse ash rose to 6.7 km altitude and drifted SE. Small ash emissions were visible in satellite and webcam images at 0920 and 1520 on 8 July and rose as high as 6.4 km altitude and drifted SE. During 10-16 July there was an average of 80 VT-type earthquakes and 93 LP-type events reported. INGEMMET reported that during 9-11 July sulfur dioxide emissions were low and remained around 300 t/d.
During 17-23 July an average of 46 VT-type events and 122 LP-type events were detected. On 20 July at 0530 an explosion generated an ash plume that rose 3-4.5 km above the crater and drifted 65 km toward Arequipa. An explosion on 21 July at 0922 produced a gas-and-ash plume that rose 5 km above the summit (figure 63). Ashfall was reported in Querapi, Ubinas, Tonohaya, Anascapa, Sacohaya, San Miguel, Escacha, Huatagua (14 km SE), Huarina, Escacha (9 km SE), Matalaque, Logén, Santa Lucía de Salinas, and Salinas de Moche. An explosion on 22 July at 1323 generated an ash plume that rose 5.5 km above the summit and drifted NE, E, and SE. During 24-30 July there were five volcanic explosions detected and an average of 60 VT-type events and 117 LP-type events. An explosion on 29 July at 0957 produced an ash plume that rose 2.5 km above the summit and drifted as far as 40 km NE, E, and SE. As a result, significant ashfall was reported in Ubinas and Matalaque.
During August, explosions, gas-and-ash emissions, and seismic earthquakes persisted. During 31 July to 6 August there was an average of 115 VT-type events and 124 LP-type events reported. Gas-and-ash emissions were observed during 1, 6, 10, 13-14, 17-18, 21, and 23 August and they drifted as far as 20 km in different directions; on 14 and 18 August continuous ash emissions extended as far as 40 km S, SE, and NE. An explosion was detected at 2110 on 1 August, which generated a gas-and-ash plume that rose 5.4 km above the summit and drifted SE and E. The explosion ejected blocks and incandescent material as far as 3 km from the crater onto the SW, S, and SE flanks. Ashfall was reported in Ubinas and Chojata (19 km ESE). Gas-and-ash emissions rose as high as 2 km above the summit and drifted in different directions through 5 August, sometimes causing ashfall within a 15-km-radius. An explosion at 0009 on 6 August ejected blocks and produced a gas-and-ash plume that rose 1.4 km above the summit and drifted SE and E, which caused ashfall in Ubinas and Chojata and other areas within a 30-km radius. During 7-13 August there was an average of 102 VT-type events and 60 LP-type events detected. INGEMMET reported that sulfur dioxide emissions were low on 7 August and averaged 400 t/d.
One volcanic explosion that was recorded on 10 August, producing gas-and-ash emissions that rose 2.4 km above the summit and drifted as far as 25 km SE and E. Ashfall was observed in Ubinas, Matalaque, and Chojata. During 10-11 and 13-14 August sulfur dioxide values increased slightly to moderate levels of 2,400-3,700 t/d. The average number of VT-type events was 104 and the number of LP-type events was 71 during 14-21 August. Two explosions were detected at 0141 and 0918 on 21 August, which produced gas-and-ash emissions that rose 3.5 km above the summit and drifted 50 km N, NE, W, and NW (figure 64). The explosion at 0918 generated an ash plume that caused ashfall in different areas of San Juan de Tarucani. During 22-27 August the average number of VT-type events was 229 and the average number of LP-type events was 54. An explosion was reported at 1757 on 25 August, which generated a gas-and-ash plume that rose 4.2 km above the summit and drifted in multiple directions as far as 25 km. During 28 August through 3 September gas-and-ash emissions rose 600 m above the summit and drifted as far as 5 km E and SE. During this time, there was an average of 78 VT-type events and 42 LP-type events.
Gas-and-steam emissions rose 600-2,600 m above the summit and drifted as far as 15 km in multiple directions during September. During 4-10 and 11-17 September there was an average of 183 VT-type events and 27 LP-type events, and 114 VT-type events and 86 LP-type events occurred, respectively. On 14 September an explosion at 1049 generated a gas-and-ash plume that rose 2.6 km above the summit and drifted as far as 15 km E, NE, SE, and S (figure 65). During 14-16 September an average of three hours of seismic tremor related to ash emissions was recorded each day. During 18-24 September the average number of VT-type events was 187 and the average number of LP-type events was 45. During 25 September and 1 October, there was an average number of 129 VT-type events and 52 LP-type events detected.
Relatively low activity was reported during October; during 2-9 October there was an average number of 155 VT-type events and 27 LP-type events recorded. On 1 October at 1656 seismic signals associated with ash emissions were recorded for an hour and thirty minutes; the ash plumes rose as high as 1 km above the summit and drifted more than 10 km E, S, and SW. On 4 October IGP reported that an ash plume drifted more than 15 km SW and S. Sulfur dioxide emissions were 1,250 t/d on that day. On 7 October a gas-and-ash plume rose 1.9 km above the summit and drifted NE, E, and SE. On 4 October the amount of sulfur dioxide emissions was 1,250 t/d. During 10-15 October there was an average number of 225 VT-type events and 34 LP-type events recorded. On 11 October at 1555 a single seismic signal associated with an ash pulse was recorded; the gas-and-ash emissions rose 700 m above the summit and drifted SW and W. There was an average of 204 VT-type events and 25 LP-type events detected during 16-22 October and 175 VT-type events and 17 LP-type events during 23-29 October. On 27 October at 0043 a gas-and-ash emission rose 500 m above the summit and drifted SE and E. A minor thermal anomaly was visible on the crater floor. During 30 October to 5 November there was an average of 95 VT-type events and 24 LP-type events detected.
Activity remained relatively low during November and December and consisted mainly of gas-and-steam emissions and seismicity. Gas-and-steam emissions rose 900-1,100 m above the summit and drifted mainly E, SE, N, and NE. IGP detected an average of 166 VT-type events and 38 LP-type events during 6-15 November, 151 VT-type events and 17 LP-type events during 16-30 November, 143 VT-type events and 23 LP-type events during 1-15 December, and 129 VT-type events and 21 LP-type events during 16-31 December. No explosions or ash emissions were recorded during November. The VAL was lowered to Yellow (the second level on a four-color scale) during the first week of November. According to the Washington VAAC an ash emission was identified in a satellite image at 0040 on 11 December that rose to 5.5 km altitude and drifted NW. Webcam images at 0620 and 1220 showed continuous gas-and-steam emissions possibly containing some ash rising as high as 7 km altitude. Webcam images during 10-31 December showed continuous gas-and-ash emissions that rose as high as 2.5 km above the summit and drifted up to 5 km NW, W, and SW. On 12 December continuous ash emissions drifted more than 10 km N and NW.
Geologic Background. The truncated appearance of Ubinas, Perú's most active volcano, is a result of a 1.4-km-wide crater at the summit. It is the northernmost of three young volcanoes located along a regional structural lineament about 50 km behind the main volcanic front. The growth and destruction of Ubinas I was followed by construction of Ubinas II beginning in the mid-Pleistocene. The upper slopes of the andesitic-to-rhyolitic Ubinas II stratovolcano are composed primarily of andesitic and trachyandesitic lava flows and steepen to nearly 45°. The steep-walled, 150-m-deep summit crater contains an ash cone with a 500-m-wide funnel-shaped vent that is 200 m deep. Debris-avalanche deposits from the collapse of the SE flank about 3,700 years ago extend 10 km from the volcano. Widespread Plinian pumice-fall deposits include one from about 1,000 years ago. Holocene lava flows are visible on the flanks, but activity documented since the 16th century has consisted of intermittent minor-to-moderate explosive eruptions.
Information Contacts: Instituto Geofisico del Peru (IGP), Calle Badajoz N° 169 Urb. Mayorazgo IV Etapa, Ate, Lima 15012, Perú (URL: https://www.gob.pe/igp); Observatorio Volcanologico del INGEMMET (Instituto Geológical Minero y Metalúrgico), Barrio Magisterial Nro. 2 B-16 Umacollo - Yanahuara Arequipa, Peru (URL: http://ovi.ingemmet.gob.pe); Gobierno Regional Moquegua, Sede Principal De Moquegua, R377+5RR, Los Chirimoyos, Moquegua 18001, Peru (URL: https://www.gob.pe/regionmoquegua); Washington Volcanic Ash Advisory Center (VAAC), Satellite Analysis Branch (SAB), NOAA/NESDIS OSPO, NOAA Science Center Room 401, 5200 Auth Rd, Camp Springs, MD 20746, USA (URL: www.ospo.noaa.gov/Products/atmosphere/vaac, archive at: http://www.ssd.noaa.gov/VAAC/archive.html); MIROVA (Middle InfraRed Observation of Volcanic Activity), a collaborative project between the Universities of Turin and Florence (Italy) supported by the Centre for Volcanic Risk of the Italian Civil Protection Department (URL: http://www.mirovaweb.it/); Copernicus Browser, Copernicus Data Space Ecosystem, European Space Agency (URL: https://dataspace.copernicus.eu/browser/).
Kanaga (United States) — January 2024 Cite this Report
Kanaga
United States
51.923°N, 177.168°W; summit elev. 1307 m
All times are local (unless otherwise noted)
Small explosion on 18 December 2023
Kanaga lies within the Kanaton caldera at the northern tip of Kanaga Island. The caldera rim forms a 760-m-high arcuate ridge south and east of Kanaga; a lake occupies part of the SE caldera floor. Most of its previous recorded eruptions are poorly documented, although they date back to 1763. Fumarolic activity at Kanaga occurs in a circular, 200-m-wide, 60-m-deep summit crater and produces vapor plumes sometimes seen on clear days from Adak, 50 km to the east. Its most recent eruption occurred in February 2012, which consisted of numerous small earthquakes, a possible weak ash cloud, and gas-and-steam emissions (BGVN 38:03). This report covers a new eruption during December 2023, based on information from the Alaska Volcano Observatory (AVO).
A small explosion was detected in local infrasound and seismic data at 2231 on 18 December, followed by elevated seismicity. No ash emissions were visible in partly cloudy satellite images. On 19 December the Volcano Alert Level (VAL) was raised to Advisory (the second level on a four-level scale) and the Aviation Color Code (ACC) was raised to Yellow (the second color on a four-color scale). The rate of seismicity significantly declined after the 18th, although it remained elevated through 30 December. Small, daily earthquakes occurred during 19-28 December. Satellite observations following the event showed a debris flow extending 1.5 km down the NW flank. Possible minor gas-and-steam emissions were visible in a webcam image on 20 December. Weakly elevated surface temperatures were identified in satellite data during 23-26 December. A series of cracks extending from the inner crater to the upper SE flank and debris deposits on the upper flanks were observed in satellite images on 27 December. AVO reported that these were likely formed during the 18 December event. Local webcam and seismic data were temporarily offline due to a power failure during 4-28 January.
On 28 January connection to the seismic stations and webcams was restored and webcam images showed gas-and-steam emissions at the summit. Occasional earthquakes were also detected each day. A period of weak seismic tremor was observed on 31 January. During February, the number of earthquakes declined. On 27 February AVO lowered the VAL to Normal (the lowest level on a four-level scale) and the ACC to Green (the lowest color on a four-color scale) due to decreased levels of seismicity and no new surface changes or elevated temperatures based on satellite and webcam data.
Geologic Background. Symmetrical Kanaga stratovolcano is situated within the Kanaton caldera at the northern tip of Kanaga Island. The caldera rim forms a 760-m-high arcuate ridge south and east of Kanaga; a lake occupies part of the SE caldera floor. The volume of subaerial dacitic tuff is smaller than would typically be associated with caldera collapse, and deposits of a massive submarine debris avalanche associated with edifice collapse extend nearly 30 km to the NNW. Several fresh lava flows from historical or late prehistorical time descend the flanks of Kanaga, in some cases to the sea. Historical eruptions, most of which are poorly documented, have been recorded since 1763. Kanaga is also noted petrologically for ultramafic inclusions within an outcrop of alkaline basalt SW of the volcano. Fumarolic activity occurs in a circular, 200-m-wide, 60-m-deep summit crater and produces vapor plumes sometimes seen on clear days from Adak, 50 km to the east.
Information Contacts: Alaska Volcano Observatory (AVO), a cooperative program of a) U.S. Geological Survey, 4200 University Drive, Anchorage, AK 99508-4667 USA (URL: https://avo.alaska.edu/), b) Geophysical Institute, University of Alaska, PO Box 757320, Fairbanks, AK 99775-7320, USA, and c) Alaska Division of Geological & Geophysical Surveys, 794 University Ave., Suite 200, Fairbanks, AK 99709, USA (URL: http://dggs.alaska.gov/).
Klyuchevskoy (Russia) — January 2024 Cite this Report
Klyuchevskoy
Russia
56.056°N, 160.642°E; summit elev. 4754 m
All times are local (unless otherwise noted)
New eruption consisting of Strombolian activity, lava flows and fountains, and ash plumes during June-December 2023
Klyuchevskoy, located on the Kamchatka Peninsula, has produced frequent moderate-volume explosive and effusive eruptions and more than 100 flank eruptions have occurred during the past 3,000 years. Eruptions recorded since the late 17th century have resulted in frequent changes to the morphology of the 700-m-wide summit crater. Eruptions over the past 400 years have primarily originated from the summit crater, although numerous major explosive and effusive eruptions have also occurred from flank craters. The previous eruption ended in November 2022 and consisted of Strombolian activity (BGVN 47:12). This report covers a new eruption during June through December 2023, characterized by Strombolian explosions, lava flows, and ash plumes. Information primarily comes from weekly and daily reports from the Kamchatkan Volcanic Eruption Response Team (KVERT) and various satellite data.
KVERT reported that a Strombolian eruption began at 2323 on 22 June. A thermal anomaly was visible in satellite data starting on 22 June (figure 75). As a result, the Aviation Color Code (ACC) was raised to Yellow (the second lowest level on a four-color scale). During 4-6 and 13 July small ash clouds were occasionally observed over the crater. On 19 July a new lava flow began to effuse along the Apakhonchich drainage on the SE flank, which continued through 19 August. Lava fountaining was reported on 21 July in addition to the active lava flow, which continued through 23 August and during 27-30 August. During 22-23 and 27-30 August the lava flow was active along the Apakhonchich drainage on the SE flank.
Similar activity was observed during September. Lava fountaining resumed on 2 September and continued through 31 October. In addition, on 2 September a lava flow began to effuse along the Kozyrevsky drainage on the SW flank. During 3-5 September resuspended ash plumes rose to 3-3.5 km altitude and extended as far as 170 km E by 1940 on 4 September. The ACC was raised to Orange (the third level on a four-color scale) at 1240 on 4 September. The ACC was briefly lowered back to Yellow at 1954 that same day before returning to Orange during 1532-1808 on 5 September due to resuspended ash plumes that rose to 3 km altitude and drifted 120 km E at 1500. KVERT reported that Strombolian activity continued, feeding the lava flows advancing down the Apakhonchichsky and Kozyrevsky drainages through most of the month. During 25 September through 16 October the lava flow was only active in the Apakhonchichisky drainage (figure 76). During 9-12 September resuspended ash plumes rose to 1.5-4 km altitude and extended 550 km E and SE. On 22 September resuspended ash plumes rose to 2-2.5 km altitude and drifted 50-90 km E, which prompted KVERT to raise the ACC to Orange; the ACC was lowered back to Yellow on 24 September. On 29 September phreatic explosions generated ash plumes that rose to 5.2-5.3 km altitude.
Activity during October continued with lava fountains, lava flows, and ash plumes. Strombolian activity with lava fountains continued at the crater and active lava flows alternately descended the Apakhonchichisky and Kozyrevsky drainages on the SE and S flanks (figure 77). During 11-12 October gas-and-steam plumes containing some ash rose to 5.5-6 km altitude and extended as far as 65 km NE and SE. The ACC was raised to Orange on 11 October. According to observers at the Kamchatka Volcanological Station, lava effusion was almost continuous, and incandescent material was ejected as high as 300 m above the crater rim. On 13 October at 1420 an ash plume rose to 5-5.5 km altitude and drifted 90-100 km SE. During 14-16 October gas-and-steam plumes containing some ash rose to 4-6 km altitude and drifted 40-145 km ESE and E. On 16 October lava on the SE flank melted the snow and ice, causing phreatic explosions and large collapses of material from the margins of the flow. At 1500 an ash plume rose to 6.5-7 km altitude and drifted 70 km ENE. On 17 October an ash plume was reported extending 360 km NE. Gray-red ashfall was observed in Klyuchi at 0700; this ash was resuspended from older material.
During 22-31 October phreatic explosions generated ash plumes mainly containing ash from collapses of previously deposited pyroclastic material that rose to 7 km altitude and extended as far as 280 km NE, E, SW, and S on 23 and 29 October the ash plumes rose to 8 km altitude. Ash plumes during 27-29 October rose to 8 km altitude and drifted as far as 300 km SE, ESE, and E. Lava fountains rose up to 500 m above the crater during 27-31 October. Scientists from the Kamchatka Volcanological Station visited the volcano on 28 October and reported that the cinder cone at the summit had grown. They also observed advancing lava on the E flank that extended about 2 km from the summit to 2,700 m elevation, incandescent ejecta 500 m above the crater, and avalanches in the Apakhonchichsky drainage. On 31 October activity intensified, and lava flows were reported moving in the Kretovsky, Kozyrevsky, and Apakhonchichisky drainages on the NW, SW, and SE flanks. At 0930 an ash plume rose to 7 km altitude and at first drifted 169 km SW and then 646 km SE. KVERT reported ash plumes rose to 14 km altitude and extended as far as 1,500 km SSE. The ACC was raised to Red (the highest level on a four-color scale). During 31 October to 1 November ash plumes rose as high as 14 km altitude and drifted as far as 2,255 km ESE.
Activity on 1 November intensified. The lava fountains rose as high as 1 km above the summit (figure 78) and fed the lava flows that were active on the Kretovsky, Kozyrevsky, and Apakhonchichsky drainages on the NW, SW, and SE flanks. Ash plumes rose to 10-14 km altitude and drifted as far as 1,500 km SSE (figure 79). According to the Kamchatka Volcanological Station, observers reported pyroclastic flows descending the flanks. Lahars descended the Studenoy River, blocking the Kozyrevsky-Petropavlovsk federal highway and descended the Krutenkaya River, blocking the road E of Klyuchi. According to news articles the ash plumes caused some flight cancellations and disruptions in the Aleutians, British Columbia (Canada), and along flight paths connecting the Unites States to Japan and South Korea. Ash plumes containing old ash from collapses in the Apakhonchichsky drainage due to phreatic explosions rose to 9.5-9.8 km altitude and drifted 192 km SW at 1400 and to 8.7 km altitude and drifted 192 km SW at 1710 on 1 November.
On 2 November ash plumes rose to 6-14 km altitude; the ash plume that rose to 14 km altitude decreased to 6.5 km altitude and drifted NNE by 2000 and continued to drift more than 3,000 km ESE and E. The ACC was lowered to Orange. On 3 November ash plumes rose to 5-8.2 km altitude and drifted 72-538 km ENE, NNE, and ESE; at 0850 an ash plume rose to 6-6.5 km altitude and drifted more than 3,000 km ESE throughout the day. During 4-6 and 8-10 November resuspended ash plumes associated with collapses of old pyroclastic material from the sides of the Apakhonchichsky drainage due to phreatic explosions rose to 4.5-5.5 km altitude and extended 114-258 km NE, ENE, and E. KVERT reported that the eruption stopped on 5 November and the lava flows had begun to cool. Resuspended ash plumes rose to 5-6 km altitude and drifted 60 km E at 0820 on 13 November and to 5 km and 4.5 km altitude at 1110 and 1430 and drifted 140 km E and 150 km ESE, respectively. On 15 November the ACC was lowered to Green.
Activity was relatively low during most of December. On 27 December Strombolian activity resumed based on a thermal anomaly visible in satellite data. On 30 December an ash plume rose to 6 km altitude and extended 195 km NW. The ACC was raised to Orange. On 31 December video and satellite data showed explosions that generated ash plumes that rose to 5-6.5 km altitude and drifted 50-230 km WNW and NW. Though a thermal anomaly persisted through 1 January 2024, no explosions were detected, so the ACC was lowered to Yellow.
Satellite data. Thermal activity was strong throughout the reporting period due to frequent lava fountaining and lava flows. MODIS thermal anomaly data provided through MIROVA (Middle InfraRed Observation of Volcanic Activity) showed strong activity during the entire reporting period, resulting from lava fountaining and lava flows (figure 80). According to data from MODVOLC thermal alerts, a total of 336 hotspots were detected in June (3), July (30), August (11), September (52), October (217), and November (23). Thermal activity was also visible in infrared satellite images, often showing a strong thermal anomaly at the summit crater and a lava flow affecting primarily the SE and SW flanks (figure 81).
Geologic Background. Klyuchevskoy is the highest and most active volcano on the Kamchatka Peninsula. Since its origin about 6,000 years ago, this symmetrical, basaltic stratovolcano has produced frequent moderate-volume explosive and effusive eruptions without major periods of inactivity. It rises above a saddle NE of Kamen volcano and lies SE of the broad Ushkovsky massif. More than 100 flank eruptions have occurred during approximately the past 3,000 years, with most lateral craters and cones occurring along radial fissures between the unconfined NE-to-SE flanks of the conical volcano between 500 and 3,600 m elevation. Eruptions recorded since the late 17th century have resulted in frequent changes to the morphology of the 700-m-wide summit crater. These eruptions over the past 400 years have originated primarily from the summit crater, but have also included numerous major explosive and effusive eruptions from flank craters.
Information Contacts: Kamchatka Volcanic Eruptions Response Team (KVERT), Far Eastern Branch, Russian Academy of Sciences, 9 Piip Blvd., Petropavlovsk-Kamchatsky, 683006, Russia (URL: http://www.kscnet.ru/ivs/kvert/); Kamchatka Volcanological Station, Kamchatka Branch of Geophysical Survey, (KB GS RAS), Klyuchi, Kamchatka Krai, Russia (URL: http://volkstat.ru/); MIROVA (Middle InfraRed Observation of Volcanic Activity), a collaborative project between the Universities of Turin and Florence (Italy) supported by the Centre for Volcanic Risk of the Italian Civil Protection Department (URL: http://www.mirovaweb.it/); Hawai'i Institute of Geophysics and Planetology (HIGP) - MODVOLC Thermal Alerts System, School of Ocean and Earth Science and Technology (SOEST), Univ. of Hawai'i, 2525 Correa Road, Honolulu, HI 96822, USA (URL: http://modis.higp.hawaii.edu/); Copernicus Browser, Copernicus Data Space Ecosystem, European Space Agency (URL: https://dataspace.copernicus.eu/browser/).
Agung (Indonesia) — January 2024 Cite this Report
Agung
Indonesia
8.343°S, 115.508°E; summit elev. 2997 m
All times are local (unless otherwise noted)
Three eruptive events reported in April, May, and December 2022
Mount Agung, located on the E end of the island of Bali, Indonesia, rises above the SE rim of the Batur caldera. The summit area extends 1.5 km E-W, with the highest point on the W and a steep-walled 800-m-wide crater on the E. Recorded eruptions date back to the early 19th century. A large and deadly explosive and effusive eruption occurred during 1963-64, which was characterized by voluminous ashfall, pyroclastic flows, and lahars that caused extensive damage and many fatalities. More recent activity was documented during November 2017-June 2019 that consisted of multiple explosions, significant ash plumes, lava flows at the summit crater, and incandescent ejecta. This report covers activity reported during April-May 2022 and December 2022 based on data from the Darwin Volcanic Ash Advisory Center (VAAC).
Activity during 2022 was relatively low and mainly consisted of a few ash plumes during April-May and December. An ash plume on 3 April rising to 3.7 km altitude (700 m above the summit) and drifting N was reported in a Darwin VAAC notice based on a ground report, with ash seen in HIMAWARI-8 visible imagery. Another ash plume was reported at 1120 on 27 May that rose to 5.5 km altitude (2.5 m above the summit); the plume was not visible in satellite or webcam images due to weather clouds. An eruption was reported based on seismic data at 0840 on 13 December, with an estimated plume altitude of 3.7 km; however, no ash was seen using satellite imagery in clear conditions before weather clouds obscured the summit.
Geologic Background. Symmetrical Agung stratovolcano, Bali's highest and most sacred mountain, towers over the eastern end of the island. The volcano, whose name means "Paramount," rises above the SE rim of the Batur caldera, and the northern and southern flanks extend to the coast. The summit area extends 1.5 km E-W, with the high point on the W and a steep-walled 800-m-wide crater on the E. The Pawon cone is located low on the SE flank. Only a few eruptions dating back to the early 19th century have been recorded in historical time. The 1963-64 eruption, one of the largest in the 20th century, produced voluminous ashfall along with devastating pyroclastic flows and lahars that caused extensive damage and many fatalities.
Information Contacts: Darwin Volcanic Ash Advisory Centre (VAAC), Bureau of Meteorology, Northern Territory Regional Office, PO Box 40050, Casuarina, NT 0811, Australia (URL: http://www.bom.gov.au/info/vaac/).
Saunders (United Kingdom) — February 2024 Cite this Report
Saunders
United Kingdom
57.8°S, 26.483°W; summit elev. 843 m
All times are local (unless otherwise noted)
Persistent thermal anomalies from the summit crater lava lake during February 2023-January 2024
Saunders is one of eleven islands that comprise the South Sandwich Islands in the South Atlantic. The active Mount Michael volcano has been in almost continuous eruption since November 2014 (BGVN 48:02). Recent activity has resulted in intermittent thermal anomalies and gas-and-steam emissions (BGVN 47:03, 48:02). Visits are infrequent due to its remote location, and cloud cover often prevents satellite observations. Satellite thermal imagery and visual observation of incandescence during a research expedition in 2019 (BGVN 28:02 and 44:08) and a finding confirmed by a National Geographic Society research team that summited Michael in November 2022 reported the presence of a lava lake.
Although nearly constant cloud cover during February 2023 through January 2024 greatly limited satellite observations, thermal anomalies from the lava lake in the summit crater were detected on clear days, especially around 20-23 August 2023. Anomalies similar to previous years (eg. BGVN 48:02) were seen in both MIROVA (Middle InfraRed Observation of Volcanic Activity) data from MODIS instruments and in Sentinel 2 infrared imagery. The only notable sulfur dioxide plume detected near Saunders was on 25 September 2023, with the TROPOMI instrument aboard the Sentinel-5P satellite.
Geologic Background. Saunders Island consists of a large central volcanic edifice intersected by two seamount chains, as shown by bathymetric mapping (Leat et al., 2013). The young Mount Michael stratovolcano dominates the glacier-covered island, while two submarine plateaus, Harpers Bank and Saunders Bank, extend north. The symmetrical Michael has a 500-m-wide summit crater and a remnant of a somma rim to the SE. Tephra layers visible in ice cliffs surrounding the island are evidence of recent eruptions. Ash clouds were reported from the summit crater in 1819, and an effusive eruption was inferred to have occurred from a N-flank fissure around the end of the 19th century and beginning of the 20th century. A low ice-free lava platform, Blackstone Plain, is located on the north coast, surrounding a group of former sea stacks. A cluster of cones on the SE flank, the Ashen Hills, appear to have been modified since 1820 (LeMasurier and Thomson, 1990). Analysis of satellite imagery available since 1989 (Gray et al., 2019; MODVOLC) suggests frequent eruptive activity (when weather conditions allow), volcanic clouds, steam plumes, and thermal anomalies indicative of a persistent, or at least frequently active, lava lake in the summit crater. Due to this observational bias, there has been a presumption when defining eruptive periods that activity has been ongoing unless there is no evidence for at least 10 months.
Information Contacts: MIROVA (Middle InfraRed Observation of Volcanic Activity), a collaborative project between the Universities of Turin and Florence (Italy) supported by the Centre for Volcanic Risk of the Italian Civil Protection Department (URL: http://www.mirovaweb.it/); NASA Global Sulfur Dioxide Monitoring Page, Atmospheric Chemistry and Dynamics Laboratory, NASA Goddard Space Flight Center (NASA/GSFC), 8800 Greenbelt Road, Goddard MD 20771, USA (URL: https://so2.gsfc.nasa.gov/); Copernicus Browser (URL: https://dataspace.copernicus.eu/browser).
Tengger Caldera (Indonesia) — February 2024 Cite this Report
Tengger Caldera
Indonesia
7.942°S, 112.95°E; summit elev. 2329 m
All times are local (unless otherwise noted)
Minor ash emission in December 2023; persistent weak thermal anomaly in the Bromo crater
Tengger Caldera, located at the N end of a volcanic massif in Indonesia’s East Java, consists of five overlapping stratovolcanoes. The youngest and only active cone in the 16-km-wide caldera is Bromo, which typically produces gas-and-steam plumes, occasional ash plumes and explosions, and weak thermal signals (BGVN 44:05, 47:01). This report covers activity during January 2022-December 2023, consisting of mostly white gas-and-steam emissions and persistent weak thermal anomalies. Information was provided by the Pusat Vulkanologi dan Mitigasi Bencana Geologi (PVMBG, also known as Indonesian Center for Volcanology and Geological Hazard Mitigation, CVGHM) and satellite imagery. The Alert Level remained at 2 (on a scale of 1-4), and visitors were warned to stay at least 1 km from the crater.
Activity was generally low during the reporting period, similar to that in 2021. According to almost daily images from MAGMA Indonesia (a platform developed by PVMBG), white emissions and plumes rose from 50 to 900 m above the main crater during this period (figure 24). During several days in March and June 2022, white plumes reached heights of 1-1.2 km above the crater.
After an increase in activity at 2114 on 3 February 2023, a PVMBG team that was sent to observe white emissions rising as high as 300 m during 9-12 February and heard rumbling noises. A sulfur dioxide odor was also strong near the crater and measurements indicated that levels were above the healthy (non-hazardous) threshold of 5 parts per million; differential optical absorption spectroscopy (DOAS) measurements indicated an average flux of 190 metric tons per day on 11 February. Incandescence originating from a large fumarole in the NNW part of the crater was visible at night. The team observed that vegetation on the E caldera wall was yellow and withered. The seismic network recorded continuous tremor and deep and shallow volcanic earthquakes.
According to a PVMBG press release, activity increased on 13 December 2023 with white, gray, and brown emissions rising as high as 900 m above Bromo’s crater rim and drifting in multiple directions (figure 25). The report noted that tremor was continuous and was accompanied in December by three volcanic earthquakes. Deformation data indicated inflation in December. There was no observable difference in the persistent thermal anomaly in the crater between 11 and 16 December 2023.
All clear views of the Bromo crater throughout this time, using Sentinel-2 infrared satellite images, showed a weak persistent thermal anomaly; none of the anomalies were strong enough to cause MODVOLC Thermal Alerts. A fire in the SE part of the caldera in early September 2023 resulted in a brief period of strong thermal anomalies.
Geologic Background. The 16-km-wide Tengger caldera is located at the northern end of a volcanic massif extending from Semeru volcano. The massive volcanic complex dates back to about 820,000 years ago and consists of five overlapping stratovolcanoes, each truncated by a caldera. Lava domes, pyroclastic cones, and a maar occupy the flanks of the massif. The Ngadisari caldera at the NE end of the complex formed about 150,000 years ago and is now drained through the Sapikerep valley. The most recent of the calderas is the 9 x 10 km wide Sandsea caldera at the SW end of the complex, which formed incrementally during the late Pleistocene and early Holocene. An overlapping cluster of post-caldera cones was constructed on the floor of the Sandsea caldera within the past several thousand years. The youngest of these is Bromo, one of Java's most active and most frequently visited volcanoes.
Information Contacts: Pusat Vulkanologi dan Mitigasi Bencana Geologi (PVMBG, also known as Indonesian Center for Volcanology and Geological Hazard Mitigation, CVGHM), Jalan Diponegoro 57, Bandung 40122, Indonesia (URL: http://www.vsi.esdm.go.id/); MAGMA Indonesia, Kementerian Energi dan Sumber Daya Mineral (URL: https://magma.esdm.go.id/v1); Copernicus Browser, Copernicus Data Space Ecosystem, European Space Agency (URL: https://dataspace.copernicus.eu/browser/); Hawai'i Institute of Geophysics and Planetology (HIGP) - MODVOLC Thermal Alerts System, School of Ocean and Earth Science and Technology (SOEST), Univ. of Hawai'i, 2525 Correa Road, Honolulu, HI 96822, USA (URL: http://modis.higp.hawaii.edu/).
Shishaldin (United States) — December 2023 Cite this Report
Shishaldin
United States
54.756°N, 163.97°W; summit elev. 2857 m
All times are local (unless otherwise noted)
New eruption with significant Strombolian explosions, ash plumes, and ashfall
Shishaldin is located on the eastern half of Unimak Island, one of the Aleutian Islands. Frequent explosive activity, primarily consisting of Strombolian ash eruptions from the small summit crater, but sometimes producing lava flows, has been recorded since the 18th century. The previous eruption ended in May 2020 and was characterized by intermittent thermal activity, increased seismicity and surface temperatures, ash plumes, and ash deposits (BGVN 45:06). This report covers a new eruption during July through November 2023, which consisted of significant explosions, ash plumes, ashfall, and lava fountaining. Information comes from daily, weekly, and special reports from the Alaska Volcano Observatory (AVO) and various satellite data. AVO monitors the volcano using local seismic and infrasound sensors, satellite data, web cameras, and remote infrasound and lightning networks.
AVO reported that intermittent tremor and low-frequency earthquakes had gradually become more regular and consistent during 10-13 July. Strongly elevated surface temperatures at the summit were identified in satellite images during 10-13 July. On 11 July AVO raised the Aviation Color Code (ACC) to Yellow (the second color on a four-color scale) and Volcano Alert Level (VAL) to Advisory (the second level on a four-level scale) at 1439. Later in the day on 11 July summit crater incandescence was observed in webcam images. Observations of the summit suggested that lava was likely present at the crater, which prompted AVO to raise the ACC to Orange (the second highest color on a four-color scale) and the VAL to Watch (the second highest level on a four-level scale). The US Coast Guard conducted an overflight on 12 July and confirmed that lava was erupting from the summit. That same day, sulfur dioxide emissions were detected in satellite images.
A significant explosion began at 0109 on 14 July that produced an ash plume that rose to 9-12 km altitude and drifted S over the Pacific Ocean (figure 43). Webcam images and photos taken around 0700 from a ship SW off Unimak Island showed small lahar deposits, which were the result of the interaction of hot pyroclastic material and snow and ice on the flanks. There was also ashfall on the SW and N flanks. A smaller explosion at 0710 generated an ash plume that rose to 4.5 km altitude. Webcam images and pilot reports showed continued low-level ash emissions during the morning, rising to less than 4.6 km altitude; those emissions included a small ash plume near the summit around 1030 resulting from a small explosion.
Seismic tremor amplitude began increasing at around 1700 on 15 July; strongly elevated surface temperatures were also reported. An ash plume rose to 4.6 km altitude and drifted SSE at 2100, based on a satellite image. A continuous ash plume during 2150 through 2330 rose to 5 km altitude and extended 125 km S. At 2357 AVO raised the ACC to Red (the highest color on a four-color scale) and the VAL to Warning (the highest level on a four-level scale), noting that seismicity remained elevated for more than six hours and explosion signals were frequently detected by regional infrasound (pressure sensor) networks. Explosions generated an ash plume that rose to 4.9 km altitude and drifted as far as 500 km SE. Activity throughout the night declined and by 0735 the ACC was lowered to Orange and the VAL to Watch. High-resolution satellite images taken on 16 July showed pyroclastic deposits extending as far as 3 km from the vent; these deposits generated lahars that extended further down the drainages on the flanks. Ash deposits were mainly observed on the SSE flank and extended to the shore of Unimak Island. During 16-17 July lava continued to erupt at the summit, which caused strongly elevated surface temperatures that were visible in satellite imagery.
Lava effusion increased at 0100 on 18 July, as noted in elevated surface temperatures identified in satellite data, increasing seismic tremor, and activity detected on regional infrasound arrays. A significant ash plume at 0700 rose to 7 km altitude and continued until 0830, eventually reaching 9.1 km altitude and drifting SSE (figure 44). As a result, the ACC was raised to Red and the VAL to Warning. By 0930 the main plume detached, but residual low-level ash emissions continued for several hours, remaining below 3 km altitude and drifting S. The eruption gradually declined and by 1208 the ACC was lowered to Orange and the VAL was lowered to Watch. High-resolution satellite images showed ash deposits on the SW flank and pyroclastic deposits on the N, E, and S flanks, extending as far as 3 km from the vent; lahars triggered by the eruption extended farther down the flanks (figure 45). Lava continued to erupt from the summit crater on 19 July.
Elevated surface temperatures were detected in satellite images during 19-25 July, despite occasional weather cloud cover, which was consistent with increased lava effusion. During 22-23 July satellite observations acquired after the eruption from 18 July showed pyroclastic flow and lahar deposits extending as far as 3 km down the N, NW, and NE flanks and as far as 1.5 km down the S and SE flanks. Ash deposits covered the SW and NE flanks. No lava flows were observed outside the crater. On 22 July a sulfur dioxide plume was detected in satellite data midday that had an estimated mass of 10 kt. In a special notice issued at 1653 on 22 July AVO noted that eruptive activity had intensified over the previous six hours, which was characterized by an hours-long steady increase in seismic tremor, intermittent infrasound signals consistent with small explosions, and an increase in surface temperatures that were visible in satellite data. Pilots first reported low-level ash plumes at around 1900. At 2320 an ash plume had risen to 9 km altitude based on additional pilot reports and satellite images. The ACC was increased to Red and the VAL to Warning at 2343. Satellite images indicated growth of a significantly higher ash plume that rose to 11 km altitude continued until 0030 and drifted NE. During the early morning hours of 23 July ash plumes had declined to 4.6 k altitude. Seismic tremor peaked at 0030 on 23 July and began to rapidly decline at 0109; active ash emissions were no longer visible in satellite data by 0130. The ACC was lowered to Orange and the VAL to Watch at 0418; bursts of increased seismicity were recorded throughout the morning, but seismicity generally remained at low levels. Elevated surface temperatures were visible in satellite data until about 0600. On 24 July pilots reported seeing vigorous gas-and-steam plumes rising to about 3 km altitude; the plumes may have contained minor amounts of ash.
During 24-25 July low level seismicity and volcanic tremor were detected at low levels following the previous explosion on 23 July. Strongly elevated surface temperatures were observed at the summit crater in satellite data. Around 2200 on 25 July seismicity began to increase, followed by infrasound signals of explosions after 0200 on 26 July. An ash plume rose to 3 km altitude at 0500 and drifted ENE, along with an associated sulfur dioxide plume that drifted NE and had an estimated mass of 22 kt. Diffuse ash emissions were visible in satellite data and rose to 6.1-7.6 km altitude and extended 125 km from the volcano starting around 1130. These ash events were preceded by about seven hours of seismic tremor, infrasound detections of explosions, and five hours of increased surface temperatures visible in satellite data. Activity began to decline around 1327, which included low-frequency earthquakes and decreased volcanic tremor, and infrasound data no longer detected significant explosions. Surface temperatures remained elevated through the end of the month.
Seismicity, volcanic tremor, and ash emissions remained at low levels during early August. Satellite images on 1 August showed that some slumping had occurred on the E crater wall due to the recent explosive activity. Elevated surface temperatures continued, which was consistent with cooling lava. On 2 August small explosive events were detected, consistent with low-level Strombolian activity. Some episodes of volcanic tremor were reported, which reflected low-level ash emissions. Those ash emissions rose to less than 3 km altitude and drifted as far as 92.6 km N. Pilots that were located N of the volcano observed an ash plume that rose to 2.7 km altitude. Seismicity began to increase in intensity around 0900 on 3 August. Seismicity continued to increase throughout the day and through the night with strongly elevated surface temperatures, which suggested that lava was active at the surface.
An ash cloud that rose to 7.6-7.9 km altitude and drifted 60-75 km NE was visible in a satellite image at 0520 on 4 August. Pilots saw and reported the plume at 0836 (figure 46). By 0900 the plume had risen to 9.1 km altitude and extended over 100 km NE. AVO raised the ACC to Red and the VAL to Warning as a result. Seismic tremor levels peaked at 1400 and then sharply declined at 1500 to slightly elevated levels; the plume was sustained during the period of high tremor and drifted N and NE. The ACC was lowered to Orange and the VAL to Watch at 2055. During 5-14 August seismicity remained low and surface temperatures were elevated based on satellite data due to cooling lava. On 9 August a small lava flow was observed that extended from the crater rim to the upper NE flank. It had advanced to 55 m in length and appeared in satellite imagery on 11 August. Occasional gas-and-steam plumes were noted in webcam images. At 1827 AVO noted that seismic tremor had steadily increased during the afternoon and erupting lava was visible at the summit in satellite images.
Strong explosion signals were detected at 0200 on 15 August. An ash cloud that was visible in satellite data extended 100 km NE and may have risen as high as 11 km altitude around 0240. By 0335 satellite images showed the ash cloud rising to 7.6 km altitude and drifting NE. Significant seismicity and explosions were detected by the local AVO seismic and infrasound networks, and volcanic lightning was detected by the World Wide Lightning Location Network (WWLLN). A sulfur dioxide plume associated with the eruption drifted over the S Bering Sea and parts of Alaska and western Canada. Seismicity was significantly elevated during the eruption but had declined by 1322. A pilot reported that ash emissions continued, rising as high as 4.9 km altitude. Elevated surface temperatures detected in satellite data were caused by hot, eruptive material (pyroclastic debris and lava) that accumulated around the summit. Eruptive activity declined by 16 August and the associated sulfur dioxide plume had mostly dissipated; remnants continued to be identified in satellite images at least through 18 August. Surface temperatures remained elevated based on satellite images, indicating hot material on the upper parts of the volcano. Small explosions were detected in infrasound data on the morning of 19 August and were consistent with pilot reports of small, short-lived ash plumes that rose to about 4.3 km altitude. Low-level explosive activity was reported during 20-24 August, according to seismic and infrasound data, and weather clouds sometimes prevented views. Elevated surface temperatures were observed in satellite images, which indicated continued hot material on the upper parts of the volcano.
Seismic tremor began to increase at around 0300 on 25 August and was followed by elevated surface temperatures identified in satellite images, consistent with erupting lava. Small explosions were recorded in infrasound data. The ACC was raised to Red and the VAL to Warning at 1204 after a pilot reported an ash plume that rose to 9.1 km altitude. Seismicity peaked at 1630 and began to rapidly decline at around 1730. Ash plumes rose as high as 10 km altitude and drifted as far as 400 km NE. By 2020 the ash plumes had declined to 6.4 km altitude and continued to drift NE. Ash emissions were visible in satellite data until 0000 on 26 August and seismicity was at low levels. AVO lowered the ACC to Orange and the VAL to Watch at 0030. Minor explosive activity within the summit crater was detected during 26-28 August and strongly elevated surface temperatures were still visible in satellite imagery through the rest of the month. An AVO field crew working on Unimak Island observed a mass flow that descended the upper flanks beginning around 1720 on 27 August. The flow produced a short-lived ash cloud that rose to 4.5 km altitude and rapidly dissipated. The mass flow was likely caused by the collapse of spatter that accumulated on the summit crater rim.
Similar variable explosive activity was reported in September, although weather observations sometimes prevented observations. A moderate resolution satellite image from the afternoon of 1 September showed gas-and-steam emissions filling the summit crater and obscuring views of the vent. In addition, hot deposits from the previous 25-26 August explosive event were visible on the NE flank near the summit, based on a 1 September satellite image. On 2 and 4 September seismic and infrasound data showed signals of small, repetitive explosions. Variable gas-and-steam emissions from the summit were visible but there was no evidence of ash. Possible summit crater incandescence was visible in nighttime webcam images during 3-4 September.
Seismicity began to gradually increase at around 0300 on 5 September and activity escalated at around 0830. A pilot reported an ash plume that rose to 7.6 km altitude at 0842 and continued to rise as high as possibly 9.7 km altitude and drifted SSE based on satellite images (figure 47). The ACC was raised to Red and the VAL to Warning at 0900. In addition to strong tremor and sustained explosions, the eruption produced volcanic lightning that was detected by the WWLLN. Around 1100 seismicity decreased and satellite data confirmed that the altitude of the ash emissions had declined to 7.6 km altitude. By 1200 the lower-altitude portion of the ash plume had drifted 125 km E. Significant ash emissions ended by 1330 based on webcam images. The ACC was lowered to Orange and the VAL to Watch at 1440. Satellite images showed extensive pyroclastic debris flows on most of the flanks that extended 1.2-3.3 km from the crater rim.
During 6-13 September elevated surface temperatures continued to be observed in satellite data, seismicity remained elevated with weak but steady tremor, and small, low-frequency earthquakes and small explosions were reported, except on 12 September. On 6 September a low-level ash plume rose to 1.5-1.8 km altitude and drifted SSE. Occasional small and diffuse gas-and-steam emissions at the summit were visible in webcam images. Around 1800 on 13 September seismic tremor amplitudes began to increase, and small explosions were detected in seismic and infrasound data. Incandescent lava at the summit was seen in a webcam image taken at 0134 on 14 September during a period of elevated tremor. No ash emissions were reported during the period of elevated seismicity. Lava fountaining began around 0200, based on webcam images. Satellite-based radar observations showed that the lava fountaining activity led to the growth of a cone in the summit crater, which refilled most of the crater. By 0730 seismicity significantly declined and remained at low levels.
Seismic tremor began to increase around 0900 on 15 September and rapidly intensified. An explosive eruption began at around 1710, which prompted AVO to raise the ACC to Red and the VAL to Warning. Within about 30 minutes ash plumes drifted E below a weather cloud at 8.2 km altitude. The National Weather Service estimated that an ash-rich plume rose as high as 12.8 km altitude and produced volcanic lightning. The upper part of the ash plume detached from the vent around 1830 and drifted E, and was observed over the Gulf of Alaska. Around the same time, seismicity dramatically decreased. Trace ashfall was reported in the community of False Pass (38 km ENE) between 1800-2030 and also in King Cove and nearby marine waters. Activity declined at around 1830 although seismicity remained elevated, ash emissions, and ashfall continued until 2100. Lightning was again detected beginning around 1930, which suggested that ash emissions continued. Ongoing explosions were detected in infrasound data, at a lower level than during the most energetic phase of this event. Lightning was last detected at 2048. By 2124 the intensity of the eruption had decreased, and ash emissions were likely rising to less than 6.7 km altitude. Seismicity returned to pre-eruption levels. On 16 September the ACC was lowered to Orange and the VAL to Watch at 1244; the sulfur dioxide plume that was emitted from the previous eruption event was still visible over the northern Pacific Ocean. Elevated surface temperatures, gas-and-steam emissions from the vent, and new, small lahars were reported on the upper flanks based on satellite and webcam images. Minor deposits were reported on the flanks which were likely the result of collapse of previously accumulated lava near the summit crater.
Elevated seismicity with tremor, small earthquakes, and elevated surface temperatures were detected during 17-23 September. Minor gas-and-steam emissions were visible in webcam images. On 20 September small volcanic debris flows were reported on the upper flanks. On 21 September a small ash deposit was observed on the upper flanks extending to the NE based on webcam images. Seismic tremor increased significantly during 22-23 September. Regional infrasound sensors suggested that low-level eruptive activity was occurring within the summit crater by around 1800 on 23 September. Even though seismicity was at high levels, strongly elevated surface temperatures indicating lava at the surface were absent and no ash emissions were detected; weather clouds at 0.6-4.6 km altitude obscured views. At 0025 on 24 September AVO noted that seismicity continued at high levels and nearly continuous small infrasound signals began, likely from low-level eruptive activity. Strongly elevated surface temperatures were identified in satellite images by 0900 and persisted throughout the day; the higher temperatures along with infrasound and seismic data were consistent with lava erupting at the summit. Around 1700 similarly elevated surface temperatures were detected from the summit in satellite data, which suggested that more vigorous lava fountaining had started. Starting around 1800 low-level ash emissions rose to altitudes less than 4.6 km altitude and quickly dissipated.
Beginning at midnight on 25 September, a series of seismic signals consistent with volcanic flows were recorded on the N side of the volcano. A change in seismicity and infrasound signals occurred around 0535 and at 0540 a significant ash cloud formed and quickly reached 14 km altitude and drifted E along the Alaska Peninsula. The cloud generated at least 150 lightning strokes with thunder that could be heard by people in False Pass. Seismicity rapidly declined to near background levels around 0600. AVO increased the ACC to Red and the VAL to Warning at 0602. The ash cloud detached from the volcano at around 0700, rose to 11.6 km altitude, and drifted ESE. Trace to minor amounts of ashfall were reported by the communities of False Pass, King Cove, Cold Bay, and Sand Point around 0700. Ash emissions continued at lower altitudes of 6-7.6 km altitude at 0820. Small explosions at the vent area continued to be detected in infrasound data and likely represented low-level eruptive activity near the vent. Due to the significant decrease in seismicity and ash emissions the ACC was lowered to Orange and the VAL to Watch at 1234. Radar data showed significant collapses of the crater that occurred on 25 September. Satellite data also showed significant hot, degassing pyroclastic and lahar deposits on all flanks, including more extensive flows on the ENE and WSW sections below two new collapse scarps. Following the significant activity during 24-25 September, only low-level activity was observed. Seismicity decreased notably near the end of the strong activity on 25 September and continued to decrease through the end of the month, though tremor and small earthquakes were still reported. No explosive activity was detected in infrasound data through 2 October. Gas-and-steam emissions rose to 3.7 km altitude, as reported by pilots and seen in satellite images. Satellite data from 26 September showed that significant collapses had occurred at the summit crater and hot, steaming deposits from pyroclastic flows and lahars were present on all the flanks, particularly to the ENE and WSW. A small ash cloud was visible in webcam images on 27 September, likely from a collapse at the summit cone. High elevated surface temperatures were observed in satellite imagery during 27-28 September, which were likely the result of hot deposits on the flanks erupted on 25 September. Minor steaming at the summit crater and from an area on the upper flanks was visible in webcam images on 28 September.
During October, explosion events continued between periods of low activity. Seismicity significantly increased starting at around 2100 on 2 October; around the same time satellite images showed an increase in surface temperatures consistent with lava fountaining. Small, hot avalanches of rock and lava descended an unspecified flank. In addition, a distinct increase in infrasound, seismicity, and lightning detections was followed by an ash plume that rose to 12.2 km altitude and drifted S and E at 0520 on 3 October, based on satellite images. Nighttime webcam images showed incandescence due to lava fountaining at the summit and pyroclastic flows descending the NE flank. AVO reported that a notable explosive eruption started at 0547 and lasted until 0900 on 3 October, which prompted a rise in the ACC to Red and the VAL to Warning. Subsequent ash plumes rose to 6-7.6 km altitude by 0931. At 1036 the ACC was lowered back to Orange and the VAL to Watch since both seismic and infrasound data quieted substantially and were slightly above background levels. Gas-and-steam emissions were observed at the summit, based on webcam images. Trace amounts of ashfall were observed in Cold Bay. Resuspended ash was present at several kilometers altitude near the volcano. During the afternoon, low-level ash plumes were visible at the flanks, which appeared to be largely generated by rock avalanches off the summit crater following the explosive activity. These ash plumes rose to 3 km altitude and drifted W. Trace amounts of ashfall were reported by observers in Cold Bay and Unalaska and flights to these communities were disrupted by the ash cloud. Satellite images taken after the eruption showed evidence of pyroclastic flows and lahar deposits in drainages 2 km down the SW flank and about 3.2 km down the NE flank, and continued erosion of the crater rim. Small explosion craters at the end of the pyroclastic flows on the NE flank were noted for the first time, which may have resulted from gas-and-steam explosions when hot deposits interact with underlying ice.
During 4 October seismicity, including frequent small earthquakes, remained elevated, but was gradually declining. Ash plumes were produced for over eight hours until around 1400 that rose to below 3.7 km altitude. These ash plumes were primarily generated off the sides of the volcano where hot rock avalanches from the crater rim had entered drainages to the SW and NE. Two explosion craters were observed at the base of the NE deposits about 3.2 km from the crater rim. Webcam images showed the explosion craters were a source of persistent ash emissions; occasional collapse events also generated ash. Seismicity remained elevated with sulfur dioxide emissions that had a daily average of more than 1,000 tons per day, and frequent small earthquakes through the end of the month. Frequent elevated surface temperatures were identified in satellite images and gas-and-steam plumes were observed in webcam images, although weather conditions occasionally prevented clear views of the summit. Emissions were robust during 14-16 October and were likely generated by the interaction of hot material and snow and ice. During the afternoon of 21 October a strong gas-and-steam plume rose to 3-4.6 km altitude and extended 40 km WSW, based on satellite images and reports from pilots. On 31 October the ACC was lowered to Yellow and the VAL was lowered to Advisory.
Activity in November was characterized by elevated seismicity with ongoing seismic tremor and small, low-frequency earthquakes, elevated surface temperatures, and gas-and-steam emissions. There was an increase in seismic and infrasound tremor amplitudes starting at 1940 on 2 November. As a result, the ACC was again raised to Orange and the VAL was increased to Watch, although ash was not identified in satellite data. An ash cloud rose to 6.1 km altitude and drifted W according to satellite data at 2000. By 0831 on 3 November ash emissions were no longer visible in satellite images. On 6 and 9 November air pressure sensors detected signals consistent with small explosions. Small explosions were detected in infrasound data consistent with weak Strombolian activity on 19 and 21 November. Seismicity started to decrease on 21 November. On 25 November gas-and-steam emissions were emitted from the vent as well as from a scarp on the NE side of the volcano near the summit. A gas-and-steam plume extended about 50 km SSE and was observed in satellite and webcam images on 26 November. On 28 November small explosions were observed in seismic and local infrasound data and gas-and-steam emissions were visible from the summit and from the upper NE collapse scarp based on webcam images. Possible small explosions were observed in infrasound data on 30 November. Weakly elevated surface temperatures and a persistent gas-and-steam plume from the summit and collapse scarps on the upper flanks. A passing aircraft reported the gas-and-steam plume rose to 3-3.4 km altitude on 30 November, but no significant ash emissions were detected.
Satellite data. MODIS thermal anomaly data provided through MIROVA (Middle InfraRed Observation of Volcanic Activity) showed a strong pulse of thermal activity beginning in July 2023 that continued through November 2023 (figure 48). This strong activity was due to Strombolian explosions and lava fountaining events at the summit crater. According to data from MODVOLC thermal alerts, a total of 101 hotspots were detected near the summit crater in July (11-14, 16-19, 23-24 and 26), August (4, 25-26, and 29), September (5, 12, and 17), and October (3, 4, and 8). Infrared satellite data showed large lava flows descending primarily the northern and SE flanks during the reporting period (figure 49). Sulfur dioxide plumes often exceeded two Dobson Units (DUs) and drifted in different directions throughout the reporting period, based on satellite data from the TROPOMI instrument on the Sentinel-5P satellite (figure 50).
Geologic Background. The symmetrical glacier-covered Shishaldin in the Aleutian Islands is the westernmost of three large stratovolcanoes in the eastern half of Unimak Island. The Aleuts named the volcano Sisquk, meaning "mountain which points the way when I am lost." Constructed atop an older glacially dissected edifice, it is largely basaltic in composition. Remnants of an older edifice are exposed on the W and NE sides at 1,500-1,800 m elevation. There are over two dozen pyroclastic cones on its NW flank, which is covered by massive aa lava flows. Frequent explosive activity, primarily consisting of Strombolian ash eruptions from the small summit crater, but sometimes producing lava flows, has been recorded since the 18th century. A steam plume often rises from the summit crater.
Information Contacts: Alaska Volcano Observatory (AVO), a cooperative program of a) U.S. Geological Survey, 4200 University Drive, Anchorage, AK 99508-4667 USA (URL: https://avo.alaska.edu/), b) Geophysical Institute, University of Alaska, PO Box 757320, Fairbanks, AK 99775-7320, USA, and c) Alaska Division of Geological & Geophysical Surveys, 794 University Ave., Suite 200, Fairbanks, AK 99709, USA (URL: http://dggs.alaska.gov/); MIROVA (Middle InfraRed Observation of Volcanic Activity), a collaborative project between the Universities of Turin and Florence (Italy) supported by the Centre for Volcanic Risk of the Italian Civil Protection Department (URL: http://www.mirovaweb.it/); Hawai'i Institute of Geophysics and Planetology (HIGP) - MODVOLC Thermal Alerts System, School of Ocean and Earth Science and Technology (SOEST), Univ. of Hawai'i, 2525 Correa Road, Honolulu, HI 96822, USA (URL: http://modis.higp.hawaii.edu/); NASA Global Sulfur Dioxide Monitoring Page, Atmospheric Chemistry and Dynamics Laboratory, NASA Goddard Space Flight Center (NASA/GSFC), 8800 Greenbelt Road, Goddard, Maryland, USA (URL: https://so2.gsfc.nasa.gov/); Copernicus Browser, Copernicus Data Space Ecosystem, European Space Agency (URL: https://dataspace.copernicus.eu/browser/).
Ioto
Japan
24.751°N, 141.289°E; summit elev. 169 m
All times are local (unless otherwise noted)
New eruption with discolored water, ejecta, and floating pumice during October-December 2023
Ioto (Iwo-jima), located about 1,200 km S of Tokyo, lies within a 9-km-wide submarine caldera along the Izu-Bonin-Mariana volcanic arc. Previous eruptions date back to 1889 and have consisted of dominantly phreatic explosions, pumice deposits during 2001, and discolored water. A submarine eruption during July through December 2022 was characterized by discolored water, pumice deposits, and gas emissions (BGVN 48:01). This report covers a new eruption during October through December 2023, which consisted of explosions, black ejecta, discolored water, and floating pumice, based on information from the Japan Meteorological Association (JMA), the Japan Coast Guard (JCG), and satellite data.
JMA reported that an eruption had been occurring offshore of Okinahama on the SE side of the island since 21 October, which was characterized by volcanic tremor, according to the Japan Maritime Self-Defense Force (JMSDF) Iwo Jima Air Base (figure 22). According to an 18 October satellite image a plume of discolored water at the site of this new eruption extended NE (figure 23). During an overflight conducted on 30 October, a vent was identified about 1 km off the coast of Okinahama. Observers recorded explosions every few minutes that ejected dark material about 20 m above the ocean and as high as 150 m. Ejecta from the vent formed a black-colored island about 100 m in diameter, according to observations conducted from the air by the Earthquake Research Institute of the University of Tokyo in cooperation with the Mainichi newspaper (figure 24). Occasionally, large boulders measuring more than several meters in size were also ejected. Observations from the Advanced Land Observing Satellite Daichi-2 and Sentinel-2 satellite images also confirmed the formation of this island (figure 23). Brown discolored water and floating pumice were present surrounding the island.
The eruption continued during November. During an overflight on 3 November observers photographed the island and noted that material was ejected 169 m high, according to a news source. Explosions gradually became shorter, and, by the 3rd, they occurred every few seconds; dark and incandescent material were ejected about 800 m above the vent. On 4 November eruptions were accompanied by explosive sounds. Floating, brown-colored pumice was present in the water surrounding the island. There was a brief increase in the number of volcanic earthquakes during 8-14 November and 24-25 November. The eruption temporarily paused during 9-11 November and by 12 November eruptions resumed to the W of the island. On 10 November dark brown-to-dark yellow-green discolored water and a small amount of black floating material was observed (figure 25). A small eruption was reported on 18 November off the NE coast of the island, accompanied by white gas-and-steam plumes (figure 23). Another pause was recorded during 17-19 November, which then resumed on 20 November and continued erupting intermittently. According to a field survey conducted by the National Institute for Disaster Prevention Science and Technology on 19 November, a 30-m diameter crater was visible on the NE coast where landslides, hot water, and gray volcanic ash containing clay have occurred and been distributed previously. Erupted blocks about 10 cm in diameter were distributed about 90-120 m from the crater. JCG made observations during an overflight on 23 November and reported a phreatomagmatic eruption. Explosions at the main vent generated dark gas-and-ash plumes that rose to 200 m altitude and ejected large blocks that landed on the island and in the ocean (figure 26). Discolored water also surrounded the island. The size of the new island had grown to 450 m N-S x 200 m E-W by 23 November, according to JCG.
The eruption continued through 11 December, followed by a brief pause in activity, which then resumed on 31 December, according to JMA. Intermittent explosions produced 100-m-high black plumes at intervals of several minutes to 30 minutes during 1-10 December. Overflights were conducted on 4 and 15 December and reported that the water surrounding the new island was discolored to dark brown-to-dark yellow-green (figure 27). No floating material was reported during this time. In comparison to the observations made on 23 November, the new land had extended N and part of it had eroded away. In addition, analysis by the Geospatial Information Authority of Japan using SAR data from Daichi-2 also confirmed that the area of the new island continued to decrease between 4 and 15 December. Ejected material combined with wave erosion transformed the island into a “J” shape, 500-m-long and with the curved part about 200 m offshore of Ioto. The island was covered with brown ash and blocks, and the surrounding water was discolored to greenish-brown and contained an area of floating pumice. JCG reported from an overflight on 4 December that volcanic ash-like material found around the S vent on the NE part of the island was newly deposited since 10 November (figure 28). By 15 December the N part of the “J” shaped island had separated and migrated N, connecting to the Okinahama coast and the curved part of the “J” had eroded into two smaller islands (figure 27).
References. Ukawa, M., Fujita, E., Kobayashi, T., 2002, Recent volcanic activity of Iwo Jima and the 2001 eruption, Monthly Chikyu, Extra No. 39, 157-164.
Geologic Background. Ioto, in the Volcano Islands of Japan, lies within a 9-km-wide submarine caldera. The volcano is also known as Ogasawara-Iojima to distinguish it from several other "Sulfur Island" volcanoes in Japan. The triangular, low-elevation, 8-km-long island narrows toward its SW tip and has produced trachyandesitic and trachytic rocks that are more alkalic than those of other volcanoes in this arc. The island has undergone uplift for at least the past 700 years, accompanying resurgent doming of the caldera; a shoreline landed upon by Captain Cook's surveying crew in 1779 is now 40 m above sea level. The Motoyama plateau on the NE half of the island consists of submarine tuffs overlain by coral deposits and forms the island's high point. Many fumaroles are oriented along a NE-SW zone cutting through Motoyama. Numerous recorded phreatic eruptions, many from vents on the W and NW sides of the island, have accompanied the uplift.
Information Contacts: Japan Meteorological Agency (JMA), 1-3-4 Otemachi, Chiyoda-ku, Tokyo 100-8122, Japan (URL: http://www.jma.go.jp/jma/indexe.html); Japan Coast Guard (JCG) Volcano Database, Hydrographic and Oceanographic Department, 3-1-1, Kasumigaseki, Chiyoda-ku, Tokyo 100-8932, Japan (URL: https://www1.kaiho.mlit.go.jp/GIJUTSUKOKUSAI/kaiikiDB/kaiyo22-2.htm); Copernicus Browser, Copernicus Data Space Ecosystem, European Space Agency (URL: https://dataspace.copernicus.eu/browser/); Asahi, 5-3-2, Tsukiji, Chuo Ward, Tokyo, 104-8011, Japan (URL: https://www.asahi.com/ajw/articles/15048458).
Search Bulletin Archive by Publication Date
Select a month and year from the drop-downs and click "Show Issue" to have that issue displayed in this tab.
The default month and year is the latest issue available.
Bulletin of the Global Volcanism Network - Volume 30, Number 08 (August 2005)
Anatahan (United States)
Surge photographed on 24 August; eruption halts on 3 September
Bagana (Papua New Guinea)
Lava flows and occasional ash plumes during April-September 2005
Fuego (Guatemala)
Ongoing ash emissions, lava flows, and associated hazards into 2005
Langila (Papua New Guinea)
Increased eruptive vigor leads to ashfall damage in mid-2005
Manam (Papua New Guinea)
Comparatively mild eruptions with rare minor local ashfall
Rabaul (Papua New Guinea)
Minor ash plumes reach Rabaul Town
Reventador (Ecuador)
Generally, activity shifting from effusive towards explosive
Sheveluch (Russia)
22 September eruption generated a substantial pyroclastic flow
Soputan (Indonesia)
Sporadic explosions into mid-2005; photo of 18 July pyroclastic flow
Soufriere Hills (United Kingdom)
Through at least 5 September 2005, the lava dome continued to grow
Anatahan (United States) — August 2005 Cite this Report
Anatahan
United States
16.35°N, 145.67°E; summit elev. 790 m
All times are local (unless otherwise noted)
Surge photographed on 24 August; eruption halts on 3 September
Anatahan has erupted almost continuously since 5 January 2005, when it started a new episode of vigorous discharges. A summary of satellite images during 16 June-20 July 2005 (BGVN 30:07) showed that it was one of the most conspicuous eruptions on the planet in 2005.
Eruptions somewhat abruptly ceased on about 3 September. Significant discharges remained absent through as late as 29 September. Activity described below through early September is based on an array of material from numerous sources, including the US Geological Survey (USGS), the Washington VAAC, the U.S. Air Force Weather Agency (AFWA), the press, and the Emergency Management Office of the Commonwealth of the Northern Mariana Islands (EMO-CNMI).
Following the general discussions of activity, a report is included contributed by Setsuya Nakada from the Earthquake Research Institute (ERI), University of Tokyo, whose team of scientists made close-range observations of a distinctive eruptive phase called an ash-cloud surge from a helicopter on 24 August. On that day they documented the surge as a robust sub-horizontal plume slowly traveling over, and in contact with, the ocean surface.
Activity during August 2005. Throughout August eruptive activity continued, with plumes rising several thousand meters above the volcano. On 1 August and during 3-9 August the National Weather Service at Tiyan, Guam, issued numerous reports for the islands of Saipan and Tinian.
On 1 August a strong sulfur odor was reported by numerous residents, and ash was observed on aircraft at Saipan International Airport. According to a news article, flights leaving the airport were delayed.
A 4 August article published in the Saipan Tribune by John Ravelo was entitled "Engine trouble forces aircraft's emergency landing." What follows comes from the opening paragraphs of that article, describing events attributed to 3 August.
"An aircraft suffered engine trouble in mid-air early last night shortly after taking off from the Saipan International Airport, prompting it to return to the tarmac for emergency landing. The Ports Police said no one was injured in the incident. This happened as Saipan, Tinian and Rota remained under volcanic haze from Anatahan until last night . . ..
"The aircraft reportedly left the Saipan airport at approximately 6 pm. Minutes later, at about 6:15 pm, Ports Police on-duty airport supervisor Sgt. Greg Arriola said his office received a call that the aircraft was coming back due to 'problems with its left engine.'
"'The aircraft landed safely. Everybody was safe,' Arriola said. He refused to elaborate and name the aircraft, saying, 'we're still checking [on] the matter.'
"Arriola did not disclose the number of passengers aboard the distressed aircraft and where the plane was supposedly bound. The haze over Saipan has resulted in flight interruptions since Monday [1 August], temporarily stranding hundreds of passengers.
"According to the U.S. Geological Survey, volcanic ash threatens jets ... as it forms deposit in engines, restricts airflow, and clogs fuel nozzles. Minute particles of volcanic ash also contaminate aircraft's ventilation, lubrication, hydraulic and electronic systems. They cause erosion and pitting of leading edges of windshields and landing lights, as well as erosion of compressor blades."
The USGS and EMO noted that a seismic station on Sarigan, Anatahan's neighboring island 6.5 km to the W, recorded more than 40 earthquakes on 9 August, three of which had magnitudes of around 4. The seismic swarm began at around 0152 and occurred over the next eight hours. At around 0539, an M 4.2 earthquake occurred, and the National Earthquake Information Center traced the event to ~ 65 km NW of Anatahan.
Tremor and long-period earthquakes were recorded through 8 August. Later, an ash plume was detected on satellite imagery by the AFWA and Washington VAAC; it was at 5-5.5 km altitude extending approximately 220-400 km NW from the summit on 9 August. A Washington VAAC report that day was the 650th Anatahan report they had issued in 2005.
During the remainder of August 2005, eruptive activity continued and ash plumes rose to 6-8 km altitude. Volcanic tremor levels ranged between 20 and 65 percent of peak levels, and long-period earthquakes occurred sporadically. But, after around 0205 on 27 August, the seismic station went off-line. During 1-3 September activity continued, with ash plumes rising to a maximum of ~ 3 km altitude.
Eruptions halt on 3 September 2005. The USGS reported that based on remote-sensing data Anatahan appeared to have stopped erupting on 3 September (UTC), and initial data documenting that circumstance represented observations between 0901 and 2308 UTC. The earlier time corresponded to when AFWA last noted visible ash on a GOES 9 image. Ash could not be detected in satellite imagery through 1825 UTC due to cloud cover. A pilot report at 2308 UTC on 3 September indicated "no activity was occurring at the volcano." The Washington VAAC reported that no ash was detected in satellite imagery through 0025 UTC on 4 September under mostly clear skies. MODIS imagery at 0040 and 0345 UTC on 4 September also show no discernible ash being erupted under clear skies.
This was the first time that the USGS and the EMO reported an absence of volcanism on Anatahan since ash-bearing discharges started in early January 2005. Since then, tremor levels have been fluctuating, with occasional Strombolian explosions.
During an overflight the week of 7 September, USGS and EMO personnel did not see any ash emissions, only low-level steam-and-gas emissions. They noted that the crater floor was covered by sediment-laden water. In East Crater they saw an active geothermal system, consisting of mud pots, mini-geysers, and steam jetting from the crater walls.
Although volcanic seismicity was at low levels through at least 16 September, according to the World Data Center for Seismology (Denver, Colorado) a M 4.4 earthquake struck the Saipan region of the Northern Mariana Islands on 9 September 2005. It occurred at about 1301 local time, with the epicenter 80 km SSW of Anatahan.
Eruption observations, 24 and 26 August 2005. The following describes a 24 August helicopter visit to the vicinity of Anatahan, which included witnessing and documenting eruptive phenomena, but not landing. Photos were also taken on 26 August while passing well to windward of the island on a commercial airliner. The report was submitted by Setsuya Nakada, who was accompanied from Japan by colleagues Takeshi Matsushima (Institute of Seismology and Volcanology, Kyushu University), and Mitsuhiro Yoshimoto (Volcano Research Center, Earthquake Reserch Institute, University of Tokyo).
They had hoped to recover GPS and tiltmeter data from stations on Anatahan, and to find, exhume, inspect, and repair any ash-covered instruments. These instrumental data span the important period starting from last year, an interval that could shed light on the behavior of the volcano and the magma system during the eruption. Geological inspection and petrological sampling were also planned.
Anatahan's seismicity changed from continuous, strong signals to undergoing intermittent pulsations around the morning of 23 August, and a large (M 4.8?) LP earthquake occurred at 2045 on 23 August. Judging from this sudden seismological change and the LP event, the USGS scientists monitoring the seismicity (Andy Lockhart, Randy White, and others) suggested suspending landing on the island for at least a few weeks.
The team decided to fly over the island without landing to assess the state of burial of their geodetic observation site. They spent about an hour in the air there (about 1000 to 1100 on the 24th) viewing and photographing the scene. Besides the pilot, the helicopter carried Nakada, Matsushima, Yoshimoto, and Juan Camacho (EMO-CMI).
During the 24 August visit, dense ash clouds issued very vigorously from the active E crater. The cloud and hung over the summit calderas, their SW rims, and swept out over the sea to the SW and W of the island.
The photographs and the impressions of Camacho and his pilot from visits in July and May 2005 suggested that the activity level was higher on 24 August. The flight disclosed an island completely covered with thick layers of both wet (dark and probably very fine) ash deposits, and fresh dry ones on the island's S slopes. The dry ones lay under the ash cloud. Green areas were restricted to spots on the outer slopes. Many gullies had begun to develop on the surface of the thick ash deposit.
The observers saw a dark eruption cloud (densely ash-laden) vigorously blasting out of the active crater. A heavy ash cloud hung over the island (figures 21 and 22). The eruption cloud rose to ~ 800 m directly above the crater, and it increased up to ~ 2,000 m over the W part of the island, where it became lighter in color. Darker, vigorous emissions also came from the east crater's W side or NW side, and less frequently from its E side. Though this may have reflected the complex circulation of air within the east crater, another possibility was that the active crater had widened recently, especially to the E. Two ash emission points may have developed inside the large active crater.
Seismic amplitudes during the flight were weaker than recorded the afternoon of 23 August. Seismic signals consisted of intermittent pulses with duration intervals from 5 to 20 minutes. Such signals could presumably have corresponded with a series of Strombolian explosions, but on the flight these were not seen. No projectiles were observed—even near the base of the eruption cloud—although the vent was obscured by a profusion of drifting clouds (figures 1 and 2). Abundant ash-laden clouds passed vigorously and continuously from the active crater, escaping in cycles of five's to ten's of minutes in duration, intervals seemingly similar to the seismicity during the flight.
Abundant ash fell from the dark ash cloud that drifted to the SW of the crater. Around 1000 a ring of ash-cloud surge expanded on the crater's southern rim. It advanced comparatively slowly, traveling SW (figures 21 to 24). Along the sea surface, many small lobes of ash cloud developed, moving slowly. These were reminiscent of lobes seen in surges observed at the Tar River Valley delta during the Soufrière Hills eruption. These eruptive scenes also appeared very similar to those observed on 29 August 2000 at Miyake-jima (Nakada and others, 2005a), where a low-temperature ash-cloud surge moved slowly from the summit crater. In the case of the ash-cloud surge seen at Anatahan, it may be that the passage across sea water had a profound influence, triggering behavior more closely phreatomagmatic than purely magmatic in character. The ash-cloud surge took place mainly as the observers approached the island. The surge was thought to correlate to an interval of elevated seismicity.
Tephra buried portions of the village ~ 7 km W of the active crater and reached 1.5 m thick. A photograph revealed that the GPS antenna, within a 50-cm-high pillar, remained distinct even though under considerable ash. The cable to the computer was also partly visible inside a collapsed hut, suggesting the prospect of still retrieving the data. The GPS end-point station ~ 1.5 km E of the crater was under a ~ 1-m-thick blanket of ash, but again the GPS antenna was seen on the edge of a small pond.
A thermal imaging camera system took an essentially simultaneous thermal (infrared) image and a visible-light photograph (figure 25). The eruption cloud was too dense to capture the temperature distribution near the floor of the crater area. Instead, the images represented only the temperature distribution of the cooler, outer portions of the clouds, where temperatures ranged from 19.5 to 27°C (figure 25).
As Nakada and colleagues departed from the Mariana Islands, Anatahan's eruption was seen again (figure 26), this time from a commercial air flight (Northwest Airlines' flight NW0078) traveling from Saipan to Nagoya and departing at 0930 on 26 August 2005. The plume was directed SW. In addition to the very different plume morphology seen that day, the eruptive intensity was judged to have been higher than on 24 August (figure 26).
References. Hilton and others, 2005, Introduction to the special issue on the 2003 eruption of Anatahan Volcano, Commonwealth of the Northern Marianas Islands (CNMI): Jour. Volcanol. Geotherm. Res., v. 146, p. 1-7.
Nakada and others, 2005a, Chronology and products of the 2000 eruption of Miyakejima Volcano, Japan: Bull. Volcanol., v. 67, p. 205-218.
Nakada and others, 2005b, Geological aspects of the 2003-2004 eruption of Anatahan Volcano, Northern Mariana Islands: Jour. Volcanol. Geothermal. Res. 146, p. 226-240.
Watanabe and others, 2005, Geodetic constraints for the mechanism of Anatahan eruption of May 2003: Jour. Volcanol. Geothermal. Res., v. 146, p. 77-85.
Geologic Background. The elongate, 9-km-long island of Anatahan in the central Mariana Islands consists of a large stratovolcano with a 2.3 x 5 km compound summit caldera. The larger western portion of the caldera is 2.3 x 3 km wide, and its western rim forms the island's high point. Ponded lava flows overlain by pyroclastic deposits fill the floor of the western caldera, whose SW side is cut by a fresh-looking smaller crater. The 2-km-wide eastern portion of the caldera contained a steep-walled inner crater whose floor prior to the 2003 eruption was only 68 m above sea level. A submarine cone, named NE Anatahan, rises to within 460 m of the sea surface on the NE flank, and numerous other submarine vents are found on the NE-to-SE flanks. Sparseness of vegetation on the most recent lava flows had indicated that they were of Holocene age, but the first historical eruption did not occur until May 2003, when a large explosive eruption took place forming a new crater inside the eastern caldera.
Information Contacts: Juan Takai Camacho and Ramon Chong, Emergency Management Office of the Commonwealth of the Northern Mariana Islands (EMO-CNMI), PO Box 100007, Saipan, MP 96950, USA (URL: http://www.cnmihsem.gov.mp/); Charles Holliday and Jenifer E. Piatt, U.S. Air Force Weather Agency (AFWA)/XOGM, Offutt Air Force Base, NE 68113, USA; Randy White and Frank Trusdell, U.S. Geological Survey, 345 Middlefield Road, Menlo Park, CA 94025-3591, USA (URL: https://volcanoes.usgs.gov/nmi/activity/); Andrew B. Lockhart, USGS, Cascades Volcano Observatory, 1300 SE Cardinal Court, Bldg. 10, Suite 100, Vancouver, WA 98683, USA; Saipan Tribune, PMB 34, Box 10001, Saipan, MP 96950, USA (URL: http://www.saipantribune.com/); Setsuya Nakada and Mitsuhiro Yoshimoto, Volcano Research Center, Earthquake Research Institute (ERI), University of Tokyo, Tokyo, Japan (URL: http://www.eri.u-tokyo.ac.jp/nakada/anat_hp/anat_200508/, http://www.eri.u-tokyo.ac.jp/VRC/index_E.html); Takeshi Matsushima, Institute of Seismology and Volcanology (SEVO), Graduate School of Science, Kyushu University, 2-5643-29 Shin'yama, Shimabara, Nagasaki 855-0843, Japan (URL: http://www.sevo.kyushu-u.ac.jp/).
Bagana (Papua New Guinea) — August 2005 Cite this Report
Bagana
Papua New Guinea
6.137°S, 155.196°E; summit elev. 1855 m
All times are local (unless otherwise noted)
Lava flows and occasional ash plumes during April-September 2005
Bagana was last reported on in June 2004 (BGVN 29:06) summarizing MODIS thermal alerts during 1 January 2001-31 May 2004. Lava flows, which had erupted at an unknown time, were described in BGVN 29:05. Bagana has been in long-term eruption since 1972, but the volcano's remote location and intervals of separatist conflict on the island had restricted access by observatory staff, and subsequent reports remained infrequent. Several Rabaul Volcano Observatory (RVO) reports addressed Bagana volcanism during March-September 2005, revealing conditions seen on the ground. There were numerous MODVOLC thermal alerts posted for Bagana during the reporting interval. The rest of the reports relied on satellite-based observations of plumes produced for the purpose of aircraft safety.
RVO noted that during April 2005 Bagana continued its effusive eruption of lava. The summit crater released weak to moderate volumes of thick white vapor on most days. Occasional gray to brown ash plumes were reported. White vapor was visible in some areas of the SW flank. Summit glow was visible on most nights when it was clear, associated with the active lava flow on the upper S flanks. White vapor visible on the upper SW flank during daytime was also associated with a lava flow. Occasional loud roaring noises like jet engines and booming noises were heard on 17, 19, and 30 April. Some of the noises accompanied emission of thick, dark gray ash clouds.
According to the Darwin Volcanic Ash Advisory Centre (VAAC), on 17 March 2005 at 0726 a very small plume to ~ 2.4 km altitude and hot spot were visible on satellite imagery. Satellite imagery at 0551 on 13 May revealed a thin plume extending 28 km ESE below 3 km altitude. Similar plumes, blowing W, were identified at 0537 on 14 May and at 0634 on 15 May.
A plume from Bagana was observed in satellite imagery for 8 June. Darwin VAAC stated that the plume initially extended 65 km WSW, then W later in the day. The height of the plume was not stated. US Air Force Weather Agency analysts indicated that at 0955 local time on 8 June (2355 UTC on 7 June) the plume extended at least ~ 38 km W, rising up to ~ 3 km, and the MODIS image they provided showed four volcanoes in the region all emitting plumes (figure 7).
During 13-19 June, Bagana was relatively quiet with variable amounts of white vapor emitted from the crater. Weak projections of incandescent lava were visible until 17 June. During 8-10 June, several low-level plumes emitted from Bagana were visible on satellite imagery extending mainly to the WSW. A plume from Bagana visible on satellite imagery on 21 June extended W. The height of the plume was not reported. A thin plume emitted from Bagana was visible on satellite imagery on 30 June. The height of the plume was not reported.
During 10-16 August, the Darwin VAAC reported that satellite observations showed an ash plume from Bagana visible at a height of ~ 3 km, extending ~ 40 km SW of the summit. Ash was not visible on the image.
During 15-21 August, volcanic activity at Bagana remained at low levels. Variable amounts of thick white vapor were emitted from the summit crater. During several nights, dull-to-moderately bright incandescence was visible. Occasional low roaring noises were heard on 15 and 20 August. At night dull to moderately bright glow was visible on 16, 18, 20, and 21 August. On 20 August, lava flowed from the main crater. Incandescent lava avalanches occasionally originated from unstable areas of the lava flow.
Between 22 and 28 August 2005, Bagana was quiet. The summit crater released variable amounts of white vapor throughout. Continuous roaring noises were heard during a 30-minute period on 23 August, and bright glow was visible the nights of 23 and 24 August. There was a single expulsion of a thick dark ash plume on 24 August.
During 12-18 September 2005, occasional small volumes of ash escaped, and emissions consisted chiefly of weak to moderate volumes of white vapor. Beginning on 17 September occasional sub-continuous booming noises commenced. Some of the booming noises were accompanied by forceful emissions of whitish-brown ash clouds. This activity continued on 18 September. Ash plumes from the activity drifted to W and NW resulting in fine ashfall in downwind areas. Occasional sub-continuous jet-like noises began to occur on 18 September along with a reported lava flow. Glow was observed at night on 14 and 18 September. This could have been associated with cascading lava detached from steep portions of an active lava flow.
The seismograph remained off from 15 August onward through the reporting period due to technical problems.
Geologic Background. Bagana volcano, in a remote portion of central Bougainville Island, is frequently active. This massive symmetrical cone was largely constructed by an accumulation of viscous andesitic lava flows. The entire edifice could have been constructed in about 300 years at its present rate of lava production. Eruptive activity is characterized by non-explosive effusion of viscous lava that maintains a small lava dome in the summit crater, although occasional explosive activity produces pyroclastic flows. Lava flows with tongue-shaped lobes up to 50 m thick and prominent levees descend the flanks on all sides.
Information Contacts: Rabaul Volcano Observatory (RVO), P.O. Box 386, Rabaul, Papua New Guinea ; Darwin Volcanic Ash Advisory Centre (VAAC), Bureau of Meteorology, Northern Territory Regional Office, PO Box 40050, Casuarina, Northern Territory 0811, Australia (URL: http://www.bom.gov.au/info/vaac/).
Fuego
Guatemala
14.4748°N, 90.8806°W; summit elev. 3799 m
All times are local (unless otherwise noted)
Ongoing ash emissions, lava flows, and associated hazards into 2005
Fuego remained active into 2005, although this report focuses on the interval 31 December 2003 through 11 May 2004. A previous report discussed activity through the end of 2003 (BGVN 29:11); this report, based mainly on information from INSIVUMEH (Instituto Nacional de Sismologia, Vulcanologia, Meterologia y Hidrologia) covers the interval from end of 2003 to 11 May 2004.
Figure 7 is a map of the Fuego-Acatenango region, emphasizing drainages and settlements frequently mentioned in activity and hazard reports. Fuego is moderately close to the centers of some of Guatemala's largest cities, including the Capital (2-3.5 million inhabitants, ~ 40 km NNE of Fuego's summit) and Antigua (~ 32,000 inhabitants, ~ 18 km NNE).
CONRED, the Guatemalan hazards agency (Cordinadora Nacional para la Reducción de Desastres) posted hazard information on their website, in part using a map format noting conditions seen from various perspectives. For example, the map issued for 9 January 2004 (during the largest crisis of the interval), included a title, a legend, a summary of critical hazards-oriented observations. One portion of the 9 January map reported a local wind velocity, N-NW at 12-18 km/hr, and the occurrence of fine and very fine ash falling within 5 to 15 km of the crater. The map also included key radio base stations and for each, a summary of the day's message content.
Many early 2005 observations were hampered by rainfall. Table 4 summarizes numerous INSIVUMEH daily reports during February, but for the bulk of the entries, it chiefly presents Smithsonian/USGS Weekly Reports to portray longer time spans.
Table 4. Samples of Fuego activity during 31 December 2003 through 11 May 2004. Summaries based largely on Smithsonian/USGS Weekly Reports are shown as multi-day intervals (marked with an asterisk, "*"). Most of the reported eruptions in column 3 were ash bearing. Courtesy of INSIVUMEH.
| Date |
Maximum plume height (above summit) and bearing |
Activity Description |
| 31 Dec-06 Jan 2004* |
-- |
During 1-5 January, lava emitted from Fuego flowed 70-100 m from the crater. Avalanches from the lava-flow fronts traveled W toward Santa Teresa ravine and toward Trinidad ravine. Seismic stations on the volcano recorded almost continuous harmonic tremor. |
| 07 Jan-13 Jan 2004* |
~3 km |
Ash emission starting around 1500-1600 on 8 January (see text). |
| 21 Jan-27 Jan 2004* |
~1.5 km, SSW (22 Jan) |
Smaller explosions to ~700 m above the crater. Incandescent avalanches traveled a maximum distance of 1 km toward Zanjon Barranca Seca, La Trinidad, and Rio Ceniza ravines. Not ashfall in populated areas. ~1.5 km from two strong explosions (evening of 22 January); blown SSW. During the rest of the week, smaller explosions sent plumes to ~700 m above the crater. |
| 28 Jan-03 Feb 2004* |
~1.1 km |
Small-to-moderate explosions. The highest rising ash plume was produced from an explosion on 29 January. The plume reached above the crater and was accompanied by avalanches of volcanic material down Barranca Seca. A small amount of ash fell in Panimache village and possibly in Santa Sofia. On 31 January two small collapses in the S edge of the central crater produced small avalanches of lava blocks. |
| 16 Feb 2004 |
0.3-1 km, SW |
Audible acoustic shock waves. Ashfall on upper edifice. |
| 17 Feb 2004 |
-- |
Incandescent avalanches rose 200 m at night, but some traveled into the drainages of the Taniluya, Ceniza, and Zanjon Barranca Seca. A mudflow descended the Quebrada Santa Teresa (on Fuego's W-SW sides) carrying blocks up to 2 m in diameter. During 0855 to 1140 Fuego produced 10 explosions characterized as strong, resulting in warnings to civil aviation authorities. Ashfall on W- and SW-flank communities. |
| 18 Feb 2004 |
1.5-1.7 km |
A rapid succession of 15 early morning explosions at 10- to 30-second intervals were heard up to 8 km distant from the summit. Incandescent material landed on many of the upper slopes. Judging by the quantity and weight of ash fall, INSIVUMEH inferred that the eruption caused substantial changes in the summit area. Finer ash fell for 10 to 15 minutes on Finca Sangre de Cristo and environs. Besides aviation safety, concerns included drinking-water contamination. Ashfall up to 8 km from summit. |
| 20 Feb 2004 |
1.5-2 km; light to moderate S winds |
Loud outbursts and incandescent avalanches down the W-flank valleys of the Seca, Taniluya, and Trinidad rivers, and to lesser extent down SE-flank valleys of the Las Lajas-El Jute rivers. Ash-bearing emissions came from the central crater at 4- to 9-minute intervals. Some traces of ash noted to the N, in the Capital. |
| 25 Feb-02 Mar 2004* |
~1.7 km |
Weak-to-moderate explosions continued at Fuego, producing plumes above the crater. Avalanches of volcanic material traveled down several ravines, including Trinidad, Ceniza, Santa Teresa, and Taniluya (to the W). Explosions on 28 February deposited small amounts of fine ash in the village of Sangre de Cristo, and explosions on 29 February deposited ash W and SW of the volcano in the villages of Yepocapa and La Cruz. |
| 04 Mar-08 Mar* |
~1.5 km |
On 5, 7, and 8 March avalanches of incandescent volcanic material traveled as far as 1.5 km down several ravines, including Seca, Taniluya, Ceniza, and Trinidad. Explosions on the 7th and 8th deposited ash 6-10 km from Fuego, including in the villages of Sangre de Cristo and Panimache. |
| 10 Mar-16 Mar 2004* |
~1.7 km |
Explosions; incandescent avalanches as far as 600 m down ravines on the volcano's W, SW, and S flanks; ash fell in W- to SW-flank settlements from Sangre de Cristo to Panimache and Finca Morelia. |
| 17 Mar-23 Mar 2004* |
~1.3 km |
Volcanic material traveled down the Seca ravine; ash fell in the village of Sangre de Cristo. |
| 24 Mar-30 Mar 2004* |
~1 km |
Three strong explosions were recorded on 26 March; they caused incandescent avalanches in the Zanjon Barranca Seca and Trinidad ravines. On 29 March two explosions within 7 minutes produced ash plumes. A lahar occurred on 29 March in the Zanjon Barranca Seca ravine. |
| 31 Mar-06 Apr* 2004 |
~1.2 km (5 April, drifting SSE) |
Lahars flowed down Seca Ravine on 30 March, and passed near the village of Sangre de Cristo on 3 April. Incandescent avalanches descended several ravines, including Santa Teresa, Ceniza, and Taniluya. |
| 07 Apr-13 Apr 2004* |
~1 km |
Lava flowed 75-100 m from the central crater and avalanches of volcanic material traveled as far as 400 m towards Santa Teresa and Taniluya ravines. |
| 14 Apr-20 Apr 2004* |
~2.3 km (16 April, drifting S) |
During 18-19 April, small eruptions hurled incandescent material up to 50 m above the vent. |
| 21 Apr-27 Apr 2004* |
~1 km (steam) |
Weak explosions produced steam clouds above the volcano. In addition, small avalanches of volcanic material occasionally traveled W toward Santa Teresa Ravine. |
| 28 Apr-04 May 2004* |
~1.5 km |
Ash-bearing explosions. On 28 April, an explosion produced an ash plume above the volcano, and ash was deposited ~4 km SW of the volcano in the villages of Panimache I and Panimache II. In addition, a small volcanic avalanche traveled W toward the Santa Teresa ravine. |
| 05 May-11 May 2004* |
-- |
Explosions chiefly produced gas-and-ash clouds. On 5 May a small lahar traveled to the W down Seca ravine. |
From the table, the pattern emerges of ongoing emissions with frequent plumes to 1 km and occasional higher plumes (several to ~2 km and one to ~3 km). Similar to previous months, the reports frequently mention dislodged lava blocks and mass wasting of volcanic materials.
The highest plume found in available reports of the interval occurred on 8 January 2004, when an ash plume rose ~3 km over the summit. Traces of ash fell in the Capital during this episode.
Fuego began its 8 January eruption around 1500 to 1600, expelling thick, broad columns of gases and ash to ~3 km above the crater. There were 25-30 explosions a minute accompanied by loud rumbling noises and acoustical shock waves felt 12 km away. Although no evacuations were ordered, settlements on the upper flanks were considered at risk, including San Andrés Iztapa, Chimaltenango, Comalapa, San Martín Jilotepeque, San José Poaquil, and Yepocapa.
The Washington VAAC added these observations: "[GOES 12] satellite imagery shows two plumes moving away from the volcano. The higher plume extends approximately 75 nm [~140 km] to the [N] and is estimated to be around FL250 [shorthand for 25,000 feet altitude, ~8 km]. A lower plume extends approximately 70 nm [126 km] to the [W] and is estimated to be up to FL190 (19,000 feet altitude, ~6 km). Hot spot activity has been fairly strong and constant over the past several hours."
A 20 February report described continued vigorous activity; ash emissions from the central crater rose to heights of 1.5-2 km above the summit (table 1). Light to moderate winds again blew the ash N and some traces fell in the Capital.
Geologic Background. Volcán Fuego, one of Central America's most active volcanoes, is also one of three large stratovolcanoes overlooking Guatemala's former capital, Antigua. The scarp of an older edifice, Meseta, lies between Fuego and Acatenango to the north. Construction of Meseta dates back to about 230,000 years and continued until the late Pleistocene or early Holocene. Collapse of Meseta may have produced the massive Escuintla debris-avalanche deposit, which extends about 50 km onto the Pacific coastal plain. Growth of the modern Fuego volcano followed, continuing the southward migration of volcanism that began at the mostly andesitic Acatenango. Eruptions at Fuego have become more mafic with time, and most historical activity has produced basaltic rocks. Frequent vigorous eruptions have been recorded since the onset of the Spanish era in 1524, and have produced major ashfalls, along with occasional pyroclastic flows and lava flows.
Information Contacts: Instituto Nacional de Sismologia, Vulcanología, Meteorología e Hidrologia (INSIVUMEH), Ministero de Communicaciones, Transporto, Obras Públicas y Vivienda, 7a. Av. 14-57, zona 13, Guatemala City 01013, Guatemala (URL: http://www.insivumeh.gob.gt/); Coordinadora Nacional para la Reducción de Desastres (CONRED), Av. Hincapié 21-72, Zona 13, Guatemala City, Guatemala; Washington Volcanic Ash Advisory Center (VAAC), Satellite Analysis Branch (NOAA/NESDIS), 4700 Silver Hill Road, Stop 9910, Washington, DC 20233-9910, USA (URL: http://www.ssd.noaa.gov/).
Langila (Papua New Guinea) — August 2005 Cite this Report
Langila
Papua New Guinea
5.525°S, 148.42°E; summit elev. 1330 m
All times are local (unless otherwise noted)
Increased eruptive vigor leads to ashfall damage in mid-2005
The Darwin VAAC issued an activity report stating that the Rabaul Volcano Observatory (RVO) had noted elevated activity since 24 April 2005. Between 28 April 2005 and 4 May 2005 Langila emitted more ash than normal, and the International Federation of Red Cross And Red Crescent Societies (IFRC) determined that ~ 3,490 people had been affected by the eruption when ashfall damaged small food gardens and contaminated some water sources.
VAAC reports on 4 May and 6-7 May noted thin plumes extending NW 110 km and 75 km, respectively. Later, on 7-8 May, the identifiable plume was half as long and diminishing. Plumes and other diagnostics eventually became obscured by weather clouds. On 8 June analysts at the Darwin VAAC saw a low-altitude plume and a hot spot. The plume moved westward and remained visible into 9 June when it ceased being detectible.
During 13-19 June 2005, Langila's Crater 2 continued to erupt. At times the eruption was marked by moderate to strong emissions of thick gray-brown ash clouds occurring at irregular intervals. Ash clouds from the eruption rose variably to 700-1000 m before they were blown to the W and NW. At other times weak to moderate emissions of light gray ash clouds were observed. Considerable ash fell near the volcano and extended to the W and NW, between Warimo and Aimola. Crater 3 was quiet. Low and high frequency earthquakes and volcanic tremor were recorded.
The Darwin VAAC reported a Langila plume on 13 June to 3-4 km altitude, but cloud cover later obscured the plume. Another plume became visible on imagery on 16 June moving W at 30 km/hour at an estimated altitude of ~ 3 km; ongoing plumes became hard to see about mid-day on 17 June. Several other episodes of plume image detection were seen. One was identified by the VAAC on 21 June, with an observation of altitude to ~ 3 km and plume length reaching 300 km to the NW. The evidence of eruption only continued until the next day, when cloud cover obscured the area. A further, brief episode of plume detection occurred beginning early on 25 June but detection ended before noon. On 30 June, the Darwin VAAC repeated a US Air Force Weather Agency (AFWA) report on a Langila plume seen on imagery, blowing SW at 20 km/hr and reaching ~ 3 km altitude. By about 6 hours later that plume ceased to be visible.
Moderate levels of volcanic activity occurred at Langila's Crater 2 during 15-21 August. The activity was marked by occasional sub-continuous forceful emissions of ash clouds. The ash clouds rose as high as 1 km before drifting N and NW. Fine ash fell in villages along the coast. On the evening of 18 August projections of incandescent lava fragments were seen. Based on a pilot report, the Darwin VAAC reported that ash from Langila was visible in the vicinity of the volcano on 23 August, at 3-4.6 km altitude. A plume was seen a bit later on MODIS imagery extending 110 km to the NNW but ash was not visible in satellite imagery.
Geologic Background. Langila, one of the most active volcanoes of New Britain, consists of a group of four small overlapping composite basaltic-andesitic cones on the lower E flank of the extinct Talawe volcano in the Cape Gloucester area of NW New Britain. A rectangular, 2.5-km-long crater is breached widely to the SE; Langila was constructed NE of the breached crater of Talawe. An extensive lava field reaches the coast on the N and NE sides of Langila. Frequent mild-to-moderate explosive eruptions, sometimes accompanied by lava flows, have been recorded since the 19th century from three active craters at the summit. The youngest and smallest crater (no. 3 crater) was formed in 1960 and has a diameter of 150 m.
Information Contacts: Rabaul Volcano Observatory (RVO), P.O. Box 386, Rabaul, Papua New Guinea; International Federation of Red Cross And Red Crescent Societies (IFRC) (URL: https://reliefweb.int/); U.S. Air Force Weather Agency (AFWA)/XOGM, Offutt Air Force Base, NE 68113, USA; Darwin Volcanic Ash Advisory Centre (VAAC), Bureau of Meteorology, Northern Territory Regional Office, PO Box 40050, Casuarina, Northern Territory 0811, Australia (URL: http://www.bom.gov.au/info/vaac/).
Manam (Papua New Guinea) — August 2005 Cite this Report
Manam
Papua New Guinea
4.08°S, 145.037°E; summit elev. 1807 m
All times are local (unless otherwise noted)
Comparatively mild eruptions with rare minor local ashfall
Manam erupted several times during October-December 2004 and January 2005 (BGVN 29:10, 29:11). The eruption on the evening of 27 January 2005 (BGVN 30:02) was more severe than the previous ones during the current eruption period; there were 14 people injured and one person killed at Warisi village. During April and May 2005, mild eruptive activity continued. Manam remained at Alert Level 2 from February 2005 through late May.
Throughout April 2005, both summit craters released occasional pale gray to brown ash clouds to a few hundred meters above the summit before being blown SW, W, and NW, resulting in fine ashfall. Occasional low rumbling and roaring noises from Southern Crater were heard on 23 April and 29 April. A weak to moderate glow accompanied by projections of incandescent lava fragments was visible on 28 April and 30 April. There were no audible noises and no night-time glow from the Main Crater.
April seismicity was at low-moderate level. Occasional weak volcanic tremors were recorded during the month. The daily number of low frequency earthquakes range between 700 and 1350.
A pilot reported an eruption on 13 June at 0445 UTC. The Darwin Volcanic Ash Advisory Centre (VAAC) reported that ash plumes from Manam were visible on satellite imagery on 16-17 June, 30 June, and 1-2 July. On 19 July ash from Manam was visible extending SW on satellite imagery. Ash was also visible on satellite imagery on 20 July. In all instances, the heights of the plumes were not reported.
According to the Rabaul Volcanological Observatory (RVO), during 15-21 August low-level volcanic activity continued at Manam, and the alert level was reduced to level 1. On 15 August, ash was emitted from Southern Crater. The Darwin VAAC reported that a low-level plume from Manam was visible on satellite imagery on 22 August. Mild eruptive activity continued during 22-28 August, with occasional emissions of weak-to-moderate ash plumes on several days. Ash clouds emitted on 22 and 26 August rose several hundred meters above the volcano's crater and drifted NW, depositing ash in areas between the towns of Jogari and Kuluguma, and beyond to Boisa Island.
During September, the Main Crater continued to release weak emissions of thin white-gray ash clouds. On 17 September, the ash clouds increased slightly in volume and were blown to the NW part of the island. No glow was observed at night and technical problems thwarted seismic recording. Manam remained at Alert Level 1, indicating low levels of activity, through 19 September.
Geologic Background. The 10-km-wide island of Manam, lying 13 km off the northern coast of mainland Papua New Guinea, is one of the country's most active volcanoes. Four large radial valleys extend from the unvegetated summit of the conical basaltic-andesitic stratovolcano to its lower flanks. These valleys channel lava flows and pyroclastic avalanches that have sometimes reached the coast. Five small satellitic centers are located near the island's shoreline on the northern, southern, and western sides. Two summit craters are present; both are active, although most observed eruptions have originated from the southern crater, concentrating eruptive products during much of the past century into the SE valley. Frequent eruptions, typically of mild-to-moderate scale, have been recorded since 1616. Occasional larger eruptions have produced pyroclastic flows and lava flows that reached flat-lying coastal areas and entered the sea, sometimes impacting populated areas.
Information Contacts: Ima Itikarai, Rabaul Volcano Observatory (RVO), P.O. Box 386, Rabaul, Papua New Guinea; Andrew Tupper, Darwin Volcanic Ash Advisory Centre (VAAC), Bureau of Meteorology, Northern Territory Regional Office, PO Box 40050, Casuarina, Northern Territory 0811, Australia (URL: http://www.bom.gov.au/info/vaac/).
Rabaul (Papua New Guinea) — August 2005 Cite this Report
Rabaul
Papua New Guinea
4.2459°S, 152.1937°E; summit elev. 688 m
All times are local (unless otherwise noted)
Minor ash plumes reach Rabaul Town
The February 2005 eruption from the Tarvurvur cone at Rabaul and its aftermath were previously described (BGVN 30:07). In late August and September 2005 Tavurvur continued to produce discrete light to pale gray ash emissions. Emissions occurred at irregular intervals and with varying frequency. Discrete explosions also occurred. Ash plumes rose between 800 and 1500 m before they were blown to the N and NW, resulting in some ashfall on the eastern half of Rabaul Town. Areas further downwind were also affected. Roaring and rumbling noises accompanied the activity. Projections of incandescent lava fragments were visible at night but were less conspicuous compared to previous weeks.
Seismicity was at moderate to high levels, with most earthquakes associated with ash emissions and explosions. Small low frequency earthquakes not associated with ash emissions were also recorded. Ground deformation measurements from global positioning system (GPS) and tide gauge instruments fluctuated but the general trend showed a very slow rate of uplift.
One high frequency earthquake occurred on 12 September NE of Tavurvur. Prevailing SE winds during the last several months caused the ash plumes to drift to the N and NW. During 12-18 September there were some brief periods of NW winds that could mark the beginning of gradual wind transition from SE to NW winds, directions that would blow ash plumes away from Rabaul Town.
Geologic Background. The low-lying Rabaul caldera on the tip of the Gazelle Peninsula at the NE end of New Britain forms a broad sheltered harbor utilized by what was the island's largest city prior to a major eruption in 1994. The outer flanks of the asymmetrical shield volcano are formed by thick pyroclastic-flow deposits. The 8 x 14 km caldera is widely breached on the east, where its floor is flooded by Blanche Bay and was formed about 1,400 years ago. An earlier caldera-forming eruption about 7,100 years ago is thought to have originated from Tavui caldera, offshore to the north. Three small stratovolcanoes lie outside the N and NE caldera rims. Post-caldera eruptions built basaltic-to-dacitic pyroclastic cones on the caldera floor near the NE and W caldera walls. Several of these, including Vulcan cone, which was formed during a large eruption in 1878, have produced major explosive activity during historical time. A powerful explosive eruption in 1994 occurred simultaneously from Vulcan and Tavurvur volcanoes and forced the temporary abandonment of Rabaul city.
Information Contacts: Rabaul Volcano Observatory (RVO), P.O. Box 386, Rabaul, Papua New Guinea.
Reventador (Ecuador) — August 2005 Cite this Report
Reventador
Ecuador
0.077°S, 77.656°W; summit elev. 3562 m
All times are local (unless otherwise noted)
Generally, activity shifting from effusive towards explosive
Reventador ceased extruding significant new lava flows in early July 2005. Subsequent activity through this report interval, late September, was manifested as intermittent explosive eruptions. These were characterized alternately as Strombolian activity and short-duration Vulcanian events.
After the post-effusive phase and during the explosive phase a significant Vulcanian event took place at 2058 on 12 September, producing an ash column more than 5 km above the summit. Large bombs were ejected more than 2 km from the vent and small pyroclastic flows were evident in gullies descending from the cone. This event was preceded by more than a week of relative quiescence, indicating that future Vulcanian eruptions may occur with little warning.
This report was submitted by Jeffrey B. Johnson (University of New Hampshire), who collaborated with colleagues including Patricio Ramón, Liliana Troncoso, Guillermo Viracucha, Jaime Lozada, Daniel Andrade, David Rivero, Gorky Ruiz, Pete Hall, and Wilson Enriquez (Geophysical Institute, Escuela Politécnica Nacional, IG-EPN). They adhered to the practice of numerically naming lava flows, for example Lava ##5.
End of significant lava effusions. BGVN 30:05 provided a detailed overview of recent active lavas erupted by Reventador between April 2005 and the end of June 2005. Visits to the caldera on 1 July revealed dramatic diminution in the advance rate of Lava ##5 along the southern caldera margin. Within the first few days of July, Lava ##5 had stagnated. Its furthest extent was ~ 4.5 km from the vent and about 50 m short of the furthest extent of Lava ##4 (erupted in May 2005), which it was overriding.
Since the first few days in July, major lava extrusion had terminated. Despite intermittent MODIS thermal alerts (~ 1 per week from University of Hawaii (HIGP)), no significant lava flows have been directly observed by IG-EPN personnel or reported by the local populace. During July, it is likely that small lava flow(s) (under 1 km in length) were extruded from the southern breach of the cone during short-lived events lasting a few days or less. For instance, a photo taken on 1 August (figure 23) indicates a short, fresh lobe (named Lava ##6), which was no longer incandescent during a night-time visit on 3 August.
Explosive activity. Pyroclastic explosions, which first occurred in early June 2005, continued intermittently until 25 September 2005. Significant Strombolian activity was noted at night by the local populace in the first few days of July, coincident with the decline of Lava ##5 extrusion. In mid-July, explosive activity was minimal, but increased towards the end of the month and during August. Between explosions, voluminous vapor plumes were often observed and loud degassing sounds were often audible, but at times the volcano was also completely silent. Incandescence was also often visible in the cone, suggesting an open-vent configuration. Periods of quiescence separated explosive activity and generally lasted hours to days. Typical eruptive events, which occurred as many as 26 times a day (i.e., on 15 September), are identified clearly by seismic records. These emissions tend to alternate between discrete pyroclastic-laden, ash-rich explosions and extended-duration Strombolian-type fountaining (figure 24). Both types of events were capable of erupting large blocks up and over the crater rim (~ 200 m above the vent), which were often sufficiently massive to be visible from the highway ~ 7.5 km distant.
A period of relative quiescence, marked by an absence of large ash-generating plumes, was evident at the end of August and during first days of September. Vent incandescence was also notably absent during several days up until the large explosion at ~ 2058 on 12 September.
Preceded by a swarm of small volcano-tectonic events, the explosion was manifested by very short-duration transient signals, with arriving infrasonic and seismic waves lasting less than ~ 1 minute. However, peak-to-peak amplitudes the respective signals (~ 211 Pa and 4.9 mm/s) were substantially greater than other explosive events occurring at the volcano during recent months.
As previously mentioned, this short-duration explosion generated a more than 5 km-high ash-cloud and ejected large bombs aerially to more than 2 km. Small pyroclastic flows were confined to gullies on the cone and reached at least 1.5 km from the vent (figure 25).
Since this large event, incandescence has been routinely present in the crater and explosions have occurred with greater frequency (figure 26). Further large explosions occurring in the morning of 24 September were likely responsible for more pyroclastic deposits evident on the upper cone and in upper-flank gullies (figure 25, right-hand photo).
Monitoring. Reventador continues to be closely monitored by the IG-EPN (figure 27). A telemetered seismic network, consisting of three local short-period seismometers, is used to quantify the eruptive chronology of the volcano, including the quantities of volcano-tectonic events (VT), long-period events (LP), hybrid events, and harmonic and spasmodic tremor, and explosion events. Three temporary stand-alone dataloggers with broad-band seismometers and infrasonic microphones, installed with collaboration from the University of New Hampshire and the University of North Carolina, have supplemented this network throughout the summer.
Additionally, field visits by IG-EPN personnel have been conducted regularly. During an expedition on August 28, Differential Optical Absorption Spectroscopy (DOAS) and Forward Looking Infrared (FLIR) measurements were made to assess gas and thermal flux, respectively. DOAS measurements revealed a continuing flux of SO2 estimated at ~ 850 tons/day. The FLIR measurements confirmed near-magmatic temperatures at the vent. It also confirmed stagnation of all lava flows on the volcano since their maximum surface temperatures had cooled into the range of ~ 50°C.
Geologic Background. Volcán El Reventador is the most frequently active of a chain of Ecuadorian volcanoes in the Cordillera Real, well east of the principal volcanic axis. The forested, dominantly andesitic stratovolcano has 4-km-wide avalanche scarp open to the E formed by edifice collapse. A young, unvegetated, cone rises from the amphitheater floor to a height comparable to the rim. It has been the source of numerous lava flows as well as explosive eruptions visible from Quito, about 90 km ESE. Frequent lahars in this region of heavy rainfall have left extensive deposits on the scarp slope. The largest recorded eruption took place in 2002, producing a 17-km-high eruption column, pyroclastic flows that traveled up to 8 km, and lava flows from summit and flank vents.
Information Contacts: Jeffrey B. Johnson, Dept. of Earth Sciences, University of New Hampshire, Durham, NH 03824, USA; Patricio Ramón, Liliana Troncoso, Guillermo Viracucha, Jaime Lozada, Daniel Andrade, David Rivero, Gorky Ruiz, Pete Hall, and Wilson Enriquez, Geophysical Institute (IG), Escuela Politécnica Nacional, Apartado 17-01-2759, Quito, Ecuador (URL: http://www.igepn.edu.ec/).
Sheveluch (Russia) — August 2005 Cite this Report
Sheveluch
Russia
56.653°N, 161.36°E; summit elev. 3283 m
All times are local (unless otherwise noted)
22 September eruption generated a substantial pyroclastic flow
From March 2005 until July 2005, the lava dome at Shiveluch continued to grow and ash-and-gas plumes and gas-and-steam plumes were frequent (BGVN 30:06). The alert level was at Orange.
On 7 July, the Russian News and Information Agency (RIA Novosti) reported that Shiveluch was producing pyroclastic flows and ash plumes rising to 5 km altitude. On 8 July, Kamchatka Volcanic Eruptions Response Team (KVERT) raised the alert level from Orange to Red, the highest level. Video footage taken the same day showed weak gas-and-steam plumes rising to ~ 5 km altitude. On 9 July, ash-and-gas plumes rose to 3 km altitude and the alert level was reduced to Orange. Ash plumes extended 27 km SW of the volcano during July 11-12.
Through July and August, the lava dome continued to grow and Shiveluch remained at alert level Orange. On 15 July, RIA Novosti reported that "[m]assive ash emissions from Shiveluch...are posing danger to nearby towns and villages. The Federal Earthquake Prediction Center's Kamchatka branch said ash storms, as well as mudflows from Shiveluch's slopes, could be dangerous for nearby settlements . . .. [T]he volcano began emitting massive ash clouds. Gas, ash, and magmatic material . . . are barreling down the slope . . .. The ash cloud has spread more than 700 kilometers to the [W] of the volcano, covering the peninsula and the nearby Sea of Okhotsk with a nearly 150-kilometer-wide strip."
On 19 July KVERT reported that a gas-steam plume extended 30 km SW from the volcano on 18 July and a gas-steam plume up to 3.5 km altitude was observed on 19 July. On 19 July, 23 July, and during 5-12 August, satellite data from the USA and Russia indicated a persistent 1 to 7 pixel thermal anomaly at the dome. On 23 July and 6 August, incandescence was observed at the lava dome. Fumarolic activity was visible on 6 August.
During 19-26 August, about ten shallow earthquakes were recorded, and a larger thermal anomaly was visible on satellite imagery. On 19 August a new viscous lava flow was emitted from the lava dome and continued to flow during 26 August to 9 September. Several ash plumes reached ~ 5.5 km altitude.
On 5 September, an ash plume rose to ~ 4 km altitude. On 8 September, a hot avalanche was accompanied by an ash plume that rose to a height of ~ 3.5 km altitude. The large thermal anomaly continued during the first week of September. On 7 September RIA Novosti reported that Shiveluch "is spewing gas and ash to heights of up to 5,000 feet [1.5 km]". On 16 September KVERT reported that the dome was continuing to grow and that viscous lava continued to flow from the dome. Incandescence at the lava dome was observed on 13 September. Gas-steam plumes up to 3.5 km altitude and a large thermal anomaly were registered all week.
On 22 September KVERT raised the alert level to Red, the highest level, and reported that according to seismic data, at 05:15 UTC on 22 September, a paroxysmal eruption began. Ash plumes reached a height about 7.5 km altitude, and ash fall was noted from 06:00 until 08:00 UTC on 22 September by seismologists working about 9 km SW of the volcano.
KVERT reported, based on US and Russian satellite data, an ash cloud with a diameter of ~ 20 km located ~ 90 km to the NW of the volcano and, based on Russian satellite data, an ash cloud with a diameter of ~ 15 km located ~ 20 km to the SSE at about 3 km altitude. Ash fall was observed in Klyuchi on the night of 22 September. According to visual data, a new pyroclastic flow extended 10-15 km.
Geologic Background. The high, isolated massif of Sheveluch volcano (also spelled Shiveluch) rises above the lowlands NNE of the Kliuchevskaya volcano group. The 1,300 km3 andesitic volcano is one of Kamchatka's largest and most active volcanic structures, with at least 60 large eruptions during the Holocene. The summit of roughly 65,000-year-old Stary Shiveluch is truncated by a broad 9-km-wide late-Pleistocene caldera breached to the south. Many lava domes occur on its outer flanks. The Molodoy Shiveluch lava dome complex was constructed during the Holocene within the large open caldera; Holocene lava dome extrusion also took place on the flanks of Stary Shiveluch. Widespread tephra layers from these eruptions have provided valuable time markers for dating volcanic events in Kamchatka. Frequent collapses of dome complexes, most recently in 1964, have produced debris avalanches whose deposits cover much of the floor of the breached caldera.
Information Contacts: Olga A. Girina, Kamchatka Volcanic Eruptions Response Team (KVERT), a cooperative program of the Institute of Volcanic Geology and Geochemistry, Far East Division, Russian Academy of Sciences, Piip Ave. 9, Petropavlovsk-Kamchatsky, 683006, Russia, the Kamchatka Experimental and Methodical Seismological Department (KEMSD), GS RAS (Russia), and the Alaska Volcano Observatory (USA); Alaska Volcano Observatory (AVO), a cooperative program of the U.S. Geological Survey, 4200 University Drive, Anchorage, AK 99508-4667, USA (URL: http://www.avo.alaska.edu/), the Geophysical Institute, University of Alaska, PO Box 757320, Fairbanks, AK 99775-7320, USA, and the Alaska Division of Geological and Geophysical Surveys, 794 University Ave., Suite 200, Fairbanks, AK 99709, USA.
Soputan (Indonesia) — August 2005 Cite this Report
Soputan
Indonesia
1.112°N, 124.737°E; summit elev. 1785 m
All times are local (unless otherwise noted)
Sporadic explosions into mid-2005; photo of 18 July pyroclastic flow
On 18 October 2004 Soputan exploded, releasing a column of white-to-gray ash floating as high as 600 m above the crater rim and drifting E (BGVN 29:12).
On 12 December an eruption around 0050 produced an E-drifting ash cloud to ~ 1 km above the volcano. It was followed by a "hot cloud" that traveled about 200 m E towards Aeseput and a lava flow that traveled SW. The eruption was preceded by increased tremor on 11 December and visible incandescence in the crater. The Directorate of Volcanology and Geological Hazard Mitigation increased the Alert Level to 2 (on a scale of 1-4). According to the Darwin Volcanic Ash Advisory Centre an eruption cloud was visible on satellite imagery on 12 December at 0925 at an altitude of ~ 10.7 km.
On 1 February 2005 white vapor rose 50-75 m above the summit. Soputan began to erupt again at 0630 on 20 April, with a plume reaching ~ 1 km above the summit and drifting SE. In addition, lava fountains rose ~ 200 m above the volcano. From 1720 on 20 April until 0900 on 21 April, lava fountains rose 75-100 m. Rapid dome growth occurred and by 21 April the lava dome had spread about 250 m E and 200 m SW. On 22 April a "white ash plume" rose ~ 100 m, and on 23 April a dark gray ash plume rose to ~ 150 m and drifted NE. Ash eruptions through 24 April produced plumes to ~ 300 m above the volcano.
On 9 May a plume of white vapor rose 75 m above the summit. Soputan remained at Alert Level 2 through 9 May.
Further activities came to light as a result of a photograph taken during a violent eruption (figure 2). According to Syamsul Rizal, the photo was taken from Soputan volcano observatory, Maliku, ~ 12 km NW, on 18 July 2005. The eruption initially vented at the usual source on the NE flank. The pyroclastic flow that resulted was described from visible observations as less dense than those from collapses at Merapi and similar to those from Karangetang.
Geologic Background. The Soputan stratovolcano on the southern rim of the Quaternary Tondano caldera on the northern arm of Sulawesi Island is one of Sulawesi's most active volcanoes. The youthful, largely unvegetated volcano is the only active cone in the Sempu-Soputan volcanic complex, which includes the Soputan caldera, Rindengan, and Manimporok (3.5 km ESE). Kawah Masem maar was formed in the W part of the caldera and contains a crater lake; sulfur has been extracted from fumarolic areas in the maar since 1938. Recent eruptions have originated at both the summit crater and Aeseput, a prominent NE-flank vent that formed in 1906 and was the source of intermittent major lava flows until 1924.
Information Contacts: Directorate of Volcanology and Geological Hazard Mitigation (DVGHM), Jalan Diponegoro 57, Bandung 40122, Indonesia (URL: http://www.vsi.esdm.go.id/); Andrew Tupper, Darwin Volcanic Ash Advisory Centre (VAAC), Bureau of Meteorology, Northern Territory Regional Office, PO Box 40050, Casuarina, Northern Territory 0811, Australia (URL: http://www.bom.gov.au/info/vaac/soputan.shtml).
Soufriere Hills (United Kingdom) — August 2005 Cite this Report
Soufriere Hills
United Kingdom
16.72°N, 62.18°W; summit elev. 915 m
All times are local (unless otherwise noted)
Through at least 5 September 2005, the lava dome continued to grow
Soufrière Hills was relatively quiet through April and early May 2005, with activity increasing somewhat through June and several explosive events in late June and in July (BGVN 30:06). Table 61 summarizes activity during 8 July thorough 26 August 2005. Further text brings this report through 5 September, with the comment that slow dome growth continued.
Table 61. A summary of the weekly number of earthquakes (EQs), rockfalls, and averaged spot measurements of SO2 flux at Soufriere Hills during July and August 2005. Cases of "mixed earthquakes" were unreported during the reporting interval. Date ranges go from noon on the starting day to noon on the end day. Courtesy of MVO.
| Date |
Hybrid EQ's |
Volcano-tectonic EQ's |
Long-period EQ's |
Rockfalls |
SO2 Flux (metric tons/day) |
| 08 Jul-15 Jul 2005 |
10 |
2 |
-- |
-- |
660 |
| 15 Jul-22 Jul 2005 |
16 |
19 |
13 |
11 |
608 |
| 22 Jul-29 Jul 2005 |
4 |
29 |
5 |
23 |
510 |
| 29 Jul-05 Aug 2005 |
4 |
8 |
9 |
33 |
986 |
| 05 Aug-12 Aug 2005 |
3 |
3 |
5 |
14 |
770 |
| 12 Aug-19 Aug 2005 |
8 |
5 |
13 |
12 |
570 |
| 19 Aug-26 Aug 2005 |
6 |
5 |
13 |
15 |
900 |
On 6 August a vigorous eruption sent a plume to ~ 1.8 km above the volcano. Evidence of uplift and fracturing were observed on the crater floor, and an area of blocky lava resembling a small lava dome was observed. Due to poor visibility further observations will be necessary to determine if the feature is a new dome or was caused by the collapse, or uplift, of old dome rock.
Volcanic and seismic activity remained at elevated levels at Soufrière Hills during 12-19 August. Periodic ash venting continued, with a vigorous episode occurring on 18 August at 1800. On 16 August, the presence of a small blocky lava dome with talus slopes was confirmed. There was some ash venting from the dome, but no significant rockfalls were seen. Activity at Soufrière Hills remained at elevated levels during 2-9 September, the end of this reporting period. Observations made on 5 September suggested that slow lava-dome growth continued.
Geologic Background. The complex, dominantly andesitic Soufrière Hills volcano occupies the southern half of the island of Montserrat. The summit area consists primarily of a series of lava domes emplaced along an ESE-trending zone. The volcano is flanked by Pleistocene complexes to the north and south. English's Crater, a 1-km-wide crater breached widely to the east by edifice collapse, was formed about 2000 years ago as a result of the youngest of several collapse events producing submarine debris-avalanche deposits. Block-and-ash flow and surge deposits associated with dome growth predominate in flank deposits, including those from an eruption that likely preceded the 1632 CE settlement of the island, allowing cultivation on recently devegetated land to near the summit. Non-eruptive seismic swarms occurred at 30-year intervals in the 20th century, but no historical eruptions were recorded until 1995. Long-term small-to-moderate ash eruptions beginning in that year were later accompanied by lava-dome growth and pyroclastic flows that forced evacuation of the southern half of the island and ultimately destroyed the capital city of Plymouth, causing major social and economic disruption.
Information Contacts: Montserrat Volcano Observatory (MVO), Fleming, Montserrat, West Indies (URL: http://www.mvo.ms/).