Recently Published Bulletin Reports
Agung (Indonesia) Three eruptive events reported in April, May, and December 2022
Tengger Caldera (Indonesia) Minor ash emission in December 2023; persistent weak thermal anomaly in the Bromo crater
Saunders (United Kingdom) Persistent thermal anomalies from the summit crater lava lake during February 2023-January 2024
Shishaldin (United States) New eruption with significant Strombolian explosions, ash plumes, and ashfall
Ioto (Japan) New eruption with discolored water, ejecta, and floating pumice during October-December 2023
Purace (Colombia) Gas-and-ash emission on 16 November 2023
Suwanosejima (Japan) Eruption plumes, crater incandescence, and occasional explosions during July-October 2023
Etna (Italy) Strombolian explosions, lava fountains, and lava flows during July-August 2023
Aira (Japan) Explosions, ash plumes, ash fall, and crater incandescence during July-October 2023
Nishinoshima (Japan) Gray emissions during October 2023
Kilauea (United States) Strong lava fountains, lava flows, and spatter at Halema’uma’u during January-September 2023
Tinakula (Solomon Islands) Continued lava flows and thermal activity during June through November 2023
Agung (Indonesia) — January 2024  Cite this Report
Agung
Indonesia
8.343°S, 115.508°E; summit elev. 2997 m
All times are local (unless otherwise noted)
Three eruptive events reported in April, May, and December 2022
Mount Agung, located on the E end of the island of Bali, Indonesia, rises above the SE rim of the Batur caldera. The summit area extends 1.5 km E-W, with the highest point on the W and a steep-walled 800-m-wide crater on the E. Recorded eruptions date back to the early 19th century. A large and deadly explosive and effusive eruption occurred during 1963-64, which was characterized by voluminous ashfall, pyroclastic flows, and lahars that caused extensive damage and many fatalities. More recent activity was documented during November 2017-June 2019 that consisted of multiple explosions, significant ash plumes, lava flows at the summit crater, and incandescent ejecta. This report covers activity reported during April-May 2022 and December 2022 based on data from the Darwin Volcanic Ash Advisory Center (VAAC).
Activity during 2022 was relatively low and mainly consisted of a few ash plumes during April-May and December. An ash plume on 3 April rising to 3.7 km altitude (700 m above the summit) and drifting N was reported in a Darwin VAAC notice based on a ground report, with ash seen in HIMAWARI-8 visible imagery. Another ash plume was reported at 1120 on 27 May that rose to 5.5 km altitude (2.5 m above the summit); the plume was not visible in satellite or webcam images due to weather clouds. An eruption was reported based on seismic data at 0840 on 13 December, with an estimated plume altitude of 3.7 km; however, no ash was seen using satellite imagery in clear conditions before weather clouds obscured the summit.
Geologic Background. Symmetrical Agung stratovolcano, Bali's highest and most sacred mountain, towers over the eastern end of the island. The volcano, whose name means "Paramount," rises above the SE rim of the Batur caldera, and the northern and southern flanks extend to the coast. The summit area extends 1.5 km E-W, with the high point on the W and a steep-walled 800-m-wide crater on the E. The Pawon cone is located low on the SE flank. Only a few eruptions dating back to the early 19th century have been recorded in historical time. The 1963-64 eruption, one of the largest in the 20th century, produced voluminous ashfall along with devastating pyroclastic flows and lahars that caused extensive damage and many fatalities.
Information Contacts: Darwin Volcanic Ash Advisory Centre (VAAC), Bureau of Meteorology, Northern Territory Regional Office, PO Box 40050, Casuarina, NT 0811, Australia (URL: http://www.bom.gov.au/info/vaac/).
Tengger Caldera (Indonesia) — February 2024 Cite this Report
Tengger Caldera
Indonesia
7.942°S, 112.95°E; summit elev. 2329 m
All times are local (unless otherwise noted)
Minor ash emission in December 2023; persistent weak thermal anomaly in the Bromo crater
Tengger Caldera, located at the N end of a volcanic massif in Indonesia’s East Java, consists of five overlapping stratovolcanoes. The youngest and only active cone in the 16-km-wide caldera is Bromo, which typically produces gas-and-steam plumes, occasional ash plumes and explosions, and weak thermal signals (BGVN 44:05, 47:01). This report covers activity during January 2022-December 2023, consisting of mostly white gas-and-steam emissions and persistent weak thermal anomalies. Information was provided by the Pusat Vulkanologi dan Mitigasi Bencana Geologi (PVMBG, also known as Indonesian Center for Volcanology and Geological Hazard Mitigation, CVGHM) and satellite imagery. The Alert Level remained at 2 (on a scale of 1-4), and visitors were warned to stay at least 1 km from the crater.
Activity was generally low during the reporting period, similar to that in 2021. According to almost daily images from MAGMA Indonesia (a platform developed by PVMBG), white emissions and plumes rose from 50 to 900 m above the main crater during this period (figure 24). During several days in March and June 2022, white plumes reached heights of 1-1.2 km above the crater.
After an increase in activity at 2114 on 3 February 2023, a PVMBG team that was sent to observe white emissions rising as high as 300 m during 9-12 February and heard rumbling noises. A sulfur dioxide odor was also strong near the crater and measurements indicated that levels were above the healthy (non-hazardous) threshold of 5 parts per million; differential optical absorption spectroscopy (DOAS) measurements indicated an average flux of 190 metric tons per day on 11 February. Incandescence originating from a large fumarole in the NNW part of the crater was visible at night. The team observed that vegetation on the E caldera wall was yellow and withered. The seismic network recorded continuous tremor and deep and shallow volcanic earthquakes.
According to a PVMBG press release, activity increased on 13 December 2023 with white, gray, and brown emissions rising as high as 900 m above Bromo’s crater rim and drifting in multiple directions (figure 25). The report noted that tremor was continuous and was accompanied in December by three volcanic earthquakes. Deformation data indicated inflation in December. There was no observable difference in the persistent thermal anomaly in the crater between 11 and 16 December 2023.
All clear views of the Bromo crater throughout this time, using Sentinel-2 infrared satellite images, showed a weak persistent thermal anomaly; none of the anomalies were strong enough to cause MODVOLC Thermal Alerts. A fire in the SE part of the caldera in early September 2023 resulted in a brief period of strong thermal anomalies.
Geologic Background. The 16-km-wide Tengger caldera is located at the northern end of a volcanic massif extending from Semeru volcano. The massive volcanic complex dates back to about 820,000 years ago and consists of five overlapping stratovolcanoes, each truncated by a caldera. Lava domes, pyroclastic cones, and a maar occupy the flanks of the massif. The Ngadisari caldera at the NE end of the complex formed about 150,000 years ago and is now drained through the Sapikerep valley. The most recent of the calderas is the 9 x 10 km wide Sandsea caldera at the SW end of the complex, which formed incrementally during the late Pleistocene and early Holocene. An overlapping cluster of post-caldera cones was constructed on the floor of the Sandsea caldera within the past several thousand years. The youngest of these is Bromo, one of Java's most active and most frequently visited volcanoes.
Information Contacts: Pusat Vulkanologi dan Mitigasi Bencana Geologi (PVMBG, also known as Indonesian Center for Volcanology and Geological Hazard Mitigation, CVGHM), Jalan Diponegoro 57, Bandung 40122, Indonesia (URL: http://www.vsi.esdm.go.id/); MAGMA Indonesia, Kementerian Energi dan Sumber Daya Mineral (URL: https://magma.esdm.go.id/v1); Copernicus Browser, Copernicus Data Space Ecosystem, European Space Agency (URL: https://dataspace.copernicus.eu/browser/); Hawai'i Institute of Geophysics and Planetology (HIGP) - MODVOLC Thermal Alerts System, School of Ocean and Earth Science and Technology (SOEST), Univ. of Hawai'i, 2525 Correa Road, Honolulu, HI 96822, USA (URL: http://modis.higp.hawaii.edu/).
Saunders (United Kingdom) — February 2024 Cite this Report
Saunders
United Kingdom
57.8°S, 26.483°W; summit elev. 843 m
All times are local (unless otherwise noted)
Persistent thermal anomalies from the summit crater lava lake during February 2023-January 2024
Saunders is one of eleven islands that comprise the South Sandwich Islands in the South Atlantic. The active Mount Michael volcano has been in almost continuous eruption since November 2014 (BGVN 48:02). Recent activity has resulted in intermittent thermal anomalies and gas-and-steam emissions (BGVN 47:03, 48:02). Visits are infrequent due to its remote location, and cloud cover often prevents satellite observations. Satellite thermal imagery and visual observation of incandescence during a research expedition in 2019 (BGVN 28:02 and 44:08) and a finding confirmed by a National Geographic Society research team that summited Michael in November 2022 reported the presence of a lava lake.
Although nearly constant cloud cover during February 2023 through January 2024 greatly limited satellite observations, thermal anomalies from the lava lake in the summit crater were detected on clear days, especially around 20-23 August 2023. Anomalies similar to previous years (eg. BGVN 48:02) were seen in both MIROVA (Middle InfraRed Observation of Volcanic Activity) data from MODIS instruments and in Sentinel 2 infrared imagery. The only notable sulfur dioxide plume detected near Saunders was on 25 September 2023, with the TROPOMI instrument aboard the Sentinel-5P satellite.
Geologic Background. Saunders Island consists of a large central volcanic edifice intersected by two seamount chains, as shown by bathymetric mapping (Leat et al., 2013). The young Mount Michael stratovolcano dominates the glacier-covered island, while two submarine plateaus, Harpers Bank and Saunders Bank, extend north. The symmetrical Michael has a 500-m-wide summit crater and a remnant of a somma rim to the SE. Tephra layers visible in ice cliffs surrounding the island are evidence of recent eruptions. Ash clouds were reported from the summit crater in 1819, and an effusive eruption was inferred to have occurred from a N-flank fissure around the end of the 19th century and beginning of the 20th century. A low ice-free lava platform, Blackstone Plain, is located on the north coast, surrounding a group of former sea stacks. A cluster of cones on the SE flank, the Ashen Hills, appear to have been modified since 1820 (LeMasurier and Thomson, 1990). Analysis of satellite imagery available since 1989 (Gray et al., 2019; MODVOLC) suggests frequent eruptive activity (when weather conditions allow), volcanic clouds, steam plumes, and thermal anomalies indicative of a persistent, or at least frequently active, lava lake in the summit crater. Due to this observational bias, there has been a presumption when defining eruptive periods that activity has been ongoing unless there is no evidence for at least 10 months.
Information Contacts: MIROVA (Middle InfraRed Observation of Volcanic Activity), a collaborative project between the Universities of Turin and Florence (Italy) supported by the Centre for Volcanic Risk of the Italian Civil Protection Department (URL: http://www.mirovaweb.it/); NASA Global Sulfur Dioxide Monitoring Page, Atmospheric Chemistry and Dynamics Laboratory, NASA Goddard Space Flight Center (NASA/GSFC), 8800 Greenbelt Road, Goddard MD 20771, USA (URL: https://so2.gsfc.nasa.gov/); Copernicus Browser (URL: https://dataspace.copernicus.eu/browser).
Shishaldin (United States) — December 2023 Cite this Report
Shishaldin
United States
54.756°N, 163.97°W; summit elev. 2857 m
All times are local (unless otherwise noted)
New eruption with significant Strombolian explosions, ash plumes, and ashfall
Shishaldin is located on the eastern half of Unimak Island, one of the Aleutian Islands. Frequent explosive activity, primarily consisting of Strombolian ash eruptions from the small summit crater, but sometimes producing lava flows, has been recorded since the 18th century. The previous eruption ended in May 2020 and was characterized by intermittent thermal activity, increased seismicity and surface temperatures, ash plumes, and ash deposits (BGVN 45:06). This report covers a new eruption during July through November 2023, which consisted of significant explosions, ash plumes, ashfall, and lava fountaining. Information comes from daily, weekly, and special reports from the Alaska Volcano Observatory (AVO) and various satellite data. AVO monitors the volcano using local seismic and infrasound sensors, satellite data, web cameras, and remote infrasound and lightning networks.
AVO reported that intermittent tremor and low-frequency earthquakes had gradually become more regular and consistent during 10-13 July. Strongly elevated surface temperatures at the summit were identified in satellite images during 10-13 July. On 11 July AVO raised the Aviation Color Code (ACC) to Yellow (the second color on a four-color scale) and Volcano Alert Level (VAL) to Advisory (the second level on a four-level scale) at 1439. Later in the day on 11 July summit crater incandescence was observed in webcam images. Observations of the summit suggested that lava was likely present at the crater, which prompted AVO to raise the ACC to Orange (the second highest color on a four-color scale) and the VAL to Watch (the second highest level on a four-level scale). The US Coast Guard conducted an overflight on 12 July and confirmed that lava was erupting from the summit. That same day, sulfur dioxide emissions were detected in satellite images.
A significant explosion began at 0109 on 14 July that produced an ash plume that rose to 9-12 km altitude and drifted S over the Pacific Ocean (figure 43). Webcam images and photos taken around 0700 from a ship SW off Unimak Island showed small lahar deposits, which were the result of the interaction of hot pyroclastic material and snow and ice on the flanks. There was also ashfall on the SW and N flanks. A smaller explosion at 0710 generated an ash plume that rose to 4.5 km altitude. Webcam images and pilot reports showed continued low-level ash emissions during the morning, rising to less than 4.6 km altitude; those emissions included a small ash plume near the summit around 1030 resulting from a small explosion.
Seismic tremor amplitude began increasing at around 1700 on 15 July; strongly elevated surface temperatures were also reported. An ash plume rose to 4.6 km altitude and drifted SSE at 2100, based on a satellite image. A continuous ash plume during 2150 through 2330 rose to 5 km altitude and extended 125 km S. At 2357 AVO raised the ACC to Red (the highest color on a four-color scale) and the VAL to Warning (the highest level on a four-level scale), noting that seismicity remained elevated for more than six hours and explosion signals were frequently detected by regional infrasound (pressure sensor) networks. Explosions generated an ash plume that rose to 4.9 km altitude and drifted as far as 500 km SE. Activity throughout the night declined and by 0735 the ACC was lowered to Orange and the VAL to Watch. High-resolution satellite images taken on 16 July showed pyroclastic deposits extending as far as 3 km from the vent; these deposits generated lahars that extended further down the drainages on the flanks. Ash deposits were mainly observed on the SSE flank and extended to the shore of Unimak Island. During 16-17 July lava continued to erupt at the summit, which caused strongly elevated surface temperatures that were visible in satellite imagery.
Lava effusion increased at 0100 on 18 July, as noted in elevated surface temperatures identified in satellite data, increasing seismic tremor, and activity detected on regional infrasound arrays. A significant ash plume at 0700 rose to 7 km altitude and continued until 0830, eventually reaching 9.1 km altitude and drifting SSE (figure 44). As a result, the ACC was raised to Red and the VAL to Warning. By 0930 the main plume detached, but residual low-level ash emissions continued for several hours, remaining below 3 km altitude and drifting S. The eruption gradually declined and by 1208 the ACC was lowered to Orange and the VAL was lowered to Watch. High-resolution satellite images showed ash deposits on the SW flank and pyroclastic deposits on the N, E, and S flanks, extending as far as 3 km from the vent; lahars triggered by the eruption extended farther down the flanks (figure 45). Lava continued to erupt from the summit crater on 19 July.
Elevated surface temperatures were detected in satellite images during 19-25 July, despite occasional weather cloud cover, which was consistent with increased lava effusion. During 22-23 July satellite observations acquired after the eruption from 18 July showed pyroclastic flow and lahar deposits extending as far as 3 km down the N, NW, and NE flanks and as far as 1.5 km down the S and SE flanks. Ash deposits covered the SW and NE flanks. No lava flows were observed outside the crater. On 22 July a sulfur dioxide plume was detected in satellite data midday that had an estimated mass of 10 kt. In a special notice issued at 1653 on 22 July AVO noted that eruptive activity had intensified over the previous six hours, which was characterized by an hours-long steady increase in seismic tremor, intermittent infrasound signals consistent with small explosions, and an increase in surface temperatures that were visible in satellite data. Pilots first reported low-level ash plumes at around 1900. At 2320 an ash plume had risen to 9 km altitude based on additional pilot reports and satellite images. The ACC was increased to Red and the VAL to Warning at 2343. Satellite images indicated growth of a significantly higher ash plume that rose to 11 km altitude continued until 0030 and drifted NE. During the early morning hours of 23 July ash plumes had declined to 4.6 k altitude. Seismic tremor peaked at 0030 on 23 July and began to rapidly decline at 0109; active ash emissions were no longer visible in satellite data by 0130. The ACC was lowered to Orange and the VAL to Watch at 0418; bursts of increased seismicity were recorded throughout the morning, but seismicity generally remained at low levels. Elevated surface temperatures were visible in satellite data until about 0600. On 24 July pilots reported seeing vigorous gas-and-steam plumes rising to about 3 km altitude; the plumes may have contained minor amounts of ash.
During 24-25 July low level seismicity and volcanic tremor were detected at low levels following the previous explosion on 23 July. Strongly elevated surface temperatures were observed at the summit crater in satellite data. Around 2200 on 25 July seismicity began to increase, followed by infrasound signals of explosions after 0200 on 26 July. An ash plume rose to 3 km altitude at 0500 and drifted ENE, along with an associated sulfur dioxide plume that drifted NE and had an estimated mass of 22 kt. Diffuse ash emissions were visible in satellite data and rose to 6.1-7.6 km altitude and extended 125 km from the volcano starting around 1130. These ash events were preceded by about seven hours of seismic tremor, infrasound detections of explosions, and five hours of increased surface temperatures visible in satellite data. Activity began to decline around 1327, which included low-frequency earthquakes and decreased volcanic tremor, and infrasound data no longer detected significant explosions. Surface temperatures remained elevated through the end of the month.
Seismicity, volcanic tremor, and ash emissions remained at low levels during early August. Satellite images on 1 August showed that some slumping had occurred on the E crater wall due to the recent explosive activity. Elevated surface temperatures continued, which was consistent with cooling lava. On 2 August small explosive events were detected, consistent with low-level Strombolian activity. Some episodes of volcanic tremor were reported, which reflected low-level ash emissions. Those ash emissions rose to less than 3 km altitude and drifted as far as 92.6 km N. Pilots that were located N of the volcano observed an ash plume that rose to 2.7 km altitude. Seismicity began to increase in intensity around 0900 on 3 August. Seismicity continued to increase throughout the day and through the night with strongly elevated surface temperatures, which suggested that lava was active at the surface.
An ash cloud that rose to 7.6-7.9 km altitude and drifted 60-75 km NE was visible in a satellite image at 0520 on 4 August. Pilots saw and reported the plume at 0836 (figure 46). By 0900 the plume had risen to 9.1 km altitude and extended over 100 km NE. AVO raised the ACC to Red and the VAL to Warning as a result. Seismic tremor levels peaked at 1400 and then sharply declined at 1500 to slightly elevated levels; the plume was sustained during the period of high tremor and drifted N and NE. The ACC was lowered to Orange and the VAL to Watch at 2055. During 5-14 August seismicity remained low and surface temperatures were elevated based on satellite data due to cooling lava. On 9 August a small lava flow was observed that extended from the crater rim to the upper NE flank. It had advanced to 55 m in length and appeared in satellite imagery on 11 August. Occasional gas-and-steam plumes were noted in webcam images. At 1827 AVO noted that seismic tremor had steadily increased during the afternoon and erupting lava was visible at the summit in satellite images.
Strong explosion signals were detected at 0200 on 15 August. An ash cloud that was visible in satellite data extended 100 km NE and may have risen as high as 11 km altitude around 0240. By 0335 satellite images showed the ash cloud rising to 7.6 km altitude and drifting NE. Significant seismicity and explosions were detected by the local AVO seismic and infrasound networks, and volcanic lightning was detected by the World Wide Lightning Location Network (WWLLN). A sulfur dioxide plume associated with the eruption drifted over the S Bering Sea and parts of Alaska and western Canada. Seismicity was significantly elevated during the eruption but had declined by 1322. A pilot reported that ash emissions continued, rising as high as 4.9 km altitude. Elevated surface temperatures detected in satellite data were caused by hot, eruptive material (pyroclastic debris and lava) that accumulated around the summit. Eruptive activity declined by 16 August and the associated sulfur dioxide plume had mostly dissipated; remnants continued to be identified in satellite images at least through 18 August. Surface temperatures remained elevated based on satellite images, indicating hot material on the upper parts of the volcano. Small explosions were detected in infrasound data on the morning of 19 August and were consistent with pilot reports of small, short-lived ash plumes that rose to about 4.3 km altitude. Low-level explosive activity was reported during 20-24 August, according to seismic and infrasound data, and weather clouds sometimes prevented views. Elevated surface temperatures were observed in satellite images, which indicated continued hot material on the upper parts of the volcano.
Seismic tremor began to increase at around 0300 on 25 August and was followed by elevated surface temperatures identified in satellite images, consistent with erupting lava. Small explosions were recorded in infrasound data. The ACC was raised to Red and the VAL to Warning at 1204 after a pilot reported an ash plume that rose to 9.1 km altitude. Seismicity peaked at 1630 and began to rapidly decline at around 1730. Ash plumes rose as high as 10 km altitude and drifted as far as 400 km NE. By 2020 the ash plumes had declined to 6.4 km altitude and continued to drift NE. Ash emissions were visible in satellite data until 0000 on 26 August and seismicity was at low levels. AVO lowered the ACC to Orange and the VAL to Watch at 0030. Minor explosive activity within the summit crater was detected during 26-28 August and strongly elevated surface temperatures were still visible in satellite imagery through the rest of the month. An AVO field crew working on Unimak Island observed a mass flow that descended the upper flanks beginning around 1720 on 27 August. The flow produced a short-lived ash cloud that rose to 4.5 km altitude and rapidly dissipated. The mass flow was likely caused by the collapse of spatter that accumulated on the summit crater rim.
Similar variable explosive activity was reported in September, although weather observations sometimes prevented observations. A moderate resolution satellite image from the afternoon of 1 September showed gas-and-steam emissions filling the summit crater and obscuring views of the vent. In addition, hot deposits from the previous 25-26 August explosive event were visible on the NE flank near the summit, based on a 1 September satellite image. On 2 and 4 September seismic and infrasound data showed signals of small, repetitive explosions. Variable gas-and-steam emissions from the summit were visible but there was no evidence of ash. Possible summit crater incandescence was visible in nighttime webcam images during 3-4 September.
Seismicity began to gradually increase at around 0300 on 5 September and activity escalated at around 0830. A pilot reported an ash plume that rose to 7.6 km altitude at 0842 and continued to rise as high as possibly 9.7 km altitude and drifted SSE based on satellite images (figure 47). The ACC was raised to Red and the VAL to Warning at 0900. In addition to strong tremor and sustained explosions, the eruption produced volcanic lightning that was detected by the WWLLN. Around 1100 seismicity decreased and satellite data confirmed that the altitude of the ash emissions had declined to 7.6 km altitude. By 1200 the lower-altitude portion of the ash plume had drifted 125 km E. Significant ash emissions ended by 1330 based on webcam images. The ACC was lowered to Orange and the VAL to Watch at 1440. Satellite images showed extensive pyroclastic debris flows on most of the flanks that extended 1.2-3.3 km from the crater rim.
During 6-13 September elevated surface temperatures continued to be observed in satellite data, seismicity remained elevated with weak but steady tremor, and small, low-frequency earthquakes and small explosions were reported, except on 12 September. On 6 September a low-level ash plume rose to 1.5-1.8 km altitude and drifted SSE. Occasional small and diffuse gas-and-steam emissions at the summit were visible in webcam images. Around 1800 on 13 September seismic tremor amplitudes began to increase, and small explosions were detected in seismic and infrasound data. Incandescent lava at the summit was seen in a webcam image taken at 0134 on 14 September during a period of elevated tremor. No ash emissions were reported during the period of elevated seismicity. Lava fountaining began around 0200, based on webcam images. Satellite-based radar observations showed that the lava fountaining activity led to the growth of a cone in the summit crater, which refilled most of the crater. By 0730 seismicity significantly declined and remained at low levels.
Seismic tremor began to increase around 0900 on 15 September and rapidly intensified. An explosive eruption began at around 1710, which prompted AVO to raise the ACC to Red and the VAL to Warning. Within about 30 minutes ash plumes drifted E below a weather cloud at 8.2 km altitude. The National Weather Service estimated that an ash-rich plume rose as high as 12.8 km altitude and produced volcanic lightning. The upper part of the ash plume detached from the vent around 1830 and drifted E, and was observed over the Gulf of Alaska. Around the same time, seismicity dramatically decreased. Trace ashfall was reported in the community of False Pass (38 km ENE) between 1800-2030 and also in King Cove and nearby marine waters. Activity declined at around 1830 although seismicity remained elevated, ash emissions, and ashfall continued until 2100. Lightning was again detected beginning around 1930, which suggested that ash emissions continued. Ongoing explosions were detected in infrasound data, at a lower level than during the most energetic phase of this event. Lightning was last detected at 2048. By 2124 the intensity of the eruption had decreased, and ash emissions were likely rising to less than 6.7 km altitude. Seismicity returned to pre-eruption levels. On 16 September the ACC was lowered to Orange and the VAL to Watch at 1244; the sulfur dioxide plume that was emitted from the previous eruption event was still visible over the northern Pacific Ocean. Elevated surface temperatures, gas-and-steam emissions from the vent, and new, small lahars were reported on the upper flanks based on satellite and webcam images. Minor deposits were reported on the flanks which were likely the result of collapse of previously accumulated lava near the summit crater.
Elevated seismicity with tremor, small earthquakes, and elevated surface temperatures were detected during 17-23 September. Minor gas-and-steam emissions were visible in webcam images. On 20 September small volcanic debris flows were reported on the upper flanks. On 21 September a small ash deposit was observed on the upper flanks extending to the NE based on webcam images. Seismic tremor increased significantly during 22-23 September. Regional infrasound sensors suggested that low-level eruptive activity was occurring within the summit crater by around 1800 on 23 September. Even though seismicity was at high levels, strongly elevated surface temperatures indicating lava at the surface were absent and no ash emissions were detected; weather clouds at 0.6-4.6 km altitude obscured views. At 0025 on 24 September AVO noted that seismicity continued at high levels and nearly continuous small infrasound signals began, likely from low-level eruptive activity. Strongly elevated surface temperatures were identified in satellite images by 0900 and persisted throughout the day; the higher temperatures along with infrasound and seismic data were consistent with lava erupting at the summit. Around 1700 similarly elevated surface temperatures were detected from the summit in satellite data, which suggested that more vigorous lava fountaining had started. Starting around 1800 low-level ash emissions rose to altitudes less than 4.6 km altitude and quickly dissipated.
Beginning at midnight on 25 September, a series of seismic signals consistent with volcanic flows were recorded on the N side of the volcano. A change in seismicity and infrasound signals occurred around 0535 and at 0540 a significant ash cloud formed and quickly reached 14 km altitude and drifted E along the Alaska Peninsula. The cloud generated at least 150 lightning strokes with thunder that could be heard by people in False Pass. Seismicity rapidly declined to near background levels around 0600. AVO increased the ACC to Red and the VAL to Warning at 0602. The ash cloud detached from the volcano at around 0700, rose to 11.6 km altitude, and drifted ESE. Trace to minor amounts of ashfall were reported by the communities of False Pass, King Cove, Cold Bay, and Sand Point around 0700. Ash emissions continued at lower altitudes of 6-7.6 km altitude at 0820. Small explosions at the vent area continued to be detected in infrasound data and likely represented low-level eruptive activity near the vent. Due to the significant decrease in seismicity and ash emissions the ACC was lowered to Orange and the VAL to Watch at 1234. Radar data showed significant collapses of the crater that occurred on 25 September. Satellite data also showed significant hot, degassing pyroclastic and lahar deposits on all flanks, including more extensive flows on the ENE and WSW sections below two new collapse scarps. Following the significant activity during 24-25 September, only low-level activity was observed. Seismicity decreased notably near the end of the strong activity on 25 September and continued to decrease through the end of the month, though tremor and small earthquakes were still reported. No explosive activity was detected in infrasound data through 2 October. Gas-and-steam emissions rose to 3.7 km altitude, as reported by pilots and seen in satellite images. Satellite data from 26 September showed that significant collapses had occurred at the summit crater and hot, steaming deposits from pyroclastic flows and lahars were present on all the flanks, particularly to the ENE and WSW. A small ash cloud was visible in webcam images on 27 September, likely from a collapse at the summit cone. High elevated surface temperatures were observed in satellite imagery during 27-28 September, which were likely the result of hot deposits on the flanks erupted on 25 September. Minor steaming at the summit crater and from an area on the upper flanks was visible in webcam images on 28 September.
During October, explosion events continued between periods of low activity. Seismicity significantly increased starting at around 2100 on 2 October; around the same time satellite images showed an increase in surface temperatures consistent with lava fountaining. Small, hot avalanches of rock and lava descended an unspecified flank. In addition, a distinct increase in infrasound, seismicity, and lightning detections was followed by an ash plume that rose to 12.2 km altitude and drifted S and E at 0520 on 3 October, based on satellite images. Nighttime webcam images showed incandescence due to lava fountaining at the summit and pyroclastic flows descending the NE flank. AVO reported that a notable explosive eruption started at 0547 and lasted until 0900 on 3 October, which prompted a rise in the ACC to Red and the VAL to Warning. Subsequent ash plumes rose to 6-7.6 km altitude by 0931. At 1036 the ACC was lowered back to Orange and the VAL to Watch since both seismic and infrasound data quieted substantially and were slightly above background levels. Gas-and-steam emissions were observed at the summit, based on webcam images. Trace amounts of ashfall were observed in Cold Bay. Resuspended ash was present at several kilometers altitude near the volcano. During the afternoon, low-level ash plumes were visible at the flanks, which appeared to be largely generated by rock avalanches off the summit crater following the explosive activity. These ash plumes rose to 3 km altitude and drifted W. Trace amounts of ashfall were reported by observers in Cold Bay and Unalaska and flights to these communities were disrupted by the ash cloud. Satellite images taken after the eruption showed evidence of pyroclastic flows and lahar deposits in drainages 2 km down the SW flank and about 3.2 km down the NE flank, and continued erosion of the crater rim. Small explosion craters at the end of the pyroclastic flows on the NE flank were noted for the first time, which may have resulted from gas-and-steam explosions when hot deposits interact with underlying ice.
During 4 October seismicity, including frequent small earthquakes, remained elevated, but was gradually declining. Ash plumes were produced for over eight hours until around 1400 that rose to below 3.7 km altitude. These ash plumes were primarily generated off the sides of the volcano where hot rock avalanches from the crater rim had entered drainages to the SW and NE. Two explosion craters were observed at the base of the NE deposits about 3.2 km from the crater rim. Webcam images showed the explosion craters were a source of persistent ash emissions; occasional collapse events also generated ash. Seismicity remained elevated with sulfur dioxide emissions that had a daily average of more than 1,000 tons per day, and frequent small earthquakes through the end of the month. Frequent elevated surface temperatures were identified in satellite images and gas-and-steam plumes were observed in webcam images, although weather conditions occasionally prevented clear views of the summit. Emissions were robust during 14-16 October and were likely generated by the interaction of hot material and snow and ice. During the afternoon of 21 October a strong gas-and-steam plume rose to 3-4.6 km altitude and extended 40 km WSW, based on satellite images and reports from pilots. On 31 October the ACC was lowered to Yellow and the VAL was lowered to Advisory.
Activity in November was characterized by elevated seismicity with ongoing seismic tremor and small, low-frequency earthquakes, elevated surface temperatures, and gas-and-steam emissions. There was an increase in seismic and infrasound tremor amplitudes starting at 1940 on 2 November. As a result, the ACC was again raised to Orange and the VAL was increased to Watch, although ash was not identified in satellite data. An ash cloud rose to 6.1 km altitude and drifted W according to satellite data at 2000. By 0831 on 3 November ash emissions were no longer visible in satellite images. On 6 and 9 November air pressure sensors detected signals consistent with small explosions. Small explosions were detected in infrasound data consistent with weak Strombolian activity on 19 and 21 November. Seismicity started to decrease on 21 November. On 25 November gas-and-steam emissions were emitted from the vent as well as from a scarp on the NE side of the volcano near the summit. A gas-and-steam plume extended about 50 km SSE and was observed in satellite and webcam images on 26 November. On 28 November small explosions were observed in seismic and local infrasound data and gas-and-steam emissions were visible from the summit and from the upper NE collapse scarp based on webcam images. Possible small explosions were observed in infrasound data on 30 November. Weakly elevated surface temperatures and a persistent gas-and-steam plume from the summit and collapse scarps on the upper flanks. A passing aircraft reported the gas-and-steam plume rose to 3-3.4 km altitude on 30 November, but no significant ash emissions were detected.
Satellite data. MODIS thermal anomaly data provided through MIROVA (Middle InfraRed Observation of Volcanic Activity) showed a strong pulse of thermal activity beginning in July 2023 that continued through November 2023 (figure 48). This strong activity was due to Strombolian explosions and lava fountaining events at the summit crater. According to data from MODVOLC thermal alerts, a total of 101 hotspots were detected near the summit crater in July (11-14, 16-19, 23-24 and 26), August (4, 25-26, and 29), September (5, 12, and 17), and October (3, 4, and 8). Infrared satellite data showed large lava flows descending primarily the northern and SE flanks during the reporting period (figure 49). Sulfur dioxide plumes often exceeded two Dobson Units (DUs) and drifted in different directions throughout the reporting period, based on satellite data from the TROPOMI instrument on the Sentinel-5P satellite (figure 50).
Geologic Background. The symmetrical glacier-covered Shishaldin in the Aleutian Islands is the westernmost of three large stratovolcanoes in the eastern half of Unimak Island. The Aleuts named the volcano Sisquk, meaning "mountain which points the way when I am lost." Constructed atop an older glacially dissected edifice, it is largely basaltic in composition. Remnants of an older edifice are exposed on the W and NE sides at 1,500-1,800 m elevation. There are over two dozen pyroclastic cones on its NW flank, which is covered by massive aa lava flows. Frequent explosive activity, primarily consisting of Strombolian ash eruptions from the small summit crater, but sometimes producing lava flows, has been recorded since the 18th century. A steam plume often rises from the summit crater.
Information Contacts: Alaska Volcano Observatory (AVO), a cooperative program of a) U.S. Geological Survey, 4200 University Drive, Anchorage, AK 99508-4667 USA (URL: https://avo.alaska.edu/), b) Geophysical Institute, University of Alaska, PO Box 757320, Fairbanks, AK 99775-7320, USA, and c) Alaska Division of Geological & Geophysical Surveys, 794 University Ave., Suite 200, Fairbanks, AK 99709, USA (URL: http://dggs.alaska.gov/); MIROVA (Middle InfraRed Observation of Volcanic Activity), a collaborative project between the Universities of Turin and Florence (Italy) supported by the Centre for Volcanic Risk of the Italian Civil Protection Department (URL: http://www.mirovaweb.it/); Hawai'i Institute of Geophysics and Planetology (HIGP) - MODVOLC Thermal Alerts System, School of Ocean and Earth Science and Technology (SOEST), Univ. of Hawai'i, 2525 Correa Road, Honolulu, HI 96822, USA (URL: http://modis.higp.hawaii.edu/); NASA Global Sulfur Dioxide Monitoring Page, Atmospheric Chemistry and Dynamics Laboratory, NASA Goddard Space Flight Center (NASA/GSFC), 8800 Greenbelt Road, Goddard, Maryland, USA (URL: https://so2.gsfc.nasa.gov/); Copernicus Browser, Copernicus Data Space Ecosystem, European Space Agency (URL: https://dataspace.copernicus.eu/browser/).
Ioto
Japan
24.751°N, 141.289°E; summit elev. 169 m
All times are local (unless otherwise noted)
New eruption with discolored water, ejecta, and floating pumice during October-December 2023
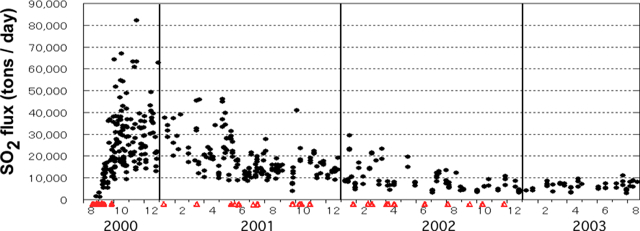
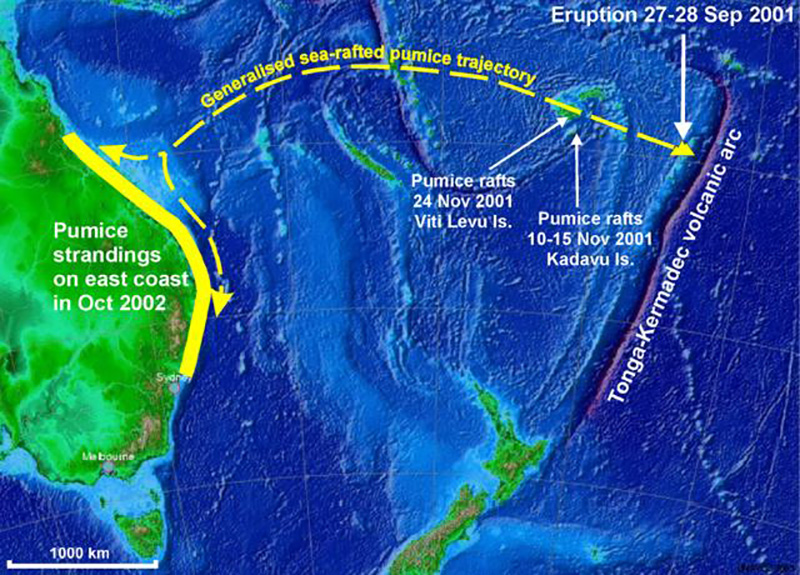
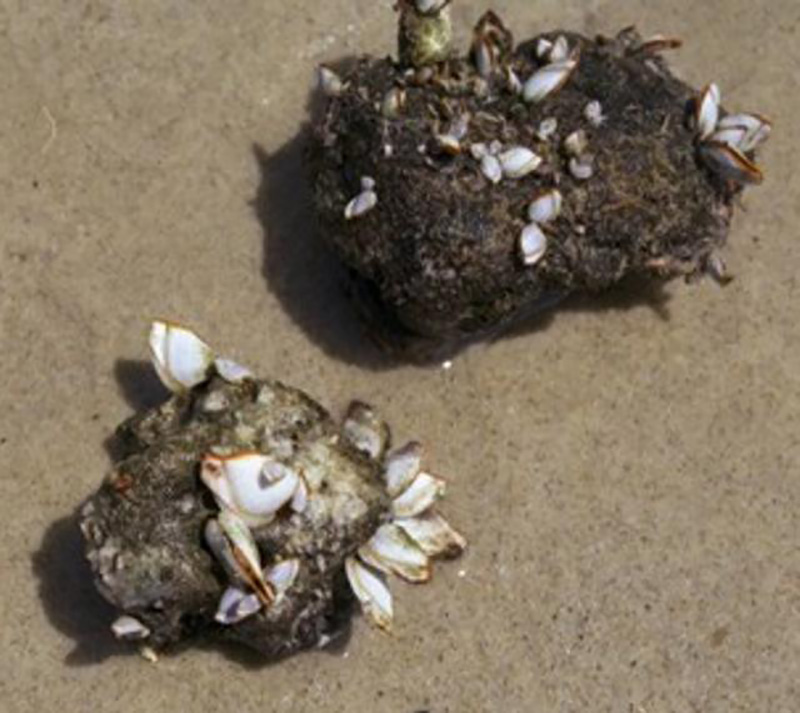
Ioto (Iwo-jima), located about 1,200 km S of Tokyo, lies within a 9-km-wide submarine caldera along the Izu-Bonin-Mariana volcanic arc. Previous eruptions date back to 1889 and have consisted of dominantly phreatic explosions, pumice deposits during 2001, and discolored water. A submarine eruption during July through December 2022 was characterized by discolored water, pumice deposits, and gas emissions (BGVN 48:01). This report covers a new eruption during October through December 2023, which consisted of explosions, black ejecta, discolored water, and floating pumice, based on information from the Japan Meteorological Association (JMA), the Japan Coast Guard (JCG), and satellite data.
JMA reported that an eruption had been occurring offshore of Okinahama on the SE side of the island since 21 October, which was characterized by volcanic tremor, according to the Japan Maritime Self-Defense Force (JMSDF) Iwo Jima Air Base (figure 22). According to an 18 October satellite image a plume of discolored water at the site of this new eruption extended NE (figure 23). During an overflight conducted on 30 October, a vent was identified about 1 km off the coast of Okinahama. Observers recorded explosions every few minutes that ejected dark material about 20 m above the ocean and as high as 150 m. Ejecta from the vent formed a black-colored island about 100 m in diameter, according to observations conducted from the air by the Earthquake Research Institute of the University of Tokyo in cooperation with the Mainichi newspaper (figure 24). Occasionally, large boulders measuring more than several meters in size were also ejected. Observations from the Advanced Land Observing Satellite Daichi-2 and Sentinel-2 satellite images also confirmed the formation of this island (figure 23). Brown discolored water and floating pumice were present surrounding the island.
The eruption continued during November. During an overflight on 3 November observers photographed the island and noted that material was ejected 169 m high, according to a news source. Explosions gradually became shorter, and, by the 3rd, they occurred every few seconds; dark and incandescent material were ejected about 800 m above the vent. On 4 November eruptions were accompanied by explosive sounds. Floating, brown-colored pumice was present in the water surrounding the island. There was a brief increase in the number of volcanic earthquakes during 8-14 November and 24-25 November. The eruption temporarily paused during 9-11 November and by 12 November eruptions resumed to the W of the island. On 10 November dark brown-to-dark yellow-green discolored water and a small amount of black floating material was observed (figure 25). A small eruption was reported on 18 November off the NE coast of the island, accompanied by white gas-and-steam plumes (figure 23). Another pause was recorded during 17-19 November, which then resumed on 20 November and continued erupting intermittently. According to a field survey conducted by the National Institute for Disaster Prevention Science and Technology on 19 November, a 30-m diameter crater was visible on the NE coast where landslides, hot water, and gray volcanic ash containing clay have occurred and been distributed previously. Erupted blocks about 10 cm in diameter were distributed about 90-120 m from the crater. JCG made observations during an overflight on 23 November and reported a phreatomagmatic eruption. Explosions at the main vent generated dark gas-and-ash plumes that rose to 200 m altitude and ejected large blocks that landed on the island and in the ocean (figure 26). Discolored water also surrounded the island. The size of the new island had grown to 450 m N-S x 200 m E-W by 23 November, according to JCG.
The eruption continued through 11 December, followed by a brief pause in activity, which then resumed on 31 December, according to JMA. Intermittent explosions produced 100-m-high black plumes at intervals of several minutes to 30 minutes during 1-10 December. Overflights were conducted on 4 and 15 December and reported that the water surrounding the new island was discolored to dark brown-to-dark yellow-green (figure 27). No floating material was reported during this time. In comparison to the observations made on 23 November, the new land had extended N and part of it had eroded away. In addition, analysis by the Geospatial Information Authority of Japan using SAR data from Daichi-2 also confirmed that the area of the new island continued to decrease between 4 and 15 December. Ejected material combined with wave erosion transformed the island into a “J” shape, 500-m-long and with the curved part about 200 m offshore of Ioto. The island was covered with brown ash and blocks, and the surrounding water was discolored to greenish-brown and contained an area of floating pumice. JCG reported from an overflight on 4 December that volcanic ash-like material found around the S vent on the NE part of the island was newly deposited since 10 November (figure 28). By 15 December the N part of the “J” shaped island had separated and migrated N, connecting to the Okinahama coast and the curved part of the “J” had eroded into two smaller islands (figure 27).
References. Ukawa, M., Fujita, E., Kobayashi, T., 2002, Recent volcanic activity of Iwo Jima and the 2001 eruption, Monthly Chikyu, Extra No. 39, 157-164.
Geologic Background. Ioto, in the Volcano Islands of Japan, lies within a 9-km-wide submarine caldera. The volcano is also known as Ogasawara-Iojima to distinguish it from several other "Sulfur Island" volcanoes in Japan. The triangular, low-elevation, 8-km-long island narrows toward its SW tip and has produced trachyandesitic and trachytic rocks that are more alkalic than those of other volcanoes in this arc. The island has undergone uplift for at least the past 700 years, accompanying resurgent doming of the caldera; a shoreline landed upon by Captain Cook's surveying crew in 1779 is now 40 m above sea level. The Motoyama plateau on the NE half of the island consists of submarine tuffs overlain by coral deposits and forms the island's high point. Many fumaroles are oriented along a NE-SW zone cutting through Motoyama. Numerous recorded phreatic eruptions, many from vents on the W and NW sides of the island, have accompanied the uplift.
Information Contacts: Japan Meteorological Agency (JMA), 1-3-4 Otemachi, Chiyoda-ku, Tokyo 100-8122, Japan (URL: http://www.jma.go.jp/jma/indexe.html); Japan Coast Guard (JCG) Volcano Database, Hydrographic and Oceanographic Department, 3-1-1, Kasumigaseki, Chiyoda-ku, Tokyo 100-8932, Japan (URL: https://www1.kaiho.mlit.go.jp/GIJUTSUKOKUSAI/kaiikiDB/kaiyo22-2.htm); Copernicus Browser, Copernicus Data Space Ecosystem, European Space Agency (URL: https://dataspace.copernicus.eu/browser/); Asahi, 5-3-2, Tsukiji, Chuo Ward, Tokyo, 104-8011, Japan (URL: https://www.asahi.com/ajw/articles/15048458).
Purace (Colombia) — December 2023 Cite this Report
Purace
Colombia
2.3095°N, 76.3948°W; summit elev. 4650 m
All times are local (unless otherwise noted)
Gas-and-ash emission on 16 November 2023
Puracé, located in Colombia, is a stratovolcano that contains a 500-m-wide summit crater. It is part of the Los Coconucos volcanic chain that is a NW-SE trending group of seven cones and craters. The most recent eruption occurred during March 2022 that was characterized by frequent seismicity and gas-and-steam emissions (BGVN 47:06). This report covers a brief eruption during November 2023 based on monthly reports from the Popayán Observatory, part of the Servicio Geologico Colombiano (SGC).
Activity during November 2022 through November 2023 primarily consisted of seismicity: VT-type events, LP-type events, HB-type events, and TR-type events (table 4). Maximum sulfur dioxide values were measured weekly and ranged from 259-5,854 tons per day (t/d) during November 2022 through April 2023. White gas-and-steam emissions were also occasionally reported.
SGC issued a report on 25 October that noted a significant increase in the number of earthquakes associated with rock fracturing. These earthquakes were located SE of the crater between Puracé and Piocollo at depths of 1-4 km. There were no reported variations in sulfur dioxide values, but SGC noted high carbon dioxide values, compared to those recorded in the first half of 2023.
SGC reported that at 1929 on 16 November the seismic network detected a signal that was possibly associated with a gas-and-ash emission, though it was not confirmed in webcam images due to limited visibility. On 17 November an observer confirmed ash deposits on the N flank. Webcam images showed an increase in degassing both inside the crater and from the NW flank, rising 700 m above the crater.
Table 4. Seismicity at Puracé during November 2022-November 2023. Volcano-tectonic (VT), long-period (LP), hybrid (HB), and tremor (TR) events are reported each month. Courtesy of SGC.
| Month |
Volcano-tectonic |
Long-period |
Hybrid |
Tremor |
| Nov 2022 |
429 |
2,023 |
5 |
831 |
| Dec 2022 |
423 |
1,390 |
9 |
834 |
| Jan 2023 |
719 |
1,622 |
0 |
957 |
| Feb 2023 |
598 |
1,701 |
2 |
1,124 |
| Mar 2023 |
331 |
2,408 |
147 |
607 |
| Apr 2023 |
614 |
4,427 |
33 |
148 |
| May 2023 |
620 |
3,717 |
170 |
109 |
| Jun 2023 |
467 |
3,293 |
86 |
148 |
| Jul 2023 |
1,116 |
5,809 |
183 |
542 |
| Aug 2023 |
692 |
2,927 |
94 |
321 |
| Sep 2023 |
887 |
1,505 |
82 |
848 |
| Oct 2023 |
2,373 |
2,949 |
135 |
692 |
| Nov 2023 |
1,212 |
2,302 |
69 |
293 |
Geologic Background. Puracé is an active andesitic volcano with a 600-m-diameter summit crater at the NW end of the Los Coconucos Volcanic Chain. This volcanic complex includes nine composite and five monogenetic volcanoes, extending from the Puracé crater more than 6 km SE to the summit of Pan de Azúcar stratovolcano. The dacitic massif which the complex is built on extends about 13 km NW-SE and 10 km NE-SW. Frequent small to moderate explosive eruptions reported since 1816 CE have modified the morphology of the summit crater, with the largest eruptions in 1849, 1869, and 1885.
Information Contacts: Servicio Geologico Colombiano (SGC), Diagonal 53 No. 34-53 - Bogotá D.C., Colombia (URL: https://www.sgc.gov.co/volcanes).
Suwanosejima (Japan) — December 2023 Cite this Report
Suwanosejima
Japan
29.638°N, 129.714°E; summit elev. 796 m
All times are local (unless otherwise noted)
Eruption plumes, crater incandescence, and occasional explosions during July-October 2023
Suwanosejima is an 8-km-long island that consists of a stratovolcano and two active summit craters, located in the northern Ryukyu Islands, Japan. Volcanism over the past century has been characterized by Strombolian explosions, ash plumes, and ashfall. The current eruption began in October 2004 and has more recently consisted of frequent eruption plumes, explosions, and incandescent ejecta (BGVN 48:07). This report covers similar activity of ash plumes, explosions, and crater incandescence during July through October 2023 using monthly reports from the Japan Meteorological Agency (JMA) and satellite data.
Thermal activity during the reporting period was relatively low; only one low-power thermal anomaly was detected during mid-July and one during early August, based on a MIROVA (Middle InfraRed Observation of Volcanic Activity) Log Radiative Power graph of the MODIS thermal anomaly data. On two clear weather days, a thermal anomaly was visible in infrared satellite images (figure 81).
Low-level activity was reported at the Otake crater during July and no explosions were detected. Eruption plumes rose as high as 1.8 km above the crater. On 13 July an ash plume rose 1.7 km above the crater rim, based on a webcam image. During the night of the 28th crater incandescence was visible in a webcam image. An eruptive event reported on 31 July produced an eruption plume that rose 2.1 km above the crater. Seismicity consisted of 11 volcanic earthquakes on the W flank, the number of which had decreased compared to June (28) and 68 volcanic earthquakes near the Otake crater, which had decreased from 722 in the previous month. According to observations conducted by the University of Tokyo Graduate School of Science, Kyoto University Disaster Prevention Research Institute, Toshima Village, and JMA, the amount of sulfur dioxide emissions released during the month was 400-800 tons per day (t/d).
Eruptive activity in the Otake crater continued during August and no explosions were reported. An eruptive event produced a plume that rose 1 km above the crater at 1447 on 12 August. Subsequent eruptive events were recorded at 0911 on 16 August, at 1303 on 20 August, and at 0317 on 21 August, which produced ash plumes that rose 1-1.1 km above the crater and drifted SE, SW, and W. On 22 August an ash plume was captured in a webcam image rising 1.4 km above the crater (figure 82). Multiple eruptive events were detected on 25 August at 0544, 0742, 0824, 1424, and 1704, which generated ash plumes that rose 1.1-1.2 km above the crater and drifted NE, W, and SW. On 28 August a small amount of ashfall was observed as far as 1.5 km from the crater. There were 17 volcanic earthquakes recorded on the W flank of the volcano and 79 recorded at the Otake crater during the month. The amount of sulfur dioxide emissions released during the month was 400-800 t/d.
Activity continued at the Otake crater during September. Occasionally, nighttime crater incandescence was observed in webcam images and ashfall was reported. An eruptive event at 1949 on 4 September produced an ash plume that rose 1 km above the crater and drifted SW. On 9 September several eruption events were detected at 0221, 0301, and 0333, which produced ash plumes that rose 1.1-1.4 km above the crater rim and drifted W; continuous ash emissions during 0404-0740 rose to a maximum height of 2 km above the crater rim (figure 83). More eruptive events were reported at 1437 on 10 September, at 0319 on 11 September, and at 0511 and 1228 on 15 September, which generated ash plumes that rose 1-1.8 km above the crater. During 25, 27, and 30 September, ash plumes rose as high as 1.3 km above the crater rim. JMA reported that large blocks were ejected as far as 300 m from the center of the crater. There were 18 volcanic earthquakes detected beneath the W flank and 82 volcanic earthquakes detected near the Otake crater. The amount of sulfur dioxide released during the month ranged from 600 to 1,600 t/d.
Activity during early-to-mid-October consisted of occasional explosions, a total number of 13, and ash plumes that rose as high as 1.9 km above the Otake crater rim on 29 October (figure 84). These explosions are the first to have occurred since June 2023. Continuous ash emissions were reported during 0510-0555 on 1 October. Explosions were recorded at 0304, 2141, and 2359 on 2 October, at 0112 on 3 October, and at 1326 on 6 October, which produced ash plumes that rose as high as 1 km above the crater rim and drifted SW and W. An explosion was noted at 0428 on 3 October, but emission details were unknown. A total of eight explosions were recorded by the seismic network at 1522 on 14 October, at 0337, 0433, 0555, 1008, and 1539 on 15 October, and at 0454 and 0517 on 16 October. Ash plumes from these explosions rose as high as 900 m above the crater and drifted SE. Eruptive events during 25-27 and 29-30 October generated plumes that rose as high as 1.9 km above the crater and drifted SE, S, and SW. Ash was deposited in Toshima village (3.5 km SSW). Eruptive activity occasionally ejected large volcanic blocks as far as 600 m from the crater. Nighttime crater incandescence was visible in webcams. Intermittent ashfall was reported as far as 1.5 km from the crater. There were 43 volcanic earthquakes detected on the W flank during the month, and 184 volcanic earthquakes detected near the Otake crater. The amount of sulfur dioxide emitted ranged between 400 and 900 t/d.
Geologic Background. The 8-km-long island of Suwanosejima in the northern Ryukyu Islands consists of an andesitic stratovolcano with two active summit craters. The summit is truncated by a large breached crater extending to the sea on the E flank that was formed by edifice collapse. One of Japan's most frequently active volcanoes, it was in a state of intermittent Strombolian activity from Otake, the NE summit crater, between 1949 and 1996, after which periods of inactivity lengthened. The largest recorded eruption took place in 1813-14, when thick scoria deposits covered residential areas, and the SW crater produced two lava flows that reached the western coast. At the end of the eruption the summit of Otake collapsed, forming a large debris avalanche and creating an open collapse scarp extending to the eastern coast. The island remained uninhabited for about 70 years after the 1813-1814 eruption. Lava flows reached the eastern coast of the island in 1884. Only about 50 people live on the island.
Information Contacts: Japan Meteorological Agency (JMA), 1-3-4 Otemachi, Chiyoda-ku, Tokyo 100-8122, Japan (URL: http://www.jma.go.jp/jma/indexe.html); MIROVA (Middle InfraRed Observation of Volcanic Activity), a collaborative project between the Universities of Turin and Florence (Italy) supported by the Centre for Volcanic Risk of the Italian Civil Protection Department (URL: http://www.mirovaweb.it/); Hawai'i Institute of Geophysics and Planetology (HIGP) - MODVOLC Thermal Alerts System, School of Ocean and Earth Science and Technology (SOEST), Univ. of Hawai'i, 2525 Correa Road, Honolulu, HI 96822, USA (URL: http://modis.higp.hawaii.edu/); Copernicus Browser, Copernicus Data Space Ecosystem, European Space Agency (URL: https://dataspace.copernicus.eu/browser/).
Etna
Italy
37.748°N, 14.999°E; summit elev. 3357 m
All times are local (unless otherwise noted)
Strombolian explosions, lava fountains, and lava flows during July-August 2023
Etna, located on the Italian island of Sicily, has had documented eruptions dating back to 1500 BCE. Activity typically originates from multiple cones at the summit, where several craters have formed and evolved. The currently active craters are Northeast Crater (NEC), Voragine (VOR), and Bocca Nuova (BN), and the Southeast Crater (SEC); VOR and BN were previously referred to as the “Central Crater”. The original Southeast crater formed in 1978, and a second eruptive site that opened on its SE flank in 2011 was named the New Southeast Crater (NSEC). Another eruptive site between the SEC and NSEC developed during early 2017 and was referred to as the "cono della sella" (saddle cone). The current eruption period began in November 2022 and has been characterized by intermittent Strombolian activity, lava flows, and ash plumes (BGVN 48:08). This report updates activity during July through October 2023, which includes primarily gas-and-steam emissions; during July and August Strombolian explosions, lava fountains, and lava flows were reported, based on weekly and special reports by the Osservatorio Etneo (OE), part of the Catania Branch of Italy's Istituo Nazionale di Geofisica e Vulcanologica (INGV) and satellite data.
Variable fumarolic degassing was reported at all summit craters (BN, VOR, NEC, and SEC) throughout the entire reporting period (table 15). The MIROVA (Middle InfraRed Observation of Volcanic Activity) volcano hotspot detection system based on the analysis of MODIS data showed frequent low-to-moderate power thermal anomalies during the reporting period (figure 399). During mid-August there was a pulse in activity that showed an increase in the power of the anomalies due to Strombolian activity, lava fountains, and lava flows. Infrared satellite imagery captured strong thermal anomalies at the central and southeast summit crater areas (figure 400). Accompanying thermal activity were occasional sulfur dioxide plumes that exceeded 2 Dobson Units (DUs) recorded by the TROPOMI instrument on the Sentinel-5P satellite (figure 401).
Table 15. Summary of activity at the four primary crater areas at the summit of Etna during July-October 2023. Information is from INGV weekly reports.
| Month |
Bocca Nuova (BN) |
Voragine (VOR) |
Northeast Crater (NEC) |
Southeast Crater (SEC) |
| Jul 2023 |
Continuous degassing. |
No observations. |
Weak gas emissions. |
Continuous degassing. Sporadic and weak-to-moderate ash emissions. Strombolian explosions. |
| Aug 2023 |
Continuous degassing. |
No observations. |
No observations. |
Continuous degassing. Occasional ash emissions. Strombolian activity, lava fountaining, and lava flows. |
| Sep 2023 |
Variable degassing. Crater incandescence. |
Weak fumarolic activity. |
Weak fumarolic activity. |
Variable degassing. |
| Oct 2023 |
Continuous degassing. |
Weak fumarolic activity. |
Weak fumarolic activity. |
Continuous degassing. |
Activity during July and August was relatively low and mainly consisted of degassing at the summit craters, particularly at SEC and BN. Cloudy weather prevented clear views of the summit during early July. During the night of 2 July some crater incandescence was visible at SEC. Explosive activity resumed at SEC during 9-10 July, which was characterized by sporadic and weak ash emissions that rapidly dispersed in the summit area (figure 402). INGV reported moderate Strombolian activity began at 2034 on 14 July and was confined to the inside of the crater and fed by a vent located in the E part of SEC. An ash emission was detected at 2037. A new vent opened on 15 July in the SE part of BN and began to produce continuous gas-and-steam emissions. During an inspection carried out on 28 July pulsating degassing, along with audible booms, were reported at two active vents in BN. Vigorous gas-and-steam emissions intermittently generated rings. On rare occasions, fine, reddish ash was emitted from BN1 and resuspended by the gas-and-steam emissions.
Around 2000 on 13 August INGV reported a sudden increase in volcanic tremor amplitude. Significant infrasonic activity coincided with the tremor increase. Incandescent flashes were visible through the cloud cover in webcam images of SEC (figure 403). Strombolian activity at SEC began to gradually intensify starting at 2040 as seismicity continued to increase. The Aviation Color Code (ACC) was raised to Yellow (the second lowest-level on a four-color scale) at 2126 and then to Orange (the second highest-level on a four-color scale) at 2129 due to above-background activity. The activity rapidly transitioned from Strombolian activity to lava fountains around 2333 that rose 300-400 m above the crater (figure 403). Activity was initially focused on the E vent of the crater, but then the vent located above the S flank of the cone also became active. A lava flow from this vent traveled SW into the drainage created on 10 February 2022, overlapping with previous flows from 10 and 21 February 2022 and 21 May 2023, moving between Monte Barbagallo and Monte Frumento Supino (figure 404). The lava flow was 350 m long, oriented NNE-SSW, and descended to an elevation of 2.8 km. Flows covered an area of 300,000 m2 and had an estimated volume of 900,000 m3. The ACC was raised to Red at 2241 based on strong explosive activity and ashfall in Rifugio Sapienza-Piano Vetore at 1.7 km elevation on the S flank. INGV reported that pyroclastic flows accompanied this activity.
Activity peaked between 0240 and 0330 on 14 August, when roughly 5-6 vents erupted lava fountains from the E to SW flank of SEC. The easternmost vents produced lava fountains that ejected material strongly to the E, which caused heavy fallout of incandescent pyroclastic material on the underlying flank, triggering small pyroclastic flows. This event was also accompanied by lightning both in the ash column and in the ash clouds that were generated by the pyroclastic flows. A fracture characterized by a series of collapse craters (pit craters) opened on the upper SW flank of SEC. An ash cloud rose a few kilometers above the crater and drifted S, causing ash and lapilli falls in Rifugio Sapienza and expanding toward Nicolosi, Mascalucia, Catania, and up to Syracuse. Ashfall resulted in operational problems at the Catania airport (50 km S), which lasted from 0238 until 2000. By 0420 the volcanic tremor amplitude values declined to background levels. After 0500 activity sharply decreased, although the ash cloud remained for several hours and drifted S. By late morning, activity had completely stopped. The ACC was lowered to Orange as volcanic ash was confined to the summit area. Sporadic, minor ash emissions continued throughout the day. At 1415 the ACC was lowered to Yellow and then to Green at 1417.
During the night of 14-15 August only occasional flashes were observed, which were more intense during avalanches of material inside the eruptive vents. Small explosions were detected at SEC at 2346 on 14 August and at 0900 on 26 August that each produced ash clouds which rapidly dispersed into the atmosphere (figure 405). According to a webcam image, an explosive event detected at 2344 at SEC generated a modest ash cloud that was rapidly dispersed by winds. The ACC was raised to Yellow at 2355 on 14 August due to increasing unrest and was lowered to Green at 0954 on 15 August.
Activity during September and October was relatively low and mainly characterized by variable degassing from BN and SEC. Intense, continuous, and pulsating degassing was accompanied by roaring sounds and flashes of incandescence at BN both from BN1 and the new pit crater that formed during late July (figure 406). The degassing from the new pit crater sometimes emitted vapor rings. Cloudy weather during 6-8 September prevented observations of the summit craters .
Geologic Background. Mount Etna, towering above Catania on the island of Sicily, has one of the world's longest documented records of volcanism, dating back to 1500 BCE. Historical lava flows of basaltic composition cover much of the surface of this massive volcano, whose edifice is the highest and most voluminous in Italy. The Mongibello stratovolcano, truncated by several small calderas, was constructed during the late Pleistocene and Holocene over an older shield volcano. The most prominent morphological feature of Etna is the Valle del Bove, a 5 x 10 km caldera open to the east. Two styles of eruptive activity typically occur, sometimes simultaneously. Persistent explosive eruptions, sometimes with minor lava emissions, take place from one or more summit craters. Flank vents, typically with higher effusion rates, are less frequently active and originate from fissures that open progressively downward from near the summit (usually accompanied by Strombolian eruptions at the upper end). Cinder cones are commonly constructed over the vents of lower-flank lava flows. Lava flows extend to the foot of the volcano on all sides and have reached the sea over a broad area on the SE flank.
Information Contacts: Sezione di Catania - Osservatorio Etneo, Istituto Nazionale di Geofisica e Vulcanologia (INGV), Sezione di Catania, Piazza Roma 2, 95123 Catania, Italy (URL: http://www.ct.ingv.it/it/); MIROVA (Middle InfraRed Observation of Volcanic Activity), a collaborative project between the Universities of Turin and Florence (Italy) supported by the Centre for Volcanic Risk of the Italian Civil Protection Department (URL: http://www.mirovaweb.it/); NASA Global Sulfur Dioxide Monitoring Page, Atmospheric Chemistry and Dynamics Laboratory, NASA Goddard Space Flight Center (NASA/GSFC), 8800 Greenbelt Road, Goddard MD 20771, USA (URL: https://so2.gsfc.nasa.gov/); Copernicus Browser, Copernicus Data Space Ecosystem, European Space Agency (URL: https://dataspace.copernicus.eu/browser/).
Aira
Japan
31.5772°N, 130.6589°E; summit elev. 1117 m
All times are local (unless otherwise noted)
Explosions, ash plumes, ash fall, and crater incandescence during July-October 2023
Aira caldera, located in the northern half of Kagoshima Bay, Japan, contains the post-caldera Sakurajima volcano. Eruptions typically originate from the Minamidake crater, and since the 8th century, ash deposits have been recorded in the city of Kagoshima (10 km W), one of Kyushu’s largest cities. The Minamidake summit cone and crater has had persistent activity since 1955; the Showa crater on the E flank has also been intermittently active since 2006. The current eruption period began during March 2017 and has recently been characterized by intermittent explosions, eruption plumes, and ashfall (BGVN 48:07). This report updates activity during July through October 2023 and describes explosive events, ash plumes, nighttime crater incandescence, and ashfall, according to monthly activity reports from the Japan Meteorological Agency (JMA) and satellite data.
Thermal activity remained at low levels during this reporting period, according to the MIROVA (Middle InfraRed Observation of Volcanic Activity) system (figure 149). There was a slight increase in the number of anomalies during September through October. Occasional thermal anomalies were visible in infrared satellite images mainly at the Minamidake crater (Vent A is located to the left and Vent B is located to the right) (figure 150).
Table 30. Number of monthly explosive events, days of ashfall, area of ash covered, and sulfur dioxide emissions from Sakurajima’s Minamidake crater at Aira during July-October 2023. Note that smaller ash events are not listed. Ashfall days were measured at Kagoshima Local Meteorological Observatory and ashfall amounts represent material covering all the Kagoshima Prefecture. Data courtesy of JMA monthly reports.
| Month |
Explosive events |
Days of ashfall |
Ashfall amount (g/m2) |
SO2 emissions (tons/day) |
| Jul 2023 |
3 |
0 |
0 |
1,600-3,200 |
| Aug 2023 |
3 |
10 |
7 |
1,800-3,300 |
| Sep 2023 |
3 |
7 |
3 |
1,600-2,300 |
| Oct 2023 |
33 |
8 |
61 |
2,200-4,200 |
JMA reported that during July, there were eight eruptions, three of which were explosion events in the Showa crater. Large blocks were ejected as far as 600 m from the Showa crater. Very small eruptions were occasionally reported at the Minamidake crater. Nighttime incandescence was observed in both the Showa and Minamidake crater. Explosions were reported on 16 July at 2314 and on 17 July at 1224 and at 1232 (figure 151). Resulting eruption plumes rose 700-2,500 m above the crater and drifted N. On 23 July the number of volcanic earthquakes on the SW flank of the volcano increased. A strong Mw 3.1 volcanic earthquake was detected at 1054 on 26 July. The number of earthquakes recorded throughout the month was 545, which markedly increased from 73 in June. No ashfall was observed at the Kagoshima Regional Meteorological Observatory during July. According to a field survey conducted during the month, the daily amount of sulfur dioxide emissions was 1,600-3,200 tons per day (t/d).
There were three eruptions reported at the Minamidake crater during August, each of which were explosive. The explosions occurred on 9 August at 0345, on 13 August at 2205, and on 31 August at 0640, which generated ash plumes that rose 800-2,000 m above the crater and drifted W. There were two eruptions detected at Showa crater; on 4 August at 2150 ejecta traveled 800 m from the Showa crater and associated eruption plumes rose 2.3 km above the crater. The explosion at 2205 on 13 August generated an ash plume that rose 2 km above the crater and was accompanied by large blocks that were ejected 600 m from the Minamidake crater (figure 152). Nighttime crater incandescence was visible in a high-sensitivity surveillance camera at both craters. Seismicity consisted of 163 volcanic earthquakes, 84 of which were detected on the SW flank. According to the Kagoshima Regional Meteorological Observatory there was a total of 7 g/m2 of ashfall over the course of 10 days during the month. According to a field survey, the daily amount of sulfur dioxide emitted was 1,800-3,300 t/d.
During September, four eruptions were reported, three of which were explosion events. These events occurred at 1512 on 9 September, at 0018 on 11 September, and at 2211 on 13 September. Resulting ash plumes generally rose 800-1,100 m above the crater. An explosion produced an ash plume at 2211 on 13 September that rose as high as 1.7 km above the crater. Large volcanic blocks were ejected 600 m from the Minamidake crater. Smaller eruptions were occasionally observed at the Showa crater. Nighttime crater incandescence was visible at the Minamidake crater. Seismicity was characterized by 68 volcanic earthquakes, 28 of which were detected beneath the SW flank. According to the Kagoshima Regional Meteorological Observatory there was a total of 3 g/m2 of ashfall over the course of seven days during the month. A field survey reported that the daily amount of sulfur dioxide emitted was 1,600-2,300 t/d.
Eruptive activity during October consisted of 69 eruptions, 33 of which were described as explosive. These explosions occurred during 4 and 11-21 October and generated ash plumes that rose 500-3,600 m above the crater and drifted S, E, SE, and N. On 19 October at 1648 an explosion generated an ash plume that rose 3.6 km above the crater (figure 153). No eruptions were reported in the Showa crater; white gas-and-steam emissions rose 100 m above the crater from a vent on the N flank. Nighttime incandescence was observed at the Minamidake crater. On 24 October an eruption was reported from 0346 through 0430, which included an ash plume that rose 3.4 km above the crater. Ejected blocks traveled 1.2 km from the Minamidake crater. Following this eruption, small amounts of ashfall were observed from Arimura (4.5 km SE) and a varying amount in Kurokami (4 km E) (figure 154). The number of recorded volcanic earthquakes during the month was 190, of which 14 were located beneath the SW flank. Approximately 61 g/m2 of ashfall was reported over eight days of the month. According to a field survey, the daily amount of sulfur dioxide emitted was 2,200-4,200 t/d.
Geologic Background. The Aira caldera in the northern half of Kagoshima Bay contains the post-caldera Sakurajima volcano, one of Japan's most active. Eruption of the voluminous Ito pyroclastic flow accompanied formation of the 17 x 23 km caldera about 22,000 years ago. The smaller Wakamiko caldera was formed during the early Holocene in the NE corner of the caldera, along with several post-caldera cones. The construction of Sakurajima began about 13,000 years ago on the southern rim and built an island that was joined to the Osumi Peninsula during the major explosive and effusive eruption of 1914. Activity at the Kitadake summit cone ended about 4,850 years ago, after which eruptions took place at Minamidake. Frequent eruptions since the 8th century have deposited ash on the city of Kagoshima, located across Kagoshima Bay only 8 km from the summit. The largest recorded eruption took place during 1471-76.
Information Contacts: Japan Meteorological Agency (JMA), 1-3-4 Otemachi, Chiyoda-ku, Tokyo 100-8122, Japan (URL: http://www.jma.go.jp/jma/indexe.html); MIROVA (Middle InfraRed Observation of Volcanic Activity), a collaborative project between the Universities of Turin and Florence (Italy) supported by the Centre for Volcanic Risk of the Italian Civil Protection Department (URL: http://www.mirovaweb.it/); Copernicus Browser, Copernicus Data Space Ecosystem, European Space Agency (URL: https://dataspace.copernicus.eu/browser/).
Nishinoshima (Japan) — November 2023 Cite this Report
Nishinoshima
Japan
27.247°N, 140.874°E; summit elev. 100 m
All times are local (unless otherwise noted)
Gray emissions during October 2023
Nishinoshima is a small island in the Ogasawara Arc, about 1,000 km S of Tokyo, Japan. It contains prominent submarine peaks to the S, W, and NE. Recorded eruptions date back to 1973, with the current eruption period beginning in October 2022. Eruption plumes and fumarolic activity characterize recent activity (BGVN 48:10). This report covers the end of the eruption for September through October 2023, based on information from monthly reports of the Japan Meteorological Agency (JMA) monthly reports, and satellite data.
No eruptive activity was reported during September 2023, although JMA noted that the surface temperature was slightly elevated compared to the surrounding area since early March 2023. The Japan Coast Guard (JCG) conducted an overflight on 20 September and reported white gas-and-steam plumes rising 3 km above the central crater of the pyroclastic cone, as well as multiple white gas-and-steam emissions emanating from the N, E, and S flanks of the crater to the coastline. In addition, dark reddish brown-to-green discolored water was distributed around almost the entire circumference of the island.
Similar low-level activity was reported during October. Multiple white gas-and-steam emissions rose from the N, E, and S flanks of the central crater of the pyroclastic cone and along the coastline; these emissions were more intense compared to the previous overflight observations. Dark reddish brown-to-green discolored water remained visible around the circumference of the island. On 4 October aerial observations by JCG showed a small eruption consisting of continuous gas-and-steam emissions emanating from the central crater, with gray emissions rising to 1.5 km altitude (figure 129). According to observations from the marine weather observation vessel Keifu Maru on 26 October, white gas-and-steam emissions persisted from the center of the pyroclastic cone, as well as from the NW, SW, and SE coasts of the island for about five minutes. Slightly discolored water was visible up to about 1 km.
Frequent low-to-moderate power thermal anomalies were recorded in the MIROVA graph (Middle InfraRed Observation of Volcanic Activity) during September (figure 130). Occasional anomalies were detected during October, and fewer during November through December. A thermal anomaly was visible in the crater using infrared satellite imagery on 6, 8, 11, 16, 18, 21, and 23 September and 8, 13, 21, 26, and 28 October (figure 131).
Geologic Background. The small island of Nishinoshima was enlarged when several new islands coalesced during an eruption in 1973-74. Multiple eruptions that began in 2013 completely covered the previous exposed surface and continued to enlarge the island. The island is the summit of a massive submarine volcano that has prominent peaks to the S, W, and NE. The summit of the southern cone rises to within 214 m of the ocean surface 9 km SSE.
Information Contacts: Japan Meteorological Agency (JMA), 1-3-4 Otemachi, Chiyoda-ku, Tokyo 100-8122, Japan (URL: http://www.jma.go.jp/jma/indexe.html); MIROVA (Middle InfraRed Observation of Volcanic Activity), a collaborative project between the Universities of Turin and Florence (Italy) supported by the Centre for Volcanic Risk of the Italian Civil Protection Department (URL: http://www.mirovaweb.it/); Copernicus Browser, Copernicus Data Space Ecosystem, European Space Agency (URL: https://dataspace.copernicus.eu/browser/).
Kilauea (United States) — October 2023 Cite this Report
Kilauea
United States
19.421°N, 155.287°W; summit elev. 1222 m
All times are local (unless otherwise noted)
Strong lava fountains, lava flows, and spatter at Halema’uma’u during January-September 2023
Kīlauea is on the island of Hawai’i and overlaps the E flank of the Mauna Loa volcano. Its East Rift Zone (ERZ) has been intermittently active for at least 2,000 years. An extended eruption period began in January 1983 and was characterized by open lava lakes and lava flows from the summit caldera and the East Rift Zone. During May 2018 magma migrated into the Lower East Rift Zone (LERZ) and opened 24 fissures along a 6-km-long NE-trending fracture zone that produced lava flows traveling in multiple directions. As lava emerged from the fissures, the lava lake at Halema'uma'u drained and explosions sent ash plumes to several kilometers altitude (BGVN 43:10).
The current eruption period started during September 2021 and has been characterized by low-level lava effusions in the active Halema’uma’u lava lake (BGVN 48:01). This report covers three notable eruption periods during February, June, and September 2023 consisting of lava fountaining, lava flows, and spatter during January through September 2023 using information from daily reports, volcanic activity notices, and abundant photo, map, and video data from the US Geological Survey's (USGS) Hawaiian Volcano Observatory (HVO).
Activity during January 2023. Small earthquake swarms were recorded on 2 January 2023; increased seismicity and changes in the pattern of deformation were noted on the morning of 5 January. At around 1500 both the rate of deformation and seismicity drastically increased, which suggested magma movement toward the surface. HVO raised the Volcano Alert Level (VAL) to Watch (the second highest level on a four-level scale) and the Aviation Color Code (ACC) to Orange (the second highest color on a four-color scale) at 1520.
Multiple lava fountains and lava effusions from vents in the central eastern portion of the Halema’uma’u crater began on 5 January around 0434; activity was confined to the eastern half of the crater and within the basin of the western half of the crater, which was the focus of the eruption in 2021-2022 (figure 525). Incandescence was visible in webcam images at 1634 on 5 January, prompting HVO to raise the VAL to Warning (the highest level on a four-level scale) and the ACC to Red (the highest color on a four-color scale). Lava fountains initially rose as high as 50 m above the vent at the onset of the eruption (figure 526) but then declined to a more consistent 5-6 m height in the proceeding days. By 1930 that same day, lava had covered most of the crater floor (an area of about 1,200,000 m2) and the lava lake had a depth of 10 m. A higher-elevation island that formed during the initial phase of the December 2020 eruption remained exposed, appearing darker in images, along with a ring of older lava around the lava lake that was active prior to December 2022. Overnight during 5-6 January the lava fountains continued to rise 5 m high, and the lava effusion rate had slowed.
On 6 January at 0815 HVO lowered the VAL to Watch and the ACC to Orange due to the declining effusion rates. Sulfur dioxide emission rates ranged from 3,000-12,500 tonnes per day (t/d), the highest value of which was recorded on 6 January. Lava continued to erupt from the vents during 6-8 January, although the footprint of the active area had shrunk; a similar progression has been commonly observed during the early stages of recent eruptions at Halema’uma’u. On 9 January HVO reported one dominant lava fountain rising 6-7 m high in the E half of the crater. Lava flows built up the margins of the lake, causing the lake to be perched. On 10 January the eastern lava lake had an area of approximately 120,000 m2 that increased to 250,000 m2 by 17 January. During 13-31 January several small overflows occurred along the margins of the E lake. A smaller area of lava was active within the basin in the W half of the crater that had been the focus of activity during 2021-2022. On 19 January just after 0200 a small ooze-out was observed on the crater’s W edge.
Activity during February 2023. Activity continued in the E part of Halema’uma’u crater, as well as in a smaller basin in the W part of the 2021-2022 lava lake (figure 527). The E lava lake contained a single lava fountain and frequent overflows. HVO reported that during the morning of 1 February the large E lava lake began to cool and crust over in the center of the lake; two smaller areas of lava were observed on the N and S sides by the afternoon. The dominant lava fountain located in the S part of the lava lake paused for roughly 45 minutes at 2315 and resumed by midnight, rising 1-2 m. At 0100 on 2 February lava from the S part was effusing across the entire E lava lake area, covering the crusted over portion in the center of the lake and continuing across the majority of the previously measured 250,000 m2 by 0400. A small lava pond near the E lake produced an overflow around 0716 on 2 February. On 3 February some lava crust began to form against the N and E levees, which defined the 250,000 m2 eastern lava lake. The small S lava fountain remained active, rising 1-6 m high during 3-9 February; around 0400 on 5 February occasional bursts doubled the height of the lava fountain.
A large breakout occurred overnight during 2100 on 4 February to 0900 on 5 February on the N part of the crater floor, equal to or slightly larger in size than the E lava lake. A second, smaller lava fountain appeared in the same area of the E lava lake between 0300 and 0700 on 5 February and was temporarily active. This large breakout continued until 7 February. A small, brief breakout was reported in the S of the E lava lake around midnight on 7 February. In the W lake, as well as the smaller lava pond in the central portion of the crater floor, contained several overflows during 7-10 February and intermittent fountaining. Activity at the S small lava pond and the small S lava fountain within the E lake declined during 9-10 February. The lava pond in the central portion of the crater floor had nearly continuous, expansive flows during 10-13 February; channels from the small central lava pond seemed to flow into the larger E lake. During 13-18 February a small lava fountain was observed in the small lava pond in the central portion of the crater floor. Continuous overflows persisted during this time.
Activity in the eastern and central lakes began to decline in the late afternoon of 17 February. By 18 February HVO reported that the lava effusions had significantly declined, and that the eastern and central lakes were no longer erupting. The W lake in the basin remained active but at a greatly reduced level that continued to decline. HVO reported that this decrease in activity is attributed to notable deflationary tilt that began early on the morning of 17 February and lasted until early 19 February. By 19 February the W lake was mostly crusted over although some weak lava flows remained, which continued through 28 February. The sulfur dioxide emission rates ranged 250-2,800 t/d, the highest value of which was recorded on 6 February.
Activity during March 2023. The summit eruption at Halema’uma’u crater continued at greatly reduced levels compared to the previous two months. The E and central vents stopped effusing lava, and the W lava lake remained active with weak lava flows; the lake was mostly crusted over, although slowly circulating lava intermittently overturned the crust. By 6 March the lava lake in the W basin had stopped because the entire surface was crusted over. The only apparent surface eruptive activity during 5-6 March was minor ooze-outs of lava onto the crater floor, which had stopped by 7 March. Several hornitos on the crater floor still glowed through 12 March according to overnight webcam images, but they did not erupt any lava. A small ooze-out of lava was observed just after 1830 in the W lava lake on 8 March, which diminished overnight. The sulfur dioxide emission rate ranged from 155-321 t/d on 21 March. The VAL was lowered to Advisory, and the ACC was lowered to Yellow (the second lowest on a four-color scale) on 23 March due to a pause in the eruption since 7 March.
Activity during April-May 2023. The eruption at Halema’uma’u crater was paused; no lava effusions were visible on the crater floor. Sulfur dioxide emission rates ranged from 75-185 t/d, the highest of which was measured on 22 April. During May and June summit seismicity was elevated compared to seismicity that preceded the activity during January.
Activity during June 2023. Earthquake activity and changes in the patterns of ground deformation beneath the summit began during the evening of 6 June. The data indicated magma movement toward the surface, prompting HVO to raise the VAL to Watch and the ACC to Orange. At about 0444 on 7 June incandescence in Halema’uma’u crater was visible in webcam images, indicating that a new eruption had begun. HVO raised the VAL to Warning and the ACC to Red (the highest color on a four-color scale). Lava flowed from fissures that had opened on the crater floor. Multiple minor lava fountains were active in the central E portion of the Halema’uma’u crater, and one vent opened on the W wall of the caldera (figure 528). The eruptive vent on the SW wall of the crater continued to effuse into the lava lake in the far SW part of the crater (figure 529). The largest lava fountain consistently rose 15 m high; during the early phase of the eruption, fountain bursts rose as high as 60 m. Lava flows inundated much of the crater floor and added about 6 m depth of new lava within a few hours, covering approximately 10,000 m2. By 0800 on 7 June lava filled the crater floor to a depth of about 10 m. During 0800-0900 the sulfur dioxide emission rate was about 65,000 t/d. Residents of Pahala (30 km downwind of the summit) reported minor deposits of fine, gritty ash and Pele’s hair. A small spatter cone had formed at the vent on the SW wall by midday, and lava from the cone was flowing into the active lava lake. Fountain heights had decreased from the onset of the eruption and were 4-9 m high by 1600, with occasional higher bursts. Inflation switched to deflation and summit earthquake activity greatly diminished shortly after the eruption onset.
At 0837 on 8 June HVO lowered the VAL to Watch and the ACC to Orange because the initial high effusion rates had declined, and no infrastructure was threatened. The surface of the lava lake had dropped by about 2 m, likely due to gas loss by the morning of 8 June. The drop left a wall of cooled lava around the margins of the crater floor. Lava fountain heights decreased during 8-9 June but continued to rise to 10 m high. Active lava and vents covered much of the W half of Halema’uma’u crater in a broad, horseshoe-shape around a central, uplifted area (figure 530). The preliminary average effusion rate for the first 24 hours of the eruption was about 150 cubic meters per second, though the estimate did not account for vesiculated lava and variations in crater floor topography. The effusion rate during the very earliest phases of the eruption appeared significantly higher than the previous three summit eruptions based on the rapid coverage of the entire crater floor. An active lava lake, also referred to as the “western lava lake” was centered within the uplifted area and was fed by a vent in the NE corner. Two small active lava lakes were located just SE from the W lava lake and in the E portion of the crater floor.
During 8-9 June the lava in the central lava lake had a thickness of approximately 1.5 m, based on measurements from a laser rangefinder. During 9-12 June the height of the lava fountains decreased to 9 m high. HVO reported that the previously active lava lake in the E part of the crater appeared stagnant during 10-11 June. The surface of the W lake rose approximately 1 m overnight during 11-12 June, likely due to the construction of a levee around it. Only a few small fountains were active during 12-13 June; the extent of the active lava had retreated so that all activity was concentrated in the SW and central parts of Halema’uma’u crater. Intermittent spattering from the vent on the SW wall was visible in overnight webcam images during 13-18 June. On the morning of 14 June a weak lava effusion originated from near the western eruptive vent, but by 15 June there were no signs of continued activity. HVO reported that other eruptive vents in the SW lava lake had stopped during this time, following several days of waning activity; lava filled the lake by about 0.5 m. Lava circulation continued in the central lake and no active lava was reported in the northern or eastern parts of the crater. Around 0800 on 15 June the top of the SW wall spatter cone collapsed, which was followed by renewed and constant spattering from the top vent and a change in activity from the base vent; several new lava flows effused from the top of the cone, as well as from the pre-existing tube-fed flow from its base. Accumulation of lava on the floor resulted in a drop of the central basin relative to the crater floor, allowing several overflows from the SW lava lake to cascade into the basin during the night of 15 June into the morning of 16 June.
Renewed lava fountaining was reported at the eruptive vent on the SW side of the crater during 16-19 June, which effused lava into the far SW part of the crater. This activity was described as vigorous during midday on 16 June; a group of observatory geologists estimated that the lava was consistently ejected at least 10 m high, with some spatter ejected even higher and farther. Deposits from the fountain further heightened and widened the spatter cone built around the original eruptive vent in the lower section of the crater wall. Multiple lava flows from the base of the cone were fed into the SW lava lake and onto the southwestern-most block from the 2018 collapse within Halema’uma’u on 17 June (figure 531); by 18 June they focused into a single flow feeding into the SW lava lake. On the morning of 19 June a second lava flow from the base of the eruptive cone advanced into the SW lava lake.
Around 1600 on 19 June there was a rapid decline in lava fountaining and effusion at the eruptive vent on the SW side of the crater; vent activity had been vigorous up to that point (figure 532). Circulation in the lava lake also slowed, and the lava lake surface dropped by several meters. Overnight webcam images showed some previously eruptive lava still flowing onto the crater floor, which continued until those flows began to cool. By 21 June no lava was erupting in Halema’uma’u crater. Overnight webcam images during 29-30 June showed some incandescence from previously erupted lava flows as they continued to cool. Seismicity in the crater declined to low levels. Sulfur dioxide emission rates ranged 160-21,000 t/d throughout the month, the highest measurement of which was recorded on 8 June. On 30 June the VAL was lowered to Advisory (the second level on a four-level scale) and the ACC was lowered to Yellow. Gradual inflation was detected at summit tiltmeters during 19-30 June.
Activity during July-August 2023. During July, the eruption paused; no lava was erupting in Halema’uma’u crater. Nighttime webcam images showed some incandescence from previously erupted lava as it continued to cool on the crater floor. During the week of 14 August HVO reported that the rate in seismicity increased, with 467 earthquakes of Mw 3.2 and smaller occurring. Sulfur dioxide emission rates remained low, ranging from 75-86 t/d, the highest of which was recorded on 10 and 15 August. On 15 August beginning at 0730 and lasting for several hours, a swarm of approximately 50 earthquakes were detected at a depth of 2-3 km below the surface and about 2 km long directly S of Halema’uma’u crater. HVO reported that this was likely due to magma movement in the S caldera region. During 0130-0500 and 1700-2100 on 21 August two small earthquake swarms of approximately 20 and 25 earthquakes, respectively, occurred at the same location and at similar depths. Another swarm of 50 earthquakes were recorded during 0430-0830 on 23 August. Elevated seismicity continued in the S area through the end of the month.
Activity during September 2023. Elevated seismicity persisted in the S summit with occasional small, brief seismic swarms. Sulfur dioxide measurements were relatively low and were 70 t/d on 8 September. About 150 earthquakes occurred during 9-10 September, and tiltmeter and Global Positioning System (GPS) data showed inflation in the S portion of the crater.
At 0252 on 10 September HVO raised the VAL to Watch and the ACC to Orange due to increased earthquake activity and changes in ground deformation that indicated magma moving toward the surface. At 1515 the summit eruption resumed in the E part of the caldera based on field reports and webcam images. Fissures opened on the crater floor and produced multiple minor lava fountains and flows (figure 533). The VAL and ACC were raised to Warning and Red, respectively. Gas-and-steam plumes rose from the fissures and drifted downwind. A line of eruptive vents stretched approximately 1.4 km from the E part of the crater into the E wall of the down dropped block by 1900. The lava fountains at the onset of the eruption had an estimated 50 m height, which later rose 20-25 m high. Lava erupted from fissures on the down dropped block and expanded W toward Halema’uma’u crater. Data from a laser rangefinder recorded about 2.5 m thick of new lava added to the W part of the crater. Sulfur dioxide emissions were elevated in the eruptive area during 1600-1500 on 10 September, measuring at least 100,000 t/d.
At 0810 on 11 September HVO lowered the VAL and ACC back to Watch and Orange due to the style of eruption and the fissure location had stabilized. The initial extremely high effusion rates had declined (but remained at high levels) and no infrastructure was threatened. An eruption plume, mainly comprised of sulfur dioxide and particulates, rose as high as 3 km altitude. Several lava fountains were active on the W side of the down dropped block during 11-15 September, while the easternmost vents on the down dropped block and the westernmost vents in the crater became inactive on 11 September (figure 534). The remaining vents spanned approximately 750 m and trended roughly E-W. The fed channelized lava effusions flowed N and W into Halema’uma’u. The E rim of the crater was buried by new lava flows; pahoehoe lava flows covered most of the crater floor except areas of higher elevation in the SW part of the crater. The W part of the crater filled about 5 m since the start of the eruption, according to data from a laser rangefinder during 11-12 September. Lava fountaining continued, rising as high as 15 m by the morning of 12 September. During the morning of 13 September active lava flows were moving on the N and E parts of the crater. The area N of the eruptive vents that had active lava on its surface became perched and was about 3 m higher than the surrounding ground surface. By the morning of 14 September active lava was flowing on the W part of the down dropped block and the NE parts of the crater. The distances of the active flows progressively decreased. Spatter had accumulated on the S (downwind) side of the vents, forming ramparts about 20 m high.
Vigorous spattering was restricted to the westernmost large spatter cone with fountains rising 10-15 m high. Minor spattering occurred within the cone to the E of the main cone, but HVO noted that the fountains remained mostly below the rim of the cone. Lava continued to effuse from these cones and likely from several others as well, traveled N and W, confined to the W part of the down-dropped block and the NE parts of Halema’uma’u. Numerous ooze-outs of lava were visible over other parts of the crater floor at night. Laser range-finder measurements taken of the W part of the crater during 14-15 September showed that lava filled the crater by 10 m since the start of the eruption. Sulfur dioxide emissions remained elevated after the onset of the eruption, ranging 20,000-190,000 t/d during the eruption activity, the highest of which occurred on 10 September.
Field crews observed the eruptive activity on 15 September; they reported a notable decrease or stop in activity at several vents. Webcam images showed little to no fountaining since 0700 on 16 September, though intermittent spattering continued from the westernmost large cone throughout the night of 15-16 September. Thermal images showed that lava continued to flow onto the crater floor. On 16 September HVO reported that the eruption stopped around 1200 and that there was no observable activity anywhere overnight or on the morning of 17 September. HVO field crews reported that active lava was no longer flowing onto Halema’uma’u crater floor and was restricted to a ponded area N of the vents on the down dropped block. They reported that spattering stopped around 1115 on 16 September. Nighttime webcam images showed some incandescence on the crater floor as lava continued to cool. Field observations supported by geophysical data showed that eruptive tremor in the summit region decreased over 15-16 September and returned to pre-eruption levels by 1700 on 16 September. Sulfur dioxide emissions were measured at a rate of 800 t/d on 16 September while the eruption was waning, and 200 t/d on 17 September, which were markedly lower compared to measurements taken the previous week of 20,000-190,000 t/d.
Geologic Background. Kilauea overlaps the E flank of the massive Mauna Loa shield volcano in the island of Hawaii. Eruptions are prominent in Polynesian legends; written documentation since 1820 records frequent summit and flank lava flow eruptions interspersed with periods of long-term lava lake activity at Halemaumau crater in the summit caldera until 1924. The 3 x 5 km caldera was formed in several stages about 1,500 years ago and during the 18th century; eruptions have also originated from the lengthy East and Southwest rift zones, which extend to the ocean in both directions. About 90% of the surface of the basaltic shield volcano is formed of lava flows less than about 1,100 years old; 70% of the surface is younger than 600 years. The long-term eruption from the East rift zone between 1983 and 2018 produced lava flows covering more than 100 km2, destroyed hundreds of houses, and added new coastline.
Information Contacts: Hawaiian Volcano Observatory (HVO), U.S. Geological Survey, PO Box 51, Hawai'i National Park, HI 96718, USA (URL: http://hvo.wr.usgs.gov/).
Tinakula (Solomon Islands) — December 2023 Cite this Report
Tinakula
Solomon Islands
10.386°S, 165.804°E; summit elev. 796 m
All times are local (unless otherwise noted)
Continued lava flows and thermal activity during June through November 2023
Tinakula is a remote 3.5 km-wide island in the Solomon Islands, located 640 km ESE of the capital, Honiara. The current eruption period began in December 2018 and has more recently been characterized by intermittent lava flows and thermal activity (BGVN 48:06). This report covers similar activity during June through November 2023 using satellite data.
During clear weather days (20 July, 23 September, 23 October, and 12 November), infrared satellite imagery showed lava flows that mainly affected the W side of the island and were sometimes accompanied by gas-and-steam emissions (figure 54). The flow appeared more intense during July and September compared to October and November. According to the MODVOLC thermal alerts, there were a total of eight anomalies detected on 19 and 21 July, 28 and 30 October, and 16 November. Infrared MODIS satellite data processed by MIROVA (Middle InfraRed Observation of Volcanic Activity) detected a small cluster of thermal activity occurring during late July, followed by two anomalies during August, two during September, five during October, and five during November (figure 55).
Geologic Background. The small 3.5-km-wide island of Tinakula is the exposed summit of a massive stratovolcano at the NW end of the Santa Cruz islands. It has a breached summit crater that extends from the summit to below sea level. Landslides enlarged this scarp in 1965, creating an embayment on the NW coast. The Mendana cone is located on the SE side. The dominantly andesitic volcano has frequently been observed in eruption since the era of Spanish exploration began in 1595. In about 1840, an explosive eruption apparently produced pyroclastic flows that swept all sides of the island, killing its inhabitants. Recorded eruptions have frequently originated from a cone constructed within the large breached crater. These have left the upper flanks and the steep apron of lava flows and volcaniclastic debris within the breach unvegetated.
Information Contacts: MIROVA (Middle InfraRed Observation of Volcanic Activity), a collaborative project between the Universities of Turin and Florence (Italy) supported by the Centre for Volcanic Risk of the Italian Civil Protection Department (URL: http://www.mirovaweb.it/); Hawai'i Institute of Geophysics and Planetology (HIGP) - MODVOLC Thermal Alerts System, School of Ocean and Earth Science and Technology (SOEST), Univ. of Hawai'i, 2525 Correa Road, Honolulu, HI 96822, USA (URL: http://modis.higp.hawaii.edu/); Copernicus Browser, Copernicus Data Space Ecosystem, European Space Agency (URL: https://dataspace.copernicus.eu/browser/).
Search Bulletin Archive by Publication Date
Select a month and year from the drop-downs and click "Show Issue" to have that issue displayed in this tab.
The default month and year is the latest issue available.
Bulletin of the Global Volcanism Network - Volume 28, Number 10 (October 2003)
Alaid (Russia)
Volcanic tremor detected beginning on 31 October
Asosan (Japan)
Phreatic eruptions during 10-14 July cause ashfall 14 km away
Bezymianny (Russia)
Rapid decrease in activity following the 26 July eruption
Ciremai (Indonesia)
Volcanic seismicity that began in March increased in October
Fuego (Guatemala)
Explosive eruptions and lava flows through October
Gamalama (Indonesia)
Small ash explosions August to early October; seismicity normal by mid-October
Ijen (Indonesia)
Shallow volcanic earthquakes and continuous tremor recorded in October
Karangetang (Indonesia)
White gas emissions and glow during October, but decreased seismicity
Krakatau (Indonesia)
Increased volcanic seismicity in August
Lewotobi (Indonesia)
Explosions and ashfall during June-July; seismicity stops in early September
Lokon-Empung (Indonesia)
Small gas plume; high but variable shallow volcanic seismicity
Masaya (Nicaragua)
Fumarole temperatures unchanged; landslides, incandescence in Santiago crater
Miyakejima (Japan)
Continued seismicity and regular gas-and-steam plumes
Nyamulagira (DR Congo)
Long-period earthquake swarms
Nyiragongo (DR Congo)
Lava lake growing through pit-wall collapses; environmental damage
Pacaya (Guatemala)
Frequent steam plumes
San Cristobal (Nicaragua)
Intermittent ash emissions between August 2002 and September 2003
Santa Maria (Guatemala)
Explosions, pyroclastic flows, and night glow in October
Semeru (Indonesia)
Frequent ash explosions continue through October
Sheveluch (Russia)
Ash eruptions, lava dome growth, steam plumes, and thermal anomalies
Soputan (Indonesia)
Ash explosion and lava flows on 31 August
Soufriere Hills (United Kingdom)
Low-level seismicity; ash venting 30 September-1 October
Unnamed (Tonga)
Pumice rafts from September-October 2001 eruption reach eastern Australia
Alaid
Russia
50.861°N, 155.565°E; summit elev. 2285 m
All times are local (unless otherwise noted)
Volcanic tremor detected beginning on 31 October
On 4 November 2003 the Level of Concern Color Code was raised to Yellow due to volcanic tremor that began on 31 October. Weak seismicity continued through 7 November. Volcanic tremor during this time was 0.5-3.3 x 10⁻⁶ mps, and a large number of weak local events were registered. On satellite images the volcano was obscured by clouds all week.
The Kamchatkan Volcanic Eruption Response Team notes that Alaid is characterized by two types of eruptions: central crater eruptions and lateral eruptions. Central crater eruptions are stronger and more dangerous then the lateral ones. The strongest central crater eruptions of Alaid were in February 1793, June 1854, July 1860, 1894, and April 1981. The April 1981 eruption sent an ash plume to 8,000-9,000 m altitude that extended for more than 1,500 km (SEAN 06:04 and 06:05). Two eruptions in 1933-1934 and 1972 (CSLP Cards nos. 1405, 1406, 1410, and 1518) ejected ash columns 3 km high.
Satellite imagery indicated possible activity in March 1982 (SEAN 07:03 and 12:04), 3 December 1996 (BGVN 21:12), and 23 August 1997 (BGVN 22:09).
Geologic Background. The highest and northernmost volcano of the Kuril Islands, Alaid is a symmetrical stratovolcano when viewed from the north, but has a 1.5-km-wide summit crater that is breached open to the south. This basaltic to basaltic andesite volcano is the northernmost of a chain constructed west of the main Kuril archipelago. Numerous pyroclastic cones are present the lower flanks, particularly on the NW and SE sides, including an offshore cone formed during the 1933-34 eruption. Strong explosive eruptions have occurred from the summit crater beginning in the 18th century. Reports of eruptions in 1770, 1789, 1821, 1829, 1843, 1848, and 1858 were considered incorrect by Gorshkov (1970). Explosive eruptions in 1790 and 1981 were among the largest reported in the Kuril Islands.
Information Contacts: Anastasia Tranbenkova, Kamchatka Volcanic Eruptions Response Team (KVERT), a cooperative program of the Institute of Volcanic Geology and Geochemistry, Far East Division, Russian Academy of Sciences, Piip Ave. 9, Petropavlovsk-Kamchatsky, 683006, Russia, the Kamchatka Experimental and Methodical Seismological Department (KEMSD), GS RAS (Russia), and the Alaska Volcano Observatory (USA); Alaska Volcano Observatory (AVO), a cooperative program of the U.S. Geological Survey, 4200 University Drive, Anchorage, AK 99508-4667, USA (URL: http://www.avo.alaska.edu/), the Geophysical Institute, University of Alaska, PO Box 757320, Fairbanks, AK 99775-7320, USA, and the Alaska Division of Geological and Geophysical Surveys, 794 University Ave., Suite 200, Fairbanks, AK 99709, USA.
Asosan
Japan
32.8849°N, 131.085°E; summit elev. 1592 m
All times are local (unless otherwise noted)
Phreatic eruptions during 10-14 July cause ashfall 14 km away
Recent noteworthy activity at Aso consisted of elevated tremor in August 2002 and a phreatic eruption in July 2003. Seismicity recorded by the Japan Meteorological Agency (JMA) between January 2000 and April 2003 (table 8) was generally constant, with continuous volcanic tremor every month in addition to isolated tremor events. The number of tremor events was high through October 2000, during April 2002, and from August 2002 through March 2003. Also during this extended period, white plumes were observed approximately once a month, with two or more plumes occurring in July, October, and December 2002, and February and March 2003. These plumes were usually less than 500 m high.
Table 8. Seismicity at Aso between January 2000 and April 2003. The seismograph station is located ~13 km W of the summit. Courtesy of JMA.
| Month |
Number of volcanic earthquakes |
Number of volcanic tremors |
| Jan 2000 |
19 |
1,466 |
| Feb 2000 |
16 |
926 |
| Mar 2000 |
73 |
1,232 |
| Apr 2000 |
-- |
-- |
| May 2000 |
39 |
537 |
| Jun 2000 |
30 |
802 |
| Jul 2000 |
29 |
1,234 |
| Aug 2000 |
21 |
2,104 |
| Sep 2000 |
36 |
1,445 |
| Oct 2000 |
38 |
1,448 |
| Nov 2000 |
43 |
202 |
| Dec 2000 |
33 |
129 |
| Jan 2001 |
51 |
60 |
| Feb 2001 |
161 |
739 |
| Mar 2001 |
76 |
537 |
| Apr 2001 |
40 |
81 |
| May 2001 |
40 |
85 |
| Jun 2001 |
99 |
188 |
| Jul 2001 |
84 |
282 |
| Aug 2001 |
60 |
471 |
| Sep 2001 |
40 |
86 |
| Oct 2001 |
91 |
32 |
| Nov 2001 |
52 |
17 |
| Dec 2001 |
45 |
5 |
| Jan 2002 |
38 |
5 |
| Feb 2002 |
59 |
20 |
| Mar 2002 |
20 |
20 |
| Apr 2002 |
114 |
1,138 |
| May 2002 |
91 |
14 |
| Jun 2002 |
191 |
36 |
| Jul 2002 |
238 |
37 |
| Aug 2002 |
153 |
4,413 |
| Sep 2002 |
144 |
1,438 |
| Oct 2002 |
103 |
1,440 |
| Nov 2002 |
652 |
3,391 |
| Dec 2002 |
154 |
8,496 |
| Jan 2003 |
122 |
6,981 |
| Feb 2003 |
178 |
4,183 |
| Mar 2003 |
92 |
1,965 |
| Apr 2003 |
70 |
474 |
Activity during August 2002. For the first time since 1992, isolated volcanic tremor events occurred at a rate of more than 300 events/day in Naka-dake Crater 1. These events were recorded between 5 and 21 August and totalled nearly 4,000 (table 9), with the highest number, 340 events, on 15 August. During this period, the water temperature of the pool in the crater remained between 57 and 60°C. On 14 August, infrared cameras measured the maximum temperature of the southern crater wall at 307°C; this increased to 314°C the following week.
Table 9. Daily number of isolated volcanic tremor events at Aso, August 2002. Courtesy of Japan Meteorological Agency.
| Date |
Isolated tremor events |
| 05 Aug 2002 |
129 |
| 06 Aug 2002 |
238 |
| 07 Aug 2002 |
241 |
| 08 Aug 2002 |
137 |
| 09 Aug 2002 |
244 |
| 10 Aug 2002 |
304 |
| 11 Aug 2002 |
315 |
| 12 Aug 2002 |
335 |
| 13 Aug 2002 |
299 |
| 14 Aug 2002 |
336 |
| 15 Aug 2002 |
340 |
| 16 Aug 2002 |
287 |
| 17 Aug 2002 |
257 |
| 18 Aug 2002 |
208 |
| 19 Aug 2002 |
162 |
| 20 Aug 2002 |
104 |
| 21 Aug 2002 |
37 as of 1100 |
Activity during July 2003. JMA reported on 11 July 2003 that tephra had fallen at Aso that morning. According to the report, a tremor event with an intermediate amplitude was recorded at 1718 on 10 July. Staff from the Aso Weather Station confirmed that small amounts of tephra had been newly deposited at Hakoishi-Toge (Hakoishi Pass), ~ 6 km ENE of the Nakadake crater. Kazunori Watanabe (Kumamoto University) and other geologists surveyed the deposit on 11 July and estimated the total mass of ejected material at roughly 130 tons. Ash was deposited as far as 14 km from the crater. A small amount of fresh vesicular glass particles were noted in the ejecta under the microscope. According to Yasuaki Sudo (Aso Volcanological Laboratory, Kyoto University), who inspected the crater area, the event was a small phreatic eruption of mud. The deposit consisted of wet ash aggregates and was ~ 1 mm thick, even at the crater rim. A spray of mud was blown off the crater rim by strong winds to 10 km from the crater.
Seismic signals implied a series of small phreatic eruptions between 12 and 14 July. Then on 27 July continuous volcanic tremor started around 1400. Observations that day noted that the water in Crater 1 was gray and boiling in the center; the temperature of the water was 76°C.
Geologic Background. The 24-km-wide Asosan caldera was formed during four major explosive eruptions from 300,000 to 90,000 years ago. These produced voluminous pyroclastic flows that covered much of Kyushu. The last of these, the Aso-4 eruption, produced more than 600 km3 of airfall tephra and pyroclastic-flow deposits. A group of 17 central cones was constructed in the middle of the caldera, one of which, Nakadake, is one of Japan's most active volcanoes. It was the location of Japan's first documented historical eruption in 553 CE. The Nakadake complex has remained active throughout the Holocene. Several other cones have been active during the Holocene, including the Kometsuka scoria cone as recently as about 210 CE. Historical eruptions have largely consisted of basaltic to basaltic andesite ash emission with periodic strombolian and phreatomagmatic activity. The summit crater of Nakadake is accessible by toll road and cable car, and is one of Kyushu's most popular tourist destinations.
Information Contacts: Volcanological Division, 1-3-4 Ote-machi, Chiyoda-ku, Tokyo 100, Japan (URL: http://www.jma.go.jp/); Volcano Research Center, Earthquake Research Institute (ERI), University of Tokyo, Yayoi 1-1-1, Bunkyo-ku, Tokyo 113, Japan (URL: http://www.eri.u-tokyo.ac.jp/VRC/index_E.html); Kazunori Watanabe, Kumamoto University, 40-1, Kurokami 2-chome, Kumamoto 860-8555, Japan; Hitoshi Yamasato and N. Uchida, Japan Meteorological Agency (JMA), Fukuoka District Meteorological Observatory, 1-2-36 Oohori, Chuo-ku, Fukuoka 810-0052, Japan; Tomoki Tsutsui and Yasuaki Sudo, Aso Volcanological Laboratory, Kyoto University, Choyo, Aso, Kumamoto, 869-1404, Japan.
Bezymianny (Russia) — October 2003 Cite this Report
Bezymianny
Russia
55.972°N, 160.595°E; summit elev. 2882 m
All times are local (unless otherwise noted)
Rapid decrease in activity following the 26 July eruption
A large explosive eruption of Bezymianny on 26 July 2003 sent an ash plume 8-11 km high and 86 km long (BGVN 28:07). A later KVERT report noted that the active eruption phase lasted ~ 4 hours after beginning on 2057. Longer plumes on 27 July extended to 192 km, 217 km and ~ 250-300 km W of the vent. Probable pyroclastic deposits were identified on the SE flank.
No seismicity was registered during 27 July-3 August. The Color Code was lowered from Red to Orange on 28 July, and reduced to Yellow on 1 August. A 1-2-pixel thermal anomaly was detected on 1 August, and observers saw gas-and-steam plumes extending ~ 15 km NW on 2 August. On 8 August the hazard status was returned to Green. Clouds frequently obscured the volcano, but another gas-and-steam plume extended SE on 19 August when a 2-pixel thermal anomaly was also noted on satellite imagery. No further seismicity was recorded through 22 August, although large volcanic tremor at nearby Kliuchevskoi volcano would have masked smaller events.
Geologic Background. The modern Bezymianny, much smaller than its massive neighbors Kamen and Kliuchevskoi on the Kamchatka Peninsula, was formed about 4,700 years ago over a late-Pleistocene lava-dome complex and an edifice built about 11,000-7,000 years ago. Three periods of intensified activity have occurred during the past 3,000 years. The latest period, which was preceded by a 1,000-year quiescence, began with the dramatic 1955-56 eruption. This eruption, similar to that of St. Helens in 1980, produced a large open crater that was formed by collapse of the summit and an associated lateral blast. Subsequent episodic but ongoing lava-dome growth, accompanied by intermittent explosive activity and pyroclastic flows, has largely filled the 1956 crater.
Information Contacts: Olga Girina, Kamchatka Volcanic Eruptions Response Team (KVERT), a cooperative program of the Institute of Volcanic Geology and Geochemistry, Far East Division, Russian Academy of Sciences, Piip Ave. 9, Petropavlovsk-Kamchatsky, 683006, Russia, the Kamchatka Experimental and Methodical Seismological Department (KEMSD), GS RAS (Russia), and the Alaska Volcano Observatory (USA); Alaska Volcano Observatory (AVO), a cooperative program of the U.S. Geological Survey, 4200 University Drive, Anchorage, AK 99508-4667, USA (URL: http://www.avo.alaska.edu/), the Geophysical Institute, University of Alaska, PO Box 757320, Fairbanks, AK 99775-7320, USA, and the Alaska Division of Geological and Geophysical Surveys, 794 University Ave., Suite 200, Fairbanks, AK 99709, USA.
Ciremai (Indonesia) — October 2003 Cite this Report
Ciremai
Indonesia
6.895°S, 108.408°E; summit elev. 3039 m
All times are local (unless otherwise noted)
Volcanic seismicity that began in March increased in October
Data from the Volcanological Survey of Indonesia (VSI) indicated a tectonic and volcanic earthquake at Cereme on 25 March, followed by one more volcanic event on 28 March. Activity picked up on 2 April with three more volcanic events, with 17 events through 14 April. Daily highs of 8 and 11 events were recorded on 24 April and 3 May, respectively (2-4 May had 22). Seismicity remained generally low (0-3/day) until 29 events occurred on 7 October.
After a felt earthquake on 7 October, volcanic earthquakes increased. This increased seismicity was accompanied by elevated visually observed activity, resulting in the hazard status being upgraded to Alert Level 2 on 13 October. Seismic activity during 6-12 October consisted of 46 deep volcanic earthquakes and 15 shallow volcanic earthquakes; 36 deep volcanic events occurred the following week of 13-19 October. There was a felt earthquake on 19 October that lasted for 95.5 seconds (35 mm amplitude). Seismic activity declined during 20-26 October, when only seven deep volcanic earthquakes were recorded. The temperature measured at the Sangkan Hurip hotspring in late October was 48°C, unchanged from previous measurements.
Geologic Background. The symmetrical Ciremai stratovolcano is located closer to the northern coast than other central Java volcanoes. A large crater, elongated in an E-W direction and formed by multiple vents, caps the summit of Gunung Ciremai, which was constructed on the northern rim of the 4.5 x 5 km Geger Halang caldera. A large landslide deposit to the north may be associated with the origin of the caldera, although collapse may rather be due to a voluminous explosive eruption (Newhall and Dzurisin, 1988). Eruptions have included explosive activity and lahars, primarily from the summit crater.
Information Contacts: Dali Ahmad, Hetty Triastuty, Nia Haerani, and Suswati, Volcanological Survey of Indonesia (VSI), Jalan Diponegoro No. 57, Bandung 40122, Indonesia (URL: http://www.vsi.esdm.go.id/); Darwin Volcanic Ash Advisory Centre (VAAC), Bureau of Meteorology, Northern Territory Regional Office, PO Box 40050, Casuarina, NT 0811, Australia (URL: http://www.bom.gov.au/info/vaac/).
Fuego (Guatemala) — October 2003 Cite this Report
Fuego
Guatemala
14.4748°N, 90.8806°W; summit elev. 3799 m
All times are local (unless otherwise noted)
Explosive eruptions and lava flows through October
Explosive and effusive activity, last reported through January 2003 (BGVN 28:01) has continued through October 2003. Plumes identified on satellite imagery between April and September 2003 were described in aviation advisories issued by the Washington Volcanic Ash Advisory Center (VAAC). Regular reports of daily activity provided by the Instituto Nacional de Sismologia, Vulcanologia, Meteorologia e Hidrologia (INSIVUMEH) on their website have been summarized for many days in the second half of October.
Activity during April-September 2003. The Washington VAAC reported that on 28 April 2003 Fuego generated intermittent ash eruptions. One cloud was observed at ~ 7 km altitude moving SW at 19-29 km/hour. On 2 May the VAAC reported possible ash around the summit, but as of 1515, none was visible. INSIVUMEH indicated that although Fuego was active with explosions, most ash was confined to near the summit.
On 29 June INSIVUMEH reported a moderate eruption during 1745-2200 that consisted mainly of lava effusion. Lava flows were observed on the E flank, in the Lajas, Jute, and Barranca Honda ravines. Avalanches generated sounds similar to a locomotive, with strong rumblings and acoustic waves. Fuego's Observatory 2, on the SW flank, reported 2 cm of ashfall. Ashfall also occurred in San Pedro Yepocapa, Patulul Suchitepequez, Cocales, and villages W and SW of the volcano. At about 2335 there was a reduction in seismic activity at the Fuego 3 station.
INSIVUMEH reported on 1 July that explosive activity continued with weak to sometimes strong explosions ejecting grayish ash up to 900 m above the crater, with occasional degassing sounds and rumblings. Pyroclastic-flow material moved into the W-flank Seca and Santa Teresa valleys, 1.5 km from the village of Sangre de Cristo. A pyroclastic flow was reported by the Washington VAAC at 1130 on 9 July. INSIVUMEH reported strong explosions with ash to 2 km above the summit, a plume extending 5-7 km W, and ashfall to the W and SW. GOES-12 imagery showed a 3.7-km-wide plume extending ~ 11 km W.
The Washington VAAC reported on 7 August that a brief puff of ash was ejected at about 1600; the small plume moved to the NW and dissipated by 1745. On 28 September the Washington VAAC, based on visible and multi-spectral IR techniques, reported an ash eruption at about 1100. This plume, which was ~ 5 x 5 km, moved S toward the coast and was no longer discernable on imagery by 1400. A second ash emission between 1415 and 1432, with an approximate altitude of 6 km, was partially obscured by clouds.
Activity during 15-30 October 2003. On 15 October INSIVUMEH reported the continuation of eruptive activity, with degassing and small rumbling sounds. Incandescence was seen above the crater at night. The ejected ash was dispersed around the volcanic edifice. A small eruption that began at 0007 on 17 October ended at 0040 after five moderate explosive pulses, each 2-3 minutes in duration, generated thick columns of grayish ash ~ 1,500 m high. Before and after this eruptive event moderate and strong explosions caused rumbling and shock waves felt at the OVFGO and FG2 observatories. Small incandescent avalanches moved towards the Santa Teresa valley.
Harmonic tremor was registered at the FG3 station at 1630 on 20 October. On 21 October, INSIVUMEH reported explosions after 0350. The majority were strong, expelling abundant incandescent material. Ash columns caused small and moderate avalanches, mainly in the Santa Teresa and Trinidad valleys, and occasionally in the Taniluyá. Shock waves were felt by communities around the volcano. Slight ashfall occurred in the Morelia and Santa Lucia villages located 7 and 10 km, respectively, SSW of the active crater.
On 23 October, INSIVUMEH reported moderate, weak and occasionally strong explosions producing grayish and blackish plumes up to one km high. Moderate and strong explosions generated rumbling and lava flows that traveled toward the Santa Teresa and Trinidad valleys. Ashfall occurred in the upper portion of the Fuego-Acatenango complex. At 0945 a strong explosion, lasting 1.5 minutes, produced a thick ash cloud that reached a height of ~ 1 km and dispersed to the SW. Two short pulses lasting 45-60 minutes between 1200-1300 and 1800-1900 on 23 October generated a series of 7-9 moderate explosions that produced a grayish column to ~ 1 km over the central crater.
A strong explosion at 0910 on 27 October was preceded by five moderate explosions at intervals of 3-7 minutes that produced gas clouds and ash 700 m high. The first event produced a heavy ash column of a height of ~ 1 km which dispersed to the SW. An explosion at 0625 caused a pyroclastic flow toward the Trinidad and Santa Teresa valleys, and produced light ashfall in the village of Sangre de Cristo. On 29 October INSIVUMEH reported predominantly weak and moderate explosions 1-3.5 minutes long with gas-and-ash columns up to 1 km high. The last of these produced ashfall, shock waves felt at OVFGO, and avalanches of incandescent material toward the Santa Teresa and Trinidad valleys.
On 30 October an effusive eruption during 2300-0600 produced incandescent lava fountains 75-100 m high with pulses of 5-6 minutes, changing to fountains ~ 50 m high and 15-20 minutes long. A short lava flow descended SW from the crater rim, reaching ~ 250 m in length and splitting into three short branches. Short avalanches and pyroclastic flows descended to the top of the Santa Teresa valley. The eruption produced moderate to weak sounds lasting ~ 2 minutes. At dawn, a thick fumarolic plume was observed blowing NW. There was no ash emission during this activity, but at 0625 hours a small explosion sent a column of gas and ash ~ 400 m high. The seismic station at FG3 registered harmonic tremor (2-4 mm amplitude).
Geologic Background. Volcán Fuego, one of Central America's most active volcanoes, is also one of three large stratovolcanoes overlooking Guatemala's former capital, Antigua. The scarp of an older edifice, Meseta, lies between Fuego and Acatenango to the north. Construction of Meseta dates back to about 230,000 years and continued until the late Pleistocene or early Holocene. Collapse of Meseta may have produced the massive Escuintla debris-avalanche deposit, which extends about 50 km onto the Pacific coastal plain. Growth of the modern Fuego volcano followed, continuing the southward migration of volcanism that began at the mostly andesitic Acatenango. Eruptions at Fuego have become more mafic with time, and most historical activity has produced basaltic rocks. Frequent vigorous eruptions have been recorded since the onset of the Spanish era in 1524, and have produced major ashfalls, along with occasional pyroclastic flows and lava flows.
Information Contacts: Instituto Nacional de Sismologia, Vulcanologia, Meteorologia e Hidrologia (INSIVUMEH), Ministero de Communicaciones, Transporto, Obras Públicas y Vivienda, 7a. Av. 14-57, zona 13, Guatemala City 01013, Guatemala (URL: http://www.insivumeh.gob.gt/).
Gamalama (Indonesia) — October 2003 Cite this Report
Gamalama
Indonesia
0.81°N, 127.3322°E; summit elev. 1714 m
All times are local (unless otherwise noted)
Small ash explosions August to early October; seismicity normal by mid-October
A series of explosive eruptions on 31 July 2003 produced ashfall and pyroclastic flows (BGVN 28:07). Several small ash explosions occurred throughout August and September (BGVN 28:09). Activity was similar during 29 September-5 October 2003, with white gas emissions rising 25-100 m and some small ash explosions. Volcanic seismicity consisted of one deep earthquake, two shallow earthquakes, and 24 emission events. Activity remained low the following week, 6-12 October, with gas emissions rising 25-50 m. The number of daily seismic events this week had returned to normal levels, so the hazard status was downgraded to Alert Level 1 (on a scale of 1-4) on 13 October.
Geologic Background. Gamalama is a near-conical stratovolcano that comprises the entire island of Ternate off the western coast of Halmahera, and is one of Indonesia's most active volcanoes. The island was a major regional center in the Portuguese and Dutch spice trade for several centuries, which contributed to the extensive documentation of activity. Three cones, progressively younger to the north, form the summit. Several maars and vents define a rift zone, parallel to the Halmahera island arc, that cuts the volcano; the S-flank Ngade maar formed after about 14,500–13,000 cal. BP (Faral et al., 2022). Eruptions, recorded frequently since the 16th century, typically originated from the summit craters, although flank eruptions have occurred in 1763, 1770, 1775, and 1962-63.
Information Contacts: Dali Ahmad, Hetty Triastuty, Nia Haerani, and Suswati, Volcanological Survey of Indonesia (VSI), Jalan Diponegoro No. 57, Bandung 40122, Indonesia (URL: http://www.vsi.esdm.go.id/).
Ijen
Indonesia
8.058°S, 114.242°E; summit elev. 2769 m
All times are local (unless otherwise noted)
Shallow volcanic earthquakes and continuous tremor recorded in October
The hazard status of Ijen was upgraded to Alert Level 2 (on a scale of 1-4) on 8 October. Seismicity the week of 6-12 October comprised four deep volcanic earthquakes, 21 shallow volcanic earthquakes, one emission event, and continuous tremor (0.5-2 mm amplitude). Only 16 shallow volcanic earthquakes were recorded the following week, along with continuous tremor (0.5-2 mm amplitude). Continuous tremor (0.5-4 mm amplitude) was recorded during 20-26 October, a week when the number of shallow volcanic events increased to 30. Gas plumes emitted from the crater rose up to 150 m high during October.
Geologic Background. The Ijen volcano complex at the eastern end of Java consists of a group of small stratovolcanoes constructed within the 20-km-wide Ijen (Kendeng) caldera. The north caldera wall forms a prominent arcuate ridge, but elsewhere the rim was buried by post-caldera volcanoes, including Gunung Merapi, which forms the high point of the complex. Immediately west of the Gunung Merapi stratovolcano is the historically active Kawah Ijen crater, which contains a nearly 1-km-wide, turquoise-colored, acid lake. Kawah Ijen is the site of a labor-intensive mining operation in which baskets of sulfur are hand-carried from the crater floor. Many other post-caldera cones and craters are located within the caldera or along its rim. The largest concentration of cones forms an E-W zone across the southern side of the caldera. Coffee plantations cover much of the caldera floor; nearby waterfalls and hot springs are tourist destinations.
Information Contacts: Dali Ahmad, Hetty Triastuty, Nia Haerani, and Suswati, Volcanological Survey of Indonesia (VSI), Jalan Diponegoro No. 57, Bandung 40122, Indonesia (URL: http://www.vsi.esdm.go.id/).
Karangetang (Indonesia) — October 2003 Cite this Report
Karangetang
Indonesia
2.781°N, 125.407°E; summit elev. 1797 m
All times are local (unless otherwise noted)
White gas emissions and glow during October, but decreased seismicity
Explosive activity has been common at Karangetang in recent years, producing ashfall and lava avalanches as recently as May and June 2003 (BGVN 28:05 and 28:07). However, Karangetang was not included in reports by the Volcanological Survey of Indonesia (VSI) between 16 June and 28 September 2003. A report for the week of 29 September-5 October indicated that there had been a decrease in multiphase and emissions earthquakes compared to the previous week (table 9). At that time white gas emissions were observed rising 400 m above the S crater and 50 m above the N crater. Red glow was seen at night over the S crater that week. No lava avalanches occurred. Similar observations were reported through 19 October. Although surface observations of activity were consistent, seismic data showed that shallow volcanic earthquakes increased and emission events decreased during 6-19 October. The hazard status remained at Alert Level 2 (on a scale of 1-4) through at least 19 October.
Table 9. Seismicity at Karangetang during 2 June-19 October 2003. No data was available between 16 June and 28 September. Courtesy of VSI.
| Date |
Deep volcanic (A-type) |
Shallow volcanic (B-type) |
Multiphase |
Emission |
Tectonic |
| 02 Jun-08 Jun 2003 |
11 |
348 |
233 |
46 |
26 |
| 09 Jun-15 Jun 2003 |
32 |
438 |
228 |
21 |
20 |
| 29 Sep-05 Oct 2003 |
15 |
84 |
50 |
121 |
38 |
| 06 Oct-12 Oct 2003 |
19 |
103 |
33 |
74 |
32 |
| 13 Oct-19 Oct 2003 |
18 |
135 |
54 |
72 |
33 |
Geologic Background. Karangetang (Api Siau) volcano lies at the northern end of the island of Siau, about 125 km NNE of the NE-most point of Sulawesi. The stratovolcano contains five summit craters along a N-S line. It is one of Indonesia's most active volcanoes, with more than 40 eruptions recorded since 1675 and many additional small eruptions that were not documented (Neumann van Padang, 1951). Twentieth-century eruptions have included frequent explosive activity sometimes accompanied by pyroclastic flows and lahars. Lava dome growth has occurred in the summit craters; collapse of lava flow fronts have produced pyroclastic flows.
Information Contacts: Dali Ahmad, Hetty Triastuty, Nia Haerani, and Suswati, Volcanological Survey of Indonesia (VSI), Jalan Diponegoro No. 57, Bandung 40122, Indonesia (URL: http://www.vsi.esdm.go.id/).
Krakatau (Indonesia) — October 2003 Cite this Report
Krakatau
Indonesia
6.1009°S, 105.4233°E; summit elev. 285 m
All times are local (unless otherwise noted)
Increased volcanic seismicity in August
A report of activity at Krakatau for the period 18-24 August was provided by the Volcanological Survey of Indonesia. There was increase in volcanic earthquakes during this time, while tectonic earthquakes decreased. No visual observations were made due to foggy weather. Seismicity consisted of 12 deep volcanic earthquakes, 56 shallow volcanic earthquakes, and three tectonic events. The hazard status was at Alert Level 2 (on a scale of 1-4).
Geologic Background. The renowned Krakatau (frequently mis-named as Krakatoa) volcano lies in the Sunda Strait between Java and Sumatra. Collapse of an older edifice, perhaps in 416 or 535 CE, formed a 7-km-wide caldera. Remnants of that volcano are preserved in Verlaten and Lang Islands; subsequently the Rakata, Danan, and Perbuwatan cones were formed, coalescing to create the pre-1883 Krakatau Island. Caldera collapse during the catastrophic 1883 eruption destroyed Danan and Perbuwatan, and left only a remnant of Rakata. This eruption caused more than 36,000 fatalities, most as a result of tsunamis that swept the adjacent coastlines of Sumatra and Java. Pyroclastic surges traveled 40 km across the Sunda Strait and reached the Sumatra coast. After a quiescence of less than a half century, the post-collapse cone of Anak Krakatau (Child of Krakatau) was constructed within the 1883 caldera at a point between the former Danan and Perbuwatan cones. Anak Krakatau has been the site of frequent eruptions since 1927.
Information Contacts: Dali Ahmad, Hetty Triastuty, and Nia Haerani, Volcanological Survey of Indonesia (VSI), Jalan Diponegoro No. 57, Bandung 40122, Indonesia (URL: http://www.vsi.esdm.go.id/).
Lewotobi (Indonesia) — October 2003 Cite this Report
Lewotobi
Indonesia
8.542°S, 122.775°E; summit elev. 1703 m
All times are local (unless otherwise noted)
Explosions and ashfall during June-July; seismicity stops in early September
Explosive ash eruptions from the summit crater of Lewotobi sent dark gray plumes 300-350 m high between 2 June and 13 July. Detonation sounds accompanied explosions on 3, 5, and 6 June. Ash fell in the villages of Bawalatang, Duang, and Boru in early June, and was reported at the volcano observatory post in early July. Ash explosions continued during 14-20 July with plumes rising 150 m above the summit. Poor weather conditions prevented observations in late July, although seismic records indicated continued activity; no reports were available for August. In early September an ash plume was reported to rise 25 m above the crater.
Seismicity during June and July was dominated by emissions events, but included tremor, explosion, and shallow volcanic earthquakes (table 2). Early September seismicity consisted of a high number of shallow volcanic events and some deep volcanic earthquakes, but all seismicity ceased after 3 September. Only four tectonic earthquakes were detected after this date, during 6-19 October. The 29 September-5 October report noted an ash plume rising to 25 m above the crater, but over the next two weeks the 25-m-high plume was described as gas emissions. The hazard status was downgraded to Alert Level 1 (on a scale of 1-4) the week of 13-19 October.
Table 2. Seismicity at Lewotobi, 2 June-19 October 2003. Note that no seismicity was recorded after 3 September 2003. Courtesy of VSI.
| Date |
Deep Volcanic |
Shallow Volcanic |
Explosion |
Emission |
Tremor |
Tectonic |
| 02 Jun-08 Jun 2003 |
0 |
13 |
7 |
29 |
20 |
12 |
| 09 Jun-15 Jun 2003 |
0 |
24 |
-- |
40 |
33 |
9 |
| 30 Jun-06 Jul 2003 |
0 |
8 |
14 |
26 |
11 |
3 |
| 07 Jul-13 Jul 2003 |
0 |
16 |
10 |
52 |
4 |
1 |
| 14 Jul-20 Jul 2003 |
4 |
17 |
19 |
24 |
10 |
4 |
| 21 Jul-27 Jul 2003 |
1 |
10 |
5 |
25 |
5 |
4 |
| 28 Jul-03 Aug 2003 |
0 |
9 |
8 |
20 |
6 |
3 |
| 01 Sep-03 Sep 2003* |
27 |
257 |
0 |
0 |
0 |
5 |
Geologic Background. The Lewotobi edifice in eastern Flores Island is composed of the two adjacent Lewotobi Laki-laki and Lewotobi Perempuan stratovolcanoes (the "husband and wife"). Their summits are less than 2 km apart along a NW-SE line. The conical Laki-laki to the NW has been frequently active during the 19th and 20th centuries, while the taller and broader Perempuan has had observed eruptions in 1921 and 1935. Small lava domes have grown during the 20th century in both of the summit craters, which are open to the north. A prominent cone, Iliwokar, occurs on the E flank of Perampuan.
Information Contacts: Dali Ahmad, Hetty Triastuty, Nia Haerani, and Suswati, Volcanological Survey of Indonesia (VSI), Jalan Diponegoro No. 57, Bandung 40122, Indonesia (URL: http://www.vsi.esdm.go.id/).
Lokon-Empung (Indonesia) — October 2003 Cite this Report
Lokon-Empung
Indonesia
1.3644°N, 124.7992°E; summit elev. 1580 m
All times are local (unless otherwise noted)
Small gas plume; high but variable shallow volcanic seismicity
The hazard status at Lokon-Empung throughout the report period of 2 June-19 October was at Alert Level 2 (on a scale of 1-4). Between 2 June and 5 October a white gas plume consistently rose 25-50 m above Tompaluan crater. The gas plume rose slightly higher, to 75 m, during the following two weeks. Seismicity remained above normal background levels during this time, with some variation (table 7). Shallow volcanic earthquakes increased in late July, but by September the weekly count was lower than in early July, eventually reaching a low the week of 15-21 September when no such events were detected. Seismicity quickly returned to high values of 138-209 shallow events per week in October.
Table 7. Seismicity at Lokon-Empung, 2 June-19 October 2003. Data was not available for 16-29 June and 04-31 August. Courtesy of VSI.
| Date |
Deep volcanic (A-type) |
Shallow volcanic (B-type) |
Tectonic |
| 02 Jun-08 Jun 2003 |
13 |
45 |
20 |
| 09 Jun-15 Jun 2003 |
25 |
88 |
27 |
| 30 Jun-06 Jul 2003 |
18 |
81 |
19 |
| 07 Jul-13 Jul 2003 |
17 |
48 |
15 |
| 14 Jul-20 Jul 2003 |
9 |
91 |
19 |
| 21 Jul-27 Jul 2003 |
25 |
232 |
21 |
| 28 Jul-03 Aug 2003 |
16 |
157 |
10 |
| 01 Sep-07 Sep 2003 |
11 |
44 |
11 |
| 08 Sep-14 Sep 2003 |
7 |
36 |
20 |
| 15 Sep-21 Sep 2003 |
12 |
0 |
22 |
| 22 Sep-28 Sep 2003 |
34 |
22 |
20 |
| 29 Sep-05 Oct 2003 |
33 |
209 |
24 |
| 06 Oct-12 Oct 2003 |
5 |
159 |
14 |
| 13 Oct-19 Oct 2003 |
24 |
138 |
14 |
Geologic Background. The Lokong-Empung volcanic complex, rising above the plain of Tondano in North Sulawesi, includes four peaks and an active crater. Lokon, the highest peak, has a flat craterless top. The morphologically younger Empung cone 2 km NE has a 400-m-wide, 150-m-deep crater that erupted last in the 18th century. A ridge extending 3 km WNW from Lokon includes the Tatawiran and Tetempangan peaks. All eruptions since 1829 have originated from Tompaluan, a 150 x 250 m crater in the saddle between Lokon and Empung. These eruptions have primarily produced small-to-moderate ash plumes that sometimes damaged croplands and houses, but lava-dome growth and pyroclastic flows have also occurred.
Information Contacts: Dali Ahmad, Hetty Triastuty, Nia Haerani, and Suswati, Volcanological Survey of Indonesia (VSI), Jalan Diponegoro No. 57, Bandung 40122, Indonesia (URL: http://www.vsi.esdm.go.id/).
Masaya (Nicaragua) — October 2003 Cite this Report
Masaya
Nicaragua
11.9844°N, 86.1688°W; summit elev. 594 m
All times are local (unless otherwise noted)
Fumarole temperatures unchanged; landslides, incandescence in Santiago crater
This report summarizes the activity at Masaya during June-September 2003. Activity was generally constant, with fumarole temperature measurements similar to those from previous months (BGVN 28:08). In June, July, and August, during visits made every two weeks, Jaime Cárdenas of Masaya Volcano National Park measured the fumarole temperatures at the Comalito and San Fernando craters (table 4). No changes were observed from previous months. During these months, seismic tremor remained constant with 20 units RSAM. No earthquakes were registered, but on both 21 June and 21 July landslides were reported in the Santiago crater. In September, temperatures obtained from the Santiago crater with a Pyrometer were 187°C and 123°C. It was noted during this visit that the lava sounded like ocean waves, and incandescence was observed at night. Temperatures at El Comalito remained moderate.
Table 4. Temperatures recorded at the El Comalito (EC) and San Fernando (SF) fumaroles of Masaya, 10 June-22 September 2003. All temperatures are in degrees Celsius. Courtesy INETER.
| Date |
EC 1 |
EC 2 |
EC 3 |
EC 4 |
EC 5 |
EC 6 |
SF 1 |
SF 2 |
SF 3 |
SF 4 |
| 10 Jun 2003 |
65.4 |
74.5 |
76.8 |
72.5 |
73.4 |
60.2 |
59.2 |
54.8 |
57.2 |
55.8 |
| 28 Jun 2003 |
66.4 |
75.4 |
78.4 |
73.6 |
73.8 |
60.4 |
60.2 |
55.6 |
58.8 |
56.7 |
| 12 Jul 2003 |
55 |
76 |
78.2 |
74 |
73.6 |
60 |
60 |
60.2 |
59.5 |
57 |
| 26 Jul 2003 |
66.8 |
78.4 |
79.4 |
75.6 |
74.2 |
61 |
61.2 |
61.4 |
60.2 |
58.2 |
| 15 Aug 2003 |
66.6 |
78.2 |
79.5 |
76 |
74.5 |
61.5 |
59.7 |
59.7 |
57.2 |
56.2 |
| 29 Aug 2003 |
67.8 |
75.6 |
76.6 |
74.8 |
76.4 |
64.2 |
59.3 |
57.4 |
56.9 |
57 |
| 22 Sep 2003 |
68.6 |
72.3 |
68.3 |
65.2 |
-- |
-- |
-- |
-- |
-- |
-- |
Geologic Background. Masaya volcano in Nicaragua has erupted frequently since the time of the Spanish Conquistadors, when an active lava lake prompted attempts to extract the volcano's molten "gold" until it was found to be basalt rock upon cooling. It lies within the massive Pleistocene Las Sierras caldera and is itself a broad, 6 x 11 km basaltic caldera with steep-sided walls up to 300 m high. The caldera is filled on its NW end by more than a dozen vents that erupted along a circular, 4-km-diameter fracture system. The Nindirí and Masaya cones, the source of observed eruptions, were constructed at the southern end of the fracture system and contain multiple summit craters, including the currently active Santiago crater. A major basaltic Plinian tephra erupted from Masaya about 6,500 years ago. Recent lava flows cover much of the caldera floor and there is a lake at the far eastern end. A lava flow from the 1670 eruption overtopped the north caldera rim. Periods of long-term vigorous gas emission at roughly quarter-century intervals have caused health hazards and crop damage.
Information Contacts: Virginia Tenorio, Instituto Nicaragüense de Estudios Territoriales (INETER), Apartado Postal 2110, Managua, Nicaragua (URL: http://www.ineter.gob.ni/).
Miyakejima (Japan) — October 2003 Cite this Report
Miyakejima
Japan
34.094°N, 139.526°E; summit elev. 775 m
All times are local (unless otherwise noted)
Continued seismicity and regular gas-and-steam plumes
Volcanic activity at Miyake-jima since the eruption during the summer of 2000 (BGVN 25:07) has continued at lower levels through August 2003. The flux of SO2 gas remained high (~ 4, 000-9, 000 tons/day), and has been nearly constant since October 2002 (figure 20). A compilation of seismic data and plume observations through April 2003 (table 3) documents this continuing activity. Plume heights following the June-September 2000 activity have not been greater than 2.2 km above the summit (table 3), and their color has been described as white or grayish white.
Table 3. Summary of seismicity and plume observations at Miyake-jima, January 2000-April 2003. All reported plumes originated from the summit crater, and were described as either white (W), light white (LW), grayish white (GW), or gray (G). No months during this time had more than six plumes observed on any single day. Data courtesy of JMA.
| Month |
Volcanic earthquakes |
Max. Plume Height (km) (date) |
Plume Color (date) |
| Jan 2000 |
2 |
-- |
-- |
| Feb 2000 |
4 |
-- |
-- |
| Mar 2000 |
1 |
-- |
-- |
| Apr 2000 |
No JMA report received this month |
| May 2000 |
3 |
-- |
-- |
| Jun 2000 |
> 13,840 |
-- |
-- |
| Jul 2000 |
> 24,494 |
1.5 (8, 14) |
W (8) colored (14, 15) |
| Aug 2000 |
> 10,175 |
14 (18) |
Mix of white and colored almost daily all after 10th |
| Sep 2000 |
146 |
3.5 (26) frequently above 1 |
W (almost daily), C (3, 24, 27) |
| Oct 2000 |
16 |
2.7 (10) |
W |
| Nov 2000 |
5 |
2.5 (26) |
W |
| Dec 2000 |
6 |
2.0 (22, 27) |
W |
| Jan 2001 |
214 |
1.8 (22, 31) |
W, GW (11) |
| Feb 2001 |
260 |
2.0 (17) |
W |
| Mar 2001 |
299 |
2.0 (2, 16, 24) |
W, GW (19) |
| Apr 2001 |
191 |
2.0 (4) |
W |
| May 2001 |
707 |
2.2 (6) |
W, G (27) |
| Jun 2001 |
192 |
2.2 (10) |
W, G (3, 10) |
| Jul 2001 |
249 |
1.6 (16, 21) |
W, G (10) |
| Aug 2001 |
306 |
2.0 (24, 25, 27, 28) |
W |
| Sep 2001 |
234 |
3.0 (16) |
W |
| Oct 2001 |
116 |
1.5 (16, 21, 22, 24, 29, 31) |
W, GW |
| Nov 2001 |
124 |
2.0 (20) |
W, GW (1) |
| Dec 2001 |
123 |
1.7 (29) |
W |
| Jan 2002 |
41 |
2.0 (6) |
W, GW |
| Feb 2002 |
88 |
1.7 (14) |
W, GW |
| Mar 2002 |
71 |
1.2 (16, 28) |
W, GW (31) |
| Apr 2002 |
104 |
1.0 (10) |
W, GW (2, 3) |
| May 2002 |
265 |
1.5 (29) |
W |
| Jun 2002 |
176 |
0.8 (9) |
W, GW (15) |
| Jul 2002 |
78 |
0.8 (27) |
W |
| Aug 2002 |
45 |
1.0 (3) |
W |
| Sep 2002 |
57 |
1.5 (4) |
W |
| Oct 2002 |
47 |
1.0 (6, 30) |
W, GW (8) |
| Nov 2002 |
55 |
1.0 (6, 29) |
W |
| Dec 2002 |
66 |
0.8 (28) |
W |
| Jan 2003 |
202 |
1.0 (25) |
W |
| Feb 2003 |
313 |
0.8 (13) |
W |
| Mar 2003 |
212 |
1.2 (28) |
W |
| Apr 2003 |
450 |
1.0 (28) |
W |
The number of monthly earthquakes was very low (1-4/month) until late June through early September 2000. Except for 5 May 2001 when 447 volcanic earthquakes occurred, daily totals have been less than 50. Monthly earthquake totals since August 2000 have been less than 300, except for May 2001 (707) and April 2003 (450). Volcanic tremor also began in July 2000 and became continuous in September 2000. Tremor through April 2003 totaled less than 500 events per month, except for May 2001, when 1, 362 events were recorded (444 on the 22nd). The unusually high seismicity noted in May 2001 corresponded to a period of continuous steam plumes with abundant SO2 content (BGVN 27:03), after which SO2 flux declined (figure 2).
Seismicity at Miyake-jima is recorded by three seismographs maintained by the Japan Meterological Agency (JMA): station "A" is ~ 1.9 km NNE of the summit at 530 m elevation, station "AKOC" is ~ 4.6 km W at 42 m elevation, and station "RST" is ~ 1.9 km SSE at 463 m elevation.
Geologic Background. The circular, 8-km-wide island of Miyakejima forms a low-angle stratovolcano that rises about 1,100 m from the sea floor in the northern Izu Islands about 200 km SSW of Tokyo. The basaltic volcano is truncated by small summit calderas, one of which, 3.5 km wide, was formed during a major eruption about 2,500 years ago. Numerous craters and vents, including maars near the coast and radially oriented fissure vents, are present on the flanks. Frequent eruptions have been recorded since 1085 CE at vents ranging from the summit to below sea level, causing much damage on this small populated island. After a three-century-long hiatus ending in 1469 CE, activity has been dominated by flank fissure eruptions sometimes accompanied by minor summit eruptions. A 1.6-km-wide summit crater was slowly formed by subsidence during an eruption in 2000.
Information Contacts: Japan Meteorological Agency (JMA), Volcanological Division, 1-3-4 Ote-machi, Chiyoda-ku, Tokyo 100, Japan (URL: http://www.jma.go.jp/); Akihiko Tomiya, Geological Survey of Japan, AIST, 1-1 Higashi, 1-Chome Tsukuba, Ibaraki 305-8567, Japan (URL: https://staff.aist.go.jp/a.tomiya/tomiyae.html).
Nyamulagira (DR Congo) — October 2003 Cite this Report
Nyamulagira
DR Congo
1.408°S, 29.2°E; summit elev. 3058 m
All times are local (unless otherwise noted)
Long-period earthquake swarms
During the 3-month period from 2 August to 8 November 2003, seismicity in the Nyamuragira area was dominated by long-period (LP) events localized along a main NNE-SSW fracture between Nyamuragira and Nyiragongo volcanoes. Intermittent swarms of LP events (60-80 events each time) occurred on Nyamuragira two to three times per week. A larger swarm was observed on 23 July (100 LP events). This activity remained fairly stable for the whole period. Earthquakes related to fracturing continued, mainly S of Nyiragongo (N of Lake Kivu ) and NE of Nyamuragira. No noticeable deformation change has been recorded along the fracture system.
Geologic Background. Africa's most active volcano, Nyamulagira (also known as Nyamuragira), is a massive high-potassium basaltic shield about 25 km N of Lake Kivu and 13 km NNW of the steep-sided Nyiragongo volcano. The summit is truncated by a small 2 x 2.3 km caldera that has walls up to about 100 m high. Documented eruptions have occurred within the summit caldera, as well as from the numerous flank fissures and cinder cones. A lava lake in the summit crater, active since at least 1921, drained in 1938, at the time of a major flank eruption. Recent lava flows extend down the flanks more than 30 km from the summit as far as Lake Kivu; extensive lava flows from this volcano have covered 1,500 km2 of the western branch of the East African Rift.
Information Contacts: Observatoire Volcanologique de Goma, Departement de Geophysique, Centre de Recherche en Sciences Naturelles, Lwiro, D.S. Bukavu, DR Congo.
Nyiragongo (DR Congo) — October 2003 Cite this Report
Nyiragongo
DR Congo
1.52°S, 29.25°E; summit elev. 3470 m
All times are local (unless otherwise noted)
Lava lake growing through pit-wall collapses; environmental damage
During the 3-month period from 2 August to 8 November 2003, volcanic activity was concentrated inside the Nyiragongo crater. An almost permanently boiling lava lake occupies the crater at the depth of 700 m. Although the level of the lake inside the crater seems to remain constant, its size is slowly growing due to collapses of the pit walls. Degassing has been significant, marked by a large gas plume above the crater which is generally blown W by the prevailing winds and extends several tens of kilometers. The impact of this activity on the environment is growing; inside the National Park, a 50 km2 area of forest was totally destroyed by volcanic gases and acid rains, and a zone with 50% destruction covers more than 700 km2, affecting crops such as potatoes, corn, beans, and bananas. In the same areas significant fluoride pollution has been detected, and tanks collecting rain water are showing fluoride concentrations up to 23 mg/l (WHO tolerance = 1.5 mg/l).
In the Nyiragongo area, long-period events are commonly detected but at reduced number and are mainly located NW and SW of the volcano. Seismicity is largely dominated by permanent tremor generated by the activity of the lava lake. Earthquakes related to fracturing continue, mainly S of Nyiragongo and NE of Nyamuragira (~ 15 km NW of Nyiragongo). No noticeable deformation change has been recorded along the fracture system between the two volcanoes.
Geologic Background. The Nyiragongo stratovolcano contained a lava lake in its deep summit crater that was active for half a century before draining catastrophically through its outer flanks in 1977. The steep slopes contrast to the low profile of its neighboring shield volcano, Nyamuragira. Benches in the steep-walled, 1.2-km-wide summit crater mark levels of former lava lakes, which have been observed since the late-19th century. Two older stratovolcanoes, Baruta and Shaheru, are partially overlapped by Nyiragongo on the north and south. About 100 cones are located primarily along radial fissures south of Shaheru, east of the summit, and along a NE-SW zone extending as far as Lake Kivu. Many cones are buried by voluminous lava flows that extend long distances down the flanks, which is characterized by the eruption of foiditic rocks. The extremely fluid 1977 lava flows caused many fatalities, as did lava flows that inundated portions of the major city of Goma in January 2002.
Information Contacts: Observatoire Volcanologique de Goma, Departement de Geophysique, Centre de Recherche en Sciences Naturelles, Lwiro, D.S. Bukavu, DR Congo.
Pacaya (Guatemala) — October 2003 Cite this Report
Pacaya
Guatemala
14.382°N, 90.601°W; summit elev. 2569 m
All times are local (unless otherwise noted)
Frequent steam plumes
Although incandescence from the long-term lava lake ended after June 2001, SO2 emission rates remained high when measured in January 2002 (BGVN 27:07). On 30 May 2002, the Washington Volcanic Ash Advisory Center (VAAC) received a report from Guatemala City indicating that Pacaya was active. Satellite imagery showed possible low-level ash near the summit. A very thin SW-drifting plume was again visible in satellite imagery on 17 June 2002, but the composition of the plume was unknown. A faint hotspot at the summit was also visible on infrared imagery. Visual observation on the afternoon 24 August 2002 from the SW showed copious white steam emissions from the summit crater (figure 34).
The Washington VAAC reported that on 5 July 2003 at 0715, a very thin ash and/or gas plume was visible on satellite imagery at an altitude of ~ 3 km extending ~ 7.5 km SW. By 1430 the plume was no longer visible, possibly obscured by thunderstorm clouds in the area. INSIVUMEH reported that only steam was emitted. Visible imagery on 9 August 2003 showed a narrow plume below 3 km altitude extending SW from the volcano, but its composition was unknown.
Reports provided by INSIVUMEH during the latter half of October 2003 indicated that during 15-21 October constant steam and abundant emissions of water and gas were being blown to the NNW and W of the volcano. These emissions continued through the end of the month. On 23 October, during periods of visibility, observers saw a line of off-white smoke across the S flank, which was dispersed in the area of the lava field near the Chupadero and the Caracol rivers. The next day observers saw a heavy column of off-white smoke rising ~ 600 m over the MacKenney crater. The plume continued through 27 October, but only to a height of ~ 400 m. The heavy gaseous cloud continued at the same height through 30 October.
Geologic Background. Eruptions from Pacaya are frequently visible from Guatemala City, the nation's capital. This complex basaltic volcano was constructed just outside the southern topographic rim of the 14 x 16 km Pleistocene Amatitlán caldera. A cluster of dacitic lava domes occupies the southern caldera floor. The post-caldera Pacaya massif includes the older Pacaya Viejo and Cerro Grande stratovolcanoes and the currently active Mackenney stratovolcano. Collapse of Pacaya Viejo between 600 and 1,500 years ago produced a debris-avalanche deposit that extends 25 km onto the Pacific coastal plain and left an arcuate scarp inside which the modern Pacaya volcano (Mackenney cone) grew. The NW-flank Cerro Chino crater was last active in the 19th century. During the past several decades, activity has consisted of frequent Strombolian eruptions with intermittent lava flow extrusion that has partially filled in the caldera moat and covered the flanks of Mackenney cone, punctuated by occasional larger explosive eruptions that partially destroy the summit.
Information Contacts: Instituto Nacional de Sismologia, Vulcanologia, Meteorologia e Hydrologia (INSIVUMEH), 7a Av. 14-57, Zona 13, Guatemala City, Guatemala (URL: http://www.insivumeh.gob.gt/); Washington Volcanic Ash Advisory Center (VAAC), Satellite Analysis Branch (SAB), NOAA/NESDIS E/SP23, NOAA Science Center Room 401, 5200 Auth Road, Camp Springs, MD 20746, USA (URL: http://www.ospo.noaa.gov/Products/atmosphere/vaac/); Jacquelyn Gluck, Global Volcanism Program, Smithsonian Institiution, Washington DC, 20560, USA.
San Cristobal (Nicaragua) — October 2003 Cite this Report
San Cristobal
Nicaragua
12.702°N, 87.004°W; summit elev. 1745 m
All times are local (unless otherwise noted)
Intermittent ash emissions between August 2002 and September 2003
This report summarizes the recorded activity at San Cristóbal during August 2002-September 2003. Reports from Instituto Nicaragüense de Estudios Territoriales (INETER) include observations from frequent visits to the volcano.
August-December 2002. During August-December 2002, abundant gas emanations were accompanied by small gas explosions. Incandescence was frequently observed. Seismicity was relatively high, but fluctuated from month to month (table 2). On 12 August, ash emissions with columns up to 800 m high were observed. More ash explosions were reported on 17 and 21 August. Gas emissions and small ash explosions continued in September, and incandescence was observed during 1-7 September. A strong explosion was reported on 6 October, and a dark gas column was observed. Throughout the month gas emissions were abundant, occasionally with columns to 600 m high. Temperatures at the South Point and El Zopilote fumaroles increased in October from the previous month. Gas emissions and ash explosions continued in November and December, with increased activity on 22 November and 16 December. Trees and fruit plants were affected by the gases in the community of Las Banderas. At the end of December, a volcano observer discovered that the path to the volcano was blocked by a deposit of sand-sized material.
Table 2. Number of earthquakes at San Cristóbal between August 2002 and June 2003. No data was available during November 2002 due to technical problems. Courtesy of INETER.
| Month |
Number of earthquakes |
| Aug 2002 |
2,183 |
| Sep 2002 |
2,792 |
| Oct 2002 |
1,017 |
| Nov 2002 |
-- |
| Dec 2002 |
200-250 / day |
| Jan 2003 |
5,671 |
| Feb 2003 |
2,595 |
| Mar 2003 |
5,329 |
| Apr 2003 |
1,713 |
| May 2003 |
5,491 |
| Jun 2003 |
4,855 |
January-March 2003. Activity decreased in the first few months of 2003. No changes were observed in the crater in January, and temperatures increased only at two fumaroles; those temperatures were low again in February. On 19 February the observer heard loud sustained noises and noted that the crater walls were colored green and yellow, indicating the presence of sulfur.
April-September 2003. Between April and September, fumarole temperatures were measured on each of the monthly visits to San Cristóbal, and showed very little change. The highest temperatures were generally found at South Point and were between 91 and 95°C. At El Munecho temperatures varied between 81 and 91°C, and at El Conejo between 77 and 86°C. Temperatures remained moderate at the other fumaroles.
Gas emissions were noted in particular between 20 and 23 April, days on which there were small increases in tremor; on 10 May gas emissions were strong enough to impede a visit. Activity increased in June, with abundant ash and gas emissions noted on 17 and 21 June. On 21 June incandescence was noted, and strong rumbling was heard in the evening. On 13 July gas emissions were dense, followed during 14-23 July by a dark column. Seismicity dropped from more than 350 events per day to 69 events on 3 July. By 9 July, only eight events per day were recorded; tremor remained constant at 35 RSAM units.
Gas emissions remained constant through August and September, with reports of gas explosions during a visit on 10 August and abundant gases during the 17 September visit. The strong noises and sounds of gas pressure being released decreased over these months, and no noise was noted on the September visit. Seismicity was very low in August and September, with no earthquakes and very low tremors in August, and only six earthquakes in September.
Geologic Background. The San Cristóbal volcanic complex, consisting of five principal volcanic edifices, forms the NW end of the Marrabios Range. The symmetrical 1745-m-high youngest cone, named San Cristóbal (also known as El Viejo), is Nicaragua's highest volcano and is capped by a 500 x 600 m wide crater. El Chonco, with several flank lava domes, is located 4 km W of San Cristóbal; it and the eroded Moyotepe volcano, 4 km NE of San Cristóbal, are of Pleistocene age. Volcán Casita, containing an elongated summit crater, lies immediately east of San Cristóbal and was the site of a catastrophic landslide and lahar in 1998. The Plio-Pleistocene La Pelona caldera is located at the eastern end of the complex. Historical eruptions from San Cristóbal, consisting of small-to-moderate explosive activity, have been reported since the 16th century. Some other 16th-century eruptions attributed to Casita volcano are uncertain and may have been from other Marrabios Range volcanoes.
Information Contacts: Virginia Tenorio, Emilio Talavera, and Martha Navarro, Instituto Nicaragüense de Estudios Territoriales (INETER), Apartado Postal 2110, Managua, Nicaragua (URL: http://www.ineter.gob.ni/).
Santa Maria (Guatemala) — October 2003 Cite this Report
Santa Maria
Guatemala
14.757°N, 91.552°W; summit elev. 3745 m
All times are local (unless otherwise noted)
Explosions, pyroclastic flows, and night glow in October
Long term eruptive activity at the Santiaguito lava-dome complex of Santa María has continued during 2003 following lahars, explosions, and pyroclastic flows reported during much of 2002 (BGVN 28:05). Plumes identified on satellite imagery between February and September 2003 were described in aviation advisories issued by the Washington Volcanic Ash Advisory Center (VAAC). Regular reports of daily activity provided by the Instituto Nacional de Sismologia, Vulcanologia, Meteorologia e Hidrologia (INSIVUMEH) on their website have been summarized for many days in the second half of October.
Satellite observations, February-September 2003. Based on GOES-8 imagery the Washington VAAC reported that explosions occurred during the evening of 16 February 2003 and the following morning. Plumes rose to 600 m above the summit, forming an ash plume that was visible on satellite imagery. Imagery from GOES-12 indicated an eruption at about 1330 on 23 July. The plume moved W and had largely dissipated by 1615 after extending ~ 80 km. Washington VAAC reported that the volcano had been active in recent days and that INSIVUMEH had reported an ash column rising to ~ 4.6 km altitude, causing ashfall on farms W of the summit.
The Washington VAAC identified another ash cloud in GOES-12 imagery on 14 August from 0715 through 0745 that was ~ 25 km long and 5 km wide. On 28 September the Washington VAAC reported an ash emission, again based on GOES-12 imagery, that reached an estimated 4.3 km altitude. By 1532 the plume appeared to have detached from the summit and begun to slowly dissipate.
Activity observed during October 2003. Weak and moderate explosions on 15 October continued to expel gray ash to heights of 300-600 m, dispersing to the W and SW. At night blocks of incandescent lava were seen down to the base of the Caliente dome. On 17 October, as during 16 October, most of the nearly 50 explosions were considered moderate, generating avalanches of block lava and ash on the SSW flanks and NE of the Caliente cone. However, at 1745 on 16 October, a strong explosion caused the collapse of a sector of the SW flank of the crater, forming a pyroclastic flow that lasted more than 3 minutes and stopped as it neared the front of the active lava flow ~ 4 km S of Santiaguito.
On 21 October, explosions sent gas-and-ash columns 200-700 m high, which were dispersed by winds to the W, causing slight ashfall of very fine particles to fall in the dome complex. During the night of 22-23 October incandescence on the edge of the crater rim of Caliente cone was observed. Avalanches lasting 3-4 minutes continued with abundant block lava and ash descending primarily down the SSW flank with a minor component to the NE. The ash columns tended to be carried W, causing fine ashfall in sparsely populated mountainous areas. On 24 October there were 26 moderate explosions, 41 weak ones, and about 20 avalanches of lava blocks and ash originating from the S edge of the lava dome in the Caliente cone crater and from the edge of the active lava flow.
During the night of 27 October incandescence along the edge of the lava dome was observed, and weak white fumarolic emissions reached ~ 200 m above the crater in the morning; explosions and avalanches persisted. On 29 October, predominantly moderate and weak explosions produced columns 200-700 m high, and very fine ash fell in nearby mountainous areas. Many of the moderate explosions produced avalanches of block lava and ash to the NE and SW. On 30 October, three small collapses of large blocks occurred from the crater rim, and more than a dozen avalanches, each preceded by explosions and lasting 2-3 minutes, produced abundant fine ash that partially covered the S flank.
Geologic Background. Symmetrical, forest-covered Santa María volcano is part of a chain of large stratovolcanoes that rise above the Pacific coastal plain of Guatemala. The sharp-topped, conical profile is cut on the SW flank by a 1.5-km-wide crater. The oval-shaped crater extends from just below the summit to the lower flank, and was formed during a catastrophic eruption in 1902. The renowned Plinian eruption of 1902 that devastated much of SW Guatemala followed a long repose period after construction of the large basaltic andesite stratovolcano. The massive dacitic Santiaguito lava-dome complex has been growing at the base of the 1902 crater since 1922. Compound dome growth at Santiaguito has occurred episodically from four vents, with activity progressing E towards the most recent, Caliente. Dome growth has been accompanied by almost continuous minor explosions, with periodic lava extrusion, larger explosions, pyroclastic flows, and lahars.
Information Contacts: Instituto Nacional de Sismologia, Vulcanologia, Meteorologia e Hidrologia (INSIVUMEH), Unit of Volcanology, Geologic Department of Investigation and Services, 7a Av. 14-57, Zona 13, Guatemala City, Guatemala (URL: http://www.insivumeh. gob.gt); Washington VAAC, Satellite Analysis Branch (SAB), NOAA/NESDIS E/SP23, NOAA Science Center Room 401, 5200 Auth Road, Camp Springs, MD 20746, USA (URL: http://www.ssd.noaa.gov/).
Semeru (Indonesia) — October 2003 Cite this Report
Semeru
Indonesia
8.108°S, 112.922°E; summit elev. 3657 m
All times are local (unless otherwise noted)
Frequent ash explosions continue through October
Frequent ash explosions at Semeru during 29 September-26 October 2003 produced white-gray ash plumes 400-500 m over the summit. The hazard status remained at Alert Level 2 (on a scale of 1-4) during this time. Although tectonic earthquakes, tremor events, shallow volcanic earthquakes, and avalanches were all detected seismically, the record was dominated by explosions (table 14). Explosions over this 4-week period averaged 95 per day, or one every 15 minutes.
Table 14. Seismicity at Semeru, 29 September-26 October 2003. Four shallow volcanic earthquakes were also detected during 6-12 October. Courtesy of VSI.
| Date |
Explosion |
Avalanche |
Tremor |
Tectonic |
| 29 Sep-05 Oct 2003 |
636 |
20 |
9 |
4 |
| 06 Oct-12 Oct 2003 |
567 |
10 |
-- |
7 |
| 13 Oct-19 Oct 2003 |
687 |
19 |
22 |
4 |
| 20 Oct-26 Oct 2003 |
768 |
16 |
3 |
11 |
Geologic Background. Semeru, the highest volcano on Java, and one of its most active, lies at the southern end of a volcanic massif extending north to the Tengger caldera. The steep-sided volcano, also referred to as Mahameru (Great Mountain), rises above coastal plains to the south. Gunung Semeru was constructed south of the overlapping Ajek-ajek and Jambangan calderas. A line of lake-filled maars was constructed along a N-S trend cutting through the summit, and cinder cones and lava domes occupy the eastern and NE flanks. Summit topography is complicated by the shifting of craters from NW to SE. Frequent 19th and 20th century eruptions were dominated by small-to-moderate explosions from the summit crater, with occasional lava flows and larger explosive eruptions accompanied by pyroclastic flows that have reached the lower flanks of the volcano.
Information Contacts: Dali Ahmad, Hetty Triastuty, Nia Haerani, and Suswati, Volcanological Survey of Indonesia (VSI), Jalan Diponegoro No. 57, Bandung 40122, Indonesia (URL: http://www.vsi.esdm.go.id/).
Sheveluch (Russia) — October 2003 Cite this Report
Sheveluch
Russia
56.653°N, 161.36°E; summit elev. 3283 m
All times are local (unless otherwise noted)
Ash eruptions, lava dome growth, steam plumes, and thermal anomalies
Eruptive activity continued during August-October 2003, including growth of a lava dome in the active crater. Seismicity remained above background levels, and weak, shallow earthquakes were recorded throughout the period. Slightly higher seismic activity was recorded on 30 October with magnitudes in the range of 2.0-2.4. Short-lived eruptions each week sent ash-and-gas plumes to heights of 100-1,500 m above the dome. Thermal anomalies were often recorded by US and Russian satellites.
Weak volcanic tremor was detected during 22-31 August. Tremor was accompanied by gas-and-steam plumes as high as 800 m during 26-27 August, and 2-4-pixel thermal anomalies on 26-30 August. Small thermal anomalies (1-4 pixels) and 500-800-m-high steam plumes were common through 19 September, with an 11-pixel anomaly on the 18th. Similar small thermal anomalies and plumes appeared again during 25-30 September. Thermal anomalies continued to be detected during 1-4, 7-8, 10-12, 16-20, 26, and 29-30 October. Steam plumes were also common, with varying heights of 100-800 m. Small steam plumes and a 1-pixel anomaly occurred 2-3 November.
Geologic Background. The high, isolated massif of Sheveluch volcano (also spelled Shiveluch) rises above the lowlands NNE of the Kliuchevskaya volcano group. The 1,300 km3 andesitic volcano is one of Kamchatka's largest and most active volcanic structures, with at least 60 large eruptions during the Holocene. The summit of roughly 65,000-year-old Stary Shiveluch is truncated by a broad 9-km-wide late-Pleistocene caldera breached to the south. Many lava domes occur on its outer flanks. The Molodoy Shiveluch lava dome complex was constructed during the Holocene within the large open caldera; Holocene lava dome extrusion also took place on the flanks of Stary Shiveluch. Widespread tephra layers from these eruptions have provided valuable time markers for dating volcanic events in Kamchatka. Frequent collapses of dome complexes, most recently in 1964, have produced debris avalanches whose deposits cover much of the floor of the breached caldera.
Information Contacts: Olga Girina, Kamchatka Volcanic Eruptions Response Team (KVERT), a cooperative program of the Institute of Volcanic Geology and Geochemistry, Far East Division, Russian Academy of Sciences, Piip Ave. 9, Petropavlovsk-Kamchatsky, 683006, Russia, the Kamchatka Experimental and Methodical Seismological Department (KEMSD), GS RAS (Russia), and the Alaska Volcano Observatory (USA); Alaska Volcano Observatory (AVO), a cooperative program of the U.S. Geological Survey, 4200 University Drive, Anchorage, AK 99508-4667, USA (URL: http://www.avo.alaska.edu/), the Geophysical Institute, University of Alaska, PO Box 757320, Fairbanks, AK 99775-7320, USA, and the Alaska Division of Geological and Geophysical Surveys, 794 University Ave., Suite 200, Fairbanks, AK 99709, USA.
Soputan (Indonesia) — October 2003 Cite this Report
Soputan
Indonesia
1.112°N, 124.737°E; summit elev. 1785 m
All times are local (unless otherwise noted)
Ash explosion and lava flows on 31 August
Increased activity during 18-22 July 2003 at Soputan consisted of frequent ash explosions and large glowing lava avalanches (BGVN 28:08). Seismicity from August through mid-October was dominated by avalanche events, with a few tectonic earthquakes (table 4). White gas emissions in this period were commonly seen rising 25-50 m above the crater, but were also reported as high as 1,000 m in late August and September. On 31 August there was ash explosion accompanied by ejection of incandescent material. The ash column reached 1,000 m above the summit. Lava flowed 750 m down the SW slope, and some descended to the N. Volcanic tremor that week (18-31 August) had an amplitude of 10-38 mm. The hazard status remained at Alert Level 2 (on a scale of 1-4) through 19 October.
Table 4. Seismicity at Soputan, 18 August-19 October 2003. Courtesy of VSI.
| Date |
Avalanche Earthquakes |
Tectonic Earthquakes |
| 18 Aug-31 Aug 2003 |
71 |
-- |
| 29 Sep-05 Oct 2003 |
80 |
12 |
| 06 Oct-12 Oct 2003 |
30 |
8 |
| 13 Oct-19 Oct 2003 |
62 |
9 |
Geologic Background. The Soputan stratovolcano on the southern rim of the Quaternary Tondano caldera on the northern arm of Sulawesi Island is one of Sulawesi's most active volcanoes. The youthful, largely unvegetated volcano is the only active cone in the Sempu-Soputan volcanic complex, which includes the Soputan caldera, Rindengan, and Manimporok (3.5 km ESE). Kawah Masem maar was formed in the W part of the caldera and contains a crater lake; sulfur has been extracted from fumarolic areas in the maar since 1938. Recent eruptions have originated at both the summit crater and Aeseput, a prominent NE-flank vent that formed in 1906 and was the source of intermittent major lava flows until 1924.
Information Contacts: Dali Ahmad, Hetty Triastuty, Nia Haerani, and Suswati, Volcanological Survey of Indonesia (VSI), Jalan Diponegoro No. 57, Bandung 40122, Indonesia (URL: http://www.vsi.esdm.go.id/).
Soufriere Hills (United Kingdom) — October 2003 Cite this Report
Soufriere Hills
United Kingdom
16.72°N, 62.18°W; summit elev. 915 m
All times are local (unless otherwise noted)
Low-level seismicity; ash venting 30 September-1 October
Activity at Soufriére Hills remained at a relatively low level from mid-September into early November 2003. Seismicity consisted mostly of hybrid earthquakes and rockfall signals (table 49). Access continues to be prohibited to some areas after the major dome collapse and explosive activity of 12-13 July 2003 (BGVN 28:08), and there is a maritime exclusion zone around the S part of the island extending 3.7 km beyond the coastline from Trant's Bay in the E to Isles Bay on the W coast.
Table 49. Summary of seismic activity at Soufriére Hills, 5 September-7 November 2003. No volcano-tectonic earthquakes were recorded during this period, but one long-period rockfall event occurred 23-31 October. Courtesy of the Montserrat Volcano Observatory.
| Date |
Rockfall |
Long-period |
Hybrid |
| 05 Sep-12 Sep 2003 |
2 |
3 |
27 |
| 12 Sep-19 Sep 2003 |
9 |
4 |
20 |
| 19 Sep-26 Sep 2003 |
13 |
1 |
20 |
| 26 Sep-03 Oct 2003 |
4 |
-- |
241 |
| 03 Oct-10 Oct 2003 |
1 |
-- |
15 |
| 10 Oct-17 Oct 2003 |
12 |
-- |
9 |
| 17 Oct-24 Oct 2003 |
8 |
2 |
12 |
| 24 Oct-31 Oct 2003 |
11 |
2 |
19 |
| 31 Oct-07 Nov 2003 |
8 |
-- |
16 |
During the week of 12-19 September, no growth of the new lava dome was observed. Activity was at a slightly higher level during the week of 26 September-3 October, especially hybrid earthquakes, most of which occurred in a swarm between 1100 and 2100 on 27 September. Some of the hybrids could be located at 2-4 km depth. A period of low-amplitude tremor was also recorded between 0800 on 30 September and 0400 on 1 October coincident with vigorous ash venting, which resulted in ash clouds reaching 2,000-2,500 m altitude and drifting W over Plymouth. Observations on 30 September and 3 October suggested that no new dome growth had occurred.
From 3 October to 7 November, activity returned to a low level. A period of low-amplitude tremor was recorded between 3 and 8 October, and some mudflow signals were also recorded during periods of heavy rain. The tremor coincided with light ash venting. Visibility was poor during this period, so no direct observations of the summit area were possible. The dome was observed clearly on 23 October and a volume survey was carried out from Galways and Perches Mountains. The small dome that extruded in July 2003 had not grown further and appeared to be stagnant, with alteration and degradation occurring such that it appears to be breaking up. The pit crater associated with the explosions of July 2003 had widened slightly, although this was thought to be due to passive slumping of material. Sulfur dioxide and hydrogen chloride emission rates were high during several days around 13-15 October and on 22 October (table 50). An observation flight on 28 October yielded clear views of the scar area and the W scar wall. No changes were observed in the morphology of the scar and no new lava was observed in the vent area.
Table 50. Gas emissions at Soufriere Hills, 5 September-7 November 2003. Hydrogen chloride emissions are calculated from hydrogen chloride to sulfur dioxide mass ratios measured in the volcanic plume using Fourier transform infrared. Values are in metric tons/day. Courtesy of the Montserrat Volcano Observatory.
| Date |
SO2 emissions (tons/day) |
HCI emissions (tons/day) |
| 12 Sep-19 Sep 2003 |
700-900 |
230-300 |
| 19 Sep-26 Sep 2003 |
500-600 |
-- |
| 26 Sep-28 Sep 2003 |
400-500 |
-- |
| 28 Sep-01 Oct 2003 |
900-1,200 |
-- |
| 04 Oct 2003 |
3,100 |
-- |
| 05 Oct 2003 |
1,900 |
-- |
| 06 Oct-08 Oct 2003 |
800-1,200 |
-- |
| 04 and 07 Oct 2003 |
-- |
600-1,000 |
| 10 Oct-12 Oct 2003 |
600-800 |
-- |
| 13 Oct 2003 |
1,900 |
-- |
| 16 Oct 2003 |
720 |
-- |
| 17 Oct-24 Oct 2003 |
950-1,200 |
-- |
| 22 Oct 2003 |
1,850 |
1,500 |
| 24 Oct-27 Oct 2003 |
800-900 |
-- |
| 28 Oct-31 Oct 2003 |
400-600 |
-- |
| 31 Oct-07 Nov 2003 |
800-1,350 |
-- |
According to the Washington VAAC, on 1 November resuspended ash was seen in satellite imagery. The ash was moving N to NNW at ~10 km/hour from Montserrat between Nevis and Antigua, and the resuspended ash was concentrated in a narrow plume.
Geologic Background. The complex, dominantly andesitic Soufrière Hills volcano occupies the southern half of the island of Montserrat. The summit area consists primarily of a series of lava domes emplaced along an ESE-trending zone. The volcano is flanked by Pleistocene complexes to the north and south. English's Crater, a 1-km-wide crater breached widely to the east by edifice collapse, was formed about 2000 years ago as a result of the youngest of several collapse events producing submarine debris-avalanche deposits. Block-and-ash flow and surge deposits associated with dome growth predominate in flank deposits, including those from an eruption that likely preceded the 1632 CE settlement of the island, allowing cultivation on recently devegetated land to near the summit. Non-eruptive seismic swarms occurred at 30-year intervals in the 20th century, but no historical eruptions were recorded until 1995. Long-term small-to-moderate ash eruptions beginning in that year were later accompanied by lava-dome growth and pyroclastic flows that forced evacuation of the southern half of the island and ultimately destroyed the capital city of Plymouth, causing major social and economic disruption.
Information Contacts: Montserrat Volcano Observatory (MVO), Mongo Hill, Montserrat, West Indies (URL: http://www.mvo.ms/); Washington Volcanic Ash Advisory Center (VAAC), Satellite Analysis Branch (SAB), NOAA/NESDIS E/SP23, NOAA Science Center Room 401, 5200 Auth Road, Camp Springs, MD 20746, USA (URL: http://www.ospo.noaa.gov/Products/atmosphere/vaac/).
Unnamed
Tonga
18.325°S, 174.365°W; summit elev. -40 m
All times are local (unless otherwise noted)
Pumice rafts from September-October 2001 eruption reach eastern Australia
A felsic shallow marine explosive eruption from a previously unknown volcano along the Tofua volcanic arc (Tonga) in September-October 2001 (BGVN 26:11 and 27:01) produced floating pumice rafts in Fiji in November 2001, approximately one month after it occurred. These sea-rafted pumice are the only recorded output of this subaqueous eruption at a remote location where direct observations are limited.
A new influx of sea-rafted pumice reached the eastern coast of Australia in October 2002 (figure 4), approximately one year after the eruption was first indicated by seismic activity and pumice stranding in Fiji. Pumice was stranded along at least two-thirds (>2,000 km) of the coastline of eastern Australia, extending from N of Townsville to Sydney. Typical amounts of pumice initially stranded on beaches were 500-4,000 individual clasts per m2; a minimum volume estimate of pumice deposited along the eastern Australian coastline is 1.25 x 10⁵ m3. Most stranded pumice clasts are 1-5 cm diameter, although some outsized clasts are up to 10 cm. Many clasts were fouled by a variety of organisms, and dark algal coverings were common to all clasts that concealed the primary character of the pumice (figure 5). This is in contrast to pumice stranded on beaches in Fiji ~ 1 month after the eruption, which were clean of fouling organisms. Fouling organisms include algae, Bryozoa, serpulid worms, corals and, oysters with goose barnacles particularly abundant.
The pumice have a low phenocryst content (< 5% modal) with the phenocryst assemblage consisting of calcic plagioclase (An88-74), pigeonite (En45 Fs46 Wo9), augite (En35 Fs29 Wo36), and titanomagnetite. Preliminary petrographic observations in dicate that the pumice is compositionally homogenous, although there is considerable variation in vesicularity within and between clasts. Tubed pumice is a minor but distinctive clast type. The pumice, like previously stranded pumice on the Great Barrier Reef (Bryan, 1968, 1971), is low-K dacite in composition (table 2), characterized by low alkalis and high iron and silica. This composition is similar to other pumice-forming eruptions from the Tonga region (Bryan, 1968).
Table 2. Major element data on sea-rafted pumice clasts from eastern Australia, 2002. Samples HI1 and GC1: major element data for whole pumice clasts determined by the atomic absorption method of silicate rock analysis using Inductively-Coupled Plasma-Atomic Emission Spectroscopy (ICP-AES) at the University of Queensland. Samples P1 and P2 (n=3 for both): averaged pumice glass compositions analysed at the Centre for Microscopy & Microanalysis, University of Queensland, using a JEOL 8800-L (wavelength dispersive) electron microprobe. Analyses were performed with an accelerating voltage of 15 kV and with a probe current of 15 nA and a probe diameter of 10 microns to avoid volatilisation of alkali elements. Courtesy of Scott Bryan and Alex Cook.
| Element |
HI1 |
GC1 |
P1 |
P2 |
| SiO2 |
71.30 |
65.90 |
66.84 |
67.33 |
| TiO2 |
0.36 |
0.58 |
0.51 |
0.50 |
| Al2O3 |
12.80 |
12.31 |
12.29 |
12.16 |
| Fe2O3^T |
5.50 |
9.88 |
-- |
-- |
| FeO^T |
-- |
-- |
8.05 |
8.04 |
| MnO |
0.10 |
0.18 |
0.16 |
0.15 |
| MgO |
1.07 |
1.43 |
0.93 |
0.92 |
| CaO |
4.34 |
5.77 |
5.40 |
5.23 |
| Na2O |
3.45 |
3.20 |
2.71 |
2.80 |
| K2O |
0.90 |
0.60 |
0.71 |
0.72 |
| P2O5 |
0.18 |
0.15 |
0.18 |
0.20 |
| BaO |
-- |
-- |
0.03 |
0.05 |
| SrO |
-- |
-- |
0.17 |
0.16 |
| LOI |
0.92 |
1.87 |
-- |
-- |
| Raw Total |
99.50 |
99.80 |
97.99 |
98.27 |
References. Bryan, W.B., 1968, Low-potash dacite drift pumice from the Coral Sea: Geological Magazine, v. 105, p. 431-439.
Bryan, W.B., 1971, Coral Sea drift pumice stranded on Eua Island, Tonga, in 1969: Geological Society of America Bulletin, v. 82, p. 2799-2812.
Geologic Background. A submarine volcano along the Tofua volcanic arc ~45 km NW of Vava'u Island was first observed in September 2001, ~35 km S of Fonualei and 60 km NE of Late volcano. The site of the eruption is at an approximate bathymetric depth of 300 m. T-phase waves were recorded on 27-28 September 2001, and on the 27th local fishermen observed an ash-rich eruption column that rose above the ocean surface. No eruptive activity was reported after the 28th, but water discoloration was documented the following month. In early November rafts and strandings of dacitic pumice were reported along the coasts of Kadavu and Viti Levu in Fiji. The depth of the summit of the submarine cone following the eruption was determined to be 40 m during a 2007 survey; the crater of the 2001 eruption was open to the E.
Information Contacts: Scott Bryan, Department of Geology & Geophysics, Yale University, PO Box 208109, New Haven CT 06520 8109 USA; Alex Cook, Queensland Museum, PO Box 3300, South Brisbane, Queensland 4101 Australia.