Recently Published Bulletin Reports
Ambrym (Vanuatu) New effusive eruption during January 2024
Popocatepetl (Mexico) Daily gas-and-ash emissions, ashfall, and occasional explosions during August-November 2023
Reventador (Ecuador) Daily explosions, gas-and-ash emissions, and incandescent avalanches during August-November 2023
Erta Ale (Ethiopia) Strong lava lake activity and lava overflows during June-November 2023
Ubinas (Peru) New eruption with explosions and ash plumes during June-December 2023
Kanaga (United States) Small explosion on 18 December 2023
Klyuchevskoy (Russia) New eruption consisting of Strombolian activity, lava flows and fountains, and ash plumes during June-December 2023
Agung (Indonesia) Three eruptive events reported in April, May, and December 2022
Saunders (United Kingdom) Persistent thermal anomalies from the summit crater lava lake during February 2023-January 2024
Tengger Caldera (Indonesia) Minor ash emission in December 2023; persistent weak thermal anomaly in the Bromo crater
Shishaldin (United States) New eruption with significant Strombolian explosions, ash plumes, and ashfall
Ioto (Japan) New eruption with discolored water, ejecta, and floating pumice during October-December 2023
Ambrym (Vanuatu) — February 2024  Cite this Report
Ambrym
Vanuatu
16.25°S, 168.12°E; summit elev. 1334 m
All times are local (unless otherwise noted)
New effusive eruption during January 2024
Ambrym contains a 12-km-wide caldera and is part of the New Hebrides Arc, located in the Vanuatu archipelago. The two currently active craters within the caldera are Benbow and Marum, both of which have produced lava lakes, explosions, lava flows, and gas-and-ash emissions. The previous eruption occurred during late January 2022 and was characterized by ash plumes, sulfur dioxide plumes, and crater incandescence (BGVN 47:05). This report covers a new, short eruption during January 2024, which consisted of a lava effusion and an explosion. Information comes from the Vanuatu Meteorology and Geohazards Department (VMGD) and satellite data.
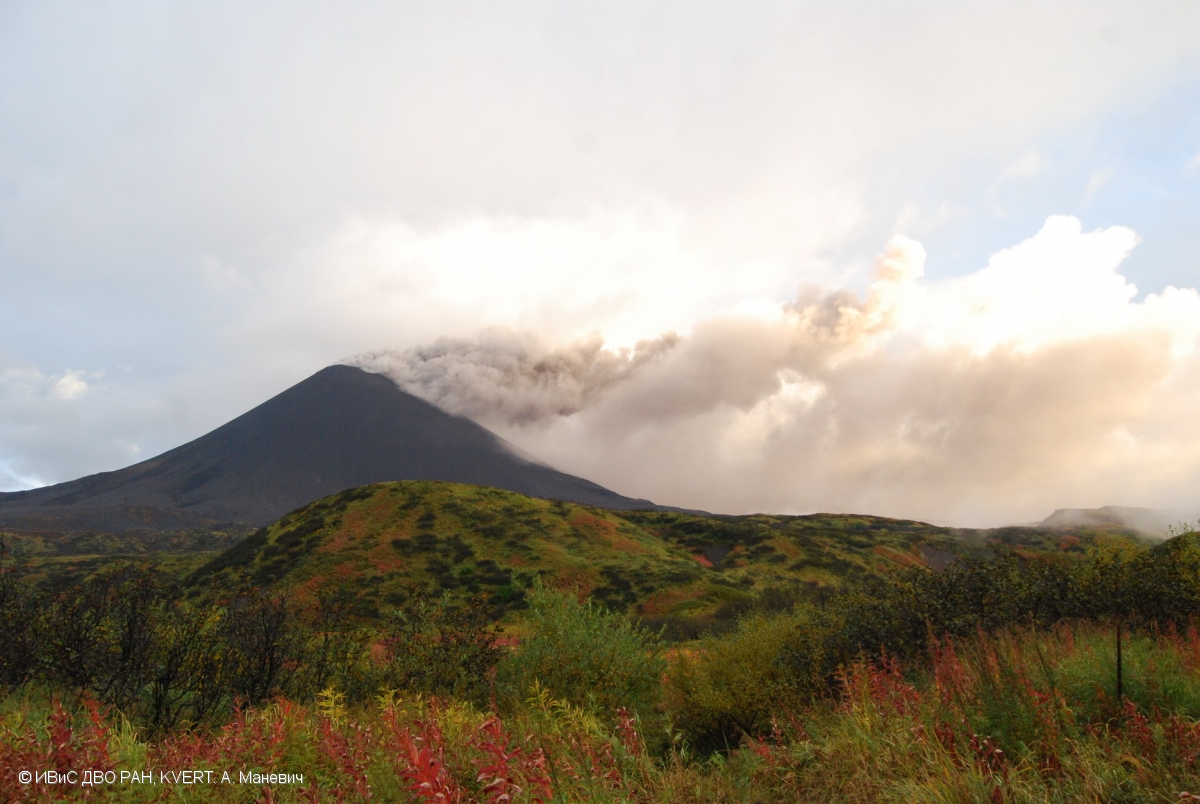
VMGD reported that at 2217 on 13 January an eruption began at Benbow Crater, based on webcam and seismic data. The eruption was characterized by a loud explosion, intense crater incandescence (figure 55), and gas-and-steam emissions. As a result, the Volcano Alert Level (VAL) was raised from 1 to 3 (on a scale of 0-5). A lava flow was reported in Benbow Crater, which lasted for four days. Satellite data showed that 1,116 tons of sulfur dioxide per day (t/d) were emitted on 14 January (figure 56). During the morning of 15 January, ground reports noted loud explosions and minor earthquakes. The sulfur dioxide flux on 15 January was 764 t/d. During 15-17 January activity decreased according to webcam images, seismic data, and field observations. No sulfur dioxide emissions were reported after 15 January. Gas-and-ash emissions also decreased, although they continued to be observed through 31 January, and crater incandescence was less intense (figure 57). The VAL was lowered to 2 on 17 January.
Geologic Background. Ambrym is a large basaltic volcano with a 12-km-wide caldera formed during a major Plinian eruption with dacitic pyroclastic flows about 1,900 years ago. A thick, almost exclusively pyroclastic sequence, initially dacitic then basaltic, overlies lava flows of a pre-caldera shield volcano. Post-caldera eruptions, primarily from Marum and Benbow cones, have partially filled the caldera floor and produced lava flows that ponded on the floor or overflowed through gaps in the caldera rim. Post-caldera eruptions have also formed a series of scoria cones and maars along a fissure system oriented ENE-WSW. Eruptions have been frequently reported since 1774, though mostly limited to extra-caldera eruptions that would have affected local populations. Since 1950 observations of eruptive activity from cones within the caldera or from flank vents have occurred almost yearly.
Information Contacts: Geo-Hazards Division, Vanuatu Meteorology and Geo-Hazards Department (VMGD), Ministry of Climate Change Adaptation, Meteorology, Geo-Hazards, Energy, Environment and Disaster Management, Private Mail Bag 9054, Lini Highway, Port Vila, Vanuatu (URL: http://www.vmgd.gov.vu/, https://www.facebook.com/VanuatuGeohazardsObservatory/); Copernicus Browser, Copernicus Data Space Ecosystem, European Space Agency (URL: https://dataspace.copernicus.eu/browser/).
Popocatepetl (Mexico) — January 2024 Cite this Report
Popocatepetl
Mexico
19.023°N, 98.622°W; summit elev. 5393 m
All times are local (unless otherwise noted)
Daily gas-and-ash emissions, ashfall, and occasional explosions during August-November 2023
Popocatépetl, located 70 km SE of Mexica City, Mexico, contains a 400 x 600 m-wide summit crater. Records of activity date back to the 14th century; three Plinian eruptions, the most recent of which took place about 800 CE, have occurred since the mid-Holocene, accompanied by pyroclastic flows and voluminous lahars that swept basins below the volcano. The current eruption period began in January 2005, characterized by numerous episodes of lava dome growth and destruction within the summit crater. Recent activity has been characterized by daily gas-and-ash emissions, ashfall, and explosions (BGVN 48:09). This report covers similar activity during August through November 2023, according to daily reports from Mexico's Centro Nacional de Prevención de Desastres (CENAPRED) and various satellite data.
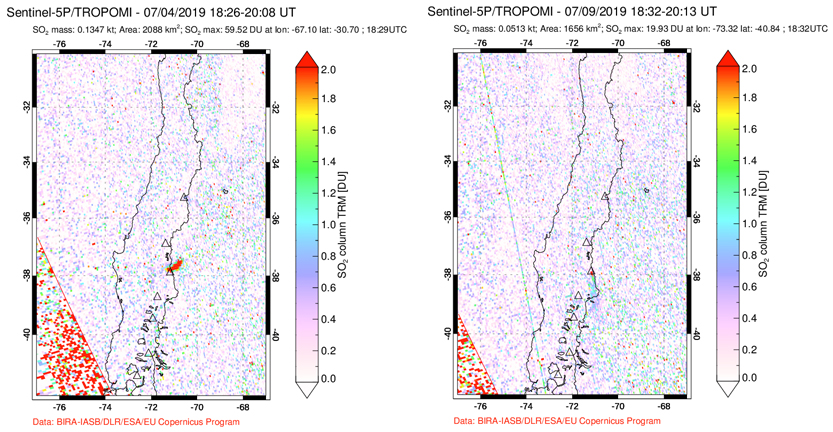
Daily gas-and-steam emissions, containing some amount of ash, continued during August through November 2023. CENAPRED reported the number of low-intensity gas-and-ash emissions or “exhalations” and the minutes of tremor, which sometimes included harmonic tremor in their daily reports (figure 220). A total of 21 volcano-tectonic (VT) tremors were detected throughout the reporting period. The average number of exhalations was 117 per day, with a maximum number of 640 on 25 September. Frequent sulfur dioxide plumes that exceeded two Dobson Units (DU) and drifted in multiple directions were visible in satellite data from the TROPOMI instrument on the Sentinel-5P satellite (figure 221).
Activity during August was relatively low and mainly consisted of occasional explosions, ash emissions, and light ashfall. There were 30 explosions (25 minor explosions and four moderate explosions), and nine VT-type events detected. An average number of 60 exhalations occurred each day, which mostly consisted of water vapor, volcanic gases, and a small amount of ash. On 2 August the National Center for Communications and Civil Protection Operations (CENACOM) reported light ashfall in Ocuituco (22 km SW), Yecapixtla (31 km SW), Cuautla (43 km SW), and Villa de Ayala (47 km SW). On 7 August light ashfall was observed in Atlautla (16 km W). A minor explosion at 0305 on 11 August was accompanied by crater incandescence. Explosions at 0618 on 13 August produced a gas-and-ash plume that rose above the summit, and at 0736 another explosion produced a puff of gas-and-ash (figure 222). Two minor explosions were detected at 0223 and 0230 on 16 August that generated eruptive columns with low ash content rising 800 m and 700 m above the crater, respectively. On 24 August an eruptive event lasted 185 minutes and consisted of light ash emissions that did not exceed 300 m above the crater. According to the Washington VAAC, ash plumes identified in daily satellite images rose to 4.6-7.6 km altitude and drifted in multiple directions, the highest of which occurred on 29 August.
There was an average of 156 exhalations each day during September, a monthly total of seven VT-type events, and 29 explosions, 14 of which were minor and nine of which were moderate. A gas-and-ash plume rose to 2 km above the summit and drifted WSW at 1216 on 1 September. CENACOM reported at 1510 observations of ashfall in Ozumba (18 km W), Atlautla, Tepetlixpa (20 km W), and Ecatzingo (15 km SW), as well as in Morelos in Cuernavaca (65 km WSW), Temixco (67 km WSW), Huitzilac (67 km W), Tepoztlán (49 km W), and Jiutepec (59 km SW). The next day, gas-and-ash plumes rose to 2 km above the summit (figure 223). At 1100 ashfall was reported in Amecameca (15 km NW), Ayapango (24 km WNW), Ozumba, Juchitepec, Tenango del Aire (29 km WNW), Atlautla, and Tlalmanalco (27 km NW). A gas-and-ash plume rose to 1 km above the summit and drifted WNW at 1810. During 5-6, 8-9, 12, 14, 19, and 24-25 September ashfall was reported in Amecameca, Atlautla, Ozumba, Tenango del Aire, Tepetlixpa, Juchitepec, Cuernavaca, Ayala, Valle de Chalco (44 km NW), Ixtapaluca (42 km NW), La Paz (50 km NW), Chimalhuacán, Ecatepec, Nezahualcóyotl (60 km NW), Xochimilco (53 km SE), Huayapan, Tetela del Volcano (20 km SW), Yautepec (50 km WSW), Cuautla (43 km SW), Yecapixtla (30 km SW) and possibly Tlaltizapán (65 km SW), Tlaquiltenango, and Tepalcingo. According to the Washington VAAC, ash plumes identified in daily satellite images rose to 5.8-9.1 km altitude and drifted in multiple directions, the highest of which was identified during 1-2 August.
Activity during October and November was relatively low. An average of 179 exhalations consisting of gas-and-steam and ash emissions were reported during October and 73 during November. Only one VT-type event and two explosions were detected during October and four VT-type events and one explosion during November. A satellite image from 0101 on 14 October showed ash fanning out to the NW at 6.7 km altitude and an image from 0717 showed a continuously emitted ash plume drifting WNW and NW at the same altitude. Ash emissions at 1831 on 14 October were ongoing and visible in webcam images slowly drifting W at an altitude of 6.4 km altitude (figure 224). On 24 October a tremor sequence began at 0310 that generated a gas-and-ash plume that rose 800 m above the summit and drifted W. Another tremor sequence occurred during 1305-1900 on 25 October that consisted of continuous ash emissions. Ash plumes identified in daily satellite images rose to 5.5-8.5 km altitude and drifted in different directions during October, according to the Washington VAAC. The highest ash plume was detected on 23 October. During 10-13 November ash plumes rose to 6.7 km altitude and drifted N, NNW, NE, and NW. On 13 November a M 1.5 VT-type event was detected at 0339 and light ashfall was reported in Amecameca, Cocotitlán (34 km NW), and Tenango del Aire, and Ocuituco. On 14 November ash plumes rose to 6 km altitude and drifted N, NE, and SE and light ashfall was reported in Cuernavaca (64 km W). The Washington VAAC reported frequent ash plumes that rose to 5.8-7.9 km altitude and drifted in several directions; the highest ash plume was recorded on 28 November.
Satellite data. MODIS thermal anomaly data provided through MIROVA (Middle InfraRed Observation of Volcanic Activity) showed frequent low-to-moderate thermal anomalies during the reporting period (figure 225). The intensity of the anomalies was lower compared to previous months. According to data from MODVOLC thermal alerts, a total of ten hotspots were detected at the summit crater on 2 August and 2, 4, 9, 19, and 26 September. Thermal activity in the summit crater was visible in infrared satellite data and was sometimes accompanied by ash plumes, as shown on 17 November (figure 226).
Geologic Background. Volcán Popocatépetl, whose name is the Aztec word for smoking mountain, rises 70 km SE of Mexico City to form North America's 2nd-highest volcano. The glacier-clad stratovolcano contains a steep-walled, 400 x 600 m wide crater. The generally symmetrical volcano is modified by the sharp-peaked Ventorrillo on the NW, a remnant of an earlier volcano. At least three previous major cones were destroyed by gravitational failure during the Pleistocene, producing massive debris-avalanche deposits covering broad areas to the south. The modern volcano was constructed south of the late-Pleistocene to Holocene El Fraile cone. Three major Plinian eruptions, the most recent of which took place about 800 CE, have occurred since the mid-Holocene, accompanied by pyroclastic flows and voluminous lahars that swept basins below the volcano. Frequent historical eruptions, first recorded in Aztec codices, have occurred since Pre-Columbian time.
Information Contacts: Centro Nacional de Prevención de Desastres (CENAPRED), Av. Delfín Madrigal No.665. Coyoacan, México D.F. 04360, México (URL: http://www.cenapred.unam.mx/, Daily Report Archive https://www.gob.mx/cenapred/archivo/articulos); Washington Volcanic Ash Advisory Center (VAAC), Satellite Analysis Branch (SAB), NOAA/NESDIS OSPO, NOAA Science Center Room 401, 5200 Auth Rd, Camp Springs, MD 20746, USA (URL: www.ospo.noaa.gov/Products/atmosphere/vaac, archive at: http://www.ssd.noaa.gov/VAAC/archive.html); MIROVA (Middle InfraRed Observation of Volcanic Activity), a collaborative project between the Universities of Turin and Florence (Italy) supported by the Centre for Volcanic Risk of the Italian Civil Protection Department (URL: http://www.mirovaweb.it/); Hawai'i Institute of Geophysics and Planetology (HIGP) - MODVOLC Thermal Alerts System, School of Ocean and Earth Science and Technology (SOEST), Univ. of Hawai'i, 2525 Correa Road, Honolulu, HI 96822, USA (URL: http://modis.higp.hawaii.edu/); NASA Global Sulfur Dioxide Monitoring Page, Atmospheric Chemistry and Dynamics Laboratory, NASA Goddard Space Flight Center (NASA/GSFC), 8800 Greenbelt Road, Goddard, Maryland, USA (URL: https://so2.gsfc.nasa.gov/); Copernicus Browser, Copernicus Data Space Ecosystem, European Space Agency (URL: https://dataspace.copernicus.eu/browser/).
Reventador (Ecuador) — January 2024 Cite this Report
Reventador
Ecuador
0.077°S, 77.656°W; summit elev. 3562 m
All times are local (unless otherwise noted)
Daily explosions, gas-and-ash emissions, and incandescent avalanches during August-November 2023
Volcán El Reventador, located in Ecuador, is a stratovolcano with a 4-km-wide avalanche scarp open to the E that was formed by edifice collapse. The largest recorded eruption took place in 2002 producing a 17-km-high eruption column, pyroclastic flows that traveled as far as 8 km, and lava flows from summit and flank vents. Recorded eruptions date back to the 16th century and have been characterized by explosive events, lava flows, ash plumes, and lahars. Frequent lahars have built deposits on the scarp slope. The current eruption period began in July 2008 and has recently been characterized daily explosions, gas-and-ash emissions, and block avalanches (BGVN 48:08). This report covers similar activity during August through November 2023 using daily reports from Ecuador's Instituto Geofisico (IG-EPN) and satellite data.
During August through November 2023, IG-EPN reported daily explosions, gas-and-ash plumes that rose as high as 1.3 km above the crater, and frequent crater incandescence, often accompanied by incandescent block avalanches that affected one or multiple flanks. More daily explosions were detected during November, with an average total of 46 per day.
Table 19. Monthly summary of explosions and plume heights recorded at Reventador from August through November 2023. Data could not be collected for 29-30 September 2023 and 6-23 October 2023. Data courtesy of IG-EPN (August-November 2023 daily reports).
| Month |
Average number of explosions per day |
Max plume height above the crater rim (km) |
| Aug 2023 |
32 |
1.3 |
| Sep 2023 |
30 |
1 |
| Oct 2023 |
31 |
1.3 |
| Nov 2023 |
46 |
1.2 |
Activity during August consisted of 6-75 daily explosions, nighttime crater incandescence, and incandescent avalanches of material. Frequent seismicity was mainly characterized by long-period (LP) events, harmonic tremor (TRARM), tremor-type (TRE), and volcano tectonic (VT)-type events. Daily gas-and-ash emissions rose 200-1,300 m above the summit and drifted W, SW, NW, NE, N, and E, based on webcam and satellite images. The Washington VAAC also reported occasional ash plumes that rose 400-1,600 m above the crater and drifted NW. Avalanches of incandescent material were reported during 1-2, 6-7, 9-14, 16-17, 18-21, and 26-29 August, which traveled 500-900 m below the crater and affected multiple flanks (figure 180). During 24-25 August incandescent material was ejected 300 m above the crater.
Gas-and-ash emissions and seismicity characterized by LP, VT, TRARM, and TRE-type events continued during September; data were not available for 29-30 September. Daily gas-and-ash emissions rose 200-1,000 m above the crater and generally drifted W, NW, and SW (figure 181). Near-daily explosions ranged from 16-53 per day, often accompanied by incandescent avalanches, which affected one or multiple flanks and traveled 100-800 m below the crater. During 2-3 September incandescent material was ejected 200 m above the crater and was accompanied by blocks rolling down the flanks. During 16-17 September incandescent material was ejected 100-200 m above the crater and avalanches descended 600 m below the crater. During 21-22 and 24-26 September incandescent material was ejected 100-300 m above the crater. According to the Washington VAAC, ash plumes rose 700 m above the crater and drifted SW, W, and NW on 3, 16, and 20 September, respectfully.
During October, daily explosions, gas-and-ash plumes, and crater incandescence continued, with 16-40 explosions recorded each day (figure 182); data was not available for 6-23 October. Seismicity consisted of LP, TRE, and TRARM-type events. Gas-and-ash emissions rose 200-1,000 m above the crater and drifted W, SW, NW, SSW, NNW, and NE. The Washington VAAC reported that ash plumes rose 1-1.3 km above the crater and drifted W, SW, and NW during 1-5 October. During 30 September-1 October incandescent avalanches descended 700 m below the crater. Ejected material rose 200 m above the crater during 2-5 October and was accompanied by avalanches of material that traveled 250-600 m below the crater rim; incandescent avalanches were also reported during 23-29 October.
Daily explosions, LP, TRARM, VT, and TRE-type events, crater incandescence, and avalanches of material continued during November. There were 26-62 daily explosions detected throughout the month. Gas-and-ash emissions rose 300-1,200 m above the crater and drifted in different directions (figure 183). The Washington VAAC reported that ash plumes rose 700-1,620 m above the crater and drifted NW, W, WNW, SW, E, SE, and ESE. Frequent incandescent avalanches descended 500-1,000 m below the crater. Explosions ejected material 100-300 m above the crater during 4-7, 11-12, and 19-23 November.
Satellite data. MIROVA (Middle InfraRed Observation of Volcanic Activity) analysis of MODIS satellite data showed intermittent thermal anomalies of low-to-moderate power (figure 184). Thermal activity mainly consisted of incandescent avalanches descending the flanks due to the frequently detected explosions. The MODVOLC hotspot system identified a total of ten hotspots on 3 August, 7, 18, 12, 22, and 28 September, and 7, 9, and 19 November.
Geologic Background. Volcán El Reventador is the most frequently active of a chain of Ecuadorian volcanoes in the Cordillera Real, well east of the principal volcanic axis. The forested, dominantly andesitic stratovolcano has 4-km-wide avalanche scarp open to the E formed by edifice collapse. A young, unvegetated, cone rises from the amphitheater floor to a height comparable to the rim. It has been the source of numerous lava flows as well as explosive eruptions visible from Quito, about 90 km ESE. Frequent lahars in this region of heavy rainfall have left extensive deposits on the scarp slope. The largest recorded eruption took place in 2002, producing a 17-km-high eruption column, pyroclastic flows that traveled up to 8 km, and lava flows from summit and flank vents.
Information Contacts: Instituto Geofísico, Escuela Politécnica Nacional (IG-EPN), Casilla 17-01-2759, Quito, Ecuador (URL: http://www.igepn.edu.ec/); MIROVA (Middle InfraRed Observation of Volcanic Activity), a collaborative project between the Universities of Turin and Florence (Italy) supported by the Centre for Volcanic Risk of the Italian Civil Protection Department (URL: http://www.mirovaweb.it/); Hawai'i Institute of Geophysics and Planetology (HIGP) - MODVOLC Thermal Alerts System, School of Ocean and Earth Science and Technology (SOEST), Univ. of Hawai'i, 2525 Correa Road, Honolulu, HI 96822, USA (URL: http://modis.higp.hawaii.edu/).
Erta Ale (Ethiopia) — January 2024 Cite this Report
Erta Ale
Ethiopia
13.601°N, 40.666°E; summit elev. 585 m
All times are local (unless otherwise noted)
Strong lava lake activity and lava overflows during June-November 2023
Erta Ale in Ethiopia has a 50-km-wide edifice that rises more than 600 m from below sea level in the Danakil depression. The summit caldera is 0.7 x 1.6 km and contains at least two pit craters (North and South). Another larger 1.8 x 3.1-km-wide depression is located SE of the summit and is bounded by curvilinear fault scarps on the SE side. Lava flows from fissures have traveled into the caldera and locally overflowed the crater rim. The current eruption has been ongoing since 1967, with at least one long-term active lava lake present in the summit caldera. Recent fissure eruptions from 2017 have occurred on the SE flank (BGVN 42:07). Recent activity has been characterized by minor thermal activity at the S crater and an active lava lake at the N crater (BGVN 48:06). This report covers strong lava lake activity primarily at the N pit crater during June through November 2023 using information from satellite infrared data.
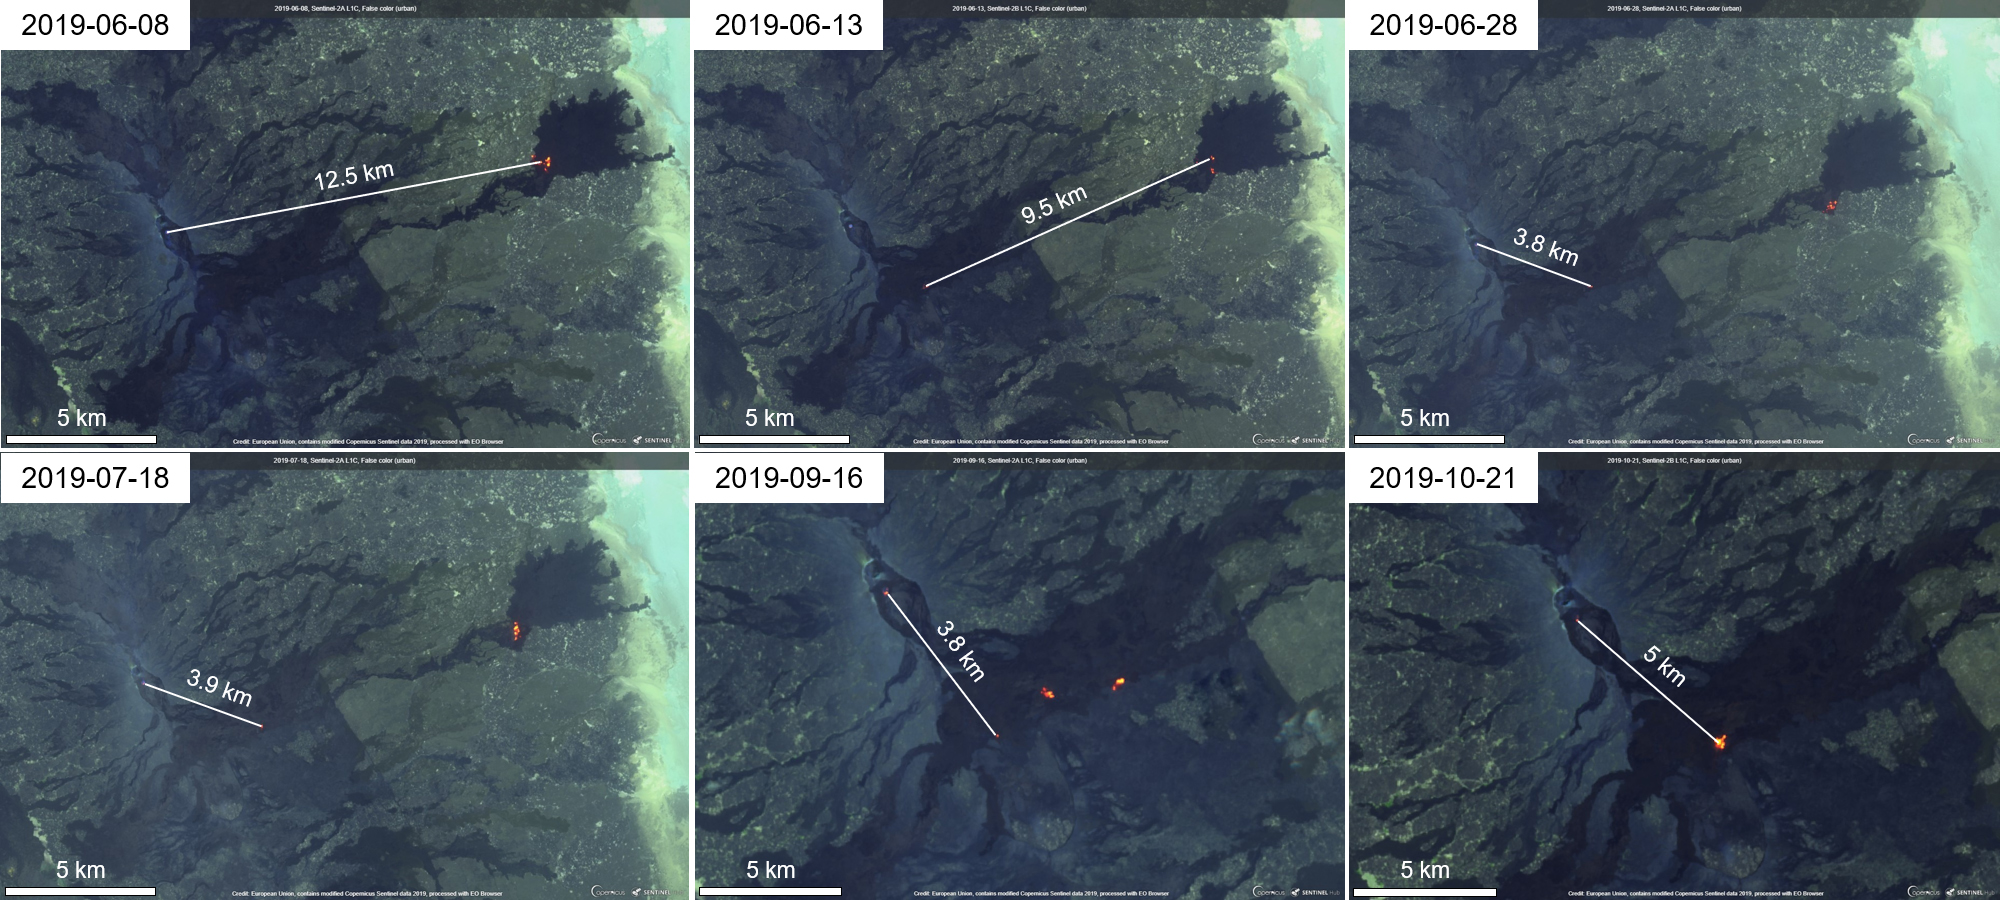
Infrared satellite images generally showed an active lava lake as the N pit crater and variable thermal activity at the S pit crater during the reporting period. On 7 June two strong thermal anomalies were detected at the S pit crater and two weaker anomalies were visible at the N pit crater. Those anomalies persisted throughout the month, although the intensity at each declined. On 2 July a possible lava lake was identified at the S pit crater, filling much of the crater. On 7 July both pit craters contained active lava lakes (figure 120). By 12 July the thermal activity decreased; two smaller anomalies were visible through the rest of the month at the S pit crater while the N pit crater showed evidence of cooling.
Renewed lava lake activity was identified at the N pit crater, based on a satellite image from 11 August, with two smaller anomalies visible at the S pit crater. By 16 August the lava lake in the N pit had begun to cool and only a small thermal anomaly was identified. Activity restarted on 21 August, filling much of the E and SE part of the N pit crater. The thermal activity at the N pit crater intensified on 31 August, particularly in the NW part of the crater. On 5 September lava filled much of the N pit crater, overflowing to the W and SW. During at least 10-20 September thermal activity at both craters were relatively low.
According to a satellite image on 25 September, strong thermal activity resumed when lava overflowed the N pit crater to the S, SW, and NE (figure 120). A satellite image taken on 5 October showed lava flows from the N had spilled into the S and begun to cool, accompanied by two weak thermal anomalies at the S pit crater. On 15 October lava flows again traveled SE and appeared to originate from the S pit crater (figure 120). Following these events, smaller thermal anomalies were visible on the SE rim of the N pit crater and within the S pit crater.
Lava was visible in the NW part of the N pit crater according to a satellite image taken on 4 November. By 9 November the intensity had decreased, and the lava appeared to cool through the rest of the month; young lava flows were visible along the W side of the S pit crater on 24 and 29 November. Lava flows occurred at the N pit crater trending NE-SW and along the E side on 29 November (figure 120).
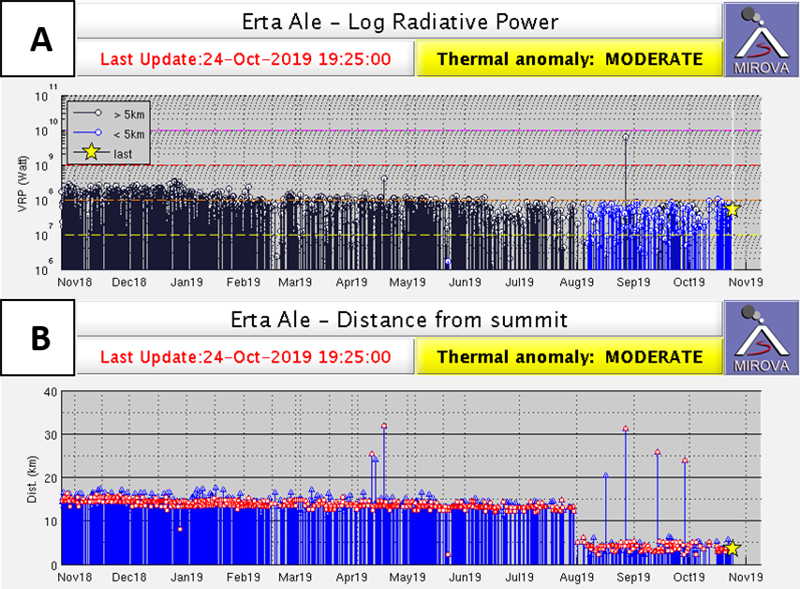
During the reporting period, the MIROVA (Middle InfraRed Observation of Volcanic Activity) thermal detection system recorded consistent activity during the first half of 2023 (figure 121). Beginning in June 2023, thermal activity increased and remained variable in intensity through the end of the year indicating the presence of an active lava lake and lava flows. The MODVOLC thermal detection system registered a total of 63 anomalies during 7, 8, and 23 July, 10 and 18 August, 3, 5, 16, 23, 24, and 25 September, 15 and 20 October, and 21, 24, 26, 28, and 30 November. Some of these stronger thermal anomalies were also detected in Sentinel-2 infrared satellite images that showed an active lava lake at the N pit crater and subsequent lava overflows from both pit craters (figure 120).
Geologic Background. The Erta Ale basaltic shield volcano in Ethiopia has a 50-km-wide edifice that rises more than 600 m from below sea level in the Danakil depression. The volcano includes a 0.7 x 1.6 km summit crater hosting steep-sided pit craters. Another larger 1.8 x 3.1 km wide depression elongated parallel to the trend of the Erta Ale range is located SE of the summit and is bounded by curvilinear fault scarps on the SE side. Basaltic lava flows from these fissures have poured into the caldera and locally overflowed its rim. The summit caldera usually also holds at least one long-term lava lake that has been active since at least 1967, and possibly since 1906. Recent fissure eruptions have occurred on the N flank.
Information Contacts: MIROVA (Middle InfraRed Observation of Volcanic Activity), a collaborative project between the Universities of Turin and Florence (Italy) supported by the Centre for Volcanic Risk of the Italian Civil Protection Department (URL: http://www.mirovaweb.it/); Hawai'i Institute of Geophysics and Planetology (HIGP) - MODVOLC Thermal Alerts System, School of Ocean and Earth Science and Technology (SOEST), Univ. of Hawai'i, 2525 Correa Road, Honolulu, HI 96822, USA (URL: http://modis.higp.hawaii.edu/); Copernicus Browser, Copernicus Data Space Ecosystem, European Space Agency (URL: https://dataspace.copernicus.eu/browser/).
Ubinas
Peru
16.345°S, 70.8972°W; summit elev. 5608 m
All times are local (unless otherwise noted)
New eruption with explosions and ash plumes during June-December 2023
Ubinas, located in Peru, has had 24 eruptions since 1550, which more recently have been characterized by explosions, ash plumes, and lahars (BGVN 45:03). This report covers a new eruption during June through December 2023 based on reports from Instituto Geofisico del Peru (IGP), Instituto Geológico Minero y Metalúrgico (INGEMMET), and satellite data.
IGP reported that seismic unrest began on 17 May, followed by an increase in seismicity during the second half of the month. There were 168 volcano-tectonic (VT) earthquakes detected, which are associated with rock fracturing processes, and 171 long-period (LP) earthquakes recorded during 16-24 May, which are associated with the movement of volcanic fluid.
Seismicity and fumarolic activity at the crater level continued to increase during June. During 1-18 June there was an average of 631 VT-type earthquakes and 829 LP earthquakes recorded. Webcams showed gas-and-steam emissions rising 500 m above the summit and drifting SE. In addition, the maximum value of emitted sulfur dioxide during this period was 337 tons/day. During 19-22 June an average of 315 VT-type events and 281 LP-type events and tremor were reported. On 20 June the Gobierno Regional de Moquegua raised the Volcano Alert Level (VAL) to Yellow (the second level on a four-color scale), based on recommendations from IGP. Webcam images showed ash emissions rising 1 km above the summit and drifting E at 0011 on 22 June, which IGP reported marked the start of a new eruption. Sporadic and diffuse gas-and-ash emissions continued to rise 800-1,500 m above the summit through the rest of the month and drifted mainly E, N, NW, W, SW, and NE. During 23-25 June there was an average of 402 VT-type earthquakes and 865 LP-type events detected. During 26-28 June the earthquakes associated with ash emissions, which have been observed since 22 June, decreased, indicating the end of the phreatic phase of the eruption, according to IGP. A thermal anomaly was detected in the crater for the first time on 26 June and was periodically visible through 4 July (figure 61). During 29-30 June there was an average of 173 VT-type earthquakes and 351 LP-type events recorded, and sulfur dioxide values ranged between 600 t/d and 1,150 t/d. During this same time, seismicity significantly increased, with 173 VT-type earthquakes, 351 LP-type events, and harmonic tremor which signified rising magma. The Gobierno Regional de Moquegua raised the Alert Level to Orange (the third level on a four-color scale) on 30 June based on the recommendation from IGP and INGEMMET.
Activity during July consisted of continued seismicity and gas-and-ash emissions. Gas-and-ash emissions rose as high as 5 km above the summit and drifted as far as 40 km in different directions during 1, 4-6, 16, 20-23, 26, and 29 July, based on webcam and satellite images. During 1-2 July an average of 72 VT-type earthquakes and 114 LP-type events were detected. In addition, during that time, ashfall was reported in Ubinas (6.5 km SSE) and Querapi (4.5 km SE). During 2-3 July INGEMMET reported gas-and-ash plumes rose 400 m above the summit and drifted SW, causing ashfall in downwind areas as far as 5 km. During 3-4 July there was an average of 69 VT-type earthquakes and 96 LP-type events reported. On 4 July starting around 0316 there were 16 seismic signals associated with explosive activity and ash emissions detected (figure 62). According to INGEMMET an explosion ejected ballistics and generated a gas-and-ash plume that rose 5.5 km above the summit and drifted SW and S. Ashfall was recorded in Querapi, Ubinas, Sacohaya (7 km SSE), Anascapa (11 km SE), San Miguel (10 km SE), Tonohaya (7 km SSE), Huatahua, Huarina, Escacha (9 km SE), and Matalaque (17 km SSE), and was most significant within 5 km of the volcano. IGP noted that ash fell within a radius of 20 km and deposits were 1 mm thick in towns in the district of Ubinas.
During 5-9 July an average of 67 VT-type events and 47 LP-type events were reported. A period of continuous gas-and-ash emissions occurred on 5 July, with plumes drifting more than 10 km SE and E. A total of 11 seismic signals associated with explosions also detected on 6, 16, 17, and 22 July. On 6 July explosions recorded at 0747 and 2330 produced gas-and-ash plumes that rose as high as 3.5 km above the summit and drifted as far as 30 km NW, NE, SE, and S. According to the Washington VAAC the explosion at 0747 produced a gas-and-ash plume that rose to 9.1 km altitude and drifted SW, which gradually dissipated, while a lower-altitude plume rose to 7.6 km altitude and drifted NE. Gobierno Regional de Moquegua declared a state of emergency for districts in the Moquegua region, along with Coalaque Chojata, Icuña, Lloque, Matalaque, Ubinas, and Yunga of the General Sánchez Cerro province, to be in effect for 60 days. On 7 July an ash plume rose to 7.3 km altitude and drifted E at 0320. At 0900 and 1520 gas-and-steam plumes with diffuse ash rose to 6.7 km altitude and drifted SE. Small ash emissions were visible in satellite and webcam images at 0920 and 1520 on 8 July and rose as high as 6.4 km altitude and drifted SE. During 10-16 July there was an average of 80 VT-type earthquakes and 93 LP-type events reported. INGEMMET reported that during 9-11 July sulfur dioxide emissions were low and remained around 300 t/d.
During 17-23 July an average of 46 VT-type events and 122 LP-type events were detected. On 20 July at 0530 an explosion generated an ash plume that rose 3-4.5 km above the crater and drifted 65 km toward Arequipa. An explosion on 21 July at 0922 produced a gas-and-ash plume that rose 5 km above the summit (figure 63). Ashfall was reported in Querapi, Ubinas, Tonohaya, Anascapa, Sacohaya, San Miguel, Escacha, Huatagua (14 km SE), Huarina, Escacha (9 km SE), Matalaque, Logén, Santa Lucía de Salinas, and Salinas de Moche. An explosion on 22 July at 1323 generated an ash plume that rose 5.5 km above the summit and drifted NE, E, and SE. During 24-30 July there were five volcanic explosions detected and an average of 60 VT-type events and 117 LP-type events. An explosion on 29 July at 0957 produced an ash plume that rose 2.5 km above the summit and drifted as far as 40 km NE, E, and SE. As a result, significant ashfall was reported in Ubinas and Matalaque.
During August, explosions, gas-and-ash emissions, and seismic earthquakes persisted. During 31 July to 6 August there was an average of 115 VT-type events and 124 LP-type events reported. Gas-and-ash emissions were observed during 1, 6, 10, 13-14, 17-18, 21, and 23 August and they drifted as far as 20 km in different directions; on 14 and 18 August continuous ash emissions extended as far as 40 km S, SE, and NE. An explosion was detected at 2110 on 1 August, which generated a gas-and-ash plume that rose 5.4 km above the summit and drifted SE and E. The explosion ejected blocks and incandescent material as far as 3 km from the crater onto the SW, S, and SE flanks. Ashfall was reported in Ubinas and Chojata (19 km ESE). Gas-and-ash emissions rose as high as 2 km above the summit and drifted in different directions through 5 August, sometimes causing ashfall within a 15-km-radius. An explosion at 0009 on 6 August ejected blocks and produced a gas-and-ash plume that rose 1.4 km above the summit and drifted SE and E, which caused ashfall in Ubinas and Chojata and other areas within a 30-km radius. During 7-13 August there was an average of 102 VT-type events and 60 LP-type events detected. INGEMMET reported that sulfur dioxide emissions were low on 7 August and averaged 400 t/d.
One volcanic explosion that was recorded on 10 August, producing gas-and-ash emissions that rose 2.4 km above the summit and drifted as far as 25 km SE and E. Ashfall was observed in Ubinas, Matalaque, and Chojata. During 10-11 and 13-14 August sulfur dioxide values increased slightly to moderate levels of 2,400-3,700 t/d. The average number of VT-type events was 104 and the number of LP-type events was 71 during 14-21 August. Two explosions were detected at 0141 and 0918 on 21 August, which produced gas-and-ash emissions that rose 3.5 km above the summit and drifted 50 km N, NE, W, and NW (figure 64). The explosion at 0918 generated an ash plume that caused ashfall in different areas of San Juan de Tarucani. During 22-27 August the average number of VT-type events was 229 and the average number of LP-type events was 54. An explosion was reported at 1757 on 25 August, which generated a gas-and-ash plume that rose 4.2 km above the summit and drifted in multiple directions as far as 25 km. During 28 August through 3 September gas-and-ash emissions rose 600 m above the summit and drifted as far as 5 km E and SE. During this time, there was an average of 78 VT-type events and 42 LP-type events.
Gas-and-steam emissions rose 600-2,600 m above the summit and drifted as far as 15 km in multiple directions during September. During 4-10 and 11-17 September there was an average of 183 VT-type events and 27 LP-type events, and 114 VT-type events and 86 LP-type events occurred, respectively. On 14 September an explosion at 1049 generated a gas-and-ash plume that rose 2.6 km above the summit and drifted as far as 15 km E, NE, SE, and S (figure 65). During 14-16 September an average of three hours of seismic tremor related to ash emissions was recorded each day. During 18-24 September the average number of VT-type events was 187 and the average number of LP-type events was 45. During 25 September and 1 October, there was an average number of 129 VT-type events and 52 LP-type events detected.
Relatively low activity was reported during October; during 2-9 October there was an average number of 155 VT-type events and 27 LP-type events recorded. On 1 October at 1656 seismic signals associated with ash emissions were recorded for an hour and thirty minutes; the ash plumes rose as high as 1 km above the summit and drifted more than 10 km E, S, and SW. On 4 October IGP reported that an ash plume drifted more than 15 km SW and S. Sulfur dioxide emissions were 1,250 t/d on that day. On 7 October a gas-and-ash plume rose 1.9 km above the summit and drifted NE, E, and SE. On 4 October the amount of sulfur dioxide emissions was 1,250 t/d. During 10-15 October there was an average number of 225 VT-type events and 34 LP-type events recorded. On 11 October at 1555 a single seismic signal associated with an ash pulse was recorded; the gas-and-ash emissions rose 700 m above the summit and drifted SW and W. There was an average of 204 VT-type events and 25 LP-type events detected during 16-22 October and 175 VT-type events and 17 LP-type events during 23-29 October. On 27 October at 0043 a gas-and-ash emission rose 500 m above the summit and drifted SE and E. A minor thermal anomaly was visible on the crater floor. During 30 October to 5 November there was an average of 95 VT-type events and 24 LP-type events detected.
Activity remained relatively low during November and December and consisted mainly of gas-and-steam emissions and seismicity. Gas-and-steam emissions rose 900-1,100 m above the summit and drifted mainly E, SE, N, and NE. IGP detected an average of 166 VT-type events and 38 LP-type events during 6-15 November, 151 VT-type events and 17 LP-type events during 16-30 November, 143 VT-type events and 23 LP-type events during 1-15 December, and 129 VT-type events and 21 LP-type events during 16-31 December. No explosions or ash emissions were recorded during November. The VAL was lowered to Yellow (the second level on a four-color scale) during the first week of November. According to the Washington VAAC an ash emission was identified in a satellite image at 0040 on 11 December that rose to 5.5 km altitude and drifted NW. Webcam images at 0620 and 1220 showed continuous gas-and-steam emissions possibly containing some ash rising as high as 7 km altitude. Webcam images during 10-31 December showed continuous gas-and-ash emissions that rose as high as 2.5 km above the summit and drifted up to 5 km NW, W, and SW. On 12 December continuous ash emissions drifted more than 10 km N and NW.
Geologic Background. The truncated appearance of Ubinas, Perú's most active volcano, is a result of a 1.4-km-wide crater at the summit. It is the northernmost of three young volcanoes located along a regional structural lineament about 50 km behind the main volcanic front. The growth and destruction of Ubinas I was followed by construction of Ubinas II beginning in the mid-Pleistocene. The upper slopes of the andesitic-to-rhyolitic Ubinas II stratovolcano are composed primarily of andesitic and trachyandesitic lava flows and steepen to nearly 45°. The steep-walled, 150-m-deep summit crater contains an ash cone with a 500-m-wide funnel-shaped vent that is 200 m deep. Debris-avalanche deposits from the collapse of the SE flank about 3,700 years ago extend 10 km from the volcano. Widespread Plinian pumice-fall deposits include one from about 1,000 years ago. Holocene lava flows are visible on the flanks, but activity documented since the 16th century has consisted of intermittent minor-to-moderate explosive eruptions.
Information Contacts: Instituto Geofisico del Peru (IGP), Calle Badajoz N° 169 Urb. Mayorazgo IV Etapa, Ate, Lima 15012, Perú (URL: https://www.gob.pe/igp); Observatorio Volcanologico del INGEMMET (Instituto Geológical Minero y Metalúrgico), Barrio Magisterial Nro. 2 B-16 Umacollo - Yanahuara Arequipa, Peru (URL: http://ovi.ingemmet.gob.pe); Gobierno Regional Moquegua, Sede Principal De Moquegua, R377+5RR, Los Chirimoyos, Moquegua 18001, Peru (URL: https://www.gob.pe/regionmoquegua); Washington Volcanic Ash Advisory Center (VAAC), Satellite Analysis Branch (SAB), NOAA/NESDIS OSPO, NOAA Science Center Room 401, 5200 Auth Rd, Camp Springs, MD 20746, USA (URL: www.ospo.noaa.gov/Products/atmosphere/vaac, archive at: http://www.ssd.noaa.gov/VAAC/archive.html); MIROVA (Middle InfraRed Observation of Volcanic Activity), a collaborative project between the Universities of Turin and Florence (Italy) supported by the Centre for Volcanic Risk of the Italian Civil Protection Department (URL: http://www.mirovaweb.it/); Copernicus Browser, Copernicus Data Space Ecosystem, European Space Agency (URL: https://dataspace.copernicus.eu/browser/).
Kanaga (United States) — January 2024 Cite this Report
Kanaga
United States
51.923°N, 177.168°W; summit elev. 1307 m
All times are local (unless otherwise noted)
Small explosion on 18 December 2023
Kanaga lies within the Kanaton caldera at the northern tip of Kanaga Island. The caldera rim forms a 760-m-high arcuate ridge south and east of Kanaga; a lake occupies part of the SE caldera floor. Most of its previous recorded eruptions are poorly documented, although they date back to 1763. Fumarolic activity at Kanaga occurs in a circular, 200-m-wide, 60-m-deep summit crater and produces vapor plumes sometimes seen on clear days from Adak, 50 km to the east. Its most recent eruption occurred in February 2012, which consisted of numerous small earthquakes, a possible weak ash cloud, and gas-and-steam emissions (BGVN 38:03). This report covers a new eruption during December 2023, based on information from the Alaska Volcano Observatory (AVO).
A small explosion was detected in local infrasound and seismic data at 2231 on 18 December, followed by elevated seismicity. No ash emissions were visible in partly cloudy satellite images. On 19 December the Volcano Alert Level (VAL) was raised to Advisory (the second level on a four-level scale) and the Aviation Color Code (ACC) was raised to Yellow (the second color on a four-color scale). The rate of seismicity significantly declined after the 18th, although it remained elevated through 30 December. Small, daily earthquakes occurred during 19-28 December. Satellite observations following the event showed a debris flow extending 1.5 km down the NW flank. Possible minor gas-and-steam emissions were visible in a webcam image on 20 December. Weakly elevated surface temperatures were identified in satellite data during 23-26 December. A series of cracks extending from the inner crater to the upper SE flank and debris deposits on the upper flanks were observed in satellite images on 27 December. AVO reported that these were likely formed during the 18 December event. Local webcam and seismic data were temporarily offline due to a power failure during 4-28 January.
On 28 January connection to the seismic stations and webcams was restored and webcam images showed gas-and-steam emissions at the summit. Occasional earthquakes were also detected each day. A period of weak seismic tremor was observed on 31 January. During February, the number of earthquakes declined. On 27 February AVO lowered the VAL to Normal (the lowest level on a four-level scale) and the ACC to Green (the lowest color on a four-color scale) due to decreased levels of seismicity and no new surface changes or elevated temperatures based on satellite and webcam data.
Geologic Background. Symmetrical Kanaga stratovolcano is situated within the Kanaton caldera at the northern tip of Kanaga Island. The caldera rim forms a 760-m-high arcuate ridge south and east of Kanaga; a lake occupies part of the SE caldera floor. The volume of subaerial dacitic tuff is smaller than would typically be associated with caldera collapse, and deposits of a massive submarine debris avalanche associated with edifice collapse extend nearly 30 km to the NNW. Several fresh lava flows from historical or late prehistorical time descend the flanks of Kanaga, in some cases to the sea. Historical eruptions, most of which are poorly documented, have been recorded since 1763. Kanaga is also noted petrologically for ultramafic inclusions within an outcrop of alkaline basalt SW of the volcano. Fumarolic activity occurs in a circular, 200-m-wide, 60-m-deep summit crater and produces vapor plumes sometimes seen on clear days from Adak, 50 km to the east.
Information Contacts: Alaska Volcano Observatory (AVO), a cooperative program of a) U.S. Geological Survey, 4200 University Drive, Anchorage, AK 99508-4667 USA (URL: https://avo.alaska.edu/), b) Geophysical Institute, University of Alaska, PO Box 757320, Fairbanks, AK 99775-7320, USA, and c) Alaska Division of Geological & Geophysical Surveys, 794 University Ave., Suite 200, Fairbanks, AK 99709, USA (URL: http://dggs.alaska.gov/).
Klyuchevskoy (Russia) — January 2024 Cite this Report
Klyuchevskoy
Russia
56.056°N, 160.642°E; summit elev. 4754 m
All times are local (unless otherwise noted)
New eruption consisting of Strombolian activity, lava flows and fountains, and ash plumes during June-December 2023
Klyuchevskoy, located on the Kamchatka Peninsula, has produced frequent moderate-volume explosive and effusive eruptions and more than 100 flank eruptions have occurred during the past 3,000 years. Eruptions recorded since the late 17th century have resulted in frequent changes to the morphology of the 700-m-wide summit crater. Eruptions over the past 400 years have primarily originated from the summit crater, although numerous major explosive and effusive eruptions have also occurred from flank craters. The previous eruption ended in November 2022 and consisted of Strombolian activity (BGVN 47:12). This report covers a new eruption during June through December 2023, characterized by Strombolian explosions, lava flows, and ash plumes. Information primarily comes from weekly and daily reports from the Kamchatkan Volcanic Eruption Response Team (KVERT) and various satellite data.
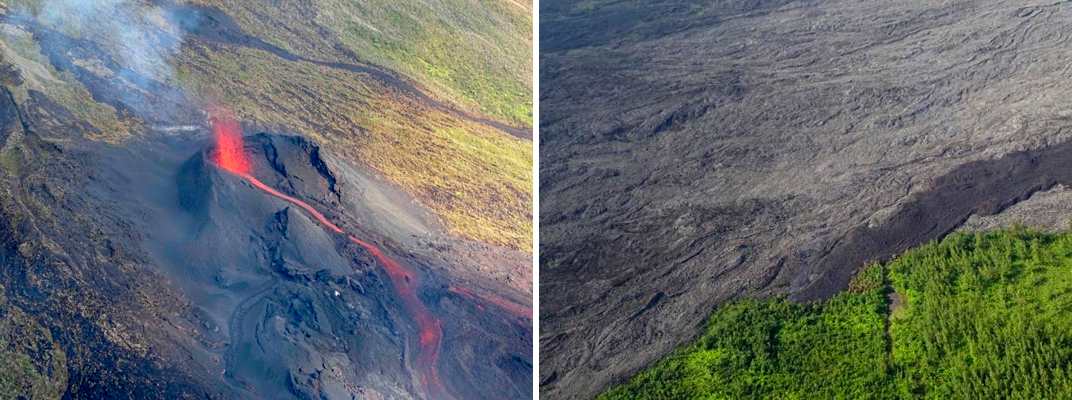
KVERT reported that a Strombolian eruption began at 2323 on 22 June. A thermal anomaly was visible in satellite data starting on 22 June (figure 75). As a result, the Aviation Color Code (ACC) was raised to Yellow (the second lowest level on a four-color scale). During 4-6 and 13 July small ash clouds were occasionally observed over the crater. On 19 July a new lava flow began to effuse along the Apakhonchich drainage on the SE flank, which continued through 19 August. Lava fountaining was reported on 21 July in addition to the active lava flow, which continued through 23 August and during 27-30 August. During 22-23 and 27-30 August the lava flow was active along the Apakhonchich drainage on the SE flank.
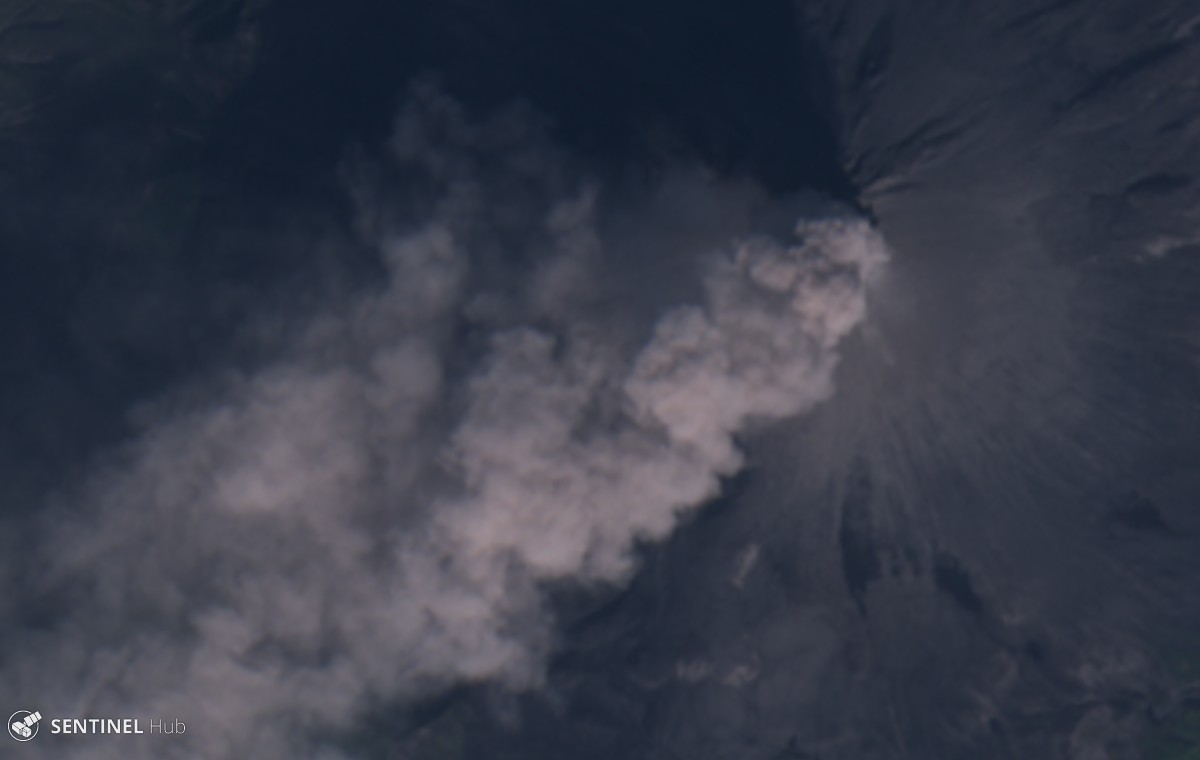
Similar activity was observed during September. Lava fountaining resumed on 2 September and continued through 31 October. In addition, on 2 September a lava flow began to effuse along the Kozyrevsky drainage on the SW flank. During 3-5 September resuspended ash plumes rose to 3-3.5 km altitude and extended as far as 170 km E by 1940 on 4 September. The ACC was raised to Orange (the third level on a four-color scale) at 1240 on 4 September. The ACC was briefly lowered back to Yellow at 1954 that same day before returning to Orange during 1532-1808 on 5 September due to resuspended ash plumes that rose to 3 km altitude and drifted 120 km E at 1500. KVERT reported that Strombolian activity continued, feeding the lava flows advancing down the Apakhonchichsky and Kozyrevsky drainages through most of the month. During 25 September through 16 October the lava flow was only active in the Apakhonchichisky drainage (figure 76). During 9-12 September resuspended ash plumes rose to 1.5-4 km altitude and extended 550 km E and SE. On 22 September resuspended ash plumes rose to 2-2.5 km altitude and drifted 50-90 km E, which prompted KVERT to raise the ACC to Orange; the ACC was lowered back to Yellow on 24 September. On 29 September phreatic explosions generated ash plumes that rose to 5.2-5.3 km altitude.
Activity during October continued with lava fountains, lava flows, and ash plumes. Strombolian activity with lava fountains continued at the crater and active lava flows alternately descended the Apakhonchichisky and Kozyrevsky drainages on the SE and S flanks (figure 77). During 11-12 October gas-and-steam plumes containing some ash rose to 5.5-6 km altitude and extended as far as 65 km NE and SE. The ACC was raised to Orange on 11 October. According to observers at the Kamchatka Volcanological Station, lava effusion was almost continuous, and incandescent material was ejected as high as 300 m above the crater rim. On 13 October at 1420 an ash plume rose to 5-5.5 km altitude and drifted 90-100 km SE. During 14-16 October gas-and-steam plumes containing some ash rose to 4-6 km altitude and drifted 40-145 km ESE and E. On 16 October lava on the SE flank melted the snow and ice, causing phreatic explosions and large collapses of material from the margins of the flow. At 1500 an ash plume rose to 6.5-7 km altitude and drifted 70 km ENE. On 17 October an ash plume was reported extending 360 km NE. Gray-red ashfall was observed in Klyuchi at 0700; this ash was resuspended from older material.
During 22-31 October phreatic explosions generated ash plumes mainly containing ash from collapses of previously deposited pyroclastic material that rose to 7 km altitude and extended as far as 280 km NE, E, SW, and S on 23 and 29 October the ash plumes rose to 8 km altitude. Ash plumes during 27-29 October rose to 8 km altitude and drifted as far as 300 km SE, ESE, and E. Lava fountains rose up to 500 m above the crater during 27-31 October. Scientists from the Kamchatka Volcanological Station visited the volcano on 28 October and reported that the cinder cone at the summit had grown. They also observed advancing lava on the E flank that extended about 2 km from the summit to 2,700 m elevation, incandescent ejecta 500 m above the crater, and avalanches in the Apakhonchichsky drainage. On 31 October activity intensified, and lava flows were reported moving in the Kretovsky, Kozyrevsky, and Apakhonchichisky drainages on the NW, SW, and SE flanks. At 0930 an ash plume rose to 7 km altitude and at first drifted 169 km SW and then 646 km SE. KVERT reported ash plumes rose to 14 km altitude and extended as far as 1,500 km SSE. The ACC was raised to Red (the highest level on a four-color scale). During 31 October to 1 November ash plumes rose as high as 14 km altitude and drifted as far as 2,255 km ESE.
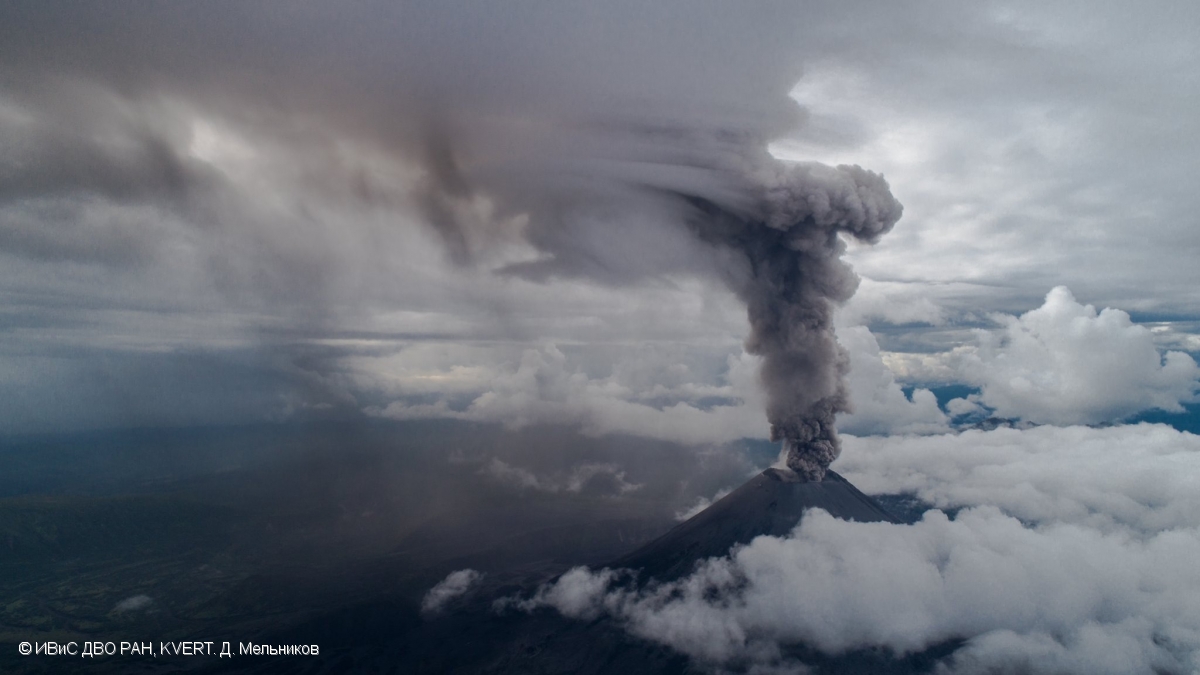
Activity on 1 November intensified. The lava fountains rose as high as 1 km above the summit (figure 78) and fed the lava flows that were active on the Kretovsky, Kozyrevsky, and Apakhonchichsky drainages on the NW, SW, and SE flanks. Ash plumes rose to 10-14 km altitude and drifted as far as 1,500 km SSE (figure 79). According to the Kamchatka Volcanological Station, observers reported pyroclastic flows descending the flanks. Lahars descended the Studenoy River, blocking the Kozyrevsky-Petropavlovsk federal highway and descended the Krutenkaya River, blocking the road E of Klyuchi. According to news articles the ash plumes caused some flight cancellations and disruptions in the Aleutians, British Columbia (Canada), and along flight paths connecting the Unites States to Japan and South Korea. Ash plumes containing old ash from collapses in the Apakhonchichsky drainage due to phreatic explosions rose to 9.5-9.8 km altitude and drifted 192 km SW at 1400 and to 8.7 km altitude and drifted 192 km SW at 1710 on 1 November.
On 2 November ash plumes rose to 6-14 km altitude; the ash plume that rose to 14 km altitude decreased to 6.5 km altitude and drifted NNE by 2000 and continued to drift more than 3,000 km ESE and E. The ACC was lowered to Orange. On 3 November ash plumes rose to 5-8.2 km altitude and drifted 72-538 km ENE, NNE, and ESE; at 0850 an ash plume rose to 6-6.5 km altitude and drifted more than 3,000 km ESE throughout the day. During 4-6 and 8-10 November resuspended ash plumes associated with collapses of old pyroclastic material from the sides of the Apakhonchichsky drainage due to phreatic explosions rose to 4.5-5.5 km altitude and extended 114-258 km NE, ENE, and E. KVERT reported that the eruption stopped on 5 November and the lava flows had begun to cool. Resuspended ash plumes rose to 5-6 km altitude and drifted 60 km E at 0820 on 13 November and to 5 km and 4.5 km altitude at 1110 and 1430 and drifted 140 km E and 150 km ESE, respectively. On 15 November the ACC was lowered to Green.
Activity was relatively low during most of December. On 27 December Strombolian activity resumed based on a thermal anomaly visible in satellite data. On 30 December an ash plume rose to 6 km altitude and extended 195 km NW. The ACC was raised to Orange. On 31 December video and satellite data showed explosions that generated ash plumes that rose to 5-6.5 km altitude and drifted 50-230 km WNW and NW. Though a thermal anomaly persisted through 1 January 2024, no explosions were detected, so the ACC was lowered to Yellow.
Satellite data. Thermal activity was strong throughout the reporting period due to frequent lava fountaining and lava flows. MODIS thermal anomaly data provided through MIROVA (Middle InfraRed Observation of Volcanic Activity) showed strong activity during the entire reporting period, resulting from lava fountaining and lava flows (figure 80). According to data from MODVOLC thermal alerts, a total of 336 hotspots were detected in June (3), July (30), August (11), September (52), October (217), and November (23). Thermal activity was also visible in infrared satellite images, often showing a strong thermal anomaly at the summit crater and a lava flow affecting primarily the SE and SW flanks (figure 81).
Geologic Background. Klyuchevskoy is the highest and most active volcano on the Kamchatka Peninsula. Since its origin about 6,000 years ago, this symmetrical, basaltic stratovolcano has produced frequent moderate-volume explosive and effusive eruptions without major periods of inactivity. It rises above a saddle NE of Kamen volcano and lies SE of the broad Ushkovsky massif. More than 100 flank eruptions have occurred during approximately the past 3,000 years, with most lateral craters and cones occurring along radial fissures between the unconfined NE-to-SE flanks of the conical volcano between 500 and 3,600 m elevation. Eruptions recorded since the late 17th century have resulted in frequent changes to the morphology of the 700-m-wide summit crater. These eruptions over the past 400 years have originated primarily from the summit crater, but have also included numerous major explosive and effusive eruptions from flank craters.
Information Contacts: Kamchatka Volcanic Eruptions Response Team (KVERT), Far Eastern Branch, Russian Academy of Sciences, 9 Piip Blvd., Petropavlovsk-Kamchatsky, 683006, Russia (URL: http://www.kscnet.ru/ivs/kvert/); Kamchatka Volcanological Station, Kamchatka Branch of Geophysical Survey, (KB GS RAS), Klyuchi, Kamchatka Krai, Russia (URL: http://volkstat.ru/); MIROVA (Middle InfraRed Observation of Volcanic Activity), a collaborative project between the Universities of Turin and Florence (Italy) supported by the Centre for Volcanic Risk of the Italian Civil Protection Department (URL: http://www.mirovaweb.it/); Hawai'i Institute of Geophysics and Planetology (HIGP) - MODVOLC Thermal Alerts System, School of Ocean and Earth Science and Technology (SOEST), Univ. of Hawai'i, 2525 Correa Road, Honolulu, HI 96822, USA (URL: http://modis.higp.hawaii.edu/); Copernicus Browser, Copernicus Data Space Ecosystem, European Space Agency (URL: https://dataspace.copernicus.eu/browser/).
Agung (Indonesia) — January 2024 Cite this Report
Agung
Indonesia
8.343°S, 115.508°E; summit elev. 2997 m
All times are local (unless otherwise noted)
Three eruptive events reported in April, May, and December 2022
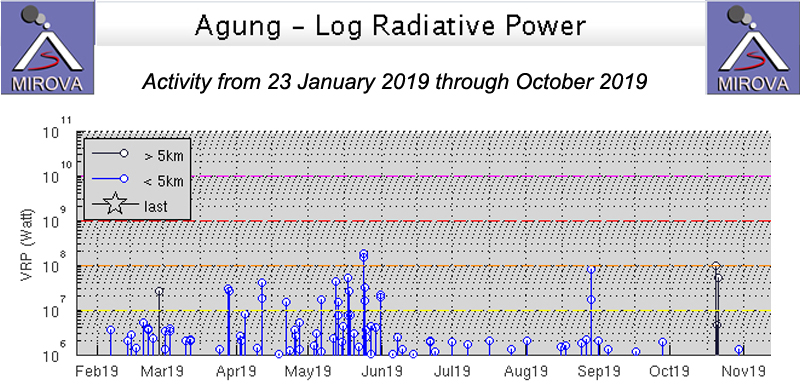
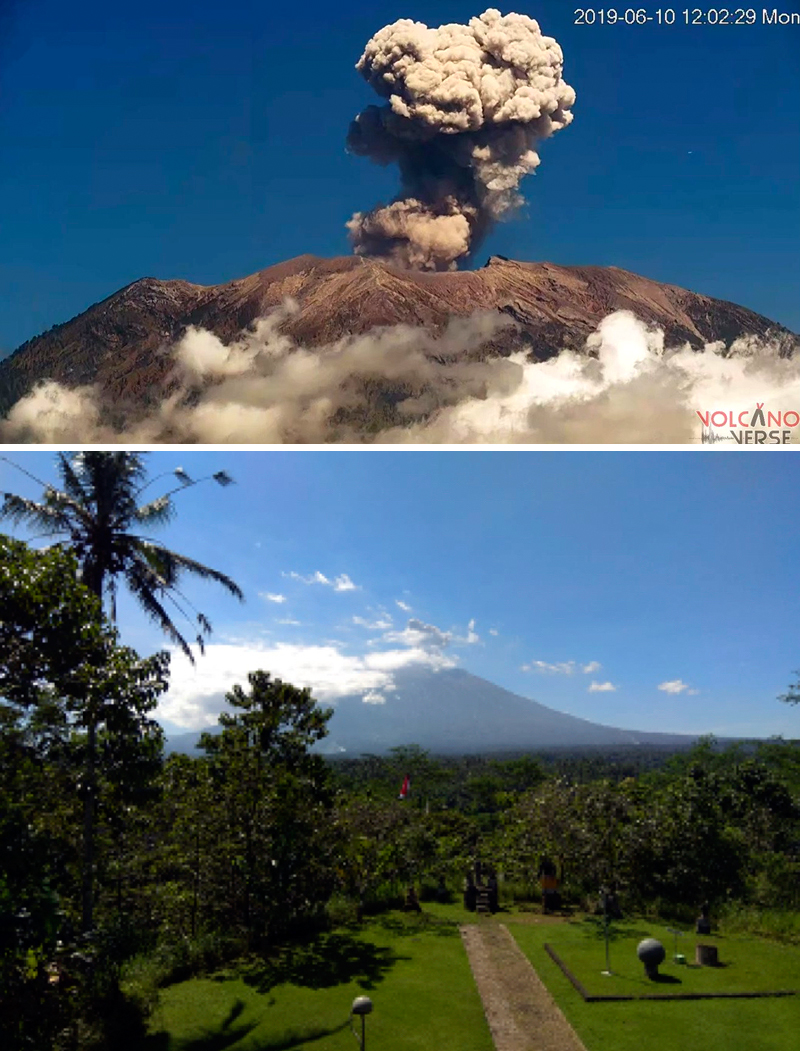
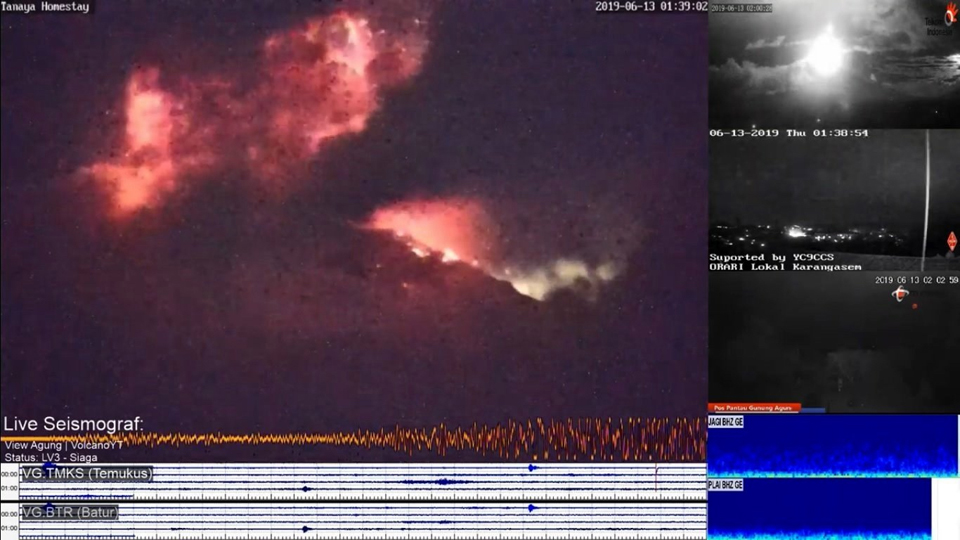
Mount Agung, located on the E end of the island of Bali, Indonesia, rises above the SE rim of the Batur caldera. The summit area extends 1.5 km E-W, with the highest point on the W and a steep-walled 800-m-wide crater on the E. Recorded eruptions date back to the early 19th century. A large and deadly explosive and effusive eruption occurred during 1963-64, which was characterized by voluminous ashfall, pyroclastic flows, and lahars that caused extensive damage and many fatalities. More recent activity was documented during November 2017-June 2019 that consisted of multiple explosions, significant ash plumes, lava flows at the summit crater, and incandescent ejecta. This report covers activity reported during April-May 2022 and December 2022 based on data from the Darwin Volcanic Ash Advisory Center (VAAC).
Activity during 2022 was relatively low and mainly consisted of a few ash plumes during April-May and December. An ash plume on 3 April rising to 3.7 km altitude (700 m above the summit) and drifting N was reported in a Darwin VAAC notice based on a ground report, with ash seen in HIMAWARI-8 visible imagery. Another ash plume was reported at 1120 on 27 May that rose to 5.5 km altitude (2.5 m above the summit); the plume was not visible in satellite or webcam images due to weather clouds. An eruption was reported based on seismic data at 0840 on 13 December, with an estimated plume altitude of 3.7 km; however, no ash was seen using satellite imagery in clear conditions before weather clouds obscured the summit.
Geologic Background. Symmetrical Agung stratovolcano, Bali's highest and most sacred mountain, towers over the eastern end of the island. The volcano, whose name means "Paramount," rises above the SE rim of the Batur caldera, and the northern and southern flanks extend to the coast. The summit area extends 1.5 km E-W, with the high point on the W and a steep-walled 800-m-wide crater on the E. The Pawon cone is located low on the SE flank. Only a few eruptions dating back to the early 19th century have been recorded in historical time. The 1963-64 eruption, one of the largest in the 20th century, produced voluminous ashfall along with devastating pyroclastic flows and lahars that caused extensive damage and many fatalities.
Information Contacts: Darwin Volcanic Ash Advisory Centre (VAAC), Bureau of Meteorology, Northern Territory Regional Office, PO Box 40050, Casuarina, NT 0811, Australia (URL: http://www.bom.gov.au/info/vaac/).
Saunders (United Kingdom) — February 2024 Cite this Report
Saunders
United Kingdom
57.8°S, 26.483°W; summit elev. 843 m
All times are local (unless otherwise noted)
Persistent thermal anomalies from the summit crater lava lake during February 2023-January 2024
Saunders is one of eleven islands that comprise the South Sandwich Islands in the South Atlantic. The active Mount Michael volcano has been in almost continuous eruption since November 2014 (BGVN 48:02). Recent activity has resulted in intermittent thermal anomalies and gas-and-steam emissions (BGVN 47:03, 48:02). Visits are infrequent due to its remote location, and cloud cover often prevents satellite observations. Satellite thermal imagery and visual observation of incandescence during a research expedition in 2019 (BGVN 28:02 and 44:08) and a finding confirmed by a National Geographic Society research team that summited Michael in November 2022 reported the presence of a lava lake.
Although nearly constant cloud cover during February 2023 through January 2024 greatly limited satellite observations, thermal anomalies from the lava lake in the summit crater were detected on clear days, especially around 20-23 August 2023. Anomalies similar to previous years (eg. BGVN 48:02) were seen in both MIROVA (Middle InfraRed Observation of Volcanic Activity) data from MODIS instruments and in Sentinel 2 infrared imagery. The only notable sulfur dioxide plume detected near Saunders was on 25 September 2023, with the TROPOMI instrument aboard the Sentinel-5P satellite.
Geologic Background. Saunders Island consists of a large central volcanic edifice intersected by two seamount chains, as shown by bathymetric mapping (Leat et al., 2013). The young Mount Michael stratovolcano dominates the glacier-covered island, while two submarine plateaus, Harpers Bank and Saunders Bank, extend north. The symmetrical Michael has a 500-m-wide summit crater and a remnant of a somma rim to the SE. Tephra layers visible in ice cliffs surrounding the island are evidence of recent eruptions. Ash clouds were reported from the summit crater in 1819, and an effusive eruption was inferred to have occurred from a N-flank fissure around the end of the 19th century and beginning of the 20th century. A low ice-free lava platform, Blackstone Plain, is located on the north coast, surrounding a group of former sea stacks. A cluster of cones on the SE flank, the Ashen Hills, appear to have been modified since 1820 (LeMasurier and Thomson, 1990). Analysis of satellite imagery available since 1989 (Gray et al., 2019; MODVOLC) suggests frequent eruptive activity (when weather conditions allow), volcanic clouds, steam plumes, and thermal anomalies indicative of a persistent, or at least frequently active, lava lake in the summit crater. Due to this observational bias, there has been a presumption when defining eruptive periods that activity has been ongoing unless there is no evidence for at least 10 months.
Information Contacts: MIROVA (Middle InfraRed Observation of Volcanic Activity), a collaborative project between the Universities of Turin and Florence (Italy) supported by the Centre for Volcanic Risk of the Italian Civil Protection Department (URL: http://www.mirovaweb.it/); NASA Global Sulfur Dioxide Monitoring Page, Atmospheric Chemistry and Dynamics Laboratory, NASA Goddard Space Flight Center (NASA/GSFC), 8800 Greenbelt Road, Goddard MD 20771, USA (URL: https://so2.gsfc.nasa.gov/); Copernicus Browser (URL: https://dataspace.copernicus.eu/browser).
Tengger Caldera (Indonesia) — February 2024 Cite this Report
Tengger Caldera
Indonesia
7.942°S, 112.95°E; summit elev. 2329 m
All times are local (unless otherwise noted)
Minor ash emission in December 2023; persistent weak thermal anomaly in the Bromo crater
Tengger Caldera, located at the N end of a volcanic massif in Indonesia’s East Java, consists of five overlapping stratovolcanoes. The youngest and only active cone in the 16-km-wide caldera is Bromo, which typically produces gas-and-steam plumes, occasional ash plumes and explosions, and weak thermal signals (BGVN 44:05, 47:01). This report covers activity during January 2022-December 2023, consisting of mostly white gas-and-steam emissions and persistent weak thermal anomalies. Information was provided by the Pusat Vulkanologi dan Mitigasi Bencana Geologi (PVMBG, also known as Indonesian Center for Volcanology and Geological Hazard Mitigation, CVGHM) and satellite imagery. The Alert Level remained at 2 (on a scale of 1-4), and visitors were warned to stay at least 1 km from the crater.
Activity was generally low during the reporting period, similar to that in 2021. According to almost daily images from MAGMA Indonesia (a platform developed by PVMBG), white emissions and plumes rose from 50 to 900 m above the main crater during this period (figure 24). During several days in March and June 2022, white plumes reached heights of 1-1.2 km above the crater.
After an increase in activity at 2114 on 3 February 2023, a PVMBG team that was sent to observe white emissions rising as high as 300 m during 9-12 February and heard rumbling noises. A sulfur dioxide odor was also strong near the crater and measurements indicated that levels were above the healthy (non-hazardous) threshold of 5 parts per million; differential optical absorption spectroscopy (DOAS) measurements indicated an average flux of 190 metric tons per day on 11 February. Incandescence originating from a large fumarole in the NNW part of the crater was visible at night. The team observed that vegetation on the E caldera wall was yellow and withered. The seismic network recorded continuous tremor and deep and shallow volcanic earthquakes.
According to a PVMBG press release, activity increased on 13 December 2023 with white, gray, and brown emissions rising as high as 900 m above Bromo’s crater rim and drifting in multiple directions (figure 25). The report noted that tremor was continuous and was accompanied in December by three volcanic earthquakes. Deformation data indicated inflation in December. There was no observable difference in the persistent thermal anomaly in the crater between 11 and 16 December 2023.
All clear views of the Bromo crater throughout this time, using Sentinel-2 infrared satellite images, showed a weak persistent thermal anomaly; none of the anomalies were strong enough to cause MODVOLC Thermal Alerts. A fire in the SE part of the caldera in early September 2023 resulted in a brief period of strong thermal anomalies.
Geologic Background. The 16-km-wide Tengger caldera is located at the northern end of a volcanic massif extending from Semeru volcano. The massive volcanic complex dates back to about 820,000 years ago and consists of five overlapping stratovolcanoes, each truncated by a caldera. Lava domes, pyroclastic cones, and a maar occupy the flanks of the massif. The Ngadisari caldera at the NE end of the complex formed about 150,000 years ago and is now drained through the Sapikerep valley. The most recent of the calderas is the 9 x 10 km wide Sandsea caldera at the SW end of the complex, which formed incrementally during the late Pleistocene and early Holocene. An overlapping cluster of post-caldera cones was constructed on the floor of the Sandsea caldera within the past several thousand years. The youngest of these is Bromo, one of Java's most active and most frequently visited volcanoes.
Information Contacts: Pusat Vulkanologi dan Mitigasi Bencana Geologi (PVMBG, also known as Indonesian Center for Volcanology and Geological Hazard Mitigation, CVGHM), Jalan Diponegoro 57, Bandung 40122, Indonesia (URL: http://www.vsi.esdm.go.id/); MAGMA Indonesia, Kementerian Energi dan Sumber Daya Mineral (URL: https://magma.esdm.go.id/v1); Copernicus Browser, Copernicus Data Space Ecosystem, European Space Agency (URL: https://dataspace.copernicus.eu/browser/); Hawai'i Institute of Geophysics and Planetology (HIGP) - MODVOLC Thermal Alerts System, School of Ocean and Earth Science and Technology (SOEST), Univ. of Hawai'i, 2525 Correa Road, Honolulu, HI 96822, USA (URL: http://modis.higp.hawaii.edu/).
Shishaldin (United States) — December 2023 Cite this Report
Shishaldin
United States
54.756°N, 163.97°W; summit elev. 2857 m
All times are local (unless otherwise noted)
New eruption with significant Strombolian explosions, ash plumes, and ashfall
Shishaldin is located on the eastern half of Unimak Island, one of the Aleutian Islands. Frequent explosive activity, primarily consisting of Strombolian ash eruptions from the small summit crater, but sometimes producing lava flows, has been recorded since the 18th century. The previous eruption ended in May 2020 and was characterized by intermittent thermal activity, increased seismicity and surface temperatures, ash plumes, and ash deposits (BGVN 45:06). This report covers a new eruption during July through November 2023, which consisted of significant explosions, ash plumes, ashfall, and lava fountaining. Information comes from daily, weekly, and special reports from the Alaska Volcano Observatory (AVO) and various satellite data. AVO monitors the volcano using local seismic and infrasound sensors, satellite data, web cameras, and remote infrasound and lightning networks.
AVO reported that intermittent tremor and low-frequency earthquakes had gradually become more regular and consistent during 10-13 July. Strongly elevated surface temperatures at the summit were identified in satellite images during 10-13 July. On 11 July AVO raised the Aviation Color Code (ACC) to Yellow (the second color on a four-color scale) and Volcano Alert Level (VAL) to Advisory (the second level on a four-level scale) at 1439. Later in the day on 11 July summit crater incandescence was observed in webcam images. Observations of the summit suggested that lava was likely present at the crater, which prompted AVO to raise the ACC to Orange (the second highest color on a four-color scale) and the VAL to Watch (the second highest level on a four-level scale). The US Coast Guard conducted an overflight on 12 July and confirmed that lava was erupting from the summit. That same day, sulfur dioxide emissions were detected in satellite images.
A significant explosion began at 0109 on 14 July that produced an ash plume that rose to 9-12 km altitude and drifted S over the Pacific Ocean (figure 43). Webcam images and photos taken around 0700 from a ship SW off Unimak Island showed small lahar deposits, which were the result of the interaction of hot pyroclastic material and snow and ice on the flanks. There was also ashfall on the SW and N flanks. A smaller explosion at 0710 generated an ash plume that rose to 4.5 km altitude. Webcam images and pilot reports showed continued low-level ash emissions during the morning, rising to less than 4.6 km altitude; those emissions included a small ash plume near the summit around 1030 resulting from a small explosion.
Seismic tremor amplitude began increasing at around 1700 on 15 July; strongly elevated surface temperatures were also reported. An ash plume rose to 4.6 km altitude and drifted SSE at 2100, based on a satellite image. A continuous ash plume during 2150 through 2330 rose to 5 km altitude and extended 125 km S. At 2357 AVO raised the ACC to Red (the highest color on a four-color scale) and the VAL to Warning (the highest level on a four-level scale), noting that seismicity remained elevated for more than six hours and explosion signals were frequently detected by regional infrasound (pressure sensor) networks. Explosions generated an ash plume that rose to 4.9 km altitude and drifted as far as 500 km SE. Activity throughout the night declined and by 0735 the ACC was lowered to Orange and the VAL to Watch. High-resolution satellite images taken on 16 July showed pyroclastic deposits extending as far as 3 km from the vent; these deposits generated lahars that extended further down the drainages on the flanks. Ash deposits were mainly observed on the SSE flank and extended to the shore of Unimak Island. During 16-17 July lava continued to erupt at the summit, which caused strongly elevated surface temperatures that were visible in satellite imagery.
Lava effusion increased at 0100 on 18 July, as noted in elevated surface temperatures identified in satellite data, increasing seismic tremor, and activity detected on regional infrasound arrays. A significant ash plume at 0700 rose to 7 km altitude and continued until 0830, eventually reaching 9.1 km altitude and drifting SSE (figure 44). As a result, the ACC was raised to Red and the VAL to Warning. By 0930 the main plume detached, but residual low-level ash emissions continued for several hours, remaining below 3 km altitude and drifting S. The eruption gradually declined and by 1208 the ACC was lowered to Orange and the VAL was lowered to Watch. High-resolution satellite images showed ash deposits on the SW flank and pyroclastic deposits on the N, E, and S flanks, extending as far as 3 km from the vent; lahars triggered by the eruption extended farther down the flanks (figure 45). Lava continued to erupt from the summit crater on 19 July.
Elevated surface temperatures were detected in satellite images during 19-25 July, despite occasional weather cloud cover, which was consistent with increased lava effusion. During 22-23 July satellite observations acquired after the eruption from 18 July showed pyroclastic flow and lahar deposits extending as far as 3 km down the N, NW, and NE flanks and as far as 1.5 km down the S and SE flanks. Ash deposits covered the SW and NE flanks. No lava flows were observed outside the crater. On 22 July a sulfur dioxide plume was detected in satellite data midday that had an estimated mass of 10 kt. In a special notice issued at 1653 on 22 July AVO noted that eruptive activity had intensified over the previous six hours, which was characterized by an hours-long steady increase in seismic tremor, intermittent infrasound signals consistent with small explosions, and an increase in surface temperatures that were visible in satellite data. Pilots first reported low-level ash plumes at around 1900. At 2320 an ash plume had risen to 9 km altitude based on additional pilot reports and satellite images. The ACC was increased to Red and the VAL to Warning at 2343. Satellite images indicated growth of a significantly higher ash plume that rose to 11 km altitude continued until 0030 and drifted NE. During the early morning hours of 23 July ash plumes had declined to 4.6 k altitude. Seismic tremor peaked at 0030 on 23 July and began to rapidly decline at 0109; active ash emissions were no longer visible in satellite data by 0130. The ACC was lowered to Orange and the VAL to Watch at 0418; bursts of increased seismicity were recorded throughout the morning, but seismicity generally remained at low levels. Elevated surface temperatures were visible in satellite data until about 0600. On 24 July pilots reported seeing vigorous gas-and-steam plumes rising to about 3 km altitude; the plumes may have contained minor amounts of ash.
During 24-25 July low level seismicity and volcanic tremor were detected at low levels following the previous explosion on 23 July. Strongly elevated surface temperatures were observed at the summit crater in satellite data. Around 2200 on 25 July seismicity began to increase, followed by infrasound signals of explosions after 0200 on 26 July. An ash plume rose to 3 km altitude at 0500 and drifted ENE, along with an associated sulfur dioxide plume that drifted NE and had an estimated mass of 22 kt. Diffuse ash emissions were visible in satellite data and rose to 6.1-7.6 km altitude and extended 125 km from the volcano starting around 1130. These ash events were preceded by about seven hours of seismic tremor, infrasound detections of explosions, and five hours of increased surface temperatures visible in satellite data. Activity began to decline around 1327, which included low-frequency earthquakes and decreased volcanic tremor, and infrasound data no longer detected significant explosions. Surface temperatures remained elevated through the end of the month.
Seismicity, volcanic tremor, and ash emissions remained at low levels during early August. Satellite images on 1 August showed that some slumping had occurred on the E crater wall due to the recent explosive activity. Elevated surface temperatures continued, which was consistent with cooling lava. On 2 August small explosive events were detected, consistent with low-level Strombolian activity. Some episodes of volcanic tremor were reported, which reflected low-level ash emissions. Those ash emissions rose to less than 3 km altitude and drifted as far as 92.6 km N. Pilots that were located N of the volcano observed an ash plume that rose to 2.7 km altitude. Seismicity began to increase in intensity around 0900 on 3 August. Seismicity continued to increase throughout the day and through the night with strongly elevated surface temperatures, which suggested that lava was active at the surface.
An ash cloud that rose to 7.6-7.9 km altitude and drifted 60-75 km NE was visible in a satellite image at 0520 on 4 August. Pilots saw and reported the plume at 0836 (figure 46). By 0900 the plume had risen to 9.1 km altitude and extended over 100 km NE. AVO raised the ACC to Red and the VAL to Warning as a result. Seismic tremor levels peaked at 1400 and then sharply declined at 1500 to slightly elevated levels; the plume was sustained during the period of high tremor and drifted N and NE. The ACC was lowered to Orange and the VAL to Watch at 2055. During 5-14 August seismicity remained low and surface temperatures were elevated based on satellite data due to cooling lava. On 9 August a small lava flow was observed that extended from the crater rim to the upper NE flank. It had advanced to 55 m in length and appeared in satellite imagery on 11 August. Occasional gas-and-steam plumes were noted in webcam images. At 1827 AVO noted that seismic tremor had steadily increased during the afternoon and erupting lava was visible at the summit in satellite images.
Strong explosion signals were detected at 0200 on 15 August. An ash cloud that was visible in satellite data extended 100 km NE and may have risen as high as 11 km altitude around 0240. By 0335 satellite images showed the ash cloud rising to 7.6 km altitude and drifting NE. Significant seismicity and explosions were detected by the local AVO seismic and infrasound networks, and volcanic lightning was detected by the World Wide Lightning Location Network (WWLLN). A sulfur dioxide plume associated with the eruption drifted over the S Bering Sea and parts of Alaska and western Canada. Seismicity was significantly elevated during the eruption but had declined by 1322. A pilot reported that ash emissions continued, rising as high as 4.9 km altitude. Elevated surface temperatures detected in satellite data were caused by hot, eruptive material (pyroclastic debris and lava) that accumulated around the summit. Eruptive activity declined by 16 August and the associated sulfur dioxide plume had mostly dissipated; remnants continued to be identified in satellite images at least through 18 August. Surface temperatures remained elevated based on satellite images, indicating hot material on the upper parts of the volcano. Small explosions were detected in infrasound data on the morning of 19 August and were consistent with pilot reports of small, short-lived ash plumes that rose to about 4.3 km altitude. Low-level explosive activity was reported during 20-24 August, according to seismic and infrasound data, and weather clouds sometimes prevented views. Elevated surface temperatures were observed in satellite images, which indicated continued hot material on the upper parts of the volcano.
Seismic tremor began to increase at around 0300 on 25 August and was followed by elevated surface temperatures identified in satellite images, consistent with erupting lava. Small explosions were recorded in infrasound data. The ACC was raised to Red and the VAL to Warning at 1204 after a pilot reported an ash plume that rose to 9.1 km altitude. Seismicity peaked at 1630 and began to rapidly decline at around 1730. Ash plumes rose as high as 10 km altitude and drifted as far as 400 km NE. By 2020 the ash plumes had declined to 6.4 km altitude and continued to drift NE. Ash emissions were visible in satellite data until 0000 on 26 August and seismicity was at low levels. AVO lowered the ACC to Orange and the VAL to Watch at 0030. Minor explosive activity within the summit crater was detected during 26-28 August and strongly elevated surface temperatures were still visible in satellite imagery through the rest of the month. An AVO field crew working on Unimak Island observed a mass flow that descended the upper flanks beginning around 1720 on 27 August. The flow produced a short-lived ash cloud that rose to 4.5 km altitude and rapidly dissipated. The mass flow was likely caused by the collapse of spatter that accumulated on the summit crater rim.
Similar variable explosive activity was reported in September, although weather observations sometimes prevented observations. A moderate resolution satellite image from the afternoon of 1 September showed gas-and-steam emissions filling the summit crater and obscuring views of the vent. In addition, hot deposits from the previous 25-26 August explosive event were visible on the NE flank near the summit, based on a 1 September satellite image. On 2 and 4 September seismic and infrasound data showed signals of small, repetitive explosions. Variable gas-and-steam emissions from the summit were visible but there was no evidence of ash. Possible summit crater incandescence was visible in nighttime webcam images during 3-4 September.
Seismicity began to gradually increase at around 0300 on 5 September and activity escalated at around 0830. A pilot reported an ash plume that rose to 7.6 km altitude at 0842 and continued to rise as high as possibly 9.7 km altitude and drifted SSE based on satellite images (figure 47). The ACC was raised to Red and the VAL to Warning at 0900. In addition to strong tremor and sustained explosions, the eruption produced volcanic lightning that was detected by the WWLLN. Around 1100 seismicity decreased and satellite data confirmed that the altitude of the ash emissions had declined to 7.6 km altitude. By 1200 the lower-altitude portion of the ash plume had drifted 125 km E. Significant ash emissions ended by 1330 based on webcam images. The ACC was lowered to Orange and the VAL to Watch at 1440. Satellite images showed extensive pyroclastic debris flows on most of the flanks that extended 1.2-3.3 km from the crater rim.
During 6-13 September elevated surface temperatures continued to be observed in satellite data, seismicity remained elevated with weak but steady tremor, and small, low-frequency earthquakes and small explosions were reported, except on 12 September. On 6 September a low-level ash plume rose to 1.5-1.8 km altitude and drifted SSE. Occasional small and diffuse gas-and-steam emissions at the summit were visible in webcam images. Around 1800 on 13 September seismic tremor amplitudes began to increase, and small explosions were detected in seismic and infrasound data. Incandescent lava at the summit was seen in a webcam image taken at 0134 on 14 September during a period of elevated tremor. No ash emissions were reported during the period of elevated seismicity. Lava fountaining began around 0200, based on webcam images. Satellite-based radar observations showed that the lava fountaining activity led to the growth of a cone in the summit crater, which refilled most of the crater. By 0730 seismicity significantly declined and remained at low levels.
Seismic tremor began to increase around 0900 on 15 September and rapidly intensified. An explosive eruption began at around 1710, which prompted AVO to raise the ACC to Red and the VAL to Warning. Within about 30 minutes ash plumes drifted E below a weather cloud at 8.2 km altitude. The National Weather Service estimated that an ash-rich plume rose as high as 12.8 km altitude and produced volcanic lightning. The upper part of the ash plume detached from the vent around 1830 and drifted E, and was observed over the Gulf of Alaska. Around the same time, seismicity dramatically decreased. Trace ashfall was reported in the community of False Pass (38 km ENE) between 1800-2030 and also in King Cove and nearby marine waters. Activity declined at around 1830 although seismicity remained elevated, ash emissions, and ashfall continued until 2100. Lightning was again detected beginning around 1930, which suggested that ash emissions continued. Ongoing explosions were detected in infrasound data, at a lower level than during the most energetic phase of this event. Lightning was last detected at 2048. By 2124 the intensity of the eruption had decreased, and ash emissions were likely rising to less than 6.7 km altitude. Seismicity returned to pre-eruption levels. On 16 September the ACC was lowered to Orange and the VAL to Watch at 1244; the sulfur dioxide plume that was emitted from the previous eruption event was still visible over the northern Pacific Ocean. Elevated surface temperatures, gas-and-steam emissions from the vent, and new, small lahars were reported on the upper flanks based on satellite and webcam images. Minor deposits were reported on the flanks which were likely the result of collapse of previously accumulated lava near the summit crater.
Elevated seismicity with tremor, small earthquakes, and elevated surface temperatures were detected during 17-23 September. Minor gas-and-steam emissions were visible in webcam images. On 20 September small volcanic debris flows were reported on the upper flanks. On 21 September a small ash deposit was observed on the upper flanks extending to the NE based on webcam images. Seismic tremor increased significantly during 22-23 September. Regional infrasound sensors suggested that low-level eruptive activity was occurring within the summit crater by around 1800 on 23 September. Even though seismicity was at high levels, strongly elevated surface temperatures indicating lava at the surface were absent and no ash emissions were detected; weather clouds at 0.6-4.6 km altitude obscured views. At 0025 on 24 September AVO noted that seismicity continued at high levels and nearly continuous small infrasound signals began, likely from low-level eruptive activity. Strongly elevated surface temperatures were identified in satellite images by 0900 and persisted throughout the day; the higher temperatures along with infrasound and seismic data were consistent with lava erupting at the summit. Around 1700 similarly elevated surface temperatures were detected from the summit in satellite data, which suggested that more vigorous lava fountaining had started. Starting around 1800 low-level ash emissions rose to altitudes less than 4.6 km altitude and quickly dissipated.
Beginning at midnight on 25 September, a series of seismic signals consistent with volcanic flows were recorded on the N side of the volcano. A change in seismicity and infrasound signals occurred around 0535 and at 0540 a significant ash cloud formed and quickly reached 14 km altitude and drifted E along the Alaska Peninsula. The cloud generated at least 150 lightning strokes with thunder that could be heard by people in False Pass. Seismicity rapidly declined to near background levels around 0600. AVO increased the ACC to Red and the VAL to Warning at 0602. The ash cloud detached from the volcano at around 0700, rose to 11.6 km altitude, and drifted ESE. Trace to minor amounts of ashfall were reported by the communities of False Pass, King Cove, Cold Bay, and Sand Point around 0700. Ash emissions continued at lower altitudes of 6-7.6 km altitude at 0820. Small explosions at the vent area continued to be detected in infrasound data and likely represented low-level eruptive activity near the vent. Due to the significant decrease in seismicity and ash emissions the ACC was lowered to Orange and the VAL to Watch at 1234. Radar data showed significant collapses of the crater that occurred on 25 September. Satellite data also showed significant hot, degassing pyroclastic and lahar deposits on all flanks, including more extensive flows on the ENE and WSW sections below two new collapse scarps. Following the significant activity during 24-25 September, only low-level activity was observed. Seismicity decreased notably near the end of the strong activity on 25 September and continued to decrease through the end of the month, though tremor and small earthquakes were still reported. No explosive activity was detected in infrasound data through 2 October. Gas-and-steam emissions rose to 3.7 km altitude, as reported by pilots and seen in satellite images. Satellite data from 26 September showed that significant collapses had occurred at the summit crater and hot, steaming deposits from pyroclastic flows and lahars were present on all the flanks, particularly to the ENE and WSW. A small ash cloud was visible in webcam images on 27 September, likely from a collapse at the summit cone. High elevated surface temperatures were observed in satellite imagery during 27-28 September, which were likely the result of hot deposits on the flanks erupted on 25 September. Minor steaming at the summit crater and from an area on the upper flanks was visible in webcam images on 28 September.
During October, explosion events continued between periods of low activity. Seismicity significantly increased starting at around 2100 on 2 October; around the same time satellite images showed an increase in surface temperatures consistent with lava fountaining. Small, hot avalanches of rock and lava descended an unspecified flank. In addition, a distinct increase in infrasound, seismicity, and lightning detections was followed by an ash plume that rose to 12.2 km altitude and drifted S and E at 0520 on 3 October, based on satellite images. Nighttime webcam images showed incandescence due to lava fountaining at the summit and pyroclastic flows descending the NE flank. AVO reported that a notable explosive eruption started at 0547 and lasted until 0900 on 3 October, which prompted a rise in the ACC to Red and the VAL to Warning. Subsequent ash plumes rose to 6-7.6 km altitude by 0931. At 1036 the ACC was lowered back to Orange and the VAL to Watch since both seismic and infrasound data quieted substantially and were slightly above background levels. Gas-and-steam emissions were observed at the summit, based on webcam images. Trace amounts of ashfall were observed in Cold Bay. Resuspended ash was present at several kilometers altitude near the volcano. During the afternoon, low-level ash plumes were visible at the flanks, which appeared to be largely generated by rock avalanches off the summit crater following the explosive activity. These ash plumes rose to 3 km altitude and drifted W. Trace amounts of ashfall were reported by observers in Cold Bay and Unalaska and flights to these communities were disrupted by the ash cloud. Satellite images taken after the eruption showed evidence of pyroclastic flows and lahar deposits in drainages 2 km down the SW flank and about 3.2 km down the NE flank, and continued erosion of the crater rim. Small explosion craters at the end of the pyroclastic flows on the NE flank were noted for the first time, which may have resulted from gas-and-steam explosions when hot deposits interact with underlying ice.
During 4 October seismicity, including frequent small earthquakes, remained elevated, but was gradually declining. Ash plumes were produced for over eight hours until around 1400 that rose to below 3.7 km altitude. These ash plumes were primarily generated off the sides of the volcano where hot rock avalanches from the crater rim had entered drainages to the SW and NE. Two explosion craters were observed at the base of the NE deposits about 3.2 km from the crater rim. Webcam images showed the explosion craters were a source of persistent ash emissions; occasional collapse events also generated ash. Seismicity remained elevated with sulfur dioxide emissions that had a daily average of more than 1,000 tons per day, and frequent small earthquakes through the end of the month. Frequent elevated surface temperatures were identified in satellite images and gas-and-steam plumes were observed in webcam images, although weather conditions occasionally prevented clear views of the summit. Emissions were robust during 14-16 October and were likely generated by the interaction of hot material and snow and ice. During the afternoon of 21 October a strong gas-and-steam plume rose to 3-4.6 km altitude and extended 40 km WSW, based on satellite images and reports from pilots. On 31 October the ACC was lowered to Yellow and the VAL was lowered to Advisory.
Activity in November was characterized by elevated seismicity with ongoing seismic tremor and small, low-frequency earthquakes, elevated surface temperatures, and gas-and-steam emissions. There was an increase in seismic and infrasound tremor amplitudes starting at 1940 on 2 November. As a result, the ACC was again raised to Orange and the VAL was increased to Watch, although ash was not identified in satellite data. An ash cloud rose to 6.1 km altitude and drifted W according to satellite data at 2000. By 0831 on 3 November ash emissions were no longer visible in satellite images. On 6 and 9 November air pressure sensors detected signals consistent with small explosions. Small explosions were detected in infrasound data consistent with weak Strombolian activity on 19 and 21 November. Seismicity started to decrease on 21 November. On 25 November gas-and-steam emissions were emitted from the vent as well as from a scarp on the NE side of the volcano near the summit. A gas-and-steam plume extended about 50 km SSE and was observed in satellite and webcam images on 26 November. On 28 November small explosions were observed in seismic and local infrasound data and gas-and-steam emissions were visible from the summit and from the upper NE collapse scarp based on webcam images. Possible small explosions were observed in infrasound data on 30 November. Weakly elevated surface temperatures and a persistent gas-and-steam plume from the summit and collapse scarps on the upper flanks. A passing aircraft reported the gas-and-steam plume rose to 3-3.4 km altitude on 30 November, but no significant ash emissions were detected.
Satellite data. MODIS thermal anomaly data provided through MIROVA (Middle InfraRed Observation of Volcanic Activity) showed a strong pulse of thermal activity beginning in July 2023 that continued through November 2023 (figure 48). This strong activity was due to Strombolian explosions and lava fountaining events at the summit crater. According to data from MODVOLC thermal alerts, a total of 101 hotspots were detected near the summit crater in July (11-14, 16-19, 23-24 and 26), August (4, 25-26, and 29), September (5, 12, and 17), and October (3, 4, and 8). Infrared satellite data showed large lava flows descending primarily the northern and SE flanks during the reporting period (figure 49). Sulfur dioxide plumes often exceeded two Dobson Units (DUs) and drifted in different directions throughout the reporting period, based on satellite data from the TROPOMI instrument on the Sentinel-5P satellite (figure 50).
Geologic Background. The symmetrical glacier-covered Shishaldin in the Aleutian Islands is the westernmost of three large stratovolcanoes in the eastern half of Unimak Island. The Aleuts named the volcano Sisquk, meaning "mountain which points the way when I am lost." Constructed atop an older glacially dissected edifice, it is largely basaltic in composition. Remnants of an older edifice are exposed on the W and NE sides at 1,500-1,800 m elevation. There are over two dozen pyroclastic cones on its NW flank, which is covered by massive aa lava flows. Frequent explosive activity, primarily consisting of Strombolian ash eruptions from the small summit crater, but sometimes producing lava flows, has been recorded since the 18th century. A steam plume often rises from the summit crater.
Information Contacts: Alaska Volcano Observatory (AVO), a cooperative program of a) U.S. Geological Survey, 4200 University Drive, Anchorage, AK 99508-4667 USA (URL: https://avo.alaska.edu/), b) Geophysical Institute, University of Alaska, PO Box 757320, Fairbanks, AK 99775-7320, USA, and c) Alaska Division of Geological & Geophysical Surveys, 794 University Ave., Suite 200, Fairbanks, AK 99709, USA (URL: http://dggs.alaska.gov/); MIROVA (Middle InfraRed Observation of Volcanic Activity), a collaborative project between the Universities of Turin and Florence (Italy) supported by the Centre for Volcanic Risk of the Italian Civil Protection Department (URL: http://www.mirovaweb.it/); Hawai'i Institute of Geophysics and Planetology (HIGP) - MODVOLC Thermal Alerts System, School of Ocean and Earth Science and Technology (SOEST), Univ. of Hawai'i, 2525 Correa Road, Honolulu, HI 96822, USA (URL: http://modis.higp.hawaii.edu/); NASA Global Sulfur Dioxide Monitoring Page, Atmospheric Chemistry and Dynamics Laboratory, NASA Goddard Space Flight Center (NASA/GSFC), 8800 Greenbelt Road, Goddard, Maryland, USA (URL: https://so2.gsfc.nasa.gov/); Copernicus Browser, Copernicus Data Space Ecosystem, European Space Agency (URL: https://dataspace.copernicus.eu/browser/).
Ioto
Japan
24.751°N, 141.289°E; summit elev. 169 m
All times are local (unless otherwise noted)
New eruption with discolored water, ejecta, and floating pumice during October-December 2023
Ioto (Iwo-jima), located about 1,200 km S of Tokyo, lies within a 9-km-wide submarine caldera along the Izu-Bonin-Mariana volcanic arc. Previous eruptions date back to 1889 and have consisted of dominantly phreatic explosions, pumice deposits during 2001, and discolored water. A submarine eruption during July through December 2022 was characterized by discolored water, pumice deposits, and gas emissions (BGVN 48:01). This report covers a new eruption during October through December 2023, which consisted of explosions, black ejecta, discolored water, and floating pumice, based on information from the Japan Meteorological Association (JMA), the Japan Coast Guard (JCG), and satellite data.
JMA reported that an eruption had been occurring offshore of Okinahama on the SE side of the island since 21 October, which was characterized by volcanic tremor, according to the Japan Maritime Self-Defense Force (JMSDF) Iwo Jima Air Base (figure 22). According to an 18 October satellite image a plume of discolored water at the site of this new eruption extended NE (figure 23). During an overflight conducted on 30 October, a vent was identified about 1 km off the coast of Okinahama. Observers recorded explosions every few minutes that ejected dark material about 20 m above the ocean and as high as 150 m. Ejecta from the vent formed a black-colored island about 100 m in diameter, according to observations conducted from the air by the Earthquake Research Institute of the University of Tokyo in cooperation with the Mainichi newspaper (figure 24). Occasionally, large boulders measuring more than several meters in size were also ejected. Observations from the Advanced Land Observing Satellite Daichi-2 and Sentinel-2 satellite images also confirmed the formation of this island (figure 23). Brown discolored water and floating pumice were present surrounding the island.
The eruption continued during November. During an overflight on 3 November observers photographed the island and noted that material was ejected 169 m high, according to a news source. Explosions gradually became shorter, and, by the 3rd, they occurred every few seconds; dark and incandescent material were ejected about 800 m above the vent. On 4 November eruptions were accompanied by explosive sounds. Floating, brown-colored pumice was present in the water surrounding the island. There was a brief increase in the number of volcanic earthquakes during 8-14 November and 24-25 November. The eruption temporarily paused during 9-11 November and by 12 November eruptions resumed to the W of the island. On 10 November dark brown-to-dark yellow-green discolored water and a small amount of black floating material was observed (figure 25). A small eruption was reported on 18 November off the NE coast of the island, accompanied by white gas-and-steam plumes (figure 23). Another pause was recorded during 17-19 November, which then resumed on 20 November and continued erupting intermittently. According to a field survey conducted by the National Institute for Disaster Prevention Science and Technology on 19 November, a 30-m diameter crater was visible on the NE coast where landslides, hot water, and gray volcanic ash containing clay have occurred and been distributed previously. Erupted blocks about 10 cm in diameter were distributed about 90-120 m from the crater. JCG made observations during an overflight on 23 November and reported a phreatomagmatic eruption. Explosions at the main vent generated dark gas-and-ash plumes that rose to 200 m altitude and ejected large blocks that landed on the island and in the ocean (figure 26). Discolored water also surrounded the island. The size of the new island had grown to 450 m N-S x 200 m E-W by 23 November, according to JCG.
The eruption continued through 11 December, followed by a brief pause in activity, which then resumed on 31 December, according to JMA. Intermittent explosions produced 100-m-high black plumes at intervals of several minutes to 30 minutes during 1-10 December. Overflights were conducted on 4 and 15 December and reported that the water surrounding the new island was discolored to dark brown-to-dark yellow-green (figure 27). No floating material was reported during this time. In comparison to the observations made on 23 November, the new land had extended N and part of it had eroded away. In addition, analysis by the Geospatial Information Authority of Japan using SAR data from Daichi-2 also confirmed that the area of the new island continued to decrease between 4 and 15 December. Ejected material combined with wave erosion transformed the island into a “J” shape, 500-m-long and with the curved part about 200 m offshore of Ioto. The island was covered with brown ash and blocks, and the surrounding water was discolored to greenish-brown and contained an area of floating pumice. JCG reported from an overflight on 4 December that volcanic ash-like material found around the S vent on the NE part of the island was newly deposited since 10 November (figure 28). By 15 December the N part of the “J” shaped island had separated and migrated N, connecting to the Okinahama coast and the curved part of the “J” had eroded into two smaller islands (figure 27).
References. Ukawa, M., Fujita, E., Kobayashi, T., 2002, Recent volcanic activity of Iwo Jima and the 2001 eruption, Monthly Chikyu, Extra No. 39, 157-164.
Geologic Background. Ioto, in the Volcano Islands of Japan, lies within a 9-km-wide submarine caldera. The volcano is also known as Ogasawara-Iojima to distinguish it from several other "Sulfur Island" volcanoes in Japan. The triangular, low-elevation, 8-km-long island narrows toward its SW tip and has produced trachyandesitic and trachytic rocks that are more alkalic than those of other volcanoes in this arc. The island has undergone uplift for at least the past 700 years, accompanying resurgent doming of the caldera; a shoreline landed upon by Captain Cook's surveying crew in 1779 is now 40 m above sea level. The Motoyama plateau on the NE half of the island consists of submarine tuffs overlain by coral deposits and forms the island's high point. Many fumaroles are oriented along a NE-SW zone cutting through Motoyama. Numerous recorded phreatic eruptions, many from vents on the W and NW sides of the island, have accompanied the uplift.
Information Contacts: Japan Meteorological Agency (JMA), 1-3-4 Otemachi, Chiyoda-ku, Tokyo 100-8122, Japan (URL: http://www.jma.go.jp/jma/indexe.html); Japan Coast Guard (JCG) Volcano Database, Hydrographic and Oceanographic Department, 3-1-1, Kasumigaseki, Chiyoda-ku, Tokyo 100-8932, Japan (URL: https://www1.kaiho.mlit.go.jp/GIJUTSUKOKUSAI/kaiikiDB/kaiyo22-2.htm); Copernicus Browser, Copernicus Data Space Ecosystem, European Space Agency (URL: https://dataspace.copernicus.eu/browser/); Asahi, 5-3-2, Tsukiji, Chuo Ward, Tokyo, 104-8011, Japan (URL: https://www.asahi.com/ajw/articles/15048458).
Search Bulletin Archive by Publication Date
Select a month and year from the drop-downs and click "Show Issue" to have that issue displayed in this tab.
The default month and year is the latest issue available.
Bulletin of the Global Volcanism Network - Volume 44, Number 11 (November 2019)
Agung (Indonesia)
Quiet returns after explosions on 10 and 13 June 2019
Copahue (Chile-Argentina)
New ash emissions begin in early August; intermittent and ongoing through October 2019
Erta Ale (Ethiopia)
Continued summit activity and lava flow outbreaks during April-October 2019
Fournaise, Piton de la (France)
Three brief eruptive events in July, August, and October 2019
Karymsky (Russia)
Moderate explosive activity with ash plumes through 24 September 2019
Mayon (Philippines)
Gas-and-steam plumes and summit incandescence during May-October 2019
Sarychev Peak (Russia)
Ash plume on 11 August; thermal anomalies from late May to early October 2019
Sheveluch (Russia)
Frequent ash explosions and lava dome growth continue through October 2019
Turrialba (Costa Rica)
Activity diminishes during March-October 2019, but small ash emissions continue
Unnamed (Tonga)
Submarine eruption in early August creates pumice rafts that drifted west to Fiji
Agung (Indonesia) — November 2019 Cite this Report
Agung
Indonesia
8.343°S, 115.508°E; summit elev. 2997 m
All times are local (unless otherwise noted)
Quiet returns after explosions on 10 and 13 June 2019
After a large, deadly explosive and effusive eruption during 1963-64, Indonesia's Mount Agung on Bali remained quiet until a new eruption began in November 2017 (BGVN 43:01). Activity continued throughout 2018 with explosions that produced ash plumes rising multiple kilometers above the summit, and the slow effusion of the lava within the summit crater. Increasingly frequent and intense explosions with ash emissions and incandescent ejecta characterized activity during February through May 2019 (BGVN 44:06). Two more explosions in June 2019 produced significant ash plumes; no further explosive activity occurred through October 2019. Information about Agung comes from Pusat Vulkanologi dan Mitigasi Bencana Geologi (PVMBG), also known as the Indonesian Center for Volcanology and Geological Hazard Mitigation (CVGHM), the Darwin Volcanic Ash Advisory Center (VAAC), and multiple sources of satellite data. This report covers the end of the eruption in June and observations through October 2019.
After a large explosion on 31 May 2019, a smaller event occurred on 10 June. Another large explosion with an ash plume that rose to 9.1 km altitude was recorded on 13 June (local time). It drifted hundreds of kilometers before dissipating. No further explosive activity was reported through October 2019, only diffuse white steam plumes rising at most a few hundred meters above the summit. The Alert Level remained at III (of four levels) throughout the period. The record of thermal activity showed an increase during the explosive events of late May and June, but then decreased significantly (figure 57). There was no obvious thermal signature in satellite images that explained the small increase in thermal energy recorded by the MIROVA data at the end of August 2019.
On 31 May 2019 a large explosion produced an ash plume that rose more than 2 km above the summit (BGVN 44:06, figure 56). The Darwin VAAC reported that it split into two plumes, one drifted E at 8.2 km and the other ESE at 6.1 km altitude, dissipating after about 20 hours early on 1 June. A small eruption with an ash plume that rose to 3.9 km altitude was reported the next day by the Darwin VAAC. It was detected in the webcam and pilot reports confirmed that it drifted E for a few hours before dissipating. PVMBG reported gray emissions to 300 m above the peak on 1 June and 100 m above the summit on 2 June. By 6 June the emissions were white, rising only 50 m above the summit. For several subsequent days, the summit was covered in fog with no observations of emissions.
On 10 June 2019 an explosion lasting 90 seconds was reported at 1212 local time; PVMBG noted a gray ash plume 1,000 m above the summit (figure 58). The Darwin VAAC confirmed the emission in satellite imagery and by pilot report; it was moving SW at 4.3 km altitude and then drifted S before dissipating by the end of the day. Early on 13 June local time (12 June UTC) a new explosion that was clearly visible in the webcam produced a large ash plume that drifted W and SW (figure 59). The explosion was recorded on the seismogram for almost four minutes and sent incandescent ejecta in all directions up to 700 m from the summit. The first satellite imagery of the plume reported by the Darwin VAAC suggested the altitude to be 9.1 km. A secondary plume was drifting W from the summit at 5.5 km altitude a few hours later. By six hours after the eruption, the 9.1 km altitude plume was about 90 km SSW of the Denpassar airport and the 5.5 km altitude plume was about 110 km W of the airport. By the time the higher altitude plume dissipated after about 14 hours, it had reached 300 km S of the airport. For the remainder of June, only diffuse white steam plumes were reported, rising generally 30-50 m above the summit, with brief pulses to 150-200 m during 27-29 June.
Although no further surface activity was reported at Agung during July through October 2019, PVMBG kept the Alert Level at III throughout the period. Only steam plumes were reported from the summit usually rising 50 m before dissipating. Steam emissions rose to 150 m a few times each month. Plumes were reported at 300 m above the summit on 6 July and 15 August. No thermal anomalies were visible in Sentinel 2 satellite images during the period.
Geologic Background. Symmetrical Agung stratovolcano, Bali's highest and most sacred mountain, towers over the eastern end of the island. The volcano, whose name means "Paramount," rises above the SE rim of the Batur caldera, and the northern and southern flanks extend to the coast. The summit area extends 1.5 km E-W, with the high point on the W and a steep-walled 800-m-wide crater on the E. The Pawon cone is located low on the SE flank. Only a few eruptions dating back to the early 19th century have been recorded in historical time. The 1963-64 eruption, one of the largest in the 20th century, produced voluminous ashfall along with devastating pyroclastic flows and lahars that caused extensive damage and many fatalities.
Information Contacts: Pusat Vulkanologi dan Mitigasi Bencana Geologi (PVMBG, also known as Indonesian Center for Volcanology and Geological Hazard Mitigation, CVGHM), Jalan Diponegoro 57, Bandung 40122, Indonesia (URL: http://www.vsi.esdm.go.id/); MIROVA (Middle InfraRed Observation of Volcanic Activity), a collaborative project between the Universities of Turin and Florence (Italy) supported by the Centre for Volcanic Risk of the Italian Civil Protection Department (URL: http://www.mirovaweb.it/); Rita Bauer, Volcano Verse (Twitter @wischweg, URL: https://twitter.com/wischweg/status/1137956367258570752); Jamie S. Sincioco, Philippines (Twitter @jaimessincioco, URL: https://twitter.com/jaimessincioco/status/1139109685796020224).
Copahue (Chile-Argentina) — November 2019 Cite this Report
Copahue
Chile-Argentina
37.856°S, 71.183°W; summit elev. 2953 m
All times are local (unless otherwise noted)
New ash emissions begin in early August; intermittent and ongoing through October 2019
Most of the large edifice of Copahue lies high in the central Chilean Andes, but the active, acidic-lake filled El Agrio crater lies on the Argentinian side of the border at the W edge of the Pliocene Caviahue caldera. Infrequent mild-to-moderate explosive eruptions have been recorded since the 18th century. The most recent eruptive episode with ash plumes lasted from early June 2017 to early December 2018. After 8 months of quiet, renewed phreatic explosions and ash emissions began in August 2019 and were ongoing through October 2019. This report summarizes activity from January through October 2019 and is based on reports issued by Servicio Nacional de Geología y Minería (SERNAGEOMIN) Observatorio Volcanológico de Los Andes del Sur (OVDAS), Buenos Aires Volcanic Ash Advisory Center (VAAC), satellite data, and photographs from nearby residents.
Intermittent steam plumes were reported from the El Agrio crater at the summit during January-July 2019, but no ash emissions were seen. An increase in seismicity and changes in the crater lake level during March led SERNAGEOMIN to increase the Alert Level from Green to Yellow at the beginning of April. Fluctuating tremor signals in the first week of August coincided with satellite imagery that showed the appearance of dark material, possibly ash, on the snow around the summit crater. The first thermal anomaly appeared on 3 September and the first clear ash explosions were recorded on 11 September. Eruptive activity was intermittent through the end of the month; a series of larger explosions beginning on 30 September caused SERNAGEOMIN to raise the Alert Level from Yellow to Orange. A period of more intense explosive activity lasted through the first week of October. The larger explosions then ceased, but during the rest of October there were continuing observations of seismicity, ash emissions, and incandescent ejecta, along with multiple thermal anomalies in the summit area.
Observations during January-April 2019. Copahue remained at Alert Level Yellow with a 1-km exclusion radius during January 2019 after ash emission in December 2018. Ongoing degassing was reported with white plumes from El Agrio crater rising to 355 m (figure 25). The Alert Level was lowered to Green at the end of the month, and the exclusion radius was reduced to 500 m, although intermittent low-level seismicity in the region continued. SERNAGEOMIN reported a M 3.2 earthquake about 10 km NE of the summit, 2 km deep, on 29 January 2019. The acidic lake inside El Agrio crater was quiet at the end of the month (figure 26).
Steam plumes occasionally rose to 180 m above the crater during February 2019. A swarm of 117 volcano-tectonic (VT) seismic events on 22-23 February 2019 was located about 14 km NE of the volcano, with the largest events around a M 3.5. Steam plumes rose to about 280 m above the crater during March. SERNAGEOMIN noted an increase in seismicity during the month, and a decrease in the lake level within El Agrio crater. This led them to increase the Alert Level to Yellow (second on a four-level scale) at the beginning of April. Emissions remained minimal during April (figure 27); an 80 m high steam plume was reported on 4 April. The lake level continued to fall, based on satellite imagery, and a M 3.1 earthquake was reported on 29 April located about 10 km NE of the summit about 10 km deep.
Observations during May-July 2019. Sporadic episodes of low-altitude steam plume degassing were noted during May 2019, but otherwise very little surface activity was reported (figure 28). On 13 May, a steam plume reached 160 m above the crater rim, and on 28 May, the tallest plume rose 200 m above the crater. Hybrid-type earthquakes were recorded early in the month, followed by a slow increase in the amplitude of the tremor signal. Seismicity increased slightly during the second half of the month with activity concentrated closer to the summit crater. A weak SO2 plume was recorded by satellite instruments on 23 May. The level of the lake began increasing during the second half of the month.
SERNAGEOMIN reported tremor signals with fluctuating amplitude throughout June 2019. Repeated episodes of low-altitude white degassing occurred around the El Agrio crater. On 7 June, a 300 m plume was observed above the crater; the level of the crater lake was variable. On 17 June a 400-m-tall white plume was observed above the crater. Seismicity, although low, increased during the second half of the month. Multiple episodes of low-altitude white degassing occurred around the active crater all during July 2019 (figure 29). On 9 July a plume rose about 450 m above the crater. On 16 July a white plume rose 250 m above the crater. SENAGEOMIN noted a rise in the rate of seismicity during the first half of the month; the tremor signal continued with fluctuating amplitude. Satellite instruments detected small SO2 plumes on 4 and 9 July (figure 30).
Activity during August-October 2019. Sentinel-2 satellite imagery from 2, 4, 7, and 9 August suggested the ejection of particulate material (figure 31), with dark streaks in the snow extending a few hundred meters E and SE from the crater. Images from the community of Caviahue on 3 and 4 August show distinct discoloration of the snow around the E side of the summit crater (figures 32 and 33). Small but discernible SO2 plumes were detected by satellite instruments on 2, 3, 16, 19, 30, and 31 August. Fluctuating tremor signals continued during August with several episodes of low-altitude white degassing from the El Agrio crater; a white plume on 5 August rose 380 m above the crater. The lake level continued to drop and the Alert Level remained at Yellow.
Distinct SO2 plumes were again captured by satellite instruments on 1, 3, and 5-7 September 2019 (figure 34). The first thermal signature in nine months also appeared in Sentinel-2 satellite imagery on 3 September (figure 35). Midday on 9 September, seismometers recorded an increase in the amplitude of a continuous tremor. High clouds prevented clear views of the crater and no ash emissions were observed. Beginning on 11 September, low-energy long-period (LP) events were associated with infrasound signals and low-energy explosions that produced small ash plumes. The largest explosion produced a plume 250 m above the crater. Incandescence and high-temperature ejecta were observed around the emission point. The ash drifted ESE about 3 km. Ten explosions were reported between 11 and 12 September, associated with low-intensity acoustic signals and ash emissions. Plumes reached 430 m above the crater rim on 12 September. Ash deposits on the snow were visible in in Sentinel-2 images on 11 and 13 September, extending about 6 km E from El Agrio crater (figure 35). Images from the ground on 12 September indicated fresh ash on the E flank (figure 36).
Although fresh snow had covered any ash deposits by 16 September 2019 (figure 37), small thermal anomalies appeared in Sentinel-2 imagery on 16 and 21 September. SO2 plumes were measured by satellite instruments on 21 and 25 September. Photos from Caviahue on 25 September showed ash on the E flank and a steam-and-ash plume drifting NE (figure 38). Ashfall on the snow was visible in satellite imagery on 26 September, and covered a larger area on 28 September; there was also a substantial thermal anomaly that day (figure 39).
During the late afternoon of 30 September, three high-energy LP earthquakes were reported located 5.8 km NE of the El Agrio crater. They were accompanied by abundant lower energy earthquakes in the same area. The VT earthquakes were equivalent to a M 3.5. Inhabitants of Caviahue (12 km E) reported feeling several of the events; atmospheric conditions prevented observation of the summit. This sudden increase in seismicity prompted SERNGEOMIN to raise the Alert Level to Orange and increase the radius of the area of potential impact to 5 km. Seismicity (VT, LP and tremor earthquakes) continued at a high rate into 1 October. Argentina's geologic hazards and mining agency, Servicio Geologico Minero Argentino (SEGEMAR) also issued a notice of the increased warning level on 30 September (figure 40).
Cameras near the volcano detected ash plumes associated with explosions around the crater at 0945 on 1 October 2019 which continued throughout the first week of the month. Satellite imagery showed streaks of dark ash over snow trending SE and E and from the summit on 1 and 8 October (figure 41). Five separate explosions were recorded during 1-2 October. Persistent degassing was accompanied by episodes of ash emissions and incandescence at night. Seismicity continued during 2-3 October, but poor weather mostly obscured visual evidence of activity; a few pulses of white and gray emissions were observed. Seismic events were located 5-7 km NE at a depths of 0.7-1.7 km, and continued for several days. Clearer skies on 4 October revealed steam plumes and pulses of ash rising from El Agrio crater. Incandescence was visible at night. A ground-based image showed ash covering the E flank and an ash plume drifting NE down the flank (figure 42). The Buenos Aires VAAC reported weak ash emissions on 4 October moving NE at 3.4 km altitude. The webcam showed continuous ash emission from the summit during 4-5 October.
White steam plumes with pulses of ash and incandescence at night were observed on 5 and 6 October. Seismic activity decreased on 6 October. The following day, SERNAGEOMIN lowered the Alert Level to Yellow and reduced the restricted zone to 1,000 m around the summit crater. While seismicity had decreased, ash emissions continued from low-level pulsating explosions which produced ash plumes that drifted E (figure 43). They observed that the total area to that date affected by ashfall was about 24.5 km2, extending up to 5 km W and 6 km E from the summit. They also noted that a pyroclastic cone about 130 m across had appeared inside the crater. Ash emissions and explosions with incandescent ejecta continued during the second week of October (figure 44). A change in wind direction created a several-kilometer-long streak of ash trending SW from the summit by 13 October; a strong thermal anomaly that day indicated continued activity (figure 45). SO2 plumes were recorded by satellite instruments on 1, 3, 4, and 13 October.
Seismicity continued for the rest of October, but no explosions were recorded. Sulfur dioxide emissions were recorded by satellite instruments on 18, 22, 23, and 30 October (figure 46). When weather permitted, constant degassing with episodes of ash emissions from the crater were visible during the day and incandescence appeared at night. Satellite imagery on 18, 23, and 28 October showed substantial ash plumes drifting in different directions from the summit. A large area around the summit crater was covered with dark ash on 18 and 23 October. Fresh snowfall had covered most of the area by 28 October, and the narrow dark streak trending SE underneath the ongoing ash plume was the only surface covered with material (figure 47). Distinct thermal anomalies appeared in satellite images on 16, 18, 23, and 31 October. A number of thermal alerts were recorded by the MIROVA system as well during the second half of the month.
The highest plume noted by SERNAGEOMIN during the second half of the month rose 1,200 m above the crater on 22 October 2019 (figure 48). The Buenos Aires VAAC reported ash emissions from the summit visible in webcams almost every day in October. On 16 October, an ash plume was seen in satellite imagery moving SE at 3.4 km altitude under mostly clear skies; the webcam showed continuous ash emission. A faint plume was barely seen moving S in satellite imagery at 3.4 km altitude on 18 October; the webcam revealed continuous emission of gases and possible dilute volcanic ash. The VAAC reported ash emissions daily from 18-25 October. Drift directions varied from SE, moving to NE on 21-23 October, and back to E and SE the following days. The altitudes ranged from 3.0 to 4.3 km. On 20 October, the plume extended about 80 km SE. The ash appeared as pulses moving NE on 22 and 23 October at 4.3 km altitude. Emissions reappeared in satellite imagery on 28 and 30-31 October, drifting SE and NE at 3.4-3.7 km altitude; incandescence was visible overnight on 30-31 October from the webcam.
Geologic Background. Volcán Copahue is an elongated composite cone constructed along the Chile-Argentina border within the 6.5 x 8.5 km wide Trapa-Trapa caldera that formed between 0.6 and 0.4 million years ago near the NW margin of the 20 x 15 km Pliocene Caviahue (Del Agrio) caldera. The eastern summit crater, part of a 2-km-long, ENE-WSW line of nine craters, contains a briny, acidic 300-m-wide crater lake (also referred to as El Agrio or Del Agrio) and displays intense fumarolic activity. Acidic hot springs occur below the eastern outlet of the crater lake, contributing to the acidity of the Río Agrio, and another geothermal zone is located within Caviahue caldera about 7 km NE of the summit. Infrequent mild-to-moderate explosive eruptions have been recorded since the 18th century. Twentieth-century eruptions from the crater lake have ejected pyroclastic rocks and chilled liquid sulfur fragments.
Information Contacts: Servicio Nacional de Geología y Minería (SERNAGEOMIN), Observatorio Volcanológico de Los Andes del Sur (OVDAS), Avda Sta María No. 0104, Santiago, Chile (URL: http://www.sernageomin.cl/); OPTIC Neuquén, Oficina Provincial de Tecnologías de la Información y la Comunicación- Gobierno de la Provincia del Neuquén, Neuquén, Argentina (URL: https://www.neuqueninforma.gob.ar/tag/optic/, Twitter: @OPTIC_Nqn, https://twitter.com/OPTIC_Nqn); Global Sulfur Dioxide Monitoring Page, Atmospheric Chemistry and Dynamics Laboratory, NASA Goddard Space Flight Center (NASA/GSFC), 8800 Greenbelt Road, Goddard, Maryland, USA (URL: https://so2.gsfc.nasa.gov/); Sentinel Hub Playground (URL: https://www.sentinel-hub.com/explore/sentinel-playground); Valentina Sepulveda, Hotel Caviahue, Caviahue, Argentina (URL: https://twitter.com/valecaviahue, Twitter:@valecaviahue); Cultur Volcan, Journal d'un volcanophile, (URL: https://laculturevolcan.blogspot.com, Twitter: @CulturVolcan); EveLyn, Twitter: @EveCaCid (URL: https://twitter.com/EveCaCid/status/1186663015271321601).
Erta Ale (Ethiopia) — November 2019 Cite this Report
Erta Ale
Ethiopia
13.601°N, 40.666°E; summit elev. 585 m
All times are local (unless otherwise noted)
Continued summit activity and lava flow outbreaks during April-October 2019
Erta Ale, located in Ethiopia, contains multiple active pit craters both within the summit and the southeast calderas. On 17 January 2017 the active lava lake displayed intense spattering, fountaining, and rim overflows with lava flows that traveled as far as 1 km, forming a lava flow field. During April 2018 through March 2019 minor activity continued in both the summit and southeast calderas, and along the active lava flow to the E (BGVN 44:04). This report updates volcanism from April through October 2019. Information primarily comes from infrared satellite images and MODIS data.
Continued lava flow breakouts occurred from April through October 2019. On 4 May 2019 a lava flow outbreak was observed in satellite imagery NE of the summit caldera (figure 92). This outbreak continued to appear in clear-weather thermal satellite images through 13 June when it was seen south of its original location (figure 93). Faint incandescence is observed at the summit caldera between June and October 2019, though it is more pronounced in the months of August through October. On 28 June a second smaller lava flow outbreak occurred within 3.8 km of the summit location. The two lava flow outbreaks remained active at least through 18 June. The distal NE lava flow does not appear in very similar images from 17 August or 16 September 2019, but three proximal thermal anomalies are seen in the southeastern caldera within 4 km of the summit. The thermal anomalies remained within 5 km through October 2019.
MIROVA (Middle InfraRed Observation of Volcanic Activity) analysis of MODIS satellite data showed consistently high-power thermal anomalies during this reporting period (figure 94). Through July 2019 these thermal anomalies were detected at distances greater than 5 km from the summit. In early August 2019 there was an abrupt decrease in the distance that continued through late October 2019 (figure 94); this likely indicates when the distal NE outbreak ended and lava emissions from the closer SE locations increased (see satellite images in figure 93). The distance changes of MODIS thermal anomalies from the summit seen in MIROVA are corroborated by MODVOLC data, which show no distal NE thermal alert pixels after July 2019 (figure 95).
Geologic Background. The Erta Ale basaltic shield volcano in Ethiopia has a 50-km-wide edifice that rises more than 600 m from below sea level in the Danakil depression. The volcano includes a 0.7 x 1.6 km summit crater hosting steep-sided pit craters. Another larger 1.8 x 3.1 km wide depression elongated parallel to the trend of the Erta Ale range is located SE of the summit and is bounded by curvilinear fault scarps on the SE side. Basaltic lava flows from these fissures have poured into the caldera and locally overflowed its rim. The summit caldera usually also holds at least one long-term lava lake that has been active since at least 1967, and possibly since 1906. Recent fissure eruptions have occurred on the N flank.
Information Contacts: Sentinel Hub Playground (URL: https://www.sentinel-hub.com/explore/sentinel-playground); MIROVA (Middle InfraRed Observation of Volcanic Activity), a collaborative project between the Universities of Turin and Florence (Italy) supported by the Centre for Volcanic Risk of the Italian Civil Protection Department (URL: http://www.mirovaweb.it/); Hawai'i Institute of Geophysics and Planetology (HIGP) - MODVOLC Thermal Alerts System, School of Ocean and Earth Science and Technology (SOEST), Univ. of Hawai'i, 2525 Correa Road, Honolulu, HI 96822, USA (URL: http://modis.higp.hawaii.edu/).
Piton de la Fournaise (France) — November 2019 Cite this Report
Piton de la Fournaise
France
21.244°S, 55.708°E; summit elev. 2632 m
All times are local (unless otherwise noted)
Three brief eruptive events in July, August, and October 2019
Short pulses of intermittent eruptive activity have been common at Piton de la Fournaise, the large basaltic shield volcano on La Réunion Island in the western Indian Ocean, for several thousand years. Over the last 20 years effusive basaltic eruptions have occurred on average twice per year. The activity is characterized by lava fountains and lava flows, and occasional explosive eruptions that shower blocks over the summit area and produce ash plumes. Almost all of the recent activity has occurred within the Enclos Fouqué caldera around the flanks of the central cone which has the Dolomieu Crater at its summit, although past eruptions in 1977, 1986, and 1998 have occurred at vents outside the caldera. Two eruptive episodes were reported during January-June 2019; from 18 February to 10 March, and from 11 to 13 June (BGVN 44:07). Three episodes during July-October 2019 are covered in this report, with information provided primarily by the Observatoire Volcanologique du Piton de la Fournaise (OVPF) as well as satellite instruments.
Three brief eruptive episodes took place during July-October 2019. In each case, slow ground inflation in the weeks leading up to the eruption was followed by sudden inflation at the time of the fissure opening and lava flow event. This was followed by a resumption of inflation days or weeks later. The first event took place during 29-30 July and consisted of three fissures opening on the N flank of the Dolomieu cone. It lasted for less than 24 hours, and the maximum flow length was about 730 m. The second event began on 11 August with two fissures opening on the S flank of the Dolomieu cone. The flows traveled downhill almost 3 km; activity ended on 15 August. Two new fissures opened during 25-27 October on the SSE flank of the cone; one was active only briefly while the second created a 3.6-km-long flow that stopped a few hundred meters before the major highway. The sudden surges of thermal energy from the eruptions are clearly visible in the MIROVA thermal data (figure 182). Each of the eruptive episodes was also accompanied by SO2 emissions that were detected by satellite instruments (figure 183).
Activity during July 2019. The last eruption, a series of flows from several fissures on the SSE flank of Dolomieu Crater near the crater rim (at the center of the Enclos Fouqué caldera), lasted from 11 to 13 June 2019 (figure 184). Ground deformation after the eruption indicated renewed inflation of the edifice which had been ongoing since May. OVPF reported an increase in seismicity beginning on 21 June which continued throughout July; the earthquakes were located near the NW rim of the Dolomieu Crater and on its NW flank. Four centimeters of elongation were recorded between two GNSS stations within the Enclos during late June and July prior to the next eruption. The next short-lived eruption took place during 29-30 July, near the location of the seismicity on the NW flank of the Dolomieu cone about 600 m E of the Formica Leo cone. The onset of the eruption was accompanied by rapid ground deformation of about 12-13 cm, recorded at a station that is located west of the Dolomieu Crater (figure 185).
The late July eruption began around 1200 local time on 29 July 2019 with the opening of three fissures over a distance of about 450 m on the N flank of Dolomieu cone, close to the tourist trail to the summit (figure 186). Lava fountains 20-30 m high were reported. Thermal measurements indicated flow temperatures of about 1,100°C at the base of the lava fountains; samples were collected for analysis (figure 187). Average discharge rates of 11.6 m3s were estimated for the eruption which ended less than 24 hours later, around 0430 on 30 July. The maximum flow length was about 730 m.
Eruption of 11-15 August 2019. During 1-10 August there were 33 shallow volcano-tectonic (VT) earthquakes located under the SE flank of Dolomieu cone; a new eruption began over this area on 11 August (figure 188). Two centimeters of inflation were recorded between the 29-30 July eruption and the 11-15 August event; this was followed by a rapid burst of inflation (tens of centimeters) at the onset of the eruption. Inflation resumed shortly after the eruption ended. The eruption began around 1620 local time on 11 August. Two fissures opened, one at 1,700 m elevation, and one at 1,500 m elevation on the SE flank, about 1,400 m apart (figure 189). Due to the steep slopes in the area, the lava flow quickly reached the "Grande Pentes" area before slowing down at the flatter "Piton Tremblet" area. The farthest traveled flow was cooling at an elevation of about 560 m, about 2 km from the National Road (RN2) on 14 August. The maximum effusion rate was measured at 9 m3/s. The eruption stopped on 15 August 2019 at 2200 local time after more than 6 hours of "piston gas" activity, and a brief pause in flow activity earlier in the day. About 3 million m3of lava were emitted, according to OVPF-IPGP. The flows from the 1,700 m and 1500 m altitude fissures reached maximum lengths of 2.9 and 2.7 km, respectively.
Activity during September-October 2019. Very little activity was reported during September 2019. Seismicity remained low with only 32 earthquakes reported during the month, and inflation, which had continued after the 11-15 August eruption, stopped at the beginning of September. Inflation resumed on 11 October. Two seismic swarms were recorded during October 2019. The first, on 21 October (207 events), lasted for about 40 minutes, and did not result in an eruption. The second began on 25 October and consisted of 827 events. It was followed by an eruption during 25-27 October located on the SSE flank of the Dolomieu cone. Deformation followed a similar pattern as it had during and prior to the eruptive events of July and August. Inflation of a few centimeters between 11 and 24 October was followed by rapid inflation of about 10 cm at the onset of the new eruption. Inflation resumed again after this eruption as well.
Two fissures opened during the 25-27 October eruption, one at 1,060 m elevation and one at 990 m. The first fissure was no longer active when viewed during an overflight 2.5 hours after it had opened. The flows moved rapidly until reaching the lower slope areas of the Grand Brule about 1.5-2 km downstream of the "Piton Tremblet" area. On 26 October only one vent was active with fountains 10-20 m high (figure 190). The lava discharge rates during the eruption averaged about 14 m3/s. The eruption ended at 1630 local time on 27 October after one hour of "gas piston" activity (figure 191). A total of about 1.8 million m3 of lava was emitted. The flows from the 990 m elevation site reached a maximum length of 3.6 km, and the lava flow front stopped about 230 m before reaching the RN2 National road (figure 192).
Geologic Background. Piton de la Fournaise is a massive basaltic shield volcano on the French island of Réunion in the western Indian Ocean. Much of its more than 530,000-year history overlapped with eruptions of the deeply dissected Piton des Neiges shield volcano to the NW. Three scarps formed at about 250,000, 65,000, and less than 5,000 years ago by progressive eastward slumping, leaving caldera-sized embayments open to the E and SE. Numerous pyroclastic cones are present on the floor of the scarps and their outer flanks. Most recorded eruptions have originated from the summit and flanks of Dolomieu, a 400-m-high lava shield that has grown within the youngest scarp, which is about 9 km wide and about 13 km from the western wall to the ocean on the E side. More than 150 eruptions, most of which have produced fluid basaltic lava flows, have occurred since the 17th century. Only six eruptions, in 1708, 1774, 1776, 1800, 1977, and 1986, have originated from fissures outside the scarps.
Information Contacts: Observatoire Volcanologique du Piton de la Fournaise, Institut de Physique du Globe de Paris (OVPF-IPGP), 14 route nationale 3, 27 ème km, 97418 La Plaine des Cafres, La Réunion, France (URL: http://www.ipgp.fr/fr); MIROVA (Middle InfraRed Observation of Volcanic Activity), a collaborative project between the Universities of Turin and Florence (Italy) supported by the Centre for Volcanic Risk of the Italian Civil Protection Department (URL: http://www.mirovaweb.it/); Global Sulfur Dioxide Monitoring Page, Atmospheric Chemistry and Dynamics Laboratory, NASA Goddard Space Flight Center (NASA/GSFC), 8800 Greenbelt Road, Goddard, Maryland, USA (URL: https://so2.gsfc.nasa.gov/).
Karymsky (Russia) — November 2019 Cite this Report
Karymsky
Russia
54.049°N, 159.443°E; summit elev. 1513 m
All times are local (unless otherwise noted)
Moderate explosive activity with ash plumes through 24 September 2019
Eruptive activity at Karymsky has been frequent since 1996, with moderate ash explosions, gas-and-steam emissions, and thermal anomalies. The latest eruptive period began in mid-February 2019 (BGVN 44:05) when explosions resumed after more than four months of quiet, producing an ash plume that extended 55 km downwind. Intermittent explosive activity continued until 24 September 2019. The volcano is monitored by the Kamchatka Volcanic Eruptions Response Team (KVERT).
Ash plumes were reported during the second half of February and the first half of March 2019 (BGVN 44:05). During May-September 2019 similar activity continued, with ash plumes being generated at least every few days (table 12). Though not included in the weekly KVERT report as notable events, obvious ash plumes were also seen in Sentinel-2 imagery on 22 July and photographed from an aircraft on 23 July. Volcanologists doing fieldwork on 14 August observed an ash plume rising to 5 km altitude (figure 44). A week later, during 20-22 August, explosions generated ash plumes as high as 6 km altitude that were visible in satellite imagery (figure 45). Although not noted in KVERT reports, a photo from 9 September showed a plume blowing downwind directly from the summit crater (figure 46). No significant ash plumes were reported by KVERT after 24 August, but the last ash explosion was recorded on 24 September.
Table 12. Notable ash plumes reported from Karymsky during May-October 2019. All dates are in UTC. Courtesy of KVERT.
| Date |
Observations |
| 06-07 May 2019 |
Gas-and-steam plume containing ash rose to 2-2.2 km in altitude and drifted 105 km SE and SW. |
| 21 May 2019 |
Ash plume drifted 9 km SW. |
| 24 May 2019 |
Ash plume identified in satellite images drifted 45 km NE. |
| 13-17 Jul 2019 |
Ash plumes drifted 60 km in multiple directions. |
| 25 Jul 2019 |
Ash plume drifted 134 km SE. |
| 26 Jul 2019 |
Ash plume drifted 60 km SE. |
| 03-05 Aug 2019 |
Ash plumes drifted 180 km SE and NW. |
| 06 Aug 2019 |
Ash plume rose 2-2.5 km in altitude and drifted about 17 km NW. |
| 14 Aug 2019 |
Volcanologists observed explosions and ash plumes that rose to 5 km altitude. Satellite images showed ash plumes drifting E and SSE that same day. |
| 20-22 Aug 2019 |
Ash plumes visible in satellite images drifted 500 km SW. Explosions on 21 August produced ash plumes to 6 km altitude. |
| 23-24 Aug 2019 |
Ash plumes drifted 51 km SE. |
During May-October 2019, thermal anomalies were detected with the MODIS satellite instruments analyzed using the MODVOLC algorithm only on 25 July (2 pixels) and 21 August (10 pixels). Consistent with both observations, KVERT noted ash explosions on those dates. The MIROVA (Middle InfraRed Observation of Volcanic Activity) volcano hotspot detection system, also based on analysis of MODIS data, detected numerous hotspots in May, none in June, 3 in July, 5 in August, and none in September or October. KVERT reported that a thermal anomaly was visible in satellite images on most, if not all, days when not obscured by clouds.
The Aviation Color Code remained at Orange (the second highest level on a four-color scale) until 3 October, when KVERT reduced it to Yellow, after which moderate gas-and-steam activity continued.
Geologic Background. Karymsky, the most active volcano of Kamchatka's eastern volcanic zone, is a symmetrical stratovolcano constructed within a 5-km-wide caldera that formed during the early Holocene. The caldera cuts the south side of the Pleistocene Dvor volcano and is located outside the north margin of the large mid-Pleistocene Polovinka caldera, which contains the smaller Akademia Nauk and Odnoboky calderas. Most seismicity preceding Karymsky eruptions originated beneath Akademia Nauk caldera, located immediately south. The caldera enclosing Karymsky formed about 7600-7700 radiocarbon years ago; construction of the stratovolcano began about 2000 years later. The latest eruptive period began about 500 years ago, following a 2300-year quiescence. Much of the cone is mantled by lava flows less than 200 years old. Historical eruptions have been vulcanian or vulcanian-strombolian with moderate explosive activity and occasional lava flows from the summit crater.
Information Contacts: Kamchatka Volcanic Eruptions Response Team (KVERT), Far Eastern Branch, Russian Academy of Sciences, 9 Piip Blvd., Petropavlovsk-Kamchatsky, 683006, Russia (URL: http://www.kscnet.ru/ivs/kvert/); Institute of Volcanology and Seismology, Far Eastern Branch, Russian Academy of Sciences (IVS FEB RAS), 9 Piip Blvd., Petropavlovsk-Kamchatsky 683006, Russia (URL: http://www.kscnet.ru/ivs/eng/); Hawai'i Institute of Geophysics and Planetology (HIGP) - MODVOLC Thermal Alerts System, School of Ocean and Earth Science and Technology (SOEST), Univ. of Hawai'i, 2525 Correa Road, Honolulu, HI 96822, USA (URL: http://modis.higp.hawaii.edu/); MIROVA (Middle InfraRed Observation of Volcanic Activity), a collaborative project between the Universities of Turin and Florence (Italy) supported by the Centre for Volcanic Risk of the Italian Civil Protection Department (URL: http://www.mirovaweb.it/); Sentinel Hub Playground (URL: https://www.sentinel-hub.com/explore/sentinel-playground).
Mayon (Philippines) — November 2019 Cite this Report
Mayon
Philippines
13.257°N, 123.685°E; summit elev. 2462 m
All times are local (unless otherwise noted)
Gas-and-steam plumes and summit incandescence during May-October 2019
Mayon, located in the Philippines, is a highly active stratovolcano with recorded historical eruptions dating back to 1616. The most recent eruptive episode began in early January 2018 that consisted of phreatic explosions, steam-and-ash plumes, lava fountaining, and pyroclastic flows (BGVN 43:04). The previous report noted small but distinct thermal anomalies, gas-and-steam plumes, and slight inflation (BGVN 44:05) that continued to occur from May into mid-October 2019. This report includes information based on daily bulletins from the Philippine Institute of Volcanology and Seismology (PHIVOLCS) and Sentinel-2 satellite imagery.
Between May and October 2019, white gas-and-steam plumes rose to a maximum altitude of 800 m on 17 May. PHIVOLCS reported that faint summit incandescence was frequently observed at night from May-July and Sentinel-2 thermal satellite imagery showed weaker thermal anomalies in September and October (figure 49); the last anomaly was identified on 12 October. Average SO2 emissions as measured by PHIVOLCS generally varied between 469-774 tons/day; the high value of the period was on 25 July, with 1,171 tons/day. Small SO2 plumes were detected by the TROPOMI satellite instrument a few times during May-September 2019 (figure 50).
Continuous GPS data has shown slight inflation since June 2018, corroborated by precise leveling data taken on 9-17 April, 16-25 July, and 23-30 October 2019. Elevated seismicity and occasional rockfall events were detected by the seismic monitoring network from PHIVOLCS from May to July; recorded activity decreased in August. Activity reported by PHIVOLCS in September-October 2019 consisted of frequent gas-and-steam emissions, two volcanic earthquakes, and no summit incandescence.
Geologic Background. Symmetrical Mayon, which rises above the Albay Gulf NW of Legazpi City, is the most active volcano of the Philippines. The steep upper slopes are capped by a small summit crater. Recorded eruptions since 1616 CE range from Strombolian to basaltic Plinian, with cyclical activity beginning with basaltic eruptions, followed by longer periods of andesitic lava flows. Eruptions occur predominately from the central conduit and have also produced lava flows that travel far down the flanks. Pyroclastic density currents and mudflows have commonly swept down many of the approximately 40 ravines that radiate from the summit and have often damaged populated lowland areas. A violent eruption in 1814 killed more than 1,200 people and devastated several towns.
Information Contacts: Philippine Institute of Volcanology and Seismology (PHIVOLCS), Department of Science and Technology, University of the Philippines Campus, Diliman, Quezon City, Philippines (URL: http://www.phivolcs.dost.gov.ph/); Sentinel Hub Playground (URL: https://www.sentinel-hub.com/explore/sentinel-playground); Global Sulfur Dioxide Monitoring Page, Atmospheric Chemistry and Dynamics Laboratory, NASA Goddard Space Flight Center (NASA/GSFC), 8800 Greenbelt Road, Goddard, Maryland, USA (URL: https://SO2.gsfc.nasa.gov/).
Sarychev Peak (Russia) — November 2019 Cite this Report
Sarychev Peak
Russia
48.092°N, 153.2°E; summit elev. 1496 m
All times are local (unless otherwise noted)
Ash plume on 11 August; thermal anomalies from late May to early October 2019
Sarychev Peak, located on Matua Island in the central Kurile Islands of Russia, has had eruptions reported since 1765. Renewed activity began in October 2017, followed by a major eruption in June 2009 that included pyroclastic flows and ash plumes (BGVN 43:11 and 34:06). Thermal anomalies, explosions, and ash plumes took place between September and October 2018. A single ash explosion occurred in May 2019. Another ash plume was seen on 11 August, and small thermal anomalies were present in infrared imagery during June-October 2019. Information is provided by the Sakhalin Volcanic Eruption Response Team (SVERT) and the Tokyo Volcanic Ash Advisory Center (VAAC), with satellite imagery from Sentinel-2.
Satellite images from Sentinel-2 showed small white plumes from Sarychev Peak during clear weather on 4 and 14 August 2019 (figure 27); similar plumes were observed on a total of nine clear weather days between late June and October 2019. According to SVERT and the Tokyo VAAC, satellite data from HIMAWARI-8 showed an ash plume rising to an altitude of 2.7 km and drifting 50 km SE on 11 August. It was visible for a few days before dissipating. No further volcanism was detected by SVERT, and no activity was evident in a 17 August Sentinel-2 image (figure 27).
Intermittent weak thermal anomalies were detected by the MIROVA system using MODIS data from late May through 7 October 2019 (figure 28). Sentinel-2 satellite imagery from 28 June, 13 and 23 July, 9 August, and 21 October showed a very small thermal anomaly, but on 28 September a pronounced thermal anomaly was visible (figure 29). No additional thermal anomalies were identified from any source after 7 October through the end of the month.
Geologic Background. Sarychev Peak, one of the most active volcanoes of the Kuril Islands, occupies the NW end of Matua Island in the central Kuriles. The andesitic central cone was constructed within a 3-3.5-km-wide caldera, whose rim is exposed only on the SW side. A dramatic 250-m-wide, very steep-walled crater with a jagged rim caps the volcano. The substantially higher SE rim forms the 1496 m high point of the island. Fresh-looking lava flows, prior to activity in 2009, had descended in all directions, often forming capes along the coast. Much of the lower-angle outer flanks of the volcano are overlain by pyroclastic-flow deposits. Eruptions have been recorded since the 1760s and include both quiet lava effusion and violent explosions. Large eruptions in 1946 and 2009 produced pyroclastic flows that reached the sea.
Information Contacts: Sakhalin Volcanic Eruption Response Team (SVERT), Institute of Marine Geology and Geophysics, Far Eastern Branch, Russian Academy of Science, Nauki st., 1B, Yuzhno-Sakhalinsk, Russia, 693022 (URL: http://www.imgg.ru/en/, http://www.imgg.ru/ru/svert/reports); Tokyo Volcanic Ash Advisory Center (VAAC), 1-3-4 Otemachi, Chiyoda-ku, Tokyo, Japan (URL: http://ds.data.jma.go.jp/svd/vaac/data/); MIROVA (Middle InfraRed Observation of Volcanic Activity), a collaborative project between the Universities of Turin and Florence (Italy) supported by the Centre for Volcanic Risk of the Italian Civil Protection Department (URL: http://www.mirovaweb.it/); Sentinel Hub Playground (URL: https://www.sentinel-hub.com/explore/sentinel-playground).
Sheveluch (Russia) — November 2019 Cite this Report
Sheveluch
Russia
56.653°N, 161.36°E; summit elev. 3283 m
All times are local (unless otherwise noted)
Frequent ash explosions and lava dome growth continue through October 2019
After a lull in activity at Sheveluch, levels intensified again in mid-December 2018 and remained high through April 2019, with lava dome growth, strong explosions that produced ash plumes, incandescent lava flows, hot avalanches, numerous thermal anomalies, and strong fumarolic activity (BGVN 44:05). This report summarizes activity between May and October 2019. The volcano is monitored by the Kamchatka Volcanic Eruptions Response Team (KVERT).
According to KVERT, explosive activity continued to generate ash plumes during May-October 2019 (table 13). Strong fumarolic activity, incandescence and growth of the lava dome, and hot avalanches accompanied this process. There were also reports of plumes caused by re-suspended ash rather than new explosions. Plumes frequently extended a few hundred kilometers downwind, with the longest ones remaining visible in imagery as much as 1,000-1,400 km away. One of the larger explosions, on 1 October (figure 52), also generated a pyroclastic flow. Some of the stronger explosions sent the plume to an altitude of 10-11 km, or more than 7 km above the summit. The Aviation Color Code remained at Orange (the second highest level on a four-color scale) throughout the reporting period, except for several hours on 6 October when it was raised to Red (the highest level).
Table 13. Explosions and ash plumes at Sheveluch during May-October 2019. Dates and times are UTC, not local. Data courtesy of KVERT.
| Dates |
Plume altitude (km) |
Drift Distance and Direction |
Remarks |
| 30 Apr-02 May 2019 |
-- |
200 km SE |
Resuspended ash. |
| 03-10 May 2019 |
-- |
50 km SE, SW |
Gas-and-steam plumes containing some ash. |
| 13 May 2019 |
-- |
16 km SE |
Resuspended ash. |
| 11-12 Jun 2019 |
-- |
60 km WNW |
Explosions and hot avalanches seen in video and satellite images. |
| 24, 27 Jun 2019 |
4.5 |
E, W |
Ash plumes. |
| 05 Aug 2019 |
2.5 |
40 km NW |
Diffuse ash plume. |
| 25 Aug 2019 |
4.5-5 |
500 km NW |
Ash plumes. |
| 29 Aug 2019 |
10 |
Various; 550 km N |
Explosions at 1510 produced ash plumes. |
| 30 Aug 2019 |
7-7.5 |
50 km SSE |
Explosions at 1957 produced ash plumes. |
| 03 Sep 2019 |
5.5 |
SE |
-- |
| 02-03, 05 Sep 2019 |
10 |
660 km SE |
Ash plumes seen in satellite images. |
| 05 Sep 2019 |
-- |
-- |
Resuspended ash. |
| 11-12 Sep 2019 |
-- |
250 km ESE |
Resuspended ash plumes. Satellite and webcam data recorded ash emissions and a gas-and-steam plume with some ash drifting 50 km ESE on 12 Sep. |
| 12-15, 17, 19 Sep 2019 |
-- |
200 km SW, SE, NE |
Ash plumes. |
| 20-21, 23, 26 Sep 2019 |
7 |
580 km ESE |
Explosions produced ash plumes. |
| 29 Sep, 01-02 Oct 2019 |
9 |
1,400 km SE, E |
Explosions produced ash plumes. Notable pyroclastic flow traveled SE on 1 Oct. |
| 04 Oct 2019 |
-- |
170 km E |
Resuspended ash. |
| 06 Oct 2019 |
10 |
430 km NE; 1,080 km ENE |
Ash plumes. Aviation Color Code raised to Red for several hours. |
| 08 Oct 2019 |
-- |
170 km E |
Resuspended ash. |
| 06, 09 Oct 2019 |
6.5-11 |
1,100 km E |
-- |
| 11-13, 15 Oct 2019 |
6.5-7 |
620 km E, SE |
Explosions produced ash plumes. |
| 16-17 Oct 2019 |
-- |
125 km E |
Resuspended ash. |
| 19-20 Oct 2019 |
-- |
110 km SE |
Resuspended ash. |
| 21 Oct 2019 |
10-11 |
1,300 km SE |
Explosions produced ash plumes. |
Numerous thermal anomalies, based on MODIS satellite instruments analyzed using the MODVOLC algorithm, were observed every month. Consistent with this, the MIROVA (Middle InfraRed Observation of Volcanic Activity) system recorded thermal anomalies almost daily. According to KVERT, a thermal anomaly over Sheveluch was identified in satellite images during the entire reporting period, although cloudy weather sometimes obscured observations.
Geologic Background. The high, isolated massif of Sheveluch volcano (also spelled Shiveluch) rises above the lowlands NNE of the Kliuchevskaya volcano group. The 1,300 km3 andesitic volcano is one of Kamchatka's largest and most active volcanic structures, with at least 60 large eruptions during the Holocene. The summit of roughly 65,000-year-old Stary Shiveluch is truncated by a broad 9-km-wide late-Pleistocene caldera breached to the south. Many lava domes occur on its outer flanks. The Molodoy Shiveluch lava dome complex was constructed during the Holocene within the large open caldera; Holocene lava dome extrusion also took place on the flanks of Stary Shiveluch. Widespread tephra layers from these eruptions have provided valuable time markers for dating volcanic events in Kamchatka. Frequent collapses of dome complexes, most recently in 1964, have produced debris avalanches whose deposits cover much of the floor of the breached caldera.
Information Contacts: Kamchatka Volcanic Eruptions Response Team (KVERT), Far Eastern Branch, Russian Academy of Sciences, 9 Piip Blvd., Petropavlovsk-Kamchatsky, 683006, Russia (URL: http://www.kscnet.ru/ivs/kvert/); Institute of Volcanology and Seismology, Far Eastern Branch, Russian Academy of Sciences (IVS FEB RAS), 9 Piip Blvd., Petropavlovsk-Kamchatsky 683006, Russia (URL: http://www.kscnet.ru/ivs/eng/); Hawai'i Institute of Geophysics and Planetology (HIGP) - MODVOLC Thermal Alerts System, School of Ocean and Earth Science and Technology (SOEST), Univ. of Hawai'i, 2525 Correa Road, Honolulu, HI 96822, USA (URL: http://modis.higp.hawaii.edu/); MIROVA (Middle InfraRed Observation of Volcanic Activity), a collaborative project between the Universities of Turin and Florence (Italy) supported by the Centre for Volcanic Risk of the Italian Civil Protection Department (URL: http://www.mirovaweb.it/).
Turrialba (Costa Rica) — November 2019 Cite this Report
Turrialba
Costa Rica
10.025°N, 83.767°W; summit elev. 3340 m
All times are local (unless otherwise noted)
Activity diminishes during March-October 2019, but small ash emissions continue
This report summarizes activity at Turrialba during March-October 2019. Typical activity similar to that reported in late 2018 and early 2019 (BGVN 44:04) included periodic weak ash explosions and numerous emissions containing some ash. However, during this period activity appeared to diminish with time. Data were provided by weekly reports by the Observatorio Vulcanologico Sismologica de Costa Rica-Universidad Nacional (OVSICORI-UNA).
According to OVSICORI-UNA, only highly diluted ash emissions were recorded from 22 April to 27 May (note that no reports were available online from the last week of March until 22 April). Weak ash explosions were again noted on 28 July, 4 August, and possibly on 20 October. OVSICORI-UNA reported more explosions or emissions containing ash on 25 and 28 October (table 9).
Table 9. Summary of reported activity at Turrialba, March-October 2019. Cloudy weather sometimes obscured observations. Maximum plume height is above the crater rim. Information courtesy of OVSICORI-UNA.
| Date |
Time |
Max plume height |
Plume drift |
Remarks |
| 01 Mar 2019 |
0444 |
200 m |
NE |
-- |
| 02-04 Mar 2019 |
-- |
200-300 m |
-- |
Continuous emissions with minor amounts of ash. |
| 09-12 Mar 2019 |
-- |
1,000 m |
-- |
Gas plumes containing minor amounts of ash. |
| 16-17 Mar 2019 |
-- |
-- |
-- |
Frequent and discontinuous emissions, but no visual confirmation due to poor visibility. |
| 20-22 Mar 2019 |
-- |
300 m |
W, SW |
Continuous emissions of steam with periodic pulses of diffuse ash; sulfur odor noted in Tierra Blanca de Cartago on 22 March. |
| 23-26 Mar 2019 |
-- |
-- |
-- |
Steam plumes with low concentration of magmatic gases. |
| 24 Mar 2019 |
0503 |
500 m |
-- |
Series of four pulses with ash. |
| 31 Mar 2019 |
0735 |
-- |
-- |
Explosion followed by passive emissions with low concentration of magmatic gases. Seismicity dominated by low-frequency events. |
| 08 Apr 2019 |
-- |
-- |
-- |
Minor ash emissions. |
| 24 Apr 2019 |
-- |
-- |
-- |
Diffuse ash emission. |
| 26 Apr 2019 |
-- |
-- |
N |
Emission with low ash content. |
| 27 Apr 2019 |
0722 |
below 100 m |
-- |
Weak, brief explosion with ash plume. |
| 04 May 2019 |
0524 |
-- |
-- |
Emission of very diluted ash. |
| 12-19 May 2019 |
-- |
-- |
-- |
Passive, short-duration emissions with small amounts of ash occurred sporadically. |
| 19-20 May 2019 |
-- |
-- |
-- |
Prolonged and intermittent periods of emissions with minor amounts of ash. |
| 28 Jul 2019 |
1441 |
-- |
-- |
Weak explosion and ash emission after 30 minutes of heavy rain. Inclement weather prevented visual confirmation. Ashfall in La Picada (N) and El Retiro farms. |
| 03-04 Aug 2019 |
-- |
-- |
-- |
Two small explosions, with some ash in the second. |
| 11 Aug 2019 |
-- |
-- |
-- |
Weak emission during night, identified by its seismic signal. No ash emission observed. |
| 05 Aug-19 Oct 2019 |
-- |
-- |
-- |
No ash detected. |
| 20 Oct 2019 |
2100 |
-- |
-- |
Explosion identified with seismicity; weather conditions prevented visual observation. No ashfall reported. |
| 25 Oct 2019 |
0400, 0700 |
-- |
-- |
Weak explosion at 0400, with ash. Ash at 0700 not associated with seismic signal, so could be a small intra-crater collapse. |
| 28 Oct 2019 |
1500 |
-- |
-- |
Weak emission containing ash. |
A report from Red Sismologica Nacional (RSN) about the 28 October ash explosion noted that it occurred at 1501 local time and lasted about 5 minutes. There were no reports of ashfall, but the crater webcam captured the small plume rising from the active vent. Incandescence in the active crater continued to be seen on the monitoring cameras.
Geologic Background. Turrialba, the easternmost of Costa Rica's Holocene volcanoes, is a large vegetated basaltic-to-dacitic stratovolcano located across a broad saddle NE of Irazú volcano overlooking the city of Cartago. The massive edifice covers an area of 500 km2. Three well-defined craters occur at the upper SW end of a broad 800 x 2200 m summit depression that is breached to the NE. Most activity originated from the summit vent complex, but two pyroclastic cones are located on the SW flank. Five major explosive eruptions have occurred during the past 3500 years. A series of explosive eruptions during the 19th century were sometimes accompanied by pyroclastic flows. Fumarolic activity continues at the central and SW summit craters.
Information Contacts: Observatorio Vulcanologico Sismologica de Costa Rica-Universidad Nacional (OVSICORI-UNA), Apartado 86-3000, Heredia, Costa Rica (URL: http://www.ovsicori.una.ac.cr/); Red Sismologica Nacional (RSN) a collaboration between a) the Sección de Sismología, Vulcanología y Exploración Geofísica de la Escuela Centroamericana de Geología de la Universidad de Costa Rica (UCR), and b) the Área de Amenazas y Auscultación Sismológica y Volcánica del Instituto Costarricense de Electricidad (ICE), Costa Rica (URL: https://rsn.ucr.ac.cr/).
Unnamed
Tonga
18.325°S, 174.365°W; summit elev. -40 m
All times are local (unless otherwise noted)
Submarine eruption in early August creates pumice rafts that drifted west to Fiji
Large areas of floating pumice, termed rafts, were encountered by sailors in the northern Tonga region approximately 80 km NW of Vava'u starting around 9 August 2019; the pumice reached the western islands of Fiji by 9 October (figure 7). Pumice rafts are floating masses of individual clasts ranging from millimeters to meters in diameter. The pumice clasts form when silicic magma is degassing, forming bubbles as it rises to the surface, which then rapidly cools to form solid rock. The isolated vesicles formed by the bubbles provide buoyancy to the rock and in turn, the entire pumice raft. These rafts are spread and carried by currents across the ocean; rafts originating in the Tonga area can eventually reach Australia. This report summarizes the pumice raft eruption from early August 2019 using witness accounts and satellite images (acquisition dates are given in UTC). Pending further research, the presumed source is the unnamed Tongan seamount (volcano number 243091) about 45 km NW of Vava'u, the origin of an earlier pumice raft produced during an eruption in 2001.
The first sighting of pumice was around 1430 on 9 August NW of Vava'u in Tonga (18° 22.068' S, 174° 50.800' W), when Shannon Lenz and Tom Whitehead on board SV Finely Finished initially encountered isolated rocks and smaller streaks of pumice clasts. The area covered by rock increasing to a raft with an estimated thickness of at least 15 cm that extended to the horizon in different directions, and which took 6-8 hours to cross (figure 8). There was no sulfur smell and the sound was described as a "cement mixer, especially below deck." There was also no plume or incandescence observed. Their video, posted to YouTube on 17 August, showed a thin surface layer of cohesive interconnected irregular streaks of pumice with the ocean surface still visible between them. Later footage showed a continuous, undulating mass of pumice entirely covering the ocean surface. Larger clasts are visible scattered throughout the raft. The pumice raft was visible in satellite imagery on this day NW of Late Island (figure 9). By 11 August the raft had evolved into a largely linear feature with smaller rafts to the SW (figure 10). Approximately four hours later, about 15 km to the WSW, Rachel Mackie encountered the pumice. Initially the pumice was "ribbons several hundred meters long and up to 20m wide. It was quite fine and like a slick across the surface of the water." By 2130 they were surrounded by the pumice, and around 25 km away the smell of sulfur was noted.
Michael and Larissa Hoult aboard the catamaran ROAM encountered the raft on 15 August (figure 11). They initially saw isolated clasts ranging from marble to tennis ball size (15-70 mm) at 18° 46′S, 174° 55'W. At around 0700 UTC (1900 local time) they noted the smell of sulfur at 18° 55′S, 175° 21′W, and by 0800 UTC they were immersed in the raft with visible clasts ranging from marble to basketball (25 cm) sizes. At this point the raft was entirely obscuring the ocean surface. On 16 and 21 August the pumice continued to disperse and drift NW (figures 12 and 13). On 20 August Scott Bryan calculated an average drift rate of around 13 km/day, with the pumice on this date about 164 km W of the unnamed seamount.
An online article published by Brad Scott at GeoNet on 9 September reported the preliminary size of the raft to be 60 km2, significantly smaller than the 2012 Havre seamount pumice raft that was 400 km2. Satellite identification of pumice-covered areas by GNS scientists showed the material moving SSW through 14 August (figure 14).
On 5 September the Maritime Safety Authority of Fiji (MSAF) issued a notice to mariners stating that the pumice was sighted in the vicinity of Lakeba, Oneata, and Aiwa Islands and was moving to the W. On 6 September a Planet Labs satellite image shows pumice encompassing the Fijian island of Lakeba over 450 km W of the Tongan islands (figure 15). The pumice entered the lagoon within the barrier reef and drifted around the island to continue towards the W. The pumice was imaged by the Landsat 8 satellite on 26 September as it moved through the Fijian islands, approximately 760 km away from its source (figure 16). The pumice is segmented into numerous smaller rafts of varying sizes that stretch over at least 140 km. On 12 September the Fiji Sun reported that the pumice had reached some of the Lau islands and was thick enough near the shore for people to stand on it.
Pumice had reached the Yasawa islands in western Fiji by 29 September and was beginning to fill the eastern bays (figure 17). By 9 October bays had been filled out to 500-600 m from the shore, and pumice had also passed through the islands to continue towards the W (figure 18). At this point the pumice beyond the islands had broken up into linear segments that continued towards the NW.
Geologic Background. A submarine volcano along the Tofua volcanic arc ~45 km NW of Vava'u Island was first observed in September 2001, ~35 km S of Fonualei and 60 km NE of Late volcano. The site of the eruption is at an approximate bathymetric depth of 300 m. T-phase waves were recorded on 27-28 September 2001, and on the 27th local fishermen observed an ash-rich eruption column that rose above the ocean surface. No eruptive activity was reported after the 28th, but water discoloration was documented the following month. In early November rafts and strandings of dacitic pumice were reported along the coasts of Kadavu and Viti Levu in Fiji. The depth of the summit of the submarine cone following the eruption was determined to be 40 m during a 2007 survey; the crater of the 2001 eruption was open to the E.
Information Contacts: GNS Science, Wairakei Research Centre, Private Bag 2000, Taupo 3352, New Zealand (URL: http://www.gns.cri.nz/); Salman Ashraf, GNS Science, Wairakei Research Centre, Private Bag 2000, Taupo 3352, New Zealand (URL: http://www.gns.cri.nz/, https://www.geonet.org.nz/news/8RnSKdhaWOEABBIh0bHDj); Brad Scott, New Zealand GeoNet Project, a collaboration between the Earthquake Commission and GNS Science, Wairakei Research Centre, Private Bag 2000, Taupo 3352, New Zealand (URL: http://www.geonet.org.nz/, https://www.geonet.org.nz/news/8RnSKdhaWOEABBIh0bHDj); Scott Bryan, School of Earth, Environmental & Biological Sciences, Science and Engineering Faculty, Queensland University of Technology, R Block Level 2, 204, Gardens Point (URL: https://staff.qut.edu.au/staff/scott.bryan); Shannon Lenz and Tom Whitehead, SV Finely Finished (URL: https://www.noonsite.com/news/south-pacific-tonga-to-fiji-navigation-alert-dangerous-slick-of-volcanic-rubble/, YouTube: https://www.youtube.com/watch?v=PEsHLSFFQhQ); Michael and Larissa Hoult, Sail Surf ROAM (URL: https://www.facebook.com/sailsurfroam/); Rachel Mackie, OLIVE (URL: http://www.oliveocean.com/, https://www.facebook.com/rachel.mackie.718); Sentinel Hub Playground (URL: https://www.sentinel-hub.com/explore/sentinel-playground); Planet Labs, Inc. (URL: https://www.planet.com/); Fiji Sun (URL: https://fijisun.com.fj/2019/09/12/pumice-menace-hits-parts-of-lau-group/).