Recently Published Bulletin Reports
Erebus (Antarctica) Lava lake remains active; most thermal alerts recorded since 2019
Rincon de la Vieja (Costa Rica) Frequent phreatic explosions during July-December 2023
Bezymianny (Russia) Explosion on 18 October 2023 sends ash plume 8 km high; lava flows and incandescent avalanches
Kilauea (United States) Low-level lava effusions in the lava lake at Halema’uma’u during July-December 2022
Nyamulagira (DR Congo) Lava flows and thermal activity during May-October 2023
Bagana (Papua New Guinea) Explosions, ash plumes, ashfall, and lava flows during April-September 2023
Mayon (Philippines) Lava flows, pyroclastic flows, ash emissions, and seismicity during April-September 2023
Nishinoshima (Japan) Eruption plumes and gas-and-steam plumes during May-August 2023
Krakatau (Indonesia) White gas-and-steam plumes and occasional ash plumes during May-August 2023
Villarrica (Chile) Strombolian activity, gas-and-ash emissions, and crater incandescence during April-September 2023
Merapi (Indonesia) Frequent incandescent avalanches during April-September 2023
Ebeko (Russia) Moderate explosive activity with ash plumes continued during June-November 2023
Erebus (Antarctica) — January 2024  Cite this Report
Erebus
Antarctica
77.53°S, 167.17°E; summit elev. 3794 m
All times are local (unless otherwise noted)
Lava lake remains active; most thermal alerts recorded since 2019
The lava lake in the summit crater of Erebus has been active since at least 1972. Located in Antarctica overlooking the McMurdo Station on Ross Island, it is the southernmost active volcano on the planet. Because of the remote location, activity is primarily monitored by satellites. This report covers activity during 2023.
The number of thermal alerts recorded by the Hawai'i Institute of Geophysics and Planetology’s MODVOLC Thermal Alerts System increased considerably in 2023 compared to the years 2020-2022 (table 9). In contrast to previous years, the MODIS instruments aboard the Aqua and Terra satellites captured data from Erebus every month during 2023. Consistent with previous years, the lowest number of anomalous pixels were recorded in January, November, and December.
Table 9. Number of monthly MODIS-MODVOLC thermal alert pixels recorded at Erebus during 2017-2023. See BGVN 42:06 for data from 2000 through 2016. The table was compiled using data provided by the HIGP – MODVOLC Thermal Alerts System.
| Year |
Jan |
Feb |
Mar |
Apr |
May |
Jun |
Jul |
Aug |
Sep |
Oct |
Nov |
Dec |
SUM |
| 2017 |
0 |
21 |
9 |
0 |
0 |
1 |
11 |
61 |
76 |
52 |
0 |
3 |
234 |
| 2018 |
0 |
21 |
58 |
182 |
55 |
17 |
137 |
172 |
103 |
29 |
0 |
0 |
774 |
| 2019 |
2 |
21 |
162 |
151 |
55 |
56 |
75 |
53 |
29 |
19 |
1 |
0 |
624 |
| 2020 |
0 |
2 |
16 |
18 |
4 |
4 |
1 |
3 |
18 |
3 |
1 |
6 |
76 |
| 2021 |
0 |
9 |
1 |
0 |
2 |
56 |
46 |
47 |
35 |
52 |
5 |
3 |
256 |
| 2022 |
1 |
13 |
55 |
22 |
15 |
32 |
39 |
19 |
31 |
11 |
0 |
0 |
238 |
| 2023 |
2 |
33 |
49 |
82 |
41 |
32 |
70 |
64 |
42 |
17 |
5 |
11 |
448 |
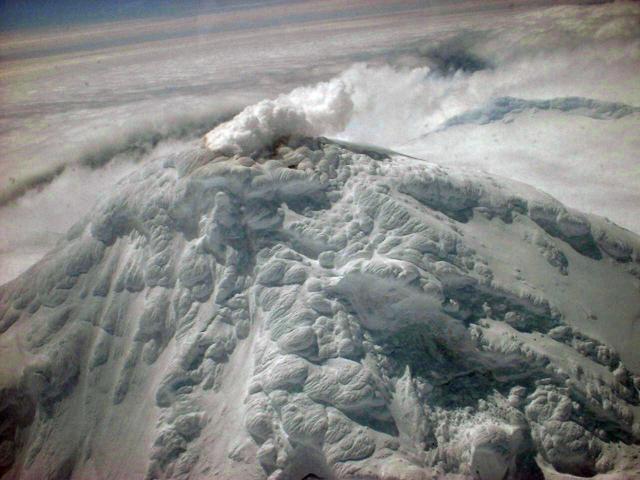
Sentinel-2 infrared images showed one or two prominent heat sources within the summit crater, accompanied by adjacent smaller sources, similar to recent years (see BGVN 46:01, 47:02, and 48:01). A unique image was obtained on 25 November 2023 by the OLI-2 (Operational Land Imager-2) on Landsat 9, showing the upper part of the volcano surrounded by clouds (figure 32).
Geologic Background. Mount Erebus, the world's southernmost historically active volcano, overlooks the McMurdo research station on Ross Island. It is the largest of three major volcanoes forming the crudely triangular Ross Island. The summit of the dominantly phonolitic volcano has been modified by one or two generations of caldera formation. A summit plateau at about 3,200 m elevation marks the rim of the youngest caldera, which formed during the late-Pleistocene and within which the modern cone was constructed. An elliptical 500 x 600 m wide, 110-m-deep crater truncates the summit and contains an active lava lake within a 250-m-wide, 100-m-deep inner crater; other lava lakes are sometimes present. The glacier-covered volcano was erupting when first sighted by Captain James Ross in 1841. Continuous lava-lake activity with minor explosions, punctuated by occasional larger Strombolian explosions that eject bombs onto the crater rim, has been documented since 1972, but has probably been occurring for much of the volcano's recent history.
Information Contacts: Hawai'i Institute of Geophysics and Planetology (HIGP) - MODVOLC Thermal Alerts System, School of Ocean and Earth Science and Technology (SOEST), Univ. of Hawai'i, 2525 Correa Road, Honolulu, HI 96822, USA (URL: http://modis.higp.hawaii.edu/); Copernicus Browser, Copernicus Data Space Ecosystem, European Space Agency (URL: https://dataspace.copernicus.eu/browser/); NASA Earth Observatory, EOS Project Science Office, NASA Goddard Space Flight Center, Goddard, Maryland, USA (URL: https://earthobservatory.nasa.gov/images/152134/erebus-breaks-through).
Rincon de la Vieja (Costa Rica) — January 2024 Cite this Report
Rincon de la Vieja
Costa Rica
10.83°N, 85.324°W; summit elev. 1916 m
All times are local (unless otherwise noted)
Frequent phreatic explosions during July-December 2023
Rincón de la Vieja is a volcanic complex in Costa Rica with a hot convecting acid lake that exhibits frequent weak phreatic explosions, gas-and-steam emissions, and occasional elevated sulfur dioxide levels (BGVN 45:10, 46:03, 46:11). The current eruption period began June 2021. This report covers activity during July-December 2023 and is based on weekly bulletins and occasional daily reports from the Observatorio Vulcanologico Sismologica de Costa Rica-Universidad Nacional (OVSICORI-UNA).
Numerous weak phreatic explosions continued during July-December 2023, along with gas-and-steam emissions and plumes that rose as high as 3 km above the crater rim. Many weekly OVSICORI-UNA bulletins included the previous week's number of explosions and emissions (table 9). For many explosions, the time of explosion was given (table 10). Frequent seismic activity (long-period earthquakes, volcano-tectonic earthquakes, and tremor) accompanied the phreatic activity.
Table 9. Number of reported weekly phreatic explosions and gas-and-steam emissions at Rincón de la Vieja, July-December 2023. Counts are reported for the week before the Weekly Bulletin date; not all reports included these data. Courtesy of OVSICORI-UNA.
| OVSICORI Weekly Bulletin |
Number of explosions |
Number of emissions |
| 28 Jul 2023 |
6 |
14 |
| 4 Aug 2023 |
10 |
12 |
| 1 Sep 2023 |
13 |
11 |
| 22 Sep 2023 |
12 |
13 |
| 29 Sep 2023 |
6 |
11 |
| 6 Oct 2023 |
12 |
5 |
| 13 Oct 2023 |
7 |
9 |
| 20 Oct 2023 |
1 |
15 |
| 27 Oct 2023 |
3 |
23 |
| 3 Nov 2023 |
3 |
10 |
| 17 Nov 2023 |
0 |
Some |
| 24 Nov 2023 |
0 |
14 |
| 8 Dec 2023 |
4 |
16 |
| 22 Dec 2023 |
8 |
18 |
Table 10. Summary of activity at Rincón de la Vieja during July-December 2023. Weak phreatic explosions and gas emissions are noted where the time of explosion was indicated in the weekly or daily bulletins. Height of plumes or emissions are distance above the crater rim. Courtesy of OVSICORI-UNA.
| Date |
Time |
Description of Activity |
| 1 Jul 2023 |
0156 |
Explosion. |
| 2 Jul 2023 |
0305 |
Explosion. |
| 4 Jul 2023 |
0229, 0635 |
Event at 0635 produced a gas-and-steam plume that rose 700 m and drifted W; seen by residents in Liberia (21 km SW). |
| 9 Jul 2023 |
1843 |
Explosion. |
| 21 Jul 2023 |
0705 |
Explosion. |
| 26 Jul 2023 |
1807 |
Explosion. |
| 28 Jul 2023 |
0802 |
Explosion generated a gas-and-steam plume that rose 500 m. |
| 30 Jul 2023 |
1250 |
Explosion. |
| 31 Jul 2023 |
2136 |
Explosion. |
| 11 Aug 2023 |
0828 |
Explosion. |
| 18 Aug 2023 |
1304 |
Explosion. |
| 21 Aug 2023 |
1224 |
Explosion generated gas-and-steam plumes rose 500-600 m. |
| 22 Aug 2023 |
0749 |
Explosion generated gas-and-steam plumes rose 500-600 m. |
| 24 Aug 2023 |
1900 |
Explosion. |
| 25 Aug 2023 |
0828 |
Event produced a steam-and-gas plume that rose 3 km and drifted NW. |
| 27-28 Aug 2023 |
0813 |
Four small events; the event at 0813 on 28 August lasted two minutes and generated a steam-and-gas plume that rose 2.5 km. |
| 1 Sep 2023 |
1526 |
Explosion generated plume that rose 2 km and ejected material onto the flanks. |
| 2-3 Sep 2023 |
- |
Small explosions detected in infrasound data. |
| 4 Sep 2023 |
1251 |
Gas-and-steam plume rose 1 km and drifted W. |
| 7 Nov 2023 |
1113 |
Explosion. |
| 8 Nov 2023 |
0722 |
Explosion. |
| 12 Nov 2023 |
0136 |
Small gas emissions. |
| 14 Nov 2023 |
0415 |
Small gas emissions. |
According to OVSICORI-UNA, during July-October the average weekly sulfur dioxide (SO2) flux ranged from 68 to 240 tonnes/day. However, in mid-November the flux increased to as high as 334 tonnes/day, the highest value measured in recent years. The high SO2 flux in mid-November was also detected by the TROPOMI instrument on the Sentinel-5P satellite (figure 43).
Geologic Background. Rincón de la Vieja, the largest volcano in NW Costa Rica, is a remote volcanic complex in the Guanacaste Range. The volcano consists of an elongated, arcuate NW-SE-trending ridge constructed within the 15-km-wide early Pleistocene Guachipelín caldera, whose rim is exposed on the south side. Sometimes known as the "Colossus of Guanacaste," it has an estimated volume of 130 km3 and contains at least nine major eruptive centers. Activity has migrated to the SE, where the youngest-looking craters are located. The twin cone of Santa María volcano, the highest peak of the complex, is located at the eastern end of a smaller, 5-km-wide caldera and has a 500-m-wide crater. A Plinian eruption producing the 0.25 km3 Río Blanca tephra about 3,500 years ago was the last major magmatic eruption. All subsequent eruptions, including numerous historical eruptions possibly dating back to the 16th century, have been from the prominent active crater containing a 500-m-wide acid lake located ENE of Von Seebach crater.
Information Contacts: Observatorio Vulcanológico Sismológica de Costa Rica-Universidad Nacional (OVSICORI-UNA), Apartado 86-3000, Heredia, Costa Rica (URL: http://www.ovsicori.una.ac.cr/); NASA Global Sulfur Dioxide Monitoring Page, Atmospheric Chemistry and Dynamics Laboratory, NASA Goddard Space Flight Center (NASA/GSFC), 8800 Greenbelt Road, Goddard MD 20771, USA (URL: https://so2.gsfc.nasa.gov/).
Bezymianny (Russia) — November 2023 Cite this Report
Bezymianny
Russia
55.972°N, 160.595°E; summit elev. 2882 m
All times are local (unless otherwise noted)
Explosion on 18 October 2023 sends ash plume 8 km high; lava flows and incandescent avalanches
Bezymianny, located on Russia’s Kamchatka Peninsula, has had eruptions since 1955 characterized by dome growth, explosions, pyroclastic flows, ash plumes, and ashfall. Activity during November 2022-April 2023 included gas-and-steam emissions, lava dome collapses generating avalanches, and persistent thermal activity. Similar eruptive activity continued from May through October 2023, described here based on information from weekly and daily reports of the Kamchatka Volcano Eruptions Response Team (KVERT), notices from Tokyo VAAC (Volcanic Ash Advisory Center), and from satellite data.
Overall activity decreased after the strong period of activity in late March through April 2023, which included ash explosions during 29 March and 7-8 April 2023 that sent plumes as high as 10-12 km altitude, along with dome growth and lava flows (BGVN 48:05). This reduced activity can be seen in the MIROVA thermal detection system graph (figure 56), which was consistent with data from the MODVOLC thermal detection system and with Sentinel-2 satellite images that showed persistent hotspots in the summit crater when conditions allowed observations. A renewed period of strong activity began in mid-October 2023.
Activity increased significantly on 17 October 2023 when large collapses began during 0700-0830 on the E flanks of the lava dome and continued to after 0930 the next day (figure 57). Ash plumes rose to an altitude of 4.5-5 km, extending 220 km NNE by 18 October. A large explosion at 1630 on 18 October produced an ash plume that rose to an altitude of 11 km (8 km above the summit) and drifted NNE and then NW, extending 900 km NW within two days at an altitude of 8 km. Minor ashfall was noted in Kozyrevsk (45 km WNW). At 0820 on 20 October an ash plume was identified in satellite images drifting 100 km ENE at altitudes of 4-4.5 km.
Lava flows and hot avalanches from the dome down the SE flank continued over the next few days, including 23 October when clear conditions allowed good observations (figures 58 and 59). A large thermal anomaly was observed over the volcano through 24 October, and in the summit crater on 30 October (figure 60). Strong fumarolic activity continued, with numerous avalanches and occasional incandescence. By the last week of October, volcanic activity had decreased to a level consistent with that earlier in the reporting period.
Aviation warnings were frequently updated during 17-20 October. KVERT issued a Volcano Observatory Notice for Aviation (VONA) on 17 October at 1419 and 1727 (0219 and 0527 UTC) raising the Aviation Color Code (ACC) from Yellow to Orange (second highest level). The next day, KVERT issued a VONA at 1705 (0505 UTC) raising the ACC to Red (highest level) but lowered it back to Orange at 2117 (0917 UTC). After another decrease to Yellow and back to Orange, the ACC was reduced to Yellow on 20 October at 1204 (0004 UTC). In addition, the Tokyo VAAC issued a series of Volcanic Ash Advisories beginning on 16 October and continuing through 30 October.
Geologic Background. The modern Bezymianny, much smaller than its massive neighbors Kamen and Kliuchevskoi on the Kamchatka Peninsula, was formed about 4,700 years ago over a late-Pleistocene lava-dome complex and an edifice built about 11,000-7,000 years ago. Three periods of intensified activity have occurred during the past 3,000 years. The latest period, which was preceded by a 1,000-year quiescence, began with the dramatic 1955-56 eruption. This eruption, similar to that of St. Helens in 1980, produced a large open crater that was formed by collapse of the summit and an associated lateral blast. Subsequent episodic but ongoing lava-dome growth, accompanied by intermittent explosive activity and pyroclastic flows, has largely filled the 1956 crater.
Information Contacts: Kamchatka Volcanic Eruptions Response Team (KVERT), Far Eastern Branch, Russian Academy of Sciences, 9 Piip Blvd., Petropavlovsk-Kamchatsky, 683006, Russia (URL: http://www.kscnet.ru/ivs/kvert/); Kamchatka Volcanological Station, Kamchatka Branch of Geophysical Survey, (KB GS RAS), Klyuchi, Kamchatka Krai, Russia (URL: http://volkstat.ru/); Tokyo Volcanic Ash Advisory Center (VAAC), 1-3-4 Otemachi, Chiyoda-ku, Tokyo 100-8122, Japan (URL: http://ds.data.jma.go.jp/svd/vaac/data/); Hawai'i Institute of Geophysics and Planetology (HIGP) - MODVOLC Thermal Alerts System, School of Ocean and Earth Science and Technology (SOEST), Univ. of Hawai'i, 2525 Correa Road, Honolulu, HI 96822, USA (URL: http://modis.higp.hawaii.edu/); MIROVA (Middle InfraRed Observation of Volcanic Activity), a collaborative project between the Universities of Turin and Florence (Italy) supported by the Centre for Volcanic Risk of the Italian Civil Protection Department (URL: http://www.mirovaweb.it/); Copernicus Browser, Copernicus Data Space Ecosystem, European Space Agency (URL: https://dataspace.copernicus.eu/browser/).chr
Kilauea (United States) — January 2023 Cite this Report
Kilauea
United States
19.421°N, 155.287°W; summit elev. 1222 m
All times are local (unless otherwise noted)
Low-level lava effusions in the lava lake at Halema’uma’u during July-December 2022
Kīlauea is the southeastern-most volcano in Hawaii and overlaps the E flank of the Mauna Loa volcano. Its East Rift Zone (ERZ) has been intermittently active for at least 2,000 years. An extended eruption period began in January 1983 and was characterized by open lava lakes and lava flows from the summit caldera and the East Rift Zone. During May 2018 magma migrated into the Lower East Rift Zone (LERZ) and opened 24 fissures along a 6-km-long NE-trending fracture zone that produced lava flows traveling in multiple directions. As lava emerged from the fissures, the lava lake at Halema'uma'u drained and explosions sent ash plumes to several kilometers altitude (BGVN 43:10).
The current eruption period started during September 2021 and has recently been characterized by lava effusions, spatter, and sulfur dioxide emissions in the active Halema’uma’u lava lake (BGVN 47:08). Lava effusions, some spatter, and sulfur dioxide emissions have continued during this reporting period of July through December 2022 using daily reports, volcanic activity notices, and abundant photo, map, and video data from the US Geological Survey's (USGS) Hawaiian Volcano Observatory (HVO).
Summary of activity during July-December 2022. Low-level effusions have continued at the western vent of the Halema’uma’u crater during July through early December 2022. Occasional weak ooze-outs (also called lava break outs) would occur along the margins of the crater floor. The overall level of the active lava lake throughout the reporting period gradually increased due to infilling, however it stagnated in mid-September (table 13). During September through November, activity began to decline, though lava effusions persisted at the western vent. By 9 December, the active part of the lava lake had completely crusted over, and incandescence was no longer visible.
Table 13. Summary of measurements taken during overflights at Kīlauea that show a gradual increase in the active lava lake level and the volume of lava effused since 29 September 2021. Lower activity was reported during September-October. Data collected during July-December 2022. Courtesy of HVO.
| Date: |
Level of the active lava lake (m): |
Cumulative volume of lava effused (million cubic meters): |
| 7 Jul 2022 |
130 |
95 |
| 19 Jul 2022 |
133 |
98 |
| 4 Aug 2022 |
136 |
102 |
| 16 Aug 2022 |
137 |
104 |
| 12 Sep 2022 |
143 |
111 |
| 5 Oct 2022 |
143 |
111 |
| 28 Oct 2022 |
143 |
111 |
Activity during July 2022. Lava effusions were reported from the western vent in the Halema’uma’u crater, along with occasional weak ooze-outs along the margins of the crater floor. The height of the lava lake was variable due to deflation-inflation tilt events; for example, the lake level dropped approximately 3-4 m during a summit deflation-inflation event reported on 1 July. Webcam images taken during the night of 6-12 July showed intermittent low-level spattering at the western vent that rose less than 10 m above the vent (figure 519). Measurements made during an overflight on 7 July indicated that the crater floor was infilled about 130 m and that 95 million cubic meters of lava had been effused since 29 September 2021. A single, relatively small lava ooze-out was active to the S of the lava lake. Around midnight on 8 July there were two brief periods of lava overflow onto the lake margins. On 9 July lava ooze-outs were reported near the SE and NE edges of the crater floor and during 10-11 July they occurred near the E, NE, and NW edges. On 16 July crater incandescence was reported, though the ooze-outs and spattering were not visible. On 18 July overnight webcam images showed incandescence in the western vent complex and two ooze-outs were reported around 0000 and 0200 on 19 July. By 0900 there were active ooze-outs along the SW edge of the crater floor. Measurements made from an overflight on 19 July indicated that the crater floor was infilled about 133 m and 98 million cubic meters of lava had erupted since 29 September 2021 (figure 520). On 20 July around 1600 active ooze-outs were visible along the N edge of the crater, which continued through the next day. Extensive ooze-outs occurred along the W margin during 24 July until 1900; on 26 July minor ooze-outs were noted along the N margin. Minor spattering was visible on 29 July along the E margin of the lake. The sulfur dioxide emission rates ranged 650-2,800 tons per day (t/d), the higher of which was measured on 8 July (figure 519).
Activity during August 2022. The eruption continued in the Halema’uma’u crater at the western vent. According to HVO the lava in the active lake remained at the level of the bounding levees. Occasional minor ooze-outs were observed along the margins of the crater floor. Strong nighttime crater incandescence was visible after midnight on 6 August over the western vent cone. During 6-7 August scattered small lava lobes were active along the crater floor and incandescence persisted above the western vent through 9 August. During 7-9 August HVO reported a single lava effusion source was active along the NW margin of the crater floor. Measurements from an overflight on 4 August indicated that the crater floor was infilled about 136 m total and that 102 million cubic meters of lava had been erupted since the start of the eruption. Lava breakouts were reported along the N, NE, E, S, and W margins of the crater during 10-16 August. Another overflight survey conducted on 16 August indicated that the crater floor infilled about 137 m and 104 million cubic meters of lava had been erupted since September 2021. Measured sulfur dioxide emissions rates ranged 1,150-2,450 t/d, the higher of which occurred on 8 August.
Activity during September 2022. During September, lava effusion continued from the western vent into the active lava lake and onto the crater floor. Intermittent minor ooze-outs were reported through the month. A small ooze-out was visible on the W crater floor margin at 0220 on 2 September, which showed decreasing surface activity throughout the day, but remained active through 3 September. On 3 September around 1900 a lava outbreak occurred along the NW margin of the crater floor but had stopped by the evening of 4 September. Field crews monitoring the summit lava lake on 9 September observed spattering on the NE margin of the lake that rose no higher than 10 m, before falling back onto the lava lake crust (figure 521). Overflight measurements on 12 September indicated that the crater floor was infilled a total of 143 m and 111 million cubic meters of lava had been erupted since September 2021. Extensive breakouts in the W and N part of the crater floor were reported at 1600 on 20 September and continued into 26 September. The active part of the lava lake dropped by 10 m while other parts of the crater floor dropped by several meters. Summit tiltmeters recorded a summit seismic swarm of more than 80 earthquakes during 1500-1800 on 21 September, which occurred about 1.5 km below Halema’uma’u; a majority of these were less than Mw 2. By 22 September the active part of the lava lake was infilled about 2 m. On 23 September the western vent areas exhibited several small spatter cones with incandescent openings, along with weak, sporadic spattering (figure 522). The sulfur dioxide emission rate ranged from 930 t/d to 2,000 t/d, the higher of which was measured on 6 September.
Activity during October 2022. Activity during October declined slightly compared to previous months, though lava effusions persisted from the western vent into the active lava lake and onto the crater floor during October (figure 523). Slight variations in the lava lake were noted throughout the month. HVO reported that around 0600 on 3 October the level of the lava lake has lowered slightly. Overflight measurements taken on 5 October indicated that the crater floor was infilled a total of about 143 m and that 111 million cubic meters of lava had been effused since September 2021. During 6-7 October the lake gradually rose 0.5 m. Sulfur dioxide measurements made on 22 October had an emission rate of 700 t/d. Another overflight taken on 28 October showed that there was little to no change in the elevation of the crater floor: the crater floor was infilled a total of 143 m and 111 million cubic meters of lava had erupted since the start of the eruption.
Activity during November 2022. Activity remained low during November, though HVO reported that lava from the western vent continued to effuse into the active lava lake and onto the crater floor throughout the month. The rate of sulfur dioxide emissions during November ranged from 300-600 t/d, the higher amount of which occurred on 9 November.
Activity during December 2022. Similar low activity was reported during December, with lava effusing from the western vent into the active lava lake and onto the crater floor. During 4-5 December the active part of the lava lake was slightly variable in elevation and fluctuated within 1 m. On 9 December HVO reported that lava was no longer erupting from the western vent in the Halema’uma’u crater and that sulfur dioxide emissions had returned to near pre-eruption background levels; during 10-11 December, the lava lake had completely crusted over, and no incandescence was visible (figure 524). Time lapse camera images covering the 4-10 December showed that the crater floor showed weak deflation and no inflation. Some passive events of crustal overturning were reported during 14-15 December, which brought fresh incandescent lava to the lake surface. The sulfur dioxide emission rate was approximately 200 t/d on 14 December. A smaller overturn event on 17 December and another that occurred around 0000 and into the morning of 20 December were also detected. A small seismic swarm was later detected on 30 December.
Geologic Background. Kilauea overlaps the E flank of the massive Mauna Loa shield volcano in the island of Hawaii. Eruptions are prominent in Polynesian legends; written documentation since 1820 records frequent summit and flank lava flow eruptions interspersed with periods of long-term lava lake activity at Halemaumau crater in the summit caldera until 1924. The 3 x 5 km caldera was formed in several stages about 1,500 years ago and during the 18th century; eruptions have also originated from the lengthy East and Southwest rift zones, which extend to the ocean in both directions. About 90% of the surface of the basaltic shield volcano is formed of lava flows less than about 1,100 years old; 70% of the surface is younger than 600 years. The long-term eruption from the East rift zone between 1983 and 2018 produced lava flows covering more than 100 km2, destroyed hundreds of houses, and added new coastline.
Information Contacts: Hawaiian Volcano Observatory (HVO), U.S. Geological Survey, PO Box 51, Hawai'i National Park, HI 96718, USA (URL: http://hvo.wr.usgs.gov/).
Nyamulagira (DR Congo) — November 2023 Cite this Report
Nyamulagira
DR Congo
1.408°S, 29.2°E; summit elev. 3058 m
All times are local (unless otherwise noted)
Lava flows and thermal activity during May-October 2023
Nyamulagira (also known as Nyamuragira) is a shield volcano in the Democratic Republic of Congo with the summit truncated by a small 2 x 2.3 km caldera with walls up to about 100 m high. Documented eruptions have occurred within the summit caldera, as well as from numerous flank fissures and cinder cones. The current eruption period began in April 2018 and has more recently been characterized by summit crater lava flows and thermal activity (BGVN 48:05). This report describes lava flows and variable thermal activity during May through October 2023, based on information from the Observatoire Volcanologique de Goma (OVG) and various satellite data.
Lava lake activity continued during May. The MIROVA (Middle InfraRed Observation of Volcanic Activity) system recorded moderate-to-strong thermal activity throughout the reporting period; activity was more intense during May and October and relatively weaker from June through September (figure 95). The MODVOLC thermal algorithm, detected a total of 209 thermal alerts. There were 143 hotspots detected during May, eight during June, nine during September, and 49 during October. This activity was also reflected in infrared satellite images, where a lava flow was visible in the NW part of the crater on 7 May and strong activity was seen in the center of the crater on 4 October (figure 96). Another infrared satellite image taken on 12 May showed still active lava flows along the NW margin of the crater. According to OVG lava effusions were active during 7-29 May and moved to the N and NW parts of the crater beginning on 9 May. Strong summit crater incandescence was visible from Goma (27 km S) during the nights of 17, 19, and 20 May (figure 97). On 17 May there was an increase in eruptive activity, which peaked at 0100 on 20 May. Notable sulfur dioxide plumes drifted NW and W during 19-20 May (figure 98). Drone footage acquired in partnership with the USGS (United States Geological Survey) on 20 May captured images of narrow lava flows that traveled about 100 m down the W flank (figure 99). Data from the Rumangabo seismic station indicated a decreasing trend in activity during 17-21 May. Although weather clouds prevented clear views of the summit, a strong thermal signature on the NW flank was visible in an infrared satellite image on 22 May, based on an infrared satellite image. On 28 May the lava flows on the upper W flank began to cool and solidify. By 29 May seismicity returned to levels similar to those recorded before the 17 May increase. Lava effusion continued but was confined to the summit crater; periodic crater incandescence was observed.
Low-level activity was noted during June through October. On 1 June OVG reported that seismicity remained at lower levels and that crater incandescence had been absent for three days, though infrared satellite imagery showed continued lava effusion in the summit crater. The lava flows on the flanks covered an estimated 0.6 km2. Satellite imagery continued to show thermal activity confined to the lava lake through October (figure 96), although no lava flows or significant sulfur dioxide emissions were reported.
Geologic Background. Africa's most active volcano, Nyamulagira (also known as Nyamuragira), is a massive high-potassium basaltic shield about 25 km N of Lake Kivu and 13 km NNW of the steep-sided Nyiragongo volcano. The summit is truncated by a small 2 x 2.3 km caldera that has walls up to about 100 m high. Documented eruptions have occurred within the summit caldera, as well as from the numerous flank fissures and cinder cones. A lava lake in the summit crater, active since at least 1921, drained in 1938, at the time of a major flank eruption. Recent lava flows extend down the flanks more than 30 km from the summit as far as Lake Kivu; extensive lava flows from this volcano have covered 1,500 km2 of the western branch of the East African Rift.
Information Contacts: Observatoire Volcanologique de Goma (OVG), Departement de Geophysique, Centre de Recherche en Sciences Naturelles, Lwiro, D.S. Bukavu, DR Congo; Hawai'i Institute of Geophysics and Planetology (HIGP) - MODVOLC Thermal Alerts System, School of Ocean and Earth Science and Technology (SOEST), Univ. of Hawai'i, 2525 Correa Road, Honolulu, HI 96822, USA (URL: http://modis.higp.hawaii.edu/); MIROVA (Middle InfraRed Observation of Volcanic Activity), a collaborative project between the Universities of Turin and Florence (Italy) supported by the Centre for Volcanic Risk of the Italian Civil Protection Department (URL: http://www.mirovaweb.it/); NASA Global Sulfur Dioxide Monitoring Page, Atmospheric Chemistry and Dynamics Laboratory, NASA Goddard Space Flight Center (NASA/GSFC), 8800 Greenbelt Road, Goddard, Maryland, USA (URL: https://so2.gsfc.nasa.gov/); Copernicus Browser, Copernicus Data Space Ecosystem, European Space Agency (URL: https://dataspace.copernicus.eu/browser/); Charles Balagizi, Goma Volcano Observatory, Departement de Geophysique, Centre de Recherche en Sciences Naturelles, Lwiro, D.S. Bukavu, DR Congo.
Bagana (Papua New Guinea) — October 2023 Cite this Report
Bagana
Papua New Guinea
6.137°S, 155.196°E; summit elev. 1855 m
All times are local (unless otherwise noted)
Explosions, ash plumes, ashfall, and lava flows during April-September 2023
The remote volcano of Bagana is located in central Bougainville Island, Papua New Guinea. Recorded eruptions date back to 1842 and activity has consisted of effusive activity that has built a small lava dome in the summit crater and occasional explosions that produced pyroclastic flows. The most recent eruption has been ongoing since February 2000 and has produced occasional explosions, ash plumes, and lava flows. More recently, activity has been characterized by ongoing effusive activity and ash emissions (BGVN 48:04). This report updates activity from April through September 2023 that has consisted of explosions, ash plumes, ashfall, and lava flows, using information from the Darwin Volcanic Ash Advisory Center (VAAC) and satellite data.
An explosive eruption was reported on 7 July that generated a large gas-and-ash plume to high altitudes and caused significant ashfall in local communities; the eruption plume had reached upper tropospheric (16-18 km altitude) altitudes by 2200, according to satellite images. Sulfur dioxide plumes were detected in satellite images on 8 July and indicated that the plume was likely a mixture of gas, ice, and ash. A report issued by the Autonomous Bougainville Government (ABG) (Torokina District, Education Section) on 10 July noted that significant ash began falling during 2000-2100 on 7 July and covered most areas in the Vuakovi, Gotana (9 km SW), Koromaketo, Laruma (25 km W) and Atsilima (27 km NW) villages. Pyroclastic flows also occurred, according to ground-based reports; small deposits confined to one drainage were inspected by RVO during an overflight on 17 July and were confirmed to be from the 7 July event. Ashfall continued until 10 July and covered vegetation, which destroyed bushes and gardens and contaminated rivers and streams.
RVO reported another eruption on 14 July. The Darwin VAAC stated that an explosive event started around 0830 on 15 July and produced an ash plume that rose to 16.5 km altitude by 1000 and drifted N, according to satellite images. The plume continued to drift N and remained visible through 1900, and by 2150 it had dissipated.
Ashfall likely from both the 7 and 15 July events impacted about 8,111 people in Torokina (20 km SW), including Tsito/Vuakovi, Gotana, Koromaketo, Kenaia, Longkogari, Kenbaki, Piva (13 km SW), and Atsinima, and in the Tsitovi district, according to ABG. Significant ashfall was also reported in Ruruvu (22 km N) in the Wakunai District of Central Bougainville, though the thickness of these deposits could not be confirmed. An evacuation was called for the villages in Wakunai, where heavy ashfall had contaminated water sources; the communities of Ruruvu, Togarau, Kakarapaia, Karauturi, Atao, and Kuritaturi were asked to evacuate to a disaster center at the Wakunai District Station, and communities in Torokina were asked to evacuate to the Piva District station. According to a news article, more than 7,000 people needed temporary accommodations, with about 1,000 people in evacuation shelters. Ashfall had deposited over a broad area, contaminating water supplies, affecting crops, and collapsing some roofs and houses in rural areas. Schools were temporarily shut down. Intermittent ash emissions continued through the end of July and drifted NNW, NW, and SW. Fine ashfall was reported on the coast of Torokina, and ash plumes also drifted toward Laruma and Atsilima.
A small explosive eruption occurred at 2130 on 28 July that ejected material from the crater vents, according to reports from Torokina, in addition to a lava flow that contained two lobes. A second explosion was detected at 2157. Incandescence from the lava flow was visible from Piva as it descended the W flank around 2000 on 29 July (figure 47). The Darwin VAAC reported that a strong thermal anomaly was visible in satellite images during 30-31 July and that ash emissions rose to 2.4 km altitude and drifted WSW on 30 July. A ground report from RVO described localized emissions at 0900 on 31 July.
The Darwin VAAC reported that ash plumes were identified in satellite imagery at 0800 and 1220 on 12 August and rose to 2.1 km and 3 km altitude and drifted NW and W, respectively. A news report stated that aid was sent to more than 6,300 people that were adversely affected by the eruption. Photos taken during 17-19 August showed ash emissions rising no higher than 1 km above the summit and drifting SE. A small explosion generated an ash plume during the morning of 19 August. Deposits from small pyroclastic flows were also captured in the photos. Satellite images captured lava flows and pyroclastic flow deposits. Two temporary seismic stations were installed near Bagana on 17 August at distances of 7 km WSW (Vakovi station) and 11 km SW (Kepox station). The Kepox station immediately started to record continuous, low-frequency background seismicity.
Satellite data. Little to no thermal activity was detected during April through mid-July 2023; only one anomaly was recorded during early April and one during early June, according to MIROVA (Middle InfraRed Observation of Volcanic Activity) data (figure 48). Thermal activity increased in both power and frequency during mid-July through September, although there were still some short gaps in detected activity. MODVOLC also detected increased thermal activity during August; thermal hotspots were detected a total of five times on 19, 20, and 27 August. Weak thermal anomalies were also captured in infrared satellite images on clear weather days throughout the reporting period on 7, 12, and 17 April, 27 May, 1, 6, 16, and 31 July, and 19 September (figure 48); a strong thermal anomaly was visible on 31 July. Distinct sulfur dioxide plumes that drifted generally NW were intermittently captured by the TROPOMI instrument on the Sentinel-5P satellite and sometimes exceeded two Dobson Units (DUs) (figure 49).
Geologic Background. Bagana volcano, in a remote portion of central Bougainville Island, is frequently active. This massive symmetrical cone was largely constructed by an accumulation of viscous andesitic lava flows. The entire edifice could have been constructed in about 300 years at its present rate of lava production. Eruptive activity is characterized by non-explosive effusion of viscous lava that maintains a small lava dome in the summit crater, although occasional explosive activity produces pyroclastic flows. Lava flows with tongue-shaped lobes up to 50 m thick and prominent levees descend the flanks on all sides.
Information Contacts: Rabaul Volcano Observatory (RVO), Geohazards Management Division, Department of Mineral Policy and Geohazards Management (DMPGM), PO Box 3386, Kokopo, East New Britain Province, Papua New Guinea; Darwin Volcanic Ash Advisory Centre (VAAC), Bureau of Meteorology, Northern Territory Regional Office, PO Box 40050, Casuarina, NT 0811, Australia (URL: http://www.bom.gov.au/info/vaac/); MIROVA (Middle InfraRed Observation of Volcanic Activity), a collaborative project between the Universities of Turin and Florence (Italy) supported by the Centre for Volcanic Risk of the Italian Civil Protection Department (URL: http://www.mirovaweb.it/); Hawai'i Institute of Geophysics and Planetology (HIGP) - MODVOLC Thermal Alerts System, School of Ocean and Earth Science and Technology (SOEST), Univ. of Hawai'i, 2525 Correa Road, Honolulu, HI 96822, USA (URL: http://modis.higp.hawaii.edu/); NASA Global Sulfur Dioxide Monitoring Page, Atmospheric Chemistry and Dynamics Laboratory, NASA Goddard Space Flight Center (NASA/GSFC), 8800 Greenbelt Road, Goddard, Maryland, USA (URL: https://so2.gsfc.nasa.gov/); Copernicus Browser, Copernicus Data Space Ecosystem, European Space Agency (URL: https://dataspace.copernicus.eu/browser/); Autonomous Bougainville Government, P.O Box 322, Buka, AROB, PNG (URL: https://abg.gov.pg/); Andrew Tupper (Twitter: @andrewcraigtupp); Simon Carn, Geological and Mining Engineering and Sciences, Michigan Technological University, 1400 Townsend Drive, Houghton, MI 49931, USA (URL: http://www.volcarno.com/, Twitter: @simoncarn); Radio NZ (URL: https://www.rnz.co.nz/news/pacific/494464/more-than-7-000-people-in-bougainville-need-temporary-accommodation-after-eruption); USAID, 1300 Pennsylvania Ave, NW, Washington DC 20004, USA (URL: https://www.usaid.gov/pacific-islands/press-releases/aug-08-2023-united-states-provides-immediate-emergency-assistance-support-communities-affected-mount-bagana-volcanic-eruptions).
Mayon (Philippines) — October 2023 Cite this Report
Mayon
Philippines
13.257°N, 123.685°E; summit elev. 2462 m
All times are local (unless otherwise noted)
Lava flows, pyroclastic flows, ash emissions, and seismicity during April-September 2023
Mayon is located in the Philippines and has steep upper slopes capped by a small summit crater. Historical eruptions date back to 1616 CE that have been characterized by Strombolian eruptions, lava flows, pyroclastic flows, and mudflows. Eruptions mostly originated from a central conduit. Pyroclastic flows and mudflows have commonly descended many of the approximately 40 drainages that surround the volcano. The most recent eruption occurred during June through October 2022 and consisted of lava dome growth and gas-and-steam emissions (BGVN 47:12). A new eruption was reported during late April 2023 and has included lava flows, pyroclastic density currents, ash emissions, and seismicity. This report covers activity during April through September 2023 based on daily bulletins from the Philippine Institute of Volcanology and Seismology (PHIVOLCS).
During April through September 2023, PHIVOLCS reported near-daily rockfall events, frequent volcanic earthquakes, and sulfur dioxide measurements. Gas-and-steam emissions rose 100-900 m above the crater and drifted in different directions. Nighttime crater incandescence was often visible during clear weather and was accompanied by incandescent avalanches of material. Activity notably increased during June when lava flows were reported on the S, SE, and E flanks (figure 52). The MIROVA graph (Middle InfraRed Observation of Volcanic Activity) showed strong thermal activity coincident with these lava flows, which remained active through September (figure 53). According to the MODVOLC thermal algorithm, a total of 110 thermal alerts were detected during the reporting period: 17 during June, 40 during July, 27 during August, and 26 during September. During early June, pyroclastic density currents (PDCs) started to occur more frequently.
Low activity was reported during much of April and May; gas-and-steam emissions rose 100-900 m above the crater and generally drifted in different directions. A total of 52 rockfall events and 18 volcanic earthquakes were detected during April and 147 rockfall events and 13 volcanic events during May. Sulfur dioxide flux measurements ranged between 400-576 tons per day (t/d) during April, the latter of which was measured on 29 April and between 162-343 t/d during May, the latter of which was measured on 13 May.
Activity during June increased, characterized by lava flows, pyroclastic density currents (PDCs), crater incandescence and incandescent rockfall events, gas-and-steam emissions, and continued seismicity. Weather clouds often prevented clear views of the summit, but during clear days, moderate gas-and-steam emissions rose 100-2,500 m above the crater and drifted in multiple directions. A total of 6,237 rockfall events and 288 volcanic earthquakes were detected. The rockfall events often deposited material on the S and SE flanks within 700-1,500 m of the summit crater and ash from the events drifted SW, S, SE, NE, and E. Sulfur dioxide emissions ranged between 149-1,205 t/d, the latter of which was measured on 10 June. Short-term observations from EDM and electronic tiltmeter monitoring indicated that the upper slopes were inflating since February 2023. Longer-term ground deformation parameters based on EDM, precise leveling, continuous GPS, and electronic tilt monitoring indicated that the volcano remained inflated, especially on the NW and SE flanks. At 1000 on 5 June the Volcano Alert Level (VAL) was raised to 2 (on a 0-5 scale). PHIVOLCS noted that although low-level volcanic earthquakes, ground deformation, and volcanic gas emissions indicated unrest, the steep increase in rockfall frequency may indicate increased dome activity.
A total of 151 dome-collapse PDCs occurred during 8-9 and 11-30 June, traveled 500-2,000 m, and deposited material on the S flank within 2 km of the summit crater. During 8-9 June the VAL was raised to 3. At approximately 1947 on 11 June lava flow activity was reported; two lobes traveled within 500 m from the crater and deposited material on the S (Mi-isi), SE (Bonga), and E (Basud) flanks. Weak seismicity accompanied the lava flow and slight inflation on the upper flanks. This lava flow remained active through 30 June, moving down the S and SE flank as far as 2.5 km and 1.8 km, respectively and depositing material up to 3.3 km from the crater. During 15-16 June traces of ashfall from the PDCs were reported in Sitio Buga, Nabonton, City of Ligao and Purok, and San Francisco, Municipality of Guinobatan. During 28-29 June there were two PDCs generated by the collapse of the lava flow front, which generated a light-brown ash plume 1 km high. Satellite monitors detected significant concentrations of sulfur dioxide beginning on 29 June. On 30 June PDCs primarily affected the Basud Gully on the E flank, the largest of which occurred at 1301 and lasted eight minutes, based on the seismic record. Four PDCs generated between 1800 and 2000 that lasted approximately four minutes each traveled 3-4 km on the E flank and generated an ash plume that rose 1 km above the crater and drifted N and NW. Ashfall was recorded in Tabaco City.
Similar strong activity continued during July; slow lava effusion remained active on the S and SE flanks and traveled as far as 2.8 km and 2.8 km, respectively and material was deposited as far as 4 km from the crater. There was a total of 6,983 rockfall events and 189 PDCs that affected the S, SE, and E flanks. The volcano network detected a total of 2,124 volcanic earthquakes. Continuous gas-and-steam emissions rose 200-2,000 m above the crater and drifted in multiple directions. Sulfur dioxide emissions averaged 792-4,113 t/d, the latter of which was measured on 28 July. During 2-4 July three PDCs were generated from the collapse of the lava flow and resulting light brown plumes rose 200-300 m above the crater. Continuous tremor pulses were reported beginning at 1547 on 3 July through 7 July at 1200, at 2300 on 8 July and going through 0300 on 10 July, and at 2300 on 16 July, as recorded by the seismic network. During 6-9 July there were 10 lava flow-collapse-related PDCs that generated light brown plumes 300-500 m above the crater. During 10-11 July light ashfall was reported in some areas of Mabinit, Legazpi City, Budiao and Salvacion, Daraga, and Camalig, Albay. By 18 July the lava flow advanced 600 m on the E flank as well.
During 1733 on 18 July and 0434 on 19 July PHIVOLCS reported 30 “ashing” events, which are degassing events accompanied by audible thunder-like sounds and entrained ash at the crater, which produced short, dark plumes that drifted SW. These events each lasted 20-40 seconds, and plume heights ranged from 150-300 m above the crater, as recorded by seismic, infrasound, visual, and thermal monitors. Three more ashing events occurred during 19-20 July. Short-term observations from electronic tilt and GPS monitoring indicate deflation on the E lower flanks in early July and inflation on the NW middle flanks during the third week of July. Longer-term ground deformation parameters from EDM, precise leveling, continuous GPS, and electronic tilt monitoring indicated that the volcano was still generally inflated relative to baseline levels. A short-lived lava pulse lasted 28 seconds at 1956 on 21 July, which was accompanied by seismic and infrasound signals. By 22 July, the only lava flow that remained active was on the SE flank, and continued to extend 3.4 km, while those on the S and E flanks weakened markedly. One ashing event was detected during 30-31 July, whereas there were 57 detected during 31 July-1 August; according to PHIVOLCS beginning at approximately 1800 on 31 July eruptive activity was dominated by phases of intermittent ashing, as well as increased in the apparent rates of lava effusion from the summit crater. The ashing phases consisted of discrete events recorded as low-frequency volcanic earthquakes (LFVQ) typically 30 seconds in duration, based on seismic and infrasound signals. Gray ash plume rose 100 m above the crater and generally drifted NE. Shortly after these ashing events began, new lava began to effuse rapidly from the crater, feeding the established flowed on the SE, E, and E flanks and generating frequent rockfall events.
Intensified unrest persisted during August. There was a total of 4,141 rockfall events, 2,881 volcanic earthquakes, which included volcanic tremor events, 32 ashing events, and 101 PDCs detected throughout the month. On clear weather days, gas-and-steam emissions rose 300-1,500 m above the crater and drifted in different directions (figure 54). Sulfur dioxide emissions averaged 735-4,756 t/d, the higher value of which was measured on 16 August. During 1-2 August the rate of lava effusion decreased, but continued to feed the flows on the SE, S, and E flanks, maintaining their advances to 3.4 km, 2.8 km, and 1.1 km from the crater, respectively (figure 55). Rockfall and PDCs generated by collapses at the lava flow margins and from the summit dome deposited material within 4 km of the crater. During 3-4 August there were 10 tremor events detected that lasted 1-4 minutes. Short-lived lava pulse lasted 35 seconds and was accompanied by seismic and infrasound signals at 0442 on 6 August. Seven collapses were recorded at the front of the lava flow during 12-14 August.
During September, similar activity of slow lava effusion, PDCs, gas-and-steam emissions, and seismicity continued. There was a total of 4,452 rockfall events, 329 volcanic earthquakes, which included volcanic tremor events, two ashing events, and 85 PDCs recorded throughout the month. On clear weather days, gas-and-steam emissions rose 100-1,500 m above the crater and drifted in multiple directions. Sulfur dioxide emissions averaged 609-2,252 t/d, the higher average of which was measured on 6 September. Slow lava effusion continued advancing on the SE, S, and E flanks, maintaining lengths of 3.4 km, 2.8 km, and 1.1 km, respectively. Rockfall and PDC events generated by collapses along the lava flow margins and at the summit dome deposited material within 4 km of the crater.
Geologic Background. Symmetrical Mayon, which rises above the Albay Gulf NW of Legazpi City, is the most active volcano of the Philippines. The steep upper slopes are capped by a small summit crater. Recorded eruptions since 1616 CE range from Strombolian to basaltic Plinian, with cyclical activity beginning with basaltic eruptions, followed by longer periods of andesitic lava flows. Eruptions occur predominately from the central conduit and have also produced lava flows that travel far down the flanks. Pyroclastic density currents and mudflows have commonly swept down many of the approximately 40 ravines that radiate from the summit and have often damaged populated lowland areas. A violent eruption in 1814 killed more than 1,200 people and devastated several towns.
Information Contacts: Philippine Institute of Volcanology and Seismology (PHIVOLCS), Department of Science and Technology, University of the Philippines Campus, Diliman, Quezon City, Philippines (URL: http://www.phivolcs.dost.gov.ph/); MIROVA (Middle InfraRed Observation of Volcanic Activity), a collaborative project between the Universities of Turin and Florence (Italy) supported by the Centre for Volcanic Risk of the Italian Civil Protection Department (URL: http://www.mirovaweb.it/); Hawai'i Institute of Geophysics and Planetology (HIGP) - MODVOLC Thermal Alerts System, School of Ocean and Earth Science and Technology (SOEST), Univ. of Hawai'i, 2525 Correa Road, Honolulu, HI 96822, USA (URL: http://modis.higp.hawaii.edu/); Copernicus Browser, Copernicus Data Space Ecosystem, European Space Agency (URL: https://dataspace.copernicus.eu/browser/); William Rogers, Legazpi City, Albay Province, Philippines.
Nishinoshima (Japan) — October 2023 Cite this Report
Nishinoshima
Japan
27.247°N, 140.874°E; summit elev. 100 m
All times are local (unless otherwise noted)
Eruption plumes and gas-and-steam plumes during May-August 2023
Nishinoshima, located about 1,000 km S of Tokyo, is a small island in the Ogasawara Arc in Japan. The island is the summit of a massive submarine volcano that has prominent submarine peaks to the S, W, and NE. Eruptions date back to 1973 and the current eruption period began in October 2022. Recent activity has consisted of small ash plumes and fumarolic activity (BGVN 48:07). This report covers activity during May through August 2023, using information from monthly reports of the Japan Meteorological Agency (JMA) monthly reports and satellite data.
Activity during May through June was relatively low. The Japan Coast Guard (JCG) did overflights on 14 and 22 June and reported white gas-and-steam emissions rising 600 m and 1,200 m from the central crater of the pyroclastic cone, respectively (figure 125). In addition, multiple white gas-and-steam emissions rose from the inner rim of the W side of the crater and from the SE flank of the pyroclastic cone. Discolored brown-to-green water was observed around almost the entire perimeter of the island; on 22 June light green discolored water was observed off the S coast of the island.
Observations from the Himawari meteorological satellite confirmed an eruption on 9 and 10 July. An eruption plume rose 1.6 km above the crater and drifted N around 1300 on 9 July. Satellite images acquired at 1420 and 2020 on 9 July and at 0220 on 10 July showed continuing emissions that rose 1.3-1.6 km above the crater and drifted NE and N. The Tokyo VAAC reported that an ash plume seen by a pilot and identified in a satellite image at 0630 on 21 July rose to 3 km altitude and drifted S.
Aerial observations conducted by JCG on 8 August showed a white-and-gray plume rising from the central crater of the pyroclastic cone, and multiple white gas-and-steam emissions were rising from the inner edge of the western crater and along the NW-SE flanks of the island (figure 126). Brown-to-green discolored water was also noted around the perimeter of the island.
Intermittent low-to-moderate power thermal anomalies were recorded in the MIROVA graph (Middle InfraRed Observation of Volcanic Activity), showing an increase in both frequency and power beginning in July (figure 127). This increase in activity coincides with eruptive activity on 9 and 10 July, characterized by eruption plumes. According to the MODVOLC thermal alert algorithm, one thermal hotspot was recorded on 20 July. Weak thermal anomalies were also detected in infrared satellite imagery, accompanied by strong gas-and-steam plumes (figure 128).
Geologic Background. The small island of Nishinoshima was enlarged when several new islands coalesced during an eruption in 1973-74. Multiple eruptions that began in 2013 completely covered the previous exposed surface and continued to enlarge the island. The island is the summit of a massive submarine volcano that has prominent peaks to the S, W, and NE. The summit of the southern cone rises to within 214 m of the ocean surface 9 km SSE.
Information Contacts: Japan Meteorological Agency (JMA), 1-3-4 Otemachi, Chiyoda-ku, Tokyo 100-8122, Japan (URL: http://www.jma.go.jp/jma/indexe.html); Tokyo Volcanic Ash Advisory Center (VAAC), 1-3-4 Otemachi, Chiyoda-ku, Tokyo 100-8122, Japan (URL: http://ds.data.jma.go.jp/svd/vaac/data/); MIROVA (Middle InfraRed Observation of Volcanic Activity), a collaborative project between the Universities of Turin and Florence (Italy) supported by the Centre for Volcanic Risk of the Italian Civil Protection Department (URL: http://www.mirovaweb.it/); Copernicus Browser, Copernicus Data Space Ecosystem, European Space Agency (URL: https://dataspace.copernicus.eu/browser/).
Krakatau (Indonesia) — October 2023 Cite this Report
Krakatau
Indonesia
6.1009°S, 105.4233°E; summit elev. 285 m
All times are local (unless otherwise noted)
White gas-and-steam plumes and occasional ash plumes during May-August 2023
Krakatau is located in the Sunda Strait between Java and Sumatra, Indonesia. Caldera collapse during the catastrophic 1883 eruption destroyed Danan and Perbuwatan cones and left only a remnant of Rakata. The post-collapse cone of Anak Krakatau (Child of Krakatau) was constructed within the 1883 caldera at a point between the former Danan and Perbuwatan cones; it has been the site of frequent eruptions since 1927. The current eruption period began in May 2021 and has recently consisted of Strombolian eruptions and ash plumes (BGVN 48:07). This report describes lower levels of activity consisting of ash and white gas-and-steam plumes during May through August 2023, based on information provided by the Indonesian Center for Volcanology and Geological Hazard Mitigation, referred to as Pusat Vulkanologi dan Mitigasi Bencana Geologi (PVMBG), MAGMA Indonesia, and satellite data.
Activity was relatively low during May and June. Daily white gas-and-steam emissions rose 25-200 m above the crater and drifted in different directions. Five ash plumes were detected at 0519 on 10 May, 1241 on 11 May, 0920 on 12 May, 2320 on 12 May, and at 0710 on 13 May, and rose 1-2.5 km above the crater and drifted SW. A webcam image taken on 12 May showed ejection of incandescent material above the vent. A total of nine ash plumes were detected during 6-11 June: at 1434 and 00220 on 6 and 7 June the ash plumes rose 500 m above the crater and drifted NW, at 1537 on 8 June the ash plume rose 1 km above the crater and drifted SW, at 0746 and at 0846 on 9 June the ash plumes rose 800 m and 3 km above the crater and drifted SW, respectively, at 0423, 1431, and 1750 on 10 June the ash plumes rose 2 km, 1.5 km, and 3.5 km above the crater and drifted NW, respectively, and at 0030 on 11 June an ash plume rose 2 km above the crater and drifted NW. Webcam images taken on 10 and 11 June at 0455 and 0102, respectively, showed incandescent material ejected above the vent. On 19 June an ash plume at 0822 rose 1.5 km above the crater and drifted SE.
Similar low activity of white gas-and-steam emissions and few ash plumes were reported during July and August. Daily white gas-and-steam emissions rose 25-300 m above the crater and drifted in multiple directions. Three ash plumes were reported at 0843, 0851, and 0852 on 20 July that rose 500-2,000 m above the crater and drifted NW.
The MIROVA (Middle InfraRed Observation of Volcanic Activity) graph of MODIS thermal anomaly data showed intermittent low-to-moderate power thermal anomalies during May through August 2023 (figure 140). Although activity was often obscured by weather clouds, a thermal anomaly was visible in an infrared satellite image of the crater on 12 May, accompanied by an eruption plume that drifted SW (figure 141).
Geologic Background. The renowned Krakatau (frequently mis-named as Krakatoa) volcano lies in the Sunda Strait between Java and Sumatra. Collapse of an older edifice, perhaps in 416 or 535 CE, formed a 7-km-wide caldera. Remnants of that volcano are preserved in Verlaten and Lang Islands; subsequently the Rakata, Danan, and Perbuwatan cones were formed, coalescing to create the pre-1883 Krakatau Island. Caldera collapse during the catastrophic 1883 eruption destroyed Danan and Perbuwatan, and left only a remnant of Rakata. This eruption caused more than 36,000 fatalities, most as a result of tsunamis that swept the adjacent coastlines of Sumatra and Java. Pyroclastic surges traveled 40 km across the Sunda Strait and reached the Sumatra coast. After a quiescence of less than a half century, the post-collapse cone of Anak Krakatau (Child of Krakatau) was constructed within the 1883 caldera at a point between the former Danan and Perbuwatan cones. Anak Krakatau has been the site of frequent eruptions since 1927.
Information Contacts: Pusat Vulkanologi dan Mitigasi Bencana Geologi (PVMBG, also known as Indonesian Center for Volcanology and Geological Hazard Mitigation, CVGHM), Jalan Diponegoro 57, Bandung 40122, Indonesia (URL: http://www.vsi.esdm.go.id/); MAGMA Indonesia, Kementerian Energi dan Sumber Daya Mineral (URL: https://magma.esdm.go.id/v1); MIROVA (Middle InfraRed Observation of Volcanic Activity), a collaborative project between the Universities of Turin and Florence (Italy) supported by the Centre for Volcanic Risk of the Italian Civil Protection Department (URL: http://www.mirovaweb.it/); Copernicus Browser, Copernicus Data Space Ecosystem, European Space Agency (URL: https://dataspace.copernicus.eu/browser/).
Villarrica (Chile) — October 2023 Cite this Report
Villarrica
Chile
39.42°S, 71.93°W; summit elev. 2847 m
All times are local (unless otherwise noted)
Strombolian activity, gas-and-ash emissions, and crater incandescence during April-September 2023
Villarrica, in central Chile, consists of a 2-km-wide caldera that formed about 3,500 years ago and is located at the base of the presently active cone at the NW margin of a 6-km-wide caldera. Historical eruptions eruptions date back to 1558 and have been characterized by mild-to-moderate explosive activity with occasional lava effusions. The current eruption period began in December 2014 and has recently consisted of nighttime crater incandescence, ash emissions, and seismicity (BGVN 48:04). This report covers activity during April through September 2023 and describes occasional Strombolian activity, gas-and-ash emissions, and nighttime crater incandescence. Information for this report primarily comes from the Southern Andes Volcano Observatory (Observatorio Volcanológico de Los Andes del Sur, OVDAS), part of Chile's National Service of Geology and Mining (Servicio Nacional de Geología y Minería, SERNAGEOMIN) and satellite data.
Seismicity during April consisted of long period (LP) events and tremor (TRE); a total of 9,413 LP-type events and 759 TR-type events were detected throughout the month. Nighttime crater incandescence persisted and was visible in the degassing column. Sulfur dioxide data was obtained using Differential Absorption Optical Spectroscopy Equipment (DOAS) that showed an average value of 1,450 ± 198 tons per day (t/d) during 1-15 April and 1,129 ± 201 t/d during 16-30 April, with a maximum daily value of 2,784 t/d on 9 April. Gas-and-steam emissions of variable intensities rose above the active crater as high as 1.3 km above the crater on 13 April. Strombolian explosions were not observed and there was a slight decrease in the lava lake level.
There were 14,123 LP-type events and 727 TR-type events detected during May. According to sulfur dioxide measurements taken with DOAS equipment, the active crater emitted an average value of 1,826 ± 482 t/d during 1-15 May and 912 ± 41 t/d during 16-30 May, with a daily maximum value of 5,155 t/d on 13 May. Surveillance cameras showed continuous white gas-and-steam emissions that rose as high as 430 m above the crater on 27 May. Nighttime incandescence illuminated the gas column less than 300 m above the crater rim was and no pyroclastic emissions were reported. A landslide was identified on 13 May on the E flank of the volcano 50 m from the crater rim and extending 300 m away; SERNAGEOMIN noted that this event may have occurred on 12 May. During the morning of 27 and 28 May minor Strombolian explosions characterized by incandescent ejecta were recorded at the crater rim; the last reported Strombolian explosions had occurred at the end of March.
Seismic activity during June consisted of five volcano-tectonic (VT)-type events, 21,606 LP-type events, and 2,085 TR-type events. The average value of sulfur dioxide flux obtained by DOAS equipment was 1,420 ± 217 t/d during 1-15 June and 2,562 ± 804 t/d, with a maximum daily value of 4,810 t/d on 17 June. White gas-and-steam emissions rose less than 480 m above the crater; frequent nighttime crater incandescence was reflected in the degassing plume. On 12 June an emission rose 100 m above the crater and drifted NNW. On 15 June one or several emissions resulted in ashfall to the NE as far as 5.5 km from the crater, based on a Skysat satellite image. Several Strombolian explosions occurred within the crater; activity on 15 June was higher energy and ejected blocks 200-300 m on the NE slope. Surveillance cameras showed white gas-and-steam emissions rising 480 m above the crater on 16 June. On 19 and 24 June low-intensity Strombolian activity was observed, ejecting material as far as 200 m from the center of the crater to the E.
During July, seismicity included 29,319 LP-type events, 3,736 TR-type events, and two VT-type events. DOAS equipment recorded two days of sulfur dioxide emissions of 4,220 t/d and 1,009 t/d on 1 and 13 July, respectively. Constant nighttime incandescence was also recorded and was particularly noticeable when accompanied by eruptive columns on 12 and 16 July. Minor explosive events were detected in the crater. According to Skysat satellite images taken on 12, 13, and 16 July, ashfall deposits were identified 155 m S of the crater. According to POVI, incandescence was visible from two vents on the crater floor around 0336 on 12 July. Gas-and-ash emissions rose as high as 1.2 km above the crater on 13 July and drifted E and NW. A series of gas-and-steam pulses containing some ash deposited material on the upper E flank around 1551 on 13 July. During 16-31 July, average sulfur dioxide emissions of 1,679 ± 406 t/d were recorded, with a maximum daily value of 2,343 t/d on 28 July. Fine ash emissions were also reported on 16, 17, and 23 July.
Seismicity persisted during August, characterized by 27,011 LP-type events, 3,323 TR-type events, and three VT-type events. The average value of sulfur dioxide measurements taken during 1-15 August was 1,642 ± 270 t/d and 2,207 ± 4,549 t/d during 16-31 August, with a maximum daily value of 3,294 t/d on 27 August. Nighttime crater incandescence remained visible in degassing columns. White gas-and-steam emissions rose 480 m above the crater on 6 August. According to a Skysat satellite image from 6 August, ash accumulation was observed proximal to the crater and was mainly distributed toward the E slope. White gas-and-steam emissions rose 320 m above the crater on 26 August. Nighttime incandescence and Strombolian activity that generated ash emissions were reported on 27 August.
Seismicity during September was characterized by five VT-type events, 12,057 LP-type events, and 2,058 TR-type events. Nighttime incandescence persisted. On 2 September an ash emission rose 180 m above the crater and drifted SE at 1643 (figure 125) and a white gas-and-steam plume rose 320 m above the crater. According to the Buenos Aires VAAC, periods of continuous gas-and-ash emissions were visible in webcam images from 1830 on 2 September to 0110 on 3 September. Strombolian activity was observed on 2 September and during the early morning of 3 September, the latter event of which generated an ash emission that rose 60 m above the crater and drifted 100 m from the center of the crater to the NE and SW. Ashfall was reported to the SE and S as far as 750 m from the crater. The lava lake was active during 3-4 September and lava fountaining was visible for the first time since 26 March 2023, according to POVI. Fountains captured in webcam images at 2133 on 3 September and at 0054 on 4 September rose as high as 60 m above the crater rim and ejected material onto the upper W flank. Sulfur dioxide flux of 1,730 t/d and 1,281 t/d was measured on 3 and 4 September, respectively, according to data obtained by DOAS equipment.
Strong Strombolian activity and larger gas-and-ash plumes were reported during 18-20 September. On 18 September activity was also associated with energetic LP-type events and notable sulfur dioxide fluxes (as high as 4,277 t/d). On 19 September Strombolian activity and incandescence were observed. On 20 September at 0914 ash emissions rose 50 m above the crater and drifted SSE, accompanied by Strombolian activity that ejected material less than 100 m SSE, causing fall deposits on that respective flank. SERNAGEOMIN reported that a Planet Scope satellite image taken on 20 September showed the lava lake in the crater, measuring 32 m x 35 m and an area of 0.001 km2. Several ash emissions were recorded at 0841, 0910, 1251, 1306, 1312, 1315, and 1324 on 23 September and rose less than 150 m above the crater. The sulfur dioxide flux value was 698 t/d on 23 September and 1,097 t/d on 24 September. On 24 September the Volcanic Alert Level (VAL) was raised to Orange (the third level on a four-color scale). SENAPRED maintained the Alert Level at Yellow (the middle level on a three-color scale) for the communities of Villarrica, Pucón (16 km N), Curarrehue, and Panguipulli.
During 24-25 September there was an increase in seismic energy (observed at TR-events) and acoustic signals, characterized by 1 VT-type event, 213 LP-type events, and 124 TR-type events. Mainly white gas-and-steam emissions, in addition to occasional fine ash emissions were recorded. During the early morning of 25 September Strombolian explosions were reported and ejected material 250 m in all directions, though dominantly toward the NW. On 25 September the average value of sulfur dioxide flux was 760 t/d. Seismicity during 25-30 September consisted of five VT-type events, 1,937 LP-type events, and 456 TR-type events.
During 25-29 September moderate Strombolian activity was observed and ejected material as far as the crater rim. In addition, ash pulses lasting roughly 50 minutes were observed around 0700 and dispersed ENE. During 26-27 September a TR episode lasted 6.5 hours and was accompanied by discrete acoustic signals. Satellite images from 26 September showed a spatter cone on the crater floor with one vent that measured 10 x 14 m and a smaller vent about 35 m NE of the cone. SERNAGEOMIN reported an abundant number of bomb-sized blocks up to 150 m from the crater, as well as impact marks on the snow, which indicated explosive activity. A low-altitude ash emission was observed drifting NW around 1140 on 28 September, based on webcam images. Between 0620 and 0850 on 29 September an ash emission rose 60 m above the crater and drifted NW. During an overflight taken around 1000 on 29 September scientists observed molten material in the vent, a large accumulation of pyroclasts inside the crater, and energetic degassing, some of which contained a small amount of ash. Block-sized pyroclasts were deposited on the internal walls and near the crater, and a distal ash deposit was also visible. The average sulfur dioxide flux measured on 28 September was 344 t/d. Satellite images taken on 29 September ashfall was deposited roughly 3 km WNW from the crater and nighttime crater incandescence remained visible. The average sulfur dioxide flux value from 29 September was 199 t/d. On 30 September at 0740 a pulsating ash emission rose 1.1 km above the crater and drifted NNW (figure 126). Deposits on the S flank extended as far as 4.5 km from the crater rim, based on satellite images from 30 September.
Infrared MODIS satellite data processed by MIROVA (Middle InfraRed Observation of Volcanic Activity) showed intermittent thermal activity during April through September, with slightly stronger activity detected during late September (figure 127). Small clusters of thermal activity were detected during mid-June, early July, early August, and late September. According to the MODVOLC thermal alert system, a total of four thermal hotspots were detected on 7 July and 3 and 23 September. This activity was also intermittently captured in infrared satellite imagery on clear weather days (figure 128).
Geologic Background. The glacier-covered Villarrica stratovolcano, in the northern Lakes District of central Chile, is ~15 km south of the city of Pucon. A 2-km-wide caldera that formed about 3,500 years ago is located at the base of the presently active, dominantly basaltic to basaltic andesite cone at the NW margin of a 6-km-wide Pleistocene caldera. More than 30 scoria cones and fissure vents are present on the flanks. Plinian eruptions and pyroclastic flows that have extended up to 20 km from the volcano were produced during the Holocene. Lava flows up to 18 km long have issued from summit and flank vents. Eruptions documented since 1558 CE have consisted largely of mild-to-moderate explosive activity with occasional lava effusion. Glaciers cover 40 km2 of the volcano, and lahars have damaged towns on its flanks.
Information Contacts: Servicio Nacional de Geología y Minería (SERNAGEOMIN), Observatorio Volcanológico de Los Andes del Sur (OVDAS), Avda Sta María No. 0104, Santiago, Chile (URL: http://www.sernageomin.cl/); Proyecto Observación Villarrica Internet (POVI) (URL: http://www.povi.cl/); Sistema y Servicio Nacional de Prevención y Repuesta Ante Desastres (SENAPRED), Av. Beauchef 1671, Santiago, Chile (URL: https://web.senapred.cl/); Buenos Aires Volcanic Ash Advisory Center (VAAC), Servicio Meteorológico Nacional-Fuerza Aérea Argentina, 25 de mayo 658, Buenos Aires, Argentina (URL: http://www.smn.gov.ar/vaac/buenosaires/inicio.php); MIROVA (Middle InfraRed Observation of Volcanic Activity), a collaborative project between the Universities of Turin and Florence (Italy) supported by the Centre for Volcanic Risk of the Italian Civil Protection Department (URL: http://www.mirovaweb.it/); Hawai'i Institute of Geophysics and Planetology (HIGP) - MODVOLC Thermal Alerts System, School of Ocean and Earth Science and Technology (SOEST), Univ. of Hawai'i, 2525 Correa Road, Honolulu, HI 96822, USA (URL: http://modis.higp.hawaii.edu/); Copernicus Browser, Copernicus Data Space Ecosystem, European Space Agency (URL: https://dataspace.copernicus.eu/browser/).
Merapi (Indonesia) — October 2023 Cite this Report
Merapi
Indonesia
7.54°S, 110.446°E; summit elev. 2910 m
All times are local (unless otherwise noted)
Frequent incandescent avalanches during April-September 2023
Merapi, located just north of the major city of Yogyakarta in central Java, Indonesia, has had activity within the last 20 years characterized by pyroclastic flows and lahars accompanying growth and collapse of the steep-sided active summit lava dome. The current eruption period began in late December 2020 and has more recently consisted of ash plumes, intermittent incandescent avalanches of material, and pyroclastic flows (BGVN 48:04). This report covers activity during April through September 2023, based on information from Balai Penyelidikan dan Pengembangan Teknologi Kebencanaan Geologi (BPPTKG), the Center for Research and Development of Geological Disaster Technology, a branch of PVMBG which specifically monitors Merapi. Additional information comes from the Pusat Vulkanologi dan Mitigasi Bencana Geologi (PVMBG, also known as Indonesian Center for Volcanology and Geological Hazard Mitigation, CVGHM), MAGMA Indonesia, the Darwin Volcanic Ash Advisory Centre (VAAC), and various satellite data.
Activity during April through September 2023 primarily consisted of incandescent avalanches of material that mainly affected the SW and W flanks and traveled as far as 2.3 km from the summit (table 25) and white gas-and-steam emissions that rose 10-1,000 m above the crater.
Table 25. Monthly summary of avalanches and avalanche distances recorded at Merapi during April through September 2023. The number of reported avalanches does not include instances where possible avalanches were heard but could not be visually confirmed as a result of inclement weather. Data courtesy of BPPTKG (April-September 2023 daily reports).
| Month |
Average number of avalanches per day |
Distance avalanches traveled (m) |
| Apr 2023 |
19 |
1,200-2,000 |
| May 2023 |
22 |
500-2,000 |
| Jun 2023 |
18 |
1,200-2,000 |
| Jul 2023 |
30 |
300-2,000 |
| Aug 2023 |
25 |
400-2,300 |
| Sep 2023 |
23 |
600-2,000 |
BPPTKG reported that during April and May white gas-and-steam emissions rose 10-750 m above the crater, incandescent avalanches descended 500-2,000 m on the SW and W flanks (figure 135). Cloudy weather often prevented clear views of the summit, and sometimes avalanches could not be confirmed. According to a webcam image, a pyroclastic flow was visible on 17 April at 0531. During the week of 28 April and 4 May a pyroclastic flow was reported on the SW flank, traveling up to 2.5 km. According to a drone overflight taken on 17 May the SW lava dome volume was an estimated 2,372,800 cubic meters and the dome in the main crater was an estimated 2,337,300 cubic meters.
During June and July similar activity persisted with white gas-and-steam emissions rising 10-350 m above the crater and frequent incandescent avalanches that traveled 300-2,000 m down the SW, W, and S flanks (figure 136). Based on an analysis of aerial photos taken on 24 June the volume of the SW lava dome was approximately 2.5 million cubic meters. A pyroclastic flow was observed on 5 July that traveled 2.7 km on the SW flank. According to the Darwin VAAC multiple minor ash plumes were identified in satellite images on 19 July that rose to 3.7 km altitude and drifted S and SW. During 22, 25, and 26 July a total of 17 avalanches descended as far as 1.8 km on the S flank.
Frequent white gas-and-steam emissions continued during August and September, rising 10-450 m above the crater. Incandescent avalanches mainly affected the SW and W flanks and traveled 400-2,300 m from the vent (figure 137). An aerial survey conducted on 10 August was analyzed and reported that estimates of the SW dome volume was 2,764,300 cubic meters and the dome in the main crater was 2,369,800 cubic meters.
Frequent and moderate-power thermal activity continued throughout the reporting period, according to a MIROVA (Middle InfraRed Observation of Volcanic Activity) analysis of MODIS satellite data (figure 138). There was an increase in the number of detected anomalies during mid-May. The MODVOLC thermal algorithm recorded a total of 47 thermal hotspots: six during April, nine during May, eight during June, 15 during July, four during August, and five during September. Some of this activity was captured in infrared satellite imagery on clear weather days, sometimes accompanied by incandescent material on the SW flank (figure 139).
Geologic Background. Merapi, one of Indonesia's most active volcanoes, lies in one of the world's most densely populated areas and dominates the landscape immediately north of the major city of Yogyakarta. It is the youngest and southernmost of a volcanic chain extending NNW to Ungaran volcano. Growth of Old Merapi during the Pleistocene ended with major edifice collapse perhaps about 2,000 years ago, leaving a large arcuate scarp cutting the eroded older Batulawang volcano. Subsequent growth of the steep-sided Young Merapi edifice, its upper part unvegetated due to frequent activity, began SW of the earlier collapse scarp. Pyroclastic flows and lahars accompanying growth and collapse of the steep-sided active summit lava dome have devastated cultivated lands on the western-to-southern flanks and caused many fatalities.
Information Contacts: Balai Penyelidikan dan Pengembangan Teknologi Kebencanaan Geologi (BPPTKG), Center for Research and Development of Geological Disaster Technology (URL: http://merapi.bgl.esdm.go.id/, Twitter: @BPPTKG); MAGMA Indonesia, Kementerian Energi dan Sumber Daya Mineral (URL: https://magma.esdm.go.id/v1); Pusat Vulkanologi dan Mitigasi Bencana Geologi (PVMBG, also known as Indonesian Center for Volcanology and Geological Hazard Mitigation, CVGHM), Jalan Diponegoro 57, Bandung 40122, Indonesia (URL: http://www.vsi.esdm.go.id/); Darwin Volcanic Ash Advisory Centre (VAAC), Bureau of Meteorology, Northern Territory Regional Office, PO Box 40050, Casuarina, NT 0811, Australia (URL: http://www.bom.gov.au/info/vaac/); MIROVA (Middle InfraRed Observation of Volcanic Activity), a collaborative project between the Universities of Turin and Florence (Italy) supported by the Centre for Volcanic Risk of the Italian Civil Protection Department (URL: http://www.mirovaweb.it/); Hawai'i Institute of Geophysics and Planetology (HIGP) - MODVOLC Thermal Alerts System, School of Ocean and Earth Science and Technology (SOEST), Univ. of Hawai'i, 2525 Correa Road, Honolulu, HI 96822, USA (URL: http://modis.higp.hawaii.edu/); Copernicus Browser, Copernicus Data Space Ecosystem, European Space Agency (URL: https://dataspace.copernicus.eu/browser/); Øystein Lund Andersen (URL: https://www.oysteinlundandersen.com/, https://twitter.com/oysteinvolcano).
Ebeko
Russia
50.686°N, 156.014°E; summit elev. 1103 m
All times are local (unless otherwise noted)
Moderate explosive activity with ash plumes continued during June-November 2023
Ebeko, located on the N end of Paramushir Island in Russia’s Kuril Islands just S of the Kamchatka Peninsula, consists of three summit craters along a SSW-NNE line at the northern end of a complex of five volcanic cones. Observed eruptions date back to the late 18th century and have been characterized as small-to-moderate explosions from the summit crater, accompanied by intense fumarolic activity. The current eruptive period began in June 2022, consisting of frequent explosions, ash plumes, and thermal activity (BGVN 47:10, 48:06). This report covers similar activity during June-November 2023, based on information from the Kamchatka Volcanic Eruptions Response Team (KVERT) and satellite data.
Moderate explosive activity continued during June-November 2023 (figures 50 and 51). According to visual data from Severo-Kurilsk, explosions sent ash 2-3.5 km above the summit (3-4.5 km altitude) during most days during June through mid-September. Activity after mid-September was slightly weaker, with ash usually reaching less than 2 km above the summit. According to KVERT the volcano in October and November was, with a few exceptions, either quiet or obscured by clouds that prevented satellite observations. KVERT issued Volcano Observatory Notices for Aviation (VONA) on 8 and 12 June, 13 and 22 July, 3 and 21 August, and 31 October warning of potential aviation hazards from ash plumes drifting 3-15 km from the volcano. Based on satellite data, KVERT reported a persistent thermal anomaly whenever weather clouds permitted viewing.
Geologic Background. The flat-topped summit of the central cone of Ebeko volcano, one of the most active in the Kuril Islands, occupies the northern end of Paramushir Island. Three summit craters located along a SSW-NNE line form Ebeko volcano proper, at the northern end of a complex of five volcanic cones. Blocky lava flows extend west from Ebeko and SE from the neighboring Nezametnyi cone. The eastern part of the southern crater contains strong solfataras and a large boiling spring. The central crater is filled by a lake about 20 m deep whose shores are lined with steaming solfataras; the northern crater lies across a narrow, low barrier from the central crater and contains a small, cold crescentic lake. Historical activity, recorded since the late-18th century, has been restricted to small-to-moderate explosive eruptions from the summit craters. Intense fumarolic activity occurs in the summit craters, on the outer flanks of the cone, and in lateral explosion craters.
Information Contacts: Kamchatka Volcanic Eruptions Response Team (KVERT), Far Eastern Branch, Russian Academy of Sciences, 9 Piip Blvd., Petropavlovsk-Kamchatsky, 683006, Russia (URL: http://www.kscnet.ru/ivs/kvert/).
Search Bulletin Archive by Publication Date
Select a month and year from the drop-downs and click "Show Issue" to have that issue displayed in this tab.
The default month and year is the latest issue available.
Bulletin of the Global Volcanism Network - Volume 25, Number 11 (November 2000)
Managing Editor: Richard Wunderman
Heard (Australia)
Discovery of a distinct vent below Mawson Peak; brown fumes in November
Kaba (Indonesia)
Explosions and light gray ash
Karangetang (Indonesia)
February-December included explosions, ash falls, lava flows, and debris flows
Karkar (Papua New Guinea)
Rumored eruption on 29 September believed to stem from Ulawun's ash fall
Langila (Papua New Guinea)
Mild Vulcanian eruptions during July-October 2000
Manam (Papua New Guinea)
Low August-October 2000 activity; increased seismicity 18 September
Marapi (Indonesia)
Large explosions in March 2000 eject ash
Merapi (Indonesia)
Consistent gas plume; lava avalanches and landslide; new lava dome and fractures
Rabaul (Papua New Guinea)
Ashfall during August-October most abundant since 1995
Sheveluch (Russia)
Frequent steam plumes, weak tremor, and possible gas-and-ash explosions
Slamet (Indonesia)
During May-October 2000, continuous tremor and abundant explosion earthquakes
Tengger Caldera (Indonesia)
Sudden explosion 29 November; eruption continues as of 18 December
Ulawun (Papua New Guinea)
An eruption during 28 September-2 October 2000 sends a plume to 10-12 km
Heard (Australia) — November 2000 Cite this Report
Heard
Australia
53.106°S, 73.513°E; summit elev. 2745 m
All times are local (unless otherwise noted)
Discovery of a distinct vent below Mawson Peak; brown fumes in November
Activity from Mawson Peak, a discrete volcanic cone that lies atop Big Ben stratovolcano, was observed by the Australian National Antarctic Research Expedition (ANARE) during October-November 2000. Frequent cloud cover obscured Big Ben.
On 19 October, workers observed several hours of fumarolic activity from the RSV Aurora Australis while 2-3 km off the N shore of Heard Island between Corinthian and Spit Bays. Gaseous emissions were rising at least 200 m above the summit. During the early morning of 20 October, those aboard the ship observed similar continuing activity until clouds obscured the view. From the Red Island area at the W end of Heard Island, on 28 October strong fumarolic activity was seen emanating from the summit of Mawson Peak. Observers suggested the presence of a second emission point on the S slopes 100-200 m below the summit.
On 9 November, a helicopter flyover of Mawson Peak revealed that the crater and lava lake observed in 1987 were no longer visible. Instead, the summit had the form of a steep, irregular ice dome with gases venting through its apex (figure 4). The flyover also confirmed an apparently distinct area of activity 150-200 m below Mawson Peak near the head of Lied Glacier (Kiernan and McConnell, 2000). This newly discovered area was separated from the summit vent by several hundred meters of clean, white ice.
Reports of more than one red glow source from the 1950-52 and 1985 eruptive events hinted at the possible existence of a second vent on Big Ben (ANARE Station Reports, and Neumann van Padang, 1963). Recent failure to locate such a vent led Quilty and Wheller (2000) to conclude that the previously observed multiple red glows were attributable to magma ponded in the summit crater and lava flowing down Big Ben's flanks. Current observations, however, now suggest the presence of a separate, lower vent in the vicinity of the 1985 flow.
On 13 November observers from Fairchild Beach on the N coast of Heard Island noted brown fumes venting from the summit area. The following day, fumarolic activity was observed from a vantage point on the E moraine of Browns Glacier Lagoon on the N coast.
References. Kiernan, K., and McConnell, A., 2000, ASAC Project 1118, Geomorphological Evolution of Heard Island: Report to Atlas Cove Station Leader, ANARE.
Neumann van Padang, M., 1963, Arabia and the Indian Ocean: Catalogue of the Active Volcanoes of the World, v. 16, p. 1-64.
Quilty, P.G., and Wheller, G., 2000, Heard Island and the McDonald Islands: A window on the Kerguelen Plateau: Papers & Proceedings of the Royal Society of Tasmania, v. 133, no. 2, p. 1-12.
Geologic Background. Heard Island on the Kerguelen Plateau in the southern Indian Ocean consists primarily of the emergent portion of two volcanic structures. The large glacier-covered composite basaltic-to-trachytic cone of Big Ben comprises most of the island, and the smaller Mt. Dixon lies at the NW tip of the island across a narrow isthmus. Little is known about the structure of Big Ben because of its extensive ice cover. The active Mawson Peak forms the island's high point and lies within a 5-6 km wide caldera breached to the SW side of Big Ben. Small satellitic scoria cones are mostly located on the northern coast. Several subglacial eruptions have been reported at this isolated volcano, but observations are infrequent and additional activity may have occurred.
Information Contacts: Kevin Kiernan, Geography and Environmental Studies, University of Tasmania, GPO Box 252-79, Hobart TAS 7001, Australia.
Kaba (Indonesia) — November 2000 Cite this Report
Kaba
Indonesia
3.522°S, 102.615°E; summit elev. 1940 m
All times are local (unless otherwise noted)
Explosions and light gray ash
This report covers activity at Kaba documented by the Volcanological Survey of Indonesia (VSI) during August 2000. Deep volcanic earthquakes dominated seismicity during the second week of August. On 17 August seismographs recorded harmonic tremor with a maximum amplitude of 14 mm. Visual observations were hindered by clouds around the summit until the third week of the month. During 22-28 August, conditions were clear and a light gray ash plume rose 200 m above the summit. Five small explosion earthquakes were registered on 26-27 August, corresponding to the same number of observed ash emissions. By the end of August, the number of deep volcanic earthquakes decreased. Kaba remained at a hazard status of 2 (on a scale of 1-4) throughout the month.
Geologic Background. Kaba, a twin volcano with Mount Hitam, has an elongated summit crater complex dominated by three large historically active craters trending ENE from the summit to the upper NE flank. The SW-most crater of Gunung Kaba, named Hidup (or Lama), is the largest. Most historical eruptions have affected only the summit area. They mostly originated from the central summit craters, although the upper-NE flank crater Kawah Vogelsang also produced explosions during the 19th and 20th centuries.
Information Contacts: Dali Ahmad, Volcanological Survey of Indonesia (VSI), Jalan Diponegoro No. 57, Bandung 40122, Indonesia (URL: http://www.vsi.esdm.go.id/).
Karangetang (Indonesia) — November 2000 Cite this Report
Karangetang
Indonesia
2.781°N, 125.407°E; summit elev. 1797 m
All times are local (unless otherwise noted)
February-December included explosions, ash falls, lava flows, and debris flows
The following report covers activity during February to mid-December 2000. At the beginning of February, the main crater of Karangetang (also known as Api Siau) produced a light-colored ash emission that rose 250-350 m, while Crater II emitted a lighter ash plume to a height of 75-100 m. At night the ash column glowed red to a height of 10-25 m. Similar activity continued through May; variable-density emissions from the main crater rose to a maximum height of 500 m, those from Crater II rose up to 150 m, red illumination was visible up to 75 m at night, and rumbling was heard intermittently through May.
In mid-June tremor events with amplitudes of 0.5-10.5 mm dominated seismicity. Ash plumes continued to rise from both craters, and lava fountaining was observed at the main crater. A lava flow and a debris avalanche sent material up to 300 m from the summit down to the Bahembang River. Red summit illumination was visible at night. Another lava flow and debris avalanche occurred in late June, lava fountains reached 50 m above the summit at times, and the maximum amplitude for tremor was 33 mm in early September. Relatively similar activity persisted through the end of the month.
During mid-October, activity increased significantly. The two craters continued to emit light-colored, variable-density ash plumes, and thundering could be heard. At 1840 on 14 October, observers saw lava flowing 100 m down to the Nenitu River. Lava avalanches traveled up to 1,000 m from the summit. Seismicity increased notably with many A-type earthquakes, tectonic earthquakes, explosive events, and continuous tremor. At 1131 on 27 October, a small explosion sent a dark ash plume to a height of 1 km. An ash cloud drifted E to the sea, while pyroclastic flows burned vegetation along their paths and reached ~1,500 m down the E, W, and S flanks. During this period, multi-phase earthquakes occurred and tremor became discontinuous.
Another explosion at 2030 on 2 November sent dark ash 1.5 km above the summit. Ashfall and pyroclastic flows occurred along the flanks; ash followed a similar pattern of distribution as after the 27 October explosion. Seismicity quieted slightly following this explosion. A smaller explosion occurred on 11 November and dark ash rose 600 m. Ash fell around the summit area, and no injuries were reported. Red illumination at night and frequent booming sounds accompanied ash plumes that continued to rise from the main crater and Crater II during October-November.
Seismicity increased by 12 December with nearly fifteen times as many multi-phase earthquakes as in late November, and the resumption of continuous tremor. Thundering sounds continued to be heard often, and red summit illumination could be observed occasionally at night. The main crater and Crater II emitted a light-colored, variable-density ash plume to 150 m above Karangetang's summit. The volcano maintained a hazard status of 2 (on a 1-4 scale) during the report period.
Geologic Background. Karangetang (Api Siau) volcano lies at the northern end of the island of Siau, about 125 km NNE of the NE-most point of Sulawesi. The stratovolcano contains five summit craters along a N-S line. It is one of Indonesia's most active volcanoes, with more than 40 eruptions recorded since 1675 and many additional small eruptions that were not documented (Neumann van Padang, 1951). Twentieth-century eruptions have included frequent explosive activity sometimes accompanied by pyroclastic flows and lahars. Lava dome growth has occurred in the summit craters; collapse of lava flow fronts have produced pyroclastic flows.
Information Contacts: Dali Ahmad, Volcanological Survey of Indonesia (VSI), Jalan Diponegoro No. 57, Bandung 40122, Indonesia (URL: http://www.vsi.esdm.go.id/).
Karkar (Papua New Guinea) — November 2000 Cite this Report
Karkar
Papua New Guinea
4.647°S, 145.976°E; summit elev. 1839 m
All times are local (unless otherwise noted)
Rumored eruption on 29 September believed to stem from Ulawun's ash fall
On 29 September there were reports of light ash fall on the NE coast of Karkar island, and fine sand deposits were found at the bottom of a swimming pool. The ash fall led to the rumor that Karkar volcano had erupted. However, an aerial inspection of the central caldera and Bagiai cone on 1 October showed that no eruptive activity had taken place. Volcanologists believe that the ash most likely originated from an eruption at Ulawun, which, at its peak on 29 September, had an eruption column to 12-15 km altitude. Ash erupted to those heights would have been taken well into the jet stream and could have been transported to Karkar, which is located 600 km to the W (downwind at high altitudes) of Ulawun. There have been no reports of anomalous activity at Karkar since fumarolic gases killed vegetation in September 1997 (BGVN 22:09).
Geologic Background. Karkar is a 19 x 25 km forest-covered island that is truncated by two nested summit calderas. The 5.5 km outer caldera was formed during one or more eruptions, the last of which occurred 9,000 years ago. The steep-walled 300-m-deep, 3.2 km diameter, inner caldera was formed sometime between 1,500 and 800 years ago. Cones are present on the N and S flanks of this basaltic-to-andesitic volcano; a linear array of small cones extends from the northern rim of the outer caldera nearly to the coast. Recorded eruptions date back to 1643 from Bagiai, a pyroclastic cone constructed within the inner caldera, the floor of which is covered by young, mostly unvegetated andesitic lava flows.
Information Contacts: Ima Itikarai, David Lolok, Herman Patia, and Steve Saunders, Rabaul Volcano Observatory (RVO), P.O. Box 386, Rabaul, Papua New Guinea.
Langila (Papua New Guinea) — November 2000 Cite this Report
Langila
Papua New Guinea
5.525°S, 148.42°E; summit elev. 1330 m
All times are local (unless otherwise noted)
Mild Vulcanian eruptions during July-October 2000
The mild Vulcanian eruptive activity that occurred at Langila's Crater 2 through June 2000 (BGVN 25:07) continued during July-October 2000. In addition, low-level volcanic activity continued at Crater 3. No reports of unusual activity were submitted during July and August.
During September, intermittent, mild Vulcanian activity occurred at Crater 2. The activity consisted of moderate emissions of thin-to-thick white vapor, which were occasionally accompanied by gray ash clouds. On 21, 25, and 30 September thick, dark gray, convoluting ash clouds were forcefully released, rose 200 m above the summit, blew to the N and NW, and deposited fine ash. On 7, 9-11, and 27 September wisps of blue vapor accompanied the emissions. During the month volcanic activity was low at Crater 3, with only thin white vapor sporadically visible.
Through October intermittent, mild Vulcanian eruptions continued at Crater 2. The vent usually emitted white vapor, which was sometimes accompanied by a blue tinge and occasionally by a light ash component. On 8 October a forceful emission of thick ash rose to 1 km above the crater rim. This heralded a few days of increased ash emissions, with some forcefully expelled light gray/brown clouds on the 15th. During 16-24 October continuous white vapor emissions with a small ash component were common. At 0801 on 24 October a dark gray-to-black ash column rose 1 km above the crater rim. On 25 October an ash cloud that rose to 2 km above the crater deposited ash toward the N. Likewise, at 0655 on 26 October a thick, white vapor plume was accompanied by an ash column that rose to 1 km above the crater rim. The ash emissions continued throughout the day, and similar activity occurred the next day. For the rest of the month activity was confined to white vapor with an occasional ash component. During October varying amounts of white fume were emitted from Crater 3. Throughout the period there were no reports of noises or night glow at the volcano; the seismograph remained out of operation.
Geologic Background. Langila, one of the most active volcanoes of New Britain, consists of a group of four small overlapping composite basaltic-andesitic cones on the lower E flank of the extinct Talawe volcano in the Cape Gloucester area of NW New Britain. A rectangular, 2.5-km-long crater is breached widely to the SE; Langila was constructed NE of the breached crater of Talawe. An extensive lava field reaches the coast on the N and NE sides of Langila. Frequent mild-to-moderate explosive eruptions, sometimes accompanied by lava flows, have been recorded since the 19th century from three active craters at the summit. The youngest and smallest crater (no. 3 crater) was formed in 1960 and has a diameter of 150 m.
Information Contacts: Ima Itikarai, David Lolok, Herman Patia, and Steve Saunders, Rabaul Volcano Observatory (RVO), P.O. Box 386, Rabaul, Papua New Guinea.
Manam (Papua New Guinea) — November 2000 Cite this Report
Manam
Papua New Guinea
4.08°S, 145.037°E; summit elev. 1807 m
All times are local (unless otherwise noted)
Low August-October 2000 activity; increased seismicity 18 September
Following the 4 June 2000 eruption at Southern Crater (BGVN 25:07), volcanic activity was low at both summit craters through October 2000. Seismicity remained relatively stable except for a slight increase in amplitudes beginning on 18 September.
During August, activity at the two summit craters was low. Main Crater gently emitted small-to-moderate volumes of white vapor, while Southern Crater weakly emitted white vapor. Seismic-event amplitudes steadily increased throughout the month, though the overall trend remained within background levels. Daily average event counts were about 1,200, with some fluctuations. No significant movements were recorded by the water-tube tiltmeter 4 km SW of the summit.
Activity remained low throughout September, with vapor emissions from both craters similar to those in August. Seismic amplitudes were steady until 18 September when a slight increase was observed that continued through the end of the month. Daily average seismic event counts remained steady, with about 1,300 events/day.
Throughout October both craters emitted varying amounts of white vapor, and there were no reports of noise or night glow. Seismicity and tilt measurements appeared to remain at background levels, although consistent measurements could not be made because scientists did not have access to the Tabele Observatory during 5-21 October.
Geologic Background. The 10-km-wide island of Manam, lying 13 km off the northern coast of mainland Papua New Guinea, is one of the country's most active volcanoes. Four large radial valleys extend from the unvegetated summit of the conical basaltic-andesitic stratovolcano to its lower flanks. These valleys channel lava flows and pyroclastic avalanches that have sometimes reached the coast. Five small satellitic centers are located near the island's shoreline on the northern, southern, and western sides. Two summit craters are present; both are active, although most observed eruptions have originated from the southern crater, concentrating eruptive products during much of the past century into the SE valley. Frequent eruptions, typically of mild-to-moderate scale, have been recorded since 1616. Occasional larger eruptions have produced pyroclastic flows and lava flows that reached flat-lying coastal areas and entered the sea, sometimes impacting populated areas.
Information Contacts: Ima Itikarai, David Lolok, Herman Patia, and Steve Saunders, Rabaul Volcano Observatory (RVO), P.O. Box 386, Rabaul, Papua New Guinea.
Marapi (Indonesia) — November 2000 Cite this Report
Marapi
Indonesia
0.38°S, 100.474°E; summit elev. 2885 m
All times are local (unless otherwise noted)
Large explosions in March 2000 eject ash
At 0553 on 11 March 2000, a significant explosion ejected thick black ash that rose 1,400 m above the summit. Explosions and ash emissions continued and increased in magnitude. At 0944 on the following day, a large explosion was heard more than 25 km away in the community of Bukittinggi. The explosion sent thick, black ash to a height of 3,000 m. Ashfall was reported ~350 km N of Marapi on the Lima Kaun District of Tanah Datar. Both major explosions were immediately preceded by shallow volcanic (B-type) earthquakes, while heightened seismicity, especially A- and B-type earthquakes, occurred up to a week before the explosions.
By 14 March explosions and ash emissions were continuing with decreased intensity. The gray-black plume rose 200 m above the crater rim. The following week seismicity increased notably with all earthquakes types increasing in number. During the [week of 28 March-3 April], black ash emissions continued to rise 100-200 m. Seismicity increased slightly compared to the previous week, but remained much lower than when the explosions initiated.
Geologic Background. Gunung Marapi, not to be confused with the better-known Merapi volcano on Java, is Sumatra's most active volcano. This massive complex stratovolcano rises 2,000 m above the Bukittinggi Plain in the Padang Highlands. A broad summit contains multiple partially overlapping summit craters constructed within the small 1.4-km-wide Bancah caldera. The summit craters are located along an ENE-WSW line, with volcanism migrating to the west. More than 50 eruptions, typically consisting of small-to-moderate explosive activity, have been recorded since the end of the 18th century; no lava flows outside the summit craters have been reported in historical time.
Information Contacts: Dali Ahmad, Volcanological Survey of Indonesia (VSI), Jalan Diponegoro No. 57, Bandung 40122, Indonesia (URL: http://www.vsi.esdm.go.id/).
Merapi (Indonesia) — November 2000 Cite this Report
Merapi
Indonesia
7.54°S, 110.446°E; summit elev. 2910 m
All times are local (unless otherwise noted)
Consistent gas plume; lava avalanches and landslide; new lava dome and fractures
During June 1999-July 2000, Merapi consistently emitted a low-density, sulfur-rich, light-colored gas plume that ranged from 150 to 1,500 m above the summit. Frequent lava avalanches toward the nearby Blongkeng, Lamat, Sat, and Senowo River drainages reached maximum distances of 2 km. Lava avalanches glowed at night, although no incandescence could be observed inside the summit's lava dome. Tiltmeters lacked significant deformational changes, although a summit visit on 13 May 2000 revealed that the 1998 lava dome was growing. Lava avalanches and multi-phase earthquakes dominated seismicity. No lahars were observed during the period.
At the end of July 2000 low-intensity glow from the lava dome was observed. Seismicity increased in the first week of August with a few deep (A-type) and shallow (B-type) earthquakes. Emissions remained similar in consistency to those of the previous months, and rose 160 m above the summit. The hazard level was raised from 1 to 2 (on a 1-4 scale). The following week seismicity continued to increase, exemplified by a M 2.8 B-type event. Gas emissions rose up to 385 m above the summit. During the third week of August, volcanic and seismic activity continued to increase with gas emissions rising 460 m and greater numbers of A- and B-type earthquakes. Surficial events still dominated the overall seismicity. Plumes rose up to 700 m in the final week of August.
Activity remained similar to the previous weeks during September-October. Emissions continued to rise from 250 to 650 m high. The volume of emitted material was estimated to be 169 tons/day at the end of September. Seismicity changed little until late October, when volcanic tremor was recorded.
On 31 October a team from the Merapi Volcano Observatory (MVO) performed summit observations. The team noted that lava avalanches from the 1957 dome had filled the upper stream beds of the Senowo and Trising Rivers. The active 1998 lava dome was lifted on its W side and split in half. A newly formed dome between the two older sides had an elongated E-W-trending shape. Concentric and radial fractures were observed on the N and SW portions of the summit crater, and some fractures showed significant dilation. Radial fractures N of the summit crater and on the floor of Puncak Garuda appeared to have been sutured and then redeveloped to form a normal fault with a total offset of 30 cm. A fracture located between the 1957 and 1948 domes opened 20.5 cm during 14 May-1 November 2000.
High rainfall during the second week in November caused a landslide at the source of the Boyong River near Kaliurang, causing one death. At the end of November, Merapi still emitted a gaseous plume from its summit. Seismographs continued to register A- and B-type earthquakes, although multi-phase earthquakes dominated the record. The volcano remained at Hazard Level 2.
Geologic Background. Merapi, one of Indonesia's most active volcanoes, lies in one of the world's most densely populated areas and dominates the landscape immediately north of the major city of Yogyakarta. It is the youngest and southernmost of a volcanic chain extending NNW to Ungaran volcano. Growth of Old Merapi during the Pleistocene ended with major edifice collapse perhaps about 2,000 years ago, leaving a large arcuate scarp cutting the eroded older Batulawang volcano. Subsequent growth of the steep-sided Young Merapi edifice, its upper part unvegetated due to frequent activity, began SW of the earlier collapse scarp. Pyroclastic flows and lahars accompanying growth and collapse of the steep-sided active summit lava dome have devastated cultivated lands on the western-to-southern flanks and caused many fatalities.
Information Contacts: Dali Ahmad, Volcanological Survey of Indonesia (VSI), Jalan Diponegoro No. 57, Bandung 40122, Indonesia (URL: http://www.vsi.esdm.go.id/).
Rabaul (Papua New Guinea) — November 2000 Cite this Report
Rabaul
Papua New Guinea
4.2459°S, 152.1937°E; summit elev. 688 m
All times are local (unless otherwise noted)
Ashfall during August-October most abundant since 1995
This report, which covers the period from August through October 2000, notes that Vulcanian eruptions prevailed at Tavurvur during 29 August through October 2000. These eruptions bore far more ash than typical. Substantial amounts of ash blew towards the city of Rabaul and other inhabited areas. During the second and third weeks of September the amount of ash falling reached a maximum since the current eruption began on 28 November 1995.
On 2 and 9 August eruptive plumes contained ash. At other times during August vent activity was relatively low, consisting only of small volumes of thin white vapor. The 29 August eruption changed this pattern.
Although the main phase of the 29 August eruption began at 1158, it was preceded by a series of weak explosions yielding dark gray ash plumes. After these less-forceful explosive events ended, moderate volumes of dark gray ash clouds erupted. Subsequently, and through 8 September, the eruption pattern was comprised of interchanging periods of either continuous, moderate-volume ash emissions or relatively subdued ash-cloud emissions typically white to pale gray in color.
At about 2200 on 8 September, the eruption became more intense, frequent, and discrete explosions producing thick billowing dark ash clouds. Throughout the rest of September, periods of sub-continuous ash emissions occurred. After 21 September, however, discrete explosions and sub-continuous ash emissions declined and continued at a subdued level. Throughout September, observers saw incandescent lava fragments occasionally ejected. Residents saw these ejected fragments more frequently after the onset of explosive activity on 8 September, and around this time the residents regularly noted audible noises associated with venting.
Explosions every few minutes produced sub-continuous moderate to heavy ash emissions that continued in October. Some of the larger explosions showered the N and NE flanks of the volcano with bombs. At night these were seen to be incandescent (red to dull orange). On inspection most projectiles were lithic blocks, but a minority were in a plastic state with some bread-crust surfaces. Jet-aircraft-like roaring from the vent was common and some of the larger explosions could be heard at distances of over 15 km. Toward the end of October, the explosions were less forceful, but contained increased volumes of solid fragments.
All activity during the reporting period appears to have been confined to the 1941 vent; the 1995 crater issued only white vapor. The current phase enlarged the vent as a result of explosive activity. The N crater was breached, forming a saddle-like depression in the rim reaching about 15-20 m lower than the originally symmetrical and level line comprising the ridge.
During the first 2-3 weeks of September ash clouds rose as high as 2 km above the summit. As previously noted, many plumes blew N and NW to drop ash on inhabited areas. As a result, many Rabaul businesses were adversely affected and, by the end of the September, some had moved ~40 km SE of Rabaul to the settlement of Kokopo. The major health center in Rabaul town was also affected and patients with respiratory problems were moved to another health center near Kokopo. During early October the ashfalls caused patients to undergo evacuation from Nonga Hospital (5 km NNW of Rabaul). Toward the end of October the annual change in the trade winds caused less ashfall in Rabaul town; frequent heavy rains around this time also provided relief from suspended dust.
Seismicity correlated fairly directly with behavior observed at the summit, and accordingly, seismic activity remained relatively low until the onset of the eruption. The total number of low-frequency earthquakes recorded during August was 208, with the largest daily number of 35 on 30 August. This monthly total was slightly higher than that in July. During the main episodes of ash eruption between 29 August and 8 September, seismicity was characterized by bands of non-harmonic volcanic tremor. Bands of volcanic tremor with reduced amplitude were recorded again during 17-19 September and, until the end of the month, seismicity included sporadic short-duration tremor associated with sub-continuous ash ejections.
For August and September, respective high-frequency earthquakes totaled 17 and 8; all occurred NE of Rabaul caldera. The time difference between S- and P-wave arrivals for these events (S minus P) was 3-6 seconds. Since 28 November 1995, strings or significant numbers of high-frequency NE earthquakes have correlated with greater summit activity at Tavurvur. The time interval from the onset of the high-frequency earthquakes to greater summit activity ranged between one week to a few months. Rabaul's last major NE earthquake sequence occurred during May-June 2000 (see BGVN 25:07).
During September a total of 3,661 low-frequency earthquakes were recorded. This total includes explosion earthquakes (with air phases). When like earthquake records were compared, the September record attained the highest total since May 1996 (when 3,993 such earthquakes were recorded). September's highest daily total, 228, was recorded on 11 September; the lowest total, 3, was recorded on 4 and 7 September, occurring on days when tremor dominated the seismicity. October seismicity included 2,544 low-frequency earthquakes.
Ground deformation measurements from electronic and wet tiltmeters showed some caldera inflation from July 1999 to April 2000. After April, the trend changed to show deflation until about August 2000. Tiltmeters registered slow inflation during the first few days of September, followed by subsidence, and then stable conditions on 8 September. Some deformation-monitoring sites in the area of Tavurvur seemed to indicate a deflationary trend starting in late September and continuing through October.
Geologic Background. The low-lying Rabaul caldera on the tip of the Gazelle Peninsula at the NE end of New Britain forms a broad sheltered harbor utilized by what was the island's largest city prior to a major eruption in 1994. The outer flanks of the asymmetrical shield volcano are formed by thick pyroclastic-flow deposits. The 8 x 14 km caldera is widely breached on the east, where its floor is flooded by Blanche Bay and was formed about 1,400 years ago. An earlier caldera-forming eruption about 7,100 years ago is thought to have originated from Tavui caldera, offshore to the north. Three small stratovolcanoes lie outside the N and NE caldera rims. Post-caldera eruptions built basaltic-to-dacitic pyroclastic cones on the caldera floor near the NE and W caldera walls. Several of these, including Vulcan cone, which was formed during a large eruption in 1878, have produced major explosive activity during historical time. A powerful explosive eruption in 1994 occurred simultaneously from Vulcan and Tavurvur volcanoes and forced the temporary abandonment of Rabaul city.
Information Contacts: Ima Itikarai, David Lolok, Herman Patia, and Steve Saunders, Rabaul Volcano Observatory (RVO), P.O. Box 386, Rabaul, Papua New Guinea.
Sheveluch (Russia) — November 2000 Cite this Report
Sheveluch
Russia
56.653°N, 161.36°E; summit elev. 3283 m
All times are local (unless otherwise noted)
Frequent steam plumes, weak tremor, and possible gas-and-ash explosions
This report covers 20 October-15 November 2000. At the end of October, the hazard status was Yellow. During 22-23 October, seismographs recorded weak continuous tremor and small shallow earthquakes. On 24, 26, and 28 October, shallow seismic events indicated possible explosions. Plume height was estimated at 700-1,200 m above the summit; heights were inferred by correlating previous observed ash-clouds with magnitudes of associated explosions. On 25 October, a gas-and-steam plume rose 200 m above the summit dome. A gas-and-steam plume on the 29th rose 700 m and extended more than 5 km E and NW.
During the first week of November, gas-and-steam plumes ranged from 100 to 300 m above the summit, with one on the 7th rising 1.5 km. Seismicity was at background levels during 10-16 November, although a gas-and-steam plume rose 600 m on 16 November. The hazard status was downgraded to Green the following day. Late on 20 November, however, frequent shallow seismic events suggested that gas-and-ash explosions rose to heights of 3.2 km. Gas-and-steam plumes on 19, 20, 21, and 23 November to respective heights of ~2 km, 1 km, 350 m, and 350 m. By the end of November, little seismicity was registered; only three deep M < 1 earthquakes were recorded. On 24 November, a gas-and-steam plume rose 400 m above the dome and drifted 5 km to the E. At 0935 on 27 November, seismographs detected a strong shallow seismic event.
Shiveluch's hazard status was elevated to Yellow on 1 December. A possible explosion the evening of 6 December was followed by tremor. A similar event the following afternoon produced a cloud estimated from seismic data to have risen 700-1,200 m. Weak seismicity was recorded for most of the second week in December. Possible explosions on 9 and 12 December were again suggested by shallow seismic events. Seismographs recorded tremor for 30 minutes after the 9 December explosion, and for 1 hour after the 12 December event; workers estimated plume heights of 700 m for both. On 13 December a gas-and-steam plume rose 200 m. Shiveluch's extrusive dome and W summit crater wall were observed to be coated with ash, likely from the 12 December explosion.
Geologic Background. The high, isolated massif of Sheveluch volcano (also spelled Shiveluch) rises above the lowlands NNE of the Kliuchevskaya volcano group. The 1,300 km3 andesitic volcano is one of Kamchatka's largest and most active volcanic structures, with at least 60 large eruptions during the Holocene. The summit of roughly 65,000-year-old Stary Shiveluch is truncated by a broad 9-km-wide late-Pleistocene caldera breached to the south. Many lava domes occur on its outer flanks. The Molodoy Shiveluch lava dome complex was constructed during the Holocene within the large open caldera; Holocene lava dome extrusion also took place on the flanks of Stary Shiveluch. Widespread tephra layers from these eruptions have provided valuable time markers for dating volcanic events in Kamchatka. Frequent collapses of dome complexes, most recently in 1964, have produced debris avalanches whose deposits cover much of the floor of the breached caldera.
Information Contacts: Olga Chubarova, Kamchatka Volcanic Eruptions Response Team (KVERT), Institute of Volcanic Geology and Geochemistry, Piip Ave. 9, Petropavlovsk-Kamchatsky, 683006, Russia; Tom Miller, Alaska Volcano Observatory (AVO), a cooperative program of a) U.S. Geological Survey, 4200 University Drive, Anchorage, AK 99508-4667, USA (URL: http://www.avo.alaska.edu/), b) Geophysical Institute, University of Alaska, PO Box 757320, Fairbanks, AK 99775-7320, USA, and c) Alaska Division of Geological & Geophysical Surveys, 794 University Ave., Suite 200, Fairbanks, AK 99709, USA.
Slamet (Indonesia) — November 2000 Cite this Report
Slamet
Indonesia
7.242°S, 109.208°E; summit elev. 3428 m
All times are local (unless otherwise noted)
During May-October 2000, continuous tremor and abundant explosion earthquakes
The following report covers mid-May to late October 2000. Activity increased during the third week of May when tremor events commonly reached amplitudes of 0.5-10 mm, and a white low-density plume rose 50-400 m above the summit. By the second week of June maximum tremor amplitudes reached 15 mm. A white gas-rich plume rose up to 200 m above the summit. In the last week of July, seismographs recorded 713 small explosion earthquakes along with tremor, and a dense white plume rose 300 m.
Similar activity persisted through mid-September, when tremor became continuous. The number of small explosion earthquakes increased; seismographs registered 3,244 events during 19-25 September, and 3,765 were registered during 26 September-2 October. A white, variable-density plume erupted continuously during the latter period. After 3 October, however, activity decreased significantly with explosion earthquakes decreasing in number to 199 during the next week. By mid-October both visual and instrumental monitoring confirmed a decrease in eruptive energy. Near the end of the month a low-density plume rose up to 300 m above the summit, but only volcanic tremor was recorded.
Geologic Background. Slamet is one of Java's most active volcanoes. It has a cluster of about three dozen cinder cones on its lower SE-NE flanks and a single cinder cone on the W flank. It is composed of two overlapping edifices, an older basaltic andesite to andesitic volcano on the west and a younger basaltic to basaltic andesite one on the east. Gunung Malang II cinder cone on the upper E flank on the younger edifice fed a lava flow that extends 6 km E. Four craters occur at the summit of Gunung Slamet, with activity migrating to the SW over time. Eruptions recorded since the 18th century have originated from a 150-m-deep, 450-m-wide, steep-walled crater at the western part of the summit and have consisted of explosive eruptions generally lasting a few days to a few weeks.
Information Contacts: Dali Ahmad, Volcanological Survey of Indonesia (VSI), Jalan Diponegoro No. 57, Bandung 40122, Indonesia (URL: http://www.vsi.esdm.go.id/).
Tengger Caldera (Indonesia) — November 2000 Cite this Report
Tengger Caldera
Indonesia
7.942°S, 112.95°E; summit elev. 2329 m
All times are local (unless otherwise noted)
Sudden explosion 29 November; eruption continues as of 18 December
A minor explosion issued from Bromo, the youngest cone of the Tengger volcanic complex (figure 3), without warning on 29 November 2000. Activity leading up to the explosion was low, characterized by a white plume that rose ~50 m on a daily basis (figure 4). The seismograph for the area was in disrepair since 18 October, so no seismic data were available. The explosion initiated with dark ash rising 100-150 m. Ash ejection persisted, reached 600-700 m in height above the crater rim, and the plume drifted up to 40 km from Bromo, where ash was deposited in layers 1-3 cm thick. A volcanic ash advisory was issued to aviators due to a plume ~1.2 km above the summit. Pilots were encouraged to navigate around the plume in order to avoid a potentially dangerous encounter. Following the explosion, the Volcanological Survey of Indonesia (VSI) repaired and upgraded the seismograph on the volcano.
Ongoing explosions and continuous tremor accompanied the volcanic activity during 5-11 December. Explosion earthquakes had amplitudes of 4-30 mm, while tremor had amplitudes of 2-6 mm. As of 5 December, the ash ejection was dark gray-brown in color, and smelled strongly of sulfur. Ash plumes rose 150-900 m over the following week, and by 8 December, satellite imagery showed convective clouds in the vicinity, and volcanic ash advisories indicated that the ash cloud had drifted to ~6.8 km above and E of the summit. The hazard status for Bromo cone placed at 2 (on a 1-4 scale). Explosions and tremor activity were ongoing and increased during the week of 12-18 December. Small explosions sent gray-brown to dark gray ash 500-600 m above the crater rim. A sulfur odor continued to be smelled at the observatory on the caldera rim (figure 5). Amplitudes for explosion earthquakes and tremor earthquakes were 5-34 mm and 1-5 mm, respectively. The seismograph recorded an unprecedented 2,375 explosion earthquakes in addition to continuous tremor.
Geologic Background. The 16-km-wide Tengger caldera is located at the northern end of a volcanic massif extending from Semeru volcano. The massive volcanic complex dates back to about 820,000 years ago and consists of five overlapping stratovolcanoes, each truncated by a caldera. Lava domes, pyroclastic cones, and a maar occupy the flanks of the massif. The Ngadisari caldera at the NE end of the complex formed about 150,000 years ago and is now drained through the Sapikerep valley. The most recent of the calderas is the 9 x 10 km wide Sandsea caldera at the SW end of the complex, which formed incrementally during the late Pleistocene and early Holocene. An overlapping cluster of post-caldera cones was constructed on the floor of the Sandsea caldera within the past several thousand years. The youngest of these is Bromo, one of Java's most active and most frequently visited volcanoes.
Information Contacts: Dali Ahmad, Volcanological Survey of Indonesia (VSI), Jalan Diponegoro No. 57, Bandung 40122, Indonesia (URL: http://www.vsi.esdm.go.id/); Darwin Volcanic Ash Advisory Centre (VAAC), Bureau of Meteorology, Northern Territory Regional Office, PO Box 40050, Casuarina, NT 0811, Australia (URL: http://www.bom.gov.au/info/vaac/).
Ulawun (Papua New Guinea) — November 2000 Cite this Report
Ulawun
Papua New Guinea
5.05°S, 151.33°E; summit elev. 2334 m
All times are local (unless otherwise noted)
An eruption during 28 September-2 October 2000 sends a plume to 10-12 km
An eruption from Ulawun that started on 28 September continued until 2 October 2000 (BGVN 25:08). Preliminary information was based on news media reports and aviation sources. The Rabaul Volcano Observatory (RVO) has since provided more accurate and detailed reports for the August-October 2000 period.
Activity during August. During August, summit activity remained low, chiefly consisting of weak releases of thin white vapor. While the summit activity remained quiet, some obvious changes were recorded in seismicity and ground deformation (electronic tiltmeter).
High-frequency earthquakes had occurred sporadically since mid-1998 in very low numbers (~1/day). A brief period of recording in April 2000 registered ~ 2/day. In mid-June 2000, following the resumption of seismic recording, high-frequency earthquakes were first seen to have increased to 15-20/day. This comparatively high number of earthquakes continued through July and August. Deployment of a portable seismograph during 13-15 August indicated these earthquakes had epicenters at Ulawun.
During August, low-frequency earthquakes occurred as usual. On about 26 August, both amplitudes and event counts dropped by a factor of three. Also beginning in August, an electronic tiltmeter located on the flanks ~2.5 km WSW of the crater vent began to show some inflation on the NS component. By month-end about 7 µrad of inflationary tilt was recorded. The EW component (radial to the vent) lacked changes.
Eruption of 28 September-2 October. A relatively small-to-moderate eruption began on 28 September 2000. Several long-term precursors to the eruption were unambiguous. High-frequency earthquakes increased dramatically after June 2000. Electronic tiltmeter trends showed inflation beginning in early August 2000. Short-term, immediate precursors included an increase in both the number of low-frequency earthquakes and the real-time seismic amplitude measurements (RSAM). The latter began to escalate on 27 September 2000.
The late-stage build-up towards the eruption began at 2200 on 27 September with an increase in low-frequency earthquakes and their amplitudes. A further increase in seismicity took place at about 0200 on the 28th. There began a series of small nonharmonic volcanic tremors with durations up to a few minutes. These increased between 1200 and 1800 on the 28th.
The late-stage buildup also appeared in RSAM readings. RSAM values changed at 2200 on the 27th from a background level of 2 units, rising at 1200 on the 28th to ~10 units, then by 1800 to 30 units. After 1800, RSAM values continued to rise and the instruments registered intense continuous volcanic tremor. Around this time the RSAM counts exhibited an artificial decline attributed to an overwhelmed event-counting system.
Other notable changes in the character of the RSAM plot occurred at 2240 on the 28th, and at 0115 and 0240 on the 29th. The first two times correlated with behavior noted by the observer watching the summit crater. Specifically, at 2240 on the 28th the observer saw the first glow reflecting off an ash-cloud emission. RVO scientists mark this as the beginning of the eruption. At 0120 on the 29th, production of incandescent lava fragments intensified, indicating the onset of a Strombolian eruption.
At 0240 on 29 November, the RSAM peaked at 8045 units. Thus, scientists inferred this as the time when the Strombolian phase of the eruption peaked. During the cover of darkness, ash clouds were just visible, initially illuminated by the glow and gradually by incandescent fragments. The latter became common by about 1200 on the 29th when ash clouds were seen blowing NW. The ash clouds began to become voluminous from 0100 on the 29th, coinciding with the intensification of the Strombolian phase of the eruption. The ash clouds were emitted forcefully, accompanied by loud roaring and rumbling noises.
By first light on 29 September people some distance away from Ulawun were able to see a thick vertical eruption column that rose ~12-15 km above the summit (figure 2). In relatively clear morning weather, the eruption column was visible from Rabaul, ~130 km NE of Ulawun. By this time ash clouds had blown WSW to NW. Roaring and rumbling noises ceased at about 1000 and resumed again at about 1300. At about this time also, there was a slight and brief change in wind direction resulting in the eruption's ash clouds being redirected to the N and NE.
The eruption continued into the night of 29 September, forcefully ejecting thick, dark, and ash-laden clouds. Explosive roaring and rumbling noises stopped at about 2200 on 29 September and projections of incandescent lava fragments began to subside at about the same time. By 0230 on 30 September, strong discharges had already stopped and glow at the summit had ceased. When daylight came, the summit activity was relatively quiet, involving only puffs of small dark gray ash clouds. A further decline reduced emissions to very thin white vapor by nightfall.
The eruption produced a moderate amount of ashfall. Ashfall was heavy 10 km downwind of the vent. Beyond that, the amount of ashfall was much reduced, lessening still further away from the vent. The ashfall destroyed gardens and cash-crop plantations within 10 km of its main path. Satellite images of the ash distribution showed that the ash was blown downwind 80-100 km from the vent.
The eruption produced three pyroclastic flows. They traveled down pre-existing gullies on the N, NW, and SE flanks. During past eruptions, pyroclastic flows also followed the same gullies down from the cone's 2,300 m summit elevation. The N-directed pyroclastic flow was the biggest. It descended to 580 m elevation. The NW-directed pyroclastic flow was the second biggest. It divided into two arms at 900 m elevation and its terminus reached an elevation similar to the one on the N flank. The SE flow was relatively small. The eruption lacked lava flows.
Scientists inspected the crater area from the air on 7 October and found two vents on the summit (labeled Vents A and B on figure 3). Comparing Vent A to its appearance during 1993, the overall depth of the crater floor appeared to have risen, becoming about 100-150 m shallower. The fill consisted of older material that collapsed from the inner crater wall and possibly new ejecta from the current eruption. A prominent breach on the N crater rim was evident and may have been created by the N pyroclastic flow. Judging by its close proximity, this flow originated from Vent B. En-echelon cracks on the E end of the crater suggested inward sagging of that side of the crater rim. At the time of the inspection, few emissions escaped the vents; however, traces of white and blue vapor wafted from other areas inside the crater.
There were reports of multiple vents during past eruptions. However, aerial inspections in 1985 and 1993 only revealed evidence of Vent A. Ulawun had a flank eruption on the SE side during the 1978 eruption.
RVO staff in Rabaul established communication links with the volcano observer based near Ulawun at 1606 on 27 September after noting increased RSAM values. Data from Ulawun were transmitted to RVO every 20 minutes. The RSAM values led to discussions with civil authorities and directions to local residents throughout the night at two-hour intervals. During the process, alert stages one and two were declared. This resulted in evacuating the local population, an effort accomplished with the help of a local timber company. Assistance was later provided by the West New Britain Provincial Government. This time-line of events is contrary to preliminary information (BGVN 25:08). that relied on local news media.
Activity during October. By 3 October the volcano produced only thin white vapor with no noise or night glow. Various ancillary observations occurred in the next weeks: during 6, 8, 10, 14, 15, 16, 17, 18 October and 1 November observers noted low rumbling or banging or both; when under cover of darkness they usually saw accompanying weak, steady glows. In at least one case they smelled sulfurous odors.
The noises at 1000 on 1 November accompanied a thick dark ash cloud that rose 100-200 m above the summit. By 1100 silent ash clouds were seen forcefully rising ~200 m above the summit. Activity then declined for a few hours until 1430-1700, an interval when observers saw thick dark gray ash clouds and occasionally heard weak rumblings. Activity quieted after that and by 2 November emissions had returned to white vapor without noise or night glow.
On 13 and 17 October small mudflows occurred, originating on the upper NW flanks and sweeping down a dry creek through Ubili village and then to the sea. At certain places the flows spread laterally. No reported damage or casualties were caused by either mudflow.
October seismicity included tremor and numerous low-frequency earthquakes. Volcanic tremors were dominant during 1-4, 8-11, and 30-31 October. The low-frequency earthquakes can be characterized by RSAM data. On 1 October RSAM stood at ~30-40 units; steady decline brought the 7 October RSAM to ~5 units. On the 8th and 11th there followed peaks of over 20 units. After that RSAM declined steadily until it reached background levels on 20 October. On 30 October, RSAM underwent a sudden increase to ~20-30 units heralding the brief 1 November eruption.
The single electronic tiltmeter located on the high WSW flank showed a steady change throughout October. The behavior could possibly be related to edifice inflation.
Geologic Background. The symmetrical basaltic-to-andesitic Ulawun stratovolcano is the highest volcano of the Bismarck arc, and one of Papua New Guinea's most frequently active. The volcano, also known as the Father, rises above the N coast of the island of New Britain across a low saddle NE of Bamus volcano, the South Son. The upper 1,000 m is unvegetated. A prominent E-W escarpment on the south may be the result of large-scale slumping. Satellitic cones occupy the NW and E flanks. A steep-walled valley cuts the NW side, and a flank lava-flow complex lies to the south of this valley. Historical eruptions date back to the beginning of the 18th century. Twentieth-century eruptions were mildly explosive until 1967, but after 1970 several larger eruptions produced lava flows and basaltic pyroclastic flows, greatly modifying the summit crater.
Information Contacts: Ima Itikarai, David Lolok, Herman Patia, and Steve Saunders, Rabaul Volcano Observatory (RVO), P.O. Box 386, Rabaul, Papua New Guinea.