Recently Published Bulletin Reports
Erebus (Antarctica) Lava lake remains active; most thermal alerts recorded since 2019
Rincon de la Vieja (Costa Rica) Frequent phreatic explosions during July-December 2023
Bezymianny (Russia) Explosion on 18 October 2023 sends ash plume 8 km high; lava flows and incandescent avalanches
Kilauea (United States) Low-level lava effusions in the lava lake at Halema’uma’u during July-December 2022
Nyamulagira (DR Congo) Lava flows and thermal activity during May-October 2023
Bagana (Papua New Guinea) Explosions, ash plumes, ashfall, and lava flows during April-September 2023
Mayon (Philippines) Lava flows, pyroclastic flows, ash emissions, and seismicity during April-September 2023
Nishinoshima (Japan) Eruption plumes and gas-and-steam plumes during May-August 2023
Krakatau (Indonesia) White gas-and-steam plumes and occasional ash plumes during May-August 2023
Merapi (Indonesia) Frequent incandescent avalanches during April-September 2023
Villarrica (Chile) Strombolian activity, gas-and-ash emissions, and crater incandescence during April-September 2023
Ebeko (Russia) Moderate explosive activity with ash plumes continued during June-November 2023
Erebus (Antarctica) — January 2024  Cite this Report
Erebus
Antarctica
77.53°S, 167.17°E; summit elev. 3794 m
All times are local (unless otherwise noted)
Lava lake remains active; most thermal alerts recorded since 2019
The lava lake in the summit crater of Erebus has been active since at least 1972. Located in Antarctica overlooking the McMurdo Station on Ross Island, it is the southernmost active volcano on the planet. Because of the remote location, activity is primarily monitored by satellites. This report covers activity during 2023.
The number of thermal alerts recorded by the Hawai'i Institute of Geophysics and Planetology’s MODVOLC Thermal Alerts System increased considerably in 2023 compared to the years 2020-2022 (table 9). In contrast to previous years, the MODIS instruments aboard the Aqua and Terra satellites captured data from Erebus every month during 2023. Consistent with previous years, the lowest number of anomalous pixels were recorded in January, November, and December.
Table 9. Number of monthly MODIS-MODVOLC thermal alert pixels recorded at Erebus during 2017-2023. See BGVN 42:06 for data from 2000 through 2016. The table was compiled using data provided by the HIGP – MODVOLC Thermal Alerts System.
| Year |
Jan |
Feb |
Mar |
Apr |
May |
Jun |
Jul |
Aug |
Sep |
Oct |
Nov |
Dec |
SUM |
| 2017 |
0 |
21 |
9 |
0 |
0 |
1 |
11 |
61 |
76 |
52 |
0 |
3 |
234 |
| 2018 |
0 |
21 |
58 |
182 |
55 |
17 |
137 |
172 |
103 |
29 |
0 |
0 |
774 |
| 2019 |
2 |
21 |
162 |
151 |
55 |
56 |
75 |
53 |
29 |
19 |
1 |
0 |
624 |
| 2020 |
0 |
2 |
16 |
18 |
4 |
4 |
1 |
3 |
18 |
3 |
1 |
6 |
76 |
| 2021 |
0 |
9 |
1 |
0 |
2 |
56 |
46 |
47 |
35 |
52 |
5 |
3 |
256 |
| 2022 |
1 |
13 |
55 |
22 |
15 |
32 |
39 |
19 |
31 |
11 |
0 |
0 |
238 |
| 2023 |
2 |
33 |
49 |
82 |
41 |
32 |
70 |
64 |
42 |
17 |
5 |
11 |
448 |
Sentinel-2 infrared images showed one or two prominent heat sources within the summit crater, accompanied by adjacent smaller sources, similar to recent years (see BGVN 46:01, 47:02, and 48:01). A unique image was obtained on 25 November 2023 by the OLI-2 (Operational Land Imager-2) on Landsat 9, showing the upper part of the volcano surrounded by clouds (figure 32).
Geologic Background. Mount Erebus, the world's southernmost historically active volcano, overlooks the McMurdo research station on Ross Island. It is the largest of three major volcanoes forming the crudely triangular Ross Island. The summit of the dominantly phonolitic volcano has been modified by one or two generations of caldera formation. A summit plateau at about 3,200 m elevation marks the rim of the youngest caldera, which formed during the late-Pleistocene and within which the modern cone was constructed. An elliptical 500 x 600 m wide, 110-m-deep crater truncates the summit and contains an active lava lake within a 250-m-wide, 100-m-deep inner crater; other lava lakes are sometimes present. The glacier-covered volcano was erupting when first sighted by Captain James Ross in 1841. Continuous lava-lake activity with minor explosions, punctuated by occasional larger Strombolian explosions that eject bombs onto the crater rim, has been documented since 1972, but has probably been occurring for much of the volcano's recent history.
Information Contacts: Hawai'i Institute of Geophysics and Planetology (HIGP) - MODVOLC Thermal Alerts System, School of Ocean and Earth Science and Technology (SOEST), Univ. of Hawai'i, 2525 Correa Road, Honolulu, HI 96822, USA (URL: http://modis.higp.hawaii.edu/); Copernicus Browser, Copernicus Data Space Ecosystem, European Space Agency (URL: https://dataspace.copernicus.eu/browser/); NASA Earth Observatory, EOS Project Science Office, NASA Goddard Space Flight Center, Goddard, Maryland, USA (URL: https://earthobservatory.nasa.gov/images/152134/erebus-breaks-through).
Rincon de la Vieja (Costa Rica) — January 2024 Cite this Report
Rincon de la Vieja
Costa Rica
10.83°N, 85.324°W; summit elev. 1916 m
All times are local (unless otherwise noted)
Frequent phreatic explosions during July-December 2023
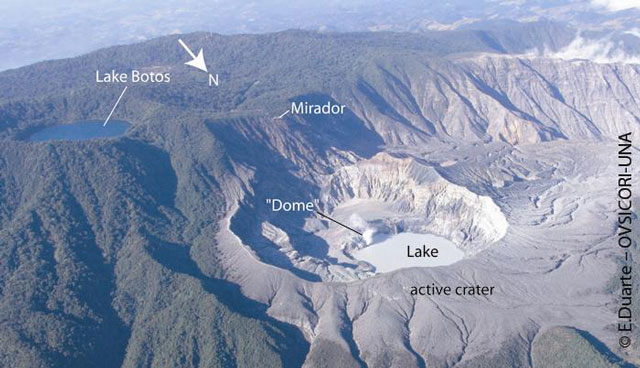
Rincón de la Vieja is a volcanic complex in Costa Rica with a hot convecting acid lake that exhibits frequent weak phreatic explosions, gas-and-steam emissions, and occasional elevated sulfur dioxide levels (BGVN 45:10, 46:03, 46:11). The current eruption period began June 2021. This report covers activity during July-December 2023 and is based on weekly bulletins and occasional daily reports from the Observatorio Vulcanologico Sismologica de Costa Rica-Universidad Nacional (OVSICORI-UNA).
Numerous weak phreatic explosions continued during July-December 2023, along with gas-and-steam emissions and plumes that rose as high as 3 km above the crater rim. Many weekly OVSICORI-UNA bulletins included the previous week's number of explosions and emissions (table 9). For many explosions, the time of explosion was given (table 10). Frequent seismic activity (long-period earthquakes, volcano-tectonic earthquakes, and tremor) accompanied the phreatic activity.
Table 9. Number of reported weekly phreatic explosions and gas-and-steam emissions at Rincón de la Vieja, July-December 2023. Counts are reported for the week before the Weekly Bulletin date; not all reports included these data. Courtesy of OVSICORI-UNA.
| OVSICORI Weekly Bulletin |
Number of explosions |
Number of emissions |
| 28 Jul 2023 |
6 |
14 |
| 4 Aug 2023 |
10 |
12 |
| 1 Sep 2023 |
13 |
11 |
| 22 Sep 2023 |
12 |
13 |
| 29 Sep 2023 |
6 |
11 |
| 6 Oct 2023 |
12 |
5 |
| 13 Oct 2023 |
7 |
9 |
| 20 Oct 2023 |
1 |
15 |
| 27 Oct 2023 |
3 |
23 |
| 3 Nov 2023 |
3 |
10 |
| 17 Nov 2023 |
0 |
Some |
| 24 Nov 2023 |
0 |
14 |
| 8 Dec 2023 |
4 |
16 |
| 22 Dec 2023 |
8 |
18 |
Table 10. Summary of activity at Rincón de la Vieja during July-December 2023. Weak phreatic explosions and gas emissions are noted where the time of explosion was indicated in the weekly or daily bulletins. Height of plumes or emissions are distance above the crater rim. Courtesy of OVSICORI-UNA.
| Date |
Time |
Description of Activity |
| 1 Jul 2023 |
0156 |
Explosion. |
| 2 Jul 2023 |
0305 |
Explosion. |
| 4 Jul 2023 |
0229, 0635 |
Event at 0635 produced a gas-and-steam plume that rose 700 m and drifted W; seen by residents in Liberia (21 km SW). |
| 9 Jul 2023 |
1843 |
Explosion. |
| 21 Jul 2023 |
0705 |
Explosion. |
| 26 Jul 2023 |
1807 |
Explosion. |
| 28 Jul 2023 |
0802 |
Explosion generated a gas-and-steam plume that rose 500 m. |
| 30 Jul 2023 |
1250 |
Explosion. |
| 31 Jul 2023 |
2136 |
Explosion. |
| 11 Aug 2023 |
0828 |
Explosion. |
| 18 Aug 2023 |
1304 |
Explosion. |
| 21 Aug 2023 |
1224 |
Explosion generated gas-and-steam plumes rose 500-600 m. |
| 22 Aug 2023 |
0749 |
Explosion generated gas-and-steam plumes rose 500-600 m. |
| 24 Aug 2023 |
1900 |
Explosion. |
| 25 Aug 2023 |
0828 |
Event produced a steam-and-gas plume that rose 3 km and drifted NW. |
| 27-28 Aug 2023 |
0813 |
Four small events; the event at 0813 on 28 August lasted two minutes and generated a steam-and-gas plume that rose 2.5 km. |
| 1 Sep 2023 |
1526 |
Explosion generated plume that rose 2 km and ejected material onto the flanks. |
| 2-3 Sep 2023 |
- |
Small explosions detected in infrasound data. |
| 4 Sep 2023 |
1251 |
Gas-and-steam plume rose 1 km and drifted W. |
| 7 Nov 2023 |
1113 |
Explosion. |
| 8 Nov 2023 |
0722 |
Explosion. |
| 12 Nov 2023 |
0136 |
Small gas emissions. |
| 14 Nov 2023 |
0415 |
Small gas emissions. |
According to OVSICORI-UNA, during July-October the average weekly sulfur dioxide (SO2) flux ranged from 68 to 240 tonnes/day. However, in mid-November the flux increased to as high as 334 tonnes/day, the highest value measured in recent years. The high SO2 flux in mid-November was also detected by the TROPOMI instrument on the Sentinel-5P satellite (figure 43).
Geologic Background. Rincón de la Vieja, the largest volcano in NW Costa Rica, is a remote volcanic complex in the Guanacaste Range. The volcano consists of an elongated, arcuate NW-SE-trending ridge constructed within the 15-km-wide early Pleistocene Guachipelín caldera, whose rim is exposed on the south side. Sometimes known as the "Colossus of Guanacaste," it has an estimated volume of 130 km3 and contains at least nine major eruptive centers. Activity has migrated to the SE, where the youngest-looking craters are located. The twin cone of Santa María volcano, the highest peak of the complex, is located at the eastern end of a smaller, 5-km-wide caldera and has a 500-m-wide crater. A Plinian eruption producing the 0.25 km3 Río Blanca tephra about 3,500 years ago was the last major magmatic eruption. All subsequent eruptions, including numerous historical eruptions possibly dating back to the 16th century, have been from the prominent active crater containing a 500-m-wide acid lake located ENE of Von Seebach crater.
Information Contacts: Observatorio Vulcanológico Sismológica de Costa Rica-Universidad Nacional (OVSICORI-UNA), Apartado 86-3000, Heredia, Costa Rica (URL: http://www.ovsicori.una.ac.cr/); NASA Global Sulfur Dioxide Monitoring Page, Atmospheric Chemistry and Dynamics Laboratory, NASA Goddard Space Flight Center (NASA/GSFC), 8800 Greenbelt Road, Goddard MD 20771, USA (URL: https://so2.gsfc.nasa.gov/).
Bezymianny (Russia) — November 2023 Cite this Report
Bezymianny
Russia
55.972°N, 160.595°E; summit elev. 2882 m
All times are local (unless otherwise noted)
Explosion on 18 October 2023 sends ash plume 8 km high; lava flows and incandescent avalanches
Bezymianny, located on Russia’s Kamchatka Peninsula, has had eruptions since 1955 characterized by dome growth, explosions, pyroclastic flows, ash plumes, and ashfall. Activity during November 2022-April 2023 included gas-and-steam emissions, lava dome collapses generating avalanches, and persistent thermal activity. Similar eruptive activity continued from May through October 2023, described here based on information from weekly and daily reports of the Kamchatka Volcano Eruptions Response Team (KVERT), notices from Tokyo VAAC (Volcanic Ash Advisory Center), and from satellite data.
Overall activity decreased after the strong period of activity in late March through April 2023, which included ash explosions during 29 March and 7-8 April 2023 that sent plumes as high as 10-12 km altitude, along with dome growth and lava flows (BGVN 48:05). This reduced activity can be seen in the MIROVA thermal detection system graph (figure 56), which was consistent with data from the MODVOLC thermal detection system and with Sentinel-2 satellite images that showed persistent hotspots in the summit crater when conditions allowed observations. A renewed period of strong activity began in mid-October 2023.
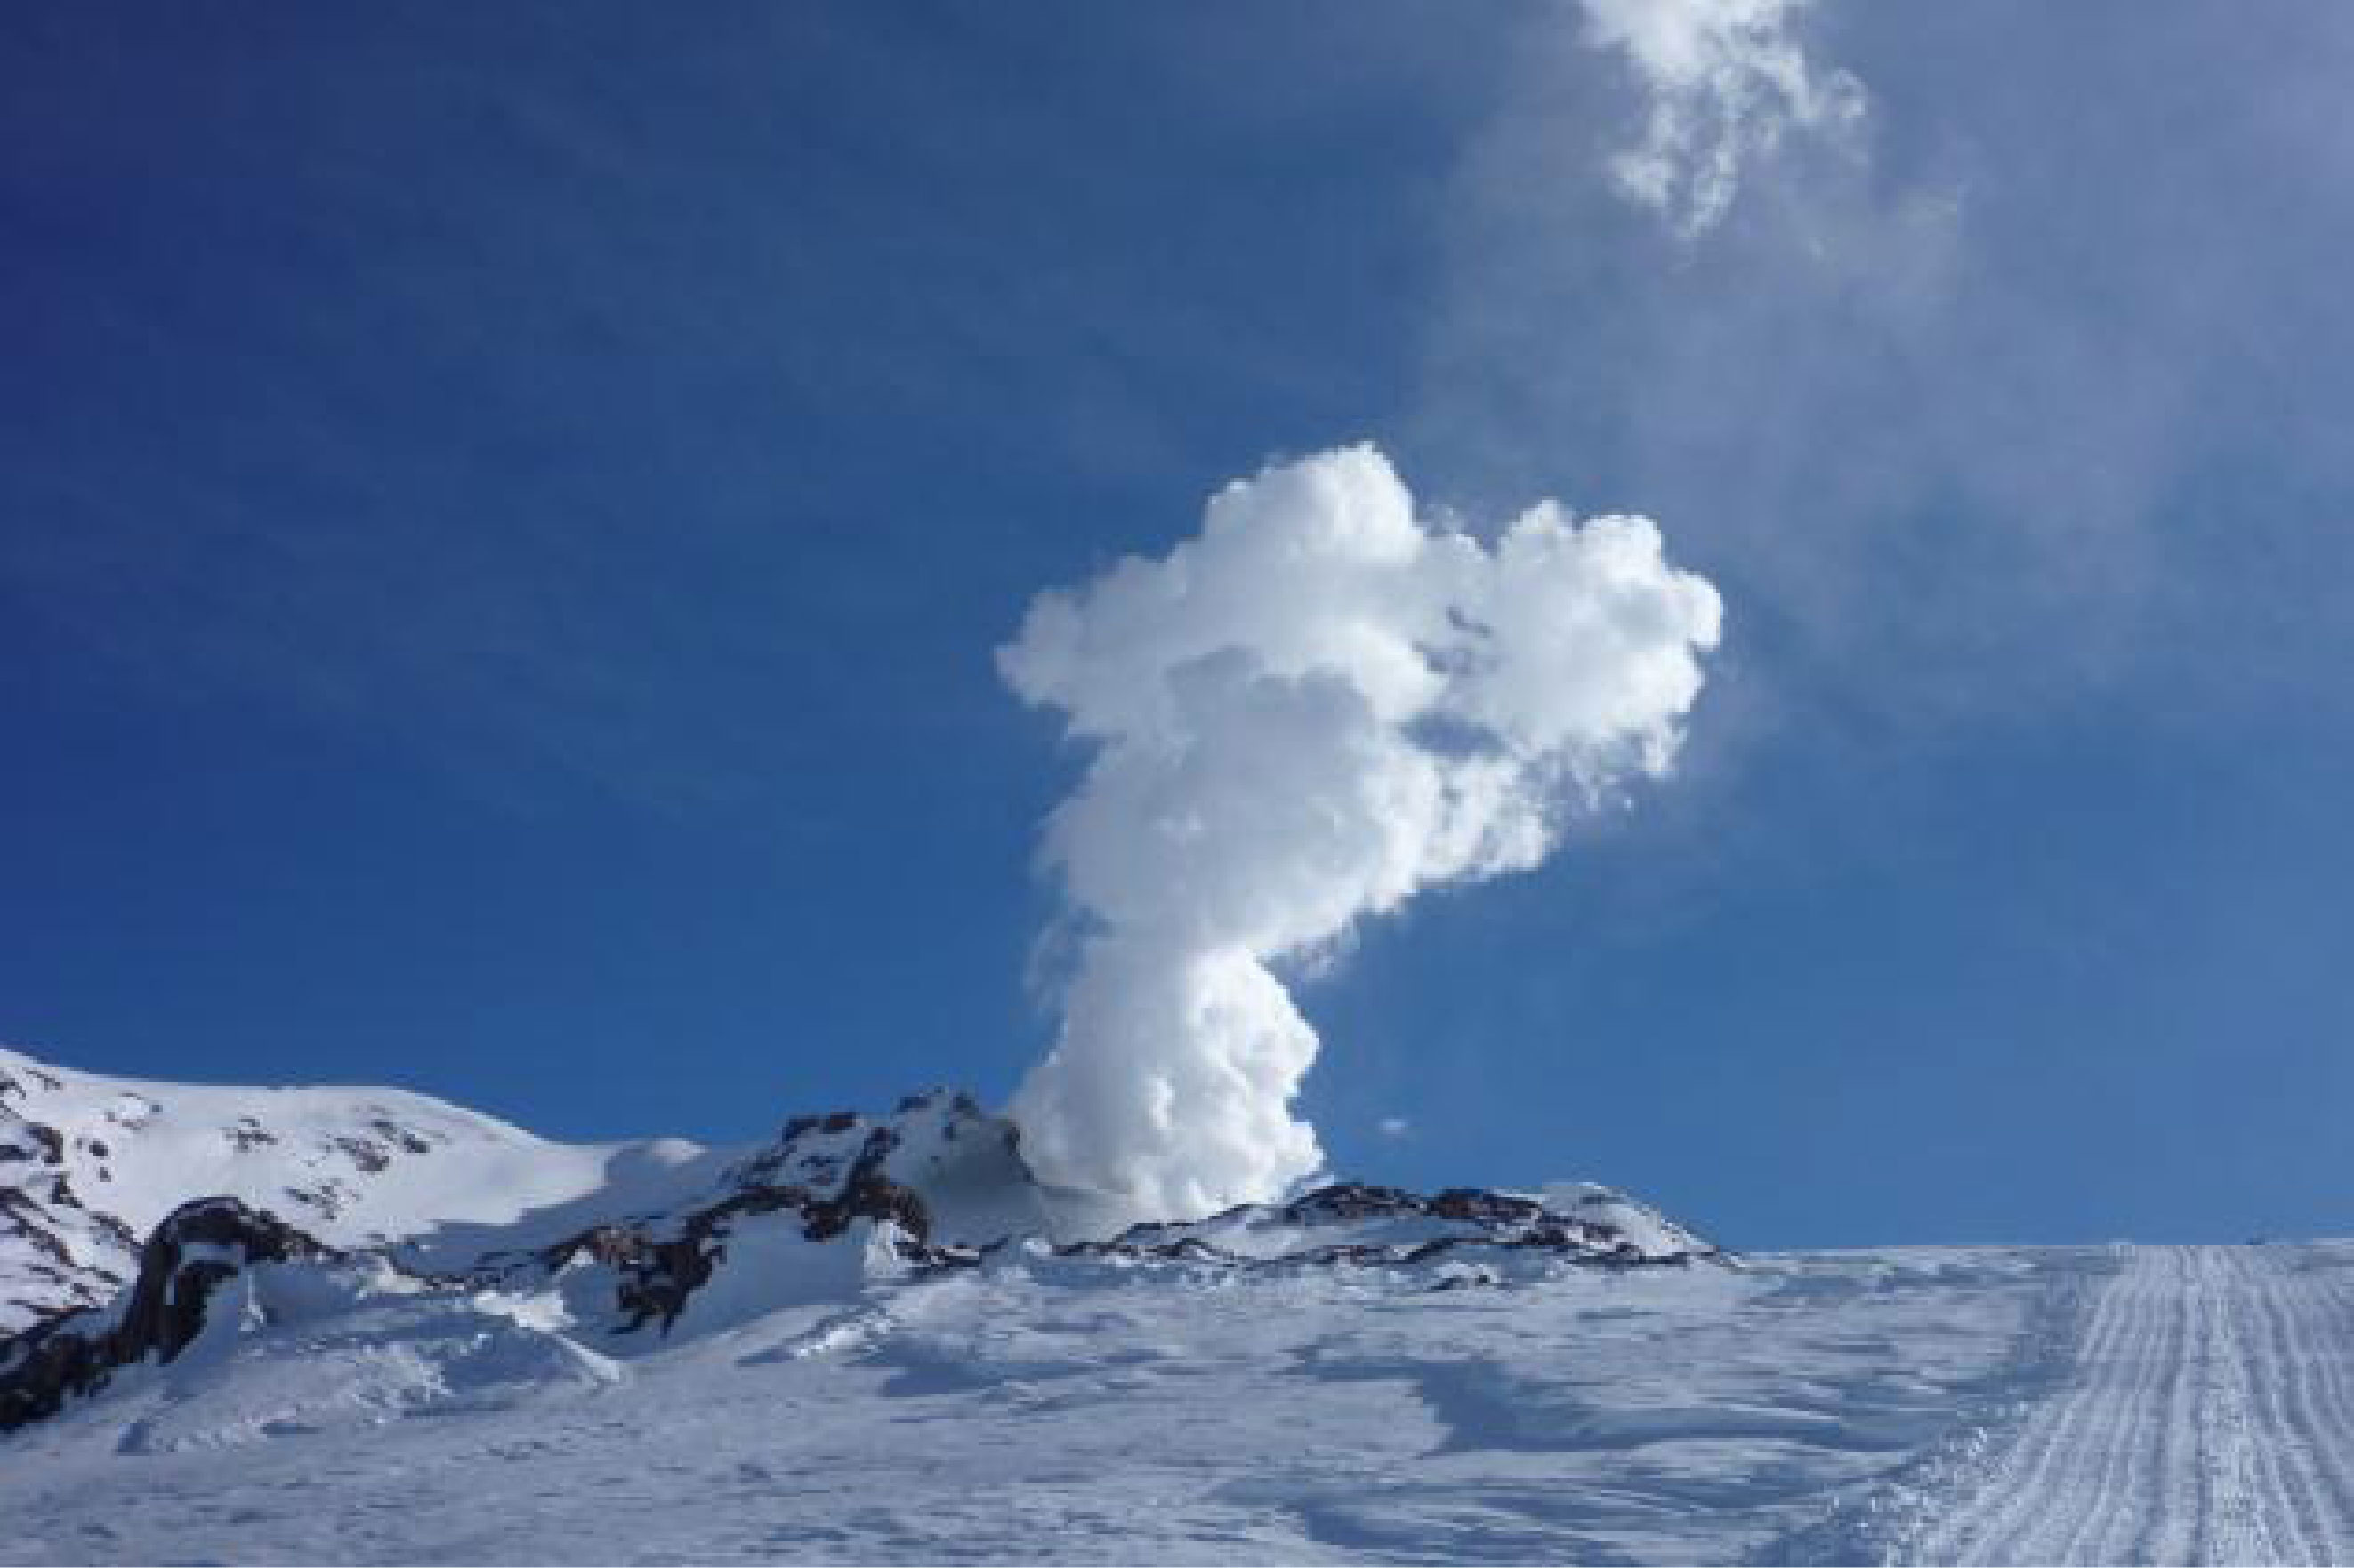
Activity increased significantly on 17 October 2023 when large collapses began during 0700-0830 on the E flanks of the lava dome and continued to after 0930 the next day (figure 57). Ash plumes rose to an altitude of 4.5-5 km, extending 220 km NNE by 18 October. A large explosion at 1630 on 18 October produced an ash plume that rose to an altitude of 11 km (8 km above the summit) and drifted NNE and then NW, extending 900 km NW within two days at an altitude of 8 km. Minor ashfall was noted in Kozyrevsk (45 km WNW). At 0820 on 20 October an ash plume was identified in satellite images drifting 100 km ENE at altitudes of 4-4.5 km.
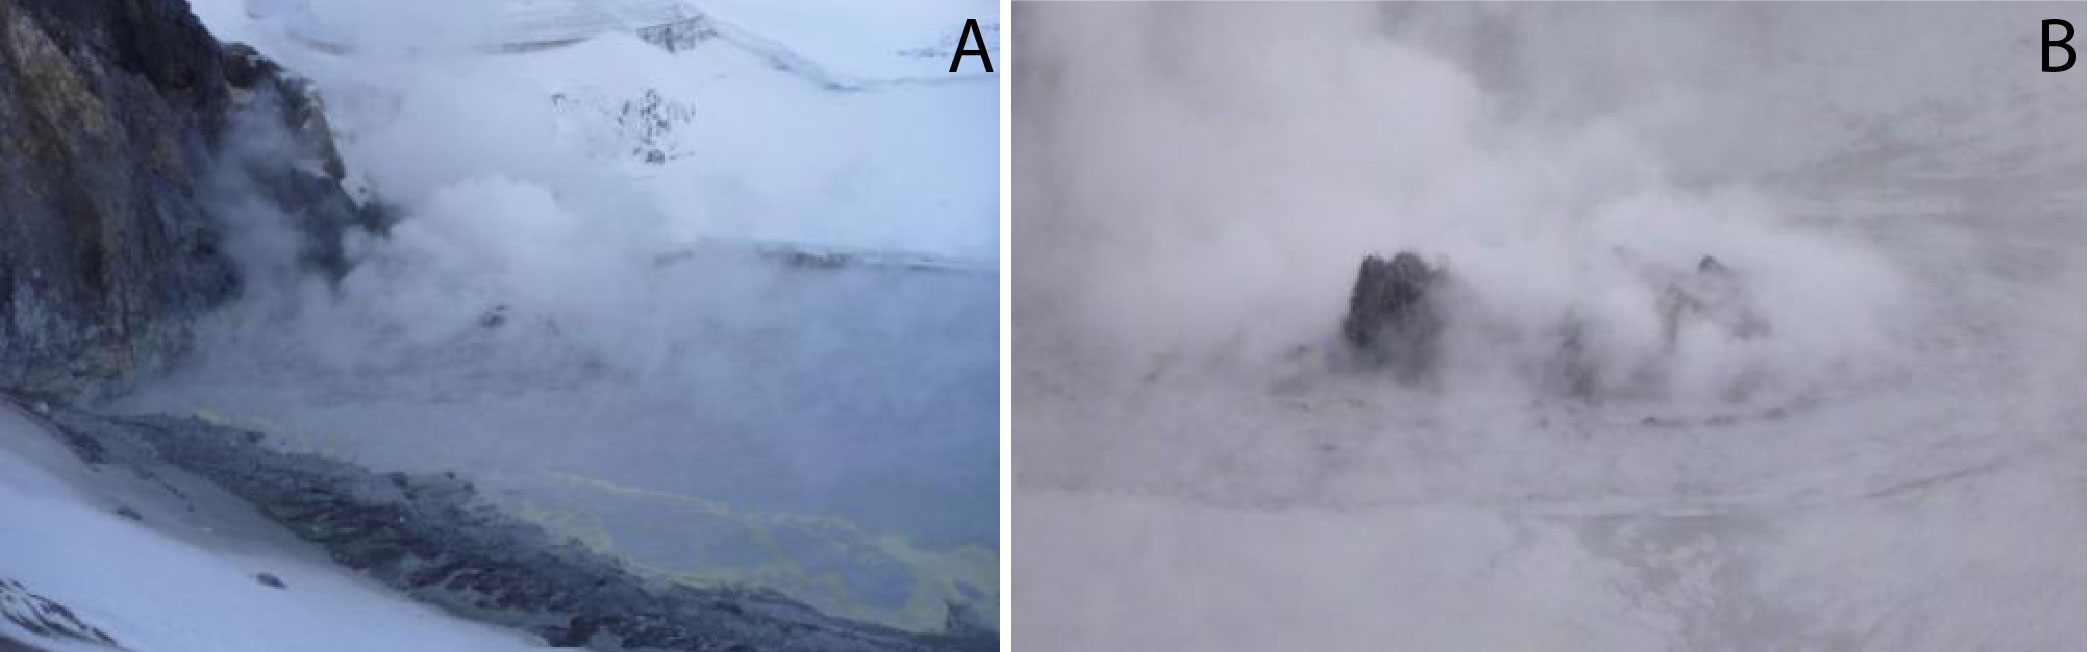
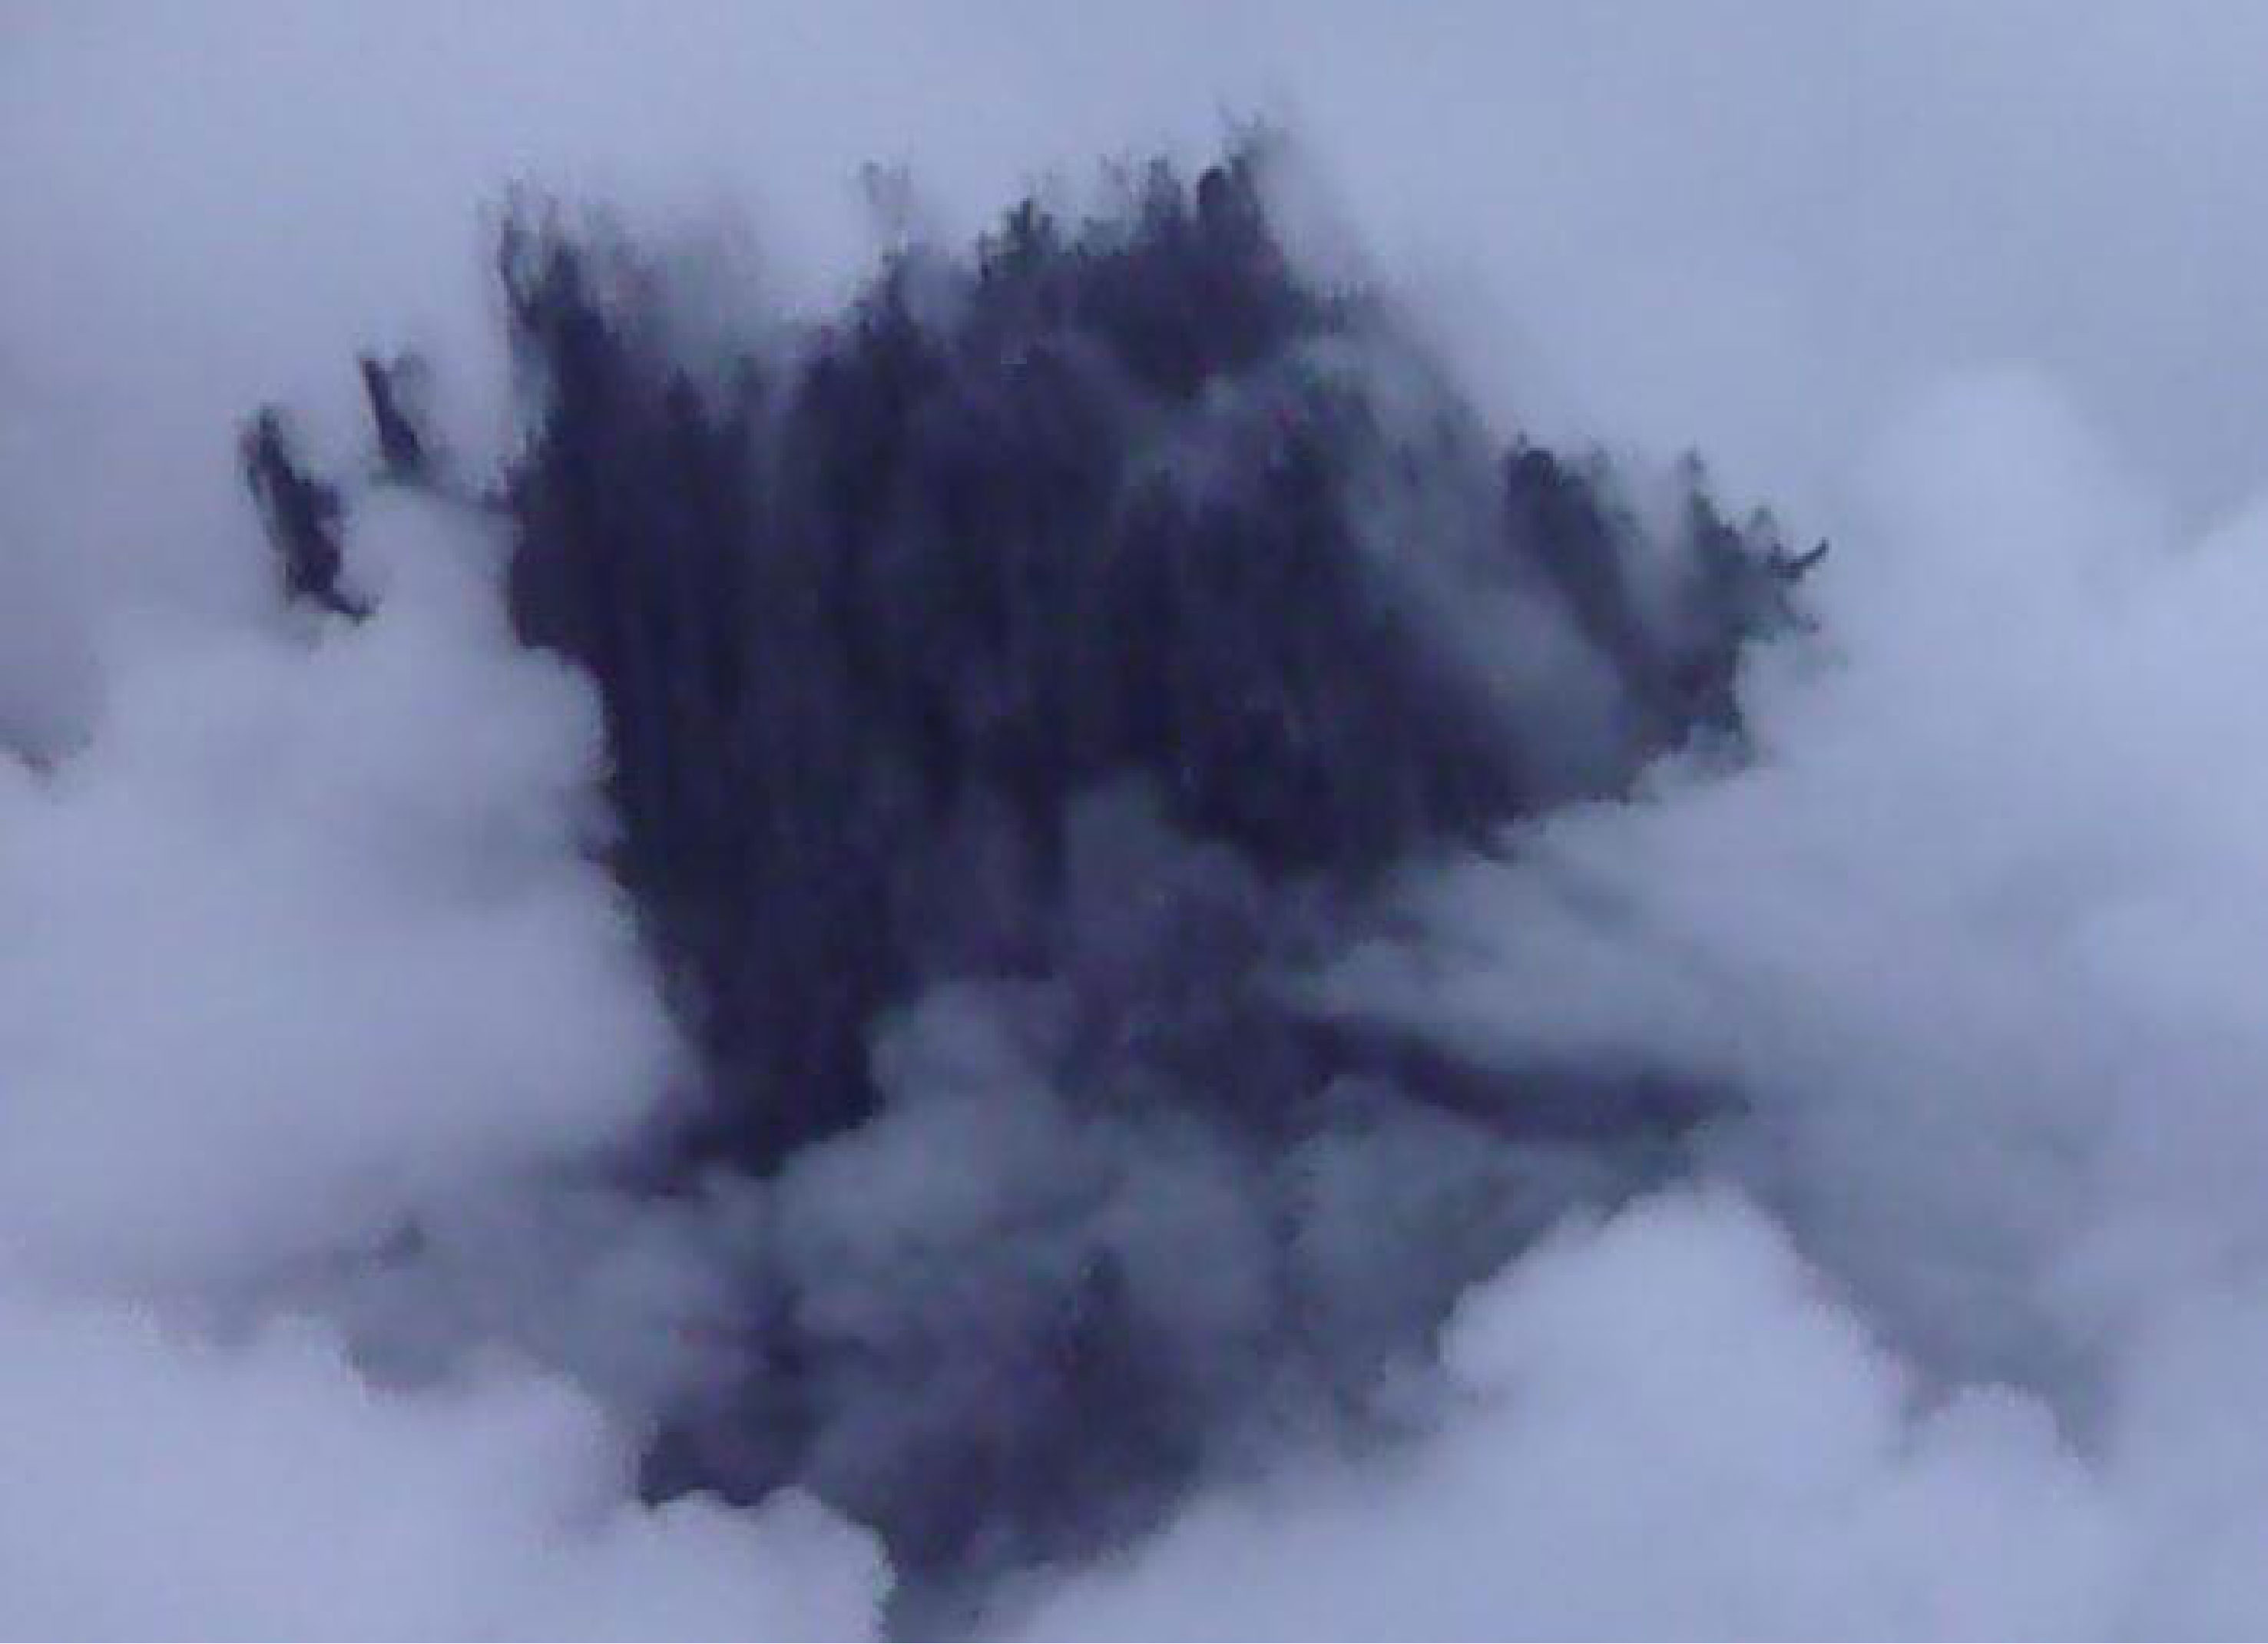
Lava flows and hot avalanches from the dome down the SE flank continued over the next few days, including 23 October when clear conditions allowed good observations (figures 58 and 59). A large thermal anomaly was observed over the volcano through 24 October, and in the summit crater on 30 October (figure 60). Strong fumarolic activity continued, with numerous avalanches and occasional incandescence. By the last week of October, volcanic activity had decreased to a level consistent with that earlier in the reporting period.
Aviation warnings were frequently updated during 17-20 October. KVERT issued a Volcano Observatory Notice for Aviation (VONA) on 17 October at 1419 and 1727 (0219 and 0527 UTC) raising the Aviation Color Code (ACC) from Yellow to Orange (second highest level). The next day, KVERT issued a VONA at 1705 (0505 UTC) raising the ACC to Red (highest level) but lowered it back to Orange at 2117 (0917 UTC). After another decrease to Yellow and back to Orange, the ACC was reduced to Yellow on 20 October at 1204 (0004 UTC). In addition, the Tokyo VAAC issued a series of Volcanic Ash Advisories beginning on 16 October and continuing through 30 October.
Geologic Background. The modern Bezymianny, much smaller than its massive neighbors Kamen and Kliuchevskoi on the Kamchatka Peninsula, was formed about 4,700 years ago over a late-Pleistocene lava-dome complex and an edifice built about 11,000-7,000 years ago. Three periods of intensified activity have occurred during the past 3,000 years. The latest period, which was preceded by a 1,000-year quiescence, began with the dramatic 1955-56 eruption. This eruption, similar to that of St. Helens in 1980, produced a large open crater that was formed by collapse of the summit and an associated lateral blast. Subsequent episodic but ongoing lava-dome growth, accompanied by intermittent explosive activity and pyroclastic flows, has largely filled the 1956 crater.
Information Contacts: Kamchatka Volcanic Eruptions Response Team (KVERT), Far Eastern Branch, Russian Academy of Sciences, 9 Piip Blvd., Petropavlovsk-Kamchatsky, 683006, Russia (URL: http://www.kscnet.ru/ivs/kvert/); Kamchatka Volcanological Station, Kamchatka Branch of Geophysical Survey, (KB GS RAS), Klyuchi, Kamchatka Krai, Russia (URL: http://volkstat.ru/); Tokyo Volcanic Ash Advisory Center (VAAC), 1-3-4 Otemachi, Chiyoda-ku, Tokyo 100-8122, Japan (URL: http://ds.data.jma.go.jp/svd/vaac/data/); Hawai'i Institute of Geophysics and Planetology (HIGP) - MODVOLC Thermal Alerts System, School of Ocean and Earth Science and Technology (SOEST), Univ. of Hawai'i, 2525 Correa Road, Honolulu, HI 96822, USA (URL: http://modis.higp.hawaii.edu/); MIROVA (Middle InfraRed Observation of Volcanic Activity), a collaborative project between the Universities of Turin and Florence (Italy) supported by the Centre for Volcanic Risk of the Italian Civil Protection Department (URL: http://www.mirovaweb.it/); Copernicus Browser, Copernicus Data Space Ecosystem, European Space Agency (URL: https://dataspace.copernicus.eu/browser/).chr
Kilauea (United States) — January 2023 Cite this Report
Kilauea
United States
19.421°N, 155.287°W; summit elev. 1222 m
All times are local (unless otherwise noted)
Low-level lava effusions in the lava lake at Halema’uma’u during July-December 2022
Kīlauea is the southeastern-most volcano in Hawaii and overlaps the E flank of the Mauna Loa volcano. Its East Rift Zone (ERZ) has been intermittently active for at least 2,000 years. An extended eruption period began in January 1983 and was characterized by open lava lakes and lava flows from the summit caldera and the East Rift Zone. During May 2018 magma migrated into the Lower East Rift Zone (LERZ) and opened 24 fissures along a 6-km-long NE-trending fracture zone that produced lava flows traveling in multiple directions. As lava emerged from the fissures, the lava lake at Halema'uma'u drained and explosions sent ash plumes to several kilometers altitude (BGVN 43:10).
The current eruption period started during September 2021 and has recently been characterized by lava effusions, spatter, and sulfur dioxide emissions in the active Halema’uma’u lava lake (BGVN 47:08). Lava effusions, some spatter, and sulfur dioxide emissions have continued during this reporting period of July through December 2022 using daily reports, volcanic activity notices, and abundant photo, map, and video data from the US Geological Survey's (USGS) Hawaiian Volcano Observatory (HVO).
Summary of activity during July-December 2022. Low-level effusions have continued at the western vent of the Halema’uma’u crater during July through early December 2022. Occasional weak ooze-outs (also called lava break outs) would occur along the margins of the crater floor. The overall level of the active lava lake throughout the reporting period gradually increased due to infilling, however it stagnated in mid-September (table 13). During September through November, activity began to decline, though lava effusions persisted at the western vent. By 9 December, the active part of the lava lake had completely crusted over, and incandescence was no longer visible.
Table 13. Summary of measurements taken during overflights at Kīlauea that show a gradual increase in the active lava lake level and the volume of lava effused since 29 September 2021. Lower activity was reported during September-October. Data collected during July-December 2022. Courtesy of HVO.
| Date: |
Level of the active lava lake (m): |
Cumulative volume of lava effused (million cubic meters): |
| 7 Jul 2022 |
130 |
95 |
| 19 Jul 2022 |
133 |
98 |
| 4 Aug 2022 |
136 |
102 |
| 16 Aug 2022 |
137 |
104 |
| 12 Sep 2022 |
143 |
111 |
| 5 Oct 2022 |
143 |
111 |
| 28 Oct 2022 |
143 |
111 |
Activity during July 2022. Lava effusions were reported from the western vent in the Halema’uma’u crater, along with occasional weak ooze-outs along the margins of the crater floor. The height of the lava lake was variable due to deflation-inflation tilt events; for example, the lake level dropped approximately 3-4 m during a summit deflation-inflation event reported on 1 July. Webcam images taken during the night of 6-12 July showed intermittent low-level spattering at the western vent that rose less than 10 m above the vent (figure 519). Measurements made during an overflight on 7 July indicated that the crater floor was infilled about 130 m and that 95 million cubic meters of lava had been effused since 29 September 2021. A single, relatively small lava ooze-out was active to the S of the lava lake. Around midnight on 8 July there were two brief periods of lava overflow onto the lake margins. On 9 July lava ooze-outs were reported near the SE and NE edges of the crater floor and during 10-11 July they occurred near the E, NE, and NW edges. On 16 July crater incandescence was reported, though the ooze-outs and spattering were not visible. On 18 July overnight webcam images showed incandescence in the western vent complex and two ooze-outs were reported around 0000 and 0200 on 19 July. By 0900 there were active ooze-outs along the SW edge of the crater floor. Measurements made from an overflight on 19 July indicated that the crater floor was infilled about 133 m and 98 million cubic meters of lava had erupted since 29 September 2021 (figure 520). On 20 July around 1600 active ooze-outs were visible along the N edge of the crater, which continued through the next day. Extensive ooze-outs occurred along the W margin during 24 July until 1900; on 26 July minor ooze-outs were noted along the N margin. Minor spattering was visible on 29 July along the E margin of the lake. The sulfur dioxide emission rates ranged 650-2,800 tons per day (t/d), the higher of which was measured on 8 July (figure 519).
Activity during August 2022. The eruption continued in the Halema’uma’u crater at the western vent. According to HVO the lava in the active lake remained at the level of the bounding levees. Occasional minor ooze-outs were observed along the margins of the crater floor. Strong nighttime crater incandescence was visible after midnight on 6 August over the western vent cone. During 6-7 August scattered small lava lobes were active along the crater floor and incandescence persisted above the western vent through 9 August. During 7-9 August HVO reported a single lava effusion source was active along the NW margin of the crater floor. Measurements from an overflight on 4 August indicated that the crater floor was infilled about 136 m total and that 102 million cubic meters of lava had been erupted since the start of the eruption. Lava breakouts were reported along the N, NE, E, S, and W margins of the crater during 10-16 August. Another overflight survey conducted on 16 August indicated that the crater floor infilled about 137 m and 104 million cubic meters of lava had been erupted since September 2021. Measured sulfur dioxide emissions rates ranged 1,150-2,450 t/d, the higher of which occurred on 8 August.
Activity during September 2022. During September, lava effusion continued from the western vent into the active lava lake and onto the crater floor. Intermittent minor ooze-outs were reported through the month. A small ooze-out was visible on the W crater floor margin at 0220 on 2 September, which showed decreasing surface activity throughout the day, but remained active through 3 September. On 3 September around 1900 a lava outbreak occurred along the NW margin of the crater floor but had stopped by the evening of 4 September. Field crews monitoring the summit lava lake on 9 September observed spattering on the NE margin of the lake that rose no higher than 10 m, before falling back onto the lava lake crust (figure 521). Overflight measurements on 12 September indicated that the crater floor was infilled a total of 143 m and 111 million cubic meters of lava had been erupted since September 2021. Extensive breakouts in the W and N part of the crater floor were reported at 1600 on 20 September and continued into 26 September. The active part of the lava lake dropped by 10 m while other parts of the crater floor dropped by several meters. Summit tiltmeters recorded a summit seismic swarm of more than 80 earthquakes during 1500-1800 on 21 September, which occurred about 1.5 km below Halema’uma’u; a majority of these were less than Mw 2. By 22 September the active part of the lava lake was infilled about 2 m. On 23 September the western vent areas exhibited several small spatter cones with incandescent openings, along with weak, sporadic spattering (figure 522). The sulfur dioxide emission rate ranged from 930 t/d to 2,000 t/d, the higher of which was measured on 6 September.
Activity during October 2022. Activity during October declined slightly compared to previous months, though lava effusions persisted from the western vent into the active lava lake and onto the crater floor during October (figure 523). Slight variations in the lava lake were noted throughout the month. HVO reported that around 0600 on 3 October the level of the lava lake has lowered slightly. Overflight measurements taken on 5 October indicated that the crater floor was infilled a total of about 143 m and that 111 million cubic meters of lava had been effused since September 2021. During 6-7 October the lake gradually rose 0.5 m. Sulfur dioxide measurements made on 22 October had an emission rate of 700 t/d. Another overflight taken on 28 October showed that there was little to no change in the elevation of the crater floor: the crater floor was infilled a total of 143 m and 111 million cubic meters of lava had erupted since the start of the eruption.
Activity during November 2022. Activity remained low during November, though HVO reported that lava from the western vent continued to effuse into the active lava lake and onto the crater floor throughout the month. The rate of sulfur dioxide emissions during November ranged from 300-600 t/d, the higher amount of which occurred on 9 November.
Activity during December 2022. Similar low activity was reported during December, with lava effusing from the western vent into the active lava lake and onto the crater floor. During 4-5 December the active part of the lava lake was slightly variable in elevation and fluctuated within 1 m. On 9 December HVO reported that lava was no longer erupting from the western vent in the Halema’uma’u crater and that sulfur dioxide emissions had returned to near pre-eruption background levels; during 10-11 December, the lava lake had completely crusted over, and no incandescence was visible (figure 524). Time lapse camera images covering the 4-10 December showed that the crater floor showed weak deflation and no inflation. Some passive events of crustal overturning were reported during 14-15 December, which brought fresh incandescent lava to the lake surface. The sulfur dioxide emission rate was approximately 200 t/d on 14 December. A smaller overturn event on 17 December and another that occurred around 0000 and into the morning of 20 December were also detected. A small seismic swarm was later detected on 30 December.
Geologic Background. Kilauea overlaps the E flank of the massive Mauna Loa shield volcano in the island of Hawaii. Eruptions are prominent in Polynesian legends; written documentation since 1820 records frequent summit and flank lava flow eruptions interspersed with periods of long-term lava lake activity at Halemaumau crater in the summit caldera until 1924. The 3 x 5 km caldera was formed in several stages about 1,500 years ago and during the 18th century; eruptions have also originated from the lengthy East and Southwest rift zones, which extend to the ocean in both directions. About 90% of the surface of the basaltic shield volcano is formed of lava flows less than about 1,100 years old; 70% of the surface is younger than 600 years. The long-term eruption from the East rift zone between 1983 and 2018 produced lava flows covering more than 100 km2, destroyed hundreds of houses, and added new coastline.
Information Contacts: Hawaiian Volcano Observatory (HVO), U.S. Geological Survey, PO Box 51, Hawai'i National Park, HI 96718, USA (URL: http://hvo.wr.usgs.gov/).
Nyamulagira (DR Congo) — November 2023 Cite this Report
Nyamulagira
DR Congo
1.408°S, 29.2°E; summit elev. 3058 m
All times are local (unless otherwise noted)
Lava flows and thermal activity during May-October 2023
Nyamulagira (also known as Nyamuragira) is a shield volcano in the Democratic Republic of Congo with the summit truncated by a small 2 x 2.3 km caldera with walls up to about 100 m high. Documented eruptions have occurred within the summit caldera, as well as from numerous flank fissures and cinder cones. The current eruption period began in April 2018 and has more recently been characterized by summit crater lava flows and thermal activity (BGVN 48:05). This report describes lava flows and variable thermal activity during May through October 2023, based on information from the Observatoire Volcanologique de Goma (OVG) and various satellite data.
Lava lake activity continued during May. The MIROVA (Middle InfraRed Observation of Volcanic Activity) system recorded moderate-to-strong thermal activity throughout the reporting period; activity was more intense during May and October and relatively weaker from June through September (figure 95). The MODVOLC thermal algorithm, detected a total of 209 thermal alerts. There were 143 hotspots detected during May, eight during June, nine during September, and 49 during October. This activity was also reflected in infrared satellite images, where a lava flow was visible in the NW part of the crater on 7 May and strong activity was seen in the center of the crater on 4 October (figure 96). Another infrared satellite image taken on 12 May showed still active lava flows along the NW margin of the crater. According to OVG lava effusions were active during 7-29 May and moved to the N and NW parts of the crater beginning on 9 May. Strong summit crater incandescence was visible from Goma (27 km S) during the nights of 17, 19, and 20 May (figure 97). On 17 May there was an increase in eruptive activity, which peaked at 0100 on 20 May. Notable sulfur dioxide plumes drifted NW and W during 19-20 May (figure 98). Drone footage acquired in partnership with the USGS (United States Geological Survey) on 20 May captured images of narrow lava flows that traveled about 100 m down the W flank (figure 99). Data from the Rumangabo seismic station indicated a decreasing trend in activity during 17-21 May. Although weather clouds prevented clear views of the summit, a strong thermal signature on the NW flank was visible in an infrared satellite image on 22 May, based on an infrared satellite image. On 28 May the lava flows on the upper W flank began to cool and solidify. By 29 May seismicity returned to levels similar to those recorded before the 17 May increase. Lava effusion continued but was confined to the summit crater; periodic crater incandescence was observed.
Low-level activity was noted during June through October. On 1 June OVG reported that seismicity remained at lower levels and that crater incandescence had been absent for three days, though infrared satellite imagery showed continued lava effusion in the summit crater. The lava flows on the flanks covered an estimated 0.6 km2. Satellite imagery continued to show thermal activity confined to the lava lake through October (figure 96), although no lava flows or significant sulfur dioxide emissions were reported.
Geologic Background. Africa's most active volcano, Nyamulagira (also known as Nyamuragira), is a massive high-potassium basaltic shield about 25 km N of Lake Kivu and 13 km NNW of the steep-sided Nyiragongo volcano. The summit is truncated by a small 2 x 2.3 km caldera that has walls up to about 100 m high. Documented eruptions have occurred within the summit caldera, as well as from the numerous flank fissures and cinder cones. A lava lake in the summit crater, active since at least 1921, drained in 1938, at the time of a major flank eruption. Recent lava flows extend down the flanks more than 30 km from the summit as far as Lake Kivu; extensive lava flows from this volcano have covered 1,500 km2 of the western branch of the East African Rift.
Information Contacts: Observatoire Volcanologique de Goma (OVG), Departement de Geophysique, Centre de Recherche en Sciences Naturelles, Lwiro, D.S. Bukavu, DR Congo; Hawai'i Institute of Geophysics and Planetology (HIGP) - MODVOLC Thermal Alerts System, School of Ocean and Earth Science and Technology (SOEST), Univ. of Hawai'i, 2525 Correa Road, Honolulu, HI 96822, USA (URL: http://modis.higp.hawaii.edu/); MIROVA (Middle InfraRed Observation of Volcanic Activity), a collaborative project between the Universities of Turin and Florence (Italy) supported by the Centre for Volcanic Risk of the Italian Civil Protection Department (URL: http://www.mirovaweb.it/); NASA Global Sulfur Dioxide Monitoring Page, Atmospheric Chemistry and Dynamics Laboratory, NASA Goddard Space Flight Center (NASA/GSFC), 8800 Greenbelt Road, Goddard, Maryland, USA (URL: https://so2.gsfc.nasa.gov/); Copernicus Browser, Copernicus Data Space Ecosystem, European Space Agency (URL: https://dataspace.copernicus.eu/browser/); Charles Balagizi, Goma Volcano Observatory, Departement de Geophysique, Centre de Recherche en Sciences Naturelles, Lwiro, D.S. Bukavu, DR Congo.
Bagana (Papua New Guinea) — October 2023 Cite this Report
Bagana
Papua New Guinea
6.137°S, 155.196°E; summit elev. 1855 m
All times are local (unless otherwise noted)
Explosions, ash plumes, ashfall, and lava flows during April-September 2023
The remote volcano of Bagana is located in central Bougainville Island, Papua New Guinea. Recorded eruptions date back to 1842 and activity has consisted of effusive activity that has built a small lava dome in the summit crater and occasional explosions that produced pyroclastic flows. The most recent eruption has been ongoing since February 2000 and has produced occasional explosions, ash plumes, and lava flows. More recently, activity has been characterized by ongoing effusive activity and ash emissions (BGVN 48:04). This report updates activity from April through September 2023 that has consisted of explosions, ash plumes, ashfall, and lava flows, using information from the Darwin Volcanic Ash Advisory Center (VAAC) and satellite data.
An explosive eruption was reported on 7 July that generated a large gas-and-ash plume to high altitudes and caused significant ashfall in local communities; the eruption plume had reached upper tropospheric (16-18 km altitude) altitudes by 2200, according to satellite images. Sulfur dioxide plumes were detected in satellite images on 8 July and indicated that the plume was likely a mixture of gas, ice, and ash. A report issued by the Autonomous Bougainville Government (ABG) (Torokina District, Education Section) on 10 July noted that significant ash began falling during 2000-2100 on 7 July and covered most areas in the Vuakovi, Gotana (9 km SW), Koromaketo, Laruma (25 km W) and Atsilima (27 km NW) villages. Pyroclastic flows also occurred, according to ground-based reports; small deposits confined to one drainage were inspected by RVO during an overflight on 17 July and were confirmed to be from the 7 July event. Ashfall continued until 10 July and covered vegetation, which destroyed bushes and gardens and contaminated rivers and streams.
RVO reported another eruption on 14 July. The Darwin VAAC stated that an explosive event started around 0830 on 15 July and produced an ash plume that rose to 16.5 km altitude by 1000 and drifted N, according to satellite images. The plume continued to drift N and remained visible through 1900, and by 2150 it had dissipated.
Ashfall likely from both the 7 and 15 July events impacted about 8,111 people in Torokina (20 km SW), including Tsito/Vuakovi, Gotana, Koromaketo, Kenaia, Longkogari, Kenbaki, Piva (13 km SW), and Atsinima, and in the Tsitovi district, according to ABG. Significant ashfall was also reported in Ruruvu (22 km N) in the Wakunai District of Central Bougainville, though the thickness of these deposits could not be confirmed. An evacuation was called for the villages in Wakunai, where heavy ashfall had contaminated water sources; the communities of Ruruvu, Togarau, Kakarapaia, Karauturi, Atao, and Kuritaturi were asked to evacuate to a disaster center at the Wakunai District Station, and communities in Torokina were asked to evacuate to the Piva District station. According to a news article, more than 7,000 people needed temporary accommodations, with about 1,000 people in evacuation shelters. Ashfall had deposited over a broad area, contaminating water supplies, affecting crops, and collapsing some roofs and houses in rural areas. Schools were temporarily shut down. Intermittent ash emissions continued through the end of July and drifted NNW, NW, and SW. Fine ashfall was reported on the coast of Torokina, and ash plumes also drifted toward Laruma and Atsilima.
A small explosive eruption occurred at 2130 on 28 July that ejected material from the crater vents, according to reports from Torokina, in addition to a lava flow that contained two lobes. A second explosion was detected at 2157. Incandescence from the lava flow was visible from Piva as it descended the W flank around 2000 on 29 July (figure 47). The Darwin VAAC reported that a strong thermal anomaly was visible in satellite images during 30-31 July and that ash emissions rose to 2.4 km altitude and drifted WSW on 30 July. A ground report from RVO described localized emissions at 0900 on 31 July.
The Darwin VAAC reported that ash plumes were identified in satellite imagery at 0800 and 1220 on 12 August and rose to 2.1 km and 3 km altitude and drifted NW and W, respectively. A news report stated that aid was sent to more than 6,300 people that were adversely affected by the eruption. Photos taken during 17-19 August showed ash emissions rising no higher than 1 km above the summit and drifting SE. A small explosion generated an ash plume during the morning of 19 August. Deposits from small pyroclastic flows were also captured in the photos. Satellite images captured lava flows and pyroclastic flow deposits. Two temporary seismic stations were installed near Bagana on 17 August at distances of 7 km WSW (Vakovi station) and 11 km SW (Kepox station). The Kepox station immediately started to record continuous, low-frequency background seismicity.
Satellite data. Little to no thermal activity was detected during April through mid-July 2023; only one anomaly was recorded during early April and one during early June, according to MIROVA (Middle InfraRed Observation of Volcanic Activity) data (figure 48). Thermal activity increased in both power and frequency during mid-July through September, although there were still some short gaps in detected activity. MODVOLC also detected increased thermal activity during August; thermal hotspots were detected a total of five times on 19, 20, and 27 August. Weak thermal anomalies were also captured in infrared satellite images on clear weather days throughout the reporting period on 7, 12, and 17 April, 27 May, 1, 6, 16, and 31 July, and 19 September (figure 48); a strong thermal anomaly was visible on 31 July. Distinct sulfur dioxide plumes that drifted generally NW were intermittently captured by the TROPOMI instrument on the Sentinel-5P satellite and sometimes exceeded two Dobson Units (DUs) (figure 49).
Geologic Background. Bagana volcano, in a remote portion of central Bougainville Island, is frequently active. This massive symmetrical cone was largely constructed by an accumulation of viscous andesitic lava flows. The entire edifice could have been constructed in about 300 years at its present rate of lava production. Eruptive activity is characterized by non-explosive effusion of viscous lava that maintains a small lava dome in the summit crater, although occasional explosive activity produces pyroclastic flows. Lava flows with tongue-shaped lobes up to 50 m thick and prominent levees descend the flanks on all sides.
Information Contacts: Rabaul Volcano Observatory (RVO), Geohazards Management Division, Department of Mineral Policy and Geohazards Management (DMPGM), PO Box 3386, Kokopo, East New Britain Province, Papua New Guinea; Darwin Volcanic Ash Advisory Centre (VAAC), Bureau of Meteorology, Northern Territory Regional Office, PO Box 40050, Casuarina, NT 0811, Australia (URL: http://www.bom.gov.au/info/vaac/); MIROVA (Middle InfraRed Observation of Volcanic Activity), a collaborative project between the Universities of Turin and Florence (Italy) supported by the Centre for Volcanic Risk of the Italian Civil Protection Department (URL: http://www.mirovaweb.it/); Hawai'i Institute of Geophysics and Planetology (HIGP) - MODVOLC Thermal Alerts System, School of Ocean and Earth Science and Technology (SOEST), Univ. of Hawai'i, 2525 Correa Road, Honolulu, HI 96822, USA (URL: http://modis.higp.hawaii.edu/); NASA Global Sulfur Dioxide Monitoring Page, Atmospheric Chemistry and Dynamics Laboratory, NASA Goddard Space Flight Center (NASA/GSFC), 8800 Greenbelt Road, Goddard, Maryland, USA (URL: https://so2.gsfc.nasa.gov/); Copernicus Browser, Copernicus Data Space Ecosystem, European Space Agency (URL: https://dataspace.copernicus.eu/browser/); Autonomous Bougainville Government, P.O Box 322, Buka, AROB, PNG (URL: https://abg.gov.pg/); Andrew Tupper (Twitter: @andrewcraigtupp); Simon Carn, Geological and Mining Engineering and Sciences, Michigan Technological University, 1400 Townsend Drive, Houghton, MI 49931, USA (URL: http://www.volcarno.com/, Twitter: @simoncarn); Radio NZ (URL: https://www.rnz.co.nz/news/pacific/494464/more-than-7-000-people-in-bougainville-need-temporary-accommodation-after-eruption); USAID, 1300 Pennsylvania Ave, NW, Washington DC 20004, USA (URL: https://www.usaid.gov/pacific-islands/press-releases/aug-08-2023-united-states-provides-immediate-emergency-assistance-support-communities-affected-mount-bagana-volcanic-eruptions).
Mayon (Philippines) — October 2023 Cite this Report
Mayon
Philippines
13.257°N, 123.685°E; summit elev. 2462 m
All times are local (unless otherwise noted)
Lava flows, pyroclastic flows, ash emissions, and seismicity during April-September 2023
Mayon is located in the Philippines and has steep upper slopes capped by a small summit crater. Historical eruptions date back to 1616 CE that have been characterized by Strombolian eruptions, lava flows, pyroclastic flows, and mudflows. Eruptions mostly originated from a central conduit. Pyroclastic flows and mudflows have commonly descended many of the approximately 40 drainages that surround the volcano. The most recent eruption occurred during June through October 2022 and consisted of lava dome growth and gas-and-steam emissions (BGVN 47:12). A new eruption was reported during late April 2023 and has included lava flows, pyroclastic density currents, ash emissions, and seismicity. This report covers activity during April through September 2023 based on daily bulletins from the Philippine Institute of Volcanology and Seismology (PHIVOLCS).
During April through September 2023, PHIVOLCS reported near-daily rockfall events, frequent volcanic earthquakes, and sulfur dioxide measurements. Gas-and-steam emissions rose 100-900 m above the crater and drifted in different directions. Nighttime crater incandescence was often visible during clear weather and was accompanied by incandescent avalanches of material. Activity notably increased during June when lava flows were reported on the S, SE, and E flanks (figure 52). The MIROVA graph (Middle InfraRed Observation of Volcanic Activity) showed strong thermal activity coincident with these lava flows, which remained active through September (figure 53). According to the MODVOLC thermal algorithm, a total of 110 thermal alerts were detected during the reporting period: 17 during June, 40 during July, 27 during August, and 26 during September. During early June, pyroclastic density currents (PDCs) started to occur more frequently.
Low activity was reported during much of April and May; gas-and-steam emissions rose 100-900 m above the crater and generally drifted in different directions. A total of 52 rockfall events and 18 volcanic earthquakes were detected during April and 147 rockfall events and 13 volcanic events during May. Sulfur dioxide flux measurements ranged between 400-576 tons per day (t/d) during April, the latter of which was measured on 29 April and between 162-343 t/d during May, the latter of which was measured on 13 May.
Activity during June increased, characterized by lava flows, pyroclastic density currents (PDCs), crater incandescence and incandescent rockfall events, gas-and-steam emissions, and continued seismicity. Weather clouds often prevented clear views of the summit, but during clear days, moderate gas-and-steam emissions rose 100-2,500 m above the crater and drifted in multiple directions. A total of 6,237 rockfall events and 288 volcanic earthquakes were detected. The rockfall events often deposited material on the S and SE flanks within 700-1,500 m of the summit crater and ash from the events drifted SW, S, SE, NE, and E. Sulfur dioxide emissions ranged between 149-1,205 t/d, the latter of which was measured on 10 June. Short-term observations from EDM and electronic tiltmeter monitoring indicated that the upper slopes were inflating since February 2023. Longer-term ground deformation parameters based on EDM, precise leveling, continuous GPS, and electronic tilt monitoring indicated that the volcano remained inflated, especially on the NW and SE flanks. At 1000 on 5 June the Volcano Alert Level (VAL) was raised to 2 (on a 0-5 scale). PHIVOLCS noted that although low-level volcanic earthquakes, ground deformation, and volcanic gas emissions indicated unrest, the steep increase in rockfall frequency may indicate increased dome activity.
A total of 151 dome-collapse PDCs occurred during 8-9 and 11-30 June, traveled 500-2,000 m, and deposited material on the S flank within 2 km of the summit crater. During 8-9 June the VAL was raised to 3. At approximately 1947 on 11 June lava flow activity was reported; two lobes traveled within 500 m from the crater and deposited material on the S (Mi-isi), SE (Bonga), and E (Basud) flanks. Weak seismicity accompanied the lava flow and slight inflation on the upper flanks. This lava flow remained active through 30 June, moving down the S and SE flank as far as 2.5 km and 1.8 km, respectively and depositing material up to 3.3 km from the crater. During 15-16 June traces of ashfall from the PDCs were reported in Sitio Buga, Nabonton, City of Ligao and Purok, and San Francisco, Municipality of Guinobatan. During 28-29 June there were two PDCs generated by the collapse of the lava flow front, which generated a light-brown ash plume 1 km high. Satellite monitors detected significant concentrations of sulfur dioxide beginning on 29 June. On 30 June PDCs primarily affected the Basud Gully on the E flank, the largest of which occurred at 1301 and lasted eight minutes, based on the seismic record. Four PDCs generated between 1800 and 2000 that lasted approximately four minutes each traveled 3-4 km on the E flank and generated an ash plume that rose 1 km above the crater and drifted N and NW. Ashfall was recorded in Tabaco City.
Similar strong activity continued during July; slow lava effusion remained active on the S and SE flanks and traveled as far as 2.8 km and 2.8 km, respectively and material was deposited as far as 4 km from the crater. There was a total of 6,983 rockfall events and 189 PDCs that affected the S, SE, and E flanks. The volcano network detected a total of 2,124 volcanic earthquakes. Continuous gas-and-steam emissions rose 200-2,000 m above the crater and drifted in multiple directions. Sulfur dioxide emissions averaged 792-4,113 t/d, the latter of which was measured on 28 July. During 2-4 July three PDCs were generated from the collapse of the lava flow and resulting light brown plumes rose 200-300 m above the crater. Continuous tremor pulses were reported beginning at 1547 on 3 July through 7 July at 1200, at 2300 on 8 July and going through 0300 on 10 July, and at 2300 on 16 July, as recorded by the seismic network. During 6-9 July there were 10 lava flow-collapse-related PDCs that generated light brown plumes 300-500 m above the crater. During 10-11 July light ashfall was reported in some areas of Mabinit, Legazpi City, Budiao and Salvacion, Daraga, and Camalig, Albay. By 18 July the lava flow advanced 600 m on the E flank as well.
During 1733 on 18 July and 0434 on 19 July PHIVOLCS reported 30 “ashing” events, which are degassing events accompanied by audible thunder-like sounds and entrained ash at the crater, which produced short, dark plumes that drifted SW. These events each lasted 20-40 seconds, and plume heights ranged from 150-300 m above the crater, as recorded by seismic, infrasound, visual, and thermal monitors. Three more ashing events occurred during 19-20 July. Short-term observations from electronic tilt and GPS monitoring indicate deflation on the E lower flanks in early July and inflation on the NW middle flanks during the third week of July. Longer-term ground deformation parameters from EDM, precise leveling, continuous GPS, and electronic tilt monitoring indicated that the volcano was still generally inflated relative to baseline levels. A short-lived lava pulse lasted 28 seconds at 1956 on 21 July, which was accompanied by seismic and infrasound signals. By 22 July, the only lava flow that remained active was on the SE flank, and continued to extend 3.4 km, while those on the S and E flanks weakened markedly. One ashing event was detected during 30-31 July, whereas there were 57 detected during 31 July-1 August; according to PHIVOLCS beginning at approximately 1800 on 31 July eruptive activity was dominated by phases of intermittent ashing, as well as increased in the apparent rates of lava effusion from the summit crater. The ashing phases consisted of discrete events recorded as low-frequency volcanic earthquakes (LFVQ) typically 30 seconds in duration, based on seismic and infrasound signals. Gray ash plume rose 100 m above the crater and generally drifted NE. Shortly after these ashing events began, new lava began to effuse rapidly from the crater, feeding the established flowed on the SE, E, and E flanks and generating frequent rockfall events.
Intensified unrest persisted during August. There was a total of 4,141 rockfall events, 2,881 volcanic earthquakes, which included volcanic tremor events, 32 ashing events, and 101 PDCs detected throughout the month. On clear weather days, gas-and-steam emissions rose 300-1,500 m above the crater and drifted in different directions (figure 54). Sulfur dioxide emissions averaged 735-4,756 t/d, the higher value of which was measured on 16 August. During 1-2 August the rate of lava effusion decreased, but continued to feed the flows on the SE, S, and E flanks, maintaining their advances to 3.4 km, 2.8 km, and 1.1 km from the crater, respectively (figure 55). Rockfall and PDCs generated by collapses at the lava flow margins and from the summit dome deposited material within 4 km of the crater. During 3-4 August there were 10 tremor events detected that lasted 1-4 minutes. Short-lived lava pulse lasted 35 seconds and was accompanied by seismic and infrasound signals at 0442 on 6 August. Seven collapses were recorded at the front of the lava flow during 12-14 August.
During September, similar activity of slow lava effusion, PDCs, gas-and-steam emissions, and seismicity continued. There was a total of 4,452 rockfall events, 329 volcanic earthquakes, which included volcanic tremor events, two ashing events, and 85 PDCs recorded throughout the month. On clear weather days, gas-and-steam emissions rose 100-1,500 m above the crater and drifted in multiple directions. Sulfur dioxide emissions averaged 609-2,252 t/d, the higher average of which was measured on 6 September. Slow lava effusion continued advancing on the SE, S, and E flanks, maintaining lengths of 3.4 km, 2.8 km, and 1.1 km, respectively. Rockfall and PDC events generated by collapses along the lava flow margins and at the summit dome deposited material within 4 km of the crater.
Geologic Background. Symmetrical Mayon, which rises above the Albay Gulf NW of Legazpi City, is the most active volcano of the Philippines. The steep upper slopes are capped by a small summit crater. Recorded eruptions since 1616 CE range from Strombolian to basaltic Plinian, with cyclical activity beginning with basaltic eruptions, followed by longer periods of andesitic lava flows. Eruptions occur predominately from the central conduit and have also produced lava flows that travel far down the flanks. Pyroclastic density currents and mudflows have commonly swept down many of the approximately 40 ravines that radiate from the summit and have often damaged populated lowland areas. A violent eruption in 1814 killed more than 1,200 people and devastated several towns.
Information Contacts: Philippine Institute of Volcanology and Seismology (PHIVOLCS), Department of Science and Technology, University of the Philippines Campus, Diliman, Quezon City, Philippines (URL: http://www.phivolcs.dost.gov.ph/); MIROVA (Middle InfraRed Observation of Volcanic Activity), a collaborative project between the Universities of Turin and Florence (Italy) supported by the Centre for Volcanic Risk of the Italian Civil Protection Department (URL: http://www.mirovaweb.it/); Hawai'i Institute of Geophysics and Planetology (HIGP) - MODVOLC Thermal Alerts System, School of Ocean and Earth Science and Technology (SOEST), Univ. of Hawai'i, 2525 Correa Road, Honolulu, HI 96822, USA (URL: http://modis.higp.hawaii.edu/); Copernicus Browser, Copernicus Data Space Ecosystem, European Space Agency (URL: https://dataspace.copernicus.eu/browser/); William Rogers, Legazpi City, Albay Province, Philippines.
Nishinoshima (Japan) — October 2023 Cite this Report
Nishinoshima
Japan
27.247°N, 140.874°E; summit elev. 100 m
All times are local (unless otherwise noted)
Eruption plumes and gas-and-steam plumes during May-August 2023
Nishinoshima, located about 1,000 km S of Tokyo, is a small island in the Ogasawara Arc in Japan. The island is the summit of a massive submarine volcano that has prominent submarine peaks to the S, W, and NE. Eruptions date back to 1973 and the current eruption period began in October 2022. Recent activity has consisted of small ash plumes and fumarolic activity (BGVN 48:07). This report covers activity during May through August 2023, using information from monthly reports of the Japan Meteorological Agency (JMA) monthly reports and satellite data.
Activity during May through June was relatively low. The Japan Coast Guard (JCG) did overflights on 14 and 22 June and reported white gas-and-steam emissions rising 600 m and 1,200 m from the central crater of the pyroclastic cone, respectively (figure 125). In addition, multiple white gas-and-steam emissions rose from the inner rim of the W side of the crater and from the SE flank of the pyroclastic cone. Discolored brown-to-green water was observed around almost the entire perimeter of the island; on 22 June light green discolored water was observed off the S coast of the island.
Observations from the Himawari meteorological satellite confirmed an eruption on 9 and 10 July. An eruption plume rose 1.6 km above the crater and drifted N around 1300 on 9 July. Satellite images acquired at 1420 and 2020 on 9 July and at 0220 on 10 July showed continuing emissions that rose 1.3-1.6 km above the crater and drifted NE and N. The Tokyo VAAC reported that an ash plume seen by a pilot and identified in a satellite image at 0630 on 21 July rose to 3 km altitude and drifted S.
Aerial observations conducted by JCG on 8 August showed a white-and-gray plume rising from the central crater of the pyroclastic cone, and multiple white gas-and-steam emissions were rising from the inner edge of the western crater and along the NW-SE flanks of the island (figure 126). Brown-to-green discolored water was also noted around the perimeter of the island.
Intermittent low-to-moderate power thermal anomalies were recorded in the MIROVA graph (Middle InfraRed Observation of Volcanic Activity), showing an increase in both frequency and power beginning in July (figure 127). This increase in activity coincides with eruptive activity on 9 and 10 July, characterized by eruption plumes. According to the MODVOLC thermal alert algorithm, one thermal hotspot was recorded on 20 July. Weak thermal anomalies were also detected in infrared satellite imagery, accompanied by strong gas-and-steam plumes (figure 128).
Geologic Background. The small island of Nishinoshima was enlarged when several new islands coalesced during an eruption in 1973-74. Multiple eruptions that began in 2013 completely covered the previous exposed surface and continued to enlarge the island. The island is the summit of a massive submarine volcano that has prominent peaks to the S, W, and NE. The summit of the southern cone rises to within 214 m of the ocean surface 9 km SSE.
Information Contacts: Japan Meteorological Agency (JMA), 1-3-4 Otemachi, Chiyoda-ku, Tokyo 100-8122, Japan (URL: http://www.jma.go.jp/jma/indexe.html); Tokyo Volcanic Ash Advisory Center (VAAC), 1-3-4 Otemachi, Chiyoda-ku, Tokyo 100-8122, Japan (URL: http://ds.data.jma.go.jp/svd/vaac/data/); MIROVA (Middle InfraRed Observation of Volcanic Activity), a collaborative project between the Universities of Turin and Florence (Italy) supported by the Centre for Volcanic Risk of the Italian Civil Protection Department (URL: http://www.mirovaweb.it/); Copernicus Browser, Copernicus Data Space Ecosystem, European Space Agency (URL: https://dataspace.copernicus.eu/browser/).
Krakatau (Indonesia) — October 2023 Cite this Report
Krakatau
Indonesia
6.1009°S, 105.4233°E; summit elev. 285 m
All times are local (unless otherwise noted)
White gas-and-steam plumes and occasional ash plumes during May-August 2023
Krakatau is located in the Sunda Strait between Java and Sumatra, Indonesia. Caldera collapse during the catastrophic 1883 eruption destroyed Danan and Perbuwatan cones and left only a remnant of Rakata. The post-collapse cone of Anak Krakatau (Child of Krakatau) was constructed within the 1883 caldera at a point between the former Danan and Perbuwatan cones; it has been the site of frequent eruptions since 1927. The current eruption period began in May 2021 and has recently consisted of Strombolian eruptions and ash plumes (BGVN 48:07). This report describes lower levels of activity consisting of ash and white gas-and-steam plumes during May through August 2023, based on information provided by the Indonesian Center for Volcanology and Geological Hazard Mitigation, referred to as Pusat Vulkanologi dan Mitigasi Bencana Geologi (PVMBG), MAGMA Indonesia, and satellite data.
Activity was relatively low during May and June. Daily white gas-and-steam emissions rose 25-200 m above the crater and drifted in different directions. Five ash plumes were detected at 0519 on 10 May, 1241 on 11 May, 0920 on 12 May, 2320 on 12 May, and at 0710 on 13 May, and rose 1-2.5 km above the crater and drifted SW. A webcam image taken on 12 May showed ejection of incandescent material above the vent. A total of nine ash plumes were detected during 6-11 June: at 1434 and 00220 on 6 and 7 June the ash plumes rose 500 m above the crater and drifted NW, at 1537 on 8 June the ash plume rose 1 km above the crater and drifted SW, at 0746 and at 0846 on 9 June the ash plumes rose 800 m and 3 km above the crater and drifted SW, respectively, at 0423, 1431, and 1750 on 10 June the ash plumes rose 2 km, 1.5 km, and 3.5 km above the crater and drifted NW, respectively, and at 0030 on 11 June an ash plume rose 2 km above the crater and drifted NW. Webcam images taken on 10 and 11 June at 0455 and 0102, respectively, showed incandescent material ejected above the vent. On 19 June an ash plume at 0822 rose 1.5 km above the crater and drifted SE.
Similar low activity of white gas-and-steam emissions and few ash plumes were reported during July and August. Daily white gas-and-steam emissions rose 25-300 m above the crater and drifted in multiple directions. Three ash plumes were reported at 0843, 0851, and 0852 on 20 July that rose 500-2,000 m above the crater and drifted NW.
The MIROVA (Middle InfraRed Observation of Volcanic Activity) graph of MODIS thermal anomaly data showed intermittent low-to-moderate power thermal anomalies during May through August 2023 (figure 140). Although activity was often obscured by weather clouds, a thermal anomaly was visible in an infrared satellite image of the crater on 12 May, accompanied by an eruption plume that drifted SW (figure 141).
Geologic Background. The renowned Krakatau (frequently mis-named as Krakatoa) volcano lies in the Sunda Strait between Java and Sumatra. Collapse of an older edifice, perhaps in 416 or 535 CE, formed a 7-km-wide caldera. Remnants of that volcano are preserved in Verlaten and Lang Islands; subsequently the Rakata, Danan, and Perbuwatan cones were formed, coalescing to create the pre-1883 Krakatau Island. Caldera collapse during the catastrophic 1883 eruption destroyed Danan and Perbuwatan, and left only a remnant of Rakata. This eruption caused more than 36,000 fatalities, most as a result of tsunamis that swept the adjacent coastlines of Sumatra and Java. Pyroclastic surges traveled 40 km across the Sunda Strait and reached the Sumatra coast. After a quiescence of less than a half century, the post-collapse cone of Anak Krakatau (Child of Krakatau) was constructed within the 1883 caldera at a point between the former Danan and Perbuwatan cones. Anak Krakatau has been the site of frequent eruptions since 1927.
Information Contacts: Pusat Vulkanologi dan Mitigasi Bencana Geologi (PVMBG, also known as Indonesian Center for Volcanology and Geological Hazard Mitigation, CVGHM), Jalan Diponegoro 57, Bandung 40122, Indonesia (URL: http://www.vsi.esdm.go.id/); MAGMA Indonesia, Kementerian Energi dan Sumber Daya Mineral (URL: https://magma.esdm.go.id/v1); MIROVA (Middle InfraRed Observation of Volcanic Activity), a collaborative project between the Universities of Turin and Florence (Italy) supported by the Centre for Volcanic Risk of the Italian Civil Protection Department (URL: http://www.mirovaweb.it/); Copernicus Browser, Copernicus Data Space Ecosystem, European Space Agency (URL: https://dataspace.copernicus.eu/browser/).
Merapi (Indonesia) — October 2023 Cite this Report
Merapi
Indonesia
7.54°S, 110.446°E; summit elev. 2910 m
All times are local (unless otherwise noted)
Frequent incandescent avalanches during April-September 2023
Merapi, located just north of the major city of Yogyakarta in central Java, Indonesia, has had activity within the last 20 years characterized by pyroclastic flows and lahars accompanying growth and collapse of the steep-sided active summit lava dome. The current eruption period began in late December 2020 and has more recently consisted of ash plumes, intermittent incandescent avalanches of material, and pyroclastic flows (BGVN 48:04). This report covers activity during April through September 2023, based on information from Balai Penyelidikan dan Pengembangan Teknologi Kebencanaan Geologi (BPPTKG), the Center for Research and Development of Geological Disaster Technology, a branch of PVMBG which specifically monitors Merapi. Additional information comes from the Pusat Vulkanologi dan Mitigasi Bencana Geologi (PVMBG, also known as Indonesian Center for Volcanology and Geological Hazard Mitigation, CVGHM), MAGMA Indonesia, the Darwin Volcanic Ash Advisory Centre (VAAC), and various satellite data.
Activity during April through September 2023 primarily consisted of incandescent avalanches of material that mainly affected the SW and W flanks and traveled as far as 2.3 km from the summit (table 25) and white gas-and-steam emissions that rose 10-1,000 m above the crater.
Table 25. Monthly summary of avalanches and avalanche distances recorded at Merapi during April through September 2023. The number of reported avalanches does not include instances where possible avalanches were heard but could not be visually confirmed as a result of inclement weather. Data courtesy of BPPTKG (April-September 2023 daily reports).
| Month |
Average number of avalanches per day |
Distance avalanches traveled (m) |
| Apr 2023 |
19 |
1,200-2,000 |
| May 2023 |
22 |
500-2,000 |
| Jun 2023 |
18 |
1,200-2,000 |
| Jul 2023 |
30 |
300-2,000 |
| Aug 2023 |
25 |
400-2,300 |
| Sep 2023 |
23 |
600-2,000 |
BPPTKG reported that during April and May white gas-and-steam emissions rose 10-750 m above the crater, incandescent avalanches descended 500-2,000 m on the SW and W flanks (figure 135). Cloudy weather often prevented clear views of the summit, and sometimes avalanches could not be confirmed. According to a webcam image, a pyroclastic flow was visible on 17 April at 0531. During the week of 28 April and 4 May a pyroclastic flow was reported on the SW flank, traveling up to 2.5 km. According to a drone overflight taken on 17 May the SW lava dome volume was an estimated 2,372,800 cubic meters and the dome in the main crater was an estimated 2,337,300 cubic meters.
During June and July similar activity persisted with white gas-and-steam emissions rising 10-350 m above the crater and frequent incandescent avalanches that traveled 300-2,000 m down the SW, W, and S flanks (figure 136). Based on an analysis of aerial photos taken on 24 June the volume of the SW lava dome was approximately 2.5 million cubic meters. A pyroclastic flow was observed on 5 July that traveled 2.7 km on the SW flank. According to the Darwin VAAC multiple minor ash plumes were identified in satellite images on 19 July that rose to 3.7 km altitude and drifted S and SW. During 22, 25, and 26 July a total of 17 avalanches descended as far as 1.8 km on the S flank.
Frequent white gas-and-steam emissions continued during August and September, rising 10-450 m above the crater. Incandescent avalanches mainly affected the SW and W flanks and traveled 400-2,300 m from the vent (figure 137). An aerial survey conducted on 10 August was analyzed and reported that estimates of the SW dome volume was 2,764,300 cubic meters and the dome in the main crater was 2,369,800 cubic meters.
Frequent and moderate-power thermal activity continued throughout the reporting period, according to a MIROVA (Middle InfraRed Observation of Volcanic Activity) analysis of MODIS satellite data (figure 138). There was an increase in the number of detected anomalies during mid-May. The MODVOLC thermal algorithm recorded a total of 47 thermal hotspots: six during April, nine during May, eight during June, 15 during July, four during August, and five during September. Some of this activity was captured in infrared satellite imagery on clear weather days, sometimes accompanied by incandescent material on the SW flank (figure 139).
Geologic Background. Merapi, one of Indonesia's most active volcanoes, lies in one of the world's most densely populated areas and dominates the landscape immediately north of the major city of Yogyakarta. It is the youngest and southernmost of a volcanic chain extending NNW to Ungaran volcano. Growth of Old Merapi during the Pleistocene ended with major edifice collapse perhaps about 2,000 years ago, leaving a large arcuate scarp cutting the eroded older Batulawang volcano. Subsequent growth of the steep-sided Young Merapi edifice, its upper part unvegetated due to frequent activity, began SW of the earlier collapse scarp. Pyroclastic flows and lahars accompanying growth and collapse of the steep-sided active summit lava dome have devastated cultivated lands on the western-to-southern flanks and caused many fatalities.
Information Contacts: Balai Penyelidikan dan Pengembangan Teknologi Kebencanaan Geologi (BPPTKG), Center for Research and Development of Geological Disaster Technology (URL: http://merapi.bgl.esdm.go.id/, Twitter: @BPPTKG); MAGMA Indonesia, Kementerian Energi dan Sumber Daya Mineral (URL: https://magma.esdm.go.id/v1); Pusat Vulkanologi dan Mitigasi Bencana Geologi (PVMBG, also known as Indonesian Center for Volcanology and Geological Hazard Mitigation, CVGHM), Jalan Diponegoro 57, Bandung 40122, Indonesia (URL: http://www.vsi.esdm.go.id/); Darwin Volcanic Ash Advisory Centre (VAAC), Bureau of Meteorology, Northern Territory Regional Office, PO Box 40050, Casuarina, NT 0811, Australia (URL: http://www.bom.gov.au/info/vaac/); MIROVA (Middle InfraRed Observation of Volcanic Activity), a collaborative project between the Universities of Turin and Florence (Italy) supported by the Centre for Volcanic Risk of the Italian Civil Protection Department (URL: http://www.mirovaweb.it/); Hawai'i Institute of Geophysics and Planetology (HIGP) - MODVOLC Thermal Alerts System, School of Ocean and Earth Science and Technology (SOEST), Univ. of Hawai'i, 2525 Correa Road, Honolulu, HI 96822, USA (URL: http://modis.higp.hawaii.edu/); Copernicus Browser, Copernicus Data Space Ecosystem, European Space Agency (URL: https://dataspace.copernicus.eu/browser/); Øystein Lund Andersen (URL: https://www.oysteinlundandersen.com/, https://twitter.com/oysteinvolcano).
Villarrica (Chile) — October 2023 Cite this Report
Villarrica
Chile
39.42°S, 71.93°W; summit elev. 2847 m
All times are local (unless otherwise noted)
Strombolian activity, gas-and-ash emissions, and crater incandescence during April-September 2023
Villarrica, in central Chile, consists of a 2-km-wide caldera that formed about 3,500 years ago and is located at the base of the presently active cone at the NW margin of a 6-km-wide caldera. Historical eruptions eruptions date back to 1558 and have been characterized by mild-to-moderate explosive activity with occasional lava effusions. The current eruption period began in December 2014 and has recently consisted of nighttime crater incandescence, ash emissions, and seismicity (BGVN 48:04). This report covers activity during April through September 2023 and describes occasional Strombolian activity, gas-and-ash emissions, and nighttime crater incandescence. Information for this report primarily comes from the Southern Andes Volcano Observatory (Observatorio Volcanológico de Los Andes del Sur, OVDAS), part of Chile's National Service of Geology and Mining (Servicio Nacional de Geología y Minería, SERNAGEOMIN) and satellite data.
Seismicity during April consisted of long period (LP) events and tremor (TRE); a total of 9,413 LP-type events and 759 TR-type events were detected throughout the month. Nighttime crater incandescence persisted and was visible in the degassing column. Sulfur dioxide data was obtained using Differential Absorption Optical Spectroscopy Equipment (DOAS) that showed an average value of 1,450 ± 198 tons per day (t/d) during 1-15 April and 1,129 ± 201 t/d during 16-30 April, with a maximum daily value of 2,784 t/d on 9 April. Gas-and-steam emissions of variable intensities rose above the active crater as high as 1.3 km above the crater on 13 April. Strombolian explosions were not observed and there was a slight decrease in the lava lake level.
There were 14,123 LP-type events and 727 TR-type events detected during May. According to sulfur dioxide measurements taken with DOAS equipment, the active crater emitted an average value of 1,826 ± 482 t/d during 1-15 May and 912 ± 41 t/d during 16-30 May, with a daily maximum value of 5,155 t/d on 13 May. Surveillance cameras showed continuous white gas-and-steam emissions that rose as high as 430 m above the crater on 27 May. Nighttime incandescence illuminated the gas column less than 300 m above the crater rim was and no pyroclastic emissions were reported. A landslide was identified on 13 May on the E flank of the volcano 50 m from the crater rim and extending 300 m away; SERNAGEOMIN noted that this event may have occurred on 12 May. During the morning of 27 and 28 May minor Strombolian explosions characterized by incandescent ejecta were recorded at the crater rim; the last reported Strombolian explosions had occurred at the end of March.
Seismic activity during June consisted of five volcano-tectonic (VT)-type events, 21,606 LP-type events, and 2,085 TR-type events. The average value of sulfur dioxide flux obtained by DOAS equipment was 1,420 ± 217 t/d during 1-15 June and 2,562 ± 804 t/d, with a maximum daily value of 4,810 t/d on 17 June. White gas-and-steam emissions rose less than 480 m above the crater; frequent nighttime crater incandescence was reflected in the degassing plume. On 12 June an emission rose 100 m above the crater and drifted NNW. On 15 June one or several emissions resulted in ashfall to the NE as far as 5.5 km from the crater, based on a Skysat satellite image. Several Strombolian explosions occurred within the crater; activity on 15 June was higher energy and ejected blocks 200-300 m on the NE slope. Surveillance cameras showed white gas-and-steam emissions rising 480 m above the crater on 16 June. On 19 and 24 June low-intensity Strombolian activity was observed, ejecting material as far as 200 m from the center of the crater to the E.
During July, seismicity included 29,319 LP-type events, 3,736 TR-type events, and two VT-type events. DOAS equipment recorded two days of sulfur dioxide emissions of 4,220 t/d and 1,009 t/d on 1 and 13 July, respectively. Constant nighttime incandescence was also recorded and was particularly noticeable when accompanied by eruptive columns on 12 and 16 July. Minor explosive events were detected in the crater. According to Skysat satellite images taken on 12, 13, and 16 July, ashfall deposits were identified 155 m S of the crater. According to POVI, incandescence was visible from two vents on the crater floor around 0336 on 12 July. Gas-and-ash emissions rose as high as 1.2 km above the crater on 13 July and drifted E and NW. A series of gas-and-steam pulses containing some ash deposited material on the upper E flank around 1551 on 13 July. During 16-31 July, average sulfur dioxide emissions of 1,679 ± 406 t/d were recorded, with a maximum daily value of 2,343 t/d on 28 July. Fine ash emissions were also reported on 16, 17, and 23 July.
Seismicity persisted during August, characterized by 27,011 LP-type events, 3,323 TR-type events, and three VT-type events. The average value of sulfur dioxide measurements taken during 1-15 August was 1,642 ± 270 t/d and 2,207 ± 4,549 t/d during 16-31 August, with a maximum daily value of 3,294 t/d on 27 August. Nighttime crater incandescence remained visible in degassing columns. White gas-and-steam emissions rose 480 m above the crater on 6 August. According to a Skysat satellite image from 6 August, ash accumulation was observed proximal to the crater and was mainly distributed toward the E slope. White gas-and-steam emissions rose 320 m above the crater on 26 August. Nighttime incandescence and Strombolian activity that generated ash emissions were reported on 27 August.
Seismicity during September was characterized by five VT-type events, 12,057 LP-type events, and 2,058 TR-type events. Nighttime incandescence persisted. On 2 September an ash emission rose 180 m above the crater and drifted SE at 1643 (figure 125) and a white gas-and-steam plume rose 320 m above the crater. According to the Buenos Aires VAAC, periods of continuous gas-and-ash emissions were visible in webcam images from 1830 on 2 September to 0110 on 3 September. Strombolian activity was observed on 2 September and during the early morning of 3 September, the latter event of which generated an ash emission that rose 60 m above the crater and drifted 100 m from the center of the crater to the NE and SW. Ashfall was reported to the SE and S as far as 750 m from the crater. The lava lake was active during 3-4 September and lava fountaining was visible for the first time since 26 March 2023, according to POVI. Fountains captured in webcam images at 2133 on 3 September and at 0054 on 4 September rose as high as 60 m above the crater rim and ejected material onto the upper W flank. Sulfur dioxide flux of 1,730 t/d and 1,281 t/d was measured on 3 and 4 September, respectively, according to data obtained by DOAS equipment.
Strong Strombolian activity and larger gas-and-ash plumes were reported during 18-20 September. On 18 September activity was also associated with energetic LP-type events and notable sulfur dioxide fluxes (as high as 4,277 t/d). On 19 September Strombolian activity and incandescence were observed. On 20 September at 0914 ash emissions rose 50 m above the crater and drifted SSE, accompanied by Strombolian activity that ejected material less than 100 m SSE, causing fall deposits on that respective flank. SERNAGEOMIN reported that a Planet Scope satellite image taken on 20 September showed the lava lake in the crater, measuring 32 m x 35 m and an area of 0.001 km2. Several ash emissions were recorded at 0841, 0910, 1251, 1306, 1312, 1315, and 1324 on 23 September and rose less than 150 m above the crater. The sulfur dioxide flux value was 698 t/d on 23 September and 1,097 t/d on 24 September. On 24 September the Volcanic Alert Level (VAL) was raised to Orange (the third level on a four-color scale). SENAPRED maintained the Alert Level at Yellow (the middle level on a three-color scale) for the communities of Villarrica, Pucón (16 km N), Curarrehue, and Panguipulli.
During 24-25 September there was an increase in seismic energy (observed at TR-events) and acoustic signals, characterized by 1 VT-type event, 213 LP-type events, and 124 TR-type events. Mainly white gas-and-steam emissions, in addition to occasional fine ash emissions were recorded. During the early morning of 25 September Strombolian explosions were reported and ejected material 250 m in all directions, though dominantly toward the NW. On 25 September the average value of sulfur dioxide flux was 760 t/d. Seismicity during 25-30 September consisted of five VT-type events, 1,937 LP-type events, and 456 TR-type events.
During 25-29 September moderate Strombolian activity was observed and ejected material as far as the crater rim. In addition, ash pulses lasting roughly 50 minutes were observed around 0700 and dispersed ENE. During 26-27 September a TR episode lasted 6.5 hours and was accompanied by discrete acoustic signals. Satellite images from 26 September showed a spatter cone on the crater floor with one vent that measured 10 x 14 m and a smaller vent about 35 m NE of the cone. SERNAGEOMIN reported an abundant number of bomb-sized blocks up to 150 m from the crater, as well as impact marks on the snow, which indicated explosive activity. A low-altitude ash emission was observed drifting NW around 1140 on 28 September, based on webcam images. Between 0620 and 0850 on 29 September an ash emission rose 60 m above the crater and drifted NW. During an overflight taken around 1000 on 29 September scientists observed molten material in the vent, a large accumulation of pyroclasts inside the crater, and energetic degassing, some of which contained a small amount of ash. Block-sized pyroclasts were deposited on the internal walls and near the crater, and a distal ash deposit was also visible. The average sulfur dioxide flux measured on 28 September was 344 t/d. Satellite images taken on 29 September ashfall was deposited roughly 3 km WNW from the crater and nighttime crater incandescence remained visible. The average sulfur dioxide flux value from 29 September was 199 t/d. On 30 September at 0740 a pulsating ash emission rose 1.1 km above the crater and drifted NNW (figure 126). Deposits on the S flank extended as far as 4.5 km from the crater rim, based on satellite images from 30 September.
Infrared MODIS satellite data processed by MIROVA (Middle InfraRed Observation of Volcanic Activity) showed intermittent thermal activity during April through September, with slightly stronger activity detected during late September (figure 127). Small clusters of thermal activity were detected during mid-June, early July, early August, and late September. According to the MODVOLC thermal alert system, a total of four thermal hotspots were detected on 7 July and 3 and 23 September. This activity was also intermittently captured in infrared satellite imagery on clear weather days (figure 128).
Geologic Background. The glacier-covered Villarrica stratovolcano, in the northern Lakes District of central Chile, is ~15 km south of the city of Pucon. A 2-km-wide caldera that formed about 3,500 years ago is located at the base of the presently active, dominantly basaltic to basaltic andesite cone at the NW margin of a 6-km-wide Pleistocene caldera. More than 30 scoria cones and fissure vents are present on the flanks. Plinian eruptions and pyroclastic flows that have extended up to 20 km from the volcano were produced during the Holocene. Lava flows up to 18 km long have issued from summit and flank vents. Eruptions documented since 1558 CE have consisted largely of mild-to-moderate explosive activity with occasional lava effusion. Glaciers cover 40 km2 of the volcano, and lahars have damaged towns on its flanks.
Information Contacts: Servicio Nacional de Geología y Minería (SERNAGEOMIN), Observatorio Volcanológico de Los Andes del Sur (OVDAS), Avda Sta María No. 0104, Santiago, Chile (URL: http://www.sernageomin.cl/); Proyecto Observación Villarrica Internet (POVI) (URL: http://www.povi.cl/); Sistema y Servicio Nacional de Prevención y Repuesta Ante Desastres (SENAPRED), Av. Beauchef 1671, Santiago, Chile (URL: https://web.senapred.cl/); Buenos Aires Volcanic Ash Advisory Center (VAAC), Servicio Meteorológico Nacional-Fuerza Aérea Argentina, 25 de mayo 658, Buenos Aires, Argentina (URL: http://www.smn.gov.ar/vaac/buenosaires/inicio.php); MIROVA (Middle InfraRed Observation of Volcanic Activity), a collaborative project between the Universities of Turin and Florence (Italy) supported by the Centre for Volcanic Risk of the Italian Civil Protection Department (URL: http://www.mirovaweb.it/); Hawai'i Institute of Geophysics and Planetology (HIGP) - MODVOLC Thermal Alerts System, School of Ocean and Earth Science and Technology (SOEST), Univ. of Hawai'i, 2525 Correa Road, Honolulu, HI 96822, USA (URL: http://modis.higp.hawaii.edu/); Copernicus Browser, Copernicus Data Space Ecosystem, European Space Agency (URL: https://dataspace.copernicus.eu/browser/).
Ebeko
Russia
50.686°N, 156.014°E; summit elev. 1103 m
All times are local (unless otherwise noted)
Moderate explosive activity with ash plumes continued during June-November 2023
Ebeko, located on the N end of Paramushir Island in Russia’s Kuril Islands just S of the Kamchatka Peninsula, consists of three summit craters along a SSW-NNE line at the northern end of a complex of five volcanic cones. Observed eruptions date back to the late 18th century and have been characterized as small-to-moderate explosions from the summit crater, accompanied by intense fumarolic activity. The current eruptive period began in June 2022, consisting of frequent explosions, ash plumes, and thermal activity (BGVN 47:10, 48:06). This report covers similar activity during June-November 2023, based on information from the Kamchatka Volcanic Eruptions Response Team (KVERT) and satellite data.
Moderate explosive activity continued during June-November 2023 (figures 50 and 51). According to visual data from Severo-Kurilsk, explosions sent ash 2-3.5 km above the summit (3-4.5 km altitude) during most days during June through mid-September. Activity after mid-September was slightly weaker, with ash usually reaching less than 2 km above the summit. According to KVERT the volcano in October and November was, with a few exceptions, either quiet or obscured by clouds that prevented satellite observations. KVERT issued Volcano Observatory Notices for Aviation (VONA) on 8 and 12 June, 13 and 22 July, 3 and 21 August, and 31 October warning of potential aviation hazards from ash plumes drifting 3-15 km from the volcano. Based on satellite data, KVERT reported a persistent thermal anomaly whenever weather clouds permitted viewing.
Geologic Background. The flat-topped summit of the central cone of Ebeko volcano, one of the most active in the Kuril Islands, occupies the northern end of Paramushir Island. Three summit craters located along a SSW-NNE line form Ebeko volcano proper, at the northern end of a complex of five volcanic cones. Blocky lava flows extend west from Ebeko and SE from the neighboring Nezametnyi cone. The eastern part of the southern crater contains strong solfataras and a large boiling spring. The central crater is filled by a lake about 20 m deep whose shores are lined with steaming solfataras; the northern crater lies across a narrow, low barrier from the central crater and contains a small, cold crescentic lake. Historical activity, recorded since the late-18th century, has been restricted to small-to-moderate explosive eruptions from the summit craters. Intense fumarolic activity occurs in the summit craters, on the outer flanks of the cone, and in lateral explosion craters.
Information Contacts: Kamchatka Volcanic Eruptions Response Team (KVERT), Far Eastern Branch, Russian Academy of Sciences, 9 Piip Blvd., Petropavlovsk-Kamchatsky, 683006, Russia (URL: http://www.kscnet.ru/ivs/kvert/).
Search Bulletin Archive by Publication Date
Select a month and year from the drop-downs and click "Show Issue" to have that issue displayed in this tab.
The default month and year is the latest issue available.
Bulletin of the Global Volcanism Network - Volume 38, Number 09 (September 2013)
Managing Editor: Richard Wunderman
Copahue (Chile-Argentina)
Small ash eruptions during 2012-2013
Etna (Italy)
46 paroxysms and birth of the New Southeast Crater (NSEC)
Mayon (Philippines)
Quiet during May 2013-November 2013; super-typhoon and lahars
Poas (Costa Rica)
Decreasing number of phreatic eruptions after 2011 through 2013
Puyehue-Cordon Caulle (Chile)
Explosive phases ended in April 2012 and the rhyolitic dome continued to flow ~1 year later
Sinabung (Indonesia)
17,000 evacuees as mid- to late-2013 eruption emits pyroclastic flows
Witori (Papua New Guinea)
Explosive ash plumes reported in May-July 2012
Copahue (Chile-Argentina) — September 2013 Cite this Report
Copahue
Chile-Argentina
37.856°S, 71.183°W; summit elev. 2953 m
All times are local (unless otherwise noted)
Small ash eruptions during 2012-2013
Our last report on Copahue volcano described the phreato-magmatic eruption of July 2000 (BGVN 25:06). Up until July 2012, activity at Copahue was characterized by passive degassing. In this report, we summarize the changes registered from Copahue which culminated in minor ash eruptions. According to Instituto Nacional de Prevención Sísmica (INPRES), a phreatic eruption occurred on 19 July 2012 and Servicio Nacional de Geologia y Mineria (SERNAGEOMIN) reported that ash emissions continued intermittently during December 2012-December 2013.
INPRES and Forte and others (2012) noted that seismicity increased in the region of Copahue after the Mw 8.8 earthquake that occurred 3 km W of the Chilean shoreline on 27 February 2010. This activity was coincident with a progressive increase in fumarolic activity from the crater lake, El Agrio. A dense plume of vapor and acidic gases were frequently observed between 200-300 meters above the crater rim (figure 7).
According to Vélez and others (2011), differential interferometry (DInSAR) studies performed with ENVISAT radar images of Copahue's flanks suggested changes in deformation trends dominated by deflation during 2003-2008 and inflation during November-December 2011. A deformation map constructed between November 2011 and Aril 2012 showed uplift with displacements up to 7 cm (Vélez, 2012).
During March 2012, acidic water from the crater lake and hot springs on the E flank of the volcano was analyzed by Caselli and others (2012) and Agusto and others (in progress). The acidity (pH2, Cl, and F) showed unusually high values. These investigators also highlighted a significant decrease in the level of Copahue's crater lake waterline.
In July 2012, several seismic events of high and low frequency spectral content were reported by INPRES. Simultaneously, intense bubbling was observed in the SW area of Copahue's crater at an interval of 1 to 3 minutes (figure 8). A small explosion was reported on 17 July 2012 and photographed by a local guide (figure 9); it consisted of phreatic manifestations up to 10 meters high.
On 19 July 2012, another phreatomagmatic explosion occurred with emissions of pyroclastic material that, according to SERNAGEOMIN, producing a plume that extending for ~18 km ESE (figure 10). The resulting proximal tephra included ash and fine- and coarse-sized lapilli up to 20 cm in diameter. A sample of this event recovered from the crater mainly consisted of sulfur-rich clasts with a low percentage of pumice fragments, scoriae fragments, irregular argillaceous white material, and accidental fragments. The pyroclastic material sampled displayed variable sizes (3-4 mm in diameter), mostly including globular morphology, and contained vesicles. Other morphologies included perfect spheres and elongated forms and like deformed drops (figure 11, A and B). Regarding glassy particles, different classes were identified according presence, size and shape of the vesicles, as vitreous pumiceous shards, platy, cuspate and blocky glass shards (figure 11 C and D). Further details of the particle morphology were obtained with SEM analysis (figure 12). Vitreous fragments showed similar composition to those described in 2000 eruption.
A seismic array from the Grupo de Estudio y Seguimiento de Volcanes Activos (GESVA) had been installed near the town of Caviahue and it registered a wide range of seismicity during July 2012. GESVA documented volcano-tectonic events, hybrid events, long period events, tremor at various frequency ranges including harmonic tremor, and explosions. Several seismic swarms were reported during the phreatomagmatic eruption on 19 July 2012. GESVA is an investigative program within the geological department of the University of Buenos Aires.
On 26 July 2012 GESVA researchers conducted a new survey of the crater lake. All physical and chemical parameters showed high values with temperatures of 60°C at the lake margin, high acidity (pH
Continued unrest December 2012-December 2013. The Observatorio Volcanológico de los Andes del Sur-Servicio Nacional de Geologia y Mineria (OVDAS-SERNAGEOMIN) reported on 22 December 2012 an alert change from Orange to Red Alert at Copahue. This report highlighted the onset of harmonic tremor which lasted for 5 minutes and was immediately followed by two explosions. A camera maintained by OVDAS (~18 km SE) captured images of incandescence up to 200 m above the crater that correlated with the timing of the explosions. The observed height of the plume was between 1-1.5 km and it drifted SE (Figure 13).
Local newspapers reported that, on 23 December, ashfall and sulfur odors were limited to the proximal towns of Zapala (~150 km SE) and Cutral Co (~210 km SE). There were some reports of local citizens self-evacuating from the area due to anticipated ashfall. People within 15 km of the volcano and along drainages were warned about a potential increase in activity potentially including lahars. The municipalities of Villa La Angostura and Bariloche, located ~340 km S within Argentina, were not at risk during this event. In contrast, they had experienced heavy ashfall in 2011 due to Puyehue-Córdon Caulle's eruption.
The Buenos Aires Volcanic Ash Advisory Center (VAAC) reported at 1400 on 22 December 2012 that satellite images revealed a 110 km ash plume extending SE of Copahue; the plume was white and gray (figure 14). The plume persisted in satellite images during the next day, although its aerial extent later became restricted near the summit. By 24 December, the 22 December ash was only detected in an isolated area over the Atlantic Ocean.
VAAC reports indicated minor and possible ash emissions at the volcano on the following dates: 27, 28, and 30 December 2012; 2, 5, 9, and 10 January 2013; on 4 February; 28 and 29 March; on 12 April; on 15 November (possible ash was reported on 21 and 22 November). VAAC reports were also released intermittently during January-November 2013 due to gas emissions.
SERNAGEOMIN reduced the Alert Level from Red to Orange on 23 December 2012. The level was reduced again, on 28 December to Yellow, and was maintained until 5 January 2013 when seismicity increased (including three spasmodic tremor events). The webcamera also documented an increase in degassing that appeared to be gray and drifting E on 5 January; the Buenos Aires VAAC was able to track this minor ash plume. Alert Level Orange status continued until 17 January when it was decreased to Yellow.
The Alert Level fluctuated later in January (to and from Orange Alert) based on changing conditions which frequently included seismic swarms. One significant swarm, for example, occurred on 22 January.
Periodic incandescence was observed during February-May and SERNAGEOMIN reported small explosions of gas with minor ash on 7 and 15 May. On 19 May, OMI (Ozone Monitoring Instrument) detected elevated SO2 emissions within 300 m above the crater. During 20 and 22 May, satellite images detected gray-colored plume that drifted up to 100 km SE. On 23 May, incandescence was observed as well as an increase in SO2 flux as measured by the OMI satellite measurements; that activity triggered an increase in Alert Level to Orange.
Red Alert was announced one time in 2013 when, on 27 May, a seismic swarm began at a time of high RSAM measurements. An evacuation order was declared by SERNAGEOMIN that day for an area surrounding the volcano with a 25 km radius; they stated that the intensity and type of seismicity observed in the last few days and the deformation of the volcanic edifice suggested the rise of a magmatic body. Army trucks and buses were made available for the ~2,240 residents within that area, primarily those living in Alto Bío Bío. The swarm continued for several days into June. The Alert Level was reduced to Orange by 3 June. Local news sources reported that residents were authorized to begin returning to their homes on 6 June. The Alert Level was reduced to Yellow on 12 June and was maintained through the rest of 2013.
On 4 June 2013, the Hyperion sensor onboard the satellite EO-1 observed Copahue at 1333 UTC and a thermal anomaly was detected from the summit area of the volcano (figure 15). The calculated temperatures ranged from ~377 to ~647°C (personal communication, Ashley Davies, NASA Jet Propulsion Laboratory).
An overflight of Copahue's summit was conducted on 9 June by OVDAS-SERNAGEOMIN in order to make observations of the area as reconnaissance for future installations of three seismometers. A 200 m plume was visible rising from the crater although no lava or lava dome was visible within the crater. There were sulfurous gas odors and the observers also noted that there were no indications of lahar flows outside of the crater.
On 23 and 26 August SERNAGEOMIN reported that incandescence was observed by the local webcamera; a possible ash event occurred on 26 June. Elevated SO2 emissions were also detected by the Ozone Monitoring Instrument (OMI) on 23 August and during 5 days in September. Incandescence was reported during the last week of September.
On 16, 23, and 28 October, ash was observed by the local webcameras; the most energetic event occurred on 28 October. Elevated SO2 was detected by OMI on during 21, 26, and 27 October.
SERNAGEOMIN reported in their November report that INSAR data from NASA determined that deformation of the edifice continued at a rate of 3.9 cm/year which was considered less than values measured earlier in the year. Incandescence was notable on 13 November and minor ash was reported on 16, 17, 18, 21, and 30 November. Elevated SO2was detected by OMI on 29 November.
Small explosions were recorded on 10 December but ash was not confirmed. The local webcamera captured a plume that reached ~1,100 m above the crater. This event was accompanied by low-frequency seismicity.
MODVOLC Alerts 2012-2013: Elevated temperatures were detected by the MODIS sensors onboard the Aqua and Terra satellites during 2012-2013 (table 1). The MODVOLC system generated alerts on 11 days during the two years of unrest. During 2013, the alerts occurred in January and May on two separate days. While the local, SERNAGEOMIN webcamera recorded incandescence (particularly at night), the satellite remote sensing capabilities contended with cloudcover that frequently masked the area. For example, in January 2013 alone, there were 4 notable cases of nighttime incandescence (on 5, 8, 9, and 11 January).
Table 1. The MODVOLC system generated several thermal alerts during January 2012-May 2013. No additional alerts were generated during June-December 2013. Courtesy of HIGP.
| Date |
Number of Pixels |
| 22 Dec 2012 |
5 |
| 23 Dec 2012 |
2 |
| 24 Dec 2012 |
2 |
| 26 Dec 2012 |
1 |
| 27 Dec 2012 |
4 |
| 28 Dec 2012 |
2 |
| 29 Dec 2012 |
2 |
| 30 Dec 2012 |
2 |
| 01 Jan 2013 |
1 |
| 03 Jan 2013 |
2 |
| 05 Jan 2013 |
3 |
| 10 Jan 2013 |
1 |
| 12 Jan 2013 |
1 |
| 09 May 2013 |
1 |
References. Agusto, M. 2011. Estudio Geoquímico de Fluidos Volcánicos-Hidrotermales del complejo volcánico Copahue-Caviahue, y su Aplicación a Tareas de Seguimiento. Tesis de Doctorado. 296 páginas. Facultad de Cs. Exactas y Naturales. Universidad de Buenos Aires.
Agusto, M., Tassi, F., Capaccioni, B., Rouwet, D., Caselli. A., Vaselli, O. (en preparación). Chemical and isotopic compositions of fumarolic discharges from magmatic-hydrothermal system of Copahue volcano (Argentina). A combined (inorganic and organic) geochemical approach to understanding the origin of the fluid discharges.
Agusto, M., Caselli, A., Tassi, F., dos Santos Afonso, M., Vaselli. O. 2012. (aceptado). Caracterización y seguimiento geoquímico de las aguas Ácidas del sistema volcÁn Copahue - río Agrio: posible aplicación para la identificación de precursores eruptivos. Revista de la Asociación Geológica Argentina. ISSN 0004-4822.
Agusto, M., Vélez, ML., Caselli, A., Euillades, P., Tassi, F., Capaccioni, B., Vaselli, O. 2012. Correlación entre anomalías térmicas, geoquímicas y procesos deflacionarios en el volcán Copahue. XIII Congreso Geológico Chileno. Antofagasta, 2012. Actas: 429-431.
Caselli, A.T., Agusto M.R. y Fazio A., 2005. Cambios térmicos y geoquímicos del lago cratérico del volcán Copahue (Neuquén): posibles variaciones cíclicas del sistema volcánico. XVI Congreso Geológico Argentino, La Plata. Actas I: 751-756.
Caselli, A., Vélez, M.L., Agusto, M.R., Bengoa, C.L. Euillades, P.A. Ibañez, J.M., 2009. Copahue volcano (Argentina): A relationship between ground deformation, seismic activity and geochemical changes. Ed. Bean, Braiden, Lockmer, Martini and O'Brien.The VOLUME project.VOLcanoes: Understanding subsurface mass movement. Printed by jaycee. ISBN: 978-1-905254-39-2, pp 309-318.
Caselli, A., M. Agusto, B. Capaccioni, F. Tassi, G. Chiodini y D. Tardani. 2012. Aumento térmico y composicional de las aguas cratéricas del VolcÁn Copahue registradas durante el año 2012 (Neuquen, Argentina). XIII Congreso Geológico Chileno. Antofagasta, 2012. Actas: 435-436.
Forte, P., C. Bengoa, A. Caselli. 2012. AnÁlisis preliminar de la actividad sísmica del complejo volcÁnico Copahue-Caviahue mediante técnicas de array. XIII Congreso Geológico Chileno. Antofagasta, 2012. Actas: 568-570.
Ibañez J. M., Del Pezzo E., Bengoa, C., Caselli, A.T., Badi, G.A y J. Almendros. 2008. Volcanic tremor associated with the geothermal activity of Copahue volcano, Southern Andes region, Argentina. Journal of Volcanology and Geothermal Research (Elsevier, ISSN:0377-0273) 174: 284-294.
Tassi, F., Caselli, A., Vaselli, O., Agusto, M., Capecchiacci. F., 2007.Downstream composition of acidic volcanic waters discharged from Copahue crater lake (Argentina): the chemical evolution of Rio Agrio watershed. Federazione Italiana della Scienze della Tierra- FIST. Italia.
Varekamp, J.C., Ouimette, A.; HermÁn, S., Bermúdez, A.; Delpino, D., 2001. Hydrothermal element fluxes from Copahue, Argentina: A "beehive" volcano in turmoil. Geology, 29 (11): 1059-1062.
Varekamp, J.C., Ouimette, A.P., Herman, S.W., Flynn, K.S., Bermudez, A., Delpino, D., 2009. Naturally acid waters from Copahue volcano, Argentina. Applied Geochemistry 24, 208-220.
Vélez, M.L., 2011. Análisis de la deformación asociada al comportamiento de sistemas volcÁnicos activos: Volcán Copahue. Tesis Doctoral. Facultad Ciencias Exactas y Naturales - Universidad de Buenos Aires, 154 p.
Velez, M. L., Euillades, P., Caselli, A., Blanco, M., Díaz, J.M., 2011, Deformation of Copahue volcano: Inversion of InSAR data using a genetic algorithm, Journal of Volcanology and Geothermal Research, 202: 117-126.
Geologic Background. Volcán Copahue is an elongated composite cone constructed along the Chile-Argentina border within the 6.5 x 8.5 km wide Trapa-Trapa caldera that formed between 0.6 and 0.4 million years ago near the NW margin of the 20 x 15 km Pliocene Caviahue (Del Agrio) caldera. The eastern summit crater, part of a 2-km-long, ENE-WSW line of nine craters, contains a briny, acidic 300-m-wide crater lake (also referred to as El Agrio or Del Agrio) and displays intense fumarolic activity. Acidic hot springs occur below the eastern outlet of the crater lake, contributing to the acidity of the Río Agrio, and another geothermal zone is located within Caviahue caldera about 7 km NE of the summit. Infrequent mild-to-moderate explosive eruptions have been recorded since the 18th century. Twentieth-century eruptions from the crater lake have ejected pyroclastic rocks and chilled liquid sulfur fragments.
Information Contacts: Observatorio Volcanológico de los Andes del Sur-Servicio Nacional de Geologia y Mineria (OVDAS-SERNAGEOMIN), Avda Sta María No. 0104, Santiago, Chile (URL: http://www.sernageomin.cl/); Alberto Caselli and Laura Vélez, Grupo de Estudio y Seguimiento de Volcanes Activos (GESVA), Departamento Ciencias Geológicas, FCE y N, Universidad de Buenos Aires, Buenos Aires , Argentina (URL: http://www.gesva.gl.fcen.uba.ar/); D. Pablo Groeber (UBA-CONICET), FCEyN - UBA (URL: http://www.ifibyne.fcen.uba.ar/new/); G. Badi, Departamento de Sismología e I. M., Facultad de Ciencias Astronómicas y Geofísicas, Universidad Nacional de La Plata (URL: http://www.fcaglp.unlp.edu.ar/ciencia-y-tecnica/); R. Daga, Laboratorio AnÁlisis por Activación Neutrónica (CAB-CNEA) - CONICET y C. Cotaro, y C. Ayala, Grupo de Caracterización de materiales (CAB-CNEA) (URL: http://www2.cab.cnea.gov.ar/); P. Euillades, L. Euillades, M. Blanco, and S. Balbarani, Instituto CEDIAC - Facultad de Ingeniería Universidad Nacional de Cuyo (URL: https://fing.uncu.edu.ar/); M. Araujo, Instituto Nacional de Prevención Sísmica (INPRES) (URL: http://www.inpres.gov.ar/); Buenos Aires Volcanic Ash Advisory Center (VAAC) (URL: http://www.smn.gov.ar/vaac/buenosaires/productos.php); Hawai'i Institute of Geophysics and Planetology (HIGP) MODVOLC Thermal Alerts System, School of Ocean and Earth Science and Technology (SOEST), Univ. of Hawai'i, 2525 Correa Road, Honolulu, HI 96822, USA (URL: http://modis.higp.hawaii.edu/); Simon Carn, NASA Global Sulfur Dioxide Monitoring, Aura/OMI (URL: https://so2.gsfc.nasa.gov/); La Nación, Buenos Aires, Argentina (URL: http://www.lanacion.com.ar/1539643-entro-en-erupcion-el-volcan-copahue); Dia a Dia, Buenoes Aires, Argentina (URL: http://www.diaadia.com.ar).
Etna
Italy
37.748°N, 14.999°E; summit elev. 3357 m
All times are local (unless otherwise noted)
46 paroxysms and birth of the New Southeast Crater (NSEC)
Since our last report on Etna (BGVN 36:05), which covered activity through 29 December 2010, intervals of vigorous activity (paroxysms) have continued, with 18 paroxysms in 2011, 7 in 2012, and 21 in 2013. During this reporting interval, 30 December 2010-31 December 2013, the activity can be viewed as a series of paroxysms detailed in a chronology shown below. Activity at the Northeast Crater (NEC) remained minor during the reporting interval. The Bocca Nuova produced activity in July and December 2011, and then in January 2013 where two episodes of intense Strombolian activity occurred on the evenings of 16 and 18 January.
In addition, during this reporting interval, there emerged a "New" Southeast crater (NSEC). The "old" SEC was last active in May 2007. NSEC formed at a large pyroclastic cone that grew alongside the SEC's active crater. The cone's early growth took place during seven paroxysmal episodes between January and July 2011, and continued to grow though the end of 2013.
Paroxysms at Etna. The term paroxysm, and its use in the phrase 'paroxysmal episode,' has become common in describing Etna's eruptive outbursts, particularly in the past few decades. INGV's Boris Behncke has described the behavior associated with these terms, employing both photos and videos widely available online. Paroxysm is a short-hand for Etna's often intense Strombolian discharges that frequently include lava fountaining, lava flow emission, and tephra columns, which erupted at the summit craters.
Behncke notes that Etna's typical paroxysm consists of three main phases: (1) prelude and waxing, (2) climax, and (3) waning and cessation. The climactic phase 2 part of the behavior represents the true paroxysm. To describe a collective set of all three phases at Etna, Behncke prefers that they be called "paroxysmal episode," "paroxysmal eruptive episode" or "eruptive episode."
Summary and chronology. Table 10 contains a 2011-2013 chronology of Etna's paroxysmal episodes at the NSEC as reported by INGV. There were 46 such episodes during the interval shown in the table. There are clear cases where the description of a single paroxysm glosses over complexities of the eruptive process (see, for example, the 30 July discussion in the next section).
Table 10. A list of NSEC paroxysmal episodes from Etna's New Southeast Crater and their numbering for 2011- 2013. The column at far right contains occasional notations of interesting or extraordinary events taken from INGV reporting. In some cases there are minor variations in dates and numbering.
| Paroxysm number |
Date |
Notes |
| 2011 |
| 1 |
13 Jan 2011 |
1-7 correspond to strong growth of NSEC; At irregular intervals small landslides occurred within the crater depression |
| 2 |
18 Feb 2011 |
-- |
| 3 |
10 Apr 2011 |
-- |
| 4 |
12 May 2011 |
-- |
| 5 |
09 Jul 2011 |
A dense eruptive plume rose several kilometers and drifted S and SE, causing ash-and-lapilli fall in populated areas and forcing the closure of the Fontanarossa international airport in Catania. |
| 6 |
19 Jul 2011 |
-- |
| 7 |
25 Jul 2011 |
-- |
| 8 |
30/31 Jul 2011 |
See figure 142 (30 July 2011) The event was essentially a repetition of the previous paroxysms, with the emission of a lava flow W toward the Valle del Bove, lava fountains rising to maximum heights of 450-500 m, and an ash plume that was blown E by the wind. |
| 9 |
08 Aug 2011 |
-- |
| 10 |
12 Aug 2011 |
-- |
| 11 |
20 Aug 2011 |
-- |
| 12 |
29 Aug 2011 |
-- |
| 13 |
08 Sep 2011 |
-- |
| 14 |
19 Sep 2011 |
This event, which occurred during rather poor weather conditions, produced lava fountains from various vents within the crater and on its southeastern flank, lava flows that descended the western slope of the Valle del Bove, and an ash cloud that was bent by the strong wind to the NE. |
| 15 |
28 Sep 2011 |
-- |
| 16 |
08 Oct 2011 |
-- |
| 17 |
23 Oct 2011 |
-- |
| 18 |
15 Nov 2011 |
This episode has in nearly all details been a repetition of its predecessors, though with a few minor variations; the culminating phase lasted about one hour and terminated rather abruptly. Ash-and-lapilli falls affected the SE flank, including the towns of Zafferana, Etnea and Acireale. |
| 2012 |
| 1 / 19 |
05 Jan 2012 |
-- |
| 2 / 20 |
09 Feb 2012 |
This event was less violent than its predecessors, but lasted more than 5 hours. A lava flow descended toward the Valle del Bove, stagnating before it reached the valley floor. |
| 3 / 21 |
04 Mar 2012 |
-- |
| 4 / 22 |
18 Mar 2012 |
Tall lava fountains, a tephra and vapor column several kilometers high (leading to ash and lapilli falls over the E sector of the volcano), and lava flows that descended into the Valle del Bove, locally interacting explosively with thick snow cover on the ground. |
| 5 / 23 |
01 Apr 2012 |
-- |
| 6 / 24 |
12 Apr 2012 |
-- |
| 7 / 25 |
24 Apr 2012 |
This event, which occurred after a relatively quiet interval of 11.5 days, repeated in virtually all details the preceding episodes, with lava fountains, copious emission of ash and lapilli, and lava flows that descended into the Valle del Bove. |
| 2013 |
| 1 / 26 |
20 Jan 2013 |
The two episodes of Strombolian activity at the New Southeast Crater during 20 and 22-23 January represented the first emission of new magmatic products after a quiet interval of nearly nine months. |
| 2 / 27 |
22-23 Jan 2013 |
-- |
| 3 / 28 |
19-20 Feb 2013 |
Starting the morning on 19 February, with 3 more paroxysms during the next 54 hours. Pronounced cone growth at NSEC. Lava flows emitted from base of NSEC ongoing between paroxysms. |
| 4 / 29 |
21 Feb 2013 |
-- |
| 5 / 30 |
23 Feb 2013 |
Very active event. See figure 143 (23 Feb). Ash plume trending ESE, lava flows from the fissure cutting the SE crater rim and also from a new eruptive fissure, and small lahars. The second paroxysm of the day produced an ash cloud that drifted E; new lava flows descended toward the Valle del Bove, following the paths of their predecessors. The rapid succession of three paroxysmal eruptive episodes in less than 36 hours is quite notable; the only known historic precedent of three paroxysms occurring in such a short time interval at Etna was the series of eruptive episodes in 2000 |
| 6 / 31 |
28 Feb 2013 |
-- |
| 7 / 32 |
5/6 Mar 2013 |
-- |
| 8 / 33 |
16 Mar 2013 |
This event, one of the most intense of the current series of paroxysms, was preceded by a long "prelude" (Strombolian activity) that started on the afternoon of 15 March, and was followed by weak, discontinuous activity at the Voragine. |
| 9 / 34 |
3 Apr 2013 |
-- |
| 10 / 35 |
12 April 2013 |
Lava fountaining; high column of pyroclastic material; The eruption formed a pyroclastic cloud directed to the SE, initially producing lapilli and ash, which fell mostly near the inhabited centers of Zafferana Etnea, Santa Venerina e Acireale; later including the communities of Giarre and Milo situated slightly to the N. |
| 11 / 36 |
18 Apr 2013 |
-- |
| 12 / 37 |
20 Apr 2013 |
Very powerful episode: lava fountains reached heights of 800-1000 m above the crater, whereas the cloud of pyroclastic material expanded toward ESE, leading to heavy fall of ash and lapilli over the areas of Zafferana Etnea, Milo, Santa Venerina and further downslope, in the area of Giarre. |
| 13 / 38 |
27 Apr 2013 |
-- |
| 14 / 39 |
26 Oct 2013 |
A gas plume laden with pyroclastic material rose several kilometers above the summit and drifted SW, affecting population centers as far as the Caltanissetta area. Activity caused the closure of airspace near Catania airport before dawn through the early morning. |
| 15 / 40 |
11 Nov 2013 |
-- |
| 16 / 41 |
17 Nov 2013 |
-- |
| 17 / 42 |
23 November 2013 |
Very powerful episode: rapid evolution from Strombolian activity to lava fountains. The eruption column, several kilometers high, was charged with pyroclastic material that was dispersed by the wind to the NE. |
| 18 / 43 |
28 Nov 2013 |
– |
| 19 / 44 |
02 Dec 2013 |
See Figure 144 (2 December) This event produced tall lava fountains, lava flows, and an eruption column charged with pyroclastic material, which drifted NNW, causing ash and lapilli to fall in the area of Bronte. Several lava flows were emitted to the SSE, SE, NE and S. The flow traveled SE and reached the base of the W headwall of the Valle del Bove. |
| 20 / 45 |
14-16 Dec 2013 |
Ash emissions caused the cancellation of more than 20 flights in and out of the Catania airport on 15 December. |
| 21 / 46 |
29-31 Dec 2013 |
-- |
Regarding paroxysm number 8 (30-31 July 2011), INGV featured photos (e.g., figure 142) and made comments such as the following.
"About 19.00 h local time (= UTC-1), the mean amplitude of the volcanic tremor started to increase again, and so did the Strombolian activity. At around 19.30, a dilute gas and ash plume was again blown eastward by the wind. The Strombolian activity progressively gained in intensity, quite more rapidly than during the morning's activity, and the incandescent jets became continuous around 21.30 local time. At the same time, renewed lava overflow toward east showed a rapid increase in effusion rate, forming a multilobate flow down the western slope of the Valle del Bove, which traveled approximately 3 km down reaching about 2,000 m elevation by 2300 local time. The ash plume became denser and was blown eastward by the wind, generating ash falls in the Ionian sector of the volcano.
"During the phase of maximum intensity, fragments of fluid lava were violently thrown to heights of about 450-500 m above the crater rim, causing heavy fallout onto the external flanks of the pyroclastic cone to a distance of 200-300 m. Lava fountains were jetting from at least two vents located within the crater and on its upper east flank, roughly aligned west-northwest - east-southeast."
2013. There were two main phases of activity during 2013. The first occurred during January-April; the second, after a 6-month quiescence, began on 26 October (table 10).
Figure 143 shows a view of the paroxysmal event of 23 February 2013. Of the events listed during the first phase of 2013 (table 10), this was a particularly active one.
INGV reported that eight eruptive events occurred between 26 October and 31 December 2013. The largest of these events occurred on 23 November 2013 and stood out as a noteworthy event in terms of amplitude. Figure 144 shows a scene from the episode on 2 December 2013.
Paroxysmal activity at Etna caused significant disruptions regionally during the reporting period; the Catania airport cancelled flights in and out of the airport several times. On 9 July 2011, Strombolian explosions turned into a continuous lava fountain; a dense eruptive plume rose several kilometers and drifted S and SE. Ash and lapilli from the plume fell in populated areas including Trecastagni, Viagrande, and Acireale (SE), and between Nicolosi and Catania (S), forcing the closure of the Fontanarossa international airport in Catania. In 2013, according to a news article, a representative from Catania airport noted activity at Etna prompted the closure of nearby airspace from before dawn through the early morning of 26 October 2013. According to another news article, the ash emissions caused the cancellation of more than 20 flights in and out of the Catania airport on 15 December 2013.
The New SEC (NSEC). The old SEC cone was last active in May 2007. The NSEC cone grew substantially between 12 January and 25 July 2011 (episodes 1-7) (table 10) and thereafter. Figure 145 shows a photo of the NSEC taken on 29 July 2011.
Since its emergence in 2011, the NSEC grew substantially, especially in 2013. The size of NSEC can be seen relative to the old SEC in figure 146. Smaller and farther left (E) is the low cone Sudestino ('little southeast'), which grew during several paroxysmal episodes during the spring of 2000 just beyond the SEC's S side (BGVN 25:03; 25:09). The right upper half of the image is dominated by the NSEC cone, which grew entirely during the previous 10 months. INGV noted that during 2013 the NSEC cone expanded both in height and width.
The October -December phase of Etna's 2013 activity is summarized in an INGV report from 22 January 2014 (B. Behncke & E. De Beni). Figure 147 shows a map of lava flows emanating from the NSEC during this phase of activity (26 October - 31 December 2013).
Geologic Background. Mount Etna, towering above Catania on the island of Sicily, has one of the world's longest documented records of volcanism, dating back to 1500 BCE. Historical lava flows of basaltic composition cover much of the surface of this massive volcano, whose edifice is the highest and most voluminous in Italy. The Mongibello stratovolcano, truncated by several small calderas, was constructed during the late Pleistocene and Holocene over an older shield volcano. The most prominent morphological feature of Etna is the Valle del Bove, a 5 x 10 km caldera open to the east. Two styles of eruptive activity typically occur, sometimes simultaneously. Persistent explosive eruptions, sometimes with minor lava emissions, take place from one or more summit craters. Flank vents, typically with higher effusion rates, are less frequently active and originate from fissures that open progressively downward from near the summit (usually accompanied by Strombolian eruptions at the upper end). Cinder cones are commonly constructed over the vents of lower-flank lava flows. Lava flows extend to the foot of the volcano on all sides and have reached the sea over a broad area on the SE flank.
Information Contacts: Boris Behncke, Istituto Nazionale di Geofisica e Vulcanologia (INGV), Sezione di Catania, Piazza Roma 2, 95123 Catania, Italy (URL: http://www.ct.ingv.it/).
Mayon (Philippines) — September 2013 Cite this Report
Mayon
Philippines
13.257°N, 123.685°E; summit elev. 2462 m
All times are local (unless otherwise noted)
Quiet during May 2013-November 2013; super-typhoon and lahars
Following the phreatic eruption on 7 May 2013 that killed 7 climbers (BGVN 38:04), there has been little increase in volcanic activity at Mayon volcano. Seismicity has mostly receded to baseline levels, aside from occasional volcanic earthquakes. These earthquakes occur about once every other day, with minimal earthquakes in June and September. The activity reported by the Philippine Institute of Volcanology and Seismology (PHIVOLCS) in table 12 below represents a continuation of table 11 from a previous Bulletin report (BGVN 34:12). Rockfalls and earthquakes are plotted in figure 22.
Table 12. Almost daily summaries of observations at Mayon, including seismicity and SO2emission rates during 1 June -23 November 2013. Number of events represent counts from the seismic monitoring network over a 24-hour period prior to the stated reporting date/time (except as noted). For example RF: 1 means 1 rockfall; and VE: 2 means 2 volcanic earthquakes. Rockfall events are related to the detachment of lava fragments at the volcano's upper slopes. No ash explosions were recorded during this time period. SO2 emission rates, measured by FLYSPEC [a miniature, light-weight ultraviolet correlation spectrometer (Horton and others, 2006)], are for the day before the reporting date. Courtesy of PHIVOLCS.
| Report Date(local time), 2013 |
Volcanic earthquakes (VE) and rockfalls (RF) |
SO2 flux (tonnes/day) |
| 01 June |
-- |
131 |
| 02 June |
RF: 1 |
-- |
| 05 June |
VE: 1 |
-- |
| 07 June |
RF: 1 |
-- |
| 10 June |
VE: 1 |
-- |
| 13 June |
VE: 1 |
-- |
| 14 June |
-- |
133 |
| 18 June |
VE: 1 |
-- |
| 01 July |
RF: 2 |
-- |
| 02 July |
VE: 1 |
-- |
| 05 July |
VE: 2 |
-- |
| 13 July |
VE: 1 RF: 2 |
-- |
| 17 July |
VE: 2 |
-- |
| 18 July |
VE: 2 RF: 1 |
-- |
| 19 July |
VE: 2 |
-- |
| 21 July |
VE: 1 |
-- |
| 27 July |
VE: 1 |
-- |
| 28 July |
VE: 2 |
-- |
| 31 July |
VE: 2 |
-- |
| 01 August |
RF: 1 |
-- |
| 02 August |
RF: 1 |
-- |
| 05 August |
VE: 1 |
-- |
| 06 August |
VE: 1 |
-- |
| 07 August |
VE: 2 |
-- |
| 08 August |
VE: 2 |
-- |
| 09 August |
VE: 2 |
-- |
| 11 August |
VE: 2 |
-- |
| 14 August |
-- |
322 |
| 16 August |
VE: 1 |
-- |
| 21 August |
VE: 1 |
-- |
| 23 August |
VE: 1 |
107 |
| 24 August |
VE: 1 |
-- |
| 30 August |
-- |
183 |
| 10 September |
-- |
218 |
| 17 September |
VE: 1 |
-- |
| 28 September |
VE: 1 |
|
| 02 October |
VE: 1 |
-- |
| 03 October |
VE: 1 |
-- |
| 05 October |
VE: 3 |
-- |
| 07 October |
VE: 1 |
-- |
| 09 October |
VE: 1 |
159 |
| 10 October |
VE: 1 |
-- |
| 13 October |
VE: 1 |
-- |
| 16 October |
-- |
466 |
| 22 October |
VE: 1 |
260 |
| 23 October |
VE: 1 |
-- |
| 24 October |
VE: 2 |
-- |
| 25 October |
-- |
84 |
| 31 October |
VE: 4 |
-- |
| 13 November |
VE: 2 |
-- |
| 15 November |
VE: 1 |
-- |
| 17 November |
VE: 1 |
-- |
| 18 November |
VE: 1 |
-- |
| 19 November |
VE: 1 |
-- |
| 20 November |
VE: 1 |
-- |
| 21 November |
VE: 3 |
-- |
| 22 November |
VE: 2 |
-- |
| 23 November |
VE: 5 |
211 |
When cloud cover and heavy rain does not inhibit observations, PHIVOLCS had consistently recorded white steam plumes that drifted in various directions from June to November 2013. Bluish fumes, a sign of hydrogen sulfide, were witnessed on 5 and 7 June, 15 and 23 August, and 7 and 28 September. Ground deformation surveys in the second week of August showed that the inflationary trend was continuing. In May 2013, electronic tilt meters measured Mayon's edifice to be slightly inflated compared to January 2010.
Crater glow of Intensity 1 was observed numerous times from June to September. According PHIVOLCS, a crater glow of Intensity 1 is faint, Intensity 2 is more visible to the naked eye, Intensity 3 is bright, and Intensity 4 is intense. Crater glow likely results from incandescence of new lava, or newly exposed lava, reflecting off local crater walls, clouds, or steam.
PHIVOLCS interprets enhanced crater glow as a sign of SO2 clouds, but there had been little SO2 fluctuation from June to November. Mayon's Alert status remained at Level 1 following the increase from Level 0 on 31 May 2013. However, PHIVOLCS continues to advise residents and visitors to avoid the 6-kilometer radius Permanent Danger Zone (PDZ) due to hazards such as rockfalls, landslides, sudden ash emissions, and phreatic eruptions. Level 1 is the 2nd value on a scale from 0 to 5, with 5 signifying an ongoing hazardous eruption; level 1 indicates an abnormal condition, but no magmatic eruption is imminent.
On 6 November 2013, PHIVOLCS issued a warning for super-typhoon Haiyan, locally known as Yolanda, indicating that excessive rainfall might trigger landslides and lahars at Mayon. Peak winds during Haiyan were consistently 170 mph, making the storm a super-typhoon as classified by NOAA ("maximum sustained 1-minute surface winds of at least [150 miles per hour]"). With the potential of large-magnitude lahars, the province of Albay started an evacuation of about 103,200 people along areas downstream, as shown in figure 23. According to the news source, Inquirer, adjacent communities, including Guinobatan, Legaspi City, Sto. Domingo, Daraga and Ligao City, were at risk for inundation, burial and washout. PHIVOLCS also issued precautions concerning debris flows from landslides of Mt. Masaraga, an old volcanic edifice N of Mayon.
Geologic Background. Symmetrical Mayon, which rises above the Albay Gulf NW of Legazpi City, is the most active volcano of the Philippines. The steep upper slopes are capped by a small summit crater. Recorded eruptions since 1616 CE range from Strombolian to basaltic Plinian, with cyclical activity beginning with basaltic eruptions, followed by longer periods of andesitic lava flows. Eruptions occur predominately from the central conduit and have also produced lava flows that travel far down the flanks. Pyroclastic density currents and mudflows have commonly swept down many of the approximately 40 ravines that radiate from the summit and have often damaged populated lowland areas. A violent eruption in 1814 killed more than 1,200 people and devastated several towns.
Information Contacts: Philippine Institute of Volcanology and Seismology (PHIVOLCS); Associated Press (URL: http://www.ap.org/); Daily Mail (URL: http://www.dailymail.co.uk); NOAA (URL: http://www.aoml.noaa.gov); and Philippine Daily Inquirer (URL: http://www.inquirer.net/).
Poas (Costa Rica) — September 2013 Cite this Report
Poas
Costa Rica
10.2°N, 84.233°W; summit elev. 2697 m
All times are local (unless otherwise noted)
Decreasing number of phreatic eruptions after 2011 through 2013
In an activity report on 31 August 2011, the Observatorio Vulcanologico y Sismologico de Costa Rica-Universidad Nacional (OVSICORI-UNA) indicated that Poás had experienced intense phreatic activity between 2006 and mid-2011. In June 2011, however, the frequency of eruptions began to decrease dramatically. The report also indicated that Laguna Caliente, the hot, acid crater lake on the northern summit, had shrunk by about 94 percent between 2006 and mid-2011; during this same period, the lake's pH had decreased from 1.22 to minus 0.72 and its water temperature had increased from 32°C to 62°C. One explosion, on 25 December 2009, apparently opened a more permanent vent at the crater lake's bottom. On the S edge of the lake is a dome (that OVSICORI-UNA sometimes in their reports refers to as a "cryptodome"), where frequent, intense degassing has occurred. The lake exhibits vigorous convective activity, and acid rain is frequently observed.
Our previous report (BGVN 36:04) discussed activity through February 2011. This report presents activity between that date and 31 December 2013. Figure 100 indicates the location of the volcano in Costa Rica. A photo of the active crater and surrounding area is shown in figure 101.
Activity in 2011. An OVSICORI-UNA activity report from November 2011 and an annual 2012 summary indicated that the temperature of the dome had increased dramatically during early 2011 as the result of super-heated gas released through the dome. The temperature, measured by thermocouple, peaked in August 2011 at 890°C, and then decreased steadily thereafter through at least the end of 2012, when the temperature was about 100°C. In early 2011, incandescence could be seen at night; however, during June-September, it could also be seen during the day. This phenomenon had not occurred since 1981. OVSICORI-UNA speculated that the changes could be either from a recent magma intrusion or a change in the hydrothermal plumbing system.
A news article (Inside Costa Rica) reported that a team of geologists and volcanologists from the Universidad de Costa Rica visited Poás on 25 May 2011 and observed 18 phreatic explosions from Laguna Caliente during a three-hour period. According to the article, the volcano normally produced 1-2 explosions per day.
On 23 July 2011, OVSICORI-UNA scientists visited Poás to document changes during the previous weeks. They observed fumaroles with vigorous bluish emissions in the fractured rock about 40 m above the lake surface. Those emissions produced incandescence observable during the daylight. The emission temperature was 670°C at the dome's mid-wall. A separate report noted that the temperatures at the dome were unusually high, in the range of 700-890°C between June and October 2011. Scientists noted that on the SE shore of Laguna Caliente, a subtle, semicircular scarp observed a few months earlier had rapidly progressed to a sharp scarp. The 60-m-wide, 2.5-m-high scarp was degassing and geyser activity was observed on the W end, next to the lake.
OVSICORI-UNA visited the volcano again on 8 September 2011, and observed that two newly formed cavities at the N base of the dome had merged into a crater that was 25 m long and 7-10 m wide. The scientists also found incandescence reflected in the gas plume about 80 m from the edge of the lake to near the top N edge of the dome (figure 102 and 103). OVSICORI-UNA reported that a new fumarole had appeared on the crater during August-September 2011.
According to OVSICORI-UNA, fumarolic activity continued during October 2011, with bluish gas plumes rising more than 1 km from the dome. Toward the end of the month, the fumarolic activity as well as incandescence from the dome had decreased. Phreatic activity continued. The lake temperature was 55°C and the level had risen 22 cm between 14 September and 27 October 2011.
OVSICORI-UNA reported that during fieldwork on 16 December 2011 scientists observed new geyser activity from a vent that had formed earlier in 2011 on the dome's N flank. A water-and-mud fountain rose 5-6 m high and flowed into the lake, resulting in a terrace along the S shore. Gas-and-steam plumes rose from the dome.
Activity in 2012. According to OVSICORI-UNA, at least 44-47 phreatic explosions were observed in 2012, either by the rangers of the Parque Nacional Volcán Poás (Poás Volcano National Park) or in seismic recordings. The number per month for the year ranged from 0 (in September) to 10 (in October). Sometimes these explosions were characterized by large bubbles of gas and liquid, under 500 m high. For example, during May 2012, eruptions occurred on 6, 15, 20 and 26 May. The eruption on 15 May was preceded by about 6 hours of very low amplitude harmonic tremor. Administrators at the National Park witnessed the explosion and reported that sediment, water, rock fragments, and plumes were ejected ~500 m above the lake surface. The lake level dropped ~0.9 m between 8 and 29 May, while the water temperature was steady during this period at ~48°C. Dome fumarole temperatures decreased during 2012, from ~700°C to ~100°C.
OVSICORI reported that higher amplitude, more frequent phreatic eruptions occurred in October 2012, especially during 18-27 October. Two phreatic explosions occurred on 27 October 2012. One of them ejected water, sulfur-rich sediments, and rock fragments onto the S and SW edges of the crater floor. According to a news article (The Tico Times), local residents heard a loud rumble at about 0100 on 28 October; a phreatic explosion ejected sediment 500 m above the lake, and produced ashfall several hundred meters away.
Between January and October 2012, the lake level decreased about 4 m; in November and December, the lake level rose by the same amount due to the high precipitation common at this time of year. Strong rainfall in November eroded the N flank of the dome.
Seismicity remained stable in 2012, with less than 200 daily earthquakes, mostly shallow low-frequency events. During 2012, the number of volcano-tectonic earthquakes remained low. The only significant seismicity occurred during 5-7 September, following the 5 September Nicoya earthquake (Mw 7.4) in the NW part of Costa Rica.
Activity in 2013. According to OVSICORI-UNA's annual report for 2013, seismic activity remained stable, with 10-150 earthquakes daily. Isolated small magnitude, shallow, volcano-tectonic earthquakes also occurred. Tremors were recorded infrequently and were of short duration. Hybrid earthquakes with large amplitudes (up to 3 cm2 reduced displacement) began in September, peaked in October, and fell in November.
In March 2013, OVSICORI-UNA began to measure the concentration of CO2, SO2, and H2S, using a portable multi-gas station provided by Italy's Istituto Nazionale di Geofisica e Vulcanologia (National Institute of Geophysics and Volcanology, INGV). In April 2013 the SO2 emission, as measured by a portable DOAS (Differential Optical Absorption Spectroscopy), was 120 /-30 metric tons per day.
In 2013, the dome temperature rose from 100°C in January to values above 500° C during the middle of the year, resulting in incandescence observed at night during May 2013. For example, maximum temperatures of 575°C and 450°C were recorded on 8 and 30 May, respectively. Later in the year, temperatures decreased to as low as 200°C in October, before rising somewhat again. Before 2013, a thermocouple was used to measure temperatures; thereafter, both a thermocouple and a remote infrared camera were used.
Lake activity in 2013 was very similar to that reported for 2012, again characterized by sporadic phreatic eruptions (figure 104). The number of eruptions per month ranged from 4 (March, April, July) to 9 (May, October). The water level remained relatively constant at 4 m until about June-August when it decreased to as low as about 1.5 m, before rising again. During 2013, no significant change in water temperature (about 45-50°C) or pH (0-0.3) was noted, similar to measurements in 2012. For example, the lake temperature was about 46°C on 8 May 2013 and 48°C on 8 May 2012. The pH was 0.03 on 8 May 2013, compared to 0.07 on 8 May 2012.
During 2013, rainfall was substantially less acidic, reflecting a decrease in the release of gases and heat through the active crater. Fumarolic activity was variable.
During the early morning hours on 2 and 3 June, residents reported a gas plume rising 1 km above the crater floor. OVSICORI-UNA observed that recent plumes had been hot (450-575°C) and rich in sulfur dioxide, giving the plumes a bluish-white color.
Geologic Background. The broad vegetated edifice of Poás, one of the most active volcanoes of Costa Rica, contains three craters along a N-S line. The frequently visited multi-hued summit crater lakes of the basaltic-to-dacitic volcano are easily accessible by vehicle from the nearby capital city of San José. A N-S-trending fissure cutting the complex stratovolcano extends to the lower N flank, where it has produced the Congo stratovolcano and several lake-filled maars. The southernmost of the two summit crater lakes, Botos, last erupted about 7,500 years ago. The more prominent geothermally heated northern lake, Laguna Caliente, is one of the world's most acidic natural lakes, with a pH of near zero. It has been the site of frequent phreatic and phreatomagmatic eruptions since an eruption was reported in 1828. Eruptions often include geyser-like ejections of crater-lake water.
Information Contacts: Observatorio Vulcanologico y Sismologico de Costa Rica-Universidad Nacional (OVSICORI-UNA), Apartado 86-3000, Heredia, Costa Rica (URL: http://www.ovsicori.una.ac.cr/); Inside Costa Rica (URL: http://www.insidecostarica.com/); The Tico Times (URL: http://www.ticotimes.net/).
Puyehue-Cordon Caulle (Chile) — September 2013 Cite this Report
Puyehue-Cordon Caulle
Chile
40.59°S, 72.117°W; summit elev. 2236 m
All times are local (unless otherwise noted)
Explosive phases ended in April 2012 and the rhyolitic dome continued to flow ~1 year later
The rift zone eruption that began at Puyehue-Cordón Caulle on 4 June 2011 (BGVN 37:03) persisted through early 2012 and declined toward the end of 2012. Relative quiescence was observed through October 2013, which is the end of this reporting period. The Observatorio Volcanológico de Los Andes del Sur-Servicio Nacional de Geología y Minería (OVDAS-SERNAGEOMIN) maintained Red Alert (the highest level in a four-color scale) from 4 June 2011 to 23 March 2012; declining activity led to a downgrade in the Alert Level on 23 March 2012 to Orange, and then again on 24 April to Yellow. The status remained at Yellow until 16 August 2012, when it decreased to Green. Green Alert was maintained through the end of this reporting period of October 2013.
Early stages of the eruption captured by remote sensing. Based on polar-orbiting satellites, scientists at the Montreal Volcanic Ash Advisory Centre (VAAC) were able to detect the volcanic ash cloud as it circled the southern hemisphere. Using a combination of infrared channels, five satellites contributed to a mosaic of data showing the wide dispersion of volcanic ash over the period of 4-6 June 2011 (figure 8). A mosaic created on 14 June 2011 captured the 4 June 2011 ash as it approached the Chilean coast while, at the same time, a new ash eruption was occurring at Puyehue-Cordón Caulle (figure 9).
Post-processing of satellite images from GOES-13 highlighted the strong thermal anomalies that occurred during the early stages of the eruption. Daniel Lindsey of NOAA prepared a video sequence of images during 12-14 June 2011 that provided a clear way to identify the ash plume extending across Chile and Argentina (figure 10). From those images, it was possible to infer that a significant amount of ash was released from this eruption based on the persistent cold infrared brightness temperatures.
Based on webcamera observations, OVDAS-SERNAGEOMIN reported that incandescence was visible during 23 February-30 April 2012 and, at times, the local webcam views captured incandescence reaching up to 600 m above the rim (table 2).
Table 2. Seismicity and observations of Cordón Caulle's eruption during 2012 were documented in regular reports from OVDAS- SERNAGEOMIN. This table highlights data from 23 February to 22 April. Note that incandescence and plume heights correspond to km above the crater. Courtesy of SERNAGEOMIN-OVDAS.
| Alert Level |
DATE |
# Eqs |
Max Mag |
Incandescence |
Plume Characteristics |
| Red |
23-Feb |
|
1.7 |
yes |
up to 1 km |
| 26-Feb |
|
1.4 |
yes |
up to 0.5 km |
| 27-Feb |
|
1.8 |
no |
no |
| 28-Feb |
|
1.7 |
no |
up to 1 km , drifted NNE |
| 1-Mar |
|
1.3 |
yes |
up to 0.7 km , drifted SE |
| 4-Mar |
|
1.2 |
yes |
up to 0.8 km , drifted ESE for ~30 km |
| 5-Mar |
|
2.5 |
yes, up to 0.2 km |
up to 1.2 km , drifted E for ~50 km |
| 6-Mar |
|
0.5 |
yes, up to 0.2 km |
up to 1.2 km , drifted N for ~30 km |
| 7-Mar |
|
1 |
yes, up to 0.1 km |
up to 0.5 km , drifted SW for ~40 km |
| 8-Mar |
|
3.2 |
no |
up to 1 km , drifted E for ~35 km |
| 9-Mar |
|
1.6 |
no |
up to 0.4 km , drifted SSW for ~40 km |
| 10-Mar |
|
0.6 |
yes, up to .1 km |
no |
| 11-Mar |
|
3.1 |
no |
up to 1 km |
| 12-Mar |
|
0.9 |
yes, up to .3 km |
up to 0.3 km , drifted NNE for ~50 km |
| 13-Mar |
|
2.5 |
yes, up to .4 km |
up to 1.2 km , drifted E for ~30 km |
| 14-Mar |
|
0.5 |
no |
up to 0.5 km , drifted N for ~20 km |
| 15-Mar |
|
1.7 |
yes, up to .2 km |
up to 0.4 km , drifted for ~12 km |
| 16-Mar |
|
1.2 |
yes, up to .2 km |
no |
| 17-Mar |
0 |
0 |
yes, up to .1 km |
no |
| 18-Mar |
|
1.4 |
yes, up to .6 km |
no |
| 19-Mar |
|
0.5 |
yes, up to .3 km |
up to 1 km , drifted NNE for ~17 km |
| 20-Mar |
|
0.6 |
no |
no |
| 21-Mar |
0 |
0 |
no |
up to 0.5 km |
| 22-Mar |
|
1.5 |
no |
up to 0.4 km |
| 23-Mar |
|
1.1 |
yes, up to .1 km |
no |
| 24-Mar |
|
0.1 |
yes, up to .1 km |
up to 0.5 km |
| 25-Mar |
|
1 |
yes, up to .1 km |
up to 0.1 km |
| 26-Mar |
|
1.3 |
yes, up to .1 km |
up to 0.1 km , drifted 9 km |
| 27-Mar |
|
0.9 |
yes, up to .1 km |
no |
| 28-Mar |
|
0.6 |
yes, up to .1 km |
up to 0.5 km |
| 29-Mar |
|
1 |
yes, up to .1 km |
up to 1.2 km |
| 30-Mar |
|
1.4 |
yes, up to .1 km |
up to 0.4 km |
| 31-Mar |
|
1.4 |
yes, up to .1 km |
up to 0.5 km |
| 1-Apr |
|
2.4 |
yes |
up to 0.6 km |
| 2-Apr |
|
1.8 |
yes |
up to 0.8 km |
| 4-Apr |
|
1.4 |
no |
no |
| 8-Apr |
|
2.8 |
no |
up to 0.45 km |
| Orange |
9-Apr |
|
1.4 |
yes, up to .1 km |
up to 0.4 km |
| 10-Apr |
|
1.3 |
yes, up to .1 km |
up to 0.5 km |
| 11-Apr |
|
1.4 |
no |
up to 1 km |
| 12-Apr |
|
1.7 |
no |
up to 0.3 km |
| 13-Apr |
|
1.1 |
no |
up to 0.2 km |
| 14-Apr |
|
1.5 |
no |
no |
| 15-Apr |
|
1.9 |
no |
no |
| 16-Apr |
|
1.7 |
no |
no |
| 17-Apr |
|
1.8 |
yes |
no |
| 18-Apr |
|
2 |
no |
no |
| 19-Apr |
|
1.8 |
no |
no |
| 20-Apr |
3 eq/hour |
1.7 |
yes, up to .1 km |
up to 0.1 km |
| 21-Apr |
|
1.9 |
no |
up to 0.2 km |
| 22-Apr |
|
3.4 |
no |
up to 0.4 km |
Based on seismicity and visual observations, declining activity was noted from late April 2012 through October 2013 (table 3). Incandescence and plumes from the crater were rarely documented, partly due to poor weather conditions. Seismicity was reported in terms of individual counts and, after the Alert Level was downgraded to Green, seismicity rarely exceeded 20 events per month.
Table 3. Activity at Puyehue-Cordón Caullefrom 24 April 2012 to 31 October 2013. Earthquake types, volcano-tectonic and long-period are abbreviated with VT and LP, respectively. MD refers to magnitudes calculated from signal duration; RD is the abbreviation for reduced duration. Courtesy of SERNAGEOMIN-OVDAS.
| Alert Level |
DATE |
# Eqs |
Max Mag |
#VT |
#LP |
MD |
Max RD |
Tremor |
RD |
Incandescence |
Plume Characteristics |
| Yellow |
2012 |
24-30 Apr |
256 |
2.5 |
5 |
251 |
2.2 |
8.9 |
0 |
0 |
at night |
up to 1,200 m |
| 1-31 May |
341 |
1.4 |
17 |
265 |
1.7 |
59.5 |
59 |
4.3 |
na |
bad weather |
| 1-15 Jun |
23 |
0.7 |
3 |
20 |
1.3 |
9.7 |
0 |
0 |
na |
bad weather |
| 16-30 Jun |
7 |
1.4 |
4 |
2 |
1 |
11.2 |
0 |
0 |
na |
generally bad weather, but a white plume up to 400 m (25 Jun) |
| 16-31 Jul |
6 |
0.3 |
2 |
4 |
1.8 |
3.6 |
0 |
0 |
na |
bad weather |
| Green |
16-31 Aug |
3 |
1.1 |
2 |
1 |
0.7 |
1.9 |
0 |
0 |
na |
bad weather |
| 1-30 Sept |
9 |
1.3 |
2 |
7 |
1.8 |
34.2 |
0 |
0 |
na |
bad weather |
| 1-31 Oct |
18 |
1.4 |
10 |
8 |
1.3 |
13 |
0 |
0 |
na |
bad weather |
| 1-30 Nov |
4 |
0.7 |
2 |
2 |
1 |
5.4 |
0 |
0 |
na |
bad weather |
| 1-31 Dec |
2 |
1.1 |
0 |
2 |
1.1 |
4.4 |
0 |
0 |
na |
bad weather |
| 2013 |
1-31 Jan |
10 |
0.7 |
2 |
8 |
1.7 |
2.5 |
0 |
0 |
na |
remobilized ash observed by local authorities; suspected new activity but not corroborated |
| 1-28 Feb |
17 |
0.9 |
7 |
10 |
1.1 |
13.4 |
0 |
0 |
na |
no |
| 1-31 Mar |
9 |
1 |
7 |
2 |
1.1 |
7.7 |
0 |
0 |
na |
no |
| Apr |
na |
na |
na |
na |
na |
na |
na |
na |
na |
no |
| 1-31 May |
1 |
2 |
1 |
0 |
0 |
0 |
0 |
0 |
na |
no |
| Jun |
na |
na |
na |
na |
na |
na |
na |
na |
na |
no |
| 1-31 Jul |
20 |
1.5 |
13 |
7 |
1.2** |
5.9 |
0 |
0 |
na |
no |
| 1-31 Aug |
29 |
1.9 |
16 |
13 |
1.1** |
4.7 |
0 |
0 |
na |
no |
| 1-30 Sept |
30 |
1.4 |
22 |
8 |
1.3** |
4.3 |
0 |
0 |
na |
no |
| 1-31 Oct |
30 |
2.4 |
21 |
9 |
1.7** |
3.8 |
0 |
0 |
na |
no |
Although activity had diminished significantly by April 2012, field researchers determined that the rhyolitic dome material remained mobile. In an interview with Earthweek released on 15 November 2013, Hugh Tuffen of Lancaster University explained that, "the lava was still oozing after almost a year, and it advances between 1 and 3 meters a day." Fieldwork yielded results later published in 2013 that highlighted the heterogeneity of processes (brittle and ductile) that could have existed in order to allow rhyolitic magma to travel explosively and effusively to the surface. This investigation included video documentation of explosive phases of the eruption in 2012 (figure 11).
References. Earthweek: A diary of the planet, 15 Nov. 2013, http://www.earthweek.com/2013/ew131115/ew131115d.html.
Schipper, C.I., Castro, J.M., Tuffen, H., James, M.R., and How, P., 2013. Shallow vent architecture during hybrid explosive-effusive activity at Cordón Caulle (Chile, 2011-12): Evidence from direct observations and pyroclast textures, Journal of Volcanology and Geothermal Research, 262: 25-37.
Links for full animation of IR images from GOES-13 data provided by Daniel Lindsey of NOAA/NESDIS/STAR/RAMM Branch:
4-6 June 2011:
http://rammb.cira.colostate.edu/templates/loop_directory.asp?data_folder=dev/lindsey/loops/4jun11_chile_ir&image_width=1020&image_height=720&no_toggle=1
12-14 June 2011:
http://rammb.cira.colostate.edu/templates/loop_directory.asp?data_folder=dev/lindsey/loops/13jun11_chile_ir&image_width=1020&image_height=720&no_toggle=1
Geologic Background. The Puyehue-Cordón Caulle volcanic complex (PCCVC) is a large NW-SE-trending late-Pleistocene to Holocene basaltic-to-rhyolitic transverse volcanic chain SE of Lago Ranco. The 1799-m-high Pleistocene Cordillera Nevada caldera lies at the NW end, separated from Puyehue stratovolcano at the SE end by the Cordón Caulle fissure complex. The Pleistocene Mencheca volcano with Holocene flank cones lies NE of Puyehue. The basaltic-to-rhyolitic Puyehue volcano is the most geochemically diverse of the PCCVC. The flat-topped, 2236-m-high volcano was constructed above a 5-km-wide caldera and is capped by a 2.4-km-wide Holocene summit caldera. Lava flows and domes of mostly rhyolitic composition are found on the E flank. Historical eruptions originally attributed to Puyehue, including major eruptions in 1921-22 and 1960, are now known to be from the Cordón Caulle rift zone. The Cordón Caulle geothermal area, occupying a 6 x 13 km wide volcano-tectonic depression, is the largest active geothermal area of the southern Andes volcanic zone.
Information Contacts: Observatorio Volcanológico de Los Andes del Sur-Servicio Nacional de Geología y Minería (OVDAS-SERNAGEOMIN), Avda Sta María No. 0104, Santiago, Chile (URL: http://www.sernageomin.cl/); Daniel Lindsey, NOAA/NESDIS/STAR/RAMM Branch (URL: http://rammb.cira.colostate.edu/); René Servranckx, Meteorological Service of Canada (URL: http://www.ec.gc.ca/meteo-weather/default.asp?lang=En&n=FDF98F96-1); and Montreal Volcanic Ash Advisory Centre (VAAC) (URL: http://ec.gc.ca/meteo-weather/default.asp?lang=En&n=6B59FE0C-1).
Sinabung (Indonesia) — September 2013 Cite this Report
Sinabung
Indonesia
3.17°N, 98.392°E; summit elev. 2460 m
All times are local (unless otherwise noted)
17,000 evacuees as mid- to late-2013 eruption emits pyroclastic flows
In several issues of the Bulletin (BGVN 35:07, 36:03, and 38:04) we described the first confirmed eruption at Sinabung volcano (figure 1), which began 27 August 2010. This report notes ongoing eruptions along with more evacuations, more pyroclastic flows, and plumes as tall as 10 km.
The Indonesian Center of Volcanology and Geological Hazard Mitigation (CVGHM) reported that seismicity at Sinabung fluctuated during 2012 and through September 2013. During early September 2013, dense white plumes rose 100-150 m above the crater, and, on 14 September, incandescence from the crater was observed. Although this and several other instances of incandescence from the volcano's crater were reported during this eruption period, no MODVOLC thermal alerts were measured.
An estimated 16,000 people live within 10 km of the Sinabung volcano. Many photos of the volcano during this eruption can be found in an article from The Atlantic (Taylor, 2013). Some of the photos disclosed plumes otherwise little documented.
According to news articles, an eruption at 0245 on 15 September produced an ash plume and ashfalls in the towns of Sukameriah (50 km NE), Kutarayat (location uncertain), Kutagugung (16 km SW), and Berastagi (14 km E). About 6,000 people were evacuated from areas within a 3-km radius of the volcano, and several flights at Medan's airport (55 km NW) were canceled. CVGHM raised the Alert Level to III.
An eruption at 1203 on 17 September 2013 ejected tephra and a dense ash plume that rose higher than the plume seen on 15 September. According to the Darwin VAAC, on 17 September, a pilot observed an ash plume that rose to an altitude of 6.1 km and drifted 55 km SE. On 18 September a low-level ash plume rose to an altitude of 3 km and drifted SE, dissipating later that day. The VAAC also noted that CVGHM had confirmed that Sinabung was degassing but not emitting any ash. The evacuees started to return home on 22 September.
Seismicity at Sinabung declined but continued to fluctuate through 22 October. White plumes were seen rising 100-300 m from the crater. On 29 September 2013, the Alert Level was lowered to II.
On 22 October grayish plumes rose 250 m. Vents appeared on the N flank and produced dense white plumes that rose 70 m. On 23 October landslides at two locations were observed, and explosions occurred at 1619 and 1651 hours. Plumes rose from the summit crater and from a fracture formed on 15 October near Lau Kawar, a lake at the foot of Sinabung. Fog prevented observations for a period after the explosions; once the fog cleared dense gray plumes were observed. A third explosion occurred at 2100 hours. On 24 October at 0550 and 0612 explosions s generated ash plumes, and at least one rose 3 km and deposited ashfall in areas S. Based on information from the Indonesian Meteorological Office, the Darwin VAAC reported that an eruption at 1737 on 26 October 2013 generated an ash plume that rose to an altitude of 4.9 km. At 0700 and 1200 hours on 27 October a webcam showed an ash plume rising to an altitude of 3.7 km and drifting over 35 km NE.
CVGHM reported elevated seismicity including continuous tremor ongoing since 29 October 2013. Relatively small ash explosions were also reported prior to the larger events on 3 November. During 29 October-2 November plumes rose to 200-2,000 m above the volcano's summit. Gas measurements conducted by CVGHM during 31 October and on 1-2 November showed a sulfur dioxide (SO2) flux of 226-426 tons per day; this was a general decrease in emissions compared to those measured routinely during the year In addition, remote sensing data suggested the formation of a new vent sometime between 29 October and 2 November 2013 near the NE summit crater.
During 31 October ashfall was noted on the SE flank up to 1 km from the summit. CVGHM reported that explosions occurred on 3 November at 0126 and 1615, both generating ash plumes up to altitudes of 7 km that drifting W. These triggered evacuations from communities within 3 km of the volcano (~1,681 residents). Rumbling sounds that lasted up to 10 min were noted by staff at the Sinabung Observation Post (~8.5 km from the volcano). News agencies reported that this was the second largest eruption since the 24 October event that displaced more than 3,300 people. The Alert Level was increased from Level II (Watch) to Level III (Alert) at 0300 on the 31st.
Another eruption was reported by CVGHM at 1423 hours on 5 November 2013. This event lasted for 20 minutes and generated an ash plume up to 3,000 m above the crater that drifted SW. Pyroclastic flows were observed at 1431 hours on 5 November that extended 1 km down the SE flank. No casualties were reported.
Based on information from the Jakarta Meteorological Watch Office, webcam data, wind data, and satellite images, the Darwin VAAC reported that on 6 November 2013 an ash plume from Sinabung rose to an altitude of 3 km (figure 2). In addition, a glowing spot was seen near Sinabung's summit.
The next day an ash plume rose to the same altitude but was not observed in satellite images because of meteorological cloud cover. Webcam images showed an eruption on 8 November that produced a low-level ash plume. The Jakarta Meteorological Watch Office, the webcam, and satellite data detecting SO2 indicated two explosions on 10 November. The first one, at 0720, generated an ash plume that rose to an altitude of 3.7 km. The altitude of the second plume, from an explosion at 1600, was unknown.
An ash plume on 11 November rose to an altitude of 3 km and drifted less than 20 km SW (figure 3). The next day an ash plume rose to an altitude of 3.7 km and drifted almost 40 km NW.
Based on webcam data and satellite images, the Darwin VAAC reported that during 13-14 November an ash plume from Sinabung rose to an altitude of 3.7 km and drifted almost 150 km NW and W. A pyroclastic flow traveled 1.2 km down the SE flank on 14 November, prompting more evacuations from villages near the base of the volcano.
An explosion observed with the webcam on 18 November 2013 produced an ash plume that rose to an altitude of 7.6 km. About 30 minutes later an ash plume also visible in satellite images rose to an altitude of 11.3 km and drifted 65 km W. Four hours later satellite images showed fresh ash plumes at an altitude of 9.1 km to the W of Sinabung and at an altitude of 4.6 km over the crater. On 19 November the webcam recorded an ash plume that rose to an altitude of 4.6 km over the crater. A news article stated that later that night that an ash plume rose to an altitude of 10 km.
A news article from 20 November noted that volcanologists updated the previous hazard map for Sinabung (see figure in BGVN 35:07). The second-tier disaster-prone area, previously defined as a radius of 2-3 km from Sinabung's crater, was expanded to 4-5 km.
CVGHM reported three explosions from Sinabung on 17 November 2013. The first explosion, at 2024, generated an ash plume that rose 500 m and drifted SW, and a pyroclastic flow that traveled 500 m down the SE flank.
At 2152 hours that day a dense ash plume from an explosion rose 500 m and drifted SW. Incandescent material was ejected 50 m away from the crater. At 2252 an ash plume rose 1 km and drifted SW. At 0704 on 18 November an explosion generated an ash plume that rose 8 km and drifted SW. A pyroclastic flow also traveled 800 m down the SE flank.
On 19 November at 2155 a dense ash plume rose 10 km, drifted SW, and exhibited lightning. Pyroclastic flows again traveled 500 m SE. Multiple explosions on 20 November (at 0240, 0405, 0529, 0619, and 0641) generated ash plumes that rose to heights between 1 and 3.5 km. An explosion at 1716 was detected by the seismic network but cloud cover prevented observations of possible plumes. White plumes rose 100 m on 21 and 23 November, but misty conditions prevented visual observations on 22 November. On 23 November scoria fell in the Sigarang-garang and Desa Kuta villages in the NNE. Two explosions on 24 November, at 0043 and 0232 hours, were detected but not visually observed. Ash plumes rose 8 km and drifted NNE at 0727, rose 1 km at 0812, and rose 3 km at 0855. Since Sinabung's activity continued to increase, CVGHM raised the Alert Level to IV on 24 November. CVGHM noted that residents and tourists were advised not to approach the crater within a 5-km radius. Remaining residents in 17 villages around the volcano were to be evacuated.
News reported that on the morning of 25 November 2013 six new eruptive events sent "lava and searing gas" up to 1.5 km down the slopes, causing villagers to evacuate; this description apparently refers to pyroclastic flows. Volcanic material erupted as high as 2 km above the crater. The Indonesian National Agency for Disaster Management (BNPB) reported that 17,713 people, out of the 20,270 residents had been evacuated to 31 shelters.
Based on webcam data and wind data, the Darwin VAAC reported that during 28-31 November and 2 December ash plumes from Sinabung rose to altitudes of 3-5.5 km. Ash plumes drifted 150 km W during 30-31 November and 55 km W on 2 December. On 3 December ash plumes rose to an altitude of 8.2 km and drifted W. According to a news report on 2 December, landslides triggered by torrential rain buried houses and killed nine people in Gundaling village, 12 km E. On 4 December an ash plume from Sinabung rose to an altitude of 8.2 km and drifted N. Later that day and during 5-6 December ash plumes rose to altitudes of 3-3.7 km and drifted NW. CVGHM reported that observers in Ndokum Siroga, about 8.5 km away from the volcano, noted gray plumes rising 1 km above Sinabung on 6 December. They also saw grayish-white and dense white plumes as high as 400 m on 7 and 8 December, respectively. Dense grayish-to-white plumes rose 70-200 m on 9 December. White plumes rose 100-150 m above the crater during 10-13 December. Tremor during 6-13 December was recorded continuously, with varying amplitude. The number of low-frequency earthquakes significantly increased on 7 December, and the number of hybrid earthquakes increased the next day. RSAM (real-time seismic amplitude measurement) values of energy steadily increased since 28 November. The Alert Level remained at IV.
In conclusion, seismicity and images of ash plumes and pyroclastic flows suggest that the current eruption of Sinabung volcano began around 14-15 September 2013 and has continued through at least 11 December 2013.
Reference: Taylor, A., 18 November 2013, In Focus: The Eruptions of Mount Sinabung, The Atlantic (URL: http://www.theatlantic.com/infocus/2013/11/the-eruptions-of-mount-sinabung/100630/).
Geologic Background. Gunung Sinabung is a Pleistocene-to-Holocene stratovolcano with many lava flows on its flanks. The migration of summit vents along a N-S line gives the summit crater complex an elongated form. The youngest crater of this conical andesitic-to-dacitic edifice is at the southern end of the four overlapping summit craters. The youngest deposit is a SE-flank pyroclastic flow 14C dated by Hendrasto et al. (2012) at 740-880 CE. An unconfirmed eruption was noted in 1881, and solfataric activity was seen at the summit and upper flanks in 1912. No confirmed historical eruptions were recorded prior to explosive eruptions during August-September 2010 that produced ash plumes to 5 km above the summit.
Information Contacts: Center of Volcanology and Geological Hazard Mitigation (CVGHM) (also known as Pusat Vulkanologi dan Mitigasi Bencana Geologi-PVMBG), National Agency for Disaster Management (Badan Nacional Penanggulangan Bencana-BNPB), Jalan Diponegoro 57, Bandung 40122, Indonesia (URL: http://vsi.esdm.go.id/); Darwin Volcanic Ash Advisory Centre (VAAC), Bureau of Meteorology, Northern Territory Regional Office, PO Box 40050, Casuarina, NT 0811, Australia (URL: http://www.bom.gov.au/info/vaac/); CBC.CA News, Toronto, Canada (URL: http://www.cbc.ca/); The Atlantic (URL: http://www.theatlantic.com); ReliefWeb (a specialized digital service of the United Nations Office for the Coordination of Humanitarian Affairs-OCHA) (URL: reliefweb.int); and Volcano Discovery (URL: http://www.volcanodiscovery.com).
Witori (Papua New Guinea) — September 2013 Cite this Report
Witori
Papua New Guinea
5.5745°S, 150.5161°E; summit elev. 724 m
All times are local (unless otherwise noted)
Explosive ash plumes reported in May-July 2012
Based on analyses of satellite images as reported by the Global Disaster Alert and Coordination System (GDACS) and the Darwin Volcanic Ash Advisory Centre (VAAC), five volcano plume advisories were issued for Pago volcano in the Summer of 2012 (table 1).
Table 1.Five VAAC volcano ash advisories were issued for Pago volcano for the period May-July 2012. Darwin VAAC Aviation Alert Colors range in four steps from green to yellow to orange to red - lowest to highest alert. Courtesy of Darwin VAAC and GDACS.
| Date – Time, 2012, UTC |
VAAC Aviation Alert Color |
Other Observations |
| 3 May – 0530 |
Red |
high level eruption to 12.2 km |
| 3 May – 0600 |
Red |
high level eruption to 13.7 km extending 74 km to NE |
| 3 May – 0715 |
Orange |
ash/steam plume to 13.7 km extending 74 km to NE |
| 10 Jul – 1630 |
Orange |
ash plume to 4.3 km extending 280 km SW |
| 10 Jul – 2203 |
Orange |
ash plume to 4.3 km extending 185 km SW |
According to the Papua New Guinea (PNG) National Disaster Centre (2013), PNG has 16 active and at least 28 potentially active or 'dormant' volcanoes which are a potential danger to the lives of about a quarter of a million people living in a total area of 16, 000 km2. Of the 16 active volcanoes, 6 of them are classified as high-risk volcanoes - high-risk in the sense that they have had explosive eruptions in the past and have the potential of repeating these eruptions in future. Of these 6 high-risk volcanoes, 3 are in New Britain - Rabaul in East New Britain, and Ulawun and Pago in West New Britain (for locations, see figure 3, BGVN 32:04, on Sulu Range volcano).
Figure 20 shows a satellite photo of approximately 8-km diameter Witori caldera from Google Earth. The walls of the caldera appear on the N and NW side of the caldera. A series of lava flows have formed the lobate character of the floor of the caldera. More detail on the lava flows appear in a previous report on Pago (figure 3, BGVN 27:08 - a vertical photo, with the old caldera rim delineated in white, distribution of new lava flows from August 2002 shown in red, compared with the previous lava flows from the 1911-18 eruption shown in light blue; a fault perpendicular to the 2002 lava flow is shown in dark blue).
References. Volcano Research Center, 2002 (4 September), Pago volcano, New Britain, Papua, New Guinea: Brief report and Photographs Aug. 26-September 2, 2002; URL:http://hakone.eri.u-tokyo.ac.jp.
Papua New Guinea (PNG) National Disaster Centre (NDC), 2013 (28 July), Volcanic eruption, PGN NDC (URL:http://www.pngndc.gov.pg/).
Geologic Background. The active Pago cone has grown within the Witori caldera (5.5 x 7.5 km) on the northern coast of central New Britain contains the active Pago cone. The gently sloping outer caldera flanks consist primarily of dacitic pyroclastic-flow and airfall deposits produced during a series of five major explosive eruptions from about 5,600 to 1,200 years ago, many of which may have been associated with caldera formation. Pago cone may have formed less than 350 years ago; it has grown to a height above the caldera rim, and a series of ten dacitic lava flows from it covers much of the caldera floor. The youngest of these was erupted during 2002-2003 from vents extending from the summit nearly to the NW caldera wall. The Buru caldera cuts the SW flank.
Information Contacts: Ima Itikarai and Herman Patia, Rabaul Volcano Observatory (RVO), P.O. Box 386, Rabaul, Papua New Guinea; Darwin Volcanic Ash Advisory Centre (VAAC), Bureau of Meteorology, Northern Territory Regional Office, PO Box 40050, Casuarina, NT 0811, Australia (URL: http://www.bom.gov.au/info/vaac/); Global Disaster Alert and Coordination System (GDACS), United Nations and the European Commission (URL: http://www.gdacs.org/Volcanoes); Volcano Research Center, Earthquake Research Institute, University of Tokyo, 113-0032 1-1-1, Yayoi, Bunkyo-ku, Tokyo (URL: http://hakone.eri.u-tokyo.ac.jp); and Papua New Guinea (PNG) National Disaster Centre (URL: http://www.pngndc.gov.pg/).