Recently Published Bulletin Reports
Erebus (Antarctica) Lava lake remains active; most thermal alerts recorded since 2019
Rincon de la Vieja (Costa Rica) Frequent phreatic explosions during July-December 2023
Bezymianny (Russia) Explosion on 18 October 2023 sends ash plume 8 km high; lava flows and incandescent avalanches
Kilauea (United States) Low-level lava effusions in the lava lake at Halema’uma’u during July-December 2022
Nyamulagira (DR Congo) Lava flows and thermal activity during May-October 2023
Bagana (Papua New Guinea) Explosions, ash plumes, ashfall, and lava flows during April-September 2023
Mayon (Philippines) Lava flows, pyroclastic flows, ash emissions, and seismicity during April-September 2023
Nishinoshima (Japan) Eruption plumes and gas-and-steam plumes during May-August 2023
Krakatau (Indonesia) White gas-and-steam plumes and occasional ash plumes during May-August 2023
Villarrica (Chile) Strombolian activity, gas-and-ash emissions, and crater incandescence during April-September 2023
Merapi (Indonesia) Frequent incandescent avalanches during April-September 2023
Ebeko (Russia) Moderate explosive activity with ash plumes continued during June-November 2023
Erebus (Antarctica) — January 2024  Cite this Report
Erebus
Antarctica
77.53°S, 167.17°E; summit elev. 3794 m
All times are local (unless otherwise noted)
Lava lake remains active; most thermal alerts recorded since 2019
The lava lake in the summit crater of Erebus has been active since at least 1972. Located in Antarctica overlooking the McMurdo Station on Ross Island, it is the southernmost active volcano on the planet. Because of the remote location, activity is primarily monitored by satellites. This report covers activity during 2023.
The number of thermal alerts recorded by the Hawai'i Institute of Geophysics and Planetology’s MODVOLC Thermal Alerts System increased considerably in 2023 compared to the years 2020-2022 (table 9). In contrast to previous years, the MODIS instruments aboard the Aqua and Terra satellites captured data from Erebus every month during 2023. Consistent with previous years, the lowest number of anomalous pixels were recorded in January, November, and December.
Table 9. Number of monthly MODIS-MODVOLC thermal alert pixels recorded at Erebus during 2017-2023. See BGVN 42:06 for data from 2000 through 2016. The table was compiled using data provided by the HIGP – MODVOLC Thermal Alerts System.
| Year |
Jan |
Feb |
Mar |
Apr |
May |
Jun |
Jul |
Aug |
Sep |
Oct |
Nov |
Dec |
SUM |
| 2017 |
0 |
21 |
9 |
0 |
0 |
1 |
11 |
61 |
76 |
52 |
0 |
3 |
234 |
| 2018 |
0 |
21 |
58 |
182 |
55 |
17 |
137 |
172 |
103 |
29 |
0 |
0 |
774 |
| 2019 |
2 |
21 |
162 |
151 |
55 |
56 |
75 |
53 |
29 |
19 |
1 |
0 |
624 |
| 2020 |
0 |
2 |
16 |
18 |
4 |
4 |
1 |
3 |
18 |
3 |
1 |
6 |
76 |
| 2021 |
0 |
9 |
1 |
0 |
2 |
56 |
46 |
47 |
35 |
52 |
5 |
3 |
256 |
| 2022 |
1 |
13 |
55 |
22 |
15 |
32 |
39 |
19 |
31 |
11 |
0 |
0 |
238 |
| 2023 |
2 |
33 |
49 |
82 |
41 |
32 |
70 |
64 |
42 |
17 |
5 |
11 |
448 |
Sentinel-2 infrared images showed one or two prominent heat sources within the summit crater, accompanied by adjacent smaller sources, similar to recent years (see BGVN 46:01, 47:02, and 48:01). A unique image was obtained on 25 November 2023 by the OLI-2 (Operational Land Imager-2) on Landsat 9, showing the upper part of the volcano surrounded by clouds (figure 32).
Geologic Background. Mount Erebus, the world's southernmost historically active volcano, overlooks the McMurdo research station on Ross Island. It is the largest of three major volcanoes forming the crudely triangular Ross Island. The summit of the dominantly phonolitic volcano has been modified by one or two generations of caldera formation. A summit plateau at about 3,200 m elevation marks the rim of the youngest caldera, which formed during the late-Pleistocene and within which the modern cone was constructed. An elliptical 500 x 600 m wide, 110-m-deep crater truncates the summit and contains an active lava lake within a 250-m-wide, 100-m-deep inner crater; other lava lakes are sometimes present. The glacier-covered volcano was erupting when first sighted by Captain James Ross in 1841. Continuous lava-lake activity with minor explosions, punctuated by occasional larger Strombolian explosions that eject bombs onto the crater rim, has been documented since 1972, but has probably been occurring for much of the volcano's recent history.
Information Contacts: Hawai'i Institute of Geophysics and Planetology (HIGP) - MODVOLC Thermal Alerts System, School of Ocean and Earth Science and Technology (SOEST), Univ. of Hawai'i, 2525 Correa Road, Honolulu, HI 96822, USA (URL: http://modis.higp.hawaii.edu/); Copernicus Browser, Copernicus Data Space Ecosystem, European Space Agency (URL: https://dataspace.copernicus.eu/browser/); NASA Earth Observatory, EOS Project Science Office, NASA Goddard Space Flight Center, Goddard, Maryland, USA (URL: https://earthobservatory.nasa.gov/images/152134/erebus-breaks-through).
Rincon de la Vieja (Costa Rica) — January 2024 Cite this Report
Rincon de la Vieja
Costa Rica
10.83°N, 85.324°W; summit elev. 1916 m
All times are local (unless otherwise noted)
Frequent phreatic explosions during July-December 2023
Rincón de la Vieja is a volcanic complex in Costa Rica with a hot convecting acid lake that exhibits frequent weak phreatic explosions, gas-and-steam emissions, and occasional elevated sulfur dioxide levels (BGVN 45:10, 46:03, 46:11). The current eruption period began June 2021. This report covers activity during July-December 2023 and is based on weekly bulletins and occasional daily reports from the Observatorio Vulcanologico Sismologica de Costa Rica-Universidad Nacional (OVSICORI-UNA).
Numerous weak phreatic explosions continued during July-December 2023, along with gas-and-steam emissions and plumes that rose as high as 3 km above the crater rim. Many weekly OVSICORI-UNA bulletins included the previous week's number of explosions and emissions (table 9). For many explosions, the time of explosion was given (table 10). Frequent seismic activity (long-period earthquakes, volcano-tectonic earthquakes, and tremor) accompanied the phreatic activity.
Table 9. Number of reported weekly phreatic explosions and gas-and-steam emissions at Rincón de la Vieja, July-December 2023. Counts are reported for the week before the Weekly Bulletin date; not all reports included these data. Courtesy of OVSICORI-UNA.
| OVSICORI Weekly Bulletin |
Number of explosions |
Number of emissions |
| 28 Jul 2023 |
6 |
14 |
| 4 Aug 2023 |
10 |
12 |
| 1 Sep 2023 |
13 |
11 |
| 22 Sep 2023 |
12 |
13 |
| 29 Sep 2023 |
6 |
11 |
| 6 Oct 2023 |
12 |
5 |
| 13 Oct 2023 |
7 |
9 |
| 20 Oct 2023 |
1 |
15 |
| 27 Oct 2023 |
3 |
23 |
| 3 Nov 2023 |
3 |
10 |
| 17 Nov 2023 |
0 |
Some |
| 24 Nov 2023 |
0 |
14 |
| 8 Dec 2023 |
4 |
16 |
| 22 Dec 2023 |
8 |
18 |
Table 10. Summary of activity at Rincón de la Vieja during July-December 2023. Weak phreatic explosions and gas emissions are noted where the time of explosion was indicated in the weekly or daily bulletins. Height of plumes or emissions are distance above the crater rim. Courtesy of OVSICORI-UNA.
| Date |
Time |
Description of Activity |
| 1 Jul 2023 |
0156 |
Explosion. |
| 2 Jul 2023 |
0305 |
Explosion. |
| 4 Jul 2023 |
0229, 0635 |
Event at 0635 produced a gas-and-steam plume that rose 700 m and drifted W; seen by residents in Liberia (21 km SW). |
| 9 Jul 2023 |
1843 |
Explosion. |
| 21 Jul 2023 |
0705 |
Explosion. |
| 26 Jul 2023 |
1807 |
Explosion. |
| 28 Jul 2023 |
0802 |
Explosion generated a gas-and-steam plume that rose 500 m. |
| 30 Jul 2023 |
1250 |
Explosion. |
| 31 Jul 2023 |
2136 |
Explosion. |
| 11 Aug 2023 |
0828 |
Explosion. |
| 18 Aug 2023 |
1304 |
Explosion. |
| 21 Aug 2023 |
1224 |
Explosion generated gas-and-steam plumes rose 500-600 m. |
| 22 Aug 2023 |
0749 |
Explosion generated gas-and-steam plumes rose 500-600 m. |
| 24 Aug 2023 |
1900 |
Explosion. |
| 25 Aug 2023 |
0828 |
Event produced a steam-and-gas plume that rose 3 km and drifted NW. |
| 27-28 Aug 2023 |
0813 |
Four small events; the event at 0813 on 28 August lasted two minutes and generated a steam-and-gas plume that rose 2.5 km. |
| 1 Sep 2023 |
1526 |
Explosion generated plume that rose 2 km and ejected material onto the flanks. |
| 2-3 Sep 2023 |
- |
Small explosions detected in infrasound data. |
| 4 Sep 2023 |
1251 |
Gas-and-steam plume rose 1 km and drifted W. |
| 7 Nov 2023 |
1113 |
Explosion. |
| 8 Nov 2023 |
0722 |
Explosion. |
| 12 Nov 2023 |
0136 |
Small gas emissions. |
| 14 Nov 2023 |
0415 |
Small gas emissions. |
According to OVSICORI-UNA, during July-October the average weekly sulfur dioxide (SO2) flux ranged from 68 to 240 tonnes/day. However, in mid-November the flux increased to as high as 334 tonnes/day, the highest value measured in recent years. The high SO2 flux in mid-November was also detected by the TROPOMI instrument on the Sentinel-5P satellite (figure 43).
Geologic Background. Rincón de la Vieja, the largest volcano in NW Costa Rica, is a remote volcanic complex in the Guanacaste Range. The volcano consists of an elongated, arcuate NW-SE-trending ridge constructed within the 15-km-wide early Pleistocene Guachipelín caldera, whose rim is exposed on the south side. Sometimes known as the "Colossus of Guanacaste," it has an estimated volume of 130 km3 and contains at least nine major eruptive centers. Activity has migrated to the SE, where the youngest-looking craters are located. The twin cone of Santa María volcano, the highest peak of the complex, is located at the eastern end of a smaller, 5-km-wide caldera and has a 500-m-wide crater. A Plinian eruption producing the 0.25 km3 Río Blanca tephra about 3,500 years ago was the last major magmatic eruption. All subsequent eruptions, including numerous historical eruptions possibly dating back to the 16th century, have been from the prominent active crater containing a 500-m-wide acid lake located ENE of Von Seebach crater.
Information Contacts: Observatorio Vulcanológico Sismológica de Costa Rica-Universidad Nacional (OVSICORI-UNA), Apartado 86-3000, Heredia, Costa Rica (URL: http://www.ovsicori.una.ac.cr/); NASA Global Sulfur Dioxide Monitoring Page, Atmospheric Chemistry and Dynamics Laboratory, NASA Goddard Space Flight Center (NASA/GSFC), 8800 Greenbelt Road, Goddard MD 20771, USA (URL: https://so2.gsfc.nasa.gov/).
Bezymianny (Russia) — November 2023 Cite this Report
Bezymianny
Russia
55.972°N, 160.595°E; summit elev. 2882 m
All times are local (unless otherwise noted)
Explosion on 18 October 2023 sends ash plume 8 km high; lava flows and incandescent avalanches
Bezymianny, located on Russia’s Kamchatka Peninsula, has had eruptions since 1955 characterized by dome growth, explosions, pyroclastic flows, ash plumes, and ashfall. Activity during November 2022-April 2023 included gas-and-steam emissions, lava dome collapses generating avalanches, and persistent thermal activity. Similar eruptive activity continued from May through October 2023, described here based on information from weekly and daily reports of the Kamchatka Volcano Eruptions Response Team (KVERT), notices from Tokyo VAAC (Volcanic Ash Advisory Center), and from satellite data.
Overall activity decreased after the strong period of activity in late March through April 2023, which included ash explosions during 29 March and 7-8 April 2023 that sent plumes as high as 10-12 km altitude, along with dome growth and lava flows (BGVN 48:05). This reduced activity can be seen in the MIROVA thermal detection system graph (figure 56), which was consistent with data from the MODVOLC thermal detection system and with Sentinel-2 satellite images that showed persistent hotspots in the summit crater when conditions allowed observations. A renewed period of strong activity began in mid-October 2023.
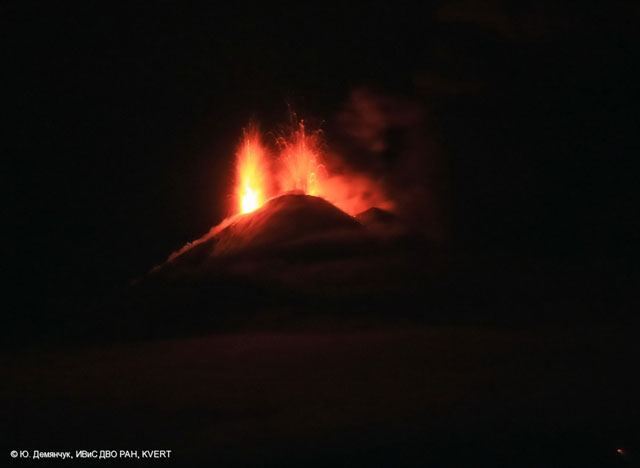
Activity increased significantly on 17 October 2023 when large collapses began during 0700-0830 on the E flanks of the lava dome and continued to after 0930 the next day (figure 57). Ash plumes rose to an altitude of 4.5-5 km, extending 220 km NNE by 18 October. A large explosion at 1630 on 18 October produced an ash plume that rose to an altitude of 11 km (8 km above the summit) and drifted NNE and then NW, extending 900 km NW within two days at an altitude of 8 km. Minor ashfall was noted in Kozyrevsk (45 km WNW). At 0820 on 20 October an ash plume was identified in satellite images drifting 100 km ENE at altitudes of 4-4.5 km.
Lava flows and hot avalanches from the dome down the SE flank continued over the next few days, including 23 October when clear conditions allowed good observations (figures 58 and 59). A large thermal anomaly was observed over the volcano through 24 October, and in the summit crater on 30 October (figure 60). Strong fumarolic activity continued, with numerous avalanches and occasional incandescence. By the last week of October, volcanic activity had decreased to a level consistent with that earlier in the reporting period.
Aviation warnings were frequently updated during 17-20 October. KVERT issued a Volcano Observatory Notice for Aviation (VONA) on 17 October at 1419 and 1727 (0219 and 0527 UTC) raising the Aviation Color Code (ACC) from Yellow to Orange (second highest level). The next day, KVERT issued a VONA at 1705 (0505 UTC) raising the ACC to Red (highest level) but lowered it back to Orange at 2117 (0917 UTC). After another decrease to Yellow and back to Orange, the ACC was reduced to Yellow on 20 October at 1204 (0004 UTC). In addition, the Tokyo VAAC issued a series of Volcanic Ash Advisories beginning on 16 October and continuing through 30 October.
Geologic Background. The modern Bezymianny, much smaller than its massive neighbors Kamen and Kliuchevskoi on the Kamchatka Peninsula, was formed about 4,700 years ago over a late-Pleistocene lava-dome complex and an edifice built about 11,000-7,000 years ago. Three periods of intensified activity have occurred during the past 3,000 years. The latest period, which was preceded by a 1,000-year quiescence, began with the dramatic 1955-56 eruption. This eruption, similar to that of St. Helens in 1980, produced a large open crater that was formed by collapse of the summit and an associated lateral blast. Subsequent episodic but ongoing lava-dome growth, accompanied by intermittent explosive activity and pyroclastic flows, has largely filled the 1956 crater.
Information Contacts: Kamchatka Volcanic Eruptions Response Team (KVERT), Far Eastern Branch, Russian Academy of Sciences, 9 Piip Blvd., Petropavlovsk-Kamchatsky, 683006, Russia (URL: http://www.kscnet.ru/ivs/kvert/); Kamchatka Volcanological Station, Kamchatka Branch of Geophysical Survey, (KB GS RAS), Klyuchi, Kamchatka Krai, Russia (URL: http://volkstat.ru/); Tokyo Volcanic Ash Advisory Center (VAAC), 1-3-4 Otemachi, Chiyoda-ku, Tokyo 100-8122, Japan (URL: http://ds.data.jma.go.jp/svd/vaac/data/); Hawai'i Institute of Geophysics and Planetology (HIGP) - MODVOLC Thermal Alerts System, School of Ocean and Earth Science and Technology (SOEST), Univ. of Hawai'i, 2525 Correa Road, Honolulu, HI 96822, USA (URL: http://modis.higp.hawaii.edu/); MIROVA (Middle InfraRed Observation of Volcanic Activity), a collaborative project between the Universities of Turin and Florence (Italy) supported by the Centre for Volcanic Risk of the Italian Civil Protection Department (URL: http://www.mirovaweb.it/); Copernicus Browser, Copernicus Data Space Ecosystem, European Space Agency (URL: https://dataspace.copernicus.eu/browser/).chr
Kilauea (United States) — January 2023 Cite this Report
Kilauea
United States
19.421°N, 155.287°W; summit elev. 1222 m
All times are local (unless otherwise noted)
Low-level lava effusions in the lava lake at Halema’uma’u during July-December 2022
Kīlauea is the southeastern-most volcano in Hawaii and overlaps the E flank of the Mauna Loa volcano. Its East Rift Zone (ERZ) has been intermittently active for at least 2,000 years. An extended eruption period began in January 1983 and was characterized by open lava lakes and lava flows from the summit caldera and the East Rift Zone. During May 2018 magma migrated into the Lower East Rift Zone (LERZ) and opened 24 fissures along a 6-km-long NE-trending fracture zone that produced lava flows traveling in multiple directions. As lava emerged from the fissures, the lava lake at Halema'uma'u drained and explosions sent ash plumes to several kilometers altitude (BGVN 43:10).
The current eruption period started during September 2021 and has recently been characterized by lava effusions, spatter, and sulfur dioxide emissions in the active Halema’uma’u lava lake (BGVN 47:08). Lava effusions, some spatter, and sulfur dioxide emissions have continued during this reporting period of July through December 2022 using daily reports, volcanic activity notices, and abundant photo, map, and video data from the US Geological Survey's (USGS) Hawaiian Volcano Observatory (HVO).
Summary of activity during July-December 2022. Low-level effusions have continued at the western vent of the Halema’uma’u crater during July through early December 2022. Occasional weak ooze-outs (also called lava break outs) would occur along the margins of the crater floor. The overall level of the active lava lake throughout the reporting period gradually increased due to infilling, however it stagnated in mid-September (table 13). During September through November, activity began to decline, though lava effusions persisted at the western vent. By 9 December, the active part of the lava lake had completely crusted over, and incandescence was no longer visible.
Table 13. Summary of measurements taken during overflights at Kīlauea that show a gradual increase in the active lava lake level and the volume of lava effused since 29 September 2021. Lower activity was reported during September-October. Data collected during July-December 2022. Courtesy of HVO.
| Date: |
Level of the active lava lake (m): |
Cumulative volume of lava effused (million cubic meters): |
| 7 Jul 2022 |
130 |
95 |
| 19 Jul 2022 |
133 |
98 |
| 4 Aug 2022 |
136 |
102 |
| 16 Aug 2022 |
137 |
104 |
| 12 Sep 2022 |
143 |
111 |
| 5 Oct 2022 |
143 |
111 |
| 28 Oct 2022 |
143 |
111 |
Activity during July 2022. Lava effusions were reported from the western vent in the Halema’uma’u crater, along with occasional weak ooze-outs along the margins of the crater floor. The height of the lava lake was variable due to deflation-inflation tilt events; for example, the lake level dropped approximately 3-4 m during a summit deflation-inflation event reported on 1 July. Webcam images taken during the night of 6-12 July showed intermittent low-level spattering at the western vent that rose less than 10 m above the vent (figure 519). Measurements made during an overflight on 7 July indicated that the crater floor was infilled about 130 m and that 95 million cubic meters of lava had been effused since 29 September 2021. A single, relatively small lava ooze-out was active to the S of the lava lake. Around midnight on 8 July there were two brief periods of lava overflow onto the lake margins. On 9 July lava ooze-outs were reported near the SE and NE edges of the crater floor and during 10-11 July they occurred near the E, NE, and NW edges. On 16 July crater incandescence was reported, though the ooze-outs and spattering were not visible. On 18 July overnight webcam images showed incandescence in the western vent complex and two ooze-outs were reported around 0000 and 0200 on 19 July. By 0900 there were active ooze-outs along the SW edge of the crater floor. Measurements made from an overflight on 19 July indicated that the crater floor was infilled about 133 m and 98 million cubic meters of lava had erupted since 29 September 2021 (figure 520). On 20 July around 1600 active ooze-outs were visible along the N edge of the crater, which continued through the next day. Extensive ooze-outs occurred along the W margin during 24 July until 1900; on 26 July minor ooze-outs were noted along the N margin. Minor spattering was visible on 29 July along the E margin of the lake. The sulfur dioxide emission rates ranged 650-2,800 tons per day (t/d), the higher of which was measured on 8 July (figure 519).
Activity during August 2022. The eruption continued in the Halema’uma’u crater at the western vent. According to HVO the lava in the active lake remained at the level of the bounding levees. Occasional minor ooze-outs were observed along the margins of the crater floor. Strong nighttime crater incandescence was visible after midnight on 6 August over the western vent cone. During 6-7 August scattered small lava lobes were active along the crater floor and incandescence persisted above the western vent through 9 August. During 7-9 August HVO reported a single lava effusion source was active along the NW margin of the crater floor. Measurements from an overflight on 4 August indicated that the crater floor was infilled about 136 m total and that 102 million cubic meters of lava had been erupted since the start of the eruption. Lava breakouts were reported along the N, NE, E, S, and W margins of the crater during 10-16 August. Another overflight survey conducted on 16 August indicated that the crater floor infilled about 137 m and 104 million cubic meters of lava had been erupted since September 2021. Measured sulfur dioxide emissions rates ranged 1,150-2,450 t/d, the higher of which occurred on 8 August.
Activity during September 2022. During September, lava effusion continued from the western vent into the active lava lake and onto the crater floor. Intermittent minor ooze-outs were reported through the month. A small ooze-out was visible on the W crater floor margin at 0220 on 2 September, which showed decreasing surface activity throughout the day, but remained active through 3 September. On 3 September around 1900 a lava outbreak occurred along the NW margin of the crater floor but had stopped by the evening of 4 September. Field crews monitoring the summit lava lake on 9 September observed spattering on the NE margin of the lake that rose no higher than 10 m, before falling back onto the lava lake crust (figure 521). Overflight measurements on 12 September indicated that the crater floor was infilled a total of 143 m and 111 million cubic meters of lava had been erupted since September 2021. Extensive breakouts in the W and N part of the crater floor were reported at 1600 on 20 September and continued into 26 September. The active part of the lava lake dropped by 10 m while other parts of the crater floor dropped by several meters. Summit tiltmeters recorded a summit seismic swarm of more than 80 earthquakes during 1500-1800 on 21 September, which occurred about 1.5 km below Halema’uma’u; a majority of these were less than Mw 2. By 22 September the active part of the lava lake was infilled about 2 m. On 23 September the western vent areas exhibited several small spatter cones with incandescent openings, along with weak, sporadic spattering (figure 522). The sulfur dioxide emission rate ranged from 930 t/d to 2,000 t/d, the higher of which was measured on 6 September.
Activity during October 2022. Activity during October declined slightly compared to previous months, though lava effusions persisted from the western vent into the active lava lake and onto the crater floor during October (figure 523). Slight variations in the lava lake were noted throughout the month. HVO reported that around 0600 on 3 October the level of the lava lake has lowered slightly. Overflight measurements taken on 5 October indicated that the crater floor was infilled a total of about 143 m and that 111 million cubic meters of lava had been effused since September 2021. During 6-7 October the lake gradually rose 0.5 m. Sulfur dioxide measurements made on 22 October had an emission rate of 700 t/d. Another overflight taken on 28 October showed that there was little to no change in the elevation of the crater floor: the crater floor was infilled a total of 143 m and 111 million cubic meters of lava had erupted since the start of the eruption.
Activity during November 2022. Activity remained low during November, though HVO reported that lava from the western vent continued to effuse into the active lava lake and onto the crater floor throughout the month. The rate of sulfur dioxide emissions during November ranged from 300-600 t/d, the higher amount of which occurred on 9 November.
Activity during December 2022. Similar low activity was reported during December, with lava effusing from the western vent into the active lava lake and onto the crater floor. During 4-5 December the active part of the lava lake was slightly variable in elevation and fluctuated within 1 m. On 9 December HVO reported that lava was no longer erupting from the western vent in the Halema’uma’u crater and that sulfur dioxide emissions had returned to near pre-eruption background levels; during 10-11 December, the lava lake had completely crusted over, and no incandescence was visible (figure 524). Time lapse camera images covering the 4-10 December showed that the crater floor showed weak deflation and no inflation. Some passive events of crustal overturning were reported during 14-15 December, which brought fresh incandescent lava to the lake surface. The sulfur dioxide emission rate was approximately 200 t/d on 14 December. A smaller overturn event on 17 December and another that occurred around 0000 and into the morning of 20 December were also detected. A small seismic swarm was later detected on 30 December.
Geologic Background. Kilauea overlaps the E flank of the massive Mauna Loa shield volcano in the island of Hawaii. Eruptions are prominent in Polynesian legends; written documentation since 1820 records frequent summit and flank lava flow eruptions interspersed with periods of long-term lava lake activity at Halemaumau crater in the summit caldera until 1924. The 3 x 5 km caldera was formed in several stages about 1,500 years ago and during the 18th century; eruptions have also originated from the lengthy East and Southwest rift zones, which extend to the ocean in both directions. About 90% of the surface of the basaltic shield volcano is formed of lava flows less than about 1,100 years old; 70% of the surface is younger than 600 years. The long-term eruption from the East rift zone between 1983 and 2018 produced lava flows covering more than 100 km2, destroyed hundreds of houses, and added new coastline.
Information Contacts: Hawaiian Volcano Observatory (HVO), U.S. Geological Survey, PO Box 51, Hawai'i National Park, HI 96718, USA (URL: http://hvo.wr.usgs.gov/).
Nyamulagira (DR Congo) — November 2023 Cite this Report
Nyamulagira
DR Congo
1.408°S, 29.2°E; summit elev. 3058 m
All times are local (unless otherwise noted)
Lava flows and thermal activity during May-October 2023
Nyamulagira (also known as Nyamuragira) is a shield volcano in the Democratic Republic of Congo with the summit truncated by a small 2 x 2.3 km caldera with walls up to about 100 m high. Documented eruptions have occurred within the summit caldera, as well as from numerous flank fissures and cinder cones. The current eruption period began in April 2018 and has more recently been characterized by summit crater lava flows and thermal activity (BGVN 48:05). This report describes lava flows and variable thermal activity during May through October 2023, based on information from the Observatoire Volcanologique de Goma (OVG) and various satellite data.
Lava lake activity continued during May. The MIROVA (Middle InfraRed Observation of Volcanic Activity) system recorded moderate-to-strong thermal activity throughout the reporting period; activity was more intense during May and October and relatively weaker from June through September (figure 95). The MODVOLC thermal algorithm, detected a total of 209 thermal alerts. There were 143 hotspots detected during May, eight during June, nine during September, and 49 during October. This activity was also reflected in infrared satellite images, where a lava flow was visible in the NW part of the crater on 7 May and strong activity was seen in the center of the crater on 4 October (figure 96). Another infrared satellite image taken on 12 May showed still active lava flows along the NW margin of the crater. According to OVG lava effusions were active during 7-29 May and moved to the N and NW parts of the crater beginning on 9 May. Strong summit crater incandescence was visible from Goma (27 km S) during the nights of 17, 19, and 20 May (figure 97). On 17 May there was an increase in eruptive activity, which peaked at 0100 on 20 May. Notable sulfur dioxide plumes drifted NW and W during 19-20 May (figure 98). Drone footage acquired in partnership with the USGS (United States Geological Survey) on 20 May captured images of narrow lava flows that traveled about 100 m down the W flank (figure 99). Data from the Rumangabo seismic station indicated a decreasing trend in activity during 17-21 May. Although weather clouds prevented clear views of the summit, a strong thermal signature on the NW flank was visible in an infrared satellite image on 22 May, based on an infrared satellite image. On 28 May the lava flows on the upper W flank began to cool and solidify. By 29 May seismicity returned to levels similar to those recorded before the 17 May increase. Lava effusion continued but was confined to the summit crater; periodic crater incandescence was observed.
Low-level activity was noted during June through October. On 1 June OVG reported that seismicity remained at lower levels and that crater incandescence had been absent for three days, though infrared satellite imagery showed continued lava effusion in the summit crater. The lava flows on the flanks covered an estimated 0.6 km2. Satellite imagery continued to show thermal activity confined to the lava lake through October (figure 96), although no lava flows or significant sulfur dioxide emissions were reported.
Geologic Background. Africa's most active volcano, Nyamulagira (also known as Nyamuragira), is a massive high-potassium basaltic shield about 25 km N of Lake Kivu and 13 km NNW of the steep-sided Nyiragongo volcano. The summit is truncated by a small 2 x 2.3 km caldera that has walls up to about 100 m high. Documented eruptions have occurred within the summit caldera, as well as from the numerous flank fissures and cinder cones. A lava lake in the summit crater, active since at least 1921, drained in 1938, at the time of a major flank eruption. Recent lava flows extend down the flanks more than 30 km from the summit as far as Lake Kivu; extensive lava flows from this volcano have covered 1,500 km2 of the western branch of the East African Rift.
Information Contacts: Observatoire Volcanologique de Goma (OVG), Departement de Geophysique, Centre de Recherche en Sciences Naturelles, Lwiro, D.S. Bukavu, DR Congo; Hawai'i Institute of Geophysics and Planetology (HIGP) - MODVOLC Thermal Alerts System, School of Ocean and Earth Science and Technology (SOEST), Univ. of Hawai'i, 2525 Correa Road, Honolulu, HI 96822, USA (URL: http://modis.higp.hawaii.edu/); MIROVA (Middle InfraRed Observation of Volcanic Activity), a collaborative project between the Universities of Turin and Florence (Italy) supported by the Centre for Volcanic Risk of the Italian Civil Protection Department (URL: http://www.mirovaweb.it/); NASA Global Sulfur Dioxide Monitoring Page, Atmospheric Chemistry and Dynamics Laboratory, NASA Goddard Space Flight Center (NASA/GSFC), 8800 Greenbelt Road, Goddard, Maryland, USA (URL: https://so2.gsfc.nasa.gov/); Copernicus Browser, Copernicus Data Space Ecosystem, European Space Agency (URL: https://dataspace.copernicus.eu/browser/); Charles Balagizi, Goma Volcano Observatory, Departement de Geophysique, Centre de Recherche en Sciences Naturelles, Lwiro, D.S. Bukavu, DR Congo.
Bagana (Papua New Guinea) — October 2023 Cite this Report
Bagana
Papua New Guinea
6.137°S, 155.196°E; summit elev. 1855 m
All times are local (unless otherwise noted)
Explosions, ash plumes, ashfall, and lava flows during April-September 2023
The remote volcano of Bagana is located in central Bougainville Island, Papua New Guinea. Recorded eruptions date back to 1842 and activity has consisted of effusive activity that has built a small lava dome in the summit crater and occasional explosions that produced pyroclastic flows. The most recent eruption has been ongoing since February 2000 and has produced occasional explosions, ash plumes, and lava flows. More recently, activity has been characterized by ongoing effusive activity and ash emissions (BGVN 48:04). This report updates activity from April through September 2023 that has consisted of explosions, ash plumes, ashfall, and lava flows, using information from the Darwin Volcanic Ash Advisory Center (VAAC) and satellite data.
An explosive eruption was reported on 7 July that generated a large gas-and-ash plume to high altitudes and caused significant ashfall in local communities; the eruption plume had reached upper tropospheric (16-18 km altitude) altitudes by 2200, according to satellite images. Sulfur dioxide plumes were detected in satellite images on 8 July and indicated that the plume was likely a mixture of gas, ice, and ash. A report issued by the Autonomous Bougainville Government (ABG) (Torokina District, Education Section) on 10 July noted that significant ash began falling during 2000-2100 on 7 July and covered most areas in the Vuakovi, Gotana (9 km SW), Koromaketo, Laruma (25 km W) and Atsilima (27 km NW) villages. Pyroclastic flows also occurred, according to ground-based reports; small deposits confined to one drainage were inspected by RVO during an overflight on 17 July and were confirmed to be from the 7 July event. Ashfall continued until 10 July and covered vegetation, which destroyed bushes and gardens and contaminated rivers and streams.
RVO reported another eruption on 14 July. The Darwin VAAC stated that an explosive event started around 0830 on 15 July and produced an ash plume that rose to 16.5 km altitude by 1000 and drifted N, according to satellite images. The plume continued to drift N and remained visible through 1900, and by 2150 it had dissipated.
Ashfall likely from both the 7 and 15 July events impacted about 8,111 people in Torokina (20 km SW), including Tsito/Vuakovi, Gotana, Koromaketo, Kenaia, Longkogari, Kenbaki, Piva (13 km SW), and Atsinima, and in the Tsitovi district, according to ABG. Significant ashfall was also reported in Ruruvu (22 km N) in the Wakunai District of Central Bougainville, though the thickness of these deposits could not be confirmed. An evacuation was called for the villages in Wakunai, where heavy ashfall had contaminated water sources; the communities of Ruruvu, Togarau, Kakarapaia, Karauturi, Atao, and Kuritaturi were asked to evacuate to a disaster center at the Wakunai District Station, and communities in Torokina were asked to evacuate to the Piva District station. According to a news article, more than 7,000 people needed temporary accommodations, with about 1,000 people in evacuation shelters. Ashfall had deposited over a broad area, contaminating water supplies, affecting crops, and collapsing some roofs and houses in rural areas. Schools were temporarily shut down. Intermittent ash emissions continued through the end of July and drifted NNW, NW, and SW. Fine ashfall was reported on the coast of Torokina, and ash plumes also drifted toward Laruma and Atsilima.
A small explosive eruption occurred at 2130 on 28 July that ejected material from the crater vents, according to reports from Torokina, in addition to a lava flow that contained two lobes. A second explosion was detected at 2157. Incandescence from the lava flow was visible from Piva as it descended the W flank around 2000 on 29 July (figure 47). The Darwin VAAC reported that a strong thermal anomaly was visible in satellite images during 30-31 July and that ash emissions rose to 2.4 km altitude and drifted WSW on 30 July. A ground report from RVO described localized emissions at 0900 on 31 July.
The Darwin VAAC reported that ash plumes were identified in satellite imagery at 0800 and 1220 on 12 August and rose to 2.1 km and 3 km altitude and drifted NW and W, respectively. A news report stated that aid was sent to more than 6,300 people that were adversely affected by the eruption. Photos taken during 17-19 August showed ash emissions rising no higher than 1 km above the summit and drifting SE. A small explosion generated an ash plume during the morning of 19 August. Deposits from small pyroclastic flows were also captured in the photos. Satellite images captured lava flows and pyroclastic flow deposits. Two temporary seismic stations were installed near Bagana on 17 August at distances of 7 km WSW (Vakovi station) and 11 km SW (Kepox station). The Kepox station immediately started to record continuous, low-frequency background seismicity.
Satellite data. Little to no thermal activity was detected during April through mid-July 2023; only one anomaly was recorded during early April and one during early June, according to MIROVA (Middle InfraRed Observation of Volcanic Activity) data (figure 48). Thermal activity increased in both power and frequency during mid-July through September, although there were still some short gaps in detected activity. MODVOLC also detected increased thermal activity during August; thermal hotspots were detected a total of five times on 19, 20, and 27 August. Weak thermal anomalies were also captured in infrared satellite images on clear weather days throughout the reporting period on 7, 12, and 17 April, 27 May, 1, 6, 16, and 31 July, and 19 September (figure 48); a strong thermal anomaly was visible on 31 July. Distinct sulfur dioxide plumes that drifted generally NW were intermittently captured by the TROPOMI instrument on the Sentinel-5P satellite and sometimes exceeded two Dobson Units (DUs) (figure 49).
Geologic Background. Bagana volcano, in a remote portion of central Bougainville Island, is frequently active. This massive symmetrical cone was largely constructed by an accumulation of viscous andesitic lava flows. The entire edifice could have been constructed in about 300 years at its present rate of lava production. Eruptive activity is characterized by non-explosive effusion of viscous lava that maintains a small lava dome in the summit crater, although occasional explosive activity produces pyroclastic flows. Lava flows with tongue-shaped lobes up to 50 m thick and prominent levees descend the flanks on all sides.
Information Contacts: Rabaul Volcano Observatory (RVO), Geohazards Management Division, Department of Mineral Policy and Geohazards Management (DMPGM), PO Box 3386, Kokopo, East New Britain Province, Papua New Guinea; Darwin Volcanic Ash Advisory Centre (VAAC), Bureau of Meteorology, Northern Territory Regional Office, PO Box 40050, Casuarina, NT 0811, Australia (URL: http://www.bom.gov.au/info/vaac/); MIROVA (Middle InfraRed Observation of Volcanic Activity), a collaborative project between the Universities of Turin and Florence (Italy) supported by the Centre for Volcanic Risk of the Italian Civil Protection Department (URL: http://www.mirovaweb.it/); Hawai'i Institute of Geophysics and Planetology (HIGP) - MODVOLC Thermal Alerts System, School of Ocean and Earth Science and Technology (SOEST), Univ. of Hawai'i, 2525 Correa Road, Honolulu, HI 96822, USA (URL: http://modis.higp.hawaii.edu/); NASA Global Sulfur Dioxide Monitoring Page, Atmospheric Chemistry and Dynamics Laboratory, NASA Goddard Space Flight Center (NASA/GSFC), 8800 Greenbelt Road, Goddard, Maryland, USA (URL: https://so2.gsfc.nasa.gov/); Copernicus Browser, Copernicus Data Space Ecosystem, European Space Agency (URL: https://dataspace.copernicus.eu/browser/); Autonomous Bougainville Government, P.O Box 322, Buka, AROB, PNG (URL: https://abg.gov.pg/); Andrew Tupper (Twitter: @andrewcraigtupp); Simon Carn, Geological and Mining Engineering and Sciences, Michigan Technological University, 1400 Townsend Drive, Houghton, MI 49931, USA (URL: http://www.volcarno.com/, Twitter: @simoncarn); Radio NZ (URL: https://www.rnz.co.nz/news/pacific/494464/more-than-7-000-people-in-bougainville-need-temporary-accommodation-after-eruption); USAID, 1300 Pennsylvania Ave, NW, Washington DC 20004, USA (URL: https://www.usaid.gov/pacific-islands/press-releases/aug-08-2023-united-states-provides-immediate-emergency-assistance-support-communities-affected-mount-bagana-volcanic-eruptions).
Mayon (Philippines) — October 2023 Cite this Report
Mayon
Philippines
13.257°N, 123.685°E; summit elev. 2462 m
All times are local (unless otherwise noted)
Lava flows, pyroclastic flows, ash emissions, and seismicity during April-September 2023
Mayon is located in the Philippines and has steep upper slopes capped by a small summit crater. Historical eruptions date back to 1616 CE that have been characterized by Strombolian eruptions, lava flows, pyroclastic flows, and mudflows. Eruptions mostly originated from a central conduit. Pyroclastic flows and mudflows have commonly descended many of the approximately 40 drainages that surround the volcano. The most recent eruption occurred during June through October 2022 and consisted of lava dome growth and gas-and-steam emissions (BGVN 47:12). A new eruption was reported during late April 2023 and has included lava flows, pyroclastic density currents, ash emissions, and seismicity. This report covers activity during April through September 2023 based on daily bulletins from the Philippine Institute of Volcanology and Seismology (PHIVOLCS).
During April through September 2023, PHIVOLCS reported near-daily rockfall events, frequent volcanic earthquakes, and sulfur dioxide measurements. Gas-and-steam emissions rose 100-900 m above the crater and drifted in different directions. Nighttime crater incandescence was often visible during clear weather and was accompanied by incandescent avalanches of material. Activity notably increased during June when lava flows were reported on the S, SE, and E flanks (figure 52). The MIROVA graph (Middle InfraRed Observation of Volcanic Activity) showed strong thermal activity coincident with these lava flows, which remained active through September (figure 53). According to the MODVOLC thermal algorithm, a total of 110 thermal alerts were detected during the reporting period: 17 during June, 40 during July, 27 during August, and 26 during September. During early June, pyroclastic density currents (PDCs) started to occur more frequently.
Low activity was reported during much of April and May; gas-and-steam emissions rose 100-900 m above the crater and generally drifted in different directions. A total of 52 rockfall events and 18 volcanic earthquakes were detected during April and 147 rockfall events and 13 volcanic events during May. Sulfur dioxide flux measurements ranged between 400-576 tons per day (t/d) during April, the latter of which was measured on 29 April and between 162-343 t/d during May, the latter of which was measured on 13 May.
Activity during June increased, characterized by lava flows, pyroclastic density currents (PDCs), crater incandescence and incandescent rockfall events, gas-and-steam emissions, and continued seismicity. Weather clouds often prevented clear views of the summit, but during clear days, moderate gas-and-steam emissions rose 100-2,500 m above the crater and drifted in multiple directions. A total of 6,237 rockfall events and 288 volcanic earthquakes were detected. The rockfall events often deposited material on the S and SE flanks within 700-1,500 m of the summit crater and ash from the events drifted SW, S, SE, NE, and E. Sulfur dioxide emissions ranged between 149-1,205 t/d, the latter of which was measured on 10 June. Short-term observations from EDM and electronic tiltmeter monitoring indicated that the upper slopes were inflating since February 2023. Longer-term ground deformation parameters based on EDM, precise leveling, continuous GPS, and electronic tilt monitoring indicated that the volcano remained inflated, especially on the NW and SE flanks. At 1000 on 5 June the Volcano Alert Level (VAL) was raised to 2 (on a 0-5 scale). PHIVOLCS noted that although low-level volcanic earthquakes, ground deformation, and volcanic gas emissions indicated unrest, the steep increase in rockfall frequency may indicate increased dome activity.
A total of 151 dome-collapse PDCs occurred during 8-9 and 11-30 June, traveled 500-2,000 m, and deposited material on the S flank within 2 km of the summit crater. During 8-9 June the VAL was raised to 3. At approximately 1947 on 11 June lava flow activity was reported; two lobes traveled within 500 m from the crater and deposited material on the S (Mi-isi), SE (Bonga), and E (Basud) flanks. Weak seismicity accompanied the lava flow and slight inflation on the upper flanks. This lava flow remained active through 30 June, moving down the S and SE flank as far as 2.5 km and 1.8 km, respectively and depositing material up to 3.3 km from the crater. During 15-16 June traces of ashfall from the PDCs were reported in Sitio Buga, Nabonton, City of Ligao and Purok, and San Francisco, Municipality of Guinobatan. During 28-29 June there were two PDCs generated by the collapse of the lava flow front, which generated a light-brown ash plume 1 km high. Satellite monitors detected significant concentrations of sulfur dioxide beginning on 29 June. On 30 June PDCs primarily affected the Basud Gully on the E flank, the largest of which occurred at 1301 and lasted eight minutes, based on the seismic record. Four PDCs generated between 1800 and 2000 that lasted approximately four minutes each traveled 3-4 km on the E flank and generated an ash plume that rose 1 km above the crater and drifted N and NW. Ashfall was recorded in Tabaco City.
Similar strong activity continued during July; slow lava effusion remained active on the S and SE flanks and traveled as far as 2.8 km and 2.8 km, respectively and material was deposited as far as 4 km from the crater. There was a total of 6,983 rockfall events and 189 PDCs that affected the S, SE, and E flanks. The volcano network detected a total of 2,124 volcanic earthquakes. Continuous gas-and-steam emissions rose 200-2,000 m above the crater and drifted in multiple directions. Sulfur dioxide emissions averaged 792-4,113 t/d, the latter of which was measured on 28 July. During 2-4 July three PDCs were generated from the collapse of the lava flow and resulting light brown plumes rose 200-300 m above the crater. Continuous tremor pulses were reported beginning at 1547 on 3 July through 7 July at 1200, at 2300 on 8 July and going through 0300 on 10 July, and at 2300 on 16 July, as recorded by the seismic network. During 6-9 July there were 10 lava flow-collapse-related PDCs that generated light brown plumes 300-500 m above the crater. During 10-11 July light ashfall was reported in some areas of Mabinit, Legazpi City, Budiao and Salvacion, Daraga, and Camalig, Albay. By 18 July the lava flow advanced 600 m on the E flank as well.
During 1733 on 18 July and 0434 on 19 July PHIVOLCS reported 30 “ashing” events, which are degassing events accompanied by audible thunder-like sounds and entrained ash at the crater, which produced short, dark plumes that drifted SW. These events each lasted 20-40 seconds, and plume heights ranged from 150-300 m above the crater, as recorded by seismic, infrasound, visual, and thermal monitors. Three more ashing events occurred during 19-20 July. Short-term observations from electronic tilt and GPS monitoring indicate deflation on the E lower flanks in early July and inflation on the NW middle flanks during the third week of July. Longer-term ground deformation parameters from EDM, precise leveling, continuous GPS, and electronic tilt monitoring indicated that the volcano was still generally inflated relative to baseline levels. A short-lived lava pulse lasted 28 seconds at 1956 on 21 July, which was accompanied by seismic and infrasound signals. By 22 July, the only lava flow that remained active was on the SE flank, and continued to extend 3.4 km, while those on the S and E flanks weakened markedly. One ashing event was detected during 30-31 July, whereas there were 57 detected during 31 July-1 August; according to PHIVOLCS beginning at approximately 1800 on 31 July eruptive activity was dominated by phases of intermittent ashing, as well as increased in the apparent rates of lava effusion from the summit crater. The ashing phases consisted of discrete events recorded as low-frequency volcanic earthquakes (LFVQ) typically 30 seconds in duration, based on seismic and infrasound signals. Gray ash plume rose 100 m above the crater and generally drifted NE. Shortly after these ashing events began, new lava began to effuse rapidly from the crater, feeding the established flowed on the SE, E, and E flanks and generating frequent rockfall events.
Intensified unrest persisted during August. There was a total of 4,141 rockfall events, 2,881 volcanic earthquakes, which included volcanic tremor events, 32 ashing events, and 101 PDCs detected throughout the month. On clear weather days, gas-and-steam emissions rose 300-1,500 m above the crater and drifted in different directions (figure 54). Sulfur dioxide emissions averaged 735-4,756 t/d, the higher value of which was measured on 16 August. During 1-2 August the rate of lava effusion decreased, but continued to feed the flows on the SE, S, and E flanks, maintaining their advances to 3.4 km, 2.8 km, and 1.1 km from the crater, respectively (figure 55). Rockfall and PDCs generated by collapses at the lava flow margins and from the summit dome deposited material within 4 km of the crater. During 3-4 August there were 10 tremor events detected that lasted 1-4 minutes. Short-lived lava pulse lasted 35 seconds and was accompanied by seismic and infrasound signals at 0442 on 6 August. Seven collapses were recorded at the front of the lava flow during 12-14 August.
During September, similar activity of slow lava effusion, PDCs, gas-and-steam emissions, and seismicity continued. There was a total of 4,452 rockfall events, 329 volcanic earthquakes, which included volcanic tremor events, two ashing events, and 85 PDCs recorded throughout the month. On clear weather days, gas-and-steam emissions rose 100-1,500 m above the crater and drifted in multiple directions. Sulfur dioxide emissions averaged 609-2,252 t/d, the higher average of which was measured on 6 September. Slow lava effusion continued advancing on the SE, S, and E flanks, maintaining lengths of 3.4 km, 2.8 km, and 1.1 km, respectively. Rockfall and PDC events generated by collapses along the lava flow margins and at the summit dome deposited material within 4 km of the crater.
Geologic Background. Symmetrical Mayon, which rises above the Albay Gulf NW of Legazpi City, is the most active volcano of the Philippines. The steep upper slopes are capped by a small summit crater. Recorded eruptions since 1616 CE range from Strombolian to basaltic Plinian, with cyclical activity beginning with basaltic eruptions, followed by longer periods of andesitic lava flows. Eruptions occur predominately from the central conduit and have also produced lava flows that travel far down the flanks. Pyroclastic density currents and mudflows have commonly swept down many of the approximately 40 ravines that radiate from the summit and have often damaged populated lowland areas. A violent eruption in 1814 killed more than 1,200 people and devastated several towns.
Information Contacts: Philippine Institute of Volcanology and Seismology (PHIVOLCS), Department of Science and Technology, University of the Philippines Campus, Diliman, Quezon City, Philippines (URL: http://www.phivolcs.dost.gov.ph/); MIROVA (Middle InfraRed Observation of Volcanic Activity), a collaborative project between the Universities of Turin and Florence (Italy) supported by the Centre for Volcanic Risk of the Italian Civil Protection Department (URL: http://www.mirovaweb.it/); Hawai'i Institute of Geophysics and Planetology (HIGP) - MODVOLC Thermal Alerts System, School of Ocean and Earth Science and Technology (SOEST), Univ. of Hawai'i, 2525 Correa Road, Honolulu, HI 96822, USA (URL: http://modis.higp.hawaii.edu/); Copernicus Browser, Copernicus Data Space Ecosystem, European Space Agency (URL: https://dataspace.copernicus.eu/browser/); William Rogers, Legazpi City, Albay Province, Philippines.
Nishinoshima (Japan) — October 2023 Cite this Report
Nishinoshima
Japan
27.247°N, 140.874°E; summit elev. 100 m
All times are local (unless otherwise noted)
Eruption plumes and gas-and-steam plumes during May-August 2023
Nishinoshima, located about 1,000 km S of Tokyo, is a small island in the Ogasawara Arc in Japan. The island is the summit of a massive submarine volcano that has prominent submarine peaks to the S, W, and NE. Eruptions date back to 1973 and the current eruption period began in October 2022. Recent activity has consisted of small ash plumes and fumarolic activity (BGVN 48:07). This report covers activity during May through August 2023, using information from monthly reports of the Japan Meteorological Agency (JMA) monthly reports and satellite data.
Activity during May through June was relatively low. The Japan Coast Guard (JCG) did overflights on 14 and 22 June and reported white gas-and-steam emissions rising 600 m and 1,200 m from the central crater of the pyroclastic cone, respectively (figure 125). In addition, multiple white gas-and-steam emissions rose from the inner rim of the W side of the crater and from the SE flank of the pyroclastic cone. Discolored brown-to-green water was observed around almost the entire perimeter of the island; on 22 June light green discolored water was observed off the S coast of the island.
Observations from the Himawari meteorological satellite confirmed an eruption on 9 and 10 July. An eruption plume rose 1.6 km above the crater and drifted N around 1300 on 9 July. Satellite images acquired at 1420 and 2020 on 9 July and at 0220 on 10 July showed continuing emissions that rose 1.3-1.6 km above the crater and drifted NE and N. The Tokyo VAAC reported that an ash plume seen by a pilot and identified in a satellite image at 0630 on 21 July rose to 3 km altitude and drifted S.
Aerial observations conducted by JCG on 8 August showed a white-and-gray plume rising from the central crater of the pyroclastic cone, and multiple white gas-and-steam emissions were rising from the inner edge of the western crater and along the NW-SE flanks of the island (figure 126). Brown-to-green discolored water was also noted around the perimeter of the island.
Intermittent low-to-moderate power thermal anomalies were recorded in the MIROVA graph (Middle InfraRed Observation of Volcanic Activity), showing an increase in both frequency and power beginning in July (figure 127). This increase in activity coincides with eruptive activity on 9 and 10 July, characterized by eruption plumes. According to the MODVOLC thermal alert algorithm, one thermal hotspot was recorded on 20 July. Weak thermal anomalies were also detected in infrared satellite imagery, accompanied by strong gas-and-steam plumes (figure 128).
Geologic Background. The small island of Nishinoshima was enlarged when several new islands coalesced during an eruption in 1973-74. Multiple eruptions that began in 2013 completely covered the previous exposed surface and continued to enlarge the island. The island is the summit of a massive submarine volcano that has prominent peaks to the S, W, and NE. The summit of the southern cone rises to within 214 m of the ocean surface 9 km SSE.
Information Contacts: Japan Meteorological Agency (JMA), 1-3-4 Otemachi, Chiyoda-ku, Tokyo 100-8122, Japan (URL: http://www.jma.go.jp/jma/indexe.html); Tokyo Volcanic Ash Advisory Center (VAAC), 1-3-4 Otemachi, Chiyoda-ku, Tokyo 100-8122, Japan (URL: http://ds.data.jma.go.jp/svd/vaac/data/); MIROVA (Middle InfraRed Observation of Volcanic Activity), a collaborative project between the Universities of Turin and Florence (Italy) supported by the Centre for Volcanic Risk of the Italian Civil Protection Department (URL: http://www.mirovaweb.it/); Copernicus Browser, Copernicus Data Space Ecosystem, European Space Agency (URL: https://dataspace.copernicus.eu/browser/).
Krakatau (Indonesia) — October 2023 Cite this Report
Krakatau
Indonesia
6.1009°S, 105.4233°E; summit elev. 285 m
All times are local (unless otherwise noted)
White gas-and-steam plumes and occasional ash plumes during May-August 2023
Krakatau is located in the Sunda Strait between Java and Sumatra, Indonesia. Caldera collapse during the catastrophic 1883 eruption destroyed Danan and Perbuwatan cones and left only a remnant of Rakata. The post-collapse cone of Anak Krakatau (Child of Krakatau) was constructed within the 1883 caldera at a point between the former Danan and Perbuwatan cones; it has been the site of frequent eruptions since 1927. The current eruption period began in May 2021 and has recently consisted of Strombolian eruptions and ash plumes (BGVN 48:07). This report describes lower levels of activity consisting of ash and white gas-and-steam plumes during May through August 2023, based on information provided by the Indonesian Center for Volcanology and Geological Hazard Mitigation, referred to as Pusat Vulkanologi dan Mitigasi Bencana Geologi (PVMBG), MAGMA Indonesia, and satellite data.
Activity was relatively low during May and June. Daily white gas-and-steam emissions rose 25-200 m above the crater and drifted in different directions. Five ash plumes were detected at 0519 on 10 May, 1241 on 11 May, 0920 on 12 May, 2320 on 12 May, and at 0710 on 13 May, and rose 1-2.5 km above the crater and drifted SW. A webcam image taken on 12 May showed ejection of incandescent material above the vent. A total of nine ash plumes were detected during 6-11 June: at 1434 and 00220 on 6 and 7 June the ash plumes rose 500 m above the crater and drifted NW, at 1537 on 8 June the ash plume rose 1 km above the crater and drifted SW, at 0746 and at 0846 on 9 June the ash plumes rose 800 m and 3 km above the crater and drifted SW, respectively, at 0423, 1431, and 1750 on 10 June the ash plumes rose 2 km, 1.5 km, and 3.5 km above the crater and drifted NW, respectively, and at 0030 on 11 June an ash plume rose 2 km above the crater and drifted NW. Webcam images taken on 10 and 11 June at 0455 and 0102, respectively, showed incandescent material ejected above the vent. On 19 June an ash plume at 0822 rose 1.5 km above the crater and drifted SE.
Similar low activity of white gas-and-steam emissions and few ash plumes were reported during July and August. Daily white gas-and-steam emissions rose 25-300 m above the crater and drifted in multiple directions. Three ash plumes were reported at 0843, 0851, and 0852 on 20 July that rose 500-2,000 m above the crater and drifted NW.
The MIROVA (Middle InfraRed Observation of Volcanic Activity) graph of MODIS thermal anomaly data showed intermittent low-to-moderate power thermal anomalies during May through August 2023 (figure 140). Although activity was often obscured by weather clouds, a thermal anomaly was visible in an infrared satellite image of the crater on 12 May, accompanied by an eruption plume that drifted SW (figure 141).
Geologic Background. The renowned Krakatau (frequently mis-named as Krakatoa) volcano lies in the Sunda Strait between Java and Sumatra. Collapse of an older edifice, perhaps in 416 or 535 CE, formed a 7-km-wide caldera. Remnants of that volcano are preserved in Verlaten and Lang Islands; subsequently the Rakata, Danan, and Perbuwatan cones were formed, coalescing to create the pre-1883 Krakatau Island. Caldera collapse during the catastrophic 1883 eruption destroyed Danan and Perbuwatan, and left only a remnant of Rakata. This eruption caused more than 36,000 fatalities, most as a result of tsunamis that swept the adjacent coastlines of Sumatra and Java. Pyroclastic surges traveled 40 km across the Sunda Strait and reached the Sumatra coast. After a quiescence of less than a half century, the post-collapse cone of Anak Krakatau (Child of Krakatau) was constructed within the 1883 caldera at a point between the former Danan and Perbuwatan cones. Anak Krakatau has been the site of frequent eruptions since 1927.
Information Contacts: Pusat Vulkanologi dan Mitigasi Bencana Geologi (PVMBG, also known as Indonesian Center for Volcanology and Geological Hazard Mitigation, CVGHM), Jalan Diponegoro 57, Bandung 40122, Indonesia (URL: http://www.vsi.esdm.go.id/); MAGMA Indonesia, Kementerian Energi dan Sumber Daya Mineral (URL: https://magma.esdm.go.id/v1); MIROVA (Middle InfraRed Observation of Volcanic Activity), a collaborative project between the Universities of Turin and Florence (Italy) supported by the Centre for Volcanic Risk of the Italian Civil Protection Department (URL: http://www.mirovaweb.it/); Copernicus Browser, Copernicus Data Space Ecosystem, European Space Agency (URL: https://dataspace.copernicus.eu/browser/).
Villarrica (Chile) — October 2023 Cite this Report
Villarrica
Chile
39.42°S, 71.93°W; summit elev. 2847 m
All times are local (unless otherwise noted)
Strombolian activity, gas-and-ash emissions, and crater incandescence during April-September 2023
Villarrica, in central Chile, consists of a 2-km-wide caldera that formed about 3,500 years ago and is located at the base of the presently active cone at the NW margin of a 6-km-wide caldera. Historical eruptions eruptions date back to 1558 and have been characterized by mild-to-moderate explosive activity with occasional lava effusions. The current eruption period began in December 2014 and has recently consisted of nighttime crater incandescence, ash emissions, and seismicity (BGVN 48:04). This report covers activity during April through September 2023 and describes occasional Strombolian activity, gas-and-ash emissions, and nighttime crater incandescence. Information for this report primarily comes from the Southern Andes Volcano Observatory (Observatorio Volcanológico de Los Andes del Sur, OVDAS), part of Chile's National Service of Geology and Mining (Servicio Nacional de Geología y Minería, SERNAGEOMIN) and satellite data.
Seismicity during April consisted of long period (LP) events and tremor (TRE); a total of 9,413 LP-type events and 759 TR-type events were detected throughout the month. Nighttime crater incandescence persisted and was visible in the degassing column. Sulfur dioxide data was obtained using Differential Absorption Optical Spectroscopy Equipment (DOAS) that showed an average value of 1,450 ± 198 tons per day (t/d) during 1-15 April and 1,129 ± 201 t/d during 16-30 April, with a maximum daily value of 2,784 t/d on 9 April. Gas-and-steam emissions of variable intensities rose above the active crater as high as 1.3 km above the crater on 13 April. Strombolian explosions were not observed and there was a slight decrease in the lava lake level.
There were 14,123 LP-type events and 727 TR-type events detected during May. According to sulfur dioxide measurements taken with DOAS equipment, the active crater emitted an average value of 1,826 ± 482 t/d during 1-15 May and 912 ± 41 t/d during 16-30 May, with a daily maximum value of 5,155 t/d on 13 May. Surveillance cameras showed continuous white gas-and-steam emissions that rose as high as 430 m above the crater on 27 May. Nighttime incandescence illuminated the gas column less than 300 m above the crater rim was and no pyroclastic emissions were reported. A landslide was identified on 13 May on the E flank of the volcano 50 m from the crater rim and extending 300 m away; SERNAGEOMIN noted that this event may have occurred on 12 May. During the morning of 27 and 28 May minor Strombolian explosions characterized by incandescent ejecta were recorded at the crater rim; the last reported Strombolian explosions had occurred at the end of March.
Seismic activity during June consisted of five volcano-tectonic (VT)-type events, 21,606 LP-type events, and 2,085 TR-type events. The average value of sulfur dioxide flux obtained by DOAS equipment was 1,420 ± 217 t/d during 1-15 June and 2,562 ± 804 t/d, with a maximum daily value of 4,810 t/d on 17 June. White gas-and-steam emissions rose less than 480 m above the crater; frequent nighttime crater incandescence was reflected in the degassing plume. On 12 June an emission rose 100 m above the crater and drifted NNW. On 15 June one or several emissions resulted in ashfall to the NE as far as 5.5 km from the crater, based on a Skysat satellite image. Several Strombolian explosions occurred within the crater; activity on 15 June was higher energy and ejected blocks 200-300 m on the NE slope. Surveillance cameras showed white gas-and-steam emissions rising 480 m above the crater on 16 June. On 19 and 24 June low-intensity Strombolian activity was observed, ejecting material as far as 200 m from the center of the crater to the E.
During July, seismicity included 29,319 LP-type events, 3,736 TR-type events, and two VT-type events. DOAS equipment recorded two days of sulfur dioxide emissions of 4,220 t/d and 1,009 t/d on 1 and 13 July, respectively. Constant nighttime incandescence was also recorded and was particularly noticeable when accompanied by eruptive columns on 12 and 16 July. Minor explosive events were detected in the crater. According to Skysat satellite images taken on 12, 13, and 16 July, ashfall deposits were identified 155 m S of the crater. According to POVI, incandescence was visible from two vents on the crater floor around 0336 on 12 July. Gas-and-ash emissions rose as high as 1.2 km above the crater on 13 July and drifted E and NW. A series of gas-and-steam pulses containing some ash deposited material on the upper E flank around 1551 on 13 July. During 16-31 July, average sulfur dioxide emissions of 1,679 ± 406 t/d were recorded, with a maximum daily value of 2,343 t/d on 28 July. Fine ash emissions were also reported on 16, 17, and 23 July.
Seismicity persisted during August, characterized by 27,011 LP-type events, 3,323 TR-type events, and three VT-type events. The average value of sulfur dioxide measurements taken during 1-15 August was 1,642 ± 270 t/d and 2,207 ± 4,549 t/d during 16-31 August, with a maximum daily value of 3,294 t/d on 27 August. Nighttime crater incandescence remained visible in degassing columns. White gas-and-steam emissions rose 480 m above the crater on 6 August. According to a Skysat satellite image from 6 August, ash accumulation was observed proximal to the crater and was mainly distributed toward the E slope. White gas-and-steam emissions rose 320 m above the crater on 26 August. Nighttime incandescence and Strombolian activity that generated ash emissions were reported on 27 August.
Seismicity during September was characterized by five VT-type events, 12,057 LP-type events, and 2,058 TR-type events. Nighttime incandescence persisted. On 2 September an ash emission rose 180 m above the crater and drifted SE at 1643 (figure 125) and a white gas-and-steam plume rose 320 m above the crater. According to the Buenos Aires VAAC, periods of continuous gas-and-ash emissions were visible in webcam images from 1830 on 2 September to 0110 on 3 September. Strombolian activity was observed on 2 September and during the early morning of 3 September, the latter event of which generated an ash emission that rose 60 m above the crater and drifted 100 m from the center of the crater to the NE and SW. Ashfall was reported to the SE and S as far as 750 m from the crater. The lava lake was active during 3-4 September and lava fountaining was visible for the first time since 26 March 2023, according to POVI. Fountains captured in webcam images at 2133 on 3 September and at 0054 on 4 September rose as high as 60 m above the crater rim and ejected material onto the upper W flank. Sulfur dioxide flux of 1,730 t/d and 1,281 t/d was measured on 3 and 4 September, respectively, according to data obtained by DOAS equipment.
Strong Strombolian activity and larger gas-and-ash plumes were reported during 18-20 September. On 18 September activity was also associated with energetic LP-type events and notable sulfur dioxide fluxes (as high as 4,277 t/d). On 19 September Strombolian activity and incandescence were observed. On 20 September at 0914 ash emissions rose 50 m above the crater and drifted SSE, accompanied by Strombolian activity that ejected material less than 100 m SSE, causing fall deposits on that respective flank. SERNAGEOMIN reported that a Planet Scope satellite image taken on 20 September showed the lava lake in the crater, measuring 32 m x 35 m and an area of 0.001 km2. Several ash emissions were recorded at 0841, 0910, 1251, 1306, 1312, 1315, and 1324 on 23 September and rose less than 150 m above the crater. The sulfur dioxide flux value was 698 t/d on 23 September and 1,097 t/d on 24 September. On 24 September the Volcanic Alert Level (VAL) was raised to Orange (the third level on a four-color scale). SENAPRED maintained the Alert Level at Yellow (the middle level on a three-color scale) for the communities of Villarrica, Pucón (16 km N), Curarrehue, and Panguipulli.
During 24-25 September there was an increase in seismic energy (observed at TR-events) and acoustic signals, characterized by 1 VT-type event, 213 LP-type events, and 124 TR-type events. Mainly white gas-and-steam emissions, in addition to occasional fine ash emissions were recorded. During the early morning of 25 September Strombolian explosions were reported and ejected material 250 m in all directions, though dominantly toward the NW. On 25 September the average value of sulfur dioxide flux was 760 t/d. Seismicity during 25-30 September consisted of five VT-type events, 1,937 LP-type events, and 456 TR-type events.
During 25-29 September moderate Strombolian activity was observed and ejected material as far as the crater rim. In addition, ash pulses lasting roughly 50 minutes were observed around 0700 and dispersed ENE. During 26-27 September a TR episode lasted 6.5 hours and was accompanied by discrete acoustic signals. Satellite images from 26 September showed a spatter cone on the crater floor with one vent that measured 10 x 14 m and a smaller vent about 35 m NE of the cone. SERNAGEOMIN reported an abundant number of bomb-sized blocks up to 150 m from the crater, as well as impact marks on the snow, which indicated explosive activity. A low-altitude ash emission was observed drifting NW around 1140 on 28 September, based on webcam images. Between 0620 and 0850 on 29 September an ash emission rose 60 m above the crater and drifted NW. During an overflight taken around 1000 on 29 September scientists observed molten material in the vent, a large accumulation of pyroclasts inside the crater, and energetic degassing, some of which contained a small amount of ash. Block-sized pyroclasts were deposited on the internal walls and near the crater, and a distal ash deposit was also visible. The average sulfur dioxide flux measured on 28 September was 344 t/d. Satellite images taken on 29 September ashfall was deposited roughly 3 km WNW from the crater and nighttime crater incandescence remained visible. The average sulfur dioxide flux value from 29 September was 199 t/d. On 30 September at 0740 a pulsating ash emission rose 1.1 km above the crater and drifted NNW (figure 126). Deposits on the S flank extended as far as 4.5 km from the crater rim, based on satellite images from 30 September.
Infrared MODIS satellite data processed by MIROVA (Middle InfraRed Observation of Volcanic Activity) showed intermittent thermal activity during April through September, with slightly stronger activity detected during late September (figure 127). Small clusters of thermal activity were detected during mid-June, early July, early August, and late September. According to the MODVOLC thermal alert system, a total of four thermal hotspots were detected on 7 July and 3 and 23 September. This activity was also intermittently captured in infrared satellite imagery on clear weather days (figure 128).
Geologic Background. The glacier-covered Villarrica stratovolcano, in the northern Lakes District of central Chile, is ~15 km south of the city of Pucon. A 2-km-wide caldera that formed about 3,500 years ago is located at the base of the presently active, dominantly basaltic to basaltic andesite cone at the NW margin of a 6-km-wide Pleistocene caldera. More than 30 scoria cones and fissure vents are present on the flanks. Plinian eruptions and pyroclastic flows that have extended up to 20 km from the volcano were produced during the Holocene. Lava flows up to 18 km long have issued from summit and flank vents. Eruptions documented since 1558 CE have consisted largely of mild-to-moderate explosive activity with occasional lava effusion. Glaciers cover 40 km2 of the volcano, and lahars have damaged towns on its flanks.
Information Contacts: Servicio Nacional de Geología y Minería (SERNAGEOMIN), Observatorio Volcanológico de Los Andes del Sur (OVDAS), Avda Sta María No. 0104, Santiago, Chile (URL: http://www.sernageomin.cl/); Proyecto Observación Villarrica Internet (POVI) (URL: http://www.povi.cl/); Sistema y Servicio Nacional de Prevención y Repuesta Ante Desastres (SENAPRED), Av. Beauchef 1671, Santiago, Chile (URL: https://web.senapred.cl/); Buenos Aires Volcanic Ash Advisory Center (VAAC), Servicio Meteorológico Nacional-Fuerza Aérea Argentina, 25 de mayo 658, Buenos Aires, Argentina (URL: http://www.smn.gov.ar/vaac/buenosaires/inicio.php); MIROVA (Middle InfraRed Observation of Volcanic Activity), a collaborative project between the Universities of Turin and Florence (Italy) supported by the Centre for Volcanic Risk of the Italian Civil Protection Department (URL: http://www.mirovaweb.it/); Hawai'i Institute of Geophysics and Planetology (HIGP) - MODVOLC Thermal Alerts System, School of Ocean and Earth Science and Technology (SOEST), Univ. of Hawai'i, 2525 Correa Road, Honolulu, HI 96822, USA (URL: http://modis.higp.hawaii.edu/); Copernicus Browser, Copernicus Data Space Ecosystem, European Space Agency (URL: https://dataspace.copernicus.eu/browser/).
Merapi (Indonesia) — October 2023 Cite this Report
Merapi
Indonesia
7.54°S, 110.446°E; summit elev. 2910 m
All times are local (unless otherwise noted)
Frequent incandescent avalanches during April-September 2023
Merapi, located just north of the major city of Yogyakarta in central Java, Indonesia, has had activity within the last 20 years characterized by pyroclastic flows and lahars accompanying growth and collapse of the steep-sided active summit lava dome. The current eruption period began in late December 2020 and has more recently consisted of ash plumes, intermittent incandescent avalanches of material, and pyroclastic flows (BGVN 48:04). This report covers activity during April through September 2023, based on information from Balai Penyelidikan dan Pengembangan Teknologi Kebencanaan Geologi (BPPTKG), the Center for Research and Development of Geological Disaster Technology, a branch of PVMBG which specifically monitors Merapi. Additional information comes from the Pusat Vulkanologi dan Mitigasi Bencana Geologi (PVMBG, also known as Indonesian Center for Volcanology and Geological Hazard Mitigation, CVGHM), MAGMA Indonesia, the Darwin Volcanic Ash Advisory Centre (VAAC), and various satellite data.
Activity during April through September 2023 primarily consisted of incandescent avalanches of material that mainly affected the SW and W flanks and traveled as far as 2.3 km from the summit (table 25) and white gas-and-steam emissions that rose 10-1,000 m above the crater.
Table 25. Monthly summary of avalanches and avalanche distances recorded at Merapi during April through September 2023. The number of reported avalanches does not include instances where possible avalanches were heard but could not be visually confirmed as a result of inclement weather. Data courtesy of BPPTKG (April-September 2023 daily reports).
| Month |
Average number of avalanches per day |
Distance avalanches traveled (m) |
| Apr 2023 |
19 |
1,200-2,000 |
| May 2023 |
22 |
500-2,000 |
| Jun 2023 |
18 |
1,200-2,000 |
| Jul 2023 |
30 |
300-2,000 |
| Aug 2023 |
25 |
400-2,300 |
| Sep 2023 |
23 |
600-2,000 |
BPPTKG reported that during April and May white gas-and-steam emissions rose 10-750 m above the crater, incandescent avalanches descended 500-2,000 m on the SW and W flanks (figure 135). Cloudy weather often prevented clear views of the summit, and sometimes avalanches could not be confirmed. According to a webcam image, a pyroclastic flow was visible on 17 April at 0531. During the week of 28 April and 4 May a pyroclastic flow was reported on the SW flank, traveling up to 2.5 km. According to a drone overflight taken on 17 May the SW lava dome volume was an estimated 2,372,800 cubic meters and the dome in the main crater was an estimated 2,337,300 cubic meters.
During June and July similar activity persisted with white gas-and-steam emissions rising 10-350 m above the crater and frequent incandescent avalanches that traveled 300-2,000 m down the SW, W, and S flanks (figure 136). Based on an analysis of aerial photos taken on 24 June the volume of the SW lava dome was approximately 2.5 million cubic meters. A pyroclastic flow was observed on 5 July that traveled 2.7 km on the SW flank. According to the Darwin VAAC multiple minor ash plumes were identified in satellite images on 19 July that rose to 3.7 km altitude and drifted S and SW. During 22, 25, and 26 July a total of 17 avalanches descended as far as 1.8 km on the S flank.
Frequent white gas-and-steam emissions continued during August and September, rising 10-450 m above the crater. Incandescent avalanches mainly affected the SW and W flanks and traveled 400-2,300 m from the vent (figure 137). An aerial survey conducted on 10 August was analyzed and reported that estimates of the SW dome volume was 2,764,300 cubic meters and the dome in the main crater was 2,369,800 cubic meters.
Frequent and moderate-power thermal activity continued throughout the reporting period, according to a MIROVA (Middle InfraRed Observation of Volcanic Activity) analysis of MODIS satellite data (figure 138). There was an increase in the number of detected anomalies during mid-May. The MODVOLC thermal algorithm recorded a total of 47 thermal hotspots: six during April, nine during May, eight during June, 15 during July, four during August, and five during September. Some of this activity was captured in infrared satellite imagery on clear weather days, sometimes accompanied by incandescent material on the SW flank (figure 139).
Geologic Background. Merapi, one of Indonesia's most active volcanoes, lies in one of the world's most densely populated areas and dominates the landscape immediately north of the major city of Yogyakarta. It is the youngest and southernmost of a volcanic chain extending NNW to Ungaran volcano. Growth of Old Merapi during the Pleistocene ended with major edifice collapse perhaps about 2,000 years ago, leaving a large arcuate scarp cutting the eroded older Batulawang volcano. Subsequent growth of the steep-sided Young Merapi edifice, its upper part unvegetated due to frequent activity, began SW of the earlier collapse scarp. Pyroclastic flows and lahars accompanying growth and collapse of the steep-sided active summit lava dome have devastated cultivated lands on the western-to-southern flanks and caused many fatalities.
Information Contacts: Balai Penyelidikan dan Pengembangan Teknologi Kebencanaan Geologi (BPPTKG), Center for Research and Development of Geological Disaster Technology (URL: http://merapi.bgl.esdm.go.id/, Twitter: @BPPTKG); MAGMA Indonesia, Kementerian Energi dan Sumber Daya Mineral (URL: https://magma.esdm.go.id/v1); Pusat Vulkanologi dan Mitigasi Bencana Geologi (PVMBG, also known as Indonesian Center for Volcanology and Geological Hazard Mitigation, CVGHM), Jalan Diponegoro 57, Bandung 40122, Indonesia (URL: http://www.vsi.esdm.go.id/); Darwin Volcanic Ash Advisory Centre (VAAC), Bureau of Meteorology, Northern Territory Regional Office, PO Box 40050, Casuarina, NT 0811, Australia (URL: http://www.bom.gov.au/info/vaac/); MIROVA (Middle InfraRed Observation of Volcanic Activity), a collaborative project between the Universities of Turin and Florence (Italy) supported by the Centre for Volcanic Risk of the Italian Civil Protection Department (URL: http://www.mirovaweb.it/); Hawai'i Institute of Geophysics and Planetology (HIGP) - MODVOLC Thermal Alerts System, School of Ocean and Earth Science and Technology (SOEST), Univ. of Hawai'i, 2525 Correa Road, Honolulu, HI 96822, USA (URL: http://modis.higp.hawaii.edu/); Copernicus Browser, Copernicus Data Space Ecosystem, European Space Agency (URL: https://dataspace.copernicus.eu/browser/); Øystein Lund Andersen (URL: https://www.oysteinlundandersen.com/, https://twitter.com/oysteinvolcano).
Ebeko
Russia
50.686°N, 156.014°E; summit elev. 1103 m
All times are local (unless otherwise noted)
Moderate explosive activity with ash plumes continued during June-November 2023
Ebeko, located on the N end of Paramushir Island in Russia’s Kuril Islands just S of the Kamchatka Peninsula, consists of three summit craters along a SSW-NNE line at the northern end of a complex of five volcanic cones. Observed eruptions date back to the late 18th century and have been characterized as small-to-moderate explosions from the summit crater, accompanied by intense fumarolic activity. The current eruptive period began in June 2022, consisting of frequent explosions, ash plumes, and thermal activity (BGVN 47:10, 48:06). This report covers similar activity during June-November 2023, based on information from the Kamchatka Volcanic Eruptions Response Team (KVERT) and satellite data.
Moderate explosive activity continued during June-November 2023 (figures 50 and 51). According to visual data from Severo-Kurilsk, explosions sent ash 2-3.5 km above the summit (3-4.5 km altitude) during most days during June through mid-September. Activity after mid-September was slightly weaker, with ash usually reaching less than 2 km above the summit. According to KVERT the volcano in October and November was, with a few exceptions, either quiet or obscured by clouds that prevented satellite observations. KVERT issued Volcano Observatory Notices for Aviation (VONA) on 8 and 12 June, 13 and 22 July, 3 and 21 August, and 31 October warning of potential aviation hazards from ash plumes drifting 3-15 km from the volcano. Based on satellite data, KVERT reported a persistent thermal anomaly whenever weather clouds permitted viewing.
Geologic Background. The flat-topped summit of the central cone of Ebeko volcano, one of the most active in the Kuril Islands, occupies the northern end of Paramushir Island. Three summit craters located along a SSW-NNE line form Ebeko volcano proper, at the northern end of a complex of five volcanic cones. Blocky lava flows extend west from Ebeko and SE from the neighboring Nezametnyi cone. The eastern part of the southern crater contains strong solfataras and a large boiling spring. The central crater is filled by a lake about 20 m deep whose shores are lined with steaming solfataras; the northern crater lies across a narrow, low barrier from the central crater and contains a small, cold crescentic lake. Historical activity, recorded since the late-18th century, has been restricted to small-to-moderate explosive eruptions from the summit craters. Intense fumarolic activity occurs in the summit craters, on the outer flanks of the cone, and in lateral explosion craters.
Information Contacts: Kamchatka Volcanic Eruptions Response Team (KVERT), Far Eastern Branch, Russian Academy of Sciences, 9 Piip Blvd., Petropavlovsk-Kamchatsky, 683006, Russia (URL: http://www.kscnet.ru/ivs/kvert/).
Search Bulletin Archive by Publication Date
Select a month and year from the drop-downs and click "Show Issue" to have that issue displayed in this tab.
The default month and year is the latest issue available.
Bulletin of the Global Volcanism Network - Volume 39, Number 10 (October 2014)
Managing Editor: Richard Wunderman
Bardarbunga (Iceland)
Substantial dike eruption ~45 km NE at Holuhraun begins 29 August 2014
Klyuchevskoy (Russia)
Two eruptive pulses: 15 August-20 December 2013 and 1 January-24 March 2015
Merapi (Indonesia)
During June 2011 to December 2014, several eruptions and elevated seismicity
Sinabung (Indonesia)
Frequent eruptions, pyroclastic flows, and advancing lava-flow lobe during May-October 2014
Bardarbunga (Iceland) — October 2014 Cite this Report
Bardarbunga
Iceland
64.633°N, 17.516°W; summit elev. 2000 m
All times are local (unless otherwise noted)
Substantial dike eruption ~45 km NE at Holuhraun begins 29 August 2014
[Barbarbunga is a subglacial caldera beneath the NW part of the Vatnajokull ice cap. Carrivick and Gertisser (2014) described the volcano as a caldera 700 m deep with a diameter of 11 km, covered by glacial ice ~850 m thick. This report is divided into two major sections, the first discussing activity between 1986 and 2008 and the second looking at more recent activity from 2014 to early 2015.]
1986-2008 activity. In 2010, the Icelandic Meteorological Office (IMO) presented a list of Icelandic volcanic eruptions from 1902-2010 on their website. That list lacks any eruption at the Bardarbunga caldera. Seibert and others (2010) stated that between 1986 and 2008, there were several uncertain cases of eruptions or unrest in the area of Loki-Fögrufjöll (S-SW of Bardarbunga caldera), which they consider a part of the larger Bardarbunga volcanic system (green in figure 1). The eruptive characteristics of these events included regional fissure and subglacial events associated with jökulhlaups (glacier bursts).
The associated jökulhlaups from 1986-2008 originated from the East and West Loki cauldrons found along the Loki Ridge of the Loki-Fögrufjöll system (figure 2). The cauldrons are located ~15 km SW of the center of the Bardarbunga caldera. Other terms for the Loki cauldrons include the East and West Skaftárketill cauldrons; the Eastern and Western Skaftá cauldrons; and the Eastern and Western cauldrons.
The Loki cauldrons are depressions formed in the Vatnajokull glacier surface by two underlying, subglacial geothermal areas (Einarsson, 2009). The geothermal areas melt the glacier's base and melt water collects forming subglacial lakes. As the lakes grow, the ice above them flattens. Eventually, the melt water escapes from the subglacial lakes in a jökulhlaup. The water of the jökulhlaup then travels ~40 km subglacially to flood the Skatfá river (Einarsson, 2009). Once the subglacial lake has emptied, the overlying ice collapses and the cauldrons can be seen again in the glacier surface (Einarsson, 2009).
Table 1 presents the dates of uncertain cases of eruption within the Bardarbunga volcanic system. The source of the jökulhlaups associated with these uncertain eruptions consistently originated from the East or West Loki cauldron or both.
Table 1. Table condensing Bardarbunga's uncertain cases of eruptive history during 1986-2008. The uncertain cases all reside in the area of Loki-Fögrufjöll. The table also show the source of the jökulhlaup associated with each of the cases. None of these uncertain cases occurred at the Bardarbunga caldera. Data in this table summarizes written communication with Páll Einarsson in 2008.
| Month |
Jökulhlaup source |
| Nov 1986 |
East Loki |
| Aug 1991 |
East Loki |
| Jul 1995 |
East Loki |
| Aug 1996 |
West Loki |
| Aug 1997 |
East Loki |
| Aug 2000 |
East and West Loki |
| Jul 2002 |
West Loki |
| Sep 2002 |
East Loki |
| Jul-Aug 2005 |
West Loki |
| Apr 2006 |
East Loki |
| Aug 2008 |
West Loki |
Two examples of uncertain eruptions at the East Loki cauldron follow. They occurred in November 1986 and August 1991. For the 1986 case, Björnsson and Einarsson (1990) stated, "There is a seismic indication that a small eruption occurred in 1986 during a Skaftá jökulhlaup from beneath the easternmost ice cauldron [figure 2]. The flood in Skaftá began on November 29, and on November 30 and the following day short bursts of continuous tremor were recorded on seismographs around Vatnajokull.... It is likely that the pressure release associated with the jökulhlaup triggered a short eruption that did not reach the surface of the glacier."
For the 1991 case, Björnsson and Einarsson (1990) reported that "Bursts of tremor were recorded on seismographs near Vatnajokull on Aug. 12, 1991, during a jökulhlaup in Skaftá. The course of events is similar to that of Nov. 30, 1986, and suggests that a small and short-lived eruption may have occurred beneath the Eastern Loki cauldron."
Based on the communication between Einarsson and GVP, the other cases in table 1 followed a similar pattern. For each of those events, the occurrence of a jökulhlaup was followed by either an eruption tremor or bursts of eruption tremor, which suggested the possibility of a small, subglacial eruption at East or West Loki.
Confirmed 1996 eruptions. There are two confirmed eruptions at Bardarbunga, both within a few weeks of each other in 1996 (1 and 2 below).
(1) Einarsson and others (1997) discuss the complex interplay of events that occurred during 29 September through 7 November 1996, which involved seismicity, dikes, jökulhlaups, and various eruptions at Bardarbunga, Grímsvötn and Gjálp (fissure between the two calderas). Einarsson and others (1997) start with this introduction: "A volcanic eruption beneath the Vatnajokull ice cap in central Iceland... began on September 30, 1996, along a 7-km-long fissure between the volcanoes Bardarbunga and Grímsvötn. The eruption continued for 13 days...."
They further note "... a minor subglacial eruption occurred on the southeast rim of the Bardarbunga caldera, 6-7 km to the north. Two small depressions formed in the ice surface there." Regarding this, Páll Einarsson added this comment in a 2015 email: "The small subglacial eruptions at the Bárðarbunga caldera rim, mentioned in our paper, are a separate event [from the one a few weeks later mentioned in (2) below]. They are evidenced by sinkholes in the glacier that were discovered late and the timing of these events is not known. Most likely the sinkholes were initiated during the Gjálp eruption, i.e. between September 30 and October 13."
(2) According to the Institute of Earth Sciences of the University of Iceland (IES, posting date uncertain), a small eruption took place at Bardarbunga in 1996. They wrote the following: "A small eruption started in Bardarbunga around 1300 hrs on November 6th. The eruption lasted for about 20 to 30 min. According to seismograms at the Meteorological office, the eruption was initiated by some intrusive activity. The intrusive activity is based on recorded eruption tremor picked up [by] the seismometers. Eruption column reached about 4 km in to the air. Relation between pressure decrease due to the flooding [has] been suggested as the main cause of the eruption." This eruption came a day after a jökulhlaup was released from the Grímsvötn caldera (BGVN 21:09 and 23:11, and IES (posting date uncertain). We have not found a clear description of where in the caldera the eruption took place on 6 November 1996.
In regards to the confirmed eruption of 6 November, Einarsson's email made these remarks: "Keep in mind that Bárðarbunga is very remote and observations of the activity are difficult and very dependent on weather conditions. The webpage of our institute describes a small explosive event that happened on Nov. 6 at the end of the large jökulhlaup, when the meltwater from the large Gjálp eruption was flushed down to the coast. Most of us think now that this was a phreatic reaction of the still hot edifice to the sudden pressure release when the caldera lake of Grímsvötn was emptied, i.e. not due to a fresh injection of magma. But observations were scarce and there may be other opinions on this."
2014-early 2015 activity. This section of the Bulletin report primarily summarizes events from 16 August 2014, when seismic activity began, into mid-January 2015. The eruption was still ongoing at that time.
Bardarbunga is monitored by a seismic network, an extensive GPS network, and various sensors such as webcams and infrared cameras. Monitoring and analyses at Bardarbunga is conducted by a group of collaborators that include the IMO, the Institute of Earth Sciences (IES) at the University of Iceland, and the National Commissioner of Police, and the Department of Civil Protection and Emergency Management.
Gudmundsson and others (2014) and IMO describe dike emplacement (without apparent breaching the ground surface) associated with a seismic swarm that began at the caldera and migrated tens of kilometers with branches to the N and NE during 16-31 August 2014. On 29 August 2014, two days before the swarm ended, an eruption was first documented at the surface at a flank vent devoid of ice cover ~45 km NE of the caldera.
Figures 3 and 4 help explain the location of volcanoes in Iceland and Bardarbunga lava that progressed northward as a dike and ultimately erupted in the Holuhraun vent.
The NE-trending dike reached an area outboard of the Vatnajokull ice cap at the Holuhraun volcanic field (figure 4), where the first clear eruption began on 29 August 2014. The fissure vent area was 4.5 km from the ice margin of the outlet glacier Dyngjujökull. The venting took place along an old fissure, and came out along an N-trending zone 600 m long. According to Gudmundsson and others (2014), that eruption was moderate and effusive.
Holuhraun is sometimes discussed in the context of Askja volcano (figure 4), which lies just to the N. Holuhraun is sometimes considered as peripheral vent system for Askja (Ialongo and others, 2015).
Figure 5 indicates the location of earthquakes during the first 16 days of dike emplacement (where days 1-16 correspond to 16-31 August 2014). Gudmundsson and others (2014) comment that "During this time, the dike generated some 17,000 earthquakes, more than produced in Iceland as a whole over a normal year." The venting to the surface at Holuhraun took place on 29 August 2014 and became strong by 31 August. In the early hours of the 29 August, the onset consisted of a minor, four-hour long, fissure eruption. The pattern on figure 5, depicting a 45-km-long dike injection along the rift system passing through Bardarbunga, testifies to the importance and utility of the seismograph in monitoring shallow magmatism leading to eruption.
According to IMO, seismic activity associated with Bardarbunga had gradually increased during the last seven years, although it temporarily diminished during the Grimsvotn eruption in May 2011. Vatnajokull GPS stations showed both upward and outward movements since early June 2014, and on 16 August 2014, the number of earthquakes significantly increased, with more than 300 earthquakes detected under the NW part of Vatnajokull ice cap (figure 5). As a result, the Aviation Color Code was increased to Yellow, the third level from the highest on a five color scale (Gray, Green, Yellow, Orange, and Red). On 18 August, IMO reported one earthquake swarm to the E and another swarm to the N of Bardarbunga. An M 4 earthquake occurred, the strongest in the region since 1996. By 18 August, 2,600 earthquakes had been detected at the volcano; earthquake locations from the E and N swarms had been migrating NE. In the evening of 18 August, earthquakes diminished in the N swarm. That same day the Aviation Color Code was raised to Orange.
According to IMO, GPS and seismic data during 20-26 August suggested that a NE-trending intrusive dike had increased from 25 to 40 km in length. During 22-26 August, several earthquakes in the 4.7-5.7 magnitude range had been detected at or near the volcano. These values were among the largest detected in the first few weeks of the swarm (Gudmundsson and others, 2014). The Aviation Color Code, chiefly Orange during this reporting interval, rose to the highest level, Red, several times during late August and September.
On 23 August seismic tremor indicated what IMO initially suggested was a small lava eruption at beneath the Dyngjujokull glacier (which is 150-400 m thick in this region). An overflight the next day found no evidence for an eruption.
On 27 August an overflight showed a 4- to 6-km-long row of cauldrons 10-15 m in diameter S of Bardarbunga.
Beginning on 31 August, lava erupted along a 1.5 km long fissure. During 1-2 September a white steam-and-gas plume rose to an altitude of 4.5 km and drifted 60 km NNE and ENE. Lava flowed N and lava fountains rose tens of meters. The number of earthquakes decreased from 500 earthquakes on 1 September to 300 earthquakes on 2 September. During the middle of September, seismicity persisted mainly around the caldera and the Dyngjujokull glacier.
On 2 September the lava had covered 4.2 km2 and was 4.5 km from the glacier's edge. By 3 September, the lava flow advanced ENE and covered 7.2 km2. The following day, the lava flow had an aerial extent of 10.8 km2. During 3-9 September, IMO observers noted ongoing lava effusion, high gas emissions, and elevated seismicity from the Holuhraun lava field. Ash production was almost negligible.
On 5 September, two new eruptive fissures were observed S of the main eruption site. These sites were less effusive and were located ~2 km from the edge of Dyngjujokull glacier (see this small shaded area in figure 2). The eruption also continued from the original fissure and generated a ~460 m high steam plume. Eventually, a row of craters formed along the eruptive fissure, the largest one was named Baugur crater.
The fissure eruption continued during 6-7 September, and the lava effusion rate was 100-200 m3/sec on 7 September (figures 6 and 7). Activity from the S fissures was less than that of the N fissure, which had been active since the beginning of the eruption. The advancing lava flow reached the W main branch of the Jökulsá á Fjöllum river (figure 4), which is fed by the icecap and exits the icecap ENE of the volcano. No explosive activity due to lava and river water interaction was observed, but steam rose from the area.
During 8-9 September, activity was no longer detected from the southernmost fissure. Lava continued to advance and interact with the Jökulsá á Fjöllum river. The extent of the lava flow reached 19 km2 and gas emissions remained high.
During 10-16 September, lava flows continued to advance at a consistent rate toward the E and W. A report on 22 September noted that the total volume of the erupted lava was 0.4-0.6 km3 and the flow rate was 250-350 m3/sec. By 30 September, the lava field was 46 km2, and the main flow had entered the river bed of Jökulsá á Fjöllum and continued to follow the river's course. Steam rose from the river where the lava was in contact with water but no explosive activity occurred.
Although reporting noted a lack of tall mobile ash plumes blown towards Europe and causing air traffic delays, the plumes remained lower and more local causing widespread air quality problems in Iceland. IMO reported continued gas emissions that included elevated SO2 emissions during 10-16 September and issued warnings to the public in the municipality of Fjarðarbyggð (180 km ENE of Bardarbunga) on 13 September. These emissions persisted through at least November.
During 17-23 September, chemical analysis and geophysical modeling indicated that the source of the magma was at a depth of more than 10 km. On 21 September, field scientists estimated that about 90% of the SO2 from the eruption originated at the active craters and the rest rose from the lava field. Dead birds were also found around the eruption site.
Seismic activity at the N part of the dike and around the vents declined in October 2014, although the lava field continued to grow and lava production continued at the same output. On 5 October, a new lava front emerged at the S edge of the main lava flow and advanced E.
On 18 October, an M 5.4 earthquake struck in the N part of Bardarbunga caldera, one of the biggest earthquakes since the start of the eruption. The growing lava field at Holuhraun was 66 km2 by 31 October. By late October, the fissure's main vent (Baugur crater) had constructed a local topographic high that stood 80 m higher than the local landscape.
In November, eruption-associated seismicity remained strong although an IMO report on the 19th suggested that the number of large, M~5 events seemed to be decreasing. FLIR thermal images of the craters on 18 November showed that by then the most intense area of thermal convection was at a crater in the N part of the eruption site. On 20 November, observers characterized the eruption in the crater as pulsating explosions every 10-15 minutes, followed by a gush of lava down the main channel with splashing on either side. During 25-26 November, the activity was characterized as pulsating, with lava surging from the vent for 2-3 minutes at intervals of about 5-10 minutes. The upper parts of the lava channel developed a sinuous appearance owing to a series of bulges in the channel's margins.
On 12 November, IMO indicated that it monitored gas releases from Holuhraun using DOAS and FTIR instruments to estimate the fluxes of SO2 and other gases in the volcanic cloud. In the first month and a half of the eruption, the average flux was 400 kg/s (~35,000 metric tons per day, t/d) with peaks up to 1300 kg/s (~112,000 t/d). The IMO calculated that, assuming a constant release of gas through 12 November, the eruption had injected into the atmosphere an amount of SO2 in the range 3.5–11.2 Mega tons, Mt (depending on whether the computed from the average or the peak flux).
On 27 November, observers indicated that a plume rose 3.1 km above the sandy plain. A thermal image from 1 December showed several changes to the lava field. In just over 24 hours there was a new lava extrusion at the NE margin that had traveled 450 m. A new flow traveled N in an area just W of the lava lake. One or more new flows also developed S of the lava lake. The lava field from this eruption was just over 75 km2.
In early December, data also showed a decline in the eruption's intensity, although seismic activity remained strong. By 9 December, the lava field at Holuhraun had covered just over 76 km2, making its aerial extent the second largest in Iceland (but still considerably smaller than the largest historical field created by the Laki fissure eruption of 1783-1784). By 18 January 2015, the lava covered an area of 85 km2. A NASA photo of the lava flow is shown in figure 8. The vent area contained a lava lake, a large mass of highly radiant (molten, red-colored) lava.
According to the IMO, the ongoing eruption's very gas-rich emissions had affected the entire country. IMO stated that "we have to go 150 years back to find an event (Trölladyngja) that had a comparable impact on Iceland and its inhabitants, in terms of environmental and health issues."
Radar measurements of the flow field during a surveillance flight on 30 December 2014 provided preliminary evidence that lava thickness averaged ~10 m in the eastern part, ~12 m in the center, and at least 14 m in the western part. IMO indicated that the preliminary estimate of the lava volume was 1.1 km3. (A later estimate in 2015 took the volume to 1.4 km3, roughly 10% of the Laki fissure eruption.)
IMO reported that during 31 December-6 January fresh lava flowed N and also to the E where in part it transited through a closed channel (shallow lava tube). During 7-20 January 2015, IMO noted that the lava field expanded along its N and NE margins. Seismicity remained strong and local air pollution from gas emissions persisted. IMO said that on the days10 and 15 January the lava field covered 84.1 and 84.3 km2, respectively.
Figure 9 shows the eruption on 21 January 2015.
Subsidence. The caldera had been subsiding during the reporting period. The subsidence at Bardarbunga caldera was visible on the ice surface and was interpreted as reflecting deformation of the caldera itself. The depression developed in a roughly bowl-shape area that, as of 20 January 2015, was about 80 km2 in area with a volume exceeding 1.5 km3.
Figure 10 shows the chronology of subsidence levels between 5 September 2014 and 30 December 2014. The subsidence in the center of the caldera was about 60 m by 20 January 2015, a value determined by comparing the ice surface elevation with that elevation at the same location before the beginning of the collapse. Gudmundsson states that the assumption is that the ice surface lies more or less passively on top of the bedrock in the caldera. As of 20 January, no evidence of major ice melting had been observed; however, increased geothermal activity on the caldera rims has resulted in ice depressions over the hot spots. Other ice depressions on the Dyngjujokull glacier were also observed, suggesting that small, short sub-glacial eruptions may have occurred there. According to Gunnar Gudmundsson, there was no evidence of a subglacial eruption within the caldera.
During early December, IMO reported that the Scientific Advisory Board of the Icelandic Civil Protection had reviewed data from the beginning of the eruption to 3 December. They acknowledged that the subsidence rate had decreased during that time, dropping from highs of up to 80 cm/day down to 25 cm/day, with most of the subsidence concentrated at the caldera center.
References. Björnsson, H. and Einarsson, P., 1990, Volcanoes beneath Vatnajokull, Iceland: Evidence from radio echo-sounding, earthquakes and j kulhlaups, Jökull, no. 40, pp 147-168.
Carrivick, J and Gertisser, R, 2014, Bardabunga: eruption develops in Iceland, Geology Today, v. 30, Issue 6, pp. 205-206, November/December 2014, John Wiley & Sons Ltd.
Einarsson, P., B. Brandsdóttir, M. T. Gudmundsson, H. Björnsson, K. Grínvold, and F. Sigmundsson, 1997, Center of the Iceland hotspot experiences volcanic unrest, Eos Trans. AGU, 78(35),369–375, doi:10.1029/97EO00237.
Einarsson, B., 2009, Jökulhlaups in Skaftá: A study of a jökulhlaup from the Western Skaftá cauldron in the Vatnajokull ice cap, Iceland, Thesis for Master of Science in Geophysics degree, School of Engineering and Natural Sciences, Faculty of Sciences, University of Iceland, (URL: https://notendur.hi.is/~mtg/nemritg/BE-MS_2009.pdf)
Gudmundsson, A, Lecoeur, N, Mohajeri, N, and Thordarson, T, 2014, Dike emplacement at Bardarbunga, Iceland, induces unusual stress changes, caldera deformation, and earthquakes. Bulletin of Volcanology, vol. 76, no. 10, pp. 1-7.
Hartley, M. E., and Thordarson, T., 2013, The 1874–1876 volcano-tectonic episode at Askja, North Iceland: Lateral flow revisited. Geochemistry, Geophysics, Geosystems, vol. 14, no. 7, pp. 2286-2309.
Ialongo, I., Hakkarainen, J., Kivi, R., Anttila, P., Krotkov, N. A., Yang, K., & Tamminen, J., 2015, Validation of satellite SO2 observations in northern Finland during the Icelandic Holuhraun fissure eruption. Atmospheric Measurement Techniques Discussions, vol. 8, no. 1, pp. 599-621.
Institute of Earth Sciences (IES), 1996, The Gjálp eruption in Vatnajokull 30/9 - 13/10 1996, Institute of Earth Sciences (IES), University of Iceland, Accessed on 31 March 2015 (URL: http://earthice.hi.is/gjalp_eruption_vatnajokull_309_1310_1996) .
Larsen, G. and Gudmundsson, M. T., 2014, Volcanic system: Bárðarbunga system, pre-publication extract from the Catalogue of Icelandic Volcanoes, Accessed on 4 April 2015, (URL: http://blog.snaefell.de/images/Bardarbunga_kafli20140825.pdf).
Icelandic Meteorological Office, 2010, List of recent volcanic eruptions in Iceland, Accessed on 31 March 2015 (URL: http://en.vedur.is/earthquakes-and-volcanism/articles/nr/1874).
Marteinsson, V.T., Rúnarsson, Á., Stefánsson, A., Thorsteinsson, T., Jóhannesson, T., Magnússon, S.H., Reynisson, E., Einarsson, B., Wade, N., Morrison, H., and Gaidos, E., 2013, Microbial communities in the subglacial waters of the Vatnajokull ice cap, Iceland, The ISME Journal, vol. 7, pp. 427–437, doi:10.1038/ismej.2012.97, (URL: http://www.nature.com/ismej/journal/v7/n2/full/ismej201297a.html).
Seibert, L., Simkin, T., and Kimberly, P., 2010, Volcanoes of the World (Third Edition), pp. 204-205, University of Cailfornia Press, ISBN 978-0-520-26877-7.
Geologic Background. The large central volcano of Bárðarbunga lies beneath the NW part of the Vatnajökull icecap, NW of Grímsvötn volcano, and contains a subglacial 700-m-deep caldera. Related fissure systems include the Veidivötn and Trollagigar fissures, which extend about 100 km SW to near Torfajökull volcano and 50 km NE to near Askja volcano, respectively. Voluminous fissure eruptions, including one at Thjorsarhraun, which produced the largest known Holocene lava flow on Earth with a volume of more than 21 km3, have occurred throughout the Holocene into historical time from the Veidivötn fissure system. The last major eruption of Veidivötn, in 1477, also produced a large tephra deposit. The subglacial Loki-Fögrufjöll volcanic system to the SW is also part of the Bárðarbunga volcanic system and contains two subglacial ridges extending from the largely subglacial Hamarinn central volcano; the Loki ridge trends to the NE and the Fögrufjöll ridge to the SW. Jökulhlaups (glacier-outburst floods) from eruptions at Bárðarbunga potentially affect drainages in all directions.
Information Contacts: Icelandic Met Office (IMO) (URL: http://en.vedur.is/); London Volcanic Ash Advisory Centre (URL: http://www.metoffice.gov.uk/aviation/vaac/); Institute of Earth Sciences (IES), University of Iceland (URL: http://earthice.hi.is); Pall Einarsson, IES, University of Iceland; Gunnar Gudmundsson, IMO; Magnus Tumi Gudmundsson, IES, University of Iceland (URL: http://earthice.hi.is); National Commissioner of Police, Department of Civil Protection and Emergency Management (URL: http://avd.is/en/):NASA Earth Observatory (URL: http://earthobservatory.nasa.gov); Peter Hartree, Reykjavik, Iceland (UR: https://web.peterhartree.co.uk/).
Klyuchevskoy (Russia) — October 2014 Cite this Report
Klyuchevskoy
Russia
56.056°N, 160.642°E; summit elev. 4754 m
All times are local (unless otherwise noted)
Two eruptive pulses: 15 August-20 December 2013 and 1 January-24 March 2015
During mid-2013 to early 2015, Klyuchevskoy had two strong eruptive pulses with an intervening lull. The first pulse occurred 15 August-20 December 2013 (~3 months of eruption). Ash plumes and related eruptive activity halted during 2014 until about January 2015 (12 months pause). The second pulse occurred very late December 2014 or very early January 2015 through at least 24 March 2015 (~3 months of eruption).
We start by discussing the latter portion of the first pulse, covering the interval 15 November to 20 December 2013. That time period was missing from our earlier reporting, which ended with our last report (BGVN 38:07) summarizing eruptions during October 2012 through 14 November 2013.
In a later subsection labeled "2015," we discuss the second of the two eruptive pulses. The Global Volcanism Program requires an eruptive repose of three or more months before an eruption is considered to be over; thus, at the time of this writing (6 April 2015), it is too early to tell whether 24 March will hold true as the end date for the later pulse.
We base this report on the reporting interval from the Kamchatkan Volcanic Eruption Response Team (KVERT). Table 15 in BGVN 38:07 delineates the Aviation Color Code (a four-step code from a low of Green, advancing from Yellow to Orange, and ultimately to a high of Red). Klyuchevskoy is also spelled alternatively Kliuchevskoi, Klyuchevskaya Sopka, and Klyuchevskaya.
Late 2013 activity (and lull during 2014). KVERT documented that eruptions were common during 15 August 2013-20 December 2013 (continuing for about 5 weeks beyond our last Bulletin report). Figure 16 shows a photo taken on 16 November 2013 (UTC) by an astronaut aboard the International Space Station. This low angle image highlights some interesting plume dynamics–whereby the dark material at left branches off from a lighter colored plume trending farther to the right (heading ESE)). A NASA Earth Observatory article (posted in 2 December 2013) commented: "The plume—likely a combination of steam, volcanic gases, and ash—stretched to the [ESE] due to prevailing winds. The dark region to the [NNW] is likely a product of shadows and of ash settling out. Several other volcanoes are visible in the image, including Ushkovsky, Tolbachik, Zimina, and Udina. To the [SSW] of Klyuchevskoy lies Bezymianny Volcano, which appears to be emitting a small steam plume (at image center)."
During the reporting interval, KVERT issued multiple reports of a type called a VONA (Volcano Observatory Notices for Aviation), and they provide a record of eruptive activity at Klyuchevskoy. A VONA issued at 0242 on 17 November 2013 indicated that web camera assessments revealed strombolian eruptions with strong gas and steam; an ash plume rose to 7 km altitude and blew 160 km E. The four-step Aviation Color Code (low to high, Green, Yellow, Orange, and Red) rose to Orange. The VONA issued the next day at 0246 on the 18th (UTC) indicated significant decrease in eruptive activity, including a lack of ash plume during the last several hours, but with cautions that aerosols with ash were still possible at low altitudes.
Two VONAs were issued on 19 November 2013; the first at 0248 (UTC) raised the Aviation Color Code from Yellow to Red. This VONA noted that based on seismic data strong ash explosions had resumed at 0216 UTC on the 19th. Visual data showed ash plumes up to 10-12 km altitude extending unstated distances SE.
The VONA for 2341 on the 19th reported a lowered Color Code, to Orange, in response to lowered ash plumes (at 5-5.5 km altitude) during the previous several hours. The plumes blew unstated distances N and NE.
2014. The VONAs for December 2013 and into early January 2014 mentioned some still robust plumes, but the eruption ended on 20 December. A 3 December 2013 VONA indicated that an explosive eruption had seemingly stopped on 19 November, but this was ruled out by a 6 December VONA that again raised the Color Code to Red associated with strong ash plumes up to 5.5-6.0 km altitude and extending over 212 km NE of the volcano.
More information about the 3 December 2013 eruption came out in the 12 December WIR (emphasis added and plume length converted to kilometers): "Seismicity of the volcano increased on December 06, and began to decrease on December 10. Video data showed ash plumes rose up to [5-6 km altitude] on December 06-10. Satellite data showed a very weak thermal anomaly over the volcano summit; ash plumes extended about [1020 km in] the different directions [from] the volcano: to the [E] on December 06-08, to the [NW] on December 09-10, and to the [E and SE] on December 10-11 [2013]." This 1020 km long ash plume was among the longest documented during the reporting interval.
On 7 December a VONA announced the Color Code had dropped to Orange although explosive eruption continued. Video and satellite data revealed a 5.5-km-altitude, NE-directed plume of unstated length. Also, volcanic tremor remained at the previous level (0.7-1.0 mcm/s) and shallow volcanic earthquakes registered.
VONAs issued on 26 December 2013 and 2 January 2014 stated the eruption had ended. The later report noted the eruption end date of 20 December 2014.
No further VONAs were issued for Klyuchevskoy during the remainder of 2014.
2015. Late in 2014, KVERT reported that both the abundance and the magnitude of shallow volcanic earthquakes began to increase during 19-20 December 2014 and again on 31 December 2014; tremor became constant. The volcano was cloaked in clouds during 31 December 2014 to 1 January 2015, but KVERT judged that a strombolian eruption probably began on 1 January 2015, which is consistent with a satellite thermal anomaly. On 2 January 2015, the Aviation Color Code rose from Green (normal) to Yellow (which is a sign of elevated unrest). During the course of January 2015 the volcano resumed frequent eruptive activity and that month KVERT issued ~15 VONAs for Klyuchevskoy. The eruption stopped on 24 March 2015 and any later events after 6 April 2015 extend beyond the current reporting period.
Besides the VONAs, KVERT also creates Weekly Information Releases (hereafter WIRs). The WIR issued on 8 January 2015 stated that both strombolian explosive eruptions of the volcano and associated incandescence continued. Lava bombs rose up to 200-300 m above the crater and ash plumes to ~5 km altitude. Seismic activity of the volcano continued to increase. The magnitude of tremor increased from 3 to 13 x10-5 m/sec. (Note that KVERT reported tremor in units reflecting the velocity of the seismic sensor. They state these units as "mcm/s," 'milli-centimeters per second', which are equivalent to 10-5 m/sec, the means of expression used in this report.) Video data on the 4th and 7th revealed strong gas-steam emissions. Clouds obscured the volcano during other days of the week. Satellite infrared data showed a bright thermal anomaly over the volcano all week.
KVERT's 16 January WIR noted clear visibility of the summit area where bombs were ejected 200-300 m above the summit crater. Strombolian and vulcanian eruptions produced a series of ash plumes that rose to 5-8 km altitude (table 16). The Aviation Color Code increased to Orange.
Figure 17 shows a strombolian eruption at the summit on 19 January 2015. The KVERT caption reported that at this time two centers of strombolian activity and lava flows could be observed at the summit crater. About a week before, video images suggested a new lava flow had started to discharge downslope, and by mid-January through March, lava flows were regularly indicated in KVERT reports (two were seen on the NW slope on 15 March).
The lava flows led to phreatic explosions at the lava flow front. These produced gas-and-steam clouds with minor amounts of ash that during 27-28 January rose to an altitude of 7-8 km. Ashfall was reported in nearby (table 16). Consistent with the lava flows and the spatter from strombolian eruptions, satellite images consistently showed thermal anomalies over the volcano.
On 15 February, a series of explosions generated ash plumes that rose to an altitude of 8 km, prompting KVERT to raise briefly the Aviation Color Code to Red. Later that day, it was lowered to Orange. During the second half of February, bombs were ejected 150 m above the crater, rather than up to ~300 m, as earlier. Towards the end of February they were no longer reported although that may have been due to lack of visibility or the spatter and bombs may have decreased in size to the point where such emissions became difficult to observe.
On 9 March, the magnitude of seismic tremor significantly decreased. Only moderate emissions of steam and gas were observed, and a thermal anomaly over the summit disappeared. The Aviation Color Code was lowered to Yellow. On 10 March, seismic tremor significantly increased again, prompting KVERT to raise the Aviation Color Code to Orange. Video images showed moderate gas-and-steam activity, while satellite images detected a gas-and-steam plume with small amounts of ash. During 10-17 March, a weak thermal anomaly was detected occasionally over the summit. The eruption continued through the middle of March, but the energy of the explosions decreased significantly, prompting KVERT to lower the Aviation Color Code to Yellow on 25 March.
As of 2 April 2015, KVERT reported that moderate activity continued, with strong fumarole activity. As previously mentioned, KVERT described the explosive eruption as ended on 24 March (table 16).
Table 16. Plume characteristics at Klyuchevskoy during 10 January to 2 April 2015 (UTC). -- means not reported, Bhgt stands for the height above the crater to which bombs were thrown (in meters). Data do not include low-rising emissions. KVERTs satellite-based assessment of the ash content in plumes was generally determined by methods discussed by Ellrod (2012) and Ackerman and others (undated) and references therein. The table was assembled largely from KVERT VONAs and their Weekly Information Releases (WIRs).
| Time period |
Max. plume altitude (km) |
Drift length and direction |
Remarks |
| 01 Jan-11 Jan 2015 |
-- |
-- |
(2nd) VONA this day (the only one until the 11th) reported strong and moderate gas-steam plumes during past weeks. Weak thermal anomaly at both the summit and at a SW-flank. Seismically active.
WIR issued on 2nd noted that explosive eruption probably continued, and a thermal anomaly appeared on the 1st. Weather clouds often masked visibility. WIR issued the 11th noted strong gas-and-steam emissions and strombolian eruptions. Bhgt 200-300 m. Thermal anomaly, but absence of ash plumes during past week. Clouds often blocked views. Aviation Color Code (2nd and 11th): Yellow |
| 12 Jan-15 Jan 2015 |
5-7 (11-15th) |
In general, 160 km SW and NE |
On 11th, ~35 km @ 5 km alt. SSE WIR issued 16 Jan noted the following: Moderate explosive activity. Ashfall in Kozyrevsk village. Bhgt 200-300 m. Thermal anomalies all week. Intervals of increased seismicity and tremor. Aviation Color Code: mainly Orange through 20 March
(10-12th) Strong explosive events; ash clouds rose up to 6-10 km alt., strong ashfall on 12th at Klyuchi village (~50 km W of volcano).
(10-12th; 15-16th) Ash plumes drifted over 200 km W and SW of volcano. |
| 16 Jan-22 Jan 2015 |
5-7 |
210 km SW, NW, NE |
WIR issued 23 Jan noted the following: Moderate explosive activity. Bhgt: 200-300 m. Satellite IR thermal anomaly was consistent with hot lava. E flank lava flow noted.
(21st) Ashfall in Klyuchi village. |
| 23 Jan-29 Jan 2015 |
5.5-7 & more (at right) |
300 km various (W, N, NE, E, and SE) |
WIR issued 30 Jan noted the following. Moderate explosive activity. Good summit visibility; incandescence and thermal anomaly all week. Bhgt: 200-300 m. E flank lava flow.
(27-28th) Phreatic explosions at the advancing E-flank lava front produced gas-and-steam plumes with minor amounts of ash that rose to 7-8 km. Ashfall on 27th both in Klyuchi village and near the Khapitsa river, and on 28th in Kozyrevsk village. |
| 30 Jan-04 Feb 2015 |
5-6 Various during week. |
(4-5th) 1,000 km NW and N |
WIR issued 5 Feb noted the following. Moderate explosive activity. Ongoing strombolian and vulcanian eruptions all week; Bhgt 200-300 m; advancing E flank lava flows and consistent thermal anomalies.
(5th) Ashfall in Klyuchi village. |
| 05 Feb-12 Feb 2015 |
5.5-6.5 |
400 km, mainly NW and N |
WIR issued 13 Feb noted the following. Moderate explosive activity. Ongoing strombolian and vulcanian eruptions all week. On 7th, ashfall in Kozyrevsk village and on 11th in Klyuchi village. Bhgt 200-300 m. |
| 13 Feb-20 Feb 2015 |
5-8 |
Up to 600 km, mainly E, SE, and S during week |
WIR issued 21 Feb noted strombolian and vulcanian eruptions: Bhgt: 150 m. (13-16th) Ashfall in Klyuchi village (temporary elevation of Avaiation Color Code to Red). |
| 21 Feb-27 Feb 2015 |
5-6 |
90 km NE |
WIR issued 28 Feb noted continuing strombolian and vulcanian eruptions and ash explosions. Bhgt not reported in this or later WIRs. |
| 28 Feb-05 Mar 2015 |
5-6 |
400 km, mainly E, SE, and NE during week |
WIR issued 6 Mar noted moderate eruption continued and still included strombolian and vulcanian eruptions, ash explosions, and summit glow. Thermal anomalies all week. |
| 06 Mar-11 Mar 2015 |
5-6 (8th and 10th) |
~338 km broadly E |
WIR issued 12 Mar noted moderate explosive eruptions continued this week. Thermal anomalies on 7th and 10-11th. (9th) Moderate emissions of steam and gas; (10th) similar to 9th but with minor ash. |
| 12 Mar-20 Mar 2015 |
5-5.5 |
90 km, broadly E |
WIR issued 20 Mar noted moderate ongoing eruption but significantly weaker than in previous weeks. Thermal anomaly weak. Better visibility during 16-17th, poor on other days.
(16-17th) (includes observations to left); poor visibility on other days;.) Aviation Color Code Orange |
| 21 Mar-26 Mar 2015 |
-- |
-- |
WIR issued 27 Mar: End of explosive eruption on 24th. Strong fumaroles persisted. Gas-steam plumes containing small amounts of ash on 22nd-23rd. Weak thermal anomaly all week. Aviation Color Code, Yellow. |
| 27 Mar-06 Apr 2015 |
-- |
-- |
WIR issued on 3 Apr stated that strong fumarolic activity and weak thermal anomalies both continued, but that clouds blocked view except for 30th. VONA was issued on 6th: Both high seismicity and moderate gas-steam emissions continued. Aviation Color Code on 3rd Yellow, changing on 10th to Green. |
References: Gary Ellrod, 2012, Remote Sensing of Volcanic Ash, National Weather Association (URL: http://www.nwas.org/committees/rs/volcano/ash.htm).
Ackerman, S., Lettvin, E, Mooney, M, Emerson, N, Lindstrom, S, Whittaker, T., Avila, L, Kohrs, R, and Bellon, B., undated, Satellite applications for geoscience education [online course; Facilitating the use of satellite observations in G6-12 Earth Science Education] University of Wisconsin and University of Washington (URL: https://cimss.ssec.wisc.edu/sage/geology/lesson3/concepts.html).
Geologic Background. Klyuchevskoy is the highest and most active volcano on the Kamchatka Peninsula. Since its origin about 6,000 years ago, this symmetrical, basaltic stratovolcano has produced frequent moderate-volume explosive and effusive eruptions without major periods of inactivity. It rises above a saddle NE of Kamen volcano and lies SE of the broad Ushkovsky massif. More than 100 flank eruptions have occurred during approximately the past 3,000 years, with most lateral craters and cones occurring along radial fissures between the unconfined NE-to-SE flanks of the conical volcano between 500 and 3,600 m elevation. Eruptions recorded since the late 17th century have resulted in frequent changes to the morphology of the 700-m-wide summit crater. These eruptions over the past 400 years have originated primarily from the summit crater, but have also included numerous major explosive and effusive eruptions from flank craters.
Information Contacts: Kamchatka Volcanic Eruption Response Team (KVERT), Far East Division, Russian Academy of Sciences, 9 Piip Blvd., Petropavlovsk-Kamchatsky, 683006, Russia (URL: http://www.kscnet.ru/ivs/); Kamchatka Branch, Geophysical Service, Russian Academy of Sciences (KB GS RAS) (URL: http://www.krsc.ru/english/network.htm); NASA Earth Observatory (URL: http://earthobservatory.NASA.gov/); and William L. Stefanov, Jacobs Technology/ESCG, NASA Johnson Space Center, Houston, Texas.
Merapi (Indonesia) — October 2014 Cite this Report
Merapi
Indonesia
7.54°S, 110.446°E; summit elev. 2910 m
All times are local (unless otherwise noted)
During June 2011 to December 2014, several eruptions and elevated seismicity
This report details activity and monitoring at Merapi from 13 June 2011 through December 2014.
The last major eruption at Merapi was in 2010 as discussed in the previous two reports. As noted in BGVN 36:01 (covering 26 October 2010 to January 2011), Merapi began to erupt on 26 October 2010 and continued erupting throughout the interval, causing ~400 fatalities. BGVN 36:05 (26 October 2010 to 12 June 2011) further discussed this eruption detailing new dome growth and how lahars damaged infrastructure.
During the current reporting interval (13 June 2011 through December 2014), Merapi erupted regularly amid elevated seismicity. This report chiefly derives from three sources: (1) Balai Penyelidikan dan Pengembangan Teknologi Kegunungapian (BPPTK), (2) Pusat Vulkanologi dan Mitigasi Bencana Geologi (PVMBG; here referenced as CVGHM which stands for Center for Volcanology and Geological Hazard Mitigation), and (3) the Darwin Volcanic Ash Advisory Center (VAAC).
Activity during 2011.The hazard status for Merapi from 13 June 2011 onwards was Alert, Level II (on a scale of I–IV), before it decreased during 12–18 September 2011 and remained at Normal, Level I. Several minor avalanches occurred, with noted incidents on 2, 4, 6, 7, 14, and 25 July; 2, 7, and 15 August; and 4 and 8 September. Merapi also released several plumes, most of which consisted of white, thin or thin-to-thick clouds that rose to a maximum of only a few hundred meters above the summit (table 21).
Table 21. From 13 June to 31 December 2011, the plumes released by Merapi were generally described as thin or thin-to-thick and white in color. The only exception was apparent puffing associated with the plume on 10 July 2011, which lasted ~3 hours. Courtesy of BPPTK weekly reports from 2011.
| Date |
Time (Local Time) |
Max. height above the crater(m) |
| 19 Jun 2011 |
2100 |
200 |
| 03 Jul 2011 |
2015 |
600 |
| 04 Jul 2011 |
2043 |
600 |
| 10 Jul 2011 |
2100-2400 |
200 |
| 16 Jul 2011 |
2115 |
400 |
| 18 Jul 2011 |
1750 |
350 |
| 25 Jul 2011 |
1510 |
400 |
| 07 Aug 2011 |
2150 |
400 |
| 10 Aug 2011 |
2028 |
600 |
| 18 Aug 2011 |
2015 |
200 |
| 03 Sep 2011 |
3002 |
350 |
| 08 Sep 2011 |
1950 |
100 |
| 16 Sep 2011 |
1650 |
200 |
| 10 Oct 2011 |
1805 |
150 |
| 23 Oct 2011 |
1740 |
125 |
| 26 Oct 2011 |
1840 |
100 |
| 06 Nov 2011 |
1456 |
400 |
| 09 Nov 2011 |
1720 |
400 |
| 02 Dec 2011 |
1740 |
150 |
| 05 Dec 2011 |
1700 |
200 |
| 14 Dec 2011 |
1929 |
900 |
| 31 Dec 2011 |
2110 |
90 |
The non-tremor seismicity at Merapi in 2011 (figure 54) was categorized into four types of earthquakes, each of which had different patterns on the time-series plots. The seismicity was also described in terms of Real-time Seismic Amplitude Measurement (RSAM), (not shown here). In 2011, avalanche earthquakes and multiphase earthquakes dominated the record.
A key means of measuring changes in linear length at Merapi consisted of surveys employing Electronic Distance Measurement (EDM) instruments (figure 55). The instruments computed the distance from several reflectors positioned on Merapi's slopes to fixed points at surrounding observatory posts. Figure 56 (below) provides the location of the posts and reflectors mentioned. Length changes were generally in the range of a few centimeters.
Activity during 2012. A thin, white plume rose to a maximum of 150 m above the crater at 1910 on 6 January, and storms and heavy clouds covered Merapi's summit. On 9 January at an unstated time, a photo from CCTV Deles (discussed by BPPTK) showed Merapi amid clear weather with a white billowing cloud rising from the crater area. A few days later, at 1835 on 15 January, Merapi ejected a thin, white plume, rising to a maximum of 100 m above the summit, heading W. Thin, white plumes were also observed above the crater to 50 m, heading E on 1 February at 1720; to 500 m at 1745 on 11 February; and to 400 m at 1800 on 13 February. During 30 July to 5 August 2012, BPPTK referred to thick, white plumes drifting from the volcano. One plume reached a maximum of 600 m above the crater at an unstated date around this time. For the intervals in 2012 discussed above, the hazard status remained constantly at Normal (I). Furthermore, during 2012, the BPPTK recorded the seismicity (figure 57) and the EDM linear length (figure 58).
Activity during 2013. A thick plume blew W and reached a maximum of 450 m above the crater at 1750 on 3 February. The hazard status was at Normal (I).
On 22 July at 0415, BPPTK observed an ash eruption with brown-to-black color, reaching 1 km above the crater. A roar was heard within a radius of 6–7 km around Merapi, and ash fell to the SE, S, and SW. The hazard status remained at Normal (I); the Aviation Color Code was at Orange. According to a news article (Yahya, 2013), the eruption caused hundreds to temporarily evacuate; they returned to their homes later the same day. On 29 October 2013, BPPTK observed a white, thin-to-thick plume that reached 150 m above the summit, heading W.
On 18 November 2013, Merapi erupted. A news article in the Jakarta Post discussed the event extensively quoting BPPTK staff (Muryanto and Ayuningtyas, 2013). The article said that the eruption began at 0453 LT forming a plume that rose to 2 km above the crater. Ash fell until about 1000 that day, with noticeable amounts found up to 60 km to the E. The news report also noted that ~600 families "in Kalitengah Lor, Kalitengah Kidul and Srune hamlets, and in Glagaharjo village, Sleman regency, Yogyakarta, had immediately gathered to be evacuated" and that "villagers in Turgo village, Turi district, Sleman, located on the western flank of Mount Merapi, also fled their homes, [returning] a few hours later as the situation returned to normal." The eruption followed an M 4.7 tectonic earthquake detected in Ciamis, West Java earlier that day and was more powerful than a previous eruption on 22 July 2013 (Muryanto and Ayuningtyas, 2013).
Based on a Darwin VAAC report at 2025 LT on the same day (18 Nov), the eruption formed a plume that reached ~12.2 km altitude. The Aviation Color Code was increased to Red. By 2104 on the 18th, VAAC satellite analysis no longer detected the high altitude volcanic plume, but the VAAC reported a lower plume at ~4.6 km altitude. At 0300 on 19 November, the low level plume had extended to ~46 km E. However, by 0735, the plume had completely dissipated, and the Aviation Color Code returned to Orange.
BPPTK noted the seismicity (figure 59), the EDM linear length (figure 60), and the tilt (figure 61). In 2013, seismicity was dominated by avalanche earthquakes (figure 59). The only major change in linear length was the distance to Kaliurang 2 which had a gradual upward trend for most of the year, before a comparatively rapid downward trend in mid-October (figure 60). The two tiltmeter records showed broad consistency, with mild increases in the middle to late part of the year that reverted near to the original tilt (figure 61). The temperature graph had a broad peak in August 2013 that could account for some of the increase in tilt, but the BPPTK report did not discuss this in any detail. (For the location of the tiltmeter stations mentioned, see figure 62.)
Activity during 2014. BPPTK noted that on 17 January at 1615, a white plume rose to 50 m above the summit, heading E.
At 1854 LT on 10 March 2014, Merapi erupted forming an ash plume that blew W. The event was captured on an automated closed-circuit video (CCTV Pasarbubar) and was followed by two more blasts within a minute (the first at 1855). At 1908, BPPTK noted a volcanic earthquake (with a maximum amplitude of 20 cm). Another video monitor (CCTV Bubar) recorded brown eruptive columns that rose straight up, reaching up to ~1.5 km above the summit. During 1925 to 1930, the eruption gradually stopped. Around this time, ash fell on several villages including Umbulharjo, Kepuharjo, Sidorejo, and Balerante, areas located ~6–7 km to the S of Merapi.
During 14-20 March 2014, thick gas plumes rose to ~600 m above the summit. On 17 March, the BPPTK recorded one such event at 0530.
On 27 March 2014, an eruption lasted from 1312 to 1316 LT. The VAAC detected volcanic ash to ~9.8 km altitude, using multi-spectral MTSAT-2 imagery, and the Aviation Color Code was raised to Red. A pilot reported that the "large ash cloud [was] moving NW." Darwin VAAC received a SACS SO2 alert at 2150 for the plume, and atmospheric SO2 gas was detected SE of Merapi. By 2232, the volcanic ash appeared to be dissipating; the advisory was terminated at 0830 on 28 March.
The 27 March eruption was the subject of a Jakarta Post news article by Muryanto and Ayuningtyas (2014), who indicated that ash fell in the Kemalang and Balerante Klaten regency and that it was 1 mm thick in some areas. The article also noted an M 5.4 tectonic earthquake that struck ~115 km SE of Malang regency, East Java on 23 March. The ash discharge had apparently been occurring regularly since the 2010 eruption but authorities had not taken this as a sign of an escalation in activity, and they urged locals to remain calm. However, according to the article, Sukiman, a resident of the nearby Deles district, said villagers responded to half an hour of ash falling by hitting "kentongan [bamboo drums] to warn others of the danger."
On 15 April, BPPTK reported that a thick white plume rose to a maximum of 300 m above the summit.
Several tectonic earthquakes occurred in April 2014. On 18 April at 2033, BPPTK recorded tectonic earthquakes 151 km SW of Merapi at a depth of 10 km. On 19 April, four more tectonic earthquakes occurred between 0800 and 2000, and an earthquake lasting 20 minutes was recorded at 0421 from a station on the peak of Merapi. On 20 April from 0426 to 0440, rumbling could be heard within a radius of 8 km around the volcano.
The BPPTK reported that on 20 April at 1600, an ash plume traveled W towards the village of Sewukan, amid foggy conditions. The associated eruption was followed by a widely heard roar and a later thin-to-thick plume rose to 400 m above the summit at 1800. The activity ultimately led to ashfall in Sewukan and in sectors to the SE, S, and SW, up to 15 km away from Merapi's summit.
The ash from this eruption was also detected by Darwin VAAC, who stated that the ash plume rose to ~10.7 km and extended ~260 km W to NW. The ash was difficult to distinguish from meteorological clouds, and at 1004 LT on 21 April, the VAAC terminated the advisory. In a news article, Minggu (2014) added further details on the eruption omitted here.
The BPPTK conducted a field expedition on 22 April to Merapi's crater. The expedition found that the eruption on 20 April had changed the summit crater morphology (figure 63). The slit that cut through the lava dome trending NE had widened by 70 m to the W, and reddish material that the team judged as indicative of oxidation was visible around the center of the lava dome. They also found new eruptive products along the crater's W side and evidence of new growth at the lava dome.
The BPPTK reported that monitoring outposts heard as many as 47 thumping sounds between 25 April and 1 May 2014, 20 sounds between 2 and 8 May, and 22 sounds between 9 and 15 May. On 25 April at 0740, a white, fumarolic plume rose to a maximum of 450 m above the summit, heading W, and the hazard status was raised to Alert (II). White, thin-to-thick plumes rose above the summit to 650 m on 2 May at 0700; to 350 m on 12 May at 0606; to 450 m on 22 May at 1924; to 300 m, heading W, on 27 May at 1854; and to 400 m on 31 May at 2010. The hazard status was lowered to Normal (I) during 21–27 May.
On 4 July 2014 at 1754, BPPTK observed thin-to-thick white plumes rising to 450 m above the summit.
On 10 September at 2008, thin, white plumes rose to 200 m above the summit, according to BPPTK.
During 10 to 16 October, Merapi released a thin white plume to ~200 m above the summit. The Darwin VAAC noted that small rock avalanches extended for ~1 km.
For 2014, BPPTK noted the seismicity (figure 64), EDM linear length (figure 65), and tilt (figure 66).
Background. Several detailed maps of Merapi have been published by various sources. Handisantono and others (2002) contains a topographic hazard map of Merapi. The map includes the location of several villages mentioned in this report, as wells as rivers and other geological landmarks. BNPB also published a map of Merapi (figure 67). The map highlights the location of the W/SW/S-flank drainage systems, which have the potential to funnel lahars to local infrastructure such as bridges and into inhabited areas.
A detailed analysis of Merapi's history and periods of activity is documented by CVGHM (2014). The ongoing magmatism and volcanism at Merapi are considered consistent with documented copper, zinc, and lead enrichment as well as zonation there (Nadeau and others, 2013).
References.
Badan Nasional Penanggulangan Bencana (BNPB), date unknown, Peta Zonasi Ancaman Banjir Laha Dingin, Relief Web (URL: http://reliefweb.int/sites/reliefweb.int/files/resources/E0676C85D7612CE1852578340054FD68-map.pdf) [accessed in April 2015]
CVGHM, 2014, G. Merapi, Jawa Tengah, 03 June 2014, Center for Volcanology and Geological Hazard Mitigation (URL: http://www.vsi.esdm.go.id/index.php/gunungapi/data-dasar-gunungapi/542-g-merapi) [accessed in April 2015]
Hadisantono, R.D., Andreastuti, M.CH.S.D., Abdurachman, E.K., Sayudi, D.S., Nurnusanto, I., Martono, A., Sumpena, A.D., Muzani, M., 2002, Peta Kawasan Rawan Bencana Gunungapi Merapi, Jawa Tengah Dan Daerah Istimewa Yogayakarta (Volcanic Hazard Map of Merapi Volcano, Central Java and Yogyakarta Special Province), Center for Volcanology and Geological Hazard Mitigation (URL: http://www.vsi.esdm.go.id/galeri/index.php/Peta-Kawasan-Rawan-Bencana-Gunungapi-01/Wilayah-Jawa/KRB-G_-Merapi) [accessed in April 2015]
Minggu, 2014, Mt. Merapi rumbles spewing volcanic material to nearby areas, 20 April 2014, Antara News (URL: http://www.antaranews.com/en/news/93713/mt-merapi-rumbles-spewing-volcanic-material-to-nearby-areas) [accessed in April 2015]
Muryanto, B., Ayuningtyas, K., 2013, Hundreds of villagers flee Mount Merapi eruptions, 19 November 2013, The Jakarta Post (URL: www.thejakartapost.com/news/2013/11/19/hundreds-villagers-flee-mount-merapi-eruptions.html) [accessed in April 2015]
Muryanto, B., Ayuningtyas, K., 2014, Mount Merapi spews sulfuric gas, ash, 11 March 2014, The Jakarta Post (URL: www.thejakartapost.com/news/2014/03/11/mt-merapi-spews-sulfuric-gas-ash.html) [accessed in April 2015]
Nadeau, O., Stix, J., Williams-Jones, A.E., 2013, The behavior of Cu, Zn and Pb during magmatic–hydrothermal activity at Merapi volcano, Indonesia, 29 March 2013, Chemical Geology Volume 342 (URL: www.sciencedirect.com/science/article/pii/S0009254113000466)
Yahya, A., 2013, Mount Merapi Status Remains Normal Despite Weak Eruptions, 22 July 2013, Bernama (URL: http://www.bernama.com/bernama/v7/ge/newsgeneral.php?id=965338) [accessed in April 2015]
Geologic Background. Merapi, one of Indonesia's most active volcanoes, lies in one of the world's most densely populated areas and dominates the landscape immediately north of the major city of Yogyakarta. It is the youngest and southernmost of a volcanic chain extending NNW to Ungaran volcano. Growth of Old Merapi during the Pleistocene ended with major edifice collapse perhaps about 2,000 years ago, leaving a large arcuate scarp cutting the eroded older Batulawang volcano. Subsequent growth of the steep-sided Young Merapi edifice, its upper part unvegetated due to frequent activity, began SW of the earlier collapse scarp. Pyroclastic flows and lahars accompanying growth and collapse of the steep-sided active summit lava dome have devastated cultivated lands on the western-to-southern flanks and caused many fatalities.
Information Contacts: Balai Penyelidikan dan Pengembangan Teknologi Kegunungapian (BPPTK), Pusat Vulkanologi dan Mitigasi Bencana Geologi (PVMBG) (URL: http://merapi.bgl.esdm.go.id/); Darwin Volcanic Ash Advisory Centre (VAAC) (URL: http://www.bom.gov.au/info/vaac/); and Center for Volcanology and Geological Hazard Mitigation (CVGHM, Pusat Vulkanologi dan Mitigasi Bencana Geologi), Badan Geologi, Kementerian Energi dan Sumber Daya Mineral (ESDM), Yogyakarta 55166, Indonesia (URL: http://www.vsi.esdm.go.id/).
Sinabung (Indonesia) — October 2014 Cite this Report
Sinabung
Indonesia
3.17°N, 98.392°E; summit elev. 2460 m
All times are local (unless otherwise noted)
Frequent eruptions, pyroclastic flows, and advancing lava-flow lobe during May-October 2014
On the basis of ash-plume reports from the aviation community around the time of this reporting, Sinabung ranked as the most active volcano in Indonesia, the world's fourth-most populated country. The volcano is located in the Karo Regency of N Sumatra (figure 19). The latest eruption began mid-September 2013; activity through April 2014 was reported in BGVN 39:01. This report describes the continuing volcanic activity from May 2014 through October 2014, primarily drawn from reports issued by the Indonesian Center of Volcanology and Geological Hazard Mitigation (CVGHM) and reports from the Darwin Volcanic Ash Advisory Centre (VAAC). During this reporting interval, many photographs of Sinabung emerged online, some with outstanding information content, but far too numerous to either catalog or feature here.
The Darwin VAAC describes their jurisdiction as covering ~150 active volcanoes located in the South Pacific region from the Philippines to the Solomon Islands, including Indonesia. They issued 1,511 Volcanic Ash Advisories (VAAs) during the 12-month period, 1 July 2013 to 30 June 2014 (their fiscal year 13/14; Darwin VAAC, 2014). During the next 7-month interval (ending 31 January 2015) the VAAC issued 742 reports (Darwin VAAC, 2015). These VAAs are part of their mission to create materials for warning and guidance to the aviation community, including aviation meteorologists, air traffic control offices, and airlines (e.g. dispatchers and pilots).
One way to assess the production of noteworthy ash plumes at volcanoes is to consider the number of VAAs issued, an assessment found in their Management Reports (Darwin VAAC, 2014; 2015). The Darwin VAAC issued Management Reports that both cover and extend beyond (i.e., both earlier and later than) this reporting interval (May to October 2014). Specifically, their reports cover 1 July 2013-30 June 2014 and 1 July 2014-31 January 2015. In both those intervals the largest number of VAAs issued for any single volcano in their region went to Sinabung. In the earlier interval this consisted of 537 out of 1,511 total regional reports; in the later interval, 321 out of 742 total regional reports.
The table in the section "Data compilation" at the bottom of this report also highlights a case at 12:32 UTC on 22 May 2014 of a rapidly growing cloud around Sinabung plausibly associated with an eruption there. The cloud reached ~15.2 km altitude and was initially assessed as eruptive and ash bearing. At the time forecasters felt there was sufficient evidence the cloud contained ash to warrant an advisory. A more detailed assessment made later determined the cloud to probably have been a cumulonimbus cloud (abbreviated Cb; a towering vertical dense cloud often associated with thunderstorms and atmospheric instability). The case illustrates the challenge of creating VAAs rapidly with limited information and time for analysis, balanced against the desire for high accuracy (with low rates of false positives and false negatives). Darwin VAAC (2015) also described the region as one with "...moist tropical convection that makes remote sensing difficult for much of the year."
During the reporting interval, Sinabung was the scene of both lava flows and vigorous dome-building eruptions that discharged significant ash plumes and pyroclastic flows (PFs). Lava flows constructed a several kilometer long tongue or lobe of lava on the flank to the S-SE. These events accompanied elevated seismicity.
During the reporting interval the Aviation Colour Code (ACC) issued by the VAAC was generally Orange; however, during the week of 15-21 October, the ACC was Red.
The ACC is a four-color scale used to inform the needs of the aviation community. The four colors denoting increasing risk are Green, Yellow, Orange, and Red. According to the World Organization of Volcano Observatories' website, Orange connotes "Volcano is exhibiting heightened unrest with increased likelihood of eruption." Red connotes "Eruption is forecast to be imminent with significant emission of ash into the atmosphere likely."
The CVGHM uses a separate volcanic hazard status code to warn people in the region. The Darwin VAAC Weekly report issued for 29 October-4 November 2014 gave this overview of the eruption and the variation in CVGHM's volcanic hazard status: "On 14 September 2013, a new eruptive phase began. By mid-October the volcano was degassing almost daily with small phreatic eruptions. Seismic and visual activity continued to build into November. After nine powerful explosions in a 24 hour period, the Centre for Volcanology and Geological Hazard Mitigation (CVGHM) raised the Alert level to Level IV on 24 November 2013, the highest volcano rating. The status was decreased to Alert Level III on 8 April 2014."
During this reporting interval, lava flows advanced in the sector S- SE from the summit (figure 20). In accord with that lobe or tongue of lava, incandescent zones were at various times noted in different parts of the flows. As reported by CVGHM, avalanches from the front of the advancing lava flows occurred often. Scientists associated this process with a distinct seismic signal called an avalanche earthquake. CVGHM repeatedly warned residents that the lava flows and their associated avalanches could threaten areas to the S and SE within 5 km of the summit. Measurements of the length of this flow are included in the table at the bottom of this report. A previous map with clearer labels of the earlier flows appears as figure 16 in BGVN 39:01.
Seismicity at Sinabung included avalanche earthquakes, low-frequency earthquakes, tectonic earthquakes, volcanic earthquakes and ongoing tremor. Totals and measured averages of these seismic events are included when available (see table at bottom). CVGHM reported that the dominating seismic signals, avalanche earthquakes and intervals of constant tremor, were associated with the instability of the growing lava dome and lava flows.
During this reporting interval, numerous eruptions took place, often generating ash plumes and in some cases pyroclastic flow. During the eruptions, some ash plumes were detected by satellite imagery. Ground-based observations were also important. For example, CVGHM often detected Sinabung eruptions, PFs, and plumes via webcam. Darwin VAAC also benefited from the CVGHM webcam data in several of their VAAs. The VAAC has also begun to use social media to both dispense and retrieve operationally relevant information (Darwin VAAC, 2015). This has aided VAAC forecaster's understanding of, for example, whether residents have noticed ashfall during times when ash is not discernable due to meteorological clouds (Darwin VAAC, 2015).
During May and October 2014, PFs had runout distances up to 4.5 km and ash plumes rose up to 5.2 km altitude. White or slightly discolored plumes were the most common type reported by CVGHM. These plumes sometimes rose to as high as on the order of 1 km over the summit.
Figure 21 is a map of Sinabung and towns surrounding the volcano.
Photographs. The following are photos documenting events at Sinabung during this reporting interval. Ancillary information pertaining to each photo can be found in a table at the bottom of this report.
Data compilation. Table 4 summarizes activity at Sinabung from May-October 2014. Data sources include reporting by CVGHM (often the original source), the Darwin VAAC (their Volcanic Ash Advisories (VAAs), Weekly Activity Reports; and other reports), the Indonesian National Agency for Disaster Management (Badan Nacional Penanggulangan Bencana-BNPB), occasional news articles; and the Smithsonian-USGS Weekly Volcanic Activity Reports.
Table 4. A synthesis of Sinabung's reported activity from May-October 2014. The bulk of this table came from CVGHM and Darwin VAAC reporting unless otherwise stated. Dates and times are in some cases ambiguous as to local time (LT) or UTC (LT = UTC + 7). Abbreviations: pyroclastic flow, PF; Aviation Color Code, ACC; earthquake(s), EQ(s); maximum amplitude, max. amp.; and altitude, alt.
| Week |
Remarks |
| 30 Apr-20 May 2014 |
ACC: Orange |
| 21 May-31 May 2014 |
ACC: Orange
22 May: At 1132 UTC, Darwin VAAC noted a suspicious, possibly ash bearing cloud around Sinabung in a MTSAT-2 IR image. In retrospective analysis, Darwin VAAC concluded the cloud was the beginning of a cumulonimbus (Cb) cloud forming due to atmospheric instability in the area (unrelated to the eruption). For more information, see text and the 21-27 May 2014 issue of the Darwin Weekly Activity Report.
26 May: Ash plume observed at 0132 UTC on MTSAT-2 satellite imagery. Plume extended 28 km SE at 3.4 km alt. Plume observed via webcam. Similar length ash plume again observed by satellite at 0432 UTC on 27th. VAA ended after plume no longer visible. |
| 01 Jun-17 Jun 2014 |
Lava flow associated with dome growth. S and SE flank lava avalanches. Columns of white plumes rose 100-400 m over crater. Seismicity dominated by avalanche EQs and tremor, both associated with instability of dome and lava flows. 13th: Lava flow: ~2.796 km long. |
| 18 Jun-28 Jun 2014 |
Visual monitoring from ~10 km ESE from summit (Post PGA Sinabung located in Ndokum Siroga village) confirmed ongoing dome growth and glowing areas of the lava flow. Avalanches from the flow front seen.
18-24th: Seismicity dominated by avalanche signals; minor deformation. |
| 29 Jun 2014 |
CVMGH reported an eruption with a 4 km alt. ash plume. PF flows traveled 4.5 km SE. Ashfall noted in settlements of Sigarang-Garang and Sukanalu (figure 21). Earthquakes reached high (105 mm) amplitude for 64 minutes. Dome growth continued. A Xinhua news report from 29 June 2014, noted a reporter's telephone interview with a CVGHM authority; the basis for the article's claim of up to 14,382 people still evacuated. |
| 30 Jun-15 Jul 2014 |
8-14th: Real-time Seismic Amplitude Measurement (RSAM) values from 8-15th remained steady. SO2 flux: 1,252 metric tons/day. Dome growth and lava flows continued.
8 Jul: Thick white plume 100-200 m above summit. 38 avalanche EQs (max. amp. 2-70 mm).
9 Jul: Thick bluish plume to 100 m above summit. 54 avalanche EQs; continuous tremor (max. amp. 2-53 mm).
10 Jul: PF traveled up to 3 km S. Plumes of blue and brown color rose 200-2000 m above summit. 52 avalanche EQs and continuous tremor (max. amp. 2-53 mm.).
11 Jul: Thick white plume 300-1000 m above summit. 59 avalanche EQs; continuous tremor (max. amp. 2-52 mm).
12 Jul: Eruption at 2305; a PF moved ~4 km E. Ashfall at several places around Karo district. Maximum height of eruption column indeterminate. 88 avalanche EQs; 2 deep volcanic (VA) EQs. Continuous tremor (max. amp. 2-66 mm). No further evacuations reported.
13 Jul: Thick white plume to 400 m over summit. 92 avalanche EQs; 1 deep volcanic (VA) EQ. Continuous tremor (max. amp. 2-45 mm).
14 Jul: Lava flow: 2.824 km long. Thick white to bluish plume to 200 m above summit. 83 avalanche EQs; 3 deep volcanic (VA) EQs; continuous tremor (max. amp. 2-62 mm). 15th (until 0600LT): 34 avalanche EQs; continuous tremor (max. amp. 2-42 mm). |
| 16 Jul-29 Jul 2014 |
23 Jul: Molten lava captured in photo posted by CVGHM at 2207 on 22 July 2014 UTC. No ash identified on satellite imagery. No Volcanic Ash Advisories (VAAs) issued. |
| 23 Jul-29 Jul 2014 |
ACC: Orange |
| 13 Aug-19 Aug 2014 |
ACC: Orange
13 Aug: 94 avalanche EQs; 2 deep volcanic EQs; 2 deep tectonic EQs; and continuous tremor. Lava ~1000-1500 m from summit moving SE.
14 Aug: PFs at 0728UTC and 0750UTC (figure 22). PFs traveled 1-1.5 km. White plumes rose 300-1000 m above the summit. 102 avalanche EQs; 3 deep volcanic EQs; and continuous tremor. Lava flow: ~2.904 km long. |
| 20 Aug-26 Aug 2014 |
ACC: Orange
20-23 Aug: White plumes rose 100-300 m over crater. Continuous tremor. Avalanche EQs reported on 20-21 and 23 Aug.
22 Aug: PFs traveled 1.5 km to SE. 3 deep volcanic EQs recorded.
23 Aug: 3 southerly moving PFs observed. (1) 0356 UTC, and travelling 2 km; (2) 1140 UTC, and travelling 2 km; (3) 0409 UTC and traveled 1.5 km. |
| 27 Aug-02 Sep 2014 |
ACC: Orange
29 Aug: PF traveled 1.5 km to SE. Time of PF is unknown.
2 Sep: PF at 0940 UTC traveled a distance of 1.5 km SE (figure 23). |
| 03 Sep-09 Sep 2014 |
ACC: Orange
5-11 Sep: White plumes, appeared bluish on some days, rose 50-500 m over crater. Avalanche EQs (average of 96 events/day), low frequency EQs (average of 75 events/day), deep tectonic EQs, and deep volcanic EQs often recorded. Avalanches, travelling various distances observed moving SE and S.
6 Sep: Lava flow: 2.915 km long (figure 20).
7 Sep: Eruption at 1358 UTC that lasted 19 minutes. Plume rose 2 km above summit and ash from plume blown S (figure 24). Eruption's PFs traveled max distances of 2 km to SE. 1 eruption earthquake noted. |
| 10 Sep-16 Sep 2014 |
10-16 Sep: RSAM stable.
12-16 Sep: White plumes rose 100-1000 m over crater. On occasions, the plumes had a bluish tint.
12 Sep: Ash plume on webcam moving E/NE at 0140 UTC. Plume not identifiable on satellite imagery due to overlying clouds. Plume height of 3.7 km alt. (based on model data). Advisory terminated on UTC 13th at 0732 after satellite imagery indicated ash had dissipated.
15 Sep: PF traveled 2.5 km to SE. |
| 17 Sep-23 Sep 2014 |
ACC: Orange
12-20 Sep: Average total of avalanche EQs was 110 events/day, average for volcanic EQs was 1 event/day, average for low frequency EQs was 75 events/day and tremor was continuously recorded.
17-20 Sep: White (sometimes bluish) plumes rose 100-200 m; RSAM stable. 18th: PFs reached 2 km to S. |
| 24 Sep-30 Sep 2014 |
ACC: Orange
24 Sep: Eruption at 1343 emitted hot ash and gravel. Eruption lasted ~15 minutes and a PF descended ~2 km from summit. Eruption column height could not be determined. 4,700 residents remain in evacuation centers.
30 Sep: Eruption at 1720 sent volcanic ash 2 km above the summit. A PF traveled 3.5 km from summit; PF's direction was unstated. Recent eruptions covered settlements and agricultural lands around Sinabung with ash. News sources noted that farmers harvested their crops early to reduce losses. |
| 01 Oct-07 Oct 2014 |
5 Oct: Four eruptions took place. (1) 0146: volcanic ash sent 2 km over crater and a PF moved max distance of 4.5 km S; (2) 0638: PFs traveled 2.5 km S; (3) 0736: PFs traveled 3 km S; and (4) 0753: eruption column with ash rose 3 km and PFs traveled 4.5 km S. No additional refugees were reported. Two other eruptions that caused PFs were reported at 0900 and 1200.
6 Oct: Low-level eruption observed on webcam starting at 0120 UTC. Eruption plume moved E and a PF also seen moving below the summit.
7 Oct: Volcanic ash at 5.2 km alt. moving S. Ash not identifiable in satellite imagery. |
| 08 Oct-14 Oct 2014 |
ACC: Orange
8 Oct: At 0543 UTC, an initial VAA issued for an in-progress eruption. Eruption first noted through webcam, but no ash was seen in satellite imagery. Eruption produced a 4.9 km eruption column and a PF (both were observed by webcam at 0543 UTC) (figure 25). Another eruption observed at 2336 UTC by webcam.
9 Oct: A low-level plume moving NE seen in satellite imagery at 0332 UTC. According to a 0531 UTC VAA, several eruptions were observed over the last 6 hours via webcam. Darwin VAAC weekly report noted that eruption from 8th reached the provincial capital Medan and disrupted flights on the 9th.
10 Oct: Eruption was observed via webcam at 0200 UTC and through satellite imagery at 0132 UTC. In the imagery from 0132 UTC, an eruption plume extended 30 NM NE. Volcanic ash was noted at 0335 UTC in satellite imagery and was last seen at 0632 UTC extending 30 NM NE.
11 Oct: Webcam captured a 3 km ash plume drifting SW.
12 Oct: Volcanic ash on webcam at 0030 UTC to SE at 3.1 km alt. Volcanic ash was again observed at 0600 UTC via webcam.
14 Oct: Ash plume recorded by webcam rising 4 km and moving SW. |
| 15 Oct-21 Oct 2014 |
ACC: Red
15 Oct: At 0036 UTC, an eruption took place that sent ash 500 m over crater and a PF 2.5 km (direction unstated). At 0200 UTC, Sinabung was observed on webcam to 4.3 km alt. Eruption column moved N. Continuous small eruptions seen via webcam, during daylight hours.
17 Oct: Ash rose to ~ 3.7 km alt. In photos taken by a pilot, ash seen extending ~15 mi to W of Sinabung. On ground, PF extended 3.5 km and ash was thrown up 2.5 km, according to a picture taken at 0409 UTC.
19-20 Oct: Eruption columns seen via both ground-based and aerial images (figure 26) |
| 22 Oct-28 Oct 2014 |
ACC: Orange
23 Oct: Eruption observed via webcam. Eruption column rose to 4.3 km alt. and extended 10 NM to N at 0400 UTC.
25 Oct: Eruption at 0249 UTC seen via webcam. Volcanic ash at 4.6 km alt. identifiable through satellite images from 0332 UTC. Plume extended 15 NM to W-NW. Eruptions also seen via webcam at 1000 UTC and 2312 UTC. In a 2331 UTC VAA, ash plume reported at 3 km and drifting E based on webcam.
26 Oct: Activity reported as high. PFs traveled 3.5 km S on two occasions and an ash plume rose 2 km over crater. Lava moved distances of 700-1000 m from summit.
27 Oct: Eruption at 1013 UTC seen via webcam. BNPB reported ~3,000 people remained in evacuation shelters. |
| 29 Oct-30 Oct 2014 |
ACC: Orange |
References. Associated Press, 2014, Volcano in Western Indonesia erupts again, accessed on 28 September 2014, (URL: http://abcnews.go.com/International/wireStory/volcano-western-indonesia-erupts-25720623 )
Darwin VAAC, (6 August) 2014, VAAC Darwin Management Report [discussing 1 July 2013 to the 30 June 2014], International Civil Aviation Organization (ICAO); Eighteenth Meeting of the Meteorology Sub-Group (Met Sg/18) Of Apanpirg; ICAO Regional Sub-Office, Beijing, China; 18–21 August 2014 [Agenda Item 7.4: Research, development and implementation issues in the MET field, [7.4] Advisories and warnings, MET SG/18 - IP/17; Agenda Item 7.4; 6 August 2014; (Presented by Australia)]; 5 pp. (URL: http://www.icao.int/APAC/Meetings/2014 METSG18/IP17_AUS AI.7.4 - VAAC Darwin Management.pdf )
Darwin VAAC, (18 February) 2015, Darwin VAAC Management Report [discussing 1 July 2014-31 January 2015], International Civil Aviation Organization (ICAO), Fifth Meeting of Meteorological Hazards Task Force (MET/H TF/5), Seoul, Republic of Korea, 18 March 2015 [Thirteenth Meeting of the Asia/Pacific Regional Opmet Bulletin Exchange Working Group (Robex Wg/13), ROBEX WG/13 & MET/H TF/5 – WP/C6; Agenda Item (conjoint session) 2 (Presented by Australia)] (URL: http://www.icao.int/APAC/Meetings/2015 ROBEXWG13/WP-C6 - AI.2 - AUS - Darwin VAAC Management Report.pdf )
Indonesian National Agency for Disaster Management (Badan Nacional Penanggulangan Bencana-BNPB), 2014, Four time Sinabung, Normal Community Activity, accessed on 6 October 2014, (URL: http://bnpb.go.id/berita/2211/empat-kali-sinabung-meletus-masyarakat-beraktivitas-normal)
The Jakarta Post/Asia News Network, 2014, Mount Sinabung erupts again, accessed on 6 October 2014, (URL: http://news.asiaone.com/news/asia/mount-sinabung-erupts-again)
Okezone.com, 2014, accessed on 28 September 2014, (URL: http://news.okezone.com/read/2014/10/01/340/1046715/hujan-abu-gunung-sinabung-guyur-karo-petani-menderita )
Pixshark.com, accessed on 7 April 2015 (URL: http://pixshark.com/peta-gunung-sinabung.htm)
World Organizations of Volcano Observatories (WOVO), Aviation Colour Codes, accessed on 8 April 2015, (URL: http://www.wovo.org/aviation-colour-codes.html)
Xinhua News Agency, 2014, 2nd LD Writethru: Mount Sinabung in Indonesia erupts, triggering massive evacuation, accessed on 29 June 2014, (URL: http://www.globalpost.com/article/6190943/2014/06/29/2nd-ld-writethru-mount-sinabung-indonesia-erupts-triggering-massive)
Xinhua News Agency, 2014, Mount Sinabung erupts in Sumatra, Indonesia, accessed on 28 September 2014, (URL: http://english.cntv.cn/2014/09/24/ARTI1411549583755731.shtml).
Geologic Background. Gunung Sinabung is a Pleistocene-to-Holocene stratovolcano with many lava flows on its flanks. The migration of summit vents along a N-S line gives the summit crater complex an elongated form. The youngest crater of this conical andesitic-to-dacitic edifice is at the southern end of the four overlapping summit craters. The youngest deposit is a SE-flank pyroclastic flow 14C dated by Hendrasto et al. (2012) at 740-880 CE. An unconfirmed eruption was noted in 1881, and solfataric activity was seen at the summit and upper flanks in 1912. No confirmed historical eruptions were recorded prior to explosive eruptions during August-September 2010 that produced ash plumes to 5 km above the summit.
Information Contacts: Indonesian Center of Volcanology and Geological Hazard Mitigation (CVGHM) (also known as Pusat Vulkanologi dan Mitigasi Bencana Geologi-PVMBG), Jalan Diponegoro 57, Bandung 40122, Indonesia (URL: http://vsi.esdm.go.id/); Indonesian National Agency for Disaster Management (Badan Nacional Penanggulangan Bencana-BNPB), Gedung Graha 55 Jl. Tanah Abang II No. 57, 10120, Jakarta Pusat (URL: http://www.bnpb.go.id/); and Darwin Volcanic Ash Advisory Centre (VAAC), Bureau of Meteorology, Northern Territory Regional Office, PO Box 40050, Casuarina, NT 0811, Australia (URL: http://www.bom.gov.au/info/vaac/).