On 27 March the Vanuatu Meteorology and Geohazards Department (VMGD) reported that minor unrest continued at East Epi during March. No activity was observed above the ocean surface by communities of Epi and neighboring islands, though signs of continuing volcanic unrest was detected in seismic data. The Alert Level remained at 1 (on a scale of 0-5) and the public was warned to stay outside of the Danger Zone, defined as a 2-km radius around the active submarine vent.
Source: Vanuatu Meteorology and Geohazards Department (VMGD)
Explosions during late January-February 2023 above the ocean surface; pumice rafts
The East Epi group, consisting of multiple submarine cones within a postulated caldera, lies off the eastern coast of Epi Island in Vanuatu (figure 6). Three cones (Epi A, B, and C) are located 4-10 km NNE from the Epi Island, with additional smaller cones south of Epi B (figure 7). Ephemeral islands were formed during eruptions in 1920 and 1953. Explosive activity was reported in 1958 and 1960, discolored water was often seen during 1971-1974 and 1988, a new vent was detected in 1979, and explosive activity occurred in February 1999, March 2002, and February 2004. A March 2004 bathymetric survey revealed that Epi B was about 300 m tall with a diameter of about 1.8 km at the base; the summit crater was about 150 m in diameter, the crater floor was at a depth of 90 m, and the highest point was on the NW rim of the summit crater, at a depth of 34 m. This report covers a new eruption during January through February 2023 that was characterized by phreatic explosions, a growing cone, and ash emissions. Information primarily comes from the Vanuatu Meteorology and Geo-Hazards Department (VMGD).
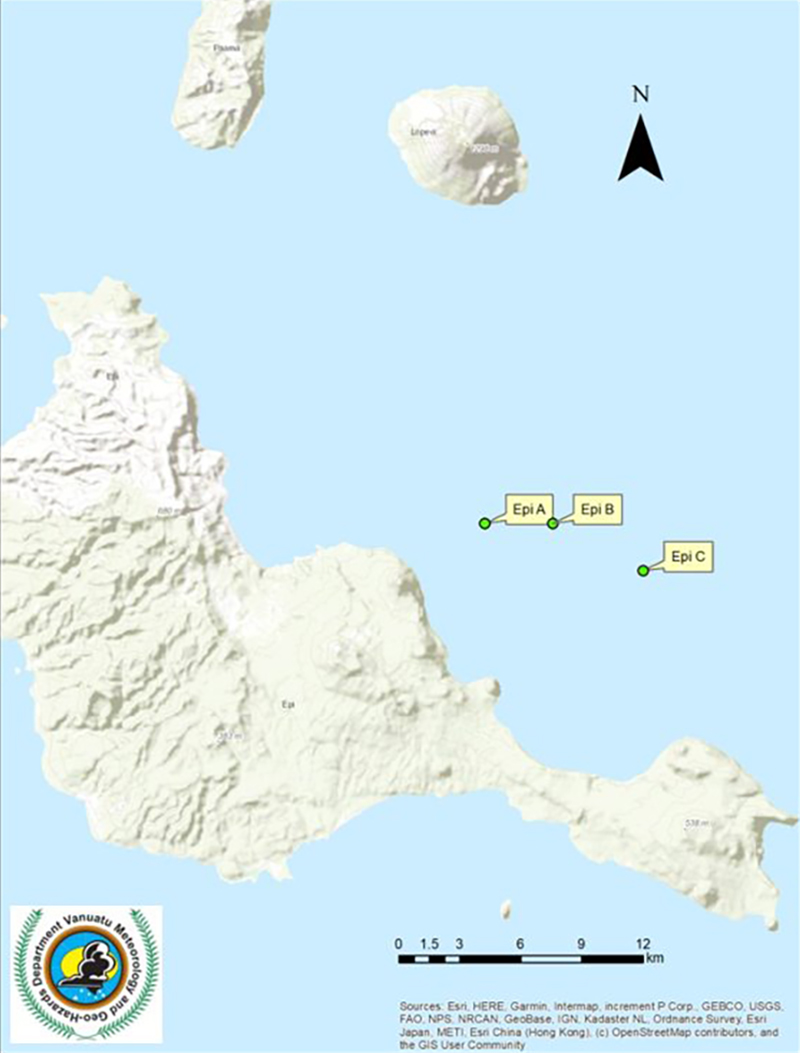 |
Figure 6. Location map showing the locations of the three main cones of the East Epi group (Epi A, Epi B, and Epi C) 4-10 km NNE of Epi Island. Epi B is the site of the 2023 activity. The small island ~16 km N of the cones (top center) is Lopevi volcano. Courtesy of VMGD. |
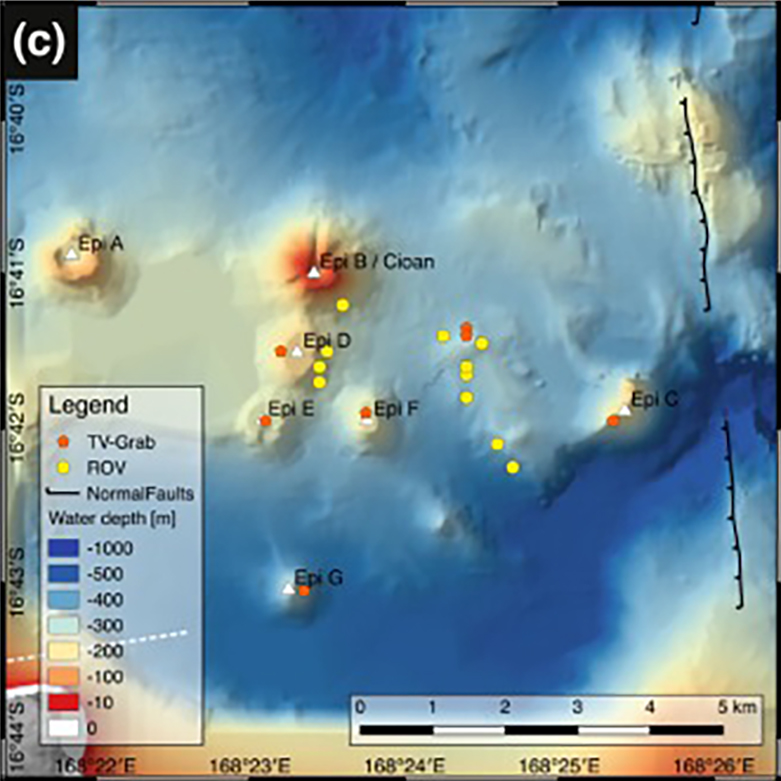 |
Figure 7. Detailed bathymetric map showing the submarine cones of the East Epi group from Beier at al. (2013, figure 1c). The bathymetric grid was compiled from GEBCO, high-resolution ship-based data from R/V Sonne cruise SO-229 (Haase et al., 2013), and digitized grids from VATATERM (Ballu and Calmant, 2004). |
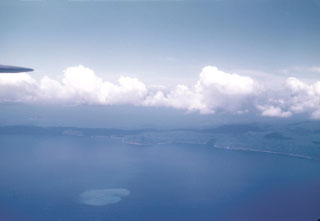
According to the Wellington VAAC, a low-level ash and sulfur dioxide plume was identified in satellite data at 0730 on 31 January 2023. VMGD reported that residents saw gas-and-steam emissions at the ocean’s surface around 0748 (figure 8) and phreatic explosions that ejected gas and tephra 100 m above the water (figure 9). Observers also reported that they saw a growing cone from ongoing ash emissions. The Wellington VAAC noted that the eruption was short-lived and had stopped by 1548 when the ash had dissipated. During an overflight on the afternoon of 31 January, gas-and-steam was observed rising from the ocean surface above Epi B, discolored water was visible around the eruption site, and pumice rafts were floating on the surface (figure 10). Several strands of pumice that drifted to the SW, NW, and N of Epi B were visible in Sentinel-2 satellite imagery on 2 and 14 February (figure 11). Gas-and-steam emissions were also visible at the surface for a few hours during 1 February. During 0700-1030 on 7 February residents observed minor, low-level gas-and-steam emissions above Epi B. The intensity of the gas-and-steam plumes varied, with stronger activity reported by local residents around 0600 on 8 February. On 23 February VMGD reported sustained seismicity and minor gas-and-steam plumes that only lasted a few hours.
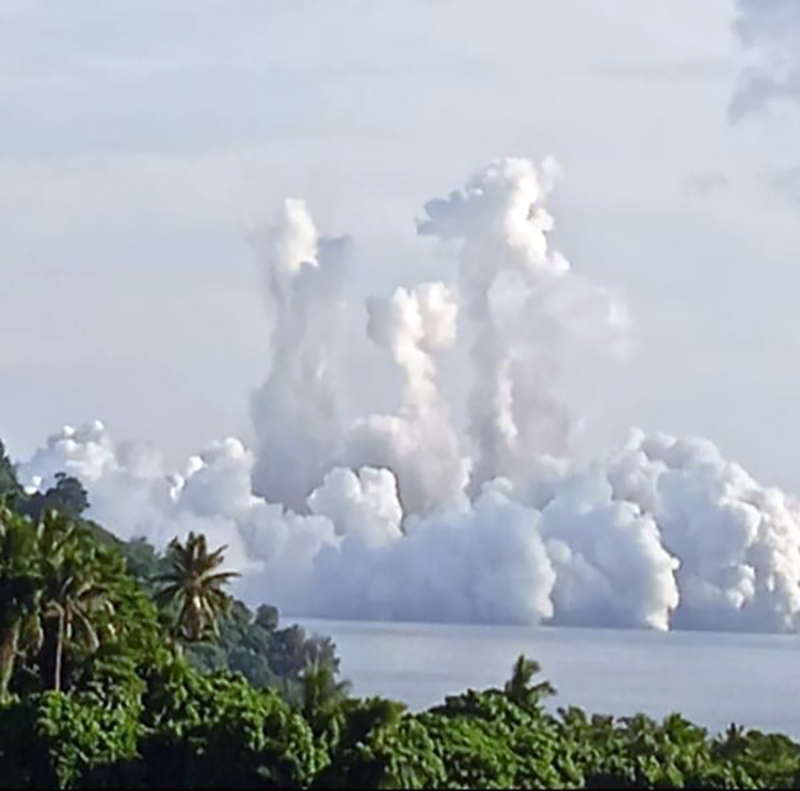 |
Figure 8. Photo of gas-and-steam plumes rising above East Epi on 31 January 2023 due to phreatic explosions. Photo by Mayline Leleny. Courtesy of VMGD. |
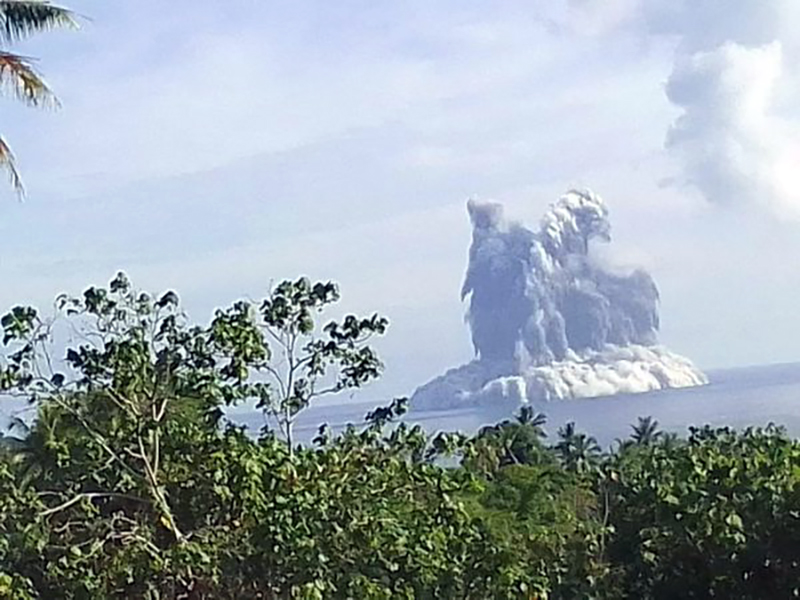 |
Figure 9. Photo of phreatic explosions and dark tephra ejected 100 m above East Epi on 31 January 2023. Photo by Mayline Leleny. Courtesy of VMGD. |
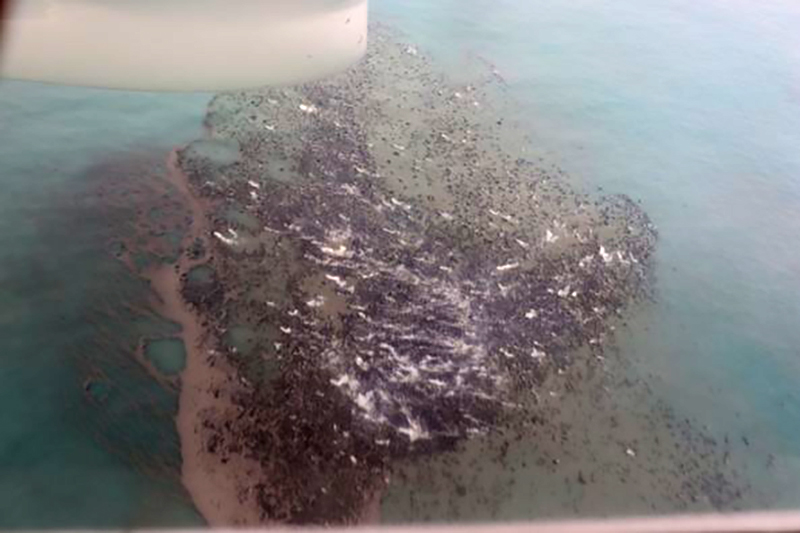 |
Figure 10. Aerial photo of pumice floating on the surface of the ocean during 31 January-1 February 2023 as a result of the phreatic explosions at East Epi on 31 January 2023. Photo has been color corrected. Courtesy of VMGD. |
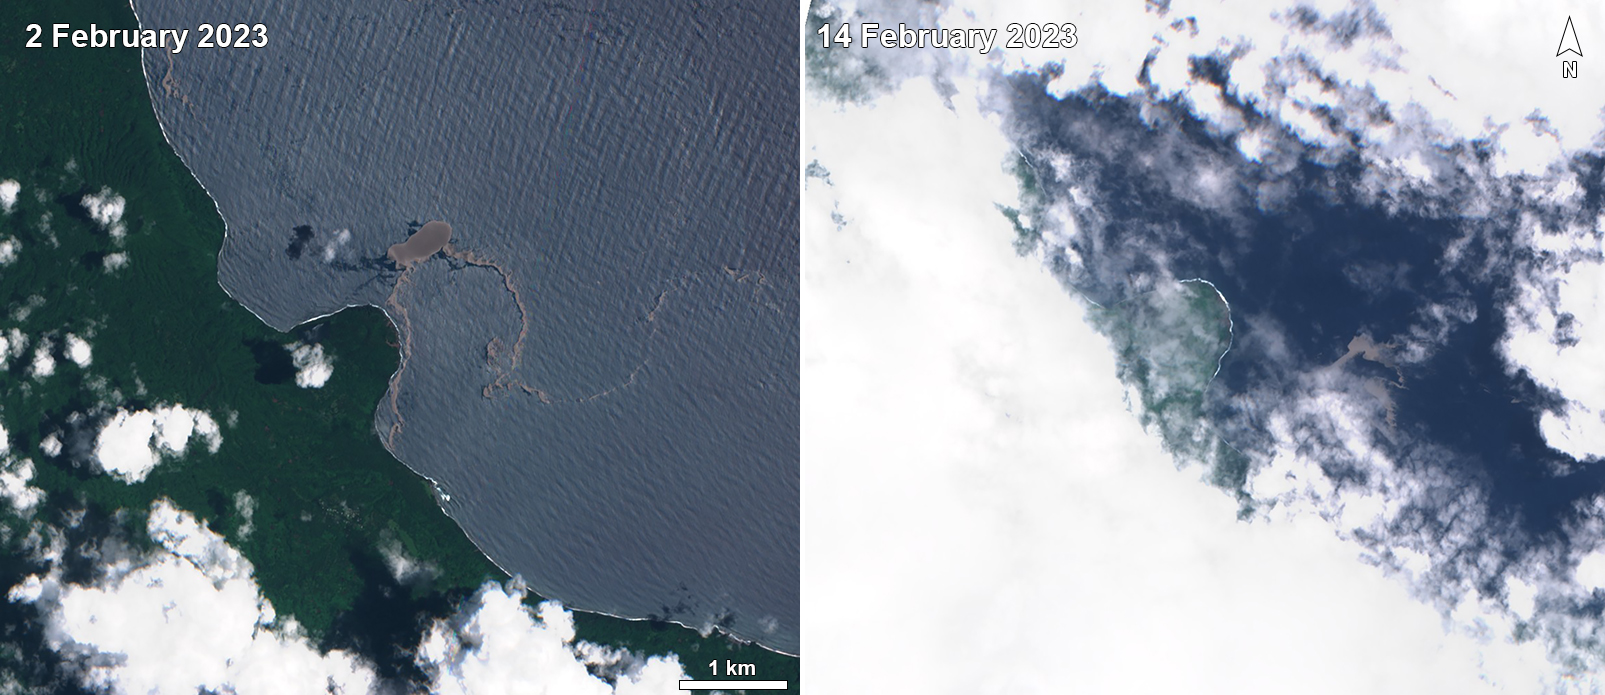 |
Figure 11. Sentinel-2 satellite images showing visible pumice rafts (dark gray) originating from East Epi that drifted SW and S toward Epi Island on 2 February (left) and 14 February 2023 (right). Images with “Natural color” rendering (bands 4, 3, 2). Courtesy of Sentinel Hub Playground. |
References. Ballu V, Calmant S, 2004. Campagne VATATERM du N.O. Alis au Vanuatu.
Beier C, Brandl P A, Lima S M, Haase K M, 2018. Tectonic control on the genesis of magmas in the New Hebrides arc (Vanuatu). Lithos, v. 312–313, p. 290-307. https://doi.org/10.1016/j.lithos.2018.05.011
Haase K M, Koschinsky A, Schwarz-Schampera U (Principal investigators for COVOLVE - COriolis VOLcanism and VEnts), and shipboard scientific party, 2013. Volcanism, hydrothermal activity and vent biology in the Coriolis Troughs, New Hebrides Island Arc; RV Sonne cruise SO-229, Cruise report / Fahrtbericht, 01.07.2013, Townsville (Australia) to 26.07.2013, Nouméa (New Caledonia). TIB – Leibniz Information Centre for Science and Technology and University Library, Erlangen, Germany. https://doi.org/10.2312/cr_so229
Information Contacts: Geo-Hazards Division, Vanuatu Meteorology and Geo-Hazards Department (VMGD), Ministry of Climate Change Adaptation, Meteorology, Geo-Hazards, Energy, Environment and Disaster Management, Private Mail Bag 9054, Lini Highway, Port Vila, Vanuatu (URL: http://www.vmgd.gov.vu/, https://www.facebook.com/VanuatuGeohazardsObservatory/); Wellington Volcanic Ash Advisory Centre (VAAC), Meteorological Service of New Zealand Ltd (MetService), PO Box 722, Wellington, New Zealand (URL: http://www.metservice.com/vaac/, http://www.ssd.noaa.gov/VAAC/OTH/NZ/messages.html); Sentinel Hub Playground (URL: https://www.sentinel-hub.com/explore/sentinel-playground).
2025: March
2023: January
| February
| August
| September
| October
| December
2004: March
On 27 March the Vanuatu Meteorology and Geohazards Department (VMGD) reported that minor unrest continued at East Epi during March. No activity was observed above the ocean surface by communities of Epi and neighboring islands, though signs of continuing volcanic unrest was detected in seismic data. The Alert Level remained at 1 (on a scale of 0-5) and the public was warned to stay outside of the Danger Zone, defined as a 2-km radius around the active submarine vent.
Source: Vanuatu Meteorology and Geohazards Department (VMGD)
On 4 December the Vanuatu Meteorology and Geohazards Department (VMGD) reported that minor unrest continued at East Epi during November. Volcanic seismicity was sustained, though no activity was observed above the ocean surface. The Alert Level remained at 1 (on a scale of 0-5) and the public was warned to stay outside of the Danger Zone, defined as a 2-km radius around the active submarine vent.
Source: Vanuatu Meteorology and Geohazards Department (VMGD)
The Vanuatu Meteorology and Geo-Hazards Department (VMGD) reported that minor unrest continued at Epi during October. Volcanic seismicity was sustained, though no surficial activity was observed. The Alert Level remained at 1 (on a scale of 0-5) and the public was warned to stay outside of the Danger Zone, defined as a 2-km radius around the active submarine vent.
Source: Vanuatu Meteorology and Geohazards Department (VMGD)
On 28 September the Vanuatu Meteorology and Geo-Hazards Department (VMGD) reported that minor unrest continued at Epi. Volcanic seismicity was sustained, though no surficial activity was observed. The Alert Level remained at 1 (on a scale of 0-5) and the public was warned to stay outside of the Danger Zone, defined as a 2-km radius around the active vent.
Source: Vanuatu Meteorology and Geohazards Department (VMGD)
On 31 August the Vanuatu Meteorology and Geo-Hazards Department (VMGD) reported that minor unrest continued at Epi. Volcanic seismicity was sustained, though no surficial activity was observed. The Alert Level remained at 1 (on a scale of 0-5) and the public was warned to stay outside of the Danger Zone, defined as a 2-km radius around the active vent.
Source: Vanuatu Meteorology and Geohazards Department (VMGD)
On 23 February the Vanuatu Meteorology and Geo-Hazards Department (VMGD) reported that minor unrest continued at Epi. Seismicity was sustained though there was only minor manifestation at the water’s surface; steaming at the surface lasting only a few hours at most was occasionally observed. The Alert Level remained at 1 (on a scale of 0-5) and the public was warned to stay outside of the Danger Zone, defined as a 2-km radius around the active vent.
Source: Vanuatu Meteorology and Geohazards Department (VMGD)
According to the Vanuatu Meteorology and Geo-Hazards Department (VMGD) an overflight of Epi was conducted during the afternoon of 31 January. Steam was observed rising from the ocean’s surface above Epi B, water around the eruption site was discolored, and rafts of pumice were floating on the surface following the currents. Several strands of pumice rafts to the SW, NW, and N of Epi B were visible in 2 February Sentinel B satellite images. During 0700-1030 on 7 February residents observed minor, low-level steaming above Epi B. The intensity of steam emissions varied, increasing and decreasing as new lava was erupted from Epi B. Steaming was again reported by residents starting around 0600 on 8 February. The seismic network recorded elevated seismicity during the previous few days.
Sources: Vanuatu Meteorology and Geohazards Department (VMGD); Sentinel Hub
The Wellington VAAC reported that a low-level plume of ash and sulfur dioxide from a new eruption at Epi was identified in satellite data at 0730 on 31 January. According to the Vanuatu Meteorology and Geo-Hazards Department (VMGD) residents saw steaming at the ocean’s surface in the area over the vents at around 0748, and phreatic explosions that ejected steam and tephra 100 m above the water. The Alert Level was raised to 1 (on a scale of 0-5) and the public was warned to stay 10 km away from the East Epi submarine volcano. Observers reportedly saw a growing cone from ongoing ash emissions. The VAAC noted that the eruption was short-lived and had ceased by 1548; the ash had dissipated.
Three submarine cones, Epi A, Epi B, and Epi C, and smaller cones and craters, are located 10-16 km NNE from the summit of Epi Island and are aligned along the N rim of an inferred caldera. Epi B is the shallowest of the seamounts and has been historically active, most recently in February 2004. A March 2004 bathymetric survey revealed that Epi B was about 300 m tall, with a diameter of about 1.8 km at the base. The summit crater was about 150 m in diameter and the crater floor was at a depth of 90 m. The highest point was on the NW rim of the summit crater, at a depth of 34 m.
Sources: Vanuatu Meteorology and Geohazards Department (VMGD); Wellington Volcanic Ash Advisory Center (VAAC)
According to a report from John Seach, an eruption at East Epi caldera in early March marked the first reported activity at the largely undersea caldera since 1988.
Source: Volcano Live
Reports are organized chronologically and indexed below by Month/Year (Publication Volume:Number), and include a one-line summary. Click on the index link or scroll down to read the reports.
Seamount with repeated eruptions and uncertain history, but stable summit elevation
[The East Epi volcanic complex includes] a group of volcanic centers most conspicuously active at a shallow seamount informally known as Epi B. What follows is a brief summary of the geography and the historical eruptions plausibly or clearly attributed to Epi B (Eissen and others, 1991), leading into a synopsis of recent research and activity. The records of the last century and recent observations suggest that Epi B represents a potential hazard for the inhabitants of the coastal villages of eastern Epi Island (roughly 2,000 people). The island of Epi lies along the Vanuatu island chain between the neighboring islands that include Malekula, Ambrym, and Lopevi to the N, and Efate and Shepherd to the S. The island contains two adjacent Quaternary stratovolcanoes and a smaller cone, as well as the margin of an inferred submarine caldera. The submarine cones Epi A, B, and C lie offshore, 10-16 km NNE from the summit of the island (16.73°S, 168.28°E). The top of Epi B is 13 km NNE of the summit (figure 1).
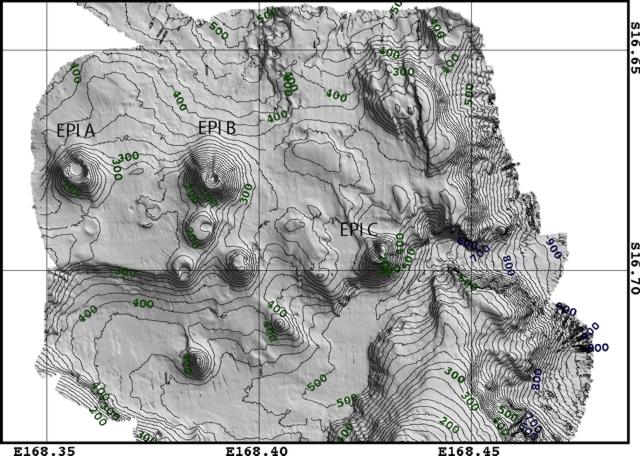 |
Figure 1. Shaded relief map of the seafloor E of Epi island disclosing Epi A, Epi B, and Epi C seamounts. The map was created from data gathered using a multi-beam swath sounder (on research vessel Alis during the VATATERM cruise) on 14 March 2004 (Ballu and others, 2004). Contour interval is 20 m. Courtesy of IRD. |
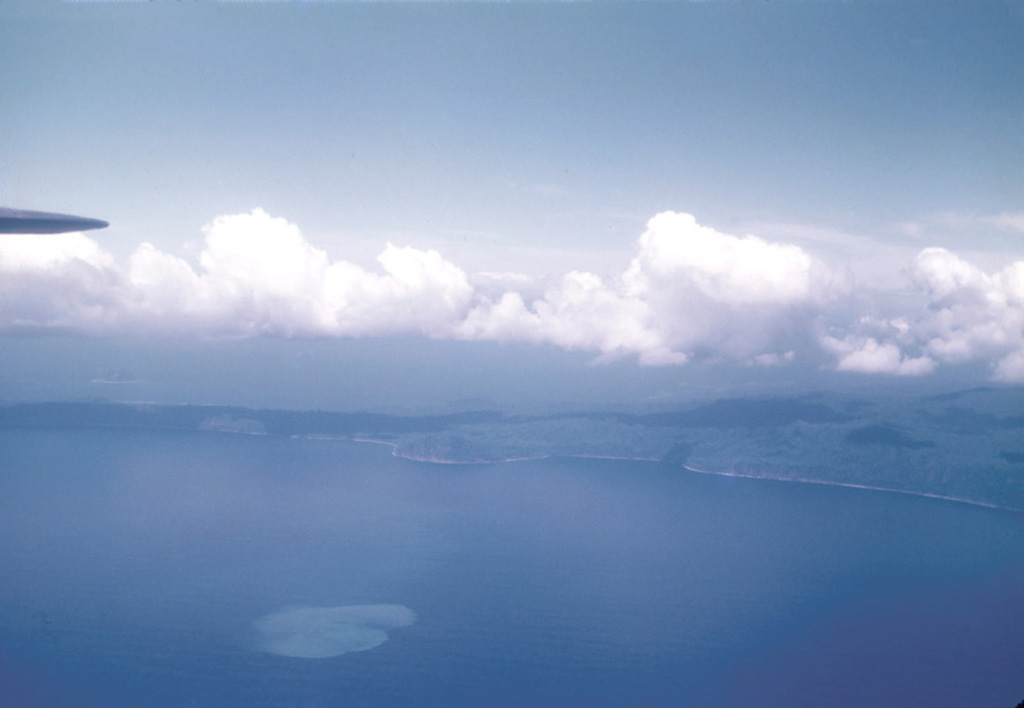
Violent activity between the islands of Lopevi and Epi was reported in 1920 (William and Warden, 1964). In 1953 a major eruption ejected volcanic material to about 100 m above the sea surface and produced rafts of floating pumice over an area of about 1,000 km2. A cone may have formed above water, but it would have been quickly destroyed (Warden, 1967). In 1958 discolored seawater was observed in this area (figure 2; Priam, 1958). Another major eruption was observed in July 1960. Until early 2004, the only recorded evidence of activity following the 1960 eruption was discolored water. Activity at Epi B was also confirmed by the British hydrographic vessel HMS Hydra in 1974, the French research vessel Machias in 1981, the SOPAC cruise of the S.P. Lee in 1984, the Russian vessel Akademik Alexander Nesmayanov in 1990, the French CALIS project using research vessel N.O. Alis in 1991, aerial observations in 1997 (figure 3), and the Australian VAVE project using the research vessel Franklin in 2001. Their collective observations showed that the depth of the cone's summit area remained stationary at -34 m until early 2004 when Epi Island residents observed explosions and surface disturbances (figure 3).
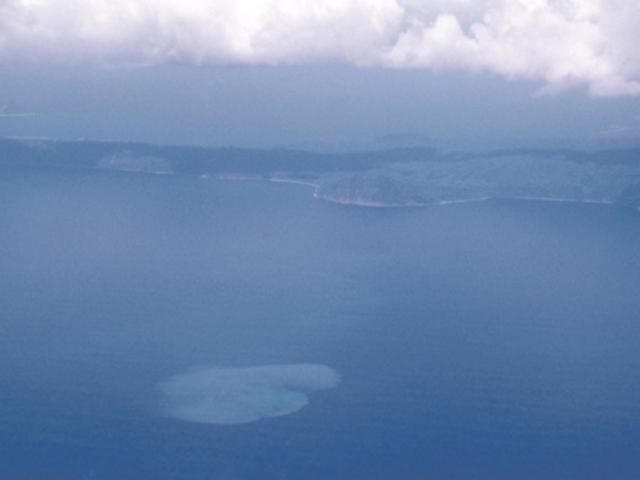 |
Figure 2. The Epi B area seen emitting a circular region of discolored water in December 1958. Copyright Roland Priam; provided courtesy of IRD. |
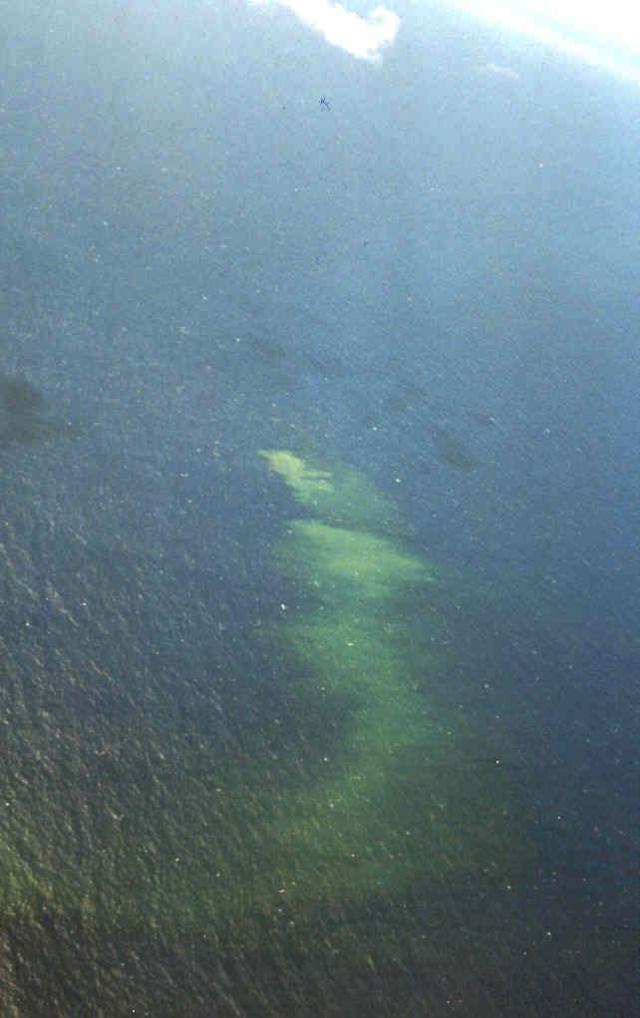 |
Figure 3. As seen from an oblique aerial perspective, the yellow submarine plume emitted from Epi B as seen in November 1997 (source area at the upper part of the photo). The plume broadened and diffused with distance from the source (towards the bottom of the photo). Copyright Vanair, Andrew Dwyer; provided courtesy of IRD. |
While adjacent to Lopevi, the crew of the fishing vessel Azurreported and photographed an explosion rising above the sea surface on 19 February 2004 (figure 4), prompting Vanuatu's Department of Geology, Mines, and Water Resources (DGMWR) to gather eyewitness accounts from the inhabitants of Epi's very isolated E coast about activity. Eyewitnesses told of explosions heard in early 1999(?), further explosions and the appearance of floating pumice rafts in March 2002, and an eruption between 16 and 24 February 2004. The latter Epi B eruption was confirmed by the infrasonic recordings of the CEA/DASE (Département d'Analyse et de Surveillance de l'Environnement) geophysics station, located in New Caledonia, more than 600 km away.
 |
Figure 4. The 19 February 2004 eruption of Epi B as seen from the fishing boat Azur. The eruption clearly broke the water surface, but is only visible here in the distance as a light-colored disturbance in the direction of the man's arm. Copyright Azur; provided courtesy of IRD. |
In March 2004 the Institut de Recherche pour le Développement (IRD) undertook a cruise (called VATATERM) aboard their research vessel N.O. Alis.Using the ship's Simrad EM1002 multi-beam sounder, the project produced the first detailed bathymetric map of the area E of Epi Island (figure 1). The Epi A, B, and C cones (Exon and Cronan, 1983; Crawford and others, 1988) have been interpreted by Crawford and others (1988) as being aligned along the N rim of a vast caldera E of Epi. The new map clearly revealed those distinct cones, and a number of smaller cones and craters between them and Epi island's NE coast.
The 2004 bathymetric data revealed that Epi B is a ~ 300-m-tall cone with a diameter of ~1.8 km at the base (figure 5). The highest point is on the NW rim of the summit crater, at a depth of -34 m, with a broad rim area around 35-40 m depth extending from the NW around the S to the SE side of the crater. The crater is about 150 m in diameter, the crater floor lying at a depth of 90 m. This crater is breached to the N by a ~60 m wide gap.
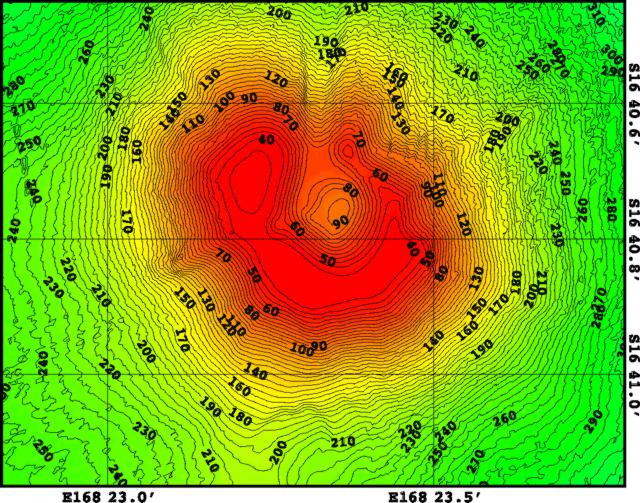 |
Figure 5. Detailed bathymetry (5 m contour interval) of Epi B seamount acquired by RV Alis using a multi-beam swath mapper (Simrad EM1002 sounder) on 14 March 2004. For rough scale, the crater is ~ 150 m in diameter and the narrow N-trending canyon is ~ 60 m wide. The VATATERM cruise and the details of creating and interpreting this map are discussed in Ballu and others (2004). |
Data recorded in 1974 and 1984 indicated that the Epi B crater was open to the S (Exon and Cronan, 1983) or to the SSE (Crawford and others, 1988). The map resulting from a 2001 hydrographic cruise did not show evidence of a summit crater (McConachy and others, 2001). It is not known if these observations represent real modifications to the crater, because the quality of the earlier measurements, using traditional echo-sounders, is questionable.
Observations during September 2001. Scientists on the Vanuatu Australia Vents Expedition (VAVE) aboard the RV Franklin (McConachy and others, 2001) investigated the area immediately SE of the Epi B seamount during September 2001. On 18 September a limited echosounding survey was done, along with a single dip CTD/hydrocast followed by a grab. The latter sample returned an 8-cm-thick layer of pumice (dacite-rhyodacite, 69-72% SiO2, in composition) on top of 3 cm of brown mud. The hydrocast found high concentrations of methane gas, 68-93 nl/l, in three samples between 250 and 337 m deep. A weak but definite light transmission anomaly was also seen at the lowest point of the cast.
Two days later, on 20 September, a more extensive echosounding survey was made in the area noted on nautical maps as having a shoal at 38 m and discolored water. The survey showed a peak at 34 m depth and two smaller structures to the S around 220 m depth. Comparison of this 2001 bathymetric map with the map created by the 2004 VATATERM cruise (figure 1) shows a correlation of this 34-m peak with the summit of Epi B; the deeper peaks correspond to the smaller cones at about 16.70°S. The team "... obtained a reduction in light transmission at the surface (corresponding to the discoloured water) of around 6% associated with low salinity and higher temperature, another near bottom (below 210 m) of up to 1%, and a narrow upper plume signal at 100 m, with a transmission anomaly of approximately 0.2%." Bottles fired and sampled for geochemical studies revealed a large methane anomaly of up to 80 nl/l near the bottom.
References.
Ballu, V., Calmant, S., and others, 2004, Campagne VATATERM du N.O. Alis au Vanuatu, mars 2004.
Crawford, A.J., Greene, H.G., and Exon, N.F., 1988, Geology, Petrology and Geochemistry of submarine volcanoes Around EPI Island, New Hebrides Arc, inGreene, H.G., and Wong, F.L., eds., Geology and Offshore Resources of Pacific Island Arcs -Vanuatu Region: Circum Pacific Council for Energy and Mineral Resources Earth Science Series, v. 8, Houston, Texas, Circum-Pacific Council for Energy and Mineral Resources, p. 301-327.
Eissen, J.P., Blot, C., and Louat, R., 1991, Chronologie de l'activité volcanique historique de l'arc insulaire des Nouvelles-Hébrides de 1595 à 1991: Nouméa, ORSTOM, Rapports Scientifiques et Techniques, Science de la Terre, Géologie-Géophysique, 69 p.
Exon, N.F., and Cronan, D.S., 1983, Hydrothermal iron deposits and associated sediments from submarine volcanoes off Vanuatu, Southwest Pacific: Marine Geology, 52, M43-M52.
Garae, E., Todman, S., and Charley, D., 2004, Rapport de l'éruption du 16-24 février 2004 du volcan sous marin "East Epi": Department of Geology, Mines and Water Resources, Section of Volcanology and Geo-Hazards Management, 14 p.
MacFarlane, A., 1976, Annual report of the geological survey for the year 1974: New Hebrides Condominium, 40 p.
Marine et Aéronautique Navale de Nouvelle-Calédonie, 1958, Observations d'un phénomène sous-marin le 7 octobre 1958 à 10 heures locales et le 18 novembre vers 06 heures locales.
McConachy, T.F., Yeats, C.J., Arculus, R.J., Binns, R.A., Barriga, F.J.A.S., Beattie, R., McInnes, B.I.A., Madsen, E., Rakau, B., Sestak, S., Sharpe, R., and Tevi, T., 2001, VAVE-2001: Vanuatu Australia Vents Expedition Aboard the RV Franklin, 5-25 September 2001, edited by C.J. Yeats, CSIRO Exploration and Mining Report 881F, Final Cruise Report FR08-2001, 318 p.
Obzhirov, A.I., 1992, Dissolved gases of the near-bottom water layer in the area of Epi Island, Vanuatu: Geo-Marine Letters, v. 12, p. 232-235.
Priam, Roland, 1958, November 7 and 13, and December 16, 1958, between 06:30 et 07:00 : reports and slides.
R/V AKADEMIK ALEXANDER NESMEYANOV, 1990, Scientific Report, April 4-7, 1990: Institute of Marine Biology, Academy of Science of the USSR, Vladivostok , USSR, 66 p.
Warden, A.J., 1967, The Geology of the Central Islands: New Hebrides Geological Survey Report No. 5, 108 p.
William, C.E.F., and Warden, A.J., 1964, Progress report of the Geological Survey for 1959-1962: New Hebrides Condominium Geological Survey, 75 p.
Information Contacts: Bernard Pelletier, Michel Lardy, and Philipson Bani, IRD, BP A5, Noumea, New Caledonia (URL: http://www.suds-en-ligne.ird.fr/fr/volcan/vanuatu/epi1.htm); Stéphane Calmant, IRD-LEGOS Toulouse, France; Valérie Ballu, IPG Paris, France; Esline Garaebiti, Sylvain Todman, Douglas Charley, Department of Geology, Mines and Water Resources, Port Vila, Vanuatu; Timothy F. McConachy, CSIRO Division of Exploration and Mining, P.O. Box 136, North Ryde, NSW 1670, Australia.
Explosions during late January-February 2023 above the ocean surface; pumice rafts
The East Epi group, consisting of multiple submarine cones within a postulated caldera, lies off the eastern coast of Epi Island in Vanuatu (figure 6). Three cones (Epi A, B, and C) are located 4-10 km NNE from the Epi Island, with additional smaller cones south of Epi B (figure 7). Ephemeral islands were formed during eruptions in 1920 and 1953. Explosive activity was reported in 1958 and 1960, discolored water was often seen during 1971-1974 and 1988, a new vent was detected in 1979, and explosive activity occurred in February 1999, March 2002, and February 2004. A March 2004 bathymetric survey revealed that Epi B was about 300 m tall with a diameter of about 1.8 km at the base; the summit crater was about 150 m in diameter, the crater floor was at a depth of 90 m, and the highest point was on the NW rim of the summit crater, at a depth of 34 m. This report covers a new eruption during January through February 2023 that was characterized by phreatic explosions, a growing cone, and ash emissions. Information primarily comes from the Vanuatu Meteorology and Geo-Hazards Department (VMGD).
|
Figure 6. Location map showing the locations of the three main cones of the East Epi group (Epi A, Epi B, and Epi C) 4-10 km NNE of Epi Island. Epi B is the site of the 2023 activity. The small island ~16 km N of the cones (top center) is Lopevi volcano. Courtesy of VMGD. |
|
Figure 7. Detailed bathymetric map showing the submarine cones of the East Epi group from Beier at al. (2013, figure 1c). The bathymetric grid was compiled from GEBCO, high-resolution ship-based data from R/V Sonne cruise SO-229 (Haase et al., 2013), and digitized grids from VATATERM (Ballu and Calmant, 2004). |
According to the Wellington VAAC, a low-level ash and sulfur dioxide plume was identified in satellite data at 0730 on 31 January 2023. VMGD reported that residents saw gas-and-steam emissions at the ocean’s surface around 0748 (figure 8) and phreatic explosions that ejected gas and tephra 100 m above the water (figure 9). Observers also reported that they saw a growing cone from ongoing ash emissions. The Wellington VAAC noted that the eruption was short-lived and had stopped by 1548 when the ash had dissipated. During an overflight on the afternoon of 31 January, gas-and-steam was observed rising from the ocean surface above Epi B, discolored water was visible around the eruption site, and pumice rafts were floating on the surface (figure 10). Several strands of pumice that drifted to the SW, NW, and N of Epi B were visible in Sentinel-2 satellite imagery on 2 and 14 February (figure 11). Gas-and-steam emissions were also visible at the surface for a few hours during 1 February. During 0700-1030 on 7 February residents observed minor, low-level gas-and-steam emissions above Epi B. The intensity of the gas-and-steam plumes varied, with stronger activity reported by local residents around 0600 on 8 February. On 23 February VMGD reported sustained seismicity and minor gas-and-steam plumes that only lasted a few hours.
|
Figure 8. Photo of gas-and-steam plumes rising above East Epi on 31 January 2023 due to phreatic explosions. Photo by Mayline Leleny. Courtesy of VMGD. |
|
Figure 9. Photo of phreatic explosions and dark tephra ejected 100 m above East Epi on 31 January 2023. Photo by Mayline Leleny. Courtesy of VMGD. |
|
Figure 10. Aerial photo of pumice floating on the surface of the ocean during 31 January-1 February 2023 as a result of the phreatic explosions at East Epi on 31 January 2023. Photo has been color corrected. Courtesy of VMGD. |
|
Figure 11. Sentinel-2 satellite images showing visible pumice rafts (dark gray) originating from East Epi that drifted SW and S toward Epi Island on 2 February (left) and 14 February 2023 (right). Images with “Natural color” rendering (bands 4, 3, 2). Courtesy of Sentinel Hub Playground. |
References. Ballu V, Calmant S, 2004. Campagne VATATERM du N.O. Alis au Vanuatu.
Beier C, Brandl P A, Lima S M, Haase K M, 2018. Tectonic control on the genesis of magmas in the New Hebrides arc (Vanuatu). Lithos, v. 312–313, p. 290-307. https://doi.org/10.1016/j.lithos.2018.05.011
Haase K M, Koschinsky A, Schwarz-Schampera U (Principal investigators for COVOLVE - COriolis VOLcanism and VEnts), and shipboard scientific party, 2013. Volcanism, hydrothermal activity and vent biology in the Coriolis Troughs, New Hebrides Island Arc; RV Sonne cruise SO-229, Cruise report / Fahrtbericht, 01.07.2013, Townsville (Australia) to 26.07.2013, Nouméa (New Caledonia). TIB – Leibniz Information Centre for Science and Technology and University Library, Erlangen, Germany. https://doi.org/10.2312/cr_so229
Information Contacts: Geo-Hazards Division, Vanuatu Meteorology and Geo-Hazards Department (VMGD), Ministry of Climate Change Adaptation, Meteorology, Geo-Hazards, Energy, Environment and Disaster Management, Private Mail Bag 9054, Lini Highway, Port Vila, Vanuatu (URL: http://www.vmgd.gov.vu/, https://www.facebook.com/VanuatuGeohazardsObservatory/); Wellington Volcanic Ash Advisory Centre (VAAC), Meteorological Service of New Zealand Ltd (MetService), PO Box 722, Wellington, New Zealand (URL: http://www.metservice.com/vaac/, http://www.ssd.noaa.gov/VAAC/OTH/NZ/messages.html); Sentinel Hub Playground (URL: https://www.sentinel-hub.com/explore/sentinel-playground).
|
|
||||||||||||||||||||||||||
There is data available for 9 confirmed eruptive periods.
2023 Jan 31 - 2023 Feb 23 Confirmed Eruption (Submarine) VEI: 1
| Episode 1 | Eruption (Submarine) | |||||||||||||||||||||||||||||||||||||||
|---|---|---|---|---|---|---|---|---|---|---|---|---|---|---|---|---|---|---|---|---|---|---|---|---|---|---|---|---|---|---|---|---|---|---|---|---|---|---|---|
| 2023 Jan 31 - 2023 Feb 23 | Evidence from Observations: Reported | ||||||||||||||||||||||||||||||||||||||
|
List of 6 Events for Episode 1
|
|||||||||||||||||||||||||||||||||||||||
2004 Feb 16 - 2004 Feb 24 Confirmed Eruption (Submarine) VEI: 2
| Episode 1 | Eruption (Submarine) | Epi B | |||||||||||||||||||||||
|---|---|---|---|---|---|---|---|---|---|---|---|---|---|---|---|---|---|---|---|---|---|---|---|---|
| 2004 Feb 16 - 2004 Feb 24 | Evidence from Observations: Reported | |||||||||||||||||||||||
| Eyewitnesses told of an eruption between 16 and 24 February 2004, and while adjacent to Lopevi, the crew of the fishing vessel Azur reported and photographed an explosion rising above the ocean surface on 19 February. The Epi B eruption was confirmed by the infrasonic recordings of the CEA/DASE (Departement d'Analyse et de Surveillance de l'Environnement) geophysics station, located in New Caledonia, more than 600 km away. | ||||||||||||||||||||||||
|
List of 3 Events for Episode 1 at Epi B
|
||||||||||||||||||||||||
2002 Mar 16 ± 15 days - 2002 Mar 16 ± 15 days Confirmed Eruption (Submarine) VEI: 1 (?)
| Episode 1 | Eruption (Submarine) | |||||||||||||||||||
|---|---|---|---|---|---|---|---|---|---|---|---|---|---|---|---|---|---|---|---|
| 2002 Mar 16 ± 15 days - 2002 Mar 16 ± 15 days | Evidence from Observations: Reported | ||||||||||||||||||
| Nearby island residents interviewed following the February 2004 eruption reported hearing explosions in early 1999(?) as well as further explosions and floating pumice rafts in March 2002. | |||||||||||||||||||
|
List of 2 Events for Episode 1
|
|||||||||||||||||||
1999 Feb 1 ± 30 days - 1999 Feb 1 ± 30 days Confirmed Eruption (Submarine) VEI: 1 (?)
| Episode 1 | Eruption (Submarine) | |||||||||||||||||||
|---|---|---|---|---|---|---|---|---|---|---|---|---|---|---|---|---|---|---|---|
| 1999 Feb 1 ± 30 days - 1999 Feb 1 ± 30 days | Evidence from Observations: Reported | ||||||||||||||||||
| Vanuatu's Department of Geology, Mines, and Water Resources (BGVN 29:04) noted that eyewitnesses to the February 2004 eruption reported hearing explosions in early 1999(?). Although the exact timing is uncertain, it is recorded here as occurring during January-February 1999. | |||||||||||||||||||
|
List of 2 Events for Episode 1
|
|||||||||||||||||||
[ 1988 Aug 16 ± 15 days ] Uncertain Eruption
| Episode 1 | Eruption (Submarine) | |||||||||||||||||||
|---|---|---|---|---|---|---|---|---|---|---|---|---|---|---|---|---|---|---|---|
| 1988 Aug 16 ± 15 days - Unknown | Evidence from Unknown | ||||||||||||||||||
| Water discoloration was more intense than usual in August 1988 (Eissen et al., 1991). | |||||||||||||||||||
|
List of 2 Events for Episode 1
|
|||||||||||||||||||
1979 Jul 2 ± 5 years ± 182 days Confirmed Eruption (Submarine) VEI: 0
| Episode 1 | Eruption (Submarine) | South flank of Epi B | ||||||||||||||||||
|---|---|---|---|---|---|---|---|---|---|---|---|---|---|---|---|---|---|---|---|
| 1979 Jul 2 ± 5 years ± 182 days - Unknown | Evidence from Observations: Reported | ||||||||||||||||||
| A new subsidiary vent on the south flank of the Epi B cone was observed during a 1984 bathymetric survey that was not present during a 1974 survey (Crawford et al., 1988). | |||||||||||||||||||
|
List of 2 Events for Episode 1 at South flank of Epi B
|
|||||||||||||||||||
[ 1974 Nov 16 ± 15 days - 1974 Nov 16 ± 15 days ] Uncertain Eruption
| Episode 1 | Eruption (Submarine) | Epi A and Epi B | ||||||||||||||||||
|---|---|---|---|---|---|---|---|---|---|---|---|---|---|---|---|---|---|---|---|
| 1974 Nov 16 ± 15 days - 1974 Nov 16 ± 15 days | Evidence from Unknown | ||||||||||||||||||
| Water discoloration was observed at two submarine cones in November 1974. | |||||||||||||||||||
|
List of 2 Events for Episode 1 at Epi A and Epi B
|
|||||||||||||||||||
[ 1973 May 5 ± 4 days - 1973 Oct 26 ± 5 days ] Uncertain Eruption
| Episode 1 | Eruption (Submarine) | |||||||||||||||||||||||||||||
|---|---|---|---|---|---|---|---|---|---|---|---|---|---|---|---|---|---|---|---|---|---|---|---|---|---|---|---|---|---|
| 1973 May 5 ± 4 days - 1973 Oct 26 ± 5 days | Evidence from Unknown | ||||||||||||||||||||||||||||
| Water discoloration observed by pilot in early May, early June and late October 1973. | |||||||||||||||||||||||||||||
|
List of 4 Events for Episode 1
|
|||||||||||||||||||||||||||||
[ 1972 May 15 ± 5 days - 1972 Jun 25 ± 5 days ] Uncertain Eruption
| Episode 1 | Eruption (Submarine) | |||||||||||||||||||
|---|---|---|---|---|---|---|---|---|---|---|---|---|---|---|---|---|---|---|---|
| 1972 May 15 ± 5 days - 1972 Jun 25 ± 5 days | Evidence from Unknown | ||||||||||||||||||
| Water discoloration observed mid-May to late June 1972. | |||||||||||||||||||
|
List of 2 Events for Episode 1
|
|||||||||||||||||||
[ 1971 Oct 28 - 1971 Nov 15 (?) ] Uncertain Eruption
| Episode 1 | Eruption (Submarine) | |||||||||||||||||||||||||||||
|---|---|---|---|---|---|---|---|---|---|---|---|---|---|---|---|---|---|---|---|---|---|---|---|---|---|---|---|---|---|
| 1971 Oct 28 - 1971 Nov 15 (?) | Evidence from Unknown | ||||||||||||||||||||||||||||
| A "boiling sea" was observed on 28 October 1971, the same day as a M 6.8 earthquake near Espiritu Santo. Discolored water was seen on 15 November, but was not seen again until May-June 1972. | |||||||||||||||||||||||||||||
|
List of 4 Events for Episode 1
|
|||||||||||||||||||||||||||||
1960 Jul 16 (?) ± 15 days Confirmed Eruption (Submarine) VEI: 0
| Episode 1 | Eruption (Submarine) | Three locations | |||||||||||||
|---|---|---|---|---|---|---|---|---|---|---|---|---|---|---|
| 1960 Jul 16 (?) ± 15 days - Unknown | Evidence from Observations: Reported | |||||||||||||
| Three centers of activity were seen during the Lopevi 1960 eruption (Warden, 1967). | ||||||||||||||
|
List of 1 Events for Episode 1 at Three locations
|
||||||||||||||
1958 Sep 16 (?) ± 15 days - 1958 Nov 16 (?) ± 15 days Confirmed Eruption (Submarine) VEI: 2 (?)
| Episode 1 | Eruption (Submarine) | Epi B cone? | ||||||||||||||||||
|---|---|---|---|---|---|---|---|---|---|---|---|---|---|---|---|---|---|---|---|
| 1958 Sep 16 (?) ± 15 days - 1958 Nov 16 (?) ± 15 days | Evidence from Observations: Reported | ||||||||||||||||||
| Explosions were seen by residents of Epi Island, followed by observations of water discoloration on 1 October 1958. Surveys on 7 October and 18 November also revealed water discolorations, but a 16 December survey showed less intense discoloration (Eissen et al., 1991). | |||||||||||||||||||
|
List of 2 Events for Episode 1 at Epi B cone?
|
|||||||||||||||||||
[ 1953 Nov 16 ± 15 days ] Uncertain Eruption
| Episode 1 | Eruption (Submarine) | Epi B cone? | ||||||||||||||||||
|---|---|---|---|---|---|---|---|---|---|---|---|---|---|---|---|---|---|---|---|
| 1953 Nov 16 ± 15 days - Unknown | Evidence from Unknown | ||||||||||||||||||
| Discoloration and churning of water observed in November 1953 (CAVW). | |||||||||||||||||||
|
List of 2 Events for Episode 1 at Epi B cone?
|
|||||||||||||||||||
1953 Feb 12 - 1953 Feb 19 Confirmed Eruption (Submarine) VEI: 3
| Episode 1 | Eruption (Submarine) | Epi B and other vents | |||||||||||||||||||||||||||||||||
|---|---|---|---|---|---|---|---|---|---|---|---|---|---|---|---|---|---|---|---|---|---|---|---|---|---|---|---|---|---|---|---|---|---|---|
| 1953 Feb 12 - 1953 Feb 19 | Evidence from Observations: Reported | |||||||||||||||||||||||||||||||||
| Three vents were simultaneously active, producing large amounts of pumice. An ephemeral island was formed at one vent, probably Epi B. | ||||||||||||||||||||||||||||||||||
|
List of 5 Events for Episode 1 at Epi B and other vents
|
||||||||||||||||||||||||||||||||||
1920 Jan 22 Confirmed Eruption (Submarine) VEI: 2
| Episode 1 | Eruption (Submarine) | Epi B cone | ||||||||||||||||||
|---|---|---|---|---|---|---|---|---|---|---|---|---|---|---|---|---|---|---|---|
| 1920 Jan 22 - Unknown | Evidence from Observations: Reported | ||||||||||||||||||
| Explosive activity listed in CAVW that built an ephemeral island. | |||||||||||||||||||
|
List of 2 Events for Episode 1 at Epi B cone
|
|||||||||||||||||||
This compilation of synonyms and subsidiary features may not be comprehensive. Features are organized into four major categories: Cones, Craters, Domes, and Thermal Features. Synonyms of features appear indented below the primary name. In some cases additional feature type, elevation, or location details are provided.
Cones |
||||
| Feature Name | Feature Type | Elevation | Latitude | Longitude |
| Epi A | Submarine cone | -220 m | 16° 40' 38.00" S | 168° 21' 25.00" E |
| Epi B
Cioan |
Submarine cone | -34 m | 16° 40' 52.00" S | 168° 23' 19.00" E |
| Epi C | Submarine cone | -365 m | 16° 41' 52.00" S | 168° 25' 41.00" E |
| Epi D | Submarine cone | -222 m | 16° 41' 24.00" S | 168° 23' 9.00" E |
| Epi E | Submarine cone | -245 m | 16° 41' 57.00" S | 168° 22' 56.00" E |
| Epi F | Submarine cone | -290 m | 16° 41' 54.00" S | 168° 23' 43.00" E |
| Epi G | Submarine cone | -285 m | 16° 43' 14.00" S | 168° 23' 7.00" E |
| Little Morne | Cone | 204 m | 16° 44' 16.00" S | 168° 21' 14.00" E |
Craters |
||||
| Feature Name | Feature Type | Elevation | Latitude | Longitude |
| East Epi | Caldera | -280 m | 16° 43' 30.00" S | 168° 24' 0.00" E |
 Discolored water rises from the submarine Epi B vent in December 1958. This vent is one of the several East Epi cones located offshore of Epi Island in Vanuatu. Ephemeral islands were formed during eruptions in 1920 and 1953.
 The 19 February 2004 eruption of Epi B, one of several cones of the submarine East Epi volcano, is seen here from the fishing boat Azur. Seen here from the Azur as a white area beyond the man's hand, the eruption breached the surface, ejecting water and steam. Eyewitnesses reported an eruption between 16 and 24 February, and the activity was confirmed by the infrasound recordings.
There are no samples for East Epi in the Smithsonian's NMNH Department of Mineral Sciences Rock and Ore collection.
| Copernicus Browser | The Copernicus Browser replaced the Sentinel Hub Playground browser in 2023, to provide access to Earth observation archives from the Copernicus Data Space Ecosystem, the main distribution platform for data from the EU Copernicus missions. |
| MIROVA | Middle InfraRed Observation of Volcanic Activity (MIROVA) is a near real time volcanic hot-spot detection system based on the analysis of MODIS (Moderate Resolution Imaging Spectroradiometer) data. In particular, MIROVA uses the Middle InfraRed Radiation (MIR), measured over target volcanoes, in order to detect, locate and measure the heat radiation sourced from volcanic activity. |
| MODVOLC Thermal Alerts | Using infrared satellite Moderate Resolution Imaging Spectroradiometer (MODIS) data, scientists at the Hawai'i Institute of Geophysics and Planetology, University of Hawai'i, developed an automated system called MODVOLC to map thermal hot-spots in near real time. For each MODIS image, the algorithm automatically scans each 1 km pixel within it to check for high-temperature hot-spots. When one is found the date, time, location, and intensity are recorded. MODIS looks at every square km of the Earth every 48 hours, once during the day and once during the night, and the presence of two MODIS sensors in space allows at least four hot-spot observations every two days. Each day updated global maps are compiled to display the locations of all hot spots detected in the previous 24 hours. There is a drop-down list with volcano names which allow users to 'zoom-in' and examine the distribution of hot-spots at a variety of spatial scales. |
|
WOVOdat
Single Volcano View Temporal Evolution of Unrest Side by Side Volcanoes |
WOVOdat is a database of volcanic unrest; instrumentally and visually recorded changes in seismicity, ground deformation, gas emission, and other parameters from their normal baselines. It is sponsored by the World Organization of Volcano Observatories (WOVO) and presently hosted at the Earth Observatory of Singapore.
GVMID Data on Volcano Monitoring Infrastructure The Global Volcano Monitoring Infrastructure Database GVMID, is aimed at documenting and improving capabilities of volcano monitoring from the ground and space. GVMID should provide a snapshot and baseline view of the techniques and instrumentation that are in place at various volcanoes, which can be use by volcano observatories as reference to setup new monitoring system or improving networks at a specific volcano. These data will allow identification of what monitoring gaps exist, which can be then targeted by remote sensing infrastructure and future instrument deployments. |
| Volcanic Hazard Maps | The IAVCEI Commission on Volcanic Hazards and Risk has a Volcanic Hazard Maps database designed to serve as a resource for hazard mappers (or other interested parties) to explore how common issues in hazard map development have been addressed at different volcanoes, in different countries, for different hazards, and for different intended audiences. In addition to the comprehensive, searchable Volcanic Hazard Maps Database, this website contains information about diversity of volcanic hazard maps, illustrated using examples from the database. This site is for educational purposes related to volcanic hazard maps. Hazard maps found on this website should not be used for emergency purposes. For the most recent, official hazard map for a particular volcano, please seek out the proper institutional authorities on the matter. |
| IRIS seismic stations/networks | Incorporated Research Institutions for Seismology (IRIS) Data Services map showing the location of seismic stations from all available networks (permanent or temporary) within a radius of 0.18° (about 20 km at mid-latitudes) from the given location of East Epi. Users can customize a variety of filters and options in the left panel. Note that if there are no stations are known the map will default to show the entire world with a "No data matched request" error notice. |
| UNAVCO GPS/GNSS stations | Geodetic Data Services map from UNAVCO showing the location of GPS/GNSS stations from all available networks (permanent or temporary) within a radius of 20 km from the given location of East Epi. Users can customize the data search based on station or network names, location, and time window. Requires Adobe Flash Player. |
| DECADE Data | The DECADE portal, still in the developmental stage, serves as an example of the proposed interoperability between The Smithsonian Institution's Global Volcanism Program, the Mapping Gas Emissions (MaGa) Database, and the EarthChem Geochemical Portal. The Deep Earth Carbon Degassing (DECADE) initiative seeks to use new and established technologies to determine accurate global fluxes of volcanic CO2 to the atmosphere, but installing CO2 monitoring networks on 20 of the world's 150 most actively degassing volcanoes. The group uses related laboratory-based studies (direct gas sampling and analysis, melt inclusions) to provide new data for direct degassing of deep earth carbon to the atmosphere. |
| Large Eruptions of East Epi | Information about large Quaternary eruptions (VEI >= 4) is cataloged in the Large Magnitude Explosive Volcanic Eruptions (LaMEVE) database of the Volcano Global Risk Identification and Analysis Project (VOGRIPA). |
| EarthChem | EarthChem develops and maintains databases, software, and services that support the preservation, discovery, access and analysis of geochemical data, and facilitate their integration with the broad array of other available earth science parameters. EarthChem is operated by a joint team of disciplinary scientists, data scientists, data managers and information technology developers who are part of the NSF-funded data facility Integrated Earth Data Applications (IEDA). IEDA is a collaborative effort of EarthChem and the Marine Geoscience Data System (MGDS). |

