
SVERT reported that an emission of sulfur dioxide from Sarychev Peak was identified in satellite data on 15 August.
Source: Sakhalin Volcanic Eruption Response Team (SVERT)
Few ash emissions and thermal anomalies during February-December 2021
Sarychev Peak occupies the NW end of Matua Island in the Kuril Islands with a central cone that was constructed in a 3-3.5 km caldera with a rim that is exposed on the SW side. Reported eruptions date back to the 1760s, characterized by both lava effusions and strong explosions. Larger eruptions in 1946 and 2009 produced pyroclastic flows that reached the sea. Its current eruption period began during February 2020 and has consisted of an ash eruption, lava flows, and ashfall deposits (BGVN 46:05). This report covers activity during February through December 2021 based on reports from the Sakhalin Volcanic Eruption Response Team (SVERT), the Kamchatka Volcanic Eruptions Response Team (KVERT), and the Tokyo Volcanic Ash Advisory Center.
During a majority of February, a lava flow continued to effuse onto the N slope of the volcano. According to satellite data, a thermal anomaly was observed in the summit on 1 February, though clouds often obscured it. Moderate gas-and-steam emissions were also reported. KVERT reported that on 19 February the effusive eruption had ended, though lava continued to advance in the summit crater and a thermal anomaly remained visible.
SVERT reported that on 12, 23, 25, and 29 June thermal anomalies were detected. The Tokyo VAAC issued a notice on 29 June and 1 July reporting brief ash emissions that rose to 3-3.4 km altitude and drifted W, SE, and E, based on satellite images. At 0020 on 30 June an ash plume was visible in satellite data that rose to 3 km altitude and drifted 30 km WNW. Plumes drifted as far as 25 km E on 1 July.
The MIROVA (Middle InfraRed Observation of Volcanic Activity) volcano hotspot detection system based on the analysis of MODIS data showed intermittent low-power thermal anomalies from late May through mid-November (figure 43). Two stronger anomalies were detected during early June and early July, the latter of which was also detected by the MODVOLC thermal algorithm on 1 July. This thermal activity was also detected in Sentinel-2 infrared satellite imagery, showing a clear thermal anomaly in the summit crater during February through September (figure 44). Though the thermal anomalies became less frequent and strong after August, MIROVA detected five anomalies during October and one weak anomaly in mid-November. Sentinel-2 also showed a weak anomaly on 9 and 26 November, the former of which also revealed trace ash deposits on the E flank and the latter of which was accompanied by a small ash plume that drifted N.
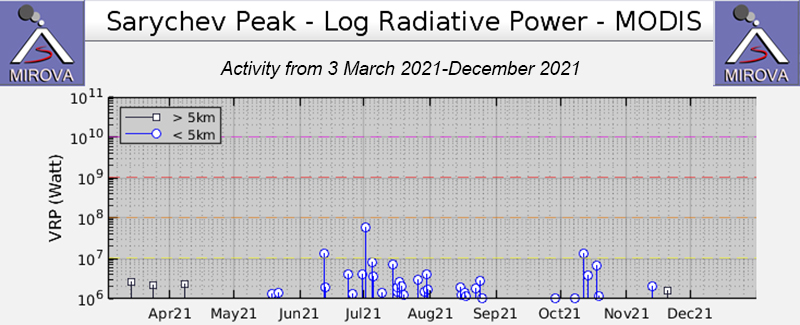 |
Figure 43. Intermittent low-power thermal anomalies at Sarychev Peak were detected by the MIROVA system (Log Radiative Power) beginning in late May through mid-November 2021. Two stronger anomalies were detected during early June and early July. A notable break in thermal activity occurred during a majority of September. Courtesy of MIROVA. |
 |
Figure 44. Sentinel-2 infrared satellite images showing a consistent thermal anomaly in the summit crater of Sarychev Peak on 14 February (top left), 19 March (top right), 5 May (middle left), 29 June (middle right), 7 July (bottom left), and 17 September (bottom right) 2021. Images using “Atmospheric penetration” rendering (bands 12, 11, 8a). Courtesy of Sentinel Hub Playground. |
Information Contacts: Sakhalin Volcanic Eruption Response Team (SVERT), Institute of Marine Geology and Geophysics, Far Eastern Branch, Russian Academy of Science, Nauki st., 1B, Yuzhno-Sakhalinsk, Russia, 693022 (URL: http://www.imgg.ru/en/, http://www.imgg.ru/ru/svert/reports); Kamchatka Volcanic Eruptions Response Team (KVERT), Far Eastern Branch, Russian Academy of Sciences, 9 Piip Blvd., Petropavlovsk-Kamchatsky, 683006, Russia (URL: http://www.kscnet.ru/ivs/kvert/); Tokyo Volcanic Ash Advisory Center (VAAC), 1-3-4 Otemachi, Chiyoda-ku, Tokyo 100-8122, Japan (URL: http://ds.data.jma.go.jp/svd/vaac/data/); MIROVA (Middle InfraRed Observation of Volcanic Activity), a collaborative project between the Universities of Turin and Florence (Italy) supported by the Centre for Volcanic Risk of the Italian Civil Protection Department (URL: http://www.mirovaweb.it/); Hawai'i Institute of Geophysics and Planetology (HIGP) - MODVOLC Thermal Alerts System, School of Ocean and Earth Science and Technology (SOEST), Univ. of Hawai'i, 2525 Correa Road, Honolulu, HI 96822, USA (URL: http://modis.higp.hawaii.edu/); Sentinel Hub Playground (URL: https://www.sentinel-hub.com/explore/sentinel-playground).
2021: January
| February
| June
| July
| August
2019: May
| August
2018: September
| October
2017: October
| November
2010: February
| March
| May
| September
| November
2009: June
| July
| November
SVERT reported that an emission of sulfur dioxide from Sarychev Peak was identified in satellite data on 15 August.
Source: Sakhalin Volcanic Eruption Response Team (SVERT)
SVERT reported that on 29 June and 1 July brief ash emissions from Sarychev Peak rose to 3 km (10,000 ft) a.s.l. A weak thermal anomaly identified in satellite data persisted through 12 July; SVERT lowered the Alert Level to Green (the lowest level on a four-color scale).
Source: Sakhalin Volcanic Eruption Response Team (SVERT)
The Tokyo VAAC and SVERT reported that during 30 June-1 July ash plumes from Sarychev Peak rose to 3-5.5 km (10,000-18,000 ft) a.s.l. and drifted W, SE, and E based on satellite images. Plumes drifted as far as 25 km E on 1 July. The Alert Level remained at Yellow (the second lowest level on a four-color scale).
Sources: Sakhalin Volcanic Eruption Response Team (SVERT); Tokyo Volcanic Ash Advisory Center (VAAC)
SVERT reported that thermal anomalies over Sarychev Peak were identified in satellite images on 12, 23, 25, and 29 June. At 0020 on 30 June an ash plume was visible in satellite data rising 3 km (10,000 ft) a.s.l. and drifting 30 km WNW. The Alert Level was raised to Yellow (the second lowest level on a four-color scale) on 30 June.
Source: Sakhalin Volcanic Eruption Response Team (SVERT)
SVERT noted that thermal anomalies over Sarychev Peak were identified in satellite images during 9-10 and 12-14 February. KVERT reported on 19 February that the effusive eruption was over, though lava continued to advance in the summit crater and a thermal anomaly remained visible. KVERT lowered the Aviation Color Code to Green (the lowest level on a four-color scale).
Sources: Sakhalin Volcanic Eruption Response Team (SVERT); Kamchatkan Volcanic Eruption Response Team (KVERT)
KVERT reported that a thermal anomaly over Sarychev Peak was identified in satellite images during 5-12 February. The Aviation Color Code remained at Yellow (the second lowest level on a four-color scale).
Source: Kamchatkan Volcanic Eruption Response Team (KVERT)
KVERT reported that the eruption at Sarychev Peak continued during 29 January-5 February, characterized by lava effusion from the crater onto the N flank. A thermal anomaly was identified in satellite images on 29 January and 1 February; weather clouds prevented observations on the other days. The Aviation Color Code remained at Yellow (the second lowest level on a four-color scale).
Source: Kamchatkan Volcanic Eruption Response Team (KVERT)
KVERT reported that the eruption at Sarychev Peak continued during 22-29 January, characterized by lava effusion from the crater onto the N flank. A daily thermal anomaly was identified in satellite images. The Aviation Color Code remained at Yellow (the second lowest level on a four-color scale).
Source: Kamchatkan Volcanic Eruption Response Team (KVERT)
KVERT reported that lava began to effuse from a vent in Sarychev Peak’s summit crater 10 January, and by 20 January it had traveled about 400 m down the N flank. A gas-and-steam plume drifted 36 km NE on 12 January. A thermal anomaly was visible during 15 and 18-21 January. The Aviation Color Code remained at Yellow (the second lowest level on a four-color scale).
Source: Kamchatkan Volcanic Eruption Response Team (KVERT)
KVERT reported that a thermal anomaly over Sarychev Peak was identified during 7-10 and 12-13 January. A gas-and-steam plume drifted 40 km NE on 12 January. The Aviation Color Code was raised to Yellow (the second lowest level on a four-color scale) on 10 January.
Source: Kamchatkan Volcanic Eruption Response Team (KVERT)
KVERT raised the Aviation Color Code to Yellow (the second lowest level on a four-color scale) for Sarychev Peak on 10 January, noting that the temperature of a thermal anomaly was 79.8 degrees Celsius above background temperatures, possibly indicating lava in the crater.
Source: Kamchatkan Volcanic Eruption Response Team (KVERT)
SVERT reported that an ash plume from Sarychev Peak rose to 2.7 km (9,000 ft) a.s.l. and drifted 50 km SE on 11 August, based on Tokyo VAAC notices. The Aviation Color Code was raised to Yellow.
Source: Sakhalin Volcanic Eruption Response Team (SVERT)
SVERT lowered the Alert Level for Sarychev Peak to Green on 22 May, noting that the last activity recorded was an ash plume on 16 May and a thermal anomaly on 17 May.
Source: Sakhalin Volcanic Eruption Response Team (SVERT)
SVERT reported that a weak thermal anomaly over Sarychev Peak was visible in satellite images on 10, 12, and 17 May. At 0830 on 16 May satellite images showed an ash plume drifting 50 km SE at an altitude as high as 2.5 km (8,200 ft) a.s.l. The Aviation Color Code was raised to Yellow on 16 May.
Source: Sakhalin Volcanic Eruption Response Team (SVERT)
KVERT reported that an ash explosion at Sarychev Peak was last noted on 10 October and a thermal anomaly was last identified on 15 October. The volcano was quiet or obscured by clouds during 16-31 October. KVERT lowered the Aviation Color Code to Yellow (the second lowest level on a four-color scale).
Source: Kamchatkan Volcanic Eruption Response Team (KVERT)
KVERT reported that a thermal anomaly over Sarychev Peak was visible in satellite images on 15 October. Weather clouds obscured views on the other days during 12-19 October. The Aviation Color Code remained at Orange.
Source: Kamchatkan Volcanic Eruption Response Team (KVERT)
Based on Tokyo VAAC data and satellite images, KVERT reported that at 1330 on 10 October an ash plume from Sarychev Peak rose to 1.7-2 km (5,600-6,600 ft) a.s.l. and drifted 95 km E. SVERT reported that on 15 October an ash plume rose 2.1 km (7,000 ft) a.s.l. and drifted 65-70 km E. The Aviation Color Code remained at Orange.
Sources: Kamchatkan Volcanic Eruption Response Team (KVERT); Sakhalin Volcanic Eruption Response Team (SVERT)
KVERT reported that a thermal anomaly over Sarychev Peak was visible in satellite images on 22 September. The Aviation Color Code remained at Orange.
Source: Kamchatkan Volcanic Eruption Response Team (KVERT)
KVERT reported a continuing eruption at Sarychev Peak (the NW part of Mantua Island) through 21 September. Island observers reported explosions at 1010 on 18 September that sent ash plumes to 4.5 km (14,800 ft) a.s.l. Ash plumes identified in satellite images during 17-18 September drifted 265 km E. The Aviation Color Code remained at Orange.
Source: Kamchatkan Volcanic Eruption Response Team (KVERT)
SVERT and KVERT reported increased activity and ash emissions at Sarychev Peak in mid-September. A thermal anomaly had been periodically visible since 7 May 2018, though more recently anomalies were detected during 8 and 11-12 September. Explosions sometimes occurred during 11 and 13-15 September, and ash emissions rose 3-4 km (10,000-13,100 ft) a.s.l. On 14 September ash plumes drifted as far as 120 km. On 14 September KVERT stated that the Aviation Color Code was raised to Orange, though on 17 September SVERT noted that the Aviation Color Code was at Yellow. KVERT reported that explosions at 0910 on 17 September generated ash plumes that rose as high as 4.5 km (14,800 ft) a.s.l. and drifted 21 km NE.
Sources: Sakhalin Volcanic Eruption Response Team (SVERT); Kamchatkan Volcanic Eruption Response Team (KVERT)
SVERT reported that weak steam-and-gas emissions from Sarychev Peak were observed on 13 November. Weather clouds prevented observations during 14-20 November. The Aviation Color Code remained at Green.
Source: Sakhalin Volcanic Eruption Response Team (SVERT)
SVERT reported that a thermal anomaly over Sarychev Peak was identified in satellite images during 6-7 November. Weak steam-and-gas emissions were observed on 8 November. Weather clouds prevented observations during 9-13 November. The Aviation Color Code remained at Green.
Source: Sakhalin Volcanic Eruption Response Team (SVERT)
SVERT reported that a thermal anomaly over Sarychev Peak was identified in satellite images on 29 October. Weather clouds prevented observations on the other days during 24-30 October. The Aviation Color Code remained at Green.
Source: Sakhalin Volcanic Eruption Response Team (SVERT)
A NOAA/NESDIS scientist noted that a thermal anomaly at Sarychev Peak was identified in satellite images on 12 October. Robust thermal anomalies were identified on 14 October, and were accompanied by a plume of unknown composition. Thermal anomalies were also recorded by the MODVOLC and MIROVA thermal detection systems.
Sources: Michael J. Pavolonis (NOAA/NESDIS), via the Volcanic Clouds Listserv; Hawai'i Institute of Geophysics and Planetology (HIGP) Thermal Alerts Team; MIROVA
Based on satellite image observations, SVERT reported that steam-and-gas emissions rose from Sarychev Peak on 28 November. Sarychev Peak does not have a seismic network; satellite imagery is the primary tool for monitoring many of the Kurile Islands volcanoes.
Source: Sakhalin Volcanic Eruption Response Team (SVERT)
SVERT reported that a diffuse ash plume from Sarychev Peak was detected by satellite on 20 September. Sarychev Peak does not have a seismic network; satellite image observations are the primary tool for monitoring many of the Kurile Islands volcanoes.
Source: Sakhalin Volcanic Eruption Response Team (SVERT)
SVERT reported that a thermal anomaly on Sarychev Peak was detected by satellite on 27 May. Sarychev Peak does not have a seismic network; satellite image observations are the primary tool for monitoring many of the Kurile Islands volcanoes.
Source: Sakhalin Volcanic Eruption Response Team (SVERT)
SVERT reported that a thermal anomaly on Sarychev Peak was detected by satellite on 9 March.
Source: Sakhalin Volcanic Eruption Response Team (SVERT)
SVERT reported that a thermal anomaly on Sarychev Peak was detected by satellite on 3 February.
Source: Sakhalin Volcanic Eruption Response Team (SVERT)
SVERT reported that a thermal anomaly on Sarychev Peak was detected by satellite on 25 November. Steam-and-gas emissions were noted on 25, 26, and 29 November.
Source: Sakhalin Volcanic Eruption Response Team (SVERT)
SVERT reported that a thermal anomaly on Sarychev Peak was detected by satellite on 21 November.
Source: Sakhalin Volcanic Eruption Response Team (SVERT)
Based on analyses of satellite imagery, SVERT reported that on 22 July a gas-and-steam plume from Sarychev Peak drifted 35 km N. Cloud cover prevented observations during 23-26 July. On 27 July, a steam-and-gas plume possibly containing some ash rose to an altitude of 3.7 km (12,000 ft) a.s.l. and drifted 55 km NW.
Sources: Sakhalin Volcanic Eruption Response Team (SVERT); Tokyo Volcanic Ash Advisory Center (VAAC)
Based on analyses of satellite imagery, SVERT reported that gas-and-steam plumes from Sarychev Peak were seen on satellite imagery during 15, 18-19, and 21 July. Plumes drifted 30-50 km W and S. Cloud cover prevented observations during 16-17 and 20 July. Sarychev Peak does not have a seismic network.
Source: Sakhalin Volcanic Eruption Response Team (SVERT)
Based on analyses of satellite imagery, SVERT reported that diffuse gas-and-steam plumes from Sarychev Peak were seen on satellite imagery during 8-10 and 12 July. Plumes drifted 15 km E on 8 July. The plumes seen on 9 July drifted 50 km E and may have contained some ash. Gas-and-ash plumes drifted 40 km E on 13 July and 25 km W and NW on 14 July.
Source: Sakhalin Volcanic Eruption Response Team (SVERT)
SVERT reported that an intense thermal anomaly from Sarychev Peak was detected on satellite imagery during 1-6 July. Gas-and-steam plumes were seen almost daily and drifted 20-75 km NW, NE, and SE. Plumes rose to altitudes of 1.5-3 km (4,900-10,000 ft) a.s.l. during 4-5 July. No large ash explosions were noted after 16 June.
Source: Sakhalin Volcanic Eruption Response Team (SVERT)
SVERT reported that an intense thermal anomaly from Sarychev Peak was detected on satellite imagery during 24-30 June. Gas-and-steam plumes drifted 9 km NW on 24 June, S on 26 June, 26 km SSE on 28 June, and 40 km SE at an altitude of 3 km on 29 June.
Source: Sakhalin Volcanic Eruption Response Team (SVERT)
The eruption from Sarychev Peak that began on 11 June continued through the 19th. SVERT reported another explosive eruption at 1730 UTC on 15 June, followed by the satellite observation of a plume early on 16 June that extended 360 km NW. The Tokyo VAAC estimated that the 16 June plume rose to an altitude of 9.7 km (32,000 feet) a.s.l., while higher ash clouds from earlier explosions reached 13.7 km (45,000 feet) altitude. Ash emissions continued during 17-18 June, causing ashfall in Yuzhno-Sakhalinsk, and gas-and-steam plumes spread NE and SW. Thermal anomalies were detected in satellite data on 18 and 19 June, but cloudy conditions prevented clear observations. One MODIS image on 18 June showed an ash plume spreading SW above the weather clouds. Although the Aviation Color Code was lowered from Red to Orange on 19 June, satellite observations showed that a diffuse ash cloud had spread approximately 20 km S and 40 km W of the volcano.
Source: Sakhalin Volcanic Eruption Response Team (SVERT)
Based on analysis of satellite imagery, SVERT reported that on 11 June a thermal anomaly from Sarychev Peak and a possible diffuse ash plume were detected. Seismicity was at background levels. The next day, a large thermal anomaly was present and ash emissions were were seen on satellite imagery. On 13 June, ash plumes rose to an altitude of 7.5 km (24,600 ft) a.s.l. and drifted 200 km SW and 105 km SE. On 14 June, a large eruption produced an ash plume that rose to an altitude of 12 km (39,400 ft) a.s.l. A large explosion the next day sent an ash plume to an altitude of 8 km (26,200 ft) a.s.l. Sarychev Peak is not monitored with ground-based instruments. According to news articles, some airlines have re-routed, canceled, or delayed flights.
Sources: The Province; Sakhalin Volcanic Eruption Response Team (SVERT); Canada.com (Postmedia Network)
Reports are organized chronologically and indexed below by Month/Year (Publication Volume:Number), and include a one-line summary. Click on the index link or scroll down to read the reports.
Ash emission and lava flows
Ash emission, accompanied by earth tremors and a booming noise, began in mid-September. On 2 October, volcanologists observed two lava flows moving rapidly down the W flank toward the Sea of Okhotsk. By 16 October, eruptive activity was limited to infrequent "smoke" effusion, allowing the staff of the hydro-meteorological station (the only inhabitants of the island) to return. Volcanologists from the Institute of Volcanology, Petropavlovsk (IVP) are presently studying the volcano. Sarychev had a mild ash eruption lasting only 6 minutes on 9 December 1965. Its last major eruption began on 30 August, 1960, producing a 5-km-high cloud of andesitic basalt ash.
Further Reference. Andreyev, V.N., Shantser, A.Ye., Khrenov, A.P., Okrugin, V.M., and Nechayev, V.N., 1978, Eruption of the volcanic peak Sarycheva in 1976: Byull. Vulkanol. Stn., no. 55, p. 35-40.
Information Contacts: Tass.
Intensely active fumaroles in center of summit crater
The W walls of the crater were ruined after the 1976 eruption, and this part of the summit was flat during the 20 September overflight. In the central part of the summit crater, there was a shallow but morphologically distinct funnel in which there were many intensely active fumaroles.
Information Contacts: G. Steinberg, Sakhalin Complex Institute.
Lava flow and gas emissions
In September 1986 the staff of a meteorological station on Matua Island reported a strong sulfur smell. During the previous observations, after the 1976 eruption, the crater was described as flat-bottomed with a depth of 50-70 m by Andreyev and others (1978). During the 2 November 1986 overflight only the SE wall remained above the crater. Gas was being emitted from most of the crater, with the most intense fumaroles restricted to its central and W parts. A black, snow-free lava tongue extended 100-150 m from the S part of the crater. Many shallow fumaroles were located in the SE part of the crater and at the head of the lava flow. Gas emission was not observed from the lava flow itself. Traces of ash that fell before September 1986 were noted on the snow-covered crater slopes. The volcano has no permanent snow cover.
Reference. Andreyev, V.N., Shantser, A.Ye., Khrenov, A.P., Okrugin, V.M., and Nechayev, V.N., 1978, Eruption of the volcanic peak Sarycheva in 1976: Byull. Vulkanol. Stn., no. 55, p. 35-40.
Information Contacts: G. Steinberg and B. Piskunov, Yuzhno-Sakhalinsk.
Ash eruptions in mid-January; ashfall bands seen on the snow
An ash eruption was reported on 14 January at 1136. During an overflight between 1220 and 1250, clouds at 1,300-1,800 m altitude obscured the summit . . . . No eruption columns were observed above the weather clouds. Two narrow gray bands on the volcano's snow-covered N and NE slopes suggested ash emission had occurred the previous day. The activity was preceded by a series of felt earthquakes 5-12 January. Epicenters of some strong earthquakes (M<=6.2) were located in the Simushir Island region . . . .
Information Contacts: G.S. Steinberg, Institute of Marine Geology & Geophysics, Yuzhno-Sakhalinsk.
Widespread plumes from large 11-16 June 2009 eruption
On 11 June 2009 one of the largest historical eruptions in the Kuril Islands began?from Sarychev Peak (figure 1). A report from the Sakhalin Volcanic Eruption Response Team (SVERT) covered events through June, and included both remote-sensing and on-the-scene observations by Russian scientists. Other contributors include astronauts and remote-sensing specialists. Synonyms for the volcano include Fue-san, Matsuwa-jima, Matua-jima, and Sarnicheff.
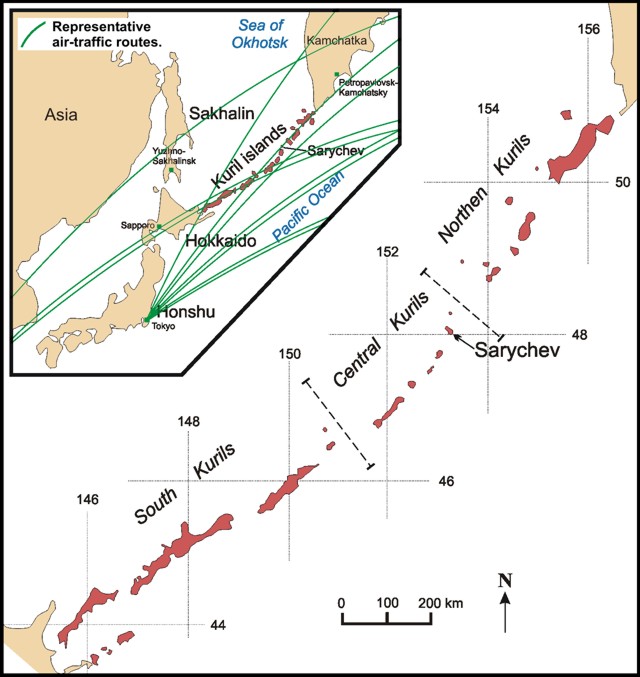 |
Figure 1. Broad-scale maps of the Kuril Islands showing regional geography and the location of Sarychev Peak. Base maps are courtesy of the Sakhalin Volcanic Eruption Response Team (SVERT). Representative aviation routes on the inset map are from Casadevall and Thompson (1995). |
Monitoring. Volcano monitoring is conducted by SVERT in the southern and central Kurils, and by KVERT in the northern Kurils (figure 1). The region is well known for severe weather, including summertime cloudy and foggy conditions; volcano monitoring has depended heavily on remote-sensing methods.
With respect to civil aviation, the Kuril Islands are the responsibility of the Tokyo Volcanic Ash Advisory Center (VAAC). A zone without designated VAAC jurisdiction over N-central Russia is ~ 1,400 km N. The substantial plumes caused concern about that zone's ambiguous status and the whereabouts of Sarychev's ash.
This part of the North Pacific is sparsely populated but is one of the world's most heavily traveled air corridors, crossed by flights linking Europe and North America to northern Asia (including Japan, parts of China, Hong Kong, and Korea). Injecting ash into these flight routes, Sarychev's eruption triggered diversions or delays to an unknown number of flights. Reliable sources indicated that some aircraft diversions over Russia, and other unexpected factors, cost as much as $100,000 USD per flight.
Precursors and initial eruption, 11 June 2009. Before the June 2009 eruption the volcano was dormant with substantial fumarolic activity. Visitors looking into the crater in August 2008 encountered thick fog, but did heard noises. On 6 June 2009 specialists came to the island to service an autonomous GPS station. Photographs documented increased gas emissions.
SVERT's report stated that the first signs of eruption came as a result of satellite observations acquired on 11 June 2009. Distinct then were both a thermal anomaly and weak ash emissions. During the eruption, ashfalls were widespread and noted at sites including Raikoke, Rasshua, Ushishir, Ketoi, the Simushir islands, the northern part of Urup Island, and widespread on Sakhalin Island.
On the night of 11-12 June, the scientific research ship George Steller passed near the island without anyone noticing an eruption, according to an oral report from the expedition chief Vladimir Burkanov.
Space Station photograph, 12 June 2009. A stunning photo of the plume taken on 12 June 2009 (figure 2) from the International Space Station (ISS) shows not only a highly complex ash cloud, but at least two or three distinct (different colored) volcanic clouds hugging the ground surface and traveling radially out from the vent. One is an unmistakable, light-colored pyroclastic flow, narrowing as it progresses out over the island until ultimately hidden by the edge of the weather clouds. Another set are broader, dark-colored clouds, presumably other pyroclastic flows.
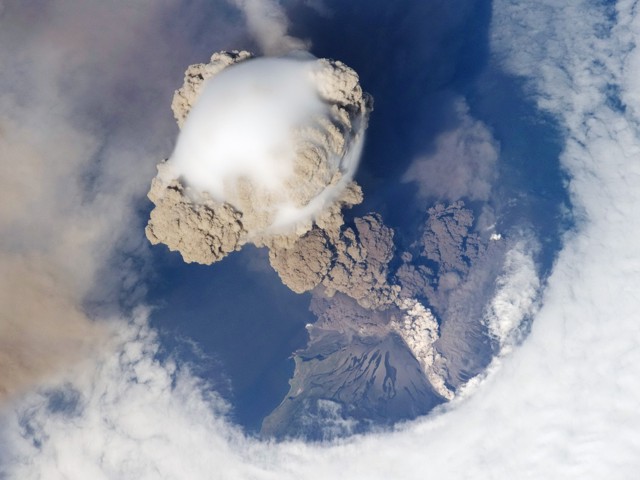 |
Figure 2. A digital photograph of a Sarychev Peak's eruption plume taken by astronauts on 12 June 2009 from the International Space Station. N is to the upper right. [Astronaut photograph ISS020-E-9048; acquired 12 June at 22:16 UTC with a Nikon D2XS digital camera fitted with a 400 mm lens; Nadir point 48.8°N, 157.5°E]. Courtesy of NASA Earth Observatory. |
The vertical plume looks dense and well confined; absent is the strongly spreading upper region common in many eruptive plumes (an umbrella cloud). The top of this cloud is bulbous, and trailing below it is a narrower, columnar lower segment colored in shades of brown and cream. At the time of this writing no clear analysis of the plume height has come to our attention. Older dispersed plumes are also apparent at distance (some at the left edge of this photo) and on satellite imagery from 12 June, with airborne ash covering a considerable area and extending in more than one direction.
Capping the ash cloud's bulbous top and in a ring just below it, lies a strikingly smooth, white portion of the plume, a feature called a pileus cloud (figure 2). It results from a slab of uncontaminated air pushed upward ahead of the rapidly rising darker zone. Pileus clouds sometimes form above mountain tops and convectively rising weather clouds. For the pileus cloud to form, the lifted air layer must have sufficient moisture (relative humidity). The underlying clouds often punch through the pileus clouds, a process that seems to have started here. The lower clouds that result are sometimes described as cloud skirts (the ring in this case).
The hole in the weather clouds centered above the volcano is likely in part due to meteorological conditions; such holes often occur similarly centered over islands in the Kuril chain. This may result, for example, from an island's landmass warming moist air or forcing it upwards to mix with dryer air, resulting in a local loss of cloud cover; such an effect might combine with downwind eddies. A broader 12 June ISS image shows a series of holes in regional weather clouds in a pattern aligned broadly over the Kuriles. Another explanation, with many adherants, is that the hole may have been caused or influenced by effects associated with dynamics of the eruption and plume propagation (Wilkinson, 2009).
The opportune ISS flyover resulted in 29 still images of the eruption taken over a 1-minute interval. NASA used the photos to create a series of animations, also available on the NASA Earth Observatory website. The ISS orbits at ~ 400 km altitude and ~ 27,500 km/hour. Patrick Vantuyne created a red-blue stereo image of the 12 June plume, posted by NASA as a "Picture of the Day."
Satellite-based observations. SVERT reported that the energetic phase of the eruption, during 11-16 June, encompassed more than ten large explosions (figures 3 and 4). Resulting ash clouds rose up to altitudes of 8-16 km and, according to some estimates, up to 21 km. Ash plumes stretched N to W for 1,500 km, and E for more than 3,000 km. Comparative analysis of ASTER-Terra satellite images indicated newly formed territory amounted to 1.4 km2. The area of island covered by June 2009 pyroclastic flows was more than 8 km2. The preliminary estimated minimum volume of eruptive rock was 0.4 km3.
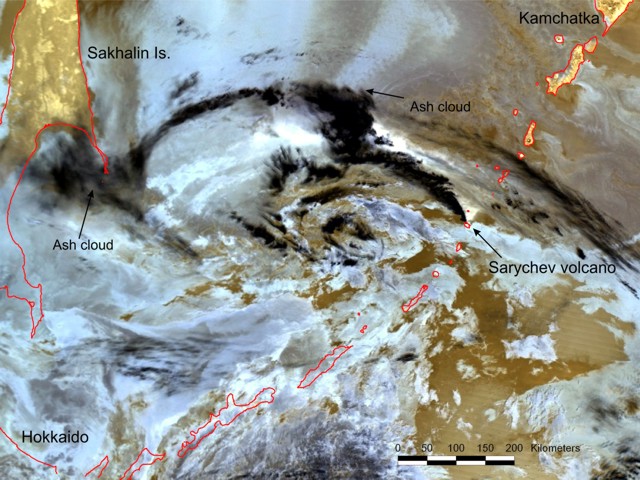 |
Figure 3. A MODIS satellite image of the Sarychev Peak eruption plume from 16 June 2009. In colored versions the plume is black. As it spread W, part of the plume took the form of a large spiral, portions of which extended at least as far W as Sakhalin Island. The plume also appears in thinner strands to the NE of the source. Courtesy of SVERT and MODIS. |
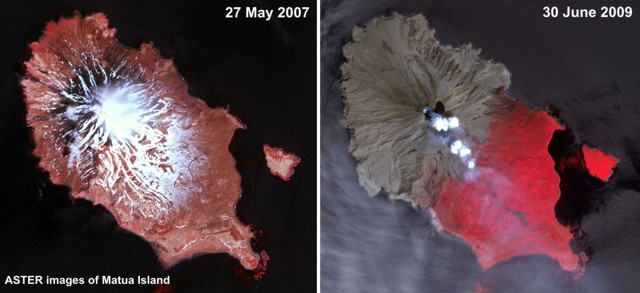 |
Figure 4. False-color ASTER images from 27 May 2007 and 30 June 2009 showing before-and-after scenes of Sarychev Peak's eruption. The 2007 photo shows remnant seasonal snow on the island and some cloud over the summit. N is towards the top and the long-axis of Matua (large island) is ~ 12 km and the diameter of Toporkovyi (small island) is ~ 1 km. The eruption's effects were strong to the NW, around the volcano, but fieldwork confirmed that they left both the SE end of Matua Island and all of the flat Toporkovyi Island comparatively untouched. Comparison of images shows that pyroclastic flows extended the shoreline of the island, particularly NE and SW of the volcano. Courtesy of ASTER and SVERT. |
Broader imagery of the region also indicated more diffuse high-altitude ash clouds. Starting on 12 June, the ash spread hundreds of kilometers both E and W and to lesser extent N, a large elongate mass high in the atmosphere that closed off a huge critical area to commercial air carriers and created new problems not seen before by aviation authorities.
According to Simon Carn, the Ozone Monitoring Instrument (OMI) on NASA's Aura satellite tracked a sulfur dioxide plume across the northern Pacific from Sakhalin Island and mainland Russia and E as far as Alaska (figure 5). Carn's tentative conclusion was that the eruption was also the largest sulfur dioxide event so far in 2009.
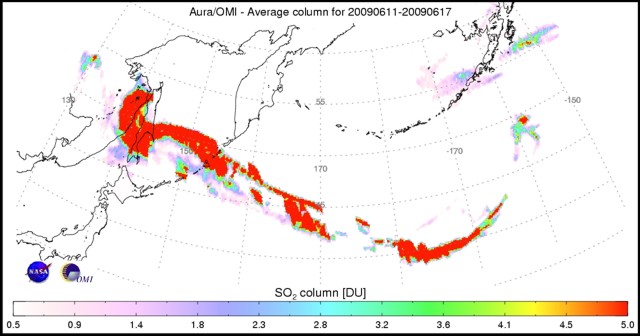 |
Figure 5. SO2 emissions from Sarychev Peak during 10-17 June 2009 led to this composite picture of gas plumes. The emissions were measured by the OMI satellite and its support team. Note concentration-pathlength scale at bottom, in Dobson Units (DU). Courtesy of Simon Carn. |
By early July both atmospheric lidar instruments and the CALIPSO limb-sounding satellite had documented extended aerosol layers at 10-20 km altitude over the Northern Hemisphere. There were two potential sources for these aerosols, fires and the Sarychev Peak eruption. Fires due to biomass burning were seen around this time in both the Yukon and Alaska. Fire-generated aerosols are now known to reach 20 km altitudes (Mike Fromm, personal communication, and Fromm and others, 2004). According to Fromm, the Sarychev Peak eruptions must have at least contributed to high-altitude aerosols. As recent as mid-August, the atmospheric limb-sounding satellite CALYPSO had detected pronounced aerosol layers at 22-23 km altitude, layers also seen on MODIS visible-wavelength imagery. Fromm concluded the aerosol burden was larger than the substantial August-September 2008 eruption at Kasatochi (Alaska).
The microwave limb-sounding (MLS) satellite Aura can detect multiple gases. According to a NASA website, in mid-June 2009 it detected clear signals of both SO2 and HCl across a large span of the North Pacific.
Continuing activity during 16-28 June 2009. After 16 June, the eruptions entered a less energetic stage. Weak explosions continued and contained small amounts of tephra. The SVERT team visited the island during 26-28 June. Intense gas emissions came from still-hot deposits. Satellite data confirmed these gas emissions, which continued through at least 20 July. Field work and satellite observations led the team to consider the eruption to be VEI 4.
Good views of the island were obtained from the sea during the 26-28 June visit by SVERT (figures 6-8). One component of fieldwork involved the GPS-aided mapping of pyroclastic deposits seen along the seashore. The team used an inflatable boat to access the shoreline (figure 9). The bulk of pyroclastic flows reached the sea (figures 10 and 11), and although wave action had substantially eroded the deposits along the coastline, the deposits clearly continued out into the sea. Weakly eroded underwater pyroclastic flows sometimes returned distinctive reflections on echo soundings. The soundings and other observations also revealed submerged deposits emitting gases and still-stirring hydrothermal exchanges.
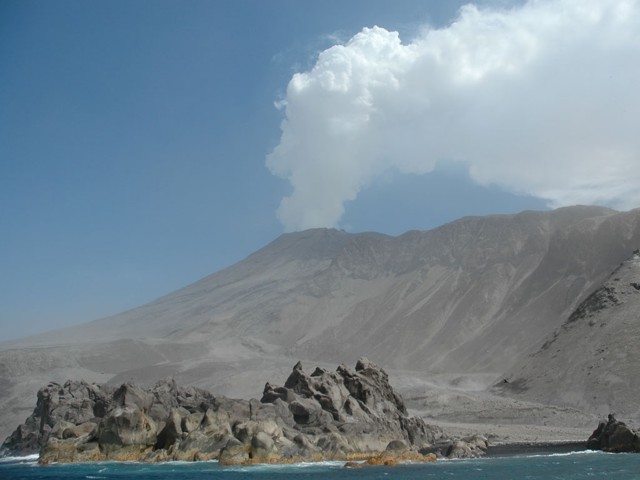 |
Figure 6. Photo of steam rising from Sarychev Peak as seen from the N at some time during 26-28 June. Rugged fringing older rocks can be seen protecting a beach front and tephra-covered landscape. Courtesy of SVERT. |
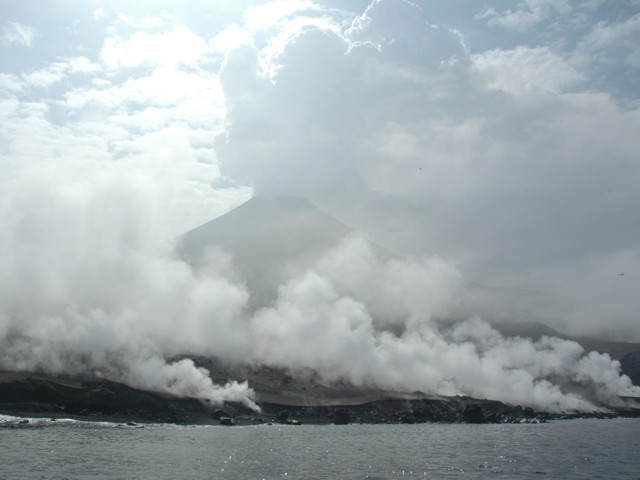 |
Figure 7. Photos of steam rising from the pyroclastic flows as seen from the N at some time during 26-28 June. The steaming peak is faintly visible in the background. Courtesy of SVERT. |
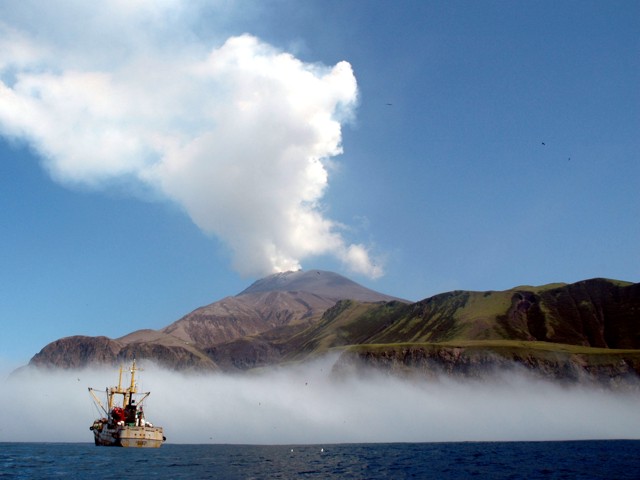 |
Figure 8. Photos of Sarychev Peak seen from the S, the side of the island least impacted by the eruption, where the landscape remained green and vegetated. The support vessel seen here brought scientists to the Island and gave them safe lodging during the expedition. Courtesy of SVERT. |
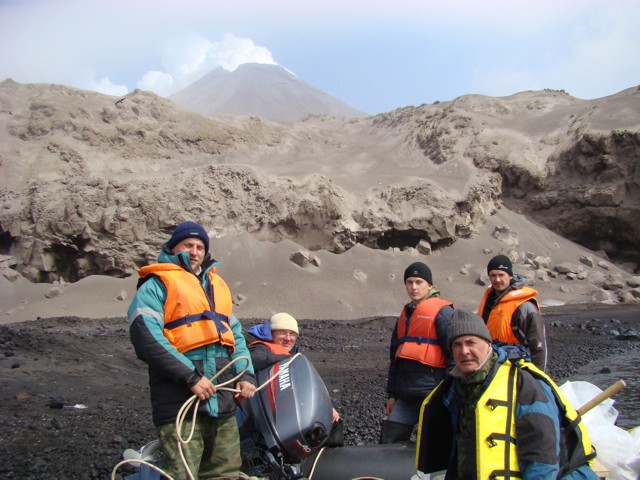 |
Figure 9. The field crew on a beach to inspect Sarychev Peak's recent pyroclastic flows. By the time of their 26-28 June visit, waves had eroded the fresh deposits that must have once covered this beach face. Massive, jointed rocks in the cliff backing the beach are older rocks; new deposits drape the upper cliff. Note steaming peak in the background. SVERT volcanologists (from left): Dmitrii Kozlov, Igor Koroteev, Artyom Degterev, Rafael Zharkov (far right), and Alexander Rybin (front right). Courtesy of SVERT. |
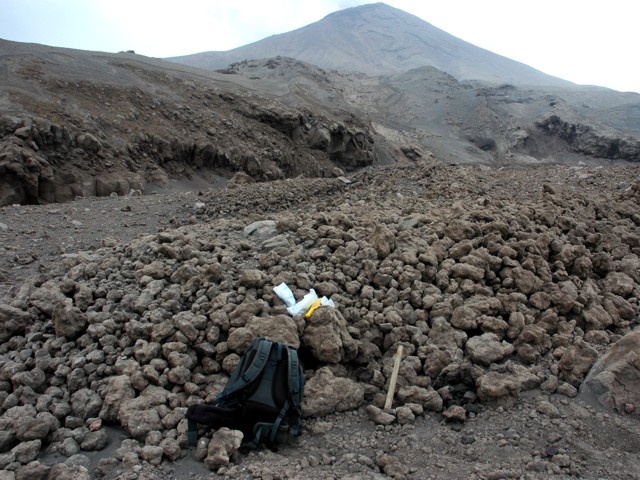 |
Figure 10. Rubbly surface of a 2009 pyroclastic flow ("pumice flow") on Sarychev Peak's W flanks. Field gear at flow front provides scale. Note the lobate form and comparatively large and consistent grain size. Courtesy of SVERT. |
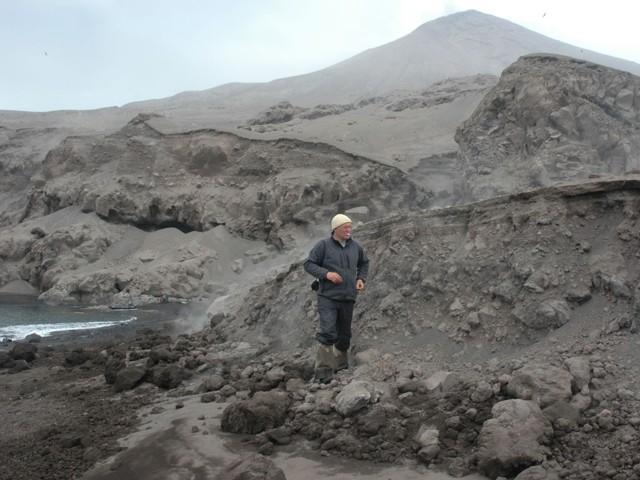 |
Figure 11. Exposed tephra stratigraphy from the Sarychev Peak eruption. The scientist is standing before fresh tephra deposits along the seashore with his feet on the beach. To his side lies a well-exposed ~ 2-m-thick pyroclastic flow deposit capped by fine-grained tephra of probable air-fall origin. The fine air-fall unit covers the surface in the distance, coloring it a uniform gray. Courtesy of SVERT. |
The field inspection revealed three pyroclastic flows from the eruption. The team also recognized other pyroclastic material, including volcanic bombs, scoria flows, and ash. Compositionally, the field analysis suggested the eruptions were basaltic andesite. In accord with the density of the fresh blocky deposits along the sea cliff, and the clasts within them (figure 11), the team saw no floating pumice.
The intense fumarolic discharges escaping the pyroclastic flows reached ~ 500°C. Fumaroles were seen most frequently associated with impacts from large volcanic bombs, and from fissures. Areas of fumarolic exhalation included sublimated minerals such as native sulfur (figure 12). The team also encountered a pond with hot water (figure 13).
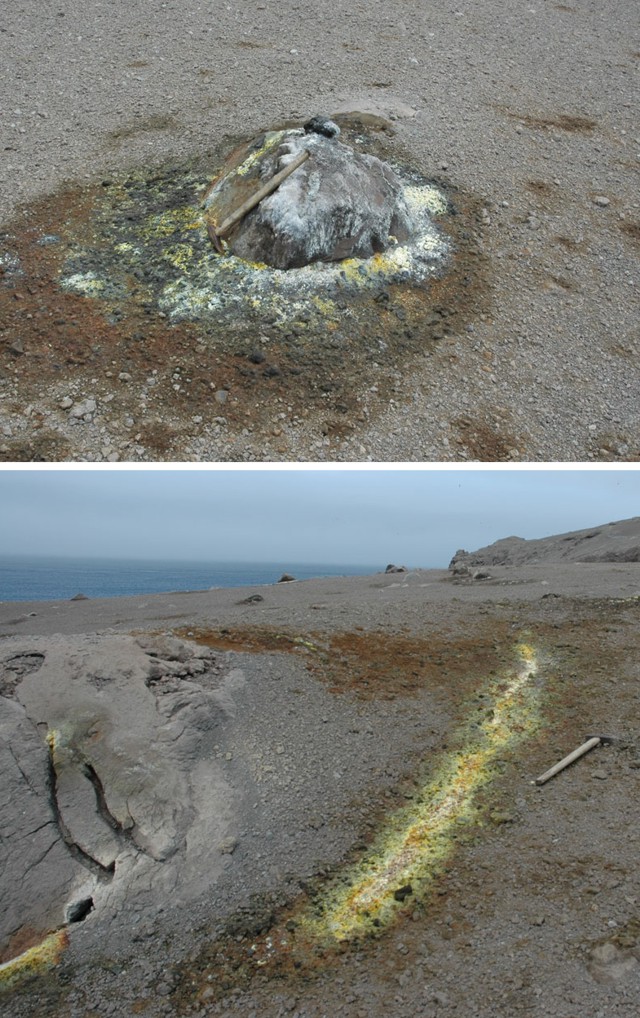 |
Figure 12. Two examples of sublimated mineral zones seen on the pyroclastic-flow surfaces from the Sarychev Peak eruption. Many such mineralized areas appeared related to bomb impacts (top). Other areas were elongate, some several meters long (bottom). Courtesy of SVERT. |
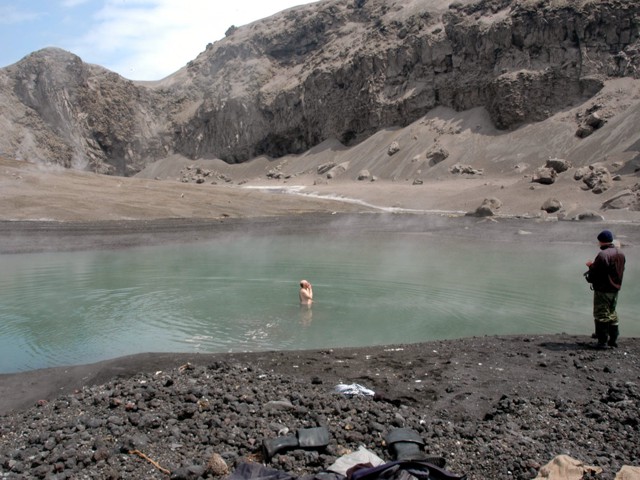 |
Figure 13. Small pond encountered on Sarychev's flanks. Cliffs and talus slopes behind the pond are tephra-draped older rocks. The green-hued water had been heated and mineralized by contact with recent eruptive products. The scientist standing in the pond estimated that the temperature was ~ 21°C. Courtesy of SVERT. |
Biological impacts. Prior to the eruption, the island was teeming with life and the SVERT team photographically documented many biological impacts (eg., surviving birds congregated at damaged or destroyed rookeries). The eruptions of June 2009 divided Matua Island into two sectors with a sharp and nearly linear boundary between them (eg., figure 5). On the NW side, nearest Sarychev Peak, its eruption left a dead zone. Many plants were buried by hot tephra, leaving a landscape devoid of vegetation on the current ground surface. This dead zone was bounded to the S by a deep ravine where a large mudflow had occurred, destroying ferns, thick growths of alder, and grass cover.
To the SE, ashfall damaged small plants, including rhododendron, crowberry, cassiopea, and phylodoce. Perhaps 10-15% of sites visited there had ash over 10 cm thick. Especially near the dead zone, many small plants suffered burial, yet they continued to blossom. Blossoming cowberry was buried in areas with thick ashfall.
Among high brush in the S part of the island, alder generally suffered little, but in some areas of ashfall (between Kruglaya mountain and the slopes of the volcano) it showed some leaf damage. The leaves of mountain ash displayed yellow rims and discolored spots. High-grasses located in the SE sector were little affected by ashfall.
In the dead zone, some bird colonies remained on the old lava flows supporting the island's capes. It was difficult to estimate how many birds had died or lost nests. Many seagulls sat on the warm surfaces of the steaming pyroclastic flows. Wounded and dead seagulls found on the surfaces of pyroclastic flows were probably killed by burns after the eruption. Near the NW part of Matua Island, the team saw large flocks of sea birds aloft.
On the 28th, SVERT visited seal habitats on the S portion of the island where they counted 20 eared seals and 10 fur seals. On a cape along Matua's W coast they encountered another seven eared seals. The team found no living land animals on the NW sector. On the SE sector, they found dead mice and three dead foxes.
Additional geological background from SVERT. The modern edifice of Sarychev Peak occupies the bulk of Matua Island but is centered towards the NW (figure 5). The island's SE side is flat, with average elevations of 30-40 m. The island's S and E sides are covered with brush and grass.
Before 25 August 1945, Matua Island supported a Japanese army base with as many as 4,000 residents. After 1945, the Soviet army occupied the island and maintained meteorological and seismic stations until a sharp decline in inhabitants at the end of the 1990's. The island still contains runways and structures. In recent years, the only people on the island were occasional visitors.
The geologic literature discusses Pliocene basaltic andesite volcanoes in this region (including Toporkovyi Island and the SE part of Matua). It is probable that these are part of an ancient shield volcano. In the SE part of Matua Island is a somma of an ancient caldera (Gorshkov 1967; Markhinin 1964; Andreev and others, 1978), making Sarychev Peak an intracaldera stratovolcano. It is formed by alternating lava and tephra of mainly basalt to andesite composition (Gorshkov 1967; Andreev et.al 1978).
According to Gorshkov (1967), after the major 1946 eruption the crater had both a diameter and depth of ~ 250 m, with steep, sometimes overhanging crater walls and a floor of solid lava. Modern lava flows consisted of two-pyroxene basalts and basaltic andesites vented from the central cone, forming small tongues near the crater.
After the 1960 eruption, field observers encountered dense fog and were thus unable to describe the crater (Shilov, 1962). According to eye-witnesses, the crater's N walls may have collapsed.
The 1976 eruption included strong emissions. Lava flows extended the W, SW, and NW slopes (Andreev and others, 1978). This eruption left the crater with a diameter of ~ 200 m and a flat bottom at a depth 50-70 m below the rim.
References. Andreev, V.N., Shantser, A.E., Khrenov, A.P., Okrugin, V.M., and Hechaev V.N., 1978, Eruption of the volcano Sarychev Peak in 1976: Bull.of volcanological stations, no. 55, p. 35-40.
Casadevall, T., and Thompson, T., 1995, World map of volcanoes and principal aeronautical features (1:34,268,000): U.S. Geological Survey, Geophysical Investigations Map GP-1011.
Fedorchenko, V.I., Abdurakhmanov, A.I., and Rodionova, R.I., 1989, Volcanism of Kurile Island arc: geology and petrogenesis: M. Nauka, p. 239.
Fromm, M., Bevilacqua, R., Stocks, B., and Servranckx, R., 2004, New Directions: Eruptive transport to the stratosphere: add fire-convection to volcanoes: Atmospheric Environment, v. 38, p. 163-165.
Glavadskii, S.N., and Efremov, G.K., 1948, Eruption of the volcano Sarychev Peak in the November 1946: Bull.of volcanological stations, no. 15, p. 48-12.
Gorshkov, G.S., 1948, Volcano Sarychev Peak: Bull.of volcanological stations, no. 15, p. 3-7.
Gorshkov, G.S., 1967, Volcanism of the Kurile Island arc: M. Nauka
Markhinin, E.K, 1964, Sarychev volcano: Bull. of volcanological stations, no. 35, p. 44-58.
Shilov, V.N., 1962, The eruption of volcano Sarychev Peak in 1960: The book of Sakhalin. v. 12, p.143-149.
Wilkinson, M.J., 2009, Sarychev Peak Eruption, Kurile Islands (caption): NASA Earth Observatory, posted 22 June 2009 (URL: http://earthobservatory.nasa.gov/IOTD/view.php?id=38985).
Information Contacts: Sakhalin Volcanic Eruptions Response Team (SVERT), Institute of Marine Geology and Geophysics (IMG & G) Far East Division Russian Academy of Sciences, 1B Science St., Yuzhno-Sakhalinsk, 693022, Russia (URL: http://www.imgg.ru/); B.W. Levin, A.V. Rybin, M.V. Chibisoba, and V.B. Gur'yanov, IMG & G; N.G. Razzhigaeva, Pacific Institute of Geography, Far East Division Russian Academy of Sciences, 7 Radio St., Vladivostok, 690041, Russia (URL: http://tig.dvo.ru/tig/); International Space Station (ISS) Expedition 20 (astronauts Gennady Padalka, Frank De Winne, Roman Romanenko, Robert Thirsk, Michael Barratt, Nicole Stott, Tim Kopra, and Koichi Wakata) (URL: http://www.nasa.gov/mission_pages/station/expeditions/expedition20/); Simon A. Carn, Department of Geological and Mining Engineering and Sciences, Michigan Technological University, 1400 Townsend Drive Houghton, MI 49931 USA; Mike Fromm, Computational Physics, Inc, 2750 Prosperity Ave, Fairfax, VA 22031, USA; NASA Astronomy Picture of the Day (URL: http://apod.nasa.gov/apod/ap090625.html); NASA Earth Observatory (URL: http://earthobservatory.nasa.gov/).
Lava flows on the E and SE flanks; aerosol layer detected by lidar
Since the last eruption at Sarychev Peak, during 11-21 June 2009 (BGVN 34:06), there have been intermittent thermal anomalies detected and one ash plume. Later fieldwork also revealed lava flows from the 2009 activity. This volcano lacks a seismometer, so satellite observations are the Sakhalin Volcanic Eruptions Response Team's (SVERT) primary monitoring tool, as they are for many volcanoes of the Kuril Islands.
The June 2009 explosive eruption deposited pyroclastic flows and associated tephra that changed the landscape around on NE Matua Island. Hot pyroclastic flows completely buried vegetated slopes, covered wide areas to the W, N, and E, and reached the sea (BGVN 34:06).
Satellite imagery collected after June 2009 revealed lava flows on the E and SE flanks. Some imagery and photos (including radar and thermal data) and a lidar atmospheric sounding found aerosols interpreted as Sarychev Peak ash at 12 km altitude over Germany.
Additional June 2009 eruption observations. Gas-and-steam emissions were frequent in July 2009, possibly with some ash on the 27th (table 1). Low-altitude plumes were visible up to 75 km away. Thermal anomalies were then detected on 21 November 2009, and 3 February, 9 March, and 27 May 2010. An ash plume was seen on 20 September 2010.
Table 1. Emissions and plumes from Sarychev Peak during July 2009-September 2010. Courtesy of SVERT.
| Date | Activity |
| 04-05 Jul 2009 | Gas-and-steam emission, plumes drifted 20-75 km NW, NE, and SE to altitudes of 1.5-3 km. |
| 08 Jul 2009 | Gas-and-steam emission, plumes drifted 15 km E. |
| 09 Jul 2009 | Gas-and-steam emission, plumes containing some ash drifted 50 km E. |
| 13 Jul 2009 | Gas-and-steam emission, plumes drifted 40 km E. |
| 14 Jul 2009 | Gas-and-steam emission, plumes drifted 25 km W and NW. |
| 15-21 Jul 2009 | Gas-and-steam emission, plumes drifted 30-50 km W and S. |
| 22 Jul 2009 | Gas-and-steam emission, plumes drifted 35 km N. |
| 27 Jul 2009 | Steam-gas plume possibly containing some ash drifted 55 km NW at 3.7 km altitude. |
| 21 Nov 2009 | Thermal anomaly, steam-gas emission. |
| 03 Feb 2010 | Thermal anomaly. |
| 09 Mar 2010 | Thermal anomaly. |
| 27 May 2010 | Thermal anomaly. |
| 20 Sep 2010 | Diffuse ash plume. |
As previously discussed (BGVN 34:06), a scientific expedition from the Institute of Marine Geology and Geophysics Far East Division Russian Academy of Sciences (FED RAS) and Pacific Institute of Geography (FED RAS) that visited the island during 26-28 June 2009 described the eruption as explosive in character (Levin and others, 2009). Also, the explosions were sufficiently strong to have created a deep crater. A 2007 photo of the summit crater disclosed a shallow depression, the floor of which was covered in pyroclastic material (figures 14 and 15). More recent images show a newly deepened and enlarged crater (figures 16 and 17).
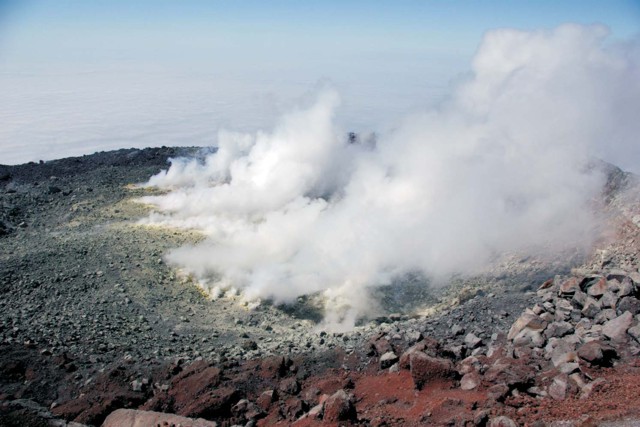 |
Figure 14. Sarychev Peak's summit crater as photographed in August 2007. Pyroclastic materials and solidified lava then filled the summit crater of the volcano to its lowest level on the NW edge. Note the large area of steaming and the crater's shallow depth and pan-like character. Courtesy of A. K. Klitin. |
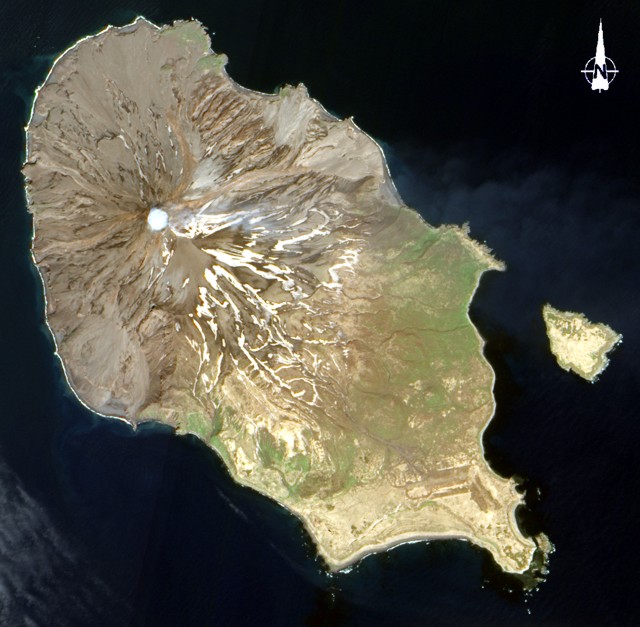 |
Figure 15. Almost a year after Sarychev Peak erupted spectacularly during June 2009, it displayed only degassing with steam hanging over the newly enlarged summit crater. The Advanced Land Images (ALI) on NASA's Earth Observing-1 (EO-1) satellite captured this image on 11 June 2010. Steam filled the summit crater, forming an almost perfect circle of white. A much fainter, barely discernible plume blew away from the summit toward the E. Courtesy of NASA Earth Observatory. |
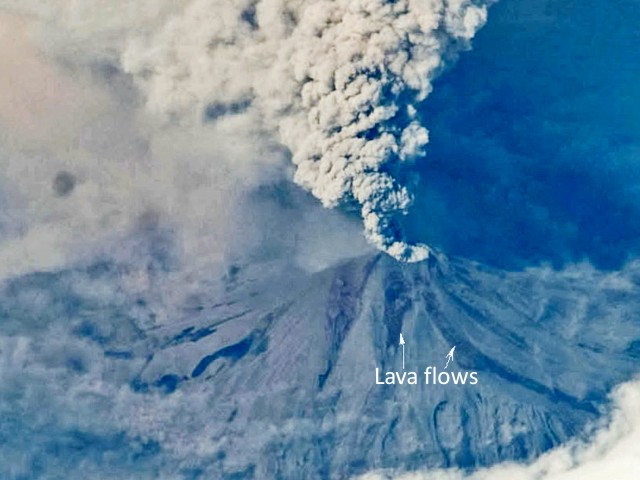 |
Figure 16. Sarychev Peak's new lava flows appear in this image from 17 June 2009. This and other photos were taken with a hand-held camera from the International Space Station. From Grishin and Melekestsev (2010). |
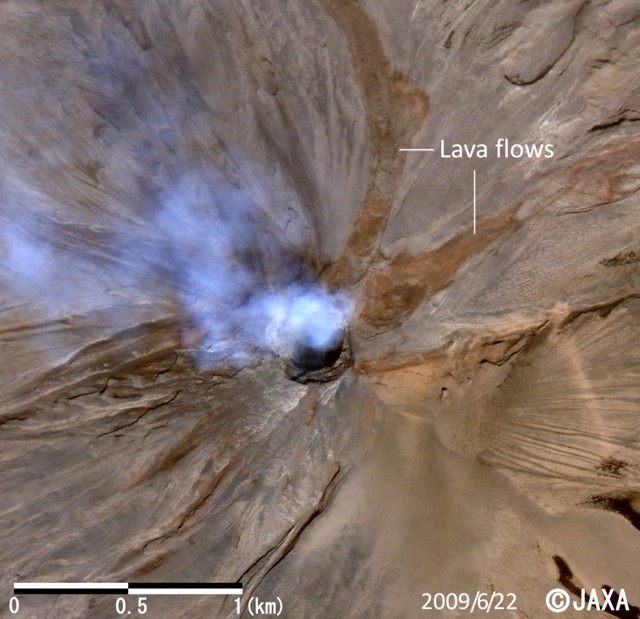 |
Figure 17. A 22 June 2009 satellite image of Sarychev Peak, zooming in on the upper slopes and clearly showing the lava flows, a passively steaming crater, and, within the summit crater, a new deep and steep-sided explosion crater. In the NE direction, the larger crater has a diameter (rim-to-rim) of ~350-450 m. Within that lies the steep-sided crater, which has a diameter of ~250 m. Courtesy of JAXA. |
Satellite images from 17-18 June 2009 (such as figure 16) disclosed two, roughly 100- to 150-m-wide streams of lava that first divided ~300 m from the crater's NE edge. More detailed satellite images (including thermal images) and photos from the field analyzed after the expedition also aided the recognition of the lava flows. Grishin and Melekestsev (2010) noted that the new lava flows extended 2.4 and 2.6 km from their source at the summit crater. The area of the lava flows was estimated as 0.8 km2; the volume was estimated as ~10 x 106 m3.
Analysis also determined that the lava flows proceeded downslope during the eruption's active phase. Field photos disclosed that the pyroclastic deposits overlapped and were coeval with the lava flows. In other words, lava flows moved roughly synchronous with the pyroclastic flows (figures 16 and 17).
In some images, fresh snow had blanketed and remained over the bulk of Matua Island, but the lava flows and thick pyroclastic flows remained devoid of, or with limited, snow cover. This effect was attributed to continued heat radiating from the lava flows and thick pyroclastic flows.
Satellite radar. Japan Aerospace Exploration Agency (JAXA) staff performed radar observations on 19 June 2009 (figure 18) using the Phased Array Type L-band Synthetic Aperture Radar (PALSAR) installed on the Advanced Land Observing Satellite (ALOS). Analysts compared an earlier radar image, from 14 March 2007, to detect surface changes between those two dates; many of the changes were attributed to the 2009 eruption (figure 18).
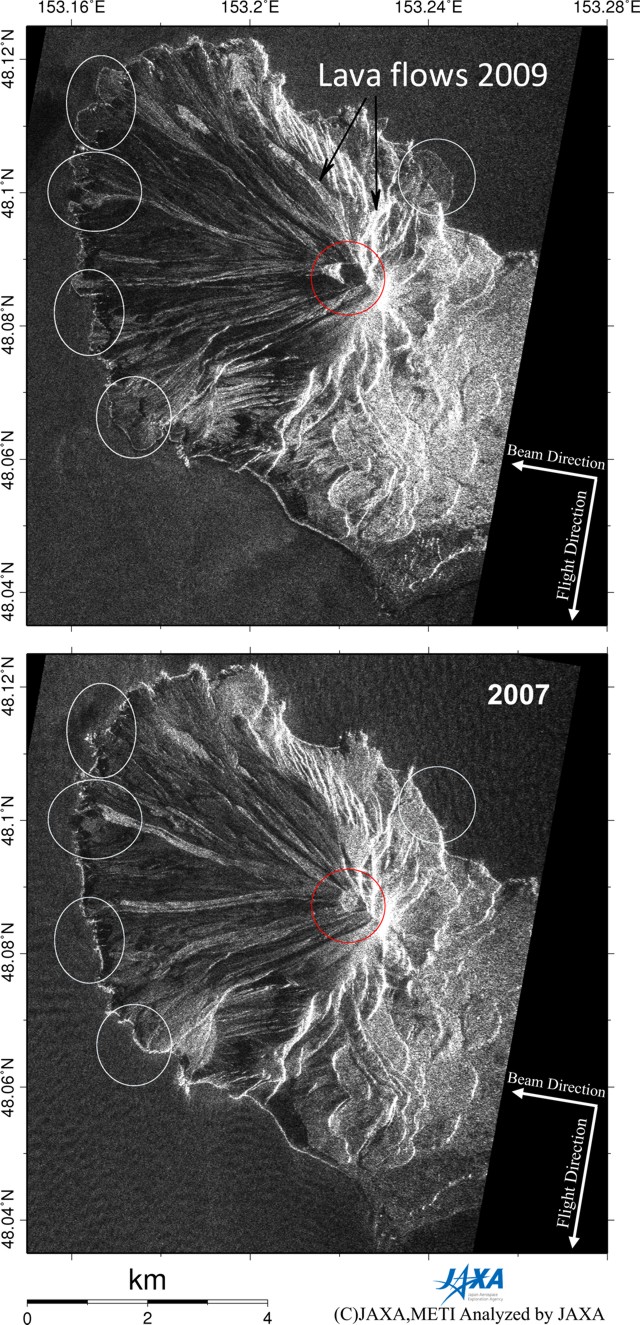 |
Figure 18. PALSAR amplitude images acquired before (bottom; on 14 March 2007) and after (top; on 19 June 2009) the eruption at Sarychev Peak. The same observational modes were used for both images (taken on descending orbit with an off-nadir angle of 34.3 degrees). PALSAR radar depict the target area without masking by weather clouds, steam or other volcanic gases. Courtesy of JAXA. |
The two images revealed areas with profound changes (circled) both around the crater and at many points along the coast. Analysts interpreted the shoreline changes as due to pyroclastic flows or lahars, which issued from the crater and transported material radially. On the upper slopes, the strong radial pattern was primarily due to pyroclastic flows and, in some locations, lava flows.
Lidar. Mattis and others (2009) discussed aerosol data from lidar soundings over Leipzig, Germany, during the summer of 2008 through the first half of 2009. They associated high backscatter seen on 1 July 2009 with aerosols from Sarychev Peak's eruption and estimated the main peak from aerosols as residing at ~12 km altitude.
Earlier backscatter peaks were attributed to Okmok (Aleutians, 15-km altitude); Kasatochi (Aleutians, 15.2 km); Shiveluch (Kamchatka, 8.8 km); Cleveland (Aleutians, 6 km); and Redoubt (Alaska, 20 km). The authors noted that, prior to the onset of the aerosol layers seen in the summer of 2008, their measurements in the previous 12 years lacked any major effects from volcanic aerosols over Germany.
References. Grishin, S.Yu., Melekestsev, I.V., 2010, Lava flows from the 2009 eruption of Sarychev Peak, the Central Kuriles, Bulletin of Kamchatka Regional Association "Educational Scientific Center"; Earth Sciences, no. 1 (15), p. 232-239.
Levin, B.V., Rybin, A.V., Razzhigaeva, N.G., and others, 2009, Complex Expedition of the "Volcano-Sarychev 2009" (Kuril Islands), Bulletin Far East Division, Russian Academy of Sciences, no. 6, p. 98-104.
Mattis, I., Seifert, P., Muller, D., Tesche, M, Hiebsch, A., Kanitz, T., Schmidt, J., and Finger, F., 2009, Volcanic aerosol layers observed with multi-wavelength Raman lidar over Europe since summer 2008, in Proceedings of the 8th International Symposium on Tropospheric Profiling, Delft, The Netherlands, October 2009. Eds. A. Apituley, H.W.J. Russchenberg, W.A.A. Monna, ISBN 978-90-6960-233-2.
Information Contacts: Sakhalin Volcanic Eruptions Response Team (SVERT), Institute of Marine Geology and Geophysics (IMG&G) Far East Division Russian Academy of Sciences (FED RAS), 1B Science St., Yuzhno-Sakhalinsk, 693022, Russia (URL: http://www.imgg.ru/); B.W. Levin, A.V. Rybin, M.V. Chibisoba, and V.B. Gur'yanov, IMG&G; N.G. Razzhigaeva, Pacific Institute of Geography FED RAS, 7 Radio St., Vladivostok, 690041, Russia (URL: http://tig.dvo.ru/tig/); S. Yu. Grishin, Institute of Biology and Soil Science FED RAS, 159 Prospect Stoletiya, Vladivostok, 690022, Russia; I.V. Melekestsev, Institute of Volcanology and Seismology FED RAS; A.K. Klitin, Sakhalin Research Institute of Fisheries and Oceanography, Yuzhno-Sakhalinsk, Russia; Gennady Padalka, Frank De Winne, Roman Romanenko, Robert Thirsk, Michael Barratt, Nicole Stott, Tim Kopra, and Koichi Wakata (astronauts), International Space Station Expedition 20 (URL: http://www.nasa.gov/mission_pages/station/expeditions/expedition20/, http://www.eorc.jaxa.jp/ALOS/img_up/l_pan_sarychev_090622.htm); NASA Earth Observatory (URL: http://earthobservatory.nasa.gov/).
Thermal anomalies, surface activity, and ash explosions during October-November 2017 and September-October 2018
Located on Matua Island in the central Kurile Islands, Russia, Sarychev Peak (figures 19 and 20) had a significant eruption in June-July 2009 (BGVN 34:06, 35:09). Prior to this, a 1946 eruption resulted in the crater with a diameter and depth of approximately 250 m, with steep, sometimes overhanging crater walls. The N crater wall may have collapsed after a 1960 eruption, based on eyewitness accounts. A 1976 eruption included strong emissions and lava flows which resulted in a crater diameter of approximately 200 m and a floor 50-70 m below the rim. The eruption on 11-16 June 2009 encompassed more than ten large explosions, resulting in pyroclastic flows and ash plumes. The area of island covered by the June 2009 pyroclastic flows was more than 8 km2 (BGVN 34:06). Monitoring reports come from the Kamchatkan Volcanic Eruption Response Team (KVERT) and the Sakhalin Island Volcanic Eruption Response Team (SVERT).
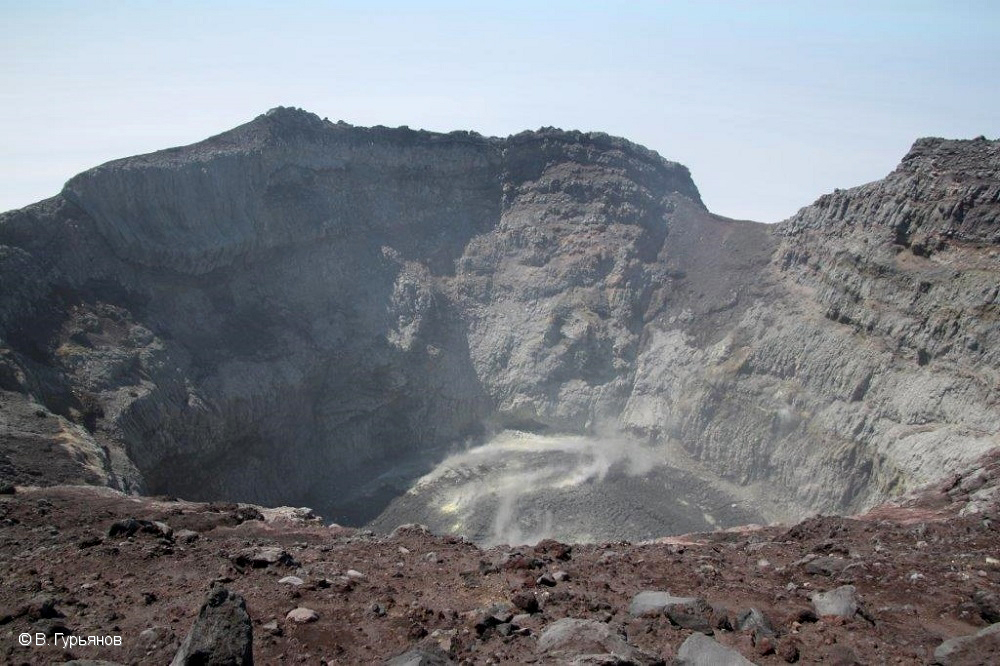 |
Figure 19. Photo looking into the crater of Sarychev Peak from the crater rim on 27 June 2017. Courtesy of V. Gurianov, Institute of Volcanology and Seismology FEB, RAS, KVERT. |
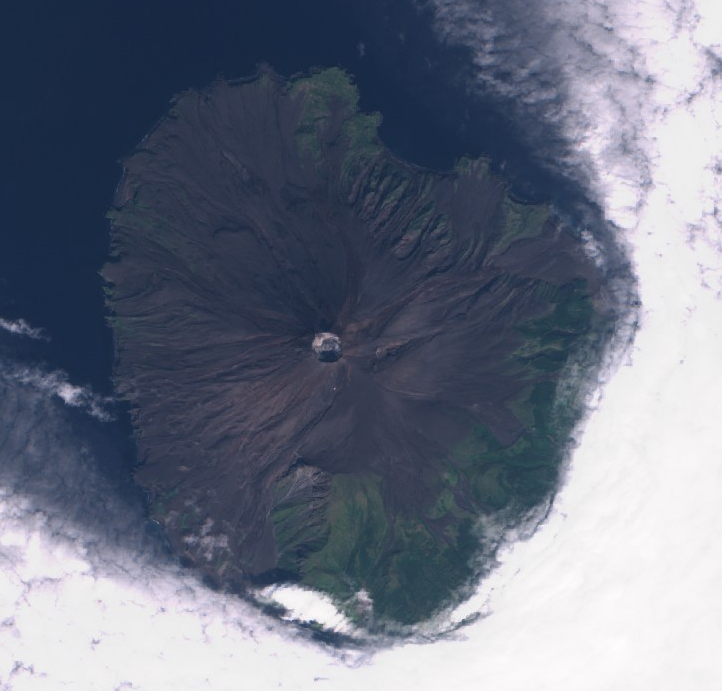 |
Figure 20. Sentinel-2 satellite image (natural color, bands 4, 3, 2) of Sarychev Peak on 8 September 2017. Courtesy of Sentinel Hub Playground. |
Thermal anomalies were noted by the NOAA Cooperative Institute for Meteorological Satellite Studies over a period of five hours on 14 October 2017 in satellite data from Terra MODIS, S-NPP VIIRS, and Himawari-8; a plume of unknown composition accompanied the anomaly. A smaller thermal anomaly was present on 12 October, but not seen the following day during favorable viewing conditions. Another thermal anomaly was reported by SVERT on 21 October; views on other days that week of 17-23 October were obscured by clouds. On 7 November gas emissions and an elongated area of snow melt and potential thermal signature was visible on the N flank of the volcano (figure 21). On 8 and 13 November steam emissions were reported by SVERT and cloud cover prevented additional observations.
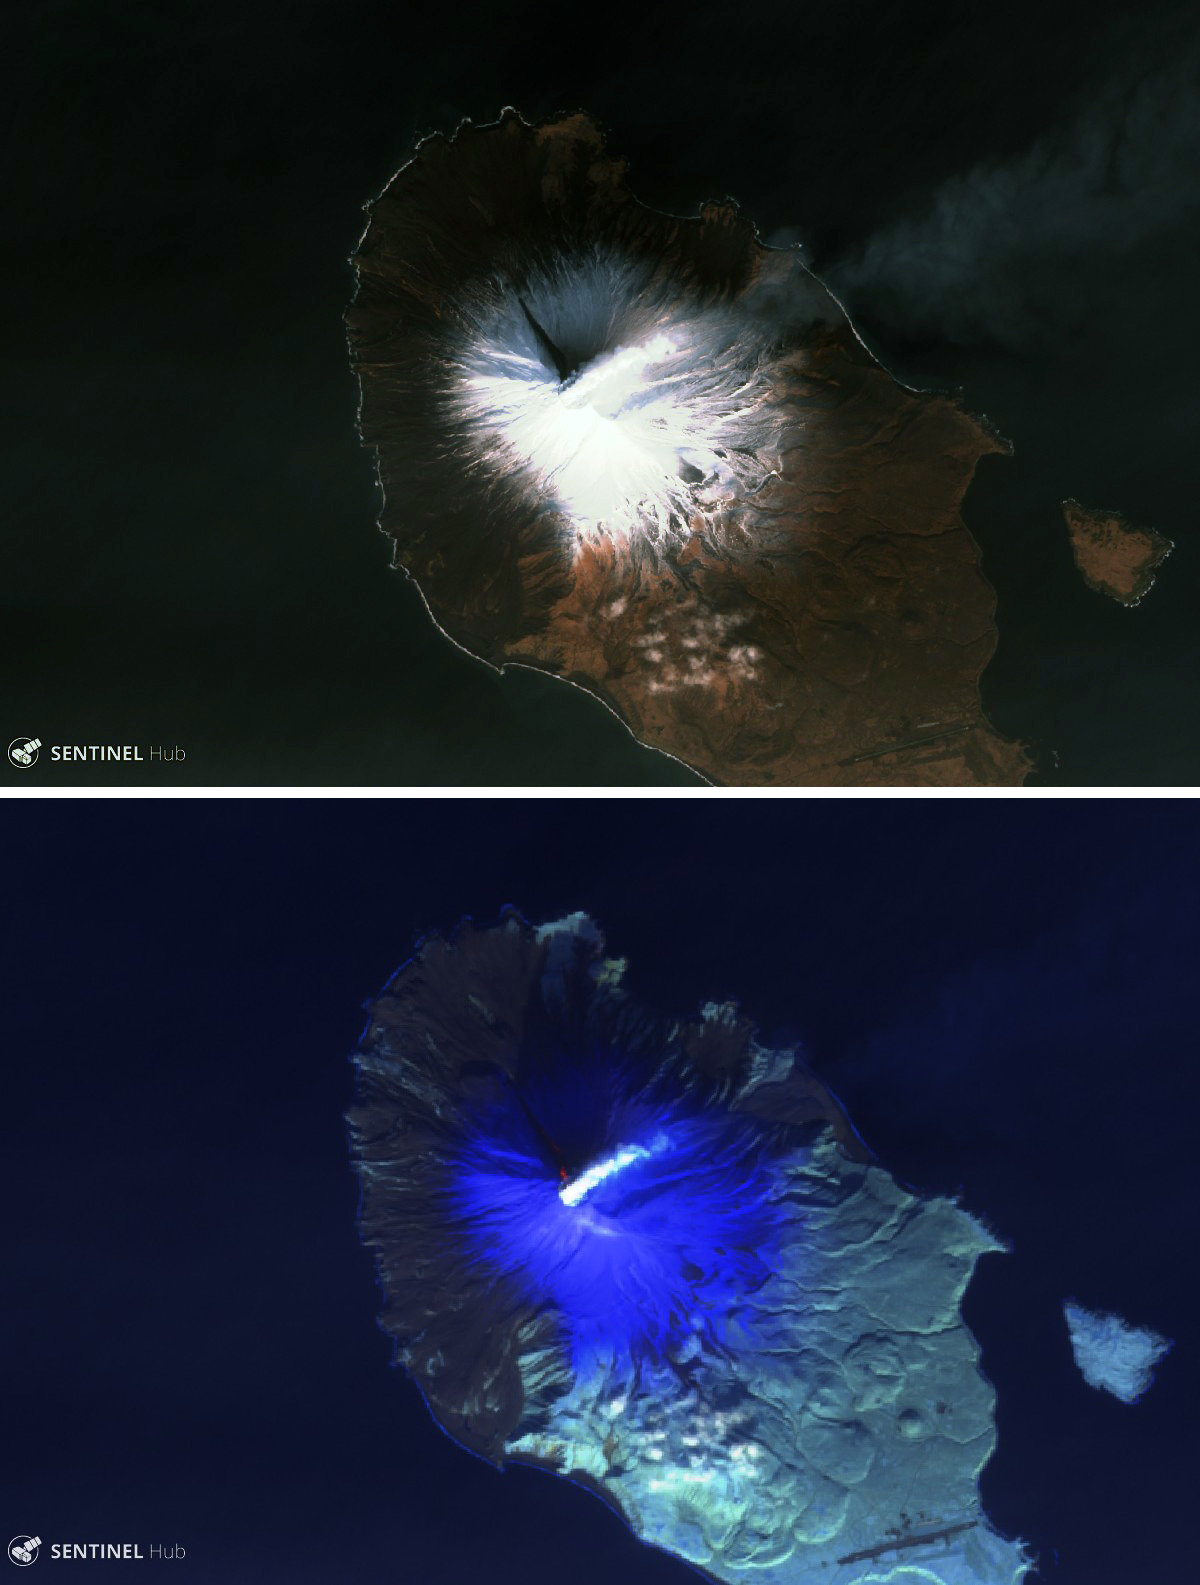 |
Figure 21. Sentinel-2 satellite images of Sarychev Peak on 7 November 2017. Top image (natural color, bands 4, 3, 2) shows a white plume rising from the summit crater and a dark area extending about 1.25 km NW on the snow-covered slopes. Bottom image (atmospheric penetration, bands 12, 11, 8A) shows hot areas (in orange) of volcano material near the summit within the dark area seen in visible imagery. Courtesy of Sentinel Hub Playground. |
The volcano was usually cloud-covered after mid-November 2017 through mid-February 2018. A small white plume seen in Sentinel-2 imagery on 20 February 2018 was not accompanied by a noticeable thermal anomaly, and the island appeared completely snow-covered. No activity of any kind was seen on the next cloud-free images taken on 4 and 11 May 2018, when the summit crater was filled with snow.
KVERT noted in a September report that there had been a thermal anomaly periodically observed after 7 May 2018. Fumarolic plumes were visible on 5 and 18 June 2018 (figure 22). Thermal anomalies were present on 8 and 11-12 September. Moderate explosions were reported during 11-15 September 2018, with ash emissions rising 3-4 km. On 14 September ash plumes drifted as far as 120 km NNE and the Aviation Color Code was raised to Orange. Explosions on 17 September generated ash plumes that rose as high as 4.5 km and drifted 21 km NE. Additional ash plumes identified in satellite images drifted 265 km E during 17-18 September. The eruption continued through 21 September, and a thermal anomaly was again visible on 22 September.
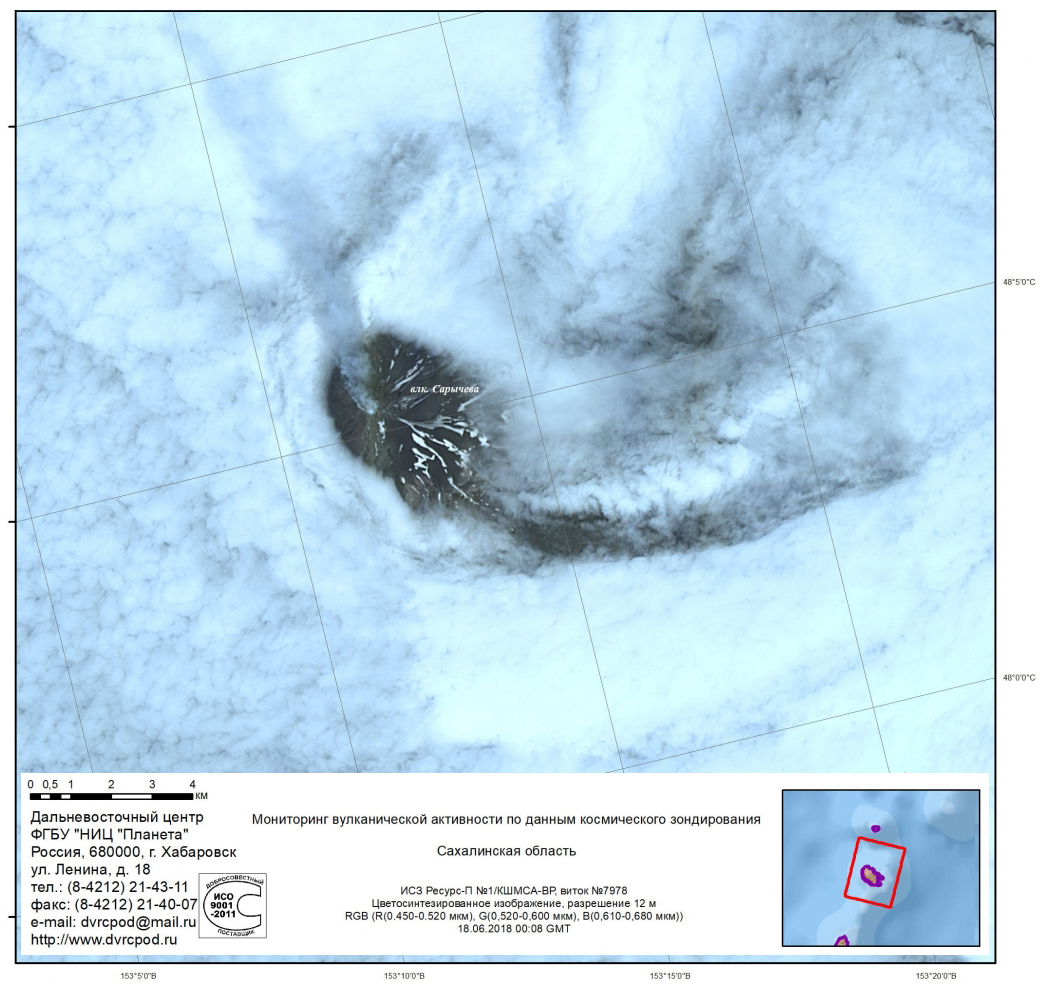 |
Figure 22. Fumarolic activity at Sarychev Peak on 18 June 2018. Courtesy of FEC SRC Planeta, Institute of Volcanology and Seismology FEB RAS, KVERT. |
Based on Tokyo VAAC data and satellite images, KVERT reported that at 1330 on 10 October 2018 an ash plume reached 1.7-2 km altitude and drifted 95 km E. SVERT reported that on 15 October an ash plume rose to 2.1 km altitude and drifted 65-70 km E. KVERT reported that a thermal anomaly was also identified in satellite images on 15 October. No further activity was seen through the end of October.
Thermal anomalies identified in MODIS data by the MIROVA system during October 2016-October 2018 occurred intermittently during the summer months each year (figure 23). However, most of those events were low-power and located several kilometers from the crater, so the heat source is unclear.
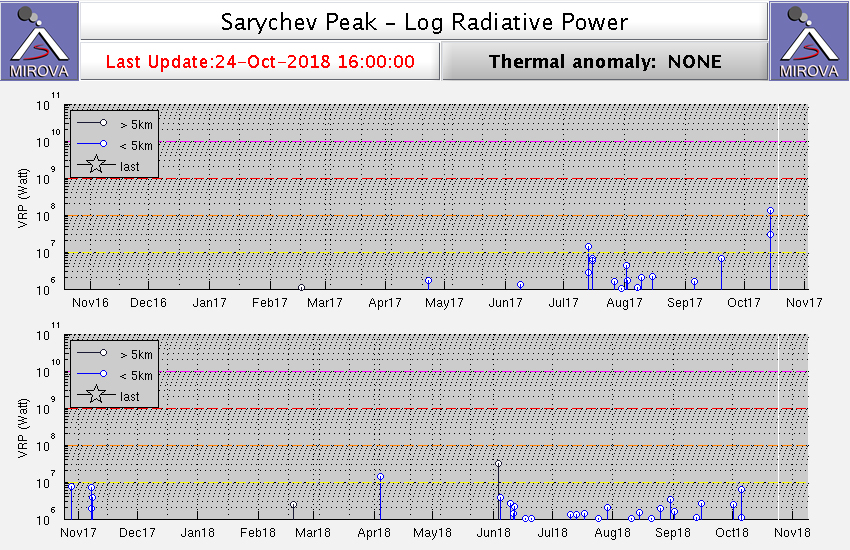 |
Figure 23. Thermal anomalies detected by the MIROVA system using MODIS data at Sarychev Peak for the year ending 18 October 2017 (top) and ending 24 October 2018 (bottom), plotted as log radiative power. Most of the events shown were located several kilometers from the summit crater. Courtesy of MIROVA. |
Information Contacts: Sakhalin Volcanic Eruptions Response Team (SVERT), Institute of Marine Geology and Geophysics (IMG&G) Far East Division Russian Academy of Sciences (FED RAS), 1B Science St., Yuzhno-Sakhalinsk, 693022, Russia (URL: http://www.imgg.ru/); Kamchatka Volcanic Eruptions Response Team (KVERT), Far Eastern Branch, Russian Academy of Sciences, 9 Piip Blvd., Petropavlovsk-Kamchatsky, 683006, Russia (URL: http://www.kscnet.ru/ivs/kvert/); NOAA, Cooperative Institute for Meteorological Satellite Studies (CIMSS), Space Science and Engineering Center (SSEC), University of Wisconsin-Madison, 1225 W. Dayton St. Madison, WI 53706, (URL: http://cimss.ssec.wisc.edu/); MIROVA (Middle InfraRed Observation of Volcanic Activity), a collaborative project between the Universities of Turin and Florence (Italy) supported by the Centre for Volcanic Risk of the Italian Civil Protection Department (URL: http://www.mirovaweb.it/); Sentinel Hub Playground (URL: https://www.sentinel-hub.com/explore/sentinel-playground).
Brief ash emission reported on 16 May 2019
Located on Matua Island in the central Kurile Islands of Russia, Sarychev Peak has historical observations of eruptions dating back to 1765. Thermal activity in October 2017 (BGVN 43:11) was the first sign of renewed activity since a major eruption with ash plumes and pyroclastic flows in June 2009 (BGVN 34:06). The following month (November 2017) there was fresh dark material on the NW flank that appeared to be from a flow of some kind. After that, intermittent thermal anomalies were the only activity reported until explosions with ash plumes took place that lasted for about a week in mid-September 2018 (figure 24). Additional explosions in mid-October were the last reported for 2018. A single ash explosion in May 2019 was the only reported activity from November 2018 to May 2019, the period covered in this report. Information is provided by the Sakhalin Volcanic Eruption Response Team (SVERT) and the Kamchatka Volcanic Eruptions Response Team (KVERT), members of the Far Eastern Branch, Russian Academy of Sciences (FEB RAS), and from satellite data.
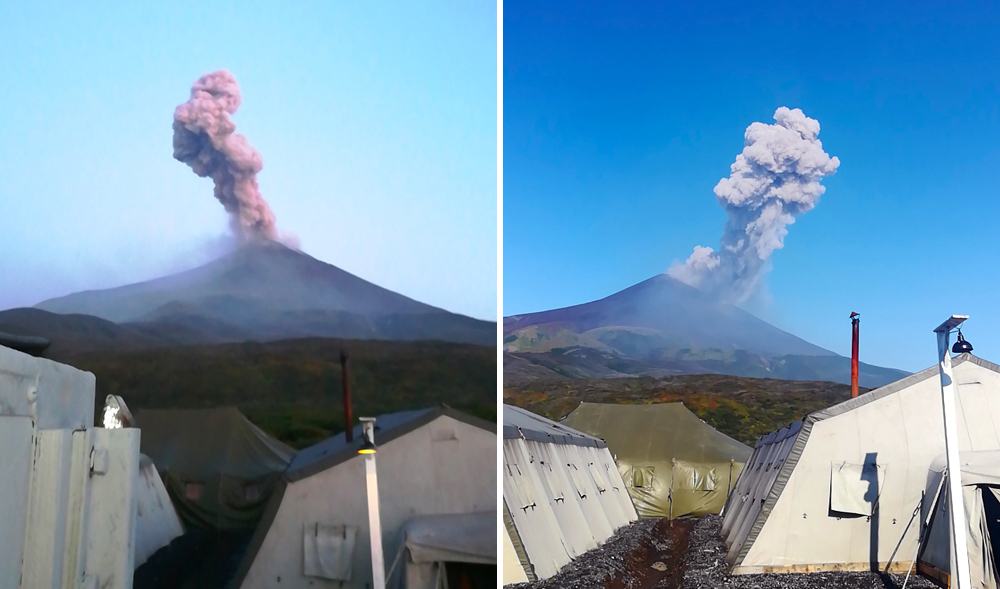 |
Figure 24. Multiple ash plumes were observed at Sarychev Peak during September 2018. Left: 13 September. Right: 18 September. Photos by S. A. Tatarenkov, courtesy of IMGG FEB RAS. |
Satellite imagery in mid-September and early October 2018 showed gas emissions from the summit vent, and a weak thermal anomaly in October (figure 25). KVERT lowered the Aviation Color Code from Orange to Yellow on 1 November 2018, and SVERT released a VONA on 12 November 2018 lowering the Aviation Color Code from Yellow to Green after the ash emissions in October.
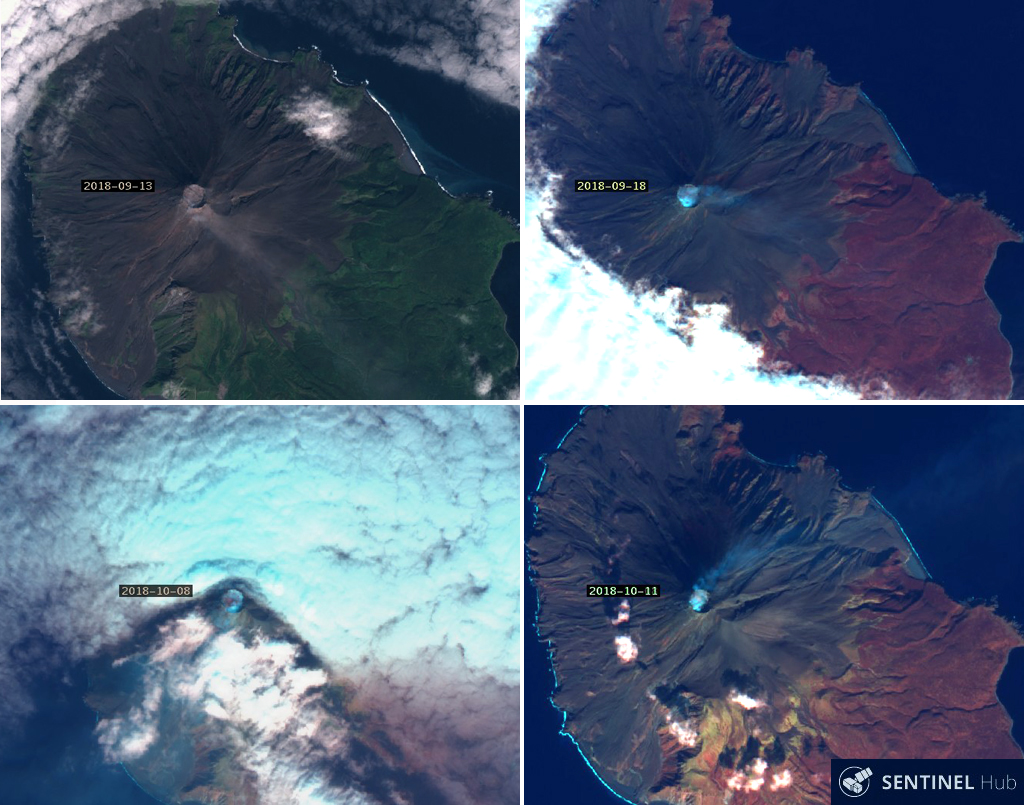 |
Figure 25. Minor gas emissions were visible at Sarychev Peak in satellite imagery in mid-September and early October 2018; a possible weak thermal anomaly appeared in the summit vent in October. Top left: 13 September. Top right: 18 September. Bottom left: 8 October. Bottom right: 11 October. The 13 September image uses "Natural Color" rendering (bands 4, 3, 2) and the other images use "Geology" rendering (bands 12, 4, 2). Sentinel-2 satellite imagery courtesy of Sentinel Hub Playground. |
Sentinel-2 satellite instruments in March, April, and May 2019 acquired images that showed dark streaks in the snow-covered peak radiating out from the summit vent in various directions. As the spring snows melted, more dark streaks appeared. It is unclear whether the streaks represent fresh ash, particulates from gas emissions in the snow, or concentrated material from earlier emissions that were exposed during the spring melting (figure 26). No further activity was reported until the Tokyo VAAC noted an eruption on 16 May 2019 that produced an ash plume which rose to 2.4 km altitude and drifted S. It was visible in satellite imagery for 3 or 4 hours before dissipating. SVERT reported the ash plume visible up to 50 km SE of the island. They also noted that weak thermal anomalies had been seen in satellite data on 10, 12, and 17 May 2019.
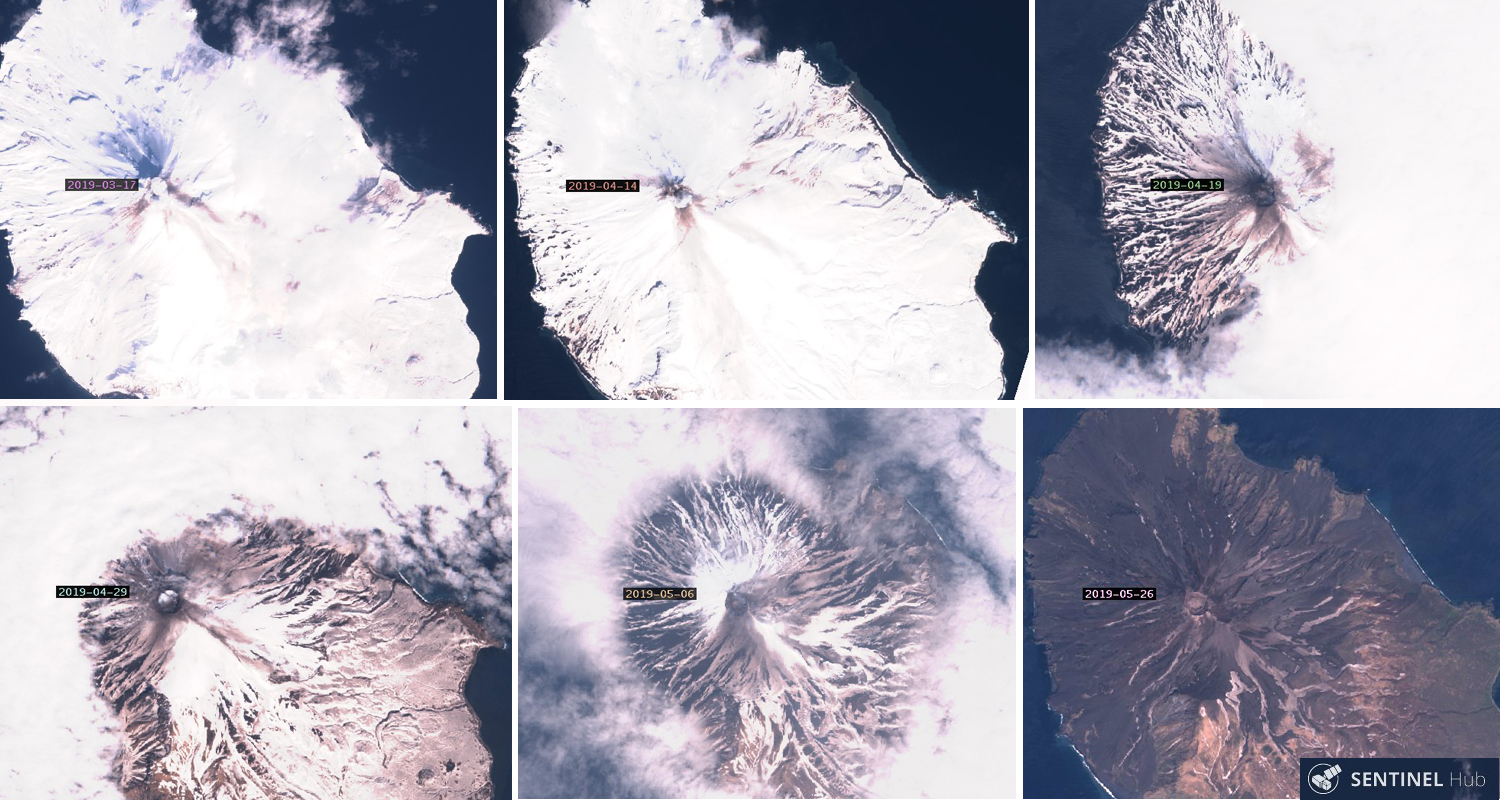 |
Figure 26. Streaks of brown radiate outward from the summit vent at Sarychev Peak in Sentinel-2 satellite imagery taken during March-May 2019. The exact material and timing of deposition is unknown. Top left: 17 March. Top middle: 14 April. Top right: 19 April. Bottom left: 29 April, Bottom middle: 6 May. Bottom right: 26 May 2019. Sentinel-2 images with "Natural Color" rendering using bands 4,3, and 2. Courtesy of Sentinel Hub Playground. |
Information Contacts: Institute of Marine Geology and Geophysics, Far Eastern Branch of the Russian Academy of Sciences, (FEB RAS IMGG), 693 022 Russia, Yuzhno-Sakhalinsk, ul. Science 1B (URL: http://imgg.ru/ru); Sakhalin Volcanic Eruption Response Team (SVERT), Institute of Marine Geology and Geophysics, Far Eastern Branch, Russian Academy of Science, Nauki st., 1B, Yuzhno-Sakhalinsk, Russia, 693022 (URL: http://www.imgg.ru/en/, http://www.imgg.ru/ru/svert/reports); Kamchatka Volcanic Eruptions Response Team (KVERT), Far Eastern Branch, Russian Academy of Sciences, 9 Piip Blvd., Petropavlovsk-Kamchatsky, 683006, Russia (URL: http://www.kscnet.ru/ivs/kvert/); Tokyo Volcanic Ash Advisory Center (VAAC), 1-3-4 Otemachi, Chiyoda-ku, Tokyo, Japan (URL: http://ds.data.jma.go.jp/svd/vaac/data/); Sentinel Hub Playground (URL: https://www.sentinel-hub.com/explore/sentinel-playground).
Ash plume on 11 August; thermal anomalies from late May to early October 2019
Sarychev Peak, located on Matua Island in the central Kurile Islands of Russia, has had eruptions reported since 1765. Renewed activity began in October 2017, followed by a major eruption in June 2009 that included pyroclastic flows and ash plumes (BGVN 43:11 and 34:06). Thermal anomalies, explosions, and ash plumes took place between September and October 2018. A single ash explosion occurred in May 2019. Another ash plume was seen on 11 August, and small thermal anomalies were present in infrared imagery during June-October 2019. Information is provided by the Sakhalin Volcanic Eruption Response Team (SVERT) and the Tokyo Volcanic Ash Advisory Center (VAAC), with satellite imagery from Sentinel-2.
Satellite images from Sentinel-2 showed small white plumes from Sarychev Peak during clear weather on 4 and 14 August 2019 (figure 27); similar plumes were observed on a total of nine clear weather days between late June and October 2019. According to SVERT and the Tokyo VAAC, satellite data from HIMAWARI-8 showed an ash plume rising to an altitude of 2.7 km and drifting 50 km SE on 11 August. It was visible for a few days before dissipating. No further volcanism was detected by SVERT, and no activity was evident in a 17 August Sentinel-2 image (figure 27).
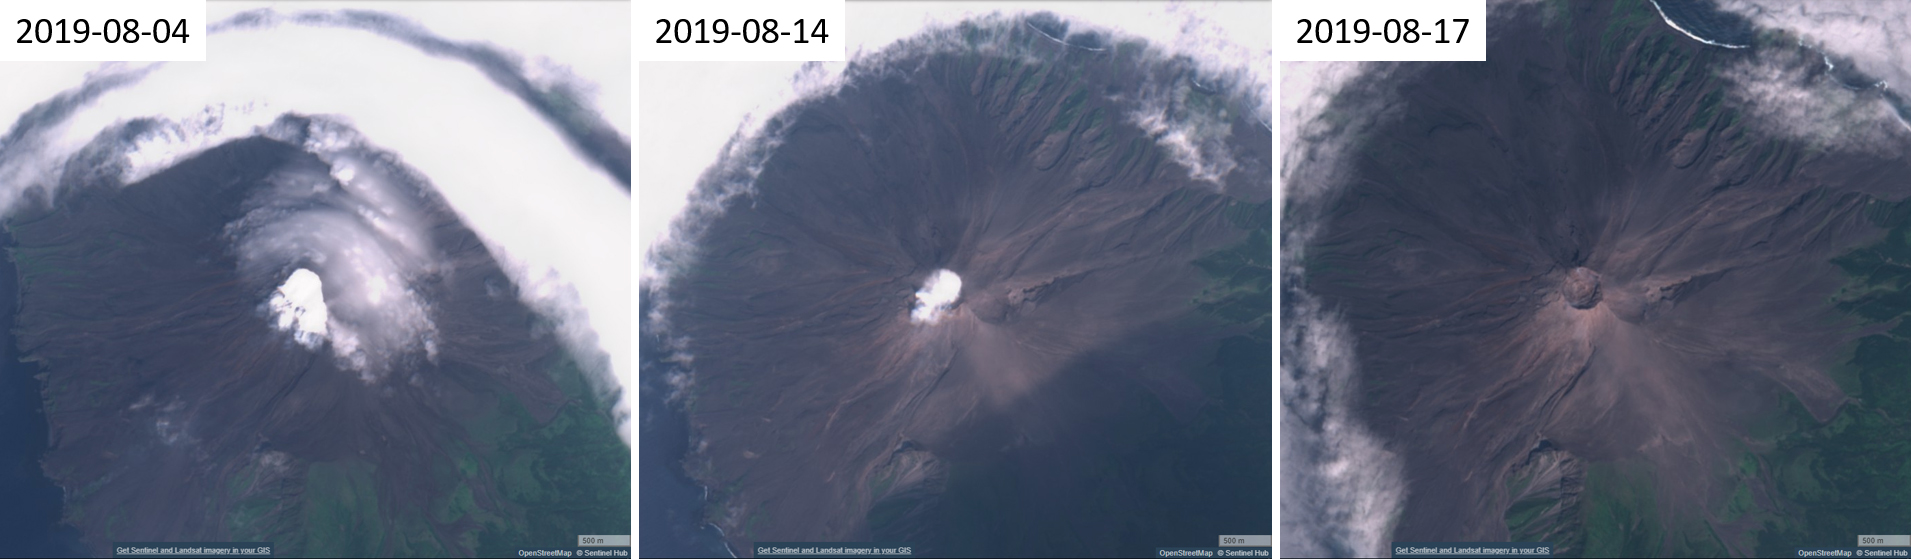 |
Figure 27. Small white plumes were visible at Sarychev Peak in Sentinel-2 satellite images on 4 and 14 August 2019 (left and center). No activity was seen on 17 August (right). All three Sentinel-2 images use the "Natural Color" (bands 4, 3, 2) rendering; courtesy of Sentinel Hub Playground. |
Intermittent weak thermal anomalies were detected by the MIROVA system using MODIS data from late May through 7 October 2019 (figure 28). Sentinel-2 satellite imagery from 28 June, 13 and 23 July, 9 August, and 21 October showed a very small thermal anomaly, but on 28 September a pronounced thermal anomaly was visible (figure 29). No additional thermal anomalies were identified from any source after 7 October through the end of the month.
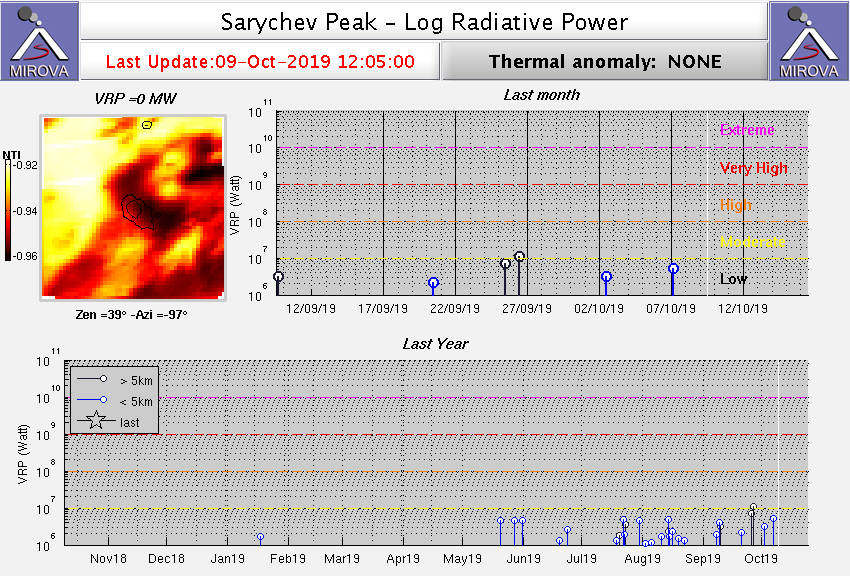 |
Figure 28. Thermal anomalies detected at Sarychev Peak by the MIROVA system (Log Radiative Power) using MODIS data for the year ending on 9 October 2019. Courtesy of MIROVA. |
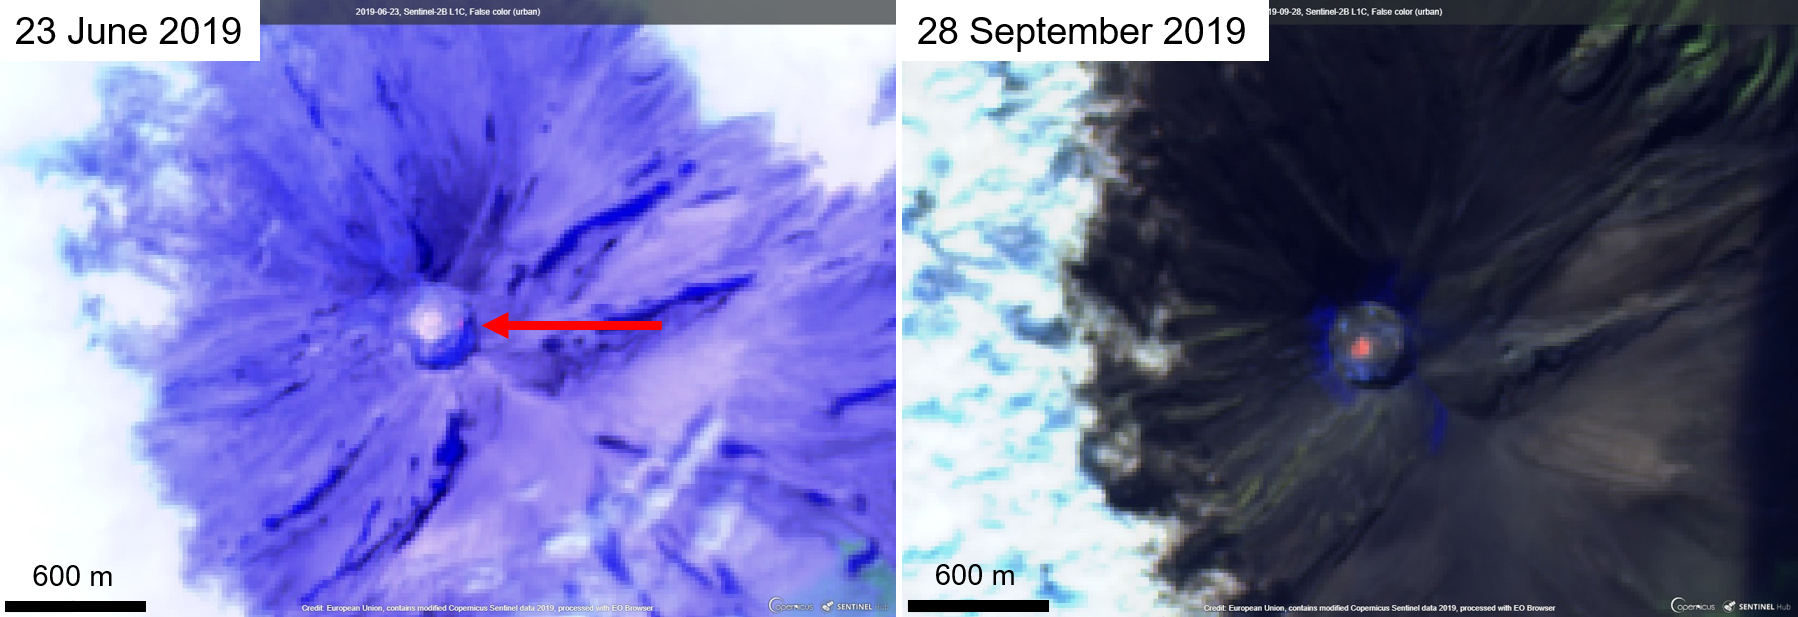 |
Figure 29. Sentinel-2 satellite images of Sarychev Peak on 23 June and 28 September 2019. A small thermal anomaly is visible on the eastern side of the crater on 23 June (left, indicated by arrow), while the thermal anomaly is more pronounced and visible in the middle of the crater on 28 September (right). Both Sentinel-2 satellite images use the "False Color (Urban)" (bands 12, 11, 4) rendering; courtesy of Sentinel Hub Playground. |
Information Contacts: Sakhalin Volcanic Eruption Response Team (SVERT), Institute of Marine Geology and Geophysics, Far Eastern Branch, Russian Academy of Science, Nauki st., 1B, Yuzhno-Sakhalinsk, Russia, 693022 (URL: http://www.imgg.ru/en/, http://www.imgg.ru/ru/svert/reports); Tokyo Volcanic Ash Advisory Center (VAAC), 1-3-4 Otemachi, Chiyoda-ku, Tokyo, Japan (URL: http://ds.data.jma.go.jp/svd/vaac/data/); MIROVA (Middle InfraRed Observation of Volcanic Activity), a collaborative project between the Universities of Turin and Florence (Italy) supported by the Centre for Volcanic Risk of the Italian Civil Protection Department (URL: http://www.mirovaweb.it/); Sentinel Hub Playground (URL: https://www.sentinel-hub.com/explore/sentinel-playground).
Ash eruption in March 2020; lava extrusion in August filled and then overflowed the crater in January 2021
Sarychev Peak forms the surface of Matua Island in the Kurile Islands with reported activity dating back to around 1765. Recent activity that started in May 2019 included ash and gas emission and elevated temperatures within the summit crater detected by satellite sensors, with the last reported activity being an ash plume reaching 2.7 km altitude on 10 August and thermal anomalies present until 7 October 2019 (BGVN 44:11). This bulletin summarizes activity during November 2019-April 2021 using reports by the Sakhalin Volcanic Eruption Response Team (SVERT) and the Kamchatka Volcanic Eruptions Response Team (KVERT), along with satellite data.
No cloud-free satellite images were found of the summit in November 2019, but Sentinel-2 satellite images showed weak gas-and-steam emissions on 2 and 20 December. Cloud-free Sentinel-2 images showed gas-and-steam emission through January 2020, and a thermal anomaly was detected in the crater on the 29th (figure 30). No clear satellite images of the summit area were found, but there is evidence of gas emission in February. Evidence of a new eruption is seen in satellite imagery of thin linear ash deposits across the snow on 1, 19, and 30 March 2020, all extending SE from the crater (figure 31). The crater was obscured by gas emissions on the 19th and a clear view of the crater floor showed no thermal anomaly on the 31st.
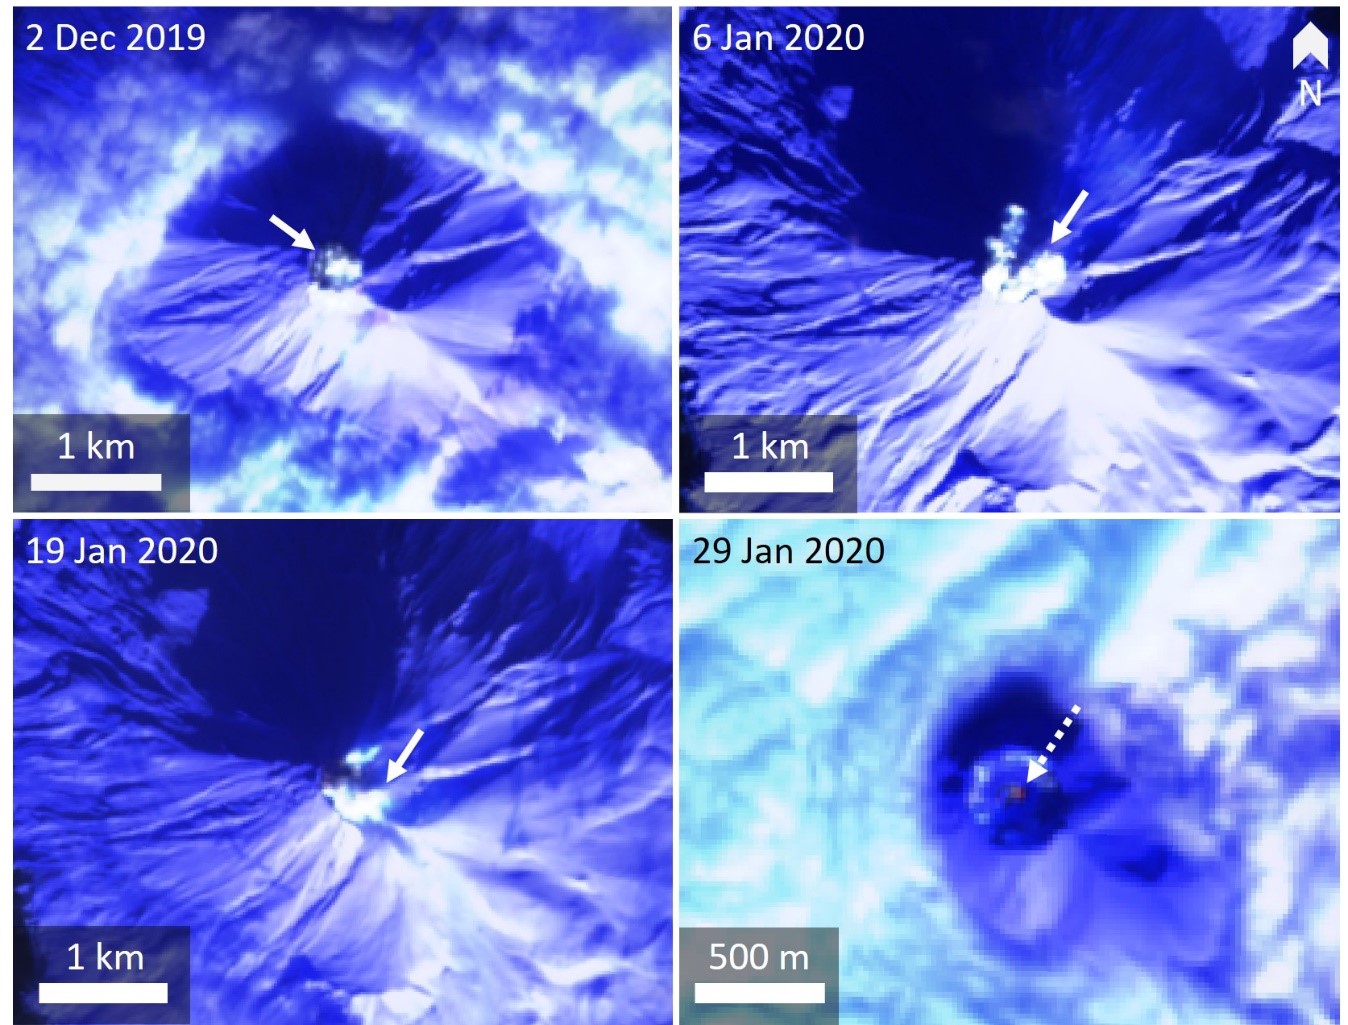 |
Figure 30. These thermal satellite images show the Sarychev Peak summit area in December 2019 and January 2020. The images from 2 December 2019, 6 January, and 19 January 2020 show gas emissions (solid arrows). The 29 January image shows a small area with an elevated temperature on the crater floor (dashed arrow). Sentinel-2 thermal satellite images with false color (urban) (bands 12, 11, 4) rendering. Courtesy of Sentinel Hub Playground. |
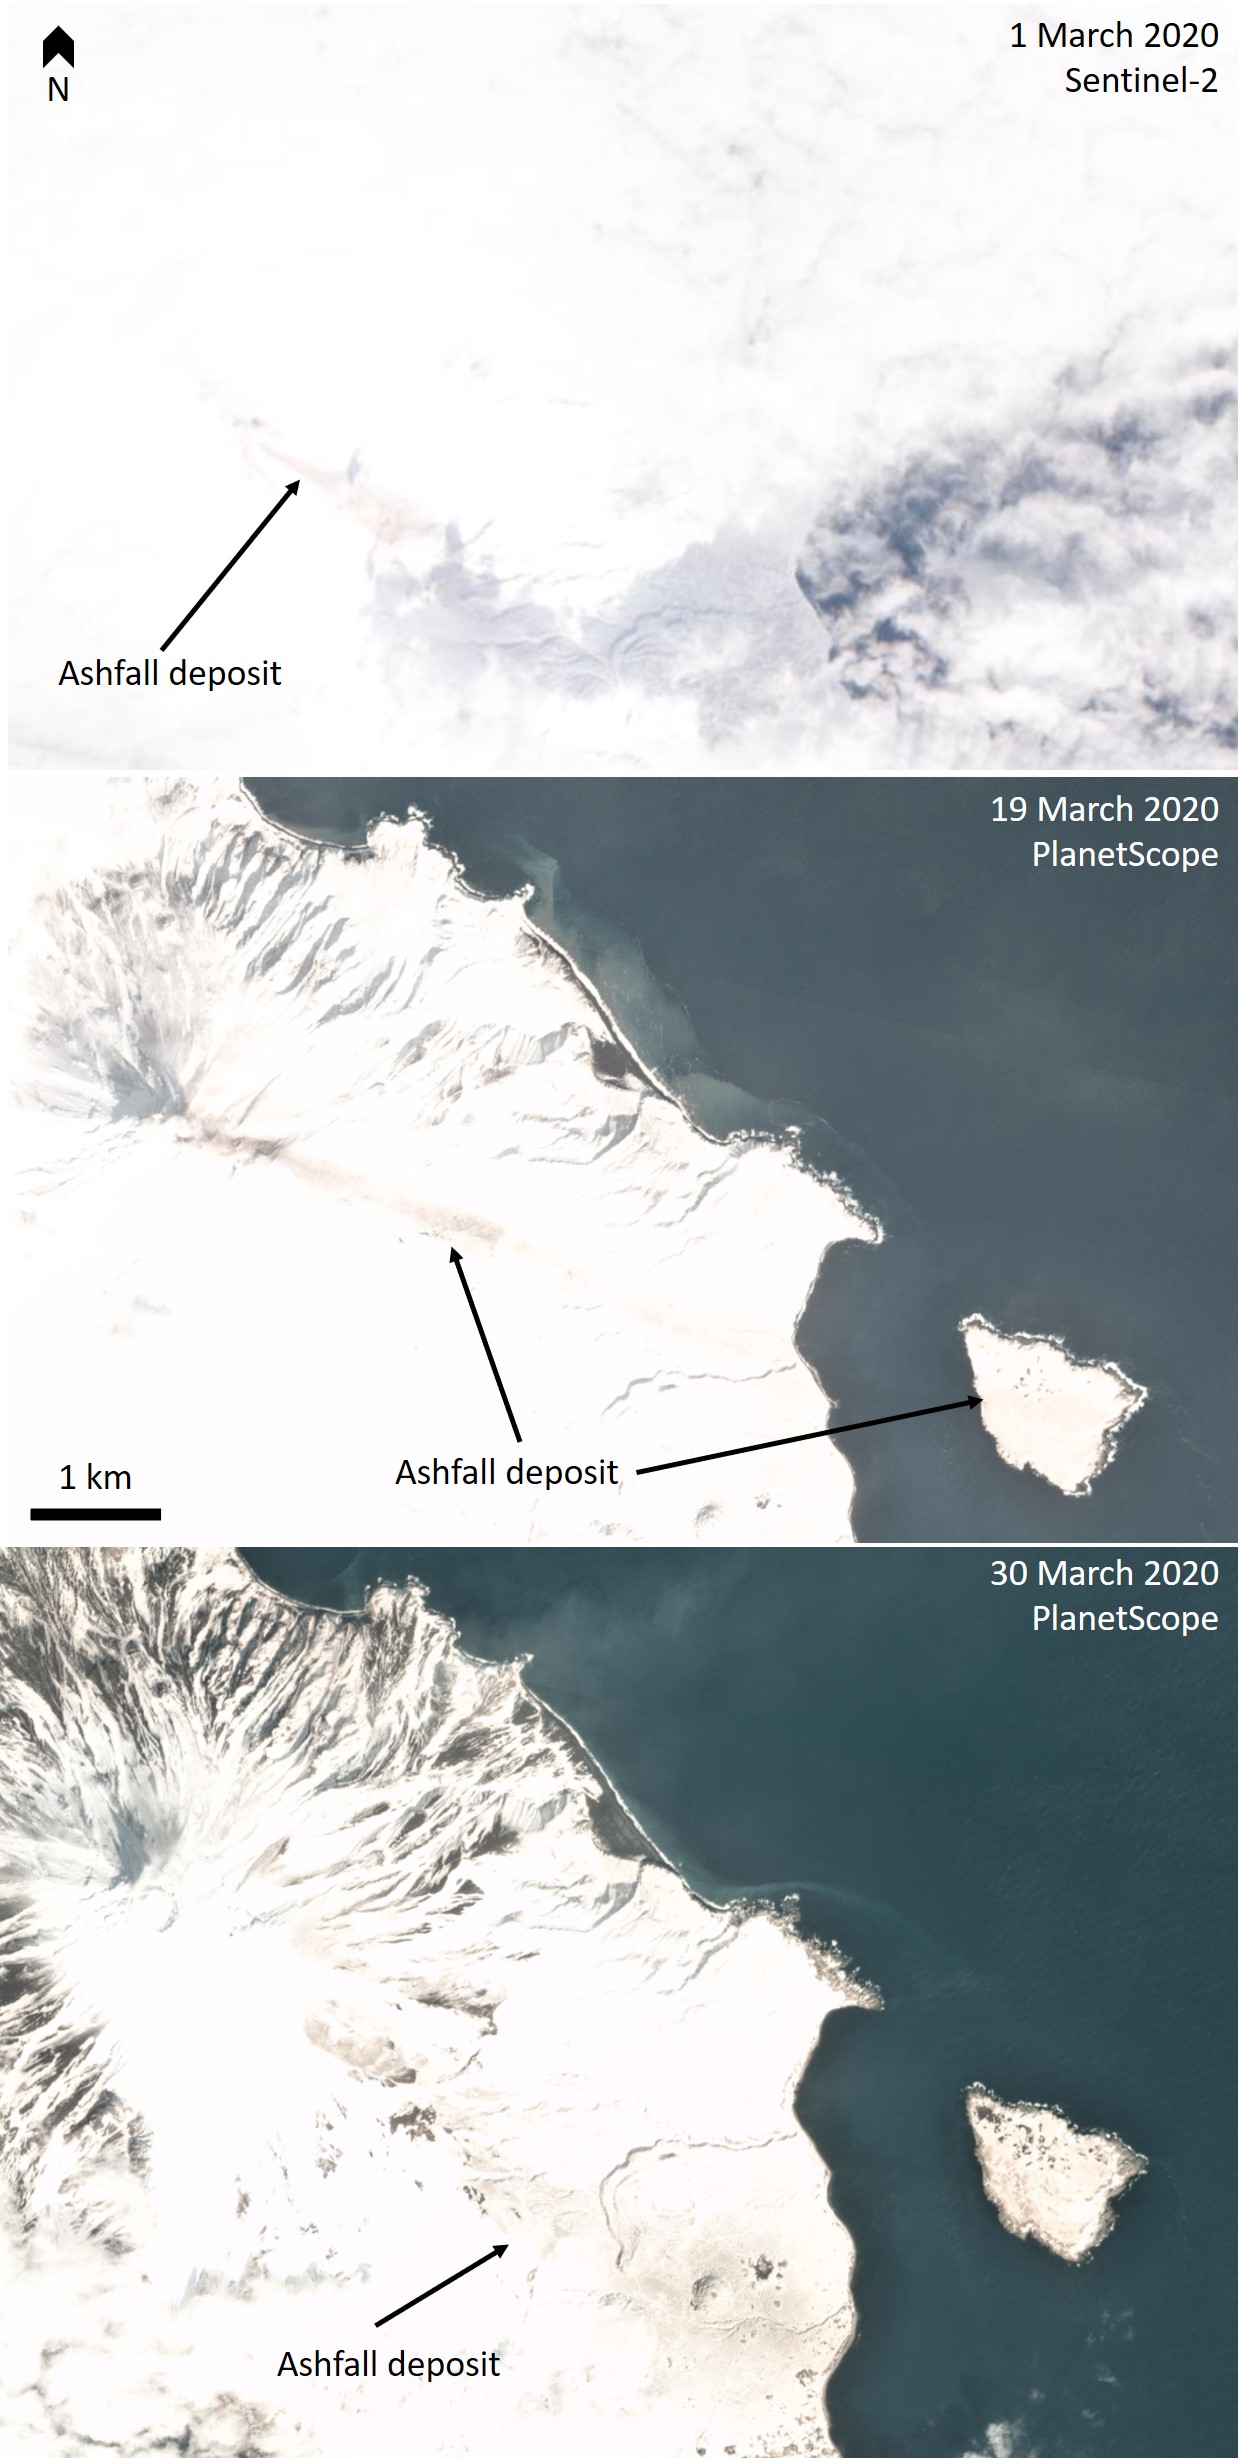 |
Figure 31. Three ashfall deposits are visible SW of the Sarychev Peak summit through March 2020. Based on satellite images, the deposit at the top was emplaced during an event that occurred during 28 February (ash-free image) and 1 March, the middle during 17 (ash-free image) and 19, and the bottom during 26 (ash-free image) and 29 March. Gas-and-steam emissions are obscuring the view into the crater. All images are at the same scale. Sentinel-2 satellite image with natural (bands 4, 3, 2) rendering. Courtesy of Planet Labs. |
The MIROVA system began detecting elevated temperatures in early April 2020, which corresponded to the Sentinel-2 thermal sensor detecting high temperatures on the crater floor (figures 32 and 33). Satellite images also showed continued gas emissions, some days obscuring the view of the crater floor.
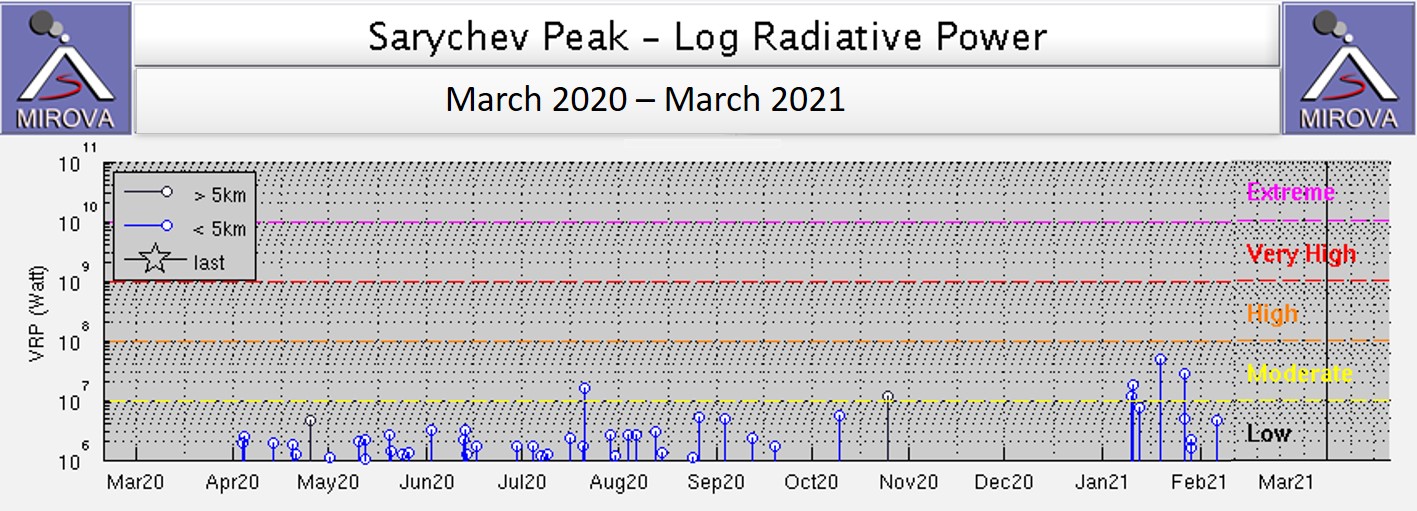 |
Figure 32. This plot shows thermal energy detected at Sarychev Peak by the MIROVA system during March 2020-March 2021. there was an increase in energy detected in April 2020, which was intermittent through to October. After a few months the system detected thermal energy again in mid-January through to early February with a higher output. Courtesy of MIROVA. |
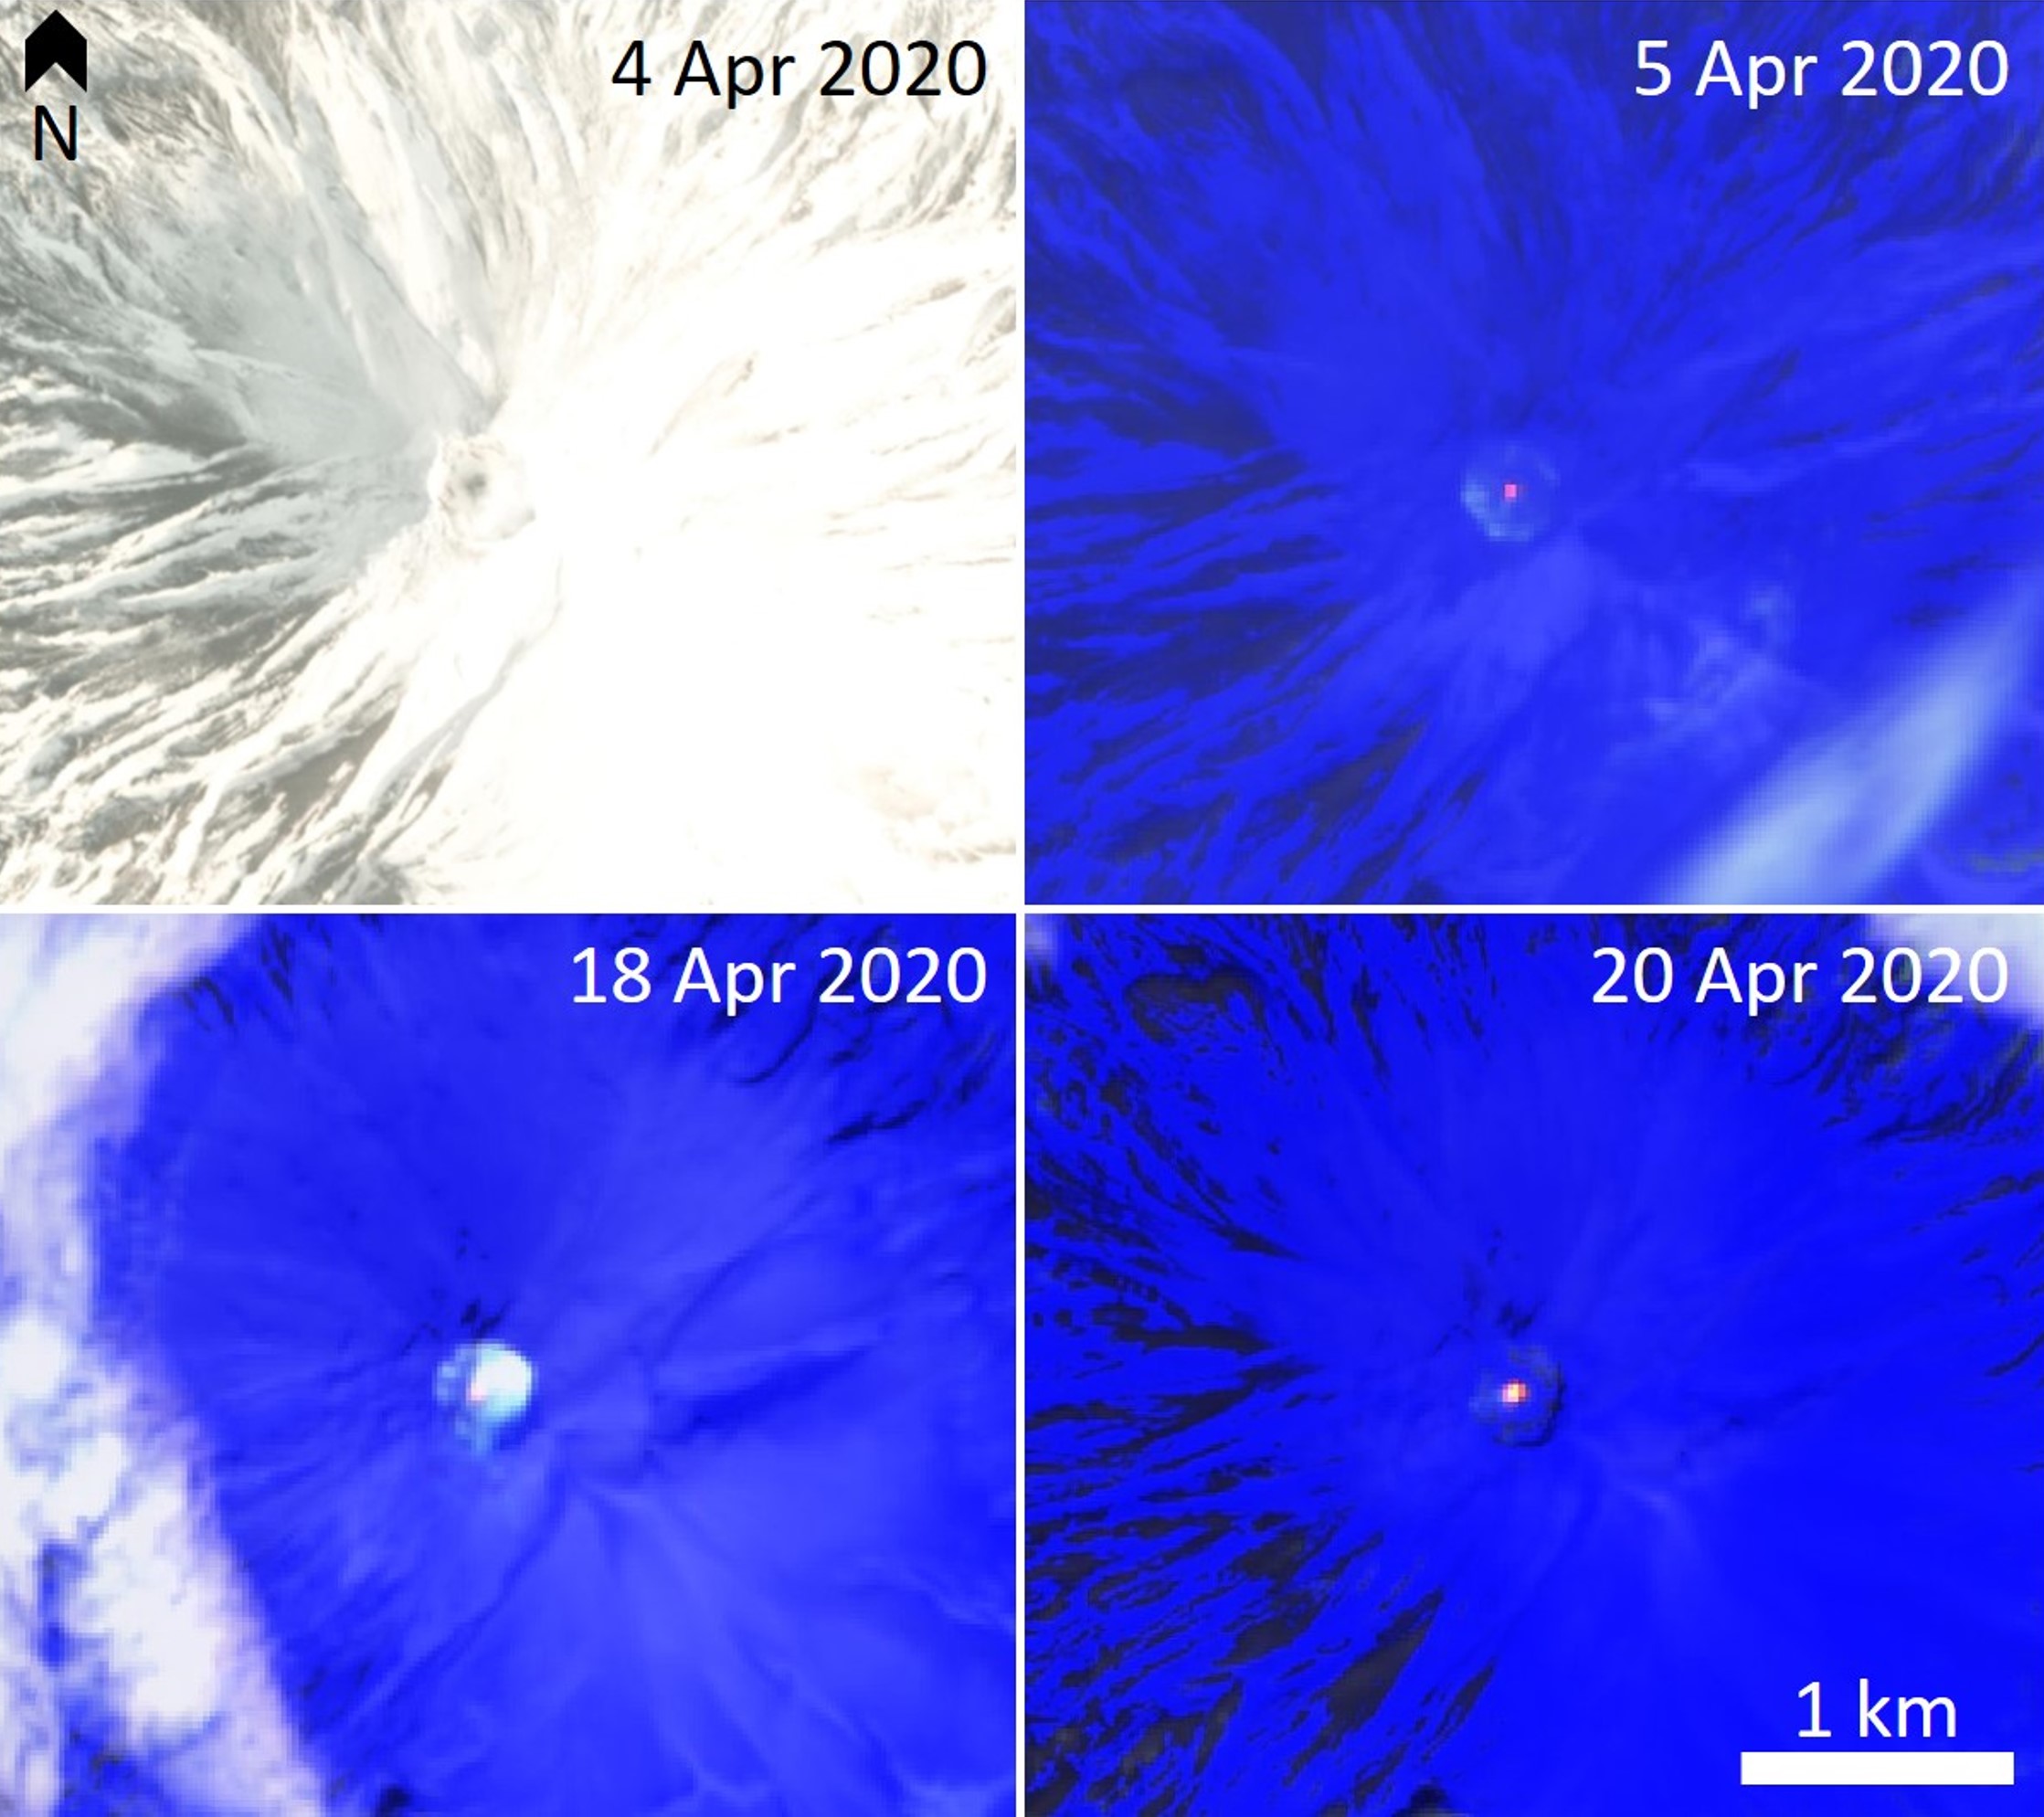 |
Figure 33. Satellite images showing the Sarychev Peak summit crater on 4, 5, 18, and 20 April 2020. The first (top left) PlanetScope image shows the snow-covered summit area with a darker snow-free area on the crater floor. The other three images are Sentinel-2 thermal satellite images with the yellow to red colors indicating high temperatures on the crater floor. There is gas and steam in the crater on the 18th. The high temperature areas correlate to the darker snow-free area in NW part of the crater in the first image; blue colors in the thermal images are snow. Sentinel-2 thermal satellite images have false color (urban) (bands 12, 11, 4) rendering. Courtesy of Planet Labs and Sentinel Hub Playground. |
The thermal anomaly on the crater floor continued through May and June, with cloud-free images showing the same area of elevated temperature as the previous months. By 20 May 2019 data from Sentinel-1 Synthetic Aperture Radar (SAR) showed morphological change in the crater associated with the area of high temperature, and this change continued through June. The TROPOspheric Monitoring Instrument (TROPOMI) detected sulfur dioxide (SO2) content within the plume on 27 May (figure 34). Gas-and-steam emission also continued in June, with more substantial plumes visible on 22 and 27 June (figure 35). TROPOMI again detected SO2 on 24 and 25 June; the plume on 24 June was also visible in Sentinel-2 imagery (figure 36).
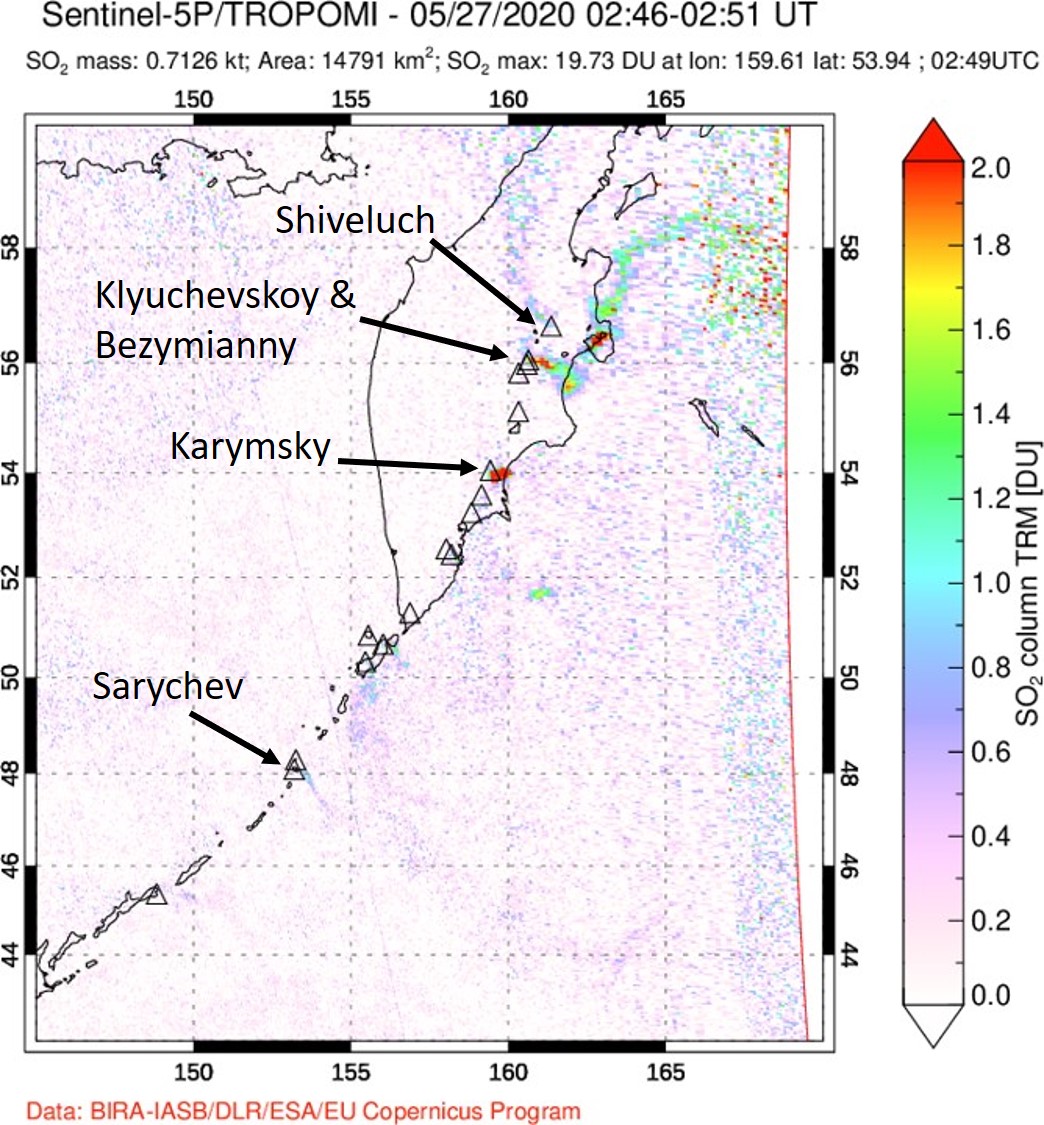 |
Figure 34. This image shows a weak gas plume from Sarychev Peak dispersing to the SE on 27 May 2020, as well as other volcanoes in Kamchatka. TROPOspheric Monitoring Instrument (TROPOMI) data showing sulfur dioxide (SO2) in Dobson Units (DU). Courtesy of NASA Global Sulfur Dioxide Monitoring Page. |
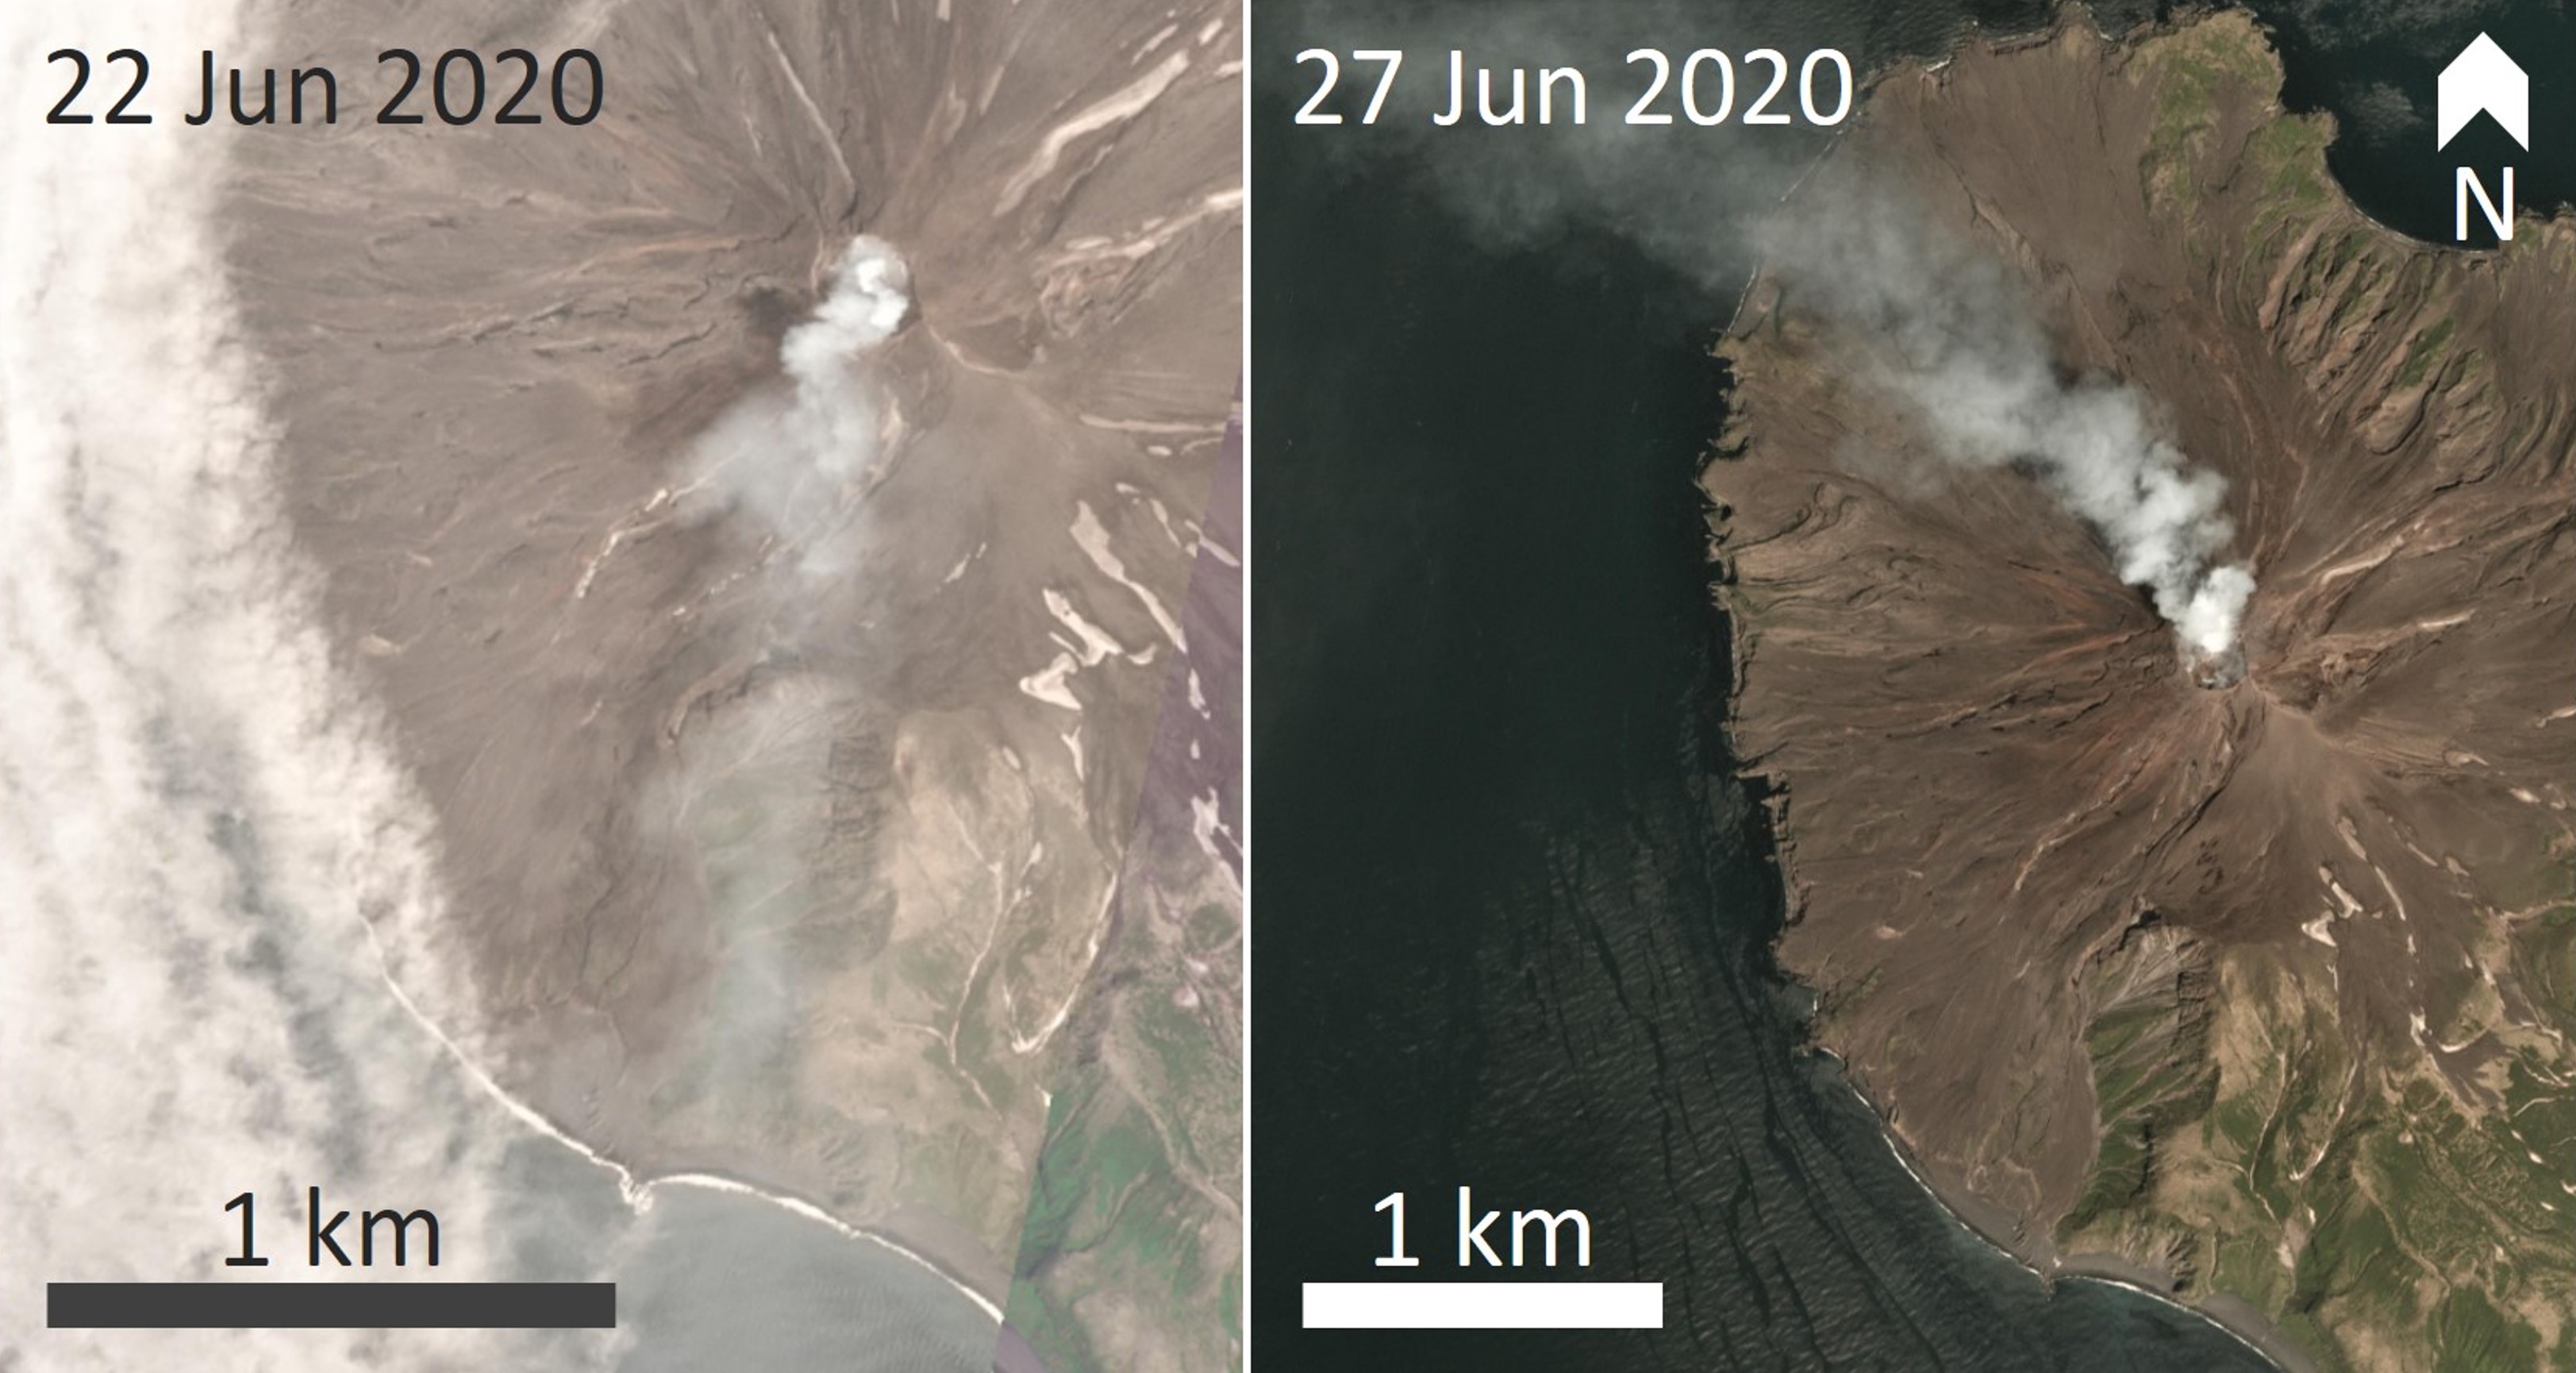 |
Figure 35. These Planet Scope satellite scenes show gas-and-steam plumes emanating from the Sarychev Peak summit crater and dispersing SSW (left) and NW (right) on 22 and 27 June 2020, respectively. Courtesy of Planet Labs. |
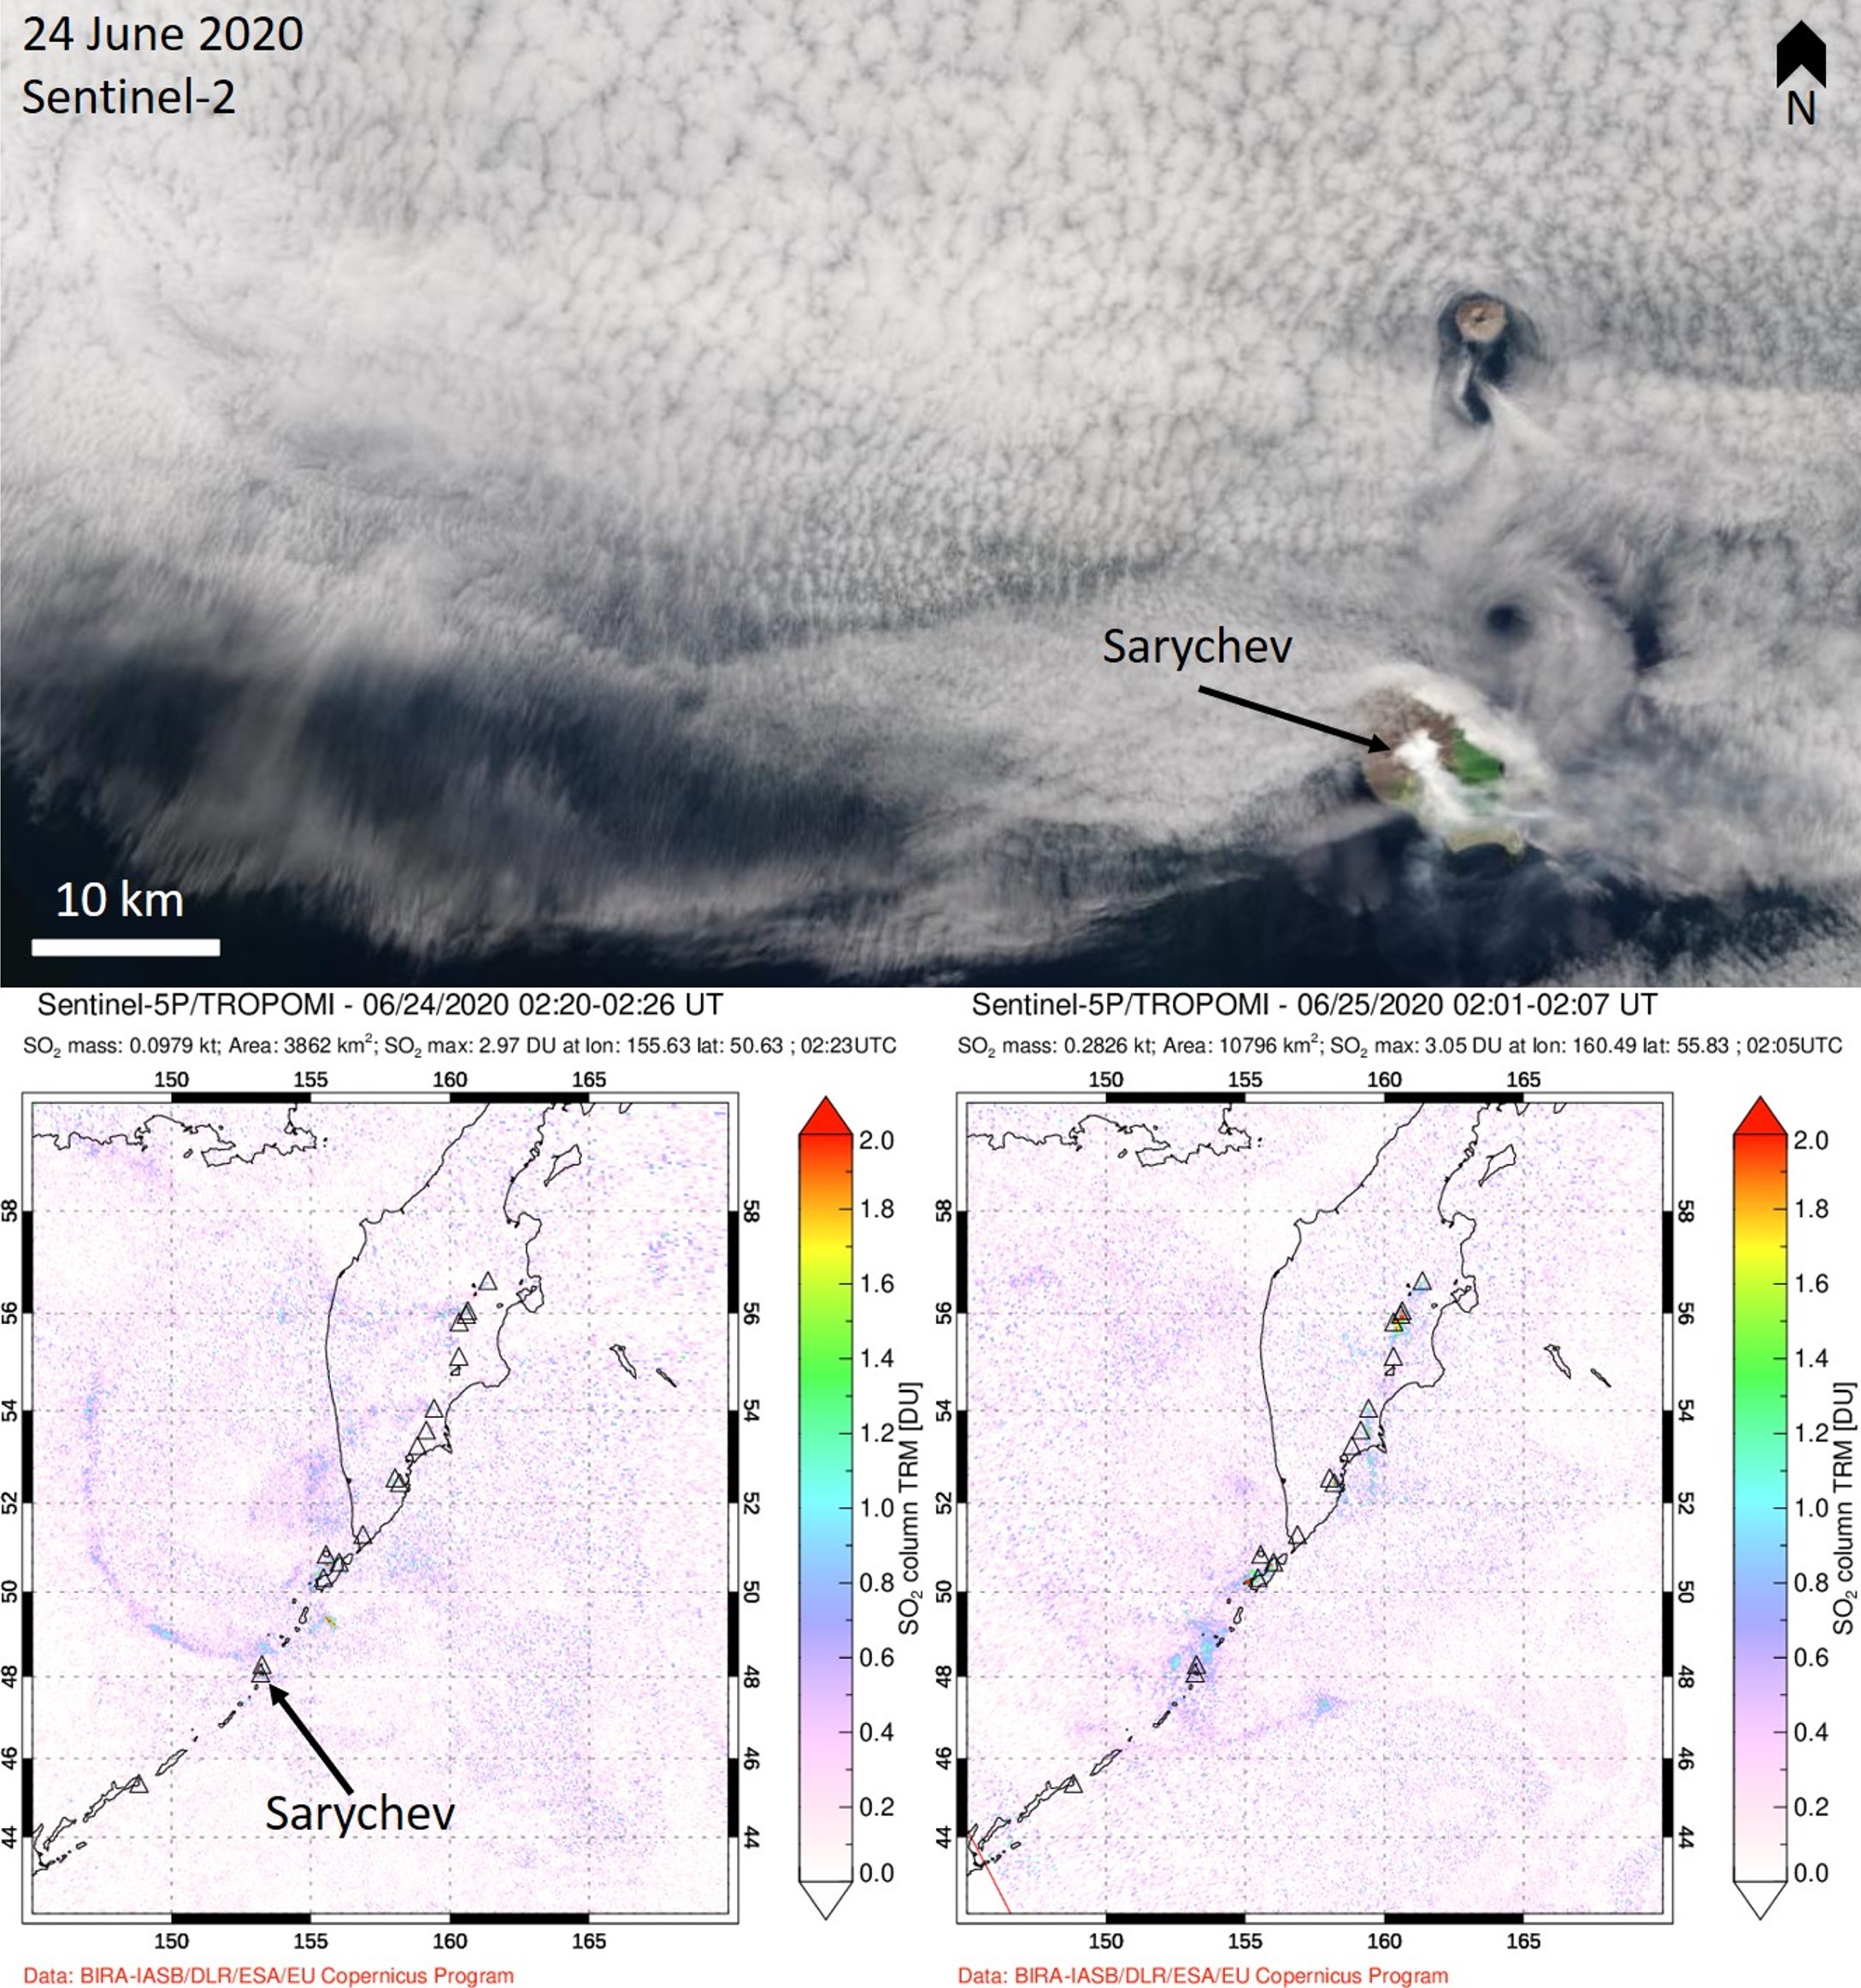 |
Figure 36. Weak gas emission at Sarychev Peak detected by satellite sensors on 25 and 26 June 2020. The top image and the bottom-left images were acquired on the 25th and show the plume being redirected by a meteorological vortex northward before curving to the W and N. Top: Sentinel-2 satellite image with natural color (bands 4, 3, 2) rendering. Courtesy of Planet Labs. Bottom: TROPOspheric Monitoring Instrument (TROPOMI) data showing sulfur dioxide (SO2) in Dobson Units (DU). Courtesy of NASA Global Sulfur Dioxide Monitoring Page. |
Throughout July satellite data show thermal emission and gas-and-steam emission, mostly within plumes dispersing from the summit crater in different directions and sometimes restricted to within the crater (figure 37). On 18 July a PlanetScope image showed lava extrusion in the crater, at the location of the elevated temperature. Sentinel-2 thermal satellite images showed weak thermal energy detected in the same location during August, and degassing continued (figure 38). By 12 August the deformation on the crater floor was clear in SAR data (figure 39), matching the PlanetScope and Sentinel-2 data. From 21 August through to 12 October there was a reduction in thermal energy detected in Sentinel-2 TIR data, with many days not having clear views of the crater floor. Plume emission continued throughout this time. There were no images showing elevated temperatures during November and December when clouds frequently covered the crater area, and there were also no anomalies detected by the MIROVA system.
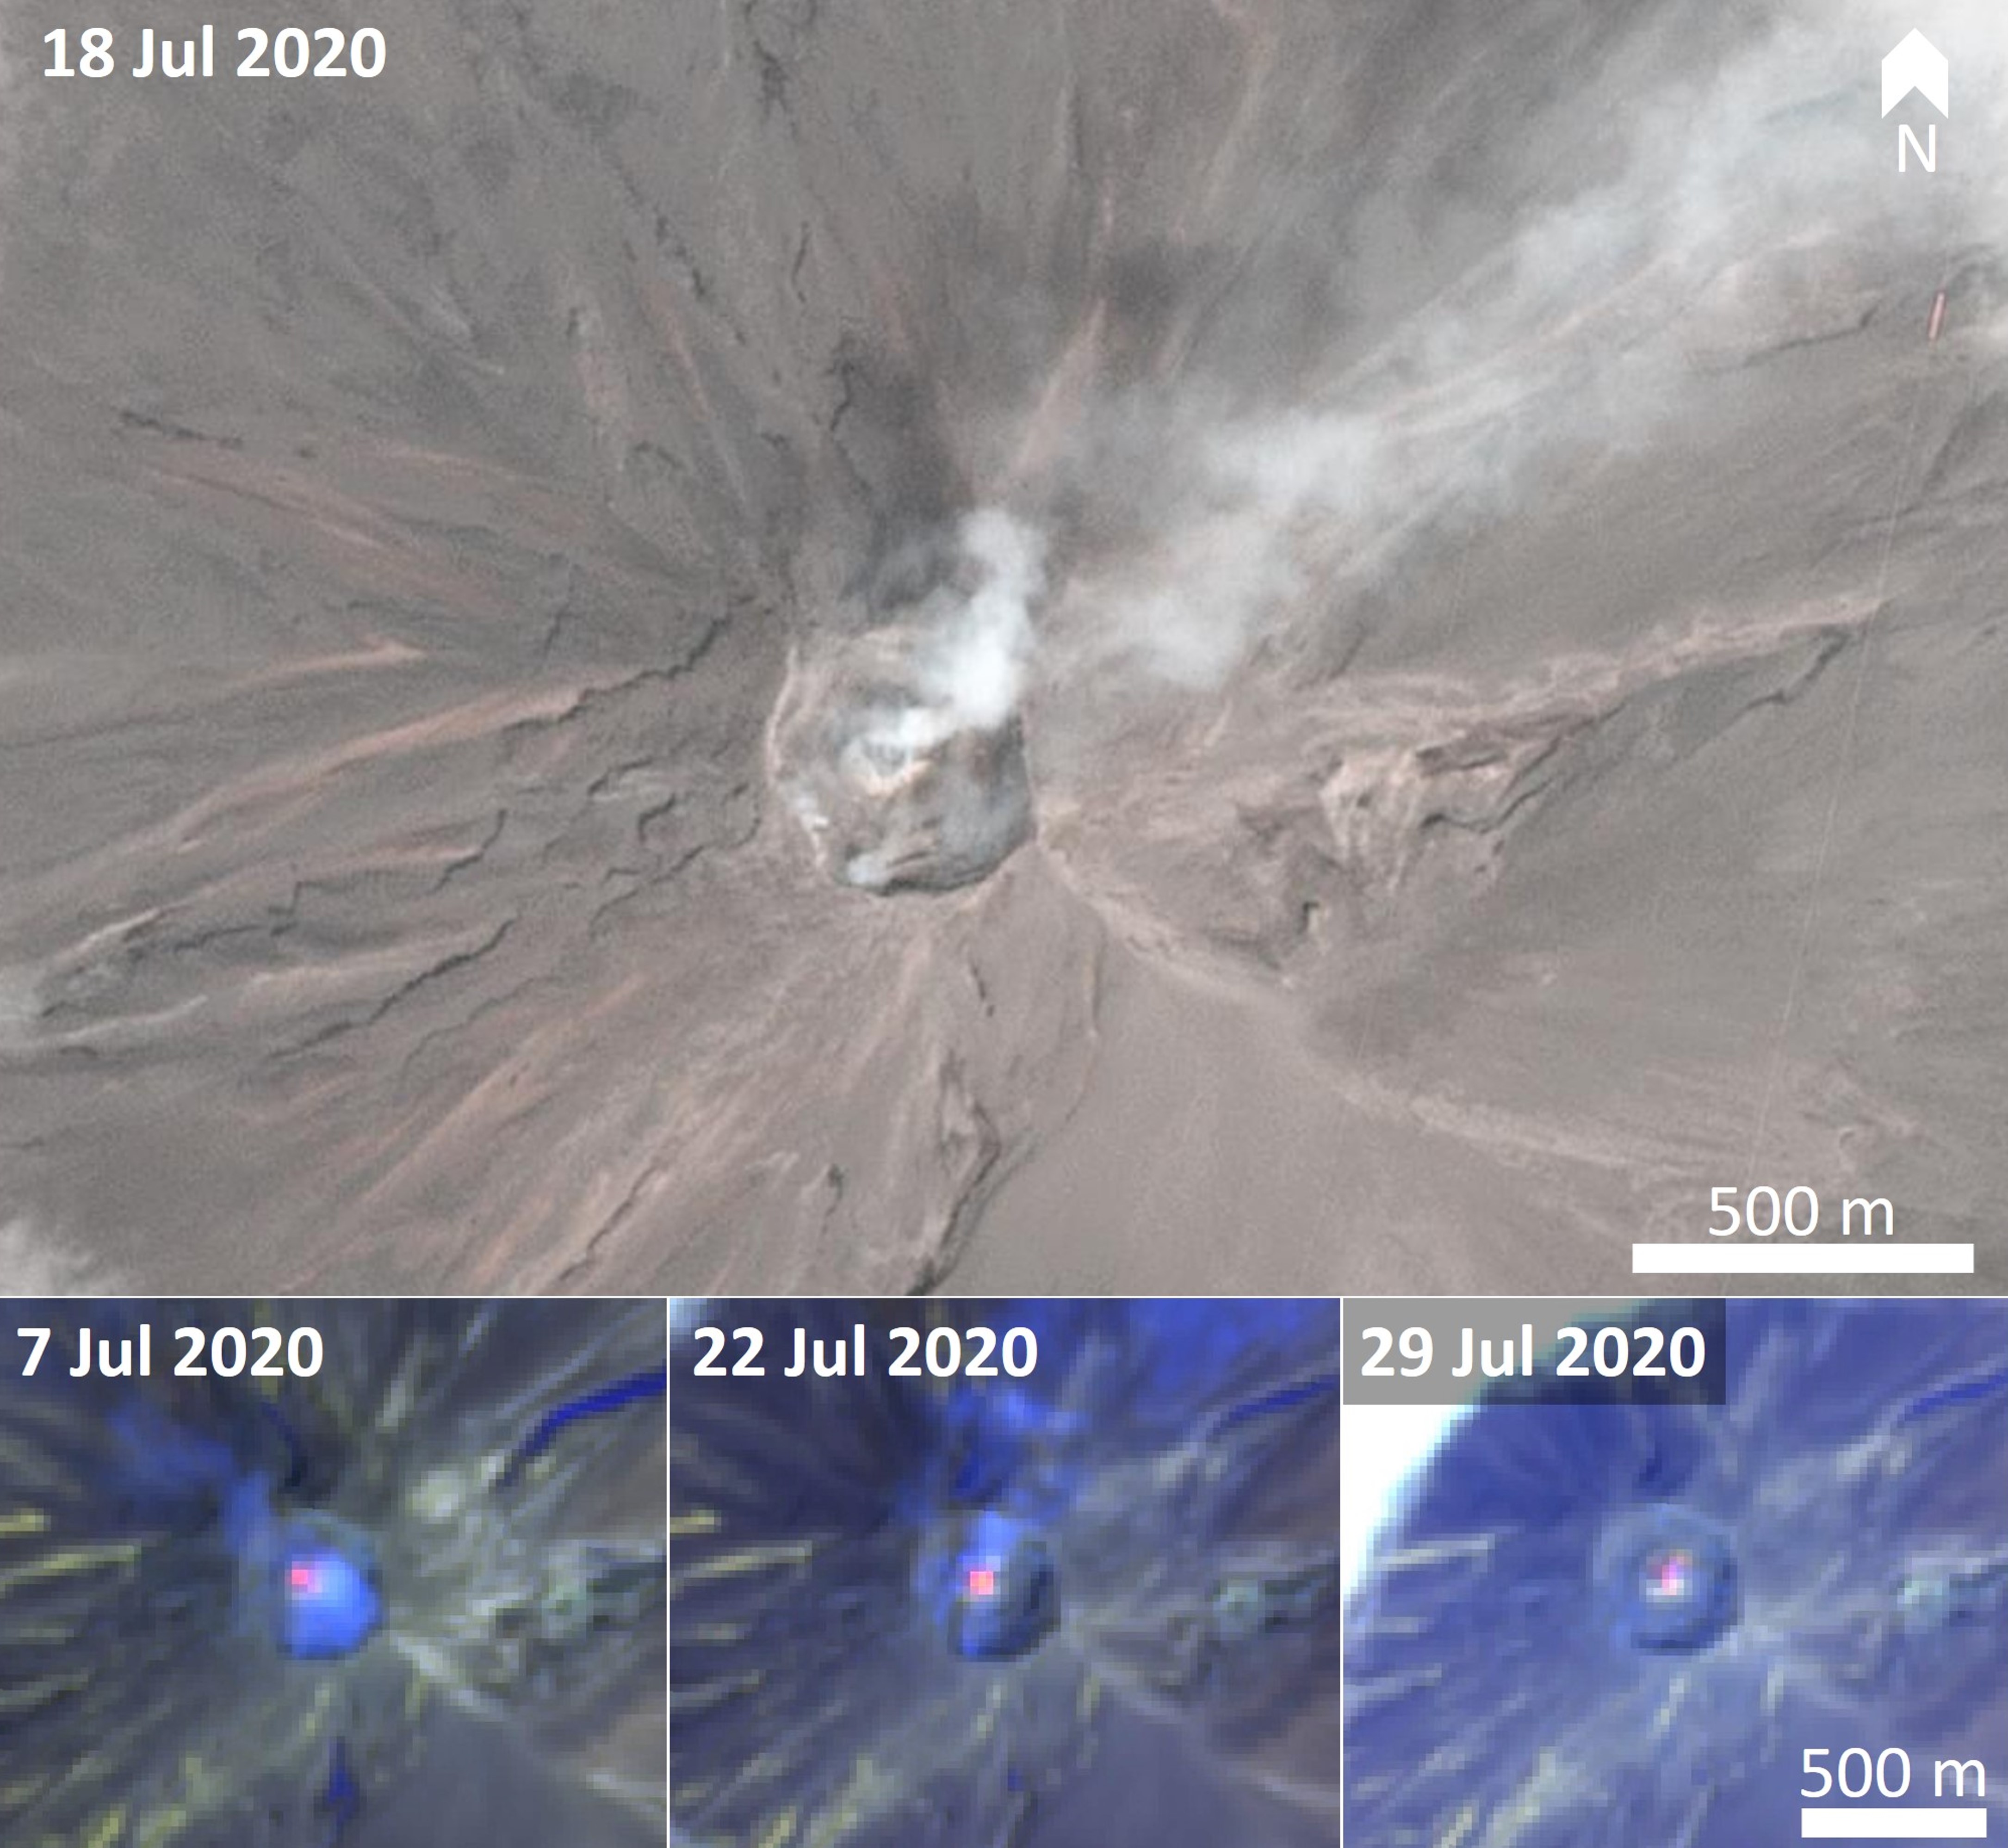 |
Figure 37. The PlanetScope natural color (top) and Sentinel-2 thermal (bottom) satellite images indicate lava in the crater during July 2020. Gas emission is also visible in the images. Sentinel-2 thermal satellite images have false color (urban) (bands 12, 11, 4) rendering. Courtesy of Planet Labs and Sentinel Hub Playground. |
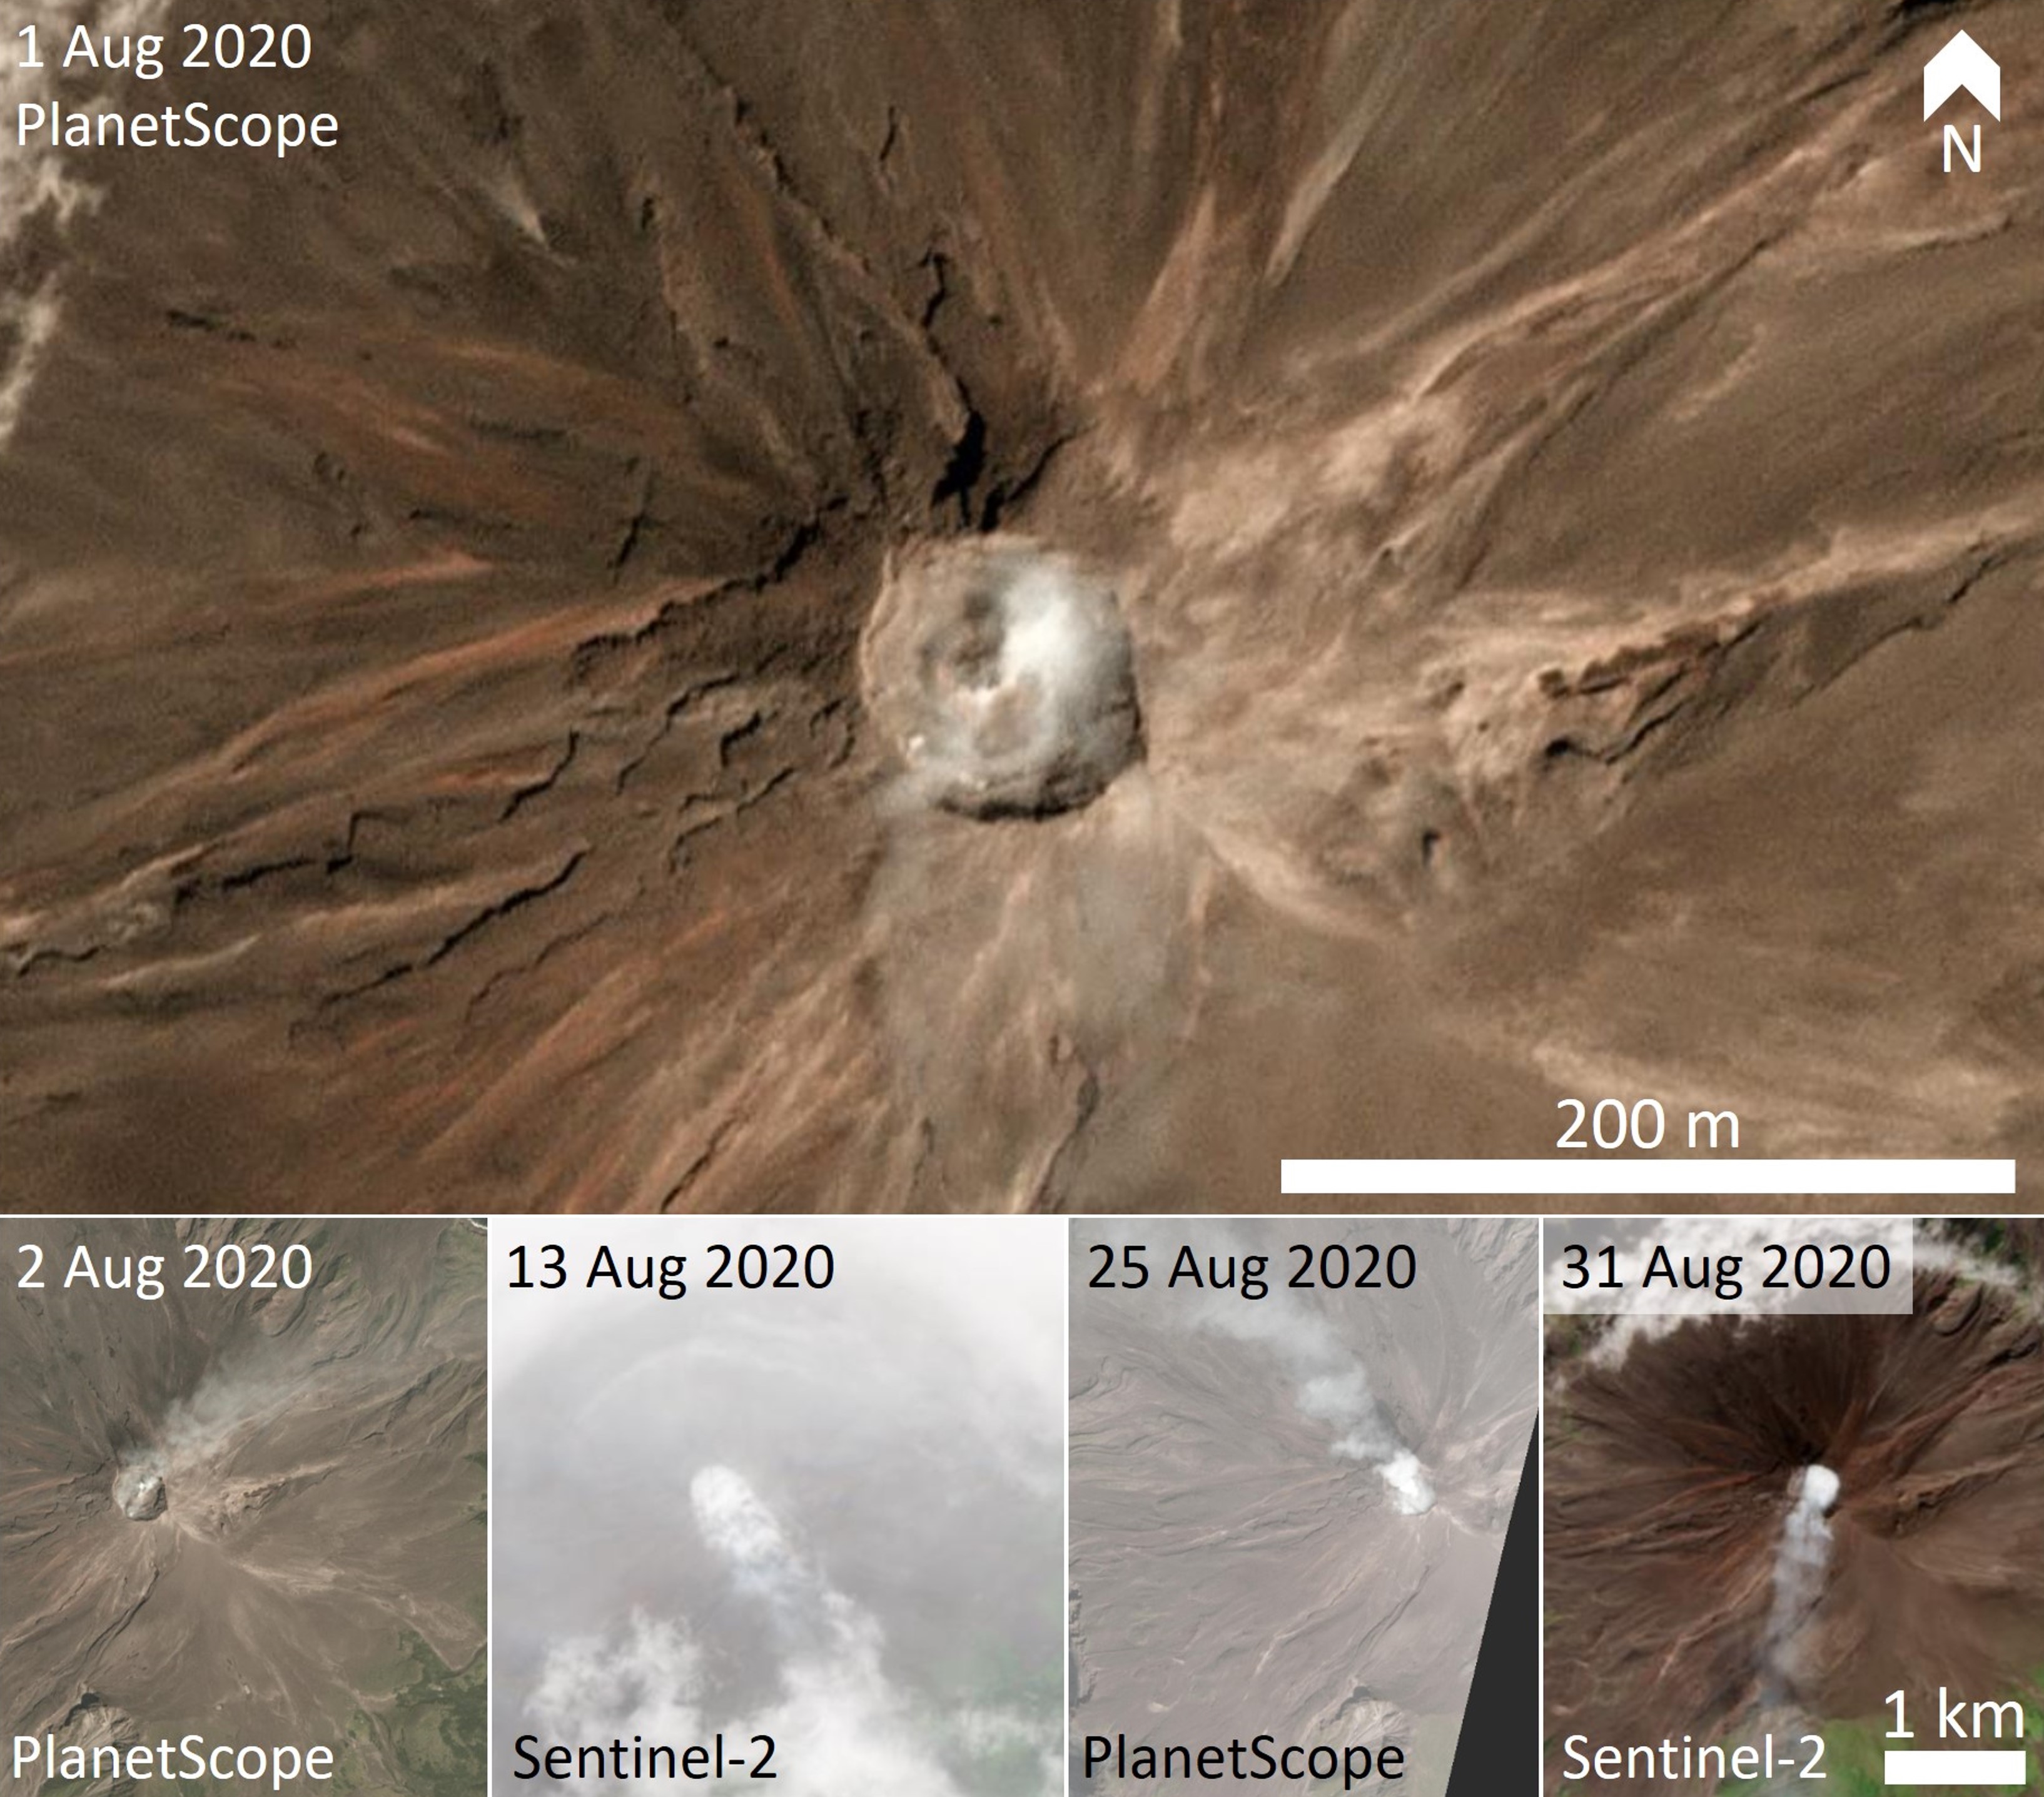 |
Figure 38. PlanetScope and Sentinel-2 satellite images acquired during August 2020 show lava in the crater and gas-and-steam plumes being dispersed in different directions by winds. Sentinel-2 satellite image with natural color (bands 4, 3, 2) rendering. Courtesy of Planet Labs and Sentinel Hub Playground. |
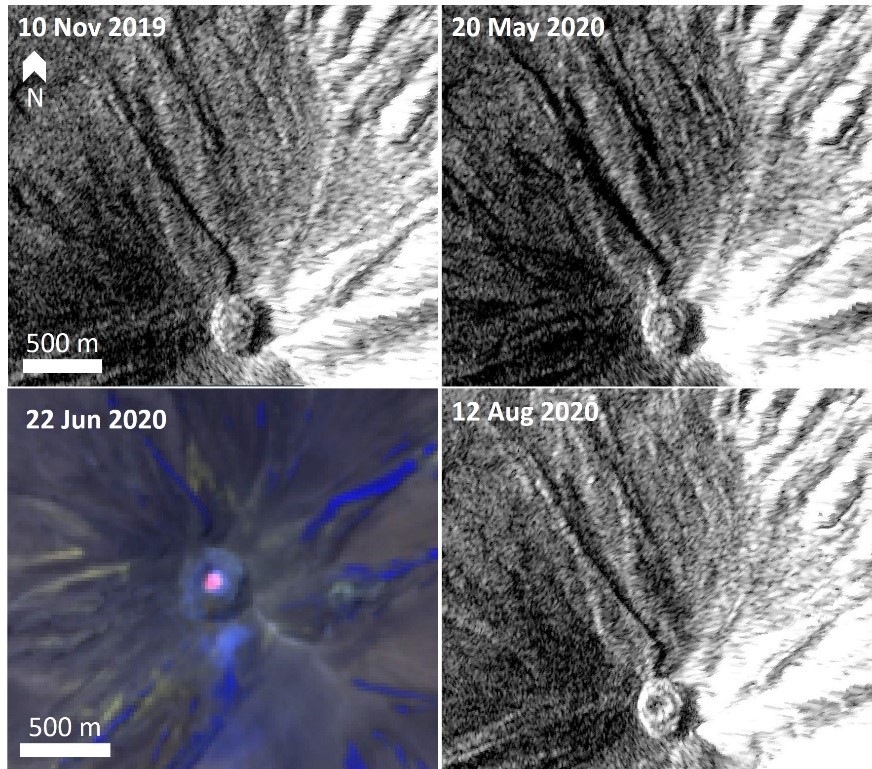 |
Figure 39. These satellite images show the morphological change in the Sarychev Peak summit crater between 10 November 2019 and 12 August 2020. The three gray-scale images use Sentinel-1 Synthetic Aperture Radar (SAR) data acquired on 10 November 2019, 20 May, and 12 August 2020. The color image in the lower left is a Sentinel-2 thermal image acquired on 22 June 2020. The SAR images show morphological changes in the crater in the same location as the elevated temperatures in the thermal images, indicating lava extrusion. Sentinel-1 SAR images are VV, decibel gamma0, and orthorectified. Sentinel-2 thermal satellite images have false color (urban) (bands 12, 11, 4) rendering. Courtesy of Sentinel Hub Playground. |
On 11 January 2021 KVERT released a Volcano Observatory Notice for Aviation (VONA) with an elevation of the Aviation Color Code from Green to Yellow. The temperature within the crater had increased above background levels by 79.8°?, indicating that renewed lava extrusion had begun in the crater on the 10th. A gas-and-steam plume extended 36 km NE on the 12th. On 15 January KVERT reported that moderate activity continued, including a gas-and-steam plume that extended 40 km NE. SAR data through January shows the lava volume increasing before flowing over the NW rim and down a preexisting channel on the flank (figure 40). KVERT reported that a lava flow on the northern flank had reached 400 m by the 20th. Lava extrusion with associated moderate gas and steam emission continued throughout the month.
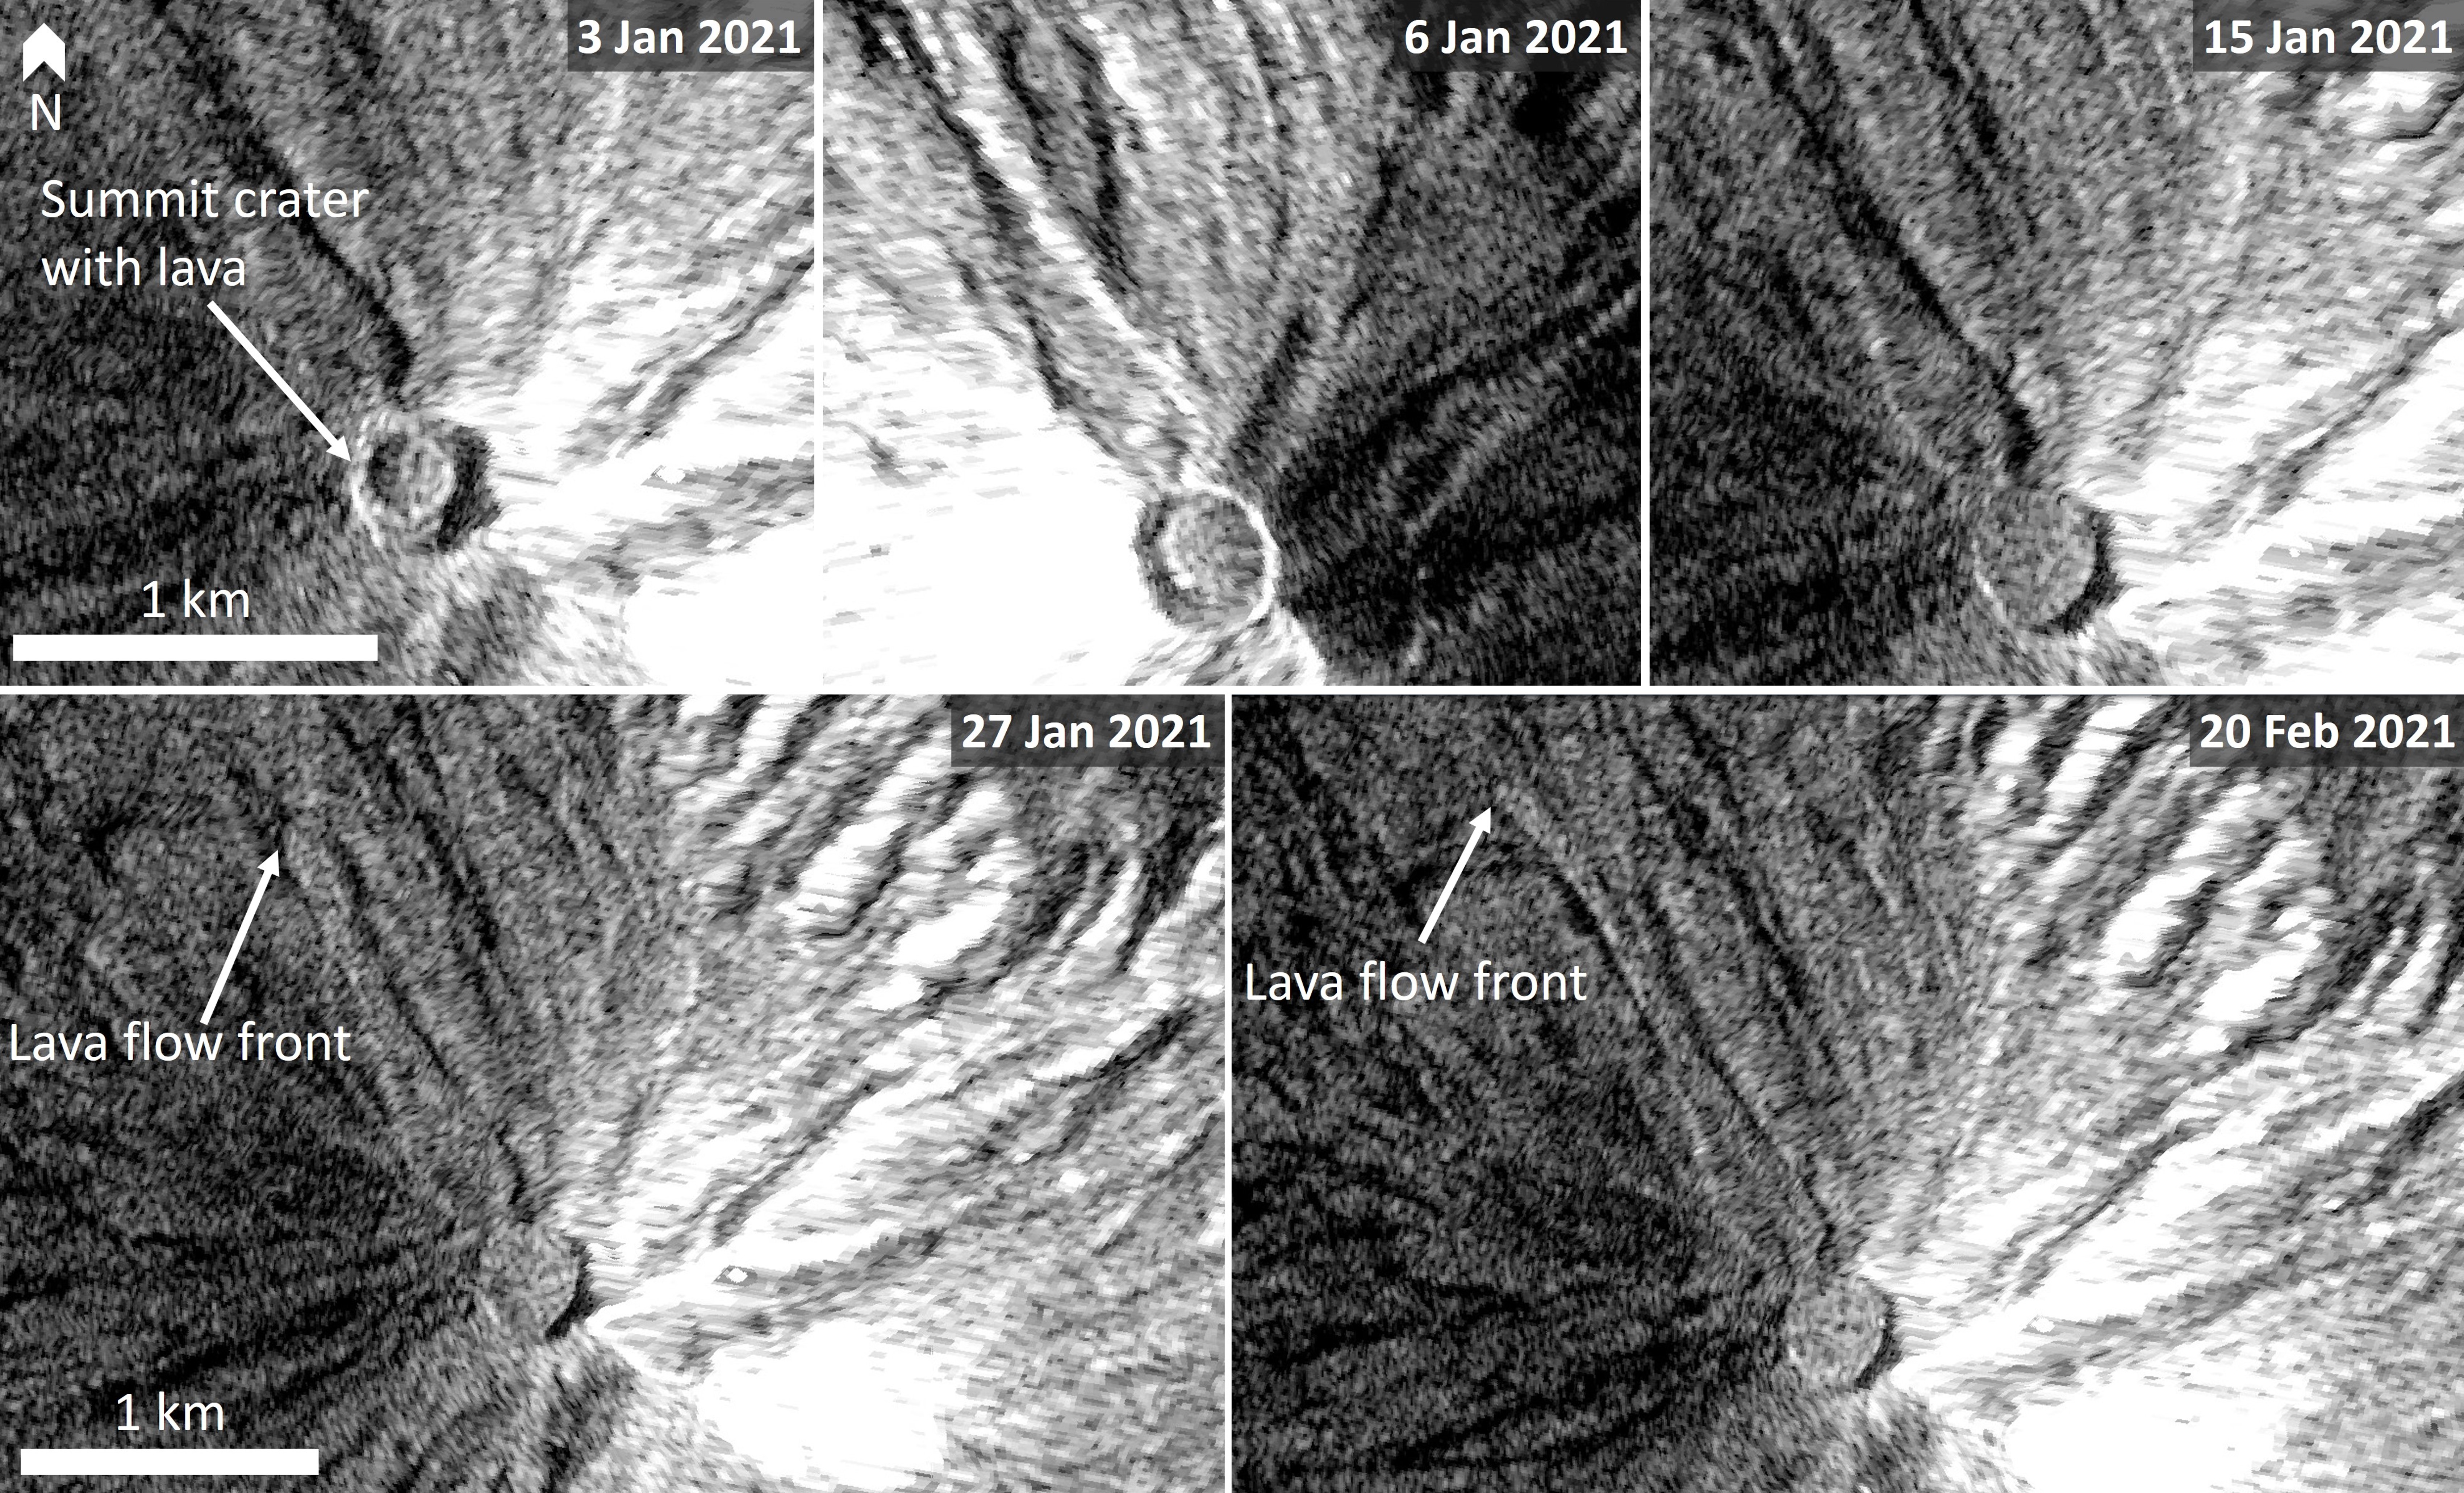 |
Figure 40. These SAR images of Sarychev Peak during 3 January to 20 February 2021 show lava extrusion filling the summit crater and descending a channel on the NW flank. Note that the 6 January image has a different look angle to the other images, and this alters how the surface appears. Sentinel-1 SAR images are VV, decibel gamma0, and orthorectified. Courtesy of Sentinel Hub Playground. |
A 3 February satellite image of the NW flank showed that the lava flow front had reached approximately 1.9 km from the crater rim where it had overflowed (figure 41). The Aviation Color Code was lowered to Green on the 18th with KVERT reporting that the eruption had ended, though thermal anomalies and gas-and-steam emission continued.
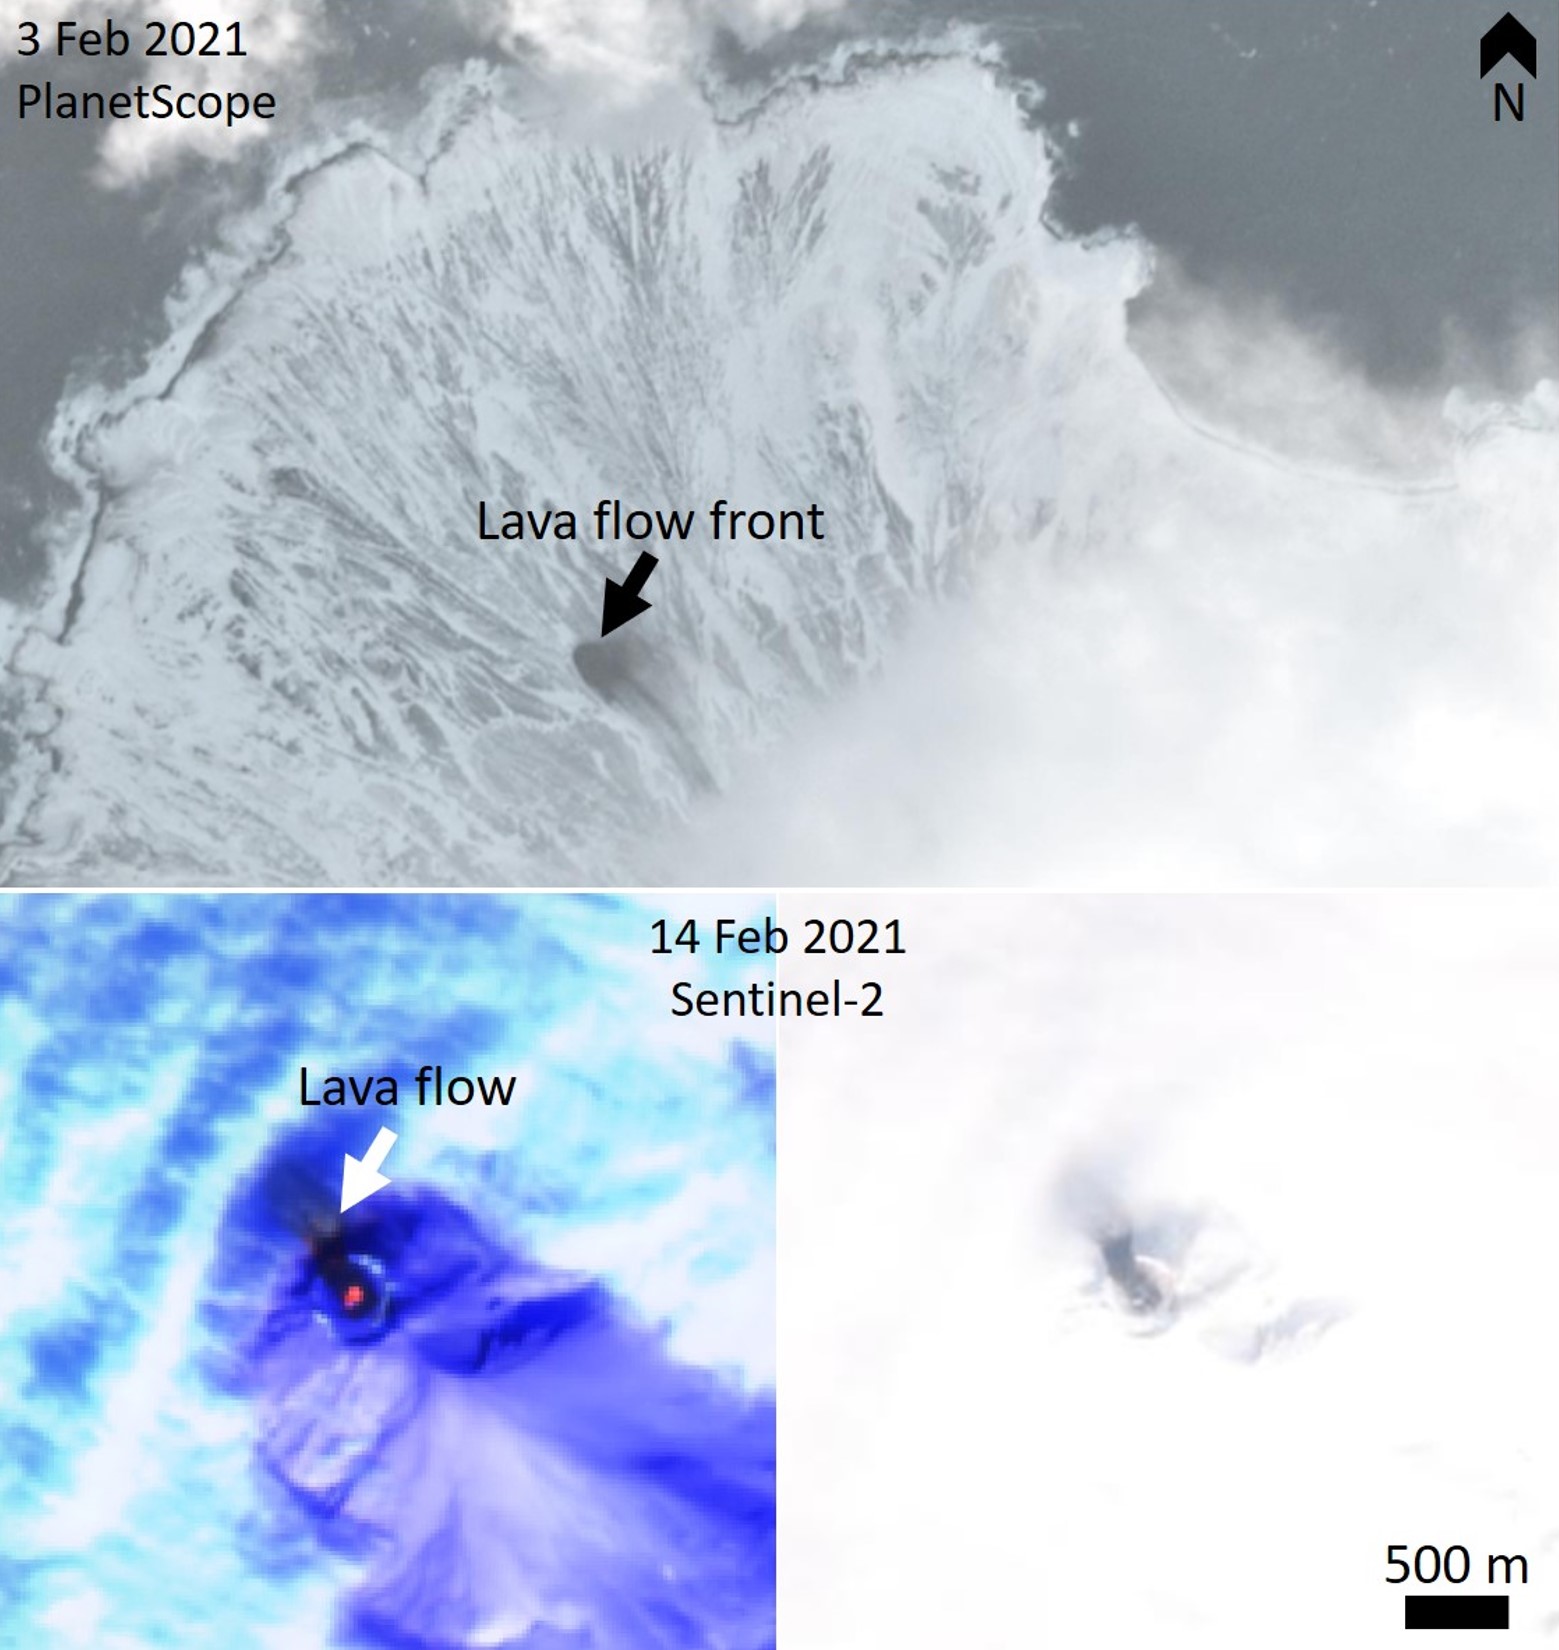 |
Figure 41. Satellite image scenes show the lava flow at Sarychev Peak on 3 and 14 February 2021. Top: PlanetScope image from 3 February showing the lobate lava flow front approximately 1.9 km from the NW crater rim. Bottom: Sentinel-2 satellite scenes from 14 February (thermal infrared to the left and natural color to the right) showing the summit crater area with lava extrusion and the lava flow overtopping the NW rim. Sentinel-2 satellite images have natural color (bands 4, 3, 2) rendering, and thermal false color (urban) (bands 12, 11, 4) rendering. Courtesy of Planet Labs and Sentinel Hub Playground. |
Satellite images of the lava flow acquired during March and April show the narrow lava lobe with pressure ridges and levees (figure 42). A comparison between a September 2019 satellite image and a clear 29 April 2021 image shows the change to the crater after the lava emplacement. The last Sentinel-2 image acquired within this period showing elevated temperatures within the crater was on 19 March and there was no more thermal energy detected by the MIROVA system by early February.
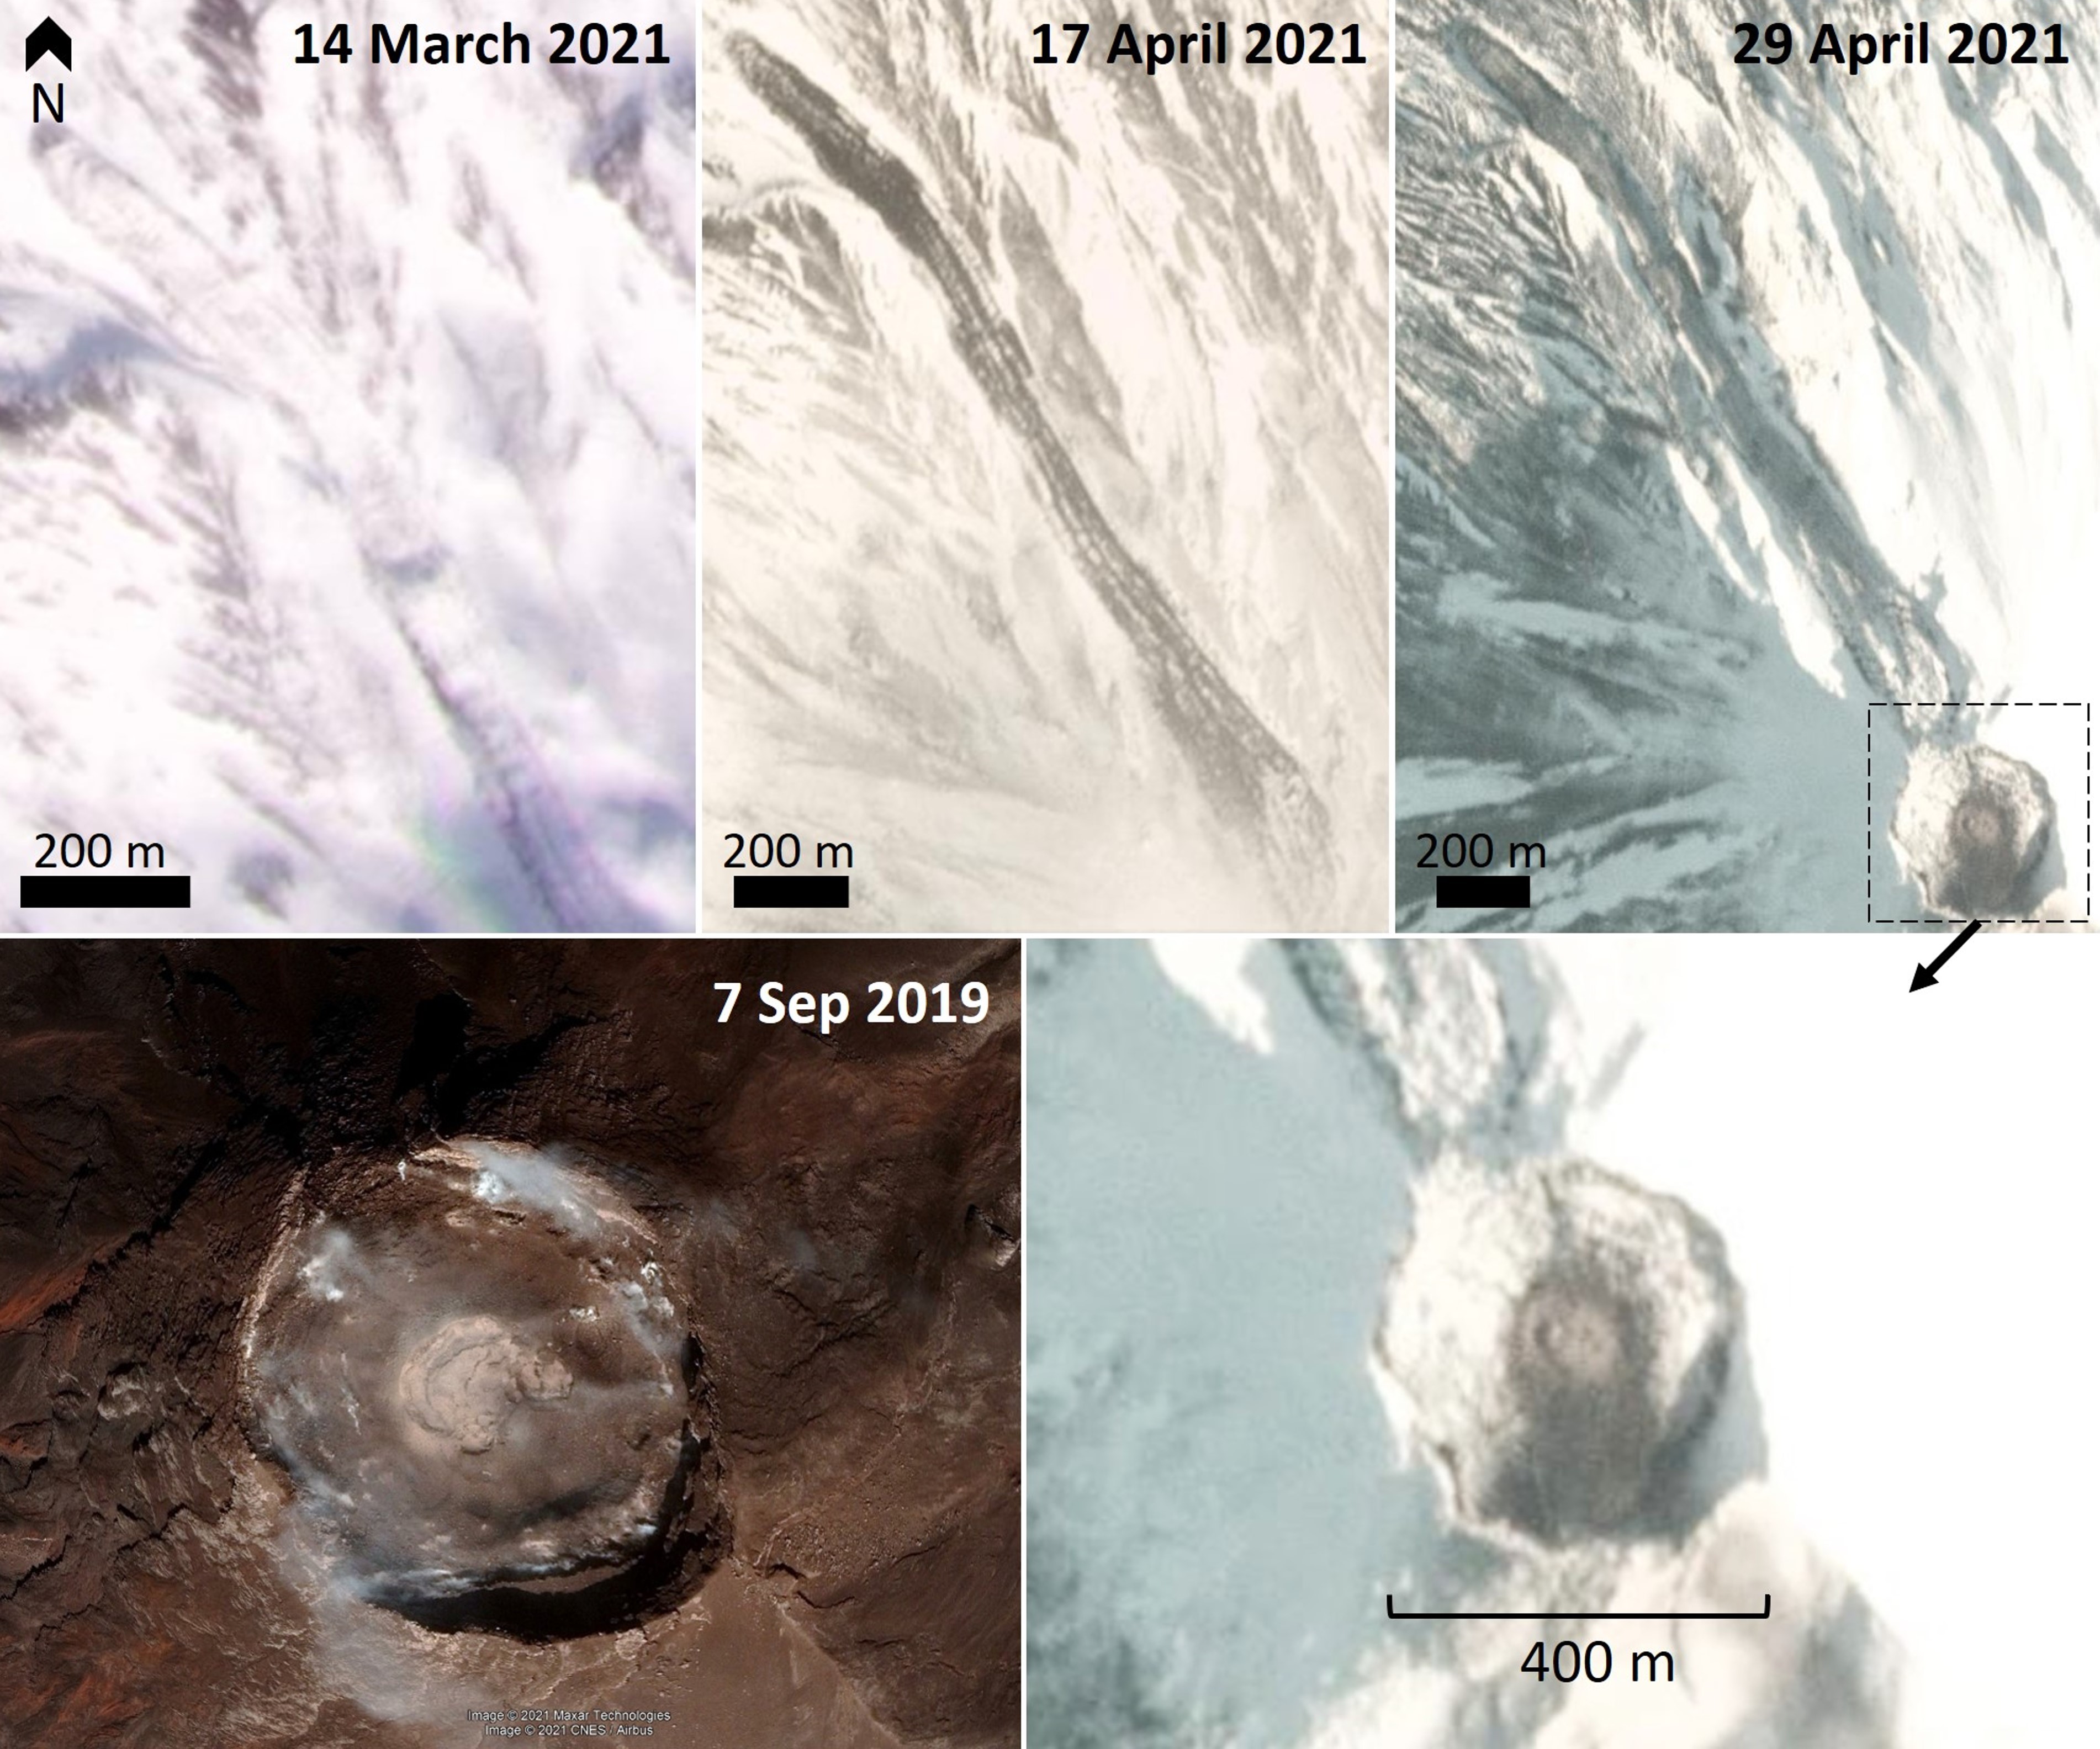 |
Figure 42. The PlanetScope satellite images across the top of this figure show the lava flow on the NW flank of Sarychev Peak during March-April 2021. The different degrees of snow cover show different surface morphological aspects like pressure ridges and levees. The bottom images show the crater on 7 September 2019 for comparison (left) and the lava within the summit crater on 29 April 2021 (right). Fumaroles are also visible around the crater walls in the 2019 image. The top images and bottom right image are PlanetScope satellite images and the lower left image is by CNES/Airbus through Google Earth. Courtesy of Planet Labs and U.S. Dept. of State Geographer Data via Google Earth, ©2019 Google. |
Information Contacts: Sakhalin Volcanic Eruption Response Team (SVERT), Institute of Marine Geology and Geophysics, Far Eastern Branch, Russian Academy of Science, Nauki st., 1B, Yuzhno-Sakhalinsk, Russia, 693022 (URL: http://www.imgg.ru/en/, http://www.imgg.ru/ru/svert/reports); Kamchatka Volcanic Eruptions Response Team (KVERT), Far Eastern Branch, Russian Academy of Sciences, 9 Piip Blvd., Petropavlovsk-Kamchatsky, 683006, Russia (URL: http://www.kscnet.ru/ivs/kvert/); Global Sulfur Dioxide Monitoring Page, Atmospheric Chemistry and Dynamics Laboratory, NASA Goddard Space Flight Center (NASA/GSFC), 8800 Greenbelt Road, Goddard, Maryland, USA (URL: https://so2.gsfc.nasa.gov/); MIROVA (Middle InfraRed Observation of Volcanic Activity), a collaborative project between the Universities of Turin and Florence (Italy) supported by the Centre for Volcanic Risk of the Italian Civil Protection Department (URL: http://www.mirovaweb.it/); Sentinel Hub Playground (URL: https://www.sentinel-hub.com/explore/sentinel-playground); Planet Labs, Inc. (URL: https://www.planet.com/); Google Earth (URL: https://www.google.com/earth/).
Few ash emissions and thermal anomalies during February-December 2021
Sarychev Peak occupies the NW end of Matua Island in the Kuril Islands with a central cone that was constructed in a 3-3.5 km caldera with a rim that is exposed on the SW side. Reported eruptions date back to the 1760s, characterized by both lava effusions and strong explosions. Larger eruptions in 1946 and 2009 produced pyroclastic flows that reached the sea. Its current eruption period began during February 2020 and has consisted of an ash eruption, lava flows, and ashfall deposits (BGVN 46:05). This report covers activity during February through December 2021 based on reports from the Sakhalin Volcanic Eruption Response Team (SVERT), the Kamchatka Volcanic Eruptions Response Team (KVERT), and the Tokyo Volcanic Ash Advisory Center.
During a majority of February, a lava flow continued to effuse onto the N slope of the volcano. According to satellite data, a thermal anomaly was observed in the summit on 1 February, though clouds often obscured it. Moderate gas-and-steam emissions were also reported. KVERT reported that on 19 February the effusive eruption had ended, though lava continued to advance in the summit crater and a thermal anomaly remained visible.
SVERT reported that on 12, 23, 25, and 29 June thermal anomalies were detected. The Tokyo VAAC issued a notice on 29 June and 1 July reporting brief ash emissions that rose to 3-3.4 km altitude and drifted W, SE, and E, based on satellite images. At 0020 on 30 June an ash plume was visible in satellite data that rose to 3 km altitude and drifted 30 km WNW. Plumes drifted as far as 25 km E on 1 July.
The MIROVA (Middle InfraRed Observation of Volcanic Activity) volcano hotspot detection system based on the analysis of MODIS data showed intermittent low-power thermal anomalies from late May through mid-November (figure 43). Two stronger anomalies were detected during early June and early July, the latter of which was also detected by the MODVOLC thermal algorithm on 1 July. This thermal activity was also detected in Sentinel-2 infrared satellite imagery, showing a clear thermal anomaly in the summit crater during February through September (figure 44). Though the thermal anomalies became less frequent and strong after August, MIROVA detected five anomalies during October and one weak anomaly in mid-November. Sentinel-2 also showed a weak anomaly on 9 and 26 November, the former of which also revealed trace ash deposits on the E flank and the latter of which was accompanied by a small ash plume that drifted N.
|
Figure 43. Intermittent low-power thermal anomalies at Sarychev Peak were detected by the MIROVA system (Log Radiative Power) beginning in late May through mid-November 2021. Two stronger anomalies were detected during early June and early July. A notable break in thermal activity occurred during a majority of September. Courtesy of MIROVA. |
|
Figure 44. Sentinel-2 infrared satellite images showing a consistent thermal anomaly in the summit crater of Sarychev Peak on 14 February (top left), 19 March (top right), 5 May (middle left), 29 June (middle right), 7 July (bottom left), and 17 September (bottom right) 2021. Images using “Atmospheric penetration” rendering (bands 12, 11, 8a). Courtesy of Sentinel Hub Playground. |
Information Contacts: Sakhalin Volcanic Eruption Response Team (SVERT), Institute of Marine Geology and Geophysics, Far Eastern Branch, Russian Academy of Science, Nauki st., 1B, Yuzhno-Sakhalinsk, Russia, 693022 (URL: http://www.imgg.ru/en/, http://www.imgg.ru/ru/svert/reports); Kamchatka Volcanic Eruptions Response Team (KVERT), Far Eastern Branch, Russian Academy of Sciences, 9 Piip Blvd., Petropavlovsk-Kamchatsky, 683006, Russia (URL: http://www.kscnet.ru/ivs/kvert/); Tokyo Volcanic Ash Advisory Center (VAAC), 1-3-4 Otemachi, Chiyoda-ku, Tokyo 100-8122, Japan (URL: http://ds.data.jma.go.jp/svd/vaac/data/); MIROVA (Middle InfraRed Observation of Volcanic Activity), a collaborative project between the Universities of Turin and Florence (Italy) supported by the Centre for Volcanic Risk of the Italian Civil Protection Department (URL: http://www.mirovaweb.it/); Hawai'i Institute of Geophysics and Planetology (HIGP) - MODVOLC Thermal Alerts System, School of Ocean and Earth Science and Technology (SOEST), Univ. of Hawai'i, 2525 Correa Road, Honolulu, HI 96822, USA (URL: http://modis.higp.hawaii.edu/); Sentinel Hub Playground (URL: https://www.sentinel-hub.com/explore/sentinel-playground).
|
|
||||||||||||||||||||||||||
There is data available for 20 confirmed eruptive periods.
2020 Feb 29 ± 1 days - 2021 Nov 26 Confirmed Eruption (Explosive / Effusive) VEI: 1
| Episode 1 | Eruption (Explosive / Effusive) | |||||||||||||||||||
|---|---|---|---|---|---|---|---|---|---|---|---|---|---|---|---|---|---|---|---|
| 2020 Feb 29 ± 1 days - 2020 Oct 12 | Evidence from Observations: Reported | ||||||||||||||||||
|
List of 2 Events for Episode 1
|
|||||||||||||||||||
| Episode 2 | Eruption (Explosive / Effusive) | ||||
|---|---|---|---|---|
| 2020 Nov 16 - 2021 Nov 26 | Evidence from Observations: Reported | |||
2019 May 16 - 2019 Oct 7 Confirmed Eruption (Explosive / Effusive) VEI: 2
| Episode 1 | Eruption (Explosive / Effusive) | ||||||||||||||
|---|---|---|---|---|---|---|---|---|---|---|---|---|---|---|
| 2019 May 16 - 2019 Oct 7 | Evidence from Observations: Reported | |||||||||||||
|
List of 1 Events for Episode 1
|
||||||||||||||
2018 Sep 8 - 2018 Oct 15 Confirmed Eruption (Explosive / Effusive) VEI: 2
| Episode 1 | Eruption (Explosive / Effusive) | Summit crater | ||||||||||||||||||||||||||||||||||||||||||||||||||||||||||||||||||||||||||||||||||||||||||||||||||||||||||||
|---|---|---|---|---|---|---|---|---|---|---|---|---|---|---|---|---|---|---|---|---|---|---|---|---|---|---|---|---|---|---|---|---|---|---|---|---|---|---|---|---|---|---|---|---|---|---|---|---|---|---|---|---|---|---|---|---|---|---|---|---|---|---|---|---|---|---|---|---|---|---|---|---|---|---|---|---|---|---|---|---|---|---|---|---|---|---|---|---|---|---|---|---|---|---|---|---|---|---|---|---|---|---|---|---|---|---|---|---|---|
| 2018 Sep 8 - 2018 Oct 15 | Evidence from Observations: Reported | ||||||||||||||||||||||||||||||||||||||||||||||||||||||||||||||||||||||||||||||||||||||||||||||||||||||||||||
|
List of 20 Events for Episode 1 at Summit crater
|
|||||||||||||||||||||||||||||||||||||||||||||||||||||||||||||||||||||||||||||||||||||||||||||||||||||||||||||
2017 Oct 12 (?) - 2017 Nov 13 (?) Confirmed Eruption (Explosive / Effusive) VEI: 0
| Episode 1 | Eruption (Explosive / Effusive) | Summit crater and NW flank | ||||||||||||||||||||||||||||||||||||||||||||||||||||||||||||||||||||
|---|---|---|---|---|---|---|---|---|---|---|---|---|---|---|---|---|---|---|---|---|---|---|---|---|---|---|---|---|---|---|---|---|---|---|---|---|---|---|---|---|---|---|---|---|---|---|---|---|---|---|---|---|---|---|---|---|---|---|---|---|---|---|---|---|---|---|---|---|---|
| 2017 Oct 12 (?) - 2017 Nov 13 (?) | Evidence from Observations: Reported | ||||||||||||||||||||||||||||||||||||||||||||||||||||||||||||||||||||
|
List of 12 Events for Episode 1 at Summit crater and NW flank
|
|||||||||||||||||||||||||||||||||||||||||||||||||||||||||||||||||||||
[ 2010 Sep 20 - 2010 Sep 20 ] Uncertain Eruption
| Episode 1 | Eruption (Explosive / Effusive) | ||||||||||||||||||||||||
|---|---|---|---|---|---|---|---|---|---|---|---|---|---|---|---|---|---|---|---|---|---|---|---|---|
| 2010 Sep 20 - 2010 Sep 20 | Evidence from Observations: Satellite (visual) | |||||||||||||||||||||||
|
List of 3 Events for Episode 1
|
||||||||||||||||||||||||
2009 Jun 11 - 2009 Jul 16 (?) ± 15 days Confirmed Eruption (Explosive / Effusive) VEI: 4
| Episode 1 | Eruption (Explosive / Effusive) | |||||||||||||||||||||||||||||||||||||||||||||||||
|---|---|---|---|---|---|---|---|---|---|---|---|---|---|---|---|---|---|---|---|---|---|---|---|---|---|---|---|---|---|---|---|---|---|---|---|---|---|---|---|---|---|---|---|---|---|---|---|---|---|
| 2009 Jun 11 - 2009 Jul 16 (?) ± 15 days | Evidence from Observations: Reported | ||||||||||||||||||||||||||||||||||||||||||||||||
|
List of 8 Events for Episode 1
|
|||||||||||||||||||||||||||||||||||||||||||||||||
1989 Jan 13 - 1989 Jan 14 Confirmed Eruption (Explosive / Effusive) VEI: 1 (?)
| Episode 1 | Eruption (Explosive / Effusive) | ||||||||||||||||||||||||
|---|---|---|---|---|---|---|---|---|---|---|---|---|---|---|---|---|---|---|---|---|---|---|---|---|
| 1989 Jan 13 - 1989 Jan 14 | Evidence from Observations: Reported | |||||||||||||||||||||||
|
List of 3 Events for Episode 1
|
||||||||||||||||||||||||
1986 Sep 1 (?) ± 15 days Confirmed Eruption (Explosive / Effusive) VEI: 1
| Episode 1 | Eruption (Explosive / Effusive) | ||||||||||||||||||||||||
|---|---|---|---|---|---|---|---|---|---|---|---|---|---|---|---|---|---|---|---|---|---|---|---|---|
| 1986 Sep 1 (?) ± 15 days - Unknown | Evidence from Observations: Reported | |||||||||||||||||||||||
|
List of 3 Events for Episode 1
|
||||||||||||||||||||||||
1976 Sep 23 - 1976 Oct 2 Confirmed Eruption (Explosive / Effusive) VEI: 2
| Episode 1 | Eruption (Explosive / Effusive) | ||||||||||||||||||||||||||||||||||||||||||||
|---|---|---|---|---|---|---|---|---|---|---|---|---|---|---|---|---|---|---|---|---|---|---|---|---|---|---|---|---|---|---|---|---|---|---|---|---|---|---|---|---|---|---|---|---|
| 1976 Sep 23 - 1976 Oct 2 | Evidence from Observations: Reported | |||||||||||||||||||||||||||||||||||||||||||
|
List of 7 Events for Episode 1
|
||||||||||||||||||||||||||||||||||||||||||||
1965 Dec 9 - 1965 Dec 9 Confirmed Eruption (Explosive / Effusive) VEI: 2
| Episode 1 | Eruption (Explosive / Effusive) | |||||||||||||||||||
|---|---|---|---|---|---|---|---|---|---|---|---|---|---|---|---|---|---|---|---|
| 1965 Dec 9 - 1965 Dec 9 | Evidence from Observations: Reported | ||||||||||||||||||
|
List of 2 Events for Episode 1
|
|||||||||||||||||||
1960 Aug 30 - 1960 Aug 30 Confirmed Eruption (Explosive / Effusive) VEI: 3
| Episode 1 | Eruption (Explosive / Effusive) | |||||||||||||||||||||||||||||
|---|---|---|---|---|---|---|---|---|---|---|---|---|---|---|---|---|---|---|---|---|---|---|---|---|---|---|---|---|---|
| 1960 Aug 30 - 1960 Aug 30 | Evidence from Observations: Reported | ||||||||||||||||||||||||||||
|
List of 4 Events for Episode 1
|
|||||||||||||||||||||||||||||
1954 Aug 16 ± 15 days - 1954 Oct 16 ± 15 days Confirmed Eruption (Explosive / Effusive) VEI: 2
| Episode 1 | Eruption (Explosive / Effusive) | ||||||||||||||||||||||||||||||||||
|---|---|---|---|---|---|---|---|---|---|---|---|---|---|---|---|---|---|---|---|---|---|---|---|---|---|---|---|---|---|---|---|---|---|---|
| 1954 Aug 16 ± 15 days - 1954 Oct 16 ± 15 days | Evidence from Observations: Reported | |||||||||||||||||||||||||||||||||
|
List of 5 Events for Episode 1
|
||||||||||||||||||||||||||||||||||
1946 Nov 9 - 1946 Nov 19 Confirmed Eruption (Explosive / Effusive) VEI: 4
| Episode 1 | Eruption (Explosive / Effusive) | ||||||||||||||||||||||||||||||||||||||||||||||||||||||
|---|---|---|---|---|---|---|---|---|---|---|---|---|---|---|---|---|---|---|---|---|---|---|---|---|---|---|---|---|---|---|---|---|---|---|---|---|---|---|---|---|---|---|---|---|---|---|---|---|---|---|---|---|---|---|
| 1946 Nov 9 - 1946 Nov 19 | Evidence from Observations: Reported | |||||||||||||||||||||||||||||||||||||||||||||||||||||
|
List of 9 Events for Episode 1
|
||||||||||||||||||||||||||||||||||||||||||||||||||||||
[ 1932 (?) ] Uncertain Eruption
| Episode 1 | Eruption (Explosive / Effusive) | |||||||||||||||||||
|---|---|---|---|---|---|---|---|---|---|---|---|---|---|---|---|---|---|---|---|
| 1932 (?) - Unknown | Evidence from Unknown | ||||||||||||||||||
|
List of 2 Events for Episode 1
|
|||||||||||||||||||
1930 Feb 13 - 1930 Feb 13 Confirmed Eruption (Explosive / Effusive) VEI: 3
| Episode 1 | Eruption (Explosive / Effusive) | ||||||||||||||||||||||||||||||||||
|---|---|---|---|---|---|---|---|---|---|---|---|---|---|---|---|---|---|---|---|---|---|---|---|---|---|---|---|---|---|---|---|---|---|---|
| 1930 Feb 13 - 1930 Feb 13 | Evidence from Observations: Reported | |||||||||||||||||||||||||||||||||
|
List of 5 Events for Episode 1
|
||||||||||||||||||||||||||||||||||
1928 Feb 14 Confirmed Eruption (Explosive / Effusive) VEI: 2
| Episode 1 | Eruption (Explosive / Effusive) | |||||||||||||||||||||||||||||
|---|---|---|---|---|---|---|---|---|---|---|---|---|---|---|---|---|---|---|---|---|---|---|---|---|---|---|---|---|---|
| 1928 Feb 14 - Unknown | Evidence from Observations: Reported | ||||||||||||||||||||||||||||
|
List of 4 Events for Episode 1
|
|||||||||||||||||||||||||||||
1927 Confirmed Eruption (Explosive / Effusive) VEI: 2 (?)
| Episode 1 | Eruption (Explosive / Effusive) | ||||||||||||||
|---|---|---|---|---|---|---|---|---|---|---|---|---|---|---|
| 1927 - Unknown | Evidence from Observations: Reported | |||||||||||||
|
List of 1 Events for Episode 1
|
||||||||||||||
1924 Feb 15 Confirmed Eruption (Explosive / Effusive) VEI: 1 (?)
| Episode 1 | Eruption (Explosive / Effusive) | Near Toporkovyi islet | |||||||||||||
|---|---|---|---|---|---|---|---|---|---|---|---|---|---|---|
| 1924 Feb 15 - Unknown | Evidence from Observations: Reported | |||||||||||||
|
List of 1 Events for Episode 1 at Near Toporkovyi islet
|
||||||||||||||
1923 Jan 17 - 1923 Jan 22 Confirmed Eruption (Explosive / Effusive) VEI: 2
| Episode 1 | Eruption (Explosive / Effusive) | |||||||||||||||||||||||||||||
|---|---|---|---|---|---|---|---|---|---|---|---|---|---|---|---|---|---|---|---|---|---|---|---|---|---|---|---|---|---|
| 1923 Jan 17 - 1923 Jan 22 | Evidence from Observations: Reported | ||||||||||||||||||||||||||||
|
List of 4 Events for Episode 1
|
|||||||||||||||||||||||||||||
1879 Jan 15 ± 45 days Confirmed Eruption (Explosive / Effusive) VEI: 0
| Episode 1 | Eruption (Explosive / Effusive) | ||||||||||||||||||||||||
|---|---|---|---|---|---|---|---|---|---|---|---|---|---|---|---|---|---|---|---|---|---|---|---|---|
| 1879 Jan 15 ± 45 days - Unknown | Evidence from Observations: Reported | |||||||||||||||||||||||
|
List of 3 Events for Episode 1
|
||||||||||||||||||||||||
1805 Confirmed Eruption (Explosive / Effusive)
| Episode 1 | Eruption (Explosive / Effusive) | ||||
|---|---|---|---|---|
| 1805 - Unknown | Evidence from Observations: Reported | |||
1765 ± 5 years Confirmed Eruption (Explosive / Effusive) VEI: 2 (?)
| Episode 1 | Eruption (Explosive / Effusive) | |||||||||||||||||||
|---|---|---|---|---|---|---|---|---|---|---|---|---|---|---|---|---|---|---|---|
| 1765 ± 5 years - Unknown | Evidence from Observations: Reported | ||||||||||||||||||
|
List of 2 Events for Episode 1
|
|||||||||||||||||||
This compilation of synonyms and subsidiary features may not be comprehensive. Features are organized into four major categories: Cones, Craters, Domes, and Thermal Features. Synonyms of features appear indented below the primary name. In some cases additional feature type, elevation, or location details are provided.
Synonyms |
||||
| Fue-san | Matsuwa-jima | Matua-jima | Sarnicheff | ||||
Cones |
||||
| Feature Name | Feature Type | Elevation | Latitude | Longitude |
| Kruglyi | Cone | 106 m | 48° 3' 53.00" N | 153° 15' 18.00" E |
| Ploskii | Vent | 200 m | 48° 4' 19.00" N | 153° 14' 39.00" E |
| Toporkovyi | Cone | 59 m | 48° 4' 28.00" N | 153° 17' 19.00" E |
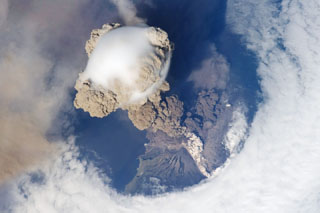 One of the largest recorded eruptions in the Kuril Islands took place 11-16 June from Sarychev Peak. This NASA Space Shuttle view on 12 June shows an eruption plume that rose to 16-21 km altitude; pyroclastic flows reached the sea and extended the shoreline in some areas. The main explosive phase ended on 16 June, but weak explosions producing ash plumes continued prior to arrival of a field team on 26-28 July, when no eruptive activity was observed.
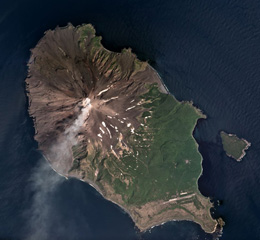 A gas plume is dispersed to the SW of Sarychev Peak in this July 2018 Planet Labs satellite image monthly mosaic (N is at the top; this image is approximately 12 km across). It forms the NW part of the 12 x 6 km Matua Island in the Kurile islands and is one of the most active volcanoes in the area. Lava flows and pyroclastic flow deposits have been emplaced across the flanks, with some pyroclastic flows having reached the sea during explosive eruptions. To the SW of the current edifice is the rim of an older caldera.
There are no samples for Sarychev Peak in the Smithsonian's NMNH Department of Mineral Sciences Rock and Ore collection.
| Copernicus Browser | The Copernicus Browser replaced the Sentinel Hub Playground browser in 2023, to provide access to Earth observation archives from the Copernicus Data Space Ecosystem, the main distribution platform for data from the EU Copernicus missions. |
| MIROVA | Middle InfraRed Observation of Volcanic Activity (MIROVA) is a near real time volcanic hot-spot detection system based on the analysis of MODIS (Moderate Resolution Imaging Spectroradiometer) data. In particular, MIROVA uses the Middle InfraRed Radiation (MIR), measured over target volcanoes, in order to detect, locate and measure the heat radiation sourced from volcanic activity. |
| MODVOLC Thermal Alerts | Using infrared satellite Moderate Resolution Imaging Spectroradiometer (MODIS) data, scientists at the Hawai'i Institute of Geophysics and Planetology, University of Hawai'i, developed an automated system called MODVOLC to map thermal hot-spots in near real time. For each MODIS image, the algorithm automatically scans each 1 km pixel within it to check for high-temperature hot-spots. When one is found the date, time, location, and intensity are recorded. MODIS looks at every square km of the Earth every 48 hours, once during the day and once during the night, and the presence of two MODIS sensors in space allows at least four hot-spot observations every two days. Each day updated global maps are compiled to display the locations of all hot spots detected in the previous 24 hours. There is a drop-down list with volcano names which allow users to 'zoom-in' and examine the distribution of hot-spots at a variety of spatial scales. |
|
WOVOdat
Single Volcano View Temporal Evolution of Unrest Side by Side Volcanoes |
WOVOdat is a database of volcanic unrest; instrumentally and visually recorded changes in seismicity, ground deformation, gas emission, and other parameters from their normal baselines. It is sponsored by the World Organization of Volcano Observatories (WOVO) and presently hosted at the Earth Observatory of Singapore.
GVMID Data on Volcano Monitoring Infrastructure The Global Volcano Monitoring Infrastructure Database GVMID, is aimed at documenting and improving capabilities of volcano monitoring from the ground and space. GVMID should provide a snapshot and baseline view of the techniques and instrumentation that are in place at various volcanoes, which can be use by volcano observatories as reference to setup new monitoring system or improving networks at a specific volcano. These data will allow identification of what monitoring gaps exist, which can be then targeted by remote sensing infrastructure and future instrument deployments. |
| Volcanic Hazard Maps | The IAVCEI Commission on Volcanic Hazards and Risk has a Volcanic Hazard Maps database designed to serve as a resource for hazard mappers (or other interested parties) to explore how common issues in hazard map development have been addressed at different volcanoes, in different countries, for different hazards, and for different intended audiences. In addition to the comprehensive, searchable Volcanic Hazard Maps Database, this website contains information about diversity of volcanic hazard maps, illustrated using examples from the database. This site is for educational purposes related to volcanic hazard maps. Hazard maps found on this website should not be used for emergency purposes. For the most recent, official hazard map for a particular volcano, please seek out the proper institutional authorities on the matter. |
| IRIS seismic stations/networks | Incorporated Research Institutions for Seismology (IRIS) Data Services map showing the location of seismic stations from all available networks (permanent or temporary) within a radius of 0.18° (about 20 km at mid-latitudes) from the given location of Sarychev Peak. Users can customize a variety of filters and options in the left panel. Note that if there are no stations are known the map will default to show the entire world with a "No data matched request" error notice. |
| UNAVCO GPS/GNSS stations | Geodetic Data Services map from UNAVCO showing the location of GPS/GNSS stations from all available networks (permanent or temporary) within a radius of 20 km from the given location of Sarychev Peak. Users can customize the data search based on station or network names, location, and time window. Requires Adobe Flash Player. |
| DECADE Data | The DECADE portal, still in the developmental stage, serves as an example of the proposed interoperability between The Smithsonian Institution's Global Volcanism Program, the Mapping Gas Emissions (MaGa) Database, and the EarthChem Geochemical Portal. The Deep Earth Carbon Degassing (DECADE) initiative seeks to use new and established technologies to determine accurate global fluxes of volcanic CO2 to the atmosphere, but installing CO2 monitoring networks on 20 of the world's 150 most actively degassing volcanoes. The group uses related laboratory-based studies (direct gas sampling and analysis, melt inclusions) to provide new data for direct degassing of deep earth carbon to the atmosphere. |
| Large Eruptions of Sarychev Peak | Information about large Quaternary eruptions (VEI >= 4) is cataloged in the Large Magnitude Explosive Volcanic Eruptions (LaMEVE) database of the Volcano Global Risk Identification and Analysis Project (VOGRIPA). |
| EarthChem | EarthChem develops and maintains databases, software, and services that support the preservation, discovery, access and analysis of geochemical data, and facilitate their integration with the broad array of other available earth science parameters. EarthChem is operated by a joint team of disciplinary scientists, data scientists, data managers and information technology developers who are part of the NSF-funded data facility Integrated Earth Data Applications (IEDA). IEDA is a collaborative effort of EarthChem and the Marine Geoscience Data System (MGDS). |

