

AVO reported that the eruption at Pavlof has ended. No explosions had been detected since [7 December] and seismicity had decreased to background levels. Weakly elevated surface temperatures and minor steaming from the recently active vent continue to be observed intermittently in satellite and webcam images, consistent with the cooling of previously erupted lava. On 19 January AVO lowered the Volcano Alert Level to Normal (the lowest level on a four-level scale) and the Aviation Color Code to Green (the lowest level on a four-color scale).
Source: US Geological Survey Alaska Volcano Observatory (AVO)
Ongoing ash explosions and lava flows until eruptive activity ended on 7 December 2022
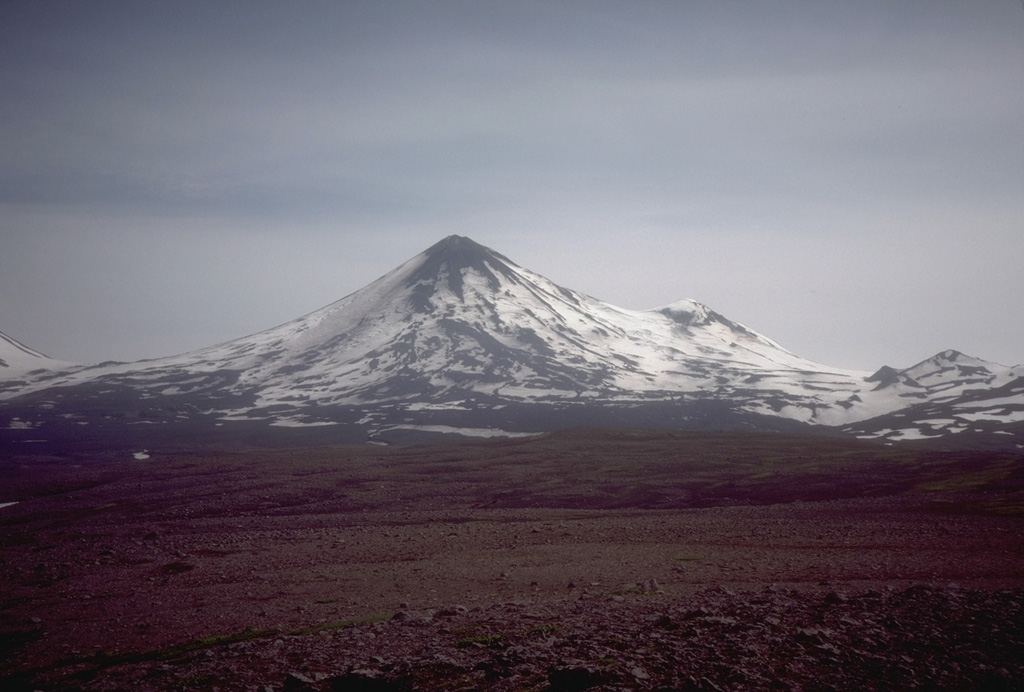
Pavlof, one of the most consistently active volcanoes in the Aleutian Islands, has been erupting since mid-November 2021, with frequent weak explosions, periods of lava spatter, fountaining, small lava flows and emissions of steam and gas that sometimes contained ash (BGVN 47:08). This eruption continued through 7 December 2022, when both explosions and significant thermal activity had stopped (figure 24). The current report, which describes activity between August 2022-January 2023, is monitored remotely by the Alaska Volcano Observatory (AVO) using local seismic and infrasound sensors, satellite data, web cameras, and remote infrasound and lightning networks, and the information below is based on AVO weekly reports and satellite data. During August to mid-December 2022, the Aviation Color Code (AVO) remained at Orange and the Volcano Alert Level (VAL) remained at Watch, the second highest level for both on a four-level scale, after which they were lowered. Weather clouds often prevented satellite and webcam views.
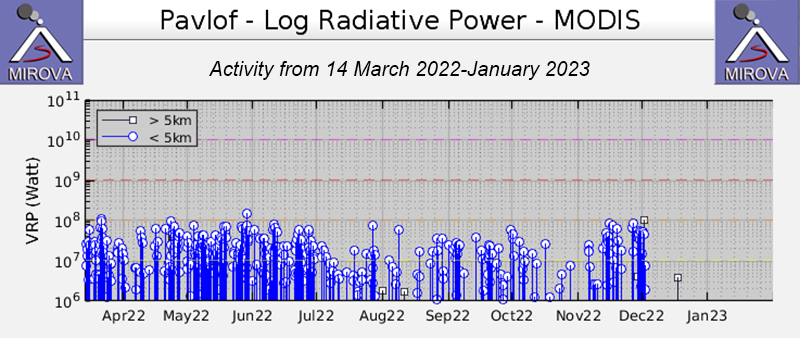 |
Figure 24. Graph of thermal anomalies at Pavlof during April 2022-March 2023, as recorded by the MIROVA system. Frequent mostly moderate power hotspots were identified during August through early December 2022. Courtesy of MIROVA. |
During August, the minor eruption from the active vent on the E flank, just below the summit, continued, with occasional explosions that probably produced minor ash emissions (figure 24) that usually rose no higher than an altitude of 3 km and dissipated quickly. According to a pilot report, a small ash emission rose to an altitude of about 4 km on 24 August. A small pyroclastic debris flow was observed in satellite data on 26 August, extending about 590 m SE from the active vent. Seismic tremor persisted, and elevated surface temperatures were identified almost daily in satellite images. No active lava flows extending down the flank were detected.
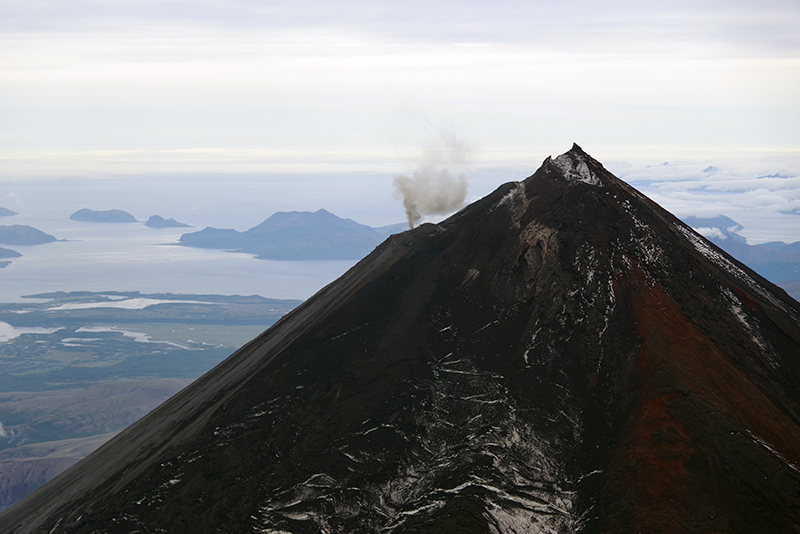 |
Figure 25. A typical small ash plume is visible rising from Pavlof in this aerial photo at 1123 on 26 August. Photo by Pavel Izbekov; courtesy of AVO/University of Alaska Fairbanks, Geophysical Institute. |
By 2 September a second small vent had re-opened ESE of the main vent. Elevated surface temperatures in the active vent area were identified in satellite images on most days, consistent with minor lava effusion. Strong incandescence at the vent and from an area within 200 m downslope was visible in webcam images starting on 14 September, indicating a short lava flow. Small explosions were detected during 18-21 September, and steam and gas plumes often containing minor amounts of ash were frequently visible. New lahar and minor ash deposits extending less than 900 m from the vent were visible during 11-13 September. Seismic tremor was nearly continuous in September.
Small explosions and persistent seismic tremor continued during October except for the first week, multiple explosions were recorded almost daily. Strongly elevated surface temperatures were often identified in satellite images, incandescence and glowing ejected rock fragments were frequently visible in nighttime webcam images, and diffuse steam plumes were sometimes visible in webcam views. Discolored snow near the vent was visible in webcam images on the morning of 7 October, suggesting low-level explosive activity; a small explosion was recorded at 1503 that same day. Webcam images on 20 October showed a new dark flow of lava and debris extending about a third of the way down the E flank. During 31 October-1 November, a diffuse steam-and-ash plume rose less than 3 km in altitude and deposited minor amounts of tephra on the E flank.
During November, multiple explosions were detected almost daily until mid-month, after which none were clearly recorded, but seismic tremor was nearly continuous. Webcam images taken on 12 and 15 November showed a lava flow and ash deposits on the upper flanks, and nighttime crater incandescence was sometimes visible. Elevated surface temperatures were observed in satellite data on most days, and occasional clear webcam views showed recent flow deposits on the volcano’s flank as well as weak steaming and light ash emissions and deposits, probably associated with lava spattering or fountaining. On 28 November, a flowage event likely resulting from the interaction of hot rocks with ice and snow on the flank was observed in seismic data and a series of webcam images, and satellite and webcam images showed that the deposit extended about 5 km down the SE flank, the largest flowage event during the current eruptive period. This event produced an ash and gas plume that reached an altitude as high as 6 km, before dissipating within tens of minutes.
Multiple small explosions were detected on 1-3 December that resulted in a narrow gully being eroded in the ice below the vent, extending about 2 km down the flank. Elevated surface temperatures and incandescent lava were not observed after 2 December. Activity significantly decreased after 3 December, with AVO reporting that the last explosion was detected on 7 December. Occasional small steam and gas plumes were visible in webcam images. Tremor had become more intermittent by mid-month, but overall seismicity remained above background levels through the end of December. On 17 December, due to the reduced activity, AVO decreased the ACC to Yellow and the VAL to Advisory, both the second lowest on a four-level scale. Weakly elevated temperatures were detected the last week of December, and a high-resolution satellite image on 27 December showed a small spot of strongly elevated temperatures within the recently active vent on the volcano’s upper E flank, but there was no sign of eruptive activity.
During the first two weeks of January 2023, seismicity remained above background levels and weakly elevated surface temperatures and minor steaming from the active vent were observed that AVO suggested might have been associated with the cooling of lava around the vent. However, no explosions or other eruptive activity was noted. By mid-January seismicity had decreased to background levels. On 19 January, AVO decreased the ACC and VAL to Green and Normal, respectively, stating that the eruption had ended. However, weakly elevated surface temperatures and minor steaming from the recently active vent continued to be observed intermittently in satellite and web camera imagery, consistent with cooling of previously erupted lava.
Information Contacts: Alaska Volcano Observatory (AVO), a cooperative program of a) U.S. Geological Survey, 4200 University Drive, Anchorage, AK 99508-4667 USA (URL: https://avo.alaska.edu/), b) Geophysical Institute, University of Alaska, PO Box 757320, Fairbanks, AK 99775-7320, USA, and c) Alaska Division of Geological & Geophysical Surveys, 3354 College Rd., Fairbanks, AK 99709, USA (URL: http://dggs.alaska.gov/); Sentinel Hub Playground (URL: https://www.sentinel-hub.com/explore/sentinel-playground); MIROVA (Middle InfraRed Observation of Volcanic Activity), a collaborative project between the Universities of Turin and Florence (Italy) supported by the Centre for Volcanic Risk of the Italian Civil Protection Department (URL: http://www.mirovaweb.it/).
2023: January
2022: January
| February
| March
| April
| May
| June
| July
| August
| September
| October
| November
| December
2021: July
| August
| September
| October
| November
| December
2020: February
| September
| October
2019: May
| June
| October
| December
2017: June
2016: March
| April
| May
| June
| July
| August
2014: May
| June
| November
2013: May
| June
| August
2007: August
| September
AVO reported that the eruption at Pavlof has ended. No explosions had been detected since [7 December] and seismicity had decreased to background levels. Weakly elevated surface temperatures and minor steaming from the recently active vent continue to be observed intermittently in satellite and webcam images, consistent with the cooling of previously erupted lava. On 19 January AVO lowered the Volcano Alert Level to Normal (the lowest level on a four-level scale) and the Aviation Color Code to Green (the lowest level on a four-color scale).
Source: US Geological Survey Alaska Volcano Observatory (AVO)
AVO reported that no elevated surface temperatures or incandescent lava at Pavlof had been observed in satellite and webcam images since 2 December. Seismicity remained above background levels with intermittent seismic tremor, though explosions had not been recorded since 7 December. On 17 December AVO lowered the Volcano Alert Level to Advisory (the second lowest level on a four-level scale) and the Aviation Color Code to Yellow (the second lowest level on a four-color scale).
Source: US Geological Survey Alaska Volcano Observatory (AVO)
AVO reported that seismic tremor and a few low-frequency earthquakes at Pavlof indicated continuing unrest during 7-13 December; one explosion was recorded on 7 December. No explosions or lava flow activity was detected in seismic, infrasound, satellite, or webcam data during the rest of the week. The report noted that events on 3 December resulted in the erosion of a narrow, 2-km-long gully beneath the ice below the vent. The Volcano Alert Level remained at Watch (the second highest level on a four-level scale) and the Aviation Color Code remained at Orange (the second highest level on a four-color scale).
Source: US Geological Survey Alaska Volcano Observatory (AVO)
AVO reported that a minor eruption at a vent on Pavlof’s upper E flank was ongoing during 29 November-6 December and nearly continuous seismic tremor was recorded. Daily small explosions were recorded through 3 December. Elevated surface temperatures were identified in satellite and webcam images during 29 November-1 December; weather clouds often prevented views during most of the week. A small plume was visible during 5-6 December; the ash content was unknown. The Volcano Alert Level remained at Watch (the second highest level on a four-level scale) and the Aviation Color Code remained at Orange (the second highest level on a four-color scale).
Source: US Geological Survey Alaska Volcano Observatory (AVO)
AVO reported that a minor eruption at a vent on Pavlof’s upper E flank was ongoing during 23-29 November and nearly continuous seismic tremor was recorded. Vent incandescence was visible in webcam images on most days, suggesting ongoing lava effusion. Elevated surface temperatures were occasionally identified in satellite images. Minor ash emissions were observed in webcam images during 26-27 November. A seismic signal at 1748 on 28 November indicated a flowage event. Webcam images from 29 November confirmed that a flowage event had occurred, and a resulting gas cloud possibly containing ash rose as high as 6.1 km (20,000 ft) a.s.l. The Volcano Alert Level remained at Watch (the second highest level on a four-level scale) and the Aviation Color Code remained at Orange (the second highest level on a four-color scale).
Source: US Geological Survey Alaska Volcano Observatory (AVO)
AVO reported that a minor eruption at a vent on Pavlof’s upper E flank was ongoing during 16-22 November and nearly continuous seismic tremor was recorded. Almost daily elevated surface temperatures were identified in satellite images; weather clouds prevented views during 21-22 November. Webcam images showed occasional minor steaming and minor ash emissions in addition to a recent mass flow and ash deposits on the upper to lower flanks visible during 15-16 November, and incandescence at the vent during 16-17 November possibly associated with lava spattering or fountaining. The Volcano Alert Level remained at Watch (the second highest level on a four-level scale) and the Aviation Color Code remained at Orange (the second highest level on a four-color scale).
Source: US Geological Survey Alaska Volcano Observatory (AVO)
AVO reported that a minor eruption at a vent on Pavlof’s upper E flank was ongoing during 9-15 November and nearly continuous seismic tremor was recorded. Multiple explosions were detected almost daily in seismic and infrasound data. Elevated surface temperatures were seen in cloudy satellite images during 10 and 12-15 November. Clear webcam images taken on 12 and 15 November showed a lava flow and ash deposits on the upper flanks, though due to cloudy conditions earlier in the week the timing of these events is uncertain. Nighttime crater incandescence was visible in webcam images on 14 and 15 November. The Volcano Alert Level remained at Watch (the second highest level on a four-level scale) and the Aviation Color Code remained at Orange (the second highest level on a four-color scale).
Source: US Geological Survey Alaska Volcano Observatory (AVO)
AVO reported that a minor eruption at a vent on Pavlof’s upper E flank was ongoing during 2-8 November and nearly continuous seismic tremor was recorded. Multiple explosions were detected almost daily in seismic and infrasound data. Trace ash deposits on the NW flank were identified in satellite images during 1-2 November, and minor steaming was visible on 3 November. Minor steam-and-ash emissions were visible in webcam images and observed by pilots during 3-4 November, and ash deposits on the flanks were visible. Elevated surface temperatures were identified in satellite images during 4-8 November. The Volcano Alert Level remained at Watch (the second highest level on a four-level scale) and the Aviation Color Code remained at Orange (the second highest level on a four-color scale).
Source: US Geological Survey Alaska Volcano Observatory (AVO)
AVO reported that a minor eruption at a vent on Pavlof’s upper E flank was ongoing during 26 October-1 November and nearly continuous seismic tremor was recorded. Multiple explosions, detected almost daily in seismic and infrasound data, had intensified during the previous week. No significant activity was observed in cloudy-to-partly-cloudy satellite and webcam views during most of the week; diffuse steam-and-ash plume rose less than 3 km (10,000 ft) a.s.l. during 31 October-1 November and deposited minor amounts of tephra on the E flank. The Volcano Alert Level remained at Watch (the second highest level on a four-level scale) and the Aviation Color Code remained at Orange (the second highest level on a four-color scale).
Source: US Geological Survey Alaska Volcano Observatory (AVO)
AVO reported that a minor eruption at a vent on Pavlof’s upper E flank was ongoing during 18-25 October and nearly continuous seismic tremor was recorded. Multiple daily explosions were detected in seismic and infrasound data. Sequences of small explosions during 18-20 October were accompanied by incandescence near the summit in webcam views. Webcam images from the afternoon of 20 October showed a new dark flow of lava and debris extending about a third of the way down the E flank. Elevated surface temperatures were identified in satellite images on almost all days. The Volcano Alert Level remained at Watch (the second highest level on a four-level scale) and the Aviation Color Code remained at Orange (the second highest level on a four-color scale).
Source: US Geological Survey Alaska Volcano Observatory (AVO)
AVO reported that a minor eruption at a vent on Pavlof’s upper E flank was ongoing during 11-18 October and seismic tremor continued. Multiple explosions were recorded in seismic and infrasound data almost daily. Clear webcam views captured very small ash emissions and lava in the immediate vicinity of the vent during 11-14 October, and incandescent rock fragments being ejected from the vent during 13-14 October. Elevated surface temperatures were identified in satellite images on most days during 13-18 October. The Volcano Alert Level remained at Watch (the second highest level on a four-level scale) and the Aviation Color Code remained at Orange (the second highest level on a four-color scale).
Source: US Geological Survey Alaska Volcano Observatory (AVO)
AVO reported that a minor eruption at a vent on Pavlof’s upper E flank was ongoing during 4-11 October. Seismic tremor continued. Strongly elevated surface temperatures were identified in satellite images during 5-6 October and incandescence was visible in nighttime webcam images. Discolored snow near the vent was visible in webcam views during the morning of 7 October suggesting low-level explosive activity; a small explosion was recorded at 1503 that same day though cloudy conditions prevented visual confirmation. Two small explosions were detected during 8-11 October. Very small ash emissions and lava near the vent were visible in occasional clear webcam images during 10-11 October. The Volcano Alert Level remained at Watch (the second highest level on a four-level scale) and the Aviation Color Code remained at Orange (the second highest level on a four-color scale).
Source: US Geological Survey Alaska Volcano Observatory (AVO)
AVO reported that a minor eruption at a vent on Pavlof’s upper E flank was ongoing during 27 September-4 October. Seismic tremor continued, and a few small earthquakes were recorded during 28-29 September. Weather clouds often prevented views of the volcano, though elevated surface temperatures were identified in satellite images on a few of the days. Diffuse steam plumes were visible in webcam views during 30 September-2 October. The Volcano Alert Level remained at Watch (the second highest level on a four-level scale) and the Aviation Color Code remained at Orange (the second highest level on a four-color scale).
Source: US Geological Survey Alaska Volcano Observatory (AVO)
AVO reported that a minor eruption at a vent on Pavlof’s upper E flank was ongoing during 20-27 September. Small explosions were detected in seismic and infrasound data during 20-21 September; seismic tremor levels were variable during the rest of the week. Weather clouds often prevented views of the volcano, though elevated surface temperatures were identified in satellite and webcam images during 20-21 and 23-27 September. A diffuse gas was occasionally seen in webcam images during 25-26 September, and one plume with possible ash content was visible during 26-27 September. The Volcano Alert Level remained at Watch and the Aviation Color Code remained at Orange.
Source: US Geological Survey Alaska Volcano Observatory (AVO)
AVO reported that a minor eruption at a vent on Pavlof’s upper E flank was ongoing during 13-20 September. Seismic tremor persisted. New lahar and minor ash deposits extending less than 900 m from the vent were visible during 11-13 September. Strong incandescence at the vent and from an area within 200 m downslope was visible in webcam images starting on 14 September, signifying the emplacement of a short lava flow. Elevated surface temperatures over the vent and flow were identified in satellite images through 20 September; lava effusion continued but no active lava flows extended down the flank from the vent. Explosions were recorded during 18-19 September and steam emissions were visible in webcam images during 19-20 September. The Volcano Alert Level remained at Watch and the Aviation Color Code remained at Orange.
Source: US Geological Survey Alaska Volcano Observatory (AVO)
AVO reported that a minor eruption at a vent on Pavlof’s upper E flank was ongoing during 6-13 September. Seismic tremor persisted. Weather clouds often prevented views of the volcano during the first part of the week, though one clear webcam view on 8 September showed a minor emission of ash or steam. Elevated surface temperatures were identified in satellite images during 10-12 September. A diffuse steam plume and new trace deposits of ash were visible in webcam images on 11 September. The Volcano Alert Level remained at Watch and the Aviation Color Code remained at Orange.
Source: US Geological Survey Alaska Volcano Observatory (AVO)
AVO reported that a minor eruption at a vent on Pavlof’s upper E flank was ongoing during 30 August-6 September. A small vent re-opened ESE of the main vent. Seismic tremor persisted. Weather clouds mostly prevented views of the volcano during the first part of the week, though incandescence from the vent was visible in webcam images at night on 1 September; elevated surface temperatures were identified in satellite images during 2-6 September. A diffuse gas plume visible in webcam images on 4 September possibly contained trace amounts of ash. Gas plumes visible the next day contained minor amounts of ash. The Volcano Alert Level remained at Watch and the Aviation Color Code remained at Orange.
Source: US Geological Survey Alaska Volcano Observatory (AVO)
AVO reported that a minor eruption at a vent on Pavlof’s upper E flank was ongoing during 23-30 August, though there was no evidence of lava effusion. Seismic tremor persisted. A small ash emission rose to about 4 km (12,000 ft) a.s.l. on 24 August and was seen by passing aircraft. Sulfur dioxide emissions were also detected that same day. The Volcano Alert Level remained at Watch and the Aviation Color Code remained at Orange.
Source: US Geological Survey Alaska Volcano Observatory (AVO)
AVO reported that a minor eruption at a vent on Pavlof’s upper E flank was ongoing during 16-23 August. There was no evidence of lava effusion, but seismic tremor persisted and multiple small explosions were detected on most days in local seismic, regional seismic, and infrasound data. During 17-18 August explosions produced minor ash emissions that rose to 3 km (10,000 ft) a.s.l. and dissipated quickly, as reported by pilots and seen in webcam images. Daily elevated surface temperatures were identified in satellite images reflecting a hot vent. The Volcano Alert Level remained at Watch and the Aviation Color Code remained at Orange.
Source: US Geological Survey Alaska Volcano Observatory (AVO)
AVO reported that a minor eruption at a vent on Pavlof’s upper E flank was ongoing during 9-16 August, though cloud cover often prevented visual confirmation. Seismic tremor persisted and multiple small daily explosions were detected in local and regional seismic and infrasound data. The explosions may have produced minor ash emissions that rose no higher than 3 km (10,000 ft) a.s.l. and dissipated quickly, though on a few of the clear views none were seen. Elevated surface temperatures were identified in satellite images on most of the days. The Volcano Alert Level remained at Watch and the Aviation Color Code remained at Orange.
Source: US Geological Survey Alaska Volcano Observatory (AVO)
AVO reported that a minor eruption at a vent on Pavlof’s upper E flank was ongoing during 3-9 August. Seismic tremor persisted and multiple daily explosions were detected in local and regional seismic and infrasound data. The explosions likely produced minor ash emissions that rose no higher than 3 km (10,000 ft) a.s.l., though cloud cover prevented confirmation on most days. Strongly elevated surface temperatures were identified in satellite images during 7-8 August. The Volcano Alert Level remained at Watch and the Aviation Color Code remained at Orange.
Source: US Geological Survey Alaska Volcano Observatory (AVO)
AVO reported that a minor eruption at a vent on Pavlof’s upper E flank was ongoing during 26 July-2 August. Daily elevated surface temperatures were identified in satellite images. Seismic tremor persisted and multiple daily explosions were detected in local and regional seismic and infrasound data. The explosions likely produced minor ash emissions that rose no higher than 3 km (10,000 ft) a.s.l., though cloud cover prevented confirmation on most days. Ash emissions were visible in webcam images during 27-28 July. Sulfur dioxide gas emissions were visible on 26 July and team emissions were noted during 30-31 July. The Volcano Alert Level remained at Watch and the Aviation Color Code remained at Orange.
Source: US Geological Survey Alaska Volcano Observatory (AVO)
AVO reported that a minor eruption at a vent on Pavlof’s upper E flank was ongoing during 19-26 July. Seismic tremor persisted and multiple daily explosions were detected in seismic and infrasound data. Elevated surface temperatures were identified almost daily in satellite images; weather clouds sometimes prevented views. Diffuse ash emissions were visible in webcam images during 19-20 July. A low-level ash cloud that rose to 2.6 km (8,600 ft) a.s.l. was observed by a pilot at around 1150 on 22 July and corresponded to a slightly larger explosion detected in infrasound data. Steam emissions were visible in satellite images during 25-26 July. The Volcano Alert Level remained at Watch and the Aviation Color Code remained at Orange.
Source: US Geological Survey Alaska Volcano Observatory (AVO)
AVO reported that a minor eruption at a vent on Pavlof’s upper E flank was ongoing during 12-19 July. Seismic tremor persisted and multiple daily explosions were detected in seismic and infrasound data. Elevated surface temperatures identified in satellite images on a few of the days possibly reflected ongoing minor lava effusion; cloud cover prevented views on most of the days during the week. Minor ash emissions were seen in webcam images during 18019 July. The Volcano Alert Level remained at Watch and the Aviation Color Code remained at Orange.
Source: US Geological Survey Alaska Volcano Observatory (AVO)
AVO reported that the eruption at a vent on Pavlof’s upper E flank was ongoing during 5-12 July, and seismic tremor persisted. Daily elevated surface temperatures identified in satellite images were consistent with the continuing effusion of short lava flows; the lava flow was 380 m long by 27 June. Three small explosions were detected during 0315-0317 on 7 July in seismic and infrasound data. Multiple small explosions were recorded during 10-12 July. The Volcano Alert Level remained at Watch and the Aviation Color Code remained at Orange.
Source: US Geological Survey Alaska Volcano Observatory (AVO)
AVO reported that the eruption at a vent on Pavlof’s upper E flank was ongoing during 29 June-5 July, and seismic tremor persisted. Daily elevated surface temperatures identified in satellite images were consistent with the continuing effusion of short (615 m or less) lava flows. The Volcano Alert Level remained at Watch and the Aviation Color Code remained at Orange.
Source: US Geological Survey Alaska Volcano Observatory (AVO)
AVO reported that the eruption at a vent on Pavlof’s upper E flank was ongoing during 21-28 June, and seismic tremor persisted. Daily elevated surface temperatures identified in satellite images were consistent with the continuing effusion of short (615 m or less) lava flows. The Volcano Alert Level remained at Watch and the Aviation Color Code remained at Orange.
Source: US Geological Survey Alaska Volcano Observatory (AVO)
AVO reported that the eruption at a vent on Pavlof’s upper E flank was ongoing during 14-21 June, and seismic tremor persisted. Daily elevated surface temperatures identified in satellite images were consistent with the continuing effusion of short (500 m or less) lava flows. The Volcano Alert Level remained at Watch and the Aviation Color Code remained at Orange.
Source: US Geological Survey Alaska Volcano Observatory (AVO)
AVO reported that the eruption at a vent on Pavlof’s upper E flank was ongoing during 8-14 June, and seismic tremor persisted. Daily elevated surface temperatures identified in satellite images were consistent with the continuing effusion of short (500 m or less) lava flows. Diffuse, low-level ash emissions were visible in webcam images on 13 June. The Volcano Alert Level remained at Watch and the Aviation Color Code remained at Orange.
Source: US Geological Survey Alaska Volcano Observatory (AVO)
AVO reported that the eruption at a vent on Pavlof’s upper E flank was ongoing during 31 May-7 June, and seismic tremor persisted. A short lava flow from the vent was observed during 31 May-1 June, and daily elevated surface temperatures identified in satellite images during the remainder of the week were consistent with continuing activity. The Volcano Alert Level remained at Watch and the Aviation Color Code remained at Orange.
Source: US Geological Survey Alaska Volcano Observatory (AVO)
AVO reported that the eruption at a vent on Pavlof’s upper E flank was ongoing during 24-31 May, and seismic tremor persisted. Daily elevated surface temperatures were identified in satellite images consistent with the effusion of short lava flows on the upper E flank. An active flow that was 650 m long was visible in satellite images during 28-29 May. The Volcano Alert Level remained at Watch and the Aviation Color Code remained at Orange.
Source: US Geological Survey Alaska Volcano Observatory (AVO)
AVO reported that the eruption at a vent on Pavlof’s upper E flank was ongoing during 17-24 May, and seismic tremor persisted. Daily elevated surface temperatures were identified in satellite images consistent with the effusion of short lava flows on the upper flank. The Volcano Alert Level remained at Watch and the Aviation Color Code remained at Orange.
Source: US Geological Survey Alaska Volcano Observatory (AVO)
AVO reported that the eruption at a vent on Pavlof’s upper E flank was ongoing during 10-17 May, and seismic tremor persisted. Daily elevated surface temperatures were identified in satellite images consistent with the effusion of short lava flows on the upper flank. The Volcano Alert Level remained at Watch and the Aviation Color Code remained at Orange.
Source: US Geological Survey Alaska Volcano Observatory (AVO)
AVO reported that the eruption at a vent on Pavlof’s upper E flank was ongoing during 3-10 May, though weather conditions sometimes prevented visual observations. Seismic tremor persisted. Daily elevated surface temperatures were identified in satellite images and almost daily steam emissions were recorded in webcam images. The lava flow from the E vent was 500 m long by 8 May. The Volcano Alert Level remained at Watch and the Aviation Color Code remained at Orange.
Source: US Geological Survey Alaska Volcano Observatory (AVO)
AVO reported that the eruption at a vent on Pavlof’s upper E flank was ongoing during 26 April-3 May, though weather conditions sometimes prevented visual observations. Seismic tremor persisted and elevated surface temperatures were identified in satellite images almost daily. A short lava flow had descended the E flank during 26-28 April and was about 500 m long. Steaming from the active vent was visible during 30 April-2 May. The Volcano Alert Level remained at Watch and the Aviation Color Code remained at Orange.
Source: US Geological Survey Alaska Volcano Observatory (AVO)
AVO reported that the eruption at a vent on Pavlof’s upper E flank was ongoing during 20-26 April, though weather conditions sometimes prevented visual observations. Seismic tremor persisted and daily elevated surface temperatures were identified in satellite images. The Volcano Alert Level remained at Watch and the Aviation Color Code remained at Orange.
Source: US Geological Survey Alaska Volcano Observatory (AVO)
AVO reported that the eruption at a vent on Pavlof’s upper E flank was ongoing during 12-19 April, though weather conditions sometimes prevented visual observations. Seismic tremor persisted and elevated surface temperatures were identified in satellite images almost daily. Steam emissions were seen rising above the summit in webcam images on 16 April. The Volcano Alert Level remained at Watch and the Aviation Color Code remained at Orange.
Source: US Geological Survey Alaska Volcano Observatory (AVO)
AVO reported that the eruption at a vent on Pavlof’s upper E flank was ongoing during 5-12 April, and seismic tremor persisted. Elevated surface temperatures were identified in satellite images almost daily. Possible minor lava effusion was visible in satellite images on 6 April, and a few small explosions were recorded each day during 6-9 April. Low-level ash emissions were visible in webcam and satellite images during 6-7 April, and satellite images captured ash and pyroclastic flow deposits extending at most 1.5 km from the vent and short lava flows on 9 April. Steam emissions from the vent were visible during 8-10 April. The Volcano Alert Level remained at Watch and the Aviation Color Code remained at Orange.
Source: US Geological Survey Alaska Volcano Observatory (AVO)
AVO reported that weak eruptive activity was ongoing at Pavlof during 30 March through 4 April, and seismic tremor persisted. Weak explosive activity was detected during 31 March and 2-3 April with low-level plumes visible in the mornings, though satellite and webcam views were mostly obscured by clouds. During 3-4 April elevated surface temperatures were detected in satellite images despite the cloudy weather. The Volcano Alert Level remained at Watch and the Aviation Color Code remained at Orange.
Source: US Geological Survey Alaska Volcano Observatory (AVO)
AVO reported that the eruption at a vent on Pavlof’s upper E flank was ongoing during 22-29 March, and seismic tremor persisted. Elevated surface temperatures were identified in satellite images on most of the days and were consistent with minor lava effusion. Cloud cover sometimes prevented webcam and satellite views of the summit area; sulfur dioxide emissions were visible in satellite images during 24-26 March. Two small explosions were detected in local and regional infrasound data during 23-24 March and one was recorded during 26-27 March. The Volcano Alert Level remained at Watch and the Aviation Color Code remained at Orange.
Source: US Geological Survey Alaska Volcano Observatory (AVO)
AVO reported that the eruption at a vent on Pavlof’s upper E flank was ongoing during 15-22 March, and seismic tremor persisted. Cloud cover sometimes prevented webcam and satellite views of the summit area, though almost-daily elevated surface temperatures identified in satellite images were consistent with minor lava effusion. Three small explosions were detected in local and regional infrasound data during 19-20 March. The Volcano Alert Level remained at Watch and the Aviation Color Code remained at Orange.
Source: US Geological Survey Alaska Volcano Observatory (AVO)
AVO reported that the eruption at a vent on Pavlof’s upper E flank was ongoing during 8-15 March, and small explosions were detected in local seismic and infrasound data on most days. Tremor levels was characterized as strong during 8-10 March and moderate during the rest of the week. A satellite image acquired on 7 March showed highly elevated surface temperatures near the vent (likely due to an accumulation of lava spatter), and a dark lahar deposit extending 750 m down the SE flank. Minor ash deposits were visible around the vent. Elevated surface temperatures were visible on most days of the week, though cloud cover sometimes prevented observations, consistent with continued activity. On 14 March satellite images showed minor lava effusion at the vent. The Volcano Alert Level remained at Watch and the Aviation Color Code remained at Orange.
Source: US Geological Survey Alaska Volcano Observatory (AVO)
AVO reported that the eruption at Pavlof was ongoing during 2-8 March. Small explosions were detected on most days. Lava effusion likely continued from a vent just E of the summit, possibly sending lava flows a short distance down the NE flank, though weather clouds often obscured views. Elevated surface temperatures were often identified in satellite images. A high-resolution satellite image acquired during 5-6 March showed a developing spatter cone in the E crater, as well as no active lava flows nor widespread ash deposits on the flanks. The Volcano Alert Level remained at Watch and the Aviation Color Code remained at Orange.
Source: US Geological Survey Alaska Volcano Observatory (AVO)
AVO reported that the eruption at Pavlof was ongoing during 23 February-1 March. Lava effusion continued from a vent just E of the summit and sent a lava flow a short distance down the NE flank. Seismicity was higher with periods of tremor, and elevated surface temperatures were periodically identified in satellite images; both were consistent with continuing lava effusion. Small explosions were detected during 24 and 26-28 February. The Volcano Alert Level remained at Watch and the Aviation Color Code remained at Orange.
Source: US Geological Survey Alaska Volcano Observatory (AVO)
AVO reported that the eruption at Pavlof was ongoing during 16-22 February with lava effusion from a vent on the upper SE flank feeding flows on the E flank. Seismicity was elevated with periods of tremor detected and elevated surface temperatures identified in satellite images; both were consistent with continuing lava effusion. The Volcano Alert Level remained at Watch and the Aviation Color Code remained at Orange.
Source: US Geological Survey Alaska Volcano Observatory (AVO)
AVO reported that the eruption at Pavlof was ongoing during 8-15 February with lava effusion from a vent on the upper SE flank feeding lava flows on the E flank. Seismicity was elevated with periods of tremor and elevated surface temperatures were identified in satellite images; both were consistent was continuing lava effusion. The Volcano Alert Level remained at Watch and the Aviation Color Code remained at Orange.
Source: US Geological Survey Alaska Volcano Observatory (AVO)
AVO reported that the eruption at Pavlof was ongoing during 1-8 February with lava effusion on the upper SE flank feeding a branching flow on the E flank. Seismicity was elevated with periods of tremor and elevated surface temperatures were identified in satellite images; both were consistent was continuing lava effusion. The Volcano Alert Level remained at Watch and the Aviation Color Code remained at Orange.
Source: US Geological Survey Alaska Volcano Observatory (AVO)
AVO reported that the eruption at Pavlof was ongoing during 25 January-1 February, and seismicity was elevated with periods of tremor. A pilot observed the active flow on the E flank on 25 January. Elevated surface temperatures consistent with the lava flow persisted through 30 January; cloud cover prevented views during 31 January-1 February. The Volcano Alert Level remained at Watch and the Aviation Color Code remained at Orange.
Source: US Geological Survey Alaska Volcano Observatory (AVO)
AVO reported that the eruption at Pavlof was ongoing during 18-25 January, with periods of elevated tremor. Small daily explosions were recorded on local and regional infrasound sensors during 18-22 January. A satellite image from 19 January showed that the lava flow on the E flank was 1.3 km long, and a lahar on the same flank was 4.4 km long. Elevated surface temperatures consistent with the active lava flow persisted through 25 January. The Volcano Alert Level remained at Watch and the Aviation Color Code remained at Orange.
Source: US Geological Survey Alaska Volcano Observatory (AVO)
AVO reported that elevated seismicity at Pavlof during 12-18 January was characterized by daily periods of tremor. Elevated surface temperatures consistent with lava effusion near the vent and the active lava flow on the SE flank were identified in satellite images almost daily; weather clouds prevented views for periods of time during 12-13 January. The Volcano Alert Level remained at Watch and the Aviation Color Code remained at Orange.
Source: US Geological Survey Alaska Volcano Observatory (AVO)
AVO reported that elevated seismicity at Pavlof during 5-11 January was characterized by daily periods of tremor. High surface temperatures consistent with active lava effusion near the vent were identified in satellite images each day. The lava flow on the SE flank lengthened from 80 to 300 m during 2-6 January based on high-resolution satellite data. Robust steaming was observed by pilots and in webcam images on 9 January. The Volcano Alert Level remained at Watch and the Aviation Color Code remained at Orange.
Source: US Geological Survey Alaska Volcano Observatory (AVO)
AVO reported that seismicity at Pavlof was elevated during 29 December 2021 to 4 January 2022 and was characterized by daily periods of tremor. Minor ash emissions were visible during 28-29 December and small explosions were occasionally recorded during 29-30 December. Thermal emissions continued to be low, and elevated surface temperatures consistent with a hot vent region were identified in satellite images during 1-3 January. During 3-4 January lava was active in an area within 100 m of the SE vent. The Volcano Alert Level remained at Watch and the Aviation Color Code remained at Orange.
Source: US Geological Survey Alaska Volcano Observatory (AVO)
AVO reported that seismicity at Pavlof was elevated during 22-28 December and was mainly characterized by periods of sustained tremor and discrete low-frequency events. Numerous small explosions were recorded almost daily, and strongly elevated surface temperatures were visible in satellite images, consistent with lava effusion. The Volcano Alert Level remained at Watch and the Aviation Color Code remained at Orange.
Source: US Geological Survey Alaska Volcano Observatory (AVO)
AVO reported seismicity at Pavlof was elevated during 14-21 December and was mainly characterized by periods of sustained tremor and discrete low-frequency events. Strongly elevated surface temperatures were visible in satellite images during 14-16 and 18-21 December, consistent with lava effusion. Numerous small explosions were recorded during 19-21 December. The Volcano Alert Level remained at Watch and the Aviation Color Code remained at Orange.
Source: US Geological Survey Alaska Volcano Observatory (AVO)
AVO reported seismicity at Pavlof was elevated during 8-14 December, and weak explosive activity was detected by geophysical sensors during 8-11 and 13-14 December. No ash emissions were visible, though satellite and webcam views were often cloudy. Elevated surface temperatures were visible in satellite images during 11-14 December; a lava flow on the E flank was visible in images during 12-13 December. The Volcano Alert Level remained at Watch and the Aviation Color Code remained at Orange.
Source: US Geological Survey Alaska Volcano Observatory (AVO)
AVO reported that the eruption at Pavlof continued during 1-7 December, focused at a vent on the upper SE flank. Seismicity remained elevated and several daily explosions were detected using infrasound data. Elevated surface temperatures were observed in satellite data during 1-2 December, though cloud cover often prevented observations. No emissions were visible in mostly cloudy satellite and webcam views during 1-3 December. Minor ash emissions were visible in webcam images on 4 December and, based on webcam images and a pilot observation, the next day a diffuse ash plume rose as high as 3 km (10,000 ft) a.s.l. and drifted tens of kilometers beyond the volcano. The Volcano Alert Level remained at Watch and the Aviation Color Code remained at Orange.
Source: US Geological Survey Alaska Volcano Observatory (AVO)
AVO reported that the eruption at Pavlof continued during 23-30 November, focused at a vent on the upper SE flank. Low lava fountaining that had begun on 14 November continued to construct an unstable cone over the vent. Hot rubbly lava flows from the cone traveled a few hundred meters down the flanks, melting snow and ice that resulted in narrow lahars which traveled several kilometers down the flanks; satellite data from 25 November showed a new debris flow extending downslope from the end of the lava flow. Seismicity remained elevated; a few small explosions were detected during 24-26 and 28-30 November. Elevated surface temperatures were periodically observed in satellite data, though cloud cover sometimes prevented observations. The Volcano Alert Level remained at Watch and the Aviation Color Code remained at Orange.
Source: US Geological Survey Alaska Volcano Observatory (AVO)
AVO reported that the eruption at Pavlof continued during 14-23 November and was focused at a vent on the upper NE flank. Seismicity remained elevated and signals were periodically recorded that were likely explosions. Lava fountaining began on 14 November and had built a small, unstable cone. Hot debris from the cone traveled a few hundred meters down the flanks, melting snow and ice that resulted in narrow lahars which traveled several kilometers down the flanks. Elevated surface temperatures were observed in satellite data at least through 23 November, suggesting that the lava fountaining continued. The Volcano Alert Level remained at Watch and the Aviation Color Code remained at Orange.
Source: US Geological Survey Alaska Volcano Observatory (AVO)
AVO reported that the eruption at Pavlof continued during 10-16 November and was focused at a vent on the upper NE flank. Seismicity remained elevated. Pilots observed steam plumes rising to 4.3 km (14,000 ft) a.s.l.; steam plumes were also visible the next day. On 11 November a narrow 2-km-long lahar deposit on the SE flank was identified in satellite images. The lahar was likely generated by the interaction of lava and snow on the upper flank. Strongly elevated surface temperatures visible in satellite images during 10-15 November were indicative of lava effusion and possibly fountaining. Several explosions were recorded during 12-14 November. The Volcano Alert Level and Aviation Color Code remained at Watch and Orange, respectively.
Source: US Geological Survey Alaska Volcano Observatory (AVO)
AVO reported that the eruption at Pavlof continued during 3-9 November and was focused at a vent on the upper NE flank. Seismicity remained elevated; several small explosions and discontinuous tremor were recorded during 5-8 November with increased frequency compared to the previous week. The explosions likely produced small, low-level ash plumes, though weather clouds often prevented confirmation by satellite and webcam images. Elevated surface temperatures were visible in satellite images overnight during 7-8 November, coincident with the emplacement of a 30-m-long lava flow. Small diffuse ash plumes were visible in webcam images and dissipated quickly. Elevated surface temperatures remained visible through 9 November. The Volcano Alert Level and Aviation Color Code remained at Watch and Orange, respectively.
Source: US Geological Survey Alaska Volcano Observatory (AVO)
AVO reported that the eruption at Pavlof continued during 27 October-2 November and was focused at a vent on the upper SE flank, near the location of the 2007 vent. Seismicity remained elevated with tremor and daily small explosion signals. The explosions likely produced low-level ash plumes that rose no higher than 3 km (10,000 ft) a.s.l., though weather clouds often prevented confirmation by satellite and webcam images. Elevated surface temperatures were visible in satellite images during 25-26 October. A small plume and discolored snow at the summit were visible in mostly clear satellite images during 27-28 October. Slightly elevated temperatures were identified in satellite images during 31 October-2 November. Minor steaming at the vent was seen in webcam images on 1 November, as well as a small ash plume that rose to a low height and dissipated quickly. The Volcano Alert Level and Aviation Color Code remained at Watch and Orange, respectively.
Source: US Geological Survey Alaska Volcano Observatory (AVO)
AVO reported that the eruption at Pavlof continued during 20-26 October and was focused at a vent on the upper SE flank, near the location of the 2007 vent. Seismicity remained elevated with tremor and daily small explosions during 20-24 October. Weather clouds obscured satellite and webcam images most days, but the explosions likely produced low-level ash plumes that rose no higher than 3 km (10,000 ft) a.s.l. Elevated surface temperatures were visible in satellite images during 25-26 October. The Volcano Alert Level and Aviation Color Code remained at Watch and Orange, respectively.
Source: US Geological Survey Alaska Volcano Observatory (AVO)
AVO reported that the eruption at Pavlof continued during 13-19 October and was focused at a vent on the upper SE flank, near the location of the 2007 vent. Seismicity remained elevated. Two small explosions were recorded in infrasound and seismic data on both 14 and 16 October. A few explosions were recorded during 17-18 October; ash deposits on the flanks were visible in satellite images. Cloudy conditions obscured satellite and webcam images most days. The Volcano Alert Level and Aviation Color Code remained at Watch and Orange, respectively.
Source: US Geological Survey Alaska Volcano Observatory (AVO)
AVO reported that seismicity at Pavlof remained elevated during 6-12 October. Two explosions were recorded by infrasound network during 6-7 October. Mostly cloudy conditions obscured satellite and webcam images most days. The Volcano Alert Level and Aviation Color Code remained at Watch and Orange, respectively.
Source: US Geological Survey Alaska Volcano Observatory (AVO)
AVO reported that seismicity at Pavlof remained elevated during 29 September-5 October. No explosions were recorded most days by the seismic and infrasound networks, and no eruptive activity was observed in mostly cloudy webcam and satellite images. On 3 October webcam images showed that recent ash deposits on the flanks had been covered by fresh snow; later that night either new ash deposits were visible in webcam images or older deposits were revealed due to snowmelt. Weakly elevated surface temperatures were identified in satellite images. At least two minor explosions were recorded during 4-5 October and minor emissions likely comprised of steam and sulfur dioxide were visible in morning webcam images on 5 October. The Volcano Alert Level and Aviation Color Code remained at Watch and Orange, respectively.
Source: US Geological Survey Alaska Volcano Observatory (AVO)
AVO reported that seismicity at Pavlof remained elevated during 21-28 September. Daily short-lived explosions from a vent on the upper SE flank were detected in seismic and infrasound data. Low-level ash emissions were visible in webcam images rising possibly several hundred meters above the summit during 21-23 September. Steam emissions rose from the vent during 24-25 September. The Volcano Alert Level and Aviation Color Code remained at Watch and Orange, respectively.
Source: US Geological Survey Alaska Volcano Observatory (AVO)
AVO reported that periods of elevated seismic tremor with no clear explosion signals were recorded at Pavlof during 14-18 September. Webcam images were mostly obscured by weather clouds. Minor ash deposits on the upper flanks and at least one minor ash emission was visible in a clear webcam view on 18 September. Small low-level ash emissions that dissipated quickly were noted by observers and visible in webcam images at 1500 on 19 September and at 0900 on 20 September. Ash deposits on the mid-flanks were identified in satellite data. Seismicity remained elevated during 2021 September; an explosion was recorded early on the 21 September. The vent in the crater continued to migrate N based on satellite data. The Volcano Alert Level and Aviation Color Code remained at Watch and Orange, respectively.
Source: US Geological Survey Alaska Volcano Observatory (AVO)
AVO reported that seismicity at Pavlof continued at low levels during 7-14 September and was interspersed with periods of more energetic tremor. Although weather clouds often obscured views, a series of four very minor ash emissions were visible in webcam images for a period of five hours on 10 September. The explosions produced minor and diffuse ash emissions that rose from a vent on the E flank and dissipated within minutes. A small explosion was recorded on 12 September and on 13 September, though cloud cover prevented visual confirmation of both events. The Volcano Alert Level and Aviation Color Code remained at Watch and Orange, respectively.
Source: US Geological Survey Alaska Volcano Observatory (AVO)
AVO reported that seismicity at Pavlof was low, though elevated above background levels during 31 August-7 September. Inclement weather sometime prevented satellite and webcam views of the volcano. A sulfur dioxide plume was visible in satellite images on 2 September. The Volcano Alert Level and Aviation Color Code remained at Watch and Orange, respectively.
Source: US Geological Survey Alaska Volcano Observatory (AVO)
AVO reported that several small daily explosions at Pavlof were recorded by seismic and infrasound sensors during 24-26 August. A pilot observed an ash plume from an explosion that rose to 3.7 km (12,000 ft) a.s.l on 25 August. Seismicity was relatively quiet during 27-31 August; elevated surface temperatures continued to be recorded on most of those days. One explosion on 28 August produced an ash emission visible in webcam data. The Volcano Alert Level and Aviation Color Code remained at Watch and Orange, respectively.
Source: US Geological Survey Alaska Volcano Observatory (AVO)
AVO reported that occasional small explosions and elevated seismicity at Pavlof were detected in geophysical data during 18-19 August; clouds often obscured the view of the volcano. Observations from webcams and pilots indicated minor low-level ash emissions during 18-19 August. Weakly elevated surface temperatures were frequently detected during 18-22 August in the active vent based on satellite and webcam data. The Volcano Alert Level and Aviation Color Code remained at Watch and Orange, respectively.
Source: US Geological Survey Alaska Volcano Observatory (AVO)
AVO reported that several small daily explosions at Pavlof were recorded by seismic and infrasound sensors during 10-17 August. The vent producing the explosions was possibly near the 2007 vent location on the upper SE flank. Small ash emissions, visible in webcam images and occasionally observed by pilots, dissipated quickly and likely deposited ash no further on the upper flanks. The Volcano Alert Level and Aviation Color Code remained at Watch and Orange, respectively.
Source: US Geological Survey Alaska Volcano Observatory (AVO)
Intermittent bursts of ash from the summit of Pavlof were visible in webcam views on 5 August, prompting AVO to raise the Volcano Alert Level and Aviation Color Code to Watch and Orange, respectively. The bursts formed diffuse plumes that rose just above the summit and drifted almost 10 km SE before dissipating. Minor daily ash emissions continued to be observed in webcam images during 5-9 August. The seismic network recorded elevated seismicity (tremor) and small explosions. Several small explosions were recorded during 8-9 August though weather clouds prevented satellite and webcam views.
Source: US Geological Survey Alaska Volcano Observatory (AVO)
At 1140 on 9 July AVO raised the Volcano Alert Level and Aviation Color Code at Pavlof to Advisory and Yellow, respectively, noting that seismicity had increased during the previous 16 hours and was characterized by near-continuous tremor. Seismicity decreased and was more periodic during 10-13 July, but remained above background levels.
Source: US Geological Survey Alaska Volcano Observatory (AVO)
AVO reported that no seismic tremor at Pavlof had been recorded during the previous two weeks, nor had eruptive activity or unusual surface temperatures been observed in satellite and webcam images. The Volcano Alert Level and Aviation Color Code were lowered to Normal and Green, respectively, on 14 October.
Source: US Geological Survey Alaska Volcano Observatory (AVO)
On 21 September AVO announced that the Volcano Alert Level for Pavlof was raised to Advisory and the Aviation Color Code was raised to Yellow. Seismicity had increased above background levels during the previous day and was characterized by ongoing tremor.
Source: US Geological Survey Alaska Volcano Observatory (AVO)
AVO reported that seismic activity at Pavlof had decreased during the past several weeks, and no eruptive activity or summit emissions had been observed since minor steaming in late February. AVO lowered the Volcano Alert Level to Normal and the Aviation Color Code to Green on 3 March.
Source: US Geological Survey Alaska Volcano Observatory (AVO)
On 28 December AVO announced that the Volcano Alert Level for Pavlof was raised to Advisory and the Aviation Color Code was raised to Yellow because seismicity was elevated above background levels during the previous few days. AVO noted that an eruption was not likely or imminent; however, past eruptions at Pavlof occurred with minor or no warning. Elevated seismicity continued through 31 December.
Source: US Geological Survey Alaska Volcano Observatory (AVO)
AVO reported that after a small explosion at Pavlof was recorded on 19 October and before 25 October clear satellite and webcam views did not show any deposits associated with the event. Weakly elevated surface temperatures and a small steam plume were occasionally visible. No other activity was detected during 26-29 October. The Aviation Color Code remained at Yellow and the Volcano Alert Level remained at Advisory.
Source: US Geological Survey Alaska Volcano Observatory (AVO)
On 19 October small explosion signals at Pavlof were detected by the infrasound network located at Sand Point and on the local seismic network, prompting AVO to raise the Aviation Color Code to Yellow and the Volcano Alert Level to Advisory. Clouds obscured satellite views of the volcano around the time of the event; slightly elevated surface temperatures were detected in satellite images during 19-20 October.
Source: US Geological Survey Alaska Volcano Observatory (AVO)
On 12 June AVO reported that elevated levels of seismicity at Pavlof, recorded since mid-May, had declined to background levels. The Aviation Color Code was lowered to Green and the Volcano Alert Level was lowered to Normal. The report noted that vapor plumes were occasionally visible in webcam views and elevated surface temperatures in the summit crater were sometimes identified in satellite images; both are common occurrences at Pavlof.
Source: US Geological Survey Alaska Volcano Observatory (AVO)
AVO reported that low-frequency tremor was detected at Pavlof during 14-15 May and a vigorous steam plume rising from the summit was visible in webcam images on 15 May. The Aviation Color Code was raised to Yellow and the Volcano Alert Level was raised to Advisory primarily because of increased seismicity. Steam plumes recorded by the webcam, low levels of seismic tremor, and warm surface temperatures identified in satellite data continued during 16-19 May; AVO noted that steam emissions and warm surface temperatures are common at Pavlof.
Source: US Geological Survey Alaska Volcano Observatory (AVO)
AVO reported that no unusual activity was detected in seismic or infrasound data at Pavlof during 21-26 June. Weakly elevated surface temperatures were identified in satellite images during 21-22 June, and a few clear webcam views revealed minor steaming. The Aviation Color Code remained at Yellow and the Volcano Alert Level remained at Advisory.
Source: US Geological Survey Alaska Volcano Observatory (AVO)
AVO reported that seismicity at Pavlof had declined since the small increase on 7 June, and no unusual activity was observed in seismic or infrasound data through 20 June. Minor steam emissions occasionally rose from the summit crater. Satellite images showed an approximately 55 km-long steam plume drifting W on 14 June, and a thermal anomaly during 15-16 and 20 June. The Aviation Color Code remained at Yellow and the Volcano Alert Level remained at Advisory.
Source: US Geological Survey Alaska Volcano Observatory (AVO)
On 7 June AVO reported that during the past several days an increase in low-frequency earthquake activity was detected at Pavlof. This kind of activity can sometime precede eruptive episodes. In addition, several short-duration tremor bursts were observed, and a pilot reported a possible ash cloud to 1.2 km (4,000 ft) a.s.l. Infrasound data from instruments on the volcano and from a more distant network in Sand Point showed no evidence of significant explosive activity. AVO noted that since activity prior to eruptions of Pavlof had always been very subtle, they increased the Aviation Color Code to Yellow and the Alert Level to Advisory based on these observations. During 8-9 June gas emissions from the summit were observed in web camera images and by local observers in Cold Bay (60 km SW). AVO noted that vapor emissions (with or without minor amounts of volcanic ash) are common and may occur from the summit vent at any time.
Source: US Geological Survey Alaska Volcano Observatory (AVO)
AVO reported that since an ash-and-steam explosion at Pavlof on 27 July, activity had continued to decline. On 4 August AVO lowered the Aviation Color Code to Yellow and the Volcano Alert Level to Advisory. During 5-9 August seismicity remained low but above background levels. Elevated surface temperatures were observed in one nighttime satellite image during 7-8 August.
Source: US Geological Survey Alaska Volcano Observatory (AVO)
AVO reported that on 28 July vigorous steam-rich gas plumes from Pavlof were visible in webcam images from Cold Bay (60 km SW) and Black Hills (35 km NNE). The report also noted that recent satellite images and a pilot observation indicated minor ash emissions associated with degassing which rose to an altitude less that 4.5 km (15,000 ft) a.s.l. The Aviation Color Code was raised to Orange and Volcano Alert Level was raised to Watch. On 29 July seismicity began to decrease. On 30 July minor steam emissions were visible in webcam images from Black Hills, and on 2 August a weak thermal anomaly was detected.
Source: US Geological Survey Alaska Volcano Observatory (AVO)
AVO reported that seismic activity at Pavlof remained elevated during 13-19 July. A steam plume was visible in satellite images and reported by observers in Sand Point (90 km E) on 18 July. The next day persistent steam plumes with occasional minor ash-producing explosions were observed in satellite views. The Aviation Color Code remained at Yellow and Volcano Alert Level remained at Advisory.
Source: US Geological Survey Alaska Volcano Observatory (AVO)
On 11 July, AVO noted that during the previous 24 hours a steam cloud from Pavlof was seen drifting SW by observers in Sand Point (90 km E) and by pilots flying near the volcano. Satellite images showed the cloud drifting 72 km SW. No unusual seismicity was detected. At 1300 the webcam recorded a minor ash emission rising tens of meters and drifting a few kilometers SW. The Aviation Color Code remained at Yellow and Volcano Alert Level remained at Advisory.
Source: US Geological Survey Alaska Volcano Observatory (AVO)
On 1 July AVO reported that seismicity at Pavlof had increased during the previous 24 hours and minor steam emissions had been recorded by the webcam in the morning. The Aviation Color Code was raised to Yellow and Volcano Alert Level was raised to Advisory. Seismicity on 2 July was lower but remained elevated. Tremor ceased on 3 July but was again detected during 4-5 July.
Source: US Geological Survey Alaska Volcano Observatory (AVO)
AVO reported that activity at Pavlof had returned to baseline levels following a brief eruptive period in mid May; minor ash emissions were last observed on 16 May. On 17 June AVO lowered the Aviation Color Code to Green and Volcano Alert Level to Normal.
Source: US Geological Survey Alaska Volcano Observatory (AVO)
On 20 May AVO reported that the period of volcanic activity at Pavlof that began on 13 May had ended; eruptive activity had not been evident in satellite or seismic data since the low-level ash emissions observed on 17 May. AVO lowered the Aviation Color Code to Yellow and Volcano Alert Level to Advisory, and noted that pauses in eruptive activity of days to weeks were common during eruptive episodes at Pavlof.
Source: US Geological Survey Alaska Volcano Observatory (AVO)
AVO reported that at about 1035 on 13 May seismic activity at Pavlof increased to levels typically associated with low-level eruptive activity; cloud cover prevented visual observations of the volcano though no thermal signals or ash emissions were evident through the cloud deck. AVO raised the Aviation Color Code to Orange and the Volcano Alert Level to Watch due to the possibility of an eruption in progress. On 14 May seismicity remained above background levels. Clear satellite and webcam views revealed no evidence for an eruption, and no ash emissions or thermal anomalies at the summit were observed. During 1927-2107 on 14 May ash emissions were evident in webcam views and reported by local observers. A diffuse ash plume rose to altitudes of 4.6-5.5 km (15,000-18,000 ft) a.s.l. and remained in the vicinity of the volcano. Elevated surface temperatures were detected in satellite data at 0850 on 15 May. Periods of elevated volcanic tremor and a small explosion associated with minor ash emissions began at 0445 on 17 May; observers in Cold Bay (60 km SE) and Sand Point (90 km E) reported ash emissions interspersed with steam emissions. A National Weather Service SIGMET noted that ash was below an altitude of 4.6 km (15,000 ft) a.s.l.
Source: US Geological Survey Alaska Volcano Observatory (AVO)
On 22 April AVO stated that seismic activity at Pavlof Volcano had continued to decrease, and no anomalous activity had been detected in satellite images since weakly elevated surface temperatures were seen on 8 April. The Aviation Color Code was lowered to Green and Volcano Alert Level was lowered to Normal.
Source: US Geological Survey Alaska Volcano Observatory (AVO)
On 6 April AVO stated that the eruption at Pavlof had ended; during the previous week satellite images indicated no signs of ash emissions or lava effusion, and seismicity was at low levels. Thermal anomalies at the summit were occasionally visible though likely indicating cooling processes of previously erupted lava. AVO lowered the Aviation Color Code to Yellow and Volcano Alert Level to Advisory.
Source: US Geological Survey Alaska Volcano Observatory (AVO)
AVO reported that the intensity of the eruption at Pavlof greatly decreased during 29-30 March, though a news article noted that ash from the eruption had caused more flights in and out of Yellowknife and Regina, Canada, to be cancelled. Elevated surface temperatures identified in satellite data and visual observations of low-level, intermittent ash plumes were noted during brief breaks in poor weather conditions. Seismicity remained elevated above background levels through 4 April, and was characterized by occasional short-duration tremor bursts. Cloud cover obscured satellite and web-cam views, though weakly elevated surface temperatures were detected in a few satellite images during 1-5 April. Airwave signals, indicative of small explosions at the summit, were recorded by the seismic stations at 1842 on 3 April. The Aviation Color Code remained at Orange and the Volcano Alert Level remained at Watch.
Sources: US Geological Survey Alaska Volcano Observatory (AVO); CityNews
AVO reported that seismicity at Pavlof began to increase at about 1553 on 27 March, characterized by a quick onset of continuous tremor. An ash plume rose to an altitude of 6.1 km (20,000 ft) a.s.l. and by 1618 was drifting N. AVO raised the Aviation Color Code to Red and the Volcano Alert Level to Warning. During the night lava fountaining from the summit crater was observed by mariners, pilots, and residents of Cold Bay (60 km SW). Lahars likely descended the flanks. Tremor levels remained high on 28 March. Lightning in the ash plume was detected in the morning, and infrasound data from a sensor network located in Dillingham (650 km away) also indicated sustained ash emissions. At 0700 a continuous ash plume was evident in satellite images drifting more than 650 km NE. A SIGMET issued by the National Weather Service (NWS) Alaska Aviation Weather Unit indicated that the maximum ash-cloud altitude was 11 km (37,000 ft) a.s.l. Strongly elevated surface temperatures suggested the presence of surficial lava flows.
The intensity of the eruption significantly declined at 1230 on 28 March; seismicity and infrasound signals decreased to low levels. AVO lowered the Aviation Color Code to Orange and the Volcano Alert Level to Watch. Seismic tremor was slightly above background levels. Ash emissions decreased through the night and were barely visible in a satellite image acquired at 0625 on 29 March. Remnant ash continued to drift over Bristol Bay and areas of interior Alaska. The webcam recorded intermittent, low-level ash plumes rising as high as 4.6 km (15,000 ft) a.s.l.
Source: US Geological Survey Alaska Volcano Observatory (AVO)
AVO reported that seismic activity at Pavlof decreased during 21-22 November but continued to remain above background levels. Weakly elevated surface temperatures during 22 and 24-25 November, consistent with the cooling lava flow on the NW flank, were observed in satellite images. The Aviation Color Code was lowered to Yellow and the Volcano Alert Level was lowered to Advisory on 25 November; AVO noted that seismicity was at low levels during the previous week, and satellite observations show no evidence for continuing eruptive activity.
Source: US Geological Survey Alaska Volcano Observatory (AVO)
On 12 November AVO raised the Aviation Color Code for Pavlov to Orange and the Volcano Alert Level to Watch, citing the beginning of a new phase of eruptive activity at about 1500. An observer in Cold Bay (52 km SW) reported that ash emissions rose slightly above the summit; minor ash emissions were also recorded by an FAA-operated webcam in Cold Bay beginning at 1650. Seismicity increased and remained elevated. Lava fountaining occurred from a vent just N of the summit and flows of rock debris and ash descended the N flank. A thermal anomaly appeared in satellite images at 1740. The eruption continued on 14 November. A narrow ash plume observed in satellite images drifted 200 km at an altitude of 4.8 km (16,000 ft) a.s.l.
The eruption intensified on 15 November prompting AVO to raise the Aviation Color Code to Red and the Volcano Alert Level to Warning. Ash plumes rose to an altitude of 7.6 km (25,000 ft) a.s.l. and drifted 200 km NW. The intensity of seismic tremor had increased significantly. Pilot reports through 1230 indicated that the ash plume had risen to an altitude of 9.1 km (30,000 ft) a.s.l. At about 1900 seismicity abruptly decreased and remained low. Satellite observations confirmed a significant decrease in ash emissions; discrete seismic events possibly indicated minor ash emissions that were not detected in satellite images. The Aviation Color Code was lowered to Orange and the Volcano Alert Level was lowered to Watch. Pilot reports on 16 November indicated no eruptive activity, and satellite images showed diminished temperatures in the summit crater. During 17-18 November seismic activity remained at low levels and elevated surface temperatures on the upper NW flank were observed, consistent with a flow of lava and/or hot debris.
Source: US Geological Survey Alaska Volcano Observatory (AVO)
AVO reported that seismicity at Pavlof continued steadily with intermittent seismic events during 18-23 June. The Aviation Color Code remained at Orange and the Volcano Alert Level remained at Watch.
Source: US Geological Survey Alaska Volcano Observatory (AVO)
AVO reported that the eruption at Pavlof continued during 11-16 June. Seismic activity was steady and characterized by intermittent events. Weakly elevated surface temperatures were occasionally observed in mostly cloudy satellite images.The Aviation Color Code remained at Orange and the Volcano Alert Level remained at Watch.
Source: US Geological Survey Alaska Volcano Observatory (AVO)
AVO reported that the Strombolian eruption at Pavlof continued during 3-10 June. On 3 June the FAA webcam showed a high steam plume rising above a vent on the NE flank and lower-level ash from pyroclastic flows on the N flank. During 3-4 June seismicity remained unchanged and persistent elevated surface temperatures were detected in satellite images. A steam plume with minor amounts of ash but rich in sulfur dioxide drifted 100 km W. Incandescence from lava fountaining was visible in webcam images on 4 June. According to a news article, flights in and out of Cold Bay and Unalaska were canceled on 4 June, affecting about 200 people.
Two strong explosions were detected by the seismic network at 0205 and 0245 on 5 June. Lightning was detected by the World Wide Lightning Location Network indicating the presence of ash; satellite images did not detected ash above the meteorological cloud tops at about 8.5 km (28,000 ft) a.s.l. A third event was detected at 0844. The level of activity declined during 5-6 June; ash emissions appeared to be greatly reduced although cloud cover continued to obscure satellite views. Elevated surface temperatures were observed in mostly cloudy satellite images during 8-9 June. The Aviation Color Code remained at Orange and the Volcano Alert Level remained at Watch.
Sources: US Geological Survey Alaska Volcano Observatory (AVO); Alaska Public Media
AVO reported that on 31 May elevated surface temperatures were detected over Pavlof in satellite images, suggesting a low-level eruption with lava. Observers camping near the volcano confirmed lava and noted that flows were originating from a vent on the NE flank. A low-level steam plume was visible in satellite images and recorded by the FAA web-cam located in Cold Bay. Several pilots observed a gas-and-ash plume drifting N at altitudes of 2.1-2.4 km (7,000-8,000 ft) a.s.l. The Aviation Color Code was raised to Orange and the Volcano Alert Level was raised to Watch. Small explosion signals were detected by a distant infrasound sensor. Later that night weak incandescence from the summit was observed in the webcam. On 1 June clouds obscured web-cam views and ash plumes were not detected in satellite images. The seismic network detected weak activity.
Activity escalated on 2 June, prompting AVO to raise the Aviation Color Code to Red and the Volcano Alert Level to Warning. Seismic tremor increased at 1500 and pilots observed ash plumes at altitudes of 6.7 km (22,000 ft) a.s.l. Satellite images showed a plume drifting more than 80 km E. Seismicity started to decrease at 2300. The web cam recorded intense lava fountaining at the summit and incandescence from a spatter-fed lava flow on the N flank. On 3 June seismicity again increased and pilots observed ash-and-steam plumes at altitudes of 7.3 km (24,000 ft) a.s.l. that drifted SSW. Later that day AVO lowered the Aviation Color Code to Orange and the Volcano Alert Level to Watch due to a decrease and stabilization of volcanic tremor. Satellite and webcam images showed two distinct parts of the plume: gas and steam with minor amounts of ash rose high above the volcano and drifted S, while pyroclastic flows on the N flank produced diffuse ash that caused hazy air and variable concentrations of ash below 3 km (10,000 ft) a.s.l. Winds were likely to push ash at lower altitudes WSW.
Source: US Geological Survey Alaska Volcano Observatory (AVO)
On 8 August AVO reported that no lava or ash emissions had been observed at Pavlof since 26 June and the volcano exhibited gradually declining levels of unrest. Seismicity was at background levels. AVO lowered the Aviation Color Code to Green and the Volcano Alert Level to Normal.
Source: US Geological Survey Alaska Volcano Observatory (AVO)
According to news articles, ash plumes from Pavlof caused airlines to cancel one flight and reroute six more on 25 June. AVO reported that during 25-26 June seismicity declined, and consisted of intermittent bursts of tremor and occasional small explosions. Satellite images showed a plume containing small amounts of ash drifting NW, and strong thermal anomalies at the summit. Pilot reports on 26 June indicated that plumes rose to altitudes between 6.1-7.6 km (20,000 to 25,000 ft) a.s.l., and then to heights just above the summit later that day. Seismicity during 26 June-1 July continued at low levels and consisted primarily of periodically continuous, low-level tremor. Thermal anomalies at the summit detected in satellite images were strong during 26-29 June and weak during 30 June-1 July.
Activity further declined during 1-2 July; tremor and explosions were no longer detected in seismic and pressure sensor data. Satellite images did not detect elevated surface temperatures, volcanic gas, or ash emissions, and there were no visual observations from pilots or from webcam images of any eruptive activity since 26 June. AVO lowered the Aviation Color Code to Yellow and the Volcano Alert Level to Advisory.
Source: US Geological Survey Alaska Volcano Observatory (AVO)
AVO reported that during 19-25 June the eruption at Pavlov continued; seismic tremor and occasional explosions were detected. Cloud cover prevented web camera views. During 19-20 and 24 June elevated surface temperatures detected in satellite images were consistent with lava effusion. A small ash plume from the summit vent was also detected in satellite image on 19 June, and possibly detected during 20-22 June.
At 2250 on 24 June seismicity increased and became the strongest seismic activity detected so far during 2013. The seismicity was characterized by continuous intense tremor and frequent small explosions likely associated with lava fountaining and ash production. Seismicity remained high on 25 June. Satellite images and pilot observations indicated that a plume drifted W at altitudes as high as 8.2-8.5 km (27,000-28,000 ft) a.s.l. Satellite images also detected a strong thermal anomaly at the summit. Trace amounts of ash fell in King Cove, 48 km SW. The Volcanic Alert Level remained at Watch and the Aviation Color Code remained at Orange.
Source: US Geological Survey Alaska Volcano Observatory (AVO)
AVO reported that ash emissions from Pavlof were intermittent and minor during 12-14 June; ash plumes below an altitude of 6.1 km (20,000 ft) a.s.l. mostly drifted SE. Elevated surface temperatures consistent with lava effusion persisted until 1620 on 14 June. Seismicity decreased during 14-15 June. Minor emissions likely stopped, but web-camera views were cloudy. On 17 June no plumes were visible in satellite images, and web camera views showed mostly cloudy conditions. During 17-18 June seismic tremor amplitude increased slightly, and elevated surface temperatures consistent with lava effusion were detected in satellite images. A small ash plume rose from the crater. The Volcanic Alert Level remained at Watch and the Aviation Color Code remained at Orange.
Source: US Geological Survey Alaska Volcano Observatory (AVO)
AVO reported that ash emissions from Pavlof that began on 4 June continued during 5-11 June, and were accompanied by seismic tremor and explosion signals. Overnight during 4-8 June satellite images detected elevated surface temperatures near the vent consistent with lava effusion and fountaining. On 5 and 6 June an ash plume observed in images drifted 40-45 km W and SW, at altitudes of 4.3-5.5 km (14,000-18,000 ft) a.s.l., based on pilot estimates. During 8-10 June images showed an ash plume drifting 20-53 km SE. The Volcanic Alert Level remained at Watch and the Aviation Color Code remained at Orange.
Source: US Geological Survey Alaska Volcano Observatory (AVO)
AVO reported that ash emissions at Pavlof began at approximately 1100 on 4 June as observed in satellite images and by pilots. Satellite images showed an ash cloud drifting SE, and pilots estimated that the cloud was at an altitude of 5.8 km (19,000 ft) a.s.l. Weak seismicity that began at 1057 accompanied the emissions, and then continued. The Volcanic Alert Level was increased to Watch and the Aviation Color Code was increased Orange.
Source: US Geological Survey Alaska Volcano Observatory (AVO)
AVO reported that seismic tremor at Pavlof markedly declined around 1100 on 21 May, and was followed through 23 May by the detection of small discrete events, likely indicative of small explosions, by pressure sensors. Although cloud cover prevented satellite observations, elevated surface temperatures at the vent were detected. On 22 May both a pilot report and photographs indicated weak steam-and-gas emissions containing little to no ash.
The eruption continued but at a lower level during 24-26 May. Neither evidence of elevated surface temperatures nor a plume were observed in partly clear satellite images during 24-25 and 27 May. Clouds obscured views on 26 May. The Volcanic Alert Level was lowered to Advisory and the Aviation Color Code was lowered to Yellow on 28 May.
Source: US Geological Survey Alaska Volcano Observatory (AVO)
AVO reported that on 14 May a diffuse ash plume from Pavlof drifted about 160 km NE at an altitude of 4.6 km (15,000 ft) a.s.l. before dissipating. Pilot reports and photographs indicated that the lava flow extending down the NW flank was still active and generated debris-laden flow deposits, presumably from the interaction of hot lava with the snow and ice on the flank. Light ashfall was reported the evening of 14 May in a mining camp 80 km NE of the volcano. No other nearby communities had reported ash fall. During 14-15 May elevated seismicity persisted and steam-and-ash clouds observed with a web camera occasionally rose up to 6.1 km (20,000 ft) a.s.l. Residents in Cold Bay (37 km SW) observed incandescence from the summit during the night. On 15 May a pilot reported a dark ash cloud drifting ENE at an altitude of 6.1 km (20,000 ft) a.s.l.
On 16 May lava fountaining at the summit was observed and photographed, and a continuous ash, steam, and gas cloud extended downwind 50-100 km at an altitude of about 6.1 km (20,000 ft) a.s.l. Satellite images showed persistent elevated surface temperatures at the summit and on the NW flank, commensurate with the summit lava fountaining and resulting lava flow.
During 18-19 May a narrow plume of steam, ash, and gas, occasionally rising up to 6.7 km (22,000 ft) a.s.l., and drifting southeast, was visible in satellite images. Pilot reports indicated that lava fountaining and ash emission continued. Overnight, trace amounts of ash fell on the community of Sand Point. During the afternoon on 19 May pilots reported that ash plumes rose to altitudes of 4.6-6.7 km (15,000-22,000 ft) a.s.l. Trace amounts of ash fell in Nelson Lagoon, 78 km NNE, during 19-20 May. The Volcanic Alert Level remained at Watch and the Aviation Color Code remained at Orange.
A news article stated that on 20 May a regional airline canceled about a dozen flights to several remote communities, including Sand Point. Another regional airline canceled a few flights, but mostly re-routed flights. On 21 May AVO reported that a low-level plume of steam, gas, and ash occasionally rose to an altitude of 6.1 km (20,000 ft) a.s.l. and drifted NNE. Trace amounts of ash again fell in Nelson Lagoon.
Sources: US Geological Survey Alaska Volcano Observatory (AVO); Associated Press
AVO reported that on 13 May seismicity at Pavlof increased at 0800 commensurate with the presence of an intense thermal anomaly at the summit observed in satellite imagery. Several spikes in seismicity occurred between 0900 and 1000. AVO noted that similar patterns of seismicity and elevated surface temperatures have previously signaled the onset of eruptive activity at Pavlof. Although not yet visually confirmed at the time of the report, a low-level eruption of lava had likely begun from a summit vent. No ash clouds were detected. The Volcanic Alert Level was increased Watch and the Aviation Color Code was increased Orange. On 14 May pilot reports and satellite images confirmed activity; a spatter-fed lava flow advanced about 0.5 km down the N flank. Minor steam-and-ash emissions from the summit were visible from Cold Bay (60 km SW).
Source: US Geological Survey Alaska Volcano Observatory (AVO)
On 19 September, a field crew confirmed that all eruptive activity from Pavlof ceased. AVO decreased the Volcanic Alert Level to Advisory and the Aviation Color Code to Yellow on 20 September due to a significant decrease of seismic activity during the previous week.
Source: US Geological Survey Alaska Volcano Observatory (AVO)
AVO reported that seismic activity at Pavlof declined markedly during 8-18 September, compared to levels recorded during the first week of September. Seismicity was characterized by volcanic tremor, and signals interpreted as small explosions. Based on observations of satellite imagery, a steam plume rose to an altitude of 6.1 km (20,000 ft) a.s.l. on 12 September and multiple thermal anomalies were present during 12-14 September. The Volcanic Alert Level remained at Watch and the Aviation Color Code remained at Orange.
Source: US Geological Survey Alaska Volcano Observatory (AVO)
Seismic activity at Pavlof fluctuated, but generally remained elevated during 5-11 September. Seismicity was characterized by volcanic tremor, and signals interpreted as frequent explosions and debris flows. During the reporting period, satellite imagery revealed strong thermal anomalies at the summit. On 8 September, a possible steam plume was visible on satellite imagery and a pilot reported that a steam-and-ash plume drifted from the summit. The Volcanic Alert Level remained at Watch and the Aviation Color Code remained at Orange.
Source: US Geological Survey Alaska Volcano Observatory (AVO)
Seismic activity at Pavlof fluctuated, but generally remained elevated during 29 August-4 September. A strong thermal anomaly was present at the summit on satellite imagery during 29 August-2 September; clouds inhibited observations on 3 and 4 September. Based on pilot reports and observations of satellite imagery, ash plumes rose to altitudes of 2.4-4.9 km (8,000-16,000 ft) a.s.l. during 28-30 August and drifted SSE and SE. On 30 August, National Weather Service observers in Cold Bay (about 60 km SW) reported that a plume rose to an altitude of 6.1 km (20,000 ft) a.s.l. and produced lightning. Based on satellite imagery, AVO reported that steam-and-ash plumes rose to altitudes of 6.1 km (20,000 ft) a.s.l. on 31 August. The Volcanic Alert Level remained at Watch and the Aviation Color Code remained at Orange.
Source: US Geological Survey Alaska Volcano Observatory (AVO)
Seismic activity at Pavlof remained elevated during 22-28 August. A strong thermal anomaly was present at the summit on satellite imagery on 22, 24, 25, and 28 August; clouds inhibited observations on other days. Based on pilot reports and calculations using satellite imagery, a steam-and-ash plume rose to an altitude between 3-5.5 km (10,000-18,000 ft) a.s.l. On 25 August, seismic events and explosions were more energetic and a signal suggesting a large lahar was noted. Plume altitudes from previous days and seismic interpretation indicated that an ash plume rose to an altitude of 6.1 km (20,000 ft) a.s.l. on 26 and 28 August. The Volcanic Alert Level remained at Watch and the Aviation Color Code remained at Orange.
Source: US Geological Survey Alaska Volcano Observatory (AVO)
AVO raised the Volcanic Alert Level to Advisory and the Aviation Color Code to Yellow for Pavlof on 14 August due to an abrupt increase in seismicity. During 14-15 August, a strong thermal anomaly was detected in the crater and prompted AVO to again raise the Volcanic Alert Level/ Aviation Color Code, to Watch/Orange. According to eye witnesses aboard a ship on 15 August, incandescent blocks rolled down the ESE flank and lava-fountaining occurred on the SE flank. The presence of lava was confirmed using satellite imagery. Pilots reported that the flanks were covered with ash and that an ash plume rose to an altitude of 2.6 km (8,400 ft) a.s.l. and drifted SW.
On 16 August, residents of Cold Bay, about 60 km SW, and of Sand Point, about 97 km ESE, saw incandescence at the summit. A strong thermal anomaly was present at the summit on satellite imagery. Seismicity increased in intensity and possibly indicated a lahar on the SE flank.
During 17-20 August, seismicity continued at high levels. Explosions were recorded and seismic signals possibly indicated flow events such as lahars. A strong thermal anomaly continued to be present at the summit. Aerial and ground observations revealed a vigorous eruption of lava during 18-20 August. Members of an AVO field party saw a lahar on the SE flank on 20 August.
Source: US Geological Survey Alaska Volcano Observatory (AVO)
Reports are organized chronologically and indexed below by Month/Year (Publication Volume:Number), and include a one-line summary. Click on the index link or scroll down to read the reports.
Harmonic tremor coincides with report of observed lava flow
Card 1744 (14 November 1973) Harmonic tremor coincides with report of observed lava flow
The following was received by cable from D.B. Stone. "Eruptive activity was observed about 10:00 p.m. Alaska Standard Time from a point 33 km NW of the summit of Pavlof. Reported as 'shooting flames' intermittently with a possible lava flow on the NW flank. A seismometer 7 km SE of the summit recorded increased microearthquake activity at about that time. Seismic records showed onset of harmonic tremor on November 13, 07:00 AST, coincident with reported eruption of lava."
Information Contacts: D.B. Stone and J. Kienle, Geophysical Institute, University of Alaska, Fairbanks AK; J.N. Davies, c/o White Alice Como Site, Cold Bay AK.
Columns of "smoke" to 2,400 m
For the past several weeks Pavlof has been producing columns 2,100-2,400 m high, carried NE up the Alaska Peninsula. Weather conditions commonly prevent observation of the volcano, but on 26 October it was active for 30 minutes of the hour that it was visible. On 31 October, for 1.5 hours, "lava" was reported streaming down the N side of the cone; this may have been a mud flow.
Information Contacts: P. Sventek, USAF, Cold Bay.
Ash eruptions, lava emission, and orange glow
10 December, 0100-0800: black ash and numerous sporadic orange mud/lava bursts. 18 December, 1300: white steam. 19 December, 1000: grey smoke. 23 December, 1000: white steam; fresh snow on N slope was darkened from the ashfall. 23 December, 1900: 10-second orange glow. 27 December, 1000: white steam; snow was white except for ash on N slope. 28 December, 0815: Tephra ejection like "a blowtorch" visible (in daylight) for 30 seconds; 1300: grey smoke. 30 December, 1755-1810: energetically emitted surges of glowing red-hot ejecta. In contrast to the sporadic 10 December activity, this emission was of a continuous pulsing nature and surges rose at least 150 m above the summit. This was the most energetic activity observed during the last several months. For the next five hours Pavlof was visible but quiet.
Information Contacts: P. Sventek, USAF, Cold Bay.
Intermittent steam and ash emissions
3-4 January: intermittent steam, grey smoke, and black ash. 5 January: black ash. 11-12 January: steam. At 2130 on 11 January a pilot reported the volcano erupting red-hot mud/lava up to 300 meters above the cone. 17 January: grey smoke. 22 January: steam. 24-25 January: grey smoke and steam. 29-30 January: constant steam. 31 January: very intermittent steam.
Information Contacts: P. Sventek, USAF, Cold Bay.
Ash eruptions and lava flows during 21-24 February
At approximately 1400 on 20 February, Pavlof was seen to eject ash clouds at about 3-minute intervals. The ash clouds moved S and dissipated into a layer near the 3,000 m level. After sunset, lava emissions became visible, but were not as energetic as those observed on 31 December.
At 2230 22 February, a USAF pilot flying at 12.5 km reported that lava was visible trailing as a rivulet down the entire NW flank. The volcano continuously emitted lava during the 45-minute pilot observation. On 23 February at 1530 a pilot reported that the activity was basically the same as on the 22nd. On 24 February at 1115 another pilot reported that the lava activity appeared to have ceased, but that strong winds were driving ash, smoke and steam down the S side of the volcano.
Information Contacts: P. Sventek, USAF, Cold Bay.
Activity remains low in March
Activity during March remained low. 3 March, 1200-1400: steaming continuously. 10 March, 1800: inactive; snow on the W flank was white. 12 March, 1400-1600: steaming quietly; 1730 snow umblemished on all sides of cone visible on fly-by. 19 March, 1600: steaming; snow umblemished on all sides of cone visible on fly-by. 22 March, 1200: steaming, W flank umblemished. 23 March, 1900: steaming weakly. 25 March, 1730: several radial ash sprays visible on N flank. 28 March, 1500-1700: inactive, with ash still visible on N flank.
Information Contacts: P. Sventek, USAF, Cold Bay.
Steam-and-ash emissions; ashfall seen on flanks
6 April, 1118: pilot reported ash extensively covering entire expanse of Pavlof's SE flank. Black smoke and intermittent steam were observed. 14 April, 0900-1900: steaming intermittently; 2 ash sprays visible on NW flank. 15 April, 0600-0700; 25 April 2300; and 27 April 1200-1900: steam emissions. 29 April, 1500: a pilot reported the volcano steaming. The entire E flank was reported to be ash-covered and very black. 30 April, 1200-1900: Although difficult to differentiate between ash and exposed rock (when viewed from Cold Bay, 60 km to the W) there appeared to be ash over the upper 100 m of the cone and along several radial areas along the near (SW) flank. Pavlof apparently produced extensive ash during the last few days of the month.
Information Contacts: P. Sventek, USAF, Cold Bay.
Ash emissions in mid-May
7 May, 1200: all flanks of volcano snow-covered. 14 May, 1500: dark ash visible on cone. 16 May, 2100: dark ash and steam emission visible. 20 May: upper 100 m of cone irregularly darkened, apparently from ash. Steam issuing from cone. At 2000, a thin layer of ash at the 3,000-m level was carried S for at least 25 km. At 2045, light grey material was ejected a few hundred meters. 21 May, 0900-0930: steaming. 31 May, 1200-1500: quiet. No longer possible to distinguish (at distance) between new ash darkening snow and dark bedrock exposed by melting snow.
Information Contacts: P. Sventek, USAF, Cold Bay.
Steam-and-ash emissions continue; ashfall on cone
2 June, 1450: pilot reported volcano steaming, extensive ash deposits visible on top and E flank of cone. 3 June, 1200-1800: volcano quiet, cone darkened by ash, or exposed rock due to melted snow. 4 June, 0900-2100: steamed continuously; occasionally ejected a light tan ash that settled into a thin layer at the 2500-m level and moved NE up the Alaska Peninsula. 5 June, 1500-2200: no activity noted. 6 June 1810-1830: no activity noted.
10 June, 2100: black smoke and ash emitted. Flanks extensively darkened by ash. 11 June, 1500: pilot reported volcano steaming. 12 June, 0900-2100: no activity apparent. 15 June, 0600-0700, 2200: steaming constantly. 19 June, 1630: steaming and emitting grey smoke. 26 June, 1400-2100: vertical steam column reached 300-500 m above cone. 27 June, 1200-1500: intermittent steam and ash emissions formed a thin layer stretching NE at the 2500-m level. 28 June, 1300-2200: ash layer extended NE at the 2,500-m level.
Information Contacts: P. Sventek, USAF, Cold Bay.
Ash on N slope; heavy steaming
4 July, 0600-2200: black ash noted on the N slope. 15 July, 2000-2300: heavy steam blown down the W slope. 18 July, 1600-2300: heavy steam emitted. 23 July, 2100-2200: no activity.
Information Contacts: R. Dean, USAF, Cold Bay.
Light steam plume seen on one day in August
31 July, 1730-2130: no activity. 3 August, 2200-2232: plume of light steam. 12 August, 1845-1900: no activity. 22 August, 1010-23 August, 1807: no activity.
Information Contacts: R. Dean, USAF, Cold Bay.
Ash covering upper slopes and the cone
10 September, 1520-1523: "smoke" emission with some intermixed ash. Ash deposits were noted on the SE slope. 22 September, 0745-1200: no activity. Lower slopes were snow-covered, the upper slopes were "dark," and the cone was black. 28 September, 0750-0843: a steady 150-m steam plume was observed. The cone was ash-covered, but snow blanketed the rest of the mountain.
Information Contacts: R. Dean, USAF, Cold Bay.
Continued steam-and-ash emissions
7 October, 1852: no activity. Ash covered the top 100 m of the cone. 9 October, 0930-1110: heavy steam emission was visible on a rare windless day. The cone was covered with ash. 28 October, 1430: a steady "smoke" plume and occasional small ash clouds issued from the vent.
6 November, 0330-0500: an eruption was reported by fishermen working in the Bering Sea off Cold Bay. 17 November, 1240: "smoking." 18 November, 1510, 1715: heavy "smoke" rose about 200 m above the vent. 19 November, 0915: steam and ash emission. Ashfall had darkened the cone. 1530: steam emission.
Information Contacts: R. Dean, USAF, Cold Bay.
Decreased seismicity; small steam emissions
Seismic activity at Pavlof, characterized by [50-1,000] events/day August-November 1976, had declined to 10-15 events/day during a 2-day period in mid-December. During periods of high seismic activity, individual events frequently blended together, producing an effect similar, but not identical, to harmonic tremor (one frequency dominant). Approximately one earthquake/week (probably tectonic in origin) is locatable.
Due to poor weather conditions, visual observations of Pavlof were impossible during January. When visited on 21 December, Pavlof was emitting very small amounts of steam.
Information Contacts: J. Davies, LDGO; R. Dean, USAF, Cold Bay.
Some steaming and ash near the summit
10 February, 1010-1640: no activity. Entire volcano covered with snow. 12 February, 1105-1355: steaming lightly. Part of cone covered with ash. 22 February, 0917-1625: no activity. Entire volcano covered with snow. 23 February, 0935-1710: no activity. 13 March, 1525: no activity. 16 March, 1530: overflight in private aircraft piloted by Capt. Young (USAF); steam was issuing from about 20 small vents in an ash-covered area approximately 50 m in diameter, l0 m below the base of the cone on the W slope. An older 30-m-diameter crater, partially filled with snow, was about 20 m below the base of the cone on the N slope.
Information Contacts: R. Dean, USAF, Cold Bay.
Ashfall darkens snow near the summit on 22 March
22 March, 1915: light "smoke" plume. Ash darkened the top 100 m of the cone; 2305: steaming.
Information Contacts: R. Dean, USAF, Cold Bay.
Steam and a little ash
Pavlof was emitting steam when viewed by J. Davies on 3 July. A few days later, according to second-hand reports, ash was present in the steam column.
Information Contacts: J. Davies and S. McNutt, LDGO.
Lava fountaining and ash emission; possible lava flow
An eruption from Pavlof 11-12 November ejected large lava fountains and ash clouds that reached 11 km altitude, and may have produced lava flows.
A seismic station [8.5 km SE] of Pavlof registered a 2.5-minute burst of low-amplitude harmonic tremor beginning 5 November at 1351. Emission of steam, ash, and some blocks from a vent high on the NE flank started 8 November at 1047 and lasted about 5 minutes, without accompanying seismicity. A second burst of low-amplitude tremor occurred between 0536 and 0541 on 9 November.
In contrast to the pattern observed before eruptions in 1973, 1974, 1975, and 1976, virtually no additional seismic activity was recorded until a group of 7 low-frequency volcanic earthquakes occurred at about 2300 on 10 November. After an explosion event appeared on seismic records at 0243 on 11 November, 10 more low-frequency volcanic earthquakes were recorded between 0300 and 0400. Continuous harmonic tremor, of fairly low amplitude, began at 0608, but amplitude intensified around 0900.
Reeve Aleutian Airways pilot Everett Skinner saw rocks up to 1 m in diameter rising 10-30 m at 1315 on the 11th. An observer in Cold Bay, 60 km to the W, noted an increase in activity about 1600. Skinner returned to the vicinity between 1630 and 1700, reporting lava fountaining from the summit, a black cloud hugging the upper N flank, and an eruption column reaching an estimated 6 km altitude. Between 1800 and 2000, various witnesses reported lava fountaining to a maximum height of 300 m, and incandescent material moving down the N flank. A satellite image returned at 1958 shows a nearly circular plume, 15 km in diameter, N of the volcano. Activity was visible through the night from Cold Bay and the Sand Point area (50-65 km to the ENE).
The next morning, at 0946, a satellite image revealed a plume 160 km long and almost as wide spreading N of Pavlof. Spectral analysis and weather balloon data indicated that the plume reached 8-9 km above sea level. Pilot reports on 12 November placed the top of the eruption cloud at 9 km at 1000, 6 km at 1100, and 11 km at 1400. The eruption clouds were described as varying from ash-rich to ash-poor. A helicopter crew from KENI television, Anchorage, videotaped pulses and bursts of lava fountaining, rising 150-300 m between 1600 and 1700. The fountains emerged from a pre-existing vent high on the NE flank, the only vent confirmed active during the eruption.
Very high-amplitude harmonic tremor accompanied the eruption, reaching its strongest levels between 2000 on 11 November and 0700 on 12 November. Tremor ceased at 1835 on the 12th, when many B-type earthquakes began to be recorded.
By the morning of 13 November, the eruption had ended. Several hundred B-type events per day were recorded 14-15 November. Renewed high-amplitude tremor began 15 November at 1306, lasting until 1711. B-type earthquakes continued 16-19 November, but fewer than 100/day were recorded.
Information Contacts: S. McNutt and J. Davies, LDGO; A. Till, USGS, Anchorage; J. Kienle, Univ. of Alaska; G. Roberts, Cold Bay Weather Station; Cmdr. J. Hair, Marine Environmental Branch, Juneau.
Ash clouds; lava flow; seismicity
NOAA weather satellite images revealed an eruption plume emerging from Pavlof at 1030 on 25 September. On the image at 1415, when weather clouds next permitted a clear view of the area, both Pavlof and Shishaldin (about 150 km to the SW) were emitting plumes. At 1545, data from infrared imagery indicated that the temperature at the top of Pavlof's cloud was -55°C, corresponding to an altitude of about 9 km. This cloud drifted nearly due E and was still visible at 1945 when imagery showed a new plume originating from Pavlof. By 2215, the new plume had reached 9-10.5 km altitude and feeding from Pavlof appeared to be continuing. By 0415 the next morning, the bulk of this plume had drifted SE and appeared to be largely disconnected from its source, although faint traces of plume may have extended back to Pavlof.
Fishermen in Pavlof Bay reported that activity continued through the night, dropping nearly 4 cm of ash on one boat. An ash sample from one of the boats was sent to the USGS in Anchorage. No certain activity could be distinguished on the satellite image returned at 0615, but there were unconfirmed reports of a renewed eruption by about 0700 and by 0930 the imagery again showed plumes from both Pavlof and Shishaldin. From infrared imagery, a temperature of -28°C was determined for the top of Pavlof's plume, indicating that its altitude was approximately 7.5 km. A Reeve Aleutian Airways pilot flying near Pavlof at 1000 observed a black eruption column and estimated the altitude of its top at roughly 6-7 km. He also reported incandescent material on the W flank. A faint plume extended ESE and was still connected to Pavlof on the satellite image at 1415. No eruption clouds have been observed on the imagery since then, and there have been no reports from pilots of renewed activity.
A visit to the volcano 2-3 October by Egill Hauksson and Lazlo Skinta revealed that lava had been extruded from a vent about 100 m below the summit and had flowed down the NNW flank to about the 600 m level. The lava covered an area of roughly 3 km2, and was 6-7 m thick at the thickest portion of the flow front, which was not advancing. A sample of the lava was sent to the Lamont-Doherty Geological Observatory. No ashfall thicknesses could be determined because of redistribution by very strong winds.
A Lamont-Doherty seismic monitoring station [8.5] km SE of the summit recorded occasional periods of harmonic tremor and an increase in the size of B-type events beginning about 2 weeks before the eruption. However, a few days before the eruption began both the number and size of events decreased; only five discrete shocks were recorded between 1500 on 22 September and 1500 on the 23rd, and only two during the next 24 hours, as compared to an average background level of 15-25/day. On 25 September, the day Pavlof's eruption was first observed on satellite imagery, the seismographs recorded a few more discrete events and intermittent, very low-amplitude harmonic tremor. Between 2000 on 25 September and 0300 on 26 September tremor amplitude increased gradually, and by about 0330 tremor was saturating the instruments. The strongest tremor was recorded between 0500 and 0900, then amplitudes began to decrease. However, tremor remained strong and continuous until 1220 on 27 September, when it declined to several-minute bursts, between which discrete events could be observed. About 100 discrete events and lower amplitude bursts of tremor were recorded during the 24-hour period ending at 1500 on 28 September. As of 5 October, B-type events and bursts of harmonic tremor were continuing.
Both the 1980 and the 1981 eruptions occurred from vents high on the N flank, but it was not certain whether these were the same vents.
Information Contacts: T. Miller and J. Riehle, USGS, Anchorage; S. McNutt and E. Hauksson, LDGO; W. Younker, NOAA/NESS, Anchorage.
Large eruption column; tremor
Strong tremor started to appear on local seismic records on 14 November at about 1500 and by 1800 was saturating the instruments. The mayor of Sand Point, about 90 km E of Pavlof, saw glow over the volcano at 2330 that night. At 1220 the next day, an airline pilot reported an eruption column rising to about 5.5 km altitude through weather clouds that covered the summit and obscured the vent area. Twenty minutes later, the column had reached 7.5 km altitude. Tephra emission was continuing at 1300. The plume blew S and SE, and spread to about 50 km width, 50 km S of the volcano. Aircraft were diverted from the area. Tremor continued to saturate the seismic instruments through the afternoon.
Information Contacts: T. Miller, USGS, Anchorage; S. McNutt, LDGO.
Ash emission; vapor plume; volcanic tremor
On 19 November a small vapor cloud rose approximately 100 m above the vent. Bad weather prevented observations until 26 November when Pavlof was visible until mid-afternoon from Cold Bay. During the morning, a vapor plume containing a little ash rose to 4.5 km altitude. At intervals of approximately 30 minutes, puffs of dark ash were emitted. The intervals became shorter, and by 1500 ash emission was nearly continuous.
Through October and early November, a Lamont-Doherty seismic monitoring station near the volcano recorded background levels of 0-40 (usually 0-30) small low-frequency events per day. A 30-minute burst of volcanic tremor began at 2000 on 4 November, and a 6-minute burst at 1757 on 9 November. Between 1430 on 11 November and 1100 on 13 November, 15 explosions were recorded. Several 1-2 minute bursts of tremor occurred between 1700 and 1900, when continuous tremor started. Its amplitude gradually increased, and tremor began to saturate the seismograph at 1100 on 14 November. Tremor was strongest between midnight and 1200 on 15 November, and continued to saturate the seismograph until 2100 on 15 November when its amplitude began to decrease. Tremor remained continuous but at low amplitude between 1300 on 16 November and 1200 on 18 November. Intermittent low-amplitude tremor and numerous low-frequency (B-type) events recorded after 1200 on 18 November were continuing on 21 November.
An increase in seismic activity had also been recorded in mid-July. Seismicity remained at background levels until 11 July. During the 24-hours beginning at 1500 on the 11th, 6 explosions were recorded at a Lamont-Doherty seismic monitoring station near the volcano. The number of recorded events increased to 55 for the same period on 12-13 July, and to 150 on 13-14 and 14-15 July, then decreased to 120 on the 15-16th, 38 on the 16-17th, and 19 on the 17-18th, returning to back-ground after 1500 on 18 July. During the period of increased seismicity, approximately half of the recorded events were explosions and half low-frequency events.
At 1549 on 15 July, a thermal infrared image from the NOAA 7 polar orbiting satellite showed a bright spot over Pavlof and an elongate plume extending approximately 150 km to the E. This plume was distinctly colder (at higher altitude) than the layer of low clouds that covered the area. No activity was visible on other NOAA 7 images returned approximately every 12 hours 11-18 July.
Information Contacts: S. McNutt, LDGO; T. Miller and M. E. Yount, USGS, Anchorage; M. Matson, NOAA/NESDIS.
Brief ash emission episodes
Activity continued through December. At 1400 on 15 December, an airline pilot observed a burst of ash from the volcano, producing a plume that drifted NW. Brief periods of ash emission separated by longer quiescent periods were continuing as of 28 December. These short eruptions produced plumes that dissipated after a few hours.
Information Contacts: M. E. Yount and T. Miller, USGS, Anchorage.
Plumes on satellite imagery; harmonic tremor
Six explosions were recorded between 1600 and 2000 on 15 December by Lamont-Doherty's 5-station seismic net 4.5-10 km from the volcano. One station, about [8.5] km from Pavlof, detected bursts of harmonic tremor 17 December, 1100-18 December, 0330; 18 December, 0530-0615 and 1040-1110; 20 December, 2200-2245; and 21 December, 2035-2048. Seismicity then decreased to the background level of several tens of events per day and remained at that level as of 26 January.
Eruption plumes were observed on three images returned 15-17 December from the NOAA 8 polar orbiting satellite. The images at 2101 on the 15th and 1031 on the 17th showed well-defined, relatively dense plumes extending 225 km E and 400 km NE from Pavlof above the weather cloud layer. A diffuse plume was observed on the image at 2018 on 18 December. No volcanic plumes were observed on other images 15-21 December, but heavy weather clouds obscured the area. There have been no eyewitness reports of eruptive activity since airline pilots last reported eruption clouds from Pavlof at 1400 on 15 December.
Information Contacts: S. McNutt, LDGO; M. E. Yount, USGS, Anchorage; M. Matson and W. Gould, NOAA/NESDIS.
Vapor plume to 6 km altitude
At 1225 on 16 March, the pilot of Air Pacific flight S27 observed a white vapor plume rising to 6 km altitude from the volcano and drifting NW. There had been no eyewitness reports of activity at Pavlof since 15 December 1983 (8:12). After an increase on 17-21 December, seismicity decreased to the background level of several tens of events per day and remained at that level as of 2 April.
Information Contacts: M. E. Yount, USGS, Anchorage; S. McNutt, LDGO.
Ash cloud to 4 km after 10 days of increasing seismicity
On 16 April at about 1100, a Reeve Aleutian Airways pilot saw an ash and vapor plume rising from Pavlof to ~4 km asl [see also 11:5]. About 30 minutes later, another pilot reported relatively steady ash emission to ~4.5 km altitude. Similar activity was observed around 1900.
A large eruption column that rose through low weather clouds to 14.5-16 km altitude was observed by airline pilots on 18 April at about 1620. That evening, ~0.3 cm of ash fell on Cold Bay, 55 km WSW. Minor ash emission was seen the next day, but weather conditions limited observations. Increased flow was reported in the Cathedral River, which drains Pavlof's NW flank.
Seismographs recorded a gradual increase in small volcanic events starting on 6 April, and a more rapid increase in seismicity 10-12 April. On 12 and 13 April, frequent discrete volcanic events were accompanied by brief (6-7 minutes or less) episodes of tremor. Preliminary inspection of later records indicated that vigorous seismicity was continuing as of 17 April, and instruments were saturated by events associated with the strong explosive activity on 18 April.
Information Contacts: M.E. Yount, USGS Anchorage; J. Taber, Lamont-Doherty Geological Observatory (LDGO).
Strong tremor accompanied large 18 April plume
No other reports of activity had been received as of early May [but see 11:05], and no information was available about changes that might have occurred to the active crater.
John Taber provided the following information from seismic stations operated by LDGO. "The number of volcanic events increased from a slightly above normal 20 events on 6 April, to 370 events on 11 April and 750 events on 13 April. The rate of seismicity then stayed relatively constant until the main eruption on 18 April. Continuous tremor began at around 1440 and intensified around 1610, when it was visible at stations 100 km away. The strong tremor continued until 1800 then gradually subsided, ending around 2100. The number and duration of volcanic events dropped abruptly after the tremor ended and continued to decrease until background levels were reached by 26 April."
Information Contacts: J. Taber, LDGO.
Strombolian activity feeds lava flow; seismicity increases
Airplane pilots reported occasional ash emission through early June. Seismicity had decreased to background levels by 26 April but began to increase again in late May and remained vigorous as of mid-June. On 14-15 June, T. Miller observed Strombolian activity feeding a lava flow from a new vent on the E side of the cone.
J. Reeder provided additional observations of the 16-18 April eruption clouds and reports of continuing minor ash emission. On 16 April at 1117, Reeve Aleutian Airways Captain Edward Livingston noted a white steam plume rising to 4.6 km altitude over Pavlof. About noon the next day, MarkAir Captain Ray Wells reported a dark gray plume over Pavlof that rose to 4.9 km altitude and drifted SW over the Pacific Ocean. On 18 April at about 1130, Reeve Aleutian Captain Lee Goch saw a plume at 3 km altitude that was again drifting over the Pacific Ocean. At 1743, a jetliner crew reported to FAA Flight Control that a plume at 15.2 km altitude was drifting NE.
Weather prevented further observations of the volcano until 6 May, when Goch saw a white steam plume, containing some minor swirls and streaks of gray ash, that reached 2.9 km altitude. The plume drifted NW for 1.5 km, but traces of ash could be detected several kilometers further downwind. A minor ash deposit was visible on the S flank of the volcano. At about noon on 10 May, Reeve Aleutian Flight Engineer George Wooliver observed ash on the N and NW flanks of Pavlof and the SW upper flank of Pavlof Sister, about 4.5 km NE. Pavlof was steaming weakly, emitting a white plume that rose no more than 100 m above the summit.
The USGS received reports from several airplane pilots of renewed activity on 30 May. At 1135, MarkAir and Reeve Aleutian pilots observed an eruption cloud rising to 4.5-5 km and drifting to the west. At 1523, an ash cloud reached about 3.5 km altitude and extended NE over Pavlof Bay. At 1604, the crew of another airliner reported "heavy smoke" that rose to about 6 km altitude and drifted NE. At 1723, white steam was being emitted to <3 km altitude.
John Reeder reports that on 4 June at about 1230, Goch and MarkAir Captain Clint Schoenleber observed a white plume with no visible ash that rose to 4.9 km and drifted N. On 9 June at 1200, Captain Livingston and co-pilot Don Munson saw a gray steam and ash plume drifting 40 km to the NE. Reeder noted that Livingston's 9 June photograph suggested that a pyroclastic flow had just moved down the ESE side of the volcano and that previous pyroclastic flows had advanced down the same flank. Goch's 6 May photograph and other observations suggested to Reeder that April eruptive activity had been confined to N and NE parts of the summit [see below], depositing tephra on the NE, N, and NW sides of the volcano. Goch observed only minor steaming on 10 June.
John Taber reported that seismicity began a gradual increase about 23 May, reached high levels by 28 May, remained vigorous through 15 June, then declined slightly.
During fieldwork near Pavlof 14-15 June, T. Miller observed vigorous Strombolian activity from a new upper E flank vent ~150 m below the summit. Spatter rose 200-250 m above the vent, feeding an E flank lava flow that was ~100 m wide and reached ~1,000 m elevation [see also 11:6]. The activity produced a small ash-poor plume fed at 5-10-second intervals. Adjacent to the new vent, the old crater was emitting steam and had enlarged somewhat since 1983.
While flying past the volcano on 16 June, James Dickson observed a 600-m ash and steam plume that was drifting toward the N. Reddish-brown ash fell from the plume.
Information Contacts: J. Reeder, ADGGS; T. Miller and M.E. Yount, USGS Anchorage; J. Taber, LDGO.
Strombolian activity feeds lava flow; strong seismicity
USGS personnel observed Strombolian activity from a new vent E of and ~100 m below the summit during fieldwork in the area 10 June-1 July. Activity was similar on each of seven occasions when the volcano was clearly visible. Spatter from the vent fell on the upper E flank, feeding a flow [see 11:4] that had reached ~1,100 m altitude by 15 June and had advanced to ~600 m altitude two weeks later. On 29 June, the flow was ~100 m wide at 750 m altitude. Some mudflow activity (2-3 lobes) was associated with the [spatter-fed] flow. Occasional moderate ash emission occurred but the largest ash columns rose only several hundred meters above the vent. On the NNE side of the summit, the vent that had been active for the past 15 years had enlarged, probably during the April eruption, but was only steaming in June. A flow fed by spatter from the old vent, probably in April, was snow-covered [see 11:7]. Thick April ashfalls were sampled NW of the volcano, and large April mudflows and significant flooding were evident.
When John Reeder flew past Pavlof on 8 July at 1500, ash ejection fed a plume that reached about 3900 m altitude and drifted approximately 15 km WSW. Flows were seen on the SE and N sides, and black ash covered the summit area.
Seismicity declined slightly 17 June, but was still strong as of 4 July. No harmonic tremor was recorded. Seismicity was stronger on GMT days 28 June and 1 July than other days between 17 June and 4 July, but USGS personnel did not observe significant fluctuations in eruptive activity.
Information Contacts: T. Miller, USGS Anchorage; J. Taber, LDGO; J. Reeder, ADGGS.
Continued Strombolian activity and vigorous seismicity
Eruptive activity accompanied by strong seismicity continued through early August. Poor weather usually obscured the volcano, but seismicity remained high with only slight day-to-day variations. A thin ash plume was visible during the late evening of 18 July and reached ~5.5 km altitude the next day. Little activity was evident on 20 July, but several explosions were heard 23 July. No changes in seismicity could be correlated with these observations.
Seismicity increased substantially on 31 July at 1845, and an airline pilot reported explosions an hour later. Pulses of seismicity that varied in amplitude from 5-6 mm to about 40 mm saturated instruments for about 20 hours, and were recorded by stations as far as 60 km from the volcano. Seismic activity declined somewhat on 2 August, remaining vigorous but detected only on the instrument 7.5 km from the summit. As of 5 August, discrete high-amplitude volcanic events averaging 30-40 seconds long continued to be recorded.
When visited by geologists on 7 August, snowfields at 800 m altitude about 4 km N of the summit were covered by 2.5-7.5 cm of pea-sized to fist-sized tephra. At a location 10-12 km WNW of the summit, 15 cm of ash had fallen since the previous visit 2 years earlier. Some ash was clearly fresh, as it was visible on top of snowfields in nearby ravines, but geologists were unable to sample or measure the thickness of ash deposits on the snow. Several booming explosions were heard during 1/2 hour at this site, and several more explosions were heard later that day from S of the summit. Airline pilots continued to report emission of vapor and ash through early August (table 1).
Table 1. Summary of reports describing activity at Pavlof, 14 June-15 September 1986, compiled by John Reeder. Observers (initials in brackets): FWS; Jean Shaul, Marcia Brown, and Clayton Brown, Cold Bay; Reeve Aleutian Airways; MarkAir; Peninsula Airways; Sand Point Air; NOAA aircraft; Clint Schoenleber and Jerry Chisum, Markair; John Reeder; Mike Whelan; Lee Goch, Don Munson, George Wooliver, Harold Black, Andy Livingston, and Edward Livingston, Reeve Aleutian Airways; Mary Maurer; Adrian Brown; Robert Adams; Steve Hakala; Guy Morgan; Chris Dan; John Sarnis; Mike and Peggy Blenden; Jeff Wilson; Jeff Backlund; Federal Aviation Administration; Wayne Russell; British sailors on the Ashley St. Mary; Theresa Dubber and Robert Senimore, FAA, Cold Bay; Steve Hakala, Sand Point.
| Date | Time | Activity Reported | Observers |
| 14 Jun 1986 | 1710 | New vent on Se summit ejected blocks and magma to 35 m, lava flow to ESE, ash plume towards SW. | -- |
| 15 Jun 1986 | 1200-2000 | Incandescent blocks and lava fountains 30-60 m from new SE vent, lava flow on SE flank, ash and steam from four vents on SE summit, 3,300 m ash-and-steam plume 30 km to NNW. | -- |
| 16 Jun 1986 | 1211 | 3,600-m ash plume 40 km to N. | -- |
| 17 Jun 1986 | 1325 | 3,300-m steam and light ash plume 8 km to NNE. | -- |
| 18 Jun 1986 | 1142-1619 | 3,000-4,600-m ash-and-steam plumes extending 80-120 km to the NE and NNE. | -- |
| 19 Jun 1986 | -- | 3,500-m steam plume with no detectable ash to NE. | -- |
| 21 Jun 1986 | 1330 | 4,200-m steam plume with streaks of ash 40 km to SW. | -- |
| 22 Jun 1986 | 1127 | 3,000-m steam plume with blue/brown haze 40 km to SW. | -- |
| 23 Jun 1986 | 1200 | 3,000-m light ash plume drifting E. | -- |
| 24 Jun 1986 | 1712 | Wind-blown ash to 300 m above ground surface 9 km S of summit. | -- |
| 27 Jun 1986 | 1045 | 3,300-m dark ash plume extending 40 km to SW. | -- |
| 08 Jul 1986 | 1500 | 3,950-m steam-and-ash plume 40 km to WSW. | -- |
| 06-12 Jul 1986 | -- | Explosions were heard and felt at canoe Bay, 45 km ENE of Pavlof by U.S. Fish and Wildlife personnel working in the area. | -- |
| 13 Jul 1986 | 1145 | 3,600-m ash plume 30 km to ENE. | -- |
| 13-19 Jul 1986 | -- | Almost continuous rumblings, 4-5 second intervals, earthquakes and ground vibrations strong enough to rattle windows, shake shelf items, and prevent sleep; some ashfall at FWS camp, 45 km ENE. | -- |
| 16 Jul 1986 | 1300 | Extensive ash deposits in Cathedral Peaks region, 17.6 km W of summit, Pavlof and Pavlof's Sister covered with ash, SE vent ejected steam with dark vertical plume of ash at 3-5-minute intervals, N vent quiet. | -- |
| 17 Jul 1986 | 1315 | 3,600-m ash plume to 30 km ENE. | -- |
| 18 Jul 1986 | -- | SE summit vent eruptions at several-minute intervals caused pulsating plume and incandescent lava flowing down SE flank that did not reach the ocean. | -- |
| 19 Jul 1986 | 1320 | 3,300-m ash plume extending 24 km to ENE. | -- |
| 20 Jul 1986 | -- | Several vents observed at SE summit, none with active lava flows, one ejecting rocks and lava bombs tens of meters high, three separate SE-flank flows, one still steaming; none had entered the ocean. | -- |
| 22 Jul 1986 | 1200 | 3,600-m dark ash plume extending to ENE. | -- |
| 29 Jul 1986 | 1200 | 3,600-m steam-and-ash plume toward WSW. | -- |
| 20-30 Jul 1986 | -- | Very little rumbling and ground vibrations at FWS camp. | -- |
| 31 Jul 1986 | 1217 | Small puffs of ash and steam to 150 m from SE vent. | -- |
| 31 Jul 1986 | 1836 | Active 600-m-long lava flow down E slope from SE vent located 120 m below summit. | -- |
| 01-03 Aug 1986 | -- | Explosions heard from 55 km NE of Pavlof, 3-5-minute intervals, heavy ash detected in streams and rivers in Aghileen Pinnacles and Cathedral Valley areas, 17.5 to W and NW of Pavlof. | -- |
| 02 Aug 1986 | 1240 | 3,000-m steam-and-ash plume extending to NE. | -- |
| 05 Aug 1986 | -- | 4,500-m steam-and-ash pluem to E. | -- |
| 08 Aug 1986 | 1300 | Dark ash clouds from N summit vent to 30-50 m at several- minute intervals, SE near-summit vents emitting traces of steam. | -- |
| 13 Aug 1986 | evening | Summit lava fountaining. | ASM |
| 14 Aug 1986 | midday | Large white steam plume. | GW |
| 18 Aug 1986 | 0850 | Dark ash to 3,600 m, drifting 80 km SE. | PA |
| 18 Aug 1986 | 1047 | Steam-and-ash plume to 4,000 m, drifting 55 km ESE. | SP |
| 20 Aug 1986 | 1556 | Ash plume to 3,600 m, drifting SE. NOAA Sound heard just before emission of large ash puff. | JS |
| 21 Aug 1986 | 0900 | Plume alternating steam and ash at 3-minute intervals to 3,000 m; visible for 15 minutes, then obscured by weather. | TD, RS |
| 22 Aug 1986 | 1152 | Ash plume to 3,600 m, drifting at least 16 km ESE. | RA |
| 22 Aug 1986 | 1241 | Occasional steam plumes. | RA |
| 05 Sep 1986 | -- | 300-m dark nearly vertical column, drifting slightly NE. | SH |
| 10 Sep 1986 | 1155 | Ash and steam to 3,000 m, drifting NE for 8 km. | HB, AL |
| 12 Sep 1986 | 1100 | Minor steam emission from 100-m region near summit. | JC |
| 15 Sep 1986 | 1430 | White steam from old N vent did not rise above summit. | MB, CB |
The active spatter-fed flow on the E flank and an inactive flow probably associated with April explosions were composed of individual tephra fragments, and moved downslope as debris flows. Airline pilots reported that the flow front on the E flank remained at about 600 m altitude as of 31 July.
On 8 August personnel aboard a Reeve Aleutian Airways plane reported that they sighted what may be a large bulge on the W side of the volcano about 2/3 of the way upslope. It appeared to have a diameter of about 300 m.
Information Contacts: T. Miller, USGS Anchorage; J. Taber, LDGO; J. Reeder, ADGGS.
Strombolian activity and ash emission ends
Airplane pilots frequently reported vapor and ash rising to 3.5-4 km altitude from Pavlof through 22 August (table 1). Sailors observed lava fountaining during the evening of 13 August, but airplane pilots generally do not fly close enough to the volcano to observe Strombolian explosions and most flights are in daylight when eruptive glow is unlikely to be evident. No pilot reports of activity were received between 22 August and 8 September, although there was some clear weather during that period. On 8 September, vigorous vapor emission was observed from Sand Point, 90 km E. During an overflight on 12 September, only minor steaming was observed.
Information Contacts: T. Miller, USGS Anchorage; J. Taber, LDGO; J. Reeder, ADGGS.
Ash emission and lava fountaining
Airplane pilots reported that ash emissions and lava fountaining resumed in early November. No activity had been reported since mid-September. Observers named below are Reeve Aleutian Airways pilots; other reports are from the FAA.
The start time of the eruption is not known, but on 30 October a clear view of the snow-covered volcano showed that it remained inactive, without vapor emissions. No other observations of Pavlof are known until 1100 on 6 November when activity was first reported. At 1130 Lee Goch and Don Munson observed a 2750 m-high plume of dark ash and white vapor drifting more than 40 km to the NE. An incandescent lava fountain (about 10 m high) emerged from a vent just SE of the summit. Two fresh-looking, gray-black, linear, flow-like features, 120 m and 50 m wide, extended about 1/3 of the way down the SE and NW flanks. Neither feature emitted any steam, and both were free of snow. The rest of the volcano remained covered with white snow. At 2045 a pilot reported that lava fountaining was continuing at the SE summit vent.
On 10 November at 1135 James Fredenhagen and Ken Gendron observed bubbling incandescent lava and a 10-m-high, 6-m-wide fountain in a crater on the upper SE flank, ~120 m below the summit. A vertical ash and steam plume rose to ~300 m above the vent.
Fredenhagen did not see incandescent lava during a 12 November flight at 1140, but vapor and ash were released from the SE summit-area vent and drifted eastward. Earlier that day he passed through a haze layer at 1,500-1,800 m altitude during his approach to Sand Point, 90 km to the east. A fissure-like feature extending from the summit to at least halfway down the SE flank appeared to be emitting black ash and depositing it nearby. No incandescent material or vapor was visible in the fissure.
On [13] November Edward Livingston reported that grayish-black ash deposits covered the entire SE side of the volcano. At 1200 on 17 November a 3,600-3,900-m-high plume issued from the vent below the SE crater. Black ash pulses occurred at 5-8-minute intervals and winds blew the ash SE in a 70-km-long cloud. By afternoon (around 1400-1630) the FAA reported that the plume had grown to 4,500 m height.
On 18 November the FAA reported that the semi-continuous plume was 4200 m high between 1000 and 1030. At 1512 an image from the NOAA 9 polar orbiting satellite recorded a weak plume extending 50-60 km N. The FAA has warned pilots in the area not to go below 3750 m and to avoid the vicinity of the volcano.
Information Contacts: J. Reeder, ADGGS; M.E. Yount, USGS Anchorage.
Eruption continues; lava flow reaches ocean
The eruption continued into December with steam plumes from the N-summit vent and ash emissions from a SE flank vent 200-300 m below the summit (table 2). Steam and ash emissions were continuing at 1840 on 10 December when pilots saw an orange-red glow in a cloud above the summit. They did not observe any material moving through the clouds. The next day at 1324, airplane pilots reported that 3-4 lava flows had moved down the SSE flank and that one had reached the Pacific Ocean at Pavlof Bay, 10 km from the summit [but see 11:12]; a 300-m-high steam column rose where the flow entered the water.
Table 2. Summary of reports describing activity at Pavlof, 17 November-16 December 1986, collected by John Reeder. Observers (initials in brackets): Edward Livingston, Lee Goch, James Fredenhagen, Don Munson, and Harold Black (Reeve Aleutian Airways); Clayton Brown (Alaska Fish and Game); Jerry Chisum (MarkAir); Marsha Brown (FAA, Cold Bay); unnamed observers from Reeve Aleutian Airways (RA), MarkAir (MA), Peninsula Airways (PA), and a private plane (Cessna).
| Date | Time | Activity Reported | Observers |
| 17 Nov 1986 | 1006-1600 | Constant steaming from N vent; black ash pulsed (every 5- 8 minutes at 1200) from SE vent, feeding a plume to 3,600-4,200 m altitude that drifted 25-30 km S; ash covered the entire SE flank. | CB, EL, JC, MA |
| 18 Nov 1986 | 1200-1652 | Steam emission from N vent; ash emission from SE vent, drifting SW. | JC, JF, CB |
| 19 Nov 1986 | 1030 | Ash plumes to 3,000-3,300 m altitude emitted at 5-minute intervals from SE vent. | EL |
| 19 Nov 1986 | 1600 | No eruption apparent despite clear visibility. | RA |
| 21 Nov 1986 | 1522 | Small amounts of ash formed 1.5-km-long plume. | PA |
| 23 Nov 1986 | 1545 | Plume rose to 3,000 m altitude; drifted NE. | Cessna |
| 26 Nov 1986 | 1130 | Dark gray ash pume rose 90-150 m above summit from SE vent and drifted 8 km SE. | LG, DM |
| 02 Dec 1986 | 1045 | Ash column from SE vent rose to 3,000 m, drifted E. | MB |
| 02 Dec 1986 | 1359 | 60-m-high brown ash cloud from SE vent. | JC, MB |
| 10 Dec 1986 | 1840 | Pilots at 3,600 m altitude observed an orange-red glow in a thin cloud horizon at 2,500 m altitude (just above the summit). | LG, DM |
| 11 Dec 1986 | 1324 | SE-vent ash plume reached 4,500-5,400 m altitude and drifted WSW for 32 km; three to four narrow lava flows had moved down the SSE flank. | HB, DM |
| 16 Dec 1986 | 1140 | 60-m-high steam plume from the SE vent; no other activity was observed. | LG |
Seismicity in early November reached more than 150 events/day, all apparently explosion shocks. Individual events had similar durations but variable amplitudes. Only a few hours of tremor were recorded.
Information Contacts: J. Reeder, ADGGS; J. Taber, LDGO.
Strong tremor accompanied early December lava flows; steaming from summit and flank fissures
John Taber reported that from 1 to 6 December, 140-200 volcanic events/day were recorded; 30-60 were explosions with a distinct airwave arrival. On 8 and 9 December the number of individual events gradually decreased until replaced by low-amplitude harmonic tremor. Tremor amplitude gradually increased until the record suddenly became saturated on 9 December at 2310, remaining saturated until 13 December at about 1400. Tremor continued to decrease until discrete events were again visible by about 0100 the next morning.
Airplane pilots had observed steam and ash emissions from summit area vents in early December, saw glow on 10 December, and new SSE flank lava flows the next day (SEAN 11:11). Closer examination by Harold Black, James Fredenhagen, and Donald Munson (Reeve Aleutian Airways) revealed that the narrow lava flow that appeared to have reached the ocean on 11 December had in fact stopped in a stream bed about 600 m short of Pavlof Bay. The flow was black and emitting no steam when Fredenhagen observed it on 20 December.
On 18 December, Fredenhagen observed that a fissure, emitting steam plumes to as much as 60 m height at intervals of 6-15 m, extended from the SE summit vent, active in the November eruption (SEAN 11:10-11), to about halfway down the SE flank. There it split at about a 90° angle, with both segments continuing for another 300 m downslope; steam issued from both segments for at least 150 m. On 23 December, he also observed small puffs of steam emerging from the old NE summit vent. During clear weather on 27-28 December, Marcia Brown (FAA, Cold Bay) saw steam issuing from the NE summit vent and moving about 300 m down the NE flank. On the 29th, the plume was blowing horizontally about 300 m to the E. The volcano was snow-covered with no detectable ash deposits. Poor weather prevented further observations.
Information Contacts: J. Reeder, ADGGS; J. Taber, LDGO.
Steam emission from two near-summit vents
Satellite images at 0514 and 1041 on 9 January show plumes drifting 150 and 100 km ESE from Pavlof. Between 17 January and 11 February, airplane crewmembers and observers at Cold Bay reported steaming from two near-summit vents (table 3).
Table 3. Summary of observations describing activity at Pavlof, 17 January-11 February 1987, collected by John Reeder.Observers (initials in brackets): Marsha Brown and Theresa Dubber, FAA, Cold Bay; Lee Goch, Don Munson, Janice Reeve Ogle, and James Fredenhagen, Reeve Aleutian Airways; Guy Morgan, Peninsula Airways.
| Date | Time | Activity Reported | Observers |
| 17 Jan 1987 | 1546 | Continuous steam emission from an upper NE-flank vent. | MB |
| 22 Jan 1987 | 0953 | Continuous steam emission from an upper NE-flank vent. | MB |
| 23 Jan 1987 | -- | Steam emission on SE flank. | TD |
| 26 Jan 1987 | 1011 | Steam emission from the NE vent. | MB |
| 31 Jan 1987 | 1400 | 250-m steam plume from a upper SE-flank vent drifted about 5.5 km NW. | LG, DM, JO |
| 02 Feb 1987 | 1300 | 150-m-high steam column from the SE vent. | LG, JF |
| 03 Feb 1987 | 1400 | 150-m-high steam column from the NE vent drifted NE. | MB |
| 05 Feb 1987 | 1000 | Ash plume from summit drifted about 20 km WSW; several black flows (lava or debris) had extended at least 600 m down the NW slope. | MB |
| 11 Feb 1987 | 1500 | 30-m steam plume from the NE vent; the summit was coverd with fresh snow. | MB |
Information Contacts: J. Reeder, ADGGS; Steve Shivers, USGS Anchorage.
Fresh ash on summit
At 1105 on 22 March Marsha Brown (FAA, Cold Bay) saw a steam plume emerging from the upper NE flank vent and drifting NE. The summit appeared to be covered with a thick layer of fresh ash. Minor steam emission occurred at other times during the month.
Information Contacts: J. Reeder, ADGGS.
Ash emission; flow; seismic amplitudes increase
The 15-month eruption continued in May. The summit was visible on several days from the end of May until 9 June. On about 22 May, Warren Johnson (Kenai Float Plane Air Service) observed a small lava flow and minor ash emission from a vent on the NE flank near the summit. On 28 May at 0627, Marsha Brown (FAA, Cold Bay) observed emission of black ash puffs at 5-minute intervals from 2 vents on the NE flank, one near the summit and the other halfway down the flank. The near-summit vent was emitting more ash. Ash from both vents rose about 800 m above the volcano and drifted about 10 km SE. Ash deposits covered the NE flank. At 1200 that day Lee Goch (Reeve Aleutian Airways) saw only minor steam emission.
On 30 May, Edward Livingston (Reeve Aleutian Airways) observed fairly steady black ash emission from the near-summit vent rising to ~300 m above the summit and drifting 24 km SSE. The SE flank was blackened by ash while the rest of the volcano was snow-covered. Ash emission was continuing at 1956 when a Peninsula Airways aircraft passed.
On 2 June at 1615 Pavlof was again visible and James Gibson (Reeve Aleutian Airways) observed, from more than 25 km away, a black steaming lava or debris flow on the NE slope that originated from the near-summit vent. The flow extended into the saddle between Pavlof and Pavlof Sister, then turned NW. Ash rose about 600 m above the near-summit vent and to about summit altitude from a source in the flow about 1/3 of the way down the NE flank.
On 6 June at 1601, the pilot of a small aircraft saw an ash plume rising to 600 m above the summit and drifting S. The 2 June flow had descended to 120 m elevation and steam was rising where the flow touched snow. On 9 June only steam emission from the upper NE vent was seen but the entire summit area was covered with ash.
Volcanic earthquake amplitudes and tremor were greatly increased from about 5 to 10 June and were much higher than during most eruptions.
Information Contacts: J. Reeder, ADGGS; J. Taber, LDGO; T. Miller, USGS Anchorage.
Incandescent flow; summit glow; ash emission continues
The eruption . . . continued in June. On 7 June at 1601 pilot Richard Williams (Peninsula Airways) saw an incandescent flow (probably lava) that had descended to 1,200 m elevation on the NNE flank. Ash was rising to 600 m above the volcano from the NE near-summit vent, drifting S. Forty minutes later the ash plume reached 760 m. Residents of Nelson Lagoon, 80 km NE, reported a bright red glow from the summit throughout the night. On 9 June at 1153 a pilot reported only steam emission from the NE near-summit vent.
The following day at 1419 the U.S. Coast Guard reported that gray ash was being emitted from the active vent and 7 hours later pilot Harold Wilson (Peninsula Airways) saw (and photographed) gray then black-gray ash emission. A plume rose to 760 m above the NE vent and drifted 2 km W. The black-gray ash emission was intermittent and lasted for about 15 minutes. Only minor steam emission was reported on 11 June but dark ash emission had resumed on 12 June at 1602 when Chuck Nickerson and George Wooliver (Reeve Aleutian Airways) passed the volcano.
A lava or debris flow seen from 25 km away during the afternoon of 2 June was reported in 12:5. That evening from 2130 to 2200 Marsha Brown (FAA, Cold Bay) saw an incandescent flow move down the NNE flank. Richard Williams observed the incandescent flow from Nelson Lagoon (80 km NE) and estimated that it extended almost 1/3 of the way down the volcano.
Information Contacts: J. Reeder, ADGGS.
Activity decreases; steam and ash emission
Activity appeared to decrease during July. A 460-m-high steam plume was sighted on 6 July by R. Williams (Peninsula Airways) from Nelson Lagoon, and a small amount of what appeared to be ash on the summit and N flank was reported on 11 July by Marsha Brown (FAA, Cold Bay). The weather was generally poor for the rest of the month but numerous pilots reported that no eruptive activity was occurring on 26 and 28 July.
Information Contacts: J. Reeder, ADGGS.
Continued ash emission
Eruptive activity was continuing in late August. At about 1130 on 29 August, pilot Chuck Nickerson (Reeve Aleutian Airways) observed a thick dark ash horizon at 1200-1800 m altitude extending 50 km SSW from Pavlof. The ash appeared to originate from a SE flank vent. Below that vent, white steam was rising along a 100 m, narrow, flow-like, feature or crack. At 1550 pilots Andy Livingston and James Fredenhagen (Reeve Aleutian Airways) observed from Sand Point (88 km E), a diffuse ash layer at 1200-1800 m altitude that extended at least 15 km SW. Ben and Lorie Kirker reported that no ash reached King Cove, about 40 km SW. On 30 August at 1400 Theresa Dubber (FAA) saw no ash being emitted during a clear view of the volcano from Cold Bay.
Information Contacts: J. Reeder, ADGGS.
New ash deposit
Marsha Brown (FAA, Cold Bay) observed "fairly extensive" black ash deposits on Pavlof's flanks during a flight on 4 September. Both the NE and SE summit-area vents were emitting steam. The ash deposits had not been visible when the volcano was observed on 30 August. On 20 September the volcano was inactive and fresh snow covered the flanks.
Information Contacts: J. Reeder, ADGGS.
Ash-rich explosions; blocks and spatter form flow
Activity increased 17 October when ash-rich explosions from the NW summit vent occurred every 30 seconds to several minutes. Ash plumes, reported through 9 November attained a maximum altitude of 4500-5800 m on 30 October (table 4). Plumes stretched E as much as 200 km and tephra fell at Canoe Bay, 45 km ENE, on 19 October. Blocks and spatter ejected to 30 m from the near-summit vent formed a short spatter flow. Night glow from the summit was visible on several evenings in mid-October. Incandescent rocks and spatter were reportedly continuing in early November. Ash deposits were last reported on 4 September (SEAN 12:09).
Table 4. Reports of activity at Pavlof, 16 October-27 November 1987, compiled by John Reeder and M.E. Yount from the following observers: Steve Hakala (Canoe Bay); Dan Coy (Sand Point Air); Scotty Gibbens and John Sarvis (USFWS); Deedee and Tom O'Malia (Cold Bay); Marsha Brown, Theresa Dubber, Chuck Taylor, Jim Yakal (FAA Flight Service, Cold Bay); Steve Shivers (USGS, Anchorage); James Gibson, George Wooliver, Chuck Nickerson, Gary Lintner, Harding (Reeve Aleutian Airways); Guy Morgan, Bryan Carricaburu, Doug Ruberg (Peninsula Airways); Harold Johnson Sr. (Nelson Lagoon); Will Gould (NOAA/NESDIS); John Sarvis (USFWS); Sand Point Air pilot; James Fredenhagen (Reeve Aleutian Airways);Coast Guard pilot. Unattributed reports were compiled by M.E. Yount.
| Date | Time | Activity Reported | Observers |
| 16 Oct 1987 | 1646 | Thin gaseous plume on NOAA 9 satellite image. | -- |
| 17 Oct 1987 | 1130 | Loud explosions (continued through the night); incandescent flow feature on NE flank. | SH |
| 18 Oct 1987 | 0800 | Incandescent material flowed 800 m from vent. | SH |
| 18 Oct 1987 | 0950 | Ash to 3,200 m altitude, drifting 16 km NW; lava spatter to 30 m above vent. | DC |
| 18 Oct 1987 | afternoon | Rain, very black with ash near volcano. | SG |
| 18 Oct 1987 | 1200-1600 | Nearly continuous black ash emission to 3,050 m altitude, then clouds obscure volcano. | DO, TO |
| 18 Oct 1987 | 1830 | Volcano still very active. | SH |
| 19 Oct 1987 | 1101 | Plume on NOAA 10 satellite image drifting 200 km E. | SS, WG |
| 19 Oct 1987 | 1138 | Ash rising to 3,000 m altitude, drifting ESE. | JG, GW |
| 19 Oct 1987 | morning | Coarse black tephra fell at Canoe Bay. | SH |
| 19 Oct 1987 | 1210 | Ash to 4,250 m altitude, drifting E at least 90 km; ash pulses every 30 seconds and rocks (some incandescent) ejected to 180 m above the vent, landing about 800 m down the flank. | BC |
| 19 Oct 1987 | 1300 | Plume to over 3,350 m, extended at least 100 km E. | GM |
| 19 Oct 1987 | afternoon | Black, steaming, flow feature on NE flank, melted snow; incandescent material ejected. | BC |
| 19 Oct 1987 | 1600 | Nearly continuous ash emission formed a plume, drifted SE. | FAA |
| 19 Oct 1987 | 1700 | Mushroom-shaped plume rose to 1,220 m above summit. | FAA |
| 19 Oct 1987 | 2000 | Ejection of incandescent material. | JY, CT |
| 19 Oct 1987 | evening | Incandescent glow from summit. | HJ |
| 25 Oct 1987 | -- | Red glow from vent; ash to 900 m above vent, drifting NE; incandescent rocks ejected. | MB |
| 26 Oct 1987 | 1828 | Ash to 460 m above volcano. | CN, GL, H |
| 26 Oct 1987 | 1907 | Incandescent material ejected 30 m; ash to 300 m above volcano, drifting E. | JS |
| 26 Oct 1987 | 1940 | Ash to 4,600 m altitude, drifting SSE; incandescent material ejected. | DR |
| 27 Oct 1987 | morning | Ash to 60 m above volcano, drifting NE. | SH |
| 29 Oct 1987 | 1608 | Ash to 30 m above volcano, drifting ESE. | CT |
| 29 Oct 1987 | 1742 | Plume to 4,600 m altitude, driftin ESE; ash fell from plume 1 km from vent. | CT |
| 30 Oct 1987 | -- | Ash plumes reached 4,500-5,800 m altitude. | -- |
| 01 Nov 1987 | -- | Volcano obscured. | -- |
| 05 Nov 1987 | 0921 | Dark ash rose about 250 m above summit, drifting NE. | JS |
| 06 Nov 1987 | 1657 | Dark ash was blown down SE flank, then drifted 20-25 km WNW. | JF |
| 07 Nov 1987 | 1238 | Dark ash rose 150-300 m above summit. | TD |
| 07 Nov 1987 | 1450 | Ash plume rose to 3.6 km altitude; some ash drifted 20-25 km WNW. | JF |
| 07 Nov 1987 | 1600 | Dark ash to 3.6 km altitude, drifted 35 km NW. | JF |
| 09 Nov 1987 | 0900 | Ash plume rose to a maximum of 3.6 km altitude. | TD |
| 09 Nov 1987 | 1000 | Ash blown down S flank. | MB |
| 09 Nov 1987 | 1210 | No eruptive activity. | CG |
| 10-16 Nov 1987 | -- | Poor visibility. | -- |
| 16 Nov 1987 | 0931 | White steam rose to summit. | MB |
| 27 Nov 1987 | 0934 | Steam rose 60 m above the summit. | JY |
Information Contacts: J. Reeder, ADGGS; M.E. Yount, USGS Anchorage.
Dark ash plumes from near-summit vent
The volcano had apparently been quiet for several weeks after new flank ash deposits were seen 4 September; it was inactive and covered with fresh snow on 20 September. A NOAA 9 satellite image on 30 September at 0525 showed a plume extending about 20 km S from Pavlof. Weather clouds obscured later activity.
Eruptions began again in mid-October and continued in November (table 4). Dark ash was steadily emitted to 250 m above the summit on the morning of 5 November. The next day wind blew ash down the SE flank for 120 m; the plume trailed about 30 km SE. Continued ash emission was observed on 6, 7, and 9 November. Plumes reached to 3.6 km altitude (~1 km above the summit) and drifted a maximum of 35 km from the volcano. During observations on 16 and 27 November only white steam was emitted.
Information Contacts: J. Reeder, ADGGS; M. Matson, NOAA/NESDIS.
Weak steam and ash emission
During observations that were limited by poor weather December-February, only weak steam and ash emission was reported (table 5).
Table 5. Reports of activity at Pavlof, 9 January-2 March 1988, compiled by John Reeder from the following observers: Theresa Dubber, James Yakal, and Marsha Brown (FAA, Cold Bay); Guy Morgan (Peninsula Airways).
| Date | Time | Activity Reported | Observers |
| 09 Jan 1988 | 1530 | 150-m steam plume with some ash from NE summit vent. | TD |
| 28 Feb 1988 | 0845 | Black plume several hundred meters high from NE summit vent; 15 minutes later, a steam-and-ash plume was rising 600 m and drifting a short distance E. | JY, MB |
| 02 Mar 1988 | 1200 | Gray steam-and-ash plume rising 300-450 m from NE summit vent and drifting E. Only white steam was visible by 1630 and there were no emissions by 1819. The volcano was snow-covered except for snow-free areas around the summit and NE vents. | GM, MB |
Information Contacts: J. Reeder, ADGGS.
Fresh ash on upper flanks
At 1800 on 20 July, Marsha Brown observed light steam emission from Pavlof's NE summit vent. The volcano's upper flanks appeared black with fresh ash, with more on the N than on the S slope. Six days earlier, at 1519 on 14 July, this ash had not yet been emitted and no steam was evident.
Information Contacts: J. Reeder, ADGGS.
New ash deposit on summit
At 1000 on 13 August, M. Brown (FAA) observed fairly extensive ash deposits on Pavlof's flanks. From Cold Bay ~20% of the visible edifice appeared dark gray and the remainder was black. The ash had been deposited since the volcano was last observed on 7 August. A wispy dark plume rose <300 m from the NE summit vent. The next day at 0740, Peninsula Airways pilot Gary Joseph reported that the volcano was covered with white snow and no ash or steam was being emitted.
Information Contacts: J. Reeder, ADGGS.
Vigorous seismicity and intermittent eruptive activity
Residents of the Alaska Peninsula first noticed small glowing plumes from Pavlof on 15 September. During the following week, seismicity was vigorous and eruptions were intermittent. Poor weather in the first week inhibited visual observations.
On the morning of 16 September, AVO received a report from residents of Cold Bay about an unusual plume emanating from the N flank of the volcano. Local pilots reported glow near the summit and large "car-sized" fragments being ejected from the summit vent. Satellite imagery showed a hot spot in the vicinity of the cone. Seismic data from stations on and near the volcano suggested a low-level eruption. By that afternoon eruptive activity had declined somewhat, although seismicity indicative of eruption remained sporadic.
Persistent seismic activity suggested that an episodic, low-level eruption continued during 17-22 September. The summit hot spot was not seen on images obtained on the early morning of 17 September. Several periods of increased seismicity from the afternoon of 17 September to the morning of 18 September suggested that the eruption was episodic in character with ejection of ash and bombs up to 300 m above the summit of the cone.
Intermittent low-level ash clouds were detected on satellite imagery on 18 September, although imagery from that afternoon to the next morning showed no ash cloud. Pilot reports on 18 September confirmed that there was no significant ash venting above the cloud tops at 3,000 m altitude. Satellite imagery from the afternoon of 19 September to the morning of 20 September also detected no ash cloud.
From the afternoon of 20 September to the afternoon of 22 September several periods of increased seismicity were observed and intermittent low-level ash clouds were detected on satellite imagery. On 23 September local observers confirmed Strombolian fountaining 150-200 m above the summit. There were no major explosions.
Information Contacts: Alaska Volcano Observatory (AVO), a cooperative program of a) U.S. Geological Survey, 4200 University Drive, Anchorage, AK 99508-4667, USA, b) Geophysical Institute, University of Alaska, PO Box 757320, Fairbanks, AK 99775-7320, USA, and c) Alaska Division of Geological & Geophysical Surveys, 794 University Ave., Suite 200, Fairbanks, AK 99709, USA.
Increasing seismicity corresponds to stronger eruptive activity
Residents of the Alaska Peninsula observed small glowing plumes from Pavlof on 15 September. During the next week, seismicity was vigorous and eruptions were intermittent (BGVN 21:08). At 1328 on 24 September seismicity began to increase, suggesting stronger eruptive activity. This increased level of seismicity persisted through the first half of October. Visual observations and satellite imagery verified that increased seismicity correlated with eruptions of ash and bombs up to 1,200 m above the summit.
On 26 September satellite imagery showed a small steam-and-ash plume extending ~45 km SE. A pilot subsequently reported a steam plume to an estimated altitude of 3,700 m. AVO staff doing airborne observations during 27-30 September reported low-level fountaining and occasional small explosions of incandescent material in the summit crater. The small explosions produced sporadic steam-and-ash plumes to 610 m above the vent. The largest plume drifted S for ~110 km and appeared faintly on satellite images. Incandescent spatter was deposited on the NW summit slope or moved down a deep gully on the NW side of the volcano.
During 4-11 October lava fountaining from two vents continued to heights of a few hundred meters above the summit. Incandescent spatter-fed lava flows moved down the steep, snow- and ice-covered slope, widening at the base and extending NW. Occasional water-rich slurries of ash and mud descended the N flank. Diffuse plumes of steam, gas, and ash rose to as high as 6 km above sea level and drifted 160 km downwind. On 15 October eruptive activity increased and seismicity reached the highest levels yet observed. Satellite imagery and pilot reports showed ongoing lava fountaining from two vents near the summit. Pilot reports indicated that diffuse ash layers reached 7,300-m altitude and extended perhaps as far as 50 km SE.
Information Contacts: Alaska Volcano Observatory (AVO), a cooperative program of a) U.S. Geological Survey, 4200 University Drive, Anchorage, AK 99508-4667, USA (URL: http://www.avo.alaska.edu/), b) Geophysical Institute, University of Alaska, PO Box 757320, Fairbanks, AK 99775-7320, USA, and c) Alaska Division of Geological & Geophysical Surveys, 794 University Ave., Suite 200, Fairbanks, AK 99709, USA.
Eruptions that began on 15 September persist during November
The current episode of eruptive activity, which began on 15 September (BGVN 21:08-21:09), persisted during 15 October-29 November. Seismicity, satellite imagery, and visual observations indicated ongoing lava fountaining from two vents near the summit. Two lava flows advanced down the flanks of the volcano. Intermittent bursts of lava to heights of <300 m above the crater continued. These bursts formed diffuse ash layers that pilots reported to be typically below an altitude of 6,100 m.
From 2200 on 18 October intense seismicity was recorded, but it ceased the next morning (19 October). This increased seismic activity indicated that the eruption strengthened considerably. On 22 October, seismicity showed a short-lived burst at about 1300, and at 1330 pilots reported an ash plume rising to an altitude of 7,600 m. At 1450 satellite observations showed a narrow ash cloud 90 km long drifting NE up the peninsula. During 26 October-1 November, intermittent narrow plumes, extending up to several hundred kilometers downwind, were visible on satellite images. Light ashfall was observed at Nelson Lagoon on the morning of 28 October.
On 4 November, seismicity significantly increased at 0800 and declined several hours later. This seismic increase was followed by an increase in eruptive activity. Satellite imagery showed a plume extending 250 km to the NE. Pilots reported the cloud top at 5,800-m altitude. During 9-15 November, diffuse ash layers occasionally reached altitudes of 7,000-7,300 m. Observers in Sand Point, Nelson Lagoon, and Cold Bay reported a steam-and-ash plume, rising from low on the N flank, to altitudes as high as the plume issuing from the summit vents. Although the source of the plume was not directly observed, the presence of ash suggested the possibility of a new vent low on the N flank. Two half-hour periods of intense seismicity, beginning at 1130 on 22 November and at 0430 on 23 November, resulted in steam-and-ash emissions. The plumes reached altitudes of 9,100 m and extended downwind. A small ash plume from the 23 November event was detected moving several hundred kilometers to the NW. However, no ashfall was reported from local communities.
Information Contacts: Alaska Volcano Observatory (AVO), a cooperative program of a) U.S. Geological Survey, 4200 University Drive, Anchorage, AK 99508-4667, USA (URL: http://www.avo.alaska.edu/), b) Geophysical Institute, University of Alaska, PO Box 757320, Fairbanks, AK 99775-7320, USA, and c) Alaska Division of Geological & Geophysical Surveys, 794 University Ave., Suite 200, Fairbanks, AK 99709, USA.
Intermittent eruptions from 15 September through [3] January
The current episode of eruptive activity, which began on 15 September (BGVN 21:08-21:10), persisted [through 3 January]. On 2 December, infrared video taken by the Alaska State Troopers confirmed that the E summit vent was more active than the W vent. The source of intense steaming low on the N flank, which had been intermittently visible to aerial and ground observers for several weeks, was not a new flank vent, but simply a site where lava was in contact with ice or meltwater. Meltwater channels extended down to the low pass between Pavlof and Pavlof Sister, then to the NW into the Cathedral River drainage. On the early morning of 4 December, seismic activity abruptly declined to about background, the lowest level after the onset of the eruption. The substantial decrease in seismicity implied that eruptive activity probably abated.
After a few days of quiescence, seismicity sharply increased on 10 December, accompanying intense long eruption pulses. Steam plumes reached an altitude of 8,500 m, and ash plumes rose to 7,700 m. On 11 December, pilots reported a steam plume at 8,700 m altitude and an ash cloud at 5,200 m. Satellite imagery indicated that a thick 20-km-wide plume extended as far as 160 km SE and a thinner, more diffuse part of the plume then turned E, extending 105 km. Seismicity declined on 12 December. However, lava fountaining from the summit vents and intermittent bursts of steam and ash to below 6,100 m continued; two lava flows were still active on the N flank. Seismicity decreased to about background levels on the evening of 13 December, but observers in Cold Bay, 60 km SW, reported lava fountaining prior to the seismic decrease. There was no steam or ash visible on the morning of 15 December.
Seismic activity began to build again around midnight on 25 December. In the early morning of 27 December seismicity quickly and steadily increased, reaching the highest level to date in this eruption episode. Early morning satellite images and pilot observations showed a summit hot spot, an active lava flow, and an ash plume extending tens of kilometers downwind (NW). That afternoon observers reported discontinuous bursts of ash and steam rising several hundred meters above the summit. Ground observers in Nelson Lagoon, 80 km NE, reported vigorous fire fountaining and a lava flow visible at night. On 28 December, visual reports in the afternoon from pilots and ground observers in Cold Bay indicated plumes reaching altitudes of 3,700-4,900 m and extending for up to 32 km WNW.
Seismicity started to decline in the afternoon, and the volcano was quiet during the night. On the morning of 29 December, pilots and ground observers in Cold Bay reported no eruptive activity. On 2 January, a pilot report indicated steam and ash drifting S from the summit. On the morning of 3 January, an observer in Cold Bay spotted a small burst of ash rising just above the summit. The eruptive pause continued during the week of 11-17 January with very low levels of seismicity.
Information Contacts: Alaska Volcano Observatory (AVO), a cooperative program of a) U.S. Geological Survey, 4200 University Drive, Anchorage, AK 99508-4667, USA (URL: http://www.avo.alaska.edu/), b) Geophysical Institute, University of Alaska, PO Box 757320, Fairbanks, AK 99775-7320, USA, and c) Alaska Division of Geological & Geophysical Surveys, 794 University Ave., Suite 200, Fairbanks, AK 99709, USA.
Pause in eruptive activity, but continued small intermittent steam plumes
The latest eruption began on 15 September and continued intermittently through 3 January, when a small ash burst was observed just above the summit (BGVN 21:08-21:12). On the morning of 24 January a pilot reported weak emission of steam and possibly minor ash rising to ~4.2 km altitude, mixing with a cloud layer, and drifting SE. Very low levels of seismicity were recorded from early January through late February.
A ground observer who glimpsed the volcano on 4 February reported that the summit vent area, which had been snow-covered the previous week, was now bare. On 6 February the same observer saw a small steam plume rising from the vent area to the level of the summit. U.S. National Weather Service observers in Cold Bay (60 km SW) reported another small steam plume up to 300 m above the summit vents during 15-16 February. A similar steam plume to 600-900 m above the vents was reported by pilots on 19 February.
Information Contacts: Alaska Volcano Observatory (AVO), a cooperative program of a) U.S. Geological Survey, 4200 University Drive, Anchorage, AK 99508-4667, USA (URL: http://www.avo.alaska.edu/), b) Geophysical Institute, University of Alaska, PO Box 757320, Fairbanks, AK 99775-7320, USA, and c) Alaska Division of Geological & Geophysical Surveys, 794 University Ave., Suite 200, Fairbanks, AK 99709, USA.
Steam plume in June; ash covering ice near summit seen in July
The latest eruption began on 15 September 1996 and continued intermittently through 3 January 1997, when a small ash burst rose just above the summit (BGVN 21:08-21:12). On the morning of 24 January a pilot reported steam and possibly minor ash emissions. A ground observer reported on 4 February that the summit vent area, which had been snow-covered the previous week, was bare. Small steam plumes, varying in height up to 900 m above the summit, were reported on 6, 15-16, and 19 February (BGVN 22:01).
Observers in Cold Bay (60 km SW) reported snow-free conditions at the summit during 8-21 March. Satellite images at the time did not show any thermal anomalies. By 4 April seismicity had returned to a near-background level, after fourteen weeks of eruptive quiescence, and the alert status was lowered from Yellow to Green. A slight increase in the level of seismicity began on 1 June and continued through the 6th. On the afternoon of 2 June U.S. National Weather Service observers in Cold Bay saw a steam plume rising and increasing in vigor to 900 m above the summit. This event prompted an increase in the alert status to Code Yellow. Satellite images recorded a moderate thermal anomaly on 3 June. Seismic activity declined during 7-13 June. Although fluctuations continued, the level was near background, so on 13 June the status returned to Code Green. Clouds obscured the volcano during 4-13 June.
During fieldwork on 8 July, Alaska Volcano Observatory (AVO) scientists had a clear aerial view of the volcano. They circled the volcano in an upward spiral, observing that most of the glacial ice was still intact. At a distance, the Pavlof cone appeared black, which had led to the belief that the glacial ice had been melted by volcanic heat. Closer inspection showed that the dark coloring was due to ash covering the snow; bright blue glacial ice could be seen in crevasses. The adjacent peak of Pavlof Sister showed an ash concentration gradient; higher concentrations made it appear darker towards its base. The only parts where the ice seemed to be missing corresponded to a rust-red region where lava had recently flowed. Approaching the summit of Pavlof, the scientists observed sulfur deposits within and around the perimeter of the jagged crater walls. The crater was filled in with debris and tephra; only remnant steam remained around the crater, and no active degassing could be seen around the buried vent.
Information Contacts: Alaska Volcano Observatory (AVO), a cooperative program of a) U.S. Geological Survey, 4200 University Drive, Anchorage, AK 99508-4667, USA (URL: http://www.avo.alaska.edu/), b) Geophysical Institute, University of Alaska, PO Box 757320, Fairbanks, AK 99775-7320, USA, and c) Alaska Division of Geological & Geophysical Surveys, 794 University Ave., Suite 200, Fairbanks, AK 99709, USA.
Thermal and seismic data presage August 2007 eruption
The Alaska Volcano Observatory (AVO) reported that Pavlof (figure 1) erupted on 15 August 2007 for the first time since 15 September 1996 (BGVN 22:09 and Waythomas, Miller, and Mangan, 2006) . Thermal anomalies and seismic activity just prior to the eruption prompted scientists at AVO to issue a warning. This report covers events reported through 3 October 2007.
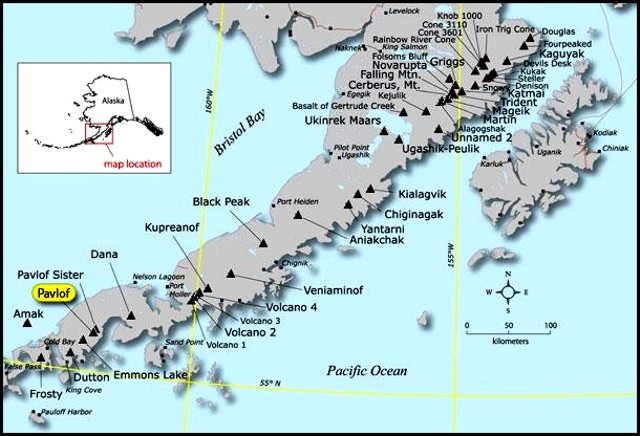 |
Figure 1. Index map showing the location of Pavlof and other Alaska Peninsula volcanoes. Courtesy of AVO and Alaska Division of Geological & Geophysical Surveys. |
According to AVO, an abrupt increase in earthquake activity began at Pavlof early on the morning of 14 August 2007. Based on patterns of unrest leading to past eruptions at Pavlof, AVO elevated the alert level and color code to 'Advisory/Yellow.' Observers from the National Oceanic and Atmospheric Administration's (NOAA) National Weather Service (NWS) in Cold Bay, Alaska, were able to see the volcano on the morning of 14 August and reported no anomalous steaming or other activity; satellite imagery from this morning also showed no obvious signs of surface activity or ash emission.
[AVO detected a strong thermal anomaly at the volcano overnight 14-15 September, and seismic activity continued to increase in both the number of events per hour and duration of individual events. Eyewitnesses aboard a ship reported incandescent blocks tumbling down the ESE flank of the volcano beginning at midnight 14 September (the night of 14-15 September). Satellite data confirmed the presence of lava. Pilot reports indicated that a weak ash plume extended 8 km SW of the summit at a height of ~ 2.6 km. Seismic activity continued at a high level. On 15 August AVO raised the aviation color code from Yellow to Orange and the Alert Level from Advisory to Watch.]
Earthquake intensity continued to increase slowly from 15 to 16 August. Strong signals at a single station SE of the summit suggested local flow activity, probably lahars (or mudflows) on that flank. Satellite images of the volcano overnight and during the morning of 16 August continued to show a strong thermal feature (figure 2). Residents of both Cold Bay and Sand Point, Alaska (105 km and 70 km, respectively, from Pavlof), observed incandescence at the summit during the night.
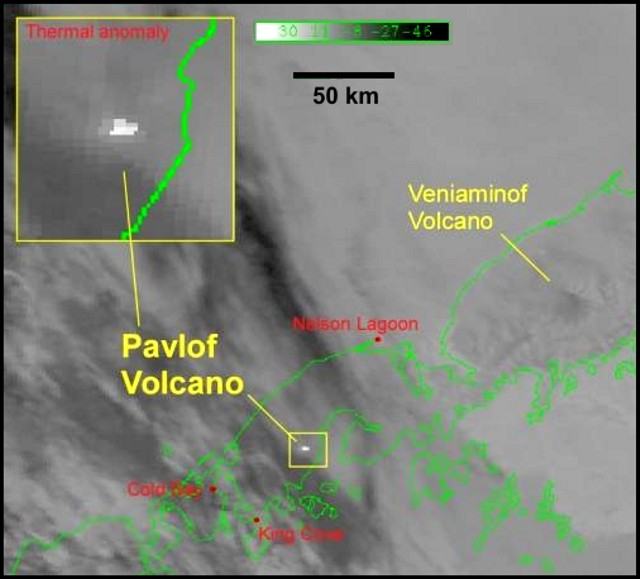 |
Figure 2. NOAA Advanced Very High Resolution Radiometer (AVHRR) satellite image showing a strong thermal anomaly at the summit of Pavlof on 16 August 2007 at 0750 local time (1550 UTC). In this image, white represents hot temperatures. Courtesy of the AVO/U.S. Geological Survey (USGS). |
Persistent earthquake activity and flow events, probably lahars (mudflows), continued on 17 August 2007. Several discrete explosion earthquakes were also recorded. Though clouds obscured the volcano in most satellite images, one GOES (Geostationary Observational Environmental Satellite) image documented a large thermal feature at the summit, interpreted to be lava at the surface.
Activity at Pavlof continued to increase during 17-24 August 2007, with reports that the steam-and-ash plume sometimes exceeded 3 km altitude. For example, a pilot reported the top of the plume to be 5.5 km in the late afternoon of 23 August, and a plume height of 4 km was estimated using satellite data from 1410 that day. Seismic activity remained elevated, with moderate levels of tremor occurring almost continuously and with occasional bursts of higher amplitude. The average seismic amplitude increased slowly throughout the week of 17-24 August. Many small-to-moderate explosions were recorded in the seismic record, as were events from lahars flowing down the SE flank. [Note: Pilot Jeff Linscott of JL Aviation filmed a lahar front on Pavlof's lower flanks before it hit the ocean on 18 August 2007; the film is available on the AVO website, which is listed in under Information Contacts below.] Satellite data showed strong thermal anomalies at the summit, as well as occasional ash clouds, throughout this week.
An AVO field crew visited Pavlof on 18-19 August to make FLIR (forward looking infrared) thermal observations of the ongoing eruption. These observations confirmed the existence of a new vent ~ 200 m below the summit on the SE flank. The vent, ~ 50 m across, fed a lava flow that, on 18 August, was more than 0.5 km long and ~ 25 m across. The crew also observed a lahar reaching the Pacific coast, incandescent lava, and explosions at the vent that sent 5-m-long blocks flying 50 m through the air. Figure 3 shows the plume from Pavlof on 23 August, and figure 4 shows the plume on 30 August 2007.
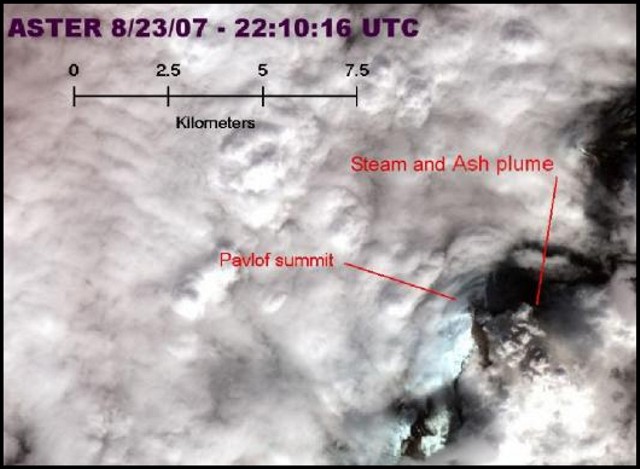 |
Figure 3. An Advanced Spaceborne Thermal Emission and Reflection Radiometer (ASTER) satellite image on 23 August 2007 at 2210 UTC showing Pavlof with a small steam-and-ash plume emitting from the crater on the SE side of the summit. The plume in this image (having a resolution of 15 m/pixel) reached an altitude of ~ 4.0 km based on the plume's temperature. Courtesy of the AVO/USGS. |
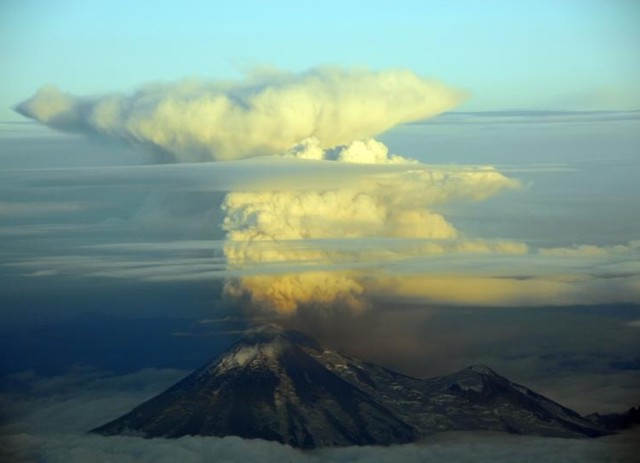 |
Figure 4. Pavlof volcano and eruption plume on evening of 30 August at 2120 local time. View is to the S, out of the right side of a PenAir Metro Airline plane en route to Anchorage from Cold Bay; plume height was approximately 5.2-5.5 km. Courtesy of Chris Waythomas and AVO/USGS. |
At about 2130 local time on 31 August, NOAA/NWS observers in Cold Bay reported a substantial plume emanating from Pavlof, along with associated lightning. The plume, which rose to an altitude of ~ 6 km, was also visible in images from the Pavlof web camera located in Cold Bay. However, there were no indications in satellite data or ground reports of an ash plume. Seismic activity remained elevated through 31 August.
During 1-19 September 2007 the eruption continued; however, seismicity after 10 September declined markedly from levels recorded earlier. AVO pointed out that typical eruptions at Pavlof were characterized by periods of diminished activity interspersed with periods of renewed eruptive activity. Satellite observations continued to show thermal anomalies even through the clouds, as well as steam plumes up to as high as 6.1 km altitude. Table 6 shows thermal anomalies from the beginning of 2007 through 3 October measured by MODIS satellite infrared detectors and processed by the Hawai'i Institute of Geophysics and Planetology (HIGP) Thermal Alerts System called MODVOLC. Anomalies measured during 2007 began on 15 August and continued through 11 September, after which none have been reported to present (3 October). Satellite thermal anomalies are frequently masked by cloud cover.
Table 6. MODIS/MODVOLC thermal anomalies measured at Pavlof for 15 August-11 September 2007; no anomalies were during 1 January-14 August or 12 September through 3 October. Courtesy of the HIGP Thermal Alerts System.
| Date | Time (UTC) | Number of Pixels | Satellite |
| 15 Aug 2007 | 0750 | 2 | Terra |
| 15 Aug 2007 | 1330 | 2 | Aqua |
| 16 Aug 2007 | 0839 | 3 | Terra |
| 16 Aug 2007 | 1235 | 1 | Aqua |
| 18 Aug 2007 | 2150 | 1 | Terra |
| 19 Aug 2007 | 0725 | 1 | Terra |
| 19 Aug 2007 | 1350 | 2 | Aqua |
| 20 Aug 2007 | 0810 | 2 | Terra |
| 20 Aug 2007 | 1210 | 3 | Aqua |
| 20 Aug 2007 | 1350 | 1 | Aqua |
| 23 Aug 2007 | 2210 | 1 | Terra |
| 23 Aug 2007 | 2220 | 1 | Aqua |
| 24 Aug 2007 | 0745 | 7 | Terra |
| 24 Aug 2007 | 1325 | 5 | Aqua |
| 25 Aug 2007 | 1230 | 7 | Aqua |
| 28 Aug 2007 | 1300 | 4 | Aqua |
| 29 Aug 2007 | 0800 | 4 | Terra |
| 30 Aug 2007 | 0705 | 2 | Terra |
| 30 Aug 2007 | 0845 | 4 | Terra |
| 30 Aug 2007 | 1250 | 3 | Aqua |
| 31 Aug 2007 | 0750 | 3 | Terra |
| 31 Aug 2007 | 1155 | 2 | Aqua |
| 31 Aug 2007 | 1330 | 3 | Aqua |
| 01 Sep 2007 | 0830 | 3 | Terra |
| 01 Sep 2007 | 1235 | 1 | Aqua |
| 02 Sep 2007 | 0735 | 1 | Terra |
| 02 Sep 2007 | 0915 | 4 | Terra |
| 02 Sep 2007 | 1320 | 4 | Aqua |
| 04 Sep 2007 | 2230 | 2 | Terra |
| 05 Sep 2007 | 1210 | 4 | Aqua |
| 05 Sep 2007 | 2135 | 2 | Terra |
| 06 Sep 2007 | 0715 | 1 or 2 | Terra |
| 06 Sep 2007 | 0850 | 8 | Terra |
| 06 Sep 2007 | 1255 | 5 | Aqua |
| 07 Sep 2007 | 0755 | 4 | Terra |
| 07 Sep 2007 | 1200 | 6 | Aqua |
| 07 Sep 2007 | 1335 | 4 | Aqua |
| 08 Sep 2007 | 0840 | 1 | Terra |
| 09 Sep 2007 | 0745 | 2 | Terra |
| 09 Sep 2007 | 2115 | 1 | Terra |
| 09 Sep 2007 | 2250 | 1 | Terra |
| 09 Sep 2007 | 2300 | 2 | Aqua |
| 10 Sep 2007 | 0825 | 8 | Terra |
| 10 Sep 2007 | 1230 | 2 | Aqua |
| 11 Sep 2007 | 0910 | 2 | Terra |
| 11 Sep 2007 | 1315 | 2 | Aqua |
| 11 Sep 2007 | 2100 | 2 | Terra |
A status report on 3 October 2007 stated that "A pause in eruptive activity at Pavlof continues. Seismicity remains at low levels and has been relatively unchanged since about September 13. No sign of renewed volcanic activity was noted in clear satellite and web camera views today." [By 5 October the alert levels were returned to Green and Normal for aviation after more than three weeks without eruptive activity; the eruption was determined to have ended on 13 September 2007.]
References. Waythomas, C.F., Miller, T.P., and Mangan, M.T., 2006, Preliminary Volcano Hazard Assessment for the Emmons Lake Volcanic Center, Alaska: Anchorage, Alaska, U.S. Geological Survey, Scientific Investigations Report 2006-5248, 33 p., 1 sheet (available online at http://www.avo.alaska.edu/pdfs/SIR2006-5248.pdf ).
Linscott, J., 2007, Film of Pavlof lahar front, 18 August 2007 [on AVO website, URL: http://www.avo.alaska.edu/volcanoes/volcimage.php?volcname=Pavlof ).
Information Contacts: Alaska Volcano Observatory (AVO), a cooperative program of the U.S. Geological Survey, 4200 University Drive, Anchorage, AK 99508-4667, USA; Geophysical Institute, University of Alaska, PO Box 757320, Fairbanks, AK 99775-7320, USA; and Alaska Division of Geological & Geophysical Surveys, 794 University Ave., Suite 200, Fairbanks, AK 99709, USA (URL: http://www.avo.alaska.edu/); Hawai'i Institute of Geophysics and Planetology (HIGP) Thermal Alerts System, School of Ocean and Earth Science and Technology (SOEST), Univ. of Hawai'i, 2525 Correa Road, Honolulu, HI 96822, USA (URL: http://modis.higp.hawaii.edu/); Jeff Linscott, JL Aviation Helicopter Service, 8015 NE Airport Way, Portland, OR 97218 USA.
Eruption in May-June 2013 with lava flows and ash emissions to ~8.5 km a.s.l.
Pavlof, the most active volcano in the Aleutian arc, erupted on 13 May 2013. Before this, it had most recently erupted on 15 August 2007, following an 11-year period of quiescence. The eruption that began in May 2013 continued through June before slowly subsiding to background levels by 8 August. Pavlof generated several ash plumes during the six-week eruption that disrupted aviation, including an 8-km high plume on 24 June. As in past Pavlof eruptions, the recent eruptions fluctuated in intensity. This report briefly discusses earthquake data during 2007-2011 and, in greater detail, the series of eruptions during May and June 2013.
According to Mangan and others (2009), Pavlof has discharged more than 40 recorded eruptions within the previous 200 years, producing mostly basaltic andesite to andesite products. That work, discussed in a separate subsection near the end of this report, also discusses the adjacent 12x19 km Emmons Lake caldera (a chain of nested calderas) on Pavlof's SW flank (figure 5). The Emmons Lake Volcanic Center (ELCV) is used to collectively describe the entire complex, including the nested caldera, intra-caldera stratovolcanoes, and the adjacent stratovolcanoes (including Pavlof) to the NE.
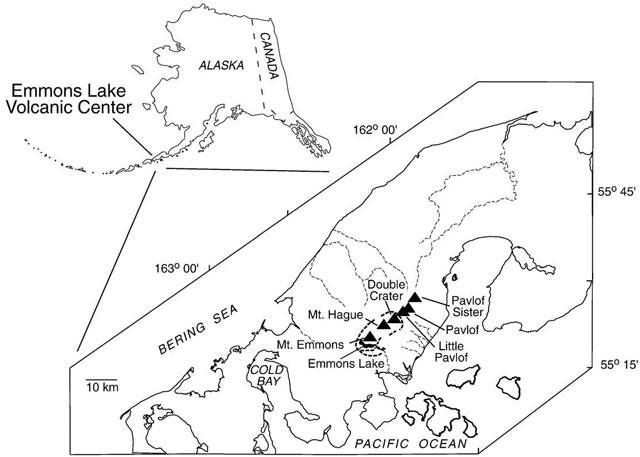 |
Figure 5. Maps showing both the location of Pavlof on the lower Alaska Peninsula (upper left) and showing more details of the complex, including the elongate Emmons Lake caldera and six stratovolcanoes. The lake occupies but a small volume of the caldera, which is breached to the SE. Taken from Mangan and others (2009). |
According to the Alaska Volcano Observatory (AVO), 48 earthquakes were located beneath Pavlof in 2007, the year of the previous eruption. During the following non-eruptive years, AVO reported 9 earthquakes centered at Pavlof in 2008, 7 earthquakes in 2009, 19 in 2010, and 13 in 2011. As of this writing, AVO has not yet published 2012 earthquake data.
Eruption in May 2013. On 13 May 2013, seismicity increased at 0800 and an intense thermal anomaly was observed at the summit in satellite imagery. Several spikes in seismicity occurred between 0900 and 1000. AVO noted that similar patterns of seismicity and elevated surface temperatures in previous cases had signaled the onset of eruptive activity at Pavlof. The Volcanic Alert Level was increased to Watch (the second highest category of four) and the Aviation Color Code was increased to Orange (the second highest category of four).
On 14 May 2013, pilot reports and satellite images indicated a spatter-fed lava flow that had advanced about 0.5 km down the N flank. The advancing lava had also generated debris-laden deposits, presumably from the interaction of hot lava with snow and ice on the flank. According to AVO, a diffuse ash plume drifted about 160 km NE at an altitude of 4.6 km before dissipating. Minor ashfall was reported the evening of 14 May in a mining camp 80 km NE of the volcano. No other nearby communities reported ashfall. Minor steam-and-ash emissions from the summit were visible from Cold Bay (~58 km SW).
During 14-15 May 2013, elevated seismicity persisted. Steam-and-ash clouds observed with a web camera at Cold Bay (55 km W of the volcano) occasionally rose to an altitude of 6.1 km. Residents in Cold Bay observed incandescence from the summit during the night. On 15 May a pilot reported a dark ash cloud drifting ENE at an altitude of 6.1 km.
On 16 May, AVO observed lava fountaining at the summit and a continuous ash, steam, and gas cloud extending 50-100 km downwind at an altitude of about 6.1 km. Satellite images showed persistent elevated surface temperatures at the summit and on the NW flank, consistent with lava fountaining at the summit and the resulting lava flow.
During 18-19 May 2013, reports noted that a narrow plume of steam, ash, and gas occasionally rising up to an altitude of 6.7 km and drifting SE was visible in satellite and pilot images (figures 6 and 7). Pilots noted that lava fountaining and ash emission continued. Overnight, trace amounts of ash fell on the community of Sand Point (88 km E). During the afternoon on 19 May, pilots reported that ash plumes rose to altitudes of 4.6-6.7 km. Trace amounts of ash fell in Nelson Lagoon (78 km NNE) during 19-20 May.
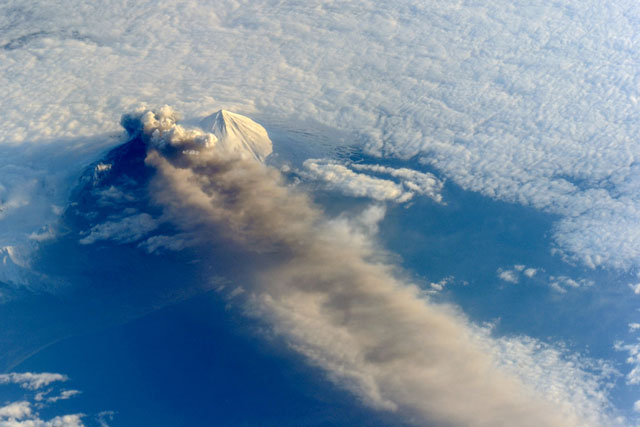 |
Figure 6. Photograph of Pavlof taken on 18 May 2013 by astronauts aboard the International Space Station. The space station was ~770 km away and S-SE of the volcano when the photograph was taken. The volcanic plume extended SE over the North Pacific Ocean. Residing next to Pavlof is the white, seemingly ash free stratovolcano Pavlof Sister. Courtesy of NASA Earth Observatory with credit for caption and processing to Robert Simmon, (NASA Earth Observatory) and G. M. Gentry (DB Consulting Group at NASA-JSC). |
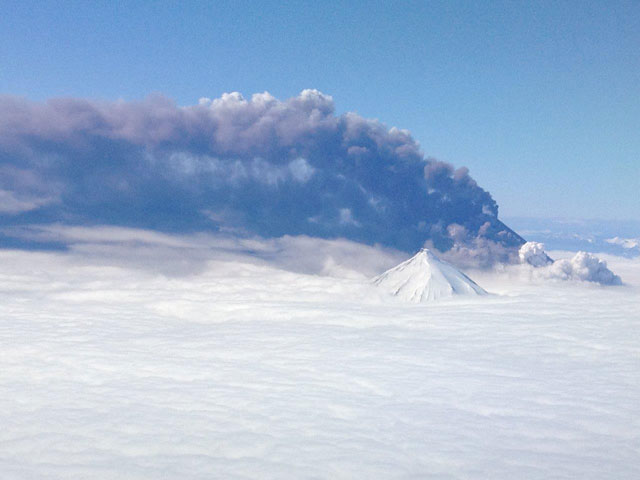 |
Figure 7. Photo of Pavlof eruption taken by a commercial pilot on 18 May 2013. Plume direction was not identified, but based on the NASA photo taken the same day (figure 6), the plume is drifting SE and the volcano in the foreground is Pavlof Sister (NE of Pavlof). Courtesy of Brandon Wilson (PenAir) and provided by AVO/Alaska Division of Geological & Geophysical Surveys. |
News articles (Associated Press, PRNewswire, Alaska Dispatch) stated that during 19-21 May 2013 two regional airlines canceled flights to several remote communities and delayed or re-routed other flights. On 21 May AVO reported that a low-level plume of steam, gas, and ash occasionally rose to an altitude of 6.1 km and drifted NNE. Trace amounts of ash again fell in Nelson Lagoon.
AVO reported that seismic tremor markedly declined around 1100 on 21 May 2013 and was followed through 23 May by the detection of small discrete events, likely indicative of small explosions, by an infrasonic pressure sensor (Chaparral model 2.5 at site PN7). Although cloud cover prevented satellite observations, elevated surface temperatures at the vent were detected. On 22 May a pilot report and photographs indicated weak steam-and-gas emissions containing little to no ash.
The eruption continued at a lower level during 24-26 May. Neither evidence of elevated surface temperatures nor a plume were observed in partly clear satellite images during 24-25 and 27 May. Clouds obscured views on 26 May. The Volcanic Alert Level was lowered to Advisory and the Aviation Color Code was lowered to Yellow on 28 May.
According to AVO, Pavlof emitted ash on 4 June at about 1100, as observed in satellite images and by pilots. Satellite images showed an ash cloud drifting SE, and pilots estimated that the cloud was at an altitude of 5.8 km. Weak seismicity that began at 1057 accompanied the emissions, and then continued. AVO increased the Volcanic Alert Level to Watch and increased the Aviation Color Code to Orange.
AVO reported that ash emissions continued during 5-11 June 2013, accompanied by tremor and explosion signals. Overnight during 4-8 June, satellite images detected elevated surface temperatures near the vent consistent with lava effusion and fountaining. Elevated surface temperatures persisted until 14 June. On 5 and 6 June, an ash plume drifted 40-45 km W and SW at altitudes of 4.3-5.5 km based on pilot estimates. During 8-10 June, an ash plume drifted 20-53 km SE. During 12-14 June, ash emissions were intermittent and minor; ash plumes remained below an altitude of 6.1 km and mostly drifted SE.
During 14-15 June 2013, seismicity decreased. Minor emissions probably ceased, but web-camera views were partially obscured by clouds. On 17 June no plumes were visible in satellite images, and web camera views showed mostly cloudy conditions.
During 17-18 June, tremor amplitude increased slightly, and elevated surface temperatures were again detected in satellite images. A small ash plume rose from the crater. The eruption continued during 19-25 June, with tremor and occasional explosions. Cloud cover prevented web camera views. Elevated surface temperatures continued to be detected during 19-20 and 24 June. A small ash plume from the summit vent was also detected in a satellite image on 19 June, and possibly during 20-22 June.
On 24 June, seismicity increased to the strongest level to date during 2013 and included continuous intense tremor and frequent small explosions likely associated with lava fountaining and ash production. Seismicity remained high on 25 June. Satellite images and pilot observations indicated that a plume drifted W at altitudes as high as 8.2-8.5 km. Satellite images also detected a strong thermal anomaly at the summit. Trace amounts of ash fell in King Cove (48 km SW). According to a news report (Reuters), regional air traffic was again cancelled or re-routed.
According to AVO, seismicity declined during 25-26 June and consisted of intermittent bursts of tremor and occasional small explosions. Satellite images showed a plume containing small amounts of ash drifting NW, and strong thermal anomalies at the summit. Pilot reports on 26 June indicated that plumes rose to altitudes between 6.1-7.6 km during the morning and then to heights just above the summit later that day. Seismicity during 26 June-1 July continued at low levels and consisted primarily of intervals of continuous, low-level tremor. Thermal anomalies at the summit detected in satellite images were strong during 26-29 June and weak during 30 June-1 July.
AVO reported that activity further declined during 1-2 July; tremor and explosions were no longer detected in seismic and pressure sensor data. Satellite images did not detect elevated surface temperatures, volcanic gas, or ash emissions, and there were no visual observations from pilots or from webcam images of any eruptive activity since 26 June. Consequently, AVO lowered the Aviation Color Code to Yellow and the Volcano Alert Level to Advisory.
On 8 August, AVO reported that no lava or ash emissions had been observed at Pavlof since 26 June and the volcano had exhibited gradually declining levels of unrest. Seismicity was at background levels. Thus, AVO lowered the Aviation Color Code to Green and the Volcano Alert Level to Normal.
Mangan and others (2009) discussion. Mangan and others (2009) cite Power and others (2004) as stating that background (non-eruptive) seismicity at Pavlof occurs as infrequent long-period earthquakes at focal depths between 20-40 km. Mangan and others contend that while only a few of these events at most occur annually, they are a stable feature attributed to quasi-steady fluxing of basaltic magma and exsolved CO2 in a deep dike and sill complex. According to the article, the seismic network at Pavlof is poorly situated to detect deep seismicity under the Emmons Lake caldera.
Mangan and others state, "All witnessed [Emmons Lake Volcanic Center] ELVC eruptions have occurred outside the caldera [,specifically] at Pavlof, the most active volcano in the entire arc. Pavlof's slopes are extensively mantled with tephra and pyroclastic debris produced during [its] historical strombolian, vulcanian, and lava fountain events (Miller et al., 1998). Limited precursory seismicity herald Pavlof eruptions (McNutt, 1989) and, to the extent studied, negligible precursory ground deformation (Lu et al., 2003; Z. Lu personal communication 2008). Of the 20 eruptions occurring since the installation of Pavlof's seismic network (1973), 13 eruptions have occurred with less than 24 h of warning. Pavlof is essentially an "open vent" volcano with magma rising aseismically through a thermally well-groomed conduit. High-frequency volcano-tectonic earthquakes, characteristic of magma rise through brittle crust, are virtually absent."
Figure 8 presents Mangan and others (2009) conceptualization of the plumbing beneath the ELVC, which includes Pavlof.
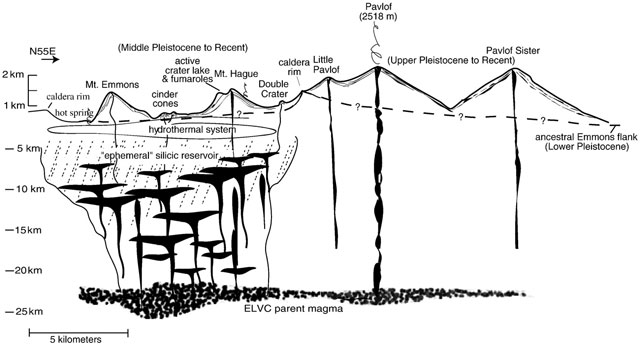 |
Figure 8. Conceptual cross-section through the Emmons Lake Volcanic Center looking at a vertical plane parallel to the volcanic axis. The drawing shows two distinct plumbing systems drawing from a common magmatic source at more than 20 km depth. Courtesy of Mangan and others (2009). |
The other volcano of the ELVC considered to have high likelihood of eruption is Mt. Hague (Waythomas and others, 2006). That study also presents a set of hazard maps for the complex.
References. Mangan, M., Miller, T., Waythomas, C., Trusdell, F., Calvert, A., and Layer, P., 2009, Diverse lavas from closely spaced volcanoes drawing from a common parent: Emmons Lake Volcanic Center, Eastern Aleutian Arc, Earth and Planetary Science Letters, Vol. 287, pp. 363-372.
Waythomas, CF; Miller, TP, and Mangan, MT, 2006, Preliminary Volcano Hazard Assessment for the Emmons Lake Volcanic Center, Alaska, U.S. Geological Survey Scientific Investigations Report 2006-5248 (URL: http://pubs.usgs.gov/sir/2006/5248/).
Information Contacts: Alaska Volcano Observatory (AVO), a cooperative program of a)U.S. Geological Survey, 4200 University Drive, Anchorage, AK 99508-4667 USA (URL: http://www.avo.alaska.edu/), b)Geophysical Institute, University of Alaska, PO Box 757320, Fairbanks, AK 99775-7320, USA, and c)Alaska Division of Geological & Geophysical Surveys, 794 University Ave., Suite 200, Fairbanks, AK 99709, USA (URL: http://www.dggs.alaska.gov/); Associated Press (URL: http://www.ap.org/); PRNewswire (URL: http://www.prnewswire.com); Alaska Dispatch (URL: http://www.alaskadispatch.com/); and Reuters (URL: http://www.reuters.com/).
Spatter-fed lava interacting with ice, spawning clastogenic lava flows, lahars, and pyroclastic flows
This report discusses Pavlof's behavior during May 2014 through 26 December 2014, a time period with two clear eruptive intervals that included lava fountaining, spatter, fragmental (agglutinate-rich, clastogenic) lava flows, lahars, pyroclastic flows, and diverse plumes. On 30 May 2014, an eruption began that continued intermittently through the first week of June. A thermal image taken from a satellite on 24 June 2014 showed warm areas ~5 km down the N flank interpreted as the signature of an earlier, still-warm lava flow. (This flow was perhaps similar to (fountain- and spatter-fed, fragmental, agglutinate-rich, clastogenic) lava flows and possible associated lahars seen during 2013; Waythomas and others, 2014; Wolf and Sumner, 2000.) Another eruption took placed during 12-16 November 2014. Besides the previously mentioned characteristics, common observations during eruptions included strombolian emissions, multiple-kilometer-long zones of incandescent lava, plumes ranging from those dominated by steam and gas to others that were rich in ash. Diagnostics from distant instruments included acoustical signals of eruption received with infrasonics and lightning from inferred ash plumes detected with a lightning detection array.
Background. In BGVN 38:05 we reported on the then most recent eruption at Pavlof, which occurred during May-June 2013. Waythomas and others (2014) summarized Pavlof's eruptive behavior during 2013. This is relevant, in part, because similar ice-spatter interactions also prevailed during 2014. "The 2013 eruption of Pavlof Volcano, Alaska began on13 May and ended 49 days later on 1 July. The eruption was characterized by persistent lava fountaining from a vent just north of the summit, intermittent strombolian explosions, and ash, gas, and aerosol plumes that reached as high as 8 km above sea level and on several occasions extended as much as 500 km downwind of the volcano. During the first several days of the eruption, accumulations of spatter near the vent periodically collapsed to form small pyroclastic avalanches that eroded and melted snow and ice to form lahars on the lower north flank of the volcano. Continued lava fountaining led to the production of clastogenic lava flows that extended to the base of the volcano, about 3–4 km beyond the vent. The generation of fountain-fed lava flows was a dominant process during the 2013 eruption; however, episodic collapse of spatter accumulations and formation of hot spatter-rich granular avalanches was a more efficient process for melting snow and ice and initiating lahars. The lahars and ash plumes generated during the eruption did not pose any serious hazards for the area. However, numerous local airline flights were cancelled or rerouted, and trace amounts of ash fall occurred at all of the local communities surrounding the volcano, including Cold Bay, Nelson Lagoon, Sand Point, and King Cove."
The reports by the AVO also announced Volcano Alert Levels and Aviation Color Codes. The four Alert Levels apply to conditions in vicinity to the volcano (of greatest concern to residents). The Levels consist of Normal, typical background or noneruptive state; Advisory, exhibiting signs of unrest or possible renewed increase; Watch, exhibiting escalating or heightened unrest; and Warning, hazardous eruption is eminent or underway. The respective Color Codes address risks to aircraft from ash plumes. The Codes consist, in increasing order of concern, Green, Yellow, Orange, and Red.
Pavlof is monitored by satellite imagery, observers, several in-situ and remote instruments, and by a Federal Aviation Administration (FAA) web camera. Figure 9 shows Pavlof as seen from the FAA web camera, which resides in Cold Bay. The photo shows conditions on a clear day when the volcano was quiet. The camera produces still images sometimes used to convey the volcano's behavior ('FAA supplementary weather products').
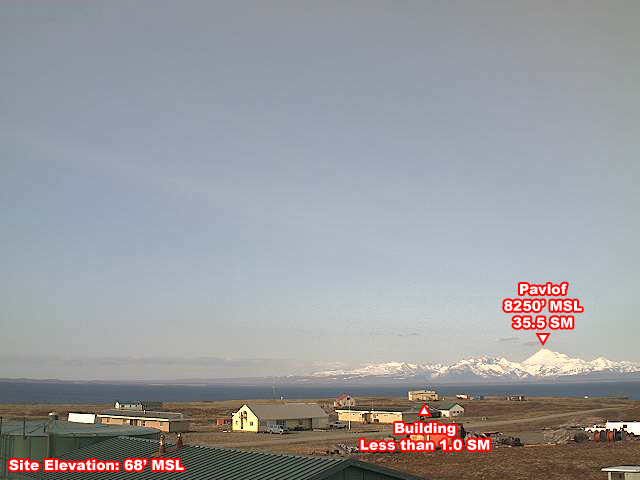 |
Figure 9. A NE view that features snow- and ice-clad Pavlof as seen from the FAA web camera in Cold Bay (Alaska) on a clear day, date unknown. MSL stands for elevation (in this case with respect to MSL, mean sea level, here expressed in feet, 1 foot = 0.305 m). SM stands for statue miles, used to describe the distance from the camera to a building and to Pavlof (~56 km away; 1 SM = 1.61 km). Courtesy of FAA (US Federal Aviation Administration). |
Eruption of 30 May to 4 June 2014. The AVO weekly report issued on 6 June 2014 summarized conditions during the 30 May-4 June eruption period as follows: "Pavlof Volcano is experiencing a typical Strombolian eruption, characterized by lava fountaining, minor explosions, and the accumulation of spatter on the upper north flank of the volcano. Accumulations of spatter have occasionally built up and collapsed, forming hot, ashy, particle-rich flows that generate high-rising steam plumes on the lower north flank of the volcano. As these flows interact with ice and snow on the volcano, they produce meltwater and steam plumes. Spatter-fed lava flows also are likely forming".
According to AVO's 6 June 2014 weekly summary, Pavlof began erupting on 30 May 2014. On the morning of 31 May 2014 elevated surface temperatures were detected at the summit of Pavlof, suggesting a low-level eruption with extruding lava. Campers near the volcano confirmed this detection, and noted lava flows originating from a vent on the NE flank. As those lava flows interacted with glacier ice, low-altitude ash clouds and plumes were created. The plumes were detected in satellite imagery, as well as by pilots and with the Cold Bay FAA web camera.
On the evening of 31 May 2014, small explosion signals were detected by a distant infrasound sensor. The eruption continued, followed by incandescence. The FAA web camera in Cold Bay detected weak incandescence glowing at the summit on the evenings of 31 May and 1 June. Clouds obscured views of the volcano by web camera although no ash clouds were detected in satellite imagery. Weak seismic activity was detected on the Pavlof network of seismometers near the volcano. An increase of seismic tremor occurred 2 June at 1500, decreasing around 2300 that evening (Alaska Standard Time = UTC - 9 hours; during May-June, Daylight Saving Time = UTC - 8 hours). The Aviation Color Code and Alert Levels on 31 May were Orange and Watch respectively.
On 2 June 2014, AVO reported a plume discharged almost continuously from the vent rising to an altitude of 6.7 km and extending over 75 km E, as seen in figure 10. The AVO daily report for this eruption stated "Hazardous conditions exist on the north flank and north side drainages heading on the volcano due to continued pyroclastic and lahar activity. Ash in the vicinity of the volcano remains a hazard to local air traffic" (figure 10).
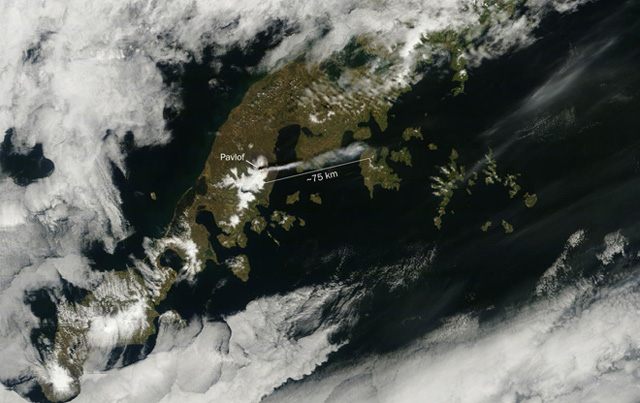 |
Figure 10. Visible image of a Pavlof plume acquired by the MODIS instrument on the Terra satellite on 2 June 2014 (2145 UTC 2 June, which corresponds to local Daylight Saving Time and date of 1345 on 2 June). The plume extended ~75 km E of Pavlof. Courtesy of NASA and AVO/USGS. |
The AVO photo archive for 2 June contained over 40 photos with captions. Some were taken from Cold Bay and others from at sea and aircraft, documenting eruptive activity that day. Chris Waythomas (AVO) noted incandescence associated with lava fountaining and low-level ash and steam plume on images caught by the FAA camera. Several photos by Rachael Kremer were captioned by AVO scientists. The caption of one image (ID #591161 written by Game McGimsey, AVO/USGS) not only described incandescence from lava fountaining at the summit vent, it also stated the presence of "spatter-fed lava flowing down the N flank." Further, "ash and steam clouds rising from lower on the north flank were likely generated by pyroclastic flows intermixing with glacier ice."
AVO daily reports issued on 2 and 3 June 2014 described a vigorous continuing eruption. Late on the 2nd, tremor increased again. During the night included observers noted intense lava fountaining and a spatter fed lava flow down the N flank. By the morning of the 3rd, and ash and steam plumes rose up to 7.3 km altitude. The AVO report issued at 1233 on the 3rd noted a wind shift and wind at the time of that report carrying the main plume SSW. Lower winds (below ~3 km altitude) carried a plume that may have contained trace ash to the WSW.
The AVO report issued at 1754 on the 3rd made these statements: "Although the eruption of Pavlof continues, seismic tremor has deceased over the past 12 hours and has remained relatively steady throughout the day at a much lower level than that of yesterday. Recent satellite data and web camera views of the eruption plume indicate that there are now two distinct parts of the plume. The part of the plume that reaches high above the volcano appears to be mainly steam and gas with minor ash present, extending south of the volcano. Additionally, pyroclastic flow activity on the north flank is producing diffuse ash emissions that result in areas of hazy air, with variable concentrations of ash below [~3 km]. Low-level winds are likely to disperse this ash to the west-southwest with no more than trace amounts accumulating. There are no reports of ash falling in nearby communities." The Aviation Color Code was reduced from Red to Orange and the Alert Level to Watch. Ash remained a hazard to local air traffic.
Similar conditions prevailed on 4 June, with plumes containing minor ash but rich in sulfur dioxide extending 30 to 100 km downwind over Cold Bay. Although incandescence was visible in early morning web cam images, seismicity had remained stable for the past 24 hours. Incandescence from lava fountaining was visible in webcam images on 4 June. According to a news article, flights in and out of Cold Bay and Unalaska were canceled on 4 June, affecting about 200 people. At 0205 and 0245 on 5 June 2014, seismic data indicated two distinct explosions. AVO inferred these represented the collapse of spatter built up around the vent, with a possible explosive component. A similar third, less energetic, event occurred at 0844. The explosions generated lightning, which was detected by the World Wide Lightning Location Network (WWLLN, a collaboration of over 50 universities) (Morton, 2014). AVO inferred that hot debris moved down the N flank, resulting in localized low-level clouds of fine ash. There was no ash above the meteorological clouds whose tops reached 8.8 km in height. As of 6 June 2014, elevated surface temperatures persisted but cited that on this morning they had observed greatly diminished ash and lava emissions. Steam or ash plumes were absent in satellite images since 4 June. A weekly summary issued on 6th noted plumes during the eruption that started on the evening of 30 May 2014 had reached about 9.1 km in altitude. Seismic data indicated lahars occurred intermittently.
Comparative quiet. During 7-23 June 2014, Pavlof was comparatively quiet. Although extreme temperatures associated with fountaining were not seen, a thermal image of Pavlof on 24 June 2014 suggested broad areas of warm temperatures from what AVO interpreted as a recent lava flow (figure 11). According to the scientist who prepared the image, David Schneider, "Composite satellite image of Pavlof Volcano showing the extent of the lava flows on the northeast flank. The base image was collected by the Worldview-2 satellite on May 9, 2014 (prior to the onset of eruptive activity) and is overlain (in color) with a Landsat-8 thermal infrared image collected early in the morning on June 24, 2014. The thermal infrared sensor measured the heat given off by the still-warm lava flow. The length of the longest branch of the lava flow is about 5 km (3 miles). Note that the lava flow appears to have traveled under the ice on the upper flank of the volcano."
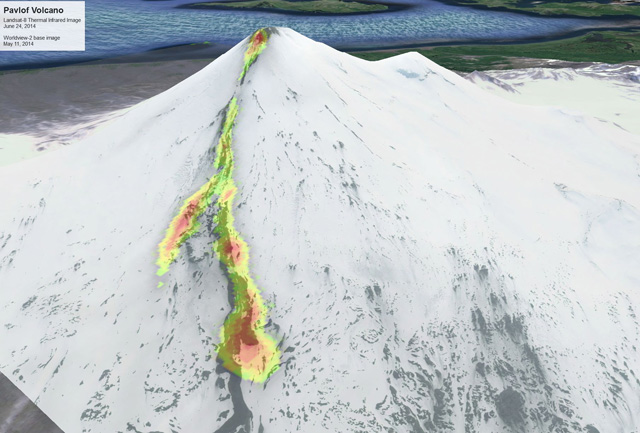 |
Figure 11. A thermal image from Landsat 8, with areas of increased infrared radiation, acquired in the early morning of 24 June 2014 showing the path of lava flows down the slopes. For scale, the longest arm of the flow was about 5 km. The lava flow traveled under the ice in an area of the upper flank. For more details, see text. Courtesy of AVO. Caption details and image preparation by D. Schneider (AVO/USGS). |
An AVO Notification issued on the 25th indicated that AVO had observed no evidence of ash emission from the volcano since early June. Clear web camera and satellite images of the volcano over the past several days showed no evidence of continued lava fountaining. The Aviation Color Code was reduced to Yellow and the Volcano Alert Level was reduced to Advisory. AVO further added that small discrete seismic events continued. They suggested that the signals may have been related to several processes including, (1) degassing of unerupted magma within the volcano's conduit and (2) periodic collapse of ejecta and other debris down the steep flanks of the volcano. The latter, appears consistent with the lava flow seen on figure 11.
On 30 July 2014 the Color Code was lowered to Green and the Volcano Alert Level to Normal. Since mid-June, levels of unrest had gradually declined. Rockfalls and small avalanches of debris still occurred sporadically on the NNW flank of volcano. The next eruptive event did not occur until 12 November.
Eruption of 12-16 November 2014. As previously mentioned, an eruption occurred during 12-16 November 2014. On 12 November 2014, AVO reported a ground observer in Cold Bay sighted ash emissions from Pavlof rising to an altitude of 2.7 km, signifying a new eruption. Minor ash emissions were visible in the Cold Bay web camera beginning around 1650 Alaska Standard Time (AKST) on 12 November. AVO raised the Aviation Color Code and Volcano Alert Level at 1957 on 12 November. Tremor remained elevated on the 12th, 13th, and 14th, with lava fountaining and ash emissions. On 14 November satellite imagery revealed a narrow ash plume extending ~200 km at 4.8 km altitude.
On 15 November 2014, AVO reported the eruption of had intensified. Thus, the Aviation Color Code was raised to Red and the Volcano Alert Level to Warning. Behavior was characterized by explosive eruptions, lava fountaining from a vent just N of the summit, and flows of rock debris and ash descending the N flank of the volcano. Ash emissions were observed from the ground and in satellite images. The intensity of seismic tremor had increased significantly, and satellite data indicated the ash cloud top at 7.6 km altitude extending 200 km NW from the vent. Figure 12 shows a Landsat 8 image captured on the 15th. The top of an ash plume in the image had reached an altitude of ~9 km. Another satellite image taken the same day showed ash plume above cloud cover and extending ~300 km NW from the volcano.
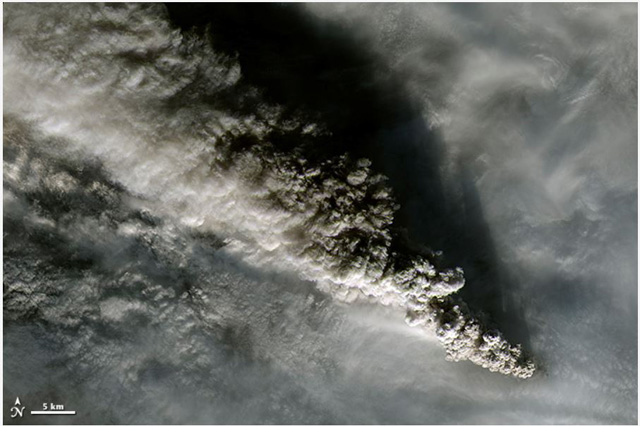 |
Figure 12. On 15 November 2015, Pavlof was lofting ash plumes to an altitude of 9 kilometers as shown in the natural-color image, acquired by the Operational Land Imager (OLI) on the Landsat 8 satellite. Pavlof's volcanic plume rises well above the cloud deck. NASA Earth Observatory image by Jesse Allen, using Landsat 8 data from the U.S. Geological Survey. Original image by David Schneider. |
Although as mentioned above, on 15 November 2014, the ash plume reached more than 9 km, tremor had abruptly decreased at about 1900 that day. This was accompanied by a large decrease in ash emissions, and the next day no evidence of an ash plume at the volcano was reported. On the 16th, the Aviation Color Code decreased to Orange and the Volcano Alert Level to Watch. During 17-18 November seismicity remained low; surface temperatures on the upper NW flank were elevated. The AVO weekly report issued on 21 November 2014 described the week's activity as still remaining low. Intermittent tremor was detected, and satellite images still showed lava flow on the volcano's NW flank. At that stage it reached ~7 km from the summit. On 25 November 2014, AVO further lowered the Aviation Color Code/Volcano Alert Level to Yellow/Advisory, citing continued low seismicity and lack of any observations to suggest ongoing lava fountaining or ash emission. According to the last AVO weekly report issued on 26 December 2014, the status of Pavlof remained unchanged. Seismicity at Pavlof continued slightly above background levels. Weather conditions continued to be cloudy during the week and no activity was observed in satellite or web camera views of the volcano.
References. Demas, A., (3 June) 2014, Volcano Warning Alert Issued for Alaska's Pavlof Volcano, U.S. Geological Survey [accessed August 2014] (URL: http://www.usgs.gov/blogs/features/usgs_top_story/volcano-warning-alert-issued-for-alaskas-pavlof-volcano/ ). [accessed August 2014]
Morton, M, (6 April) 2014, Volcanic Lightning Generated in a Bottle, Earth Magazine (URL: http://www.earthmagazine.org/article/volcanic-lightning-generated-bottle)
Schwaiger, H.F., Denlinger, R.P., and Mastin, L.G., April 2012, Ash3d: A finite-volume, conservative numerical model for ash transport and tephra deposition. Journal of Geophysical Research, v. 117, Issue B4, 20 p.[accessed August 2014] (URL: http://onlinelibrary.wiley.com/doi/10.1029/2011JB008968/pdf).
Schwartz, D., (11 August) 2013, Ash3D is Federal Answer to Ash Cloud Response, Peninsula Clarion [accessed August 2014] (URL: http://peninsulaclarion.com/news/2013-08-10).
Waythomas, C. F., Haney, M. M., Fee, D., Schneider, D. J., and Wech, A., 2014, The 2013 eruption of Pavlof Volcano, Alaska: a spatter eruption at an ice-and snow-clad volcano. Bulletin of Volcanology, 76(10), pp. 1-12.
Wolff, J. A., & Sumner, J. M. (2000). Lava fountains and their products. Encyclopedia of volcanoes, H Sigurdsson, B Houghton, S McNutt, H Rymer, J Stix (Eds.); pp. 321-329.
Information Contacts: Alaska Volcano Observatory (AVO), a cooperative program of a) U.S. Geological Survey, 4200 University Drive, Anchorage, AK 99508-4667 USA (URL: http://www.avo.alaska.edu/), b) Geophysical Institute, University of Alaska, PO Box 757320,Fairbanks, AK 99775-7320, USA, and c) Alaska Division of Geological & Geophysical Surveys,794 University Ave., Suite 200, Fairbanks, AK 99709, USA (URL: http://www.dggs.alaska.gov/); Christopher Waythomas, Game McGimsey, and Cheryl Cameron, AVO; Rachel Kremer (affiliation unknown); Federal Aviation Administration (FAA), 800 Independence Ave, SW, Washington, DC 20591, USA (URL: http://www.faa.gov/); and National Aeronautics and Space Administration (NASA) (URL: http://modis.gsfc.nasa.gov/).
Ash plume to 11 km on 27 March 2016 that drifted 1,200 km NE; multiple smaller ash events through July 2016
Pavlof volcano, near the end of the Alaska Peninsula 970 km SW of Anchorage, frequently produces explosive eruptions from the summit vents and occasional lava flows. The largest confirmed historical eruption took place in 1911 when a fissure opened on the N flank; it has erupted more than 25 times since then. The last reported eruption in mid-November 2014 included lava fountaining from a vent just N of the summit, and flows of rock debris and ash descending the N flank, along with an ash plume that rose to around 9 km altitude and drifted 300 km NW. Pavlof was quiet in 2015, but then abruptly renewed activity in late March 2016. It is monitored primarily by the Alaska Volcano Observatory (AVO) and the Anchorage Volcanic Ash Advisory Center (VAAC).
A sudden vigorous eruption that began on 27 March 2016 lasted for about 20 hours, sending ash to 11 km altitude, producing a plume dispersed NE for 1,200 km, and a similarly large SO2 plume. The volcano was then quiet until a short-lived, smaller ash emission occurred in mid-May for eight days. Intermittent low-level ctivity picked up again from late June through late July 2016, characterized by minor emissions of dark-colored ash and steam rising to 4.5 km altitude. Fallout of ash was limited to the flanks of the volcano and the immediate area around Pavlof. The last report of ash emissions was on 30 July, although low-amplitude tremors and steam plumes persisted through August, and intermittent thermal anomalies from the summit continued through the end of 2016.
After a short and intense eruption between 12 and 15 November 2014 (BGVN 40:04), activity decreased quickly to background levels. The AVO had reduced the Aviation Color Code (ACC) from Red (highest) to Orange on 16 November, and from Orange to Yellow on 25 November. Seismicity remained slightly above background levels until early January. On 15 January 2015 the AVO reduced the ACC to the lowest level of Green where it remained for over a year until it was changed abruptly to Red on 28 March 2016 at the start of a new eruption.
AVO reported that seismicity began to increase at 1553 on 27 March 2016, characterized by a quick onset of continuous tremor. An ash plume rose to an altitude of 6.1 km, and by 1618 was drifting N (figure 13). During the night, lava fountaining from the summit crater was observed by mariners, pilots, and residents of nearby Cold Bay (60 km SW).
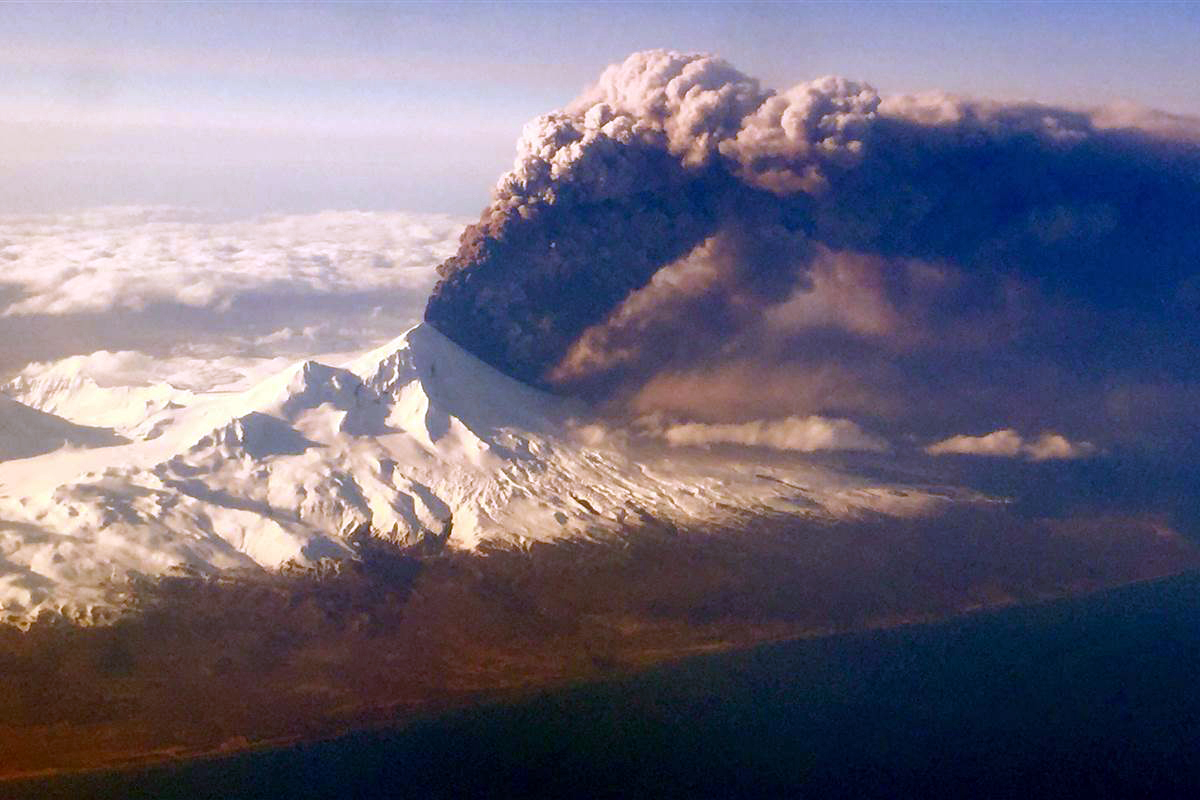 |
Figure 13. Pavlof erupts, sending a plume of volcanic ash into the air on the evening of 27 March 2016 (AKDT) as photographed by a passenger on a plane travelling to Anchorage from Dutch Harbor. Courtesy of Colt Snapp. |
On 28 March, tremor levels remained high; lightning in the ash plume was detected in the morning, and infrasound data from a sensor network in Dillingham (470 km NE) indicated sustained ash emissions. At 0700 a continuous ash plume was evident in satellite images drifting more than 650 km NE, and a MODIS image captured at midday revealed the extent and substantial thickness of the cloud (figure 14). A SIGMET (significant meteorological information notice) issued by the National Weather Service (NWS) Alaska Aviation Weather Unit indicated that the maximum ash-cloud altitude was approaching 11 km. Strongly elevated surface temperatures also suggested the presence of lava flows.
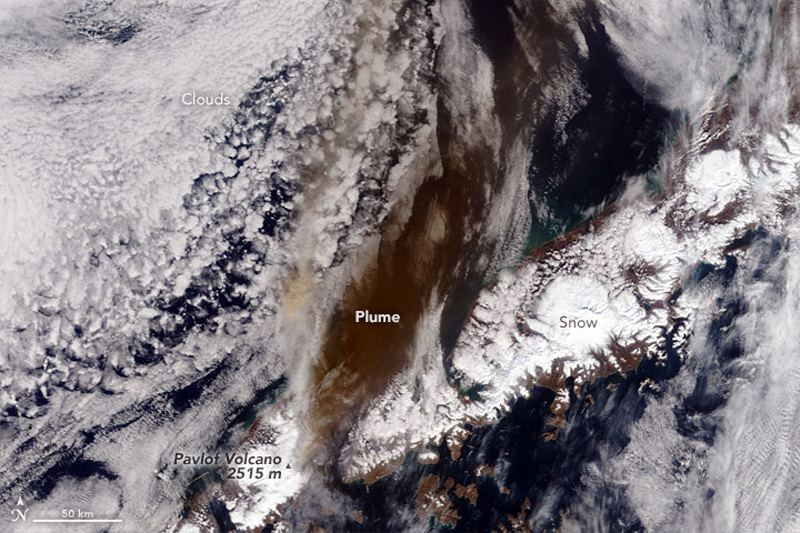 |
Figure 14. The Moderate Resolution Imaging Spectroradiometer (MODIS) instrument on a NASA satellite acquired this image of the ash plume from Pavlof at 1145 Alaska time (2145 UTC) on 28 March 2016 extending several hundred km to the NE. Courtesy of NASA Earth Observatory. |
The energetic ash-producing phase of the eruption lasted from 1600 AKDT (00:00 UTC) on 27 March until about 1230 AKDT (20:30 UTC) on 28 March, and produced an ash cloud that stretched NE over Bristol Bay and interior Alaska for over 1,200 km. As a result, over 40 Alaska Airlines flights to and from Fairbanks, Alaska, were cancelled according to NBC News. Minor ashfall (0.8 to 6.3 mm or 1/32 to 1/4 in) was reported in the nearby community of Nelson Lagoon (80 km NW) and trace ashfall (less than 0.8 mm) was confirmed near Dillingham (470 km NE). A large SO2 plume also drifted NE from the volcano extending all the way across Alaska to Yukon Territory and British Columbia in Canada (figure 15).
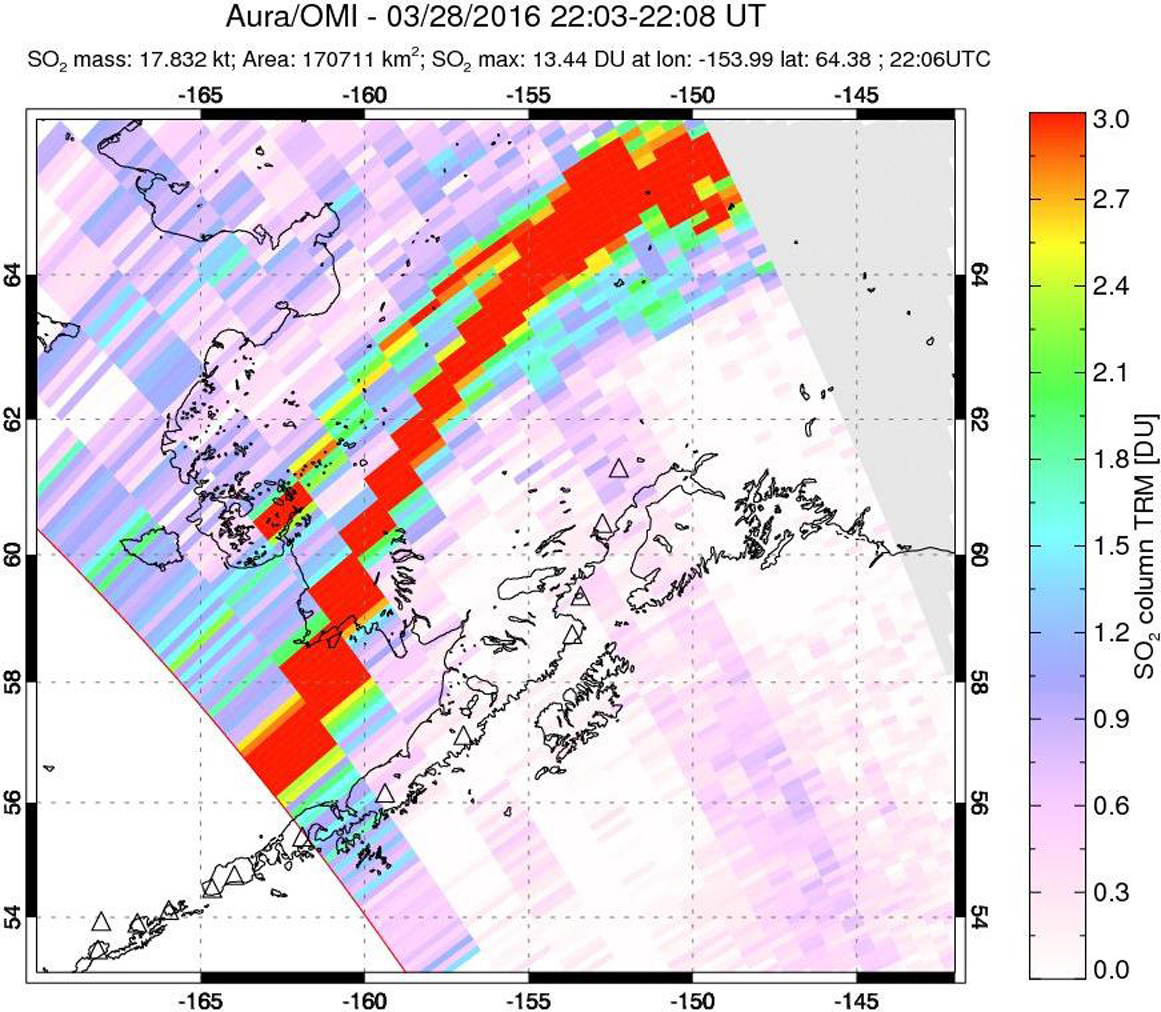 |
Figure 15. A large SO2 plume trails NE from Pavlof on 28 March 2016 after a substantial explosion sent an ash plume to nearly 12 km altitude. The ash cloud and the SO2 plume both extended for 1,200 km NE across interior Alaska. Courtesy of NASA/GSFC. |
Seismicity and infrasound signals had decreased to low enough levels by 1230 on 28 March that the AVO lowered the Aviation Color Code to Orange and the Volcano Alert Level to Watch. However, seismic tremor remained above background levels. Ash emissions decreased through the night and were barely visible in a satellite image acquired at 0625 AKDT on 29 March. Remnant ash continued to drift over Bristol Bay and areas of interior Alaska. The webcam at Cold Bay recorded intermittent, low-level ash plumes rising as high as 4.6 km.
Thermal anomalies, measured by MODIS satellite sensors and analyzed by MODVOLC, appeared from 28 March (0025 UTC) through 29 March 2016 (1360 UTC), with 20 pixels recorded on 28 March. The MIROVA system also recorded an abrupt spike to 'Very High' thermal anomaly levels on 28 March, dropping slightly in the next two days (figure 16) and then disappearing a few days later. Low-power anomalies were detected on 2 and 6 April, and then ceased for several months.
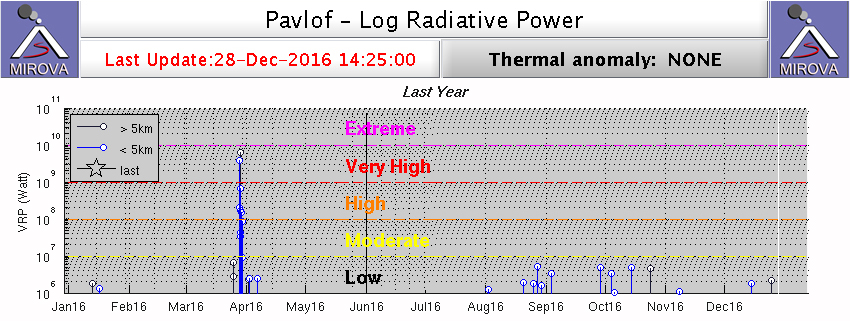 |
Figure 16. MIROVA Log Radiative Power data for Pavlof between 28 December 2015 and 28 December 2016. Note the 'Very High' level spike in Log Radiative Power during 28-30 March 2016. Values dropped significantly in early April and then disappeared for several months. Low VRP values reappeared in late August and were intermittent for the remainder of 2016. AVO determined that the summit crater was enlarged as a result of the March 2016 explosion; the new crater geometry possibly allowed satellite sensors to more easily detect emissions of hot gases from the vent. Ongoing observations of moderately elevated surface temperatures between August and December 2016 likely reflect this change in the crater, and do not indicate new eruptive activity or rising magma, according to AVO scientists. Courtesy of MIROVA. |
The AVO reported that the intensity of the eruption greatly decreased during 29-30 March, although The Canadian Press reported that ash from the eruption had caused flights in and out of Yellowknife and Regina, Canada, to be cancelled on those dates. Elevated surface temperatures identified in satellite data and visual observations of low-level, intermittent ash plumes were noted during brief breaks in poor weather conditions during these days. Airwave signals, indicative of small explosions at the summit, were recorded on 3 April, but tremors had ceased by the next day. On 6 April AVO noted no signs of ash emissions or lava effusion during the previous week, and seismicity was at low levels. Thermal anomalies at the summit were occasionally visible, though likely indicating cooling processes of previously erupted lava. AVO lowered the Aviation Color Code to Yellow and Volcano Alert Level to Advisory on 6 April. After two more weeks of no activity, the ACC was lowered to Green/Normal on 22 April 2016.
On 13 May 2016 the AVO raised the Aviation Color Code back to Orange as a result of increased seismicity typically associated with minor eruptive activity. Four minor ash eruptive episodes were inferred from seismic data between 13 and 16 May. On 14 May, local observers in Cold Bay reported ash emissions below 5 km in the vicinity of the volcano. According to the Anchorage VAAC, on 15 May a minor eruption was noted on the Cold Bay web camera, but volcanic ash was not visible in satellite data. Elevated surface temperatures were detected in satellite data on 15 May. Periods of elevated volcanic tremor and a small explosion associated with minor ash emissions was noted on 17 May; observers in Cold Bay and Sand Point (90 km E) reported ash emissions interspersed with steam emissions. The Anchorage VAAC noted that strong winds caused resuspension of volcanic ash on the lee side of Pavlof on 17 and 18 May. The AVO lowered the ACC to Yellow on 20 May and noted that all volcanic ash clouds produced during the 13-17 May event were below 4.5 km altitude, and that no lava effusion or fountaining was detected. Weak seismic tremor and small explosions were observed on 21 May, after which activity ceased. The AVO lowered the ACC to Green on 17 June.
Seismic activity increased again on 30 June for about a week, prompting the AVO to raise the ACC to Yellow on 1 July 2016; minor steam emissions were also observed in the web camera. AVO technicians installed a new web camera in the Black Hills area north of the volcano near the Bering Sea coast in early July. On 11 July, weakly elevated surface temperatures were observed at the summit in satellite imagery and a steam and gas cloud extended SW for about 80 km. Minor ash emissions reaching a few tens of meters above the summit were observed that afternoon extending a few kilometers to the SW. Small ash emissions were again observed on 18 July along with an increase in seismic tremor for about 48 hours.
On 28 July a low-intensity eruption with vigorous degassing produced a steam-rich plume and minor ash emissions. As a result, the AVO raised the ACC to Orange. The drifting steam and ash cloud was below 4.6 km above sea level and dissipated rapidly. The Anchorage VAAC reported steam and minor ash emissions continuing through 30 July.
A decline in activity led AVO to lower the ACC to Yellow on 4 August. Periods of low-amplitude tremor continued, but no plumes or thermal signals at the summit were detected. Elevated surface temperatures at the summit were observed in satellite data on 8 August, and a low-level but persistent steam plume was visible in web camera images on 11 August. A large steam plume was noted by observers in Sand Point on 15 August. Elevated surface temperatures were detected through cloud cover in satellite data on 20 and 25 August. Low-level unrest continued through the fall with persistent degassing from the summit and elevated surface temperatures detected in satellite data. A robust steam plume on 31 August reached 4.6 km, but there was no evidence of ash and it dissipated rapidly.
Several times during late September during clear views, webcam images showed a persistent steam plume from the summit crater. Elevated surface temperatures in the summit crater were observed in satellite images on 25, 28, and 29 September, and again during 4-6, 13-14, and 16 October. In early November, the AVO determined that the summit crater was larger and more centrally located than before, as a result of the March 2016 explosion. The new crater geometry possibly allowed satellite sensors to more easily detect emissions of hot gases from the vent. Ongoing observations of moderately elevated surface temperatures (figure 16) likely reflect this change in the crater, and do not indicate new eruptive activity or rising magma. Seismicity remained slightly above background levels through the end of 2016, and the ACC remained at Yellow.
Information Contacts: Alaska Volcano Observatory (AVO), a cooperative program of a) U.S. Geological Survey, 4200 University Drive, Anchorage, AK 99508-4667 USA (URL: http://www.avo.alaska.edu/), b) Geophysical Institute, University of Alaska, PO Box 757320, Fairbanks, AK 99775-7320, USA, and c) Alaska Division of Geological & Geophysical Surveys, 794 University Ave., Suite 200, Fairbanks, AK 99709, USA (URL: http://www.dggs.alaska.gov/); Anchorage Volcanic Ash Advisory Center (VAAC), Alaska Aviation Weather Unit, NWS NOAA US Dept of Commerce, 6930 Sand Lake Road, Anchorage, AK 99502-1845(URL: http://www.ssd.noaa.gov/); Hawai'i Institute of Geophysics and Planetology (HIGP), MODVOLC Thermal Alerts System, School of Ocean and Earth Science and Technology (SOEST), Univ. of Hawai'i, 2525 Correa Road, Honolulu, HI 96822, USA (URL: http://modis.higp.hawaii.edu/); MIROVA (Middle InfraRed Observation of Volcanic Activity), a collaborative project between the Universities of Turin and Florence (Italy) supported by the Centre for Volcanic Risk of the Italian Civil Protection Department (URL: http://www.mirovaweb.it/); NASA Goddard Space Flight Center (NASA/GSFC), Global Sulfur Dioxide Monitoring Page, Atmospheric Chemistry and Dynamics Laboratory, Goddard, Maryland, USA (URL: https://so2.gsfc.nasa.gov/); NASA Earth Observatory, EOS Project Science Office, NASA Goddard Space Flight Center, Goddard, Maryland, USA (URL: http://earthobservatory.nasa.gov/); Colt Snapp (URL: https://twitter.com/colt_snapp/status/714345047173369856); The Canadian Press, via Vancouver Observer (URL: http://www.vancouverobserver.com/news/environment/flights-cancelled-and-out-regina-yellowknife-after-volcano-alaska); NBC News (URL: http://www.nbcnews.com/news/weather/pavlof-volcano-erupts-covering-400-miles-alaska-ash-n546956).
Intermittent minor explosions and gas-and-ash emissions during August-October 2021
Pavlof is located on the Alaska Peninsula, about 970 km SW of Anchorage, and was constructed along a line of vents extending NE from the Emmons Lake caldera. The volcano is about 7 km in diameter and contains active vents on the N and E flanks near the summit. Historical eruptions have been characterized by Strombolian to Vulcanian explosions from the summit vents, along with occasional lava flows; the largest eruption took place in 1911 when a fissure opened on the N flank and ejected large blocks and effused lava. More recently, there was a short eruption from March to July 2016 that consisted of a strong ash plume and several smaller ash events (BGVN 42:03). This report updates information from December 2017 through October 2021, which includes low-level gas-and-ash emissions, minor explosions, and local ash deposits during the second half of 2021, based on daily and weekly reports from the Alaska Volcano Observatory (AVO) and satellite data.
Summary of activity during 2019. No activity was reported during December 2017 through April 2019, according to the AVO weekly reports, although Sentinel-2 infrared satellite imagery showed occasional high temperatures at the summit crater during December 2017 and through 2018 (figure 17). Low-frequency seismic tremor was initially detected on 16 May 2019 that prompted AVO to raise the Aviation Color Code (ACC) and Volcano Alert Level (VAL) to Yellow and Advisory, respectively. Webcam images showed a gas-and-steam plume rising from the summit and overnight satellite images indicated warm surface temperatures. This activity continued to be reported through 11 June 2019, after which seismicity declined to background levels. As a result, the ACC and VAL were lowered to Green and Normal, respectively. Gas-and-steam emissions continued intermittently, along with elevated surface temperatures, but were described as normal background behavior (figure 18). Small explosion signals were detected on infrasound and seismic networks on 19 October 2019, though no ash cloud was visible due to weather conditions. Clear satellite images and webcam images later that week also did not show any deposits associated with these events, according to AVO. Weakly elevated surface temperatures and small gas-and-steam plumes were visible, however, which continued to be detected through 30 October. On 28 December seismicity increased again, though no eruptive activity or emissions were reported, which caused AVO to raise the ACC and VAL to Yellow and Advisory, respectively.
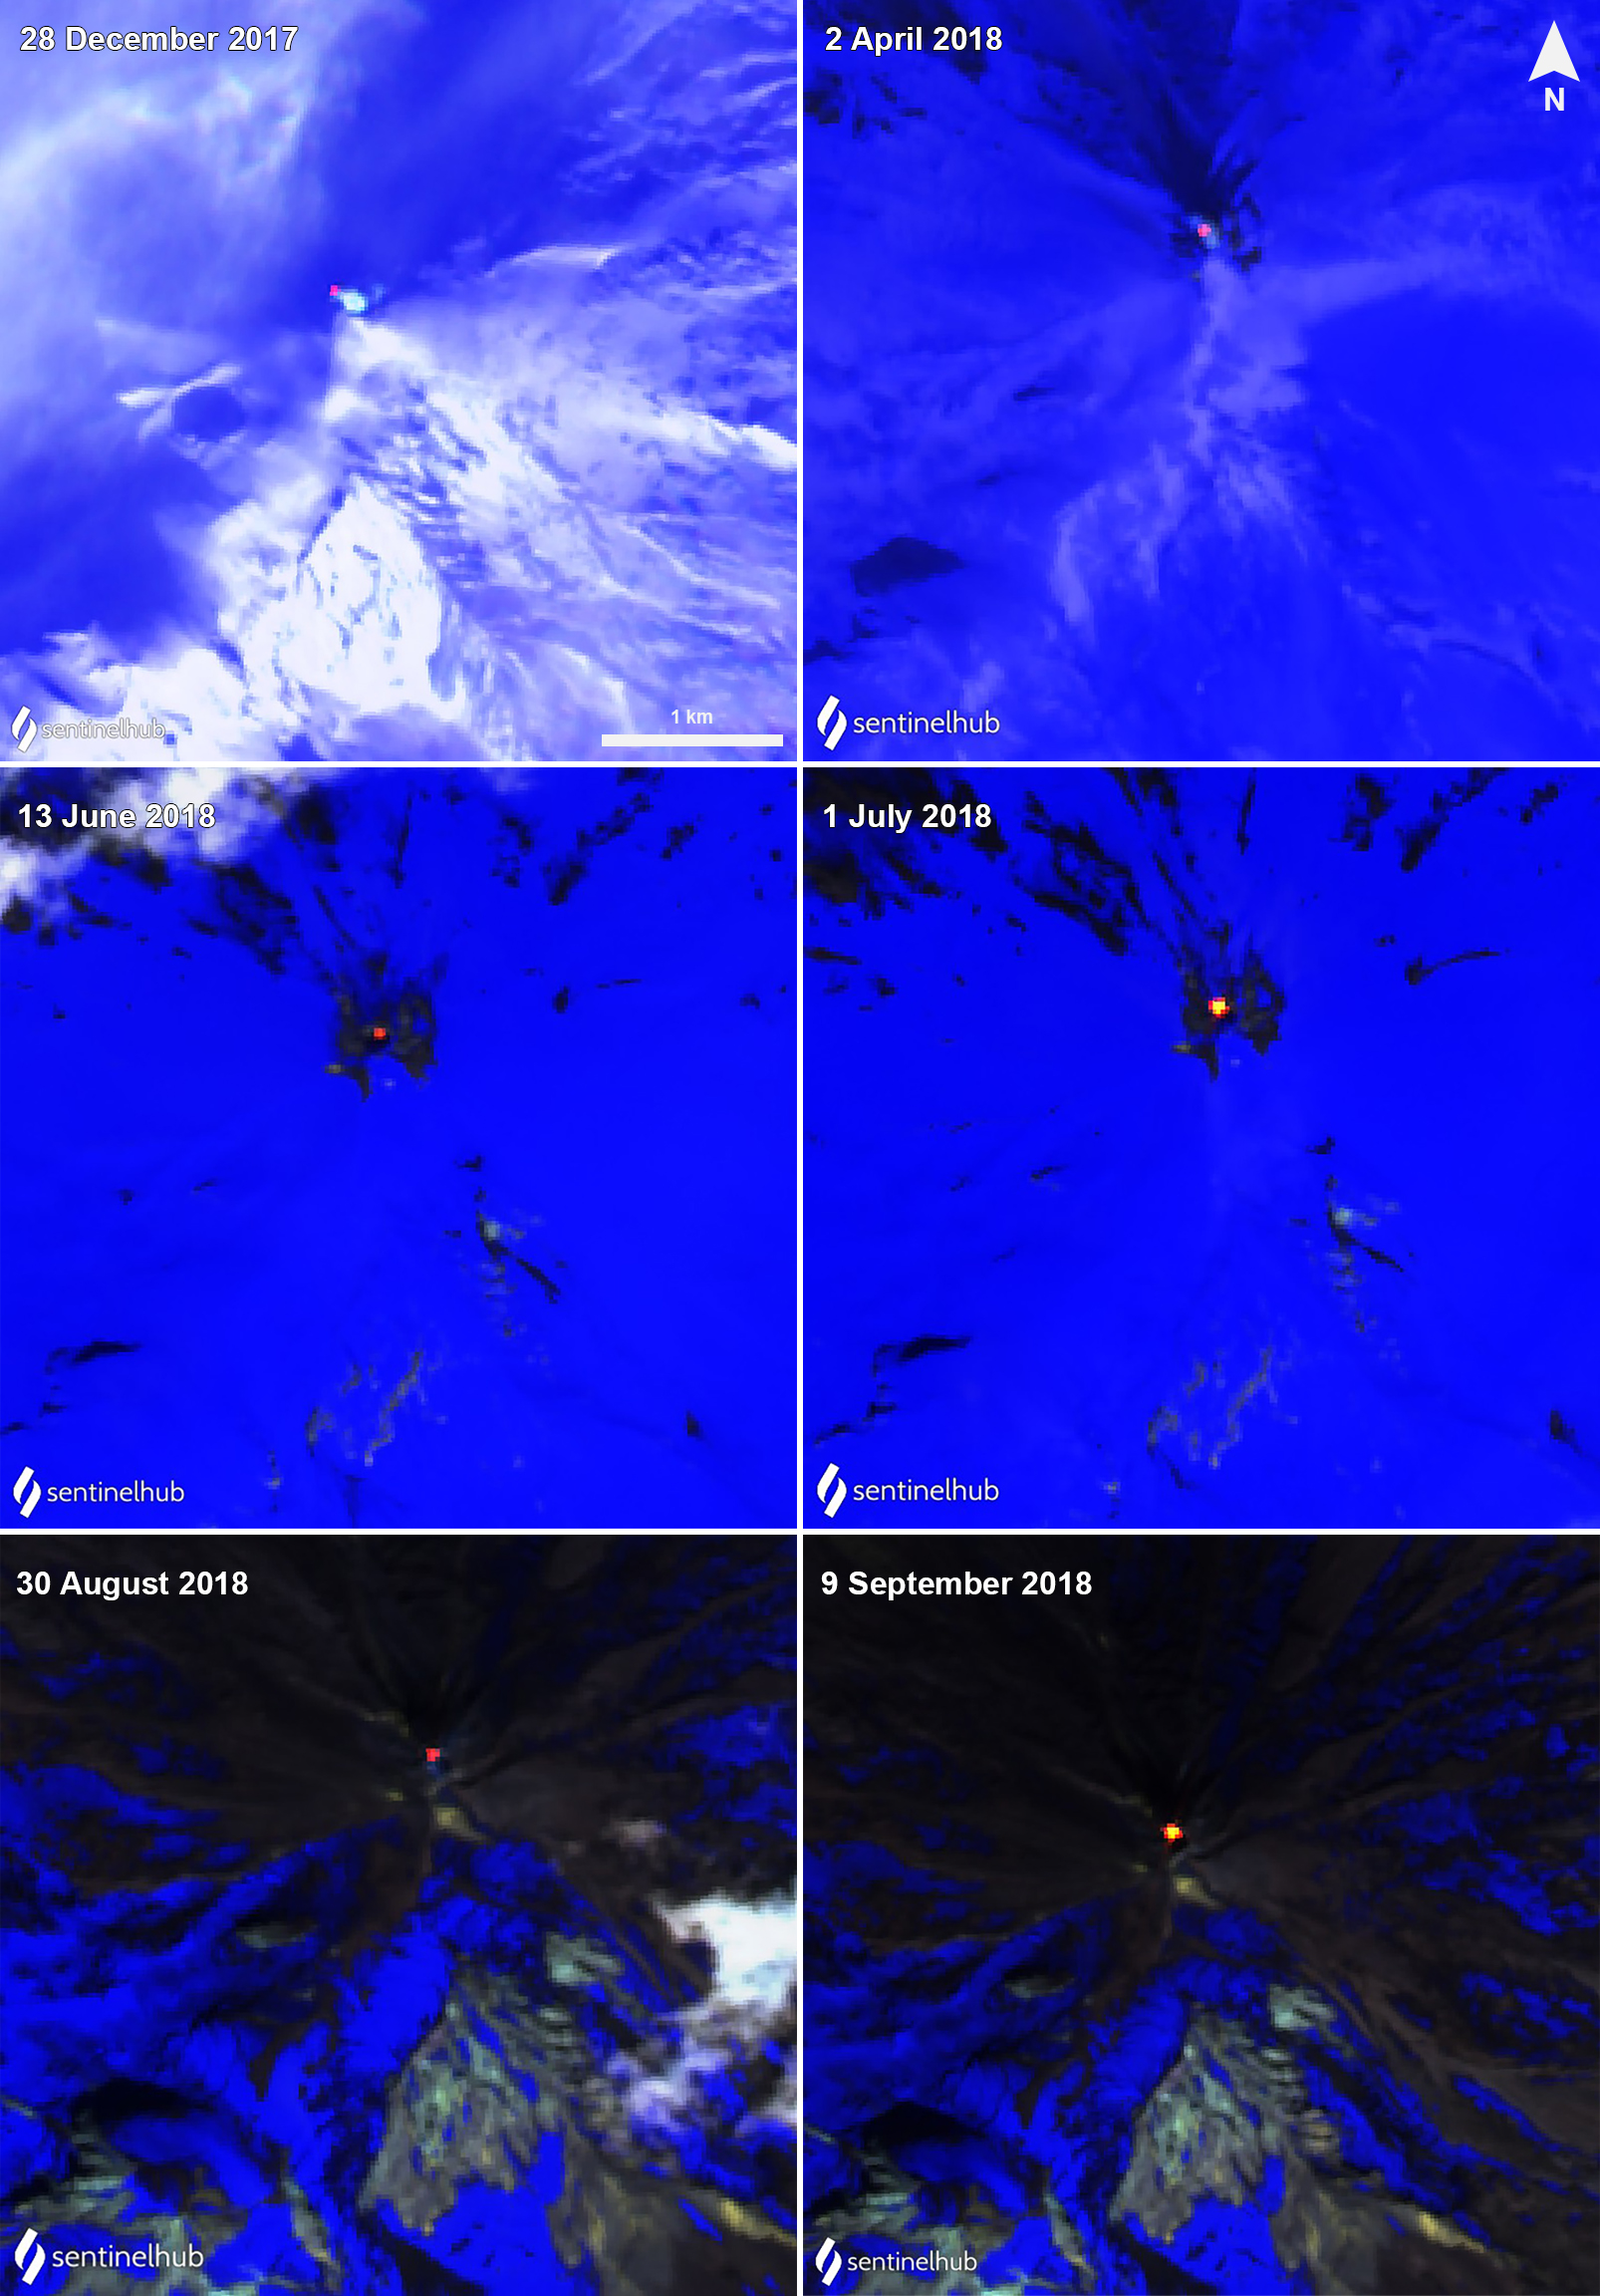 |
Figure 17. Sentinel-2 infrared satellite imagers showing a small, yet persistent thermal anomaly in the summit crater of Pavlof on 28 December 2017 (top left), 2 April (top right), 13 June (middle left), 1 July (middle right), 30 August (bottom left), and 9 September (bottom right) 2018. Some anomalies are accompanied by white gas-and-steam emissions. Sentinel-2 images with "Atmospheric penetration" (bands 12, 11, 8A) rendering. Courtesy of Sentinel Hub Playground. |
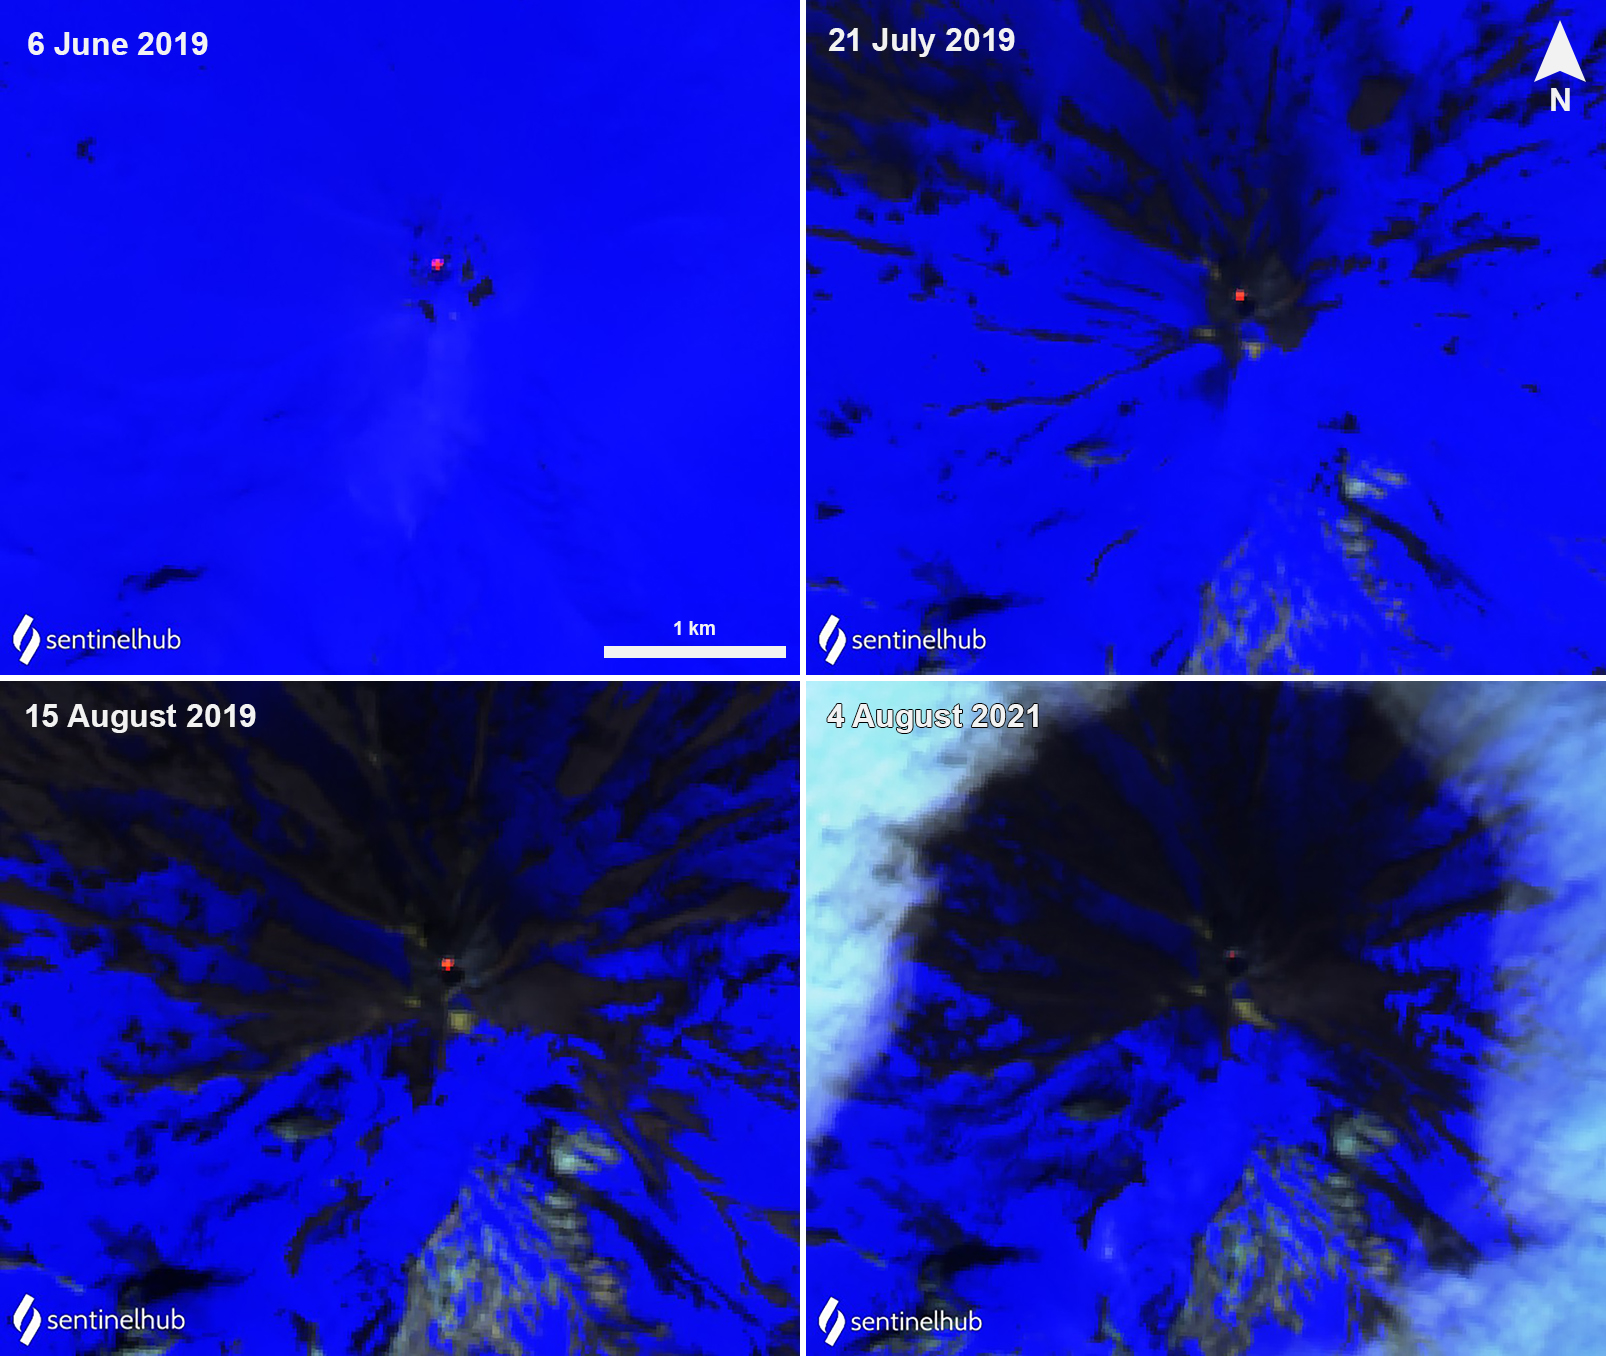 |
Figure 18. Sentinel-2 infrared satellite images showing a continued thermal anomaly in the summit crater of Pavlof on 6 June (top left), 21 July (top right), 15 August (bottom left) 2019 and renewed activity marked with a weaker anomaly on 4 August 2021 (bottom right). Sentinel-2 images with "Atmospheric penetration" (bands 12, 11, 8A) rendering. Courtesy of Sentinel Hub Playground. |
Summary of activity during 2020. Slightly elevated seismicity and surface temperatures continued to be reported through 2 March 2020. Little to no activity was detected from March through much of September. Then, increased seismic tremors accompanied by occasional small earthquakes were reported during 21-30 September, which prompted AVO to raise the ACC and VAL to Yellow and Advisory. Clouds often obscured the summit, but occasional gas-and-steam emissions were observed during clear weather.
Activity during July-October 2021. Activity remained low through most of 2021. On 9 July the ACC and VAL were raised to Yellow and Advisory, respectively, due to increased seismic activity and near-continuous tremor that was observed in infrasound and regional seismic data. No eruptive activity or emissions from the summit were observed, however. During the following week, intermittent periods of seismic tremor lasted tens of minutes to several hours and were accompanied by minor gas-and-steam emissions and elevated temperatures in the summit crater, as detected by satellite and webcam images. A thin deposit of ash, likely carried out by gas-and-steam emissions, was visible on the flank that extended a short distance from the summit crater on 18 July. Weakly elevated surface temperatures were detected on 19 July. A pilot on 23 July reported a small, resuspended ash cloud that rose 2 km altitude and extended 32-40 km SE, which was a result of high winds.
Sentinel-2 infrared satellite imagery showed renewed, but weak thermal activity beginning on 4 August (figure 18). During the morning of 5 August minor ash emissions were reported for an hour just above the summit and drifted almost 10 km SE before dissipating; seismic tremor and small explosions were detected by local seismic and infrasound instruments, according to AVO. This prompted AVO to raise the ACC and VAL to Orange and Watch, respectively. Local ash fallout was visible on the SE flank. Intermittent small explosions and low-level ash emissions continued to be reported during most of August, although cloud cover prevented a clear view of the activity. Weakly elevated surface temperatures were reported at night in satellite data. On 25 August an explosion generated an ash plume that rose to 3.7 km altitude, based on a pilot report.
Weather clouds often prevent clear views of the summit during September, but intermittent explosions and low-level ash emissions persisted. Elevated seismicity was detected but remained at low levels. A series of four minor ash emissions were visible in webcam images for a period of five hours on 10 September, which produced minor and diffuse ash emissions that rose from a vent on the E flank. A small explosion occurred early on 12 September that likely produced a minor ash cloud surrounding the vent near the summit, although views were obscured by clouds. During the morning of 18 September clear webcam views showed a recent ash deposit on the upper flanks that was associated with at least one minor ash emission event; periods of increased seismic tremor were also detected over the past day (figure 19). Subsequent ash emission events were noted in webcam images and by local observers at 0900 and 1500 on 19 September. Emissions remained low and dispersed quickly, though satellite images showed deposits on the surrounding flanks. Periods of increased tremor accompanied these ash emissions. During 22-23 September low level ash emissions rose possibly several hundred meters above the summit, according to webcam data. Small explosions were detected in seismic and infrasound data during 25-28 September; on 26 September explosions were visible in webcam images at 2016 and during the next morning at 0716. A small ash emission was observed in webcam images at 1601. Ash deposits resulting from the explosions were visible on the E and SE flanks (figure 20). Regional infrasound data also recorded a small explosion on 28 September.
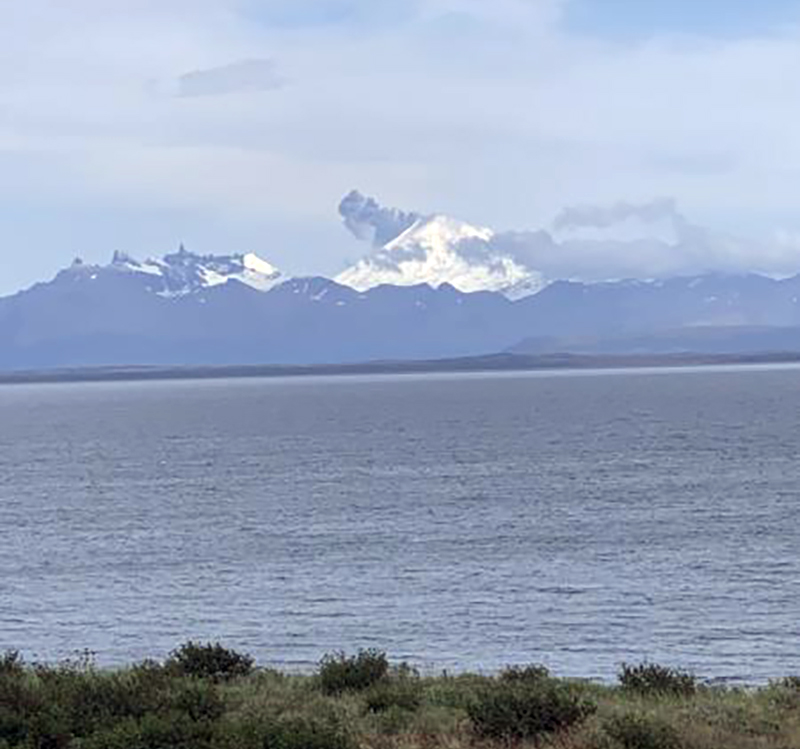 |
Figure 19. Photo of a small ash cloud rising above Pavlof on 18 September 2021 at 1513, as seen from Cold Bay, AK. Photo by Robert Nielsen, courtesy of AVO. |
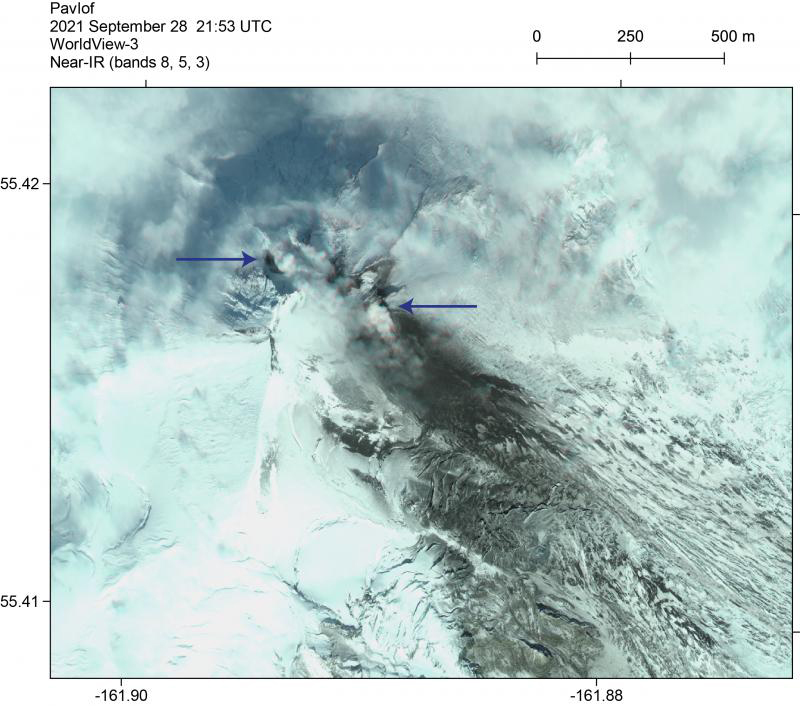 |
Figure 20. Worldview-3 near IR satellite image of Pavlof on 28 September 2021 showing ash deposits on the SE flanks from intermittent explosions and gas-and-steam plumes from the N and SE vents (blue arrows). Photo by Matt Loewen, courtesy of AVO. |
Activity during October consisted of minor gas-and-steam and ash emissions and intermittent minor explosions, although clouds often prevented clear views of the summit. As a result, low-level ash emissions and local ash deposits were visible on the flanks only during clear weather. Explosions during the latter half of October were focused at the vent on the upper SE flank, near the location of the 2007 vent. Seismicity remained elevated through the month, as well as slightly elevated surface temperatures.
Information Contacts: Alaska Volcano Observatory (AVO), a cooperative program of a) U.S. Geological Survey, 4200 University Drive, Anchorage, AK 99508-4667 USA (URL: https://avo.alaska.edu/), b) Geophysical Institute, University of Alaska, PO Box 757320, Fairbanks, AK 99775-7320, USA, and c) Alaska Division of Geological & Geophysical Surveys, 3354 College Rd., Fairbanks, AK 99709, USA (URL: http://dggs.alaska.gov/); Sentinel Hub Playground (URL: https://www.sentinel-hub.com/explore/sentinel-playground).
Weak ash explosions, small lava flows, and lahars during November 2021-July 2022
A new eruptive period at Pavlof began on 5 August 2021 (BGVN 46:11), with intermittent minor ash explosions, low-level ash emissions, seismic tremor, and weak thermal activity. This activity continued through at least July 2022 along with lava effusion and lahars. The volcano, one of the most consistently active on the Alaskan Peninsula, is monitored remotely by the Alaska Volcano Observatory (AVO) using local seismic and infrasound sensors, satellite data, web cameras, and remote infrasound and lightning networks. During November 2021-July 2022, the Aviation Color Code remained at Orange and the Volcano Alert Level remained at Watch, the second highest level for both. Weather clouds often prevented satellite and webcam views.
According to AVO reports, during November 2021-July 2022 there were frequently weak explosions detected in seismic and infrasound data; minor ash emissions rose a few hundred feet above the vent and quickly dissipated near the summit, as observed in satellite and webcam images. Recent ballistic ejecta were sometimes visible on the upper flanks. Consistent with the explosions and lava effusion, seismic tremor was recorded throughout the reporting period. In addition, AVO reported sustained high to moderately elevated surface temperatures near the summit associated with the lava effusion were recorded at least through July.
Based on AVO reports, lava effusion in the form of fountaining, spatter, and small lava flows from the SE vent continued through at least July. AVO reports described the lava flows as short and sometimes sporadic. Lahars that were first reported on 10 November 2021 eventually extended down the ESE flank for several kilometers, not quite to the base of the volcano.
In November 2021 weak intermittent ash explosions generated minor ash emissions that rose a few hundred feet above the vent. On 8 November a small lava flow was first noted in satellite data near a vent on the volcano’s upper SE flank that had by 11 November extended 200 m below the vent (figure 21). Occasional periods of lava fountaining from the vent began on 14 November. By then, a small cone of hot unstable spatter and rock debris had formed. Occasional collapse of parts of the cone sent hot granular flows of rock debris several hundred meters down the flank that melted the snow and ice and produced variable amounts of meltwater, which began to incorporate loose debris on the flank to form lahars less than 2 m deep. During early December numerous explosions were detected, but then explosions became intermittent during the rest of the month. Weak ash emissions rose to an altitude no higher than about 3 km, about 500 m above the summit. Flows were up to 200 m long through December.
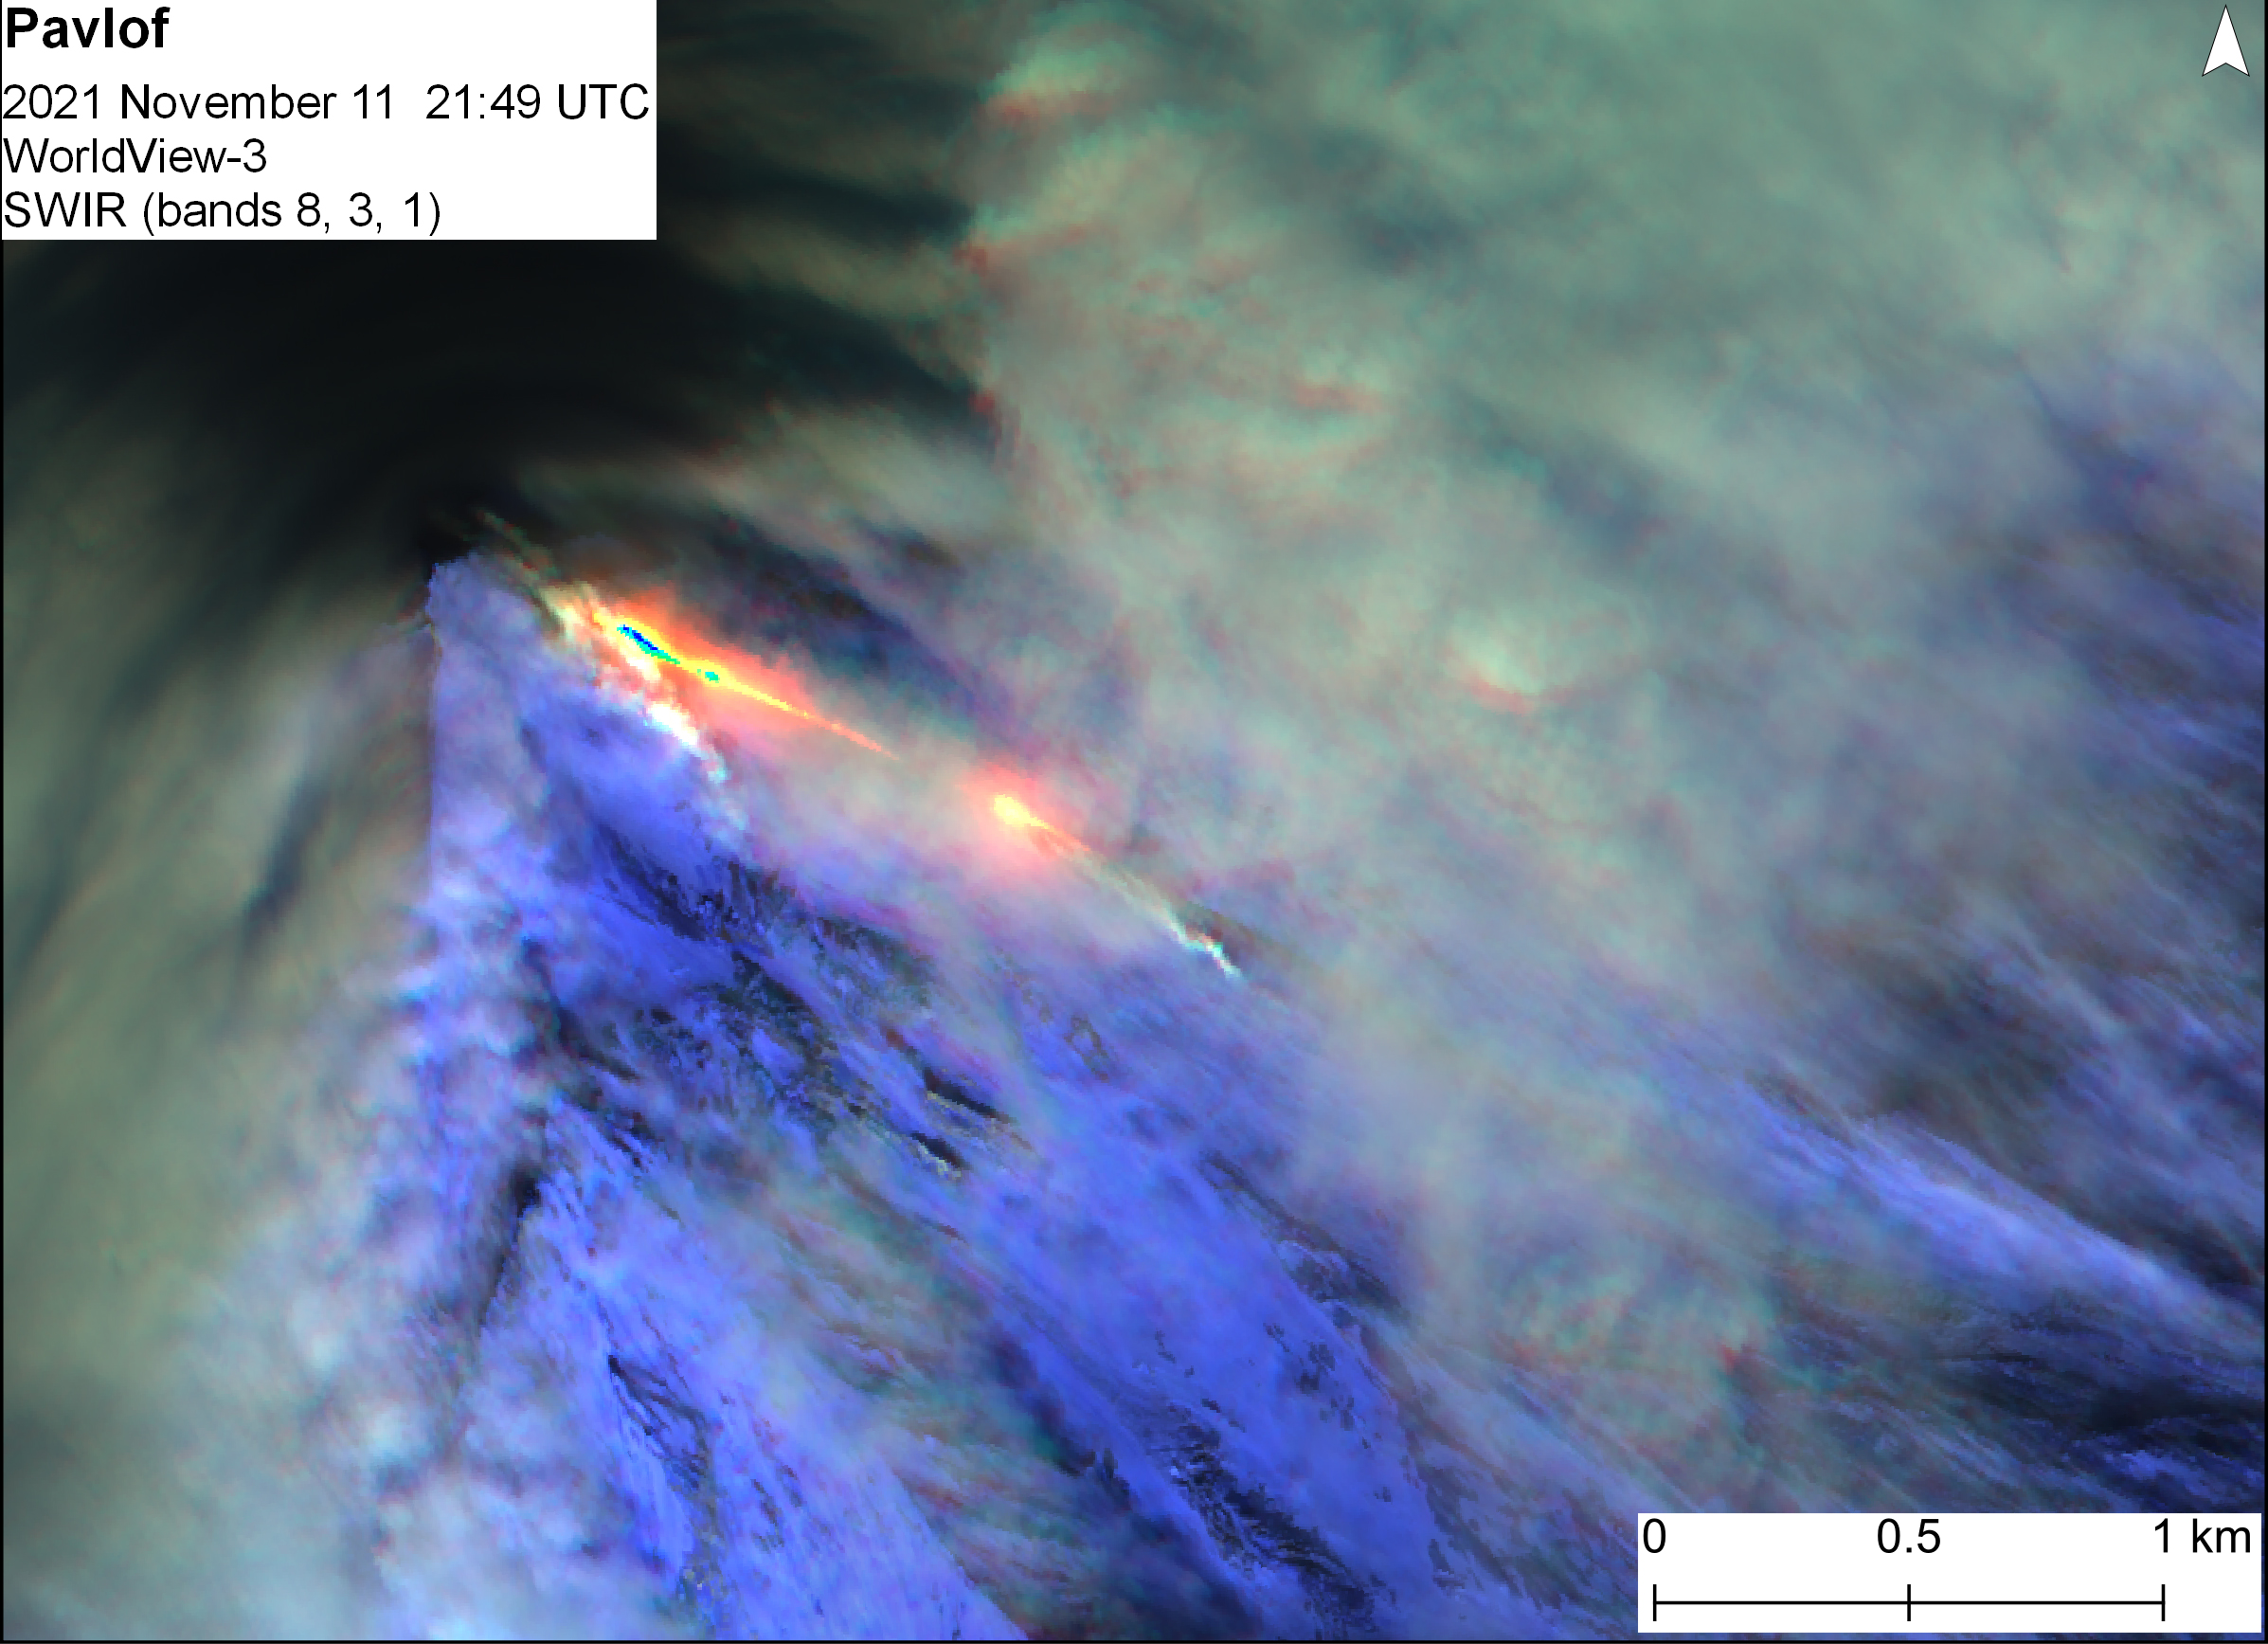 |
Figure 21. WorldView-3 false color short-wave infrared satellite image of Pavlof on 11 November 2021, showing lava flow and steam emission. SWIR rendering (bands 8, 3, 1). Prepared by M. Loewen, courtesy of AVO. |
Lava flows were 300 m long in first week of January, after which satellite-based radar showed a widening of the vent. Satellite images on 19 January showed lava extending downslope 1.3 km and a new flow branch developing (figure 22). Explosions were detected again on 19 January (figure 23), 22 January, 24 February, and 28 February 2022. Robust steam emissions were observed in webcam images during mid-January.
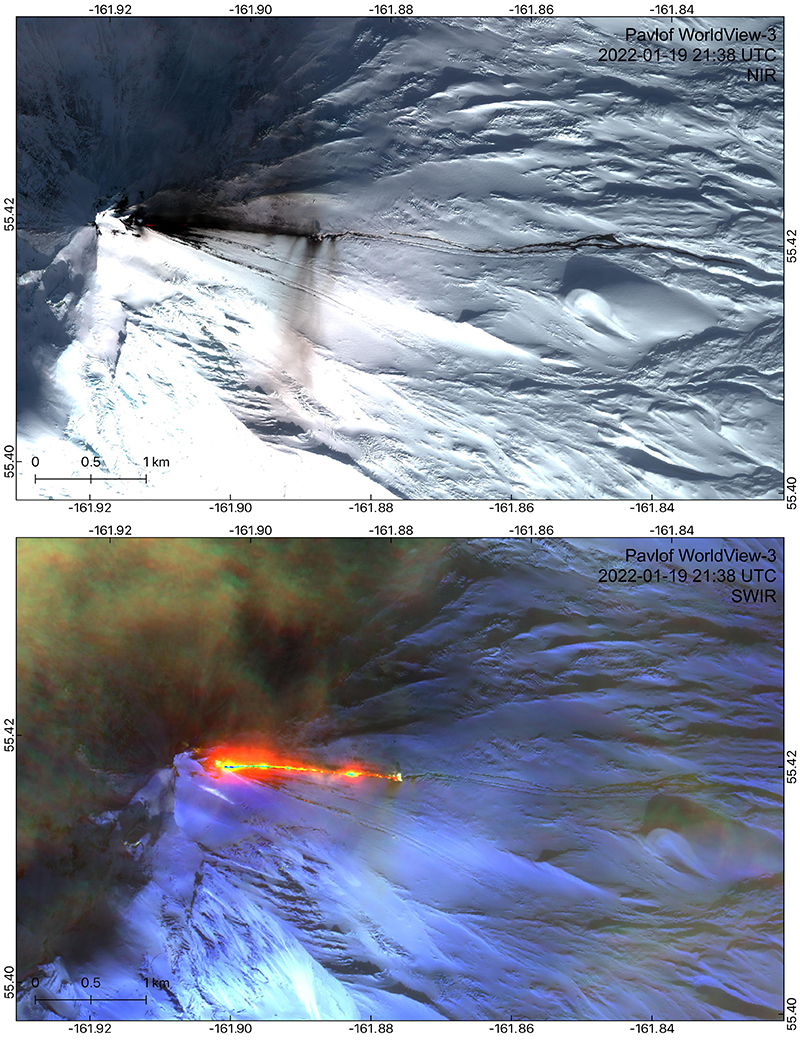 |
Figure 22. WorldView-3 visible (top) and false color short-wave infrared (bottom) satellite images of Pavlof on 19 January 2022. A lava flow extends 1.3 km E from a vent on the E flank. Lava has melted the snow and ice and produced lahars that extend beyond the lava flow up to 4.4 km E of the vent. Minor ash deposits are also visible as dark streaks on the snow. Prepared by H. Dietterich, courtesy of AVO. |
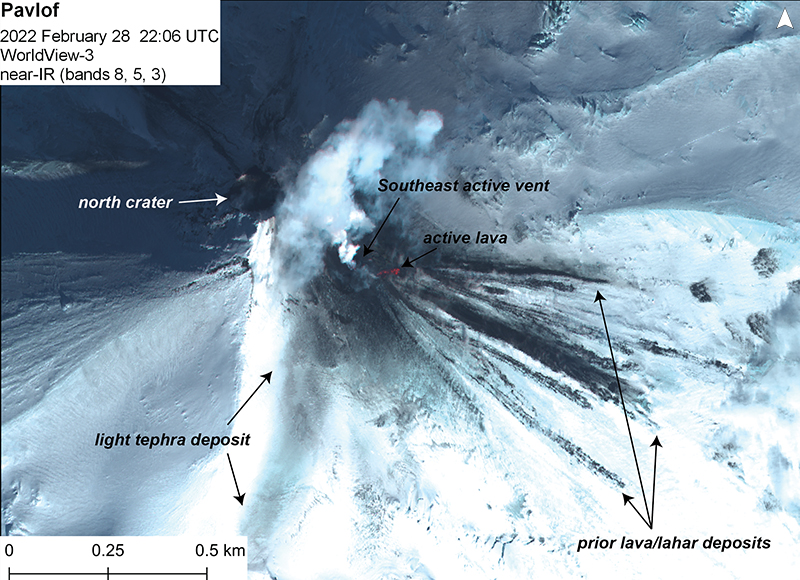 |
Figure 23. WorldView-3 false color near-infrared satellite image of Pavlof on 28 February 2022 showing a small area of active lava near the E vent, previous lava flow and lahar deposits to the E and SE, and a minor ash deposit to the S. Prepared by M. Loewen, courtesy of AVO. |
Infrasound instruments detected occasional small explosions in early March, and satellite images sometimes showed minor ash deposits covering snow near the vent. Explosions became more numerous in mid-March, then decreased towards the end of the month, with no ash emissions seen during the latter part of the month. However, steaming from the vent was observed, along with a weak gas plume. Sulfur dioxide emissions were visible in satellite images during 24-26 March. Two small explosions were detected in local and regional infrasound data during 23-24 March and one was recorded during 26-27 March.
Weak explosive activity was detected during 31 March and 2-3 April with low-level plumes visible in the mornings, though satellite and webcam views were mostly obscured by clouds. Seismic tremor and elevated surface temperatures were detected almost daily during April. Possible minor lava effusion was visible in satellite images on 6 April, and a few small explosions were recorded each day during 6-9 April. Low-level ash emissions were visible in webcam and satellite images during 6-7 April, and satellite images captured ash and pyroclastic flow deposits extending at most 1.5 km from the vent and short lava flows on 9 April. Steam emissions from the vent were visible during 8-10 April. A short lava flow had descended the E flank during 26-28 April and was about 500 m long. Steaming from the active vent was visible during 30 April-2 May.
The lava flow from the E vent was 500 m long by 8 May. Daily elevated surface temperatures were identified in satellite images consistent with the effusion of short lava flows on the upper flank through 31 May. An active flow that was 650 m long was visible in satellite images during 28-29 May. No explosions or ash emissions were detected during May and June 2022. Sulfur dioxide emissions were detected in satellite data on 12 June. Lava flows up to 500 m long were observed through 10 June, and then up to 615 m long on 24 June and 1 July. On 7 July three small explosions were detected, although ash emissions were not observed. Thereafter, minor explosions were detected daily, and weak ash emissions rose as high as 500 m above the summit. Sulfur dioxide emissions were detected on 26 July.
Information Contacts: Alaska Volcano Observatory (AVO), a cooperative program of a) U.S. Geological Survey, 4200 University Drive, Anchorage, AK 99508-4667 USA (URL: https://avo.alaska.edu/), b) Geophysical Institute, University of Alaska, PO Box 757320, Fairbanks, AK 99775-7320, USA, and c) Alaska Division of Geological & Geophysical Surveys, 3354 College Rd., Fairbanks, AK 99709, USA (URL: http://dggs.alaska.gov/).
Ongoing ash explosions and lava flows until eruptive activity ended on 7 December 2022
Pavlof, one of the most consistently active volcanoes in the Aleutian Islands, has been erupting since mid-November 2021, with frequent weak explosions, periods of lava spatter, fountaining, small lava flows and emissions of steam and gas that sometimes contained ash (BGVN 47:08). This eruption continued through 7 December 2022, when both explosions and significant thermal activity had stopped (figure 24). The current report, which describes activity between August 2022-January 2023, is monitored remotely by the Alaska Volcano Observatory (AVO) using local seismic and infrasound sensors, satellite data, web cameras, and remote infrasound and lightning networks, and the information below is based on AVO weekly reports and satellite data. During August to mid-December 2022, the Aviation Color Code (AVO) remained at Orange and the Volcano Alert Level (VAL) remained at Watch, the second highest level for both on a four-level scale, after which they were lowered. Weather clouds often prevented satellite and webcam views.
|
Figure 24. Graph of thermal anomalies at Pavlof during April 2022-March 2023, as recorded by the MIROVA system. Frequent mostly moderate power hotspots were identified during August through early December 2022. Courtesy of MIROVA. |
During August, the minor eruption from the active vent on the E flank, just below the summit, continued, with occasional explosions that probably produced minor ash emissions (figure 24) that usually rose no higher than an altitude of 3 km and dissipated quickly. According to a pilot report, a small ash emission rose to an altitude of about 4 km on 24 August. A small pyroclastic debris flow was observed in satellite data on 26 August, extending about 590 m SE from the active vent. Seismic tremor persisted, and elevated surface temperatures were identified almost daily in satellite images. No active lava flows extending down the flank were detected.
|
Figure 25. A typical small ash plume is visible rising from Pavlof in this aerial photo at 1123 on 26 August. Photo by Pavel Izbekov; courtesy of AVO/University of Alaska Fairbanks, Geophysical Institute. |
By 2 September a second small vent had re-opened ESE of the main vent. Elevated surface temperatures in the active vent area were identified in satellite images on most days, consistent with minor lava effusion. Strong incandescence at the vent and from an area within 200 m downslope was visible in webcam images starting on 14 September, indicating a short lava flow. Small explosions were detected during 18-21 September, and steam and gas plumes often containing minor amounts of ash were frequently visible. New lahar and minor ash deposits extending less than 900 m from the vent were visible during 11-13 September. Seismic tremor was nearly continuous in September.
Small explosions and persistent seismic tremor continued during October except for the first week, multiple explosions were recorded almost daily. Strongly elevated surface temperatures were often identified in satellite images, incandescence and glowing ejected rock fragments were frequently visible in nighttime webcam images, and diffuse steam plumes were sometimes visible in webcam views. Discolored snow near the vent was visible in webcam images on the morning of 7 October, suggesting low-level explosive activity; a small explosion was recorded at 1503 that same day. Webcam images on 20 October showed a new dark flow of lava and debris extending about a third of the way down the E flank. During 31 October-1 November, a diffuse steam-and-ash plume rose less than 3 km in altitude and deposited minor amounts of tephra on the E flank.
During November, multiple explosions were detected almost daily until mid-month, after which none were clearly recorded, but seismic tremor was nearly continuous. Webcam images taken on 12 and 15 November showed a lava flow and ash deposits on the upper flanks, and nighttime crater incandescence was sometimes visible. Elevated surface temperatures were observed in satellite data on most days, and occasional clear webcam views showed recent flow deposits on the volcano’s flank as well as weak steaming and light ash emissions and deposits, probably associated with lava spattering or fountaining. On 28 November, a flowage event likely resulting from the interaction of hot rocks with ice and snow on the flank was observed in seismic data and a series of webcam images, and satellite and webcam images showed that the deposit extended about 5 km down the SE flank, the largest flowage event during the current eruptive period. This event produced an ash and gas plume that reached an altitude as high as 6 km, before dissipating within tens of minutes.
Multiple small explosions were detected on 1-3 December that resulted in a narrow gully being eroded in the ice below the vent, extending about 2 km down the flank. Elevated surface temperatures and incandescent lava were not observed after 2 December. Activity significantly decreased after 3 December, with AVO reporting that the last explosion was detected on 7 December. Occasional small steam and gas plumes were visible in webcam images. Tremor had become more intermittent by mid-month, but overall seismicity remained above background levels through the end of December. On 17 December, due to the reduced activity, AVO decreased the ACC to Yellow and the VAL to Advisory, both the second lowest on a four-level scale. Weakly elevated temperatures were detected the last week of December, and a high-resolution satellite image on 27 December showed a small spot of strongly elevated temperatures within the recently active vent on the volcano’s upper E flank, but there was no sign of eruptive activity.
During the first two weeks of January 2023, seismicity remained above background levels and weakly elevated surface temperatures and minor steaming from the active vent were observed that AVO suggested might have been associated with the cooling of lava around the vent. However, no explosions or other eruptive activity was noted. By mid-January seismicity had decreased to background levels. On 19 January, AVO decreased the ACC and VAL to Green and Normal, respectively, stating that the eruption had ended. However, weakly elevated surface temperatures and minor steaming from the recently active vent continued to be observed intermittently in satellite and web camera imagery, consistent with cooling of previously erupted lava.
Information Contacts: Alaska Volcano Observatory (AVO), a cooperative program of a) U.S. Geological Survey, 4200 University Drive, Anchorage, AK 99508-4667 USA (URL: https://avo.alaska.edu/), b) Geophysical Institute, University of Alaska, PO Box 757320, Fairbanks, AK 99775-7320, USA, and c) Alaska Division of Geological & Geophysical Surveys, 3354 College Rd., Fairbanks, AK 99709, USA (URL: http://dggs.alaska.gov/); Sentinel Hub Playground (URL: https://www.sentinel-hub.com/explore/sentinel-playground); MIROVA (Middle InfraRed Observation of Volcanic Activity), a collaborative project between the Universities of Turin and Florence (Italy) supported by the Centre for Volcanic Risk of the Italian Civil Protection Department (URL: http://www.mirovaweb.it/).
This compilation of synonyms and subsidiary features may not be comprehensive. Features are organized into four major categories: Cones, Craters, Domes, and Thermal Features. Synonyms of features appear indented below the primary name. In some cases additional feature type, elevation, or location details are provided.
Synonyms |
||||
| Paulowsky | ||||
Cones |
||||
| Feature Name | Feature Type | Elevation | Latitude | Longitude |
| Little Pavlof | Cone | |||
|
|
||||||||||||||||||||||||
There is data available for 45 confirmed Holocene eruptive periods.
2021 Aug 5 - 2022 Dec 7 Confirmed Eruption Max VEI: 2
| Episode 1 | Eruption Episode | ||||||||||||||||||||||||||||||
|---|---|---|---|---|---|---|---|---|---|---|---|---|---|---|---|---|---|---|---|---|---|---|---|---|---|---|---|---|---|---|
| 2021 Aug 5 - 2022 Dec 7 | Evidence from Observations: Reported | |||||||||||||||||||||||||||||
|
List of 4 Events for Episode 1
| ||||||||||||||||||||||||||||||
2016 Mar 27 - 2016 Jul 30 Confirmed Eruption Max VEI: 3
| Episode 1 | Eruption Episode | Summit crater | ||||||||||||||||||||||||||||||||||||||||||||||||||||||||||||||||||||||||||||||||||||||||||||||||||||||||||||||||||||||||||||||||||||||||||||||||||||||||||||||||||||||||||||||||||||||||||||||||||||||||||||||||||||||
|---|---|---|---|---|---|---|---|---|---|---|---|---|---|---|---|---|---|---|---|---|---|---|---|---|---|---|---|---|---|---|---|---|---|---|---|---|---|---|---|---|---|---|---|---|---|---|---|---|---|---|---|---|---|---|---|---|---|---|---|---|---|---|---|---|---|---|---|---|---|---|---|---|---|---|---|---|---|---|---|---|---|---|---|---|---|---|---|---|---|---|---|---|---|---|---|---|---|---|---|---|---|---|---|---|---|---|---|---|---|---|---|---|---|---|---|---|---|---|---|---|---|---|---|---|---|---|---|---|---|---|---|---|---|---|---|---|---|---|---|---|---|---|---|---|---|---|---|---|---|---|---|---|---|---|---|---|---|---|---|---|---|---|---|---|---|---|---|---|---|---|---|---|---|---|---|---|---|---|---|---|---|---|---|---|---|---|---|---|---|---|---|---|---|---|---|---|---|---|---|---|---|---|---|---|---|---|---|---|---|---|---|---|---|---|---|
| 2016 Mar 27 - 2016 Jul 30 | Evidence from Observations: Reported | ||||||||||||||||||||||||||||||||||||||||||||||||||||||||||||||||||||||||||||||||||||||||||||||||||||||||||||||||||||||||||||||||||||||||||||||||||||||||||||||||||||||||||||||||||||||||||||||||||||||||||||||||||||||
|
List of 41 Events for Episode 1 at Summit crater
| |||||||||||||||||||||||||||||||||||||||||||||||||||||||||||||||||||||||||||||||||||||||||||||||||||||||||||||||||||||||||||||||||||||||||||||||||||||||||||||||||||||||||||||||||||||||||||||||||||||||||||||||||||||||
2014 Nov 12 - 2014 Nov 15 Confirmed Eruption Max VEI: 3
| Episode 1 | Eruption Episode | Vent just N of summit and N flank | ||||||||||||||||||||||||||||||||||||||||||||||||||||||||||||||||||||||||||
|---|---|---|---|---|---|---|---|---|---|---|---|---|---|---|---|---|---|---|---|---|---|---|---|---|---|---|---|---|---|---|---|---|---|---|---|---|---|---|---|---|---|---|---|---|---|---|---|---|---|---|---|---|---|---|---|---|---|---|---|---|---|---|---|---|---|---|---|---|---|---|---|---|---|---|---|
| 2014 Nov 12 - 2014 Nov 15 | Evidence from Observations: Reported | ||||||||||||||||||||||||||||||||||||||||||||||||||||||||||||||||||||||||||
|
List of 13 Events for Episode 1 at Vent just N of summit and N flank
| |||||||||||||||||||||||||||||||||||||||||||||||||||||||||||||||||||||||||||
2014 May 31 - 2014 Jun 6 Confirmed Eruption Max VEI: 3
| Episode 1 | Eruption Episode | NE flank | ||||||||||||||||||||||||||||||||||||||||||||||||||||||||||||||||||||||||||||||||||||||||||||||||||||||||||||||||||||||||||||||||||||||
|---|---|---|---|---|---|---|---|---|---|---|---|---|---|---|---|---|---|---|---|---|---|---|---|---|---|---|---|---|---|---|---|---|---|---|---|---|---|---|---|---|---|---|---|---|---|---|---|---|---|---|---|---|---|---|---|---|---|---|---|---|---|---|---|---|---|---|---|---|---|---|---|---|---|---|---|---|---|---|---|---|---|---|---|---|---|---|---|---|---|---|---|---|---|---|---|---|---|---|---|---|---|---|---|---|---|---|---|---|---|---|---|---|---|---|---|---|---|---|---|---|---|---|---|---|---|---|---|---|---|---|---|---|---|---|---|
| 2014 May 31 - 2014 Jun 6 | Evidence from Observations: Reported | ||||||||||||||||||||||||||||||||||||||||||||||||||||||||||||||||||||||||||||||||||||||||||||||||||||||||||||||||||||||||||||||||||||||
|
List of 25 Events for Episode 1 at NE flank
| |||||||||||||||||||||||||||||||||||||||||||||||||||||||||||||||||||||||||||||||||||||||||||||||||||||||||||||||||||||||||||||||||||||||
2013 May 13 - 2013 Jun 26 Confirmed Eruption Max VEI: 3
| Episode 1 | Eruption Episode | Summit crater | ||||||||||||||||||||||||||||||||||||||||||||||||||||||||||||||||||||||||||||||||||||||||||||||||||||||||||||||||||||||||||||||||||||||||||||||||||||||||||||||||||||
|---|---|---|---|---|---|---|---|---|---|---|---|---|---|---|---|---|---|---|---|---|---|---|---|---|---|---|---|---|---|---|---|---|---|---|---|---|---|---|---|---|---|---|---|---|---|---|---|---|---|---|---|---|---|---|---|---|---|---|---|---|---|---|---|---|---|---|---|---|---|---|---|---|---|---|---|---|---|---|---|---|---|---|---|---|---|---|---|---|---|---|---|---|---|---|---|---|---|---|---|---|---|---|---|---|---|---|---|---|---|---|---|---|---|---|---|---|---|---|---|---|---|---|---|---|---|---|---|---|---|---|---|---|---|---|---|---|---|---|---|---|---|---|---|---|---|---|---|---|---|---|---|---|---|---|---|---|---|---|---|---|---|---|---|---|---|
| 2013 May 13 - 2013 Jun 26 | Evidence from Observations: Reported | ||||||||||||||||||||||||||||||||||||||||||||||||||||||||||||||||||||||||||||||||||||||||||||||||||||||||||||||||||||||||||||||||||||||||||||||||||||||||||||||||||||
|
List of 31 Events for Episode 1 at Summit crater
| |||||||||||||||||||||||||||||||||||||||||||||||||||||||||||||||||||||||||||||||||||||||||||||||||||||||||||||||||||||||||||||||||||||||||||||||||||||||||||||||||||||
2007 Aug 15 - 2007 Sep 13 Confirmed Eruption Max VEI: 2
| Episode 1 | Eruption Episode | ||||||||||||||||||||||||||||||||||||||||||||||||||||||||||||
|---|---|---|---|---|---|---|---|---|---|---|---|---|---|---|---|---|---|---|---|---|---|---|---|---|---|---|---|---|---|---|---|---|---|---|---|---|---|---|---|---|---|---|---|---|---|---|---|---|---|---|---|---|---|---|---|---|---|---|---|---|
| 2007 Aug 15 - 2007 Sep 13 | Evidence from Observations: Reported | |||||||||||||||||||||||||||||||||||||||||||||||||||||||||||
|
List of 10 Events for Episode 1
| ||||||||||||||||||||||||||||||||||||||||||||||||||||||||||||
[ 2001 Jun 5 ± 4 days ] Uncertain Eruption
| Episode 1 | Eruption Episode | ||||||||||||||||||||
|---|---|---|---|---|---|---|---|---|---|---|---|---|---|---|---|---|---|---|---|---|
| 2001 Jun 5 ± 4 days - Unknown | Evidence from Unknown | |||||||||||||||||||
|
List of 2 Events for Episode 1
| ||||||||||||||||||||
1996 Sep 11 - 1997 Jan 3 (?) Confirmed Eruption Max VEI: 2
| Episode 1 | Eruption Episode | |||||||||||||||||||||||||||||||||||||||||||||||||||||||||||||||||
|---|---|---|---|---|---|---|---|---|---|---|---|---|---|---|---|---|---|---|---|---|---|---|---|---|---|---|---|---|---|---|---|---|---|---|---|---|---|---|---|---|---|---|---|---|---|---|---|---|---|---|---|---|---|---|---|---|---|---|---|---|---|---|---|---|---|
| 1996 Sep 11 - 1997 Jan 3 (?) | Evidence from Observations: Reported | ||||||||||||||||||||||||||||||||||||||||||||||||||||||||||||||||
|
List of 11 Events for Episode 1
| |||||||||||||||||||||||||||||||||||||||||||||||||||||||||||||||||
1990 Mar 5 - 1990 Mar 5 Confirmed Eruption Max VEI: 2 (?)
| Episode 1 | Eruption Episode | |||||||||||||||||||||||||||||||||||
|---|---|---|---|---|---|---|---|---|---|---|---|---|---|---|---|---|---|---|---|---|---|---|---|---|---|---|---|---|---|---|---|---|---|---|---|
| 1990 Mar 5 - 1990 Mar 5 | Evidence from Observations: Reported | ||||||||||||||||||||||||||||||||||
|
List of 5 Events for Episode 1
| |||||||||||||||||||||||||||||||||||
1986 Apr 16 - 1988 Aug 13 Confirmed Eruption Max VEI: 3
| Episode 1 | Eruption Episode | NNE & SE summit vents, NE & SE flanks | |||||||||||||||||||||||||||||||||||||||||||||||||||||||||||||||||||||
|---|---|---|---|---|---|---|---|---|---|---|---|---|---|---|---|---|---|---|---|---|---|---|---|---|---|---|---|---|---|---|---|---|---|---|---|---|---|---|---|---|---|---|---|---|---|---|---|---|---|---|---|---|---|---|---|---|---|---|---|---|---|---|---|---|---|---|---|---|---|---|
| 1986 Apr 16 - 1988 Aug 13 | Evidence from Observations: Reported | |||||||||||||||||||||||||||||||||||||||||||||||||||||||||||||||||||||
|
List of 12 Events for Episode 1 at NNE & SE summit vents, NE & SE flanks
| ||||||||||||||||||||||||||||||||||||||||||||||||||||||||||||||||||||||
1983 Nov 11 - 1983 Dec 18 Confirmed Eruption Max VEI: 3
| Episode 1 | Eruption Episode | Upper NNE flank | ||||||||||||||||||||||||||||||||||||||||||||
|---|---|---|---|---|---|---|---|---|---|---|---|---|---|---|---|---|---|---|---|---|---|---|---|---|---|---|---|---|---|---|---|---|---|---|---|---|---|---|---|---|---|---|---|---|---|
| 1983 Nov 11 - 1983 Dec 18 | Evidence from Observations: Reported | ||||||||||||||||||||||||||||||||||||||||||||
|
List of 7 Events for Episode 1 at Upper NNE flank
| |||||||||||||||||||||||||||||||||||||||||||||
1983 Jul 11 - 1983 Jul 18 Confirmed Eruption Max VEI: 2 (?)
| Episode 1 | Eruption Episode | |||||||||||||||||||||||||||||||||||
|---|---|---|---|---|---|---|---|---|---|---|---|---|---|---|---|---|---|---|---|---|---|---|---|---|---|---|---|---|---|---|---|---|---|---|---|
| 1983 Jul 11 - 1983 Jul 18 | Evidence from Observations: Reported | ||||||||||||||||||||||||||||||||||
|
List of 5 Events for Episode 1
| |||||||||||||||||||||||||||||||||||
[ 1982 Jul 15 ± 45 days ] Uncertain Eruption
| Episode 1 | Eruption Episode | |||||||||||||||||||||||||
|---|---|---|---|---|---|---|---|---|---|---|---|---|---|---|---|---|---|---|---|---|---|---|---|---|---|
| 1982 Jul 15 ± 45 days - Unknown | Evidence from Unknown | ||||||||||||||||||||||||
|
List of 3 Events for Episode 1
| |||||||||||||||||||||||||
1981 Sep 25 - 1981 Sep 27 Confirmed Eruption Max VEI: 3
| Episode 1 | Eruption Episode | Upper NNE flank (100 m below summit) | ||||||||||||||||||||||||||||||||||||||||||||||||||||||
|---|---|---|---|---|---|---|---|---|---|---|---|---|---|---|---|---|---|---|---|---|---|---|---|---|---|---|---|---|---|---|---|---|---|---|---|---|---|---|---|---|---|---|---|---|---|---|---|---|---|---|---|---|---|---|---|
| 1981 Sep 25 - 1981 Sep 27 | Evidence from Observations: Reported | ||||||||||||||||||||||||||||||||||||||||||||||||||||||
|
List of 9 Events for Episode 1 at Upper NNE flank (100 m below summit)
| |||||||||||||||||||||||||||||||||||||||||||||||||||||||
1981 Mar 30 (in or before) - 1981 May 28 Confirmed Eruption Max VEI: 1
| Episode 1 | Eruption Episode | ||||||||||||||||||||||||||||||
|---|---|---|---|---|---|---|---|---|---|---|---|---|---|---|---|---|---|---|---|---|---|---|---|---|---|---|---|---|---|---|
| 1981 Mar 30 (in or before) - 1981 May 28 | Evidence from Observations: Reported | |||||||||||||||||||||||||||||
|
List of 4 Events for Episode 1
| ||||||||||||||||||||||||||||||
1980 Nov 8 - 1980 Nov 13 Confirmed Eruption Max VEI: 3
| Episode 1 | Eruption Episode | Upper NNE flank | ||||||||||||||||||||||||||||||||||||||||||||||||||||||
|---|---|---|---|---|---|---|---|---|---|---|---|---|---|---|---|---|---|---|---|---|---|---|---|---|---|---|---|---|---|---|---|---|---|---|---|---|---|---|---|---|---|---|---|---|---|---|---|---|---|---|---|---|---|---|---|
| 1980 Nov 8 - 1980 Nov 13 | Evidence from Observations: Reported | ||||||||||||||||||||||||||||||||||||||||||||||||||||||
|
List of 9 Events for Episode 1 at Upper NNE flank
| |||||||||||||||||||||||||||||||||||||||||||||||||||||||
1980 Jul 6 ± 1 days Confirmed Eruption Max VEI: 1
| Episode 1 | Eruption Episode | |||||||||||||||||||||||||
|---|---|---|---|---|---|---|---|---|---|---|---|---|---|---|---|---|---|---|---|---|---|---|---|---|---|
| 1980 Jul 6 ± 1 days - Unknown | Evidence from Observations: Reported | ||||||||||||||||||||||||
|
List of 3 Events for Episode 1
| |||||||||||||||||||||||||
1975 Sep 13 - 1977 Mar 16 (in or after) ± 15 days Confirmed Eruption Max VEI: 2
| Episode 1 | Eruption Episode | |||||||||||||||||||||||||||||||||||||||||||||||||||||||
|---|---|---|---|---|---|---|---|---|---|---|---|---|---|---|---|---|---|---|---|---|---|---|---|---|---|---|---|---|---|---|---|---|---|---|---|---|---|---|---|---|---|---|---|---|---|---|---|---|---|---|---|---|---|---|---|
| 1975 Sep 13 - 1977 Mar 16 (in or after) ± 15 days | Evidence from Observations: Reported | ||||||||||||||||||||||||||||||||||||||||||||||||||||||
|
List of 9 Events for Episode 1
| |||||||||||||||||||||||||||||||||||||||||||||||||||||||
1974 Sep 1 (in or before) - 1975 Jan 13 Confirmed Eruption Max VEI: 3
| Episode 1 | Eruption Episode | |||||||||||||||||||||||||||||||||||||||||||||||||||||||
|---|---|---|---|---|---|---|---|---|---|---|---|---|---|---|---|---|---|---|---|---|---|---|---|---|---|---|---|---|---|---|---|---|---|---|---|---|---|---|---|---|---|---|---|---|---|---|---|---|---|---|---|---|---|---|---|
| 1974 Sep 1 (in or before) - 1975 Jan 13 | Evidence from Observations: Reported | ||||||||||||||||||||||||||||||||||||||||||||||||||||||
|
List of 9 Events for Episode 1
| |||||||||||||||||||||||||||||||||||||||||||||||||||||||
1974 Mar 12 - 1974 Mar 24 (?) Confirmed Eruption Max VEI: 1
| Episode 1 | Eruption Episode | ||||||||||||||||||||||||||||||
|---|---|---|---|---|---|---|---|---|---|---|---|---|---|---|---|---|---|---|---|---|---|---|---|---|---|---|---|---|---|---|
| 1974 Mar 12 - 1974 Mar 24 (?) | Evidence from Observations: Reported | |||||||||||||||||||||||||||||
|
List of 4 Events for Episode 1
| ||||||||||||||||||||||||||||||
1973 Nov 12 - 1973 Nov 13 Confirmed Eruption Max VEI: 2
| Episode 1 | Eruption Episode | Upper NE flank | |||||||||||||||||||||||||||||||||||||||
|---|---|---|---|---|---|---|---|---|---|---|---|---|---|---|---|---|---|---|---|---|---|---|---|---|---|---|---|---|---|---|---|---|---|---|---|---|---|---|---|---|
| 1973 Nov 12 - 1973 Nov 13 | Evidence from Observations: Reported | |||||||||||||||||||||||||||||||||||||||
|
List of 6 Events for Episode 1 at Upper NE flank
| ||||||||||||||||||||||||||||||||||||||||
1966 Mar 15 Confirmed Eruption Max VEI: 2
| Episode 1 | Eruption Episode | Upper NE or NNE flank | |||||||||||||||||||||||||||||
|---|---|---|---|---|---|---|---|---|---|---|---|---|---|---|---|---|---|---|---|---|---|---|---|---|---|---|---|---|---|---|
| 1966 Mar 15 - Unknown | Evidence from Observations: Reported | |||||||||||||||||||||||||||||
|
List of 4 Events for Episode 1 at Upper NE or NNE flank
| ||||||||||||||||||||||||||||||
1960 Jul 2 (?) ± 182 days - 1963 Jun 16 (?) ± 15 days Confirmed Eruption Max VEI: 2
| Episode 1 | Eruption Episode | Upper NE or NNE flank | ||||||||||||||||||||||||
|---|---|---|---|---|---|---|---|---|---|---|---|---|---|---|---|---|---|---|---|---|---|---|---|---|---|
| 1960 Jul 2 (?) ± 182 days - 1963 Jun 16 (?) ± 15 days | Evidence from Observations: Reported | ||||||||||||||||||||||||
|
List of 3 Events for Episode 1 at Upper NE or NNE flank
| |||||||||||||||||||||||||
1958 May 17 - 1958 Aug 28 Confirmed Eruption Max VEI: 2
| Episode 1 | Eruption Episode | Upper NNE flank | |||||||||||||||||||||||||||||
|---|---|---|---|---|---|---|---|---|---|---|---|---|---|---|---|---|---|---|---|---|---|---|---|---|---|---|---|---|---|---|
| 1958 May 17 - 1958 Aug 28 | Evidence from Observations: Reported | |||||||||||||||||||||||||||||
|
List of 4 Events for Episode 1 at Upper NNE flank
| ||||||||||||||||||||||||||||||
1953 Nov 25 - 1954 Aug 16 ± 15 days Confirmed Eruption Max VEI: 1 (?)
| Episode 1 | Eruption Episode | Upper NE or NNE flank | |||||||||||||||||||
|---|---|---|---|---|---|---|---|---|---|---|---|---|---|---|---|---|---|---|---|---|
| 1953 Nov 25 - 1954 Aug 16 ± 15 days | Evidence from Observations: Reported | |||||||||||||||||||
|
List of 2 Events for Episode 1 at Upper NE or NNE flank
| ||||||||||||||||||||
1951 Oct 16 ± 15 days - 1952 Feb 16 (?) ± 15 days Confirmed Eruption Max VEI: 2
| Episode 1 | Eruption Episode | Upper NE or NNE flank | ||||||||||||||||||||||||
|---|---|---|---|---|---|---|---|---|---|---|---|---|---|---|---|---|---|---|---|---|---|---|---|---|---|
| 1951 Oct 16 ± 15 days - 1952 Feb 16 (?) ± 15 days | Evidence from Observations: Reported | ||||||||||||||||||||||||
|
List of 3 Events for Episode 1 at Upper NE or NNE flank
| |||||||||||||||||||||||||
1950 Jul 31 - 1951 May 16 ± 15 days Confirmed Eruption Max VEI: 2
| Episode 1 | Eruption Episode | Upper NE or NNE flank | ||||||||||||||||||||||||
|---|---|---|---|---|---|---|---|---|---|---|---|---|---|---|---|---|---|---|---|---|---|---|---|---|---|
| 1950 Jul 31 - 1951 May 16 ± 15 days | Evidence from Observations: Reported | ||||||||||||||||||||||||
|
List of 3 Events for Episode 1 at Upper NE or NNE flank
| |||||||||||||||||||||||||
1936 - 1948 May (?) Confirmed Eruption Max VEI: 3
| Episode 1 | Eruption Episode | ||||||||||||||||||||||||||||||||||||||||
|---|---|---|---|---|---|---|---|---|---|---|---|---|---|---|---|---|---|---|---|---|---|---|---|---|---|---|---|---|---|---|---|---|---|---|---|---|---|---|---|---|
| 1936 - 1948 May (?) | Evidence from Observations: Reported | |||||||||||||||||||||||||||||||||||||||
|
List of 6 Events for Episode 1
| ||||||||||||||||||||||||||||||||||||||||
1929 Mar - 1931 Aug Confirmed Eruption Max VEI: 2
| Episode 1 | Eruption Episode | ||||||||||||||||||||||||||||||
|---|---|---|---|---|---|---|---|---|---|---|---|---|---|---|---|---|---|---|---|---|---|---|---|---|---|---|---|---|---|---|
| 1929 Mar - 1931 Aug | Evidence from Observations: Reported | |||||||||||||||||||||||||||||
|
List of 4 Events for Episode 1
| ||||||||||||||||||||||||||||||
1924 Jan 17 Confirmed Eruption Max VEI: 2
| Episode 1 | Eruption Episode | |||||||||||||||||||||||||
|---|---|---|---|---|---|---|---|---|---|---|---|---|---|---|---|---|---|---|---|---|---|---|---|---|---|
| 1924 Jan 17 - Unknown | Evidence from Observations: Reported | ||||||||||||||||||||||||
|
List of 3 Events for Episode 1
| |||||||||||||||||||||||||
1922 Dec 24 - 1923 Feb 28 ± 60 days Confirmed Eruption Max VEI: 2
| Episode 1 | Eruption Episode | |||||||||||||||||||||||||
|---|---|---|---|---|---|---|---|---|---|---|---|---|---|---|---|---|---|---|---|---|---|---|---|---|---|
| 1922 Dec 24 - 1923 Feb 28 ± 60 days | Evidence from Observations: Reported | ||||||||||||||||||||||||
|
List of 3 Events for Episode 1
| |||||||||||||||||||||||||
1917 Oct Confirmed Eruption Max VEI: 2
| Episode 1 | Eruption Episode | ||||||||||||||||||||||||||||||
|---|---|---|---|---|---|---|---|---|---|---|---|---|---|---|---|---|---|---|---|---|---|---|---|---|---|---|---|---|---|---|
| 1917 Oct - Unknown | Evidence from Observations: Reported | |||||||||||||||||||||||||||||
|
List of 4 Events for Episode 1
| ||||||||||||||||||||||||||||||
1914 Jul 6 Confirmed Eruption Max VEI: 2
| Episode 1 | Eruption Episode | |||||||||||||||||||||||||
|---|---|---|---|---|---|---|---|---|---|---|---|---|---|---|---|---|---|---|---|---|---|---|---|---|---|
| 1914 Jul 6 - Unknown | Evidence from Observations: Reported | ||||||||||||||||||||||||
|
List of 3 Events for Episode 1
| |||||||||||||||||||||||||
1906 - 1911 Dec 7 (?) Confirmed Eruption Max VEI: 3
| Episode 1 | Eruption Episode | Summit and north flank fissure | |||||||||||||||||||||||||||||||||||||||||||||||||
|---|---|---|---|---|---|---|---|---|---|---|---|---|---|---|---|---|---|---|---|---|---|---|---|---|---|---|---|---|---|---|---|---|---|---|---|---|---|---|---|---|---|---|---|---|---|---|---|---|---|---|
| 1906 - 1911 Dec 7 (?) | Evidence from Observations: Reported | |||||||||||||||||||||||||||||||||||||||||||||||||
|
List of 8 Events for Episode 1 at Summit and north flank fissure
| ||||||||||||||||||||||||||||||||||||||||||||||||||
1901 Confirmed Eruption Max VEI: 2 (?)
| Episode 1 | Eruption Episode | ||||||||||||||||||||
|---|---|---|---|---|---|---|---|---|---|---|---|---|---|---|---|---|---|---|---|---|
| 1901 - Unknown | Evidence from Observations: Reported | |||||||||||||||||||
|
List of 2 Events for Episode 1
| ||||||||||||||||||||
1894 Confirmed Eruption Max VEI: 2 (?)
| Episode 1 | Eruption Episode | ||||||||||||||||||||
|---|---|---|---|---|---|---|---|---|---|---|---|---|---|---|---|---|---|---|---|---|
| 1894 - Unknown | Evidence from Observations: Reported | |||||||||||||||||||
|
List of 2 Events for Episode 1
| ||||||||||||||||||||
1892 Confirmed Eruption Max VEI: 2 (?)
| Episode 1 | Eruption Episode | ||||||||||||||||||||
|---|---|---|---|---|---|---|---|---|---|---|---|---|---|---|---|---|---|---|---|---|
| 1892 - Unknown | Evidence from Observations: Reported | |||||||||||||||||||
|
List of 2 Events for Episode 1
| ||||||||||||||||||||
1886 Confirmed Eruption Max VEI: 2 (?)
| Episode 1 | Eruption Episode | ||||||||||||||||||||
|---|---|---|---|---|---|---|---|---|---|---|---|---|---|---|---|---|---|---|---|---|
| 1886 - Unknown | Evidence from Observations: Reported | |||||||||||||||||||
|
List of 2 Events for Episode 1
| ||||||||||||||||||||
1880 Confirmed Eruption Max VEI: 1 (?)
| Episode 1 | Eruption Episode | ||||||||||||||||||||
|---|---|---|---|---|---|---|---|---|---|---|---|---|---|---|---|---|---|---|---|---|
| 1880 - Unknown | Evidence from Observations: Reported | |||||||||||||||||||
|
List of 2 Events for Episode 1
| ||||||||||||||||||||
1866 Mar 14 Confirmed Eruption Max VEI: 2
| Episode 1 | Eruption Episode | |||||||||||||||||||||||||
|---|---|---|---|---|---|---|---|---|---|---|---|---|---|---|---|---|---|---|---|---|---|---|---|---|---|
| 1866 Mar 14 - Unknown | Evidence from Observations: Reported | ||||||||||||||||||||||||
|
List of 3 Events for Episode 1
| |||||||||||||||||||||||||
[ 1852 ] Uncertain Eruption
| Episode 1 | Eruption Episode | Upper north flank | |||||||||||||||||||
|---|---|---|---|---|---|---|---|---|---|---|---|---|---|---|---|---|---|---|---|---|
| 1852 - Unknown | Evidence from Unknown | |||||||||||||||||||
|
List of 2 Events for Episode 1 at Upper north flank
| ||||||||||||||||||||
1846 Aug - 1846 Aug Confirmed Eruption Max VEI: 2
| Episode 1 | Eruption Episode | |||||||||||||||||||||||||||||||||||
|---|---|---|---|---|---|---|---|---|---|---|---|---|---|---|---|---|---|---|---|---|---|---|---|---|---|---|---|---|---|---|---|---|---|---|---|
| 1846 Aug - 1846 Aug | Evidence from Observations: Reported | ||||||||||||||||||||||||||||||||||
|
List of 5 Events for Episode 1
| |||||||||||||||||||||||||||||||||||
1845 Aug 12 Confirmed Eruption Max VEI: 2
| Episode 1 | Eruption Episode | ||||||||||||||||||||||||||||||||||||||||
|---|---|---|---|---|---|---|---|---|---|---|---|---|---|---|---|---|---|---|---|---|---|---|---|---|---|---|---|---|---|---|---|---|---|---|---|---|---|---|---|---|
| 1845 Aug 12 - Unknown | Evidence from Observations: Reported | |||||||||||||||||||||||||||||||||||||||
|
List of 6 Events for Episode 1
| ||||||||||||||||||||||||||||||||||||||||
1838 Confirmed Eruption Max VEI: 1
| Episode 1 | Eruption Episode | |||||||||||||||||||||||||
|---|---|---|---|---|---|---|---|---|---|---|---|---|---|---|---|---|---|---|---|---|---|---|---|---|---|
| 1838 - Unknown | Evidence from Observations: Reported | ||||||||||||||||||||||||
|
List of 3 Events for Episode 1
| |||||||||||||||||||||||||
1825 Confirmed Eruption Max VEI: 2 (?)
| Episode 1 | Eruption Episode | ||||||||||||||||||||
|---|---|---|---|---|---|---|---|---|---|---|---|---|---|---|---|---|---|---|---|---|
| 1825 - Unknown | Evidence from Observations: Reported | |||||||||||||||||||
|
List of 2 Events for Episode 1
| ||||||||||||||||||||
1817 Confirmed Eruption Max VEI: 2
| Episode 1 | Eruption Episode | |||||||||||||||||||||||||
|---|---|---|---|---|---|---|---|---|---|---|---|---|---|---|---|---|---|---|---|---|---|---|---|---|---|
| 1817 - Unknown | Evidence from Observations: Reported | ||||||||||||||||||||||||
|
List of 3 Events for Episode 1
| |||||||||||||||||||||||||
1790 Confirmed Eruption Max VEI: 2
| Episode 1 | Eruption Episode | ||||||||||||||||||||
|---|---|---|---|---|---|---|---|---|---|---|---|---|---|---|---|---|---|---|---|---|
| 1790 - Unknown | Evidence from Observations: Reported | |||||||||||||||||||
|
List of 2 Events for Episode 1
| ||||||||||||||||||||
1762 - 1786 Confirmed Eruption Max VEI: 4 (?)
| Episode 1 | Eruption Episode | Volcano Uncertain | ||||||||||||||||||||||||
|---|---|---|---|---|---|---|---|---|---|---|---|---|---|---|---|---|---|---|---|---|---|---|---|---|---|
| 1762 - 1786 | Evidence from Unknown | ||||||||||||||||||||||||
| Intermitent eruptive activity from 1762 to 1786 has variably been attributed to Pavlof or Pavlof Sister volcano. The AVO website noted that "Grewingk (1850, translated 2003 by Fritz Jaensch) reported Pavlof active from 1762-1786, and said that the northern crater collapsed in 1786. Veniaminov (1840, translated by Lydia T. Black and R.H. Geoghegan, 1984) reports: "Before 1786 the northern, or interior, half burned. In 1786, following an eruption, at the time of a severe earthquake and tremendous thunder, its upper part collapsed; at the same time the crater opened in the southern or shore-ward half, whence smoke is emitted to this day." Hantke (1955) also reports: "From 1762 to 1786, only the northern vent was active. That crater was then closed off by a plug. Eruptions then came out of southern vent." Kennedy and Waldron (1955), and McNutt (1985), suggests that some or all of this activity may be from Pavlof Sister. Coats (1950) lists this eruption as from Pavlof Sister. Sapper (1927) estimates between 10^8 to 10^9 cubic meters of tephra were erupted." Waythomas et al. (2006) attributed the 1762-1786 activity to Pavlof volcano. | |||||||||||||||||||||||||
|
List of 3 Events for Episode 1 at Volcano Uncertain
| |||||||||||||||||||||||||
There is no Deformation History data available for Pavlof.
There is data available for 6 emission periods. Expand each entry for additional details.
| Start Date: 2016 Mar 27 | Stop Date: 2016 Mar 27 | Method: Satellite (Aura OMI) |
| SO2 Altitude Min: 9 km | SO2 Altitude Max: 9 km | Total SO2 Mass: 20 kt |
Data Details
| Date Start | Date End | Assumed SO2 Altitude | SO2 Algorithm | SO2 Mass |
| 20160327 | 9.0 | 20.000 |
| Start Date: 2014 Nov 15 | Stop Date: 2014 Nov 15 | Method: Satellite (Aqua AIRS) |
| SO2 Altitude Min: 12 km | SO2 Altitude Max: 12 km | Total SO2 Mass: 46 kt |
Data Details
| Date Start | Date End | Assumed SO2 Altitude | SO2 Algorithm | SO2 Mass |
| 20141115 | 12.0 | 46.000 |
| Start Date: 2014 Jun 03 | Stop Date: 2014 Jun 03 | Method: Satellite (Aura OMI) |
| SO2 Altitude Min: 13 km | SO2 Altitude Max: 13 km | Total SO2 Mass: 10 kt |
Data Details
| Date Start | Date End | Assumed SO2 Altitude | SO2 Algorithm | SO2 Mass |
| 20140603 | 12.5 | 10.000 |
| Start Date: 2013 Jun 25 | Stop Date: 2013 Jun 25 | Method: Satellite (Aura OMI) |
| SO2 Altitude Min: 13 km | SO2 Altitude Max: 13 km | Total SO2 Mass: 5 kt |
Data Details
| Date Start | Date End | Assumed SO2 Altitude | SO2 Algorithm | SO2 Mass |
| 20130625 | 12.5 | 5.000 |
| Start Date: 1986 Apr 19 | Stop Date: 1986 Apr 19 | Method: Satellite (Nimbus-7 TOMS) |
| SO2 Altitude Min: 16 km | SO2 Altitude Max: 16 km | Total SO2 Mass: 70 kt |
Data Details
| Date Start | Date End | Assumed SO2 Altitude | SO2 Algorithm | SO2 Mass |
| 19860419 | 16.0 | 70.000 |
| Start Date: 1983 Nov 15 | Stop Date: 1983 Nov 15 | Method: Satellite (Nimbus-7 TOMS) |
| SO2 Altitude Min: 8 km | SO2 Altitude Max: 8 km | Total SO2 Mass: 50 kt |
Data Details
| Date Start | Date End | Assumed SO2 Altitude | SO2 Algorithm | SO2 Mass |
| 19831115 | 7.5 | 50.000 |
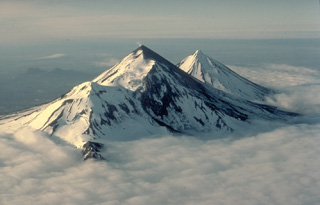 The twin volcanoes of Pavlof (left) and Pavlof Sister (right) rise above a sea of clouds on the southern Alaska Peninsula. The two conical stratovolcanoes are constructed on the same NE-SW line as Little Pavlof, a flank cone in the left center of this 1978 view from the SW. Pavlof, its NE slopes darkened by ash, is the most active volcano of the Aleutian arc. Ash-free Pavlof Sister is somewhat more glacially dissected than Pavlof and has had only one historical eruption.
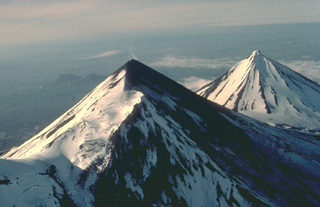 The twin volcanoes of Pavlof (left) and Pavlof Sister (right) are prominent landmarks on the southern Alaska Peninsula. The summits of the two conical stratovolcanoes are only 5 km apart. This 1978 view from the SW shows a steam plume rising from the 2519-m summit of Pavlof, the most active volcano of the Aleutian arc. Pavlof Sister, somewhat more eroded than Pavlof, has had only a single historical eruption, in the 18th century.
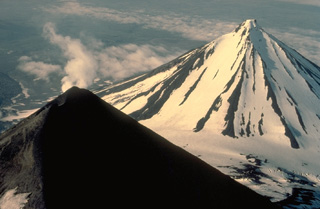 A steam plume rises from the summit of Pavlof volcano, whose upper slopes are snow-free as a result of its frequent eruptions. More-extensive glacial dissection of Pavlof Sister volcano (upper right) has produced a series of parasol-ribbed ridges that radiate from the summit. Only one historical eruption is known from Pavlof Sister.
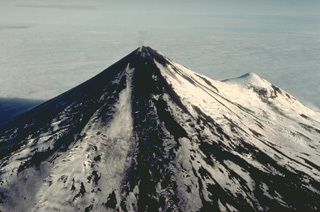 Pavlof volcano is the most active of the Aleutian arc and one of the most prominent landmarks of the southern Alaska Peninsula. A small steam plume rises from the 2519-m summit of Pavlof in this aerial view from the NW with the flank cone of Little Pavlof on the right. The conical volcano was constructed NE of the rim of Emmons Lake caldera and has active vents high on the north and east sides near the summit. Its frequent eruptions are typically strombolian and vulcanian in character, with occasional spatter-fed lava flows.
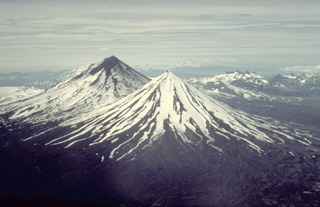 Pavlof Sister (center) and Pavlof (upper left) are twin stratovolcanoes whose summits are only 5 km apart. A low saddle about 1100-m high separates the conical volcanoes. They are the most prominent features along a NE-SW-trending line of vents that extends from Emmons Lake caldera, which is behind 2519-m Pavlof volcano in this view from the NE, to 2142-m Pavlof Sister volcano.
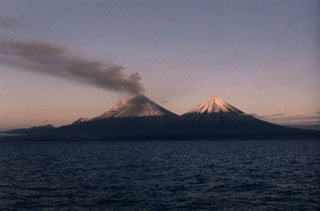 An ash plume disperses to the south in mid-July 1986, three months after the start of an eruption of Pavlof that lasted nearly 2.5 years. This photo was taken from the west on a fishing boat in Pavlof Bay, with Pavlof Sister to the right. The 1986-88 eruption produced intermittent ashfall and lava flows from two vents near the summit, one halfway down the SE flank, and another 600 m below the summit on the NE flank. Lava flows traveled to the N, NE, SE, ESE, and SSE, the latter to within 600 m of the Pavlof Bay shoreline.
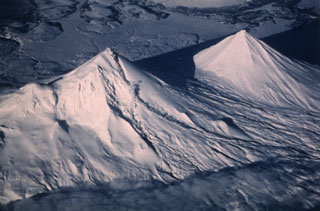 Pavlof (left) and Pavlof Sister (right) are shown in this 20 January 1987 view from the SW. Small steam plumes rise along the length of a lava flow descending a valley on the SE (right) flank of Pavlof. Recent snowfall covers ashfall that was frequently deposited on its slopes. This eruption began with explosive activity on 16 April 1986 and continued until 13 August 1988. Lava flows traveled down the N, NE, SE, ESE, and SSE flanks, the latter reaching to within 600 m of Pavlof Bay.
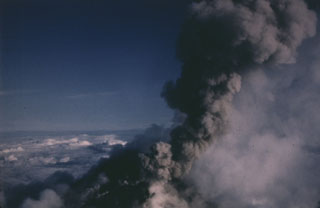 An ash plume rises from vents near the summit of Pavlof on 10 June 1987 in this view from the NNE. Intermittent explosive eruptions took place from vents at the summit and flanks from April 1986 until August 1988, and lava flows descended the flanks in several direction. One lava flow reached to within 600 m of Pavlof Bay and another descended to the saddle between Pavlof and Pavlof Sister.
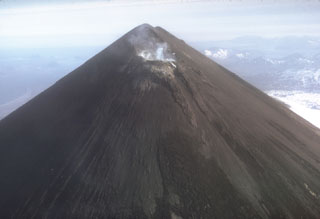 The entire upper flanks of Pavlof are darkened by ash in this November 1973 photo taken after a 12-13 November explosive eruption. Small plumes rise from the crater on the uppermost NE flank just below the normally snow-covered summit.
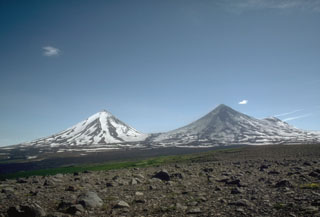 The summits of Pavlof Sister (left) and Pavlof (right) rise above a roughly 1,100-m-elevation saddle. They are viewed here in 1975 from lowlands to the NW. Pavlof is darkened by recent ash deposition and has been the source of frequent eruptions in historical time. Little Pavlof, a cone on the right flank of Pavlof, was also constructed along a line of vents trending NE from Emmons Lake caldera.
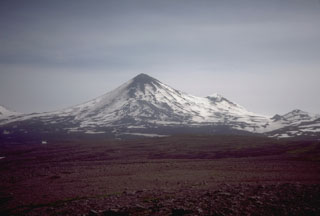 Pavlof, rising above low plains to its NW, is one of Alaska's most active volcanoes. It is part of a NNE-SSW-trending line of volcanoes near the tip of the Alaskan Peninsula. Little Pavlof is the small cone on the right horizon. The low saddle to the left separates Pavlof from Pavlof Sister, whose lower flanks are seen to the far left.
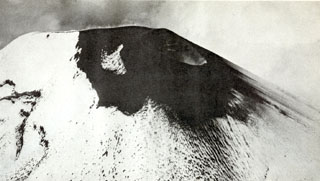 Ash surrounds a small crater on the NE side of the summit in 1942. Pavlof was in a period of almost continuous minor explosive activity from 1936 to 1948. Significant eruptions took place in 1936, July 1937, and 1942. By 1942 eruptions had filled the fissure that formed during the 1911 eruption.
 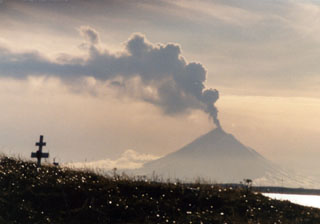 An ash plume rises above Pavlof volcano on 13 November 1996, as seen from Nelson Lagoon about 70 km NE. Intermittent small ash and Strombolian eruptions began on 15 September and lava fountains produced a lava flow. Eruption plumes rose above 6.7 km altitude on four days between 18 October and 11 December 1996.
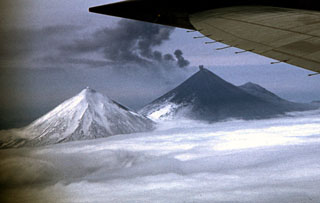 A small ash plume rises from the summit crater of Pavlof volcano on 28 May 1960 as the detached plume from an earlier explosion drifts away to the east. Ash deposits are visible on the flanks in this view from the north. Mild ash eruptions took place from about 1960 to 1963, especially during July 1962 to June 1963. The peak to the left is Pavlof Sister, and Little Pavlof forms the smaller peak to the right of Pavlof.
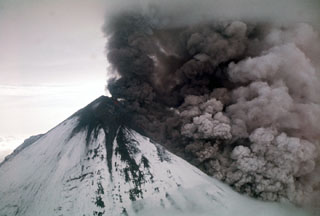 An ash plume rises above the surface of a pyroclastic flow descending the flanks of Pavlof on the Alaska Peninsula in 1975. Incandescent lava can be seen on the upper cone. Intermittent phreatomagmatic to magmatic eruptions began 13 September 1975 and continued until at least March 1977. Possible lava flows or lahars were reported in October 1975 and December 1976.
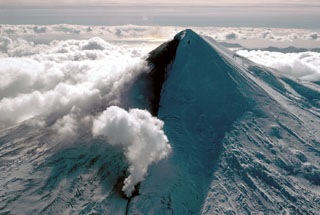 A steam plume (bottom center) rises from a lava flow front descending the flank of Pavlof on 23 September 1996. The eruption began on 15 September with lava fountains that fed the lava flow.
 An ash plume from Pavlof on the evening of 30 August 2007 at 2120 local time. This view is to the S, out of the right side of a plane flying to Anchorage from Cold Bay. The ash plume height was approximately 5.2-5.5 km.
The maps shown below have been scanned from the GVP map archives and include the volcano on this page. Clicking on the small images will load the full 300 dpi map. Very small-scale maps (such as world maps) are not included. The maps database originated over 30 years ago, but was only recently updated and connected to our main database. We welcome users to tell us if they see incorrect information or other problems with the maps; please use the Contact GVP link at the bottom of the page to send us email.
The following 6 samples associated with this volcano can be found in the Smithsonian's NMNH Department of Mineral Sciences collections, and may be availble for research (contact the Rock and Ore Collections Manager). Catalog number links will open a window with more information.
| Catalog Number | Sample Description | Lava Source | Collection Date |
|---|---|---|---|
| NMNH 116142-1 | Andesitic Basalt | -- | -- |
| NMNH 116142-2 | Andesitic Basalt | -- | -- |
| NMNH 116142-3 | Andesitic Basalt | -- | -- |
| NMNH 117233-167 | Volcanic Rock | -- | -- |
| NMNH 38548 | Volcanic Dust | -- | -- |
| NMNH 88321 | Volcanic Ash | -- | -- |
| Alaska Volcano Observatory (Link to Pavlof) | The Alaska Volcano Observatory (AVO) is a joint program of the U.S. Geological Survey (USGS), the Geophysical Institute of the University of Alaska Fairbanks (UAFGI), and the State of Alaska Division of Geological and Geophysical Surveys (ADGGS). AVO was formed in 1988, and uses federal, state, and university resources to monitor and study Alaska's hazardous volcanoes, to predict and record eruptive activity, and to mitigate volcanic hazards to life and property. |
| Copernicus Browser | The Copernicus Browser replaced the Sentinel Hub Playground browser in 2023, to provide access to Earth observation archives from the Copernicus Data Space Ecosystem, the main distribution platform for data from the EU Copernicus missions. |
| MIROVA | Middle InfraRed Observation of Volcanic Activity (MIROVA) is a near real time volcanic hot-spot detection system based on the analysis of MODIS (Moderate Resolution Imaging Spectroradiometer) data. In particular, MIROVA uses the Middle InfraRed Radiation (MIR), measured over target volcanoes, in order to detect, locate and measure the heat radiation sourced from volcanic activity. |
| MODVOLC Thermal Alerts | Using infrared satellite Moderate Resolution Imaging Spectroradiometer (MODIS) data, scientists at the Hawai'i Institute of Geophysics and Planetology, University of Hawai'i, developed an automated system called MODVOLC to map thermal hot-spots in near real time. For each MODIS image, the algorithm automatically scans each 1 km pixel within it to check for high-temperature hot-spots. When one is found the date, time, location, and intensity are recorded. MODIS looks at every square km of the Earth every 48 hours, once during the day and once during the night, and the presence of two MODIS sensors in space allows at least four hot-spot observations every two days. Each day updated global maps are compiled to display the locations of all hot spots detected in the previous 24 hours. There is a drop-down list with volcano names which allow users to 'zoom-in' and examine the distribution of hot-spots at a variety of spatial scales. |
|
WOVOdat
Single Volcano View Temporal Evolution of Unrest Side by Side Volcanoes |
WOVOdat is a database of volcanic unrest; instrumentally and visually recorded changes in seismicity, ground deformation, gas emission, and other parameters from their normal baselines. It is sponsored by the World Organization of Volcano Observatories (WOVO) and presently hosted at the Earth Observatory of Singapore.
GVMID Data on Volcano Monitoring Infrastructure The Global Volcano Monitoring Infrastructure Database GVMID, is aimed at documenting and improving capabilities of volcano monitoring from the ground and space. GVMID should provide a snapshot and baseline view of the techniques and instrumentation that are in place at various volcanoes, which can be use by volcano observatories as reference to setup new monitoring system or improving networks at a specific volcano. These data will allow identification of what monitoring gaps exist, which can be then targeted by remote sensing infrastructure and future instrument deployments. |
| Volcanic Hazard Maps | The IAVCEI Commission on Volcanic Hazards and Risk has a Volcanic Hazard Maps database designed to serve as a resource for hazard mappers (or other interested parties) to explore how common issues in hazard map development have been addressed at different volcanoes, in different countries, for different hazards, and for different intended audiences. In addition to the comprehensive, searchable Volcanic Hazard Maps Database, this website contains information about diversity of volcanic hazard maps, illustrated using examples from the database. This site is for educational purposes related to volcanic hazard maps. Hazard maps found on this website should not be used for emergency purposes. For the most recent, official hazard map for a particular volcano, please seek out the proper institutional authorities on the matter. |
| IRIS seismic stations/networks | Incorporated Research Institutions for Seismology (IRIS) Data Services map showing the location of seismic stations from all available networks (permanent or temporary) within a radius of 0.18° (about 20 km at mid-latitudes) from the given location of Pavlof. Users can customize a variety of filters and options in the left panel. Note that if there are no stations are known the map will default to show the entire world with a "No data matched request" error notice. |
| UNAVCO GPS/GNSS stations | Geodetic Data Services map from UNAVCO showing the location of GPS/GNSS stations from all available networks (permanent or temporary) within a radius of 20 km from the given location of Pavlof. Users can customize the data search based on station or network names, location, and time window. Requires Adobe Flash Player. |
| DECADE Data | The DECADE portal, still in the developmental stage, serves as an example of the proposed interoperability between The Smithsonian Institution's Global Volcanism Program, the Mapping Gas Emissions (MaGa) Database, and the EarthChem Geochemical Portal. The Deep Earth Carbon Degassing (DECADE) initiative seeks to use new and established technologies to determine accurate global fluxes of volcanic CO2 to the atmosphere, but installing CO2 monitoring networks on 20 of the world's 150 most actively degassing volcanoes. The group uses related laboratory-based studies (direct gas sampling and analysis, melt inclusions) to provide new data for direct degassing of deep earth carbon to the atmosphere. |
| Large Eruptions of Pavlof | Information about large Quaternary eruptions (VEI >= 4) is cataloged in the Large Magnitude Explosive Volcanic Eruptions (LaMEVE) database of the Volcano Global Risk Identification and Analysis Project (VOGRIPA). |
| EarthChem | EarthChem develops and maintains databases, software, and services that support the preservation, discovery, access and analysis of geochemical data, and facilitate their integration with the broad array of other available earth science parameters. EarthChem is operated by a joint team of disciplinary scientists, data scientists, data managers and information technology developers who are part of the NSF-funded data facility Integrated Earth Data Applications (IEDA). IEDA is a collaborative effort of EarthChem and the Marine Geoscience Data System (MGDS). |