Instituto Geofísico del Perú (IGP) reported that the eruption at Sabancaya continued at moderate levels during 8-14 April with a daily average of 44 explosions. Gas-and-ash plumes rose as high as 3 km above the summit and drifted less than 10 km E, SE, and S. Thermal anomalies over the lava dome in the summit crater were identified in satellite data. Slight inflation was detected near the Hualca Hualca sector (4 km N). Sulfur dioxide emissions were at moderate levels, 524 tons per day. The Alert Level remained at Orange (the third level on a four-color scale) and the public were warned to stay outside of a 12 km radius.
Source: Instituto Geofísico del Perú (IGP)
Explosions, gas-and-ash plumes, and thermal activity persist during November 2022-April 2023
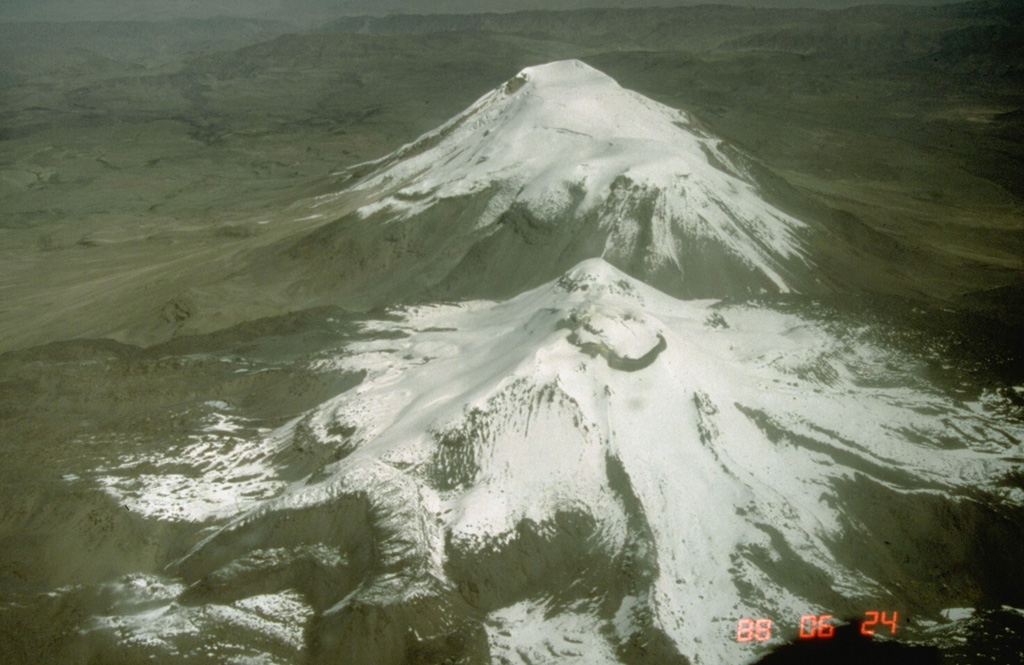
Sabancaya is located in Peru, NE of Ampato and SE of Hualca Hualca. Eruptions date back to 1750 and have been characterized by explosions, phreatic activity, ash plumes, and ashfall. The current eruption period began in November 2016 and has more recently consisted of daily explosions, gas-and-ash plumes, and thermal activity (BGVN 47:11). This report updates activity during November 2022 through April 2023 using information from Instituto Geophysico del Peru (IGP) that use weekly activity reports and various satellite data.
Intermittent low-to-moderate power thermal anomalies were reported by the MIROVA project during November 2022 through April 2023 (figure 119). There were few short gaps in thermal activity during mid-December 2022, late December-to-early January 2023, late January to mid-February, and late February. According to data recorded by the MODVOLC thermal algorithm, there were a total of eight thermal hotspots: three in November 2022, three in February 2023, one in March, and one in April. On clear weather days, some of this thermal anomaly was visible in infrared satellite imagery showing the active lava dome in the summit crater (figure 120). Almost daily moderate-to-strong sulfur dioxide plumes were recorded during the reporting period by the TROPOMI instrument on the Sentinel-5P satellite (figure 121). Many of these plumes exceeded 2 Dobson Units (DU) and drifted in multiple directions.
 |
Figure 119. Intermittent low-to-moderate thermal anomalies were detected during November 2022 through April 2023 at Sabancaya, as shown in this MIROVA graph (Log Radiative Power). There were brief gaps in thermal activity during mid-December 2022, late December-to-early January 2023, late January to mid-February, and late February. Courtesy of MIROVA. |
 |
Figure 120. Infrared (bands 12, 11, 8A) satellite images showed a constant thermal anomaly in the summit crater of Sabancaya on 14 January 2023 (top left), 28 February 2023 (top right), 5 March 2023 (bottom left), and 19 April 2023 (bottom right), represented by the active lava dome. Sometimes gas-and-steam and ash emissions also accompanied this activity. Courtesy of Copernicus Browser. |
 |
Figure 121. Moderate-to-strong sulfur dioxide plumes were detected almost every day, rising from Sabancaya by the TROPOMI instrument on the Sentinel-5P satellite throughout the reporting period; the DU (Dobson Unit) density values were often greater than 2. Plumes from 23 November 2022 (top left), 26 December 2022 (top middle), 10 January 2023 (top right), 15 February 2023 (bottom left), 13 March 2023 (bottom middle), and 21 April 2023 (bottom right) that drifted SW, SW, W, SE, W, and SW, respectively. Courtesy of NASA Global Sulfur Dioxide Monitoring Page. |
IGP reported that moderate activity during November and December 2022 continued; during November, an average number of explosions were reported each week: 30, 33, 36, and 35, and during December, it was 32, 40, 47, 52, and 67. Gas-and-ash plumes in November rose 3-3.5 km above the summit and drifted E, NE, SE, S, N, W, and SW. During December the gas-and-ash plumes rose 2-4 km above the summit and drifted in different directions. There were 1,259 volcanic earthquakes recorded during November and 1,693 during December. Seismicity also included volcano-tectonic-type events that indicate rock fracturing events. Slight inflation was observed in the N part of the volcano near Hualca Hualca (4 km N). Thermal activity was frequently reported in the crater at the active lava dome (figure 120).
Explosive activity continued during January and February 2023. The average number of explosions were reported each week during January (51, 50, 60, and 59) and February (43, 54, 51, and 50). Gas-and-ash plumes rose 1.6-2.9 km above the summit and drifted NW, SW, and W during January and rose 1.4-2.8 above the summit and drifted W, SW, E, SE, N, S, NW, and NE during February. IGP also detected 1,881 volcanic earthquakes during January and 1,661 during February. VT-type earthquakes were also reported. Minor inflation persisted near Hualca Hualca. Satellite imagery showed continuous thermal activity in the crater at the lava dome (figure 120).
During March, the average number of explosions each week was 46, 48, 31, 35, and 22 and during April, it was 29, 41, 31, and 27. Accompanying gas-and-ash plumes rose 1.7-2.6 km above the summit crater and drifted W, SW, NW, S, and SE during March. According to a Buenos Aires Volcano Ash Advisory Center (VAAC) notice, on 22 March at 1800 through 23 March an ash plume rose to 7 km altitude and drifted NW. By 0430 an ash plume rose to 7.6 km altitude and drifted W. On 24 and 26 March continuous ash emissions rose to 7.3 km altitude and drifted SW and on 28 March ash emissions rose to 7.6 km altitude. During April, gas-and-ash plumes rose 1.6-2.5 km above the summit and drifted W, SW, S, NW, NE, and E. Frequent volcanic earthquakes were recorded, with 1,828 in March and 1,077 in April, in addition to VT-type events. Thermal activity continued to be reported in the summit crater at the lava dome (figure 120).
Information Contacts: Instituto Geofisico del Peru (IGP), Centro Vulcanológico Nacional (CENVUL), Calle Badajoz N° 169 Urb. Mayorazgo IV Etapa, Ate, Lima 15012, Perú (URL: https://www.igp.gob.pe/servicios/centro-vulcanologico-nacional/inicio); Buenos Aires Volcanic Ash Advisory Center (VAAC), Servicio Meteorológico Nacional-Fuerza Aérea Argentina, 25 de mayo 658, Buenos Aires, Argentina (URL: http://www.smn.gov.ar/vaac/buenosaires/inicio.php); MIROVA (Middle InfraRed Observation of Volcanic Activity), a collaborative project between the Universities of Turin and Florence (Italy) supported by the Centre for Volcanic Risk of the Italian Civil Protection Department (URL: http://www.mirovaweb.it/); Hawai'i Institute of Geophysics and Planetology (HIGP) - MODVOLC Thermal Alerts System, School of Ocean and Earth Science and Technology (SOEST), Univ. of Hawai'i, 2525 Correa Road, Honolulu, HI 96822, USA (URL: http://modis.higp.hawaii.edu/); NASA Global Sulfur Dioxide Monitoring Page, Atmospheric Chemistry and Dynamics Laboratory, NASA Goddard Space Flight Center (NASA/GSFC), 8800 Greenbelt Road, Goddard MD 20771, USA (URL: https://so2.gsfc.nasa.gov/); Copernicus Browser, Copernicus Data Space Ecosystem, European Space Agency (URL: https://dataspace.copernicus.eu/browser/).
2024: January
| February
| March
| April
2023: January
| February
| March
| April
| May
| June
| July
| August
| September
| October
| November
| December
2022: February
| April
| May
| June
| July
| August
| September
| November
| December
2021: January
| February
| March
| April
| May
| June
| July
| August
| October
| November
| December
2020: January
| February
| April
| May
| June
| July
| August
| September
| November
| December
2019: February
| March
| May
| June
| July
| August
| September
| October
| November
| December
2018: January
| February
| March
| April
| May
| June
| July
| August
| September
| October
| November
| December
2017: January
| February
| March
| April
| May
| June
| July
| August
| September
| October
| November
| December
2016: September
| November
| December
2015: July
| August
| December
2014: July
| August
| September
| October
| December
2013: February
| March
| April
| May
Instituto Geofísico del Perú (IGP) reported that the eruption at Sabancaya continued at moderate levels during 8-14 April with a daily average of 44 explosions. Gas-and-ash plumes rose as high as 3 km above the summit and drifted less than 10 km E, SE, and S. Thermal anomalies over the lava dome in the summit crater were identified in satellite data. Slight inflation was detected near the Hualca Hualca sector (4 km N). Sulfur dioxide emissions were at moderate levels, 524 tons per day. The Alert Level remained at Orange (the third level on a four-color scale) and the public were warned to stay outside of a 12 km radius.
Source: Instituto Geofísico del Perú (IGP)
Instituto Geofísico del Perú (IGP) reported that moderate levels of eruptive activity continued at Sabancaya during 20-26 March. The monitoring network recorded a range of 5-30 explosions per day. Explosions generated ash plumes that rose as high as 1.1 km above the summit crater and drifted less than 10 km in multiple directions; plume heights were not visible during 24-26 March. Seismic signals associated with the movement of magma and gases were registered; totaled counts ranged between 16 and 76 events per day. Thermal anomalies over the lava dome in the summit crater were identified in satellite images almost daily but were not detected during the night of 22 March. Deformation monitoring data indicated continued slight inflation near the Hualca Hualca sector (4 km N). The Alert Level remained at Orange (the third level on a four-color scale) and the public was reminded to stay at least 12 km away from the summit crater in all directions.
Source: Instituto Geofísico del Perú (IGP)
Instituto Geofísico del Perú (IGP) reported that the eruption at Sabancaya continued at moderate levels during 11-17 March with a daily average of 29 explosions. Gas-and-ash plumes rose as high as 2.2 km above the summit and drifted less than 10 km W, SW, and S. Thermal anomalies over the lava dome in the summit crater were identified in satellite data. Slight inflation was detected near the Hualca Hualca sector (4 km N). The Alert Level remained at Orange (the third level on a four-color scale) and the public were warned to stay outside of a 12 km radius.
Source: Instituto Geofísico del Perú (IGP)
Instituto Geofísico del Perú (IGP) reported that the eruption at Sabancaya continued at moderate levels during 12-18 February with a daily average of 35 explosions. Gas-and-ash plumes rose as high as 2.6 km above the summit and drifted less than 10 km E, SE, and W. Thermal anomalies over the lava dome in the summit crater were identified in satellite data. Slight inflation was detected near the Hualca Hualca sector (4 km N). The Alert Level remained at Orange (the third level on a four-color scale) and the public were warned to stay outside of a 12 km radius.
Source: Instituto Geofísico del Perú (IGP)
Instituto Geofísico del Perú (IGP) reported that moderate levels of eruptive activity continued at Sabancaya during 5-11 February. The monitoring network recorded a daily average of 33 explosions that often ejected gas-and-ash emissions as high as 2 km above the summit crater; ash plumes drifted less than 10 km downwind. The seismic network recorded seismic signals associated with the movement of magma and gases; counts ranged between 17 and 69 events per day. Thermal anomalies over the lava dome in the summit crater were identified in daily processed satellite data. Deformation monitoring data indicated slight inflation of the area near the Hualca Hualca sector (4 km N) continued. The Alert Level remained at Orange (the third level on a four-color scale) and the public was reminded to stay at least 12 km away from the summit crater in all directions.
Source: Instituto Geofísico del Perú (IGP)
Instituto Geofísico del Perú (IGP) reported that the eruption at Sabancaya continued at moderate levels during 22-28 January with a daily average of 47 explosions. Gas-and-ash plumes rose as high as 2 km above the summit and drifted less than 10 km NW and W. Thermal anomalies over the lava dome in the summit crater were identified in satellite data. Slight inflation was detected near the Hualca Hualca sector (4 km N). The Alert Level remained at Orange (the third level on a four-color scale) and the public were warned to stay outside of a 12 km radius.
Source: Instituto Geofísico del Perú (IGP)
Instituto Geofísico del Perú (IGP) reported that the eruption at Sabancaya continued at moderate levels during 3-7 January with a daily average of 61 explosions. Gas-and-ash plumes rose as high as 1.7 km above the summit and drifted less than 10 km NW, W, and SW. Thermal anomalies over the lava dome in the summit crater were identified in satellite data. Slight inflation was detected near the Hualca Hualca sector (4 km N). The Alert Level remained at Orange (the third level on a four-color scale) and the public were warned to stay outside of a 12 km radius.
Source: Instituto Geofísico del Perú (IGP)
Instituto Geofísico del Perú (IGP) reported that the eruption at Sabancaya continued at moderate levels during 11-17 December with a daily average of 55 explosions. Gas-and-ash plumes rose as high as 3.5 km above the summit and drifted E and SE. Thermal anomalies over the lava dome in the summit crater were identified in satellite data. Minor inflation was detected near the Hualca Hualca sector (4 km N). The Alert Level remained at Orange (the second highest level on a four-color scale) and the public were warned to stay outside of a 12 km radius.
Source: Instituto Geofísico del Perú (IGP)
Instituto Geofísico del Perú (IGP) reported that the eruption at Sabancaya continued at moderate levels during 20-26 November with a daily average of 31 explosions. Gas-and-ash plumes rose as high as 2.9 km above the summit and drifted NE and SW. Thermal anomalies over the lava dome in the summit crater were identified in satellite data. Minor inflation was detected near the Hualca Hualca sector (4 km N). The Alert Level remained at Orange (the second highest level on a four-color scale) and the public were warned to stay outside of a 12 km radius.
Source: Instituto Geofísico del Perú (IGP)
Instituto Geofísico del Perú (IGP) reported that the eruption at Sabancaya continued at moderate levels during 30 October-5 November with a daily average of five explosions. Gas-and-ash plumes rose as high as 2.2 km above the summit and drifted W, SW, and SE. A total of 12 thermal anomalies from the lava dome in the summit crater were detected using satellite data. Minor inflation was detected near the Hualca Hualca sector (4 km N). The Alert Level remained at Orange (the second highest level on a four-color scale) and the public were warned to stay outside of a 12 km radius.
Source: Instituto Geofísico del Perú (IGP)
Instituto Geofísico del Perú (IGP) reported that the eruption at Sabancaya continued at moderate levels during 16-22 October with a daily average of six explosions. Gas-and-ash plumes rose as high as 2 km above the summit and drifted SE and S. A total of two thermal anomalies from the lava dome in the summit crater were detected using satellite data. Minor inflation was detected near the Hualca Hualca sector (4 km N). The Alert Level remained at Orange (the second highest level on a four-color scale) and the public were warned to stay outside of a 12 km radius.
Source: Instituto Geofísico del Perú (IGP)
Instituto Geofísico del Perú (IGP) reported that the eruption at Sabancaya continued during 25 September-1 October with a daily average of 39 explosions. Gas-and-ash plumes rose as high as 3 km above the summit and drifted E, SE, S, and SW. A total of 12 thermal anomalies from the lava dome in the summit crater were detected using satellite data. Minor inflation was detected near the Hualca Hualca sector (4 km N). Sulfur dioxide emissions increased, averaging 2,039 tons per day on 1 October. The Alert Level remained at Orange (the second highest level on a four-color scale) and the public were warned to stay outside of a 12 km radius.
Source: Instituto Geofísico del Perú (IGP)
Instituto Geofísico del Perú (IGP) reported that the eruption at Sabancaya continued during 4-10 September with a daily average of 13 explosions. Gas-and-ash plumes rose as high as 2.3 km above the summit and drifted SE, E, NE, and NW. A total of 10 thermal anomalies from the lava dome in the summit crater were detected using satellite data. Minor inflation was detected near the Hualca Hualca sector (4 km N). The Alert Level remained at Orange (the second highest level on a four-color scale) and the public were warned to stay outside of a 12 km radius.
Source: Instituto Geofísico del Perú (IGP)
Instituto Geofísico del Perú (IGP) reported that the eruption at Sabancaya continued during 14-20 August with a daily average of 28 explosions. Gas-and-ash plumes rose as high as 3.2 km above the summit and drifted W, NW, N, and NE. A total of 13 thermal anomalies from the lava dome in the summit crater were detected using satellite data. Minor inflation was detected near the Hualca Hualca sector (4 km N). The Alert Level remained at Orange (the second highest level on a four-color scale) and the public were warned to stay outside of a 12 km radius.
Source: Instituto Geofísico del Perú (IGP)
Instituto Geofísico del Perú (IGP) reported that the eruption at Sabancaya continued during 31 July-6 August with a daily average of 19 explosions. Gas-and-ash plumes rose as high as 2.3 km above the summit and drifted in multiple directions. Three thermal anomalies from the lava dome in the summit crater were detected using satellite data. Minor inflation was detected near the Hualca Hualca sector (4 km N). The Alert Level remained at Orange (the second highest level on a four-color scale) and the public were warned to stay outside of a 12 km radius.
Source: Instituto Geofísico del Perú (IGP)
Instituto Geofísico del Perú (IGP) reported that the eruption at Sabancaya continued during 24-30 July with a daily average of 12 explosions. Gas-and-ash plumes rose as high as 2.3 km above the summit and drifted E, SE, and NE. Six thermal anomalies from the lava dome in the summit crater were detected using satellite data. Minor inflation was detected near the Hualca Hualca sector (4 km N). The Alert Level remained at Orange (the second highest level on a four-color scale) and the public were warned to stay outside of a 12 km radius.
Source: Instituto Geofísico del Perú (IGP)
Instituto Geofísico del Perú (IGP) reported moderate levels of activity at Sabancaya during 10-16 July with a daily average of 23 explosions. Gas-and-ash plumes rose as high as 2.5 km above the summit and drifted NE, E, and SE. Nine thermal anomalies from the lava dome in the summit crater were detected using satellite data. Minor inflation was detected near the Hualca Hualca sector (4 km N). The Alert Level remained at Orange (the second highest level on a four-color scale) and the public were warned to stay outside of a 12 km radius.
Source: Instituto Geofísico del Perú (IGP)
Instituto Geofísico del Perú (IGP) reported moderate levels of activity at Sabancaya during 12-18 June with a daily average of 18 explosions. Gas-and-ash plumes rose as high as 1.5 km above the summit and drifted SE, E, and NE. Five thermal anomalies originating from the lava dome in the summit crater were identified in satellite data. Minor inflation continued to be detected near Hualca Hualca (4 km N). The Alert Level remained at Orange (the second highest level on a four-color scale) and the public were warned to stay outside of a 12-km radius.
Source: Instituto Geofísico del Perú (IGP)
Instituto Geofísico del Perú (IGP) reported moderate levels of activity at Sabancaya during 29 May-4 June with a daily average of 24 explosions. Gas-and-ash plumes rose as high as 2.1 km above the summit and drifted NW and W. Six thermal anomalies originating from the lava dome in the summit crater were identified in satellite data. Minor inflation continued to be detected near Hualca Hualca (4 km N). The Alert Level remained at Orange (the second highest level on a four-color scale) and the public were warned to stay outside of a 12-km radius.
Source: Instituto Geofísico del Perú (IGP)
Instituto Geofísico del Perú (IGP) reported moderate levels of activity at Sabancaya during 15-21 May with a daily average of 37 explosions. Gas-and-ash plumes rose as high as 2.4 km above the summit and drifted NE, E, and SE. Eight thermal anomalies originating from the lava dome in the summit crater were identified in satellite data. Seismic sensors detected 232 volcanic activity-related earthquakes, in addition to volcano-tectonic earthquakes. The Alert Level remained at Orange (the second highest level on a four-color scale) and the public were warned to stay outside of a 12-km radius.
Source: Instituto Geofísico del Perú (IGP)
Instituto Geofísico del Perú (IGP) reported moderate levels of activity at Sabancaya during 1-7 May with a daily average of 23 explosions. Gas-and-ash plumes rose as high as 2 km above the summit and drifted N, E, and SE. Three thermal anomalies originating from the lava dome in the summit crater were identified in satellite data. The Alert Level remained at Orange (the second highest level on a four-color scale) and the public were warned to stay outside of a 12-km radius.
Source: Instituto Geofísico del Perú (IGP)
Instituto Geofísico del Perú (IGP) reported moderate levels of activity at Sabancaya during 17-23 April with a daily average of 31 explosions. Gas-and-ash plumes rose as high as 1.6 km above the summit and drifted NE, E, SW, and W. Fourthermal anomalies originating from the lava dome in the summit crater were identified in satellite data. The Alert Level remained at Orange (the second highest level on a four-color scale) and the public were warned to stay outside of a 12-km radius.
Source: Instituto Geofísico del Perú (IGP)
Instituto Geofísico del Perú (IGP) reported moderate levels of activity at Sabancaya during 10-16 April with a daily average of 41 explosions. Gas-and-ash plumes rose as high as 2.5 km above the summit and drifted NW, W, SW, and S. Six thermal anomalies originating from the lava dome in the summit crater were identified in satellite data. The Alert Level remained at Orange (the second highest level on a four-color scale) and the public were warned to stay outside of a 12-km radius.
Source: Instituto Geofísico del Perú (IGP)
Instituto Geofísico del Perú (IGP) reported moderate levels of activity at Sabancaya during 27 February-5 March with a daily average of 46 explosions. Gas-and-ash plumes rose as high as 2.6 km above the summit and drifted NW, W, and SW. Four thermal anomalies originating from the lava dome in the summit crater were identified in satellite data. The Alert Level remained at Orange (the second highest level on a four-color scale) and the public were warned to stay outside of a 12-km radius.
Source: Instituto Geofísico del Perú (IGP)
Instituto Geofísico del Perú (IGP) reported moderate levels of activity at Sabancaya during 13-19 February with a daily average of 51 explosions. Gas-and-ash plumes rose as high as 2.6 km above the summit and drifted in multiple directions. Four thermal anomalies originating from the lava dome in the summit crater were identified in satellite data. The Alert Level remained at Orange (the second highest level on a four-color scale) and the public were warned to stay outside of a 12-km radius.
Source: Instituto Geofísico del Perú (IGP)
Instituto Geofísico del Perú (IGP) reported moderate levels of activity at Sabancaya during 23-29 January with a daily average of 59 explosions. Gas-and-ash plumes rose as high as 2.1 km above the summit and drifted SW and W. Four thermal anomalies originating from the lava dome in the summit crater were identified in satellite data. Minor inflation continued to be detected near Hualca Hualca (4 km N). The Alert Level remained at Orange (the second highest level on a four-color scale) and the public were warned to stay outside of a 12-km radius.
Source: Instituto Geofísico del Perú (IGP)
Instituto Geofísico del Perú (IGP) reported moderate levels of activity at Sabancaya during 26-31 December with a daily average of 67 explosions. Gas-and-ash plumes rose as high as 2.6 km above the summit and drifted SW and W. Six thermal anomalies originating from the lava dome in the summit crater were identified in satellite data. Minor inflation continued to be detected near Hualca Hualca (4 km N). The Alert Level remained at Orange (the second highest level on a four-color scale) and the public were warned to stay outside of a 12-km radius.
Source: Instituto Geofísico del Perú (IGP)
Instituto Geofísico del Perú (IGP) reported moderate levels of activity at Sabancaya during 5-11 December with a daily average of 40 explosions. Gas-and-ash plumes rose as high as 2 km above the summit and drifted SW, S, and NE. Two thermal anomalies originating from the lava dome in the summit crater were identified in satellite data. Minor inflation continued to be detected near Hualca Hualca (4 km N). The Alert Level remained at Orange (the second highest level on a four-color scale) and the public were warned to stay outside of a 12-km radius.
Source: Instituto Geofísico del Perú (IGP)
Instituto Geofísico del Perú (IGP) reported moderate levels of activity at Sabancaya during 7-13 November with a daily average of 33 explosions. Gas-and-ash plumes rose as high as 3 km above the summit and drifted S, E, and NE. As many as five thermal anomalies originating from the lava dome in the summit crater were identified in satellite data. Minor inflation continued to be detected near Hualca Hualca (4 km N). The Alert Level remained at Orange (the second highest level on a four-color scale) and the public were warned to stay outside of a 12-km radius.
Source: Instituto Geofísico del Perú (IGP)
Instituto Geofísico del Perú (IGP) reported moderate levels of activity at Sabancaya during 31 October-6 November with a daily average of 30 explosions. Gas-and-ash plumes rose as high as 3 km above the summit and drifted NE, E, and SE. As many as five thermal anomalies originating from the lava dome in the summit crater were identified in satellite data. Minor inflation continued to be detected near Hualca Hualca (4 km N). The Alert Level remained at Orange (the second highest level on a four-color scale) and the public were warned to stay outside of a 12-km radius.
Source: Instituto Geofísico del Perú (IGP)
Instituto Geofísico del Perú (IGP) reported moderate levels of activity at Sabancaya during 5-11 September with a daily average of 46 explosions. Gas-and-ash plumes rose as high as 3 km above the summit and drifted NE, E, and SE. As many as nine thermal anomalies originating from the lava dome in the summit crater were identified in satellite data. Minor inflation continued to be detected near Hualca Hualca (4 km N). The Alert Level remained at Orange (the second highest level on a four-color scale) and the public were warned to stay outside of a 12-km radius.
Source: Instituto Geofísico del Perú (IGP)
Instituto Geofísico del Perú (IGP) reported moderate levels of activity at Sabancaya during 5-11 September with a daily average of 44 explosions. Gas-and-ash plumes rose as high as 2.9 km above the summit and drifted NE, E, and SE. As many as 10 thermal anomalies originating from the lava dome in the summit crater were identified in satellite data. Minor inflation continued to be detected near Hualca Hualca (4 km N). The Alert Level remained at Orange (the second highest level on a four-color scale) and the public were warned to stay outside of a 12-km radius.
Source: Instituto Geofísico del Perú (IGP)
Instituto Geofísico del Perú (IGP) reported moderate levels of activity at Sabancaya during 1-7 August with a daily average of 19 explosions. Gas-and-ash plumes rose as high as 2.7 km above the summit and drifted E, SE, SW, and W. As many as seven thermal anomalies originating from the lava dome in the summit crater were identified in satellite data. Minor inflation continued to be detected near Hualca Hualca (4 km N). The Alert Level remained at Orange (the second highest level on a four-color scale) and the public were warned to stay outside of a 12-km radius.
Source: Instituto Geofísico del Perú (IGP)
Instituto Geofísico del Perú (IGP) reported moderate levels of activity at Sabancaya during 4-10 July with a daily average of 20 explosions. Gas-and-ash plumes rose as high as 2.2 km above the summit and drifted E, SE, and S. As many as six thermal anomalies originating from the lava dome in the summit crater were identified in satellite data. Minor inflation continued to be detected near Hualca Hualca (4 km N). The Alert Level remained at Orange (the second highest level on a four-color scale) and the public were warned to stay outside of a 12-km radius.
Source: Instituto Geofísico del Perú (IGP)
Instituto Geofísico del Perú (IGP) reported moderate levels of activity at Sabancaya during 30 May-6 June with a daily average of nine explosions. Gas-and-ash plumes rose as high as 1.5 km above the summit and drifted E and SE. As many as six thermal anomalies originating from the lava dome in the summit crater were identified in satellite data. Minor inflation continued to be detected near Hualca Hualca (4 km N). The Alert Level remained at Orange (the second highest level on a four-color scale) and the public were warned to stay outside of a 12-km radius.
Source: Instituto Geofísico del Perú (IGP)
Instituto Geofísico del Perú (IGP) reported moderate levels of activity at Sabancaya during 2-8 May with a daily average of 53 explosions. Gas-and-ash plumes rose as high as 3 km above the summit and drifted N, NE, E, and SE. As many as five thermal anomalies originating from the lava dome in the summit crater were identified in satellite data. Minor inflation continued to be detected near Hualca Hualca (4 km N). The Alert Level remained at Orange (the second highest level on a four-color scale) and the public were warned to stay outside of a 12-km radius.
Source: Instituto Geofísico del Perú (IGP)
Instituto Geofísico del Perú (IGP) reported moderate levels of activity at Sabancaya during 18-24 April with a daily average of 37 explosions. Gas-and-ash plumes rose as high as 2.3 km above the summit and drifted N, NE, SE, and S. As many as 10 thermal anomalies originating from the lava dome in the summit crater were identified in satellite data. Minor inflation continued to be detected near Hualca Hualca (4 km N). The Alert Level remained at Orange (the second highest level on a four-color scale) and the public were warned to stay outside of a 12-km radius.
Source: Instituto Geofísico del Perú (IGP)
Instituto Geofísico del Perú (IGP) reported moderate levels of activity at Sabancaya during 4-10 April with a daily average of 52 explosions. Gas-and-ash plumes rose as high as 2.5 km above the summit and drifted E, SE, and S. Three thermal anomalies originating from the lava dome in the summit crater were identified in satellite data. Minor inflation continued to be detected near Hualca Hualca (4 km N). The Alert Level remained at Orange (the second highest level on a four-color scale) and the public were warned to stay outside of a 12-km radius.
Source: Instituto Geofísico del Perú (IGP)
Instituto Geofísico del Perú (IGP) reported moderate levels of activity at Sabancaya during 21-27 February with a daily average of 35 explosions. Gas-and-ash plumes rose as high as 2.5 km above the summit and drifted NW, W, SW, and S. Three thermal anomalies originating from the lava dome in the summit crater were identified in satellite data. Minor inflation continued to be detected near Hualca Hualca (4 km N). The Alert Level remained at Orange (the second highest level on a four-color scale) and the public were warned to stay outside of a 12-km radius.
Source: Instituto Geofísico del Perú (IGP)
Instituto Geofísico del Perú (IGP) reported a daily average of 32 explosions at Sabancaya during 27 December 2021 to 2 January 2022. Gas-and-ash plumes rose as high as 2.8 km above the summit and drifted NW, W, and SW. Eight thermal anomalies originating from the lava dome in the summit crater were identified in satellite data. Minor inflation continued to be detected near Hualca Hualca (4 km N). The Alert Level remained at Orange (the second highest level on a four-color scale) and the public were warned to stay outside of a 12-km radius.
Source: Instituto Geofísico del Perú (IGP)
Instituto Geofísico del Perú (IGP) reported a daily average of 74 explosions at Sabancaya during 15-21 November. Gas-and-ash plumes rose as high as 2 km above the summit and drifted NE, S, SW, and W. Eight thermal anomalies originating from the lava dome in the summit crater were identified in satellite data. Minor inflation continued to be detected near Hualca Hualca (4 km N). The Alert Level remained at Orange (the second highest level on a four-color scale) and the public were warned to stay outside of a 12-km radius.
Source: Instituto Geofísico del Perú (IGP)
Instituto Geofísico del Perú (IGP) reported a daily average of 27 explosions at Sabancaya during 4-10 October. Gas-and-ash plumes rose as high as 2 km above the summit and drifted in multiple directions. One thermal anomaly originating from the lava dome in the summit crater was identified in satellite data. Minor inflation continued to be detected near Hualca Hualca (4 km N). The Alert Level remained at Orange (the second highest level on a four-color scale) and the public were warned to stay outside of a 12-km radius.
Source: Instituto Geofísico del Perú (IGP)
Instituto Geofísico del Perú (IGP) reported a daily average of 36 explosions at Sabancaya during 23-30 August. Gas-and-ash plumes rose as high as 3.5 km above the summit and drifted S, SW, N, and NE. Ten thermal anomalies originating from the lava dome in the summit crater were identified in satellite data. Minor inflation continued to be detected near Hualca Hualca (4 km N). The Alert Level remained at Orange (the second highest level on a four-color scale) and the public were warned to stay outside of a 12-km radius.
Source: Instituto Geofísico del Perú (IGP)
Instituto Geofísico del Perú (IGP) reported a daily average of 58 explosions at Sabancaya during 19-25 July. Gas-and-ash plumes rose as high as 2.3 km above the summit and drifted S, SE, E, and NE. Nine thermal anomalies originating from the lava dome in the summit crater were identified in satellite data. Minor inflation continued to be detected near Hualca Hualca (4 km N). The Alert Level remained at Orange (the second highest level on a four-color scale) and the public were warned to stay outside of a 12-km radius.
Source: Instituto Geofísico del Perú (IGP)
Instituto Geofísico del Perú (IGP) reported a daily average of 80 explosions at Sabancaya during 14-20 June. Gas-and-ash plumes rose as high as 2.3 km above the summit and drifted S, SE, E, and NE. Seven thermal anomalies originating from the lava dome in the summit crater were identified in satellite data. Minor inflation continued to be detected near Hualca Hualca (4 km N). The Alert Level remained at Orange (the second highest level on a four-color scale) and the public were warned to stay outside of a 12-km radius.
Source: Instituto Geofísico del Perú (IGP)
Instituto Geofísico del Perú (IGP) reported a daily average of 37 explosions at Sabancaya during 10-16 May. Gas-and-ash plumes rose as high as 3.5 km above the summit and drifted S, SE, E, and NE. Ashfall was reported in the district of Chivay (NE), in the area of Achacota. Eight thermal anomalies originating from the lava dome in the summit crater were identified in satellite data. Minor inflation continued to be detected near Hualca Hualca (4 km N). The Alert Level remained at Orange (the second highest level on a four-color scale) and the public were warned to stay outside of a 12-km radius.
Source: Instituto Geofísico del Perú (IGP)
Instituto Geofísico del Perú (IGP) reported a daily average of 91 explosions at Sabancaya during 12-18 April. Gas-and-ash plumes rose as high as 2.3 km above the summit and drifted S, SW, NW, and N. Eight thermal anomalies originating from the lava dome in the summit crater were identified in satellite data. Minor inflation continued to be detected near Hualca Hualca (4 km N). The Alert Level remained at Orange (the second highest level on a four-color scale) and the public were warned to stay outside of a 12-km radius.
Source: Instituto Geofísico del Perú (IGP)
Instituto Geofísico del Perú (IGP) reported a daily average of 90 explosions at Sabancaya during 22-28 March. Gas-and-ash plumes rose as high as 2.5 km above the summit and drifted SW, W, N, and NW. Six thermal anomalies originating from the lava dome in the summit crater were identified in satellite data. Minor inflation continued to be detected in areas N of Hualca Hualca (4 km N). The Alert Level remained at Orange (the second highest level on a four-color scale) and the public were warned to stay outside of a 12-km radius.
Source: Instituto Geofísico del Perú (IGP)
Instituto Geofísico del Perú (IGP) reported a daily average of 71 explosions at Sabancaya during 15-21 February. Gas-and-ash plumes rose as high as 3.2 km above the summit and drifted in multiple directions. Ten thermal anomalies originating from the lava dome in the summit crater were identified in satellite data. Minor inflation continued to be detected in areas N of Hualca Hualca (4 km N). The Alert Level remained at Orange (the second highest level on a four-color scale) and the public were warned to stay outside of a 12-km radius.
Source: Instituto Geofísico del Perú (IGP)
Instituto Geofísico del Perú (IGP) reported a daily average of 29 explosions at Sabancaya during 11-17 January. Gas-and-ash plumes rose as high as 3 km above the summit and drifted in multiple directions. One thermal anomaly over the crater was identified in satellite data. Minor inflation continued to be detected in areas N of Hualca Hualca (4 km N) and on the SE flank. The Alert Level remained at Orange (the second highest level on a four-color scale) and the public were warned to stay outside of a 12-km radius.
Source: Instituto Geofísico del Perú (IGP)
Instituto Geofísico del Perú (IGP) reported a daily average of 54 explosions at Sabancaya during 7-13 December. Gas-and-ash plumes rose as high as 2.8 km above the summit and drifted NW, W, and SW. Eight thermal anomalies over the crater were identified in satellite data. Minor inflation continued to be detected in areas N of Hualca Hualca (4 km N) and on the SE flank. INGEMMET stated that ashfall was noted in the towns of Cabanaconde (22 km NW), Pinchollo (20 km N), and Madrigal (20 km NE) during 9-10 December. The Alert Level remained at Orange (the second highest level on a four-color scale) and the public were warned to stay outside of a 12-km radius.
Sources: Instituto Geofísico del Perú (IGP); Instituto Geológico Minero y Metalúrgico (INGEMMET)
Instituto Geofísico del Perú (IGP) and Instituto Geológico Minero y Metalúrgico (INGEMMET) reported that seismicity at Sabancaya had increased on 11 November. During the following week, the number and magnitude of explosions increased, and crater incandescence was visible in satellite and webcam data. The increased activity likely signified lava effusion, and a new lava dome in the NE part of the summit crater was confirmed in satellite images on 16 November. The dome, named Iskay, was 110 x 130 m in dimension and about 12,000 square meters in area. An IGP scientist noted that the dome was 78% smaller than the dome that had formed at the end of 2019.
A daily average of 49 explosions was recorded during 16-22 November. Gas-and-ash plumes rose as high as 3.5 km above the summit and drifted in multiple directions; ashfall was reported in the Huanca district on 22 November. Thirteen thermal anomalies over the crater were identified in satellite data. Minor inflation continued to be detected in areas N of Hualca Hualca (4 km N) and on the SE flank. The Alert Level remained at Orange (the second highest level on a four-color scale) and the public were warned to stay outside of a 12-km radius.
Sources: Instituto Geofísico del Perú (IGP); Instituto Geológico Minero y Metalúrgico (INGEMMET)
Instituto Geofísico del Perú (IGP) reported a daily average of 54 explosions at Sabancaya during 9-15 November. Gas-and-ash plumes rose as high as 3.3 km above the summit and drifted NE, N, and NW. Eleven thermal anomalies over the crater were identified in satellite data. Minor inflation continued to be detected in areas N of Hualca Hualca (4 km N) and on the SE flank. The Alert Level remained at Orange (the second highest level on a four-color scale) and the public were warned to stay outside of a 12-km radius.
Source: Instituto Geofísico del Perú (IGP)
Instituto Geofísico del Perú (IGP) reported a daily average of 36 explosions at Sabancaya during 21-27 September. Gas-and-ash plumes rose as high as 2.5 km above the summit and drifted NE, E, SE, SW, and NW. Eleven thermal anomalies over the crater were identified in satellite data. Minor inflation was detected in areas N of Hualca Hualca (4 km N) and on the SE flank. Ashfall was reported in Lluta (30 km SW) and Huanca (75 km SSE) on 24 September. The Alert Level remained at Orange (the second highest level on a four-color scale) and the public were warned to stay outside of a 12-km radius.
Source: Instituto Geofísico del Perú (IGP)
Instituto Geofísico del Perú (IGP) reported a daily average of 29 explosions at Sabancaya during 24-30 August. Gas-and-ash plumes rose as high as 3.5 km above the summit and drifted E, SE, and S, SW, and NW. Four thermal anomalies over the crater were identified in satellite data. Minor inflation was detected in areas N of Hualca Hualca (4 km N) and on the SE flank. On 29 August Instituto Geológico Minero y Metalúrgico (INGEMMET) reported increased activity during 28-29 August and noted higher seismic levels and inflation over the previous few weeks. The Alert Level remained at Orange (the second highest level on a four-color scale) and the public were warned to stay outside of a 12-km radius.
Sources: Instituto Geofísico del Perú (IGP); Instituto Geológico Minero y Metalúrgico (INGEMMET)
Instituto Geofísico del Perú (IGP) reported a daily average of 19 explosions at Sabancaya during 3-9 August. Gas-and-ash plumes rose as high as 2.5 km above the summit and drifted SE, S, SW, and NW. There were five thermal anomalies over the crater identified in satellite data. The Alert Level remained at Orange (the second highest level on a four-color scale) and the public were warned to stay outside of a 12-km radius.
Source: Instituto Geofísico del Perú (IGP)
Instituto Geofísico del Perú (IGP) reported a daily average of 17 explosions at Sabancaya during 6-12 July. Gas-and-ash plumes rose as high as 2.5 km above the summit and drifted SE, E, and NE. There were six thermal anomalies over the crater identified in satellite data. The Alert Level remained at Orange (the second highest level on a four-color scale) and the public were warned to stay outside of a 12-km radius.
Source: Instituto Geofísico del Perú (IGP)
Instituto Geológico Minero y Metalúrgico (INGEMMET) reported that drone footage acquired at Sabancaya on 20 June showed that the lava dome in the main crater had been destroyed, leaving blocks on the crater floor. Explosions at fractured areas generated gas-and-ash plumes. During 23-24 June explosions produced gas-and-ash plumes that rose as high as 1.8 km above the summit and drifted E and SE. Ashfall was reported in areas downwind including in the districts of Chivay, Achoma, Ichupampa, Yanque, and Coporaque, and in the area of Sallali.
Instituto Geofísico del Perú (IGP) reported a daily average of 20 explosions during 29 June-5 July. Gas-and-ash plumes rose as high as 3.5 km above the summit and drifted S, SE, NE, and N. There were seven thermal anomalies over the crater identified in satellite data. The Alert Level remained at Orange (the second highest level on a four-color scale) and the public were warned to stay outside of a 12-km radius.
Sources: Instituto Geológico Minero y Metalúrgico (INGEMMET); Instituto Geofísico del Perú (IGP)
Instituto Geofísico del Perú (IGP) reported that a daily average of 12 explosions occurred at Sabancaya during 22-28 June. Gas-and-ash plumes rose as high as 4 km above the summit and drifted NE, E, and SE; on 27 June ashfall was reported in several areas NE possibly including the districts of Madrigal, Lari, Achoma, Ichupampa, Yanque, Chivay, and Coporaque. There were 10 thermal anomalies identified in satellite data, originating from the lava dome in the summit crater. The Alert Level remained at Orange (the second highest level on a four-color scale) and the public were warned to stay outside of a 12-km radius.
Source: Instituto Geofísico del Perú (IGP)
Instituto Geofísico del Perú (IGP) reported that a daily average of 18 explosions occurred at Sabancaya during 1-7 June. Gas-and-ash plumes rose as high as 1.5 km above the summit and drifted E and SE. There were three thermal anomalies identified in satellite data, originating from the lava dome in the summit crater. The Alert Level remained at Orange (the second highest level on a four-color scale) and the public were warned to stay outside of a 12-km radius.
Source: Instituto Geofísico del Perú (IGP)
Instituto Geofísico del Perú (IGP) reported that a daily average of 12 explosions occurred at Sabancaya during 11-17 May. Gas-and-ash plumes rose as high as 2.5 km above the summit and drifted NE, E, and SE. There were seven thermal anomalies identified in satellite data, originating from the lava dome in the summit crater. The Alert Level remained at Orange (the second highest level on a four-color scale) and the public were warned to stay outside of a 12-km radius.
Source: Instituto Geofísico del Perú (IGP)
Instituto Geofísico del Perú (IGP) reported that a daily average of 11 explosions occurred at Sabancaya during 13-19 April. Gas-and-ash plumes rose as high as 3.9 km above the summit and drifted NW, S, and SE. There were eight thermal anomalies identified in satellite data, originating from the lava dome in the summit crater. The Alert Level remained at Orange (the second highest level on a four-color scale) and the public were warned to stay outside of a 12-km radius.
Source: Instituto Geofísico del Perú (IGP)
Instituto Geofísico del Perú (IGP) reported that a daily average of 18 low- to medium-intensity explosions occurred at Sabancaya during 24 February-1 March. Gas-and-ash plumes rose as high as 2 km above the summit and drifted W, SW, and S. There was one thermal anomaly identified in satellite data, originating from the lava dome in the summit crater. On 26, 27, and 28 February at 1552, 1420, and 1300, respectively, lahars descended the Huayuray-Pinchollo drainage on the N flank. The lahars were small to moderate in size and blocked the Chivay-Cabanaconde road in the district of Cabanaconde. The Alert Level remained at Orange (the second highest level on a four-color scale) and the public were warned to stay outside of a 12-km radius.
Source: Instituto Geofísico del Perú (IGP)
Instituto Geofísico del Perú (IGP) reported that an average of eight daily low- to medium-intensity explosions occurred at Sabancaya during 6-12 January. Gas-and-ash plumes rose as high as 3 km above the summit and drifted NE, E, and SE. There were six thermal anomalies identified in satellite data, originating from the 282-m-diameter lava dome in the summit crater. The Alert Level remained at Orange (the second highest level on a four-color scale) and the public were warned to stay outside of a 12-km radius.
Source: Instituto Geofísico del Perú (IGP)
Instituto Geofísico del Perú (IGP) reported that a daily average of eight low-to-medium intensity explosions occurred at Sabancaya during 23-29 December. Gas-and-ash plumes rose as high as 2.5 km above the summit and drifted NE, E, and SW. There were five thermal anomalies identified in satellite data, originating from the 280-m-diameter lava dome in the summit crater. The Alert Level remained at Orange (the second highest level on a four-color scale) and the public were warned to stay outside of a 12-km radius.
Source: Instituto Geofísico del Perú (IGP)
Instituto Geofísico del Perú (IGP) reported that an average of 17 daily low-to-medium intensity explosions occurred at Sabancaya during 25 November-1 December. Gas-and-ash plumes rose as high as 4 km above the summit and drifted NE, E, and S. There were five thermal anomalies identified in satellite data, originating from the 240-m-diameter lava dome in the summit crater. The Alert Level remained at Orange (the second highest level on a four-color scale) and the public were warned to stay outside of a 12-km radius.
Source: Instituto Geofísico del Perú (IGP)
Instituto Geofísico del Perú (IGP) reported that an average of 50 explosions of low-to-medium intensity per day occurred at Sabancaya during 11-17 November. Gas-and-ash plumes rose as high as 2.5 km above the summit and drifted SE and S. There were seven thermal anomalies identified in satellite data. The Alert Level remained at Orange (the second highest level on a four-color scale) and the public were warned to stay outside of a 12-km radius.
Source: Instituto Geofísico del Perú (IGP)
Instituto Geofísico del Perú (IGP) reported that an average of 28 low-to-medium intensity explosions per day occurred at Sabancaya during 28 October-3 November. Gas-and-ash plumes rose as high as 2 km above the summit and drifted W, SW, and S. There were nine thermal anomalies identified in satellite data. The Alert Level remained at Orange (the second highest level on a four-color scale) and the public were warned to stay outside of a 12-km radius.
Sources: Instituto Geofísico del Perú (IGP); Observatorio Vulcanológico del INGEMMET (OVI)
Instituto Geofísico del Perú (IGP) reported that an average of 48 low-to-medium intensity explosions per day occurred at Sabancaya during 21-27 October. Gas-and-ash plumes rose as high as 2.5 km above the summit and drifted W, SW, and S. There were 15 thermal anomalies identified in satellite data. The report noted that the lava dome in the summit crater had been slowing extruding since February and filling in the N part of the crater, though the rate of the extrusion had increased in recent months. On 26 October Observatorio Vulcanológico del INGEMMET (OVI) conducted a drone overflight and captured video of the lava dome. The estimated volume of the lava dome was 4.6 million cubic meters based on the footage. The Alert Level remained at Orange (the second highest level on a four-color scale) and the public were warned to stay outside of a 12-km radius.
Sources: Instituto Geofísico del Perú (IGP); Andina Agencia Peruana de Noticias
Instituto Geofísico del Perú (IGP) reported that an average of 36 low-to-medium intensity explosions per day occurred at Sabancaya during 7-13 October. Gas-and-ash plumes rose as high as 3.5 km above the summit and drifted SE and SW. There were 15 thermal anomalies identified in satellite data. The Alert Level remained at Orange (the second highest level on a four-color scale) and the public were warned to stay outside of a 12-km radius.
Source: Instituto Geofísico del Perú (IGP)
Instituto Geofísico del Perú (IGP) reported that an average of 15 low-to-medium intensity explosions per day occurred at Sabancaya during 23-29 September. Gas-and-ash plumes rose as high as 1.7 km above the summit and drifted NW, W, and SW. There were 11 thermal anomalies identified in satellite data. The Alert Level remained at Orange (the second highest level on a four-color scale) and the public were warned to stay outside of a 12-km radius.
Source: Instituto Geofísico del Perú (IGP)
Instituto Geofísico del Perú (IGP) reported that an average of 26 low-to-medium intensity explosions per day occurred at Sabancaya during 26 August-1 September. Gas-and-ash plumes rose as high as 2 km above the summit and drifted SE, NW, and SW. There were 11 thermal anomalies identified in satellite data. The Alert Level remained at Orange (the second highest level on a four-color scale) and the public were warned to stay outside of a 12-km radius.
Source: Instituto Geofísico del Perú (IGP)
Instituto Geofísico del Perú (IGP) reported that an average of 25 low-to-medium intensity explosions per day occurred at Sabancaya during 12-18 August. Gas-and-ash plumes rose as high as 3 km above the summit and drifted SE, S, and SW. There were eight thermal anomalies identified in satellite data. The Alert Level remained at Orange (the second highest level on a four-color scale) and the public were warned to stay outside of a 12-km radius.
Source: Instituto Geofísico del Perú (IGP)
Instituto Geofísico del Perú (IGP) reported that an average of 13 low-to-medium intensity explosions per day occurred at Sabancaya during 22-28 July. Gas-and-ash plumes rose as high as 2.3 km above the crater rim and drifted NE, E, and SE. There were eight thermal anomalies identified in satellite data. The report noted that the public should not approach the crater within a 12-km radius. Single explosions on 1 and 5 August produced an ash plume that drifted more than 30 km E and W, respectively.
Source: Instituto Geofísico del Perú (IGP)
Instituto Geofísico del Perú (IGP) reported that during 3-9 June an average of 12 explosion per day were recorded at Sabancaya. Ash plumes rose 2.9 km above the crater rim. On 7 June explosions generated ash plumes that drifted 30 km S and SW. The public was warned to not approach the crater within a 12-km radius.
Source: Instituto Geofísico del Perú (IGP)
Instituto Geofísico del Perú (IGP) and Instituto Geológico Minero y Metalúrgico (INGEMMET) reported that an average of 33 low-to-medium intensity explosions per day occurred at Sabancaya during 13-19 May. Gas-and-ash plumes rose as high as 2.5 km above the crater rim and drifted NW, N, and NE. There were 10 thermal anomalies identified in satellite data. The report noted that the public should not approach the crater within a 12-km radius.
Sources: Instituto Geofísico del Perú (IGP); Instituto Geológico Minero y Metalúrgico (INGEMMET)
Instituto Geofísico del Perú (IGP) and Instituto Geológico Minero y Metalúrgico (INGEMMET) reported that an average of 43 explosions per day occurred at Sabancaya during 25-31 March. Long-period seismic events were recorded, and hybrid earthquakes were infrequent and of low magnitude. Gas-and-ash plumes rose as high as 1.5 km above the crater rim and drifted 30 km NE, SE, S, and SW. MIROVA detected one thermal anomaly, and on 31 March the sulfur-dioxide gas flux was high at 3,000 tons per day. The report noted that the public should not approach the crater within a 12-km radius.
Sources: Instituto Geológico Minero y Metalúrgico (INGEMMET); Instituto Geofísico del Perú (IGP)
Instituto Geofísico del Perú (IGP) and Instituto Geológico Minero y Metalúrgico (INGEMMET) reported that an average of 15 explosions per day occurred at Sabancaya during 4-10 March. Long-period seismic events were recorded, and hybrid earthquakes were infrequent and of low magnitude. Gas-and-ash plumes rose as high as 2.8 km above the crater rim and drifted 20 km SW, W, and NW. MIROVA detected four thermal anomalies, and on 3 March the sulfur-dioxide gas flux was high at 3,360 tons per day. The report noted that the public should not approach the crater within a 12-km radius.
Sources: Instituto Geológico Minero y Metalúrgico (INGEMMET); Instituto Geofísico del Perú (IGP)
Observatorio Vulcanológico del Sur del IGP (OVS-IGP) and Observatorio Vulcanológico del INGEMMET (OVI) reported that an average of 20 explosions per day occurred at Sabancaya during 18-24 February. Long-period seismic events were recorded, and hybrid earthquakes were infrequent and of low magnitude. Although weather conditions sometimes prevented visual observations, gas-and-ash plumes were seen rising as high as 2.2 km above the crater rim and drifted 30 km SW. MIROVA detected two thermal anomalies. The report noted that the public should not approach the crater within a 12-km radius.
Sources: Instituto Geológico Minero y Metalúrgico (INGEMMET); Instituto Geofísico del Perú (IGP)
Observatorio Vulcanológico del Sur del IGP (OVS-IGP) and Observatorio Vulcanológico del INGEMMET (OVI) reported that an average of 26 explosions per day occurred at Sabancaya during 4-10 February. Long-period seismic events were recorded, and hybrid earthquakes were infrequent and of low magnitude. Although weather conditions sometimes prevented visual observations, gas-and-ash plumes were seen rising as high as 3 km above the crater rim and drifted 30 km S and SW. MIROVA detected one thermal anomaly. The report noted that the public should not approach the crater within a 12-km radius.
Sources: Instituto Geológico Minero y Metalúrgico (INGEMMET); Instituto Geofísico del Perú (IGP)
Observatorio Vulcanológico del Sur del IGP (OVS-IGP) and Observatorio Vulcanológico del INGEMMET (OVI) reported that an average of 18 explosions per day occurred at Sabancaya during 10-16 December. Long-period seismic events were recorded, and hybrid earthquakes were infrequent and of low magnitude. Gas-and-ash plumes rose as high as 2.2 km above the crater rim and drifted 40 km W and SW. MIROVA detected five thermal anomalies, and on 13 December the sulfur-dioxide gas flux was high at 3,100 tons per day. The report noted that the public should not approach the crater within a 12-km radius.
Sources: Instituto Geológico Minero y Metalúrgico (INGEMMET); Instituto Geofísico del Perú (IGP)
Observatorio Vulcanológico del Sur del IGP (OVS-IGP) and Observatorio Vulcanológico del INGEMMET (OVI) reported that an average of 17 explosions per day occurred at Sabancaya during 3-9 December. Long-period seismic events were recorded, and hybrid earthquakes were infrequent and of low magnitude. Gas-and-ash plumes rose as high as 3 km above the crater rim and drifted 40 km E and SW. MIROVA detected seven thermal anomalies, and on 6 December the sulfur-dioxide gas flux was high at 3,600 tons per day. The report noted that the public should not approach the crater within a 12-km radius.
Sources: Instituto Geológico Minero y Metalúrgico (INGEMMET); Instituto Geofísico del Perú (IGP)
Observatorio Vulcanológico del Sur del IGP (OVS-IGP) and Observatorio Vulcanológico del INGEMMET (OVI) reported that an average of 21 explosions per day occurred at Sabancaya during 26 November-2 December. Long-period seismic events were recorded, and hybrid earthquakes were infrequent and of low magnitude. Gas-and-ash plumes rose as high as 2.5 km above the crater rim and drifted 30 km N, E, and SE. MIROVA detected eight thermal anomalies, and on 28 November the sulfur-dioxide gas flux was high at 4,600 tons per day. The report noted that the public should not approach the crater within a 12-km radius.
Sources: Instituto Geológico Minero y Metalúrgico (INGEMMET); Instituto Geofísico del Perú (IGP)
Observatorio Vulcanológico del Sur del IGP (OVS-IGP) and Observatorio Vulcanológico del INGEMMET (OVI) reported that an average of 20 explosions per day occurred at Sabancaya during 19-25 November. Long-period seismic events were recorded, and hybrid earthquakes were infrequent and of low magnitude. Gas-and-ash plumes rose as high as 2.7 km above the crater rim and drifted 40 km NW and N. MIROVA detected six thermal anomalies, and on 22 November the sulfur-dioxide gas flux was high at 3,000 tons per day. The report noted that the public should not approach the crater within a 12-km radius.
Sources: Instituto Geológico Minero y Metalúrgico (INGEMMET); Instituto Geofísico del Perú (IGP)
Observatorio Vulcanológico del Sur del IGP (OVS-IGP) and Observatorio Vulcanológico del INGEMMET (OVI) reported that an average of 20 explosions per day occurred at Sabancaya during 12-18 November. Long-period seismic events were recorded, and hybrid earthquakes were infrequent and of low magnitude. Gas-and-ash plumes rose as high as 3 km above the crater rim and drifted 40 km NW, SW, and S. MIROVA detected seven thermal anomalies, and on 13 November the sulfur-dioxide gas flux was high at 3,000 tons per day. The report noted that the public should not approach the crater within a 12-km radius.
Sources: Instituto Geológico Minero y Metalúrgico (INGEMMET); Instituto Geofísico del Perú (IGP)
Observatorio Vulcanológico del Sur del IGP (OVS-IGP) and Observatorio Vulcanológico del INGEMMET (OVI) reported that an average of 18 explosions per day occurred at Sabancaya during 5-11 November. Hybrid earthquakes were infrequent and of low magnitude. Gas-and-ash plumes rose as high as 3.7 km above the crater rim and drifted 40 km N, NW, and W. MIROVA detected seven thermal anomalies, and on 8 November the sulfur-dioxide gas flux was high at 2,500 tons per day. The report noted that the public should not approach the crater within a 12-km radius.
Sources: Instituto Geológico Minero y Metalúrgico (INGEMMET); Instituto Geofísico del Perú (IGP)
Observatorio Vulcanológico del Sur del IGP (OVS-IGP) and Observatorio Vulcanológico del INGEMMET (OVI) reported that an average of 30 explosions per day occurred at Sabancaya during 29 October-4 November. Hybrid earthquakes were infrequent and of low magnitude. Gas-and-ash plumes rose as high as 3.4 km above the crater rim and drifted 40 km W, SW, and S. MIROVA detected seven thermal anomalies, and on 2 November the sulfur-dioxide gas flux was high at 2,300 tons per day. The report noted that the public should not approach the crater within a 12-km radius.
Sources: Instituto Geológico Minero y Metalúrgico (INGEMMET); Instituto Geofísico del Perú (IGP)
Observatorio Vulcanológico del Sur del IGP (OVS-IGP) and Observatorio Vulcanológico del INGEMMET (OVI) reported that an average of 30 explosions per day occurred at Sabancaya during 22-28 October. Hybrid earthquakes were infrequent and of low magnitude, and long-period events were detected. Gas-and-ash plumes rose as high as 3.4 km above the crater rim and drifted 40 km SE, E, and NE. MIROVA detected five thermal anomalies, and on 27 October the sulfur-dioxide gas flux was high at 2,671 tons per day. The report noted that the public should not approach the crater within a 12-km radius.
Sources: Instituto Geológico Minero y Metalúrgico (INGEMMET); Instituto Geofísico del Perú (IGP)
Observatorio Vulcanológico del Sur del IGP (OVS-IGP) and Observatorio Vulcanológico del INGEMMET (OVI) reported that explosions at Sabancaya averaged 23 per day during 15-21 October. Hybrid earthquakes were infrequent and of low magnitude. Gas-and-ash plumes rose as high as 3 km above the crater rim and drifted 40 km W, NE, and SE. The MIROVA system detected five thermal anomalies, and on 19 October the sulfur dioxide gas flux was high at 2,200 tons per day. The report noted that the public should not approach the crater within a 12-km radius.
Sources: Instituto Geológico Minero y Metalúrgico (INGEMMET); Instituto Geofísico del Perú (IGP)
Observatorio Vulcanológico del Sur del IGP (OVS-IGP) and Observatorio Vulcanológico del INGEMMET (OVI) reported that explosions at Sabancaya averaged 17 per day during 8-14 October. Hybrid earthquakes were infrequent and of low magnitude. Gas-and-ash plumes rose as high as 2.5 km above the crater rim and drifted 30 km NE, E, SE, and SW. The MIROVA system detected six thermal anomalies, and on 14 October the sulfur dioxide gas flux was high at 3,132 tons per day. The report noted that the public should not approach the crater within a 12-km radius.
Sources: Instituto Geológico Minero y Metalúrgico (INGEMMET); Instituto Geofísico del Perú (IGP)
Observatorio Vulcanológico del Sur del IGP (OVS-IGP) and Observatorio Vulcanológico del INGEMMET (OVI) reported that explosions at Sabancaya averaged 24 per day during 1-7 October. Hybrid earthquakes were infrequent and of low magnitude. Gas-and-ash plumes rose as high as 3 km above the crater rim and drifted 50 km SE, S, and SW. Ashfall was reported in Huanca (75 km SSE). The MIROVA system detected five thermal anomalies, and on 1 October the sulfur dioxide gas flux was high at 5,027 tons/day. The report noted that the public should not approach the crater within a 12-km radius.
Sources: Instituto Geológico Minero y Metalúrgico (INGEMMET); Instituto Geofísico del Perú (IGP)
Observatorio Vulcanológico del Sur del IGP (OVS-IGP) and Observatorio Vulcanológico del INGEMMET (OVI) reported that explosions at Sabancaya averaged 21 per day during 24-30 September. Hybrid earthquakes were infrequent and of low magnitude. Gas-and-ash plumes rose as high as 3.7 km above the crater rim and drifted 50 km E, SE, and SW. The MIROVA system detected six thermal anomalies, and on 29 September the sulfur dioxide gas flux was high at 3,250 tons/day. The report noted that the public should not approach the crater within a 12-km radius.
Sources: Instituto Geológico Minero y Metalúrgico (INGEMMET); Instituto Geofísico del Perú (IGP)
Observatorio Vulcanológico del Sur del IGP (OVS-IGP) and Observatorio Vulcanológico del INGEMMET (OVI) reported that explosions at Sabancaya averaged 16 per day during 17-23 September. Hybrid earthquakes were infrequent and of low magnitude. Gas-and-ash plumes rose as high as 3.5 km above the crater rim and drifted 40 km N, NE, and SE. The MIROVA system detected eight thermal anomalies, and on 17 September the sulfur dioxide gas flux was high at 1,600 tons/day. The report noted that the public should not approach the crater within a 12-km radius.
Sources: Instituto Geológico Minero y Metalúrgico (INGEMMET); Instituto Geofísico del Perú (IGP)
Observatorio Vulcanológico del Sur del IGP (OVS-IGP) and Observatorio Vulcanológico del INGEMMET (OVI) reported that explosions at Sabancaya averaged 13 per day during 10-16 September. Hybrid earthquakes were infrequent and of low magnitude. Gas-and-ash plumes rose as high as 2.5 km above the crater rim and drifted 30 km N, NE, and SE. The MIROVA system detected seven thermal anomalies, and on 12 September the sulfur dioxide gas flux was high at 2,060 tons/day. The report noted that the public should not approach the crater within a 12-km radius.
Sources: Instituto Geológico Minero y Metalúrgico (INGEMMET); Instituto Geofísico del Perú (IGP)
Observatorio Vulcanológico del Sur del IGP (OVS-IGP) and Observatorio Vulcanológico del INGEMMET (OVI) reported that explosions at Sabancaya averaged 17 per day during 3-9 September. Hybrid earthquakes were infrequent and of low magnitude. Gas-and-ash plumes rose as high as 3.5 km above the crater rim and drifted 50 km SW, E, and NE. The MIROVA system detected seven thermal anomalies, and on 3 September the sulfur dioxide gas flux was high at 2,380 tons/day. The report noted that the public should not approach the crater within a 12-km radius.
Sources: Instituto Geológico Minero y Metalúrgico (INGEMMET); Instituto Geofísico del Perú (IGP)
Observatorio Vulcanológico del Sur del IGP (OVS-IGP) and Observatorio Vulcanológico del INGEMMET (OVI) reported that explosions at Sabancaya averaged 25 per day during 27 August-2 September. Hybrid earthquakes were infrequent and of low magnitude. Gas-and-ash plumes rose as high as 3 km above the crater rim and drifted 50 km SE, E, and NE. The MIROVA system detected six thermal anomalies, and on 2 September the sulfur dioxide gas flux was high at 3,970 tons/day. The report noted that the public should not approach the crater within a 12-km radius.
Sources: Instituto Geológico Minero y Metalúrgico (INGEMMET); Instituto Geofísico del Perú (IGP)
Observatorio Vulcanológico del Sur del IGP (OVS-IGP) and Observatorio Vulcanológico del INGEMMET (OVI) reported that explosions at Sabancaya averaged 25 per day during 20-26 August. Hybrid earthquakes were infrequent and low magnitude. Gas-and-ash plumes rose as high as 4.5 km above the crater rim and drifted 50 km SE, E, NE, and N. The MIROVA system detected seven thermal anomalies, and on 25 August the sulfur dioxide gas flux was high at 2,230 tons/day. The report noted that the public should not approach the crater within a 12-km radius.
Sources: Instituto Geológico Minero y Metalúrgico (INGEMMET); Instituto Geofísico del Perú (IGP)
Observatorio Vulcanológico del Sur del IGP (OVS-IGP) and Observatorio Vulcanológico del INGEMMET (OVI) reported that explosions at Sabancaya averaged 27 per day during 13-19 August. Hybrid earthquakes were infrequent and low-magnitude. Gas-and-ash plumes rose as high as 3.7 km above the crater rim and drifted 50 km SE, E, and NE. The MIROVA system detected nine thermal anomalies, and on 19 August the sulfur dioxide gas flux was high at 3,100 tons/day. The report noted that the public should not approach the crater within a 12-km radius.
Sources: Instituto Geológico Minero y Metalúrgico (INGEMMET); Instituto Geofísico del Perú (IGP)
Observatorio Vulcanológico del Sur del IGP (OVS-IGP) and Observatorio Vulcanológico del INGEMMET (OVI) reported that explosions at Sabancaya averaged 23 per day during 6-12 August. Hybrid earthquakes were infrequent and low magnitude. Gas-and-ash plumes rose as high as 2.9 km above the crater rim and drifted 40 km SE, E, and NE. The MIROVA system detected five thermal anomalies, and on 9 August the sulfur dioxide gas flux was high at 2,700 tons/day. The report noted that the public should not approach the crater within a 12-km radius.
Sources: Instituto Geológico Minero y Metalúrgico (INGEMMET); Instituto Geofísico del Perú (IGP)
Observatorio Vulcanológico del Sur del IGP (OVS-IGP) and Observatorio Vulcanológico del INGEMMET (OVI) reported that explosions at Sabancaya averaged 19 per day during 30 July-5 August. Hybrid earthquakes were infrequent and low magnitude. Gas-and-ash plumes rose as high as 2.6 km above the crater rim and drifted 30 km SE, E, and NE. On 2 August the sulfur dioxide gas flux was high at 5,000 tons/day. The report noted that the public should not approach the crater within a 12-km radius.
Sources: Instituto Geológico Minero y Metalúrgico (INGEMMET); Instituto Geofísico del Perú (IGP)
Observatorio Vulcanológico del Sur del IGP (OVS-IGP) and Observatorio Vulcanológico del INGEMMET (OVI) reported that explosions at Sabancaya averaged 19 per day during 23-29 July. Hybrid earthquakes were infrequent and low magnitude. Gas-and-ash plumes rose as high as 3 km above the crater rim and drifted 40 km SE and E. On 26 July the sulfur dioxide gas flux was high at 4,195 tons/day. The report noted that the public should not approach the crater within a 12-km radius.
Sources: Instituto Geológico Minero y Metalúrgico (INGEMMET); Instituto Geofísico del Perú (IGP)
Observatorio Vulcanológico del Sur del IGP (OVS-IGP) and Observatorio Vulcanológico del INGEMMET (OVI) reported that explosions at Sabancaya averaged 25 per day during 16-22 July. Hybrid earthquakes were infrequent and low-magnitude. Gas-and-ash plumes rose as high as 2.5 km above the crater rim and drifted 30 km S, SE, and E. The MIROVA system detected one thermal anomaly, and on 18 July the sulfur dioxide gas flux was very high at 12,068 tons/day. The report noted that the public should not approach the crater within a 12-km radius.
Sources: Instituto Geológico Minero y Metalúrgico (INGEMMET); Instituto Geofísico del Perú (IGP)
Observatorio Vulcanológico del Sur del IGP (OVS-IGP) and Observatorio Vulcanológico del INGEMMET (OVI) reported that explosions at Sabancaya averaged 23 per day during 9-17 July. Hybrid earthquakes were infrequent and low magnitude. Gas-and-ash plumes rose as high as 2.5 km above the crater rim and drifted 30 km S, SE, and E. The MIROVA system detected two thermal anomalies. The report noted that the public should not approach the crater within a 12-km radius.
Sources: Instituto Geológico Minero y Metalúrgico (INGEMMET); Instituto Geofísico del Perú (IGP)
Observatorio Vulcanológico del Sur del IGP (OVS-IGP) and Observatorio Vulcanológico del INGEMMET (OVI) reported that explosions at Sabancaya averaged 22 per day during 2-8 July. Hybrid earthquakes were infrequent and low magnitude. Gas-and-ash plumes rose as high as 2.5 km above the crater rim and drifted 30 km S, SE, and E. The MIROVA system detected nine thermal anomalies, and on 3 July the sulfur dioxide gas flux was high at 4,715 tons/day. The report noted that the public should not approach the crater within a 12-km radius.
Sources: Instituto Geológico Minero y Metalúrgico (INGEMMET); Instituto Geofísico del Perú (IGP)
Observatorio Vulcanológico del Sur del IGP (OVS-IGP) and Observatorio Vulcanológico del INGEMMET (OVI) reported that explosions at Sabancaya averaged 24 per day during 25 June-1 July. Hybrid earthquakes were infrequent and low magnitude. Gas-and-ash plumes rose as high as 2.5 km above the crater rim and drifted 30 km S, SE, and E. The MIROVA system detected six thermal anomalies, and on 21 June the sulfur dioxide gas flux was high at 3,000 tons/day. The report noted that the public should not approach the crater within a 12-km radius.
Sources: Instituto Geológico Minero y Metalúrgico (INGEMMET); Instituto Geofísico del Perú (IGP)
Observatorio Vulcanológico del Sur del IGP (OVS-IGP) and Observatorio Vulcanológico del INGEMMET (OVI) reported that explosions at Sabancaya averaged 29 per day during 18-24 June. Hybrid earthquakes were infrequent and low magnitude. Gas-and-ash plumes rose as high as 1.8 km above the crater rim and drifted 30 km S, SE, and E. The MIROVA system detected 11 thermal anomalies, and on 21 June the sulfur dioxide gas flux was high at 4,900 tons/day. The report noted that the public should not approach the crater within a 12-km radius.
Sources: Instituto Geológico Minero y Metalúrgico (INGEMMET); Instituto Geofísico del Perú (IGP)
Observatorio Vulcanológico del Sur del IGP (OVS-IGP) and Observatorio Vulcanológico del INGEMMET (OVI) reported that explosions at Sabancaya averaged 19 per day during 11-17 June. Hybrid earthquakes were infrequent and low magnitude. Gas-and-ash plumes rose as high as 1.4 km above the crater rim and drifted 30 km S and SE. The MIROVA system detected two thermal anomalies, and on 14 June the sulfur dioxide gas flux was high at 4,300 tons/day. The report noted that the public should not approach the crater within a 12-km radius.
Sources: Instituto Geológico Minero y Metalúrgico (INGEMMET); Instituto Geofísico del Perú (IGP)
Observatorio Vulcanológico del Sur del IGP (OVS-IGP) and Observatorio Vulcanológico del INGEMMET (OVI) reported that explosive activity at Sabancaya was comparable to the previous week; explosions averaged 28 per day during 28 May-3 June. Seismicity was dominated by long-period events and signals indicating emissions. Gas-and-ash plumes rose as high as 4.3 km above the crater rim and drifted 40 km NE, E, and SE. The MIROVA system detected six thermal anomalies, and on 30 May the sulfur dioxide gas flux was high at 5,571 tons/day. The report noted that the public should not approach the crater within a 12-km radius.
Sources: Instituto Geológico Minero y Metalúrgico (INGEMMET); Instituto Geofísico del Perú (IGP)
Observatorio Vulcanológico del Sur del IGP (OVS-IGP) and Observatorio Vulcanológico del INGEMMET (OVI) reported that explosive activity at Sabancaya was comparable to the previous week; explosions averaged 35 per day during 21-27 May. Seismicity was dominated by long-period events and signals indicating emissions. Gas-and-ash plumes rose as high as 3.3 km above the crater rim and drifted 30 km NE, E, and SE. The MIROVA system detected nine thermal anomalies, and on 24 May the sulfur dioxide gas flux was high at 3,950 tons/day. The report noted that the public should not approach the crater within a 12-km radius.
Sources: Instituto Geológico Minero y Metalúrgico (INGEMMET); Instituto Geofísico del Perú (IGP)
Observatorio Vulcanológico del Sur del IGP (OVS-IGP) and Observatorio Vulcanológico del INGEMMET (OVI) reported that explosive activity at Sabancaya was comparable to the previous week; explosions averaged 30 per day during 14-20 May. Seismicity was dominated by long-period events and signals indicating emissions. Gas-and-ash plumes rose as high as 1.9 km above the crater rim and drifted N and NW. The MIROVA system detected nine thermal anomalies, and on 19 May the sulfur dioxide gas flux was high at 3,147 tons/day. The report noted that the public should not approach the crater within a 12-km radius.
Sources: Instituto Geológico Minero y Metalúrgico (INGEMMET); Instituto Geofísico del Perú (IGP)
Intermittent ash and gas emissions at Sabancaya during 9-15 May were reported by the Buenos Aires VAAC, with plume altitudes reaching 7-9 km (2,300-3,000 ft) a.s.l.
Source: Buenos Aires Volcanic Ash Advisory Center (VAAC)
Observatorio Vulcanológico del Sur del IGP (OVS-IGP) and Observatorio Vulcanológico del INGEMMET (OVI) reported that explosive activity at Sabancaya increased compared to the previous week; explosions averaged 25 per day during 30 April-6 May. The number of long-period events and signals indicating emissions increased. Gas-and-ash plumes rose as high as 2 km above the crater rim and drifted 40 km N, NE, and E. The MIROVA system detected four thermal anomalies, and on 6 May the sulfur dioxide gas flux was high at 2,662 tons/day. The report noted that the public should not approach the crater within a 12-km radius.
Sources: Instituto Geológico Minero y Metalúrgico (INGEMMET); Instituto Geofísico del Perú (IGP)
Observatorio Vulcanológico del Sur del IGP (OVS-IGP) and Observatorio Vulcanológico del INGEMMET (OVI) reported that explosive activity at Sabancaya was similar to the previous week; explosions averaged 22 per day during 23-29 April. Seismicity was dominated by long-period events and signals indicating emissions. Gas-and-ash plumes rose as high as 2 km above the crater rim and drifted 30 km NE and SE. The report noted that the public should not to approach the crater within a 12-km radius.
Sources: Instituto Geológico Minero y Metalúrgico (INGEMMET); Instituto Geofísico del Perú (IGP)
Observatorio Vulcanológico del Sur del IGP (OVS-IGP) and Observatorio Vulcanológico del INGEMMET (OVI) reported that explosive activity at Sabancaya increased compared to the previous week; explosions averaged 19 per day during 16-22 April. Seismicity was dominated by long-period events, with a rise in signals indicating emissions. Gas-and-ash plumes rose as high as 2.2 km above the crater rim and drifted 40 km NW, W, and SW. The MIROVA system detected five thermal anomalies, and on 17 April the sulfur dioxide gas flux was high at 3,421 tons/day. The report noted that the public should not approach the crater within a 12-km radius.
Sources: Instituto Geológico Minero y Metalúrgico (INGEMMET); Instituto Geofísico del Perú (IGP)
Observatorio Vulcanológico del Sur del IGP (OVS-IGP) and Observatorio Vulcanológico del INGEMMET (OVI) reported that explosive activity at Sabancaya was similar to the previous week; explosions averaged 15 per day during 9-15 April. Seismicity was dominated by long-period events, with signals indicating emissions. Gas-and-ash plumes rose as high as 2.2 km above the crater rim and drifted 30 km NW and SW. Minor ashfall was reported in Huambo and Cabanaconde. The MIROVA system detected three thermal anomalies. The report noted that the public should not to approach the crater within a 12-km radius.
Sources: Instituto Geológico Minero y Metalúrgico (INGEMMET); Instituto Geofísico del Perú (IGP)
Observatorio Vulcanológico del Sur del IGP (OVS-IGP) and Observatorio Vulcanológico del INGEMMET (OVI) reported that explosive activity at Sabancaya was similar compared to the previous week; explosions averaged 15 per day during 2-8 April. Seismicity was dominated by long-period events, with signals indicating emissions. Gas-and-ash plumes rose as high as 3.2 km above the crater rim and drifted 30 km NE, SE, and S. Ashfall was reported in Achoma (25 km NE), Chivay (36 km NE), and Huanca. The MIROVA system detected three thermal anomalies. The report noted that the public should not to approach the crater within a 12-km radius.
Sources: Instituto Geológico Minero y Metalúrgico (INGEMMET); Instituto Geofísico del Perú (IGP)
Observatorio Vulcanológico del Sur del IGP (OVS-IGP) and Observatorio Vulcanológico del INGEMMET (OVI) reported that explosive activity at Sabancaya was similar compared to the previous week; explosions averaged 18 per day during 26 March-1 April. Seismicity was dominated by long-period events, with signals indicating emissions. Gas-and-ash plumes rose as high as 4.7 km above the crater rim and drifted 50 km SW and NW. The sulfur dioxide flux was high, at 2,855 tons per day on 30 March. The MIROVA system detected six thermal anomalies. On 28 March a lahar which began at 1113 descended the SE flank towards the Sallalli river. The report noted that the public should not to approach the crater within a 12-km radius.
Sources: Instituto Geológico Minero y Metalúrgico (INGEMMET); Instituto Geofísico del Perú (IGP)
Observatorio Vulcanológico del Sur del IGP (OVS-IGP) and Observatorio Vulcanológico del INGEMMET (OVI) reported that explosive activity at Sabancaya was similar compared to the previous week; explosions averaged 17 per day during 19-25 March. Seismicity was dominated by long-period events, with signals indicating emissions. Gas-and-ash plumes rose 2.7 km above the crater rim and drifted 30 km SW. The sulfur dioxide flux was high, at 5,180 tons per day on 21 March. At 0853 on 7 March an ash plume rose 3.5 km and drifted more than 30 km NW. The report noted that the public should not to approach the crater within a 12-km radius.
Sources: Instituto Geológico Minero y Metalúrgico (INGEMMET); Instituto Geofísico del Perú (IGP)
Observatorio Vulcanológico del Sur del IGP (OVS-IGP) and Observatorio Vulcanológico del INGEMMET (OVI) reported that explosive activity at Sabancaya increased compared to the previous week; explosions averaged 17 per day during 12-18 March. Seismicity was dominated by long-period events, with signals indicating emissions. Gas-and-ash plumes rose 3 km above the crater rim and drifted 30 km NW, SW, and S. The sulfur dioxide flux was high, at 3,110 tons per day on 14 March. The report noted that the public should not to approach the crater within a 12-km radius.
Sources: Instituto Geológico Minero y Metalúrgico (INGEMMET); Instituto Geofísico del Perú (IGP)
Observatorio Vulcanológico del Sur del IGP (OVS-IGP) and Observatorio Vulcanológico del INGEMMET (OVI) reported that explosive activity at Sabancaya decreased compared to the previous week; explosions averaged 10 per day during 5-11 March. Seismicity was dominated by long-period events, with signals indicating emissions. Gas-and-ash plumes rose 5.4 km above the crater rim and drifted 30 km N, NW, W, and SW. The sulfur dioxide flux was high, at 2,396 tons per day on 9 March. The report noted that the public should not to approach the crater within a 12-km radius.
Sources: Instituto Geológico Minero y Metalúrgico (INGEMMET); Instituto Geofísico del Perú (IGP)
Observatorio Vulcanológico del Sur del IGP (OVS-IGP) and Observatorio Vulcanológico del INGEMMET (OVI) reported that explosive activity at Sabancaya decreased compared to the previous week; there was an average of 12 explosions recorded per day during 26 February-4 March. Seismicity was dominated by long-period events, with signals indicating emissions. Gas-and-ash plumes rose 2 km above the crater rim and drifted 30 km NW, W, and SW. The sulfur dioxide flux was high, at 2,440 tons per day on 3 March. The report noted that the public should not to approach the crater within a 12-km radius.
Sources: Instituto Geológico Minero y Metalúrgico (INGEMMET); Instituto Geofísico del Perú (IGP)
Observatorio Vulcanológico del Sur del IGP (OVS-IGP) and Observatorio Vulcanológico del INGEMMET (OVI) reported that explosive activity at Sabancaya was similar to the previous week; there was an average of 17 explosions recorded per day during 19-25 February. Seismicity was dominated by long-period events, with signals indicating emissions. Gas-and-ash plumes rose 4.5 km above the crater rim and drifted 50 km NW, SW, S, and SE. The MIROVA system detected one thermal anomaly. The sulfur dioxide flux was high, at 2,092 tons per day on 25 February. The report noted that the public should not to approach the crater within a 12-km radius.
Sources: Instituto Geológico Minero y Metalúrgico (INGEMMET); Instituto Geofísico del Perú (IGP)
Observatorio Vulcanológico del Sur del IGP (OVS-IGP) and Observatorio Vulcanológico del INGEMMET (OVI) reported that explosive activity at Sabancaya was similar to the previous week; there was an average of 19 explosions recorded per day during 12-18 February. Seismicity was dominated by long-period events, with signals indicating emissions. Gas-and-ash plumes rose 2.5 km above the crater rim and drifted 30 km NW, SW, and S. The MIROVA system detected three thermal anomalies. The sulfur dioxide flux was the highest value yet registered during the eruption, at 9,270 tons per day on 15 February. The report noted that the public should not to approach the crater within a 12-km radius.
Sources: Instituto Geológico Minero y Metalúrgico (INGEMMET); Instituto Geofísico del Perú (IGP)
Observatorio Vulcanológico del Sur del IGP (OVS-IGP) and Observatorio Vulcanológico del INGEMMET (OVI) reported that explosive activity at Sabancaya was similar to the previous week; there was an average of 18 explosions recorded per day during 5-11 February. Seismicity was dominated by long-period events, with signals indicating emissions. Gas-and-ash plumes rose 3.9 km above the crater rim and drifted 50 km NW, SW, S, and SE. The MIROVA system detected three thermal anomalies. The sulfur dioxide flux was high, at 2,062 tons per day on 10 February. The report noted that the public should not to approach the crater within a 12-km radius.
Sources: Instituto Geológico Minero y Metalúrgico (INGEMMET); Instituto Geofísico del Perú (IGP)
Observatorio Vulcanológico del Sur del IGP (OVS-IGP) and Observatorio Vulcanológico del INGEMMET (OVI) reported that explosive activity at Sabancaya decreased compared to the previous week; there was an average of 22 explosions recorded per day during 29 January-4 February. Seismicity was dominated by long-period events, with signals indicating emissions. Gas-and-ash plumes rose 3.5 km above the crater rim and drifted 50 km NW, SW, and S. The MIROVA system detected two thermal anomalies. The sulfur dioxide flux was high, at 3,388 tons per day on 31 January. The report noted that the public should not to approach the crater within a 12-km radius.
Sources: Instituto Geológico Minero y Metalúrgico (INGEMMET); Instituto Geofísico del Perú (IGP)
Observatorio Vulcanológico del Sur del IGP (OVS-IGP) and Observatorio Vulcanológico del INGEMMET (OVI) reported that explosive activity at Sabancaya had decreased compared to the previous week; there was an average of 33 explosions recorded per day during 22-28 January. Seismicity was dominated by long-period events, with signals indicating emissions. Gas-and-ash plumes rose 3 km above the crater rim and drifted 50 km NW and SW. The MIROVA system detected five thermal anomalies. The sulfur dioxide flux was high, at 3,477 tons per day on 22 January. The report noted that the public should not to approach the crater within a 12-km radius.
Sources: Instituto Geológico Minero y Metalúrgico (INGEMMET); Instituto Geofísico del Perú (IGP)
Observatorio Vulcanológico del Sur del IGP (OVS-IGP) and Observatorio Vulcanológico del INGEMMET (OVI) reported that explosive activity at Sabancaya was similar to the previous week; there was an average of 57 explosions recorded per day during 15-21 January. Seismicity was dominated by long-period events, with signals indicating emissions. Gas-and-ash plumes rose 3.3 km above the crater rim and drifted 50 km NW. The MIROVA system detected six thermal anomalies. The sulfur dioxide flux was high, at 3,410 tons per day on 19 January. The report noted that the public should not to approach the crater within a 12-km radius.
Sources: Instituto Geológico Minero y Metalúrgico (INGEMMET); Instituto Geofísico del Perú (IGP)
Observatorio Vulcanológico del Sur del IGP (OVS-IGP) and Observatorio Vulcanológico del INGEMMET (OVI) reported that explosive activity at Sabancaya was similar to the previous week; there was an average of 57 explosions recorded per day during 8-14 January. Seismicity was dominated by long-period events, with signals indicating emissions. Gas-and-ash plumes rose 2.5 km above the crater rim and drifted 50 km NW and SW. The MIROVA system detected three thermal anomalies. The sulfur dioxide flux was high, at 2,071 tons per day on 12 January. The report noted that the public should not to approach the crater within a 12-km radius.
Sources: Instituto Geológico Minero y Metalúrgico (INGEMMET); Instituto Geofísico del Perú (IGP)
Observatorio Vulcanológico del Sur del IGP (OVS-IGP) and Observatorio Vulcanológico del INGEMMET (OVI) reported that explosive activity at Sabancaya was similar to the previous week; there was an average of 41 explosions recorded per day during 1-7 January. Seismicity was dominated by long-period events, with signals indicating emissions. Gas-and-ash plumes rose 3 km above the crater rim and drifted 50 km N, NW, and W. The MIROVA system detected nine thermal anomalies. The sulfur dioxide flux was high, at 3,409 tons per day on 5 January. The report noted that the public should not to approach the crater within a 12-km radius.
Sources: Instituto Geológico Minero y Metalúrgico (INGEMMET); Instituto Geofísico del Perú (IGP)
Observatorio Vulcanológico del Sur del IGP (OVS-IGP) and Observatorio Vulcanológico del INGEMMET (OVI) reported that explosive activity at Sabancaya decreased compared to the previous week; there was an average of 55 explosions recorded per day during 11-17 December. Seismicity was dominated by long-period events, with signals indicating emissions. Gas-and-ash plumes rose 2.5 km above the crater rim and drifted 50 km NW, W, and SW. The MIROVA system detected six thermal anomalies. The sulfur dioxide flux was high, at 2,200 tons per day on 15 December. The report noted that the public should not approach the crater within a 12-km radius.
Sources: Instituto Geológico Minero y Metalúrgico (INGEMMET); Instituto Geofísico del Perú (IGP)
Observatorio Vulcanológico del Sur del IGP (OVS-IGP) and Observatorio Vulcanológico del INGEMMET (OVI) reported that explosive activity at Sabancaya decreased compared to the previous week; there was an average of 63 explosions recorded per day during 4-10 December. Seismicity was dominated by long-period events, with signals indicating emissions. Gas-and-ash plumes rose 3 km above the crater rim and drifted 50 km NE and SW. The MIROVA system detected four thermal anomalies. The sulfur dioxide flux was high, at 1,392 tons per day on 4 December. The report noted that the public should not to approach the crater within a 12-km radius.
Sources: Instituto Geológico Minero y Metalúrgico (INGEMMET); Instituto Geofísico del Perú (IGP)
Observatorio Vulcanológico del Sur del IGP (OVS-IGP) and Observatorio Vulcanológico del INGEMMET (OVI) reported that explosive activity at Sabancaya slightly decreased compared to the previous week; there was an average of 69 explosions recorded per day during 27 November-3 December. Seismicity was dominated by long-period events, with signals indicating emissions. Gas-and-ash plumes rose 3.3 km above the crater rim and drifted 40 km NE and SW. The MIROVA system detected eight thermal anomalies. The sulfur dioxide flux was high, at 2,036 tons per day, on 28 November. The report noted that the public should not to approach the crater within a 12-km radius.
Sources: Instituto Geológico Minero y Metalúrgico (INGEMMET); Instituto Geofísico del Perú (IGP)
Observatorio Vulcanológico del Sur del IGP (OVS-IGP) and Observatorio Vulcanológico del INGEMMET (OVI) reported that explosive activity at Sabancaya slightly decreased compared to the previous week; there was an average of 78 explosions recorded per day during 20-26 November. Seismicity was dominated by long-period events, with signals indicating emissions. Gas-and-ash plumes rose 4.2 km above the crater rim and drifted 50 km NE, N, and NW. The MIROVA system detected 11 thermal anomalies. The sulfur dioxide flux was high, at 2,944 tons per day on 23 November. The report noted that the public should not to approach the crater within a 12-km radius.
Sources: Instituto Geológico Minero y Metalúrgico (INGEMMET); Instituto Geofísico del Perú (IGP)
Observatorio Vulcanológico del Sur del IGP (OVS-IGP) and Observatorio Vulcanológico del INGEMMET (OVI) reported that explosive activity at Sabancaya increased compared to the previous week; there was an average of 82 explosions recorded per day during 13-19 November. Seismicity was dominated by long-period events, with signals indicating emissions. Gas-and-ash plumes rose 4 km above the crater rim and drifted 40 km NE, N, and NW. The MIROVA system detected eight thermal anomalies. The sulfur dioxide flux was high, at 3,103 tons per day on 13 November. The report noted that the public should not to approach the crater within a 12-km radius.
Sources: Instituto Geológico Minero y Metalúrgico (INGEMMET); Instituto Geofísico del Perú (IGP)
Observatorio Vulcanológico del Sur del IGP (OVS-IGP) and Observatorio Vulcanológico del INGEMMET (OVI) reported that explosive activity at Sabancaya increased compared to the previous week; there was an average of 66 explosions recorded per day during 6-12 November. Seismicity was dominated by long-period events, with signals indicating emissions. Gas-and-ash plumes rose 4 km above the crater rim and drifted 50 km NE, E, and SE. The MIROVA system detected six thermal anomalies. The sulfur dioxide flux was high, at 2,763 tons per day on 8 November. The report noted that the public should not to approach the crater within a 12-km radius.
Sources: Instituto Geológico Minero y Metalúrgico (INGEMMET); Instituto Geofísico del Perú (IGP)
Observatorio Vulcanológico del Sur del IGP (OVS-IGP) and Observatorio Vulcanológico del INGEMMET (OVI) reported that explosive activity at Sabancaya increased compared to the previous week; there was an average of 57 daily explosions during 30 October-5 November. Seismicity was dominated by long-period events, with signals indicating emissions. Gas-and-ash plumes rose 3.8 km above the crater rim and drifted 40 km N, NE, and E. The MIROVA system detected five thermal anomalies. The sulfur dioxide flux was high, at 3,996 tons per day, on 30 October. The report noted that the public should not to approach the crater within a 12-km radius.
Sources: Instituto Geológico Minero y Metalúrgico (INGEMMET); Instituto Geofísico del Perú (IGP)
Observatorio Vulcanológico del Sur del IGP (OVS-IGP) and Observatorio Vulcanológico del INGEMMET (OVI) reported that explosive activity at Sabancaya slightly decreased compared to the previous week; there was an average of 43 explosions recorded per day during 23-29 October. Seismicity was dominated by long-period events, with a relatively steady rate of signals indicating emissions and an increasing number of hybrid events. Gas-and-ash plumes rose 3.9 km above the crater rim and drifted 30 km NW, NE, E, and SE. The MIROVA system detected eight thermal anomalies. The sulfur dioxide flux was high, at 2,635 tons per day on 29 October. The report noted that the public should not to approach the crater within a 12-km radius.
Sources: Instituto Geológico Minero y Metalúrgico (INGEMMET); Instituto Geofísico del Perú (IGP)
Observatorio Vulcanológico del Sur del IGP (OVS-IGP) and Observatorio Vulcanológico del INGEMMET (OVI) reported that explosive activity at Sabancaya slightly increased compared to the previous week; there was an average of 47 explosions recorded per day during 16-22 October. Seismicity was dominated by long-period events, with an increase in signals indicating emissions and a low number of hybrid events. Gas-and-ash plumes rose 3.8 km above the crater rim and drifted 60 km NE, E, and SE. The MIROVA system detected four thermal anomalies. The report warned the public not to approach the crater within a 12-km radius.
Sources: Instituto Geológico Minero y Metalúrgico (INGEMMET); Instituto Geofísico del Perú (IGP)
Observatorio Vulcanológico del Sur del IGP (OVS-IGP) and Observatorio Vulcanológico del INGEMMET (OVI) reported that explosive activity at Sabancaya was similar to the previous week; there was an average of 41 explosions recorded per day during 9-15 October. The earthquakes were dominated by long-period events, with fewer numbers of signals indicating emissions and hybrid events. Gas-and-ash plumes rose 3.1 km above the crater rim and drifted more than 35 km S and SE. The MIROVA system detected four thermal anomalies. The report warned the public not to approach the crater within a 12-km radius.
Sources: Instituto Geológico Minero y Metalúrgico (INGEMMET); Instituto Geofísico del Perú (IGP)
Observatorio Vulcanológico del Sur del IGP (OVS-IGP) and Observatorio Vulcanológico del INGEMMET (OVI) reported that explosive activity at Sabancaya slightly declined; there was an average of 42 explosions recorded per day during 2-8 October. The earthquakes were dominated by long-period events, with fewer numbers of signals indicating emissions and hybrid events. Gas-and-ash plumes rose 3.5 km above the crater rim and drifted no more than 40 km N, NW, and W. The MIROVA system detected 10 thermal anomalies. The report warned the public not to approach the crater within a 12-km radius.
Sources: Instituto Geológico Minero y Metalúrgico (INGEMMET); Instituto Geofísico del Perú (IGP)
Observatorio Vulcanológico del Sur del IGP (OVS-IGP) and Observatorio Vulcanológico del INGEMMET (OVI) reported that explosive activity at Sabancaya increased; there was an average of 45 explosions recorded per day during 25 September-1 October. The earthquakes were dominated by long-period events, with fewer numbers of signals indicating emissions and hybrid events. Gas-and-ash plumes rose 3.5 km above the crater rim and drifted no more than 40 km E and NE. The MIROVA system detected seven thermal anomalies. The report warned the public not to approach the crater within a 12-km radius.
Sources: Instituto Geológico Minero y Metalúrgico (INGEMMET); Instituto Geofísico del Perú (IGP)
Observatorio Vulcanológico del Sur del IGP (OVS-IGP) and Observatorio Vulcanológico del INGEMMET (OVI) reported that explosive activity at Sabancaya increased; there was an average of 45 explosions recorded per day during 18-24 September. The earthquakes were dominated by long-period events, with fewer signals indicating emissions and hybrid events. Gas-and-ash plumes rose 3.5 km above the crater rim and drifted no more than 40 km E and SE. The MIROVA system detected seven thermal anomalies. The report warned the public not to approach the crater within a 12-km radius.
Sources: Instituto Geológico Minero y Metalúrgico (INGEMMET); Instituto Geofísico del Perú (IGP)
Observatorio Vulcanológico del Sur del IGP (OVS-IGP) and Observatorio Vulcanológico del INGEMMET (OVI) reported that explosive activity at Sabancaya continued to decline; there was an average of 29 explosions recorded per day during 11-17 September. The earthquakes were dominated by long-period events and signals indicating emissions, with fewer numbers of hybrid events. Gas-and-ash plumes rose 2.5 km above the crater rim and drifted no more than 30 km E and SE. The MIROVA system detected one thermal anomaly. The report warned the public not to approach the crater within a 12-km radius.
Sources: Instituto Geológico Minero y Metalúrgico (INGEMMET); Instituto Geofísico del Perú (IGP)
Observatorio Vulcanológico del Sur del IGP (OVS-IGP) and Observatorio Vulcanológico del INGEMMET (OVI) reported that explosive activity at Sabancaya was slightly lower compared to the previous week; there was an average of 38 explosions recorded per day during 4-10 September. The earthquakes were dominated by long-period signals, with fewer numbers of hybrid events and emission signals. Gas-and-ash plumes rose 3.5 km above the crater rim and drifted no more than 40 km SE. The MIROVA system detected five thermal anomalies. The report warned the public not to approach the crater within a 12-km radius.
Sources: Instituto Geológico Minero y Metalúrgico (INGEMMET); Instituto Geofísico del Perú (IGP)
Observatorio Vulcanológico del Sur del IGP (OVS-IGP) and Observatorio Vulcanológico del INGEMMET (OVI) reported that explosive activity at Sabancaya was similar to the previous week; there was an average of 44 explosions recorded per day during 28 August-3 September. The earthquakes were dominated by long-period signals, with fewer numbers of hybrid events and signals indicating emissions. Gas-and-ash plumes rose 3.2 km above the crater rim and drifted no more than 40 km SE and S. The MIROVA system detected five thermal anomalies. The report warned the public not to approach the crater within a 12-km radius.
Sources: Instituto Geológico Minero y Metalúrgico (INGEMMET); Instituto Geofísico del Perú (IGP)
Observatorio Vulcanológico del Sur del IGP (OVS-IGP) and Observatorio Vulcanológico del INGEMMET (OVI) reported that explosive activity at Sabancaya was similar to the previous week; there was an average of 46 explosions recorded per day during 21-27 August. The earthquakes were dominated by long-period signals and signals indicating emissions, with fewer numbers of hybrid events recorded. Gas-and-ash plumes rose 3.4 km above the crater rim and drifted no more than 50 km SE and NW. The MIROVA system detected eight thermal anomalies. The report warned the public not to approach the crater within a 12-km radius.
Sources: Instituto Geológico Minero y Metalúrgico (INGEMMET); Instituto Geofísico del Perú (IGP)
Observatorio Vulcanológico del Sur del IGP (OVS-IGP) and Observatorio Vulcanológico del INGEMMET (OVI) reported that explosive activity at Sabancaya was similar to the previous week; there was an average of 41 explosions recorded per day during 14-20 August. The earthquakes were dominated by long-period signals, with fewer numbers of hybrid events recorded. Gas-and-ash plumes rose 3.4 km above the crater rim and drifted no more than 30 km SE. The report warned the public not to approach the crater within a 12-km radius.
Sources: Instituto Geológico Minero y Metalúrgico (INGEMMET); Instituto Geofísico del Perú (IGP)
Observatorio Vulcanológico del Sur del IGP (OVS-IGP) and Observatorio Vulcanológico del INGEMMET (OVI) reported that explosive activity at Sabancaya decreased compared to the previous week; there was an average of 49 explosions recorded per day during 7-13 August. The earthquakes were dominated by long-period signals, with fewer numbers of hybrid and tremor events recorded. Gas-and-ash plumes rose 3.2 km above the crater rim and drifted no more than 40 km NE and E. Sulfur dioxide flux was as high as 912 tons per day, recorded on 8 August. The MIROVA system detected 12 thermal anomalies. The report reminded the public not to approach the crater within a 12-km radius.
Sources: Instituto Geológico Minero y Metalúrgico (INGEMMET); Instituto Geofísico del Perú (IGP)
Observatorio Vulcanológico del Sur del IGP (OVS-IGP) and Observatorio Vulcanológico del INGEMMET (OVI) reported that explosive activity at Sabancaya increased compared to the previous week; there was an average of 65 small explosions recorded per day during 31 July-6 August. The earthquakes were dominated by long-period signals; the number of hybrid and tremor events had decreased. Gas-and-ash plumes rose 4 km above the crater rim and drifted no more than 30 km N and SE. Sulfur dioxide flux was as high as 2,254 tons per day, recorded on 2 August. The MIROVA system detected nine thermal anomalies. The report reminded the public not to approach the crater within a 12-km radius.
Sources: Instituto Geológico Minero y Metalúrgico (INGEMMET); Instituto Geofísico del Perú (IGP)
Observatorio Vulcanológico del Sur del IGP (OVS-IGP) and Observatorio Vulcanológico del INGEMMET (OVI) reported that explosive activity at Sabancaya increased compared to the previous week; there was an average of 40 explosions recorded per day during 24-30 July. Gas-and-ash plumes rose 5 km above the crater rim and drifted more than 50 km NW and SE. Sulfur dioxide flux was as high as 2,530 tons per day, recorded on 28 July. The MIROVA system detected nine thermal anomalies.
Sources: Instituto Geológico Minero y Metalúrgico (INGEMMET); Instituto Geofísico del Perú (IGP)
Observatorio Vulcanológico del Sur del IGP (OVS-IGP) and Observatorio Vulcanológico del INGEMMET (OVI) reported that since the beginning of July there had been a gradual increase in activity at Sabancaya associated with rising magma and increased sulfur dioxide gas emissions. Gas-and-ash plumes rose to moderate heights, between 2.5 and 4.5 km above the crater rim. On 22 July winds shifted S and SE, causing ashfall in Lluta (30 km SW), Huanca (75 km SSE), and in some parts of Arequipa (80 km SSE).
Sources: Instituto Geológico Minero y Metalúrgico (INGEMMET); Instituto Geofísico del Perú (IGP)
Observatorio Vulcanológico del Sur del IGP (OVS-IGP) and Observatorio Vulcanológico del INGEMMET (OVI) reported that explosive activity at Sabancaya increased compared to the previous week; there was an average of 19 explosions recorded per day during 10-16 July. Gas-and-ash plumes rose 3.5 km above the crater rim and drifted more than 40 km NW and E. Sulfur dioxide flux was as high as 2,959 tons per day, recorded on 16 July. The MIROVA system detected six thermal anomalies. An explosion at 0931 on 19 July generated an ash plume that rose 4 km above the crater rim and drifted N.
Sources: Instituto Geológico Minero y Metalúrgico (INGEMMET); Instituto Geofísico del Perú (IGP)
Observatorio Vulcanológico del Sur del IGP (OVS-IGP) and Observatorio Vulcanológico del INGEMMET (OVI) reported that explosive activity at Sabancaya increased compared to the previous week; there was an average of 10 explosions recorded per day during 3-9 July, and the explosions were more energetic. Gas-and-ash plumes rose 5.5 km above the crater rim and drifted more than 50 km NW and S. Sulfur dioxide flux was as high as 2,239 tons per day.
Sources: Instituto Geológico Minero y Metalúrgico (INGEMMET); Instituto Geofísico del Perú (IGP)
Observatorio Vulcanológico del Sur del IGP (OVS-IGP) and Observatorio Vulcanológico del INGEMMET (OVI) reported that explosive activity at Sabancaya continued to decline; there was an average of five explosions recorded per day during 26 June-2 July. The explosions were also less energetic. Gas-and-ash plumes rose as high as 1.5 km above the crater rim and drifted more than 30 km SE. Sulfur dioxide flux was as high as 1,472 tons per day, recorded on 1 July.
Sources: Instituto Geológico Minero y Metalúrgico (INGEMMET); Instituto Geofísico del Perú (IGP)
Observatorio Vulcanológico del Sur del IGP (OVS-IGP) and Observatorio Vulcanológico del INGEMMET (OVI) reported that explosive activity at Sabancaya decreased from the previous week; there was an average of 15 explosions recorded per day during 19-25 June. The explosions were also less energetic. Gas-and-ash plumes rose as high as 3.5 km above the crater rim and drifted more than 40 km S. The MIROVA system detected as many as 10 thermal anomalies, spread over the SE, N, and NE flanks. Sulfur dioxide flux was as high as 5,700 tons per day, recorded on 24 June.
Sources: Instituto Geológico Minero y Metalúrgico (INGEMMET); Instituto Geofísico del Perú (IGP)
Observatorio Vulcanológico del Sur del IGP (OVS-IGP) and Observatorio Vulcanológico del INGEMMET (OVI) reported that explosive activity at Sabancaya slightly decreased from the previous week; there was an average of 26 explosions recorded per day during 12-18 June. Gas-and-ash plumes rose as high as 3.7 km above the crater rim and drifted more than 40 km SW. The MIROVA system detected nine thermal anomalies, spread over the SE, N, and NW flanks. Sulfur dioxide flux was as high as 3,557 tons per day on 14 June.
Sources: Instituto Geológico Minero y Metalúrgico (INGEMMET); Instituto Geofísico del Perú (IGP)
Observatorio Vulcanológico del Sur del IGP (OVS-IGP) and Observatorio Vulcanológico del INGEMMET (OVI) reported that explosive activity at Sabancaya slightly decreased from the previous week; there was an average of 31 explosions recorded per day during 5-11 June. The number and magnitude of long-period and hybrid events were moderate and low, respectively. Levels of long-period events were moderate and hybrid events were low. Gas-and-ash plumes rose as high as 2.8 km above the crater rim and drifted more than 30 km E and SE. The MIROVA system detected four thermal anomalies, spread over the SE, N, and NW flanks. Sulfur dioxide flux was as high as 3,392 tons per day on 6 June.
Sources: Instituto Geológico Minero y Metalúrgico (INGEMMET); Instituto Geofísico del Perú (IGP)
Observatorio Vulcanológico del Sur del IGP (OVS-IGP) and Observatorio Vulcanológico del INGEMMET (OVI) reported that for the second week in a row explosive activity at Sabancaya slightly increased from the previous week; there was an average of 47 explosions recorded per day during 29 May-4 June. Seismicity was dominated by long-period events, and the number and magnitude of hybrid events were low. Gas-and-ash plumes rose as high as 3 km above the crater rim and drifted more than 40 km E and SE. The MIROVA system detected five thermal anomalies, spread over the SE, N, and NW flanks. Sulfur dioxide flux was as high as 1,703 tons per day on 3 June.
Sources: Instituto Geofísico del Perú (IGP); Instituto Geológico Minero y Metalúrgico (INGEMMET)
Observatorio Vulcanológico del Sur del IGP (OVS-IGP) and Observatorio Vulcanológico del INGEMMET (OVI) reported that during 22-28 May explosive activity at Sabancaya slightly increased from the previous week, with an average of 41 explosions detected per day. Seismcity was dominated by long-period events, and the number and magnitude of hybrid events were low. Gas-and-ash plumes rose as high as 2.8 km above the crater rim and drifted more than 30 km E and SE. The MIROVA system detected two thermal anomalies.
Sources: Instituto Geofísico del Perú (IGP); Instituto Geológico Minero y Metalúrgico (INGEMMET)
Observatorio Vulcanológico del Sur del IGP (OVS-IGP) and Observatorio Vulcanológico del INGEMMET (OVI) reported that during 15-21 May explosive activity at Sabancaya was similar to the previous week, with an average of 39 explosions detected per day. The number and magnitude of long-period and hybrid events was low. Gas-and-ash plumes rose as high as 4.2 km above the crater rim and drifted more than 40 km NE, E, and SE. The MIROVA system detected six thermal anomalies.
Sources: Instituto Geofísico del Perú (IGP); Instituto Geológico Minero y Metalúrgico (INGEMMET)
Observatorio Vulcanológico del Sur del IGP (OVS-IGP) and Observatorio Vulcanológico del INGEMMET (OVI) reported that during 8-14 May explosive activity at Sabancaya slightly decreased from the previous week, with an average of 38 explosions detected per day. The number of long-period events continued to increase, while hybrid events were sporadic. Gas-and-ash plumes rose as high as 4.2 km above the crater rim and drifted more than 40 km NE, E, and SE.
Sources: Instituto Geofísico del Perú (IGP); Instituto Geológico Minero y Metalúrgico (INGEMMET)
Observatorio Vulcanológico del Sur del IGP (OVS-IGP) and Observatorio Vulcanológico del INGEMMET (OVI) reported that during 1-7 May explosive activity at Sabancaya increased, with an average of 41 explosions detected per day. The number of long-period and hybrid events also increased. Ash plumes rose as high as 3.5 km above the crater rim and drifted more than 40 km NE and E.
Based on webcam images, satellite views, and seismic data the Buenos Aires VAAC reported that during 3-9 May sporadic gas-and-ash puffs rose to altitudes of 7-8.2 km (23,000-27,000 ft) a.s.l. and drifted SE, E, and NE.
Sources: Instituto Geofísico del Perú (IGP); Instituto Geológico Minero y Metalúrgico (INGEMMET); Buenos Aires Volcanic Ash Advisory Center (VAAC)
Observatorio Vulcanológico del Sur del IGP (OVS-IGP) and Observatorio Vulcanológico del INGEMMET (OVI) reported that during 24-30 April seismicity at Sabancaya slightly declined compared to the previous week, with an average of 33 explosions recorded per day. Ash plumes rose as high as 3.2 km above the crater rim and drifted more than 40 km SE. Based on webcam images, satellite views, and seismic data the Buenos Aires VAAC reported sporadic gas-and-ash puffs during 25 April-2 May. Strong ash plumes rose to an altitude of 7.9 km (26,000 ft) a.s.l. (or 2.4 km above the crater rim) and drifted SE on 26 and 28 April.
Sources: Instituto Geofísico del Perú (IGP); Instituto Geológico Minero y Metalúrgico (INGEMMET); Buenos Aires Volcanic Ash Advisory Center (VAAC)
Based on webcam images, satellite views, and seismic data the Buenos Aires VAAC reported sporadic gas-and-ash puffs from Sabancaya during 18-25 April, sometimes rising as high as 8.2 km (25,000 ft) a.s.l.; clouds sometimes hindered observations of the volcano.
Source: Buenos Aires Volcanic Ash Advisory Center (VAAC)
Observatorio Vulcanológico del Sur del IGP (OVS-IGP) and Observatorio Vulcanológico del INGEMMET (OVI) reported that during 10-16 April seismicity at Sabancaya increased compared to the previous week, with an average of 37 explosions recorded per day. Ash plumes rose as high as 3 km above the crater rim (13 April) and drifted more than 40 km NW and SE. The Buenos Aires VAAC reported that on 17 April ash plumes rose to an altitude of 7.9 km (26,000 ft) a.s.l. and drifted SE. The next day ash emissions were recorded by the webcam. The Alert Level remained at Orange (the second highest level on a four-color scale).
Sources: Instituto Geofísico del Perú (IGP); Instituto Geológico Minero y Metalúrgico (INGEMMET); Buenos Aires Volcanic Ash Advisory Center (VAAC)
Observatorio Vulcanológico del Sur del IGP (OVS-IGP) and Observatorio Vulcanológico del INGEMMET (OVI) reported that during 3-9 April seismicity at Sabancaya declined compared to the previous week, with an average of 27 explosions recorded per day. Ash plumes rose as high as 3.2 km above the crater rim (on 8 April) and drifted more than 40 km NW and NE. Ashfall was reported in Pinchollo (20 km N), Maca, and Chivay. The Buenos Aires VAAC reported that diffuse ash plumes drifted 100 km E on 9 April. Intermittent ash emissions during 10-11 April rose as high as 7 km (23,000 ft) a.s.l. and drifted SE. The Alert Level remained at Orange (the second highest level on a four-color scale).
Sources: Instituto Geofísico del Perú (IGP); Instituto Geológico Minero y Metalúrgico (INGEMMET); Buenos Aires Volcanic Ash Advisory Center (VAAC)
Observatorio Vulcanológico del Sur del IGP (OVS-IGP) and Observatorio Vulcanológico del INGEMMET (OVI) reported that during 27 March-2 April there were an average of 41 explosions recorded per day. The number and magnitude of hybrid events decreased while long-period events increased. Ash plumes rose as high as 4.8 km above the crater rim and drifted more than 40 km NW, N, and SW. Ashfall was reported in Pinchollo (20 km N) and Cabanaconde (22 km NW). Overall activity increased compared to the precious week. The Alert Level remained at Orange (the second highest level on a four-color scale).
Sources: Instituto Geofísico del Perú (IGP); Instituto Geológico Minero y Metalúrgico (INGEMMET)
Based on webcam images, satellite views, and seismic data the Buenos Aires VAAC reported sporadic gas-and-ash puffs from Sabancaya during 24-27 March, sometimes rising as high as 9.1 km (30,000 ft) a.s.l. Weather clouds often hindered observations of the volcano, especially during 22-3 and 25 March.
Source: Buenos Aires Volcanic Ash Advisory Center (VAAC)
Based on webcam images, satellite views, and seismic data the Buenos Aires VAAC reported sporadic gas-and-ash puffs from Sabancaya during 14-15, 17-19, and 21 March, sometimes rising as high as 8.2 km (27,000 ft) a.s.l. Weather clouds often hindered observations of the volcano. Observatorio Vulcanológico del Sur del IGP (OVS-IGP) and Observatorio Vulcanológico del INGEMMET (OVI) reported that at 0802 on 21 March an ash plume rose 2 km and drifted more than 30 km SSE.
Sources: Instituto Geofísico del Perú (IGP); Instituto Geológico Minero y Metalúrgico (INGEMMET); Buenos Aires Volcanic Ash Advisory Center (VAAC)
Based on webcam images, satellite views, and seismic data the Buenos Aires VAAC reported that during 8-14 March sporadic gas-and-ash puffs rose from Sabancaya. Weather clouds often hindered observations of the volcano. On 9 March ash plumes rose to an altitude of 11 km (36,000 ft) a.s.l. and drifted NW and SW. Ash plumes rose to an altitude of 6.7 km (22,000 ft) a.s.l. on 12 March.
Source: Buenos Aires Volcanic Ash Advisory Center (VAAC)
Based on webcam images, satellite views, and seismic data the Buenos Aires VAAC reported that during 1-4 and 6-7 March sporadic gas-and-ash puffs rose from Sabancaya. Weather clouds often hindered observations of the volcano. On 3 March ash plumes rose to altitudes of 9.1-10.4 km (30,000-34,000 ft) a.s.l. and drifted W, SW, and S. Intermittent increases in seismicity were also detected that day.
Source: Buenos Aires Volcanic Ash Advisory Center (VAAC)
Based on webcam views and seismic data the Buenos Aires VAAC reported that during 22-26 and 28 February sporadic gas-and-ash puffs rose from Sabancaya, and during 24-28 February they rose to altitudes of 7-11.9 km (23,000-39,000 ft) a.s.l. Weather clouds often hindered observations of the volcano.
Source: Buenos Aires Volcanic Ash Advisory Center (VAAC)
Based on webcam views, satellite images, and seismic data the Buenos Aires VAAC reported that during 14-21 February sporadic gas-and-ash puffs rose from Sabancaya, and during 16-17 and 20 February rose to altitudes of 7.3-8.2 km (24,000-27,000 ft) a.s.l. Weather clouds often hindered observations of the volcano.
Source: Buenos Aires Volcanic Ash Advisory Center (VAAC)
Based on webcam views, satellite images, and seismic data the Buenos Aires VAAC reported that during 8-10 and 12-14 February sporadic gas-and-ash puffs rose from Sabancaya as high as an altitude of 9.1 km (30,000 ft) a.s.l.
Source: Buenos Aires Volcanic Ash Advisory Center (VAAC)
Based on webcam and satellite views, the Buenos Aires VAAC reported that sporadic gas-and-ash puffs rose from Sabancaya during 2-6 February. Weather clouds sometimes prevented visual observations.
Source: Buenos Aires Volcanic Ash Advisory Center (VAAC)
Based on webcam and satellite views, and seismic data, the Buenos Aires VAAC reported that sporadic gas-and-ash puffs rose from Sabancaya during 25-31 January. Weather clouds sometimes prevented visual observations. A field team from IGP's Observatorio Vulcanológico del Sur (OVS) visited Sabancaya on 26 January and observed ash plumes from explosions rising about 2 km above the crater rim.
Sources: Instituto Geofísico del Perú (IGP); Buenos Aires Volcanic Ash Advisory Center (VAAC)
Based on webcam and satellite views, the Buenos Aires VAAC reported that sporadic gas-and-ash puffs rose from Sabancaya during 17-24 January. Meteorological cloud cover sometimes prevented observations.
Source: Buenos Aires Volcanic Ash Advisory Center (VAAC)
Based mostly on webcam views, the Buenos Aires VAAC reported that sporadic gas-and-ash puffs rose from Sabancaya during 11-14 and 16-17 January. Partial satellite views on 13 January revealed an ash plume at an altitude of 7.6 km (25,000 ft) a.s.l. On 16 January a pilot observed an ash plume that had risen to an altitude of 8.2 km (25,000 ft) a.s.l., though meteorological cloud cover prevented satellite and webcam confirmation.
Source: Buenos Aires Volcanic Ash Advisory Center (VAAC)
Based on webcam and satellite views, the Buenos Aires VAAC reported that during 3-10 January intermittent ash puffs from Sabancaya likely rose as high as 9.1 km (30,000 ft) a.s.l. and drifted WSW, W, N, and NE; weather clouds sometimes obscured satellite and webcam views, and the webcam was not operational during 5-6 January.
Source: Buenos Aires Volcanic Ash Advisory Center (VAAC)
On 28 December the Technical and Scientific Committee for volcanic risk management of the Arequipa region (comprised of five groups including IGP's OVS and INGEMMET's OVI) recommended that the Alert Level for Sabancaya be raised from Yellow to Orange based on increased activity detected during 8 November-26 December. A progressive increase in the number of explosions per day to 52 was noted along with the detection of 14 daily hybrid events. Harmonic tremor was recorded on 21, 24, and 25 December. Thermal anomalies were identified by the MIROVA system with the last one being recorded on 24 December. Gas-and-ash plumes rose as high as 4.5 km above the crater and drifted 40 km in different directions, affecting the villages of Maca, Achoma, Yanque, and Chivay, and areas to the W and NW including Huambo, Cabanaconde, Pinchollo, Lari, Tapay, and Madrigal. The public was warned to stay at least 12 km away from the volcano. An explosion on 2 January 2017 generated an ash plume that rose 2.5 km and drifted more than 30 km S and SW.
Sources: Instituto Geofísico del Perú (IGP); Instituto Geológico Minero y Metalúrgico (INGEMMET)
Based on webcam and satellite views, the Buenos Aires VAAC reported that during 21-26 December intermittent, strong ash puffs from Sabancaya rose 6.4-7.6 km (25,000-28,000 ft) a.s.l. and drifted in multiple directions.
Source: Buenos Aires Volcanic Ash Advisory Center (VAAC)
IGP's OVS reported that during 12-18 December seismicity at Sabancaya continued to be dominated by long-period earthquakes; hybrid earthquakes decreased from 14 events per day to 6. Gas-and-ash plumes rose as high as 3.5 km above the crater and drifted more than 35 km NW, E, SE, and S.
Based on webcam and satellite views, the Buenos Aires VAAC reported that during 14-20 December gas-and-water-vapor emissions and sporadic ash puffs rose 6.4-8.2 km (21,000-27,000 ft) a.s.l. (2.3 km above the crater) and drifted SW, WSW, W, and NW.
Sources: Instituto Geofísico del Perú (IGP); Buenos Aires Volcanic Ash Advisory Center (VAAC)
Although weather clouds often prevented webcam and satellite views of Sabancaya, the Buenos Aires VAAC noted that some clear observations during 7-13 December revealed continuous gas-and-water-vapor emissions with sporadic ash puffs which rose to variable heights. Plumes drifted SW, SE, and ENE.
Source: Buenos Aires Volcanic Ash Advisory Center (VAAC)
The Technical and Scientific Committee for volcanic risk management of the Arequipa region (comprised of five groups including IGP's OVS and INGEMMET's OVI) reported that during 30 November-2 December and 5-6 December explosions at Sabancaya generated ash-and-gas plumes that rose as high as 4.5 km above the crater rim and drifted around 40 km in multiple directions. Inflation at the SE flank continued to be detected. Seismic activity remained constant; tremor amplitude greatly increased on 2 December.
Sources: Instituto Geofísico del Perú (IGP); Instituto Geológico Minero y Metalúrgico (INGEMMET)
The Technical and Scientific Committee for volcanic risk management of the Arequipa region (comprised of five groups including IGP's OVS and INGEMMET's OVI) reported 288 explosions at Sabancaya during 21-27 November. Ash plumes rose as high as 4.5 km above the crater rim and drifted 35-40 km E and SE. Sulfur dioxide emissions were as high as 3,300 tonnes/day and deformation was detected on the SE flank. During 28-29 November ash plumes rose 2 km and drifted 30 km S and SE. The Alert level remained at Yellow; the public was warned to stay at least 10 km away from the volcano.
Sources: Instituto Geofísico del Perú (IGP); Instituto Geológico Minero y Metalúrgico (INGEMMET)
The Technical and Scientific Committee for volcanic risk management of the Arequipa region (comprised of five groups including IGP's OVS and INGEMMET's OVI) reported multiple explosions at Sabancaya during 16-18 and 20-21 November, and ash plumes that rose 2-4.2 km above the crater rim and drifted more than 40 km N, NE, S, and SW. The Buenos Aires VAAC stated that ash plumes visible in satellite and webcam images drifted SE on 19 November.
Sources: Observatorio Vulcanológico del INGEMMET (OVI); Instituto Geofísico del Perú (IGP)
A Technical and Scientific Committee for volcanic risk management of the Arequipa region is comprised of five groups including IGP's Observatorio Vulcanológico del Sur (OVS) and INGEMMET's Observatorio Vulcanológico (OVI) and have been monitoring Sabancaya since 2013. The committee reported that new ash-bearing explosions began on 6 November. The explosions, detected at 2126, 2127, and 2149, produced ash plumes that rose 1.5 km above the crater rim and drifted E.
The frequency of hybrid earthquakes increased noticeably in early October and in the hours prior to the 6 November explosions. Volcanic gas emissions had also increased significantly, with values as high as 7,173 tons/day on 23 October. The MIROVA system had detected a thermal anomaly at the volcano on 2 November.
During 6-13 November ash-and-gas emissions from explosions and from periods in between explosions rose as high as 3 km above the crater. An event at 1320 on 8 November generated a significant ash plume that rose 2.4 km above the crater rim with ash dispersing within a 5-km radius. During 9-10 November ash plumes rose as high as 2 km and drifted 30-35 km SE, E, and NE, producing ashfall in the villages of Valle del Colca to the NE. On 11 November an explosion generated an ash plume that rose 3 km and drifted 40 km E and NE. An ash plume from an explosion the next day rose 2 km and drifted 30 km NE.
Sources: Instituto Geofísico del Perú (IGP); Instituto Geológico Minero y Metalúrgico (INGEMMET)
Based on webcam and satellite views and notices from IGP, the Buenos Aires VAAC reported that during 7-8 November gas-and-water-vapor plumes with minor amounts of ash rose from Sabancaya to a maximum height of 2.2 km above the summit.
Source: Buenos Aires Volcanic Ash Advisory Center (VAAC)
Observatorio Vulcanológico del INGEMMET (OVI) reported that during a field inspection of Sabancaya on 25 August scientists noted five new fumarolic areas; two were located in the N part of the summit area, and three were on the NE flank. The number of hybrid earthquakes increased during 25-27 August. A small explosion at 0651 on 27 August produced a dense ash plume that rose 1 km above the crater and drifted E.
Source: Observatorio Vulcanológico del INGEMMET (OVI)
Instituto Geofísico del Perú (IGP) Observatorio Volcanológico del Sur (OVS) reported that during 9-14 December the number of volcano-tectonic (VT) earthquakes less than 6 km from the crater sharply increased; VT earthquakes in general were focused within 8 km of the crater at depths ranging from 3 to 15 km. White fumarolic plumes were steadily emitted, while bluish gasses were more sporadically observed. Gas plumes rose 800-1,400 m above the crater’s base. The Buenos Aires VAAC reported that during 11-12 December Sabancaya's webcam recorded weak emissions with minor amounts of ash.
Sources: Instituto Geofísico del Perú (IGP); Buenos Aires Volcanic Ash Advisory Center (VAAC)
The Buenos Aires VAAC reported that on 26 August a pilot observed an ash plume from Sabancaya rising to an altitude of 6.1 km (20,000 ft) a.s.l. and drifting E. Satellite images and the webcam showed gas-and-water-vapor plumes with possible diffuse ash coincident with a temporary and small increase in seismicity.
Source: Buenos Aires Volcanic Ash Advisory Center (VAAC)
INGEMMET volcanologists who climbed to the summit of Sabancaya during 9-10 July observed ash deposits from emissions during the previous weeks.
Source: Instituto Geológico Minero y Metalúrgico (INGEMMET)
Based on reports from INGEMMET, the webcam, and satellite images, the Buenos Aires VAAC reported that on 27 December water vapor and gas plumes from Sabancaya possibly contained small amounts of ash.
Source: Buenos Aires Volcanic Ash Advisory Center (VAAC)
IGP reported that during 21-27 October seismic activity at Sababcaya was low, and sporadic white and blue plumes rose as high as 1.2 km. Although a pilot reported an ash plume drifting E on 23 October, the Buenos Aires VAAC reported that ash was not detected in satellite images. The webcam showed gas-and-steam emissions, likely with diffuse ash, dissipating near the summit. On 25 October a pilot reported ash drifting E, but again satellite images did not detected ash.
Sources: Instituto Geofísico del Perú (IGP); Buenos Aires Volcanic Ash Advisory Center (VAAC)
IGP and INGEMMET reported that during 24-30 September seismicity at Sabancaya remained elevated; long-period, volcano-tectonic, and hybrid earthquakes were detected. White gas emissions rose as high as 1 km above the crater and drifted SE. The plumes were grayish from ash on 26 and 29 September.
Sources: Instituto Geofísico del Perú (IGP); Instituto Geológico Minero y Metalúrgico (INGEMMET)
IGP reported that on 27 August INGEMMET reported long-period, volcano-tectonic, and hybrid earthquakes at Sabancaya. White to light gray plumes rose 100-300 m above the summit and drifted SE. On 28-29 August the Buenos Aires VAAC reported volcanic ash.
Sources: Instituto Geológico Minero y Metalúrgico (INGEMMET); Buenos Aires Volcanic Ash Advisory Center (VAAC)
IGP reported that on 24-25 August an increase in volcano-tectonic and long-period earthquakes, and during 23-25 August there was a slight increase in white to blueish white fumarolic emissions that rose 500-1500 m above the summit of Sabancaya. On 25 August during the night instruments detected a sequence of explosive events that lasted 82 seconds. On 26 August INGEMMET reported long-period, volcano-tectonic, and hybrid earthquakes. White to light gray plumes rose 100-1300 m above the summit drifting SE.
Sources: Instituto Geológico Minero y Metalúrgico (INGEMMET); Instituto Geofísico del Perú (IGP)
On 13, 17, and 18 August the Buenos Aires VAAC reported volcanic ash at Sabancaya based on satellite, remote camera, and pilot reports.
Source: Buenos Aires Volcanic Ash Advisory Center (VAAC)
IGP reported that on 6 August there was increasing seismic and fumarolic activity at Sabancaya over the past four days. Fumarolic emissions increased, were white to blueish white and gray and rose to 3 km above the crater. On 9 August IGP reported an explosion that lasted 50 seconds at Sabancaya accompanied by increasing seismic activity including a strong increase in hybrid earthquakes. Intermittent views in cloudy conditions showed strong fumarolic emissions continued.
Source: Instituto Geofísico del Perú (IGP)
IGP reported that during 12-27 June there were renewed signs of activity from Sabancaya. Fumarolic activity increased and gases were notably more blue and gray. Seismicity also increased, particularly long-period (LP) earthquakes (~100 LP events per day during 18, 19, and 21 June). Since 6 June, hybrid earthquakes were detected; IGP noted that this seismicity can be attributed to rising magma. During 6-10 July, a daily average of 11 hybrid earthquakes was recorded. In the past few weeks, volcano-tectonic (VT) earthquakes migrated closer to the volcano, especially when the locations were compared with those from 2013. Within a week, the concentration of VT earthquakes had moved ~10 km closer to the crater, reaching a distance ~6 km N of the crater. This activity prompted IGP to install a new seismometer to augment their monitoring capabilities, now comprising six seismometers.
From mid-June through 10 July, fumarolic activity continued and white plumes were visible, although with less intensity within the last two weeks. Seismicity increased during this time period, particularly on 30 June and 1 July when a daily average of 87 LP earthquakes was recorded. From 27 June through 6 July, there was a daily average of 44 VT earthquakes. VT earthquakes were also occurring close to the crater. There were three persistent clusters of VT earthquakes near the crater: 6 km N, 16 km NE, and 10 km E.
Source: Instituto Geofísico del Perú (IGP)
On 10 May Instituto Geofísico de Perú (IGP) reported that results of an interferogram of Sabancaya provided by a collaborator at Cornell University showed that an area of deformation (subsidence of 7 cm centered at 6 km NE of the crater) was coincident with the main area of seismicity. Volcano-tectonic (VT) earthquakes continued to dominate the seismic signals, although long-period (LP) events continued to be detected. There was also an increase of hybrid events. On 10 May a M 4 VT event occurred 15 km W and fumarolic activity increased, with plumes rising 1.2 km high.
Source: Instituto Geofísico del Perú (IGP)
On 4 April Instituto Geofísico de Perú (IGP) reported that volcano-tectonic (VT) earthquakes at Sabancaya dominated the seismic signals although long-period (LP) events continued to be detected.
Source: Instituto Geofísico del Perú (IGP)
In an Instituto Geofísico de Perú (IGP) report, a photo showed a fumarolic plume rising above Sabancaya on 8 March. During the third week of March, a bluish colored plume rose 500 m above the crater, possibly indicating sulfur dioxide emissions. On 25 March the seismic network detected a continuing high rate of volcano-tectonic (VT) earthquakes and an increasing number of long-period (LP) events. On 27 March and 1 April VT earthquakes continued to be dominant and located below the NE sector of the crater. The number and amplitude of LP events did not change.
Previously, residents of Sallalli, 11 km S of Sabancaya, reported that fumarolic activity had increased on 5 December 2012. Four earthquakes within 15 km of the crater during 22-23 February caused damage in Maca, 20 km NE. In response, the Instituto Geofísico de Perú (IGP) installed seismic stations and recorded hundreds of earthquakes per day.
INGEMMET also installed monitoring equipment, and in partnership with IGP increased monitoring efforts. On 27 February scientists observed that the emissions were mostly water vapor, carbon dioxide, and sulfur dioxide. During 28 February-5 March there were 400-500 earthquakes per day recorded, mostly volcano-tectonic events.
Sources: Instituto Geológico Minero y Metalúrgico (INGEMMET); Instituto Geofísico del Perú (IGP)
INGEMMET reported that during 24 February-6 March fumarolic emissions from Sabancaya rose 400-1,000 m above the crater. On 27 February scientists who visited the volcano noted no ash deposits, and observed that the fumarolic emissions were comprised mostly of water vapor, carbon dioxide, and sulfur dioxide. During 28 February-5 March there were 400-500 earthquakes per day recorded, mostly volcano-tectonic events. The temperature of La Calera hot spring was unchanged from the previous year. The Alert Level remained at Yellow.
Source: Instituto Geológico Minero y Metalúrgico (INGEMMET)
According to news articles, INGEMMET recorded 536 earthquakes from Sabancaya, or about 20 per hour, during 22-23 February. About 80 homes were damaged by the earthquakes, causing some evacuations. A plume rose 100 m; plumes had been intermittently visible since 15 January.
Source: Reuters
Reports are organized chronologically and indexed below by Month/Year (Publication Volume:Number), and include a one-line summary. Click on the index link or scroll down to read the reports.
Increased fumarolic activity
Sabancaya reportedly began strong fumarolic activity in December 1986 [see also 15:05]. Interviews with area residents indicated that glowing tephra ejections from the crater were visible at night. Seismicity was felt on the flanks but was not noticed at a distance of 15 km.
A summit photograph was taken 10 August 1987, 8 months after initial reports of activity, during a civil defense helicopter reconnaissance in response to requests from residents and local authorities. Light to dense steam emerged from several sources in a moat surrounding the central plug of the middle (of at least three) summit cone. The dome, moat, and surrounding pyroclastic cone were covered with thick ice and snow except in areas adjacent to steam emission.
Geologists observed the volcano 22-24 June 1988.
22 June (Banks, Hall, Salas, Mothes, and Huaman; at 40 km distance with binoculars.) Every 0.5-2 minutes, voluminous steam pulses, some with dark, basal "rooster-tails," rose 0.5-1 km above the summit. A yellowish plume streamed horizontally 10-15 km E. A dark area of several tens to hundreds of square meters was prominent on the NE slope adjacent to the source of the steam emission.
23 June (Hall, Salas, Mothes, and Huaman; at 15 km.) Activity was similar to 22 June with perhaps slightly decreased plume heights. Strong sulfurous fumes were reported by flank inhabitants. Some cattle had died in these areas, either directly from the fumes or after eating contaminated foliage.
24 June (Banks, Lazo, Portillo, Salas, Huaman, and Tejada; from a fixed-wing flight supported by the Fuerza Aérea del Perú in coordination with the Defensa Civil. Observations are preliminary and will be improved by analysis of photographs and geological investigations on the ground.) A continuous annular crack encircled the outer flanks of an old pyroclastic cone. Weak to moderate fumarolic activity emitted vapor along the annular crack and the dome's edges. Frequent steam emissions (every 1-2 minutes) rose 0.3-5 km and originated from a vent in the moat on the SE side of the dome. Emission energy was substantially less than on 22 June. Some ejection events were lightly colored with ash but no "rooster-tail" forms were noted. Initial white steam pulses dissipated 500 m above the crater, but a yellowish plume streamed more than 10 km E. There was ~ 20-50 x 106 m3 of ice and snow on Sabancaya, a substantial decrease since the August 1987 observations. A bare area, devoid of snow and ice, surrounded the annular crack at variable distances averaging 50 m. Snow beyond this bare area was lightly dusted with ash, particularly on the SE side nearest the pulsing steam vent. Fresh sulfur surrounded many of the fumaroles. Several tens of meters in the bare area, S of the summit, were yellow. No crater lake was observed in the moat between the central dome and the surrounding pyroclastic cone. No new lava or bomb craters were observed. Sabancaya appeared to be built on a pile of young, thick, blocky lava flows and domes erupted from a vent on the mid-NE flanks of the larger Ampato volcano (figure 1). No thick pyroclastic deposits were obvious on Sabancaya or Ampato.
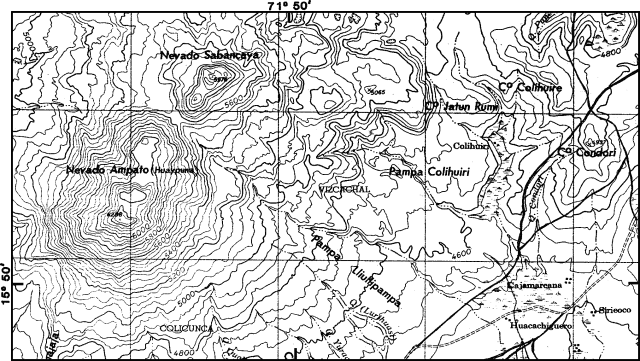 |
Figure 1. Map of Sabancaya and Ampato showing the plateau, drainage system, and villages to the SE. Contour interval, 50 m. From the Chivay sheet (1:100,000), Instituto Geográfico Militar, 1980. |
25 June (at 30 km from Aeroperú flight.) Activity was greatly diminished relative to that of 24 June.
Information Contacts: N. Banks, CVO; M. Hall, Instituto Geofísico, and P. Mothes, Defensa Civil liaison, Quito, Ecuador; M. Lazo, G. Salas Alvarez, and H. Portillo, Univ Nacional de Arequipa; D. Huaman, Instituto Geofísico del Perú, Lima; M. Tejada, Tercera Region Defensa Civil, Arequipa.
Ash eruption; plume to 7 km
Sabancaya is the youngest of a group of four stratovolcanoes . . . (figures 2 and 3). Weak solfataric activity from vents within and outside the summit crater has continued at Sabancaya for many years, . . . . Increased fumarolic activity began in 1985, and a September 1986 helicopter overflight by Alberto Parodi revealed that part of the ice cap had melted and sulfur was being precipitated by the fumaroles. According to area residents (roughly 4,000 people live on or near the volcano, and many more in valleys draining the edifice), strong fumarolic activity and ejection of glowing tephra began in December 1986. Frequent pulses of steam, minor ash emission, and a strong sulfur odor (noted by area residents) were reported by visiting scientists in June 1988 (13:6). By April 1989 the plume had reached 800 m height and the ice cover was significantly reduced (Guido Salas estimated in June 1990 that the ice cover was 20-40 x 106 m3). Activity then gradually increased through May 1990.
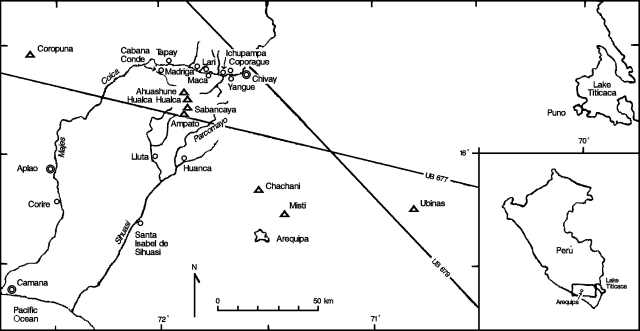 |
Figure 2. Sketch map of SE Perú (box on inset map) showing the locations of Sabancaya and nearby volcanoes (triangles), and towns and rivers in the region. Pilots were warned of eruption cloud hazard along high-altitude routes UB677 and UB679 in the 5 June Notice to Airmen (NOTAM). Low-altitude air routes (W23, W25, and W26) and reporting points (ATIPA, VUGAL, and NEVDO) covered by the 5 June NOTAM are not shown. |
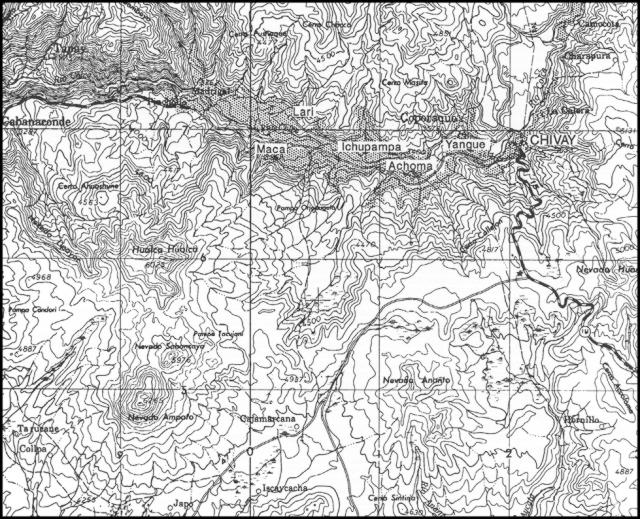 |
Figure 3. Portion of the Chivay 1:250,000 sheet (SD 19-13, Instituto Geográfico Nacional, Lima, Perú, 1988), showing Sabancaya, Ampato, Hualca-Hualca, and Ahuashune volcanoes, nearby towns, and the upper Colca river valley. Contour interval, 100 m. |
Eruption begins, 29 May. A loud sonic boom on 29 May signalled the onset of periodic explosions at the volcano. From 29 May to 3 June, 2-3 explosions occurred/day with 700-800-m column heights. The eruption plume had a strong sulfur odor. A 1 June press report noted that residents of Maca, 18 km NE of the volcano on the Río Colca, heard underground noises and smelled sulfur (see also 6 June). Two additional seismographs were installed on 3 June and increased seismic monitoring was begun (one seismograph had been installed ~ 10 km SW of the crater in 1989). By 3 June, the plume's height had increased to 1 km and it was blowing SSE (figure 4).
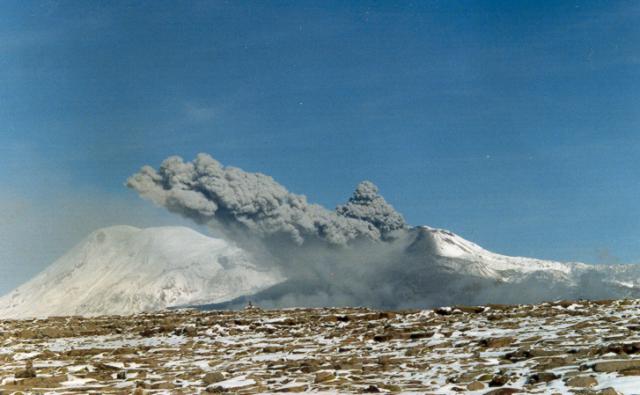 |
Figure 4. Tephra cloud from Sabancaya, viewed from the E on 3 June 1990. Ampato volcano is at left. Photo by Ch. Pattry, courtesy of Alberto Parodi. |
Intensity increases, 4 June. Residents at the base of the volcano reported that explosions had increased to 1 every 20 minutes with a strong sulfur odor and higher noise levels. Ash emission was reported to be continuous, with a column height of 2 km and pulses every few minutes. The plume appeared water-rich, dark gray, and blew NE and ENE, with dense ashfall to 5 km and light ashfall as far as 10 km downwind. Frequent earthquakes were reported.
5 June. The eruption intensity continued to increase, becoming essentially continuous with column heights of 3-6 km. Glowing tephra ejection was reported. The continued ash emission reportedly was seriously affecting grazing land within 10 km of the volcano. Residents in scattered settlements were advised to evacuate at once and remove livestock (llamas and alpacas); many people were reported to have already left. A NOTAM was issued at 1730 stating that routes in the Sabancaya area were affected by the plume, just over 9 km asl (roughly 3 km above the summit).
7 June. The Corporation for Airports and Commercial Aviation requested airlines regularly flying over south Perú to modify routes and issued specific warnings to Perúvian airlines flying to Arequipa. They reported a column to 7 km above the summit. The press reported that the plume headed toward Arequipa and Puno with ash continuing to fall up to 20 km away, destroying pastures and crops, and contaminating the Río Sihuas to the south. Earthquakes were felt at 3-minute intervals in the towns of Chivay (30 km NE of Sabancaya), Maca (18 km NE), Lari (20 km NNE), and Achoma (22 km NE). The press also reported that "crevices with sulfur emanations opened on the ground" in Maca.
8 June. Violent explosions occurred every 5-10 minutes, ejecting pyroclastic material, mainly fine ash, to 1 km height. Ash was reported to cover an area with a radius of 20 km at accumulations up to 1 cm thick. No new lava or juvenile material had been identified. The explosions were accompanied by felt shocks and dull rumbling. The seismic network measured 5-6 microearthquakes/day. Satellite wind data on 11 June indicated that surface winds were from the S, winds at ~ 8 km altitude (372 mbars) were from the NW (298°) at 32-38 m/s (60-70 knots), and winds at >10 km (200 mbars) were from the WNW at 40 m/s (75 knots). As of 17 June, eruptive activity appeared to be continuing to increase.
Information Contacts: A. Parodi, Arequipa; N. Banks, CVO; M. Casaverde, A. Rodriguez, and E. Deza, Instituto Geofísico del Perú, Lima; R. Kosaka, G. Salas Alvarez, and M. Lazo, Univ Nacional de San Agustín, Arequipa; A. Giesecke, CERESIS, Lima; N. Krull, FAA; S. Hamerla, SAB; EFE network, Madrid, Spain; Agence France-Presse; Reuters.
Ash emission continues; plume to 3-5 km
Sabancaya continued to eject ash through late June. Pulses of volcanic gas and ash were emitted at roughly 30-minute intervals, reaching 1-3 km above the summit. Ashfall appeared to be limited to a 10-km radius. Accumulations of several tens of centimeters were reported on the ice/snow cap that covers ~ 4 km2 of the summit area. No juvenile material was evident in a preliminary petrographic examination of the ash. An average of 15 high-frequency (A-type) events were recorded daily. The seismic network consisted of two seismometers 22 km NE and NW of Sabancaya, with an additional seismometer being installed on the S side of the volcano. A 1:100,000 scale hazard map was produced by the Univ Nacional de San Agustín and Civil Defense officials. Towns in the 1,500-m-deep Colca Valley, 20 km N of the volcano, are perched above the valley floor and not at much apparent risk from lahars or other volcano related flows. Although between 8,000 and 10,000 people were living in other drainages in the area, all were at least 25 km away. Field geology showed one old lava flow to be hornblende-rich high-Si andesite/dacite in composition. Pits dug at the volcano's E base yielded only alluvium, with no recent volcanic deposits.
Information Contacts: M. Hall, Instituto Geofísico, Quito, Ecuador; N. Banks, CVO.
Ash emissions decreasing in intensity; more information on June activity
A joint mission by Minard Hall, Escuela Politécnica Nacional, Quito, Ecuador, and scientists from the Instituto Geofísico del Perú (IGP) and the Univ Nacional, San Agustín (UNSA) in Arequipa, was conducted 16-24 June to evaluate the status of activity at Sabancaya. The following is Hall's report on the mission (translated by John Ewert) which supplements information in 15:5-6.
"The first indication of the reactivation . . . began in December 1986 with the appearance of summit crater fumarolic activity, which increased during 1988. In June and July 1987, a swarm of felt earthquakes was reported in the region but could not be confirmed. During a visit to the area by the [USGS] Volcano Disaster Assistance Program and the author in June 1988, the inhabitants of Huanca (25 km S from Sabancaya) reported that nothing new had occurred at the volcano other than an increase in summit fumarolic activity.
"On 28 May 1990, the inhabitants of the region informed Civil Defense of an eruption . . . consisting of a steam and ash plume that ascended several kilometers above the volcano. IGP and UNSA were informed at the same time. More intense activity was reported 2-4 June, leaving a thin (1 mm) deposit of ash in the valley E of the volcano. From 12 June until this writing (23 June) the volcano has apparently shown the same level of activity, consisting of violent emission of gases and ash forming a light-gray to medium-gray cloud that rose 2-3 km above the summit. Emissions lasted less than a minute before stopping and typically occurred every 20-30 minutes. Between emissions the volcano maintained a vapor plume several hundred meters high.
"During the mission a trace of gray ash fell over an extensive area to the N, NE, and E of Sabancaya, causing considerable worry among the inhabitants. Nevertheless, the quantity of ash that has fallen since 12 June is not significant and we confirmed that only 1 cm of ash had accumulated at the E foot of the cone since that date. All of the cone, including its snow and ice, is covered with several centimeters of ash. The two neighboring volcanoes are also covered with a trace of gray ash. It should be noted that neither of these neighboring volcanoes are displaying abnormal activity."
Since the time of Hall's report, there has been a gradual decrease in activity (column height and frequency of explosive events) at Sabancaya.
Information Contacts: M. Hall, Instituto Geofísico, Quito, Ecuador; N. Banks, CVO.
Vigorous Vulcanian activity; mudflows force daily clearing of river channel
Strong Vulcanian explosions were observed during a visit on 13-19 April. The explosions, occurring every 20-30 minutes, lasted ~ 1 minute and produced 3-4-km-high, medium-gray ash clouds. Small avalanches were produced by falling blocks at the base of the eruptive columns. Quiet degassing continued between explosions. Light-gray ashfall was frequent during the visit, depositing 2 mm one night ~9.5 km SE of the summit (at Cajamarcana).
The volcano began erupting in late May 1990, reportedly ejecting ash to 7 km. By late June 1990 (15:7), activity had decreased to periodic explosions with weak ash columns 2-3 km high, but then increased slowly through November. High-frequency seismicity (>122 events recorded over one 2-week period) was usually centered ~ 10 km NE, although two earthquakes occurred under the crater. Several tremor episodes were recorded, starting in October.
The plume was black and heavy with ash during an overflight on 10 November, rising an estimated 5-8 km in distinct, but almost continuous pulses. Ash deposited on Hualca Hualca (4 km N) caused increased melting of the glaciers (estimated 20 cm of snow above the ice and berm) producing numerous mudflows. These moved down the N flank nightly, dumping an estimated 13,000 m3 of debris/day into the Majes River drainage system ~ 5 km N of the volcano. Construction crews cleared the channel daily. Airfall deposits were composed of 80% lithics and 20% glassy fragments and breadcrusted material. At one outcrop, the 1990 ash accumulations were 1 cm thick, overlying at progressively greater depth 30 cm soil, 2 cm ash, 40 cm soil, and another 2 cm ash. Eruptive activity observed on 22 December appeared about the same as it was on 10 November.
Information Contacts: P. Vetsch and R. Haubrichs, SVG, Switzerland; N. Banks, CVO; Instituto Geofísico del Perú, Lima.
Earthquake swarm damages towns and triggers mudslides; 20 people reported dead
A swarm of earthquakes, reported on 23-24 July, triggered mudslides that partly buried four villages. In towns within 20 km N of the volcano, the earthquakes caused many houses to collapse, especially in Maca (15 km N) which was almost completely destroyed. The press reported that 20 people were killed, 80 were injured, and 3,000 were left homeless. More than 20 earthquakes/day were reported felt (MM <=V) 75 km SE (in Arequipa). The largest of the shocks (Ms [4.7]), detected at [1444] on 23 July by the WWSSN, was centered [35] km [ENE] from the volcano at shallow depth.
Information Contacts: NEIC; EFE network, Madrid, Spain; Agence France-Presse; Reuters; UPI; AP.
Increased activity prompts official alert; ashfalls force evacuation of nearby towns
The press reported that the Instituto Geofísico del Perú and Civil Defense officials declared an "alert" on 19 February, following increased activity at the volcano. Gas and ash from the 4.5-km-high plume had reportedly caused respiratory problems and covered homes and crops during the previous several months, prompting people to evacuate several towns within a 14-km radius of the volcano. The press also reported that several small streams of "lava" had moved downslope during the previous few days. Seismicity at the volcano had increased to as many as 50 earthquakes recorded daily. Vulcanian activity has continued at varying intensity (ash clouds 2-7 km high) since the start of the eruption in late May 1990.
Information Contacts: A. Giesecke, CERESIS, Lima; N. Banks, CVO; AP.
Moderate Vulcanian activity continues; hazard maps completed
Fieldwork was conducted on 4-8 March by scientists from the Univ Blaise Pascal (Clermont-Ferrand, France), the Instituto de Geofisico del Perú (Arequipa, Perú), and the Univ de Liège (Belgium). The purpose of the visit was to observe current activity, assess eruptive hazards, and collect samples of juvenile material. The joint mission investigations included the geology and geomorphology of the summit domes and block-lava flows, the role played by explosions on the morphology of the summit, crater, and ice cap (fracturing, gullying, tephra-fall cover, and mudflows), and analysis of tephra, lavas, and ice.
An ash explosion was observed early in the morning on 5 March from Sallili (8 km E at the base of the volcano). The eruption column rose for 30 seconds to a height of 2.5 km and generated a dark gray plume that was blown W. A vapor-rich explosion ~ 2.5 hours later produced a dominantly white plume that rose 1.5 km. Between these explosion there was a discrete vapor plume above the crater. Another early morning explosion on 7 March lasted for about 60 seconds and fed a dark gray plume 1.5 km high. Dominantly white plumes later that morning rose 1-2 km.
Activity of a similar nature has been exhibited since December 1992, with strong explosions of gas, ash, and blocks forming a gray or light-gray plume rising 1-3 km above the summit. Explosions have occurred every 1-2 hours (20-30 minutes in late 1992), and generally lasted <1 minute. Residents of Sallili have seen glowing projections at night since autumn 1993. Observations in December 1992 (Salas and Thouret) indicated that the crater had widened.
The 1990-92 tephra represent a small bulk volume (0.025 km3), but are widely dispersed around the crater; ballistic blocks reached a few hundred meters, and ash as far as 20 km. The juvenile component belongs to a K-rich calc-alkaline series and is compositionally variable from andesite (58% SiO2) to dacite (63% SiO2). The mineral assemblage of 1990-93 juvenile magma consists of plagioclase, green pyroxene, brown amphibole, biotite, destabilized olivine, and Fe-Ti oxides. Since 1990 the juvenile component has increased from 15 to ~50% by volume. Ejecta consist of black, vitreous, slightly vesicular andesitic fragments and gray dacitic fragments. Glassy black blocks with radial fractures dominate the 1994 tephra. Although the geochemical difference between the andesite and dacite is small, mineralogical disequilibrium suggests an interaction between two magma batches. One was more felsic than the dacite and included oligoclase and hypersthene; the other was more mafic than the andesite and included labradorite, bronzite, and olivine.
Hazard assessment and hazard-zone mapping has been done based on geological and geomorphological data, photo interpretation, remote sensing, and models of tephra dispersion (Thouret and others, 1994). Hazard zones are defined for tephra-fall, pyroclastic flows, lahars, and potential catastrophic events. These zones are portrayed for moderate Vulcanian activity (1990-94), growth of a dome and/or emission of a blocky lava flow, possible increase of Vulcanian activity (including small-scale pyroclastic flows), and a potential large Plinian event. Geological study and remote sensing of the current activity have provided a sound basis for evaluating and mapping hazards at and around Sabancaya. Holocene block-lava flows cover as much as 40 km2 around the summit domes. Thin Plinian tephra-fall deposits from historical eruptions are found as far as 11 km from the crater, and block-and-ash pyroclastic-flow deposits as far as 7 km from the source. Recent lahars have traveled ~25 km downstream.
Unstable lava domes pose a threat for ~35,000 people living in the Rio Colca and Siguas valleys. Sabancaya is still ice-clad (currently estimated to be 3.5 km2 of glacial ice) despite its recent 4-year period of activity. The Majes River irrigation canal project is also at potential risk should a moderate-to-large eruption melt the ice and snow on Sabancaya and Ampato.
Reference. Thouret, J-C., Guillande, R., Huaman, D., Gourgaud, A., Salas, G., and Chorowicz, J., 1994, L'activité actuelle du Nevado Sabancaya (Sud-Pérou): reconnaissance géologique et satellitaire, évaluation et cartographie des menaces volcaniques: Bull. Soc. Geol. France, v. 165, no. 1, p. 49-63.
Information Contacts: A. Gourgaud, F. Legros, and J-C. Thouret, Univ Blaise Pascal, Clermont-Ferrand, France; G. Salas, Univ San Augustine, Arequipa; A. Rodriguez and M. Uribe, Instituto de Géofisico del Perú, Arequipa; E. Juvigné, Univ de Liège, Belgium.
Continuing activity, eleven eruptions observed during 9-10 May
During a 2-day visit to Sabancaya, 11 eruptions were witnessed, 5 on 9 May and 6 on 10 May. The repose periods varied in duration from 35-160 minutes, with a mean of 125 minutes on both days. All of the eruptions started with the quiet emission of a white vapor plume followed tens of seconds later by a rapidly rising cloud of vapor and ash. Each eruption progressed from the S vent to the two N vents, and typically lasted 5-15 minutes.
Throughout the eruptions only a few blocks were ejected from the crater as seen from the foot of the cone, ~500 m from the crater rim. No "cannon-like" explosions were seen or heard. The talus apron at the foot of the cone consisted mainly of dense blocks with abundant thermal cracks, and minor amounts of poorly vesiculated scoria.
Plume height varied between 1 and 4 km above the crater, though usually the plumes rose ~2-2.5 km. Eruptions were typically followed by emission of a quiet, slowly rising white-blue plume; these plumes drifted to the SW and S on 9 May and S and E on 10 May. The presence of ash on Sabancaya and the adjacent Ampato volcano caused enhanced ice-melting during daytime hours, creating continuous small mudflows.
Although observations were not as detailed, activity on 11 May was apparently much less than on 9-10 May with only three reported eruptions, one being purely phreatic (white vapor).
Vulcanian activity has persisted at varying intensity levels since ash emission began in late May 1990 (BGVN 15:05, 15:06, 16:05, and 17:01). During the previous visit to the volcano in March 1994 (BGVN 19:03), scientists observed explosions, classified tephra layers, and carried out hazard-zone mapping. Unstable lava domes continue to threaten the 35,000 inhabitants living in the Rio Colca and Siguas valleys. Sabancaya remains ice-covered and poses a potential risk to the Majes River irrigation canal project if a moderate-to-large eruption were to occur. Of particular concern is an eruption that might melt the ice on both Sabancaya and Ampato volcanoes.
Information Contacts: Jean-Luc Le Pennec, Centre ORSTOM de Brest, BP 70, 29 280 Plouzane, France; Francois Legros, Universite Blaise Pascal, Departement des Sciences de la Terre, 5 rue Kessler, 63038 Clermont-Ferrand, France; Anibal Rodriguez and Miguel Uribe, Instituto Geofísico del Perú, Arequipa, Perú; Jean-Claude Thouret and Alain Gourgaud, Centre de Recherches Volcanologiques, 5 rue Kessler, 63038 Clermont-Ferrand, France.
Quiet on 19 July; ash-bearing plumes on 1-2 May
During a mid-[July] visit, Sabancaya displayed only fumarolic activity. Visiting scientists also examined the area well to Sabancaya's N along the Colca river. They determined that previous reports of destructive, seismically triggered mudslides in 1991 (BGVN 16:07) had been incorrect.
On 19 July scientists flew over Sabancaya and the two adjacent volcanoes Ampato and Hualca Hualca (figure 5) while taking slides and Super VHS images. Ice fields and snow cover were observed only on the summit regions of Ampato (6,288 m) and Hualca Hualca (6,025 m). Thus, the ice fields that existed on Sabancaya prior to the most recent eruption (29 May 1991, BGVN 15:05) had not returned.
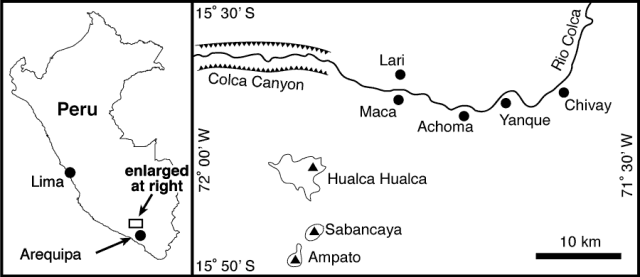 |
Figure 5. Map of the region around Sabancaya showing adjacent stratovolcanoes and the Colca river. This segment of the Colca river flows westwards. Courtesy of M. Bulmer, F. Engle, and A. Johnston, CEPS. |
As the photo (figure 6) reveals, Sabancaya's cone remains nearly symmetrical with slopes of 30-40 degrees. The cone is roughly 1 km in diameter and contains a central crater with a diameter of approximately 400 m. Slope failure occurred along a ~600-m-long arcuate scarp seen on the cone's NE flank. This could prove to be a zone of weakness in any future eruption. An active fumarole was located at the summit cone in a spot on the wall of the southern crater rim; it vented rapidly. Less active fumaroles were seen on the western crater wall and sulfur deposits occurred on the upper crater walls. When the cone was viewed from a distance of 1 km, observers saw significant atmospheric aberrations that implied gas emissions.
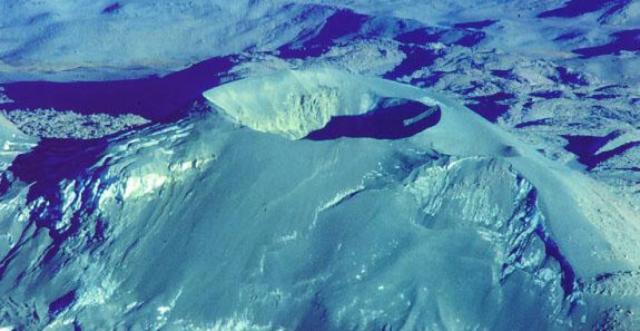 |
Figure 6. Aerial photo of Sabancaya taken on 19 July 1997 looking W. The crater is approximately 400 m in diameter. The surface of the cone is mantled in young ash deposits (not snow). Courtesy of M. Bulmer, F. Engle, and A. Johnston, CEPS. |
In the Colca Valley scientists saw extensive damage from the 23-24 July 1991 earthquake swarm including abandoned, damaged buildings, and slope failures; what they failed to find, however, was evidence that mudslides had ravaged local villages. This was important because BGVN 16:07 briefly described seismic damage from the earthquakes but also stated that they ". . . triggered mudslides that partly buried four villages." Based on this latest visit, this latter statement was clearly incorrect; it may have stemmed from the cited press accounts.
The scientists visited the villages of Maca, Achoma, Yanque, Lari, and Chivay. The earthquake damage was greatest in Maca, which lies in the Colca valley below the NNE flank of Hualca Hualca, a spot 15 km N of Sabancaya. Particularly in Maca, there was abundant evidence of seismically induced damage to structures. It should be noted that most buildings in the region had been constructed with walls made of loose stone without the benefit of concrete mortar or steel reinforcing.
On the NW side of Maca the group found evidence for a series of rotational and translational slides and slumps triggered by 2 m of throw along a normal fault. There was a series of well defined backscarps delineating different slope failures (figure 7) that extended ~1 km from the NW margin of Maca down to the Colca river. No houses were located on the failed surfaces; instead, this area had been terraced for agricultural use, but it was fallow when visited. The failure "complex" remained mobile and its toe was being undercut by the river. The village of Maca was being rebuilt gradually as people returned to the area. Some of the new housing includes concrete structures but most are made of adobe (clay and straw) brick with corrugated sheet-metal roofing.
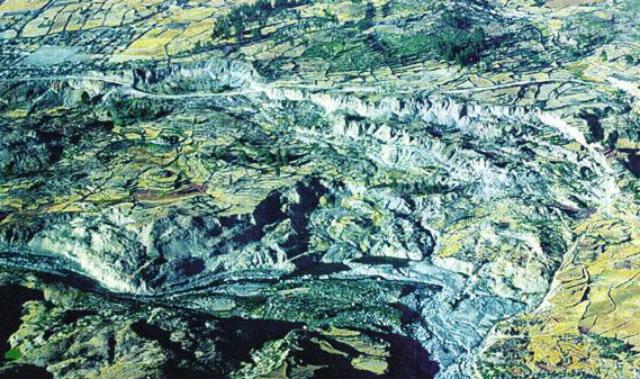 |
Figure 7. Aerial photo of Sabancaya taken on 19 June 1997 looking SE; it shows slope failures located NW of the village of Maca. The Rio Colca is visible in the lower part of the image. Note the road running across the upper third of the photo (trending E-W); it had to be realigned near Maca. Maca's market square can be seen in the upper left side of photo. Courtesy of M. Bulmer, F. Engle, and A. Johnston, CEPS. |
Prior to the visit, on 1 and 2 May, aviation reports described ash-bearing plumes. The plume on 1 May reportedly reached ~5.5-km altitude; the one on 2 May, ~7.3-km altitude.
Information Contacts: M.H. Bulmer, F. Engle, and A. Johnston, Center for Earth and Planetary Studies (CEPS), National Air and Space Museum, Smithsonian Institution, Washington, DC 20560 USA; Guido Salas, Universidad de San Agustin, Casilla 1203, Arequipa, Perú; A. Seimon, Department of Geography, University of Colorado, Boulder, CO 80309-0260 USA; NOAA/NESDIS Satellite Analysis Branch (SAB), Room 401, 5200 Auth Road, Camp Springs, MD 20746, USA; Tom Fox, Air Navigation Bureau, International Civil Aviation Organization (ICAO), 999 University St., Montreal H3C 5H7, Canada (URL: https://www.icao.int/safety/airnavigation/).
Summit activity, ice observed on visit in May
Sabancaya was observed by scientists of the National Air and Space Museum's Colca Valley Geohazard Project during a four-day visit (18-21 May) made in preparation for field work later in the year. Continuous fumarolic activity at the E side of the crater rim was observed during this visit. Seasonal snow patches were visible on the SE flank that were not present when the team made an aerial observation in July 1997 (BGVN 22:07).
On 18 May a seismic event was noted by observers traveling in a vehicle on the Pampa Lliullipampa, SE of the volcano. The disturbance produced a dust cloud that spanned the entire Ampato-Sabancaya-Hualca Hualca complex along its E slopes, a distance of 15 kilometers. A video camera recorded the disturbance at 1525 on 18 May. Roughly concurrently, scientists at the Instituto Geofísico in Arequipa detected a deep focus M 6 earthquake centered 250 km to the N near Ayacucho. Tremors occurred at this time in the pueblo of Cabana Conde located 15 kilometers NW of Hualca Hualca.
On 20 May A. Seimon of the University of Colorado ascended Sabancaya's SE flank and recorded a video of the fumarolic activity inside the crater rim, including the steady emission of gas from the crater floor (figure 8). He noticed ice along the route up the E flank. The ice lies beneath a layer of ash 5 to 10 cm thick, a depth that seemed sufficient to insulate it from higher surface temperatures. Ice was also observed filling a breach in the N side of the crater rim.
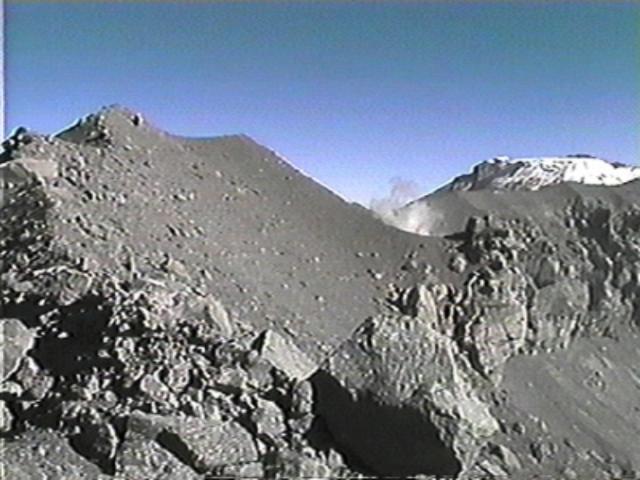 |
Figure 8. Video frame showing the inside of the S rim of Sabancaya's crater. The fumarole was continuous during the observation period (18-21 May). Snow-covered Nevado Ampato is visible beyond the crater rim. Courtesy of A. Seimon. |
Sabancaya is the youngest of the three adjacent stratovolcanoes located 75 km NW of Arequipa. The volcano's 29 May 1990 eruption produced a plume reaching a maximum height of 7 km (BGVN 15:05). The plume traveled NE and carried fine ash that fell up to 20 km away. Extensive mudflows (not mudslides) had occurred in the area in the months after the Sabancaya eruptions that began in late May 1990. These mudflows resulted from fallen ash and the subsequent melting of snow and ice on Hualca Hualca (BGVN 16:05; v. 15, no. 5).
Information Contacts: F. Engle, Center for Earth and Planetary Studies (CEPS), National Air and Space Museum, Smithsonian Institution, Washington, D.C. 20560 USA; A. Seimon, Department of Geography, University of Colorado, Boulder, CO 80309-0260 USA; S.O. Brooks, Department of Geography, University of Wisconsin, Madison, WI USA 53706-1491.
Increases in August gas emissions
Activity was monitored during 13-31 August using satellite remote sensing data and detailed field observations. During this time, the amount of gas being emitted from the central crater increased. At the height of emission, gas clouds from the crater rose over 1 km. Most frequently, plumes attained heights of 300-500 m before dissipating due to strong winds. However, on several occasions cumulo-type clouds formed and moved over the surrounding Pampa. Gas emissions were predominantly white in color but occasionally gray, yellow, and brown. During active phases new plumes emerged on average every 2-3 minutes. Nearly continuous venting occurred from two fumaroles on the N and S sides of the crater.
At 0640 on 16 August a pronounced increase in gas emission was observed. Dense white clouds filled the crater and formed a plume rising over 300 m. At 0645 material was seen falling from a gray/brown cloud onto the S flank of the cone. This small ash ejection lasted for a few minutes (figure 9). A noticeable decline in the emission rate occurred from 0726 until 0847, when gas clouds became infrequent. Activity continued at this reduced level into the next day. At 1355 on the 18th a yellow/brown and gray cloud rose ~800 m above the crater. Following this, activity returned to faint gas emissions. Increased activity was observed again at 1019 on the 20th when dense yellow and brown clouds were emitted. Another thick brown gas cloud emerged at 1044, after which there was a return to white emissions. Activity decreased noticeably from 1100 to 1200, by which time the gas was only faintly visible. On the 22nd at 1420 dense white clouds rose 500 m over the crater. Plumes emerged predominantly from the S side of the crater every 2-3 minutes.
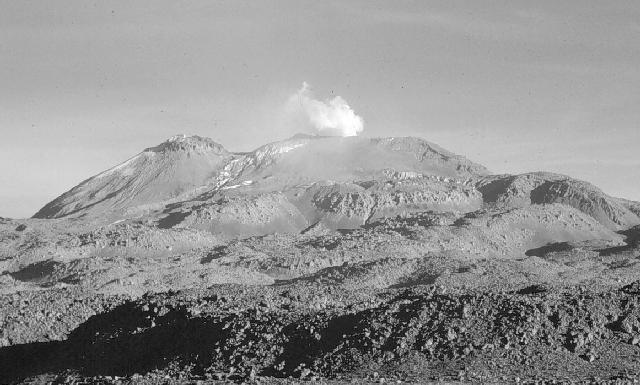 |
Figure 9. A ground view of one of the small ash eruptions at Sabancaya on 16 August at 0700 looking to the NW. Ash fell on the S side of the upper slopes of the cone. Courtesy of Mark Bulmer. |
No emissions were seen on 23 August until 1325; a large dense gas cloud emerged from the whole crater at 1510. At 1524 the cloud on the S side of the crater formed a brown plume that rose straight upwards more than 400 m. Gas clouds descended the upper S slopes of the cone at 1530. Five minutes later a light brown-white and yellow gas plume formed on the N side of the crater. Emissions continued until dusk when observations ceased. On the morning of the 24th at 0740 dark gray clouds rose slowly from the crater. At 0756 gas from the lower portion of an ascending plume moved down the upper slopes of the cone on the N side. By 0804 the color of the plumes emerging from the crater altered to white. However, at 0816 a gray/brown gas cloud emerged and dispersed <100 m above the crater. After this no further emissions were seen until 1359 when white emissions commenced, forming cumulo-type clouds that sat over Ampato. At 0700 on the 25th, dark gray and brown clouds were emitted from the center of the crater. At 0714 a white, brown, and gray cloud emerged from the middle of the crater. Emissions were light for the rest of the day.
On 26 August at 0757 a light brown-and-gray cloud emerged. Only faint emissions were noted until 0804 when a new brown and white cloud rose 300 m. The amount of gas released then diminished to very small clouds every 2-3 minutes. At 1430 gas was rising from the whole crater; activity remained at a similar level for the rest of the afternoon. At dusk, a brown haze sat over the crater. Only limited observations were possible on 28 August. Activity was first noted at 0857 when a gray cloud emerged from the S side of the crater. Gas emission was observed at 1430 but not at 1630. The next observation was at 1447 on the 31st, at which time white clouds were being emitted from the center of the crater. At 1625 the amount of gas being released appeared to increase and became grayer. Evening sunlight was seen refracted in gas clouds ~1 km above the crater, producing a rainbow effect.
Information Contacts: Mark Bulmer, Frederick Engle, and Andrew Johnston, Center for Earth and Planetary Studies, National Air and Space Museum, Smithsonian Institution, Washington DC 20560-0315.
Intermittent gas plumes in early September, some with ash
Activity was monitored during 1-9 September using detailed field observations combined with satellite and aerial remote sensing data. Activity was generally similar to that reported in August. On 6 September a large eruption began. In the preceding days activity had fluctuated. On 1 September, the only activity observed was a small white gas cloud at 0944. Gas clouds were emitted from 0748 until 0942 on 2 September. These predominantly white and gray clouds rose only 200 m above the crater before dissipating. The only exception was a period of ten minutes when brown and dark gray clouds issued from the crater. The sole emission the following day was a small white gas cloud at 1506. On 4 and 5 September small gas emissions were observed from the fumarole on the S side of the cone.
Activity on 6 September was first noted at 0702 when large white and gray gas clouds rose from the whole crater. At 0704 part of the gas column began to sink and move down the upper flanks, obscuring the E-flank ice walls. The gray and brown gas cloud was densest on the S side of the crater and appeared to be expanding as it rose. At 0711, the whiter part of the cloud rose upward while the dark gray portion dropped ash on the N side of the cone. Wind speeds at the summit appeared to increase, and the 400-m-high column began to be pushed N. At 0716 more gas descended the flanks. At 0735 observers on the edge of the easternmost lava flow could smell sulfur.
The main gas emission continued to be from the S side of the crater and at 0740 another cloud descended over halfway down the flanks. At 0743 a large white and dark gray gas cloud emerged from the crater. Ash fell from it onto the upper and mid-slopes. Another large gray, white, and brown plume filled the whole crater at 0746 and billowing to 400 m. At 0749 the plume color changed to brown, yellow, and dark gray. Ash was blown N. New gas clouds emerged from the crater on average every 30 seconds. At 0824 the cloud color returned to white and light gray for a few minutes before it once again became brown, gray, and yellow. The brown portion seemed to contain the ash. Gas once again descended the upper slopes at 0846. Winds at the summit began to pull the top of the plumes apart and by 0854 they were almost flat across the crater.
There was a reduction in gas emission at 1143. Gas continued to periodically descend the upper slopes and ashfall appeared to be mainly on the N slopes. At 1155 a gas cloud descended to mid-slope. The interval between gas emissions grew during the afternoon. After three hours of white- and gray-colored gas clouds, yellow, white, and brown clouds emerged again at 1604. This marked renewal of activity was similar to that in the early morning. Gas originated mainly from the southern fumarole and occasionally descended the upper slopes. Gas clouds rose 500 m and formed a cumulo-like mass. At 1737 there was a big gas release, part of which descended the cone slope while the main cloud rose and curled N over the crater. After this the intensity of the activity from the cone diminished and gas clouds became light gray.
On 7 September a faint brown haze was noted over Sabancaya at 0630. Dust in the atmosphere obscured viewing. Gas clouds were observed at 0643, 0704, 0719, and 1210. Visibility improved around mid-day, and ashfall was observed on the S side of the cone at 1243. At 1652 a small gas cloud descended the upper slopes. From 1740 until dark, gas emissions were continuous, but none were seen the following day. On 9 September observers on a morning flight around the volcano observed light emissions from fumaroles on the N and S crater rims. Fresh sulfur deposits existed on the crater walls. The crater itself was deeper than the year before and the floor could not be seen. Recent ash eruptions had covered the ice walls on the E side.
Information Contacts: Mark Bulmer, Frederick Engle, and Andrew Johnston, Center for Earth and Planetary Studies, National Air and Space Museum, Smithsonian Institution, Washington DC 20560-0315 USA; Guido Salas, Departamento Academico de Geoloia y Geofisica, Universidad Nacional de San Augustin, Arequipa, Perú; Elian Perea, Universidad Nacional de San Augustin, Arequipa, Perú.
During 28 April-10 May observers saw continuous gas plumes, some containing ash
A team of geologists monitored Sabancaya from the settlement of Sallalli on the E flank of the volcano during the daylight hours from 28 April to 10 May. In this period, gas emissions from the active crater fluctuated but were less than those observed in 1998 (BGVN 23:08 and 23:09).
During much of the current visit, a continual background emission was observed rising from the whole crater. Vigorous activity also occurred from three fumaroles located on the S, E, and N rims of the crater. The fumarole on the S rim was most active, with emissions every 1-3 minutes, while the fumarole on the N rim was the most sporadic.
During periods of calm air, gas clouds the width of the crater rose 1,000 m before dissipating, but summit level winds often sheared gas clouds 200-300 m above the vent. Emissions were predominantly white in color, but occasionally were gray or brown and appeared to contain ash. Localized fresh ash deposits were observed on the S flank of the cone. Material was also observed cascading from the ice wall on the E side of the cone forming small talus aprons.
Strong sulfurous smells were noted on five separate days while observers conducted topographic surveys on the lava flows. These coincided with winds blowing downslope from the summit.
While in the town of Arequipa, the group visited the Universidad San Augustin and reviewed the seismic records for Sabancaya and the Colca Valley over the period 1987 to the present. These data failed to reveal any direct correlation between eruptions of Sabancaya and the succession of earthquakes that occurred in the Colca Valley during 1990-1991 (BGVN 16:07).
Frequent seismic swarms have occurred in the Colca Valley around the towns of Lari and Cabana Conde but have shown no correlation with the low level eruptions at Sabancaya. In 1991, the local press (El Correo, 3 May, 1991) reported a correlation between a rise in the geothermal water temperature in the Colca Valley and the activity at Sabancaya but no geophysical data can be provided to support this correlation. Examination of the seismic records for Sabancaya suggests that the magma chamber is isolated.
Information Contacts: Mark Bulmer, Center for Earth and Planetary Studies, National Air and Space Museum, Washington DC 20560-0315; Tracy Gregg, Department of Geological Sciences, SUNY Buffalo, NY 14260-3050; Stephen Metzger, Department of Geology, University of Nevada Reno, NV 89557; Steve Schubring, Department of Geography, Geology, and Anthropology, Indiana State University, IN 47802 USA; Jeff Byrnes, Department of Geology and Planetary Sciences, University of Pittsburgh, PA 15260 USA; Guido Salas, Departamento de Geología y Geofísica, Universidad Nacional de San Agustín, Arequipa, Perú.
Inflation at Hualca Hualca detected by satellite surveys from June 1992 to April 1996
A satellite-based interferometric synthetic aperture radar (InSAR) survey of the remote central Andes volcanic arc (Pritchard and Simons, 2002) revealed deformation in the Sabancaya area during June 1992-mid 1997. Inflation was detected ~2.5 km E of the Hualca Hualca cone and 7 km N of Sabancaya (figure 16), with the maximum deformation rate in the radar line-of-sight being ~2 cm/year. While not temporally well-constrained, this inflation seems to have stopped in 1997, perhaps related to the large eruption of Sabancaya in May 1997 (BGVN 22:07). No deformation was observed between mid 1997-December 2001. The inferred source depth was 11-13 km below sea level. Additional details about the study and analysis are available in Pritchard and Simons (2002).
Reference. Pritchard, M., and Simons, M., 2002, A satellite geodetic survey of large-scale deformation of volcanic centres in the Central Andes: Nature, v. 418, p. 167-170.
Information Contacts: Matthew Pritchard and Mark Simons, Division of Geological and Planetary Sciences, California Institute of Technology, Pasadena, CA 91125, USA (URL: http://www.gps.caltech.edu/).
New ashfall during July 2003
As previously reported in BGVN 28:05 no deformation had been observed during mid-1997 through December 2001. In mid-2003 observers saw evidence of recent ash emissions.
On 31 July 2003, during a commercial flight from Cusco to Arequipa, Mike Sheridan observed ashfall deposits on fresh snow at Sabancaya volcano. The flight path was S of the volcano on a cloud-free day, and fresh snowfall had occurred a day or two before. Ashfall deposits blanketed the cone's summit and, on the NE side, extended to the volcano's base. Two days later, when traveling by car, Sheridan and Jean-Claude Thouret observed the ash from the E. They saw ash down to ~ 5,000 m elevation. The ash blanket appeared comparable to those observed at Sabancaya in the 1990s.
Information Contacts: Michael F. Sheridan, SUNY at Buffalo, Dept. of Geology, Buffalo, NY 14260; Jean-Claude Thouret, Centre de Recherches Volcanologiques, 5 rue Kessler, 63038 Clermont-Ferrand, France.
Increased seismic and fumarolic activity in late 2012 and early 2013
Sabancaya volcano, located 72 km NW of Arequipa city, is one of the most active volcanoes of the Central Andes (figure 10). Our last report of Sabancaya described ashfall during July 2003 (BGVN 29:01). This report describes an increase in anomalous seismic and fumarolic activity, beginning in late 2012 and continuing through the end of March 2013. The restlessness spurred increased monitoring of the volcano.
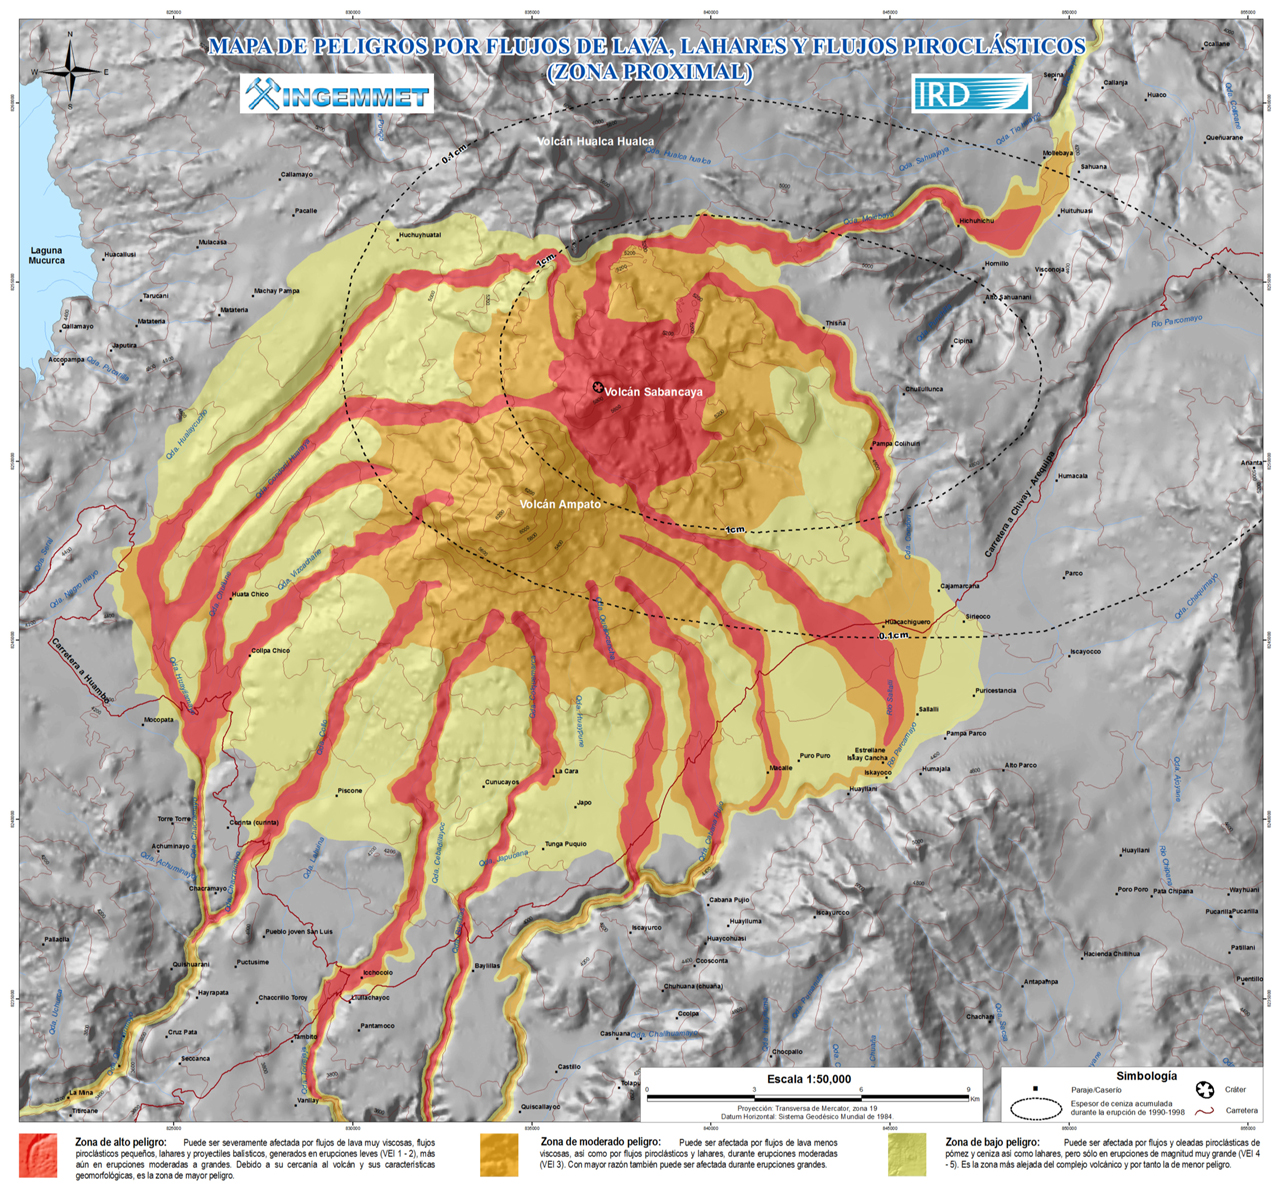 |
Figure 10. A map illustrating hazards at the Ampato-Sabancaya volcanic complex (high danger, red; moderate danger, orange; and low danger, yellow). Types of volcanic hazards include pyroclastic flows (including debris flows), mudflows, lava flows, and avalanches. The overall thickness of ash deposits from eruptions during 1990-1998 is indicated by 1 and 0.1 cm isopachs. Major roads and highways are shown as thick, dark red lines; thin lighter red lines are elevation contours. The map shown is featured on a poster with more details. From Mariño and others (2013). |
Between 1988 and 1997, activity at Sabancaya was intermittent and characterized by low to moderate Vulcanian eruptions (VEI 2) and mainly modest eruption columns (less than 5 km above the summit) with local ashfall (e.g., SEAN 13:06; BGVN 19:03). After this eruptive episode, between 1998 and 2012, minor and intermittent fumarolic emissions rose from the active crater. During the last months of 2012, a slight increase of fumarolic activity was observed during a field campaign by Peru's Instituto Geológico Minero y Metalúrgico (INGEMMET) volcanologists and their counterparts from the Laboratoire Magmas et Volcans (Clermont-Ferrand, France).
The Instituto Geofisico del Peru (IGP) reported that inhabitants from Sallalli hamlet, ~ 11 km S of Sabancaya, observed an increase in fumarolic emissions beginning 5 December 2012. Meteorological conditions prevented IGP scientists from visiting the area during the rainy season.
In mid-February 2013, local residents reported an increase in fumarolic activity, which was confirmed by INGEMMET scientists that visited the volcano on 15 and 22-23 February (figure 11). Scientists also reported a strong sulfur odor within an 8-km radius, and felt several strong earthquakes probably associated with the volcano's unrest.
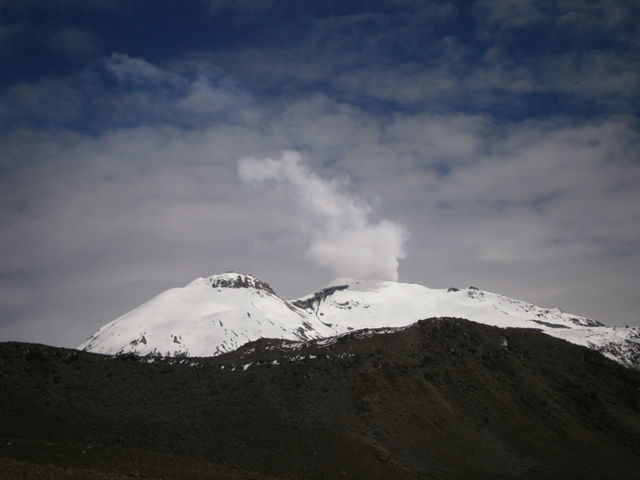 |
Figure 11. Photograph taken of a gas plume above the active vent of Sabancaya, as seen from the SE flank on 17 February 2013. Courtesy of Pablo Samaniego, IRD. |
IGP reported that within a span of 95 minutes on 22 February 2013, three earthquakes, of M 4.6, 5.2, and 5.0 respectively, were registered at Sabancaya (figure 12). This activity prompted IGP to install a network of close proximity seismic stations. Earthquakes continued through the following day (23 February) and caused damage at Maca village, 20 km NE of the crater.
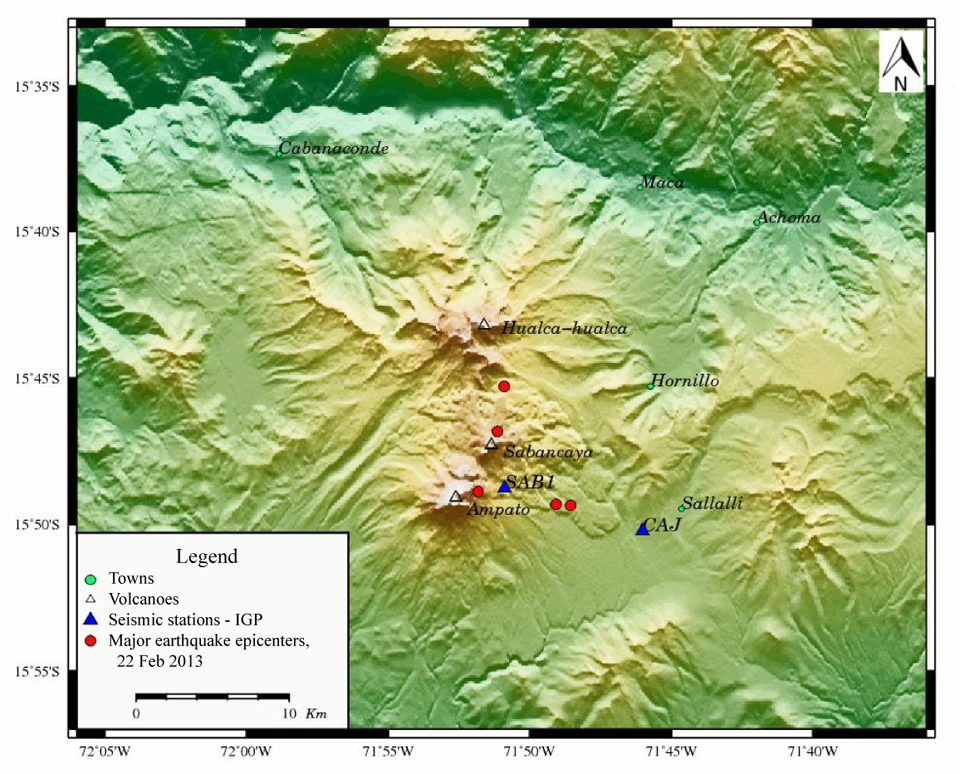 |
Figure 12. The principal earthquakes (red dots) registered at Sabancaya on 22 February 2013. Of these, three earthquakes of M 4.6, 5.2, and 5.0 occurred within a span of 95 minutes. Courtesy of IGP. |
During 22-23 February, a seismic station installed by INGEMMET registered more than 500 small volcano tectonic (VT) seismic events at Sabancaya. On 23 February IGP separately reported 560 events at the Cajamarcana seismic station (CAJ on figure 13b) on the SE flank. According to a Reuters article from 27 February, 80 homes were damaged by the seismicity during 22-23 February, leading to some evacuations. During that seismicity, a plume rose ~100 m above Sabancaya. After 24 February, VT, long period (LP), and hybrid seismicity continued (figure 13).
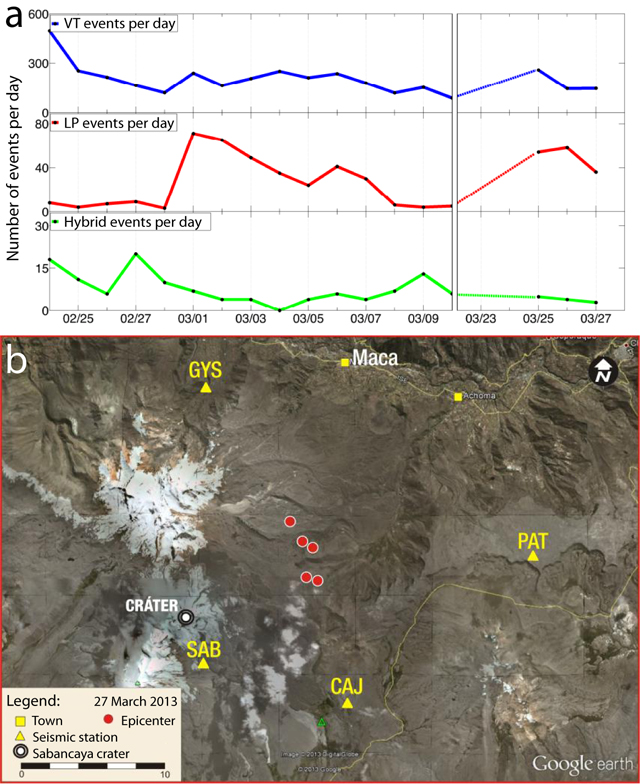 |
Figure 13. (a) Plot of daily earthquakes at Sabancaya, showing the number of volcano tectonic, long period, and hybrid events that occurred during 24 February-27 March 2013. (b) The locations of earthquake epicenters on 27 March 2013 (red dots) and the seismic stations that were monitoring the volcano as of that date (yellow triangles). Courtesy of IGP. |
Reference. Mariño J., Samaniego P., Rivera M., Bellot N., Manrique N., Macedo L., Delgado R., 2013, Mapa de peligros del Complejo Volcánico Ampato-Sabancaya, Esc. 1:50.000. Edit. INGEMMET-IRD.
Information Contacts: Instituto Geológico Minero y Metalúrgico (INGEMMET), Av. Dolores (Urb. Las Begonias B-3), J.L. Bustamante y Rivero, Arequipa, Perú (URL: http://www.ingemmet.gob.pe); Pablo Samaniego Eguiguren, Laboratoire Magmas et Volcans, Université Blaise Pascal, Le Centre National de la Recherche Scientifique (CNRS), Institut de Recherche pour le Développement (IRD), Casilla 18-1209, Calle Teruel 357 - Miraflores, Lima 18 - PERU (URL: https://lmv.univ-bpclermont.fr/en/); Reuters, report by Lima Newsroom; Orlando Macedo, PhD, Chief of Volcanology Research Department, Instituto Geofisico del Peru, (IGP), Arequipa Volcano Observatory, Urb. La Marina B-19, Cayma, Arequipa, Peru.
Increased seismicity February 2013; explosive events in August 2014
Although historical records of eruptive activity at Peru's Sabancaya volcano go back to 1750, there have only been a handful of eruptions documented since the 1980s; activity that began in 1986 was the first recorded in over 200 years. Weak solfataric activity from vents within and outside the 350-m-wide summit crater since then has created a persistent risk of ash plumes, Vulcanian explosions, and glacial melting causing mudflows. Reports of fresh ashfall on snow-covered slopes in 2003 (BGVN 29:01) indicated that some level of eruptive activity was continuing into the early 2000's. An increase in seismic and fumarolic activity in late 2012 and 2013 led to increased monitoring at the volcano, located 72 km NW of Arequipa. IGP-OVS (Instituto Geofisico del Peru, Observatoria Vulcanologico del Sur) and OVI-INGEMMET (Observatorio Volcanologico del INGEMMET, Instituto Geológical Minero y Metalúrgico) installed a number of seismic stations after significant seismic events in February 2013 (reported on in BGVN 38:02) caused damage to numerous homes in the area.
While the data reported by Peru's IGP-OVS and OVI-INGEMMET indicate ongoing seismic activity beginning in February 2013, and two phreatic-type explosions on 9 and 25 August 2014, no substantial eruption of ash was reported between February 2013 and February 2016. Numerous VAAC (Volcanic Ash Advisory Center) reports of ash were reported by pilots, but the Buenos Aires VAAC noted that no ash plume was visible either on satellite images or from the web camera located near the volcano. Occasional references to "possible light volcanic ash" are mentioned in some VAAC reports, but generally not corroborated with visual or satellite information. A few photographs from the area appear to show trace amounts of fine ash or particulates from magmatic gases in the snow around the crater, but such deposits were not confirmed by fieldwork. Throughout the period, Sabancaya emitted significant water vapor plumes occasionally as high as 3,000 m, and SO2-rich magmatic gases that were blue in color and possibly contained trace amounts of ash.
Activity during 2013 and 2014. After a decade of quiet, a significant increase in fumarolic emissions was observed in late 2012 (BGVN 38:02). Throughout 2013 earthquakes were concentrated in areas NE, N and NW of the crater up to 25 km away; much of this seismicity was later interpreted by IGP-OVS to be related to regional tectonism and not to volcanic activity. An increase in SO2 emissions, seen as bluish gas emitting from the fumaroles, was observed in March 2013, but a field visit in May noted no fresh lava or ash in the area.
White, gray, and bluish SO2-rich fumarolic emissions increased in June 2014. VT (volcano-tectonic) earthquakes were recorded within 1.7 km of the crater in early July; IGP-OVS seismologists identified hybrid-type seismic events that they associated with the rise of magmatic material near the crater in early July. By mid-July, VT earthquakes were averaging over 200 per day, and the foci were located 12 km NNE of the crater. During late July, seismic events decreased, and the foci moved to 8 km N of the crater. Persistent off-white and bluish fumaroles rose 500-600 m above the crater during July 2014.
Fumarolic emissions intensified markedly on 5 August 2014, rising to 3 km above the crater; whitish water vapor, bluish magmatic gases, and gray emissions were observed, suggesting a "possible release of minor volcanic ash", as reported by IGP-OVS. The VT seismic events also began to increase in magnitude, ranging between 2.5 and 4.6 ML, including two located very close to the crater, between 4 and 14 km deep. Both LP and Hybrid seismic events, increased to hundreds of events per day in the early days of August. At 0429 local time on 9 August 2014 a large explosion was recorded; it was not observed due to darkness and cloud cover. After the explosions, VT events dropped back to tens per day, and emissions rose to between 500 and 1,000 m above the crater. Many of the earthquakes were located within 1.5 km of the crater at depths between 4 and 14 km. On 25 August beginning at 2039 local time four consecutive explosions lasting a total of 82 seconds were recorded (figure 14). Again, due to darkness, there was no visual confirmation of the explosion.
 |
Figure 14. Seismograph from 25 August 2014 at SAB seismic station, located 3 km from the top of Sabancaya. Four explosive events occurred in the crater area at 2039 local time, followed by numerous small earthquakes. The energy calculated by IGP-OVS for this sequence of events was 1,151 MJ, with a total duration of 82 seconds. Courtesy of IGP-OVS (2014 Annual Report, Sabancaya). |
In the days between the 9 and 25 August explosions, observed emissions from the fumaroles were water vapor and bluish magmatic gases rising to heights between 500 and 1,500 m above the crater (figure 15).
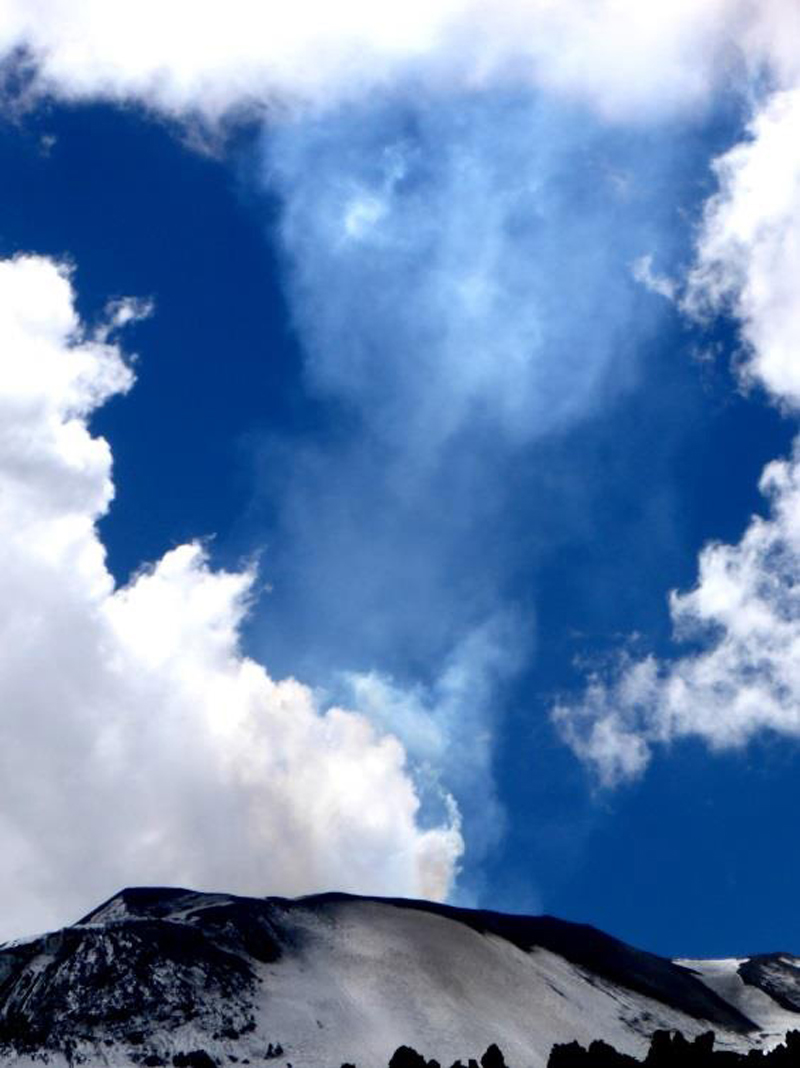 |
Figure 15. Emissions from Sabancaya on 13 August 2014. White vapor plumes and bluish SO2-rich magmatic gases are emitting from the crater. Courtesy of IGP-OVS (2014 Annual report, Sabancaya). |
Water vapor and magmatic gas plume heights in September 2014 rose between 500 and 2,000 m above the crater. OVI-INGEMMET daily reports noted grayish plumes containing "possible ash" on 26 and 29 September 2014.
In October 2014, fumarolic emission heights were below 1 km above the crater; they were generally white steam plumes but also showed significant bluish SO2 content. Constant emissions of water vapor and SO2 to heights of 1,400 m above the floor of the crater continued into November along with intermittent seismic activity at constant levels since August. Seismicity increased slightly in early December and fumaroles of water vapor and SO2 were observed rising to heights between 500 and 1,600 m above the crater floor. Seismic signals characteristic of a mudflow were recorded in mid-December 2014 in the ravine between Sabancaya and Ampato, the large volcano immediately SW.
Buenos Aires VAAC reports in 2014 were all ambiguous as to the presence of ash from Sabancaya. A "faint ash cloud" was detected in visible imagery on 14 July 2014. Numerous pilot reports of ash between August and December were not verified by satellite imagery under clear skies, and the webcam usually revealed water vapor emissions or cloud cover at the summit at the time of most of the reports. VAAC reports that do mention "possible minor volcanic ash" were given on 16 September, 23 October, 10 November, and 27 December 2014.
Activity during 2015 and early 2016. A similar level of activity continued during 2015. Neither OVI-INGEMMET nor IGP-OVA reported explosions with ash emissions during the year. Constant emissions of steam and bluish magmatic gases were observed from the fumaroles within the crater. Plumes of water vapor and magmatic gases rose to 1 km above the crater in January and to 1.2 km in February. From March through May seismic activity remained steady and fumarolic plumes were consistently below 1 km above the crater.
Seismicity increased during June 2015. Fumarolic plume heights also increased to 2.4 km above the crater, and bluish SO2-rich gases were frequently observed. During July, some seismic events were located within 3 km of the crater, and fumarolic plumes rose to 2 km. Volcanologists from OVI-INGEMMET visited on 10 July 2015 and observed trace amounts of ashfall or particulates from SO2 emissions in the vicinity of the crater (figure 16). IGP-OVS scientists who visited in late July to make temperature measurements observed constant water vapor and magmatic gas emissions. The temperature at the side of the dome was measured at 81°C, and the hottest points at the bottom of the crater were 391° and 280°C.
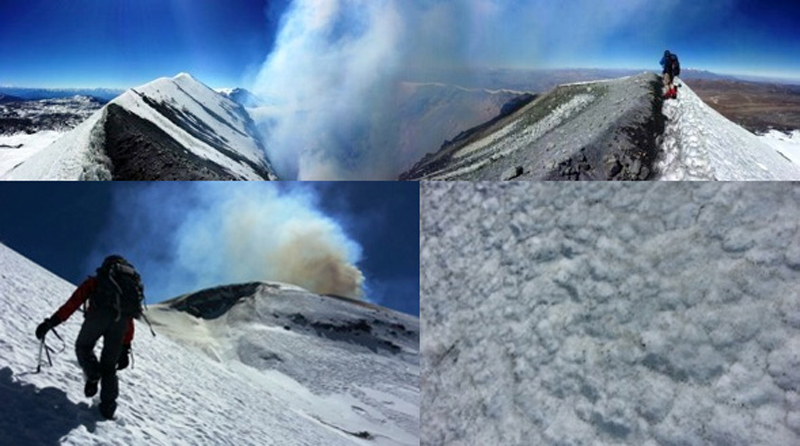 |
Figure 16. Crater inspection of Sabancaya on 10 July 2015 where trace amounts of ash or particulates from SO2 emissions were observed. Courtesy of OVI-INGEMMET. |
During late August 2015 and the first week of September seismicity increased significantly, and was located within 6 km of the crater at depths between 6 and 9 km. Fumarolic emissions ranged between 600 and 1,600 m above the crater. Seismicity was low during October. An IGP-OVS visit on 1 October obtained temperature data similar to that collected in late July. The expedition reported the absence of recently deposited solid material in the vicinity of the crater, and also observed the constant emission of steam and magmatic gases (figure 17).
 |
Figure 17. Emissions of white steam and bluish magmatic gases from Sabancaya in the early hours of 1 October 2015. Courtesy of IGP-OVA (2015 Annual report, Sabancaya). |
VT seismicity remained low in November 2015, but an increase in the second week in December included two events (4.0 and 3.6) located within 2 km of the volcano. Constant emissions of water vapor and magmatic gases rising to 1,100 m were observed.
Buenos Aires VAAC reports for 2015 were again ambiguous about the presence of ash. Many reports note that pilot observations of ash clouds were not corroborated by satellite or webcam images. However, on several occasions, the VAAC reports indicated that the webcam showed continuous emission of steam, gases, and "possible light volcanic ash" (8 March, 19 May, 15 and 21 June, 18 and 21 July, 26 August, 10 October, 6 November and 12 December).
Sabancaya maintained a similar level of seismic and fumarolic unrest through February 2016 that was monitored and reported by both OVI-INGEMMET and IGP-OVS. OVI-INGEMMET reported plume heights of water vapor in early January as high as 2,000 m above the crater, gradually decreasing to below 1,000 m in early February. The intermittent presence of magmatic gases was also noted during this time.
While there have not been substantial ash emissions since renewed seismic activity began in 2013, there have been measurable SO2 emissions observed by IGP-OVS and recorded by NASA's OMI instrument (figure 18). Emissions of SO2 recorded on 27 December 2014 (0.937 kT), 3 April 2015 (0.750 kt), 28 November 2015 (0.773 kt), 25 February 2016 (0.365 kt) appear most likely to have originated at Sabancaya.
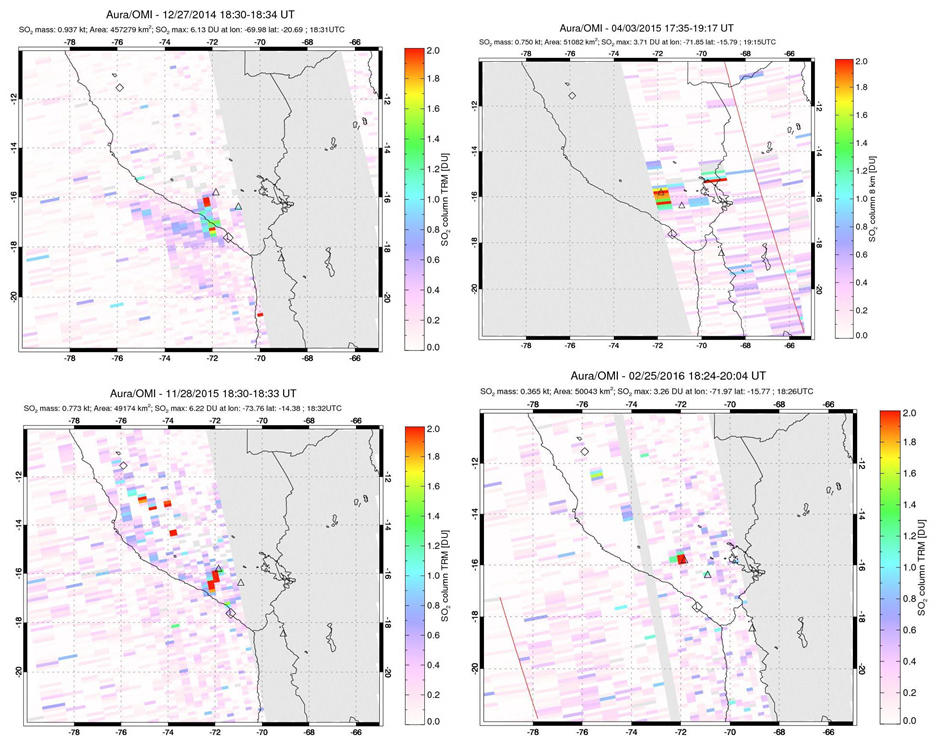 |
Figure 18. Four different images from the OMI instrument satellite data from NASA's Goddard Space Flight Center showing SO2 anomalies possibly attributable to Sabancaya (upper left triangle). The image dates are 27 December 2014 (top left), 3 April 2015 (top right), 28 November 2015 (bottom left), and 25 February 2016 (bottom right). Courtesy of NASA Goddard Space Flight Center. |
Information Contacts: Instituto Geofisico del Peru, Observatoria Vulcanologico del Sur (IGP-OVS), Arequipa Regional Office, Urb La Marina B-19, Cayma, Arequipa, Peru (URL: http://ovs.igp.gob.pe/); Observatorio Volcanologico del INGEMMET, (Instituto Geológical Minero y Metalúrgico) (OVI-INGEMMET), Barrio Magisterial Nro. 2 B-16 Umacollo - Yanahuara Arequipa (URL: http://ovi.ingemmet.gob.pe); Buenos Aires Volcanic Ash Advisory Center (VAAC), Servicio Meteorológico Nacional-Fuerza Aérea Argentina, 25 de mayo 658, Buenos Aires, Argentina (URL: http://www.smn.gov.ar/vaac/buenosaires/inicio.php?lang=es); NASA Goddard Space Flight Center, Global Sulfur Dioxide Monitoring Page, Atmospheric Chemistry and Dynamics Laboratory (URL: https://so2.gsfc.nasa.gov/).
Eruption with continuing ash plumes began on 6 November 2016
Although historical records of eruptive activity at Peru's Sabancaya volcano go back to 1750, there have only been a handful documented since the 1980s; activity that began in 1986 was the first recorded in over 200 years. During the last period of substantial ash eruptions between 1990 and 1998 ashfall deposits up to 4 cm thick were reported 8 km E of the volcano. Evidence for minor ash-emitting events was reported in 2000 and 2003. Intermittent seismic unrest and fumarolic emissions characterized activity from late 2012 through 2015. Seismically detected explosions during August 2014 led to releases of SO2 gases and steam plumes, some as high as 2 km, along with possible minor volcanic ash. Possible minor volcanic ash emissions were also mentioned by Peruvian authorities and pilot reports between September and December 2014 but there were no confirmed reports of ash emissions during this period. A crater inspection during 9-10 July 2015 found trace amounts of ash at the crater that contained crystals of plagioclase, biotite, and amphibole, along with fresh volcanic glass. These were interpreted by the volcanologists to represent minor ash emissions during recent weeks.
Unrest with steam plumes and variable seismicity continued during 2016 until 6 November when continuous ash-bearing explosions began. Activity during 2016 through February 2017 is covered in this report with information from the two Peruvian observatories that monitor the volcano: Instituto Geofisico del Peru - Observatoria Vulcanologico del Sur (IGP-OVS), and Observatorio Volcanologico del INGEMMET (Instituto Geológical Minero y Metalúrgico) (OVI-INGEMMET). Aviation reports and notices come from the Buenos Aires Volcanic Ash Advisory Center (VAAC), and satellite data is reported from several sources.
Sabancaya maintained a level of seismic and fumarolic unrest through most of 2016, similar to levels recorded in 2014 and 2015, with almost constant water-vapor and SO2 plumes rising from the crater. Additionally, tectonic (not volcanic) seismicity caused damage and fatalities in nearby villages. An explosion on 27 August 2016 did not produce ash, but new areas of fumarolic activity on the N flank were observed around this time. Hybrid seismic events related to the movement of magma, and SO2 emissions, increased noticeably during September and October 2016. An explosive eruption with numerous ash plumes began on 6 November 2016. Continuous ash emissions with plume heights exceeding 10 km altitude were recorded several times through February 2017. Thermal anomalies were first measured in satellite data in early November, along with numerous significant SO2 plumes.
Activity during January-October 2016. Heights of plumes consisting of water vapor and minor magmatic gases generally decreased during January 2016, from 1,800 m to less than 1,200 m by the month's end. Seismic activity was generally low in terms of both numbers of events and magnitude. The daily number of events ranged from 8 to 20, and the largest event, a M 4.0, was registered on 29 January.
Plume heights continued declining in February, from 1,000 m during the first week to 400-800 m by the end of the month. During March, April, and May the heights of steam and SO2 plumes ranged from 200 to 1,300 m above the crater, and values of SO2 flux ranged from 600 to 1,500 metric tons per day (t/d). These values increased only slightly in July and August; plumes rose 2,000 m above the crater rim and SO2 emissions were as high as 2,600 t/d.
Seismicity continued at low levels through late August. Three significant tectonic earthquakes in mid-August were not related to volcanic activity, but the earthquake 25 km NE of Sabancaya on the Ichupampa fault on 14 August caused at least four fatalities, and numerous aftershocks were recorded in the region. A spike in SO2 emissions at the volcano to 4,030 t/d occurred shortly after the earthquake.
On 27 August 2016 there was a hybrid-type seismic event that IGP-OVS interpreted as an explosion of 72 MJ (Megajoules) of energy. An official statement from the Scientific and Technical Committee for Risk Management (IGP-OVS, OVI-INGEMMET, and others) issued on 6 September noted that "dense gray gases reached 1,000 m above the crater and drifted E." However, no VAAC reports were issued, and ash was not mentioned in the OVI INGEMMET weekly report.
During the last two weeks of August, two large zones of new fumarolic activity were detected in satellite imagery. OVI visited the site on 25 August, and IGP-OVS visited on 1 September 2016. The scientists observed areas of increased fumarolic emissions outside of the crater on the NE and NW flanks of the volcano (figure 19). The first zone was located on the NW flank and extended from the vicinity of the crater down to 5,700 m elevation, while the second area was located on the NE flank at about 5,600 m. Both areas follow a NW-SE trend. The flux of SO2 increased to values greater than 4,000 t/d at the end of August.
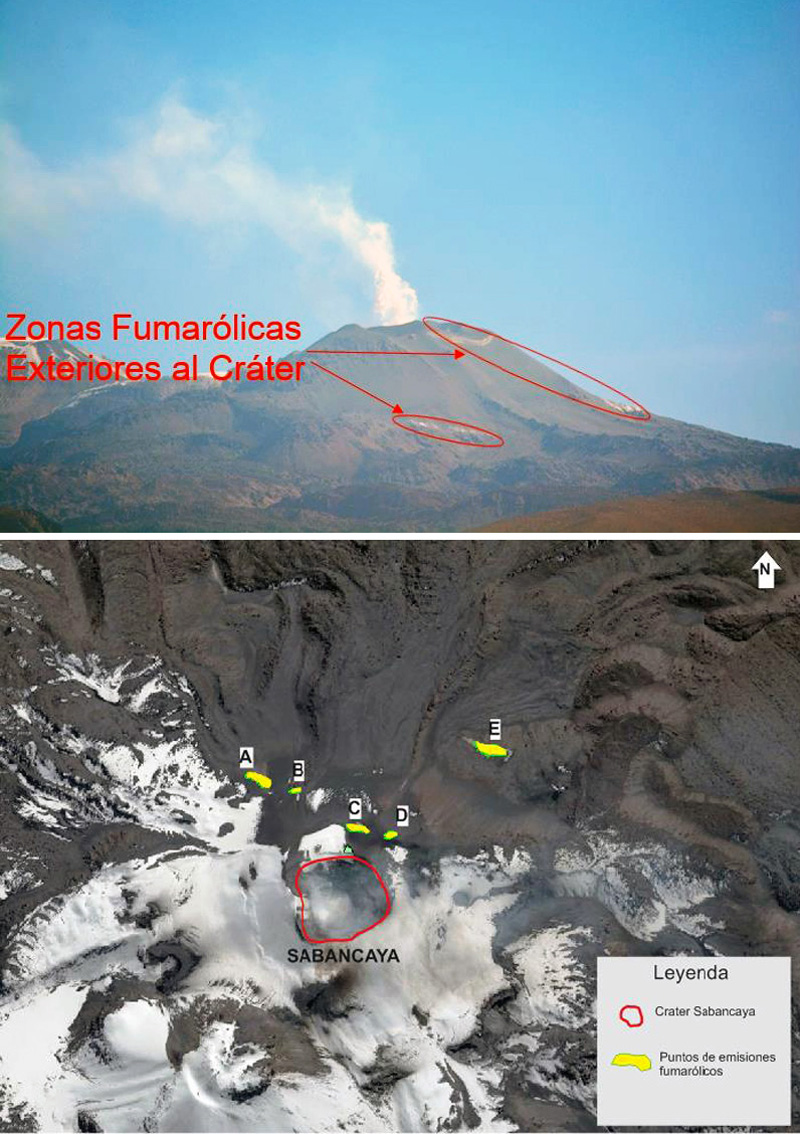 |
Figure 19. New areas of fumarolic activity at Sabancaya, August 2016. Top: Two large fumarolic areas photographed on 1 September 2016 that appeared on the flanks during late August. The main zone was located on the NW flank and extended from the vicinity of the crater down to 5,700 m elevation, while the second area was located on the NE flank at about 5,600 m. Courtesy of IGP-OVS (Sabancaya Report 27, 1 September 2016) Bottom: Google Earth image showing location of fumarolic fields. A, B, C, and D are part of the NW flank field and E is the NE flank field. Courtesy of OVI-INGEMMET (Special Report, 1 September 2016). |
OVI-INGEMMET reported an increase in the total number of seismic events during September 2016, especially hybrid-type events, along with generally lower plume heights, but increased emissions of SO2. IGP-OVS noted a swarm of hybrid-type seismic events on 27 September distinct from the distal tectonic-related events of the previous month, and indicative of an increase in volcanic activity. IGP-OVS returned to Sabancaya on 28 September 2016 to gather temperature measurements at the new fumarole areas. A NW-SE trending belt on the NE side of the volcano had temperature readings between 71° and 91°C.
At the beginning of October, water vapor and SO2 gas plumes rose as high as 2,000 m above the crater, and the SO2 flux was over 3,000 t/d. Volcanic seismicity increased from 220 earthquakes per day during the first week to 470 during the second week. SO2 emissions continued to increase and by 22 October were at 7,173 t/d.
From 9 January through 3 November 2016 the Buenos Aires VAAC issued 52 reports with pilot observations of ash. The VAAC was unable to confirm the presence of ash in emissions and instead described only water vapor or magmatic gases recorded via the web camera. There were no MODIS thermal anomalies shown by the MODVOLC or MIROVA systems from January 2014 through October 2016.
Activity during November 2016-February 2017. OVI-INGEMMET reported an eruption beginning at 2040 local time on 6 November 2016 (0140 on 7 November UTC) that started with an explosion and was followed by the continuous emission of low volume ash that rose up to 1,500 m above the crater rim (about 7,500 m altitude) (figure 20).
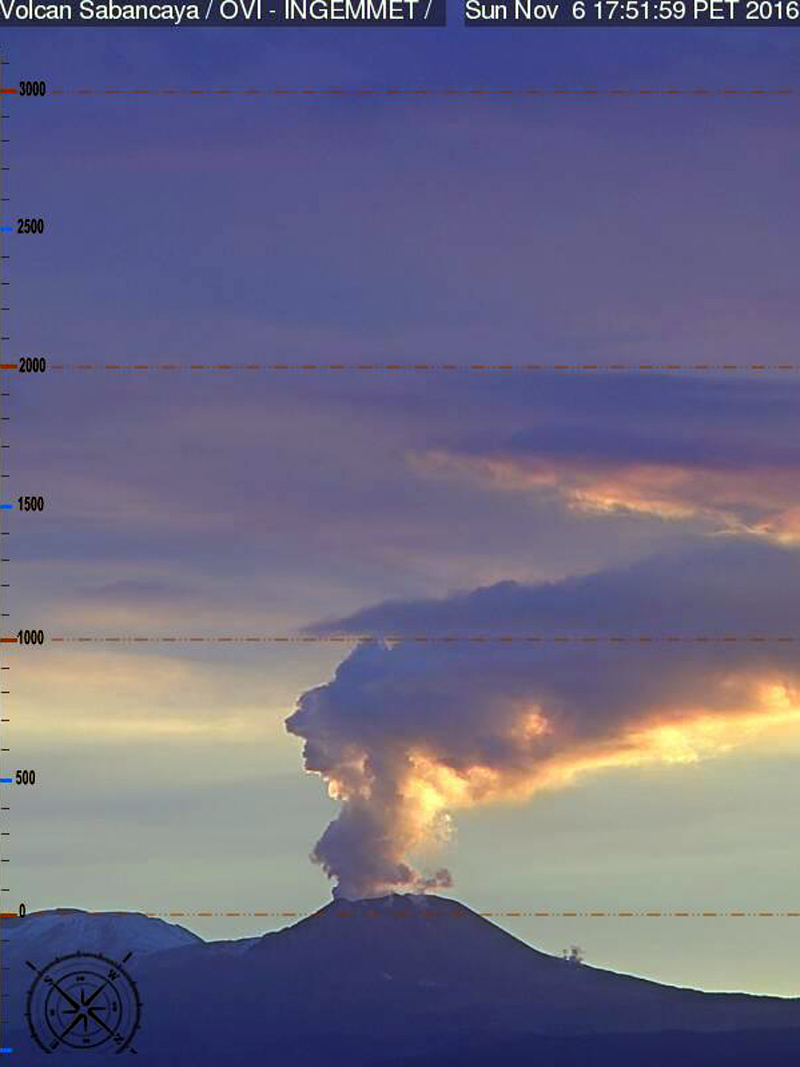 |
Figure 20. The beginning of the eruption at Sabancaya, in the province of Caylloma in Arequipa, on 6 November 2016. Courtesy OVI-INGEMMET (Sabancaya 2016 Weekly Report 45). |
Several types of volcanic-related seismic events continued to increase in number and intensity during November and December. The eruption exhibited an average of 39 daily explosive events with ash plumes (figures 21, 22, and 23) between 7 November and 15 December. There were 63 explosions on 30 November, and between 5 and 11 December there were 328 explosions.
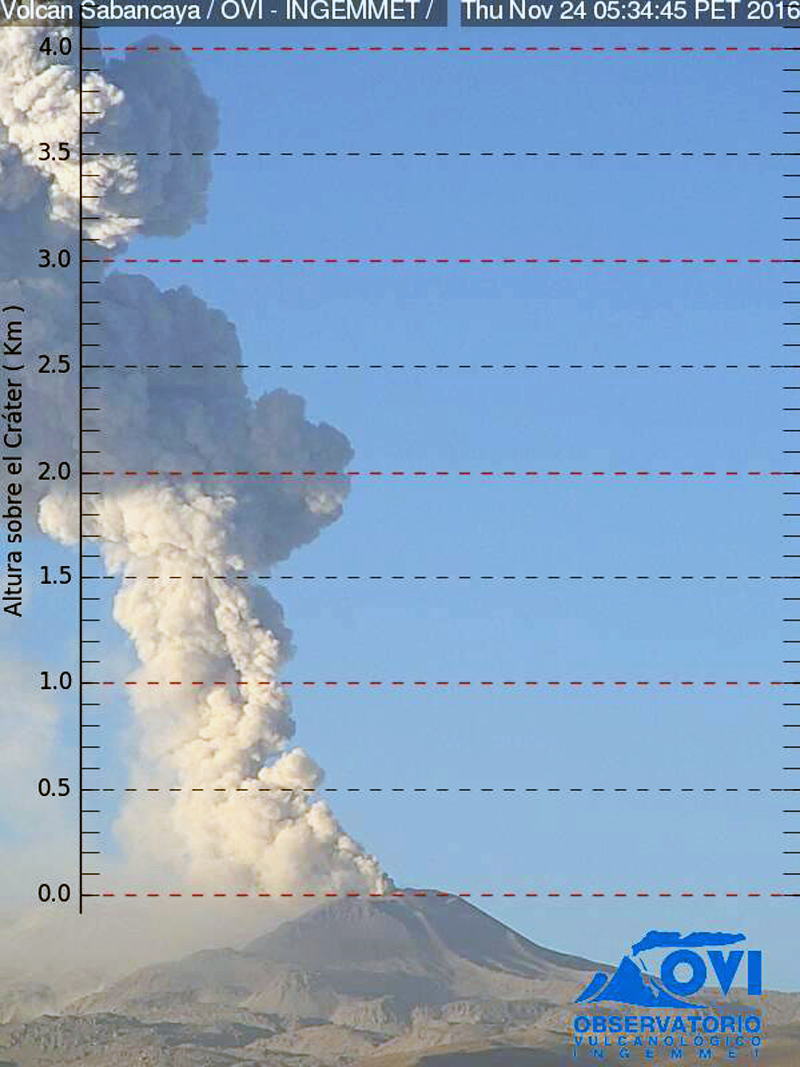 |
Figure 21. Ash plume rising over 4,000 m above the summit (5, 967 m elevation) at Sabancaya, 24 November 2016. Courtesy OVI-OVS (2016 Sabancaya Joint OVI-OVS Weekly Report 2, 21-27 November). |
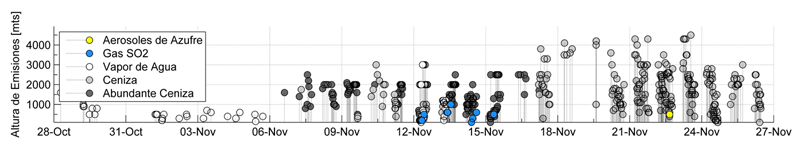 |
Figure 22. Plume heights and compositions at Sabancaya from 28 October through 27 November 2016. Ash emissions began on 6 November, and continued to increase in density and plume height throughout the month. White circles represent water vapor, light gray are ash, dark gray are abundant ash, blue are SO2 gas, and yellow are sulfur aerosols. Courtesy OVI-OVS (2016 Sabancaya Joint OVI-OVS Weekly Report 2, 21-27 November). |
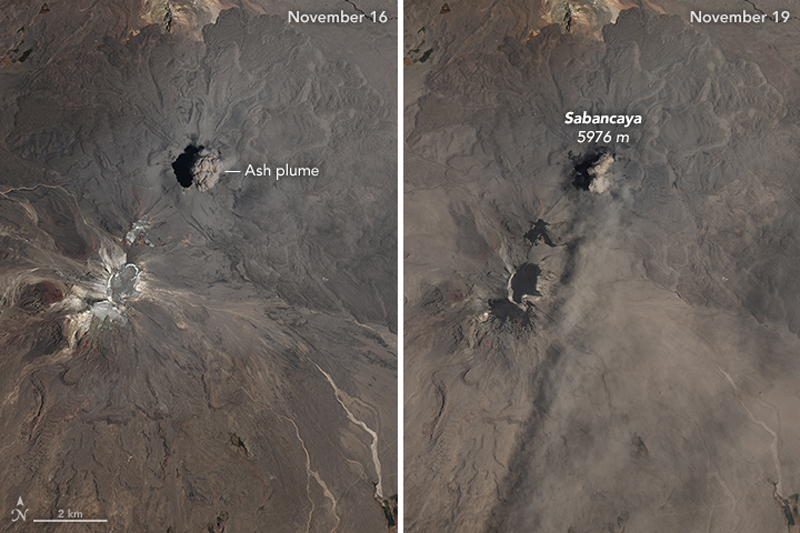 |
Figure 23. NASA Earth Observatory images of ash plumes from Sabancaya on 16 and 19 November 2016. The bright area to the SW in the 16 November image is snow near the peak of Mount Ampato, which is covered with ash in the 19 November image. The 16 November image was acquired by a multispectral imager on the European Space Agency's Sentinel 2 spacecraft. The Operational Land Imager (OLI) on Landsat 8 captured the November 19 image. Courtesy of NASA Earth Observatory. |
Ash emissions were continuous from the beginning of the eruption through mid-December, with heights up to 4.5 km (10.5 km altitude) above the crater, according to the Scientific-Technical Committee of government scientists monitoring the eruption. Ashfall several millimeters thick was recorded in areas as far as 40 km away. During the first weeks of the eruption ash fell mainly to the E and NE on the villages of Maca, Achoma, Yanque and Chivay (18-30 km NE). Later in December, ashfall was reported W and NW in the villages of Huambo (28 km W), Cabanaconde (22 km NW), and Pinchollo (18 km N). On 26 December, ashfall was again reported in the villages of Cabanaconde, Pinchollo, and Tapay (25 km NW) to the NW and N, and Lari and Madrigal (20 km NE), Maca, and areas of Achoma to the NE. The seismic energy released from tremors and explosive events continued to increase throughout November into December (figures 24 and 25).
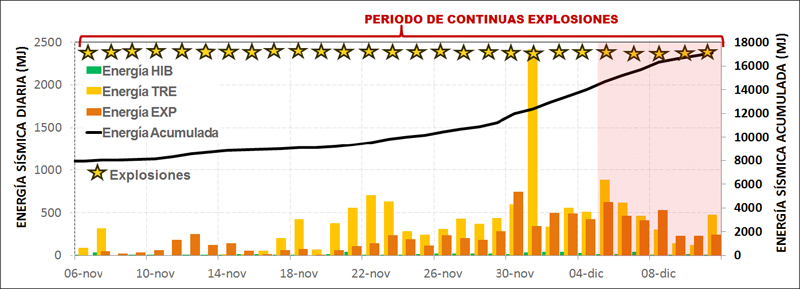 |
Figure 24. Seismic energy and types of seismic events at Sabancaya, 6 November-8 December 2016. HIB are hybrid-type seismic events, TRE are tremors, EXP are explosions. Black line represents cumulative energy in Megajoules (MJ). Y axis is daily seismic energy on the left and cumulative energy on the right. Stars represent the period of continuous explosions. Courtesy of OVI-OVS (2016 Sabancaya Joint OVI-OVS Weekly Report 4, 5-11 December). |
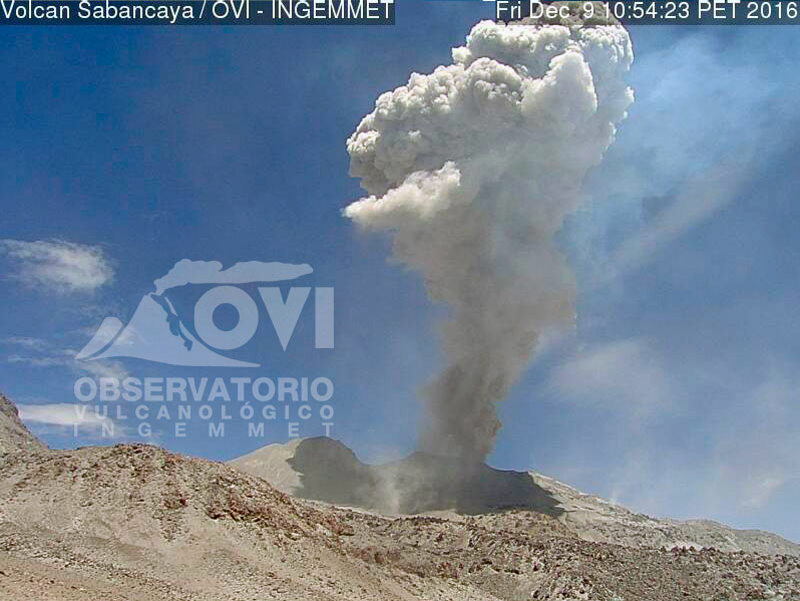 |
Figure 25. Web camera image of ash-and-steam plume at Sabancaya, 9 December 2016. Courtesy of OVI-OVS (2016 Sabancaya Joint OVI-OVS Weekly Report 4, 5-11 December). |
Beginning on 21 December there was a notable increase in seismicity (mainly of hybrid events), in the number (up to 52 per day) and height of plumes, and ash emissions. These changes led the Scientific-Technical Committee to raise the Volcanic Warning Level from Yellow to Orange (2 to 3 on a 4-level scale) on 28 December, warning people to remain more than 12 km from the crater (figures 26 and 27). A small lahar affected the area of Pinchollo (18 km N) on 3 January 2017.
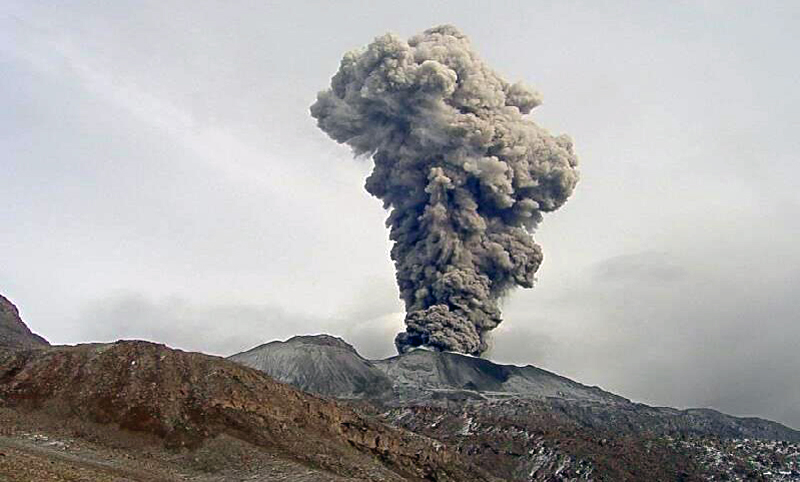 |
Figure 26. Dense ash cloud at Sabancaya, 26 December 2016. Increasing intensity of seismicity and number of explosions led to an increase in the Volcano Warning Level on 28 December. Courtesy of OVI-OVS (Informe Especial No. 01-2017). |
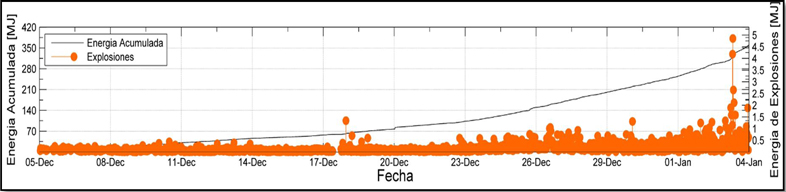 |
Figure 27. Seismic energy released by Sabancaya between 5 December 2016 and 4 January 2017. Note increasing energy of the explosions in early January. Courtesy of OVI-OVS (Informe Especial No. 01-2017). |
Seismicity remained high during January with long-period (LP), tremor, and hybrid-type events all continuing, and an average of 70-76 daily explosions. During the second week in January explosions peaked at an average of 84 per day. This number decreased during early February to around 20 per day but then rose back to over 40 by the end of the month. A significant number of hybrid seismic events occurred during the last week of February.
Gas-and-ash plumes rose to 4.5 km above the crater in early January, dropping back to 2-3 km for the rest of the month, before rising again to 3-4 km (9-10 km altitude) during February. In their Special Report in January 2017, the joint Scientific-Technical committee presented a map showing that ash dispersal had affected communities in nearly every direction 40 km from the summit (figure 28).
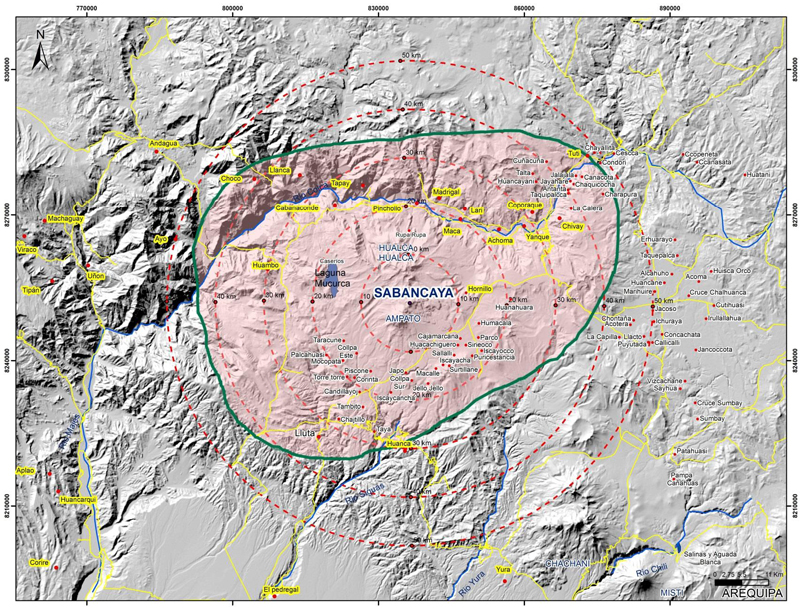 |
Figure 28. Area affected by ashfall (in pink) from Sabancaya as of mid-January 2017. Courtesy of OVI-OVS (Informe Especial No. 01-2017). |
Buenos Aires VAAC Reports, November 2016-February 2017. The Buenos Aires VAAC first noted minor amounts of volcanic ash in emissions visible from the volcano webcam on 7 November 2016 (UTC). Ash was not identified in satellite imagery until midday 8 November when it was reported at 7.6 km altitude (about 1.7 km above the summit). Observations of continuous emissions of steam and ash were reported daily, when not obscured by weather, from then through the end of February 2017. Plume heights were commonly 7.6-8.2 km altitude, about 1.7-2.3 km above the summit. Higher plumes were also recorded a number of times during this period, including 10.3 km altitude on 17 and 23 November. The plume was clearly visible in satellite imagery on 24 November, drifting SE at 10.9 km. Plumes on 3 December rose 10 km and drifted SW; they were partially hidden by weather clouds. Pulses of volcanic ash drifting over 35 km SE at 10.6 km altitude were visible on 11 and 12 December. For most of January 2017 the plumes were obscured by weather clouds, but were visible on 6 January at 9.1 km altitude. Higher plumes were more often recorded in February; they rose continuously over 10 km from 4 to 7 February. The highest plume during the period was on 26 February, at 11.9 km, drifting SW.
Thermal anomalies in satellite data. The MIROVA thermal anomaly plot of MODIS data provided independent satellite confirmation of the beginning of the eruption. The first thermal anomaly appeared on 2 November 2016, and values increased in frequency and intensity in the subsequent weeks. Energy values reached moderate levels in early February 2017 (figure 29). The first MODVOLC thermal alert pixel for Sabancaya appeared on 6 January 2017. There were seven MODVOLC alert pixels in January and six in February, suggesting a persistent source of heat during this time.
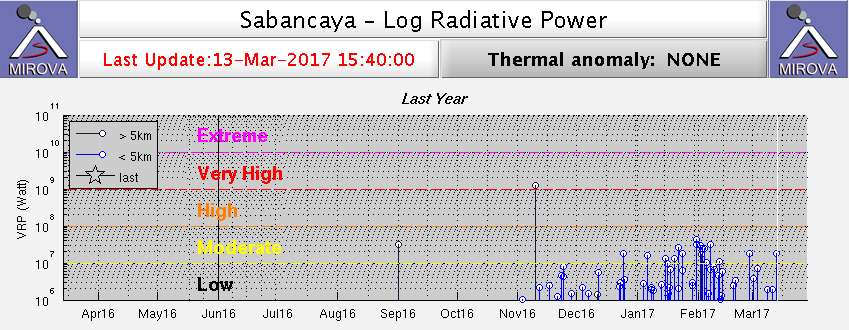 |
Figure 29. Log Radiative Power values for Sabancaya between 13 March 2016 and 13 March 2017. The first MIROVA-identified thermal anomaly was on 2 November 2016, and values increased in frequency and intensity after that. Courtesy of MIROVA. |
Sulfur dioxide data. Sulfur dioxide plumes from Sabancaya were captured numerous times by the OMI satellite instrument from NASA's Global Sulfur Dioxide Monitoring system between November 2016 and February 2017. They revealed significant SO2 plumes travelling in all directions away from the summit for distances up to 200 km (figure 30).
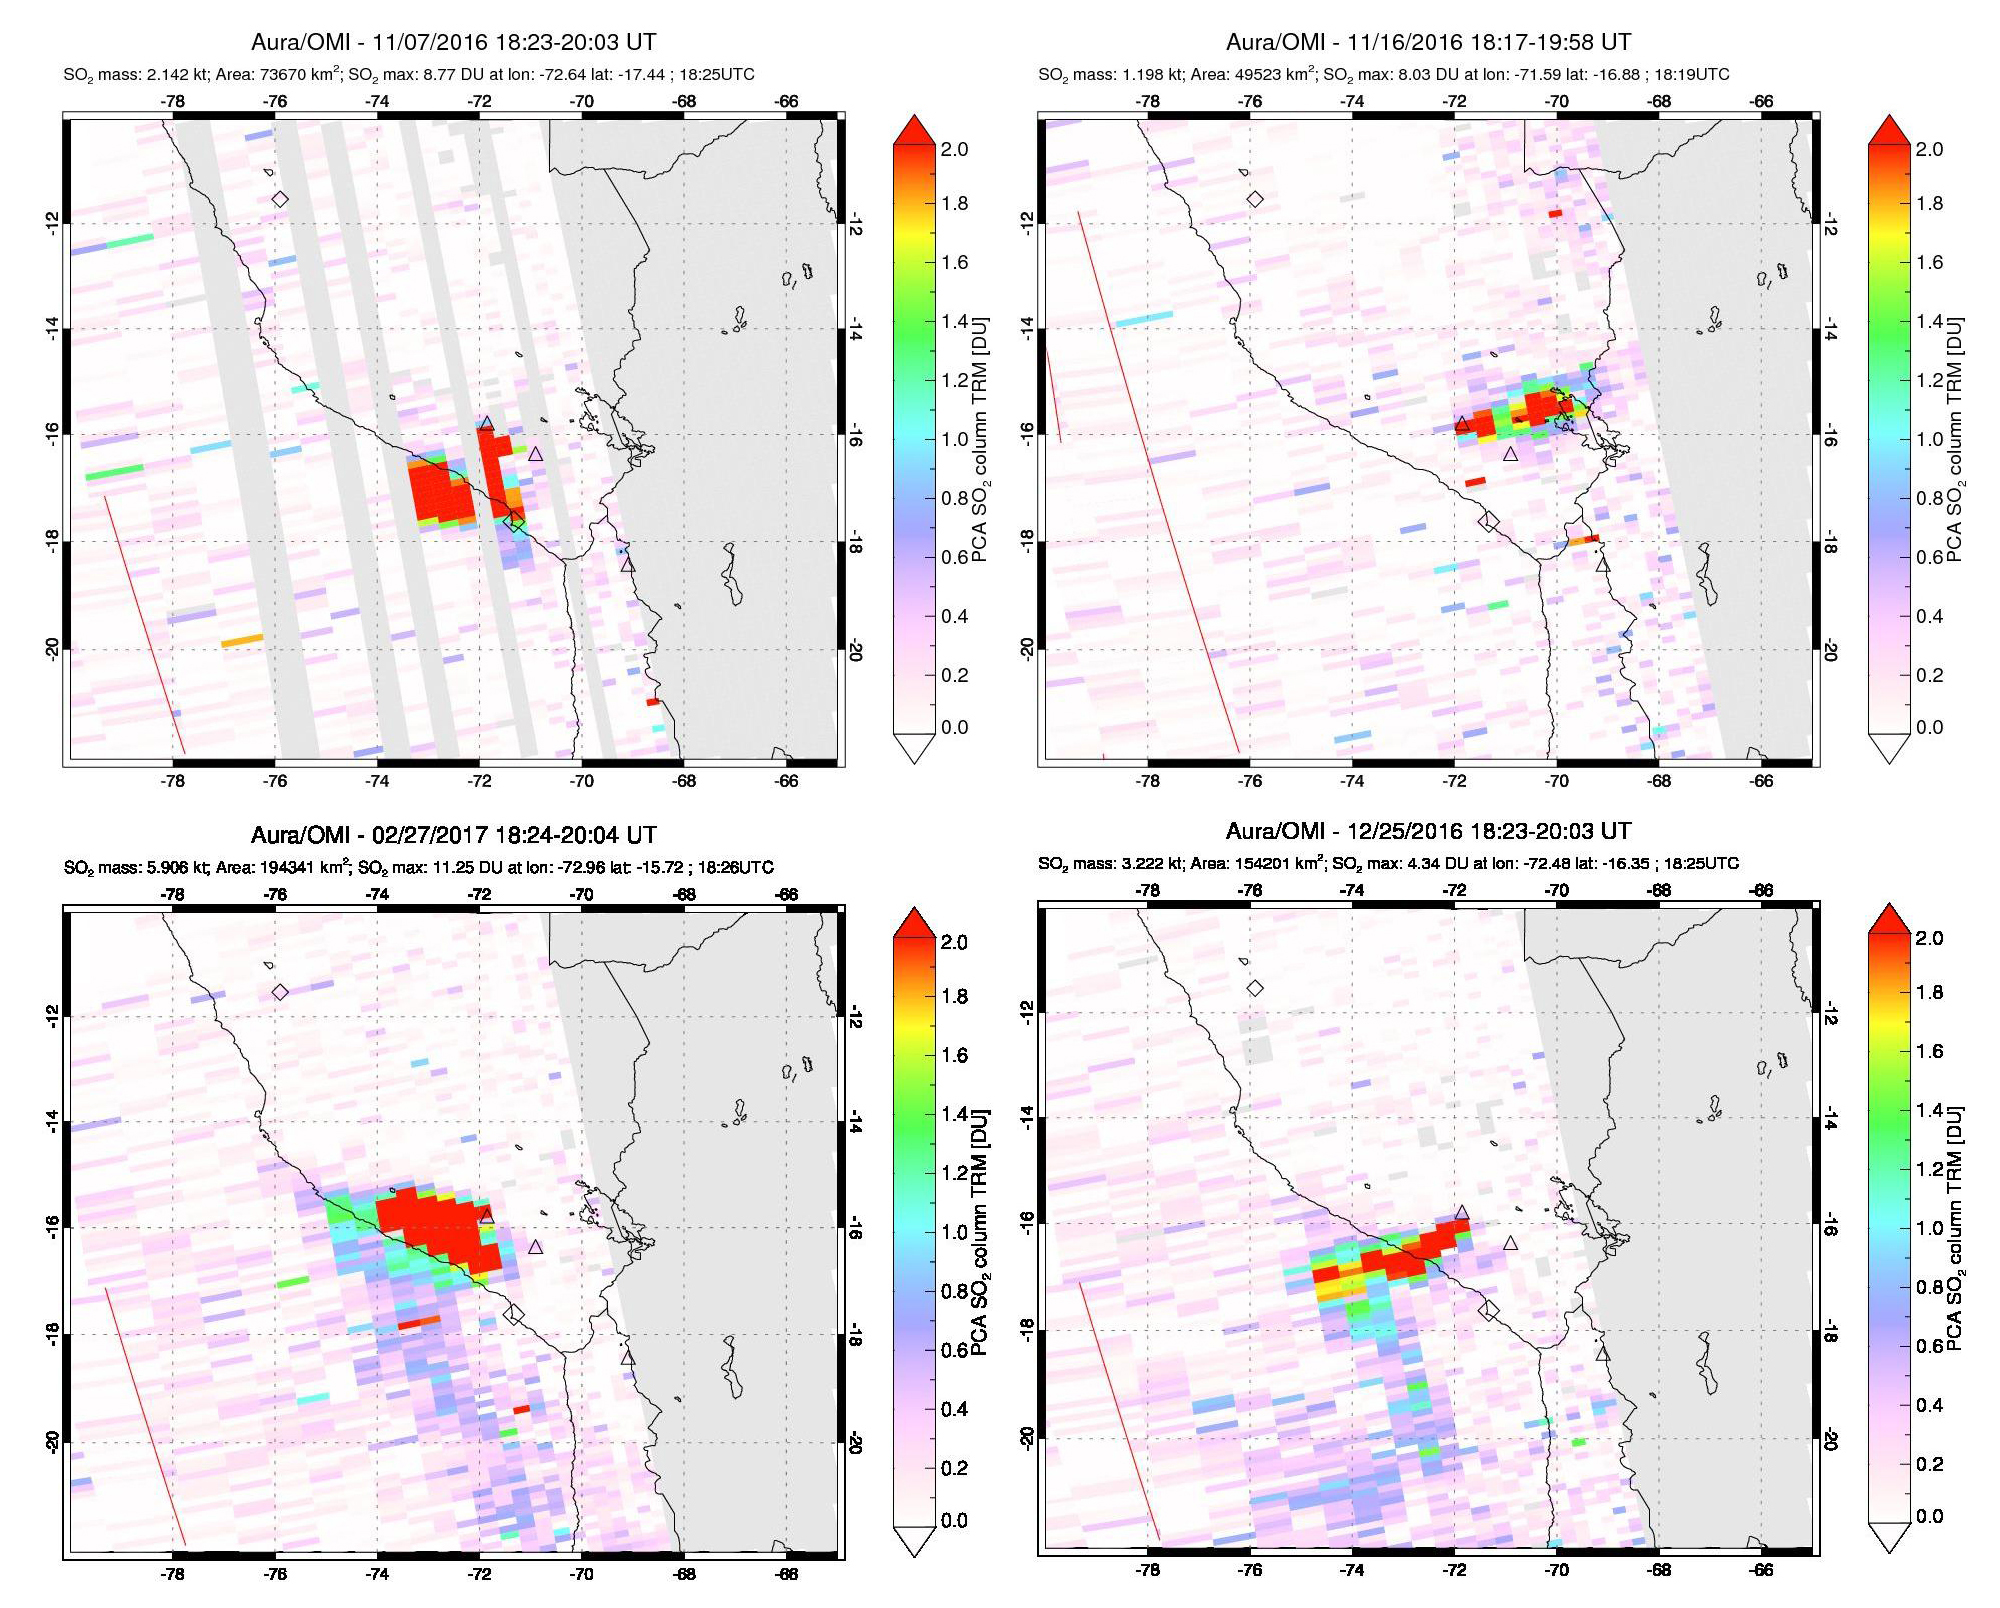 |
Figure 30. SO2 plumes drifting in different directions up to 200 km from Sabancaya captured by the OMI instrument on the Aura satellite. Clockwise from top left: 7 November 2016, first day of ash eruption, plume drifting SW and S towards Arequipa; 16 November 2016, plume drifting NE toward Lake Titicaca; 25 December 2016, plume drifting WSW over the Pacific Ocean; 27 February 2017, large plume drifting S and W, corresponding to an 11.9-km-altitude ash plume reported by Buenos Aires VAAC on 26 February. Courtesy of NASA GSFC. |
Information Contacts: Observatorio Volcanologico del INGEMMET, (Instituto Geológical Minero y Metalúrgico), Barrio Magisterial Nro. 2 B-16 Umacollo - Yanahuara Arequipa (URL: http://ovi.ingemmet.gob.pe); Instituto Geofisico del Peru, Observatoria Vulcanologico del Sur (IGP-OVS), Arequipa Regional Office, Urb La Marina B-19, Cayma, Arequipa, Peru (URL: http://ovs.igp.gob.pe/); NASA Earth Observatory, EOS Project Science Office, NASA Goddard Space Flight Center, Goddard, Maryland, USA (URL: http://earthobservatory.nasa.gov/); MIROVA (Middle InfraRed Observation of Volcanic Activity), a collaborative project between the Universities of Turin and Florence (Italy) supported by the Centre for Volcanic Risk of the Italian Civil Protection Department (URL: http://www.mirovaweb.it/); Hawai'i Institute of Geophysics and Planetology (HIGP), MODVOLC Thermal Alerts System, School of Ocean and Earth Science and Technology (SOEST), Univ. of Hawai'i, 2525 Correa Road, Honolulu, HI 96822, USA (URL: http://modis.higp.hawaii.edu/); NASA Goddard Space Flight Center (NASA/GSFC), Global Sulfur Dioxide Monitoring Page, Atmospheric Chemistry and Dynamics Laboratory, Goddard, Maryland, USA (URL: https://so2.gsfc.nasa.gov/).
Continuous pulses of ash emissions for ten months, February-November 2017
Activity that began in 1986 at Sabancaya was the first recorded in over 200 years. During the last period of substantial ash eruptions between 1990 and 1998 ashfall deposits up to 4 cm thick were reported 8 km E of the volcano. Intermittent seismic unrest and fumarolic emissions characterized activity from late 2012 through October 2016, with a few possible minor ash emissions unconfirmed during this period, and probable SO2 plumes.
Hybrid seismic events, related to the movement of magma, and SO2 emissions increased noticeably during September and October 2016. An explosive eruption period with numerous ash plumes began on 6 November 2016 and has continued throughout 2017. Continuous ash emissions with plume heights exceeding 10 km altitude were often recorded through February 2017. Thermal anomalies were first measured in satellite data in early November 2016, along with numerous significant SO2 plumes (BGVN 42:05). Details of the continuing eruptive activity at Sabancaya from February-November 2017 are discussed in this report with information from the two Peruvian observatories that monitor the volcano: Instituto Geofisico del Peru - Observatoria Vulcanologico del Sur (IGP-OVS), and Observatorio Volcanologico del INGEMMET (Instituto Geológical Minero y Metalúrgico) (OVI-INGEMMET). Aviation reports and notices come from the Buenos Aires Volcanic Ash Advisory Center (VAAC), and satellite data is reported from several sources.
Images from December 2016. An expedition to Sabancaya during 9-18 December 2016 by photographer Martin Rietze recorded numerous ash emissions and the impacts of the ongoing eruption on the region (figures 31-36). Similar activity continued throughout 2017.
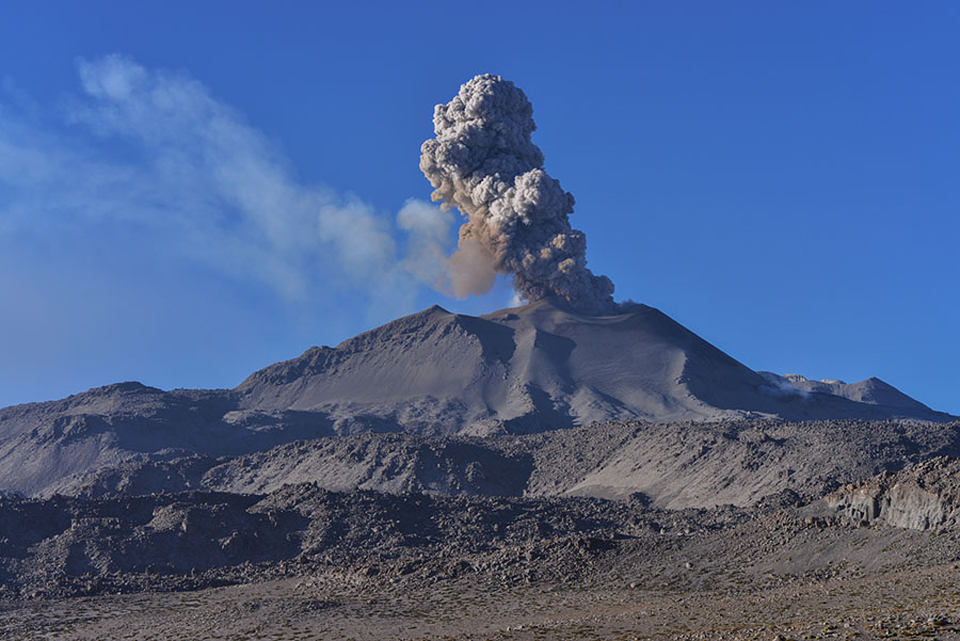 |
Figure 31. Gas and a dense ash plume rose above Sabancaya during 12-15 December 2016 in this view taken 6.5 km NNE of the volcano. Photo copyright by Martin Rietze, used with permission. |
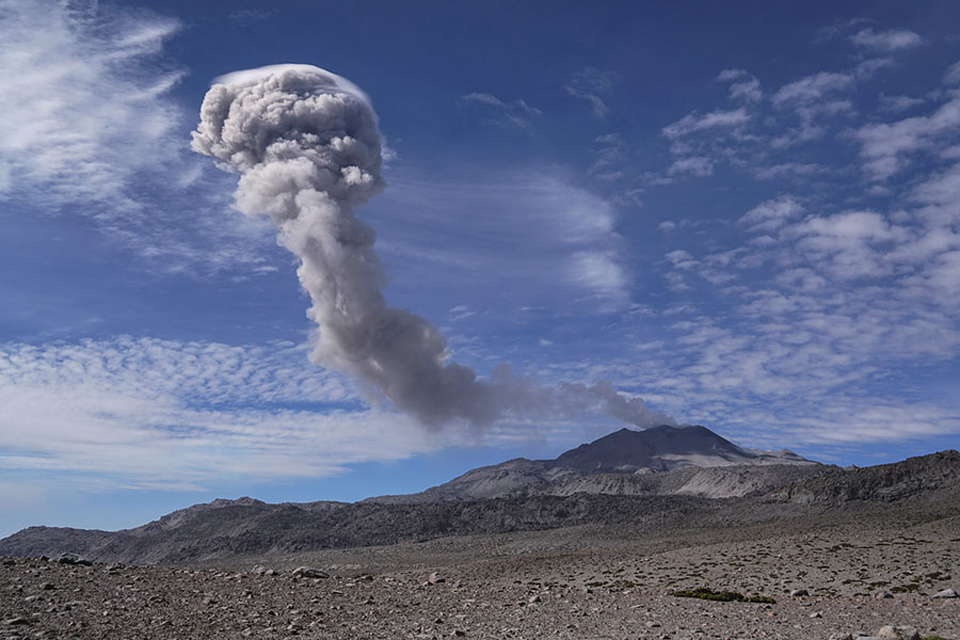 |
Figure 32. A column of ash drifted E from Sabancaya during 12-15 December 2016 while a cloud cap condensed on top of the plume. Image taken from 6.5 km NNE of the summit. Photo copyright by Martin Rietze, used with permission. |
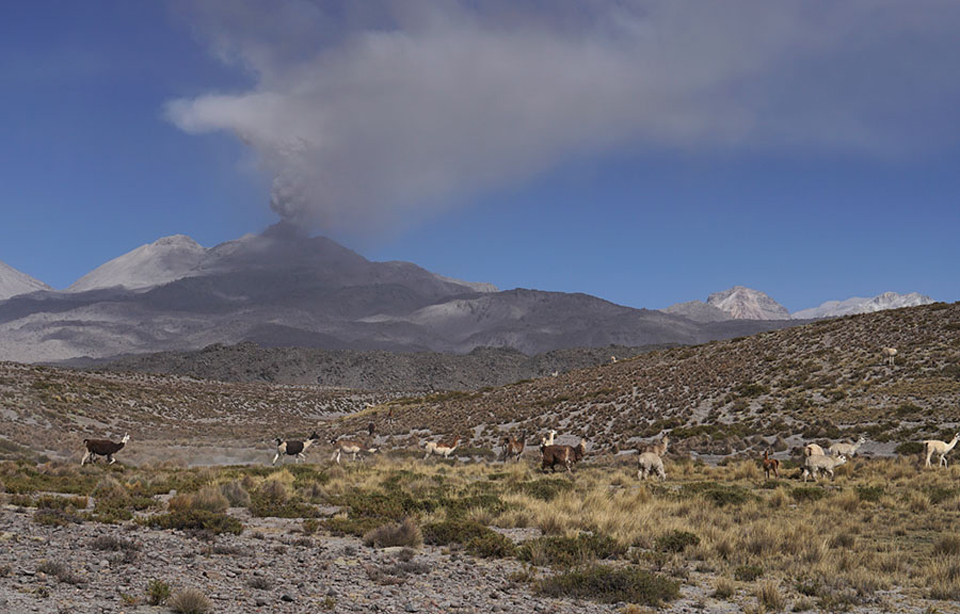 |
Figure 33. An ash plume fanned out to the E from Sabancaya during 12-15 December 2016. Image taken from 15 km E. Photo copyright by Martin Rietze, used with permission. |
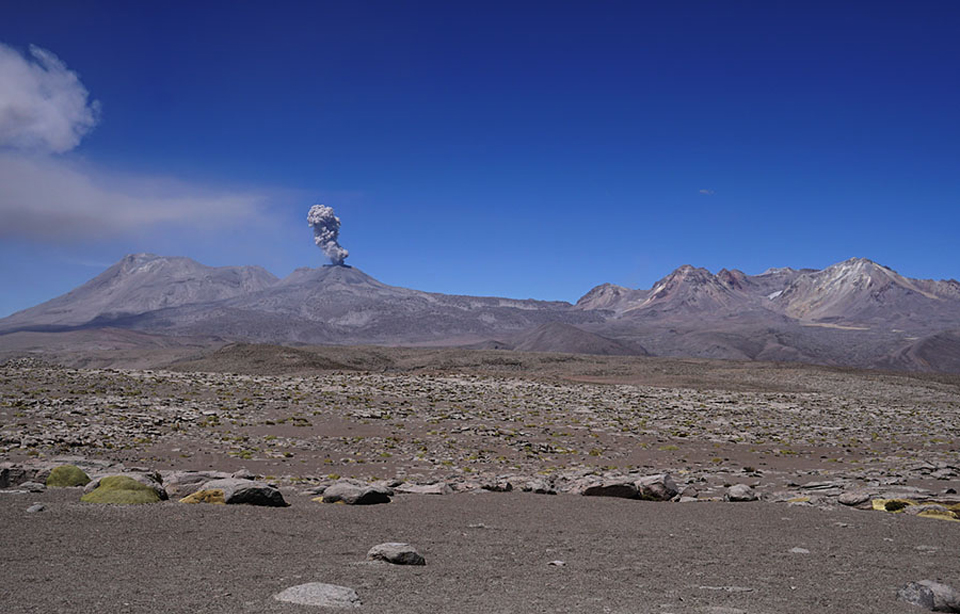 |
Figure 34. Sabancaya lies in the saddle between the older volcanic complexes of Ampato to the S (left) and Hualca Hualca to the N (right) in this view taken from 15 km E. It is the only one of the three to have erupted during the Holocene. An ash plume rose from Sabancaya during 12-15 December 2016, while ash from an earlier pulse is visible drifting S over Ampato. Photo copyright by Martin Rietze, used with permission. |
 |
Figure 35. Trace amounts of ashfall from Sabancaya covered the region 10 km W of the volcano during 12-15 December 2016. Photo copyright by Martin Rietze, used with permission. |
 |
Figure 36. An ash-and-steam plume rose vertically from Sabancaya during 12-15 December 2016 while a meteor streaked across the nighttime sky in this image taken 6.5 km NNE of the summit. Photo copyright by Martin Rietze, used with permission. |
Summary of activity, February-November 2017. The persistent eruptive activity during February-November 2017 can be visualized by the continuous MIROVA plot of Log Radiative Power during this time (figure 37). The Buenos Aires VAAC issued 1,174 VAAC reports for Sabancaya during February-November 2017, with over 100 recorded each month (table 1). Tens of explosions were reported daily by OVI-INGEMMET and IGP-OVS throughout the period. Ash plumes usually rose to the 9-11 km altitude range (3,000-5,000 m above the summit), and drifted 30-50 km in many directions before dissipating. MODVOLC thermal alerts were reported between 2 and 16 times every month, and satellite data registered SO2 plumes with values greater than two Dobson Units multiple days each month (figure 38).
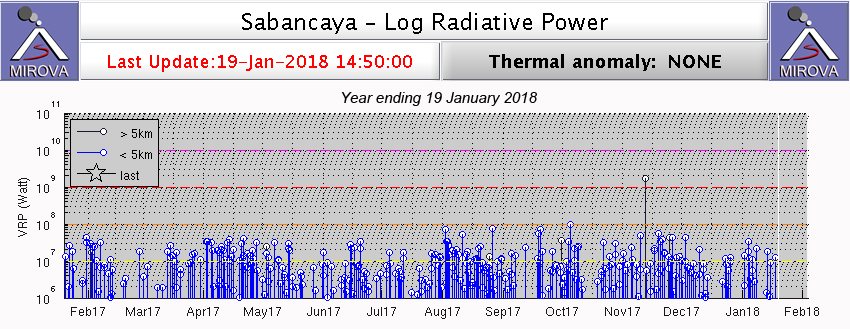 |
Figure 37. MODIS infrared satellite data plotted by MIROVA for the 12 months ending 19 January 2018 show the continuous signature of thermal activity from Sabancaya during that time. Courtesy of MIROVA. |
Table 1. Eruptive activity at Sabancaya, February-November 2017. Compiled using data from IGP-OVS/OVI-INGEMMET reports, the Buenos Aires VAAC, HIGP, and NASA GSFC.
| Month | VAAC Reports | Avg Daily Explosions by week | Max Plume Heights (m above crater) | Plume Drift | MODVOLC Alerts | Days with SO2 over 2 DU |
| Feb 2017 | 108 | 58, 23, 19, 42 | 3,000-4,300 | 40 km, NW, N, S, SE, SW | 6 | 12 |
| Mar 2017 | 122 | 44, 36, 36, 37, 41 | 2,500-4,800 | 30-40 km, S, NW, SW, N | 4 | 8 |
| Apr 2017 | 113 | 27, 37, 36, 33 | 3,000-3,200 | 40 km NW, NE, SE, W, N | 16 | 11 |
| May 2017 | 117 | 41, 38, 39, 41 | 2,800-4,200 | 30-40 km NE, E, SE | 4 | 3 |
| Jun 2017 | 104 | 47, 31, 26, 15, 5 | 1,500-3,700 | 30-40 km E, SE, SW, S | 4 | 5 |
| Jul 2017 | 127 | 10, 19, 24, 40 | 3,500-5,500 | 40-50 km NW, S, E, N, SE | 2 | 13 |
| Aug 2017 | 124 | 65, 41, 46, 44 | 3,200-4,200 | 30-50 km N, SE, NW, S | 12 | 10 |
| Sep 2017 | 118 | 38, 29, 45, 45 | 2,500-3,500 | 30-40 km SE, E, NE | 6 | 5 |
| Oct 2017 | 120 | 42, 41, 47, 43 | 3,100-3,900 | 35-60 N, NW, W, S, SE, NE, E | 9 | 8 |
| Nov 2017 | 121 | 57, 66, 82, 78, 69 | 3,300-4,200 | 40-50 km N, NE, E, SE, NW, SW | 11 | 10 |
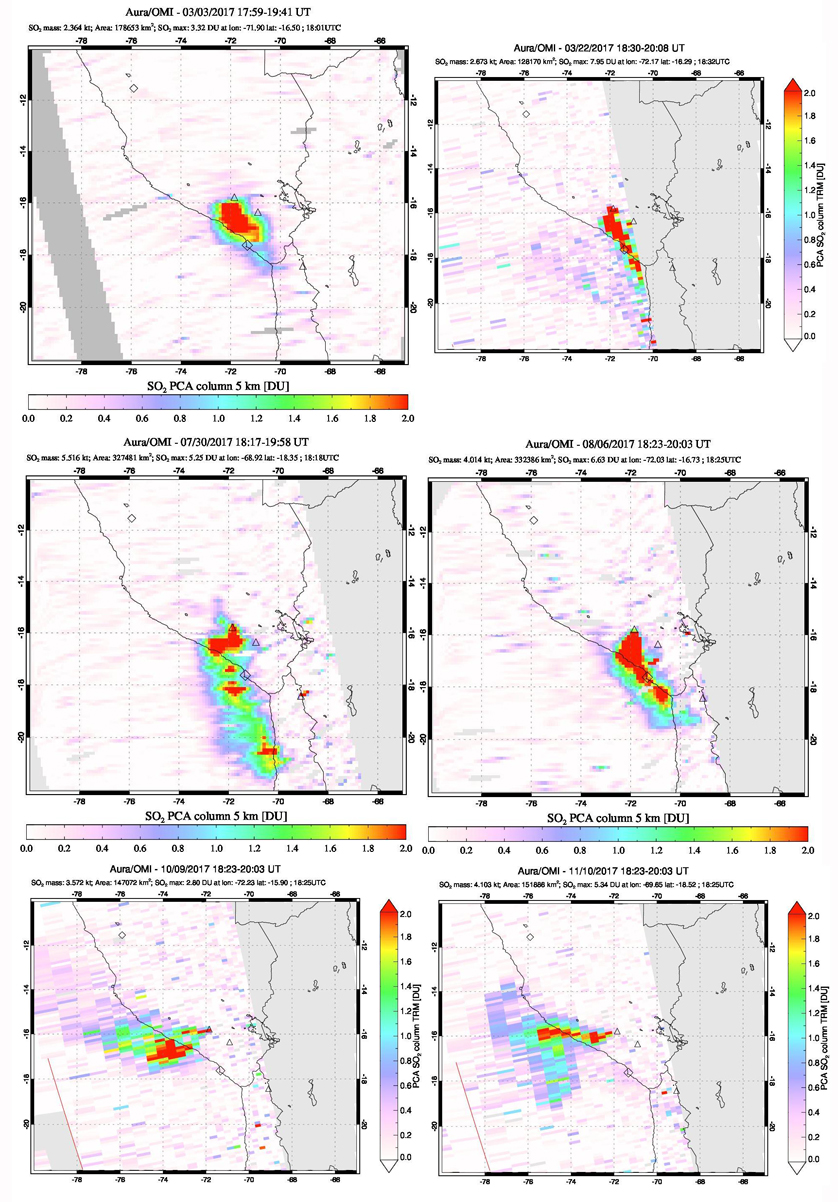 |
Figure 38. Numerous significant SO2 plumes were captured by the OMI instrument on the Aura satellite for Sabancaya during February-November 2017. Plumes drifted SSE on 4 March, 22 March, 30 July, and 6 August 2017 (top four images), and SW and W on 9 October and 10 November 2017 (bottom two images). The red pixels indicate values of Dobson Units (DU) greater than 2. Courtesy of NASA Goddard Space Flight Center. |
Activity during February-November 2017. IGP-OVS and OVI-INGEMMET monitor seismicity, inflation and deflation, SO2 emissions, and visual activity with webcams from several locations around Sabancaya (figure 39). Ash plumes during February 2017 rose to heights of 3,000-4,300 m above the summit (figure 40). The average number of daily explosions decreased from 53 the first week to 19 the third week, and then increased to 42 during the last week. Ash plumes drifted up to 40 km in numerous directions.
 |
Figure 39. Stations where IGP-OVS and OVI-INGEMMET monitor seismicity (red), inflation and deflation (green), SO2 emissions (orange), and their webcam locations (yellow) for Sabancaya. Courtesy of IGP-OVS and OVI-INGEMMET weekly reports. |
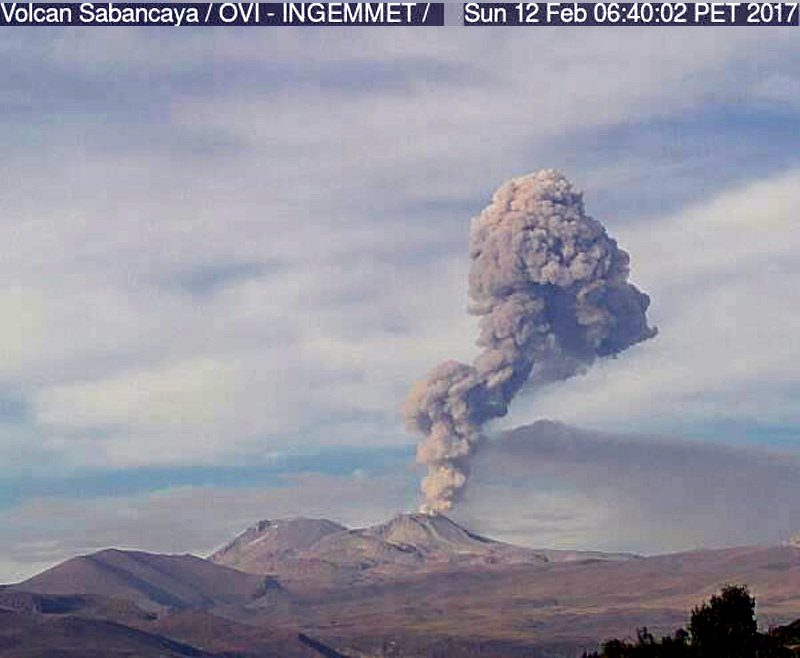 |
Figure 40. Ash emission from Sabancaya, 12 February 2017. View from the OVI-INGEMMET webcam located near Coporaque, about 30 km NE. Courtesy of OVI-INGEMMET (Reporte Semanal de Monitoreo de la Actividad del Volcan Sabancaya, Semana del 06 al 12 de febrero de 2017). |
During March 2017 the number of daily explosions was very consistent averaging each week between 36 and 44 events. Maximum ash plume heights ranged from 2,500 to 4,800 m and drifted 30-40 km to either the NW or SW (figure 41). Ash fell in Pinchollo (20 km N) and Cabanaconde (22 km NW) during the last few days of the month.
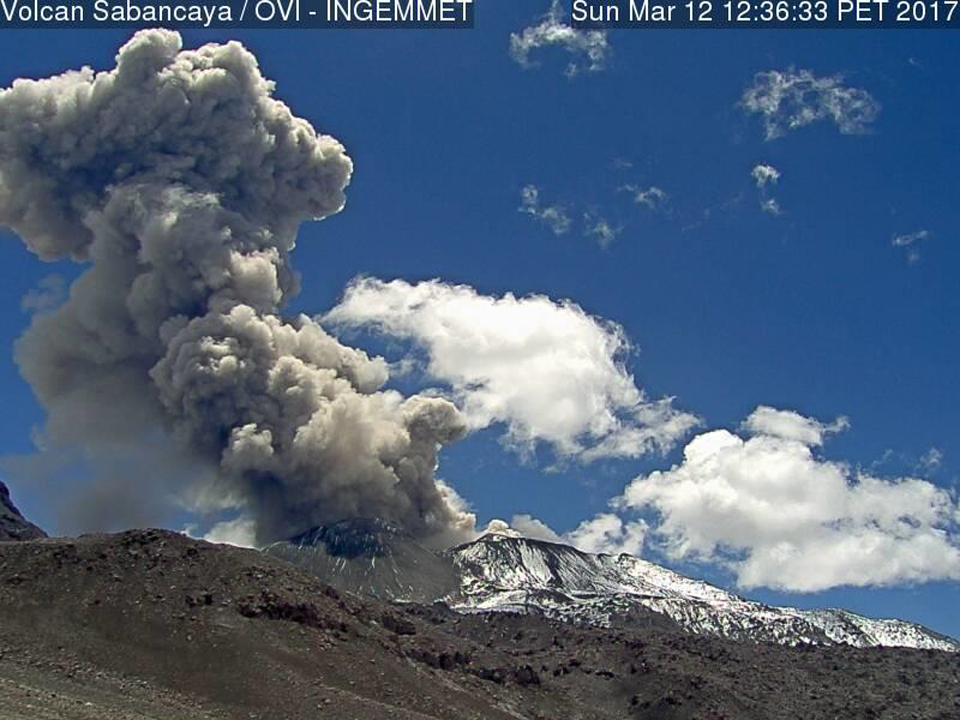 |
Figure 41. Ash emission from Sabancaya, 12 March 2017. Taken from OVI-INGEMMET webcam located about 4 km NE. Courtesy of OVI-INGEMMET (Reporte Semanal de Monitoreo de la Actividad del Volcan Sabancaya, Semana del 06 al 12 de marzo de 2017). |
Ash fell during the first week of April in Pinchollo, Maca (20 km NE) and Chivay (32 km NE). Plume heights during the month were slightly lower, ranging from 3,000-3,200 m and drifted 40 km in several directions. The frequency of daily explosions decreased slightly from March to an average each week ranging from 27 to37. The Buenos Aires VAAC reported that diffuse ash plumes drifted 100 km E on 9 April.
The frequency of daily explosions increased slightly during May; weekly averages ranged from 38 to 41. Plume heights were somewhat higher, at 2,800-4,200 m, and drifted 30-40 km in many directions (figure 42). There was a notable decrease during June 2017 in the number of daily explosions from an average during the first week of 47 to an average of only five at the end of the month. Deflation was observed in the GPS data after 21 June. Plume heights ranged from 1,500 to 3,700 m.
 |
Figure 42. On 20 May 2017 the Moderate Resolution Imaging Spectroradiometer (MODIS) on NASA's Terra satellite captured this image of repeated puffs of ash rising from Sabancaya and drifting E. Courtesy of NASA Earth Observatory. |
Activity increased steadily during July 2017. Daily explosions rose from an average of 10 during the first week to 40 the last week; ash plume heights were up to 5,000 m during those weeks (figures 43, 44) and drifted 50 km or more generally NW and SE. Ash plumes during the third week affected communities N of the volcano, including the villages of Cabanaconde, Pinchollo, Lari (20 km NE), Madrigal (20 km NE), Ichupampa (23 km NE), Maca and Achoma (21 km NE). Winds changed to the S on 22 July, so ashfall then affected Lluta (30 km SW), Huanca (75 km SSE), and some parts of Arequipa (80 km SSE).
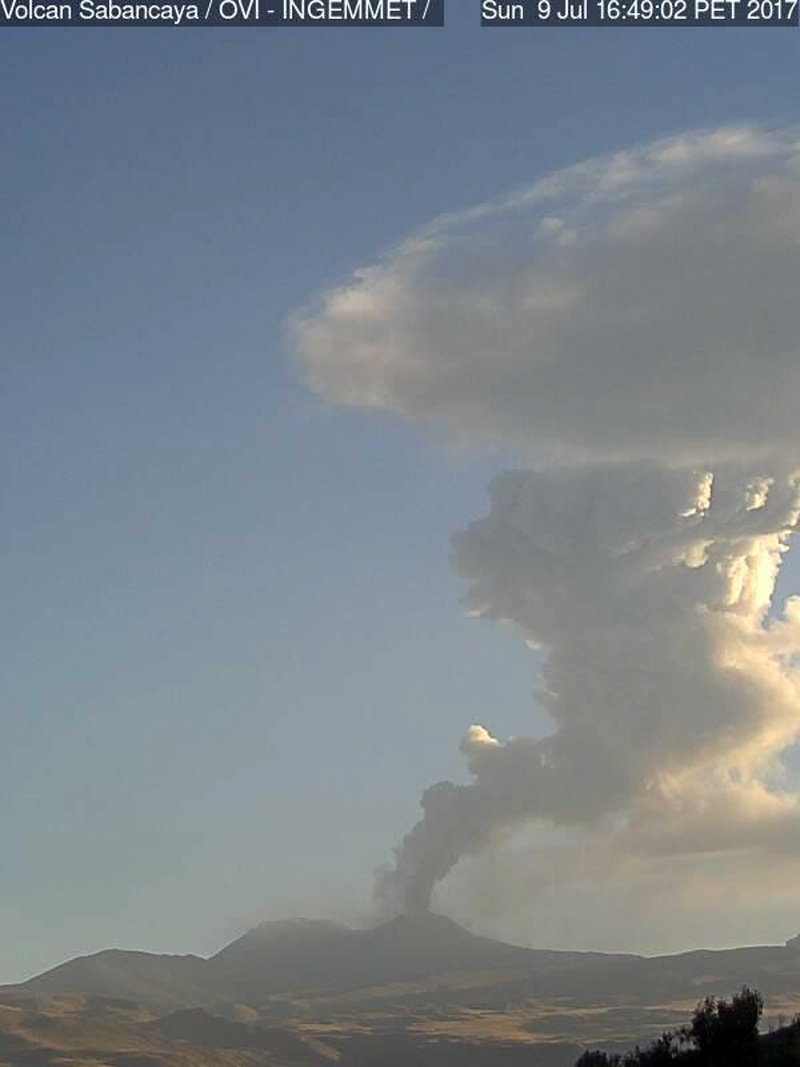 |
Figure 43. Ash and gas emission from Sabancaya rose several kilometers above the summit on 9 July 2017 in this OVI-INGEMMET image from their webcam located near Coporaque, about 30 km NE. Courtesy of OVI-INGEMMET (Reporte Semanal de Monitoreo de la Actividad del Volcan Sabancaya, Semana del 03 al 09 de julio de 2017). |
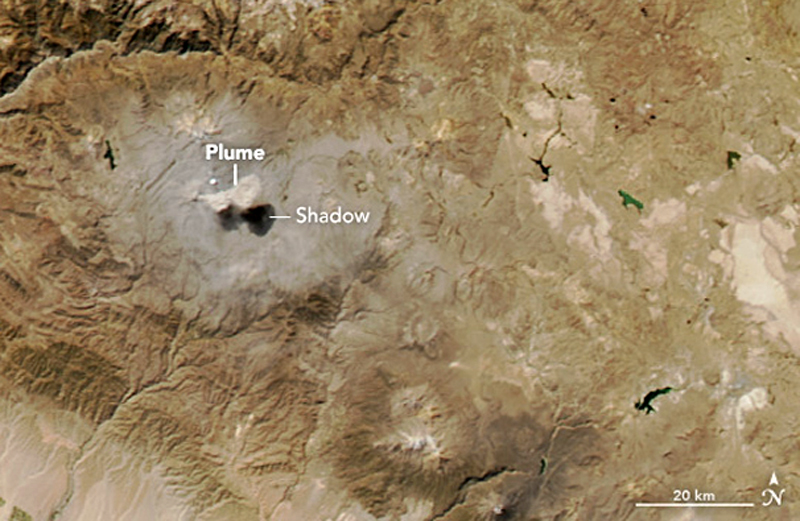 |
Figure 44. On 26 July 2017, the Moderate Resolution Imaging Spectroradiometer (MODIS) on NASA's Aqua satellite captured this natural-color image of an ash plume drifting E from Sabancaya. The rising ash cast a shadow on the ground below. Courtesy of NASA Earth Observatory. |
After averaging 65 explosions per day during the first week of August 2017, activity declined slightly to weekly averages of 41-46 explosions per day for the rest of the month. Plume heights ranged from 3,200 to 4,200 m and drifted generally 30-50 km NW or SE. During September 2017 activity was much the same. Plume heights ranged from 2,500-3,500 m, and drifted 30-40 km SE or NE. The weekly averages of daily explosion frequency varied between 29 and 45 events.
A noteworthy difference in activity occurred during October 2017, when there were tremors with ash emissions lasting for more than three hours per day during the last two weeks of the month. Daily explosion frequency averaged from 41 to 47 each week, and plume heights ranged from 3,100 to 3,900 m (figure 45). A few plumes drifted as far as 60 km during the third week of the month.
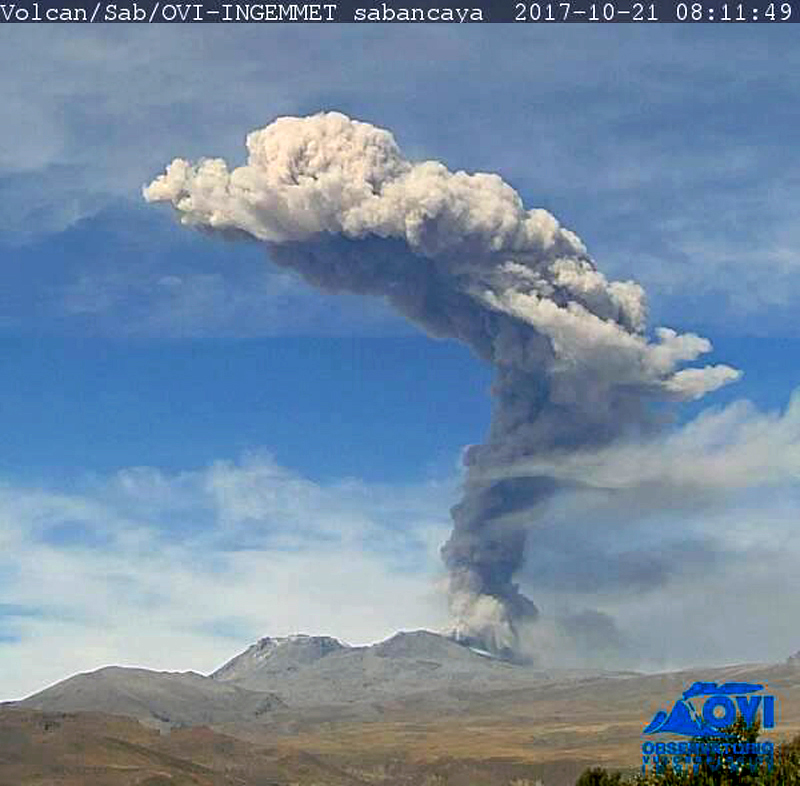 |
Figure 45. A large ash and gas plume rose from Sabancaya on 21 October 2017 in this view from the OVI-INGEMMET webcam located near Coporaque, about 30 km NE. Courtesy of OVI-INGEMMET (Reporte Semanal de Monitoreo de la Actividad del Volcan Sabancaya, Semana del 16 al 22 de octubre de 2017). |
During November 2017 the number of daily explosions increased from an average of 57 the first week to 82 by the third week, decreasing to 69 at the end of the month. Plume heights remained at 3,300-4,200 m, drifting 40-50 km in several directions. Tremors with ash emissions lasted 1-2 hours most days.
Information Contacts: Observatorio Volcanologico del INGEMMET, (Instituto Geológical Minero y Metalúrgico), Barrio Magisterial Nro. 2 B-16 Umacollo - Yanahuara Arequipa (URL: http://ovi.ingemmet.gob.pe); Instituto Geofisico del Peru, Observatoria Vulcanologico del Sur (IGP-OVS), Arequipa Regional Office, Urb La Marina B-19, Cayma, Arequipa, Peru (URL: http://ovs.igp.gob.pe/); NASA Earth Observatory, EOS Project Science Office, NASA Goddard Space Flight Center, Goddard, Maryland, USA (URL: http://earthobservatory.nasa.gov/); MIROVA (Middle InfraRed Observation of Volcanic Activity), a collaborative project between the Universities of Turin and Florence (Italy) supported by the Centre for Volcanic Risk of the Italian Civil Protection Department (URL: http://www.mirovaweb.it/); Hawai'i Institute of Geophysics and Planetology (HIGP), MODVOLC Thermal Alerts System, School of Ocean and Earth Science and Technology (SOEST), Univ. of Hawai'i, 2525 Correa Road, Honolulu, HI 96822, USA (URL: http://modis.higp.hawaii.edu/); NASA Goddard Space Flight Center (NASA/GSFC), Global Sulfur Dioxide Monitoring Page, Atmospheric Chemistry and Dynamics Laboratory, Goddard, Maryland, USA (URL: https://so2.gsfc.nasa.gov/); Martin Rietze (URL: http://www.mrietze.com/).
Strong, sporadic explosions with ash plumes throughout December 2017-May 2018
Although tephrochronology has dated activity at Sabancaya back several thousand years, renewed activity that began in 1986 was the first recorded in over 200 years. Intermittent activity since then has produced significant ashfall deposits, seismic unrest, and fumarolic emissions. A renewed period of explosive activity began in early November 2016 and continued through 2017. It was characterized by continuing pulses of ash emissions with plume heights exceeding 10 km altitude, thermal anomalies, and numerous significant SO2 plumes (BGVN 42:12). Details of the continuing eruptive activity from December 2017 to May 2018 in this report come from the two Peruvian observatories that monitor the volcano: Instituto Geofisico del Peru - Observatoria Vulcanologico del Sur (IGP-OVS), and Observatorio Volcanologico del INGEMMET (Instituto Geológical Minero y Metalúrgico) (OVI-INGEMMET). Aviation notices come from the Buenos Aires Volcanic Ash Advisory Center (VAAC), and satellite data is reported from several sources.
Sabancaya continued with its explosive eruption that began on 6 November 2016 during December 2017-May 2018. Around 100 aviation notices were issued each month by the Buenos Aires VAAC; tens of daily explosions were reported, fluctuating from highs in the 60s per day in December 2017 to lows in the teens per day during February-April 2018. Ash plumes heights varied at 3-5 km above the summit; altitudes mentioned in the VAAC reports were between 7.3 and 8.5 km altitude most days, although plume heights over 9.1 km were observed a number of times. MIROVA thermal anomalies were recorded every week; MODVOLC thermal alerts occurred every month. A significant number of SO2 anomalies greater than two Dobson Units were measured by NASA's Goddard Space Flight Center each month (table 2).
Table 2. Eruptive Activity at Sabancaya, December 2017-May 2018. Compiled using data from IGP-OVS, OVI-INGEMMET, Buenos Aires VAAC, HIGP - MODVOLC Thermal Alerts System, and NASA Goddard Space Flight Center.
| Month | VAAC Reports | Avg Daily Explosions by week | Max Plume Heights (m above crater) | Plume Drift | MODVOLC Alerts | Min Days with SO2 over 2 DU |
| Dec 2017 | 120 | 69, 63, 55, 67, 42 | 2,500-3,300 | 40-50 km, SW, NE, NW, W, N | 2 | 7 |
| Jan 2018 | 101 | 41, 57, 57, 33 | 2,500-3,300 | 50 km, SW, W, NW, N | 2 | 13 |
| Feb 2018 | 94 | 22, 18, 19, 17 | 2,500-4,500 | 30-50 km, SE, S, SW, NW | 1 | 12 |
| Mar 2018 | 115 | 12, 10, 17, 17, 18 | 2,000-5,350 | 30-50 km, S, SW, W, NW, N | 3 | 13 |
| Apr 2018 | 114 | 15, 15, 19, 22 | 2,000-3,200 | 30-40 km, All | 3 | 12 |
| May 2018 | 132 | 25, 27, 30, 35, 28 | 1,900-4,300 | 30-40 km, NW, N, NE, E, SE, S | 4 | 7 |
Activity during December 2017-February 2018. The Buenos Aires VAAC issued 120 aviation alerts during December 2017; webcam and satellite imagery revealed continuous emissions of water vapor and gas, accompanied by sporadic puffs of ash, throughout the month. When visible in satellite imagery, plumes rose to 7.3-8.2 km altitude (figure 46); a few plumes were reported to 9.1 km altitude. According to OVI-INGEMMET, about 1,800 explosions took place in December. During the third week, ashfall was reported in Huambo (28 km WNW). There were two MODVOLC thermal alerts issued, on 3 and 10 December.
 |
Figure 46. Webcam photo of an ash plume at Sabancaya on 16 December 2017. The Buenos Aires VAAC reported a plume that day to 8.2 km altitude. Courtesy of OVI-INGEMMET (RSSAB-51-2017/OVI-INGEMMET & IGP Semana del 11 al 17 de diciembre de 2017). |
The number of explosions reported by OVI-INGEMMET dropped slightly to about 1,400 during January 2018. The number of VAAC reports was similar to December; when weather clouds prevented observations of emissions, seismic activity showed intermittent peaks that suggested puffs of ash. Plume descriptions by the Buenos Aires VAAC ranged from intermittent plumes that rose to 7.0-7.6 km altitude early in the month to persistent puffs of ash that rose to 7.9-8.2 km altitude during the last two weeks of January. The prevailing winds were directed SW and NW, and ash plumes often drifted as far as 50 km. NASA Goddard Space Flight Center recorded at least 13 days with SO2 emissions greater than two Dobson Units (DU) (figure 47). HIGP issued two MODVOLC thermal alerts on 4 and 20 January.
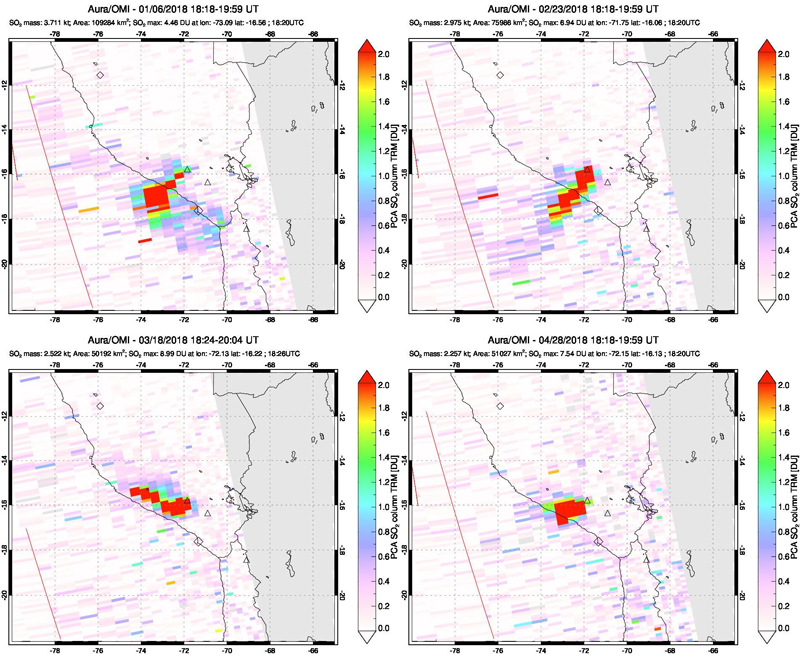 |
Figure 47. SO2 emissions at Sabancaya were significant throughout the report period. Most months, NASA-GSFC measured 10 or more days where the Dobson Unit (DU) values exceeded two. Dobson Units are a measure of the molecular density of SO2 in the atmosphere. The larger plumes shown here are from 6 January 2018 (top left), 23 February 2018 (top right), 18 March 2018 (bottom left), and 28 April 2018 (bottom right). Courtesy of NASA Goddard Space Flight Center. |
OVI-INGEMMET reported ash plume heights during February 2018 at 2,500-4,500 m above the summit. They also noted that deflation was measured during the middle two weeks of the month. The number of daily explosions decreased significantly from the previous few months, with about 500 total explosions recorded in February. The Buenos Aires VAAC noted that the webcam showed continuous emissions of gases with sporadic puffs of ash every day that the summit was visible. Ash plumes were only visible in satellite imagery a few times during the month; during 8-10 February, intermittent emissions were seen moving SE between 7.9 and 8.5 km altitude. During 17-24 February, weak, thin ash plumes drifted several different directions at 7.3-7.9 km altitude (figure 48), and on 28 February a plume was visible drifting NW at 7.6 km altitude. Only a single MODVOLC thermal alert was issued on 18 February.
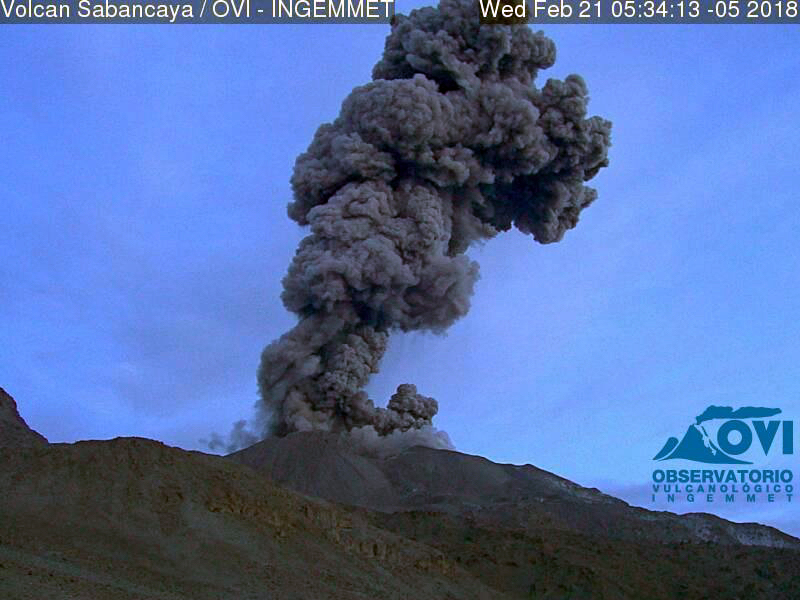 |
Figure 48. A strong pulse of ash rose from the summit of Sabancaya early in the morning of 21 February 2018. Courtesy of OVI-INGEMMET (RSSAB-08-2018/OVI-INGEMMET & IGP Semana del 19 al 25 de febrero de 2018). |
Activity during March-May 2018. Three MODVOLC thermal alerts were issued in March 2018, two on 14 March and one on 27 March. Sporadic ash explosions continued, but with the lowest number per day of the reporting period. About 450 explosions were recorded during March. In spite of the smaller number of explosions, some of the tallest ash plumes of the period occurred this month. The Buenos Aires VAAC reported a diffuse ash plume drifting NW in satellite imagery on 2 March at 8.8 km altitude. The following week, several ash plumes were spotted in satellite imagery at altitudes of 7.3-8.2 km drifting either SW or NW. On 11 March, cloudy weather prevented visual satellite imagery observations, but multispectral imagery and the webcam revealed intermittent pulses of ash moving SW at 7.6 km altitude. The following day sporadic strong pulses of ash were observed in the webcam, and there was a pilot report of an ash plume at 9.1 km altitude. During the second half of March, ash plumes were noted in satellite imagery most days at altitudes of 6.4-8.2 km; a few pulses produced short-lived ash plumes that rose over 9.1 km, including on 14, 22, 24, and during 27-30 March (figure 49). The highest plume was observed in visible imagery drifting E on 28 March at 10.1 km altitude. A lahar was also reported on 28 March descending the SE flank, towards the Sallalli River; no damage was reported.
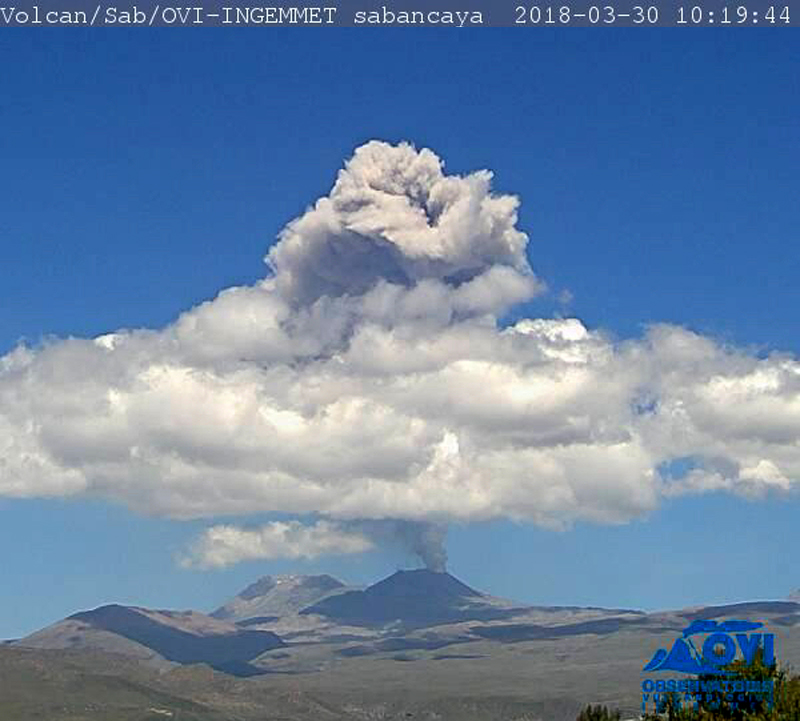 |
Figure 49. An ash plume at Sabancaya on 30 March 2018 can be seen rising from the summit and above the meteorological cloud in this webcam image. The Buenos Aires VAAC reported ash plumes on 30 March that rose to 9.1 and 9.5 km and drifted NE. Courtesy of OVI-INGEMMET (RSSAB-13-2018/OVI-INGEMMET & IGP Semana del 26 de marzo al 01 de abril de 2018). |
The number of explosions during April 2018 increased slightly from March to about 540. The maximum plume heights ranged from 2,000 to 3,200 m above the summit according to OVI-INGEMMET. The webcam showed continuous emissions of water vapor and gas and sporadic pulses of ash throughout the month. Ashfall was reported during the first week in Achoma (23 km NE), Chivay (33 km NE), and Huanca. During the second week, the prevailing winds brought ashfall to the W and NW to Huambo (28 km W) and Cabanaconde (22 km NW). The Buenos Aires VAAC reported faint ash plumes visible in satellite imagery nearly every day; plume heights consistently ranged from 7.0 to 8.2 km altitude. Three MODVOLC thermal alerts were issued during the month, one on 13 April and two on 17 April.
Activity increased in many ways during May 2018. The Buenos Aires VAAC issued 132 aviation alerts, the most of any month during the period. The numbers of daily explosions increased compared to April, resulting in a monthly total of around 900. OVI-INGEMMET reported plume heights up to 4,300 m above the summit. MODVOLC thermal alerts were issued on 8, 19, 24, and 26 May. In addition to ash plumes visible in satellite imagery every day at altitudes of 7.3-8.2 km altitude (figure 50), a significant number of ash plumes were reported to altitudes greater than 9.1 km during the month, resulting in more VONA's (Volcanic Observatory Notice to Aviation) issued than in previous months. Sporadic strong puffs of ash were observed in the webcam on the days that satellite imagery measurements of ash plume heights exceeded 9.1 km including on 4, 5, 10, 14, 19, 21, 22, 25, 28, and 31 May. The highest plumes reached 10.4 km altitude on 19 May and 10.1 km altitude on 25 May. Hotspots were also reported on 20, 24, and 27 May. As in previous months, the webcam showed constant emissions of steam and gas, with intermittent pulses of volcanic ash throughout the month.
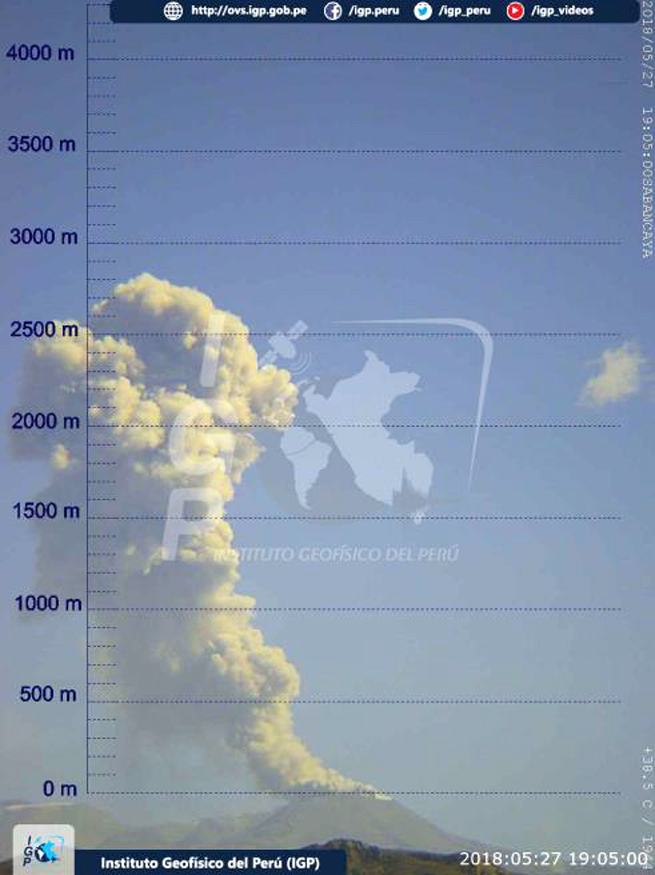 |
Figure 50. An IGP webcam at Sabancaya recorded the plume height above the summit at 2,800 m on 27 May 2018. Courtesy of OVI-INGEMMET (RSSAB-22-2018/OVI-INGEMMET & IGP Semana del 28 de mayo al 3 de junio del 2018). |
Information Contacts: Observatorio Volcanologico del INGEMMET, (Instituto Geológical Minero y Metalúrgico), Barrio Magisterial Nro. 2 B-16 Umacollo - Yanahuara Arequipa, Peru (URL: http://ovi.ingemmet.gob.pe); Instituto Geofisico del Peru, Observatoria Vulcanologico del Sur (IGP-OVS), Arequipa Regional Office, Urb La Marina B-19, Cayma, Arequipa, Peru (URL: http://ovs.igp.gob.pe/); Buenos Aires Volcanic Ash Advisory Center (VAAC), Servicio Meteorológico Nacional-Fuerza Aérea Argentina, 25 de mayo 658, Buenos Aires, Argentina (URL: http://www.smn.gov.ar/vaac/buenosaires/inicio.php); Hawai'i Institute of Geophysics and Planetology (HIGP) - MODVOLC Thermal Alerts System, School of Ocean and Earth Science and Technology (SOEST), Univ. of Hawai'i, 2525 Correa Road, Honolulu, HI 96822, USA (URL: http://modis.higp.hawaii.edu/); NASA Goddard Space Flight Center (NASA/GSFC), Global Sulfur Dioxide Monitoring Page, Atmospheric Chemistry and Dynamics Laboratory, 8800 Greenbelt Road, Goddard, Maryland, USA (URL: https://so2.gsfc.nasa.gov/).
Frequent ash plumes continued during June-November 2018
Sabancaya has been continuously active in recent years after renewed unrest began in February 2013 following almost 10 years of quiescence. After an increase in seismicity and an increase in the volume and frequency of fumarole emissions, the first explosion of the current eruption occurred in November 2016. Since then, activity has largely consisted of ash plumes and fumarolic activity.
This report summarizes activity during June-November 2018 (table 3) and is based on reports by the Observatorio Vulcanológico division of El Instituto Geológico, Minero y Metalúrgico (OVI-INGEMMET) and Instituto Geofísico del Perú (IGP), and satellite data. During this time the average daily number of explosions was 22, and ranged from 13 to 30. Maximum ash plume heights varied between 1.3 to 4.5 km above the crater, with the maximum plume heights each month usually between 2.5 and 3.7 km. SO2 emissions were variable and reached a maximum of 14,859 tons per day and the drift directions were wind dependent (figure 51).
Table 3. Summary of eruptive activity at Sabancaya during June-November 2018 based on OVI-INGEMMET weekly reports and the HIGP MODVOLC hotspot monitoring algorithm.
| Month | Avg. Daily Explosions by week | Max Plume Heights (m above crater) | Plume Drift | MODVOLC Alerts | Max SO2 tons/day |
| Jun 2018 | 24, 19, 29, 24 | 1,300-2,500 | 20-30 km, E, S, SE | 19 | 3,000-5,600 |
| Jul 2018 | 22, 23, 25, 24 | 1,300-2,500 | 20-30 km, S, SE, E | 12 | 4,715-14,859 |
| Aug 2018 | 19, 23, 27, 25, 25 | 2,600-4,500 | 30-50 km, N, NE, S, SE | 27 | 2,230-5,000 |
| Sep 2018 | 17, 13, 16, 21 | 2,500-3,700 | 30-50 km, N, NE, S, SE, NW | 28 | 1,600-3,970 |
| Oct 2018 | 24, 17, 23, 30 | 2,500-3,500 | 30-50 km, N, NE, SE, S, SW, W | 21 | 2,200-5,027 |
| Nov 2018 | 30, 18, 20, 20, 21 | 2,500-3,700 | 30-40 km, N, E, SE, S, SW, W, NW | 35 | 2,300-4,600 |
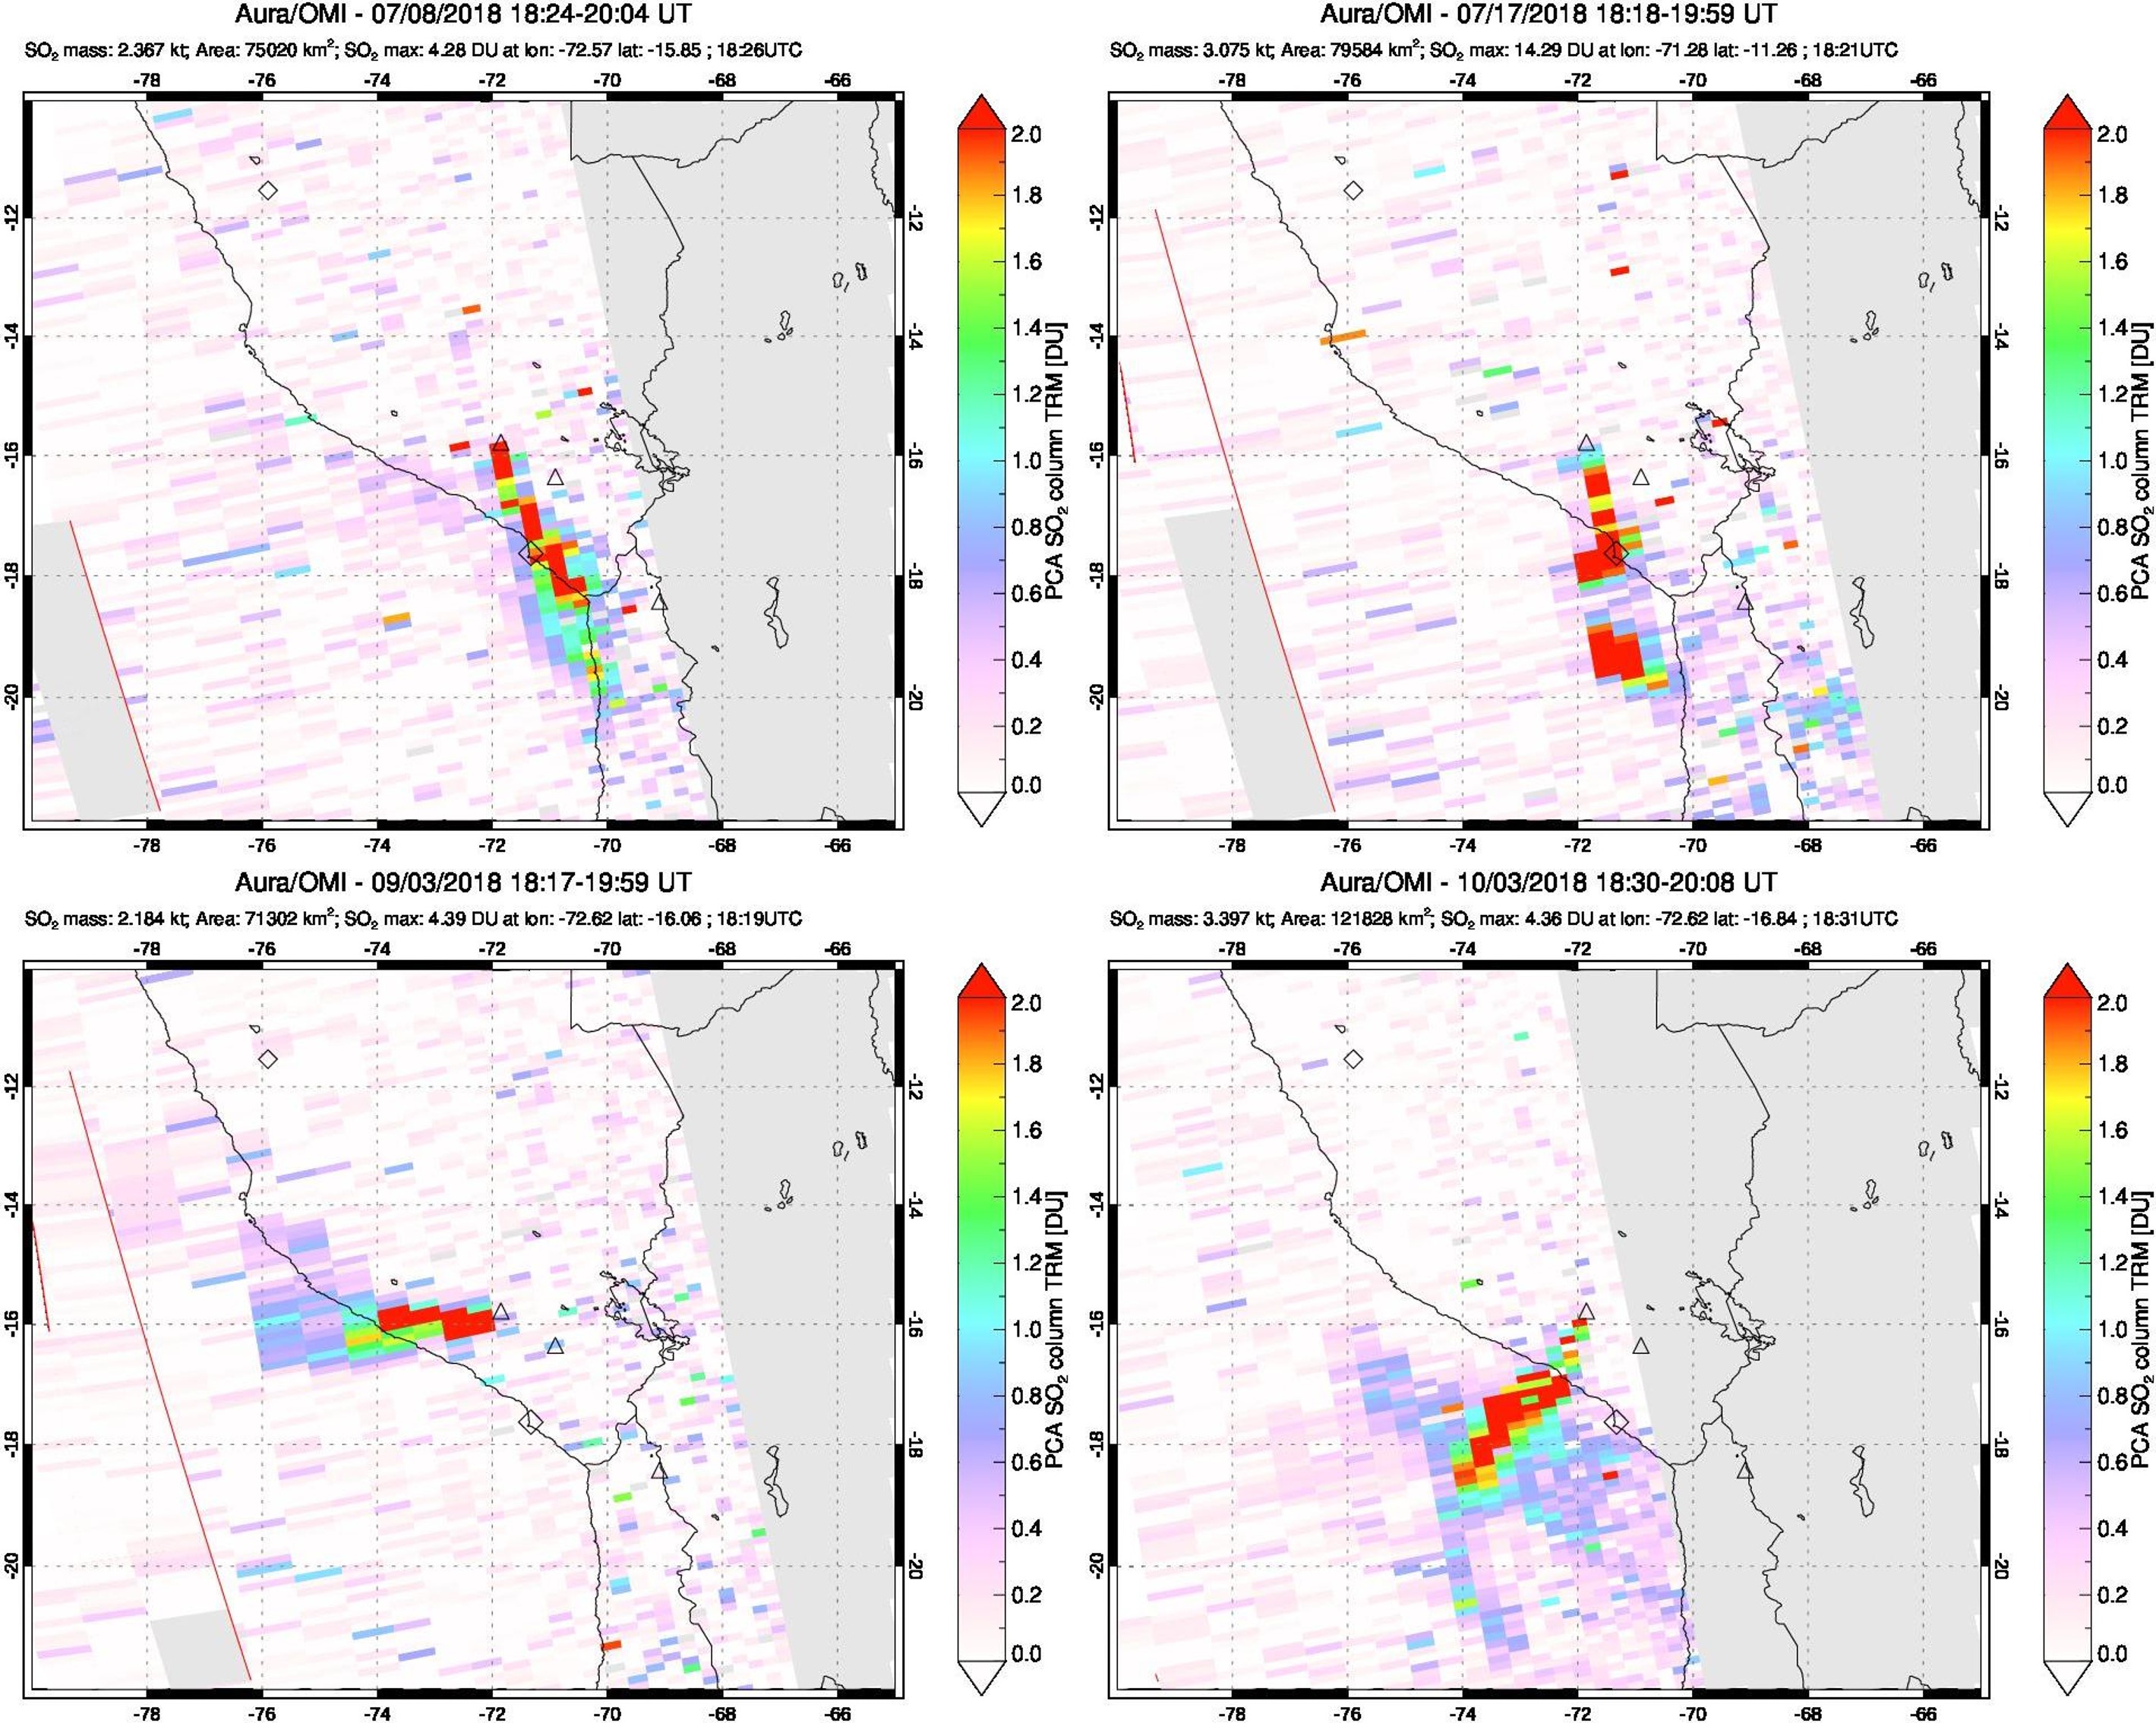 |
Figure 51. Examples of SO2 plumes from Sabancaya detected by the NASA Ozone Monitoring Instrument (OMI) in July, September, and October 2018 (dates, times, and SO2 max values are given in the header of each image). Courtesy of NASA Goddard Flight Center. |
During June, Sabancaya produced 19-29 explosions per day that ejected ash plumes up to heights of 1.3-2.5 km above the crater (figure 52). These ash plumes extended to 20-30 km away from the volcano. The maximum emissions of SO2 throughout the month ranged from 3,500 to 5,600 tons per day. There was a total of 19 MIROVA thermal anomalies.
 |
Figure 52. An IGP webcam recorded an ash plume at Sabancaya that reached 1,500 m above the crater on 21 June 2018. Courtesy of IGP via OVI-INGEMMET (RSSAB-25-2018 18-24 June 2018 report). |
Throughout July there were on average 22-25 explosions per day. Ash plumes reached heights of 1.3-2.5 km above the crater, and drifted 20-30 km to the S, SE, and E (figure 53). On 23 July, Sabancaya produced a continuous ash plume that traveled over 100 km to the SE (figure 54). SO2 emissions were higher this month, with maximum emissions reaching 14,859 tons per day. Twelve MODVOLC thermal alerts were issued.
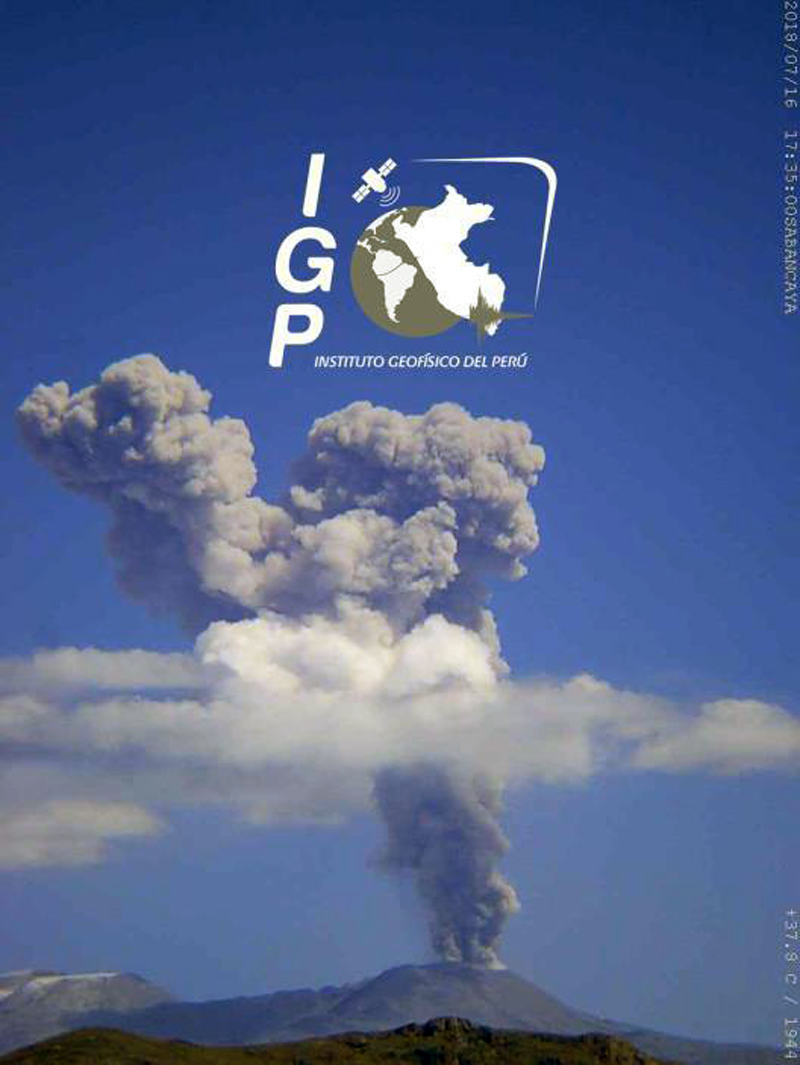 |
Figure 53. An ash plume rising through meteorological clouds at Sabancaya on 16 July 2018. Courtesy of IGP via OVI-INGEMMET (RSSAB-29-2018 16-22 July 2018 report). |
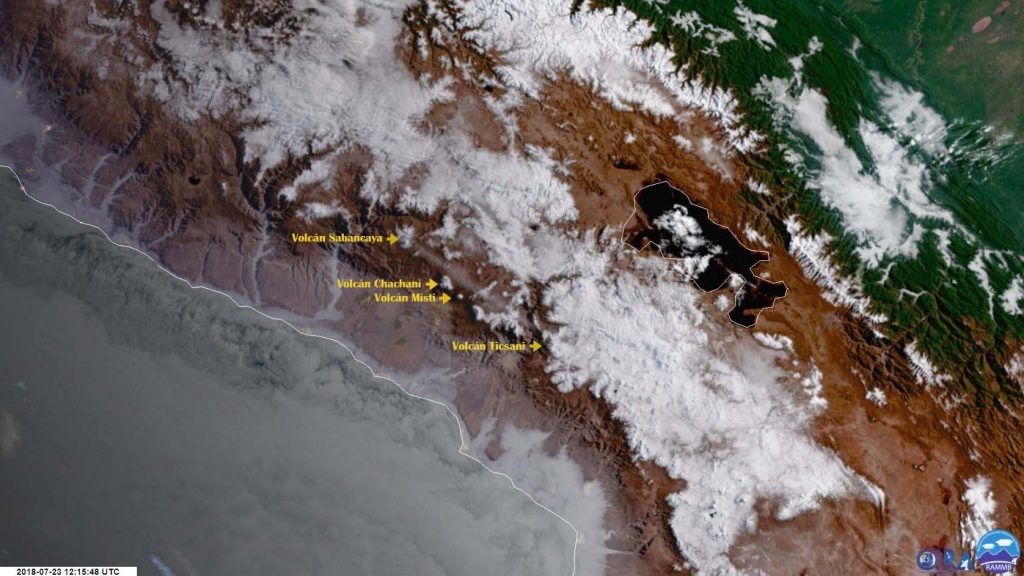 |
Figure 54. The ash plume at Sabancaya on 23 July 2018 traveled over Chachani, Misti, and Ubinas volcanoes, and the Quinistaquillas, Carumas, and Calacoa districts. Courtesy of OVI-INGEMMET (13 August 2018 report). |
There were an average of 19-27 explosions per day throughout August (figure 55). Ash plumes reached maximum heights of 2.6-4.5 km, and drifted 30-50 km away in various directions. Activity generated two ash plumes on 24 August, one to 4 km above the crater at 0800 and the other to 4.5 km at 0945 (figure 56). The ash was dispersed to the NE, N, and E for 30 km over the towns of Chivay, Yanque, Coporaque, Ichupampa, Achoma, Maca and Pinchollo. On the 25th, an explosion at 1020 produced an ash plume to over 3 km above the crater that resulted in ashfall in the towns of Achoma, Maca and Pinchollo. There were 28 MODVOLC thermal alerts throughout the month. The maximum SO2 emissions reached 2,230-5,000 tons per day.
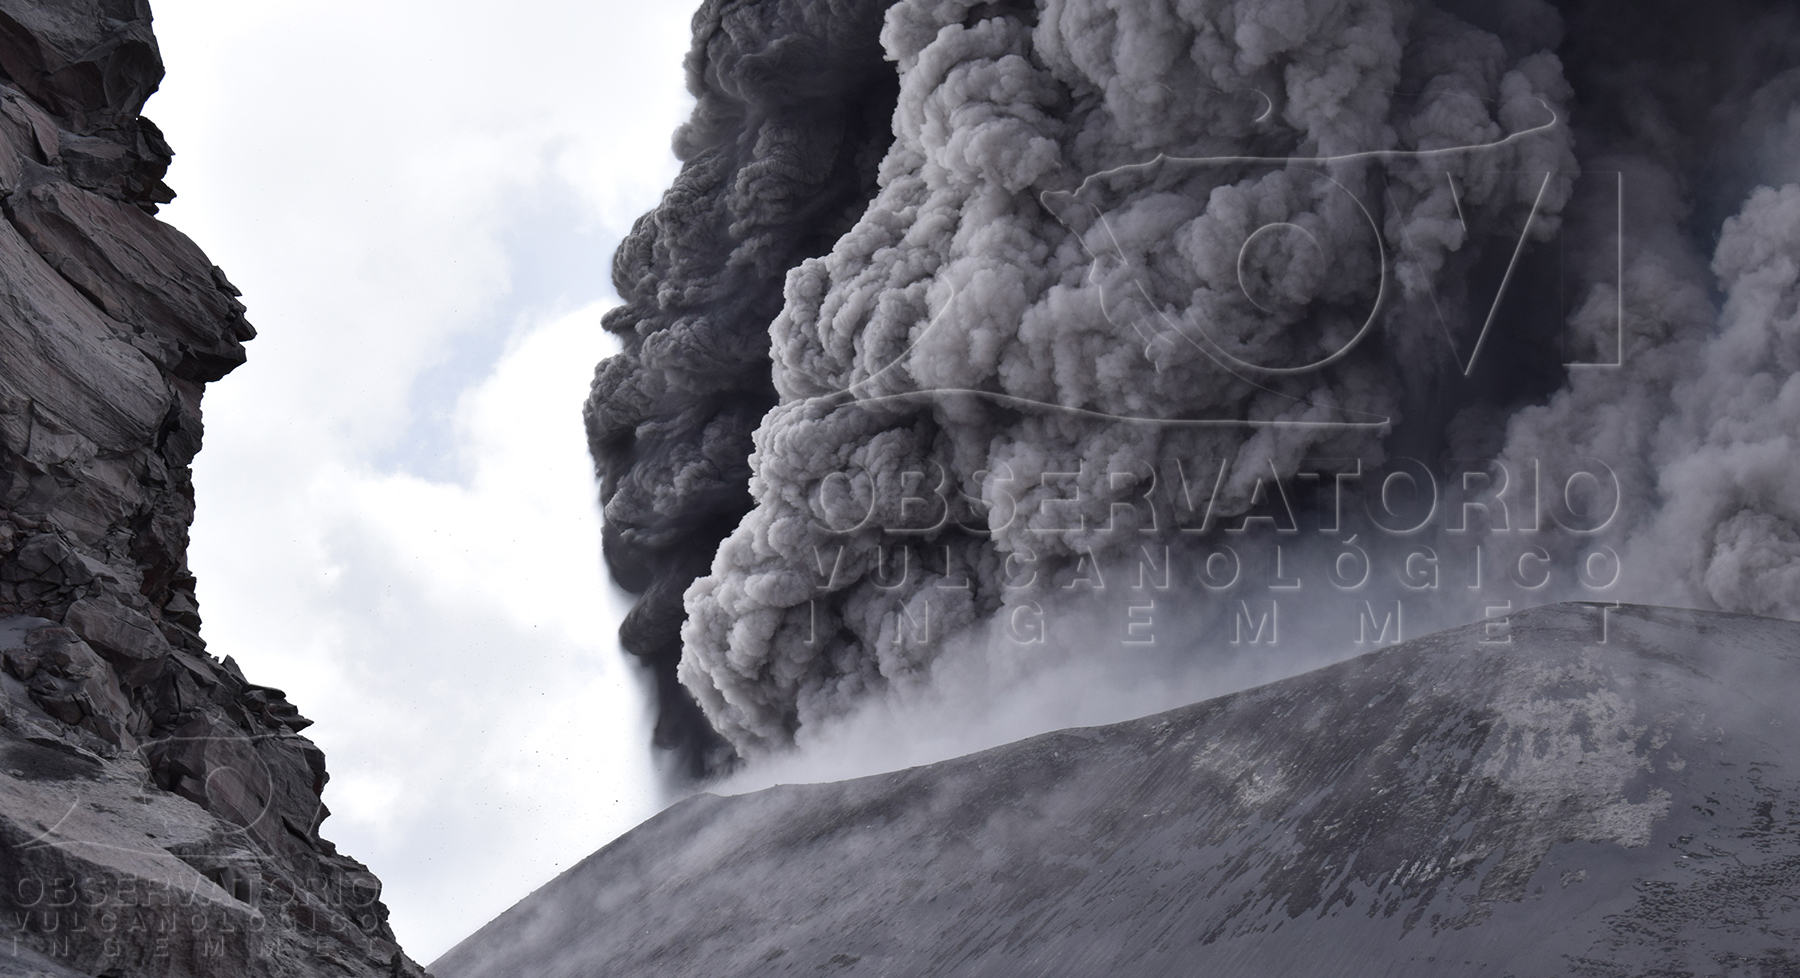 |
Figure 55. Photograph of an explosion producing an ash plume at Sabancaya in early August 2018, taken while OVI-INGEMMET installed monitoring equipment. Courtesy of OVI-INGEMMET (10 August 2018 report). |
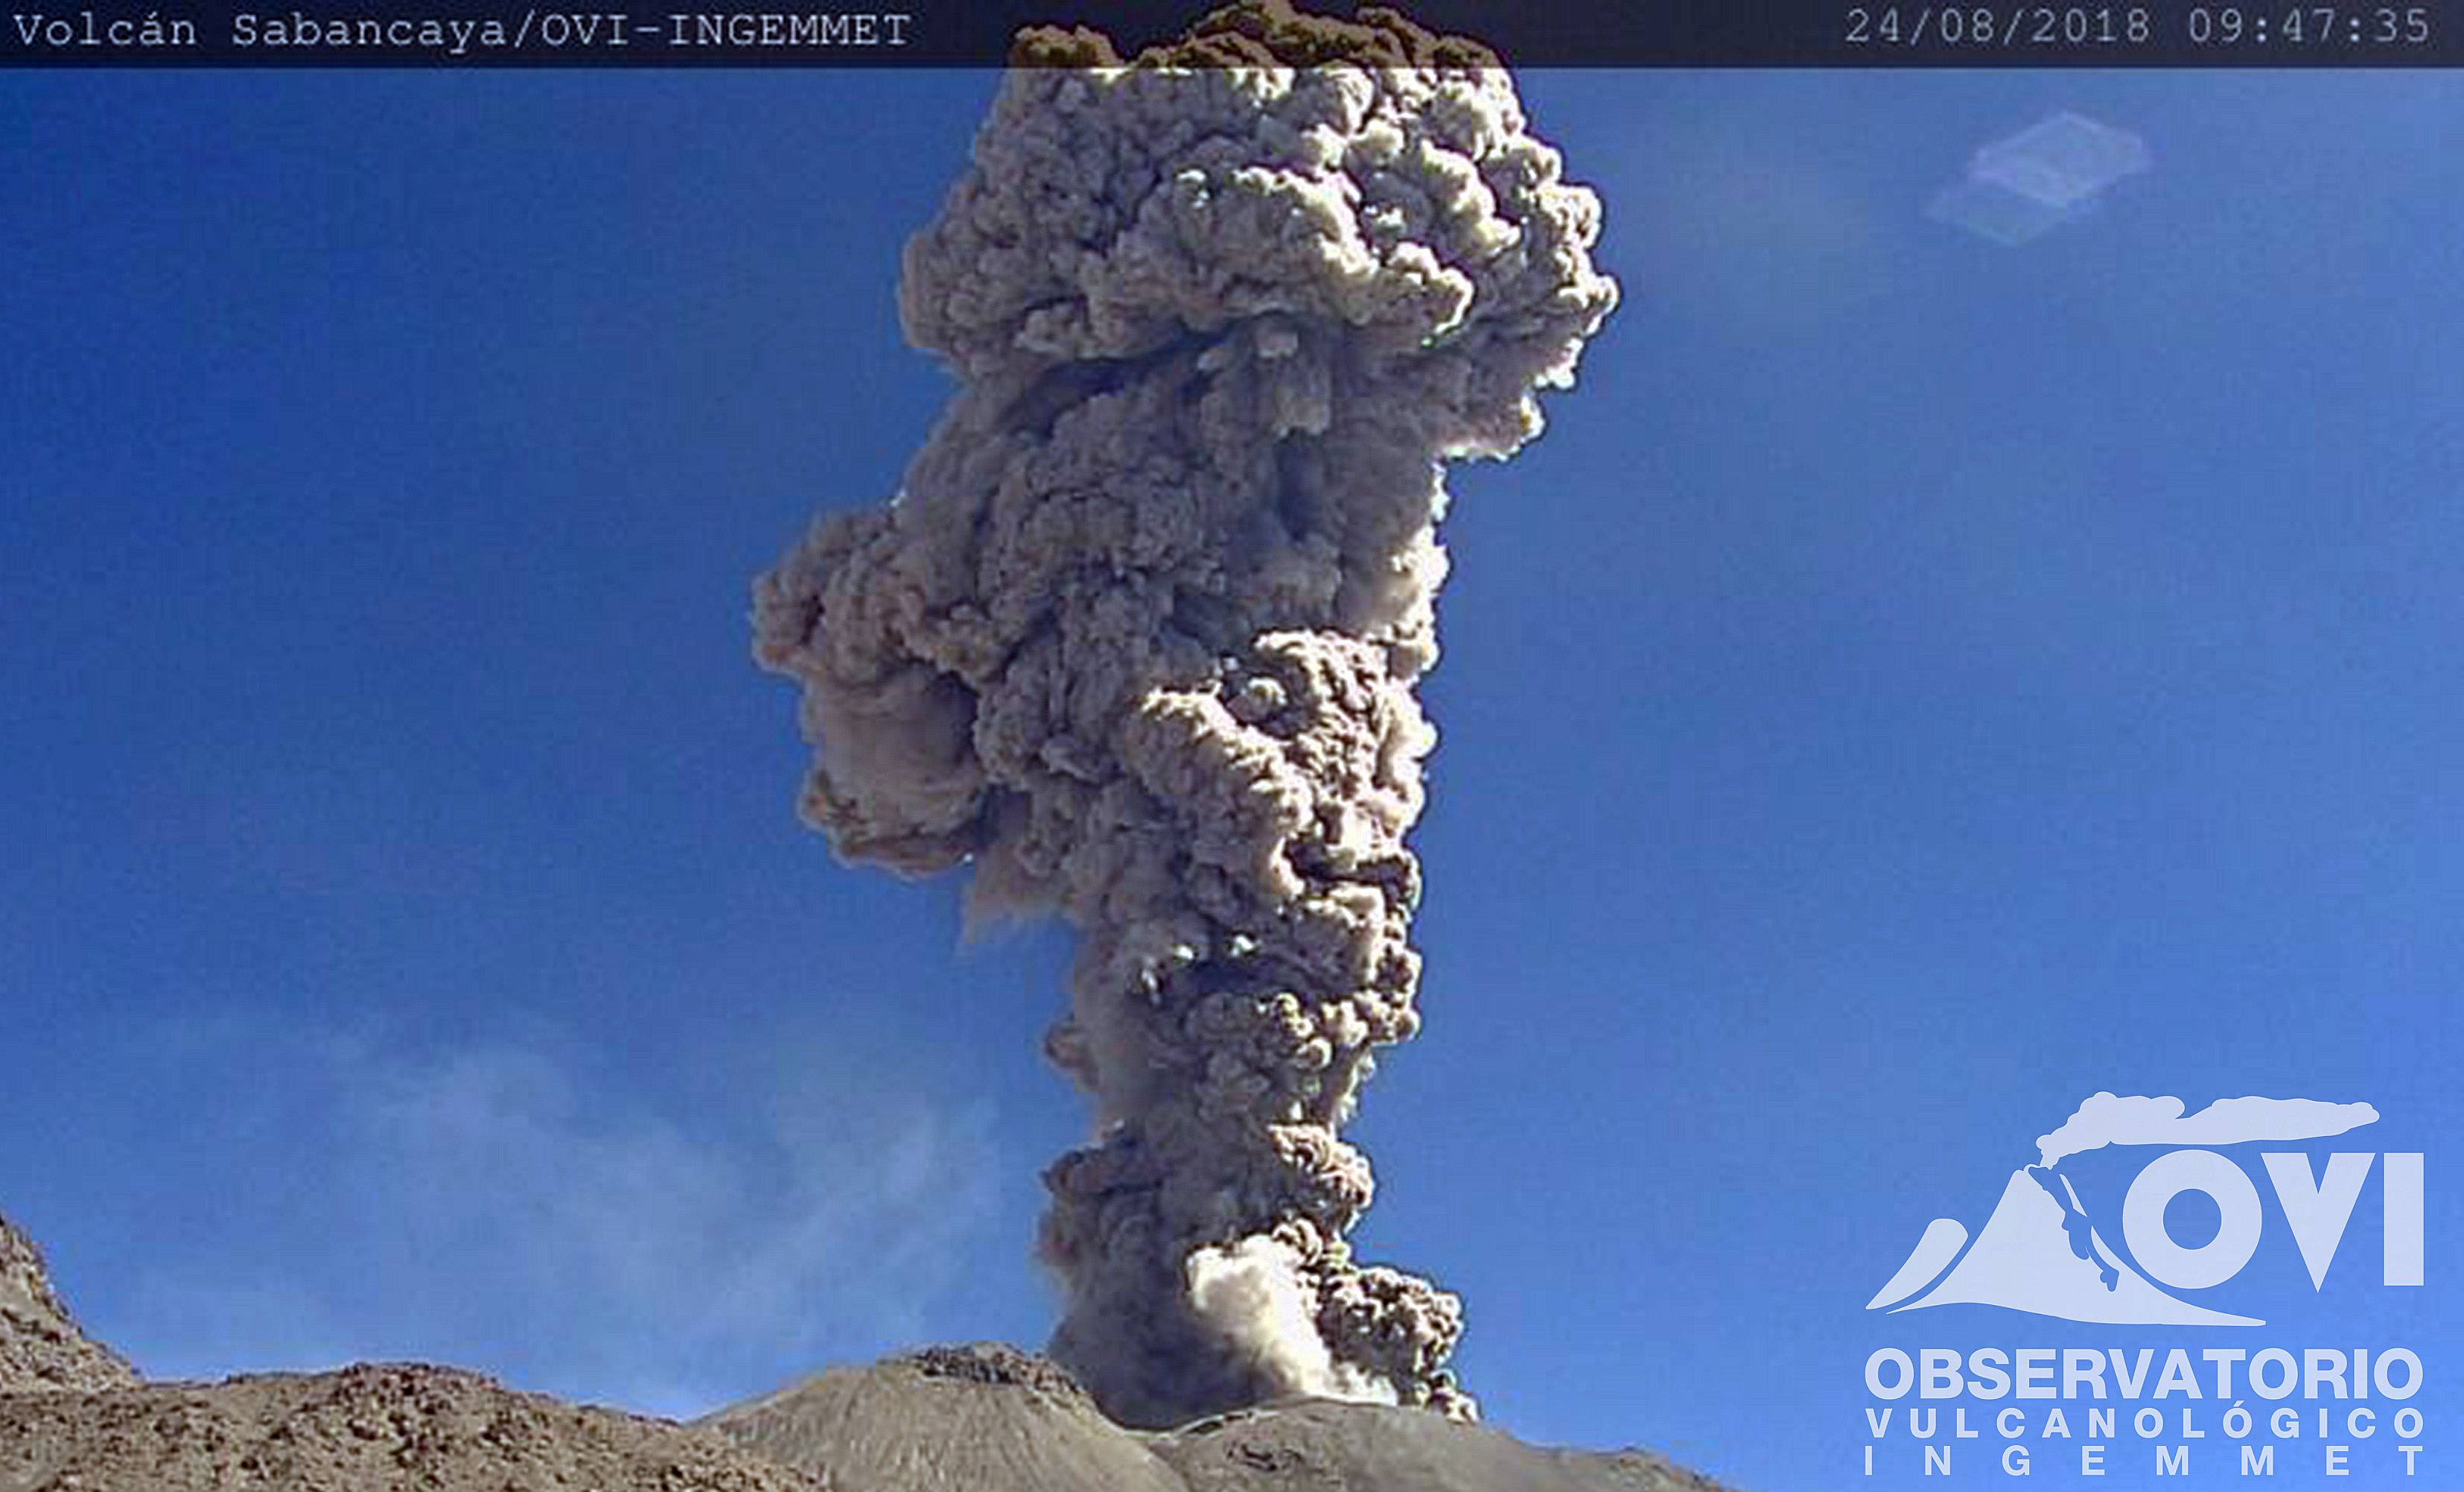 |
Figure 56. An ash plume at Sabancaya on 24 August 2018 at 0947 that reached a 4.5 km above the crater. The ash was dispersed 30 km to the NE, N, and E, and impacted the towns of Chivay, Yanque, Coporaque, Ichupampa, Achoma, Maca, and Pinchollo. Courtesy of OVI-INGEMMET (27 August 2018 report). |
There was an average of 13-21 explosions per day during September, with ash plumes reaching 2.5-3.5 km above the crater. The ash traveled 30-50 km away in different directions (figure 57). There were 28 MODVOLC thermal alerts issued throughout the month, consistent with elevated thermal activity that is visible in Sentinel-2 satellite images (figure 58). The maximum measured SO2 emissions were 1,600-3,970 tons per day. A drone overflight by the IGP and the Pontifical Catholic University of Peru (PUCP) in the third week of September gave the first view of the crater since the eruption began in 2016 (figure 59), revealing lava in the crater and at least six ash emission points.
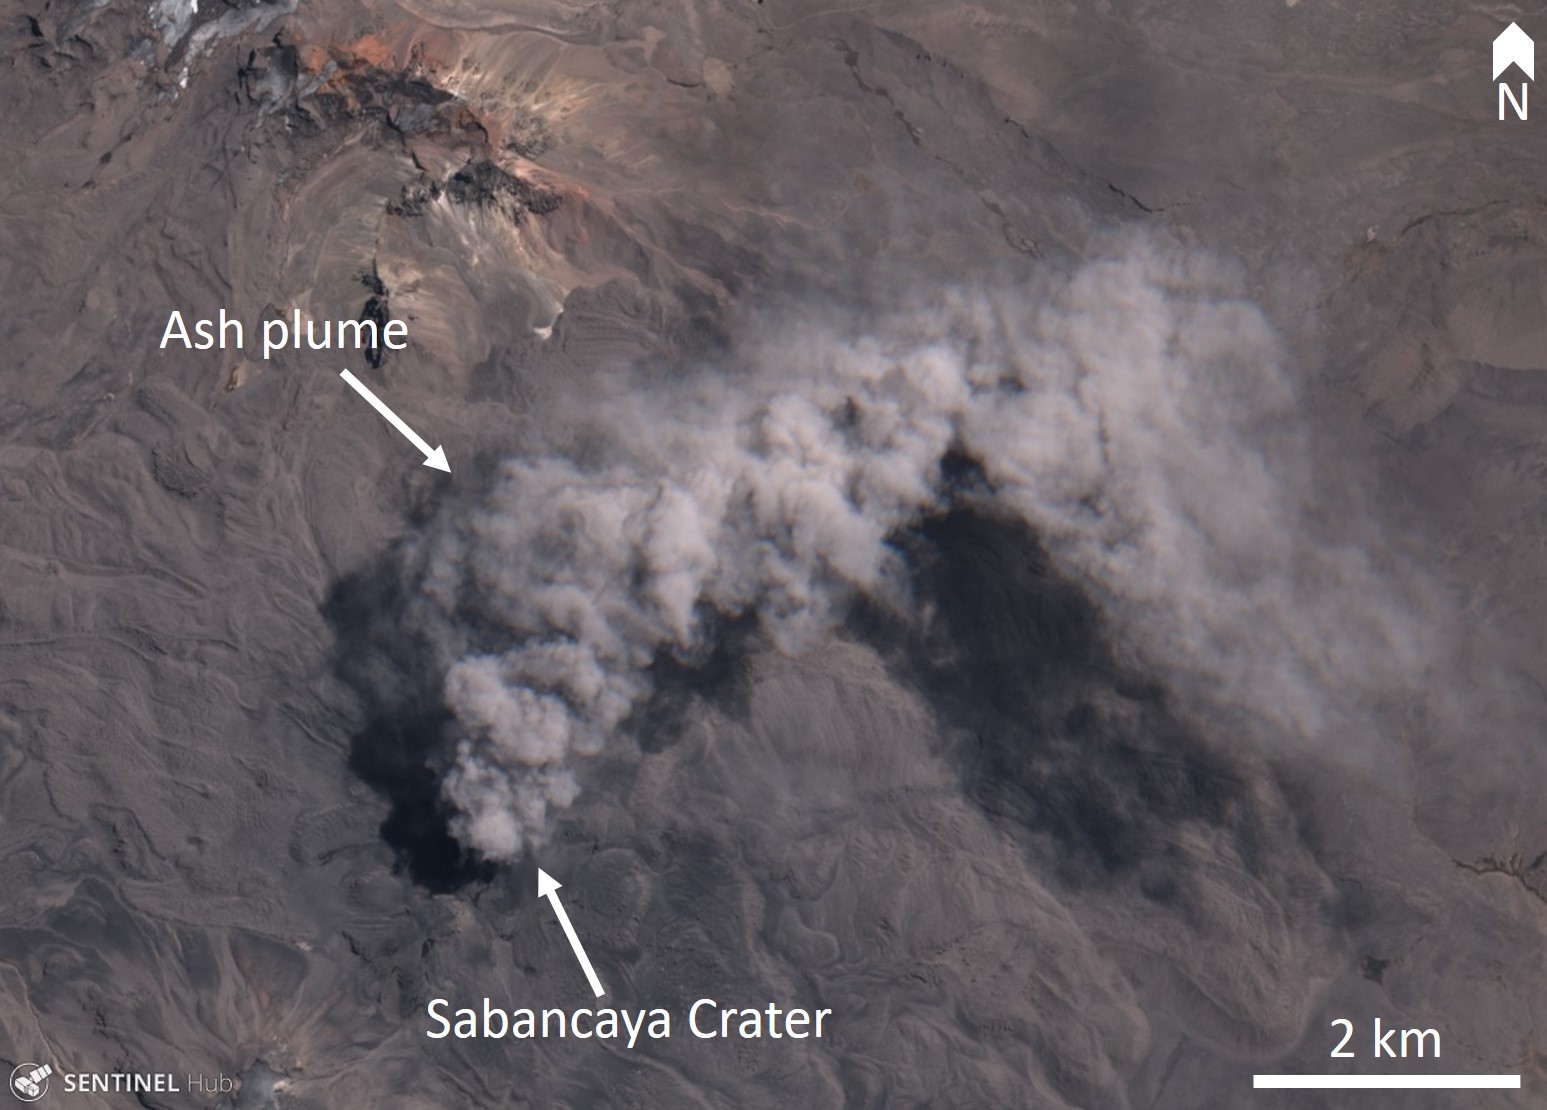 |
Figure 57. Sentinel-2 satellite image of an ash plume at Sabancaya on 17 September 2018. The ash plume was directed towards the NE, then the SE. Natural color (bands 4, 3, 2) image courtesy of Sentinel Hub Playground. |
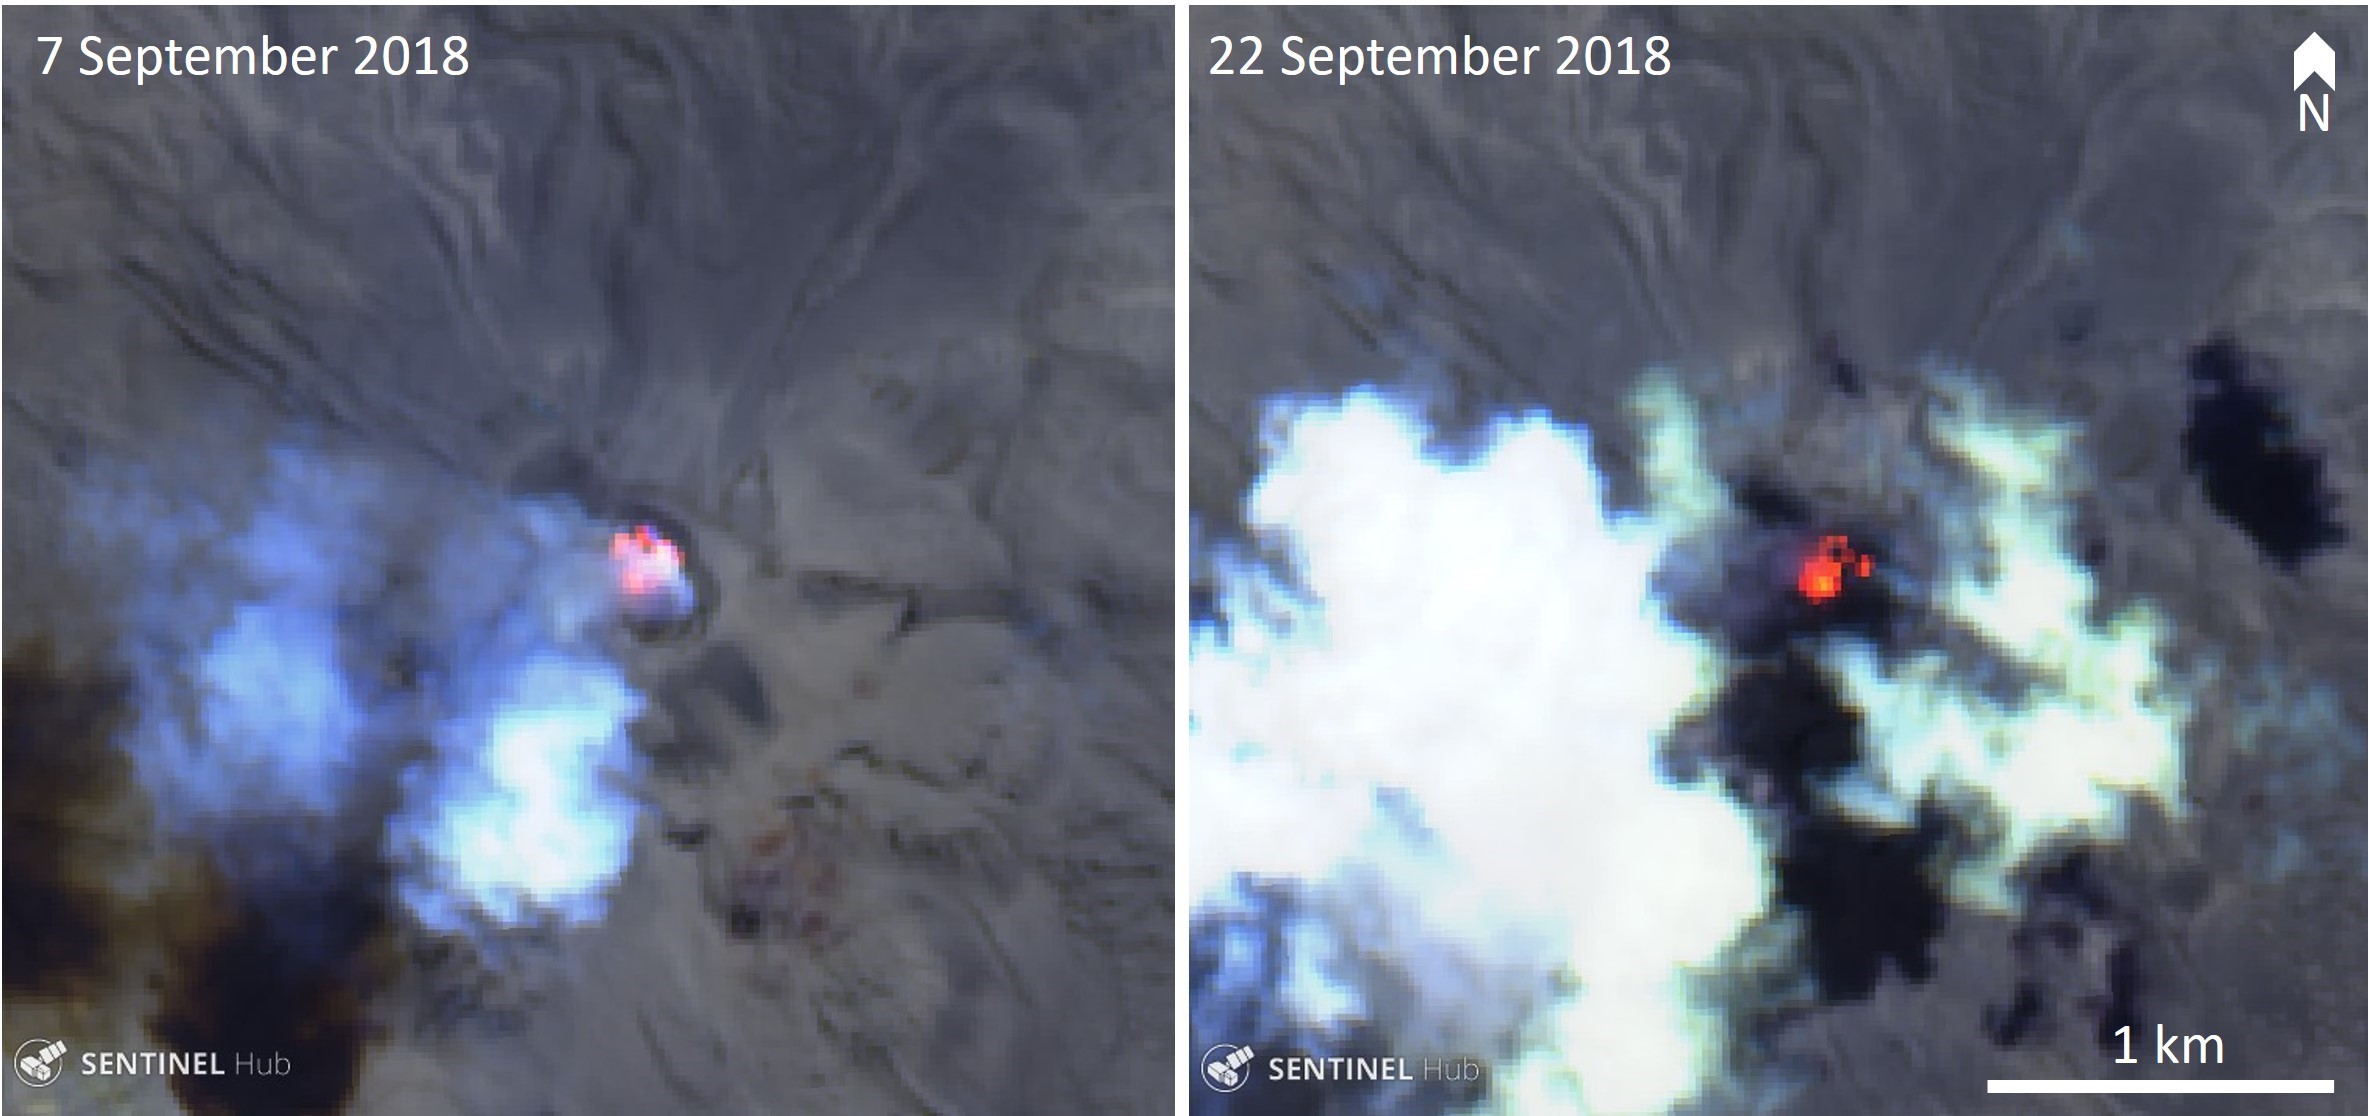 |
Figure 58. Sentinel-2 satellite images showing elevated thermal activity (bright orange-red) in the Sabancaya crater on the 7 and 22 September 2018. False color (urban) images (bands 12, 11, 4) courtesy of Sentinel Hub Playground. |
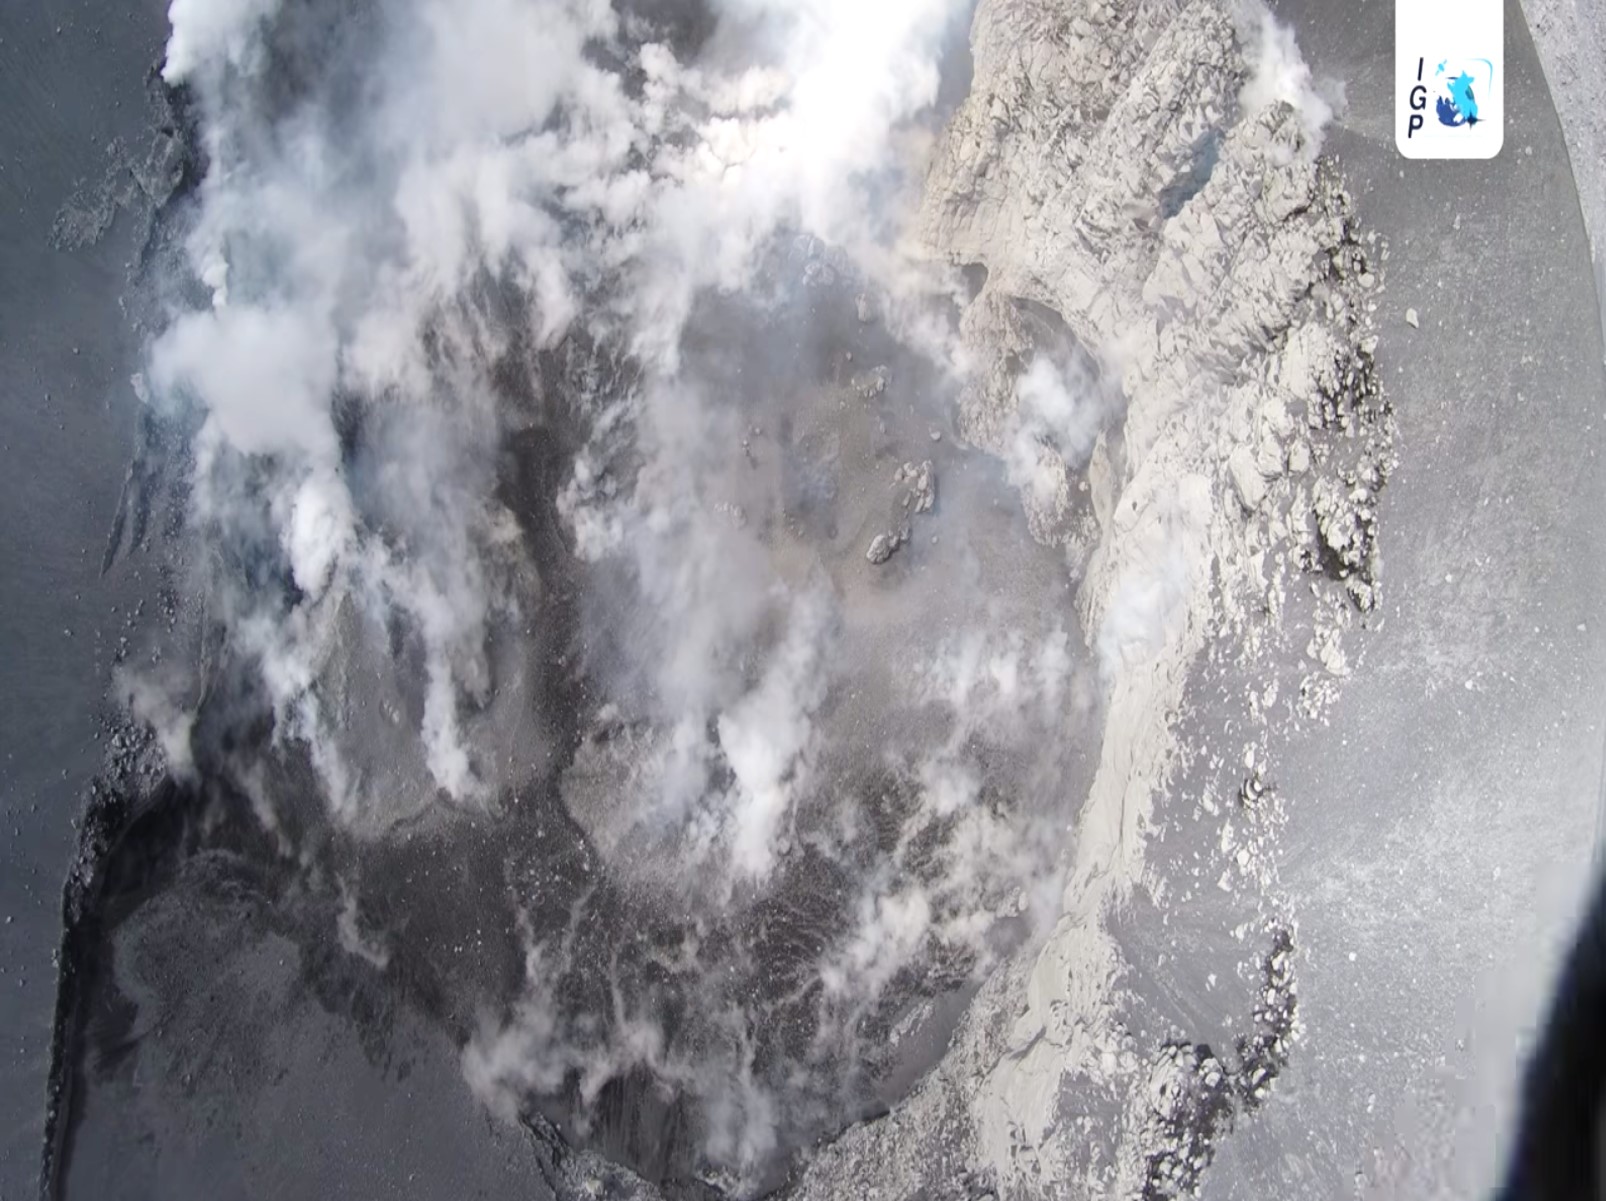 |
Figure 59. Drone video of the Sabancaya crater was taken in September 2018 showed lava on the crater floor and ash emissions from six locations. This image is a screenshot taken from video collected during the collaborative overflight by IGP and the Pontifical Catholic University of Peru. Courtesy of IGP (24 September 2018 report). |
Similar activity continued through October, with an average of 17-30 reported explosions per day. Ash plumes reached maximum heights of 2.5-3.5 km and dispersed 30-50 km in various directions (figure 60). Ashfall was reported in the Huanca area during the week of 1-7 October. Maximum SO2 emissions were 2,200-5,027 tons per day. There were 21 MODVOLC thermal alerts issued for the month.
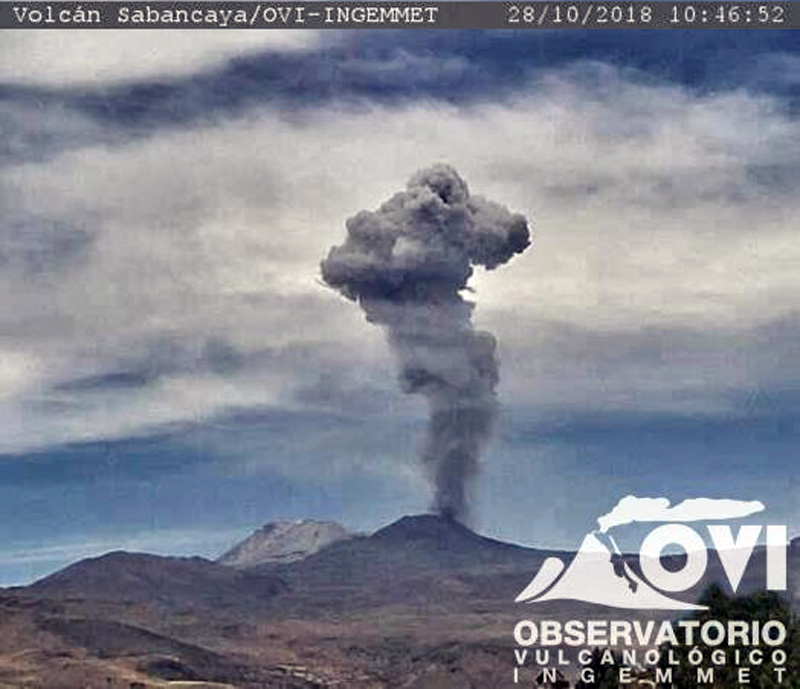 |
Figure 60. An example of an ash plume at Sabancaya on 28 October 2018. Courtesy of OVI-INGEMMET (RSSAB-43-2018 22-28 October weekly report). |
November 2018 marked two years of uninterrupted activity at Sabancaya (figure 61). Between November 2016 and November 2017 there were 14,000 registered explosions with an average of 39 per day. From November 2017 to November 2018 there were more than 9,800 explosions recorded with an average of 27 per day. During the month there was an average of 18-30 explosions per day, with ash plumes reaching maximum heights of 2.5-3.7 km above the crater and dispersing 30-40 km in all directions. This month saw the highest number of MODVOLC thermal alerts with a total of 35. The maximum detected SO2 emissions were 2,300-4,600 tons per day.
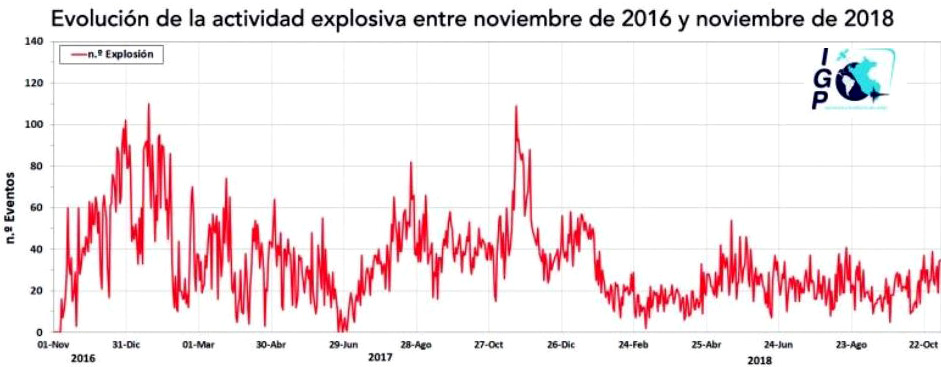 |
Figure 61. Graph showing the number of explosions per day at Sabancaya from November 2017 through to November 2018. Courtesy of IGP (6 November 2018 report). |
Information Contacts: Observatorio Volcanologico del INGEMMET, (Instituto Geológical Minero y Metalúrgico), Barrio Magisterial Nro. 2 B-16 Umacollo - Yanahuara Arequipa, Peru (URL: http://ovi.ingemmet.gob.pe; video URL: https://www.youtube.com/watch?v=CpLhruMwuxQ); Instituto Geofisico del Peru, Observatoria Vulcanologico del Sur (IGP-OVS), Arequipa Regional Office, Urb La Marina B-19, Cayma, Arequipa, Peru (URL: http://ovs.igp.gob.pe/); NASA Goddard Space Flight Center (NASA/GSFC), Global Sulfur Dioxide Monitoring Page, Atmospheric Chemistry and Dynamics Laboratory, 8800 Greenbelt Road, Goddard, Maryland, USA (URL: https://so2.gsfc.nasa.gov/); Sentinel Hub Playground (URL: https://www.sentinel-hub.com/explore/sentinel-playground).
Daily ash and SO2 plumes, persistent thermal anomalies, December 2018-May 2019
Although tephrochronology has dated activity at Sabancaya back several thousand years, renewed activity that began in 1986 was the first recorded in over 200 years. Intermittent activity since then has produced significant ashfall deposits, seismic unrest, and fumarolic emissions. A renewed period of explosive activity began in early November 2016 and has continued through 2018. It has been characterized by continuing pulses of ash emissions with some plume heights exceeding 10 km altitude, thermal anomalies, and numerous significant SO2 plumes. Ash emissions and high levels of SO2 continued each week during December 2018-May 2019, the period covered in this report. The Instituto Geofísico del Perú (IGP) reports weekly on numbers of daily explosions, ash plume heights and directions of drift, and the maximum SO2 emissions in tons per day (table 4). The Buenos Aires Volcanic Ash Advisory Center (VAAC) produced three or four daily reports of ongoing ash emissions at Sabancaya throughout the period.
Table 4. Summary of eruptive activity at Sabancaya during December 2018-May 2018 based on IGP weekly reports and the HIGP MODVOLC hotspot monitoring algorithm.
| Month | Avg. Daily Explosions by week | Max Plume Heights (m above crater) | Plume Drift | MODVOLC Alerts | Max SO2 tons/day |
| Dec 2018 | 17, 18, 19, 23 | 2,200-3,300 | 30-40 km, N, E, SE, W, SW | 6 | 2,300-3,600 |
| Jan 2019 | 27, 23, 29, 23, 28 | 1,500-3,700 | 20-30 km, SW, W, NW, S, SE, NE | 1 | 3,300 |
| Feb 2019 | 26, 23, 20, 17 | 2,200-3,000 | 20-40 km, S, SE, NW, SW | 1 | -- |
| Mar 2019 | 15, 15, 33, 43 | 1,500-3,500 | 20-40 km, NW, W, SW, NE, E, S, SE | 2 | 2,100-3,000 |
| Apr 2019 | 34, 35, 16, 8 | 1,700-3,200 | 20 km, E, SE, SW, NW | 5 | 2,385-5,600 |
| May 2019 | 20, 18, 33, 32, 17 | 2,500-3,500 | E, SE, NW, N, NE | 16 | -- |
Thermal activity at Sabancaya decreased noticeably during December 2018-April 2019 compared with the previous six months (BGVN 43:12, table 3). The number of monthly MODVOLC thermal alerts dropped to the low single digits from the 12-36 range of the previous six months before increasing again in May 2019. The MIROVA graph of thermal energy also shows the decrease in intensity and frequency during the period with a sharp increase in frequency in mid-May 2019 (figure 62).
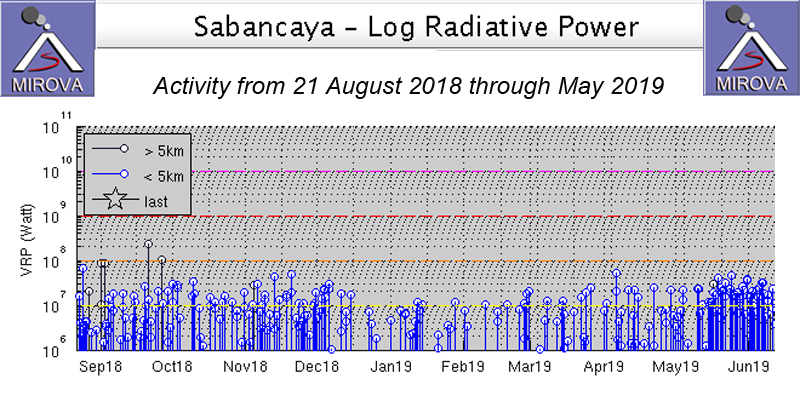 |
Figure 62. The log radiative power of thermal energy at Sabancaya from 21 August 2018 through May 2019 showed thermal activity decreasing from mid-December 2018 through mid-May 2019 before a clear increase in frequency and a small increase in intensity. Courtesy of MIROVA. |
The numbers of daily explosions averaged by week remained relatively constant in the teens and low twenty's for most of the period. An increase to the 33-43 per day range was recorded from mid-March through mid-April 2019 (table 4). The ash plume heights ranged from 1.5 to 3.7 km above the summit and plumes drifted 20-40 km in various directions with prevailing winds (figure 63). IGP issued Ash Alerts twice; on 19 March 2019 the communities of Chivay, Yanque, Coporaque, Achoma, and areas more than 30 km NE were affected. On 17 May 2019 the communities of Cabanaconde, Tapay, and Pinchollo, located more than 30 km N and NW, were affected.
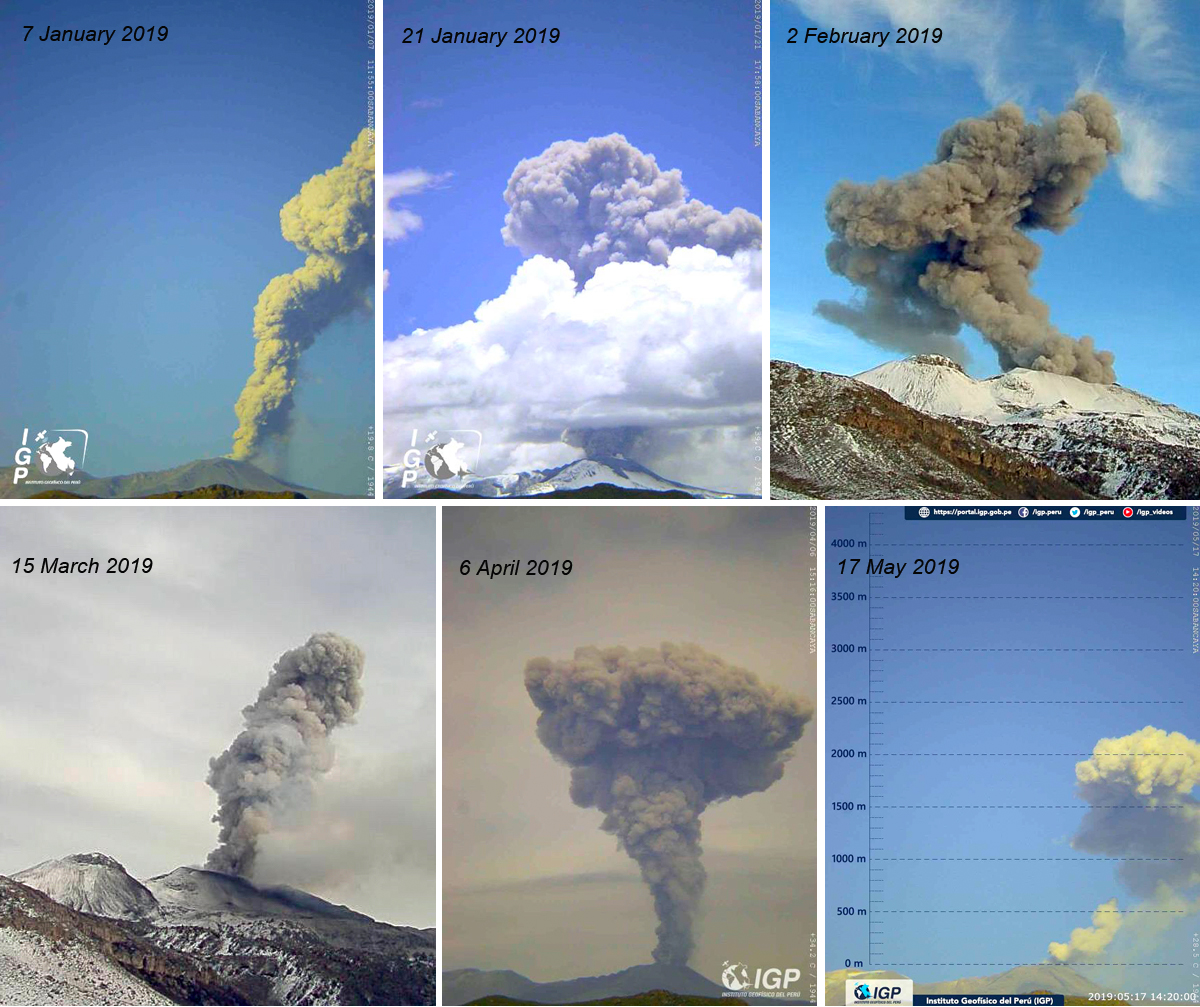 |
Figure 63. Ash plumes were reported from Sabancaya on a near-daily basis during December 2018-May 2019. Plume heights ranged from 1.5 to 3.7 km above the crater. Top left: 7 January 2019. Top middle: 21 January 2019. Top right: 2 February 2019, Bottom left: 15 March 2019, Bottom middle: 6 April 2019. Bottom right: 17 May 2019. Courtesy of IGP. |
Sulfur dioxide emissions also persisted at significant levels throughout the period, and satellite instruments recorded large SO2 plumes in the atmosphere frequently, sometimes for multiple consecutive days (figures 64 and 65). The values of SO2 emissions were reported weekly in the range of 2,100-5,600 t/d (tons per day) by IGP, and the satellite measurements exceeded 2 DU (Dobson Units) many times each month.
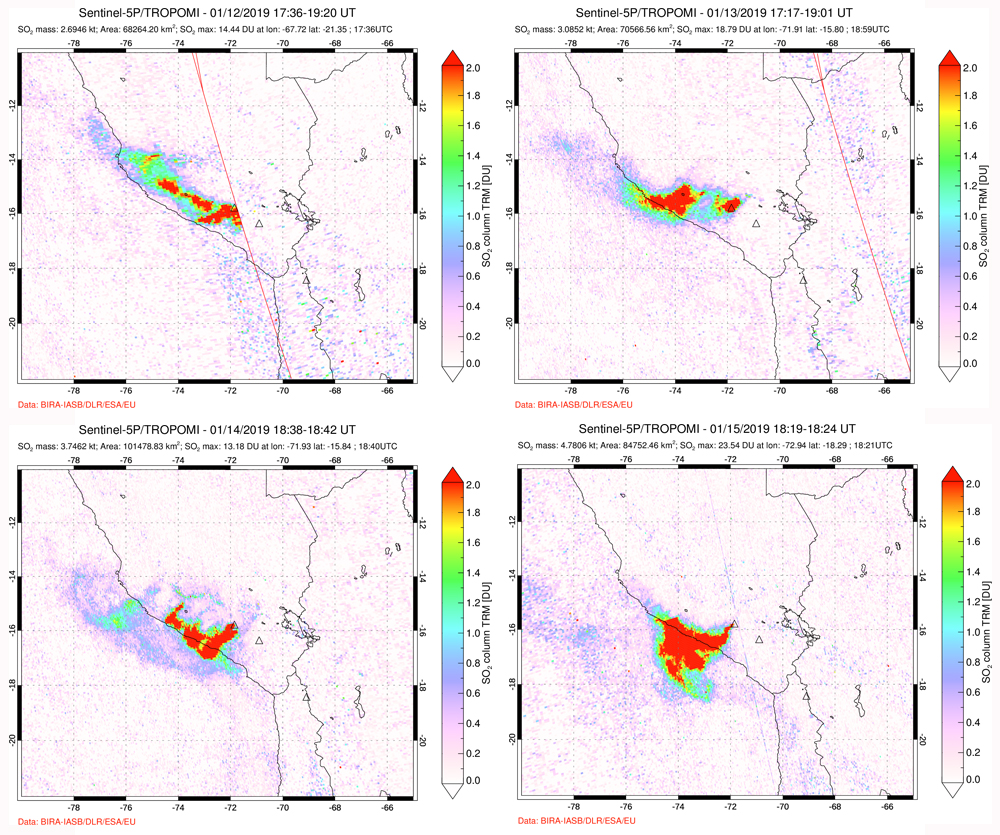 |
Figure 64. Persistent, large SO2 plumes from Sabancaya appeared daily during 12-15 January 2019 in the TROPOMI instrument satellite data. The values each day ranged from 13.18 to 23.54 Dobson Units (DU) a measure of the density of SO2 in the atmosphere. Courtesy of NASA Goddard Space Flight Center. |
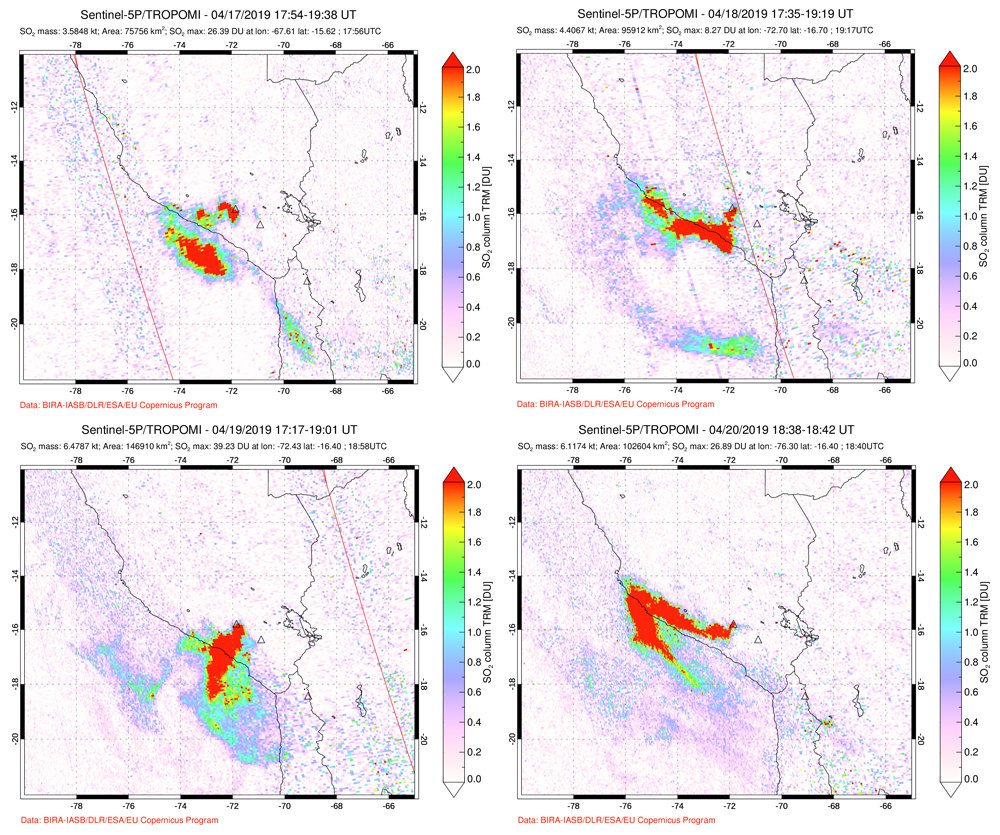 |
Figure 65. Consecutive days of high SO2 emissions were reported during 17-20 April 2019 at Sabancaya by the TROPOMI instrument on the Sentinel 5-P satellite. Values ranged from 8.27 to 39.23 DU, and plumes were detected for hundreds of kilometers from the volcano, following the prevailing winds which changed direction frequently. Courtesy of NASA Goddard Space Flight Center. |
Satellite imagery also captured evidence of the ongoing activity during November 2018-May 2019. Ash plumes were visible rising from the summit when the sky was clear but could also be distinguished from surrounding meteoric clouds. Ashfall on snow left streaks of dark material along the prevailing wind directions (figure 66). Thermal anomalies at the summit crater were also detected even when meteoric clouds were moderately thick (figure 67).
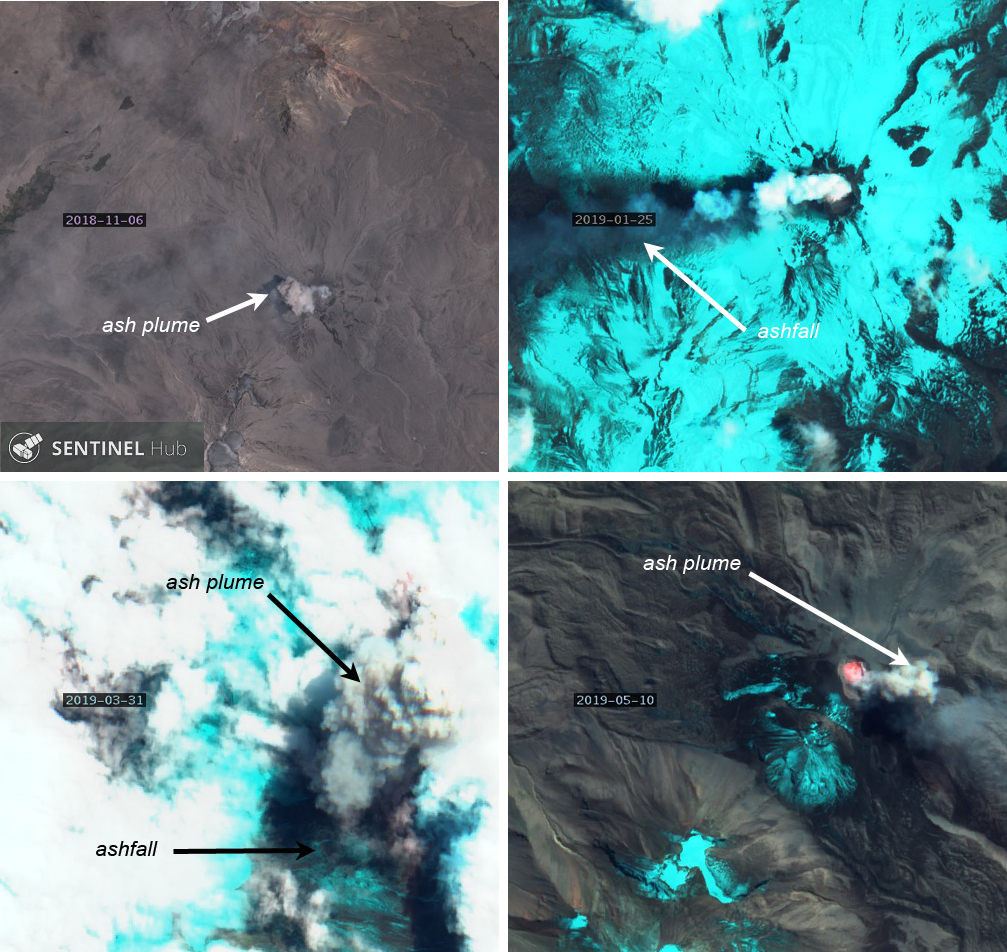 |
Figure 66. Sentinel-2 imagery detected ash plumes at Sabancaya on clear as well as cloudy days. Top left: 6 November 2018. Top right: 25 January 2019. Bottom left: 31 March 2019. Bottom right: 10 May 2019. Sometimes the ash fall left dark streaks in the snow. Top left image uses bands 4,3,2, others use bands 12, 4, 2. Courtesy of Sentinel Hub Playground. |
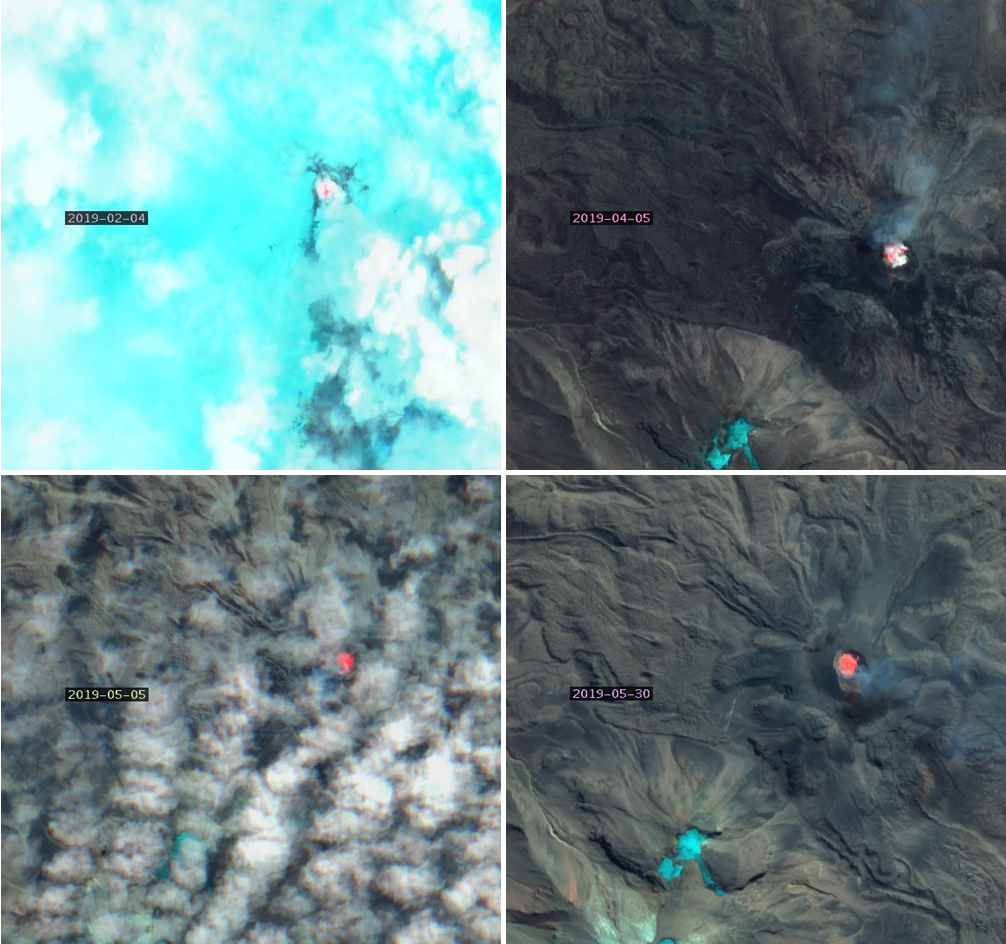 |
Figure 67. Thermal anomalies inside Sabancaya's crater were detected on clear days and also when significant meteorological cloud cover was present. Top left: 4 February 2019. Top right: 5 April 2019. Bottom left: 5 May 2019. Bottom right: 30 May 2019. All images use bands 12, 4, 2. Courtesy of Sentinel Hub Playground. |
Information Contacts: Instituto Geofisico del Peru (IGP), Calle Badajoz N° 169 Urb. Mayorazgo IV Etapa, Ate, Lima 15012 – Perú, (URL: www.igp.gob.pe); MIROVA (Middle InfraRed Observation of Volcanic Activity), a collaborative project between the Universities of Turin and Florence (Italy) supported by the Centre for Volcanic Risk of the Italian Civil Protection Department (URL: http://www.mirovaweb.it/); Hawai'i Institute of Geophysics and Planetology (HIGP) - MODVOLC Thermal Alerts System, School of Ocean and Earth Science and Technology (SOEST), Univ. of Hawai'i, 2525 Correa Road, Honolulu, HI 96822, USA (URL: http://modis.higp.hawaii.edu/); Global Sulfur Dioxide Monitoring Page, Atmospheric Chemistry and Dynamics Laboratory, NASA Goddard Space Flight Center (NASA/GSFC), 8800 Greenbelt Road, Goddard, Maryland, USA (URL: https://so2.gsfc.nasa.gov/); Sentinel Hub Playground (URL: https://www.sentinel-hub.com/explore/sentinel-playground).
Explosions, ash and SO2 plumes, thermal anomalies, and lava dome growth during June-November 2019
Sabancaya is an andesitic stratovolcano located in Peru. The most recent eruptive episode began in early November 2016, which is characterized by gas-and-steam and ash emissions, seismicity, and explosive events (BGVN 44:06). The ash plumes are dispersed by wind with a typical radius of 30 km, which occasionally results in ashfall. Current volcanism includes high seismicity, gas-and-steam emissions, ash and SO2 plumes, numerous thermal anomalies, and explosive events. This report updates information from June through November 2019 using information primarily from the Instituto Geofisico del Peru (IGP) and Observatorio Volcanologico del INGEMMET (Instituto Geológical Minero y Metalúrgico) (OVI-INGEMMET).
Table 5. Summary of eruptive activity at Sabancaya during June-November 2019 based on IGP weekly reports, the Buenos Aires VAAC advisories, the HIGP MODVOLC hotspot monitoring algorithm, and Sentinel-5P/TROPOMI satellite data.
| Month | Avg. Daily Explosions by week | Max plume Heights (km above crater) | Plume drift | MODVOLC Alerts | Min Days with SO2 over 2 DU |
| Jun 2019 | 12, 13, 16, 17 | 2.6-3.8 | 30 km S, SW, E, SE, NW, NE | 15 | 20 |
| Jul 2019 | 23, 22, 16, 13 | 2.3-3.7 | E, SE, S, NE | 7 | 25 |
| Aug 2019 | 12, 30, 25, 26 | 2-4.5 | 30 km NW, W S, NE, SE, SW | 7 | 25 |
| Sep 2019 | 29, 32, 24, 15 | 1.5-2.5 | S, SE, E, W, NW, SW | 14 | 26 |
| Oct 2019 | 32, 36, 44, 48, 28 | 2.5-3.5 | S, SE, SW, W | 11 | 25 |
| Nov 2019 | 58, 50, 47, 17 | 2-4 | W, SW, S, NE, E | 13 | 22 |
Explosions, ash emissions, thermal signatures, and high concentrations of SO2 were reported each week during June-November 2019 by IGP, the Buenos Aires Volcanic Ash Advisory Centre (VAAC), HIGP MODVOLC, and Sentinel-2 and Sentinel-5P/TROPOMI satellite data (table 5). Thermal anomalies were visible in the summit crater, even in the presence of meteoric clouds and ash plumes were occasionally visible rising from the summit in clear weather (figure 68). The maximum plume height reached 4.5 km above the crater drifting NW, W, and S the week of 29 July-4 August, according to IGP who used surveillance cameras to visually monitor the plume (figure 69). This ash plume had a radius of 30 km, which resulted in ashfall in Colca (NW) and Huambo (W). On 27 July the SO2 levels reached a high of 12,814 tons/day, according to INGEMMET. An average of 58 daily explosions occurred in early November, which is the largest average of this reporting period.
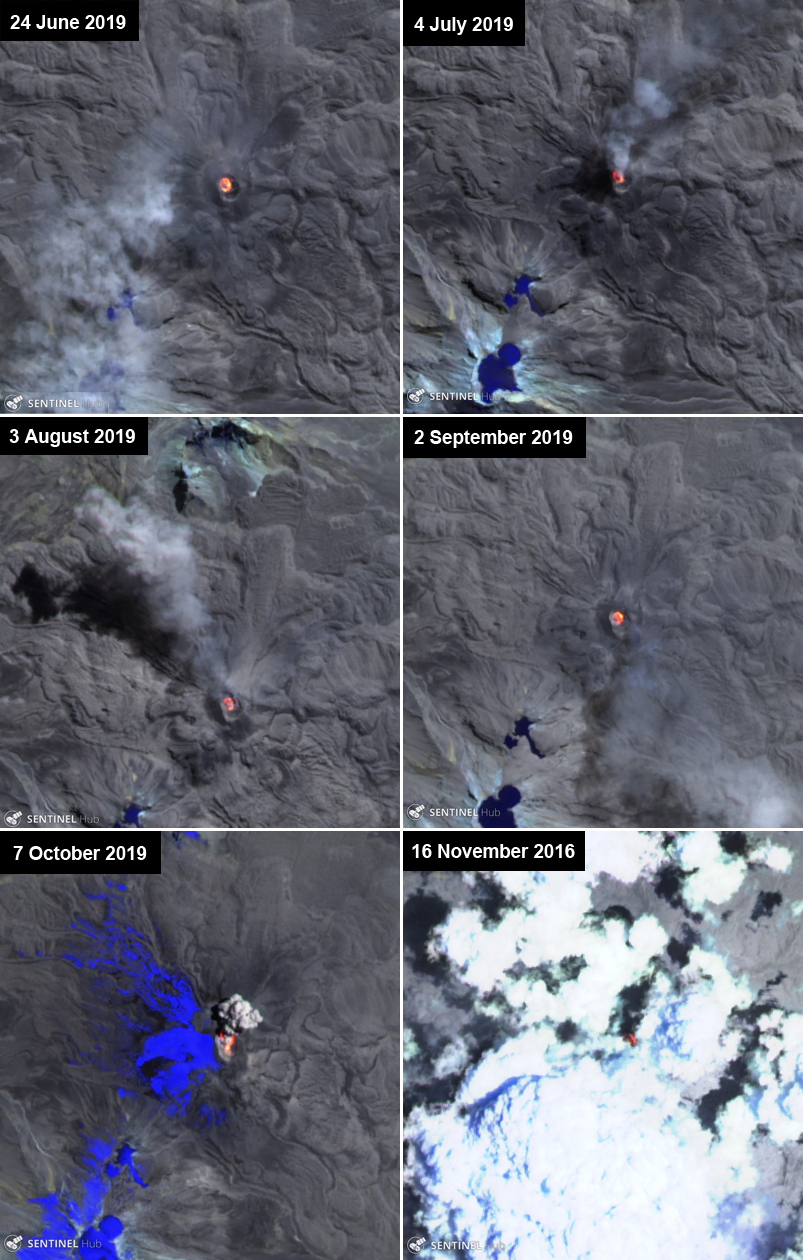 |
Figure 68. Sentinel-2 satellite imagery detected ash plumes, gas-and-steam emissions, and multiple thermal signatures (bright yellow-orange) in the crater at Sabancaya during June-November 2019. Sentinel-2 atmospheric penetration (bands 12, 11, 8A) images courtesy of Sentinel Hub Playground. |
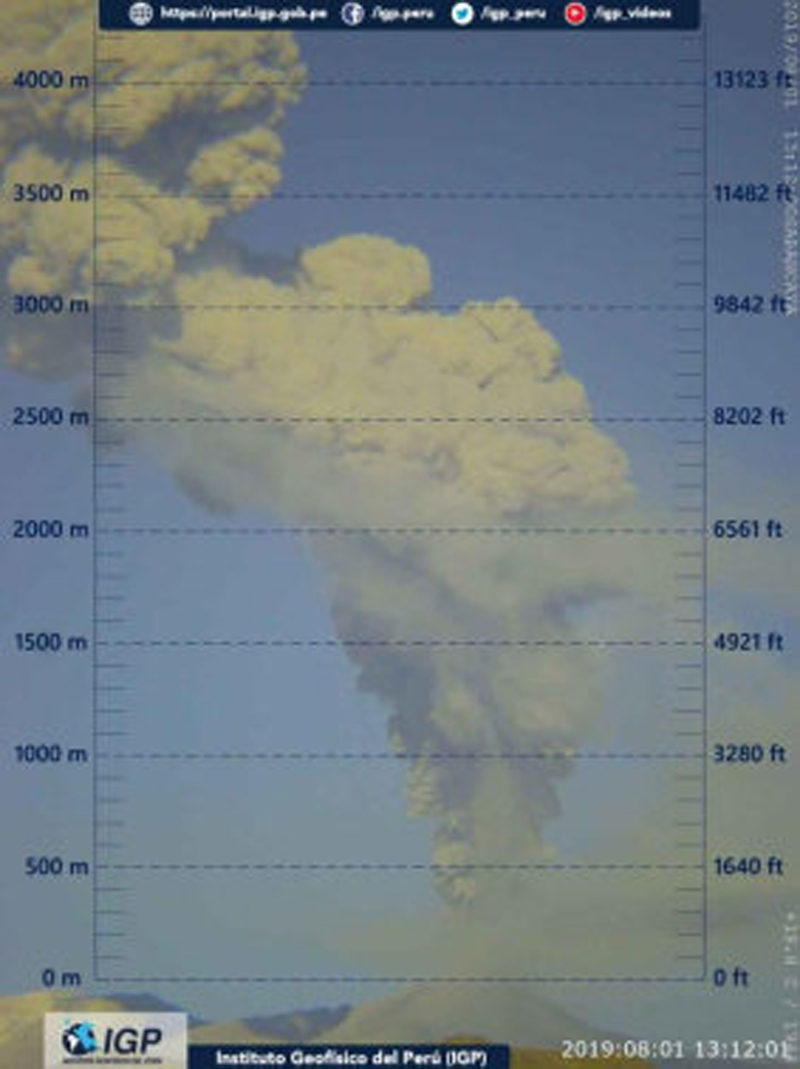 |
Figure 69. A webcam image of an ash plume rising from Sabancaya on 1 August 2019 at least 4 km above the crater. Courtesy of IGP. |
Seismicity was also particularly high between August and September 2019, according to INGEMMET. On 14 August, roughly 850 earthquakes were detected. There were 280 earthquakes reported on 15 September, located 6 km NE of the crater. Both seismic events were characterized as seismic swarms. Seismicity decreased afterward but continued through the reporting period.
In February 2017, a lava dome was established inside the crater. Since then, it has been growing slowly, filling the N area of the crater and producing thermal anomalies. On 26 October 2019, OVI-INGEMMET conducted a drone overflight and captured video of the lava dome (figure 70). According to IGP, this lava dome is approximately 4.6 million cubic meters with a growth rate of 0.05 m3/s.
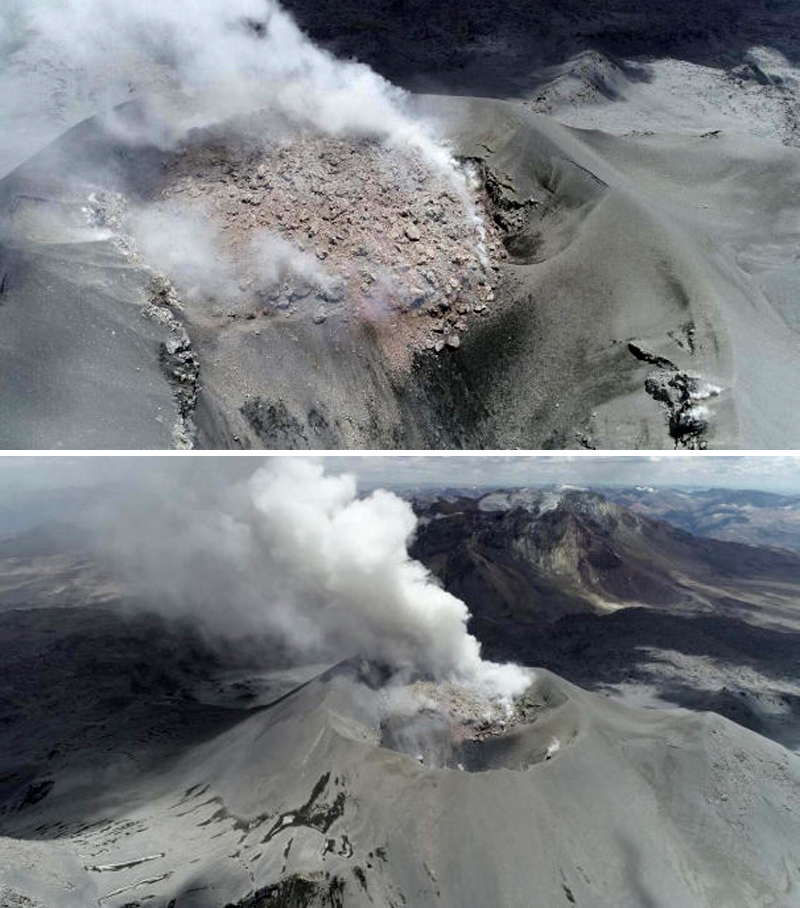 |
Figure 70. Drone images of the lava dome and degassing inside the crater at Sabancaya on 26 (top) and 27 (bottom) October 2019. Courtesy of INGEMMET (Informe Ténico No A6969). |
MIROVA (Middle InfraRed Observation of Volcanic Activity) analysis of MODIS satellite data shows strong, consistent thermal anomalies occurring all throughout June through November 2019 (figure 71). In conjunction with these thermal anomalies, the October 2019 special issue report by INGEMMET showed new hotspots forming along the crater rim in July 2018 and August 2019 (figure 72).
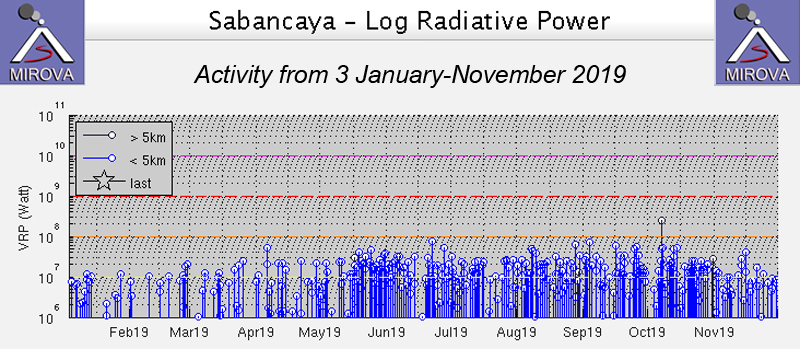 |
Figure 71. Thermal anomalies at Sabancaya for 3 January through November 2019 as recorded by the MIROVA system (Log Radiative Power) were frequent, strong, and consistent. Courtesy of MIROVA. |
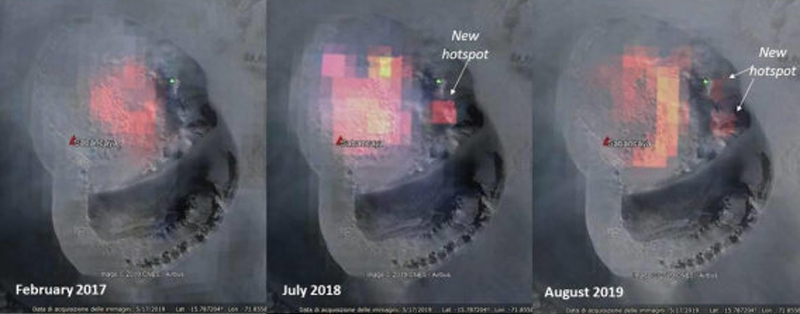 |
Figure 72. Thermal hotspots on the NW section of the crater at Sabancaya using MIROVA images. These images show the progression of the formation of at least two new hotspots between February 2017 to August 2019. Courtesy of INGEMMET, Informe Técnico No A6969. |
Sulfur dioxide emissions also persisted at significant levels from June through November 2019, as detected by Sentinel-5P/TROPOMI satellite data (figure 73). The satellite measurements of the SO2 emissions exceeded 2 DU (Dobson Units) at least 20 days each month during this time. These SO2 plumes sometimes occurred for multiple consecutive days (figure 74).
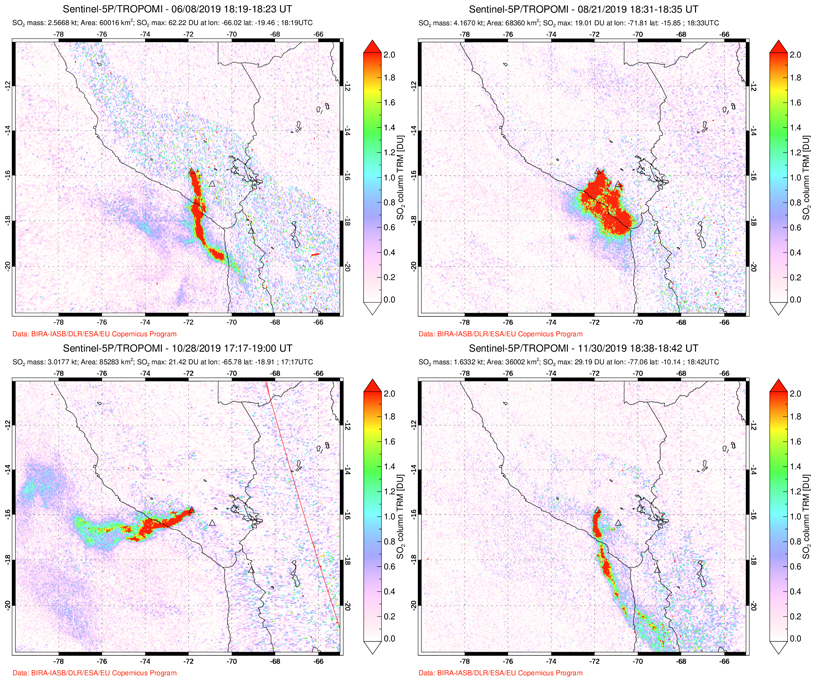 |
Figure 73. Consistent, large SO2 plumes from Sabancaya were seen in TROPOMI instrument satellite data throughout June-November 2019, many of which drifted in different directions based on the prevailing winds. Courtesy of NASA Goddard Space Flight Center. |
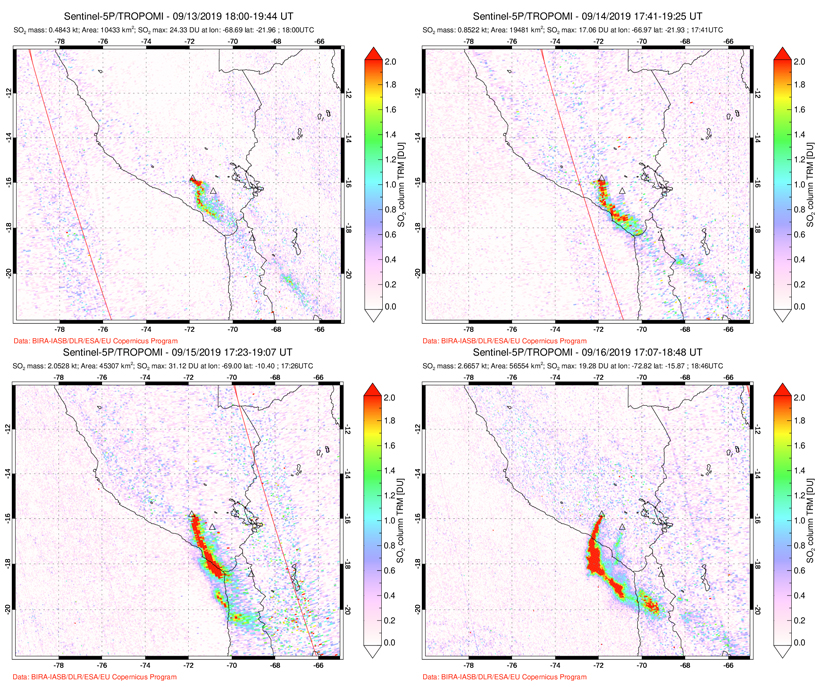 |
Figure 74. Persistent SO2 plumes from Sabancaya appeared daily during 13-16 September 2019 in the TROPOMI instrument satellite data. Courtesy of NASA Goddard Space Flight Center. |
Information Contacts: Instituto Geofisico del Peru (IGP), Calle Badajoz N° 169 Urb. Mayorazgo IV Etapa, Ate, Lima 15012, Perú (URL: https://www.gob.pe/igp); Observatorio Volcanologico del INGEMMET (Instituto Geológical Minero y Metalúrgico), Barrio Magisterial Nro. 2 B-16 Umacollo - Yanahuara Arequipa, Peru (URL: http://ovi.ingemmet.gob.pe); MIROVA (Middle InfraRed Observation of Volcanic Activity), a collaborative project between the Universities of Turin and Florence (Italy) supported by the Centre for Volcanic Risk of the Italian Civil Protection Department (URL: http://www.mirovaweb.it/); Hawai'i Institute of Geophysics and Planetology (HIGP) - MODVOLC Thermal Alerts System, School of Ocean and Earth Science and Technology (SOEST), Univ. of Hawai'i, 2525 Correa Road, Honolulu, HI 96822, USA (URL: http://modis.higp.hawaii.edu/); Global Sulfur Dioxide Monitoring Page, Atmospheric Chemistry and Dynamics Laboratory, NASA Goddard Space Flight Center (NASA/GSFC), 8800 Greenbelt Road, Goddard, Maryland, USA (URL: https://SO2.gsfc.nasa.gov/); Buenos Aires Volcanic Ash Advisory Center (VAAC), Servicio Meteorológico Nacional-Fuerza Aérea Argentina, 25 de mayo 658, Buenos Aires, Argentina (URL: http://www.smn.gov.ar/vaac/buenosaires/inicio.php); Sentinel Hub Playground (URL: https://www.sentinel-hub.com/explore/sentinel-playground).
Daily explosions with ash emissions, large SO2 flux, ongoing thermal anomalies, December 2019-May 2020
Although tephrochronology has dated activity at Sabancaya back several thousand years, renewed activity that began in 1986 was the first recorded in over 200 years. Intermittent activity since then has produced significant ashfall deposits, seismic unrest, and fumarolic emissions. A new period of explosive activity that began in November 2016 has been characterized by pulses of ash emissions with some plumes exceeding 10 km altitude, thermal anomalies, and significant SO2 plumes. Ash emissions and high levels of SO2 continued each week during December 2019-May 2020. The Observatorio Vulcanologico INGEMMET (OVI) reports weekly on numbers of daily explosions, ash plume heights and directions of drift, seismicity, and other activity. The Buenos Aires Volcanic Ash Advisory Center (VAAC) issued three or four daily reports of ongoing ash emissions at Sabancaya throughout the period.
The dome inside the summit crater continued to grow throughout this period, along with nearly constant ash, gas, and steam emissions; the average number of daily explosions ranged from 4 to 29. Ash and gas plume heights rose 1,800-3,800 m above the summit crater, and multiple communities around the volcano reported ashfall every month (table 6). Sulfur dioxide emissions were notably high and recorded daily with the TROPOMI satellite instrument (figure 75). Thermal activity declined during December 2019 from levels earlier in the year but remained steady and increased in both frequency and intensity during April and May 2020 (figure 76). Infrared satellite images indicated that the primary heat source throughout the period was from the dome inside the summit crater (figure 77).
Table 6. Persistent activity at Sabancaya during December 2019-May 2020 included multiple daily explosions with ash plumes that rose several kilometers above the summit and drifted in many directions; this resulted in ashfall in communities within 30 km of the volcano. Satellite instruments recorded SO2 emissions daily. Data courtesy of OVI-INGEMMET.
| Month | Avg. Daily Explosions by week | Max plume Heights (m above crater) | Plume drift (km) and direction | Communities reporting ashfall | Min Days with SO2 over 2 DU |
| Dec 2019 | 16, 13, 5, 5 | 2,600-3,800 | 20-30 NW | Pinchollo, Madrigal, Lari, Maca, Achoma, Coporaque, Yanque, Chivay, Huambo, Cabanaconde | 27 |
| Jan 2020 | 10, 8, 11, 14, 4 | 1,800-3,400 | 30 km W, NW, SE, S | Chivay, Yanque, Achoma | 29 |
| Feb 2020 | 8, 11, 20, 19 | 2,000-2,200 | 30 km SE, E, NE, W | Huambo | 29 |
| Mar 2020 | 14, 22, 29, 18 | 2,000-3,000 | 30 km NE, W, NW, SW | Madrigal, Lari, Pinchollo | 30 |
| Apr 2020 | 12, 12, 16, 13, 8 | 2,000-3,000 | 30 km SE, NW, E, S | Pinchollo, Madrigal, Lari, Maca, Ichupampa, Yanque, Chivay, Coporaque, Achoma | 27 |
| May 2020 | 15, 14, 6, 16 | 1,800-2,400 | 30 km SW, SE, E, NE, W | Chivay, Achoma, Maca, Lari, Madrigal, Pinchollo | 27 |
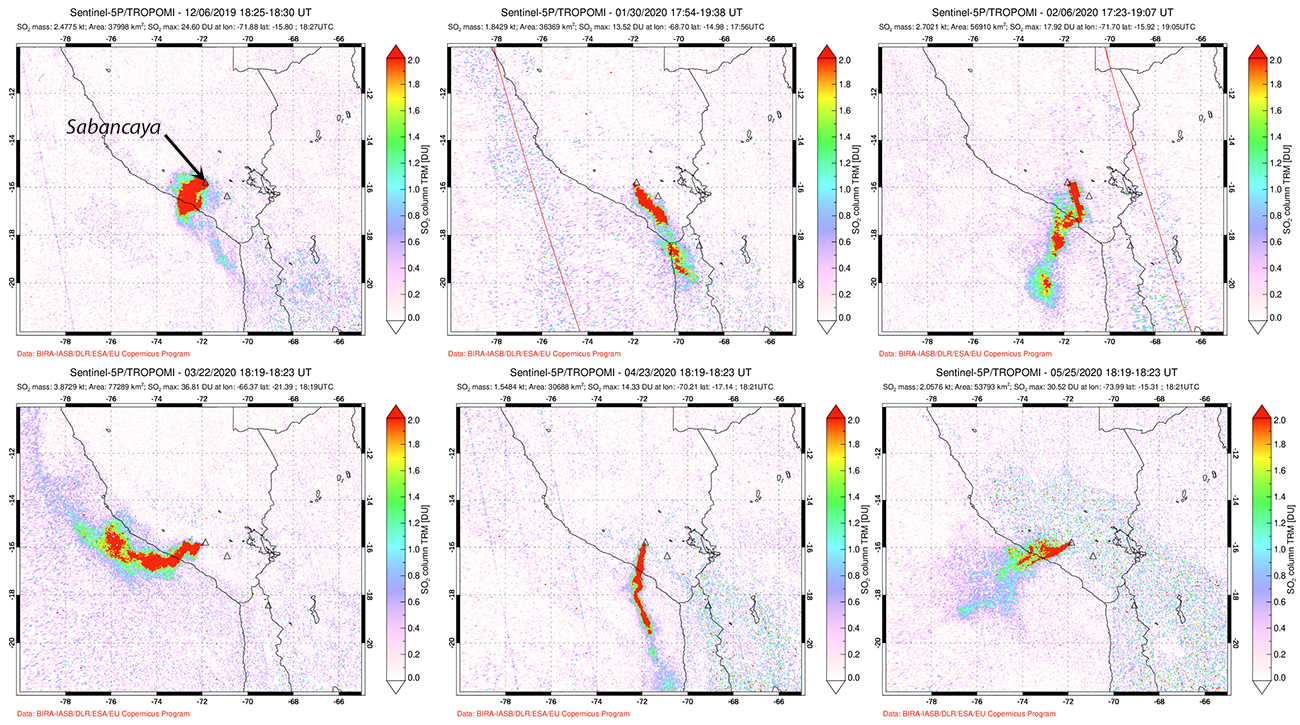 |
Figure 75. Sulfur dioxide anomalies were captured daily from Sabancaya during December 2019-May 2020 by the TROPOMI instrument on the Sentinel-5P satellite. Some of the largest SO2 plumes are shown here with dates listed in the information at the top of each image. Courtesy of NASA Global Sulfur Dioxide Monitoring Page. |
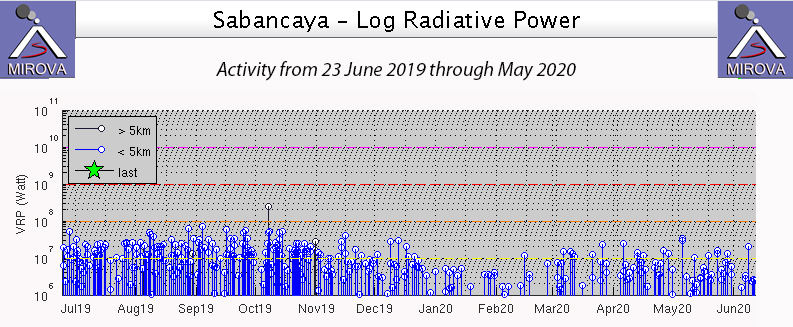 |
Figure 76. Thermal activity at Sabancaya declined during December 2019 from levels earlier in the year but remained steady and increased slightly in frequency and intensity during April and May 2020, according to the MIROVA graph of Log Radiative Power from 23 June 2019 through May 2020. Courtesy of MIROVA. |
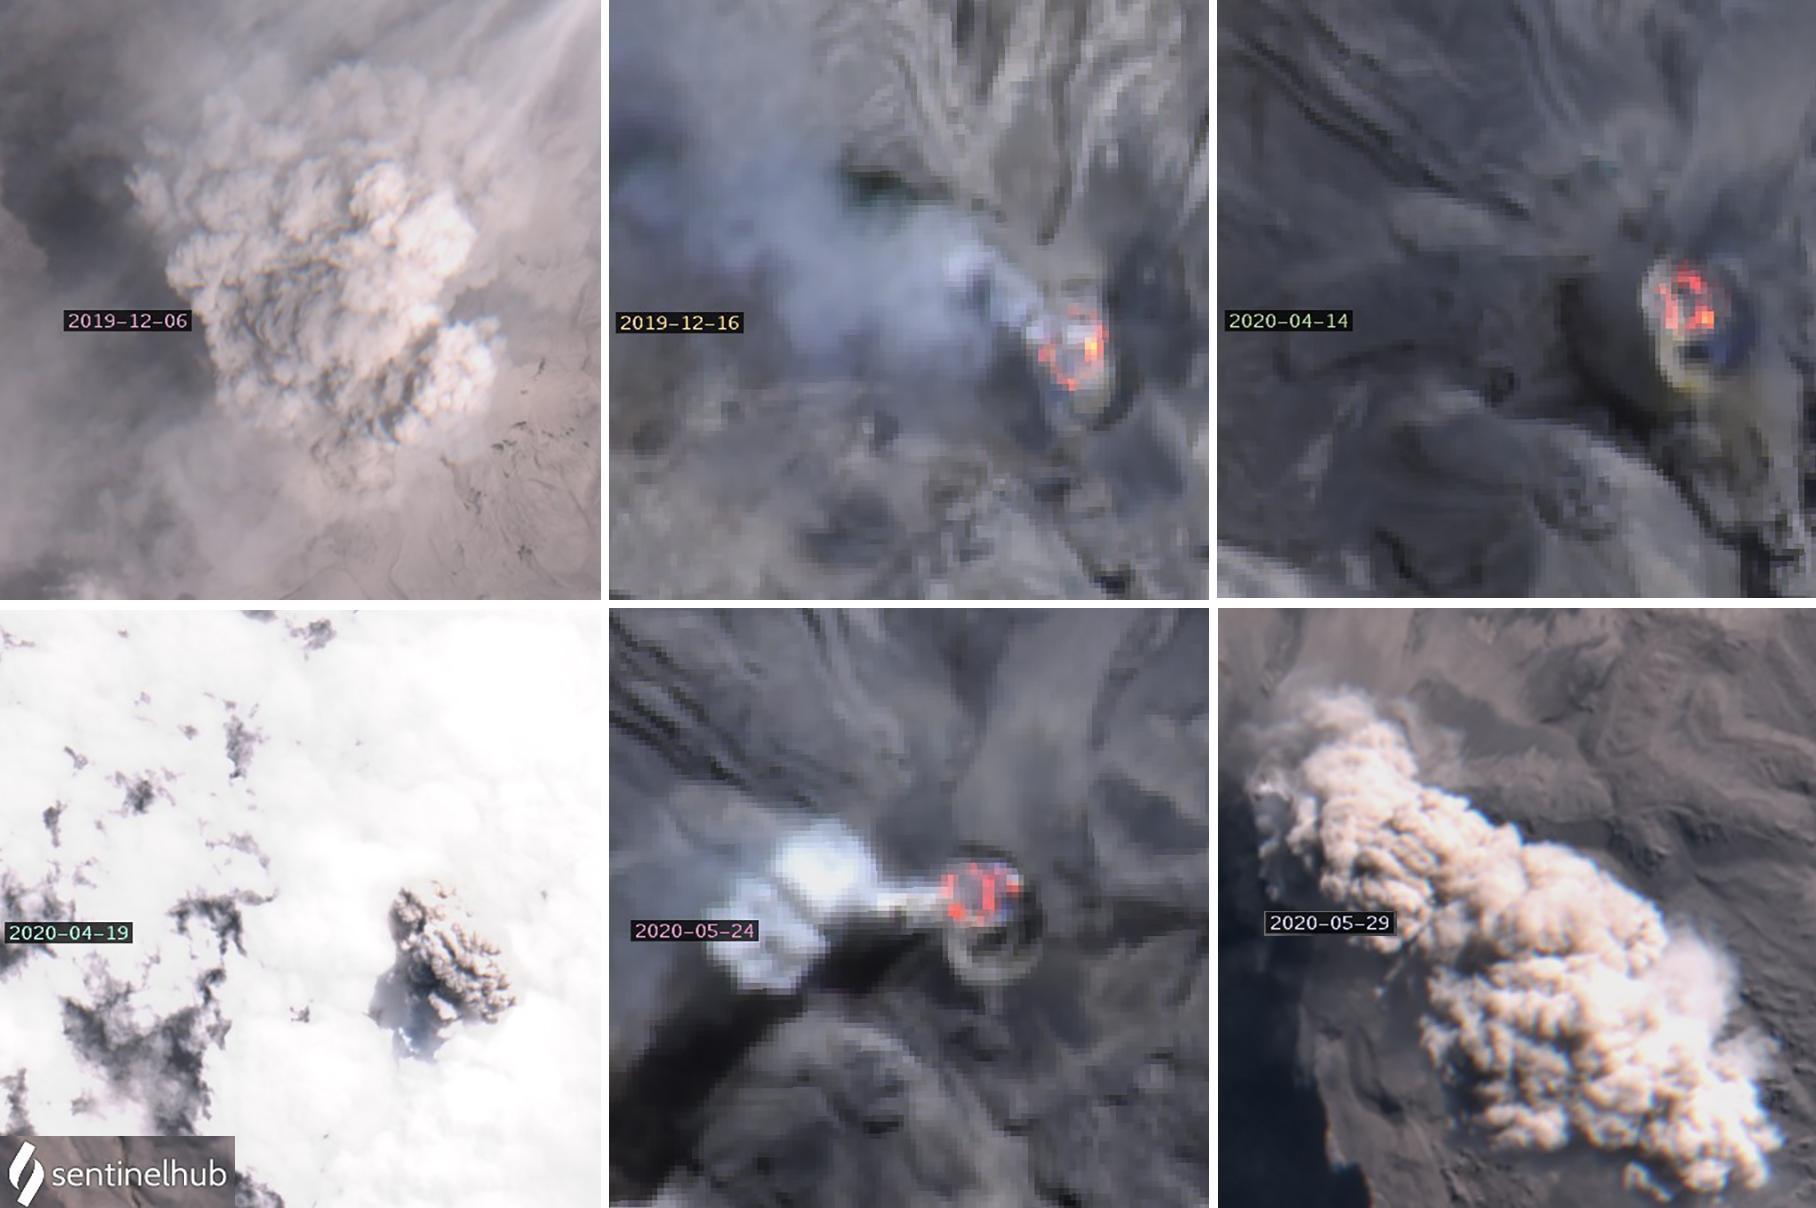 |
Figure 77. Sentinel-2 satellite imagery of Sabancaya confirmed the frequent ash emissions and ongoing thermal activity from the dome inside the summit crater during December 2019-May 2020. Top row (left to right): On 6 December 2019 a large plume of steam and ash drifted N from the summit. On 16 December 2019 a thermal anomaly encircled the dome inside the summit caldera while gas and possible ash drifted NW. On 14 April 2020 a very similar pattern persisted inside the crater. Bottom row (left to right): On 19 April an ash plume was clearly visible above dense cloud cover. On 24 May the infrared glow around the dome remained strong; a diffuse plume drifted W. A large plume of ash and steam drifted SE from the summit on 29 May. Infrared images use Atmospheric penetration rendering (bands 12, 11, 8a), other images use Natural Color rendering (bands 4, 3, 2). Courtesy of Sentinel Hub Playground. |
The average number of daily explosions during December 2019 decreased from a high of 16 the first week of the month to a low of five during the last week. Six pyroclastic flows occurred on 10 December (figure 78). Tremors were associated with gas-and-ash emissions for most of the month. Ashfall was reported in Pinchollo, Madrigal, Lari, Maca, Achoma, Coporaque, Yanque, and Chivay during the first week of the month, and in Huambo and Cabanaconde during the second week (figure 79). Inflation of the volcano was measured throughout the month. SO2 flux was measured by OVI as ranging from 2,500 to 4,300 tons per day.
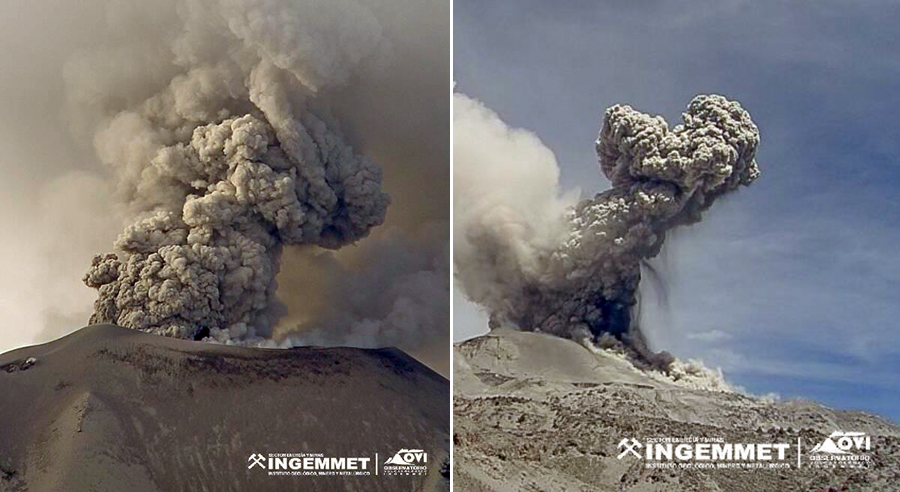 |
Figure 78. Multiple daily explosions at Sabancaya produced ash plumes that rose several kilometers above the summit. Left image is from 5 December and right image is from 11 December 2019. Note pyroclastic flows to the right of the crater on 11 December. Courtesy of OVI (Reporte Semanal de Monitorio de la Actividad de la Volcan Sabancaya, RSSAB-49-2019/INGEMMET Semana del 2 al 8 de diciembre de 2019 and RSSAB-50-2019/INGEMMET Semana del 9 al 15 de diciembre de 2019). |
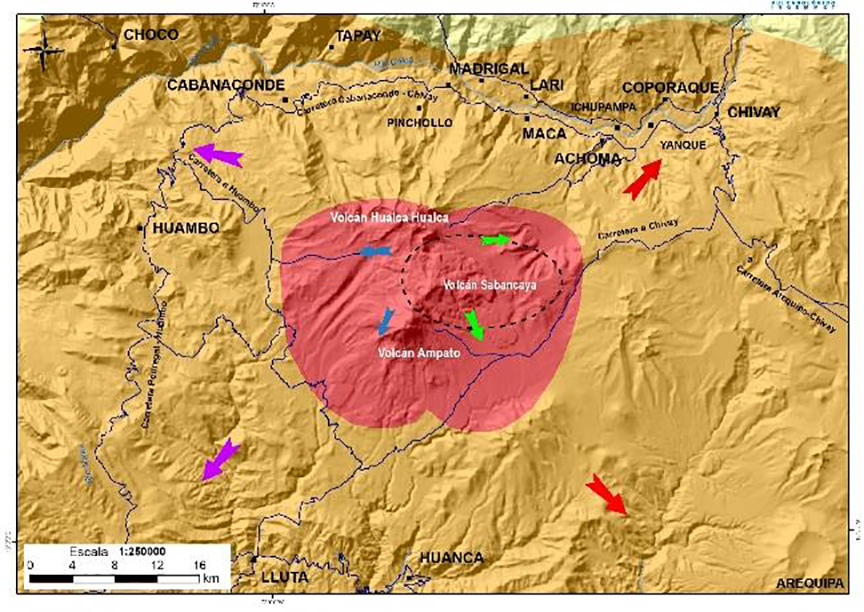 |
Figure 79. Communities to the N and W of Sabancaya recorded ashfall from the volcano the first week of December and also every month during December 2019-May 2020. The red zone is the area where access is prohibited (about a 12-km radius from the crater). Courtesy of OVI (Reporte Semanal de Monitorio de la Actividad de la Volcan Sabancaya, RSSAB-22-2020/INGEMMET Semana del 25 al 31 de mayo del 2020). |
During January and February 2020 the number of daily explosions averaged 4-20. Ash plumes rose as high as 3.4 km above the summit (figure 80) and drifted up to 30 km in multiple directions. Ashfall was reported in Chivay, Yanque, and Achoma on 8 January, and in Huambo on 25 February. Sulfur dioxide flux ranged from a low of 1,200 t/d on 29 February to a high of 8,200 t/d on 28 January. Inflation of the edifice was measured during January; deformation changed to deflation in early February but then returned to inflation by the end of the month.
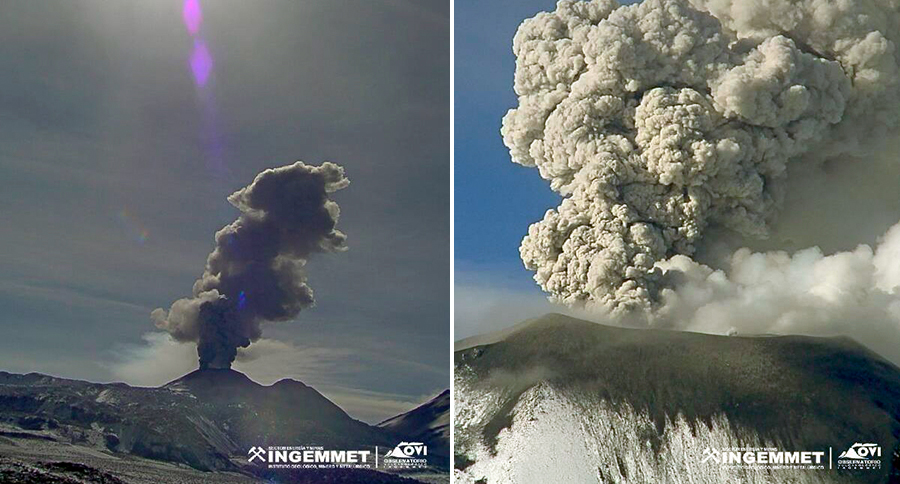 |
Figure 80. Ash plumes rose from Sabancaya every day during January and February 2020. Left: 11 January. Right: 28 February. Courtesy of OVI (Reporte Semanal de Monitorio de la Actividad de la Volcan Sabancaya, RSSAB-02-2020/INGEMMET Semana del 06 al 12 de enero del 2020 and RSSAB-09-2020/INGEMMET Semana del 24 de febrero al 01 de marzo del 2020). |
Explosions continued during March and April 2020, averaging 8-29 per day. Explosions appeared to come from multiple vents on 11 March (figure 81). Ash plumes rose 3 km above the summit during the first week of March and again the first week of April; they were lower during the other weeks. Ashfall was reported in Madrigal, Lari, and Pinchollo on 27 March and 5 April. On 17 April ashfall was reported in Maca, Ichupampa, Yanque, Chivay, Coporaque, and Achoma. Sulfur dioxide flux ranged from 1,900 t/d on 5 March to 10,700 t/d on 30 March. Inflation at depth continued throughout March and April with 10 ± 4 mm recorded between 21 and 26 April. Similar activity continued during May 2020; explosions averaged 6-16 per day (figure 82). Ashfall was reported on 6 May in Chivay, Achoma, Maca, Lari, Madrigal, and Pinchollo; heavy ashfall was reported in Achoma on 12 May. Additional ashfall was reported in Achoma, Maca, Madrigal, and Lari on 23 May.
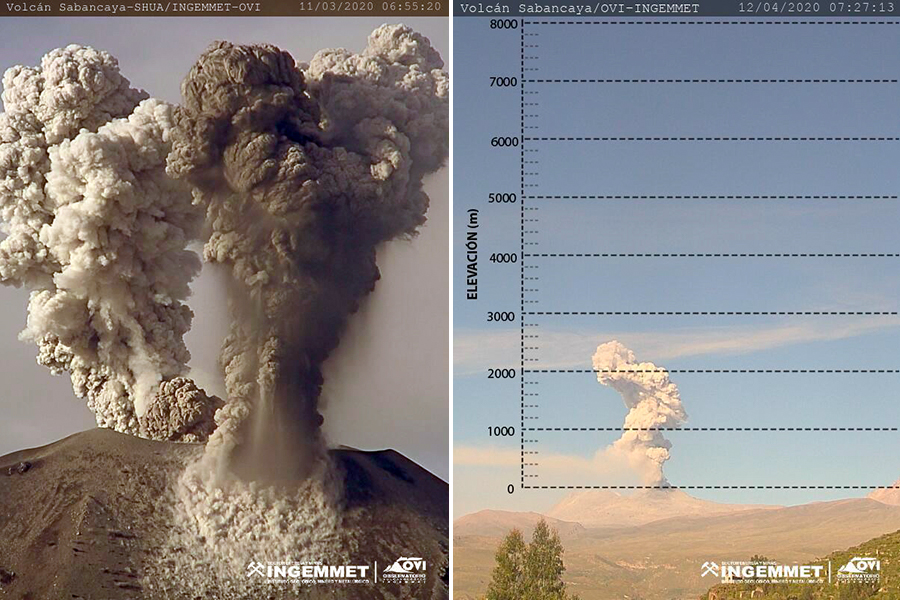 |
Figure 81. Explosions at Sabancaya on 11 March 2020 appeared to originate simultaneously from two different vents (left). The plume on 12 April was measured at about 2,500 m above the summit. Courtesy of OVI-INGEMMET (Reporte Semanal de Monitorio de la Actividad de la Volcan Sabancaya, RSSAB-11-2020/INGEMMET Semana del 9 al 15 de marzo del 2020 and RSSAB-15-2020/INGEMMET Semana del 6 al 12 de abril del 2020). |
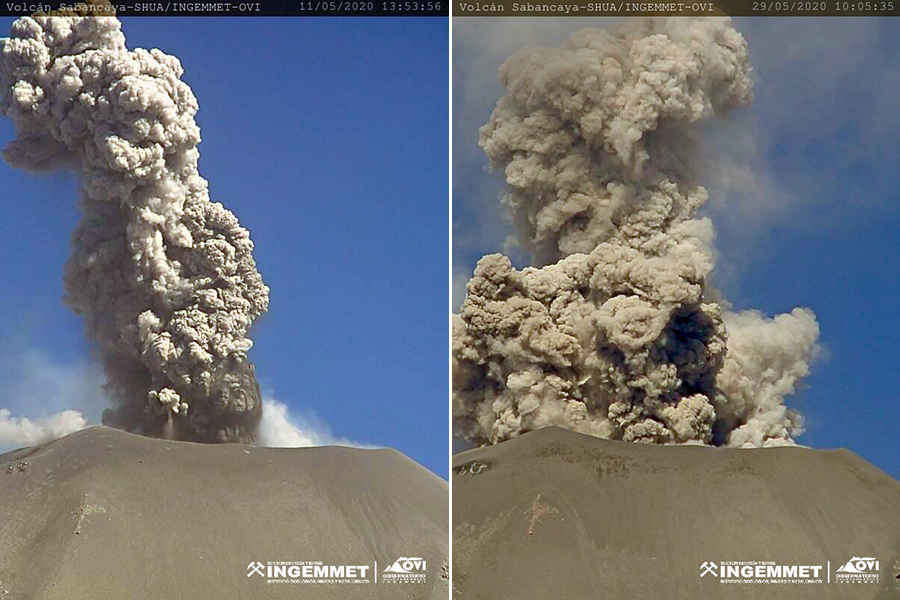 |
Figure 82. Explosions dense with ash continued during May 2020 at Sabancaya. On 11 and 29 May 2020 ash plumes rose from the summit and drifted as far as 30 km before dissipating. Courtesy of OVI-INGEMMET (Reporte Semanal de Monitorio de la Actividad de la Volcan Sabancaya , RSSAB-20-2020/INGEMMET Semana del 11 al 17 de mayo del 2020 and RSSAB-22-2020/INGEMMET Semana del 25 al 31 de mayo del 2020). |
Information Contacts: Observatorio Volcanologico del INGEMMET (Instituto Geológical Minero y Metalúrgico), Barrio Magisterial Nro. 2 B-16 Umacollo - Yanahuara Arequipa, Peru (URL: http://ovi.ingemmet.gob.pe); Buenos Aires Volcanic Ash Advisory Center (VAAC), Servicio Meteorológico Nacional-Fuerza Aérea Argentina, 25 de mayo 658, Buenos Aires, Argentina (URL: http://www.smn.gov.ar/vaac/buenosaires/inicio.php); Global Sulfur Dioxide Monitoring Page, Atmospheric Chemistry and Dynamics Laboratory, NASA Goddard Space Flight Center (NASA/GSFC), 8800 Greenbelt Road, Goddard, Maryland, USA (URL: https://so2.gsfc.nasa.gov/); MIROVA (Middle InfraRed Observation of Volcanic Activity), a collaborative project between the Universities of Turin and Florence (Italy) supported by the Centre for Volcanic Risk of the Italian Civil Protection Department (URL: http://www.mirovaweb.it/); Sentinel Hub Playground (URL: https://www.sentinel-hub.com/explore/sentinel-playground).
Daily explosions produced ash plumes, SO2 plumes, and thermal anomalies during June-September 2020
Sabancaya, located in Peru, is a stratovolcano that has been very active since 1986. The current eruptive period began in November 2016 and has recently been characterized by lava dome growth, daily explosions, ash plumes, ashfall, SO2 plumes, and ongoing thermal anomalies (BGVN 45:06). Similar activity continues into this reporting period of June through September 2020 using information from weekly reports from the Observatorio Vulcanologico INGEMMET (OVI), the Instituto Geofisico del Peru (IGP), and various satellite data. The Buenos Aires Volcanic Ash Advisory Center (VAAC) issued a total of 520 reports of ongoing ash emissions during this time.
Volcanism during this reporting period consisted of daily explosions, nearly constant gas-and-ash plumes, SO2 plumes, and persistent thermal anomalies in the summit crater. Gas-and-ash plumes rose to 1.5-4 km above the summit crater, drifting up to 35 km from the crater in multiple directions; several communities reported ashfall every month except for August (table 7). Sulfur dioxide emissions were notably high and recorded almost daily with the TROPOMI satellite instrument (figure 83). The satellite measurements of the SO2 emissions exceeded 2 DU (Dobson Units) at least 20 days each month of the reporting period. These SO2 plumes sometimes persisted over multiple days and ranged between 1,900-10,700 tons/day. MIROVA (Middle InfraRed Observation of Volcanic Activity) analysis of MODIS satellite data shows frequent thermal activity through September within 5 km of the summit crater, though the power varied; by late August, the thermal anomalies were stronger compared to the previous months (figure 84). This increase in power is also reflected by the MODVOLC algorithm that detected 11 thermal anomalies over the days of 31 August and 4, 6, 13, 17, 18, 20, and 22 September 2020. Many of these thermal hotspots were visible in Sentinel-2 thermal satellite imagery, occasionally accompanied by gas-and-steam and ash plumes (figure 85).
Table 7. Persistent activity at Sabancaya during June through September included multiple daily explosions that produced ash plumes rising several kilometers above the summit and drifting in multiple directions; this resulted in ashfall in communities within 35 km of the volcano. Satellite instruments recorded daily SO2 emissions. Data courtesy of OVI-INGEMMET, IGP, and the NASA Global Sulfur Dioxide Monitoring Page.
| Month | Avg. daily explosions by week | Max plume heights (km above the crater) | Plume drift (km) and direction | Communities reporting ashfall | Minimum days with SO2 over 2 DU | SO2 emissions per day (tons) by week |
| Jun 2020 | 20, 10, 9, 13 | 1.5-4 | 30 km, SE, S, SW, NE, W, E | Chivay, Achoma, Ichupampa, Yanque, and Coporaque, Sallali, Madrigal, Lari, and Ichupampa | 28 | 8,400, 2,200, 3,100, 7,600 |
| Jul 2020 | 20, 15, 11, 12, 19 | 2-2.6 | 15-30 km E, NE, NW, SE, SW, S, W | Achoma and Chivay | 23 | 4,400, 6,000, 1,900, 2,100, 5,900 |
| Aug 2020 | 18, 12, 9, 29 | 1.7-3.6 | 20-30 km W, SW, SE, S, E, NW | - | 20 | 2,300, 3,800, 5,300, 10,700 |
| Sep 2020 | 39, 35, 33, 38, 40 | 1.8-3.5 | 25-35 km SE, S, SW, W, E, NE, N, NW, W | Lari, Achoma, Maca, Chivay, Taya, Huambo, Huanca, and Lluta | 28 | 9,700, 2,600, 8,800, 7,800, 4,100 |
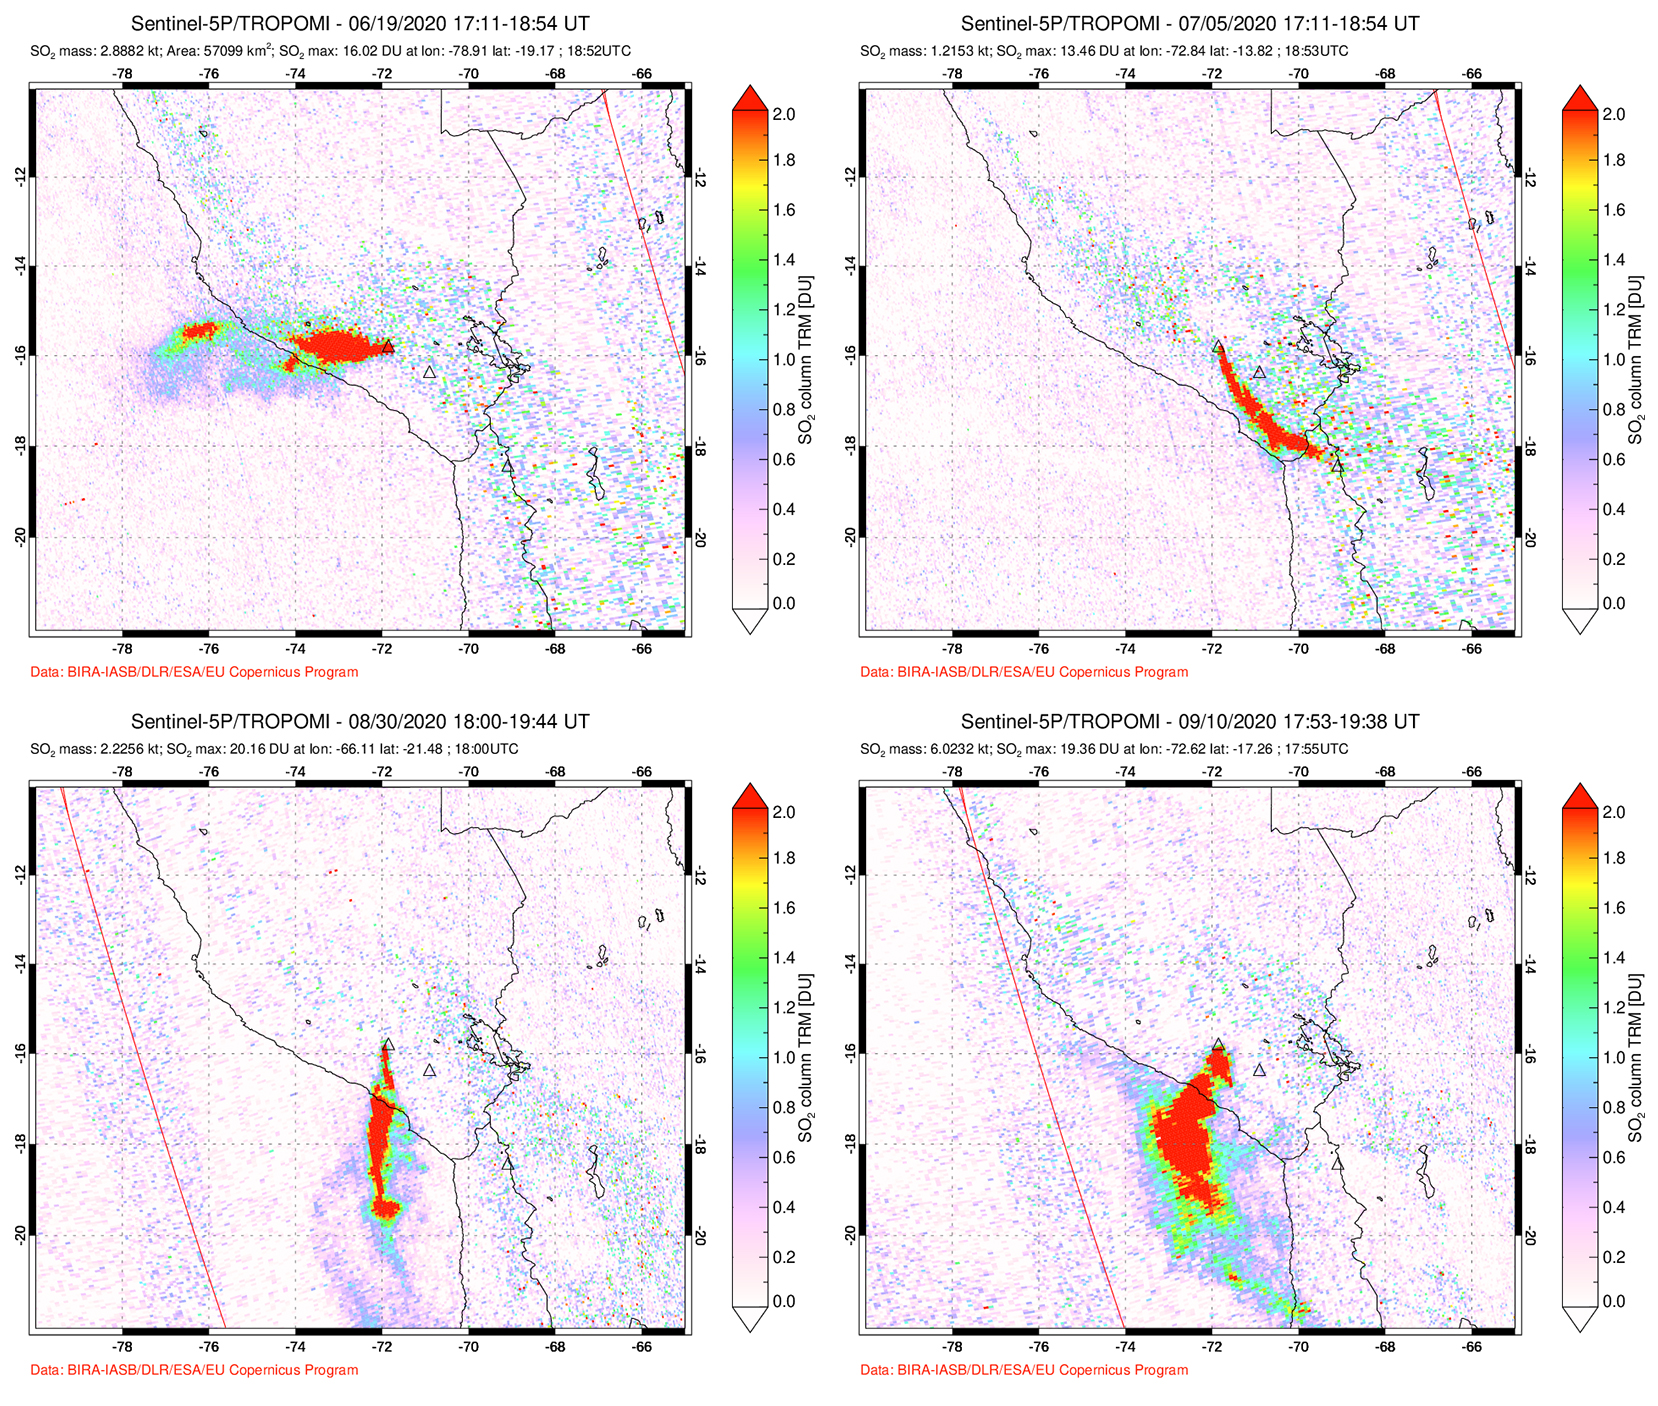 |
Figure 83. Sulfur dioxide plumes were captured almost daily from Sabancaya during June through September 2020 by the TROPOMI instrument on the Sentinel-5P satellite. Some of the largest SO2 plumes occurred on 19 June (top left), 5 July (top right), 30 August (bottom left), and 10 September (bottom right) 2020. Courtesy of NASA Global Sulfur Dioxide Monitoring Page. |
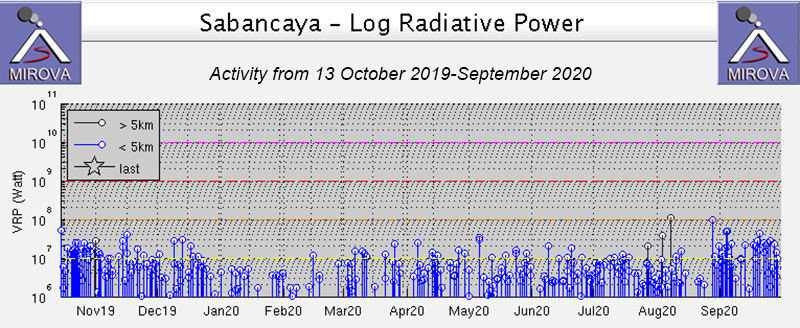 |
Figure 84. Thermal activity at Sabancaya varied in power from 13 October 2019 through September 2020, but was consistent in frequency, according to the MIROVA graph (Log Radiative Power). A pulse in thermal activity is shown in late August 2020. Courtesy of MIROVA. |
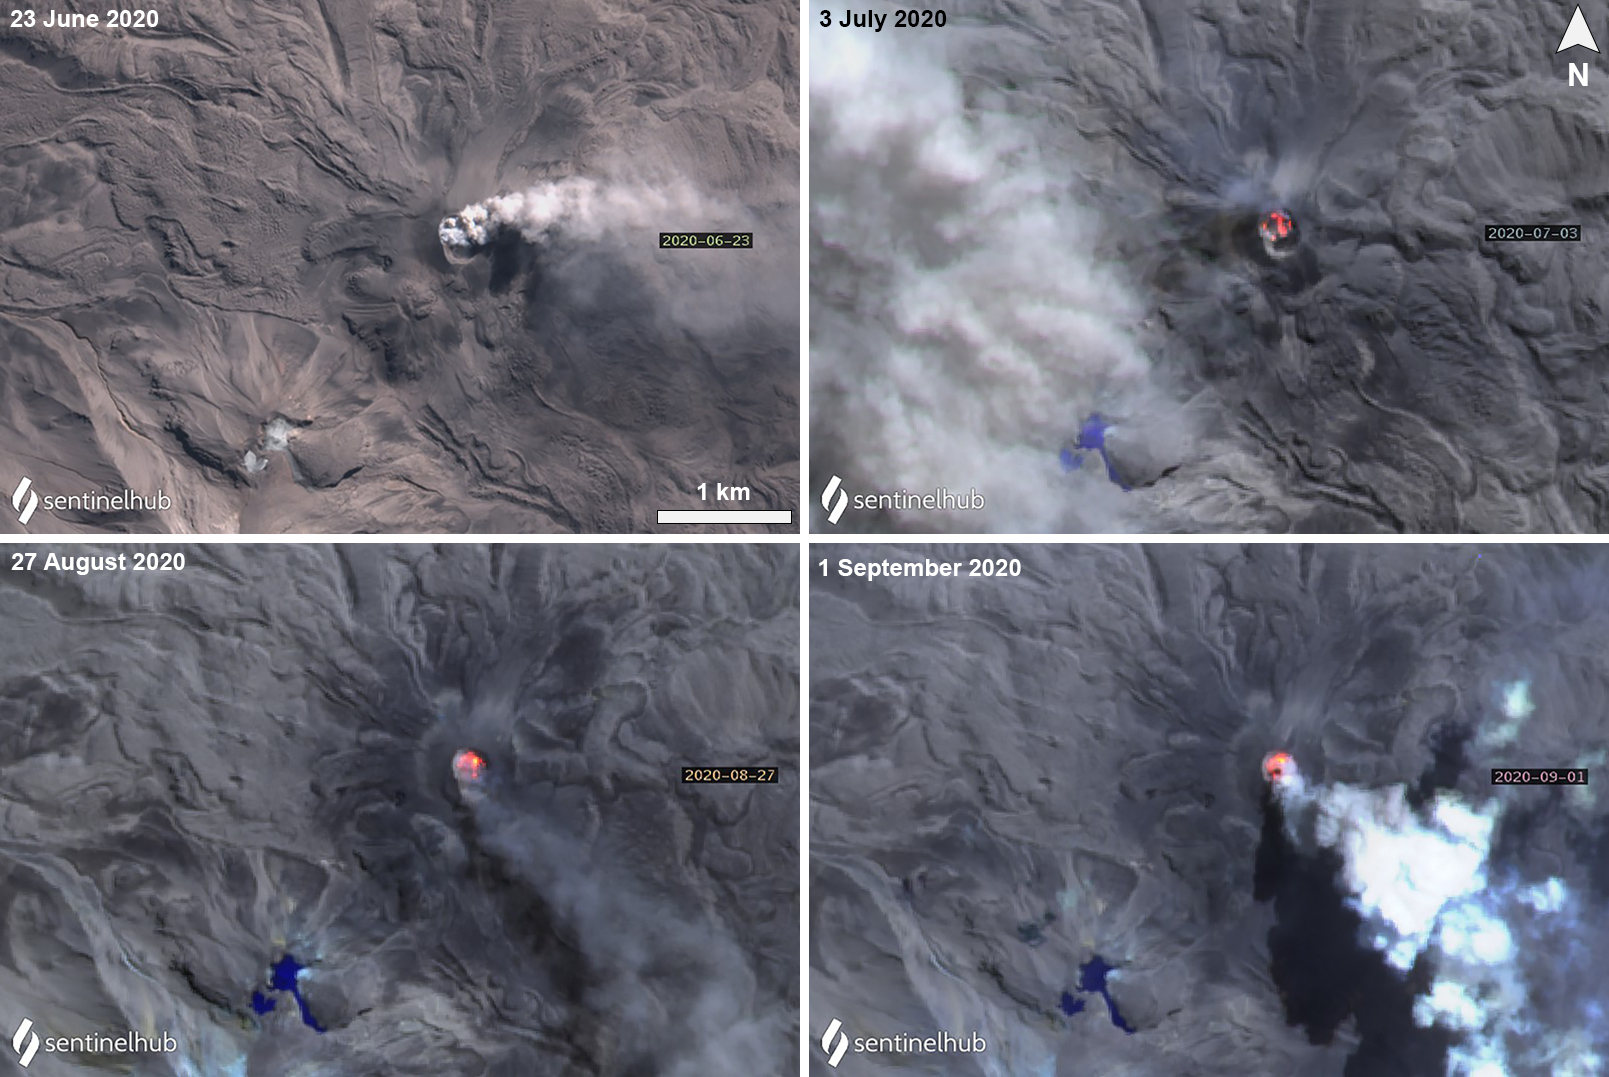 |
Figure 85. Sentinel-2 thermal satellite imagery showed frequent gas-and-steam and ash plumes rising from Sabancaya, accompanied by ongoing thermal activity from the summit crater during June through September 2020. On 23 June (top left) a dense gray-white ash plume was visible drifting E from the summit. On 3 July (top right) and 27 August (bottom left) a strong thermal hotspot (bright yellow-orange) was accompanied by some degassing. On 1 September (bottom right) the thermal anomaly persisted with a dense gray-white ash plume drifting SE from the summit. Images using “Natural Color” rendering (bands 4, 3, 2) on 23 June 2020 (top left) and the rest have “Atmospheric penetration” rendering (bands 12, 11, 8a). Courtesy of Sentinel Hub Playground. |
OVI detected slight inflation on the N part of the volcano, which continued to be observed throughout the reporting period. Persistent thermal anomalies caused by the summit crater lava dome were observed in satellite data. The average number of daily explosions during June ranged from 18 during 1-7 June to 9 during 15-21 June, which generated gas-and-ash plumes that rose 1.5-4 km above the crater and drifted 30 km SE, S, SW, NE, W, and E (figure 86). The strongest sulfur dioxide emissions were recorded during 1-7 June measuring 8,400 tons/day. On 20 June drone video showed that the lava dome had been destroyed, leaving blocks on the crater floor, though the crater remained hot, as seen in thermal satellite imagery (figure 85). During 22-28 June there were an average of 13 daily explosions, which produced ash plumes rising to a maximum height of 4 km, drifting NE, E, and SE. As a result, ashfall was reported in the districts of Chivay, Achoma, Ichupampa, Yanque, and Coporaque, and in the area of Sallali. Then, on 27 June ashfall was reported in several areas NE of the volcano, which included the districts of Madrigal, Lari, Achoma, Ichupampa, Yanque, Chivay, and Coporaque.
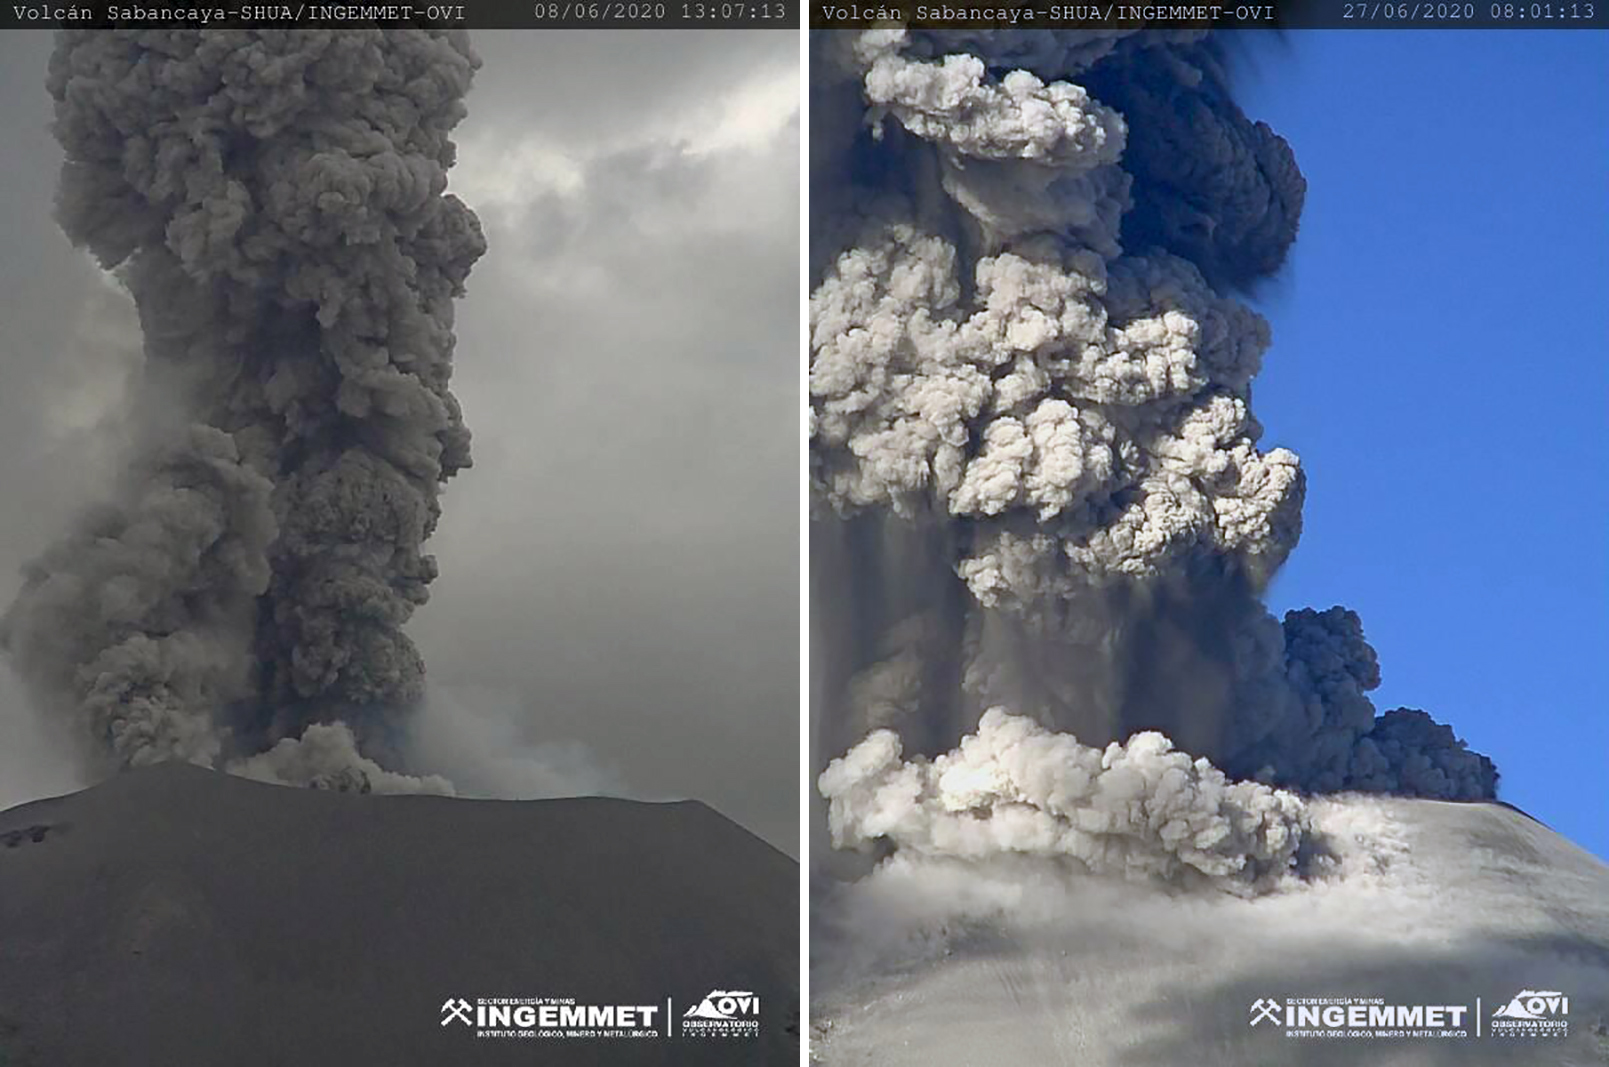 |
Figure 86. Multiple daily explosions at Sabancaya produced ash plumes that rose 1.5-4 km above the crater during June 2020. Images are showing 8 (left) and 27 (right) June 2020. Courtesy of OVI (Reporte Semanal de Monitorio de la Actividad de la Volcan Sabancaya, RSSAB-24-2020/INGEMMET Semana del 08 al 14 de junio del 2020 and RSSAB-26-2020/INGEMMET Semana del 22 al 28 de junio del 2020). |
Slight inflation continued to be monitored in July, occurring about 4-6 km N of the crater, as well as on the SE flank. Daily explosions continued, producing gas-and-ash plumes that rose 2-2.6 km above the crater and drifting 15-30 km E, NE, NW, SE, SW, S, and W (figure 87). The number of daily explosions increased slightly compared to the previous month, ranging from 20 during 1-5 July to 11 during 13-19 July. SO2 emissions that were measured each week ranged from 1,900 to 6,000 tons/day, the latter of which occurred during 6-12 July. Thermal anomalies continued to be observed in thermal satellite data over the summit crater throughout the month. During 6-12 July gas-and-ash plumes rose 2.3-2.5 km above the crater, drifting 30 km SE, E, and NE, resulting in ashfall in Achoma and Chivay.
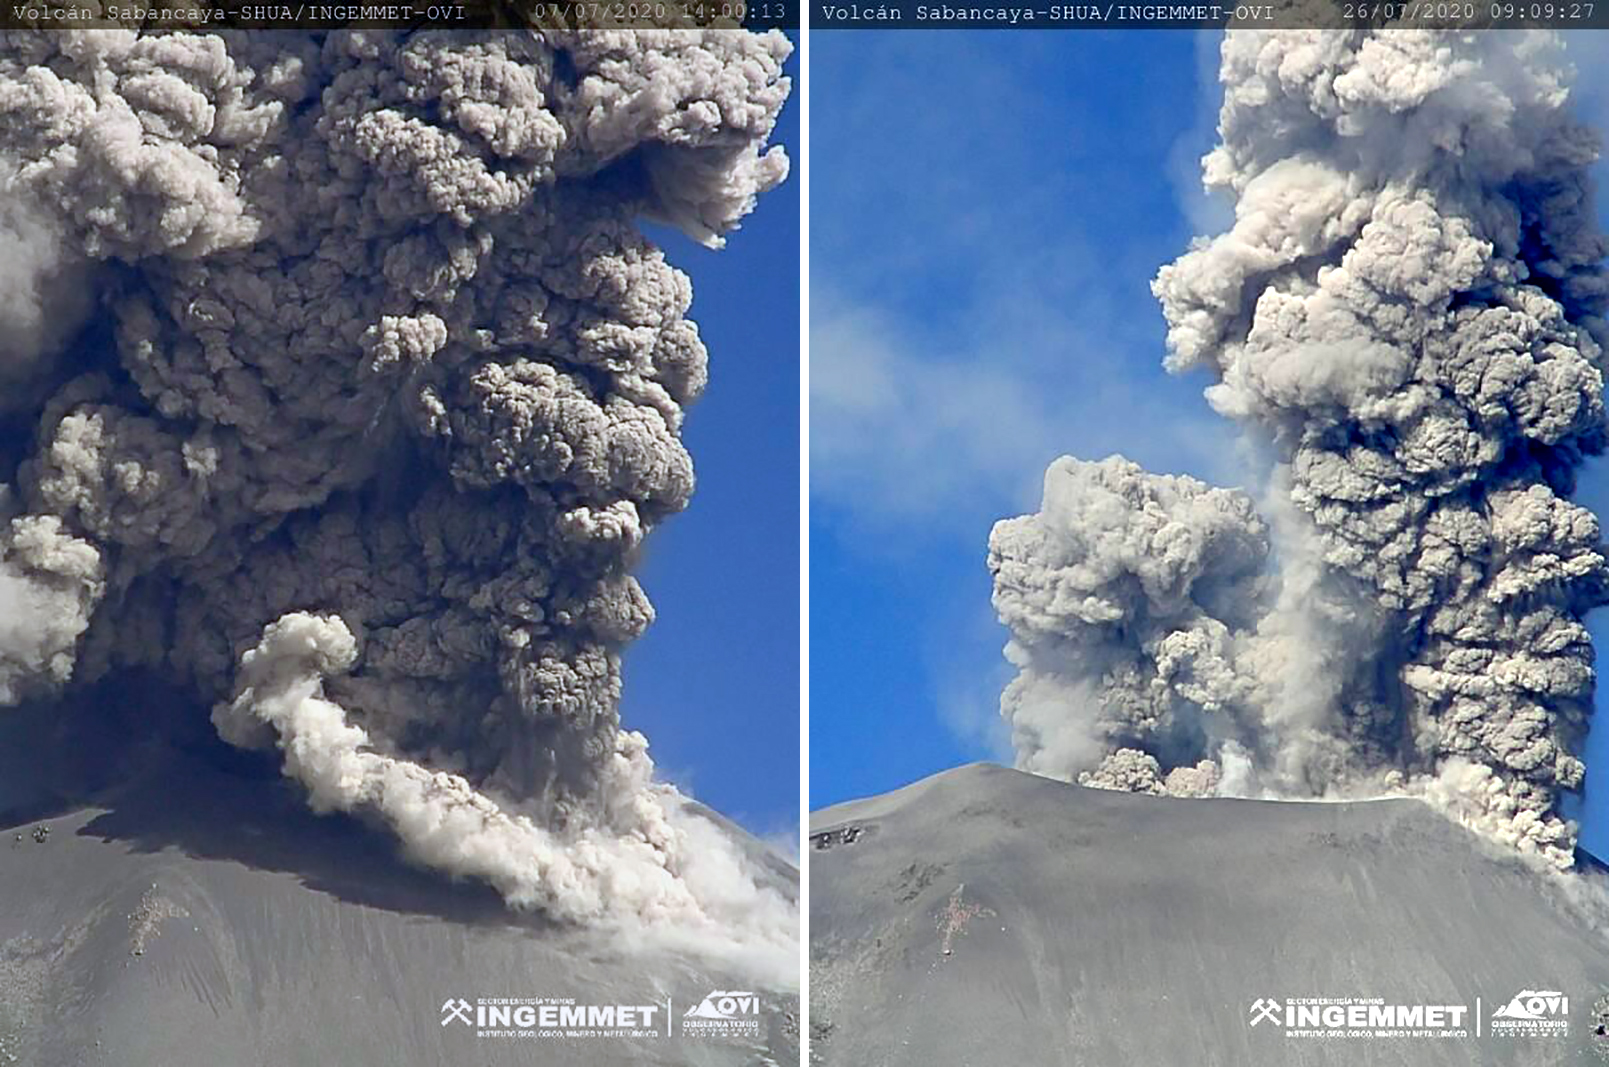 |
Figure 87. Multiple daily explosions at Sabancaya produced ash plumes that rose 2-3.5 km above the crater during July 2020. Images are showing 7 (left) and 26 (right) July 2020. Courtesy of OVI (Reporte Semanal de Monitorio de la Actividad de la Volcan Sabancaya, RSSAB-28-2020/INGEMMET Semanal: del 06 al 12 de julio del 2020 and RSSAB-30-2020/INGEMMET Semanal: del 20 al 26 de julio del 2020). |
OVI reported continued slight inflation on the N and SE flanks during August. Daily explosive activity had slightly declined in the first part of the month, ranging from 18 during the 3-9 August to 9 during 17-23 August. Dense gray gas-and-ash plumes rose 1.7-3.6 km above the crater, drifting 20-30 km in various directions (figure 88), though no ashfall was reported. Thermal anomalies were observed using satellite data throughout the month. During 24-30 August a pulse in activity increased the daily average of explosions to 29, as well as the amount of SO2 emissions (10,700 tons/day); nighttime incandescence accompanied this activity. During 28-29 August higher levels of seismicity and inflation were reported compared to the previous weeks. The daily average of explosions increased again during 31 August-6 September to 39; nighttime incandescence remained.
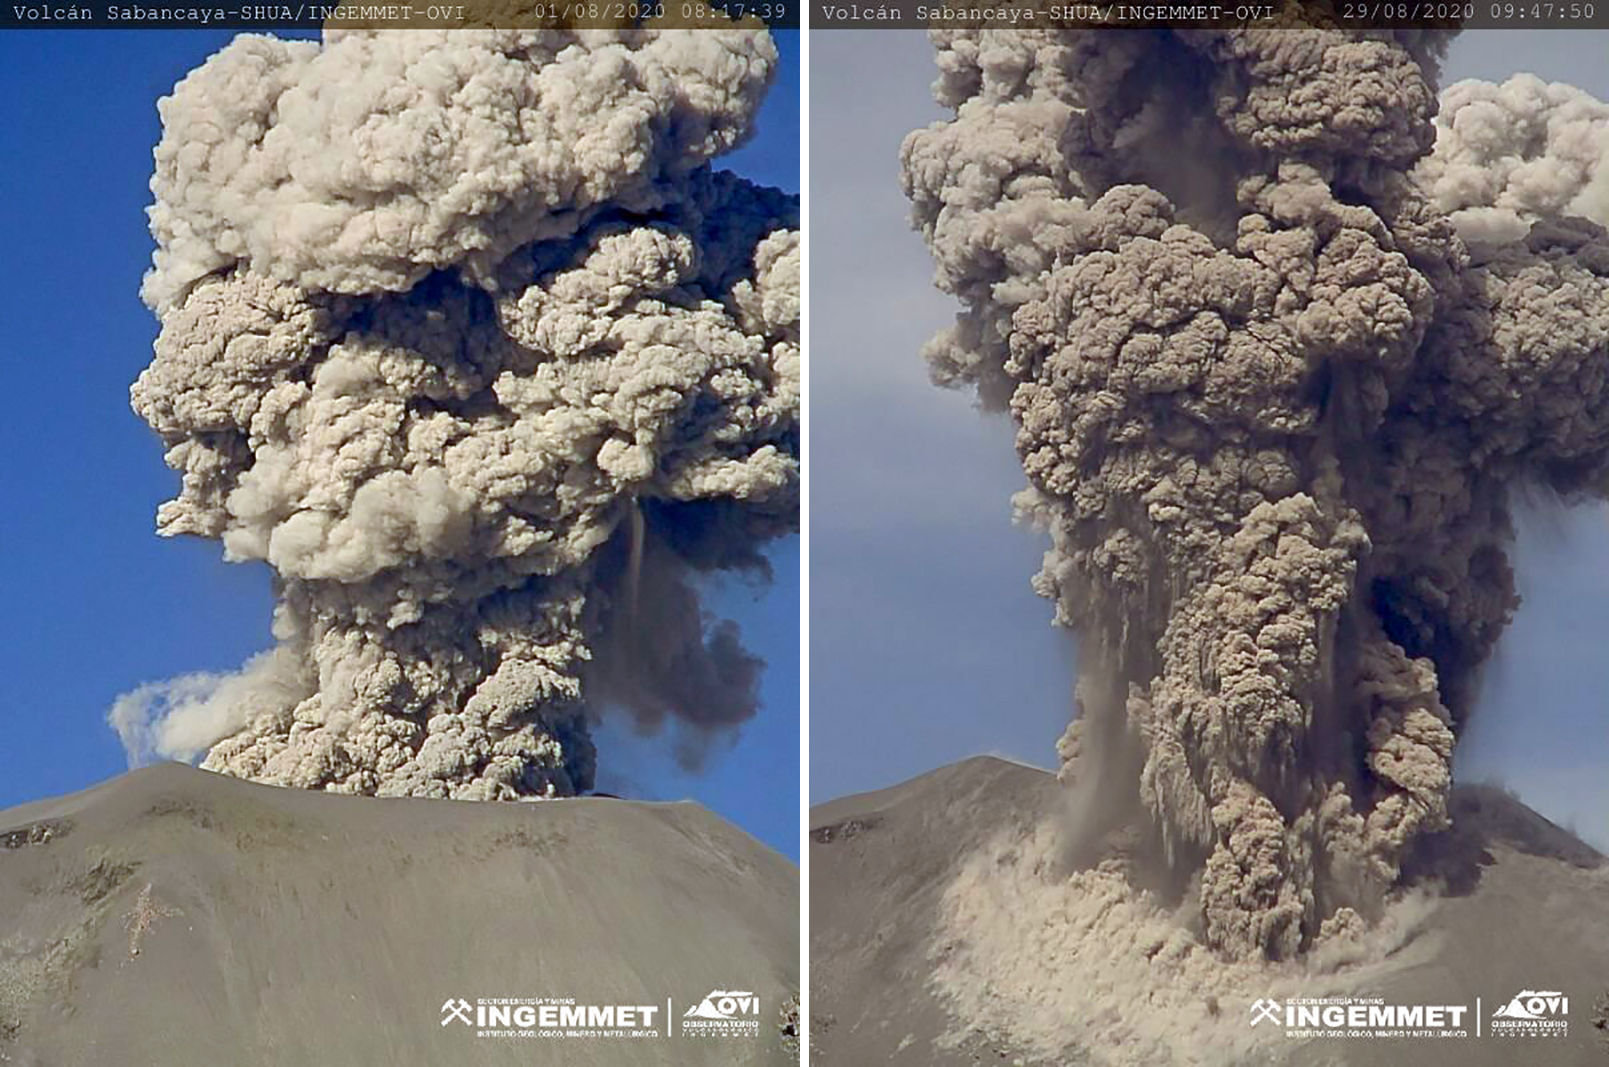 |
Figure 88. Multiple daily explosions at Sabancaya produced ash plumes that rose 1.7-3.6 km above the crater during August 2020. Images are showing 1 (left) and 29 (right) August 2020. Courtesy of OVI (Reporte Semanal de Monitorio de la Actividad de la Volcan Sabancaya, RSSAB-31-2020/INGEMMET Semanal del 27 de julio al 02 de agosto del 2020 and RSSAB-35-2020/INGEMMET Semanal del 24 al 30 de agosto del 2020). |
Increased volcanism was reported during September with the daily average of explosions ranging from 33 during 14-20 September to 40 during 28 September-4 October. The resulting gas-and-ash plumes rose 1.8-3.5 km above the crater drifting 25-35 km in various directions (figure 89). SO2 flux was measured by OVI ranging from 2,600 to 9,700 tons/day, the latter of which was recorded during 31 August to 6 September. During 7-13 September an average of 35 explosions were reported, accompanied by gas-and-ash plumes that rose 2.6-3.5 km above the crater and drifting 30 km SE, SW, W, E, and S. These events resulted in ashfall in Lari, Achoma, and Maca. The following week (14-20 September) ashfall was reported in Achoma and Chivay. During 21-27 September the daily average of explosions was 38, producing ash plumes that resulted in ashfall in Taya, Huambo, Huanca, and Lluta. Slight inflation on the N and SE flanks continued to be monitored by OVI. Strong activity, including SO2 emissions and thermal anomalies over the summit crater persisted into at least early October.
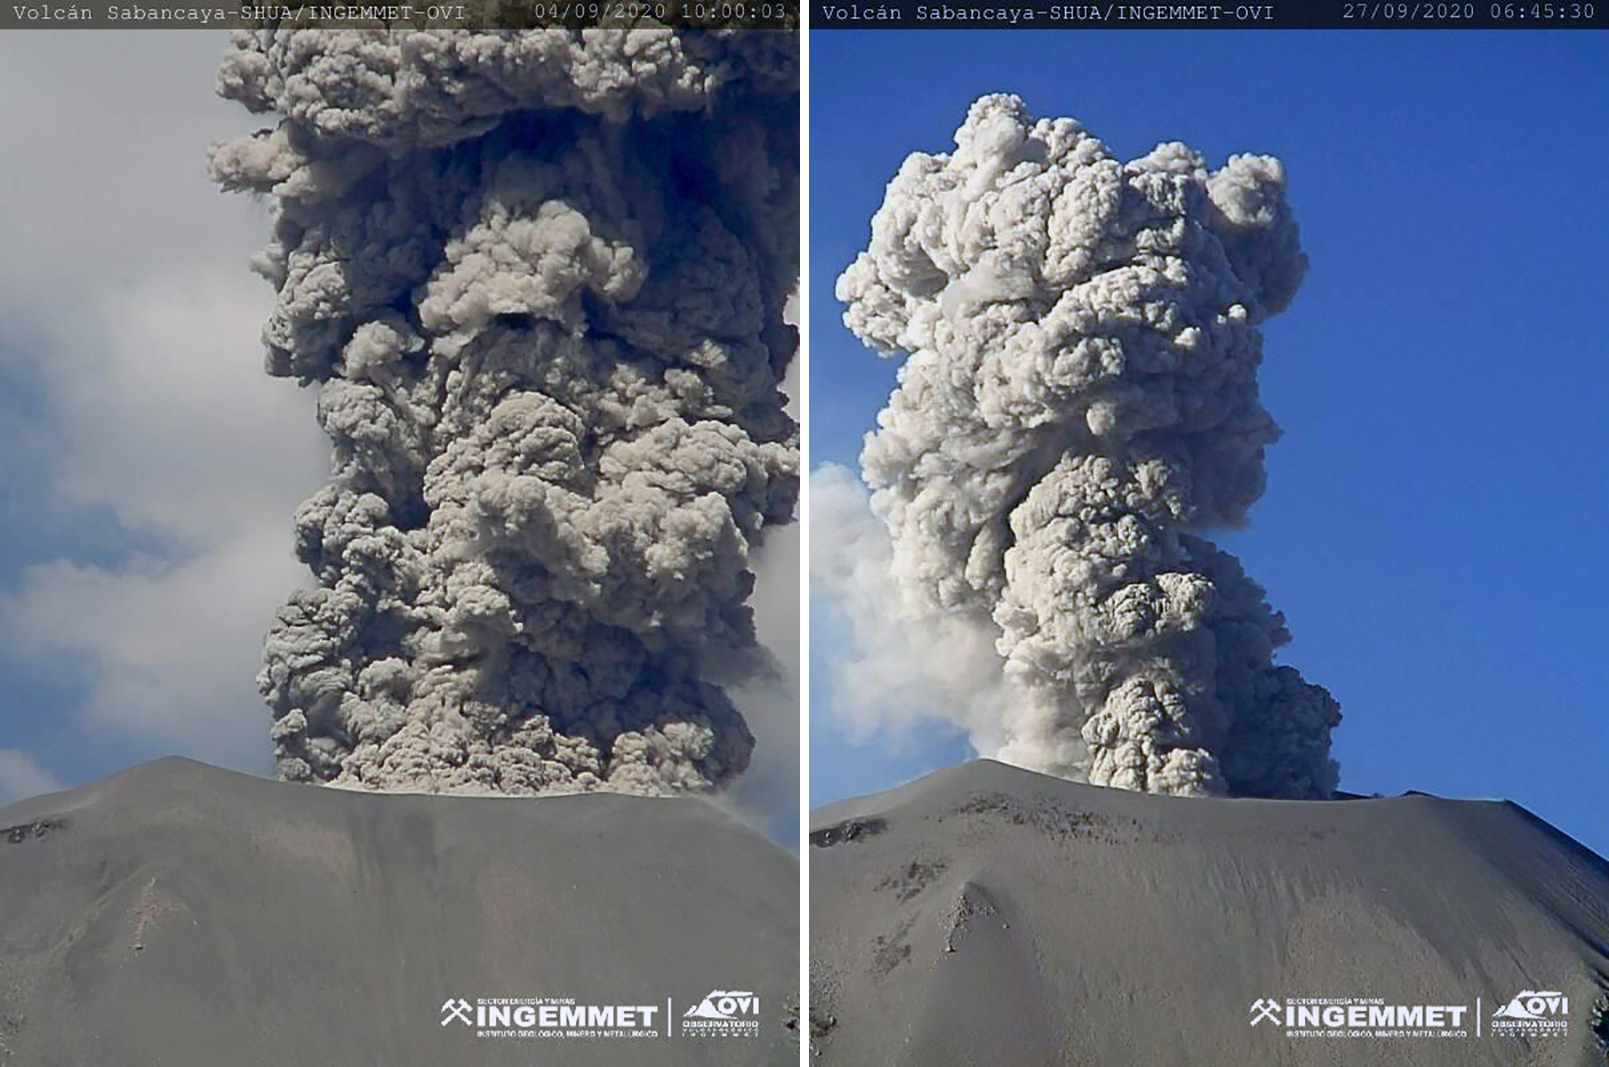 |
Figure 89. Multiple daily explosions at Sabancaya produced ash plumes that rose 1.8-2.6 km above the crater during September 2020. Images are showing 4 (left) and 27 (right) September 2020. Courtesy of OVI (Reporte Semanal de Monitorio de la Actividad de la Volcan Sabancaya, RSSAB-36-2020/INGEMMET Semanal del 31 de agosto al 06 de septiembre del 2020 and RSSAB-39-2020/INGEMMET Semanal del 21 al 27 de septiembre del 2020). |
Information Contacts: Observatorio Volcanologico del INGEMMET (Instituto Geológical Minero y Metalúrgico), Barrio Magisterial Nro. 2 B-16 Umacollo - Yanahuara Arequipa, Peru (URL: http://ovi.ingemmet.gob.pe); Instituto Geofisico del Peru (IGP), Calle Badajoz N° 169 Urb. Mayorazgo IV Etapa, Ate, Lima 15012, Perú (URL: https://www.gob.pe/igp); Buenos Aires Volcanic Ash Advisory Center (VAAC), Servicio Meteorológico Nacional-Fuerza Aérea Argentina, 25 de mayo 658, Buenos Aires, Argentina (URL: http://www.smn.gov.ar/vaac/buenosaires/inicio.php); MIROVA (Middle InfraRed Observation of Volcanic Activity), a collaborative project between the Universities of Turin and Florence (Italy) supported by the Centre for Volcanic Risk of the Italian Civil Protection Department (URL: http://www.mirovaweb.it/); Hawai'i Institute of Geophysics and Planetology (HIGP) - MODVOLC Thermal Alerts System, School of Ocean and Earth Science and Technology (SOEST), Univ. of Hawai'i, 2525 Correa Road, Honolulu, HI 96822, USA (URL: http://modis.higp.hawaii.edu/); Sentinel Hub Playground (URL: https://www.sentinel-hub.com/explore/sentinel-playground).
Daily ash explosions, large SO2 flux, and thermal anomalies from multiple domes, October 2020-March 2021
Although tephrochronology has dated activity at Sabancaya back several thousand years, renewed activity that began in 1986 was the first recorded in over 200 years. A new period of explosive activity that began in November 2016 has been characterized by pulses of ash emissions with some plumes exceeding 10 km altitude, frequent thermal anomalies, and significant SO2 plumes. Daily ash emissions and high levels of SO2 continued during October 2020-March 2021, the period covered in this report. The Observatorio Vulcanologico INGEMMET (OVI) reported daily on numbers of explosions, ash plume heights and directions of drift, seismicity, ashfall, and other activity; IGP (Instituto Geophysico del Peru) issued weekly reports of activity.
Activity at Sabancaya during October 2020-March 2021 consisted of multiple daily explosions with dense gas-and-ash plumes, SO2 emissions, and persistent thermal anomalies from the summit crater. OVI and INGEMMET confirmed the presence of a second dome inside the summit crater in mid-November. Ash plumes rose 1-2 km above the summit on most days; higher plumes occasionally reached 2.5-3.0 km above the summit. Ash most commonly drifted W and SW, but there were significant periods where the wind sent ash N and NE. Ashfall was reported in communities around the volcano on 3-8 days each month. The Buenos Aires Volcanic Ash Advisory Center (VAAC) issued three or four daily reports of ongoing ash emissions throughout the period. The plumes generally rose to 7.3-8.2 km altitude and drifted in various directions, often visible in satellite imagery.
Moderate levels of thermal energy were reported by the MIROVA project during July 2020-March 2021. Power values were generally consistent, with a small increase in November and a brief drop from late December through January 2021 (figure 90). The MODVOLC system reported nine thermal alerts in October, 12 in November, one in December, none in January, and four each both February and March. Moderate to strong SO2 emissions were recorded virtually every day during the period by the TROPOMI instrument on the Sentinel-5P satellite (figure 91).
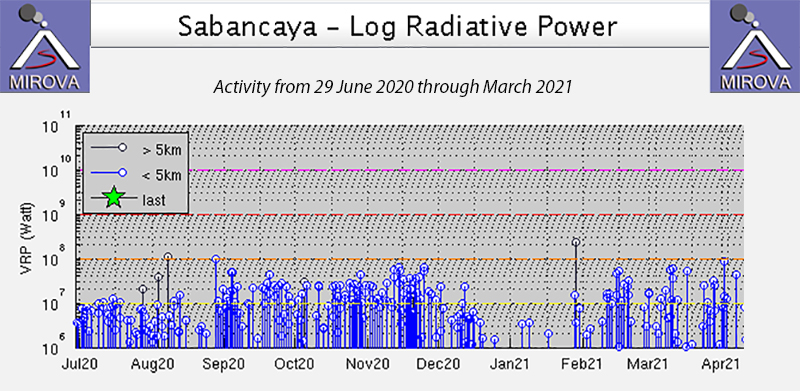 |
Figure 90. Thermal anomalies at Sabancaya from July 2020-March 2021 persisted at low to moderate power levels through the period. A small increase in frequency occurred during November 2020 and a decrease in thermal activity was apparent from late December through January 2021. Courtesy of MIROVA. |
 |
Figure 91. High levels of SO2 emissions from Sabancaya were recorded by the TROPOMI instrument on the Sentinel-5P satellite during October 2020-March 2021. Examples of the larger plumes each month are shown here; the date is along the top of each image. Courtesy of NASA Global Sulfur Dioxide Monitoring Page. |
The Buenos Aires VAAC reported intermittent pulses of ash moving SE from the summit at 7.6 km altitude on 1 October 2020 (figure 92). Continuous ash emissions were reported at 7.3-7.9 km altitude throughout the month, resulting in several reports of ashfall. Ash was reported in Lluta on 5-6 October, in Taya on 6 October, in Huanca on 10 and 15 October, in Maca and Lari on 18, 27, and 28 October, in Madrigal on 18 and 27-29 October, and in Chivay on 27 and 29 October. Ash was also visible in satellite imagery on 16 and 26 October. Thermal anomalies were present in satellite images on 1, 6, 11, 16, and 26 October (figure 93).
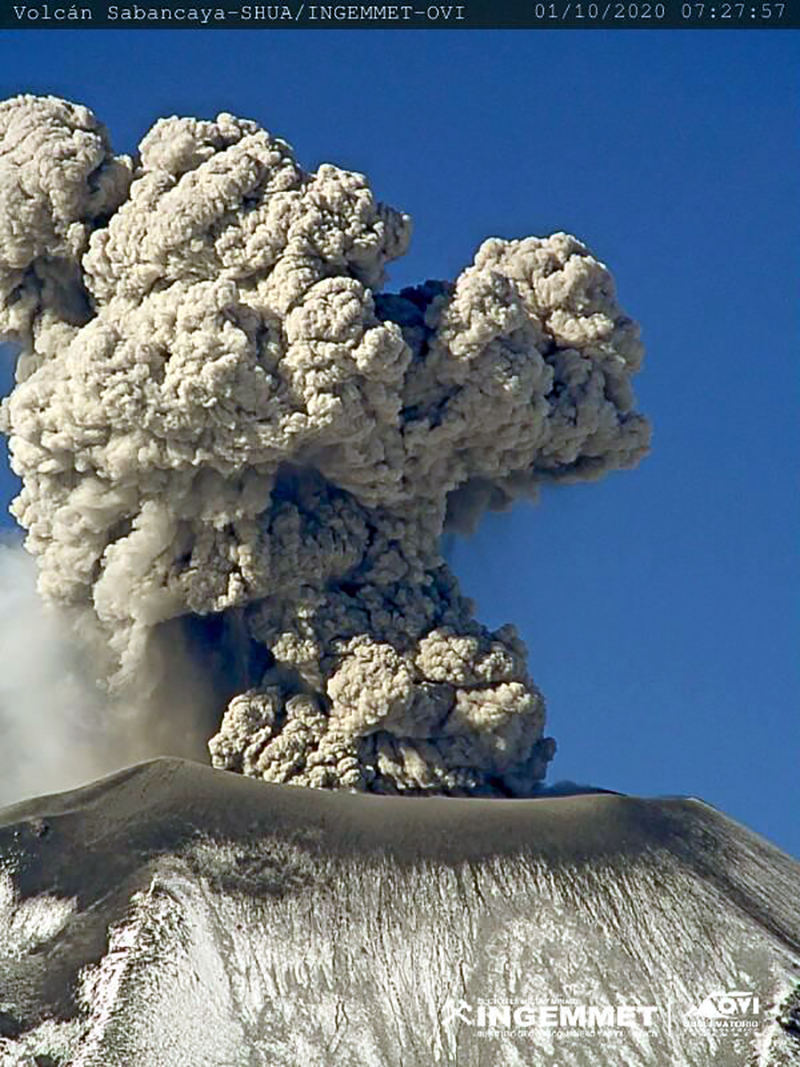 |
Figure 92. A dense plume of ash rose to 7.6 km altitude and drifted SE from the summit of Sabancaya on 1 October 2020. Courtesy of OVI-INGEMMET (REPORTE DIARIO DE LA ACTIVIDAD DEL VOLCAN Sabancaya, RDSAB-250-2020 / DGAR-INGEMMET Diario: 01 de octubre del 2020). |
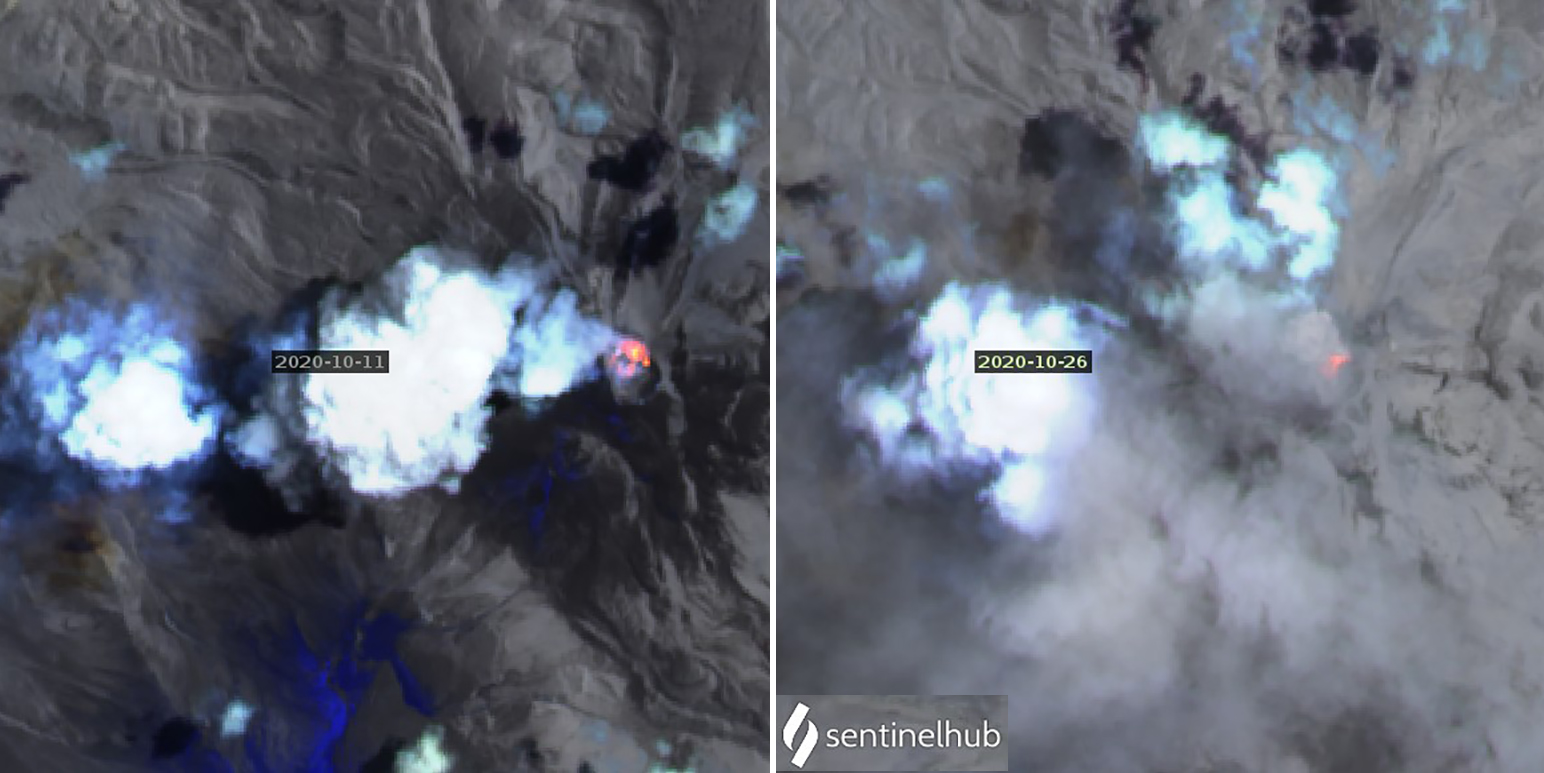 |
Figure 93. Thermal anomalies and ash emissions appeared in Sentinel-2 satellite imagery at Sabancaya multiple times during October 2020. On 11 October a strong thermal anomaly was present along with a dense steam plume drifting W (left). On 26 October both an ash plume and a thermal anomaly were present (right). Images use Atmospheric penetration rendering (bands 12, 11, 8a). Courtesy of Sentinel Hub Playground. |
Strong thermal anomalies appeared in satellite images on 5, 10, 15, 20, and 25 November 2020. Two distinct ash plumes rose from the summit crater on 5 November, and thermal anomalies were also present in multiple areas of the crater in satellite images that day (figure 94). OVI reported the existence of a second dome in the summit crater the next day. In a report issued on 17 November INGEMMET named the second dome “Iskay” and identified it in the NE part of the crater using satellite images; it was about 12,000 m2 in size (figure 95). On 25 November thermal signals from both domes were visible in satellite imagery along with an ash plume drifting W that rose to 2,900 m above the summit (figure 96). Ashfall was reported in both Madrigal and Lari on 14 and 16 November, in Lluta on 25 November, and in Huambo on 25-28 November.
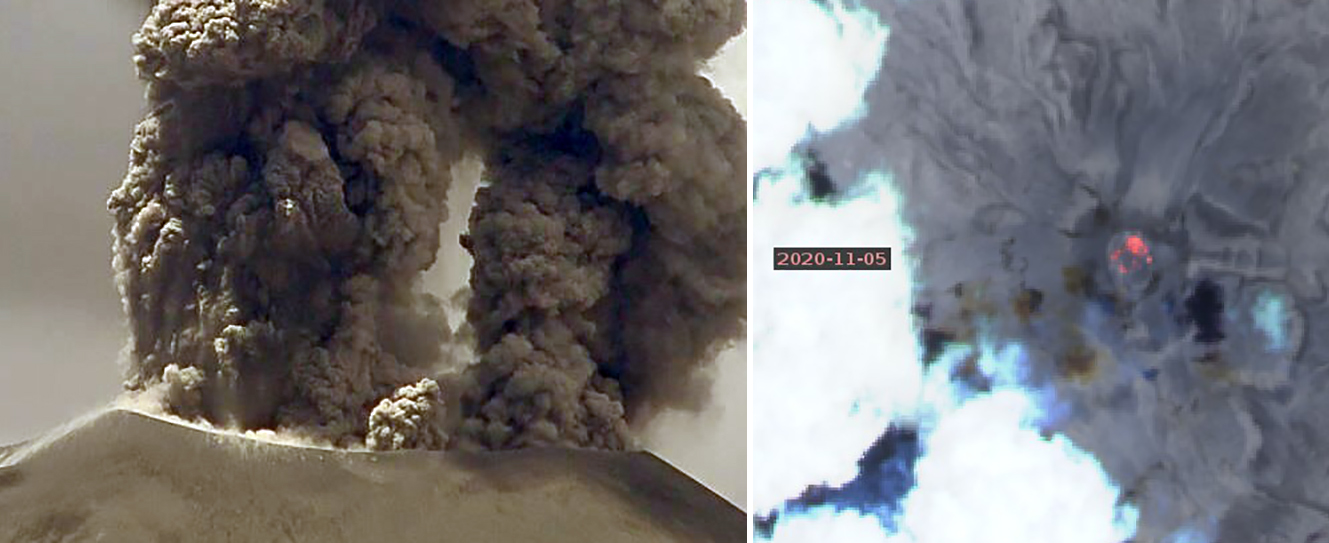 |
Figure 94. Thermal and ash activity at Sabancaya on 5 November 2020 both suggested the presence of a second dome inside the summit crater. Two ash plumes rose from the summit (left) and a strong thermal anomaly appeared in the NE quadrant of the crater (right). Left image is from INGEMMET webcam. Right image is Atmospheric penetration rendering (bands 12, 11, 8a) of Sentinel-2 satellite image. Courtesy of OVI-INGEMMET (REPORTE DIARIO DE LA ACTIVIDAD DEL VOLCAN, RDSAB-285 2020 / DGAR INGEMMET Diario: 05 de noviembre del 2020) and Sentinel Hub Playground. |
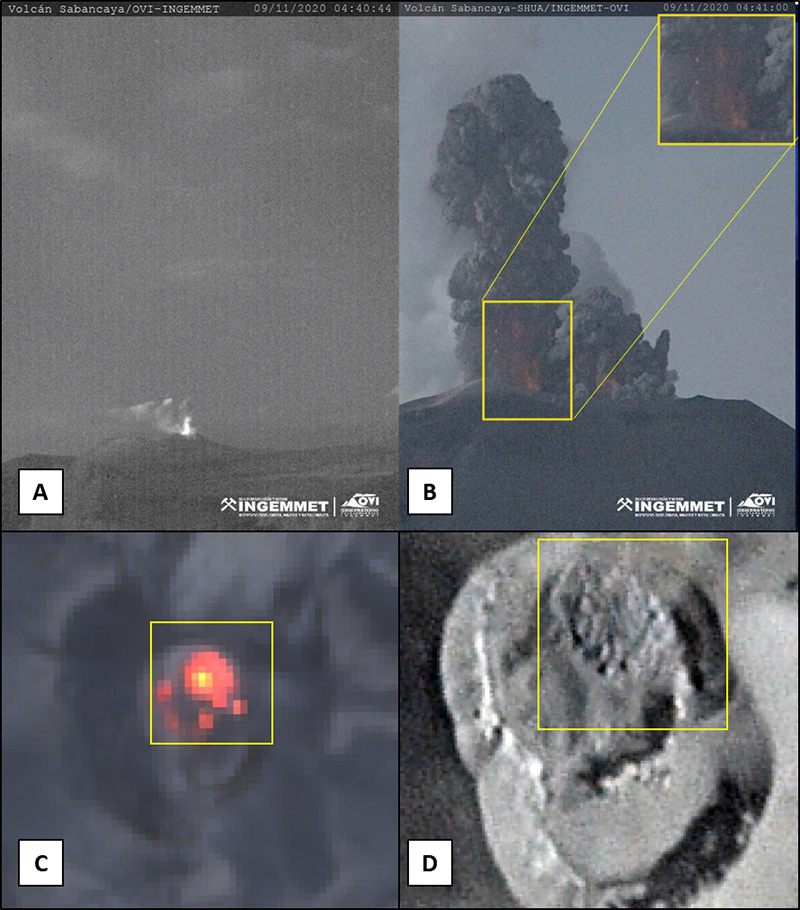 |
Figure 95. OVI-INGEMMET used webcams and satellite imagery to identify a new dome inside the summit crater of Sabancaya in November 2020. (A) Incandescence over the crater taken by a surveillance camera ~25 km NE on 9 November. (B) Incandescent ejecta rises from two locations within the summit crater taken by a surveillance camera ~4.7 km N on 9 November. (C) Sentinel-2 near-infrared satellite image from 15 November showing hotspots inside the crater; source: MOUNTS. (D) Planet Labs satellite image taken on 16 November showing the location of the growing dome; source: PlanetLabs Inc. Figure prepared by C. Laverde (SGC). Courtesy of OVI-INGEMMET (OVI / 17 noviembre, 2020 / Comentarios desactivados en INGEMMET RATIFICA LA PRESENCIA DEL SEGUNDO DOMO DE LAVA EN EL CRÁTER DEL VOLCÁN SABANCAYA DURANTE SU ACTUAL PROCESO ERUPTIVO / Noticias, Novedades). |
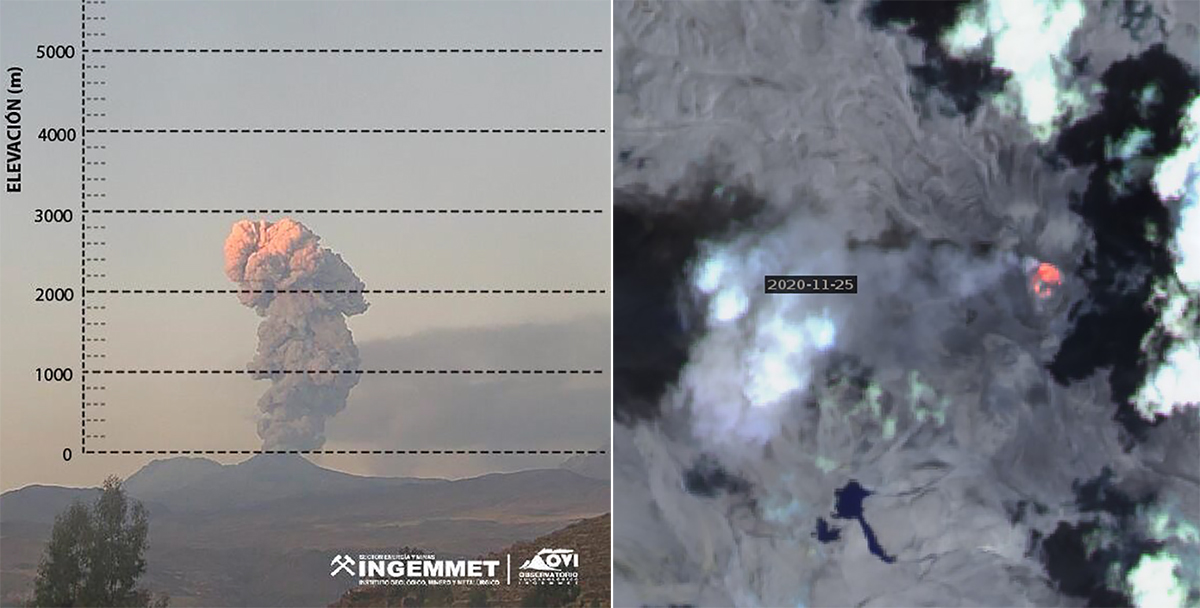 |
Figure 96. The dense ash plume that rose 2.9 km above the summit of Sabancaya on 25 November 2020 (left) could be seen drifting W in satellite imagery that day (right). It rose from the new dome in the NE quadrant of the crater, which appeared as a strong thermal anomaly in the Sentinel-2 satellite image using Atmospheric penetration rendering (bands 12, 11, 8a). Courtesy of OVI-INGEMMET (REPORTE DIARIO DE LA ACTIVIDAD DEL VOLCAN Sabancaya, RDSAB-305 2020 / DGAR INGEMMET Diario: 25 de noviembre del 2020) and Sentinel Hub Playground. |
Ash emissions continued from both areas of the summit during December 2020 (figure 97); a thermal anomaly was recorded in a satellite image on 15 December. Ashfall was reported in Cabanaconde on 1, 8, and 10 December and was also reported in Pinchollo and Madrigal on 10 December. Two dense ash plumes on 5 January 2021 confirmed that both summit domes were still active (figure 98). Ash emissions appeared in satellite images on 4, 9, and 29 January 2021, along with a thermal anomaly on 29 January (figure 99). Ashfall was reported in Huanca on 15 January, Huambo on 18 January, Madrigal and Pinchollo on 27 January, and in Chivay on 29 January. A lahar descended the Pinchollo ravine near Huayraray around 1610 on 20 January.
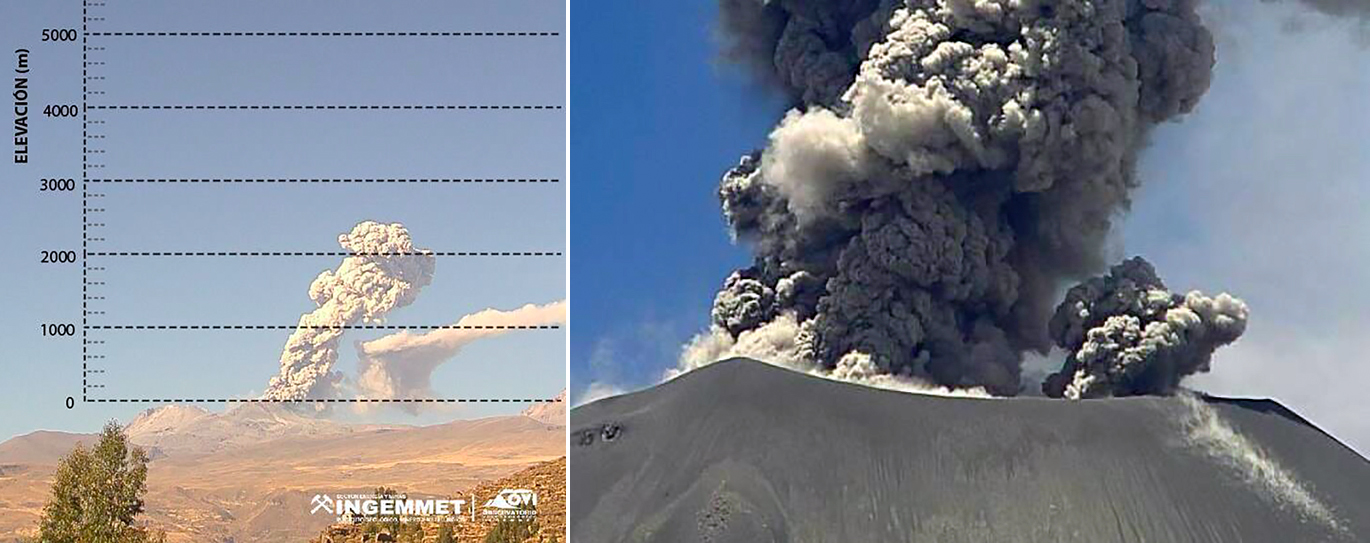 |
Figure 97. Ash emissions continued from two areas within the summit crater of Sabancaya during December 2020. On 9 December the taller plume rose to 2,400 m above the summit (left). On 16 December two dense ash plumes were captured by one of the webcams (right). Courtesy of OVI-INGEMMET (REPORTE DIARIO DE LA ACTIVIDAD DEL VOLCAN Sabancaya, RDSAB –319-2020/ DGAR –INGEMMET Diario: 09 de diciembre del 2020 and RDSAB –324-2020/ DGAR –INGEMMET Diario: 16 de diciembre del 2020). |
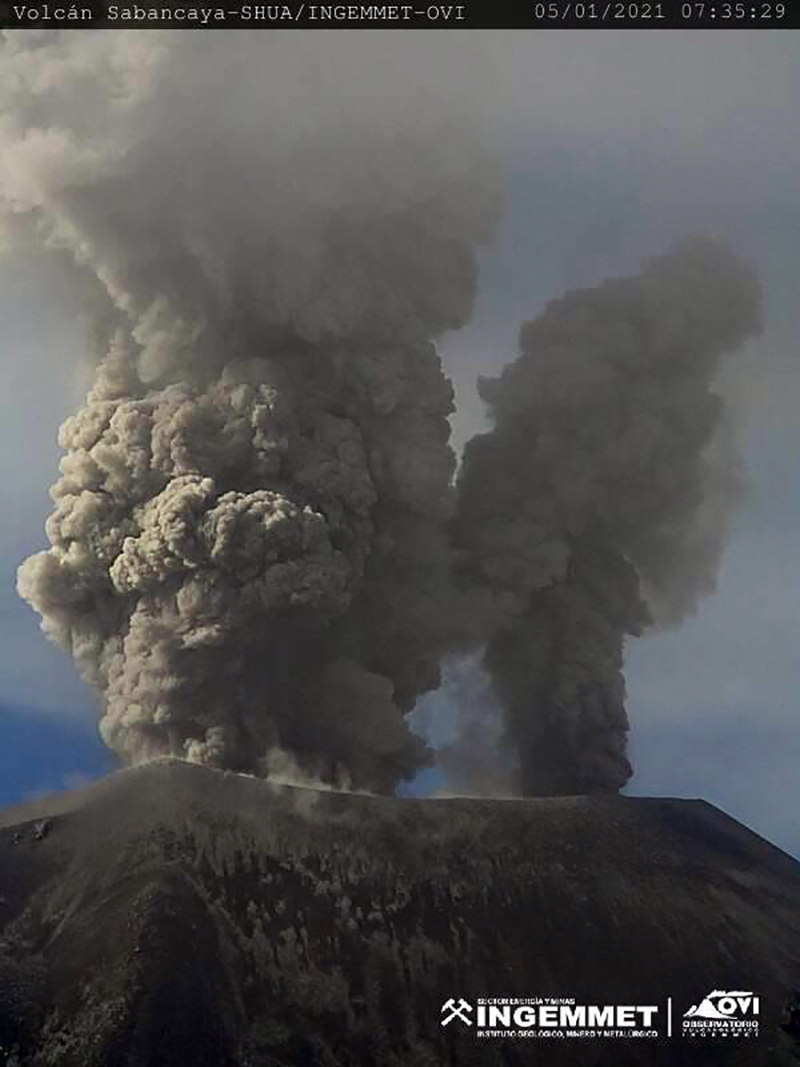 |
Figure 98. Two dense ash plumes rising from the summit of Sabancaya on 5 January 2021 confirmed that both domes were still active. Courtesy of OVI-INGEMMET (VOLCAN SABANCAYA Reporte de monitoreo volcanico, 05 enero del 2021, RMVSAB, 002 2021 / DGAR INGEMMET). |
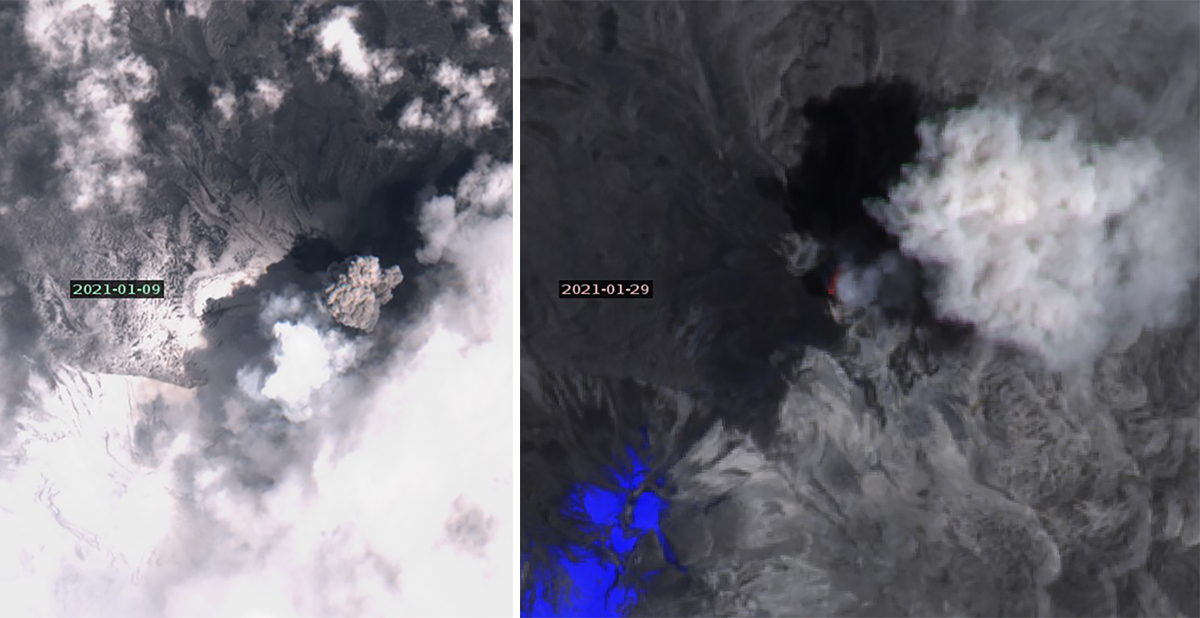 |
Figure 99. Ash emissions from Sabancaya appeared in Sentinel-2 satellite images on 4, 9, and 29 January 2021. The plume on 9 January (left) was visible in the Natural color rendering (bands 4, 3, 2) and the plume on 29 January (right) partially obscured a thermal anomaly at the summit in an Atmospheric penetration rendering (bands 12, 11, 8a) image. Courtesy of Sentinel Hub Playground. |
Daily ash emissions continued during February 2021 with plumes that rose as high as 3 km above the summit (figure 100). Ash plumes were visible in satellite images on 13 and 18 February (figure 101). Ashfall was reported in Huanca on 5 February, Pinchollo on 11 February, and in Madrigal on 11, 15, and 16 February. Two small to moderate lahars were reported in the area of Sallalli on 4 February. Ashfall was also reported in Huambo on 8, 9, and 17 March, Cabanaconde on 9 March, and in Huanca on 15 and 25 March. Satellite images indicated ash emissions on 10 March and thermal anomalies on 10 and 25 March (figure 102).
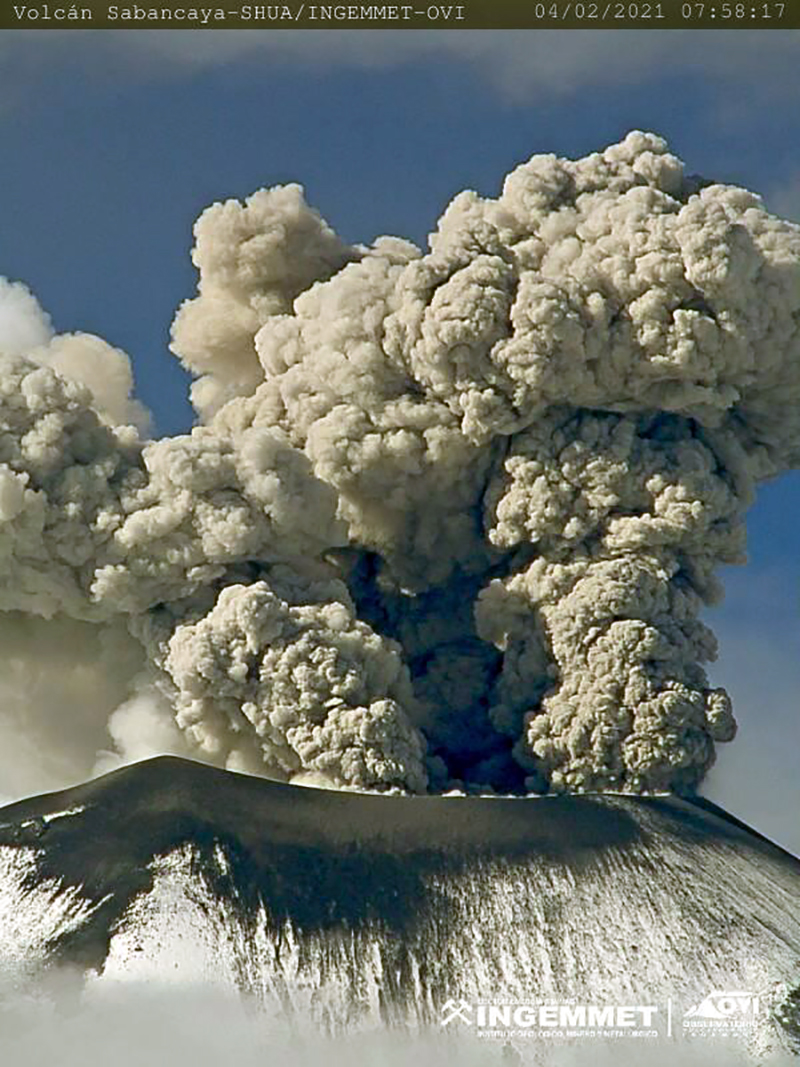 |
Figure 100. Daily ash emissions rose from Sabancaya during February 2021. On 4 February the plume rose to 2.6 km above the summit and drifted S and SE. Courtesy of OVI-INGEMMET (VOLCAN SABANCAYA, Region Arequipa, Reporte de monitoreo volcanico, RMVSAB-024 2021 / DGAR INGEMMET 04 febrero del 2021). |
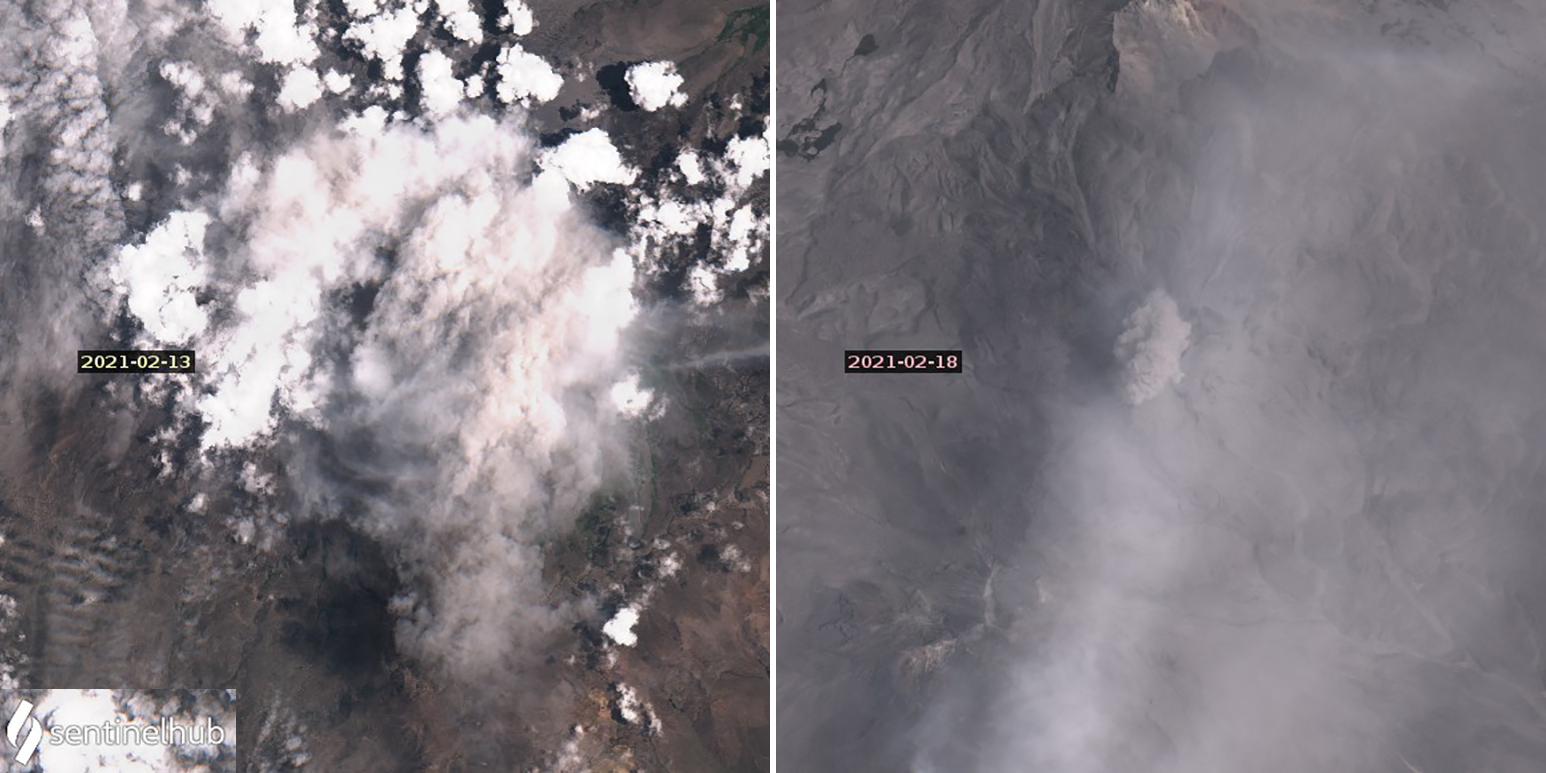 |
Figure 101. Ash plumes were a daily occurrence at Sabancaya during February 2021. A large plume covered the volcanic edifice and nearby area on 13 February (left). A smaller plume on 18 February was concentrated over the summit (right). Natural color rendering (bands 4, 3, 2) of Sentinel-2 images. Courtesy of Sentinel Hub Playground. |
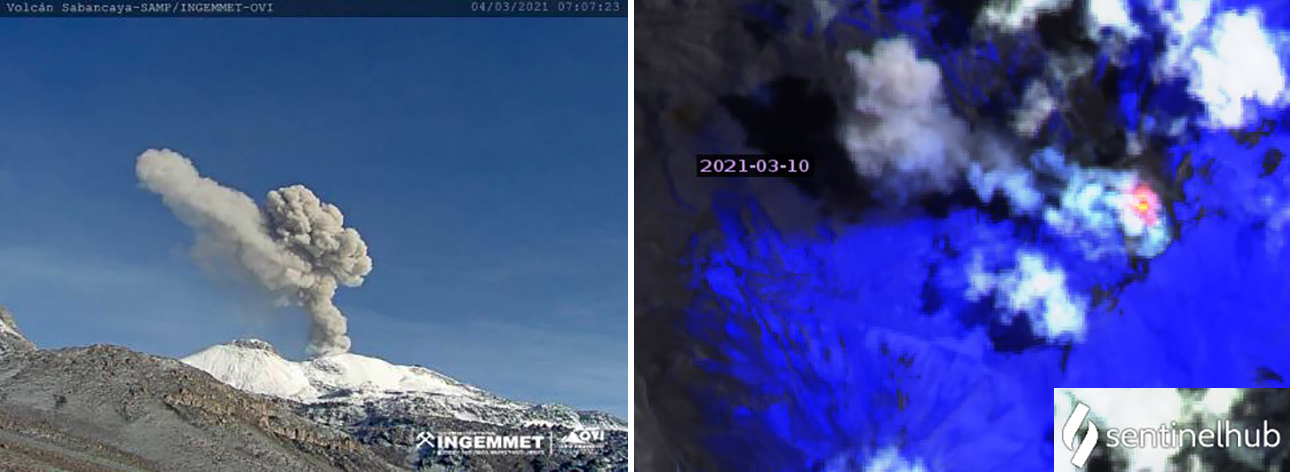 |
Figure 102. Ash emissions and thermal activity continued at Sabancaya during March 2021. On 4 March ash emissions rose to 1.8 km above the summit and drifted W and SW (left). On 10 March ash emissions rose to 900 m and drifted W and NW while a strong thermal anomaly was evident inside the summit crater (right). Sentinel-2 satellite image uses Atmospheric penetration rendering (bands 12, 11, 8a) courtesy of Sentinel Hub Playground. Left image courtesy of INGEMMET (VOLCAN SABANCAYA, Region Arequipa, Reporte de monitoreo volcanico, RMVSAB-044 2021/ DGAR INGEMMET 04 marzo del 2021). |
Information Contacts: Observatorio Volcanologico del INGEMMET (Instituto Geológical Minero y Metalúrgico), Barrio Magisterial Nro. 2 B-16 Umacollo - Yanahuara Arequipa, Peru (URL: http://ovi.ingemmet.gob.pe); Instituto Geofisico del Peru (IGP), Calle Badajoz N° 169 Urb. Mayorazgo IV Etapa, Ate, Lima 15012, Perú (URLhttps://www.igp.gob.pe/servicios/centro-vulcanologico-nacional/inicio); Buenos Aires Volcanic Ash Advisory Center (VAAC), Servicio Meteorológico Nacional-Fuerza Aérea Argentina, 25 de mayo 658, Buenos Aires, Argentina (URL: http://www.smn.gov.ar/vaac/buenosaires/inicio.php); MIROVA (Middle InfraRed Observation of Volcanic Activity), a collaborative project between the Universities of Turin and Florence (Italy) supported by the Centre for Volcanic Risk of the Italian Civil Protection Department (URL: http://www.mirovaweb.it/); Hawai'i Institute of Geophysics and Planetology (HIGP) - MODVOLC Thermal Alerts System, School of Ocean and Earth Science and Technology (SOEST), Univ. of Hawai'i, 2525 Correa Road, Honolulu, HI 96822, USA (URL: http://modis.higp.hawaii.edu/); NASA Global Sulfur Dioxide Monitoring Page, Atmospheric Chemistry and Dynamics Laboratory, NASA Goddard Space Flight Center (NASA/GSFC), 8800 Greenbelt Road, Goddard, Maryland, USA (URL: https://so2.gsfc.nasa.gov/); Sentinel Hub Playground (URL: https://www.sentinel-hub.com/explore/sentinel-playground).
Daily explosions, ash emissions, and thermal anomalies from dome during April-September 2021
Although tephrochronology has dated activity at Sabancaya back several thousand years, renewed activity that began in 1986 was the first recorded since 1784. A new period of explosive activity that began in November 2016 has been characterized by pulses of ash emissions with some plumes exceeding 10 km altitude, frequent thermal anomalies, and significant SO2 plumes. Daily ash emissions and high levels of SO2 continued during April-September 2021, the period covered in this report. The Observatorio Vulcanologico INGEMMET (OVI) reported daily on numbers of explosions, ash plume heights and directions of drift, seismicity, ashfall, and other activity; IGP (Instituto Geophysico del Peru) issued weekly reports of activity.
Activity at Sabancaya during April-September 2021 consisted of tens of daily explosions with dense gas-and-ash plumes, strong SO2 emissions, and persistent thermal anomalies from the growing dome at the summit crater. Ash plumes rose 1-2 km above the summit on most days; higher plumes occasionally reached 2.5-3.0 km. Ash most commonly drifted E and SE but there was significant variation in the wind direction. Ashfall was reported in communities around the volcano on multiple days each month except September. The Buenos Aires Volcanic Ash Advisory Center (VAAC) issued three or four daily reports of ongoing ash emissions throughout the period. The plumes rose to 6.4-8.2 km altitude and drifted in various directions, often visible in satellite imagery. Minor inflation was reported on the N flank near Hualca Hualca throughout the period.
Moderate levels of thermal energy were reported by the MIROVA project during April-September 2021 with minor fluctuations throughout the period (figure 103). The MODVOLC system reported seven thermal alerts in April, two in May, three in June, eleven in July, six in August, and two in September. Thermal anomalies and ash emissions were visible in Sentinel-2 satellite images multiple times each month (figure 104). Moderate to strong SO2 emissions were recorded virtually every day during the period by the TROPOMI instrument on the Sentinel-5P satellite (figure 105).
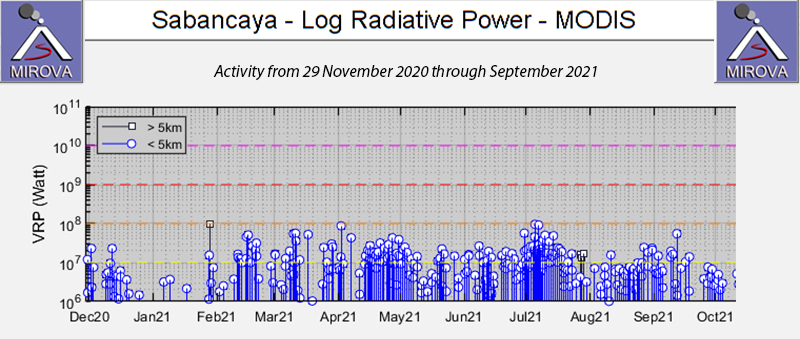 |
Figure 103. Thermal anomalies persisted at moderate levels with minor fluctuations throughout the period of April-September 2021 discussed in this report. Courtesy of MIROVA. |
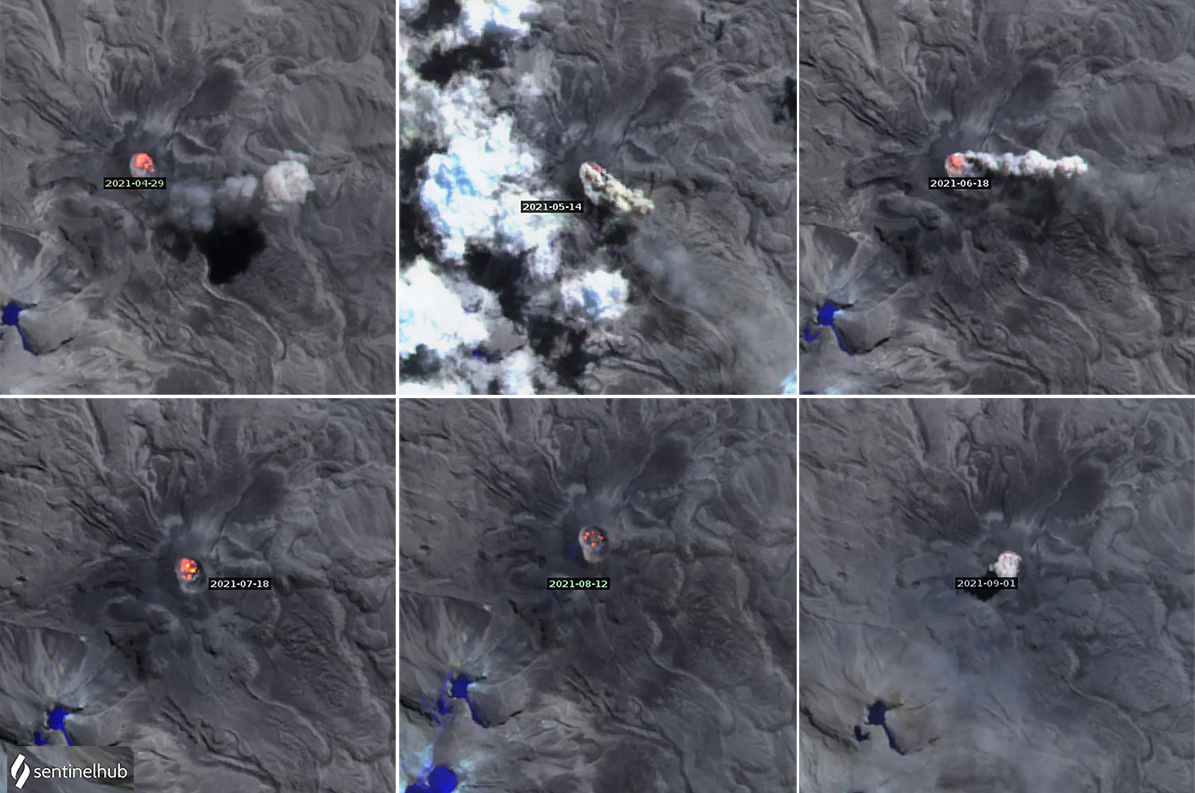 |
Figure 104. Sentinel-2 satellite images of Sabancaya showed thermal anomalies within the summit crater on multiple days every month during April-September 2021. Multiple hotspots within the crater were often visible. In addition, dense pulses of ash often rose from areas around the crater and drifted in various directions. Images use Atmospheric penetration rendering (bands 12, 11, 8a). Courtesy of Sentinel Hub Playground. |
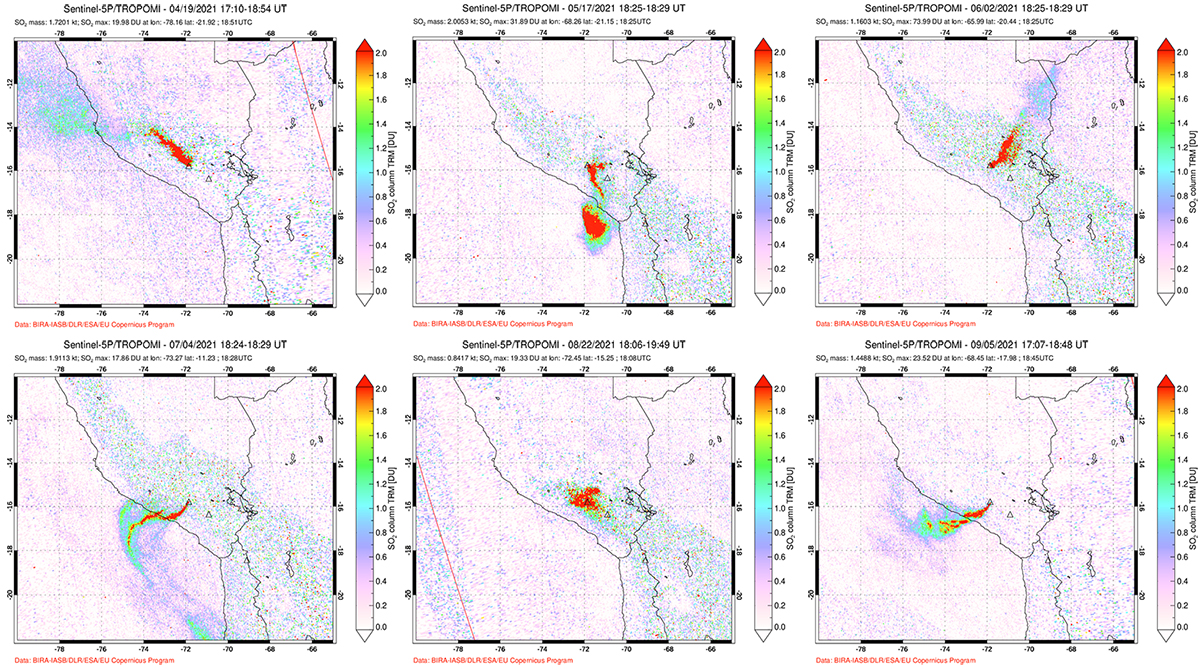 |
Figure 105. High levels of SO2 emissions from Sabancaya were recorded by the TROPOMI instrument on the Sentinel-5P satellite during April-September 2021, SO2 DU (Dobson Unit) density values were greater than 2 every day. Examples of the larger plumes each month are shown here; the date is along the top of each image. Courtesy of NASA Global Sulfur Dioxide Monitoring Page. |
Thermal anomalies were present inside the summit crater on 9, 19, 24, and 29 April 2021. Dense ash plumes rose 800-2,800 m above the crater rim from the 37-87 daily explosions. Intermittent ash plumes were reported daily by the Buenos Aires VAAC at 7.0-8.2 km altitude, drifting in multiple directions. Strong winds produced an ash plume that was visible in satellite imagery 100 km SE on 24 April (figure 106). Ashfall was reported on 12 days in different communities. Huanca reported ashfall on 6, 12, and 13 April, and it was noted in Madrigal and Pinchollo on 15, 17, 19, and 21 April. During 16-19 April ash was reported in Cabanaconde; it fell in Achoma Maca on 19 and 21 April, in Huambo on 20 April, and in Anexo de Salla on 25-26 April.
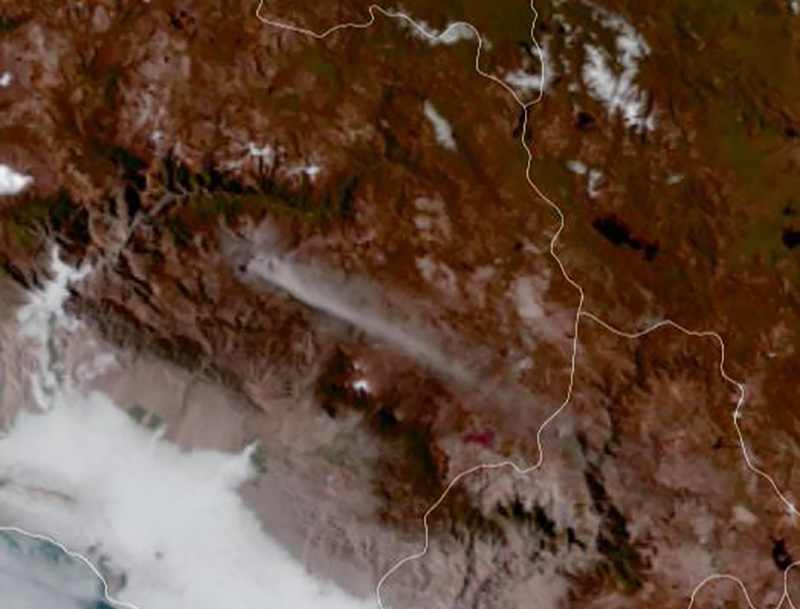 |
Figure 106. A GOES-16 satellite image from 24 April 2021 shows ash drifting 100 km SE from Sabancaya. Courtesy of OVI-INGEMMET (Reporte de actividad volcánica No. SAB111 2021, 25 de abril de 2021, 08:00 horas, Últimas 24 horas). |
Ash emissions from 43-75 daily explosions continued throughout May 2021 rising as high as 3.2 km above the summit, with ashfall reported in Madrigal and Pinchollo on 1 May and in Cabanaconde the next day. Huanca reported ashfall on 10 May, and Chivay, Achoma, Maca, and Madrigal reported it on 16 May. The next day ash fell in Chivay, Ichupampa, and Coporaque. Small amounts of ash were reported in Los Anexos de Pillones and Vincocaya in the district of San Antonio de Chuca on 19 and 20 May. Achoma and Yanque reported ashfall on 22 May. Ash plumes rose from multiple different areas of the summit crater on several occasions (figure 107). The Buenos Aires VAAC reported that daily ash emissions rose to 6.4-8.2 km altitude and drifted mostly E or SE. Thermal anomalies were present in satellite images on 4, 9, 14, 19, and 29 May.
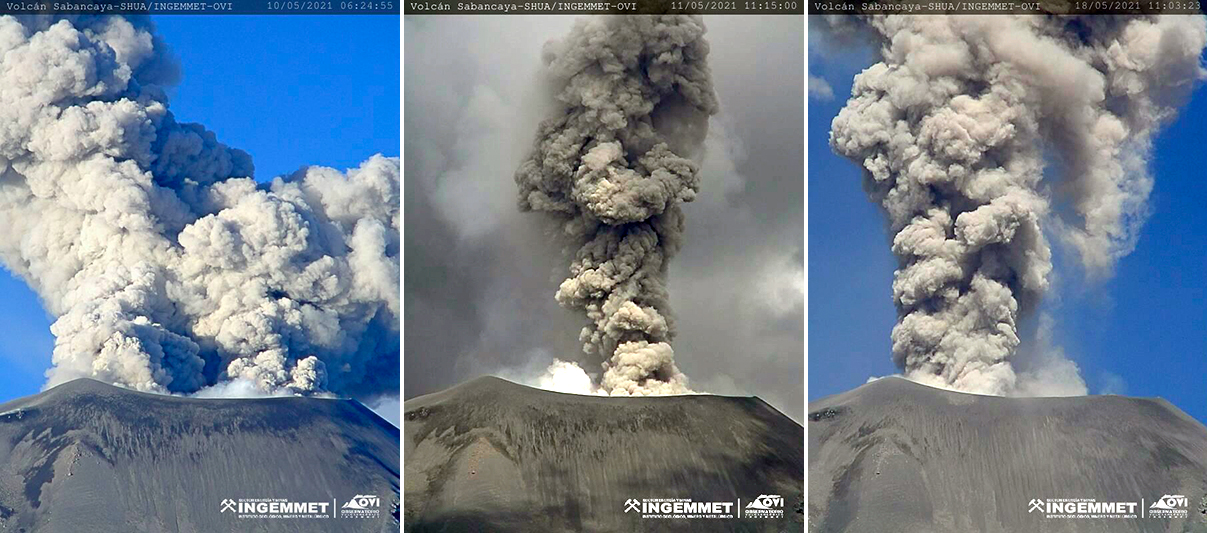 |
Figure 107. Daily ash emissions at Sabancaya during May 2021 rose from different areas within the summit crater. Two separate ash plumes on 10 May (left) originated from opposite sides of the crater, on 11 May (center) dense gray ash rose from the center right of the crater, and on 18 May it was rising from the left side of the crater (right). Courtesy of OVI-INGEMMET (Reporte de monitoreo volcanico RMVSAB-87, 88, and 93, on 10, 11, and 18 May 2021). |
Sentinel-2 satellite images showed thermal anomalies inside the summit crater on 3, 8, 13, 18, 23, and 28 June 2021. All were accompanied by ash emissions. Dense ash plumes rose up to 2,400 m above the summit from many of the 51-80 daily explosions (figure 108). The Buenos Aires VAAC also reported multiple plumes each day rising to 6.4-8.2 km altitude and drifting NE, E, or SE. Ashfall was reported in Achoma, Yanque, and Chivay during 2-4 June, and in Coporaque and Ichupampa on 3 June. Small amounts of ash were reported on 14 June in Chivay, Yanque, Ichupampa, and Coporaque, and on 30 June in Yanque, Achoma, Coporaque, Madrigal, and Cabanaconde.
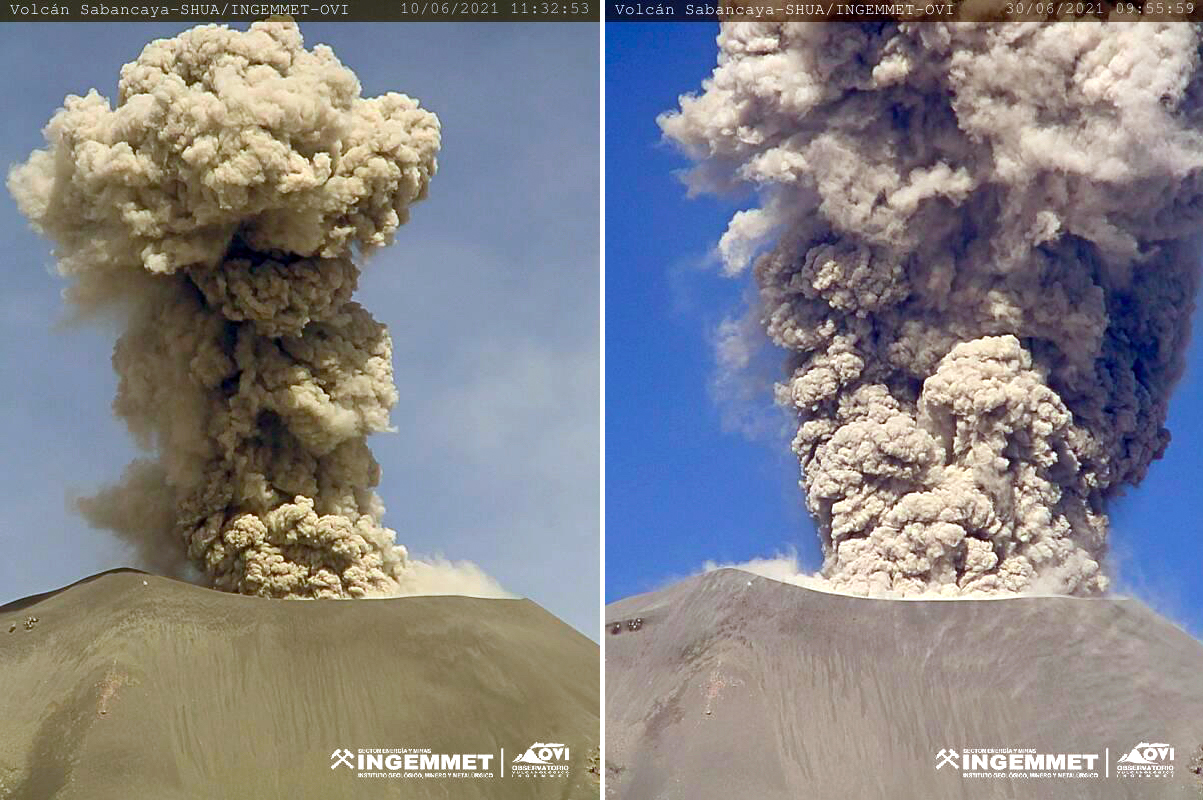 |
Figure 108. Dense ash emissions rose as high as 2,400 m above the summit crater at Sabancaya during June 2021, including the plumes on 10 (left) and 30 (right) June. Courtesy of OVI-INGEMMET (Reporte de monitoreo volcanico RMVSAB-110-2021 10 junio 2021, and RMVSAB-123-2021 30 junio 2021). |
Ashfall was reported in Cabanaconde on 1 July, in Huanca on 11, 22, and 23 July, and in Achoma on 16-17 July. Thermal anomalies, some with multiple distinct hotspots, were recorded in satellite images on 3, 8, 13, 18, 23, and 28 July. Plume heights ranged from 1,100-2,500 m above the summit from 47-118 daily explosions from several sites within the crater (figure 109); the Buenos Aires VAAC reported ash emissions drifting in many directions at 6.1-7.6 km altitude each day during the month.
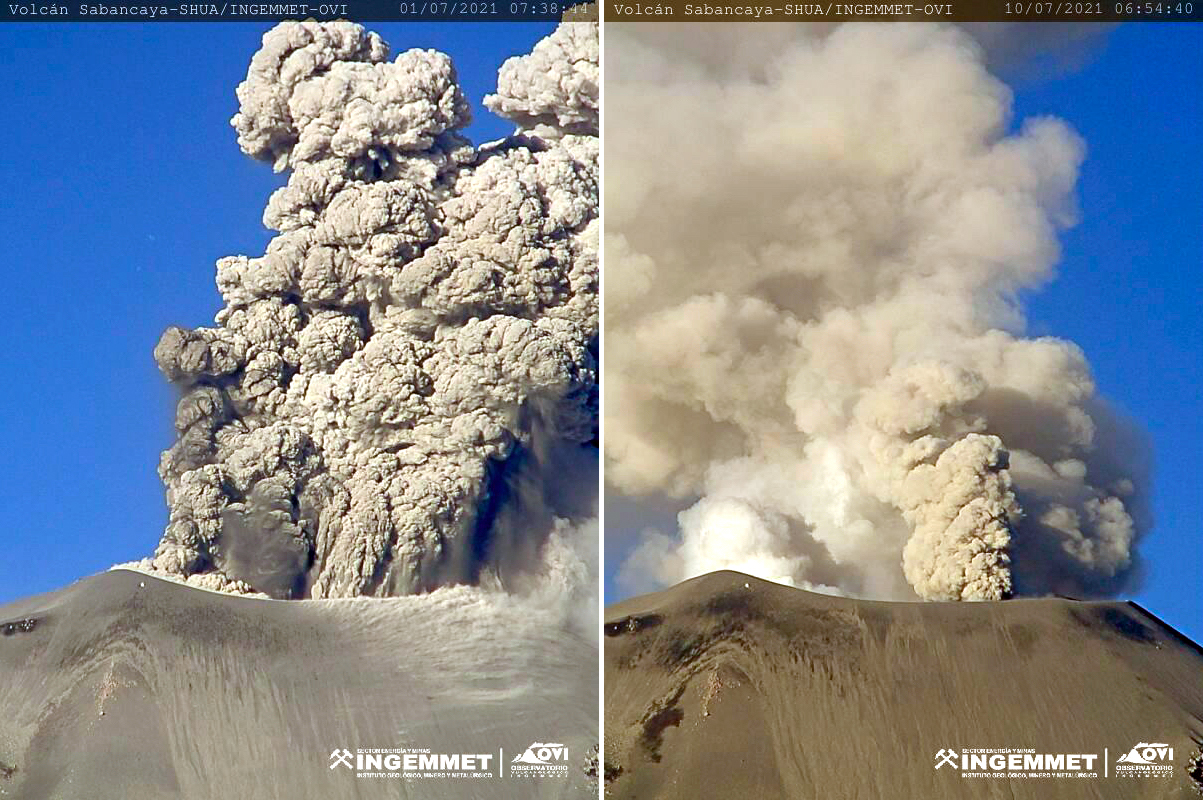 |
Figure 109. Ash and steam emissions from multiple sites on the growing dome at the summit crater of Sabancaya were typical throughout July 2021 including on 1 (left) and 10 (right) July. Courtesy of OVI-INGEMMET (Reporte de monitoreo volcanico RMVSAB-124-2021 and Reporte de actividad volcánica No. SAB189 2021, 10 de julio de 2021, 08:00 horas, Últimas 24 horas). |
The average number of daily explosions during August 2021 varied each week between 36 and 54, with plumes reported 2-3.5 km above the summit (figure 110). During the week of 9-15 August ash emissions were visible in satellite images drifting 134 km E and NE. The next week they appeared 68 km from the summit, and small amounts of ashfall were reported in Madrigal and Pinchollo. Satellite images showed thermal anomalies at the summit on 2, 12, 17, and 22 August. The Buenos Aires VAAC reported daily ash emissions rising to 6.7-8.2 km altitude. Similar activity continued throughout September 2021; ashfall was reported in Madrigal on 4 September. The number of daily explosions averaged 26-44 each week and plumes were reported 2-4 km above the summit. The Buenos Aires VAAC reported the daily ash emissions rising to 7.0-8.2 km altitude and drifting in multiple different directions. Satellite images showed thermal anomalies at the summit on 1, 11, and 16 September.
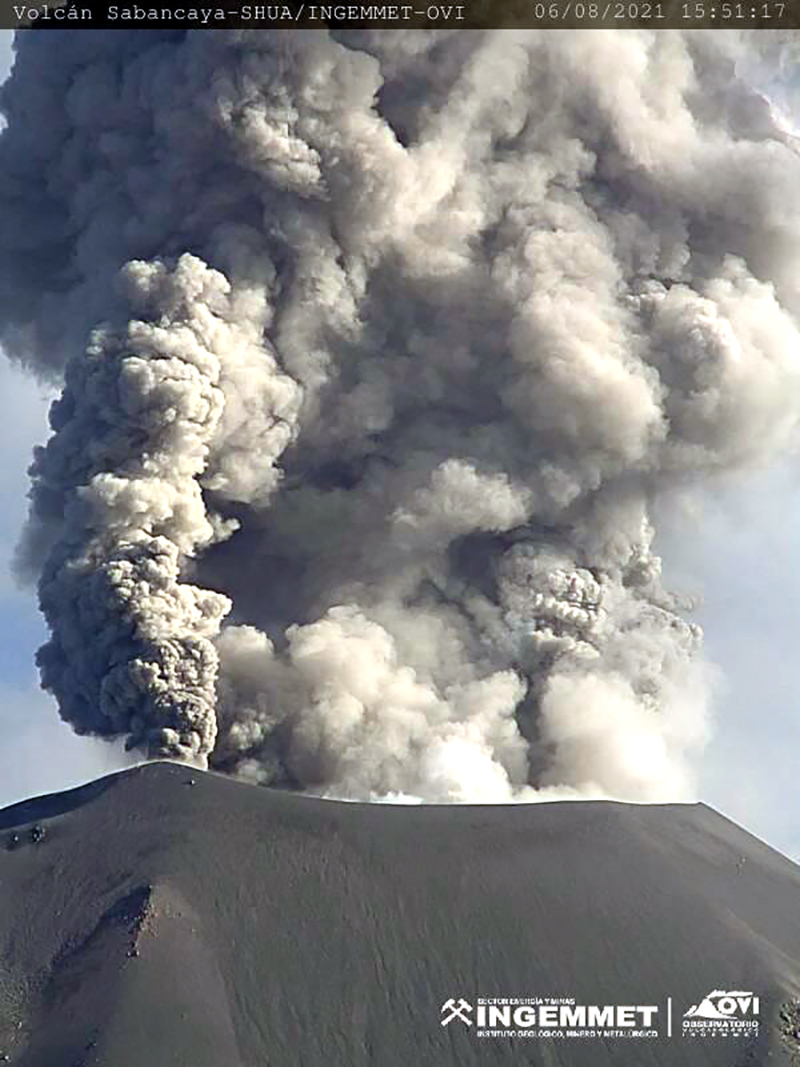 |
Figure 110. A dense ash plume from several source areas of the summit crater of Sabancaya rose multiple kilometers on 6 August 2021. Courtesy of OVI-INGEMMET (Reporte de monitoreo volcanico RMVSAB-123-2021, 2-8 agosto 2021). |
Information Contacts: Observatorio Volcanologico del INGEMMET (Instituto Geológical Minero y Metalúrgico), Barrio Magisterial Nro. 2 B-16 Umacollo - Yanahuara Arequipa, Peru (URL: http://ovi.ingemmet.gob.pe); Sentinel Hub Playground (URL: https://www.sentinel-hub.com/explore/sentinel-playground); NASA Global Sulfur Dioxide Monitoring Page, Atmospheric Chemistry and Dynamics Laboratory, NASA Goddard Space Flight Center (NASA/GSFC), 8800 Greenbelt Road, Goddard MD, USA (URL: https://so2.gsfc.nasa.gov/); MIROVA (Middle InfraRed Observation of Volcanic Activity), a collaborative project between the Universities of Turin and Florence (Italy) supported by the Centre for Volcanic Risk of the Italian Civil Protection Department (URL: http://www.mirovaweb.it/); Hawai'i Institute of Geophysics and Planetology (HIGP) - MODVOLC Thermal Alerts System, School of Ocean and Earth Science and Technology (SOEST), Univ. of Hawai'i, 2525 Correa Road, Honolulu, HI 96822, USA (URL: http://modis.higp.hawaii.edu/).
Frequent low energy explosions, ash-and-gas plumes during October 2021-March 2022
Sabancaya is located NE of Ampato and SE of Hualca Hualca volcanoes. Holocene activity has consisted of Plinian eruptions, followed by lava flow effusions, which have formed an extensive apron around the volcano on all sides except the south. Records of eruptions date back to 1750, with the most recent eruption beginning in November 2016, which has been characterized by daily explosions, ash emissions, thermal activity, and high levels of sulfur dioxide (BGVN 46:10). This activity continues during this reporting period of October 2021 through March 2022. The Observatorio Vulcanologico INGEMMET (OVI) reported daily on numbers of explosions, ash plume heights and directions of drift, seismicity, ashfall, and other activity; IGP (Instituto Geophysico del Peru) issued weekly reports of activity.
Activity during October 2021 through March 2022 consisted of tens of daily explosions, gas-and-steam plumes, strong sulfur dioxide emissions, and frequent thermal anomalies from the dome in the summit crater. Ash plumes rose 800-4,000 m above the summit and drifted in different directions. Daily sulfur dioxide measurements ranged from 400 and 5,600 tons/day, the largest of which took place on 5 January 2022. Some light ashfall was reported around the volcano during October and March. The Buenos Aires Volcanic Ash Advisory Center (VAAC) issued frequent reports of ash emissions that rose to 5.5-9.5 km altitude. Minor inflation continued to be detected near Hualca Hualca (4 km N).
Moderate levels of thermal activity were reported by the MIROVA project during October 2021 through March 2022; the intensity increased gradually during October, followed by a gradual decrease in November and continuing through mid-January 2022 (figure 111). Short breaks in activity occurred in late January through February, though the levels of these anomalies were relatively consistent. A total of 10 thermal alerts were detected by the MODVOLC system on 1, 17, and 19 November 2021, 4 January 2022, 5, 7, 12, and 21 February, and 13 and 25 March. Thermal anomalies were visible in Sentinel-2 infrared satellite images on clear weather days (figure 112). Moderate to strong sulfur dioxide plumes were recorded almost daily during the reporting period by the TROPOMI instrument on the Sentinel-5P satellite (figure 113). A majority of these plumes exceeded 2 Dobson Units (DU) and drifted in different directions.
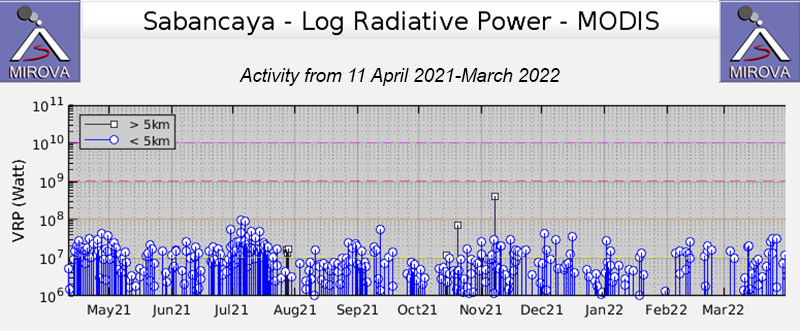 |
Figure 111. Frequent low-to-moderate strength thermal anomalies with some fluctuations occurred during October 2021 through March 2022 at Sabancaya, as shown in this MIROVA graph (Log Radiative Power). The strength of the anomalies increased gradually during October, then they were on a declining trend through mid-January 2022. Short breaks in activity occurred in late January through February, and the strength of the anomalies remained relatively consistent. Courtesy of MIROVA. |
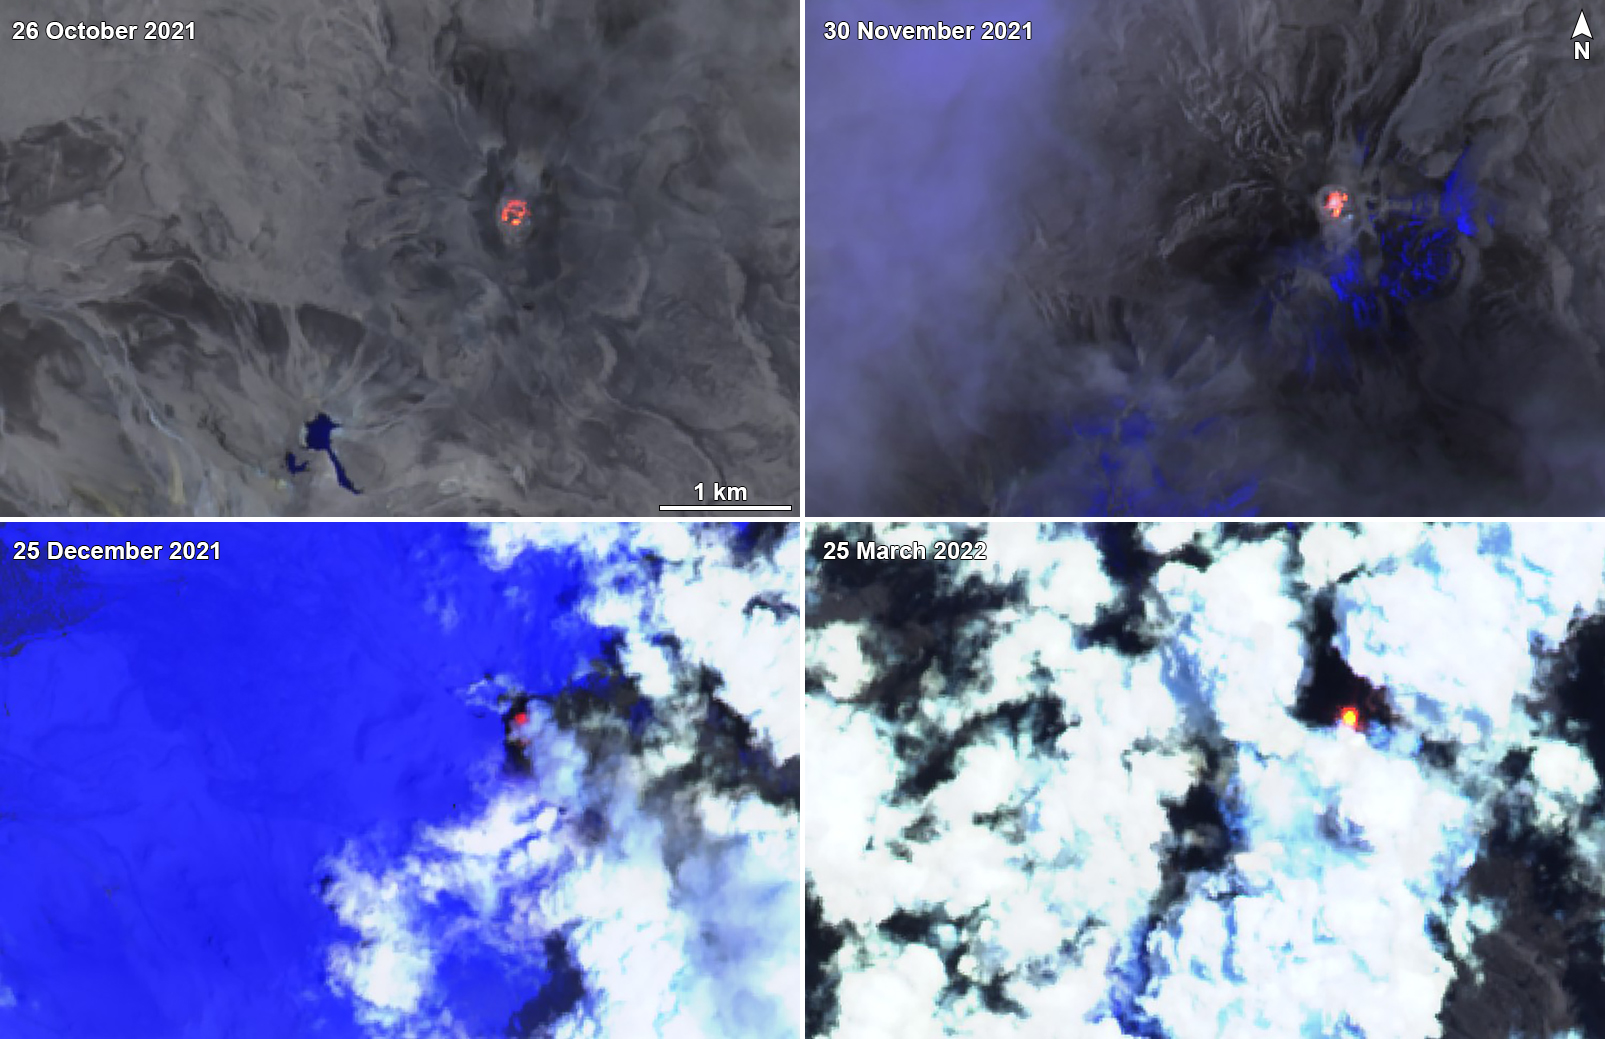 |
Figure 112. Sentinel-2 infrared satellite images of Sabancaya showed thermal anomalies in the summit crater on clear weather days on 26 October 2021 (top left), 30 November 2021 (top right), 25 December 2021 (bottom left), and 25 March 2022 (bottom right). Images use Atmospheric penetration rendering (bands 12, 11, 8a). Courtesy of Sentinel Hub Playground. |
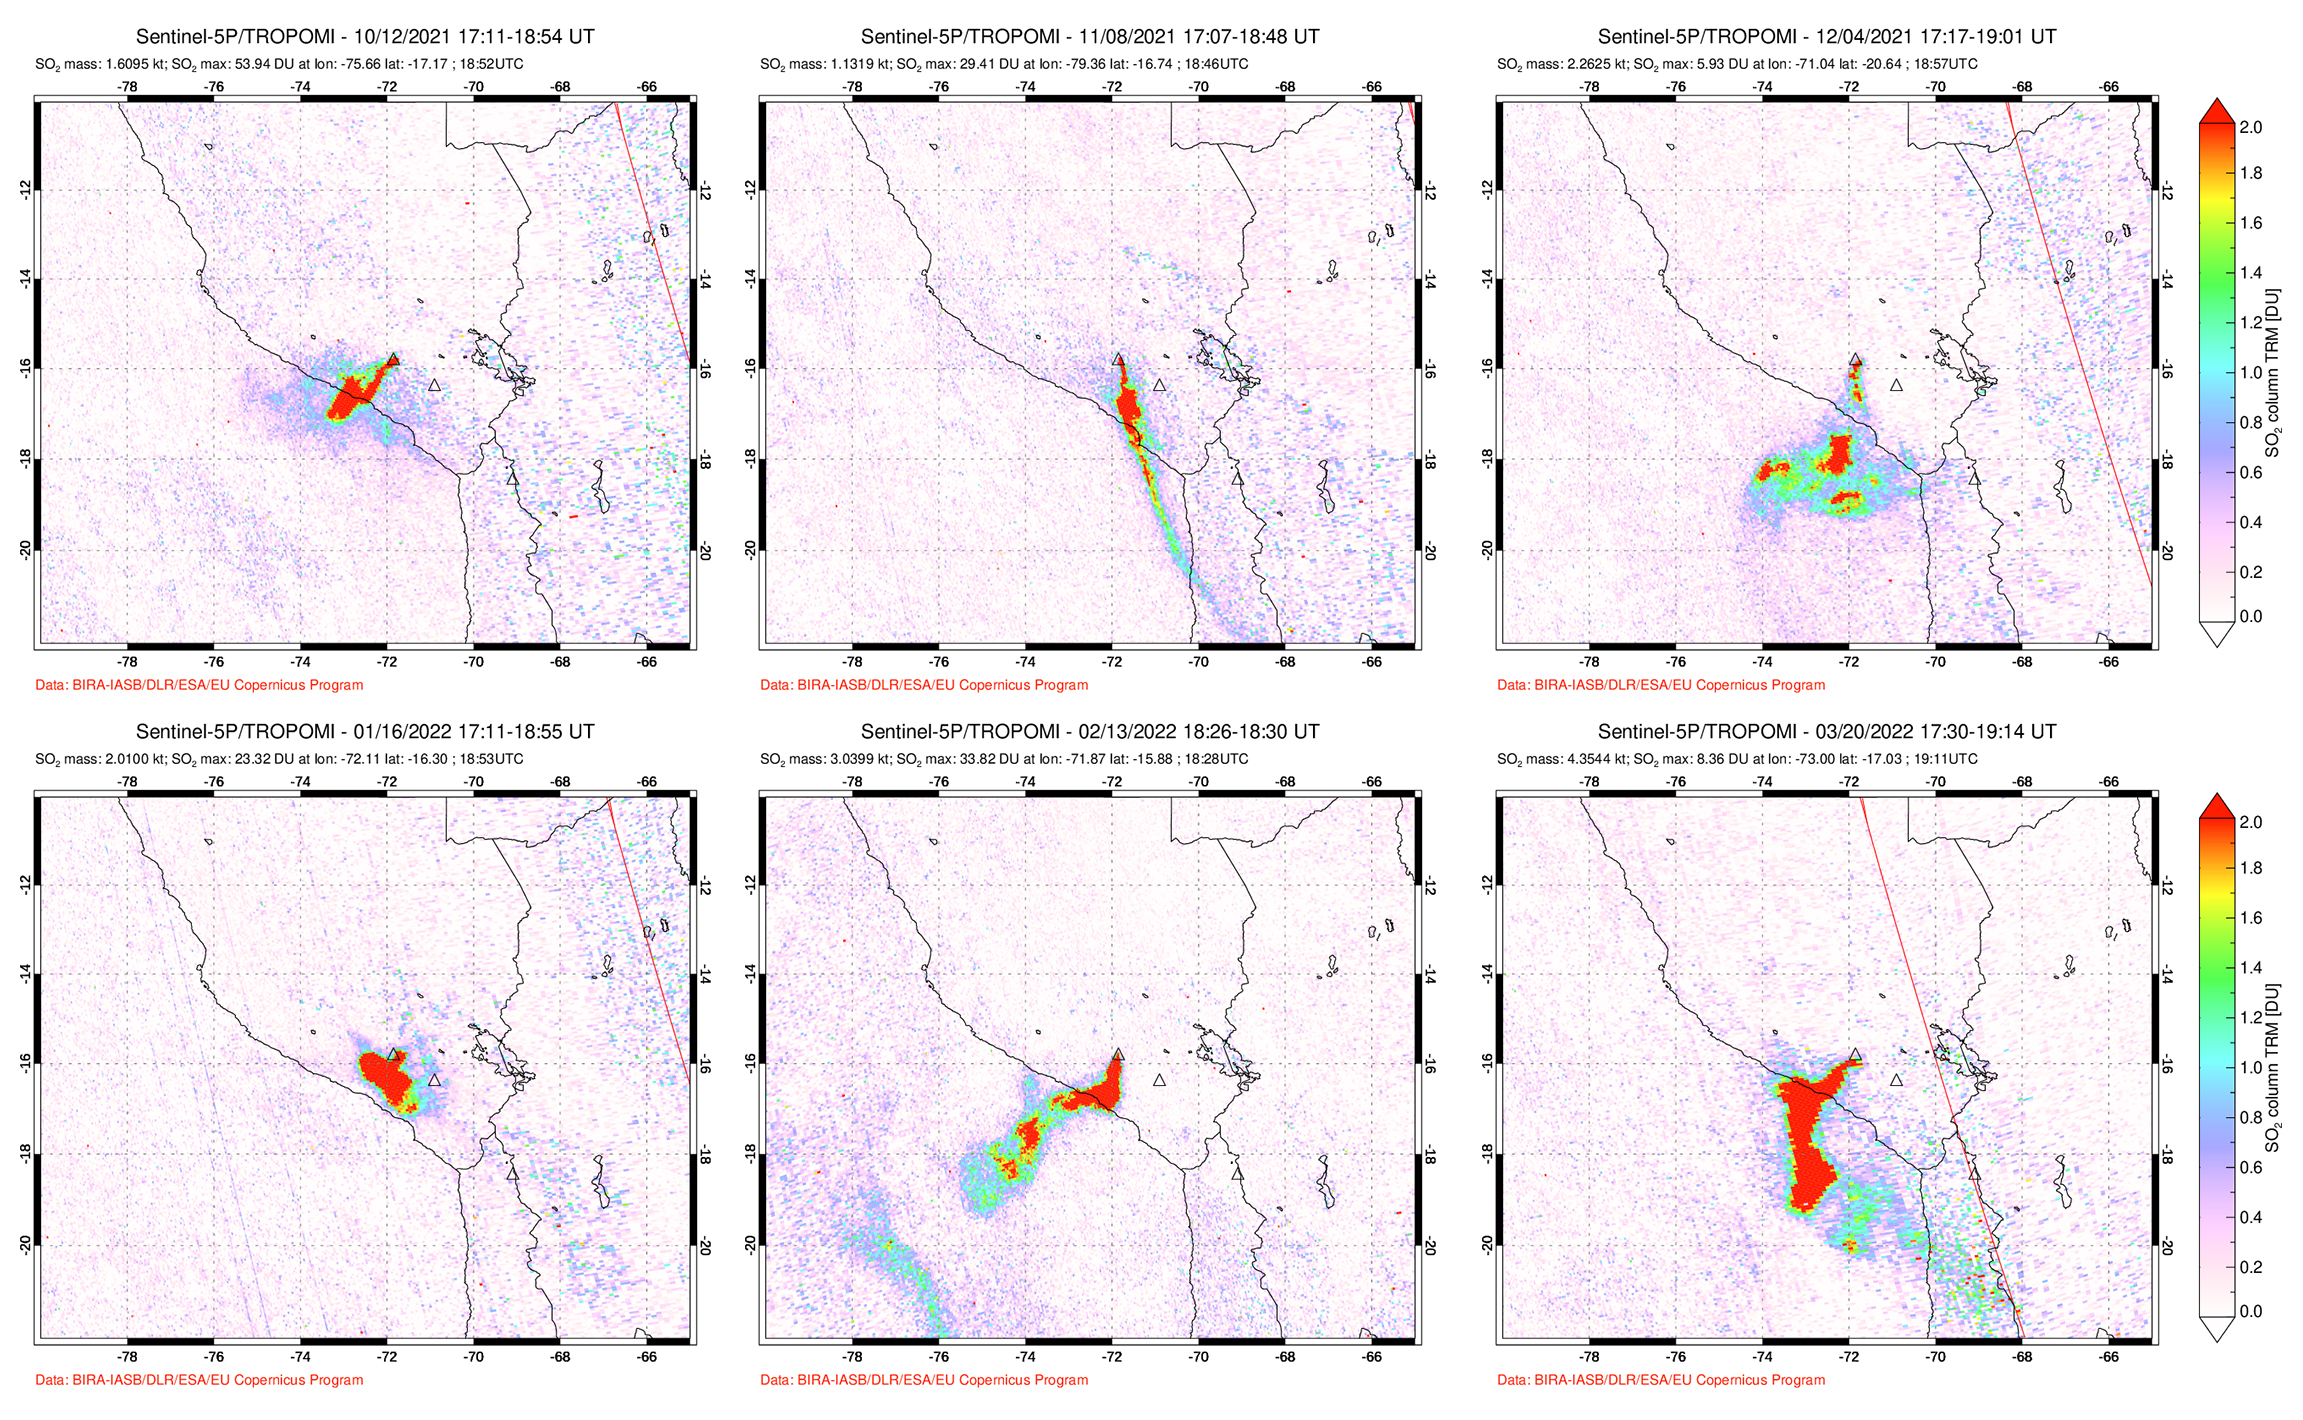 |
Figure 113. Strong sulfur dioxide plumes from Sabancaya were recorded by the TROPOMI instrument on the Sentinel-5P satellite during October 2021 through February 2022; the DU (Dobson Unit) density values were frequently greater than 2. Plumes from 12 October 2021 (top left), 8 November 2021 (top middle), 4 December 2021 (top right), 16 January 2022 (bottom left), 13 February 2022 (bottom middle), and 20 March 2022 (bottom right). Courtesy of NASA Global Sulfur Dioxide Monitoring Page. |
An average of 35 daily explosions were reported by IGP during October, generating gas-and-ash plumes 2-3.5 km above the summit that drifted in various directions (figure 114). A total of 4,486 volcanic earthquakes were detected during the month, which included volcanic-tremor (VT) events. Frequent sulfur dioxide measurements ranged from 1,900 and 4,000 tons/day. Intermittent light ashfall was reported in towns to the SW and NE, including Lluta, Taya, Mocca, Cuñirca, Achoma, Ichupampa, and Yanque. During November, an average of 70 daily explosions were detected, which produced gas-and-ash plumes to 2-2.5 km altitude above the summit. There were 2,846 volcanic earthquakes recorded during the month, which included VT-type events.
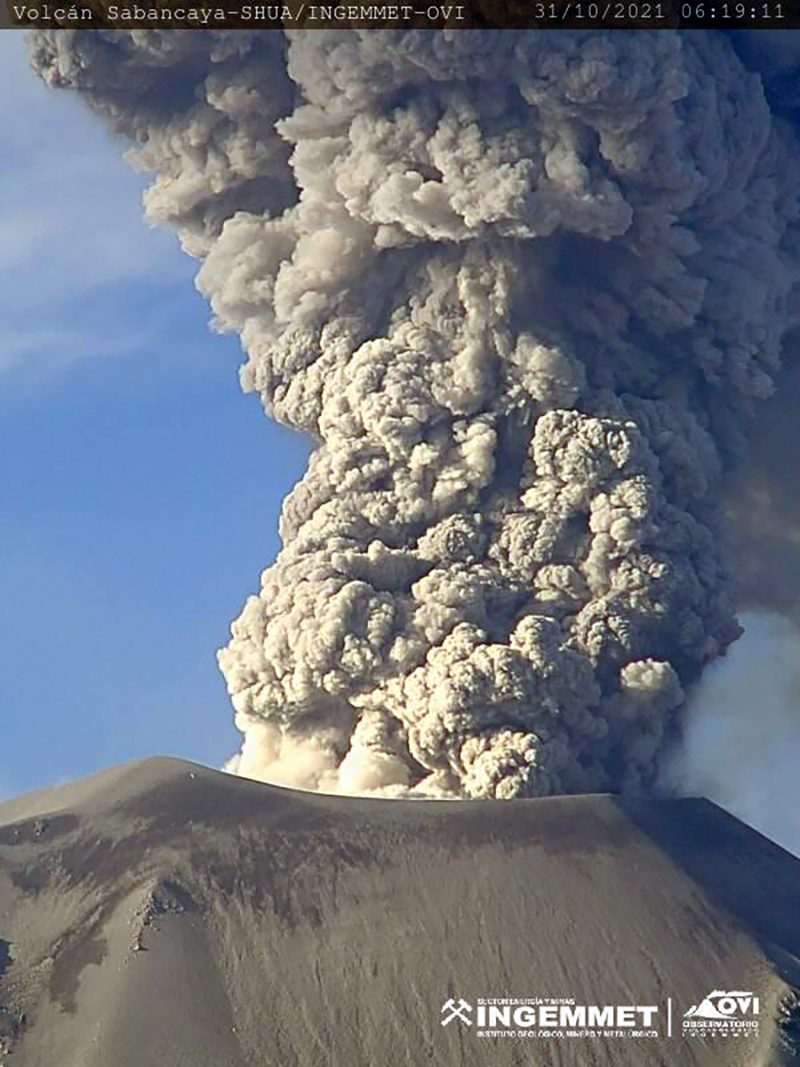 |
Figure 114. Photo of a gray ash plume rising from Sabancaya at 0619 on 31 October 2021. Courtesy of INGEMMET. |
During December 2021 and January 2022, IGP reported an average of 53 and 39 daily low energy explosions, respectively. These explosions generated ash-and-gas plumes that rose 1-4 km above the summit and drifted in different directions. About 2,777 volcanic earthquakes were recorded during December and 1,280 during January. Sulfur dioxide measurements ranged from 700 and 5,600 tons/day, the highest of which took place on 5 January. On 5 January an ash-and-gas plume rose 2 km above the summit and drifted SW, accompanied by incandescent ejecta (figure 115).
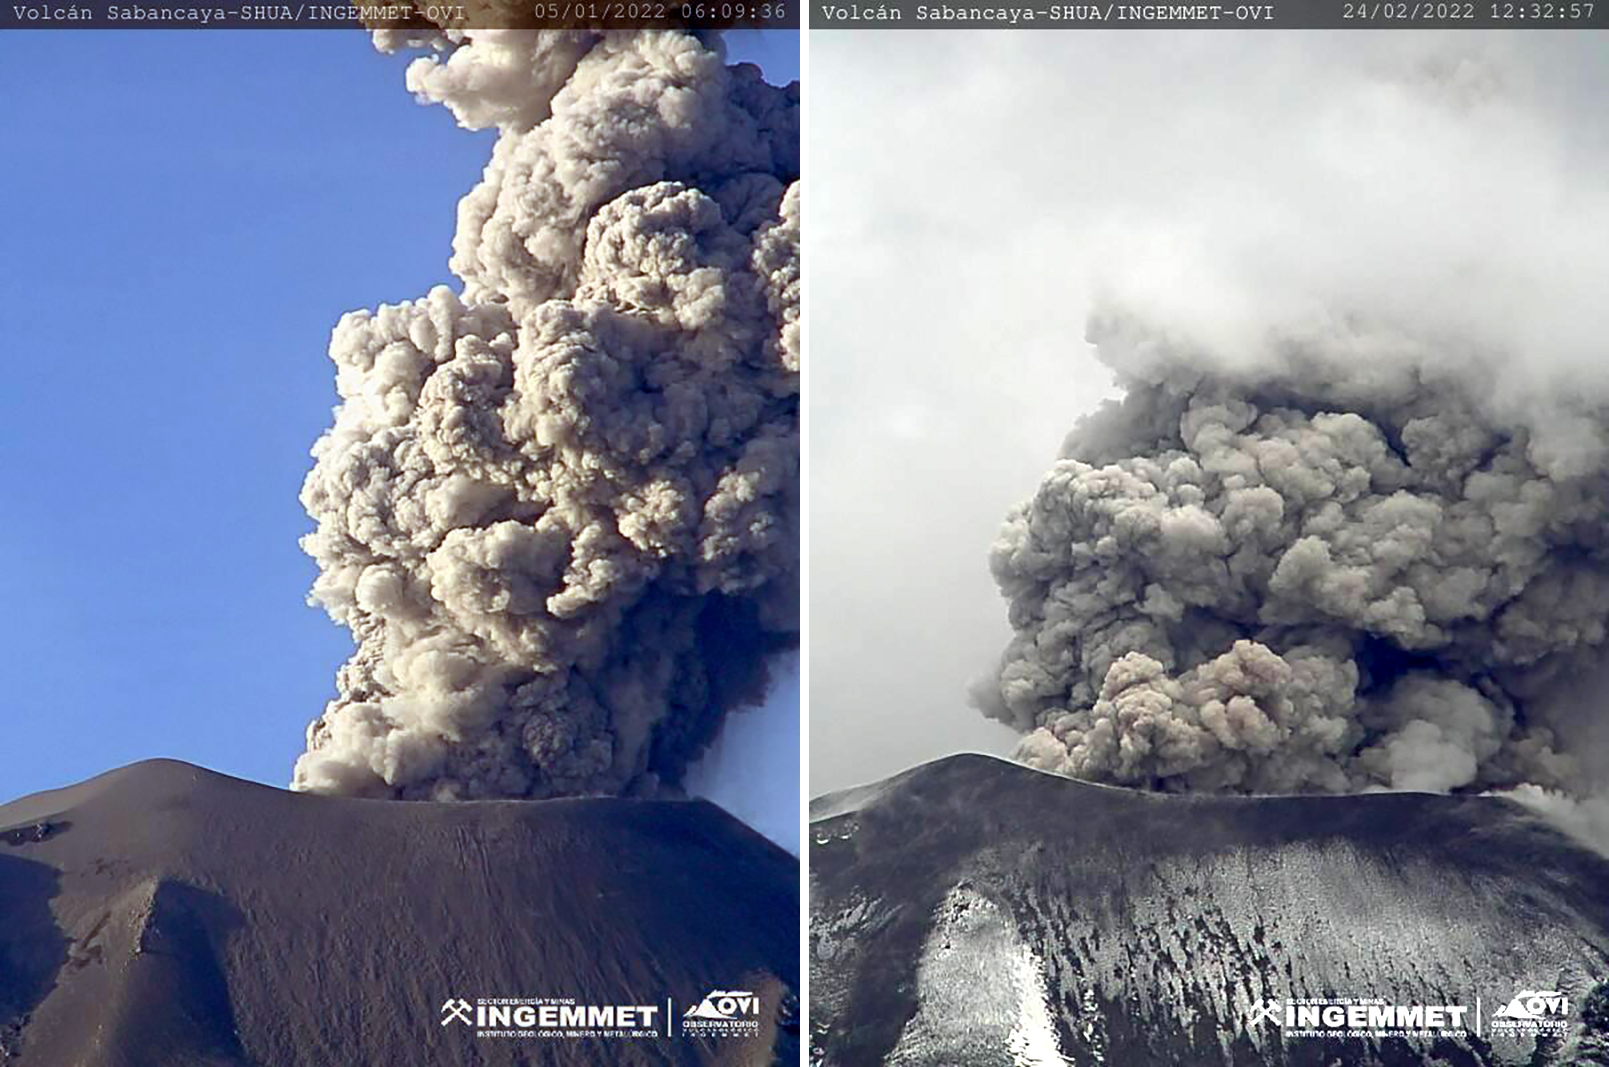 |
Figure 115. Photos of gray ash plumes rising from Sabancaya on 5 January 2022 (left) and 24 February 2022 (right). The plume on the left rose 2 km above the summit and drifted SW, while the one on the right rose 2.4 km above the summit and drifted SE. Courtesy of INGEMMET. |
Similar activity of ash-and-gas plumes and low energy explosions persisted during February and March; an average of 25 and 26 daily explosions were detected, respectively. Ash-and-gas plumes rose 800-3,000 m above the summit and drifted in multiple directions, especially NE and SE. On 24 February an ash-and-gas plume rose 2.4 km above the summit and drifted SE (figure 115). Some light ashfall was intermittently reported in villages surrounding the volcano on 4, 7-11, and 14-16 March; on 4 March, for example, it affected Pinchollo to the NE. About 662 volcanic earthquakes were detected during February and 756 during March. Sulfur dioxide measurements ranged from 400 and 5,000 tons/day, the highest of which was taken on 24 February.
Information Contacts: Observatorio Volcanologico del INGEMMET (Instituto Geológical Minero y Metalúrgico), Barrio Magisterial Nro. 2 B-16 Umacollo - Yanahuara Arequipa, Peru (URL: http://ovi.ingemmet.gob.pe); Instituto Geofisico del Peru (IGP), Calle Badajoz N° 169 Urb. Mayorazgo IV Etapa, Ate, Lima 15012, Perú (URL: https://www.igp.gob.pe/servicios/centro-vulcanologico-nacional/inicio); Buenos Aires Volcanic Ash Advisory Center (VAAC), Servicio Meteorológico Nacional-Fuerza Aérea Argentina, 25 de mayo 658, Buenos Aires, Argentina (URL: http://www.smn.gov.ar/vaac/buenosaires/inicio.php); MIROVA (Middle InfraRed Observation of Volcanic Activity), a collaborative project between the Universities of Turin and Florence (Italy) supported by the Centre for Volcanic Risk of the Italian Civil Protection Department (URL: http://www.mirovaweb.it/); Hawai'i Institute of Geophysics and Planetology (HIGP) - MODVOLC Thermal Alerts System, School of Ocean and Earth Science and Technology (SOEST), Univ. of Hawai'i, 2525 Correa Road, Honolulu, HI 96822, USA (URL: http://modis.higp.hawaii.edu/); NASA Global Sulfur Dioxide Monitoring Page, Atmospheric Chemistry and Dynamics Laboratory, NASA Goddard Space Flight Center (NASA/GSFC), 8800 Greenbelt Road, Goddard MD 20771, USA (URL: https://so2.gsfc.nasa.gov/); Sentinel Hub Playground (URL: https://www.sentinel-hub.com/explore/sentinel-playground).
Daily explosions, gas-and-ash plumes, and thermal activity during April-October 2022
Sabancaya, located in Peru NE of Ampato and SE of Hualca Hualca, has had Holocene activity that consisted of Plinian eruptions and lava flow effusions, which have formed an extensive apron around the volcano on all sides except the south. Eruptions date back to 1750, with the most recent beginning in November 2016 characterized by frequent, low-energy explosions and gas-and-ash plumes (BGVN 47:05). This report covers activity during April through October 2022 using information from Instituto Geophysico del Peru (IGP) that use weekly activity reports and various satellite data.
Frequent low-to-moderate power thermal anomalies were reported by the MIROVA project during April through October 2022 (figure 116). There was a small gap in detected activity during mid-to-late October. According to data recorded by the MODVOLC thermal algorithm, there was a total of 34 thermal hotspots: 7 in April, 5 in May, 5 in June, 3 in July, 5 in August, 5 in September, and 4 in October. On clear weather days, some of this thermal activity was visible in Sentinel-2 infrared satellite data that showed the active summit crater (figure 117). Moderate-to-strong sulfur dioxide plumes were recorded almost daily during the reporting period by the TROPOMI instrument on the Sentinel-5P satellite (figure 118). Many of these plumes exceeded 2 Dobson Units (DU) and drifted in multiple directions.
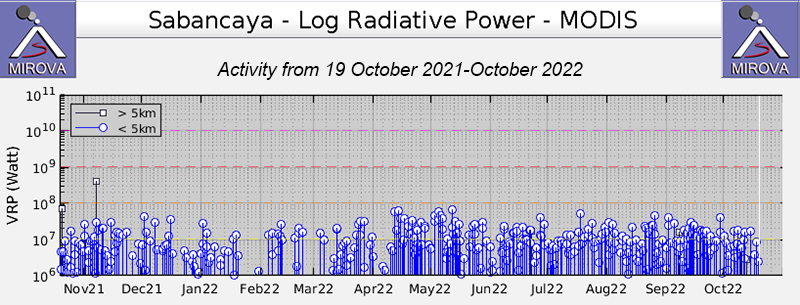 |
Figure 116. Frequent low-to-moderate strength thermal anomalies were detected during April through October 2022 at Sabancaya, as shown in this MIROVA graph (Log Radiative Power). There was a small gap in detected activity during mid-to-late October. Courtesy of MIROVA. |
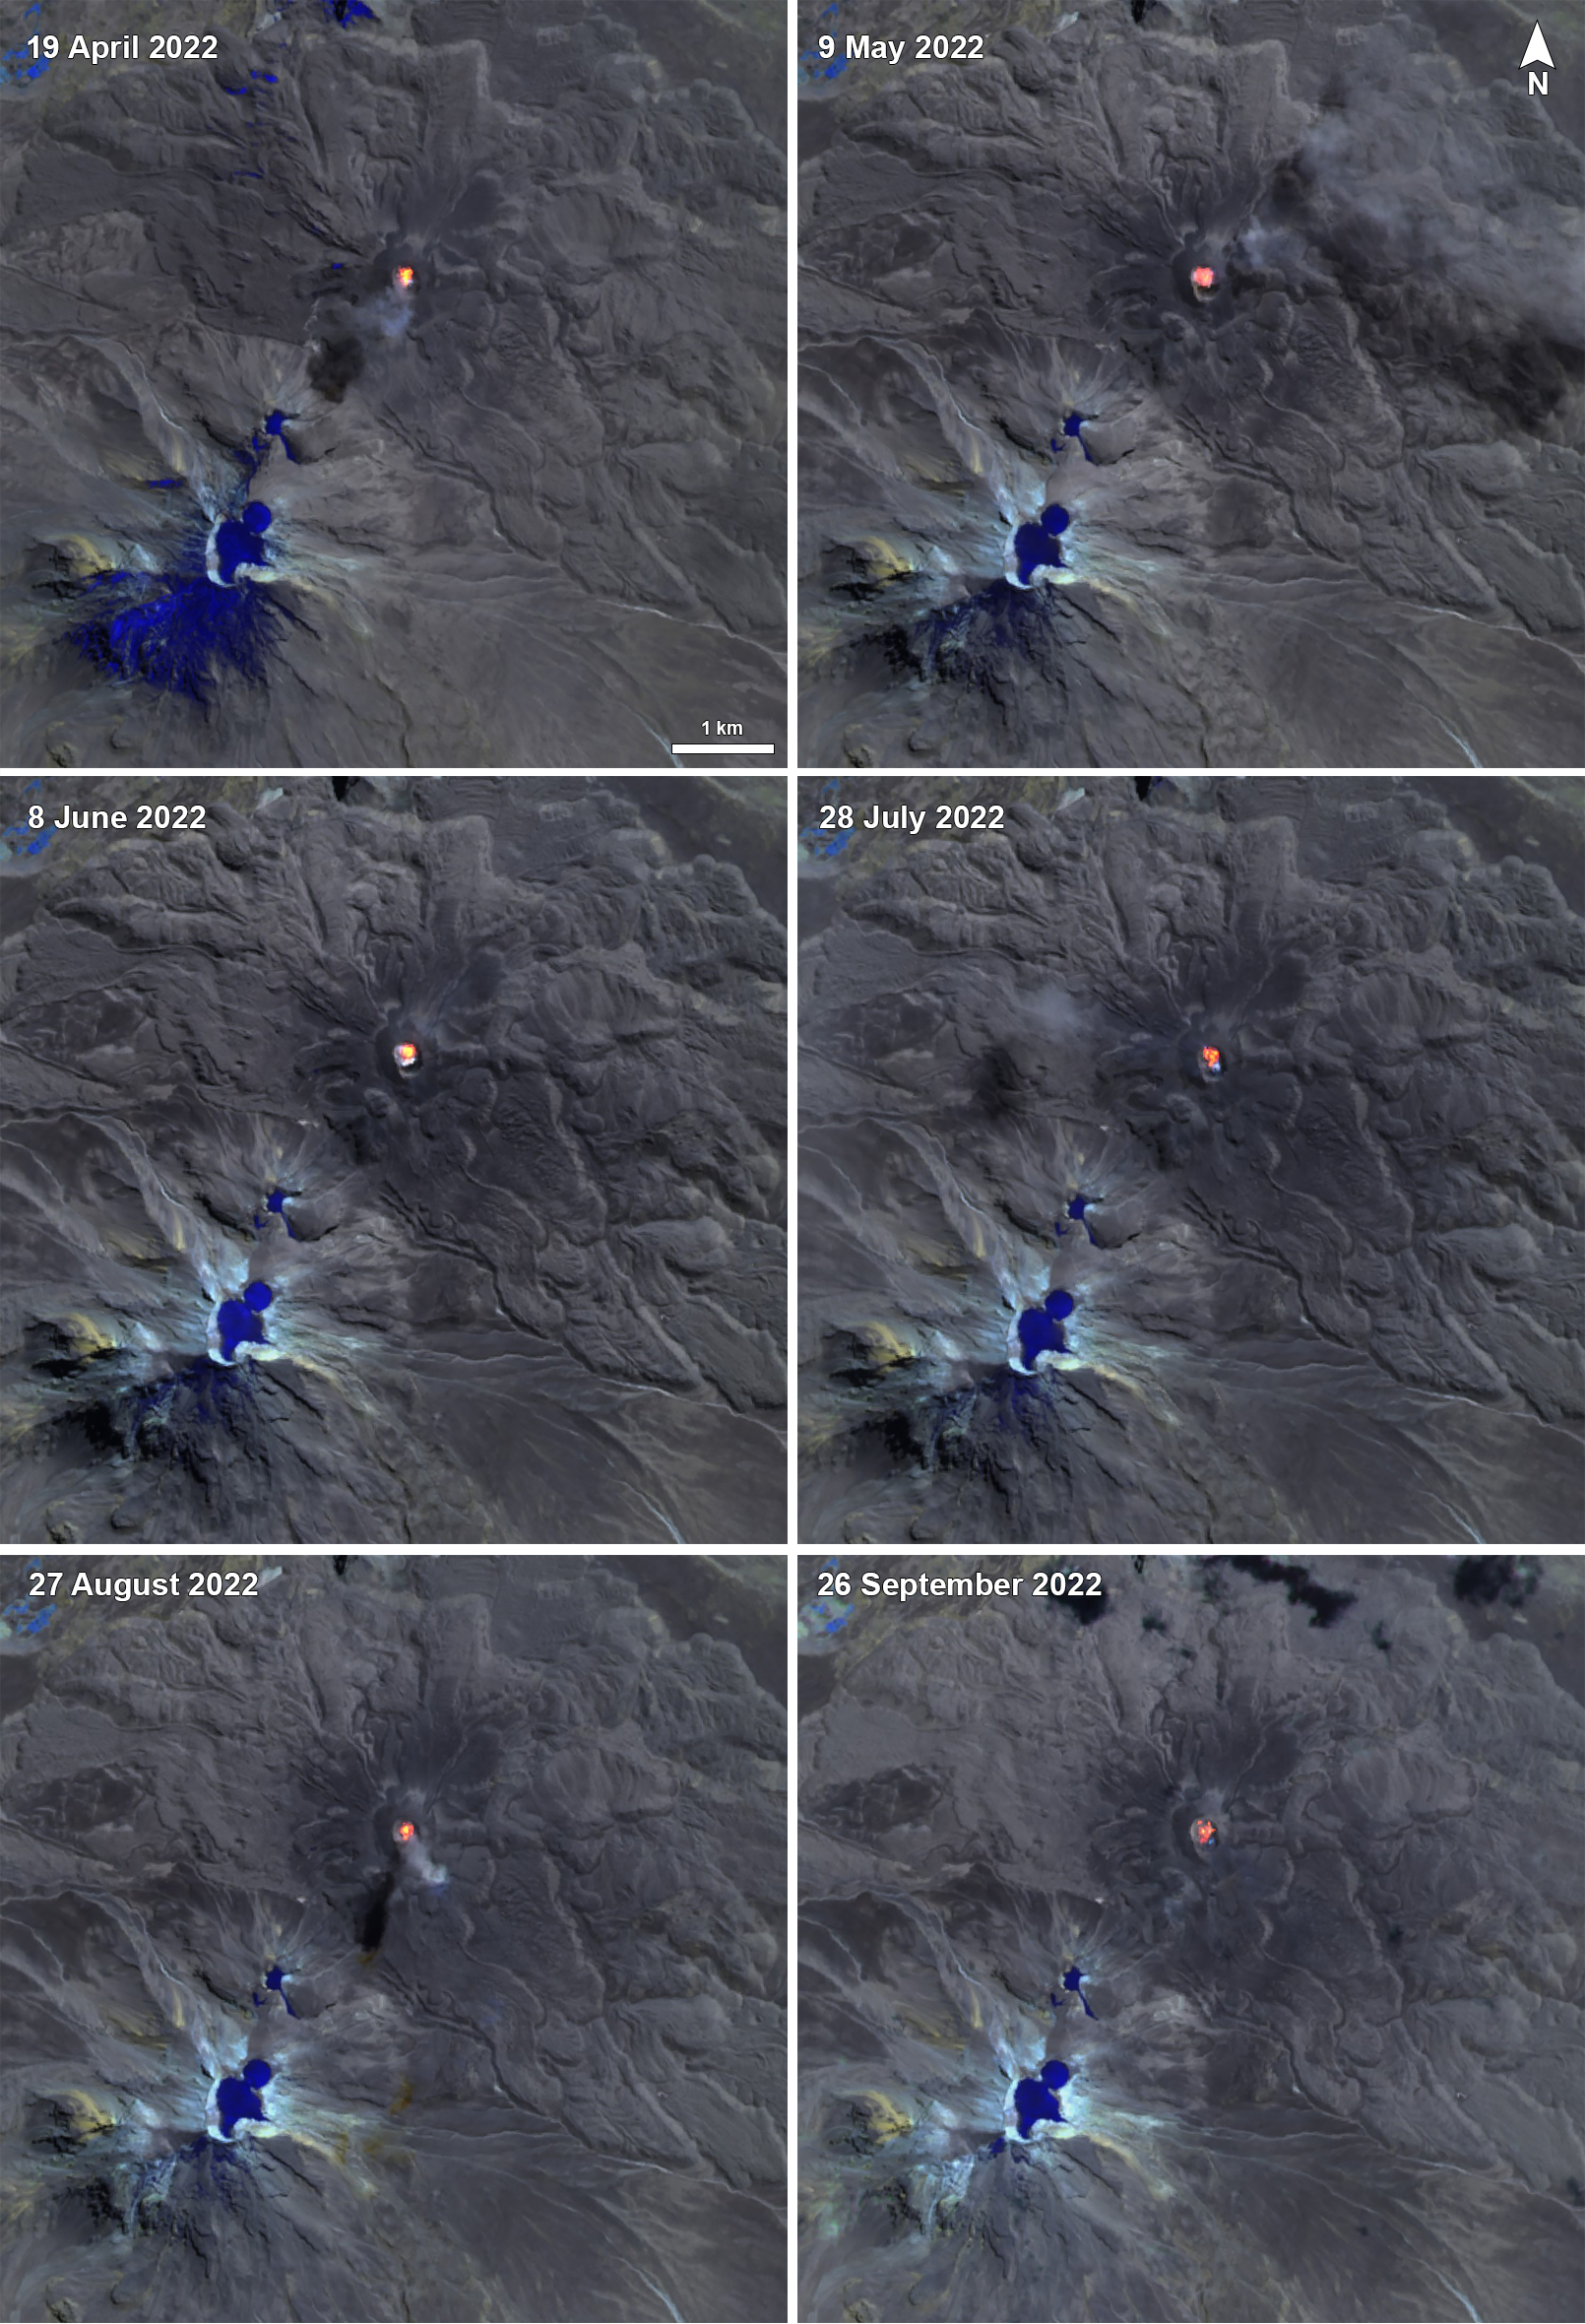 |
Figure 117. Sentinel-2 infrared satellite imagery showed persistent thermal activity at the summit crater of Sabancaya on 19 April 2022 (top left), 9 May 2022 (top right), 8 June 2022 (middle left), 28 July 2022 (middle right), 27 August 2022 (bottom left), and 26 September 2022 (bottom right). Occasionally, gas-and-steam emissions accompanied this activity, as shown on 19 April and 27 August, which drifted SW and SE, respectively. Images use Atmospheric penetration rendering (bands 12, 11, 8a). Courtesy of Sentinel Hub Playground. |
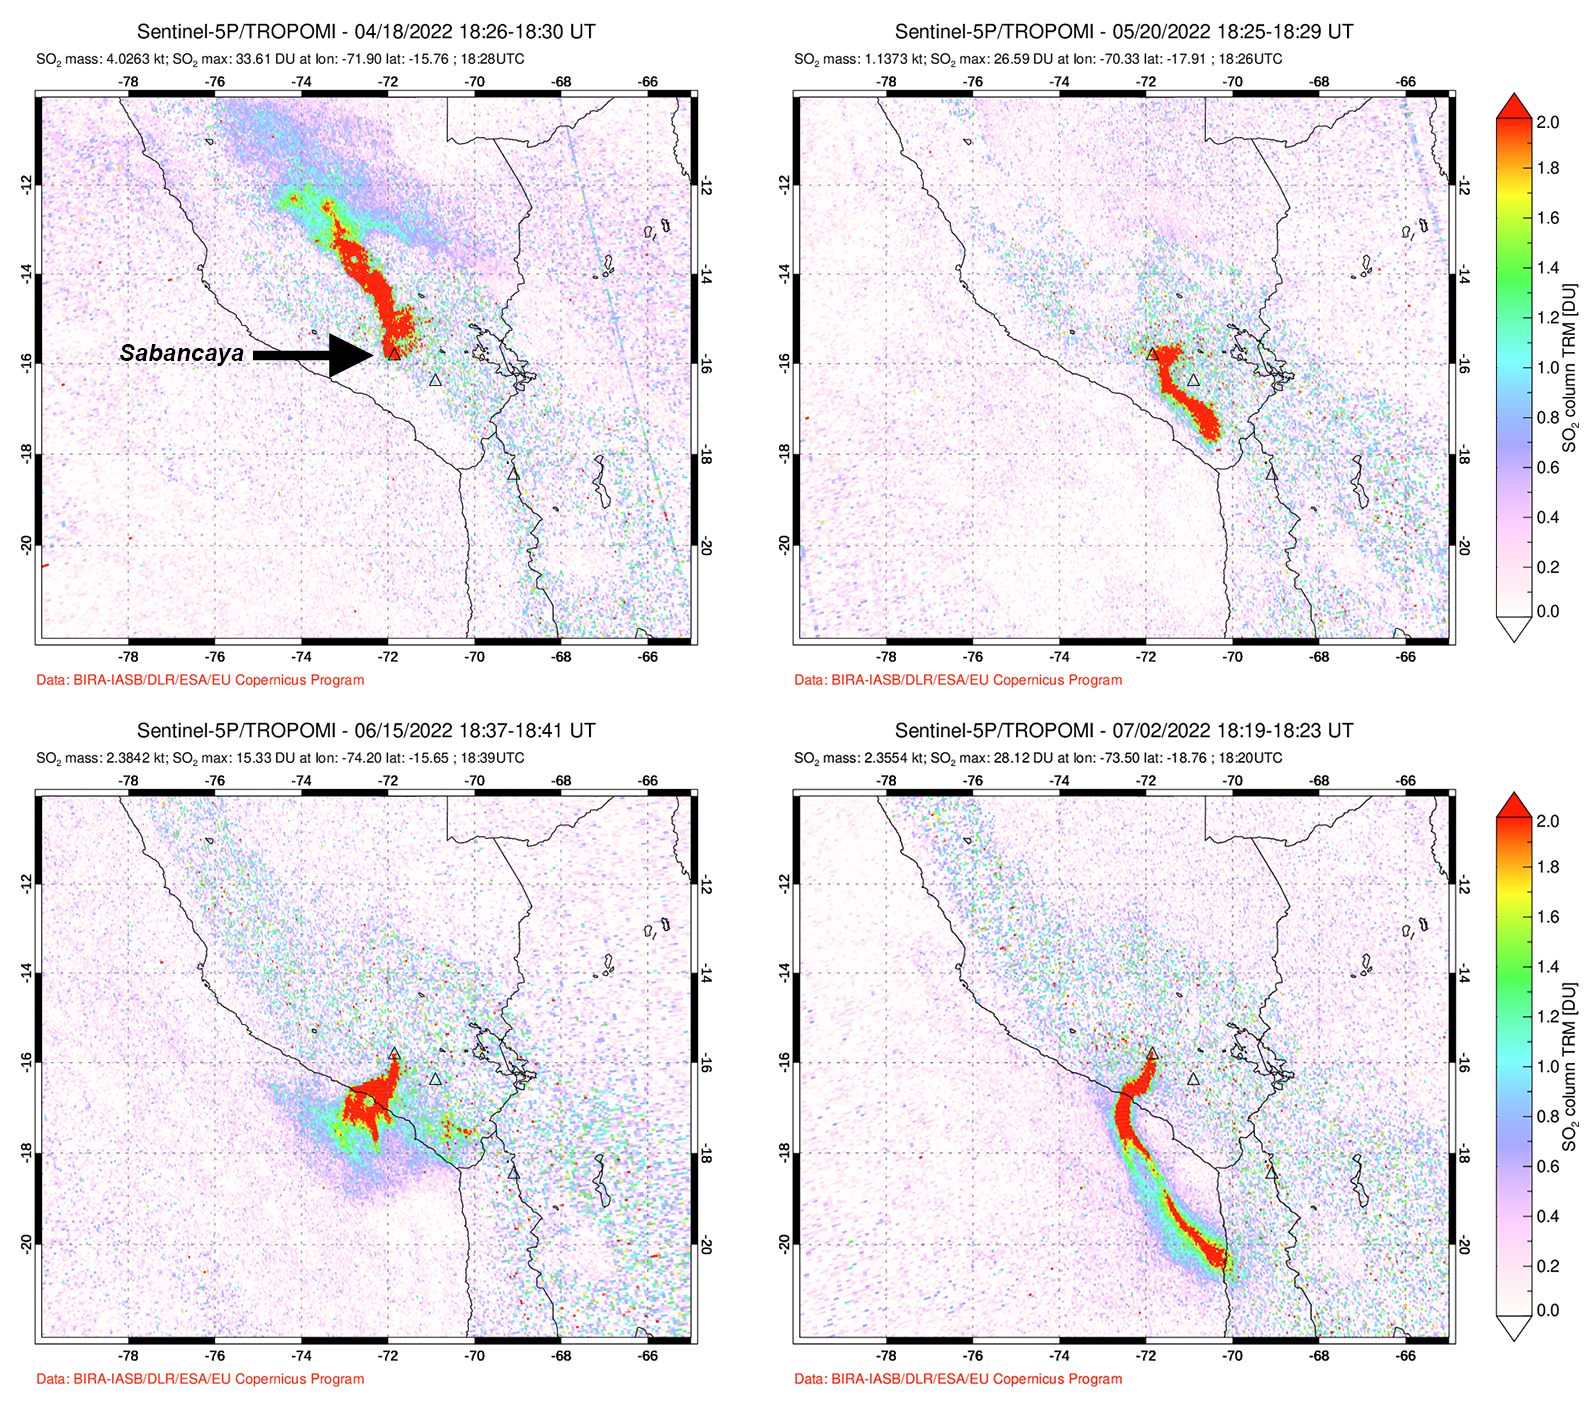 |
Figure 118. Strong sulfur dioxide plumes were detected rising from Sabancaya by the TROPOMI instrument on the Sentinel-5P satellite during the entire reporting period; the DU (Dobson Unit) density values were frequently greater than 2. Plumes from 18 April 2022 (top left), 20 May 2022 (top right), 15 June 2022 (bottom left), and 2 July 2022 (bottom right) that drifted SE, SE, SW, and SW, respectively. Courtesy of NASA Global Sulfur Dioxide Monitoring Page. |
IGP reported that moderate levels of eruptive activity continued during April and May 2022; the weekly averages of explosions were 41, 52, 46, 37, and 40 during April, and 53, 54, 21, and 15 during May. Gas-and-ash plumes in April rose 2-3.4 km above the summit and drifted in different directions. During May gas-and-ash plumes rose 2-3 km above the summit and drifted E, SE, N, NE, and S. There were 1,125 volcanic earthquakes recorded during April and 1,337 during May. Seismicity also included volcano-tectonic-type events that indicate rock fracturing events. Thermal activity was frequently reported in the crater due to an active lava dome.
Similar explosive activity continued during June and July. The weekly averages of explosions were 9, 8, 17, and 18 during June, and 22, 20, 28, 30, and 27 during July. Gas-and-ash plumes rose 1.5-2.5 km above the summit and drifted E, SE, and NE during June and rose 1.5-2.7 km above the summit and drifted SE, E, S, N, NW, and SW during July. IGP also detected 945 volcanic earthquakes during June and 1,444 during July; VT-type earthquakes were also reported. Satellite imagery showed persistent thermal anomalies within the crater due to the active lava dome.
The weekly averages of explosions were 19, 25, 33, 48 during August and 58, 44, 47, 50, 46 during September. Accompanying gas-and-ash plumes rose 2.4-2.7 km above the summit and drifted in multiple directions during August and 1.6-3 km above the summit and drifted E, SE, SW, and NE during September. Frequent seismic events continued to be detected; there were 1,378 events reported during August and 1,817 events during September. VT-type events persisted. Satellite data identified several thermal anomalies in the crater due to the active lava dome.
The weekly averages of explosions during October were 45, 56, 40, and 28. The accompanying gas-and-ash plumes rose 2.5-3 km above the summit and drifted W, NE, E, and SE. Seismicity continued, with 1,346 events detected throughout the month, in addition to VT-type events. Thermal activity at the summit crater was commonly detected in satellite imagery.
Information Contacts: Observatorio Volcanologico del INGEMMET (Instituto Geológical Minero y Metalúrgico), Barrio Magisterial Nro. 2 B-16 Umacollo - Yanahuara Arequipa, Peru (URL: http://ovi.ingemmet.gob.pe); Instituto Geofisico del Peru (IGP), Calle Badajoz N° 169 Urb. Mayorazgo IV Etapa, Ate, Lima 15012, Perú (URL: https://www.igp.gob.pe/servicios/centro-vulcanologico-nacional/inicio); Buenos Aires Volcanic Ash Advisory Center (VAAC), Servicio Meteorológico Nacional-Fuerza Aérea Argentina, 25 de mayo 658, Buenos Aires, Argentina (URL: http://www.smn.gov.ar/vaac/buenosaires/inicio.php); MIROVA (Middle InfraRed Observation of Volcanic Activity), a collaborative project between the Universities of Turin and Florence (Italy) supported by the Centre for Volcanic Risk of the Italian Civil Protection Department (URL: http://www.mirovaweb.it/); Hawai'i Institute of Geophysics and Planetology (HIGP) - MODVOLC Thermal Alerts System, School of Ocean and Earth Science and Technology (SOEST), Univ. of Hawai'i, 2525 Correa Road, Honolulu, HI 96822, USA (URL: http://modis.higp.hawaii.edu/); NASA Global Sulfur Dioxide Monitoring Page, Atmospheric Chemistry and Dynamics Laboratory, NASA Goddard Space Flight Center (NASA/GSFC), 8800 Greenbelt Road, Goddard MD 20771, USA (URL: https://so2.gsfc.nasa.gov/); Sentinel Hub Playground (URL: https://www.sentinel-hub.com/explore/sentinel-playground).
Explosions, gas-and-ash plumes, and thermal activity persist during November 2022-April 2023
Sabancaya is located in Peru, NE of Ampato and SE of Hualca Hualca. Eruptions date back to 1750 and have been characterized by explosions, phreatic activity, ash plumes, and ashfall. The current eruption period began in November 2016 and has more recently consisted of daily explosions, gas-and-ash plumes, and thermal activity (BGVN 47:11). This report updates activity during November 2022 through April 2023 using information from Instituto Geophysico del Peru (IGP) that use weekly activity reports and various satellite data.
Intermittent low-to-moderate power thermal anomalies were reported by the MIROVA project during November 2022 through April 2023 (figure 119). There were few short gaps in thermal activity during mid-December 2022, late December-to-early January 2023, late January to mid-February, and late February. According to data recorded by the MODVOLC thermal algorithm, there were a total of eight thermal hotspots: three in November 2022, three in February 2023, one in March, and one in April. On clear weather days, some of this thermal anomaly was visible in infrared satellite imagery showing the active lava dome in the summit crater (figure 120). Almost daily moderate-to-strong sulfur dioxide plumes were recorded during the reporting period by the TROPOMI instrument on the Sentinel-5P satellite (figure 121). Many of these plumes exceeded 2 Dobson Units (DU) and drifted in multiple directions.
|
Figure 119. Intermittent low-to-moderate thermal anomalies were detected during November 2022 through April 2023 at Sabancaya, as shown in this MIROVA graph (Log Radiative Power). There were brief gaps in thermal activity during mid-December 2022, late December-to-early January 2023, late January to mid-February, and late February. Courtesy of MIROVA. |
|
Figure 120. Infrared (bands 12, 11, 8A) satellite images showed a constant thermal anomaly in the summit crater of Sabancaya on 14 January 2023 (top left), 28 February 2023 (top right), 5 March 2023 (bottom left), and 19 April 2023 (bottom right), represented by the active lava dome. Sometimes gas-and-steam and ash emissions also accompanied this activity. Courtesy of Copernicus Browser. |
|
Figure 121. Moderate-to-strong sulfur dioxide plumes were detected almost every day, rising from Sabancaya by the TROPOMI instrument on the Sentinel-5P satellite throughout the reporting period; the DU (Dobson Unit) density values were often greater than 2. Plumes from 23 November 2022 (top left), 26 December 2022 (top middle), 10 January 2023 (top right), 15 February 2023 (bottom left), 13 March 2023 (bottom middle), and 21 April 2023 (bottom right) that drifted SW, SW, W, SE, W, and SW, respectively. Courtesy of NASA Global Sulfur Dioxide Monitoring Page. |
IGP reported that moderate activity during November and December 2022 continued; during November, an average number of explosions were reported each week: 30, 33, 36, and 35, and during December, it was 32, 40, 47, 52, and 67. Gas-and-ash plumes in November rose 3-3.5 km above the summit and drifted E, NE, SE, S, N, W, and SW. During December the gas-and-ash plumes rose 2-4 km above the summit and drifted in different directions. There were 1,259 volcanic earthquakes recorded during November and 1,693 during December. Seismicity also included volcano-tectonic-type events that indicate rock fracturing events. Slight inflation was observed in the N part of the volcano near Hualca Hualca (4 km N). Thermal activity was frequently reported in the crater at the active lava dome (figure 120).
Explosive activity continued during January and February 2023. The average number of explosions were reported each week during January (51, 50, 60, and 59) and February (43, 54, 51, and 50). Gas-and-ash plumes rose 1.6-2.9 km above the summit and drifted NW, SW, and W during January and rose 1.4-2.8 above the summit and drifted W, SW, E, SE, N, S, NW, and NE during February. IGP also detected 1,881 volcanic earthquakes during January and 1,661 during February. VT-type earthquakes were also reported. Minor inflation persisted near Hualca Hualca. Satellite imagery showed continuous thermal activity in the crater at the lava dome (figure 120).
During March, the average number of explosions each week was 46, 48, 31, 35, and 22 and during April, it was 29, 41, 31, and 27. Accompanying gas-and-ash plumes rose 1.7-2.6 km above the summit crater and drifted W, SW, NW, S, and SE during March. According to a Buenos Aires Volcano Ash Advisory Center (VAAC) notice, on 22 March at 1800 through 23 March an ash plume rose to 7 km altitude and drifted NW. By 0430 an ash plume rose to 7.6 km altitude and drifted W. On 24 and 26 March continuous ash emissions rose to 7.3 km altitude and drifted SW and on 28 March ash emissions rose to 7.6 km altitude. During April, gas-and-ash plumes rose 1.6-2.5 km above the summit and drifted W, SW, S, NW, NE, and E. Frequent volcanic earthquakes were recorded, with 1,828 in March and 1,077 in April, in addition to VT-type events. Thermal activity continued to be reported in the summit crater at the lava dome (figure 120).
Information Contacts: Instituto Geofisico del Peru (IGP), Centro Vulcanológico Nacional (CENVUL), Calle Badajoz N° 169 Urb. Mayorazgo IV Etapa, Ate, Lima 15012, Perú (URL: https://www.igp.gob.pe/servicios/centro-vulcanologico-nacional/inicio); Buenos Aires Volcanic Ash Advisory Center (VAAC), Servicio Meteorológico Nacional-Fuerza Aérea Argentina, 25 de mayo 658, Buenos Aires, Argentina (URL: http://www.smn.gov.ar/vaac/buenosaires/inicio.php); MIROVA (Middle InfraRed Observation of Volcanic Activity), a collaborative project between the Universities of Turin and Florence (Italy) supported by the Centre for Volcanic Risk of the Italian Civil Protection Department (URL: http://www.mirovaweb.it/); Hawai'i Institute of Geophysics and Planetology (HIGP) - MODVOLC Thermal Alerts System, School of Ocean and Earth Science and Technology (SOEST), Univ. of Hawai'i, 2525 Correa Road, Honolulu, HI 96822, USA (URL: http://modis.higp.hawaii.edu/); NASA Global Sulfur Dioxide Monitoring Page, Atmospheric Chemistry and Dynamics Laboratory, NASA Goddard Space Flight Center (NASA/GSFC), 8800 Greenbelt Road, Goddard MD 20771, USA (URL: https://so2.gsfc.nasa.gov/); Copernicus Browser, Copernicus Data Space Ecosystem, European Space Agency (URL: https://dataspace.copernicus.eu/browser/).
This compilation of synonyms and subsidiary features may not be comprehensive. Features are organized into four major categories: Cones, Craters, Domes, and Thermal Features. Synonyms of features appear indented below the primary name. In some cases additional feature type, elevation, or location details are provided.
Cones |
||||
| Feature Name | Feature Type | Elevation | Latitude | Longitude |
|
Ampato
Ambato Huaypuna |
Stratovolcano | 6278 m | 15° 49' 13" S | 71° 52' 48" W |
| Hualca Hualca | Stratovolcano | 5978 m | 15° 43' 2" S | 71° 51' 55" W |
|
|
||||||||||||||||||||||||
There is data available for 12 confirmed Holocene eruptive periods.
2016 Nov 6 - 2024 Apr 19 (continuing) Confirmed Eruption Max VEI: 3
| Episode 1 | Eruption Episode | Sabancaya crater | ||||||||||||||||||||||||||||||||||||||||||||||||||||||||||||||||||||||||||||||||||||||||||||||||||||||||||||||||||||||||||||||||||||||||||||||||||||||||||||||||||||||||||||||||||||||||||||||||||||||||||||||||||||||||||||||||||||||||||||||||||||||||||||||||||||||||||||||||||||||||||||||||||||||||||||||||||||||||||||||||||||||||||||||||||||||||||||||||||||||||||||||||||||||||||||||||||||||||||||||||||||||||||||||||||||||||||||||||||||||||||||||||||||||||||||||||||||||||||||||||||||||||||||||||||||||||||||||||||||||||||||||||||||||||||||||||||||||||||||||||||||||||||||||||||||||||||||||||||||||||||||||||||||||||||||||||||||||||||||||||||||||||||||||||||||||||||||||||||||||||||||||||||||||||||||||||||||||||||||||||||||||||||||||||||||||||||||||||||||||||||||||||||||||||||||||||||||||||||||||||||||||||||||||||||||||||||||||||||||||||||||||||||||||||||||||||||||||||||||||||||||||||||||||||||||||||||||||||||||||||||||||||||||||||||||||||||||||||||||||||||||||||||||||||||||||||||||||||||||||
|---|---|---|---|---|---|---|---|---|---|---|---|---|---|---|---|---|---|---|---|---|---|---|---|---|---|---|---|---|---|---|---|---|---|---|---|---|---|---|---|---|---|---|---|---|---|---|---|---|---|---|---|---|---|---|---|---|---|---|---|---|---|---|---|---|---|---|---|---|---|---|---|---|---|---|---|---|---|---|---|---|---|---|---|---|---|---|---|---|---|---|---|---|---|---|---|---|---|---|---|---|---|---|---|---|---|---|---|---|---|---|---|---|---|---|---|---|---|---|---|---|---|---|---|---|---|---|---|---|---|---|---|---|---|---|---|---|---|---|---|---|---|---|---|---|---|---|---|---|---|---|---|---|---|---|---|---|---|---|---|---|---|---|---|---|---|---|---|---|---|---|---|---|---|---|---|---|---|---|---|---|---|---|---|---|---|---|---|---|---|---|---|---|---|---|---|---|---|---|---|---|---|---|---|---|---|---|---|---|---|---|---|---|---|---|---|---|---|---|---|---|---|---|---|---|---|---|---|---|---|---|---|---|---|---|---|---|---|---|---|---|---|---|---|---|---|---|---|---|---|---|---|---|---|---|---|---|---|---|---|---|---|---|---|---|---|---|---|---|---|---|---|---|---|---|---|---|---|---|---|---|---|---|---|---|---|---|---|---|---|---|---|---|---|---|---|---|---|---|---|---|---|---|---|---|---|---|---|---|---|---|---|---|---|---|---|---|---|---|---|---|---|---|---|---|---|---|---|---|---|---|---|---|---|---|---|---|---|---|---|---|---|---|---|---|---|---|---|---|---|---|---|---|---|---|---|---|---|---|---|---|---|---|---|---|---|---|---|---|---|---|---|---|---|---|---|---|---|---|---|---|---|---|---|---|---|---|---|---|---|---|---|---|---|---|---|---|---|---|---|---|---|---|---|---|---|---|---|---|---|---|---|---|---|---|---|---|---|---|---|---|---|---|---|---|---|---|---|---|---|---|---|---|---|---|---|---|---|---|---|---|---|---|---|---|---|---|---|---|---|---|---|---|---|---|---|---|---|---|---|---|---|---|---|---|---|---|---|---|---|---|---|---|---|---|---|---|---|---|---|---|---|---|---|---|---|---|---|---|---|---|---|---|---|---|---|---|---|---|---|---|---|---|---|---|---|---|---|---|---|---|---|---|---|---|---|---|---|---|---|---|---|---|---|---|---|---|---|---|---|---|---|---|---|---|---|---|---|---|---|---|---|---|---|---|---|---|---|---|---|---|---|---|---|---|---|---|---|---|---|---|---|---|---|---|---|---|---|---|---|---|---|---|---|---|---|---|---|---|---|---|---|---|---|---|---|---|---|---|---|---|---|---|---|---|---|---|---|---|---|---|---|---|---|---|---|---|---|---|---|---|---|---|---|---|---|---|---|---|---|---|---|---|---|---|---|---|---|---|---|---|---|---|---|---|---|---|---|---|---|---|---|---|---|---|---|---|---|---|---|---|---|---|---|---|---|---|---|---|---|---|---|---|---|---|---|---|---|---|---|---|---|---|---|---|---|---|---|---|---|---|---|---|---|---|---|---|---|---|---|---|---|---|---|---|---|---|---|---|---|---|---|---|---|---|---|---|---|---|---|---|---|---|---|---|---|---|---|---|---|---|---|---|---|---|---|---|---|---|---|---|---|---|---|---|---|---|---|---|---|---|---|---|---|---|---|---|---|---|---|---|---|---|---|---|---|---|---|---|---|---|---|---|---|---|---|---|---|---|---|---|---|---|---|---|---|---|---|---|---|---|---|---|---|---|---|---|---|---|---|---|---|---|---|---|---|---|---|---|---|---|---|---|---|---|---|---|---|---|---|---|---|---|---|---|---|---|---|---|---|---|---|---|---|---|---|---|---|---|---|---|---|---|---|---|---|---|---|---|---|---|---|---|---|---|---|---|---|---|---|---|---|---|---|---|---|---|---|---|---|---|---|---|---|---|---|---|---|---|---|---|---|---|---|---|---|---|---|---|---|---|---|---|---|---|---|---|---|---|---|---|---|---|---|---|---|---|---|---|---|---|---|---|---|---|---|---|---|---|---|---|---|---|---|---|---|---|---|---|---|---|---|---|---|---|---|---|---|---|---|---|---|---|---|---|---|---|---|---|---|---|---|---|---|---|---|---|---|---|---|---|---|---|---|---|---|---|---|---|---|---|---|---|---|---|---|---|---|---|---|---|---|---|---|---|---|---|---|---|---|---|---|---|---|---|---|---|---|---|---|---|---|---|---|---|---|---|---|---|---|
| 2016 Nov 6 - 2024 Apr 19 (continuing) | Evidence from Observations: Reported | ||||||||||||||||||||||||||||||||||||||||||||||||||||||||||||||||||||||||||||||||||||||||||||||||||||||||||||||||||||||||||||||||||||||||||||||||||||||||||||||||||||||||||||||||||||||||||||||||||||||||||||||||||||||||||||||||||||||||||||||||||||||||||||||||||||||||||||||||||||||||||||||||||||||||||||||||||||||||||||||||||||||||||||||||||||||||||||||||||||||||||||||||||||||||||||||||||||||||||||||||||||||||||||||||||||||||||||||||||||||||||||||||||||||||||||||||||||||||||||||||||||||||||||||||||||||||||||||||||||||||||||||||||||||||||||||||||||||||||||||||||||||||||||||||||||||||||||||||||||||||||||||||||||||||||||||||||||||||||||||||||||||||||||||||||||||||||||||||||||||||||||||||||||||||||||||||||||||||||||||||||||||||||||||||||||||||||||||||||||||||||||||||||||||||||||||||||||||||||||||||||||||||||||||||||||||||||||||||||||||||||||||||||||||||||||||||||||||||||||||||||||||||||||||||||||||||||||||||||||||||||||||||||||||||||||||||||||||||||||||||||||||||||||||||||||||||||||||||||||||
|
List of 440 Events for Episode 1 at Sabancaya crater
| |||||||||||||||||||||||||||||||||||||||||||||||||||||||||||||||||||||||||||||||||||||||||||||||||||||||||||||||||||||||||||||||||||||||||||||||||||||||||||||||||||||||||||||||||||||||||||||||||||||||||||||||||||||||||||||||||||||||||||||||||||||||||||||||||||||||||||||||||||||||||||||||||||||||||||||||||||||||||||||||||||||||||||||||||||||||||||||||||||||||||||||||||||||||||||||||||||||||||||||||||||||||||||||||||||||||||||||||||||||||||||||||||||||||||||||||||||||||||||||||||||||||||||||||||||||||||||||||||||||||||||||||||||||||||||||||||||||||||||||||||||||||||||||||||||||||||||||||||||||||||||||||||||||||||||||||||||||||||||||||||||||||||||||||||||||||||||||||||||||||||||||||||||||||||||||||||||||||||||||||||||||||||||||||||||||||||||||||||||||||||||||||||||||||||||||||||||||||||||||||||||||||||||||||||||||||||||||||||||||||||||||||||||||||||||||||||||||||||||||||||||||||||||||||||||||||||||||||||||||||||||||||||||||||||||||||||||||||||||||||||||||||||||||||||||||||||||||||||||||||
2015 Mar 8 - 2015 Dec 12 Confirmed Eruption Max VEI: 1
| Episode 1 | Uncertain Episode | Summit crater | ||||||||||||||||||||||||
|---|---|---|---|---|---|---|---|---|---|---|---|---|---|---|---|---|---|---|---|---|---|---|---|---|---|
| 2015 Mar 8 - 2015 Dec 12 | Evidence from Observations: Aviation | ||||||||||||||||||||||||
|
List of 3 Events for Episode 1 at Summit crater
| |||||||||||||||||||||||||
[ 2014 Aug 5 - 2014 Dec 27 ] Uncertain Eruption
| Episode 1 | Eruption Episode | ||||||||||||||||||||
|---|---|---|---|---|---|---|---|---|---|---|---|---|---|---|---|---|---|---|---|---|
| 2014 Aug 5 - 2014 Dec 27 | Evidence from Observations: Reported | |||||||||||||||||||
|
List of 2 Events for Episode 1
| ||||||||||||||||||||
2003 Jul 30 ± 1 days - 2003 Jul 31 (?) Confirmed Eruption Max VEI: 2 (?)
| Episode 1 | Eruption Episode | |||||||||||||||||||||||||
|---|---|---|---|---|---|---|---|---|---|---|---|---|---|---|---|---|---|---|---|---|---|---|---|---|---|
| 2003 Jul 30 ± 1 days - 2003 Jul 31 (?) | Evidence from Observations: Reported | ||||||||||||||||||||||||
|
List of 3 Events for Episode 1
| |||||||||||||||||||||||||
2000 Apr 16 (?) ± 15 days - 2000 Oct 29 (in or after) Confirmed Eruption Max VEI: 2
| Episode 1 | Eruption Episode | |||||||||||||||||||||||||
|---|---|---|---|---|---|---|---|---|---|---|---|---|---|---|---|---|---|---|---|---|---|---|---|---|---|
| 2000 Apr 16 (?) ± 15 days - 2000 Oct 29 (in or after) | Evidence from Observations: Reported | ||||||||||||||||||||||||
|
List of 3 Events for Episode 1
| |||||||||||||||||||||||||
1990 May 28 - 1998 Sep 16 (?) ± 15 days Confirmed Eruption Max VEI: 3
| Episode 1 | Eruption Episode | |||||||||||||||||||||||||||||||||||||||||||||||||||||||||||||||||||||||||||
|---|---|---|---|---|---|---|---|---|---|---|---|---|---|---|---|---|---|---|---|---|---|---|---|---|---|---|---|---|---|---|---|---|---|---|---|---|---|---|---|---|---|---|---|---|---|---|---|---|---|---|---|---|---|---|---|---|---|---|---|---|---|---|---|---|---|---|---|---|---|---|---|---|---|---|---|
| 1990 May 28 - 1998 Sep 16 (?) ± 15 days | Evidence from Observations: Reported | ||||||||||||||||||||||||||||||||||||||||||||||||||||||||||||||||||||||||||
|
List of 13 Events for Episode 1
| |||||||||||||||||||||||||||||||||||||||||||||||||||||||||||||||||||||||||||
1988 Jun 22 - 1988 Oct 16 (?) ± 15 days Confirmed Eruption Max VEI: 1
| Episode 1 | Eruption Episode | |||||||||||||||||||||||||
|---|---|---|---|---|---|---|---|---|---|---|---|---|---|---|---|---|---|---|---|---|---|---|---|---|---|
| 1988 Jun 22 - 1988 Oct 16 (?) ± 15 days | Evidence from Observations: Reported | ||||||||||||||||||||||||
|
List of 3 Events for Episode 1
| |||||||||||||||||||||||||
[ 1987 Aug 7 ] Uncertain Eruption
| Episode 1 | Eruption Episode | |||||||||||||||||||||||||
|---|---|---|---|---|---|---|---|---|---|---|---|---|---|---|---|---|---|---|---|---|---|---|---|---|---|
| 1987 Aug 7 - Unknown | Evidence from Unknown | ||||||||||||||||||||||||
|
List of 3 Events for Episode 1
| |||||||||||||||||||||||||
1986 Dec 16 ± 15 days Confirmed Eruption Max VEI: 1
| Episode 1 | Eruption Episode | |||||||||||||||||||||||||
|---|---|---|---|---|---|---|---|---|---|---|---|---|---|---|---|---|---|---|---|---|---|---|---|---|---|
| 1986 Dec 16 ± 15 days - Unknown | Evidence from Observations: Reported | ||||||||||||||||||||||||
|
List of 3 Events for Episode 1
| |||||||||||||||||||||||||
1784 Jul Confirmed Eruption
| Episode 1 | Eruption Episode | |||||||||||||||||||||||||
|---|---|---|---|---|---|---|---|---|---|---|---|---|---|---|---|---|---|---|---|---|---|---|---|---|---|
| 1784 Jul - Unknown | Evidence from Observations: Reported | ||||||||||||||||||||||||
|
List of 3 Events for Episode 1
| |||||||||||||||||||||||||
1750 Confirmed Eruption
| Episode 1 | Eruption Episode | |||||||||||||||
|---|---|---|---|---|---|---|---|---|---|---|---|---|---|---|---|
| 1750 - Unknown | Evidence from Observations: Reported | ||||||||||||||
|
List of 1 Events for Episode 1
| |||||||||||||||
1350 ± 150 years Confirmed Eruption
| Episode 1 | Eruption Episode | ||||||||||||||||||||
|---|---|---|---|---|---|---|---|---|---|---|---|---|---|---|---|---|---|---|---|---|
| 1350 ± 150 years - Unknown | Evidence from Correlation: Tephrochronology | |||||||||||||||||||
|
List of 2 Events for Episode 1
| ||||||||||||||||||||
3490 BCE ± 40 years Confirmed Eruption Max VEI: 0
| Episode 1 | Eruption Episode | ||||||||||||||||||||
|---|---|---|---|---|---|---|---|---|---|---|---|---|---|---|---|---|---|---|---|---|
| 3490 BCE ± 40 years - Unknown | Evidence from Isotopic: 14C (uncalibrated) | |||||||||||||||||||
|
List of 2 Events for Episode 1
| ||||||||||||||||||||
6600 BCE (?) Confirmed Eruption
| Episode 1 | Eruption Episode | |||||||||||||||||||||||||
|---|---|---|---|---|---|---|---|---|---|---|---|---|---|---|---|---|---|---|---|---|---|---|---|---|---|
| 6600 BCE (?) - Unknown | Evidence from Correlation: Tephrochronology | ||||||||||||||||||||||||
|
List of 3 Events for Episode 1
| |||||||||||||||||||||||||
There is data available for 6 deformation periods. Expand each entry for additional details.
| Start Date: 2013 Nov 15 | Stop Date: 2014 May 10 | Direction: Variable (uplift / subsidence) | Method: InSAR |
| Magnitude: Unknown | Spatial Extent: Unknown | Latitude: -16.000 | Longitude: -72.000 |
Remarks: Post-seismic deformation from 17 July 2013 earthquake | |||
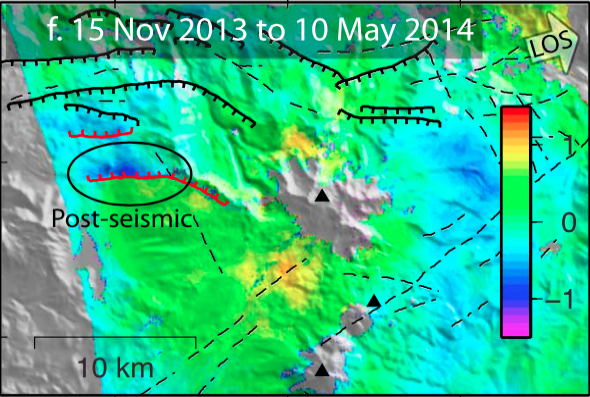 |
(f) TerraSAR-X interferogram showing postseismic deformation. From: Jay et al. 2015. |
||
Reference List: Jay et al. 2015.
Full References:
Jay, J. A., Delgado, F. J., Torres, J. L., Pritchard, M. E., Macedo, O., and Aguilar, V., 2015. Deformation and seismicity near Sabancaya volcano, southern Peru, from 2002 to 2015.. Geophysical Research Letters, 42, 2780-2788. https://doi.org/10.1002/2015GL063589
| Start Date: 2013 Jul 17 | Stop Date: 2013 Nov 15 | Direction: Variable (uplift / subsidence) | Method: InSAR |
| Magnitude: Unknown | Spatial Extent: 4.00 km | Latitude: -16.000 | Longitude: -72.000 |
Remarks: Aftershocks from July 17 earthquake | |||
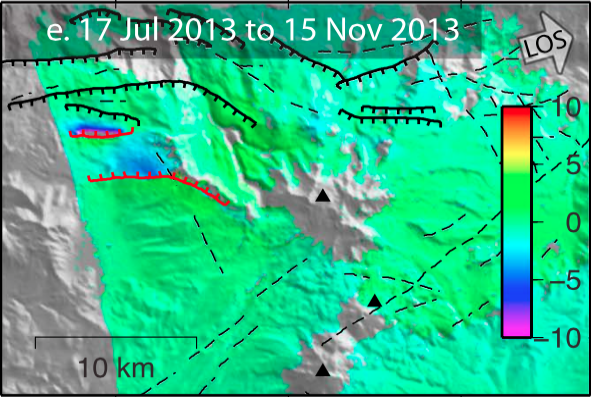 |
(e) TerraSAR-X interferogram showing deformation related to aftershock activity following the 17 July earthquake From: Jay et al. 2015. |
||
Model Solutions
| Model Solution Type | Min Depth | Max Depth | Min Volume Change | Max Volume Change | Remarks | Citation |
| Plane (fault) | 1 | Jay et al. 2015 |
Reference List: Jay et al. 2015.
Full References:
Jay, J. A., Delgado, F. J., Torres, J. L., Pritchard, M. E., Macedo, O., and Aguilar, V., 2015. Deformation and seismicity near Sabancaya volcano, southern Peru, from 2002 to 2015.. Geophysical Research Letters, 42, 2780-2788. https://doi.org/10.1002/2015GL063589
| Start Date: 2013 May 12 | Stop Date: 2013 Jul 17 | Direction: Variable (uplift / subsidence) | Method: InSAR |
| Magnitude: 16.000 cm | Spatial Extent: 20.00 km | Latitude: -16.000 | Longitude: -72.000 |
Remarks: Mw 5.9 earthquake on 17 July 2013 and aftershocks | |||
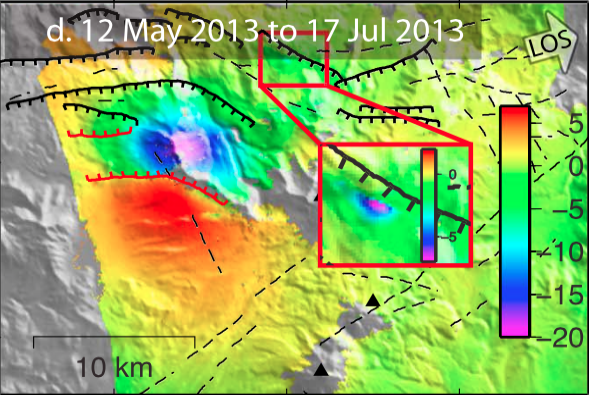 |
(d) TerraSAR-X interferogram showing deformation related to the Mw 5.9 earthquake on 17 July 2013 and inset showing deformation related to another earthquake of smaller magnitude From: Jay et al. 2015. |
||
Model Solutions
| Model Solution Type | Min Depth | Max Depth | Min Volume Change | Max Volume Change | Remarks | Citation |
| Plane (fault) | 4 | Jay et al. 2015 |
Reference List: Jay et al. 2015.
Full References:
Jay, J. A., Delgado, F. J., Torres, J. L., Pritchard, M. E., Macedo, O., and Aguilar, V., 2015. Deformation and seismicity near Sabancaya volcano, southern Peru, from 2002 to 2015.. Geophysical Research Letters, 42, 2780-2788. https://doi.org/10.1002/2015GL063589
| Start Date: 2012 Jan 14 | Stop Date: 2013 May 12 | Direction: Subsidence | Method: InSAR |
| Magnitude: 6.000 cm | Spatial Extent: 8.00 km | Latitude: -16.000 | Longitude: -72.000 |
Remarks: Earthquake swarm 22-23 February 2013 | |||
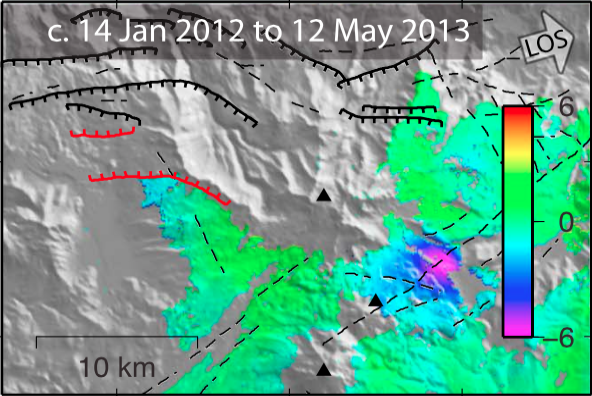 |
(c) TerraSAR-X interferogram showing deformation related to the earthquake swarm in late February 2013 From: Jay et al. 2015. |
||
Model Solutions
| Model Solution Type | Min Depth | Max Depth | Min Volume Change | Max Volume Change | Remarks | Citation |
| Plane (fault) | 4 | Jay et al. 2015 |
Reference List: Jay et al. 2015.
Full References:
Jay, J. A., Delgado, F. J., Torres, J. L., Pritchard, M. E., Macedo, O., and Aguilar, V., 2015. Deformation and seismicity near Sabancaya volcano, southern Peru, from 2002 to 2015.. Geophysical Research Letters, 42, 2780-2788. https://doi.org/10.1002/2015GL063589
| Start Date: 2002 Dec 06 | Stop Date: 2003 Sep 12 | Direction: Subsidence | Method: InSAR |
| Magnitude: 5.000 cm | Spatial Extent: 13.00 km | Latitude: -16.000 | Longitude: -72.000 |
Remarks: Mw 5.3 earthquake on 13 December 2002 | |||
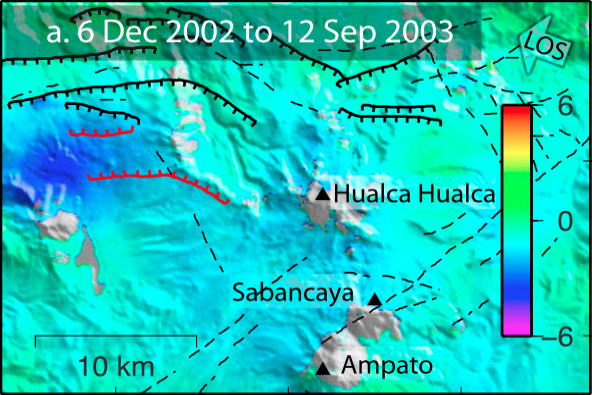 |
(a) ERS interferogram from track 454 showing subsidence related to the Mw 5.3 earthquake on 13 December 2002 From: Jay et al. 2015. |
||
Model Solutions
| Model Solution Type | Min Depth | Max Depth | Min Volume Change | Max Volume Change | Remarks | Citation |
| Plane (fault) | 12 | Jay et al. 2015 |
Reference List: Jay et al. 2015.
Full References:
Jay, J. A., Delgado, F. J., Torres, J. L., Pritchard, M. E., Macedo, O., and Aguilar, V., 2015. Deformation and seismicity near Sabancaya volcano, southern Peru, from 2002 to 2015.. Geophysical Research Letters, 42, 2780-2788. https://doi.org/10.1002/2015GL063589
| Start Date: 1992 | Stop Date: 1997 | Direction: Uplift | Method: InSAR |
| Magnitude: Unknown | Spatial Extent: 50.00 km | Latitude: -16.000 | Longitude: -72.000 |
Remarks: Uplift centered on Hualca Hualca volcano | |||
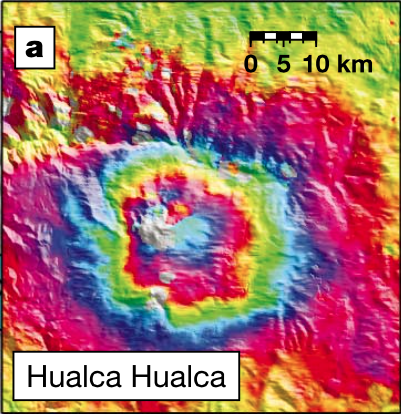 |
Hualca Hualca, Peru, time span June 1992?April 1996 (3.9 yr) From: Pritchard and Simons 2002. |
||
Model Solutions
| Model Solution Type | Min Depth | Max Depth | Min Volume Change | Max Volume Change | Remarks | Citation |
| Point | 11 | 13 | 15000000 | 30000000 | Pritchard and Simons 2002 |
Reference List: Pritchard and Simons 2002; Pritchard and Simons 2004.
Full References:
Pritchard, M. E., and M. Simons, 2002. A satellite geodetic survey of large-scale deformation of volcanic centres in the central Andes. Nature, 418, 167-171. https://doi.org/10.1038/nature00872
Pritchard, M. E., and M. Simons, 2004. Surveying volcanic arcs with satellite interferometry: The central Andes, Kamchatka, and beyond. GSA Today, 14(8), 4-9. https://doi.org/10.1130/1052-5173(2004)014<4:SVAWSR>2.0.CO
There is no Emissions History data available for Sabancaya.
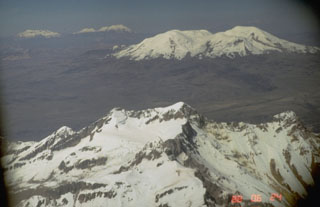 Volcanoes of three ages can be seen in this aerial view across northern Perú. The eroded, 6093-m-high Solimana volcano (foreground) has not erupted since the Pleistocene, but has an active fumarole. It is located NW of the younger Coropuna volcano (upper right), which has produced major flank lava flows during the Holocene. The three-peaked Sabancaya volcanic complex (upper left) includes the historically active cone of Sabancaya proper, which is flanked on the left by Hualca Hualca volcano and on the right by Ampato volcano.
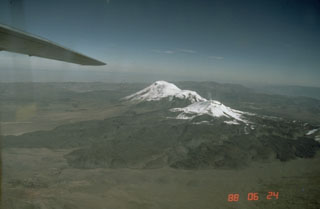 A dark-colored 15-km-wide apron of trachytic and dacitic lava flows surrounds 5967-m-high Sabancaya volcano. The prominent lava flow at the left extends more than 10 km down the SSE flank. Ampato volcano in the background forms the 6288-m high point of the Sabancaya volcanic complex. Amapato and Hualca Hualca volcano (out of view to the right) have also erupted during the Holocene, but only Sabancaya has erupted in historical time.
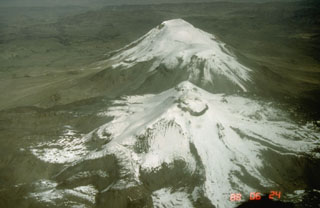 The Sabancaya volcanic complex consists of Sabancaya volcano proper (foreground), the older 6288-m-high Ampato volcano (background), and 6025-m Hualca Hualca volcano. Sabancaya, viewed here from the NE, is constructed on the saddle between the two older volcanoes. It is the youngest of the three Holocene volcanic centers and the only one to have erupted in historical time. An extensive 15-km-wide apron of trachytic and dacitic lava flows surrounds the 5967-m-high volcano. Records of historical eruptions date back to 1750.
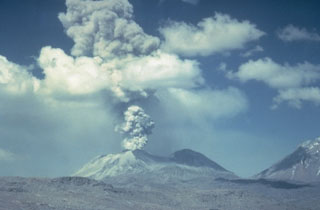 An ash-bearing plume rises above Sabancaya volcano in this photo taken from the NE, possibly in October, 1988. Voluminous steam plumes, some with dark, basal "rooster-tails," were observed to have risen 0.5-1 km above the summit on June 22, 1988. The northern flank of Ampato volcano rises at the far right.
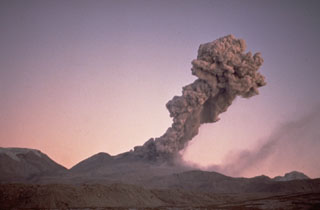 Winds deflect an eruption column from Sabancaya volcano to the NE on July 13, 1990. Residents living near the volcano reported an explosive eruption from Sabancaya that began on May 28, 1990. Initially, several explosions occurred per day, producing plumes to about 2 km height. Activity intensified on June 4, and by the 8th explosions occurred at intervals of 5-10 minutes and ashfall covered a radius of 20 km. More-or-less constant ash emission continued until 1998.
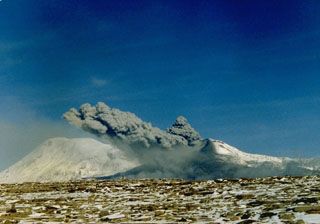 An explosive eruption from Sabancaya volcano is viewed from the east on June 9, 1990. Explosive activity, which had begun on May 28, 1990, was continuing in 1995. Sabancaya volcano was constructed on the saddle between Ampato (left) and Hualca Hualca volcanoes. Ashfall from Sabancaya in 1991, which accumulated on Hualca Hualca, caused increased melting of glaciers that produced mudflows down the Majes river drainage north of the volcano.
 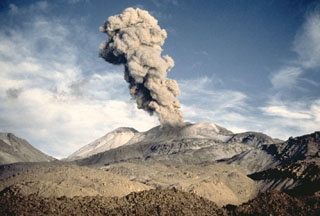 A Vulcanian ash plume, viewed from the SE, rises above Sabancaya volcano in northern Perú on 15 April 1991. Strong explosions were observed at intervals of 20-30 minutes during a visit to the volcano on 13-19 April. The explosions lasted about a minute and produced 3-4 km high ash plumes.
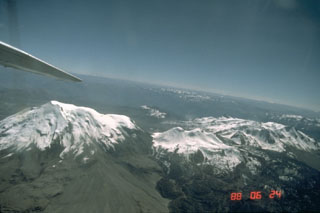 The Sabancaya volcanic complex, viewed here from the east, consists of 6288-m Ampato volcano (left), the eroded 6025-m-high Hualca Hualca volcano (right), and Sabancaya volcano proper (center), which was constructed on the saddle between the two older volcanoes. The two older centers have produced morphologically youthful lava flows, but 5967-m-high Sabancaya is the only center to have erupted in historical time.
The maps shown below have been scanned from the GVP map archives and include the volcano on this page. Clicking on the small images will load the full 300 dpi map. Very small-scale maps (such as world maps) are not included. The maps database originated over 30 years ago, but was only recently updated and connected to our main database. We welcome users to tell us if they see incorrect information or other problems with the maps; please use the Contact GVP link at the bottom of the page to send us email.
There are no samples for Sabancaya in the Smithsonian's NMNH Department of Mineral Sciences Rock and Ore collection.
| Copernicus Browser | The Copernicus Browser replaced the Sentinel Hub Playground browser in 2023, to provide access to Earth observation archives from the Copernicus Data Space Ecosystem, the main distribution platform for data from the EU Copernicus missions. |
| MIROVA | Middle InfraRed Observation of Volcanic Activity (MIROVA) is a near real time volcanic hot-spot detection system based on the analysis of MODIS (Moderate Resolution Imaging Spectroradiometer) data. In particular, MIROVA uses the Middle InfraRed Radiation (MIR), measured over target volcanoes, in order to detect, locate and measure the heat radiation sourced from volcanic activity. |
| MODVOLC Thermal Alerts | Using infrared satellite Moderate Resolution Imaging Spectroradiometer (MODIS) data, scientists at the Hawai'i Institute of Geophysics and Planetology, University of Hawai'i, developed an automated system called MODVOLC to map thermal hot-spots in near real time. For each MODIS image, the algorithm automatically scans each 1 km pixel within it to check for high-temperature hot-spots. When one is found the date, time, location, and intensity are recorded. MODIS looks at every square km of the Earth every 48 hours, once during the day and once during the night, and the presence of two MODIS sensors in space allows at least four hot-spot observations every two days. Each day updated global maps are compiled to display the locations of all hot spots detected in the previous 24 hours. There is a drop-down list with volcano names which allow users to 'zoom-in' and examine the distribution of hot-spots at a variety of spatial scales. |
|
WOVOdat
Single Volcano View Temporal Evolution of Unrest Side by Side Volcanoes |
WOVOdat is a database of volcanic unrest; instrumentally and visually recorded changes in seismicity, ground deformation, gas emission, and other parameters from their normal baselines. It is sponsored by the World Organization of Volcano Observatories (WOVO) and presently hosted at the Earth Observatory of Singapore.
GVMID Data on Volcano Monitoring Infrastructure The Global Volcano Monitoring Infrastructure Database GVMID, is aimed at documenting and improving capabilities of volcano monitoring from the ground and space. GVMID should provide a snapshot and baseline view of the techniques and instrumentation that are in place at various volcanoes, which can be use by volcano observatories as reference to setup new monitoring system or improving networks at a specific volcano. These data will allow identification of what monitoring gaps exist, which can be then targeted by remote sensing infrastructure and future instrument deployments. |
| Volcanic Hazard Maps | The IAVCEI Commission on Volcanic Hazards and Risk has a Volcanic Hazard Maps database designed to serve as a resource for hazard mappers (or other interested parties) to explore how common issues in hazard map development have been addressed at different volcanoes, in different countries, for different hazards, and for different intended audiences. In addition to the comprehensive, searchable Volcanic Hazard Maps Database, this website contains information about diversity of volcanic hazard maps, illustrated using examples from the database. This site is for educational purposes related to volcanic hazard maps. Hazard maps found on this website should not be used for emergency purposes. For the most recent, official hazard map for a particular volcano, please seek out the proper institutional authorities on the matter. |
| IRIS seismic stations/networks | Incorporated Research Institutions for Seismology (IRIS) Data Services map showing the location of seismic stations from all available networks (permanent or temporary) within a radius of 0.18° (about 20 km at mid-latitudes) from the given location of Sabancaya. Users can customize a variety of filters and options in the left panel. Note that if there are no stations are known the map will default to show the entire world with a "No data matched request" error notice. |
| UNAVCO GPS/GNSS stations | Geodetic Data Services map from UNAVCO showing the location of GPS/GNSS stations from all available networks (permanent or temporary) within a radius of 20 km from the given location of Sabancaya. Users can customize the data search based on station or network names, location, and time window. Requires Adobe Flash Player. |
| DECADE Data | The DECADE portal, still in the developmental stage, serves as an example of the proposed interoperability between The Smithsonian Institution's Global Volcanism Program, the Mapping Gas Emissions (MaGa) Database, and the EarthChem Geochemical Portal. The Deep Earth Carbon Degassing (DECADE) initiative seeks to use new and established technologies to determine accurate global fluxes of volcanic CO2 to the atmosphere, but installing CO2 monitoring networks on 20 of the world's 150 most actively degassing volcanoes. The group uses related laboratory-based studies (direct gas sampling and analysis, melt inclusions) to provide new data for direct degassing of deep earth carbon to the atmosphere. |
| Large Eruptions of Sabancaya | Information about large Quaternary eruptions (VEI >= 4) is cataloged in the Large Magnitude Explosive Volcanic Eruptions (LaMEVE) database of the Volcano Global Risk Identification and Analysis Project (VOGRIPA). |
| EarthChem | EarthChem develops and maintains databases, software, and services that support the preservation, discovery, access and analysis of geochemical data, and facilitate their integration with the broad array of other available earth science parameters. EarthChem is operated by a joint team of disciplinary scientists, data scientists, data managers and information technology developers who are part of the NSF-funded data facility Integrated Earth Data Applications (IEDA). IEDA is a collaborative effort of EarthChem and the Marine Geoscience Data System (MGDS). |

