Recently Published Bulletin Reports
Agung (Indonesia) Three eruptive events reported in April, May, and December 2022
Tengger Caldera (Indonesia) Minor ash emission in December 2023; persistent weak thermal anomaly in the Bromo crater
Saunders (United Kingdom) Persistent thermal anomalies from the summit crater lava lake during February 2023-January 2024
Shishaldin (United States) New eruption with significant Strombolian explosions, ash plumes, and ashfall
Ioto (Japan) New eruption with discolored water, ejecta, and floating pumice during October-December 2023
Purace (Colombia) Gas-and-ash emission on 16 November 2023
Suwanosejima (Japan) Eruption plumes, crater incandescence, and occasional explosions during July-October 2023
Etna (Italy) Strombolian explosions, lava fountains, and lava flows during July-August 2023
Aira (Japan) Explosions, ash plumes, ash fall, and crater incandescence during July-October 2023
Nishinoshima (Japan) Gray emissions during October 2023
Kilauea (United States) Strong lava fountains, lava flows, and spatter at Halema’uma’u during January-September 2023
Tinakula (Solomon Islands) Continued lava flows and thermal activity during June through November 2023
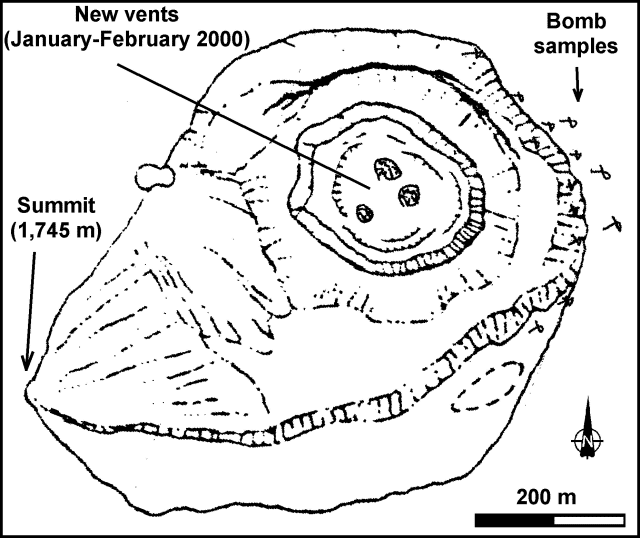
Agung (Indonesia) — January 2024  Cite this Report
Agung
Indonesia
8.343°S, 115.508°E; summit elev. 2997 m
All times are local (unless otherwise noted)
Three eruptive events reported in April, May, and December 2022
Mount Agung, located on the E end of the island of Bali, Indonesia, rises above the SE rim of the Batur caldera. The summit area extends 1.5 km E-W, with the highest point on the W and a steep-walled 800-m-wide crater on the E. Recorded eruptions date back to the early 19th century. A large and deadly explosive and effusive eruption occurred during 1963-64, which was characterized by voluminous ashfall, pyroclastic flows, and lahars that caused extensive damage and many fatalities. More recent activity was documented during November 2017-June 2019 that consisted of multiple explosions, significant ash plumes, lava flows at the summit crater, and incandescent ejecta. This report covers activity reported during April-May 2022 and December 2022 based on data from the Darwin Volcanic Ash Advisory Center (VAAC).
Activity during 2022 was relatively low and mainly consisted of a few ash plumes during April-May and December. An ash plume on 3 April rising to 3.7 km altitude (700 m above the summit) and drifting N was reported in a Darwin VAAC notice based on a ground report, with ash seen in HIMAWARI-8 visible imagery. Another ash plume was reported at 1120 on 27 May that rose to 5.5 km altitude (2.5 m above the summit); the plume was not visible in satellite or webcam images due to weather clouds. An eruption was reported based on seismic data at 0840 on 13 December, with an estimated plume altitude of 3.7 km; however, no ash was seen using satellite imagery in clear conditions before weather clouds obscured the summit.
Geologic Background. Symmetrical Agung stratovolcano, Bali's highest and most sacred mountain, towers over the eastern end of the island. The volcano, whose name means "Paramount," rises above the SE rim of the Batur caldera, and the northern and southern flanks extend to the coast. The summit area extends 1.5 km E-W, with the high point on the W and a steep-walled 800-m-wide crater on the E. The Pawon cone is located low on the SE flank. Only a few eruptions dating back to the early 19th century have been recorded in historical time. The 1963-64 eruption, one of the largest in the 20th century, produced voluminous ashfall along with devastating pyroclastic flows and lahars that caused extensive damage and many fatalities.
Information Contacts: Darwin Volcanic Ash Advisory Centre (VAAC), Bureau of Meteorology, Northern Territory Regional Office, PO Box 40050, Casuarina, NT 0811, Australia (URL: http://www.bom.gov.au/info/vaac/).
Tengger Caldera (Indonesia) — February 2024 Cite this Report
Tengger Caldera
Indonesia
7.942°S, 112.95°E; summit elev. 2329 m
All times are local (unless otherwise noted)
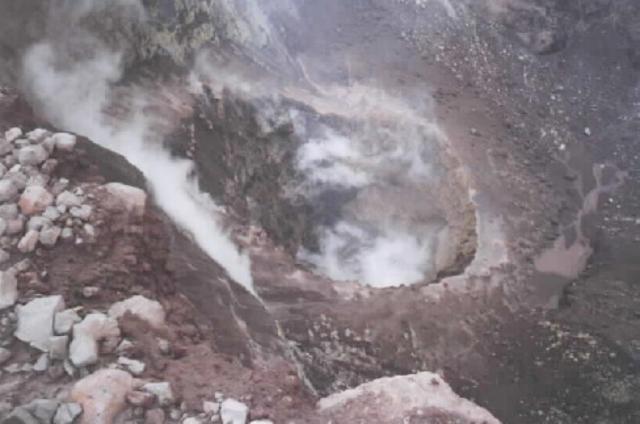
Minor ash emission in December 2023; persistent weak thermal anomaly in the Bromo crater
Tengger Caldera, located at the N end of a volcanic massif in Indonesia’s East Java, consists of five overlapping stratovolcanoes. The youngest and only active cone in the 16-km-wide caldera is Bromo, which typically produces gas-and-steam plumes, occasional ash plumes and explosions, and weak thermal signals (BGVN 44:05, 47:01). This report covers activity during January 2022-December 2023, consisting of mostly white gas-and-steam emissions and persistent weak thermal anomalies. Information was provided by the Pusat Vulkanologi dan Mitigasi Bencana Geologi (PVMBG, also known as Indonesian Center for Volcanology and Geological Hazard Mitigation, CVGHM) and satellite imagery. The Alert Level remained at 2 (on a scale of 1-4), and visitors were warned to stay at least 1 km from the crater.
Activity was generally low during the reporting period, similar to that in 2021. According to almost daily images from MAGMA Indonesia (a platform developed by PVMBG), white emissions and plumes rose from 50 to 900 m above the main crater during this period (figure 24). During several days in March and June 2022, white plumes reached heights of 1-1.2 km above the crater.
After an increase in activity at 2114 on 3 February 2023, a PVMBG team that was sent to observe white emissions rising as high as 300 m during 9-12 February and heard rumbling noises. A sulfur dioxide odor was also strong near the crater and measurements indicated that levels were above the healthy (non-hazardous) threshold of 5 parts per million; differential optical absorption spectroscopy (DOAS) measurements indicated an average flux of 190 metric tons per day on 11 February. Incandescence originating from a large fumarole in the NNW part of the crater was visible at night. The team observed that vegetation on the E caldera wall was yellow and withered. The seismic network recorded continuous tremor and deep and shallow volcanic earthquakes.
According to a PVMBG press release, activity increased on 13 December 2023 with white, gray, and brown emissions rising as high as 900 m above Bromo’s crater rim and drifting in multiple directions (figure 25). The report noted that tremor was continuous and was accompanied in December by three volcanic earthquakes. Deformation data indicated inflation in December. There was no observable difference in the persistent thermal anomaly in the crater between 11 and 16 December 2023.
All clear views of the Bromo crater throughout this time, using Sentinel-2 infrared satellite images, showed a weak persistent thermal anomaly; none of the anomalies were strong enough to cause MODVOLC Thermal Alerts. A fire in the SE part of the caldera in early September 2023 resulted in a brief period of strong thermal anomalies.
Geologic Background. The 16-km-wide Tengger caldera is located at the northern end of a volcanic massif extending from Semeru volcano. The massive volcanic complex dates back to about 820,000 years ago and consists of five overlapping stratovolcanoes, each truncated by a caldera. Lava domes, pyroclastic cones, and a maar occupy the flanks of the massif. The Ngadisari caldera at the NE end of the complex formed about 150,000 years ago and is now drained through the Sapikerep valley. The most recent of the calderas is the 9 x 10 km wide Sandsea caldera at the SW end of the complex, which formed incrementally during the late Pleistocene and early Holocene. An overlapping cluster of post-caldera cones was constructed on the floor of the Sandsea caldera within the past several thousand years. The youngest of these is Bromo, one of Java's most active and most frequently visited volcanoes.
Information Contacts: Pusat Vulkanologi dan Mitigasi Bencana Geologi (PVMBG, also known as Indonesian Center for Volcanology and Geological Hazard Mitigation, CVGHM), Jalan Diponegoro 57, Bandung 40122, Indonesia (URL: http://www.vsi.esdm.go.id/); MAGMA Indonesia, Kementerian Energi dan Sumber Daya Mineral (URL: https://magma.esdm.go.id/v1); Copernicus Browser, Copernicus Data Space Ecosystem, European Space Agency (URL: https://dataspace.copernicus.eu/browser/); Hawai'i Institute of Geophysics and Planetology (HIGP) - MODVOLC Thermal Alerts System, School of Ocean and Earth Science and Technology (SOEST), Univ. of Hawai'i, 2525 Correa Road, Honolulu, HI 96822, USA (URL: http://modis.higp.hawaii.edu/).
Saunders (United Kingdom) — February 2024 Cite this Report
Saunders
United Kingdom
57.8°S, 26.483°W; summit elev. 843 m
All times are local (unless otherwise noted)
Persistent thermal anomalies from the summit crater lava lake during February 2023-January 2024
Saunders is one of eleven islands that comprise the South Sandwich Islands in the South Atlantic. The active Mount Michael volcano has been in almost continuous eruption since November 2014 (BGVN 48:02). Recent activity has resulted in intermittent thermal anomalies and gas-and-steam emissions (BGVN 47:03, 48:02). Visits are infrequent due to its remote location, and cloud cover often prevents satellite observations. Satellite thermal imagery and visual observation of incandescence during a research expedition in 2019 (BGVN 28:02 and 44:08) and a finding confirmed by a National Geographic Society research team that summited Michael in November 2022 reported the presence of a lava lake.
Although nearly constant cloud cover during February 2023 through January 2024 greatly limited satellite observations, thermal anomalies from the lava lake in the summit crater were detected on clear days, especially around 20-23 August 2023. Anomalies similar to previous years (eg. BGVN 48:02) were seen in both MIROVA (Middle InfraRed Observation of Volcanic Activity) data from MODIS instruments and in Sentinel 2 infrared imagery. The only notable sulfur dioxide plume detected near Saunders was on 25 September 2023, with the TROPOMI instrument aboard the Sentinel-5P satellite.
Geologic Background. Saunders Island consists of a large central volcanic edifice intersected by two seamount chains, as shown by bathymetric mapping (Leat et al., 2013). The young Mount Michael stratovolcano dominates the glacier-covered island, while two submarine plateaus, Harpers Bank and Saunders Bank, extend north. The symmetrical Michael has a 500-m-wide summit crater and a remnant of a somma rim to the SE. Tephra layers visible in ice cliffs surrounding the island are evidence of recent eruptions. Ash clouds were reported from the summit crater in 1819, and an effusive eruption was inferred to have occurred from a N-flank fissure around the end of the 19th century and beginning of the 20th century. A low ice-free lava platform, Blackstone Plain, is located on the north coast, surrounding a group of former sea stacks. A cluster of cones on the SE flank, the Ashen Hills, appear to have been modified since 1820 (LeMasurier and Thomson, 1990). Analysis of satellite imagery available since 1989 (Gray et al., 2019; MODVOLC) suggests frequent eruptive activity (when weather conditions allow), volcanic clouds, steam plumes, and thermal anomalies indicative of a persistent, or at least frequently active, lava lake in the summit crater. Due to this observational bias, there has been a presumption when defining eruptive periods that activity has been ongoing unless there is no evidence for at least 10 months.
Information Contacts: MIROVA (Middle InfraRed Observation of Volcanic Activity), a collaborative project between the Universities of Turin and Florence (Italy) supported by the Centre for Volcanic Risk of the Italian Civil Protection Department (URL: http://www.mirovaweb.it/); NASA Global Sulfur Dioxide Monitoring Page, Atmospheric Chemistry and Dynamics Laboratory, NASA Goddard Space Flight Center (NASA/GSFC), 8800 Greenbelt Road, Goddard MD 20771, USA (URL: https://so2.gsfc.nasa.gov/); Copernicus Browser (URL: https://dataspace.copernicus.eu/browser).
Shishaldin (United States) — December 2023 Cite this Report
Shishaldin
United States
54.756°N, 163.97°W; summit elev. 2857 m
All times are local (unless otherwise noted)
New eruption with significant Strombolian explosions, ash plumes, and ashfall
Shishaldin is located on the eastern half of Unimak Island, one of the Aleutian Islands. Frequent explosive activity, primarily consisting of Strombolian ash eruptions from the small summit crater, but sometimes producing lava flows, has been recorded since the 18th century. The previous eruption ended in May 2020 and was characterized by intermittent thermal activity, increased seismicity and surface temperatures, ash plumes, and ash deposits (BGVN 45:06). This report covers a new eruption during July through November 2023, which consisted of significant explosions, ash plumes, ashfall, and lava fountaining. Information comes from daily, weekly, and special reports from the Alaska Volcano Observatory (AVO) and various satellite data. AVO monitors the volcano using local seismic and infrasound sensors, satellite data, web cameras, and remote infrasound and lightning networks.
AVO reported that intermittent tremor and low-frequency earthquakes had gradually become more regular and consistent during 10-13 July. Strongly elevated surface temperatures at the summit were identified in satellite images during 10-13 July. On 11 July AVO raised the Aviation Color Code (ACC) to Yellow (the second color on a four-color scale) and Volcano Alert Level (VAL) to Advisory (the second level on a four-level scale) at 1439. Later in the day on 11 July summit crater incandescence was observed in webcam images. Observations of the summit suggested that lava was likely present at the crater, which prompted AVO to raise the ACC to Orange (the second highest color on a four-color scale) and the VAL to Watch (the second highest level on a four-level scale). The US Coast Guard conducted an overflight on 12 July and confirmed that lava was erupting from the summit. That same day, sulfur dioxide emissions were detected in satellite images.
A significant explosion began at 0109 on 14 July that produced an ash plume that rose to 9-12 km altitude and drifted S over the Pacific Ocean (figure 43). Webcam images and photos taken around 0700 from a ship SW off Unimak Island showed small lahar deposits, which were the result of the interaction of hot pyroclastic material and snow and ice on the flanks. There was also ashfall on the SW and N flanks. A smaller explosion at 0710 generated an ash plume that rose to 4.5 km altitude. Webcam images and pilot reports showed continued low-level ash emissions during the morning, rising to less than 4.6 km altitude; those emissions included a small ash plume near the summit around 1030 resulting from a small explosion.
Seismic tremor amplitude began increasing at around 1700 on 15 July; strongly elevated surface temperatures were also reported. An ash plume rose to 4.6 km altitude and drifted SSE at 2100, based on a satellite image. A continuous ash plume during 2150 through 2330 rose to 5 km altitude and extended 125 km S. At 2357 AVO raised the ACC to Red (the highest color on a four-color scale) and the VAL to Warning (the highest level on a four-level scale), noting that seismicity remained elevated for more than six hours and explosion signals were frequently detected by regional infrasound (pressure sensor) networks. Explosions generated an ash plume that rose to 4.9 km altitude and drifted as far as 500 km SE. Activity throughout the night declined and by 0735 the ACC was lowered to Orange and the VAL to Watch. High-resolution satellite images taken on 16 July showed pyroclastic deposits extending as far as 3 km from the vent; these deposits generated lahars that extended further down the drainages on the flanks. Ash deposits were mainly observed on the SSE flank and extended to the shore of Unimak Island. During 16-17 July lava continued to erupt at the summit, which caused strongly elevated surface temperatures that were visible in satellite imagery.
Lava effusion increased at 0100 on 18 July, as noted in elevated surface temperatures identified in satellite data, increasing seismic tremor, and activity detected on regional infrasound arrays. A significant ash plume at 0700 rose to 7 km altitude and continued until 0830, eventually reaching 9.1 km altitude and drifting SSE (figure 44). As a result, the ACC was raised to Red and the VAL to Warning. By 0930 the main plume detached, but residual low-level ash emissions continued for several hours, remaining below 3 km altitude and drifting S. The eruption gradually declined and by 1208 the ACC was lowered to Orange and the VAL was lowered to Watch. High-resolution satellite images showed ash deposits on the SW flank and pyroclastic deposits on the N, E, and S flanks, extending as far as 3 km from the vent; lahars triggered by the eruption extended farther down the flanks (figure 45). Lava continued to erupt from the summit crater on 19 July.
Elevated surface temperatures were detected in satellite images during 19-25 July, despite occasional weather cloud cover, which was consistent with increased lava effusion. During 22-23 July satellite observations acquired after the eruption from 18 July showed pyroclastic flow and lahar deposits extending as far as 3 km down the N, NW, and NE flanks and as far as 1.5 km down the S and SE flanks. Ash deposits covered the SW and NE flanks. No lava flows were observed outside the crater. On 22 July a sulfur dioxide plume was detected in satellite data midday that had an estimated mass of 10 kt. In a special notice issued at 1653 on 22 July AVO noted that eruptive activity had intensified over the previous six hours, which was characterized by an hours-long steady increase in seismic tremor, intermittent infrasound signals consistent with small explosions, and an increase in surface temperatures that were visible in satellite data. Pilots first reported low-level ash plumes at around 1900. At 2320 an ash plume had risen to 9 km altitude based on additional pilot reports and satellite images. The ACC was increased to Red and the VAL to Warning at 2343. Satellite images indicated growth of a significantly higher ash plume that rose to 11 km altitude continued until 0030 and drifted NE. During the early morning hours of 23 July ash plumes had declined to 4.6 k altitude. Seismic tremor peaked at 0030 on 23 July and began to rapidly decline at 0109; active ash emissions were no longer visible in satellite data by 0130. The ACC was lowered to Orange and the VAL to Watch at 0418; bursts of increased seismicity were recorded throughout the morning, but seismicity generally remained at low levels. Elevated surface temperatures were visible in satellite data until about 0600. On 24 July pilots reported seeing vigorous gas-and-steam plumes rising to about 3 km altitude; the plumes may have contained minor amounts of ash.
During 24-25 July low level seismicity and volcanic tremor were detected at low levels following the previous explosion on 23 July. Strongly elevated surface temperatures were observed at the summit crater in satellite data. Around 2200 on 25 July seismicity began to increase, followed by infrasound signals of explosions after 0200 on 26 July. An ash plume rose to 3 km altitude at 0500 and drifted ENE, along with an associated sulfur dioxide plume that drifted NE and had an estimated mass of 22 kt. Diffuse ash emissions were visible in satellite data and rose to 6.1-7.6 km altitude and extended 125 km from the volcano starting around 1130. These ash events were preceded by about seven hours of seismic tremor, infrasound detections of explosions, and five hours of increased surface temperatures visible in satellite data. Activity began to decline around 1327, which included low-frequency earthquakes and decreased volcanic tremor, and infrasound data no longer detected significant explosions. Surface temperatures remained elevated through the end of the month.
Seismicity, volcanic tremor, and ash emissions remained at low levels during early August. Satellite images on 1 August showed that some slumping had occurred on the E crater wall due to the recent explosive activity. Elevated surface temperatures continued, which was consistent with cooling lava. On 2 August small explosive events were detected, consistent with low-level Strombolian activity. Some episodes of volcanic tremor were reported, which reflected low-level ash emissions. Those ash emissions rose to less than 3 km altitude and drifted as far as 92.6 km N. Pilots that were located N of the volcano observed an ash plume that rose to 2.7 km altitude. Seismicity began to increase in intensity around 0900 on 3 August. Seismicity continued to increase throughout the day and through the night with strongly elevated surface temperatures, which suggested that lava was active at the surface.
An ash cloud that rose to 7.6-7.9 km altitude and drifted 60-75 km NE was visible in a satellite image at 0520 on 4 August. Pilots saw and reported the plume at 0836 (figure 46). By 0900 the plume had risen to 9.1 km altitude and extended over 100 km NE. AVO raised the ACC to Red and the VAL to Warning as a result. Seismic tremor levels peaked at 1400 and then sharply declined at 1500 to slightly elevated levels; the plume was sustained during the period of high tremor and drifted N and NE. The ACC was lowered to Orange and the VAL to Watch at 2055. During 5-14 August seismicity remained low and surface temperatures were elevated based on satellite data due to cooling lava. On 9 August a small lava flow was observed that extended from the crater rim to the upper NE flank. It had advanced to 55 m in length and appeared in satellite imagery on 11 August. Occasional gas-and-steam plumes were noted in webcam images. At 1827 AVO noted that seismic tremor had steadily increased during the afternoon and erupting lava was visible at the summit in satellite images.
Strong explosion signals were detected at 0200 on 15 August. An ash cloud that was visible in satellite data extended 100 km NE and may have risen as high as 11 km altitude around 0240. By 0335 satellite images showed the ash cloud rising to 7.6 km altitude and drifting NE. Significant seismicity and explosions were detected by the local AVO seismic and infrasound networks, and volcanic lightning was detected by the World Wide Lightning Location Network (WWLLN). A sulfur dioxide plume associated with the eruption drifted over the S Bering Sea and parts of Alaska and western Canada. Seismicity was significantly elevated during the eruption but had declined by 1322. A pilot reported that ash emissions continued, rising as high as 4.9 km altitude. Elevated surface temperatures detected in satellite data were caused by hot, eruptive material (pyroclastic debris and lava) that accumulated around the summit. Eruptive activity declined by 16 August and the associated sulfur dioxide plume had mostly dissipated; remnants continued to be identified in satellite images at least through 18 August. Surface temperatures remained elevated based on satellite images, indicating hot material on the upper parts of the volcano. Small explosions were detected in infrasound data on the morning of 19 August and were consistent with pilot reports of small, short-lived ash plumes that rose to about 4.3 km altitude. Low-level explosive activity was reported during 20-24 August, according to seismic and infrasound data, and weather clouds sometimes prevented views. Elevated surface temperatures were observed in satellite images, which indicated continued hot material on the upper parts of the volcano.
Seismic tremor began to increase at around 0300 on 25 August and was followed by elevated surface temperatures identified in satellite images, consistent with erupting lava. Small explosions were recorded in infrasound data. The ACC was raised to Red and the VAL to Warning at 1204 after a pilot reported an ash plume that rose to 9.1 km altitude. Seismicity peaked at 1630 and began to rapidly decline at around 1730. Ash plumes rose as high as 10 km altitude and drifted as far as 400 km NE. By 2020 the ash plumes had declined to 6.4 km altitude and continued to drift NE. Ash emissions were visible in satellite data until 0000 on 26 August and seismicity was at low levels. AVO lowered the ACC to Orange and the VAL to Watch at 0030. Minor explosive activity within the summit crater was detected during 26-28 August and strongly elevated surface temperatures were still visible in satellite imagery through the rest of the month. An AVO field crew working on Unimak Island observed a mass flow that descended the upper flanks beginning around 1720 on 27 August. The flow produced a short-lived ash cloud that rose to 4.5 km altitude and rapidly dissipated. The mass flow was likely caused by the collapse of spatter that accumulated on the summit crater rim.
Similar variable explosive activity was reported in September, although weather observations sometimes prevented observations. A moderate resolution satellite image from the afternoon of 1 September showed gas-and-steam emissions filling the summit crater and obscuring views of the vent. In addition, hot deposits from the previous 25-26 August explosive event were visible on the NE flank near the summit, based on a 1 September satellite image. On 2 and 4 September seismic and infrasound data showed signals of small, repetitive explosions. Variable gas-and-steam emissions from the summit were visible but there was no evidence of ash. Possible summit crater incandescence was visible in nighttime webcam images during 3-4 September.
Seismicity began to gradually increase at around 0300 on 5 September and activity escalated at around 0830. A pilot reported an ash plume that rose to 7.6 km altitude at 0842 and continued to rise as high as possibly 9.7 km altitude and drifted SSE based on satellite images (figure 47). The ACC was raised to Red and the VAL to Warning at 0900. In addition to strong tremor and sustained explosions, the eruption produced volcanic lightning that was detected by the WWLLN. Around 1100 seismicity decreased and satellite data confirmed that the altitude of the ash emissions had declined to 7.6 km altitude. By 1200 the lower-altitude portion of the ash plume had drifted 125 km E. Significant ash emissions ended by 1330 based on webcam images. The ACC was lowered to Orange and the VAL to Watch at 1440. Satellite images showed extensive pyroclastic debris flows on most of the flanks that extended 1.2-3.3 km from the crater rim.
During 6-13 September elevated surface temperatures continued to be observed in satellite data, seismicity remained elevated with weak but steady tremor, and small, low-frequency earthquakes and small explosions were reported, except on 12 September. On 6 September a low-level ash plume rose to 1.5-1.8 km altitude and drifted SSE. Occasional small and diffuse gas-and-steam emissions at the summit were visible in webcam images. Around 1800 on 13 September seismic tremor amplitudes began to increase, and small explosions were detected in seismic and infrasound data. Incandescent lava at the summit was seen in a webcam image taken at 0134 on 14 September during a period of elevated tremor. No ash emissions were reported during the period of elevated seismicity. Lava fountaining began around 0200, based on webcam images. Satellite-based radar observations showed that the lava fountaining activity led to the growth of a cone in the summit crater, which refilled most of the crater. By 0730 seismicity significantly declined and remained at low levels.
Seismic tremor began to increase around 0900 on 15 September and rapidly intensified. An explosive eruption began at around 1710, which prompted AVO to raise the ACC to Red and the VAL to Warning. Within about 30 minutes ash plumes drifted E below a weather cloud at 8.2 km altitude. The National Weather Service estimated that an ash-rich plume rose as high as 12.8 km altitude and produced volcanic lightning. The upper part of the ash plume detached from the vent around 1830 and drifted E, and was observed over the Gulf of Alaska. Around the same time, seismicity dramatically decreased. Trace ashfall was reported in the community of False Pass (38 km ENE) between 1800-2030 and also in King Cove and nearby marine waters. Activity declined at around 1830 although seismicity remained elevated, ash emissions, and ashfall continued until 2100. Lightning was again detected beginning around 1930, which suggested that ash emissions continued. Ongoing explosions were detected in infrasound data, at a lower level than during the most energetic phase of this event. Lightning was last detected at 2048. By 2124 the intensity of the eruption had decreased, and ash emissions were likely rising to less than 6.7 km altitude. Seismicity returned to pre-eruption levels. On 16 September the ACC was lowered to Orange and the VAL to Watch at 1244; the sulfur dioxide plume that was emitted from the previous eruption event was still visible over the northern Pacific Ocean. Elevated surface temperatures, gas-and-steam emissions from the vent, and new, small lahars were reported on the upper flanks based on satellite and webcam images. Minor deposits were reported on the flanks which were likely the result of collapse of previously accumulated lava near the summit crater.
Elevated seismicity with tremor, small earthquakes, and elevated surface temperatures were detected during 17-23 September. Minor gas-and-steam emissions were visible in webcam images. On 20 September small volcanic debris flows were reported on the upper flanks. On 21 September a small ash deposit was observed on the upper flanks extending to the NE based on webcam images. Seismic tremor increased significantly during 22-23 September. Regional infrasound sensors suggested that low-level eruptive activity was occurring within the summit crater by around 1800 on 23 September. Even though seismicity was at high levels, strongly elevated surface temperatures indicating lava at the surface were absent and no ash emissions were detected; weather clouds at 0.6-4.6 km altitude obscured views. At 0025 on 24 September AVO noted that seismicity continued at high levels and nearly continuous small infrasound signals began, likely from low-level eruptive activity. Strongly elevated surface temperatures were identified in satellite images by 0900 and persisted throughout the day; the higher temperatures along with infrasound and seismic data were consistent with lava erupting at the summit. Around 1700 similarly elevated surface temperatures were detected from the summit in satellite data, which suggested that more vigorous lava fountaining had started. Starting around 1800 low-level ash emissions rose to altitudes less than 4.6 km altitude and quickly dissipated.
Beginning at midnight on 25 September, a series of seismic signals consistent with volcanic flows were recorded on the N side of the volcano. A change in seismicity and infrasound signals occurred around 0535 and at 0540 a significant ash cloud formed and quickly reached 14 km altitude and drifted E along the Alaska Peninsula. The cloud generated at least 150 lightning strokes with thunder that could be heard by people in False Pass. Seismicity rapidly declined to near background levels around 0600. AVO increased the ACC to Red and the VAL to Warning at 0602. The ash cloud detached from the volcano at around 0700, rose to 11.6 km altitude, and drifted ESE. Trace to minor amounts of ashfall were reported by the communities of False Pass, King Cove, Cold Bay, and Sand Point around 0700. Ash emissions continued at lower altitudes of 6-7.6 km altitude at 0820. Small explosions at the vent area continued to be detected in infrasound data and likely represented low-level eruptive activity near the vent. Due to the significant decrease in seismicity and ash emissions the ACC was lowered to Orange and the VAL to Watch at 1234. Radar data showed significant collapses of the crater that occurred on 25 September. Satellite data also showed significant hot, degassing pyroclastic and lahar deposits on all flanks, including more extensive flows on the ENE and WSW sections below two new collapse scarps. Following the significant activity during 24-25 September, only low-level activity was observed. Seismicity decreased notably near the end of the strong activity on 25 September and continued to decrease through the end of the month, though tremor and small earthquakes were still reported. No explosive activity was detected in infrasound data through 2 October. Gas-and-steam emissions rose to 3.7 km altitude, as reported by pilots and seen in satellite images. Satellite data from 26 September showed that significant collapses had occurred at the summit crater and hot, steaming deposits from pyroclastic flows and lahars were present on all the flanks, particularly to the ENE and WSW. A small ash cloud was visible in webcam images on 27 September, likely from a collapse at the summit cone. High elevated surface temperatures were observed in satellite imagery during 27-28 September, which were likely the result of hot deposits on the flanks erupted on 25 September. Minor steaming at the summit crater and from an area on the upper flanks was visible in webcam images on 28 September.
During October, explosion events continued between periods of low activity. Seismicity significantly increased starting at around 2100 on 2 October; around the same time satellite images showed an increase in surface temperatures consistent with lava fountaining. Small, hot avalanches of rock and lava descended an unspecified flank. In addition, a distinct increase in infrasound, seismicity, and lightning detections was followed by an ash plume that rose to 12.2 km altitude and drifted S and E at 0520 on 3 October, based on satellite images. Nighttime webcam images showed incandescence due to lava fountaining at the summit and pyroclastic flows descending the NE flank. AVO reported that a notable explosive eruption started at 0547 and lasted until 0900 on 3 October, which prompted a rise in the ACC to Red and the VAL to Warning. Subsequent ash plumes rose to 6-7.6 km altitude by 0931. At 1036 the ACC was lowered back to Orange and the VAL to Watch since both seismic and infrasound data quieted substantially and were slightly above background levels. Gas-and-steam emissions were observed at the summit, based on webcam images. Trace amounts of ashfall were observed in Cold Bay. Resuspended ash was present at several kilometers altitude near the volcano. During the afternoon, low-level ash plumes were visible at the flanks, which appeared to be largely generated by rock avalanches off the summit crater following the explosive activity. These ash plumes rose to 3 km altitude and drifted W. Trace amounts of ashfall were reported by observers in Cold Bay and Unalaska and flights to these communities were disrupted by the ash cloud. Satellite images taken after the eruption showed evidence of pyroclastic flows and lahar deposits in drainages 2 km down the SW flank and about 3.2 km down the NE flank, and continued erosion of the crater rim. Small explosion craters at the end of the pyroclastic flows on the NE flank were noted for the first time, which may have resulted from gas-and-steam explosions when hot deposits interact with underlying ice.
During 4 October seismicity, including frequent small earthquakes, remained elevated, but was gradually declining. Ash plumes were produced for over eight hours until around 1400 that rose to below 3.7 km altitude. These ash plumes were primarily generated off the sides of the volcano where hot rock avalanches from the crater rim had entered drainages to the SW and NE. Two explosion craters were observed at the base of the NE deposits about 3.2 km from the crater rim. Webcam images showed the explosion craters were a source of persistent ash emissions; occasional collapse events also generated ash. Seismicity remained elevated with sulfur dioxide emissions that had a daily average of more than 1,000 tons per day, and frequent small earthquakes through the end of the month. Frequent elevated surface temperatures were identified in satellite images and gas-and-steam plumes were observed in webcam images, although weather conditions occasionally prevented clear views of the summit. Emissions were robust during 14-16 October and were likely generated by the interaction of hot material and snow and ice. During the afternoon of 21 October a strong gas-and-steam plume rose to 3-4.6 km altitude and extended 40 km WSW, based on satellite images and reports from pilots. On 31 October the ACC was lowered to Yellow and the VAL was lowered to Advisory.
Activity in November was characterized by elevated seismicity with ongoing seismic tremor and small, low-frequency earthquakes, elevated surface temperatures, and gas-and-steam emissions. There was an increase in seismic and infrasound tremor amplitudes starting at 1940 on 2 November. As a result, the ACC was again raised to Orange and the VAL was increased to Watch, although ash was not identified in satellite data. An ash cloud rose to 6.1 km altitude and drifted W according to satellite data at 2000. By 0831 on 3 November ash emissions were no longer visible in satellite images. On 6 and 9 November air pressure sensors detected signals consistent with small explosions. Small explosions were detected in infrasound data consistent with weak Strombolian activity on 19 and 21 November. Seismicity started to decrease on 21 November. On 25 November gas-and-steam emissions were emitted from the vent as well as from a scarp on the NE side of the volcano near the summit. A gas-and-steam plume extended about 50 km SSE and was observed in satellite and webcam images on 26 November. On 28 November small explosions were observed in seismic and local infrasound data and gas-and-steam emissions were visible from the summit and from the upper NE collapse scarp based on webcam images. Possible small explosions were observed in infrasound data on 30 November. Weakly elevated surface temperatures and a persistent gas-and-steam plume from the summit and collapse scarps on the upper flanks. A passing aircraft reported the gas-and-steam plume rose to 3-3.4 km altitude on 30 November, but no significant ash emissions were detected.
Satellite data. MODIS thermal anomaly data provided through MIROVA (Middle InfraRed Observation of Volcanic Activity) showed a strong pulse of thermal activity beginning in July 2023 that continued through November 2023 (figure 48). This strong activity was due to Strombolian explosions and lava fountaining events at the summit crater. According to data from MODVOLC thermal alerts, a total of 101 hotspots were detected near the summit crater in July (11-14, 16-19, 23-24 and 26), August (4, 25-26, and 29), September (5, 12, and 17), and October (3, 4, and 8). Infrared satellite data showed large lava flows descending primarily the northern and SE flanks during the reporting period (figure 49). Sulfur dioxide plumes often exceeded two Dobson Units (DUs) and drifted in different directions throughout the reporting period, based on satellite data from the TROPOMI instrument on the Sentinel-5P satellite (figure 50).
Geologic Background. The symmetrical glacier-covered Shishaldin in the Aleutian Islands is the westernmost of three large stratovolcanoes in the eastern half of Unimak Island. The Aleuts named the volcano Sisquk, meaning "mountain which points the way when I am lost." Constructed atop an older glacially dissected edifice, it is largely basaltic in composition. Remnants of an older edifice are exposed on the W and NE sides at 1,500-1,800 m elevation. There are over two dozen pyroclastic cones on its NW flank, which is covered by massive aa lava flows. Frequent explosive activity, primarily consisting of Strombolian ash eruptions from the small summit crater, but sometimes producing lava flows, has been recorded since the 18th century. A steam plume often rises from the summit crater.
Information Contacts: Alaska Volcano Observatory (AVO), a cooperative program of a) U.S. Geological Survey, 4200 University Drive, Anchorage, AK 99508-4667 USA (URL: https://avo.alaska.edu/), b) Geophysical Institute, University of Alaska, PO Box 757320, Fairbanks, AK 99775-7320, USA, and c) Alaska Division of Geological & Geophysical Surveys, 794 University Ave., Suite 200, Fairbanks, AK 99709, USA (URL: http://dggs.alaska.gov/); MIROVA (Middle InfraRed Observation of Volcanic Activity), a collaborative project between the Universities of Turin and Florence (Italy) supported by the Centre for Volcanic Risk of the Italian Civil Protection Department (URL: http://www.mirovaweb.it/); Hawai'i Institute of Geophysics and Planetology (HIGP) - MODVOLC Thermal Alerts System, School of Ocean and Earth Science and Technology (SOEST), Univ. of Hawai'i, 2525 Correa Road, Honolulu, HI 96822, USA (URL: http://modis.higp.hawaii.edu/); NASA Global Sulfur Dioxide Monitoring Page, Atmospheric Chemistry and Dynamics Laboratory, NASA Goddard Space Flight Center (NASA/GSFC), 8800 Greenbelt Road, Goddard, Maryland, USA (URL: https://so2.gsfc.nasa.gov/); Copernicus Browser, Copernicus Data Space Ecosystem, European Space Agency (URL: https://dataspace.copernicus.eu/browser/).
Ioto
Japan
24.751°N, 141.289°E; summit elev. 169 m
All times are local (unless otherwise noted)
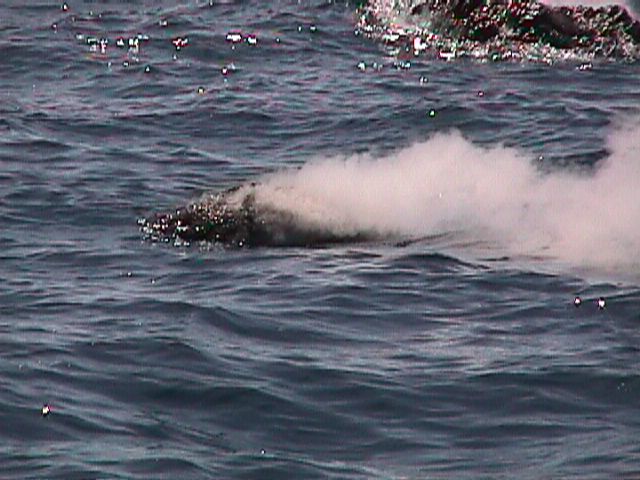
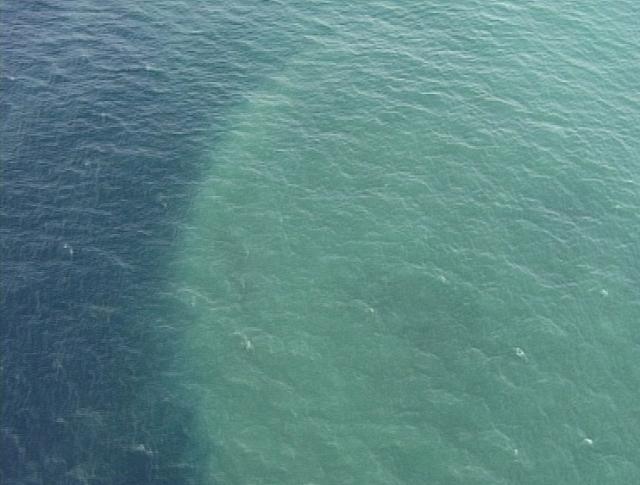
New eruption with discolored water, ejecta, and floating pumice during October-December 2023
Ioto (Iwo-jima), located about 1,200 km S of Tokyo, lies within a 9-km-wide submarine caldera along the Izu-Bonin-Mariana volcanic arc. Previous eruptions date back to 1889 and have consisted of dominantly phreatic explosions, pumice deposits during 2001, and discolored water. A submarine eruption during July through December 2022 was characterized by discolored water, pumice deposits, and gas emissions (BGVN 48:01). This report covers a new eruption during October through December 2023, which consisted of explosions, black ejecta, discolored water, and floating pumice, based on information from the Japan Meteorological Association (JMA), the Japan Coast Guard (JCG), and satellite data.
JMA reported that an eruption had been occurring offshore of Okinahama on the SE side of the island since 21 October, which was characterized by volcanic tremor, according to the Japan Maritime Self-Defense Force (JMSDF) Iwo Jima Air Base (figure 22). According to an 18 October satellite image a plume of discolored water at the site of this new eruption extended NE (figure 23). During an overflight conducted on 30 October, a vent was identified about 1 km off the coast of Okinahama. Observers recorded explosions every few minutes that ejected dark material about 20 m above the ocean and as high as 150 m. Ejecta from the vent formed a black-colored island about 100 m in diameter, according to observations conducted from the air by the Earthquake Research Institute of the University of Tokyo in cooperation with the Mainichi newspaper (figure 24). Occasionally, large boulders measuring more than several meters in size were also ejected. Observations from the Advanced Land Observing Satellite Daichi-2 and Sentinel-2 satellite images also confirmed the formation of this island (figure 23). Brown discolored water and floating pumice were present surrounding the island.
The eruption continued during November. During an overflight on 3 November observers photographed the island and noted that material was ejected 169 m high, according to a news source. Explosions gradually became shorter, and, by the 3rd, they occurred every few seconds; dark and incandescent material were ejected about 800 m above the vent. On 4 November eruptions were accompanied by explosive sounds. Floating, brown-colored pumice was present in the water surrounding the island. There was a brief increase in the number of volcanic earthquakes during 8-14 November and 24-25 November. The eruption temporarily paused during 9-11 November and by 12 November eruptions resumed to the W of the island. On 10 November dark brown-to-dark yellow-green discolored water and a small amount of black floating material was observed (figure 25). A small eruption was reported on 18 November off the NE coast of the island, accompanied by white gas-and-steam plumes (figure 23). Another pause was recorded during 17-19 November, which then resumed on 20 November and continued erupting intermittently. According to a field survey conducted by the National Institute for Disaster Prevention Science and Technology on 19 November, a 30-m diameter crater was visible on the NE coast where landslides, hot water, and gray volcanic ash containing clay have occurred and been distributed previously. Erupted blocks about 10 cm in diameter were distributed about 90-120 m from the crater. JCG made observations during an overflight on 23 November and reported a phreatomagmatic eruption. Explosions at the main vent generated dark gas-and-ash plumes that rose to 200 m altitude and ejected large blocks that landed on the island and in the ocean (figure 26). Discolored water also surrounded the island. The size of the new island had grown to 450 m N-S x 200 m E-W by 23 November, according to JCG.
The eruption continued through 11 December, followed by a brief pause in activity, which then resumed on 31 December, according to JMA. Intermittent explosions produced 100-m-high black plumes at intervals of several minutes to 30 minutes during 1-10 December. Overflights were conducted on 4 and 15 December and reported that the water surrounding the new island was discolored to dark brown-to-dark yellow-green (figure 27). No floating material was reported during this time. In comparison to the observations made on 23 November, the new land had extended N and part of it had eroded away. In addition, analysis by the Geospatial Information Authority of Japan using SAR data from Daichi-2 also confirmed that the area of the new island continued to decrease between 4 and 15 December. Ejected material combined with wave erosion transformed the island into a “J” shape, 500-m-long and with the curved part about 200 m offshore of Ioto. The island was covered with brown ash and blocks, and the surrounding water was discolored to greenish-brown and contained an area of floating pumice. JCG reported from an overflight on 4 December that volcanic ash-like material found around the S vent on the NE part of the island was newly deposited since 10 November (figure 28). By 15 December the N part of the “J” shaped island had separated and migrated N, connecting to the Okinahama coast and the curved part of the “J” had eroded into two smaller islands (figure 27).
References. Ukawa, M., Fujita, E., Kobayashi, T., 2002, Recent volcanic activity of Iwo Jima and the 2001 eruption, Monthly Chikyu, Extra No. 39, 157-164.
Geologic Background. Ioto, in the Volcano Islands of Japan, lies within a 9-km-wide submarine caldera. The volcano is also known as Ogasawara-Iojima to distinguish it from several other "Sulfur Island" volcanoes in Japan. The triangular, low-elevation, 8-km-long island narrows toward its SW tip and has produced trachyandesitic and trachytic rocks that are more alkalic than those of other volcanoes in this arc. The island has undergone uplift for at least the past 700 years, accompanying resurgent doming of the caldera; a shoreline landed upon by Captain Cook's surveying crew in 1779 is now 40 m above sea level. The Motoyama plateau on the NE half of the island consists of submarine tuffs overlain by coral deposits and forms the island's high point. Many fumaroles are oriented along a NE-SW zone cutting through Motoyama. Numerous recorded phreatic eruptions, many from vents on the W and NW sides of the island, have accompanied the uplift.
Information Contacts: Japan Meteorological Agency (JMA), 1-3-4 Otemachi, Chiyoda-ku, Tokyo 100-8122, Japan (URL: http://www.jma.go.jp/jma/indexe.html); Japan Coast Guard (JCG) Volcano Database, Hydrographic and Oceanographic Department, 3-1-1, Kasumigaseki, Chiyoda-ku, Tokyo 100-8932, Japan (URL: https://www1.kaiho.mlit.go.jp/GIJUTSUKOKUSAI/kaiikiDB/kaiyo22-2.htm); Copernicus Browser, Copernicus Data Space Ecosystem, European Space Agency (URL: https://dataspace.copernicus.eu/browser/); Asahi, 5-3-2, Tsukiji, Chuo Ward, Tokyo, 104-8011, Japan (URL: https://www.asahi.com/ajw/articles/15048458).
Purace (Colombia) — December 2023 Cite this Report
Purace
Colombia
2.3095°N, 76.3948°W; summit elev. 4650 m
All times are local (unless otherwise noted)
Gas-and-ash emission on 16 November 2023
Puracé, located in Colombia, is a stratovolcano that contains a 500-m-wide summit crater. It is part of the Los Coconucos volcanic chain that is a NW-SE trending group of seven cones and craters. The most recent eruption occurred during March 2022 that was characterized by frequent seismicity and gas-and-steam emissions (BGVN 47:06). This report covers a brief eruption during November 2023 based on monthly reports from the Popayán Observatory, part of the Servicio Geologico Colombiano (SGC).
Activity during November 2022 through November 2023 primarily consisted of seismicity: VT-type events, LP-type events, HB-type events, and TR-type events (table 4). Maximum sulfur dioxide values were measured weekly and ranged from 259-5,854 tons per day (t/d) during November 2022 through April 2023. White gas-and-steam emissions were also occasionally reported.
SGC issued a report on 25 October that noted a significant increase in the number of earthquakes associated with rock fracturing. These earthquakes were located SE of the crater between Puracé and Piocollo at depths of 1-4 km. There were no reported variations in sulfur dioxide values, but SGC noted high carbon dioxide values, compared to those recorded in the first half of 2023.
SGC reported that at 1929 on 16 November the seismic network detected a signal that was possibly associated with a gas-and-ash emission, though it was not confirmed in webcam images due to limited visibility. On 17 November an observer confirmed ash deposits on the N flank. Webcam images showed an increase in degassing both inside the crater and from the NW flank, rising 700 m above the crater.
Table 4. Seismicity at Puracé during November 2022-November 2023. Volcano-tectonic (VT), long-period (LP), hybrid (HB), and tremor (TR) events are reported each month. Courtesy of SGC.
| Month |
Volcano-tectonic |
Long-period |
Hybrid |
Tremor |
| Nov 2022 |
429 |
2,023 |
5 |
831 |
| Dec 2022 |
423 |
1,390 |
9 |
834 |
| Jan 2023 |
719 |
1,622 |
0 |
957 |
| Feb 2023 |
598 |
1,701 |
2 |
1,124 |
| Mar 2023 |
331 |
2,408 |
147 |
607 |
| Apr 2023 |
614 |
4,427 |
33 |
148 |
| May 2023 |
620 |
3,717 |
170 |
109 |
| Jun 2023 |
467 |
3,293 |
86 |
148 |
| Jul 2023 |
1,116 |
5,809 |
183 |
542 |
| Aug 2023 |
692 |
2,927 |
94 |
321 |
| Sep 2023 |
887 |
1,505 |
82 |
848 |
| Oct 2023 |
2,373 |
2,949 |
135 |
692 |
| Nov 2023 |
1,212 |
2,302 |
69 |
293 |
Geologic Background. Puracé is an active andesitic volcano with a 600-m-diameter summit crater at the NW end of the Los Coconucos Volcanic Chain. This volcanic complex includes nine composite and five monogenetic volcanoes, extending from the Puracé crater more than 6 km SE to the summit of Pan de Azúcar stratovolcano. The dacitic massif which the complex is built on extends about 13 km NW-SE and 10 km NE-SW. Frequent small to moderate explosive eruptions reported since 1816 CE have modified the morphology of the summit crater, with the largest eruptions in 1849, 1869, and 1885.
Information Contacts: Servicio Geologico Colombiano (SGC), Diagonal 53 No. 34-53 - Bogotá D.C., Colombia (URL: https://www.sgc.gov.co/volcanes).
Suwanosejima (Japan) — December 2023 Cite this Report
Suwanosejima
Japan
29.638°N, 129.714°E; summit elev. 796 m
All times are local (unless otherwise noted)
Eruption plumes, crater incandescence, and occasional explosions during July-October 2023
Suwanosejima is an 8-km-long island that consists of a stratovolcano and two active summit craters, located in the northern Ryukyu Islands, Japan. Volcanism over the past century has been characterized by Strombolian explosions, ash plumes, and ashfall. The current eruption began in October 2004 and has more recently consisted of frequent eruption plumes, explosions, and incandescent ejecta (BGVN 48:07). This report covers similar activity of ash plumes, explosions, and crater incandescence during July through October 2023 using monthly reports from the Japan Meteorological Agency (JMA) and satellite data.
Thermal activity during the reporting period was relatively low; only one low-power thermal anomaly was detected during mid-July and one during early August, based on a MIROVA (Middle InfraRed Observation of Volcanic Activity) Log Radiative Power graph of the MODIS thermal anomaly data. On two clear weather days, a thermal anomaly was visible in infrared satellite images (figure 81).
Low-level activity was reported at the Otake crater during July and no explosions were detected. Eruption plumes rose as high as 1.8 km above the crater. On 13 July an ash plume rose 1.7 km above the crater rim, based on a webcam image. During the night of the 28th crater incandescence was visible in a webcam image. An eruptive event reported on 31 July produced an eruption plume that rose 2.1 km above the crater. Seismicity consisted of 11 volcanic earthquakes on the W flank, the number of which had decreased compared to June (28) and 68 volcanic earthquakes near the Otake crater, which had decreased from 722 in the previous month. According to observations conducted by the University of Tokyo Graduate School of Science, Kyoto University Disaster Prevention Research Institute, Toshima Village, and JMA, the amount of sulfur dioxide emissions released during the month was 400-800 tons per day (t/d).
Eruptive activity in the Otake crater continued during August and no explosions were reported. An eruptive event produced a plume that rose 1 km above the crater at 1447 on 12 August. Subsequent eruptive events were recorded at 0911 on 16 August, at 1303 on 20 August, and at 0317 on 21 August, which produced ash plumes that rose 1-1.1 km above the crater and drifted SE, SW, and W. On 22 August an ash plume was captured in a webcam image rising 1.4 km above the crater (figure 82). Multiple eruptive events were detected on 25 August at 0544, 0742, 0824, 1424, and 1704, which generated ash plumes that rose 1.1-1.2 km above the crater and drifted NE, W, and SW. On 28 August a small amount of ashfall was observed as far as 1.5 km from the crater. There were 17 volcanic earthquakes recorded on the W flank of the volcano and 79 recorded at the Otake crater during the month. The amount of sulfur dioxide emissions released during the month was 400-800 t/d.
Activity continued at the Otake crater during September. Occasionally, nighttime crater incandescence was observed in webcam images and ashfall was reported. An eruptive event at 1949 on 4 September produced an ash plume that rose 1 km above the crater and drifted SW. On 9 September several eruption events were detected at 0221, 0301, and 0333, which produced ash plumes that rose 1.1-1.4 km above the crater rim and drifted W; continuous ash emissions during 0404-0740 rose to a maximum height of 2 km above the crater rim (figure 83). More eruptive events were reported at 1437 on 10 September, at 0319 on 11 September, and at 0511 and 1228 on 15 September, which generated ash plumes that rose 1-1.8 km above the crater. During 25, 27, and 30 September, ash plumes rose as high as 1.3 km above the crater rim. JMA reported that large blocks were ejected as far as 300 m from the center of the crater. There were 18 volcanic earthquakes detected beneath the W flank and 82 volcanic earthquakes detected near the Otake crater. The amount of sulfur dioxide released during the month ranged from 600 to 1,600 t/d.
Activity during early-to-mid-October consisted of occasional explosions, a total number of 13, and ash plumes that rose as high as 1.9 km above the Otake crater rim on 29 October (figure 84). These explosions are the first to have occurred since June 2023. Continuous ash emissions were reported during 0510-0555 on 1 October. Explosions were recorded at 0304, 2141, and 2359 on 2 October, at 0112 on 3 October, and at 1326 on 6 October, which produced ash plumes that rose as high as 1 km above the crater rim and drifted SW and W. An explosion was noted at 0428 on 3 October, but emission details were unknown. A total of eight explosions were recorded by the seismic network at 1522 on 14 October, at 0337, 0433, 0555, 1008, and 1539 on 15 October, and at 0454 and 0517 on 16 October. Ash plumes from these explosions rose as high as 900 m above the crater and drifted SE. Eruptive events during 25-27 and 29-30 October generated plumes that rose as high as 1.9 km above the crater and drifted SE, S, and SW. Ash was deposited in Toshima village (3.5 km SSW). Eruptive activity occasionally ejected large volcanic blocks as far as 600 m from the crater. Nighttime crater incandescence was visible in webcams. Intermittent ashfall was reported as far as 1.5 km from the crater. There were 43 volcanic earthquakes detected on the W flank during the month, and 184 volcanic earthquakes detected near the Otake crater. The amount of sulfur dioxide emitted ranged between 400 and 900 t/d.
Geologic Background. The 8-km-long island of Suwanosejima in the northern Ryukyu Islands consists of an andesitic stratovolcano with two active summit craters. The summit is truncated by a large breached crater extending to the sea on the E flank that was formed by edifice collapse. One of Japan's most frequently active volcanoes, it was in a state of intermittent Strombolian activity from Otake, the NE summit crater, between 1949 and 1996, after which periods of inactivity lengthened. The largest recorded eruption took place in 1813-14, when thick scoria deposits covered residential areas, and the SW crater produced two lava flows that reached the western coast. At the end of the eruption the summit of Otake collapsed, forming a large debris avalanche and creating an open collapse scarp extending to the eastern coast. The island remained uninhabited for about 70 years after the 1813-1814 eruption. Lava flows reached the eastern coast of the island in 1884. Only about 50 people live on the island.
Information Contacts: Japan Meteorological Agency (JMA), 1-3-4 Otemachi, Chiyoda-ku, Tokyo 100-8122, Japan (URL: http://www.jma.go.jp/jma/indexe.html); MIROVA (Middle InfraRed Observation of Volcanic Activity), a collaborative project between the Universities of Turin and Florence (Italy) supported by the Centre for Volcanic Risk of the Italian Civil Protection Department (URL: http://www.mirovaweb.it/); Hawai'i Institute of Geophysics and Planetology (HIGP) - MODVOLC Thermal Alerts System, School of Ocean and Earth Science and Technology (SOEST), Univ. of Hawai'i, 2525 Correa Road, Honolulu, HI 96822, USA (URL: http://modis.higp.hawaii.edu/); Copernicus Browser, Copernicus Data Space Ecosystem, European Space Agency (URL: https://dataspace.copernicus.eu/browser/).
Etna
Italy
37.748°N, 14.999°E; summit elev. 3357 m
All times are local (unless otherwise noted)
Strombolian explosions, lava fountains, and lava flows during July-August 2023
Etna, located on the Italian island of Sicily, has had documented eruptions dating back to 1500 BCE. Activity typically originates from multiple cones at the summit, where several craters have formed and evolved. The currently active craters are Northeast Crater (NEC), Voragine (VOR), and Bocca Nuova (BN), and the Southeast Crater (SEC); VOR and BN were previously referred to as the “Central Crater”. The original Southeast crater formed in 1978, and a second eruptive site that opened on its SE flank in 2011 was named the New Southeast Crater (NSEC). Another eruptive site between the SEC and NSEC developed during early 2017 and was referred to as the "cono della sella" (saddle cone). The current eruption period began in November 2022 and has been characterized by intermittent Strombolian activity, lava flows, and ash plumes (BGVN 48:08). This report updates activity during July through October 2023, which includes primarily gas-and-steam emissions; during July and August Strombolian explosions, lava fountains, and lava flows were reported, based on weekly and special reports by the Osservatorio Etneo (OE), part of the Catania Branch of Italy's Istituo Nazionale di Geofisica e Vulcanologica (INGV) and satellite data.
Variable fumarolic degassing was reported at all summit craters (BN, VOR, NEC, and SEC) throughout the entire reporting period (table 15). The MIROVA (Middle InfraRed Observation of Volcanic Activity) volcano hotspot detection system based on the analysis of MODIS data showed frequent low-to-moderate power thermal anomalies during the reporting period (figure 399). During mid-August there was a pulse in activity that showed an increase in the power of the anomalies due to Strombolian activity, lava fountains, and lava flows. Infrared satellite imagery captured strong thermal anomalies at the central and southeast summit crater areas (figure 400). Accompanying thermal activity were occasional sulfur dioxide plumes that exceeded 2 Dobson Units (DUs) recorded by the TROPOMI instrument on the Sentinel-5P satellite (figure 401).
Table 15. Summary of activity at the four primary crater areas at the summit of Etna during July-October 2023. Information is from INGV weekly reports.
| Month |
Bocca Nuova (BN) |
Voragine (VOR) |
Northeast Crater (NEC) |
Southeast Crater (SEC) |
| Jul 2023 |
Continuous degassing. |
No observations. |
Weak gas emissions. |
Continuous degassing. Sporadic and weak-to-moderate ash emissions. Strombolian explosions. |
| Aug 2023 |
Continuous degassing. |
No observations. |
No observations. |
Continuous degassing. Occasional ash emissions. Strombolian activity, lava fountaining, and lava flows. |
| Sep 2023 |
Variable degassing. Crater incandescence. |
Weak fumarolic activity. |
Weak fumarolic activity. |
Variable degassing. |
| Oct 2023 |
Continuous degassing. |
Weak fumarolic activity. |
Weak fumarolic activity. |
Continuous degassing. |
Activity during July and August was relatively low and mainly consisted of degassing at the summit craters, particularly at SEC and BN. Cloudy weather prevented clear views of the summit during early July. During the night of 2 July some crater incandescence was visible at SEC. Explosive activity resumed at SEC during 9-10 July, which was characterized by sporadic and weak ash emissions that rapidly dispersed in the summit area (figure 402). INGV reported moderate Strombolian activity began at 2034 on 14 July and was confined to the inside of the crater and fed by a vent located in the E part of SEC. An ash emission was detected at 2037. A new vent opened on 15 July in the SE part of BN and began to produce continuous gas-and-steam emissions. During an inspection carried out on 28 July pulsating degassing, along with audible booms, were reported at two active vents in BN. Vigorous gas-and-steam emissions intermittently generated rings. On rare occasions, fine, reddish ash was emitted from BN1 and resuspended by the gas-and-steam emissions.
Around 2000 on 13 August INGV reported a sudden increase in volcanic tremor amplitude. Significant infrasonic activity coincided with the tremor increase. Incandescent flashes were visible through the cloud cover in webcam images of SEC (figure 403). Strombolian activity at SEC began to gradually intensify starting at 2040 as seismicity continued to increase. The Aviation Color Code (ACC) was raised to Yellow (the second lowest-level on a four-color scale) at 2126 and then to Orange (the second highest-level on a four-color scale) at 2129 due to above-background activity. The activity rapidly transitioned from Strombolian activity to lava fountains around 2333 that rose 300-400 m above the crater (figure 403). Activity was initially focused on the E vent of the crater, but then the vent located above the S flank of the cone also became active. A lava flow from this vent traveled SW into the drainage created on 10 February 2022, overlapping with previous flows from 10 and 21 February 2022 and 21 May 2023, moving between Monte Barbagallo and Monte Frumento Supino (figure 404). The lava flow was 350 m long, oriented NNE-SSW, and descended to an elevation of 2.8 km. Flows covered an area of 300,000 m2 and had an estimated volume of 900,000 m3. The ACC was raised to Red at 2241 based on strong explosive activity and ashfall in Rifugio Sapienza-Piano Vetore at 1.7 km elevation on the S flank. INGV reported that pyroclastic flows accompanied this activity.
Activity peaked between 0240 and 0330 on 14 August, when roughly 5-6 vents erupted lava fountains from the E to SW flank of SEC. The easternmost vents produced lava fountains that ejected material strongly to the E, which caused heavy fallout of incandescent pyroclastic material on the underlying flank, triggering small pyroclastic flows. This event was also accompanied by lightning both in the ash column and in the ash clouds that were generated by the pyroclastic flows. A fracture characterized by a series of collapse craters (pit craters) opened on the upper SW flank of SEC. An ash cloud rose a few kilometers above the crater and drifted S, causing ash and lapilli falls in Rifugio Sapienza and expanding toward Nicolosi, Mascalucia, Catania, and up to Syracuse. Ashfall resulted in operational problems at the Catania airport (50 km S), which lasted from 0238 until 2000. By 0420 the volcanic tremor amplitude values declined to background levels. After 0500 activity sharply decreased, although the ash cloud remained for several hours and drifted S. By late morning, activity had completely stopped. The ACC was lowered to Orange as volcanic ash was confined to the summit area. Sporadic, minor ash emissions continued throughout the day. At 1415 the ACC was lowered to Yellow and then to Green at 1417.
During the night of 14-15 August only occasional flashes were observed, which were more intense during avalanches of material inside the eruptive vents. Small explosions were detected at SEC at 2346 on 14 August and at 0900 on 26 August that each produced ash clouds which rapidly dispersed into the atmosphere (figure 405). According to a webcam image, an explosive event detected at 2344 at SEC generated a modest ash cloud that was rapidly dispersed by winds. The ACC was raised to Yellow at 2355 on 14 August due to increasing unrest and was lowered to Green at 0954 on 15 August.
Activity during September and October was relatively low and mainly characterized by variable degassing from BN and SEC. Intense, continuous, and pulsating degassing was accompanied by roaring sounds and flashes of incandescence at BN both from BN1 and the new pit crater that formed during late July (figure 406). The degassing from the new pit crater sometimes emitted vapor rings. Cloudy weather during 6-8 September prevented observations of the summit craters .
Geologic Background. Mount Etna, towering above Catania on the island of Sicily, has one of the world's longest documented records of volcanism, dating back to 1500 BCE. Historical lava flows of basaltic composition cover much of the surface of this massive volcano, whose edifice is the highest and most voluminous in Italy. The Mongibello stratovolcano, truncated by several small calderas, was constructed during the late Pleistocene and Holocene over an older shield volcano. The most prominent morphological feature of Etna is the Valle del Bove, a 5 x 10 km caldera open to the east. Two styles of eruptive activity typically occur, sometimes simultaneously. Persistent explosive eruptions, sometimes with minor lava emissions, take place from one or more summit craters. Flank vents, typically with higher effusion rates, are less frequently active and originate from fissures that open progressively downward from near the summit (usually accompanied by Strombolian eruptions at the upper end). Cinder cones are commonly constructed over the vents of lower-flank lava flows. Lava flows extend to the foot of the volcano on all sides and have reached the sea over a broad area on the SE flank.
Information Contacts: Sezione di Catania - Osservatorio Etneo, Istituto Nazionale di Geofisica e Vulcanologia (INGV), Sezione di Catania, Piazza Roma 2, 95123 Catania, Italy (URL: http://www.ct.ingv.it/it/); MIROVA (Middle InfraRed Observation of Volcanic Activity), a collaborative project between the Universities of Turin and Florence (Italy) supported by the Centre for Volcanic Risk of the Italian Civil Protection Department (URL: http://www.mirovaweb.it/); NASA Global Sulfur Dioxide Monitoring Page, Atmospheric Chemistry and Dynamics Laboratory, NASA Goddard Space Flight Center (NASA/GSFC), 8800 Greenbelt Road, Goddard MD 20771, USA (URL: https://so2.gsfc.nasa.gov/); Copernicus Browser, Copernicus Data Space Ecosystem, European Space Agency (URL: https://dataspace.copernicus.eu/browser/).
Aira
Japan
31.5772°N, 130.6589°E; summit elev. 1117 m
All times are local (unless otherwise noted)
Explosions, ash plumes, ash fall, and crater incandescence during July-October 2023
Aira caldera, located in the northern half of Kagoshima Bay, Japan, contains the post-caldera Sakurajima volcano. Eruptions typically originate from the Minamidake crater, and since the 8th century, ash deposits have been recorded in the city of Kagoshima (10 km W), one of Kyushu’s largest cities. The Minamidake summit cone and crater has had persistent activity since 1955; the Showa crater on the E flank has also been intermittently active since 2006. The current eruption period began during March 2017 and has recently been characterized by intermittent explosions, eruption plumes, and ashfall (BGVN 48:07). This report updates activity during July through October 2023 and describes explosive events, ash plumes, nighttime crater incandescence, and ashfall, according to monthly activity reports from the Japan Meteorological Agency (JMA) and satellite data.
Thermal activity remained at low levels during this reporting period, according to the MIROVA (Middle InfraRed Observation of Volcanic Activity) system (figure 149). There was a slight increase in the number of anomalies during September through October. Occasional thermal anomalies were visible in infrared satellite images mainly at the Minamidake crater (Vent A is located to the left and Vent B is located to the right) (figure 150).
Table 30. Number of monthly explosive events, days of ashfall, area of ash covered, and sulfur dioxide emissions from Sakurajima’s Minamidake crater at Aira during July-October 2023. Note that smaller ash events are not listed. Ashfall days were measured at Kagoshima Local Meteorological Observatory and ashfall amounts represent material covering all the Kagoshima Prefecture. Data courtesy of JMA monthly reports.
| Month |
Explosive events |
Days of ashfall |
Ashfall amount (g/m2) |
SO2 emissions (tons/day) |
| Jul 2023 |
3 |
0 |
0 |
1,600-3,200 |
| Aug 2023 |
3 |
10 |
7 |
1,800-3,300 |
| Sep 2023 |
3 |
7 |
3 |
1,600-2,300 |
| Oct 2023 |
33 |
8 |
61 |
2,200-4,200 |
JMA reported that during July, there were eight eruptions, three of which were explosion events in the Showa crater. Large blocks were ejected as far as 600 m from the Showa crater. Very small eruptions were occasionally reported at the Minamidake crater. Nighttime incandescence was observed in both the Showa and Minamidake crater. Explosions were reported on 16 July at 2314 and on 17 July at 1224 and at 1232 (figure 151). Resulting eruption plumes rose 700-2,500 m above the crater and drifted N. On 23 July the number of volcanic earthquakes on the SW flank of the volcano increased. A strong Mw 3.1 volcanic earthquake was detected at 1054 on 26 July. The number of earthquakes recorded throughout the month was 545, which markedly increased from 73 in June. No ashfall was observed at the Kagoshima Regional Meteorological Observatory during July. According to a field survey conducted during the month, the daily amount of sulfur dioxide emissions was 1,600-3,200 tons per day (t/d).
There were three eruptions reported at the Minamidake crater during August, each of which were explosive. The explosions occurred on 9 August at 0345, on 13 August at 2205, and on 31 August at 0640, which generated ash plumes that rose 800-2,000 m above the crater and drifted W. There were two eruptions detected at Showa crater; on 4 August at 2150 ejecta traveled 800 m from the Showa crater and associated eruption plumes rose 2.3 km above the crater. The explosion at 2205 on 13 August generated an ash plume that rose 2 km above the crater and was accompanied by large blocks that were ejected 600 m from the Minamidake crater (figure 152). Nighttime crater incandescence was visible in a high-sensitivity surveillance camera at both craters. Seismicity consisted of 163 volcanic earthquakes, 84 of which were detected on the SW flank. According to the Kagoshima Regional Meteorological Observatory there was a total of 7 g/m2 of ashfall over the course of 10 days during the month. According to a field survey, the daily amount of sulfur dioxide emitted was 1,800-3,300 t/d.
During September, four eruptions were reported, three of which were explosion events. These events occurred at 1512 on 9 September, at 0018 on 11 September, and at 2211 on 13 September. Resulting ash plumes generally rose 800-1,100 m above the crater. An explosion produced an ash plume at 2211 on 13 September that rose as high as 1.7 km above the crater. Large volcanic blocks were ejected 600 m from the Minamidake crater. Smaller eruptions were occasionally observed at the Showa crater. Nighttime crater incandescence was visible at the Minamidake crater. Seismicity was characterized by 68 volcanic earthquakes, 28 of which were detected beneath the SW flank. According to the Kagoshima Regional Meteorological Observatory there was a total of 3 g/m2 of ashfall over the course of seven days during the month. A field survey reported that the daily amount of sulfur dioxide emitted was 1,600-2,300 t/d.
Eruptive activity during October consisted of 69 eruptions, 33 of which were described as explosive. These explosions occurred during 4 and 11-21 October and generated ash plumes that rose 500-3,600 m above the crater and drifted S, E, SE, and N. On 19 October at 1648 an explosion generated an ash plume that rose 3.6 km above the crater (figure 153). No eruptions were reported in the Showa crater; white gas-and-steam emissions rose 100 m above the crater from a vent on the N flank. Nighttime incandescence was observed at the Minamidake crater. On 24 October an eruption was reported from 0346 through 0430, which included an ash plume that rose 3.4 km above the crater. Ejected blocks traveled 1.2 km from the Minamidake crater. Following this eruption, small amounts of ashfall were observed from Arimura (4.5 km SE) and a varying amount in Kurokami (4 km E) (figure 154). The number of recorded volcanic earthquakes during the month was 190, of which 14 were located beneath the SW flank. Approximately 61 g/m2 of ashfall was reported over eight days of the month. According to a field survey, the daily amount of sulfur dioxide emitted was 2,200-4,200 t/d.
Geologic Background. The Aira caldera in the northern half of Kagoshima Bay contains the post-caldera Sakurajima volcano, one of Japan's most active. Eruption of the voluminous Ito pyroclastic flow accompanied formation of the 17 x 23 km caldera about 22,000 years ago. The smaller Wakamiko caldera was formed during the early Holocene in the NE corner of the caldera, along with several post-caldera cones. The construction of Sakurajima began about 13,000 years ago on the southern rim and built an island that was joined to the Osumi Peninsula during the major explosive and effusive eruption of 1914. Activity at the Kitadake summit cone ended about 4,850 years ago, after which eruptions took place at Minamidake. Frequent eruptions since the 8th century have deposited ash on the city of Kagoshima, located across Kagoshima Bay only 8 km from the summit. The largest recorded eruption took place during 1471-76.
Information Contacts: Japan Meteorological Agency (JMA), 1-3-4 Otemachi, Chiyoda-ku, Tokyo 100-8122, Japan (URL: http://www.jma.go.jp/jma/indexe.html); MIROVA (Middle InfraRed Observation of Volcanic Activity), a collaborative project between the Universities of Turin and Florence (Italy) supported by the Centre for Volcanic Risk of the Italian Civil Protection Department (URL: http://www.mirovaweb.it/); Copernicus Browser, Copernicus Data Space Ecosystem, European Space Agency (URL: https://dataspace.copernicus.eu/browser/).
Nishinoshima (Japan) — November 2023 Cite this Report
Nishinoshima
Japan
27.247°N, 140.874°E; summit elev. 100 m
All times are local (unless otherwise noted)
Gray emissions during October 2023
Nishinoshima is a small island in the Ogasawara Arc, about 1,000 km S of Tokyo, Japan. It contains prominent submarine peaks to the S, W, and NE. Recorded eruptions date back to 1973, with the current eruption period beginning in October 2022. Eruption plumes and fumarolic activity characterize recent activity (BGVN 48:10). This report covers the end of the eruption for September through October 2023, based on information from monthly reports of the Japan Meteorological Agency (JMA) monthly reports, and satellite data.
No eruptive activity was reported during September 2023, although JMA noted that the surface temperature was slightly elevated compared to the surrounding area since early March 2023. The Japan Coast Guard (JCG) conducted an overflight on 20 September and reported white gas-and-steam plumes rising 3 km above the central crater of the pyroclastic cone, as well as multiple white gas-and-steam emissions emanating from the N, E, and S flanks of the crater to the coastline. In addition, dark reddish brown-to-green discolored water was distributed around almost the entire circumference of the island.
Similar low-level activity was reported during October. Multiple white gas-and-steam emissions rose from the N, E, and S flanks of the central crater of the pyroclastic cone and along the coastline; these emissions were more intense compared to the previous overflight observations. Dark reddish brown-to-green discolored water remained visible around the circumference of the island. On 4 October aerial observations by JCG showed a small eruption consisting of continuous gas-and-steam emissions emanating from the central crater, with gray emissions rising to 1.5 km altitude (figure 129). According to observations from the marine weather observation vessel Keifu Maru on 26 October, white gas-and-steam emissions persisted from the center of the pyroclastic cone, as well as from the NW, SW, and SE coasts of the island for about five minutes. Slightly discolored water was visible up to about 1 km.
Frequent low-to-moderate power thermal anomalies were recorded in the MIROVA graph (Middle InfraRed Observation of Volcanic Activity) during September (figure 130). Occasional anomalies were detected during October, and fewer during November through December. A thermal anomaly was visible in the crater using infrared satellite imagery on 6, 8, 11, 16, 18, 21, and 23 September and 8, 13, 21, 26, and 28 October (figure 131).
Geologic Background. The small island of Nishinoshima was enlarged when several new islands coalesced during an eruption in 1973-74. Multiple eruptions that began in 2013 completely covered the previous exposed surface and continued to enlarge the island. The island is the summit of a massive submarine volcano that has prominent peaks to the S, W, and NE. The summit of the southern cone rises to within 214 m of the ocean surface 9 km SSE.
Information Contacts: Japan Meteorological Agency (JMA), 1-3-4 Otemachi, Chiyoda-ku, Tokyo 100-8122, Japan (URL: http://www.jma.go.jp/jma/indexe.html); MIROVA (Middle InfraRed Observation of Volcanic Activity), a collaborative project between the Universities of Turin and Florence (Italy) supported by the Centre for Volcanic Risk of the Italian Civil Protection Department (URL: http://www.mirovaweb.it/); Copernicus Browser, Copernicus Data Space Ecosystem, European Space Agency (URL: https://dataspace.copernicus.eu/browser/).
Kilauea (United States) — October 2023 Cite this Report
Kilauea
United States
19.421°N, 155.287°W; summit elev. 1222 m
All times are local (unless otherwise noted)
Strong lava fountains, lava flows, and spatter at Halema’uma’u during January-September 2023
Kīlauea is on the island of Hawai’i and overlaps the E flank of the Mauna Loa volcano. Its East Rift Zone (ERZ) has been intermittently active for at least 2,000 years. An extended eruption period began in January 1983 and was characterized by open lava lakes and lava flows from the summit caldera and the East Rift Zone. During May 2018 magma migrated into the Lower East Rift Zone (LERZ) and opened 24 fissures along a 6-km-long NE-trending fracture zone that produced lava flows traveling in multiple directions. As lava emerged from the fissures, the lava lake at Halema'uma'u drained and explosions sent ash plumes to several kilometers altitude (BGVN 43:10).
The current eruption period started during September 2021 and has been characterized by low-level lava effusions in the active Halema’uma’u lava lake (BGVN 48:01). This report covers three notable eruption periods during February, June, and September 2023 consisting of lava fountaining, lava flows, and spatter during January through September 2023 using information from daily reports, volcanic activity notices, and abundant photo, map, and video data from the US Geological Survey's (USGS) Hawaiian Volcano Observatory (HVO).
Activity during January 2023. Small earthquake swarms were recorded on 2 January 2023; increased seismicity and changes in the pattern of deformation were noted on the morning of 5 January. At around 1500 both the rate of deformation and seismicity drastically increased, which suggested magma movement toward the surface. HVO raised the Volcano Alert Level (VAL) to Watch (the second highest level on a four-level scale) and the Aviation Color Code (ACC) to Orange (the second highest color on a four-color scale) at 1520.
Multiple lava fountains and lava effusions from vents in the central eastern portion of the Halema’uma’u crater began on 5 January around 0434; activity was confined to the eastern half of the crater and within the basin of the western half of the crater, which was the focus of the eruption in 2021-2022 (figure 525). Incandescence was visible in webcam images at 1634 on 5 January, prompting HVO to raise the VAL to Warning (the highest level on a four-level scale) and the ACC to Red (the highest color on a four-color scale). Lava fountains initially rose as high as 50 m above the vent at the onset of the eruption (figure 526) but then declined to a more consistent 5-6 m height in the proceeding days. By 1930 that same day, lava had covered most of the crater floor (an area of about 1,200,000 m2) and the lava lake had a depth of 10 m. A higher-elevation island that formed during the initial phase of the December 2020 eruption remained exposed, appearing darker in images, along with a ring of older lava around the lava lake that was active prior to December 2022. Overnight during 5-6 January the lava fountains continued to rise 5 m high, and the lava effusion rate had slowed.
On 6 January at 0815 HVO lowered the VAL to Watch and the ACC to Orange due to the declining effusion rates. Sulfur dioxide emission rates ranged from 3,000-12,500 tonnes per day (t/d), the highest value of which was recorded on 6 January. Lava continued to erupt from the vents during 6-8 January, although the footprint of the active area had shrunk; a similar progression has been commonly observed during the early stages of recent eruptions at Halema’uma’u. On 9 January HVO reported one dominant lava fountain rising 6-7 m high in the E half of the crater. Lava flows built up the margins of the lake, causing the lake to be perched. On 10 January the eastern lava lake had an area of approximately 120,000 m2 that increased to 250,000 m2 by 17 January. During 13-31 January several small overflows occurred along the margins of the E lake. A smaller area of lava was active within the basin in the W half of the crater that had been the focus of activity during 2021-2022. On 19 January just after 0200 a small ooze-out was observed on the crater’s W edge.
Activity during February 2023. Activity continued in the E part of Halema’uma’u crater, as well as in a smaller basin in the W part of the 2021-2022 lava lake (figure 527). The E lava lake contained a single lava fountain and frequent overflows. HVO reported that during the morning of 1 February the large E lava lake began to cool and crust over in the center of the lake; two smaller areas of lava were observed on the N and S sides by the afternoon. The dominant lava fountain located in the S part of the lava lake paused for roughly 45 minutes at 2315 and resumed by midnight, rising 1-2 m. At 0100 on 2 February lava from the S part was effusing across the entire E lava lake area, covering the crusted over portion in the center of the lake and continuing across the majority of the previously measured 250,000 m2 by 0400. A small lava pond near the E lake produced an overflow around 0716 on 2 February. On 3 February some lava crust began to form against the N and E levees, which defined the 250,000 m2 eastern lava lake. The small S lava fountain remained active, rising 1-6 m high during 3-9 February; around 0400 on 5 February occasional bursts doubled the height of the lava fountain.
A large breakout occurred overnight during 2100 on 4 February to 0900 on 5 February on the N part of the crater floor, equal to or slightly larger in size than the E lava lake. A second, smaller lava fountain appeared in the same area of the E lava lake between 0300 and 0700 on 5 February and was temporarily active. This large breakout continued until 7 February. A small, brief breakout was reported in the S of the E lava lake around midnight on 7 February. In the W lake, as well as the smaller lava pond in the central portion of the crater floor, contained several overflows during 7-10 February and intermittent fountaining. Activity at the S small lava pond and the small S lava fountain within the E lake declined during 9-10 February. The lava pond in the central portion of the crater floor had nearly continuous, expansive flows during 10-13 February; channels from the small central lava pond seemed to flow into the larger E lake. During 13-18 February a small lava fountain was observed in the small lava pond in the central portion of the crater floor. Continuous overflows persisted during this time.
Activity in the eastern and central lakes began to decline in the late afternoon of 17 February. By 18 February HVO reported that the lava effusions had significantly declined, and that the eastern and central lakes were no longer erupting. The W lake in the basin remained active but at a greatly reduced level that continued to decline. HVO reported that this decrease in activity is attributed to notable deflationary tilt that began early on the morning of 17 February and lasted until early 19 February. By 19 February the W lake was mostly crusted over although some weak lava flows remained, which continued through 28 February. The sulfur dioxide emission rates ranged 250-2,800 t/d, the highest value of which was recorded on 6 February.
Activity during March 2023. The summit eruption at Halema’uma’u crater continued at greatly reduced levels compared to the previous two months. The E and central vents stopped effusing lava, and the W lava lake remained active with weak lava flows; the lake was mostly crusted over, although slowly circulating lava intermittently overturned the crust. By 6 March the lava lake in the W basin had stopped because the entire surface was crusted over. The only apparent surface eruptive activity during 5-6 March was minor ooze-outs of lava onto the crater floor, which had stopped by 7 March. Several hornitos on the crater floor still glowed through 12 March according to overnight webcam images, but they did not erupt any lava. A small ooze-out of lava was observed just after 1830 in the W lava lake on 8 March, which diminished overnight. The sulfur dioxide emission rate ranged from 155-321 t/d on 21 March. The VAL was lowered to Advisory, and the ACC was lowered to Yellow (the second lowest on a four-color scale) on 23 March due to a pause in the eruption since 7 March.
Activity during April-May 2023. The eruption at Halema’uma’u crater was paused; no lava effusions were visible on the crater floor. Sulfur dioxide emission rates ranged from 75-185 t/d, the highest of which was measured on 22 April. During May and June summit seismicity was elevated compared to seismicity that preceded the activity during January.
Activity during June 2023. Earthquake activity and changes in the patterns of ground deformation beneath the summit began during the evening of 6 June. The data indicated magma movement toward the surface, prompting HVO to raise the VAL to Watch and the ACC to Orange. At about 0444 on 7 June incandescence in Halema’uma’u crater was visible in webcam images, indicating that a new eruption had begun. HVO raised the VAL to Warning and the ACC to Red (the highest color on a four-color scale). Lava flowed from fissures that had opened on the crater floor. Multiple minor lava fountains were active in the central E portion of the Halema’uma’u crater, and one vent opened on the W wall of the caldera (figure 528). The eruptive vent on the SW wall of the crater continued to effuse into the lava lake in the far SW part of the crater (figure 529). The largest lava fountain consistently rose 15 m high; during the early phase of the eruption, fountain bursts rose as high as 60 m. Lava flows inundated much of the crater floor and added about 6 m depth of new lava within a few hours, covering approximately 10,000 m2. By 0800 on 7 June lava filled the crater floor to a depth of about 10 m. During 0800-0900 the sulfur dioxide emission rate was about 65,000 t/d. Residents of Pahala (30 km downwind of the summit) reported minor deposits of fine, gritty ash and Pele’s hair. A small spatter cone had formed at the vent on the SW wall by midday, and lava from the cone was flowing into the active lava lake. Fountain heights had decreased from the onset of the eruption and were 4-9 m high by 1600, with occasional higher bursts. Inflation switched to deflation and summit earthquake activity greatly diminished shortly after the eruption onset.
At 0837 on 8 June HVO lowered the VAL to Watch and the ACC to Orange because the initial high effusion rates had declined, and no infrastructure was threatened. The surface of the lava lake had dropped by about 2 m, likely due to gas loss by the morning of 8 June. The drop left a wall of cooled lava around the margins of the crater floor. Lava fountain heights decreased during 8-9 June but continued to rise to 10 m high. Active lava and vents covered much of the W half of Halema’uma’u crater in a broad, horseshoe-shape around a central, uplifted area (figure 530). The preliminary average effusion rate for the first 24 hours of the eruption was about 150 cubic meters per second, though the estimate did not account for vesiculated lava and variations in crater floor topography. The effusion rate during the very earliest phases of the eruption appeared significantly higher than the previous three summit eruptions based on the rapid coverage of the entire crater floor. An active lava lake, also referred to as the “western lava lake” was centered within the uplifted area and was fed by a vent in the NE corner. Two small active lava lakes were located just SE from the W lava lake and in the E portion of the crater floor.
During 8-9 June the lava in the central lava lake had a thickness of approximately 1.5 m, based on measurements from a laser rangefinder. During 9-12 June the height of the lava fountains decreased to 9 m high. HVO reported that the previously active lava lake in the E part of the crater appeared stagnant during 10-11 June. The surface of the W lake rose approximately 1 m overnight during 11-12 June, likely due to the construction of a levee around it. Only a few small fountains were active during 12-13 June; the extent of the active lava had retreated so that all activity was concentrated in the SW and central parts of Halema’uma’u crater. Intermittent spattering from the vent on the SW wall was visible in overnight webcam images during 13-18 June. On the morning of 14 June a weak lava effusion originated from near the western eruptive vent, but by 15 June there were no signs of continued activity. HVO reported that other eruptive vents in the SW lava lake had stopped during this time, following several days of waning activity; lava filled the lake by about 0.5 m. Lava circulation continued in the central lake and no active lava was reported in the northern or eastern parts of the crater. Around 0800 on 15 June the top of the SW wall spatter cone collapsed, which was followed by renewed and constant spattering from the top vent and a change in activity from the base vent; several new lava flows effused from the top of the cone, as well as from the pre-existing tube-fed flow from its base. Accumulation of lava on the floor resulted in a drop of the central basin relative to the crater floor, allowing several overflows from the SW lava lake to cascade into the basin during the night of 15 June into the morning of 16 June.
Renewed lava fountaining was reported at the eruptive vent on the SW side of the crater during 16-19 June, which effused lava into the far SW part of the crater. This activity was described as vigorous during midday on 16 June; a group of observatory geologists estimated that the lava was consistently ejected at least 10 m high, with some spatter ejected even higher and farther. Deposits from the fountain further heightened and widened the spatter cone built around the original eruptive vent in the lower section of the crater wall. Multiple lava flows from the base of the cone were fed into the SW lava lake and onto the southwestern-most block from the 2018 collapse within Halema’uma’u on 17 June (figure 531); by 18 June they focused into a single flow feeding into the SW lava lake. On the morning of 19 June a second lava flow from the base of the eruptive cone advanced into the SW lava lake.
Around 1600 on 19 June there was a rapid decline in lava fountaining and effusion at the eruptive vent on the SW side of the crater; vent activity had been vigorous up to that point (figure 532). Circulation in the lava lake also slowed, and the lava lake surface dropped by several meters. Overnight webcam images showed some previously eruptive lava still flowing onto the crater floor, which continued until those flows began to cool. By 21 June no lava was erupting in Halema’uma’u crater. Overnight webcam images during 29-30 June showed some incandescence from previously erupted lava flows as they continued to cool. Seismicity in the crater declined to low levels. Sulfur dioxide emission rates ranged 160-21,000 t/d throughout the month, the highest measurement of which was recorded on 8 June. On 30 June the VAL was lowered to Advisory (the second level on a four-level scale) and the ACC was lowered to Yellow. Gradual inflation was detected at summit tiltmeters during 19-30 June.
Activity during July-August 2023. During July, the eruption paused; no lava was erupting in Halema’uma’u crater. Nighttime webcam images showed some incandescence from previously erupted lava as it continued to cool on the crater floor. During the week of 14 August HVO reported that the rate in seismicity increased, with 467 earthquakes of Mw 3.2 and smaller occurring. Sulfur dioxide emission rates remained low, ranging from 75-86 t/d, the highest of which was recorded on 10 and 15 August. On 15 August beginning at 0730 and lasting for several hours, a swarm of approximately 50 earthquakes were detected at a depth of 2-3 km below the surface and about 2 km long directly S of Halema’uma’u crater. HVO reported that this was likely due to magma movement in the S caldera region. During 0130-0500 and 1700-2100 on 21 August two small earthquake swarms of approximately 20 and 25 earthquakes, respectively, occurred at the same location and at similar depths. Another swarm of 50 earthquakes were recorded during 0430-0830 on 23 August. Elevated seismicity continued in the S area through the end of the month.
Activity during September 2023. Elevated seismicity persisted in the S summit with occasional small, brief seismic swarms. Sulfur dioxide measurements were relatively low and were 70 t/d on 8 September. About 150 earthquakes occurred during 9-10 September, and tiltmeter and Global Positioning System (GPS) data showed inflation in the S portion of the crater.
At 0252 on 10 September HVO raised the VAL to Watch and the ACC to Orange due to increased earthquake activity and changes in ground deformation that indicated magma moving toward the surface. At 1515 the summit eruption resumed in the E part of the caldera based on field reports and webcam images. Fissures opened on the crater floor and produced multiple minor lava fountains and flows (figure 533). The VAL and ACC were raised to Warning and Red, respectively. Gas-and-steam plumes rose from the fissures and drifted downwind. A line of eruptive vents stretched approximately 1.4 km from the E part of the crater into the E wall of the down dropped block by 1900. The lava fountains at the onset of the eruption had an estimated 50 m height, which later rose 20-25 m high. Lava erupted from fissures on the down dropped block and expanded W toward Halema’uma’u crater. Data from a laser rangefinder recorded about 2.5 m thick of new lava added to the W part of the crater. Sulfur dioxide emissions were elevated in the eruptive area during 1600-1500 on 10 September, measuring at least 100,000 t/d.
At 0810 on 11 September HVO lowered the VAL and ACC back to Watch and Orange due to the style of eruption and the fissure location had stabilized. The initial extremely high effusion rates had declined (but remained at high levels) and no infrastructure was threatened. An eruption plume, mainly comprised of sulfur dioxide and particulates, rose as high as 3 km altitude. Several lava fountains were active on the W side of the down dropped block during 11-15 September, while the easternmost vents on the down dropped block and the westernmost vents in the crater became inactive on 11 September (figure 534). The remaining vents spanned approximately 750 m and trended roughly E-W. The fed channelized lava effusions flowed N and W into Halema’uma’u. The E rim of the crater was buried by new lava flows; pahoehoe lava flows covered most of the crater floor except areas of higher elevation in the SW part of the crater. The W part of the crater filled about 5 m since the start of the eruption, according to data from a laser rangefinder during 11-12 September. Lava fountaining continued, rising as high as 15 m by the morning of 12 September. During the morning of 13 September active lava flows were moving on the N and E parts of the crater. The area N of the eruptive vents that had active lava on its surface became perched and was about 3 m higher than the surrounding ground surface. By the morning of 14 September active lava was flowing on the W part of the down dropped block and the NE parts of the crater. The distances of the active flows progressively decreased. Spatter had accumulated on the S (downwind) side of the vents, forming ramparts about 20 m high.
Vigorous spattering was restricted to the westernmost large spatter cone with fountains rising 10-15 m high. Minor spattering occurred within the cone to the E of the main cone, but HVO noted that the fountains remained mostly below the rim of the cone. Lava continued to effuse from these cones and likely from several others as well, traveled N and W, confined to the W part of the down-dropped block and the NE parts of Halema’uma’u. Numerous ooze-outs of lava were visible over other parts of the crater floor at night. Laser range-finder measurements taken of the W part of the crater during 14-15 September showed that lava filled the crater by 10 m since the start of the eruption. Sulfur dioxide emissions remained elevated after the onset of the eruption, ranging 20,000-190,000 t/d during the eruption activity, the highest of which occurred on 10 September.
Field crews observed the eruptive activity on 15 September; they reported a notable decrease or stop in activity at several vents. Webcam images showed little to no fountaining since 0700 on 16 September, though intermittent spattering continued from the westernmost large cone throughout the night of 15-16 September. Thermal images showed that lava continued to flow onto the crater floor. On 16 September HVO reported that the eruption stopped around 1200 and that there was no observable activity anywhere overnight or on the morning of 17 September. HVO field crews reported that active lava was no longer flowing onto Halema’uma’u crater floor and was restricted to a ponded area N of the vents on the down dropped block. They reported that spattering stopped around 1115 on 16 September. Nighttime webcam images showed some incandescence on the crater floor as lava continued to cool. Field observations supported by geophysical data showed that eruptive tremor in the summit region decreased over 15-16 September and returned to pre-eruption levels by 1700 on 16 September. Sulfur dioxide emissions were measured at a rate of 800 t/d on 16 September while the eruption was waning, and 200 t/d on 17 September, which were markedly lower compared to measurements taken the previous week of 20,000-190,000 t/d.
Geologic Background. Kilauea overlaps the E flank of the massive Mauna Loa shield volcano in the island of Hawaii. Eruptions are prominent in Polynesian legends; written documentation since 1820 records frequent summit and flank lava flow eruptions interspersed with periods of long-term lava lake activity at Halemaumau crater in the summit caldera until 1924. The 3 x 5 km caldera was formed in several stages about 1,500 years ago and during the 18th century; eruptions have also originated from the lengthy East and Southwest rift zones, which extend to the ocean in both directions. About 90% of the surface of the basaltic shield volcano is formed of lava flows less than about 1,100 years old; 70% of the surface is younger than 600 years. The long-term eruption from the East rift zone between 1983 and 2018 produced lava flows covering more than 100 km2, destroyed hundreds of houses, and added new coastline.
Information Contacts: Hawaiian Volcano Observatory (HVO), U.S. Geological Survey, PO Box 51, Hawai'i National Park, HI 96718, USA (URL: http://hvo.wr.usgs.gov/).
Tinakula (Solomon Islands) — December 2023 Cite this Report
Tinakula
Solomon Islands
10.386°S, 165.804°E; summit elev. 796 m
All times are local (unless otherwise noted)
Continued lava flows and thermal activity during June through November 2023
Tinakula is a remote 3.5 km-wide island in the Solomon Islands, located 640 km ESE of the capital, Honiara. The current eruption period began in December 2018 and has more recently been characterized by intermittent lava flows and thermal activity (BGVN 48:06). This report covers similar activity during June through November 2023 using satellite data.
During clear weather days (20 July, 23 September, 23 October, and 12 November), infrared satellite imagery showed lava flows that mainly affected the W side of the island and were sometimes accompanied by gas-and-steam emissions (figure 54). The flow appeared more intense during July and September compared to October and November. According to the MODVOLC thermal alerts, there were a total of eight anomalies detected on 19 and 21 July, 28 and 30 October, and 16 November. Infrared MODIS satellite data processed by MIROVA (Middle InfraRed Observation of Volcanic Activity) detected a small cluster of thermal activity occurring during late July, followed by two anomalies during August, two during September, five during October, and five during November (figure 55).
Geologic Background. The small 3.5-km-wide island of Tinakula is the exposed summit of a massive stratovolcano at the NW end of the Santa Cruz islands. It has a breached summit crater that extends from the summit to below sea level. Landslides enlarged this scarp in 1965, creating an embayment on the NW coast. The Mendana cone is located on the SE side. The dominantly andesitic volcano has frequently been observed in eruption since the era of Spanish exploration began in 1595. In about 1840, an explosive eruption apparently produced pyroclastic flows that swept all sides of the island, killing its inhabitants. Recorded eruptions have frequently originated from a cone constructed within the large breached crater. These have left the upper flanks and the steep apron of lava flows and volcaniclastic debris within the breach unvegetated.
Information Contacts: MIROVA (Middle InfraRed Observation of Volcanic Activity), a collaborative project between the Universities of Turin and Florence (Italy) supported by the Centre for Volcanic Risk of the Italian Civil Protection Department (URL: http://www.mirovaweb.it/); Hawai'i Institute of Geophysics and Planetology (HIGP) - MODVOLC Thermal Alerts System, School of Ocean and Earth Science and Technology (SOEST), Univ. of Hawai'i, 2525 Correa Road, Honolulu, HI 96822, USA (URL: http://modis.higp.hawaii.edu/); Copernicus Browser, Copernicus Data Space Ecosystem, European Space Agency (URL: https://dataspace.copernicus.eu/browser/).
Search Bulletin Archive by Publication Date
Select a month and year from the drop-downs and click "Show Issue" to have that issue displayed in this tab.
The default month and year is the latest issue available.
Bulletin of the Global Volcanism Network - Volume 25, Number 02 (February 2000)
Aira (Japan)
Frequent explosive eruptions continue from Minami-dake
Ambrym (Vanuatu)
Lava lakes disappear, but ash eruptions continue from many active vents
Concepcion (Nicaragua)
Explosions from the crater cause ashfall in late December
Hekla (Iceland)
Fissure eruption; abundant lava flows produced
Iwatesan (Japan)
Tremor event and earthquake swarm on 12 November 1999
Kirishimayama (Japan)
Earthquake swarm during 6-15 November 1999
Mayon (Philippines)
Strong explosions, lava flows, and pyroclastic flows following dome growth
San Cristobal (Nicaragua)
Continued frequent eruptions and ashfall through December 1999
Shishaldin (United States)
Small phreatic explosions during September 1999-January 2000
Telica (Nicaragua)
Lava lake seen in August; sporadic ash explosions August-December
Terceira (Portugal)
Activity in 1999; submarine eruption plume during January-February 2000
Aira
Japan
31.5772°N, 130.6589°E; summit elev. 1117 m
All times are local (unless otherwise noted)
Frequent explosive eruptions continue from Minami-dake
The southern-most cone at Sakura-jima, Minami-dake, manifested increased eruptivity from late October to early November 1999. Following a lull in the second half of November, vigorous activity in December was marked by incandescent columns, large amounts of bomb ejections, and ballistics falling as far as 4 km from the crater.
High eruptive activity occurred in late October and early November 1999. On 31 October the JMA issued a Volcanic Advisory. In early November, 19 eruptions (including 18 explosions) occurred at Minami-dake before activity declined to lower levels later in the month. Activity increased again in early December with a few explosions each day and small numbers of ballistic clasts falling onto the upper slopes. On the afternoon of 10 December JMA issued another Volcanic Advisory. At 0555 this day, Sakura-jima issued a large amount of bombs. Incandescent columns as high as 100 m were accompanied 116 times by volcanic lightning. According to a JMA field inspection, ballistics were scattered 3-4 km away from the Minami-dake crater; the maximum size was 4 cm across. Incandescent columns rose as high as 300 m at 0554 on 24 December and were accompanied by volcanic lightning six times.
Daily numbers of eruptions ranged from 2 to 8 during early- to mid-December; eruptions were mostly explosive. The maximum amplitude of explosion earthquakes recorded at JMA observation point A, 4.6-km WNW of the crater, reached up to 28 µm; the largest value was caused by an explosion at 1301 on 12 December. The plume heights of December explosions ranged from 1,500 m to 2,000 m. Explosions took place on 23 consecutive days between 3 and 25 December. This is the longest record of daily explosions since JMA started observing Sakura-jima in 1955; the previous record was 21 days in 1960. Explosions began again late in the month, with six more on 31 December.
The total of 88 explosions during December 1999 was the second highest monthly count since 1955; the highest was 93 explosions in June 1974. According to the JMA, the total number of eruptions in 1999 was 386, including 237 explosions.
Frequent explosive eruptions continued in early January (figure 21). Explosions on 2 January sent an eruption column to 2,200 m above the crater rim and emitted abundant cinders, as well as bombs that fell midway down the flanks of the volcano. Nine explosive eruptions occurred on 5 January, one of which again ejected cinders and bombs as far as the middle flank of the volcano. The highest plumes in early January reached 2,200 m above the crater rim during explosions at 0821 on 5 January and at 0746 on 14 January. The maximum amplitude of explosion seismic signals at JMA observation point A (4.6 km WNW of the active crater) was 17 µm for the 0513 explosion on 14 January.
Geologic Background. The Aira caldera in the northern half of Kagoshima Bay contains the post-caldera Sakurajima volcano, one of Japan's most active. Eruption of the voluminous Ito pyroclastic flow accompanied formation of the 17 x 23 km caldera about 22,000 years ago. The smaller Wakamiko caldera was formed during the early Holocene in the NE corner of the caldera, along with several post-caldera cones. The construction of Sakurajima began about 13,000 years ago on the southern rim and built an island that was joined to the Osumi Peninsula during the major explosive and effusive eruption of 1914. Activity at the Kitadake summit cone ended about 4,850 years ago, after which eruptions took place at Minamidake. Frequent eruptions since the 8th century have deposited ash on the city of Kagoshima, located across Kagoshima Bay only 8 km from the summit. The largest recorded eruption took place during 1471-76.
Information Contacts: JMA-Fukuoka, Japan Meteorological Agency (JMA), 1-3-4 Ote-machi, Chiyoda-ku, Tokyo 100, Japan; Setsuya Nakada, Volcano Research Center, ERI, University of Tokyo, Yayoi 1-1-1, Bunkyo-ku, Tokyo 113, Japan (URL: http://www.eri.u-tokyo.ac.jp/VRC/index_E.html); Tatsuro Chiba, Nihon University, Japan (URL: http://www.nihon-u.ac.jp/en/).
Ambrym (Vanuatu) — February 2000 Cite this Report
Ambrym
Vanuatu
16.25°S, 168.12°E; summit elev. 1334 m
All times are local (unless otherwise noted)
Lava lakes disappear, but ash eruptions continue from many active vents
Eruptive activity continued at Ambrym in late 1999 and through January 2000. A volcanic ash advisory regarding this volcano was issued to aviators on 1 November 1999 reporting "smoke and ash" rising to ~1,500 m altitude. Similar notices were issued on 5 and 6 November. [Aviation reports on 9-10 December] described an ash cloud up to 2,700 m altitude.
John Search and Geoff Mackley investigated Ambrym caldera during a 19-28 January 2000 climb. Lava lakes had disappeared from both Benbow and Mbwelesu craters and a new vent had opened inside the previously inactive 1953 crater. A series of earthquakes were registered around Ambrym Island on 27 November 1999. The largest of these was magnitude 7.1. The earthquakes were followed by a month of reduced activity during which there were no reported observations of lava lakes. Landslides were visible in the caldera and ground cracking visible at Benbow, Mbwelesu, and Niri Mbwelesu craters.
Activity at Benbow Crater. Four vents were active inside Benbow. On 19 January a white plume tinged with blue and yellow rose 1,000 m above the crater rim. Twin plumes were visible the next day rising from the S end of the crater at 15 m/s and from the N end of the crater, where they were tinged with brown. Each time the crater was climbed from the S on 22, 23, and 24 January the pit was full of vapor and no sounds were heard. On 25 January the observers lowered themselves into Benbow using 200 m of rope. The floor of the first level was covered with fine brown ash and a shallow brown pond was present in the SW end of the crater. The inner crater was climbed and observations made from its rim. Below the observers was a ledge 120-140 m down covered with ash and containing a 10-m circular vent emitting white vapor. The main vent was 50 m farther down and 40 m in diameter. This was the vent that contained the lava lake in January 1999 (BGVN 24:02). No lava was observed inside this vent and it made no sound. At 1300 a large roar from the vent was followed by brown ash emission. At the NE end of the inner crater was a plume emission from an unseen vent.
The N end of Benbow crater (on the first level) contained another vent that could not be directly observed but regularly emitted light brown ash. On 26 January a loud continuous 30-second degassing heard from the N vent was followed by brown ash emission and rain of small cinders on observers at the S crater edge. From the central pit the vapor was rising at 5 m/s. During the late afternoon two visible atmospheric perturbations were observed above the main vent. The first followed a loud degassing sound and rose at 40 m/s to a height of 200 m above the vent. Rockfalls were also heard during the afternoon. During the night of 26 January twin skyglows of fluctuating intensity were visible above Benbow followed by a large brown ash emission that rose 1,400 m above the crater in 3 minutes.
Activity at Niri Mbwelesu Taten. On both 19 and 20 January light brown or red/brown ash was emitted from the collapse pit and rose 200-250 m. On 21 January a brown pond of water 150 m NE of the pit was bubbling from both fixed and random locations. Active fumaroles were present on a ledge 60 m down. There were large cracks on the SE side and evidence of wall collapse since August 1999. Ash fell on observers in the area N of the pit. On 23 January larger ash emissions occurred about every hour.
On 24 January the collapse pit was entered using ropes. Fumaroles on the ledge 60 m down averaged 64°C. The pit bottom was 120-140 m below the ledge covered in brown ash. Small clouds of ash were emitted occasionally from two large fissures. Bubbles of hot blue vapors, 6 m in diameter, rose past the observer. Continual degassing sounds were heard in the pit, like the sound of waves crashing on the beach. On 26 January from 0600 to 1100 dark gray ash clouds were continually being emitted from the pit. Plumes rose at 8 m/s to a height of 200 m above the pit, filling the caldera in all directions. During the afternoon the pit returned to a low level of activity. On 27 January a continuous emission of brown ash occurred all day to a height of 800 m above the pit.
Activity at Niri Mbwelesu. On 20 January white vapor tinged with blue was constantly emitted to 600 m above crater. During the evening a very intense pulsating night glow was visible. The glow would brighten (sometimes flicker), then rapidly drop to a lower level of illumination. The bright/dim cycle would repeat every 10-15 seconds. On 21 January in the afternoon degassing was heard from the crater rim and during the evening clouds were illuminated 250 m above the crater. Observers on the crater edge felt hot vapor. When the crater was climbed on the evening of 25 January a clearing of the vapor enabled the bottom to be seen 280 m down. A 40-m-diameter vent was visible emitting bright yellow burning gas, radiant heat was felt on the faces of observers, and moderate degassing was heard.
Activity at Mbwelesu. Observations were made of Mbwelesu crater on 21 January. The two lava lakes observed in August 1999 had disappeared (BGVN 24:08). A brown pond surrounded by fumaroles was in the Vent B location, with large amounts of ash and rock to the SE. The sill on the SE edge of the crater had large craters and several large sections (over 10 m) that had broken off and fallen into the crater. The fumarole field 40 m SE of the crater rim had a temperature of 72.7°C. Heavy rains caused waterfalls and rockfalls inside the crater. The crater was otherwise quiet with some vapor emissions from many fumaroles on the floor. Fumaroles were also present in the location of the former lava lake at Vent C.
Activity in the 1953 Crater. The 1953 crater contained two levels. The higher (W half) contained a brown pond. The lower (E half) had developed a deep smoking vent. This was in the location of the green pond observed in August 1999.
Geologic Background. Ambrym is a large basaltic volcano with a 12-km-wide caldera formed during a major Plinian eruption with dacitic pyroclastic flows about 1,900 years ago. A thick, almost exclusively pyroclastic sequence, initially dacitic then basaltic, overlies lava flows of a pre-caldera shield volcano. Post-caldera eruptions, primarily from Marum and Benbow cones, have partially filled the caldera floor and produced lava flows that ponded on the floor or overflowed through gaps in the caldera rim. Post-caldera eruptions have also formed a series of scoria cones and maars along a fissure system oriented ENE-WSW. Eruptions have been frequently reported since 1774, though mostly limited to extra-caldera eruptions that would have affected local populations. Since 1950 observations of eruptive activity from cones within the caldera or from flank vents have occurred almost yearly.
Information Contacts: John Seach, PO Box 16, Chatsworth Island, N.S.W. 2469, Australia; Wellington Volcanic Ash Advisory Center (VAAC), MetService, PO Box 722, Wellington, New Zealand (URL: http://www.metservice.co.nz/).
Concepcion (Nicaragua) — February 2000 Cite this Report
Concepcion
Nicaragua
11.538°N, 85.622°W; summit elev. 1700 m
All times are local (unless otherwise noted)
Explosions from the crater cause ashfall in late December
Starting around dawn on 23 December, INETER registered low-amplitude seismic tremor at the seismic station located at the foot of Concepción. The seismic signal grew gradually and every few minutes small earthquakes were observed. Due to the increasing seismicity, at 1315 on 24 December INETER informed Civil Defense in Managua of the activity and recommended taking precautions for volcanic gases, ashfall, and, in the event of rain, for lahars or mudflows.
On the morning of 27 December INETER received reports from Lacsa and Aviateca airlines that their pilots had observed emission of material from Concepción rising ~300 m above the crater. Residents of Moyogalpa (at the W foot of the volcano) confirmed moderate activity. Minor amounts of gas and volcanic ash blew towards Moyogalpa.
INETER specialists conducted fieldwork around the volcano on 28 December and confirmed the occurrence of low-level eruptive activity based on their own observations and descriptions by local residents. Activity was characterized by sporadic gas explosions from the crater that ejected small amounts W-blown ash. The seismic instrumentation indicated constant tremor with rare volcanic earthquakes related to the crater explosions.
The level of seismicity had decreased by the morning of 29 December, and continued to decline through 1000 on the 30th. Although volcanic activity had also diminished, an explosion at 1600 on 29 December caused ashfall as far as San Jorge (also known as Rivas, a town 25 km SW of Concepción).
Some pilot reports received on 27 December also indicated possible activity from the adjacent Maderas volcano, which has no known historical activity. INETER observers were unable to confirm these reports during fieldwork in the area. However, another seismic station was installed on Ometepe Island in the SW zone of Maderas, which should help to confirm or refute any future reports of Maderas activity.
Geologic Background. Volcán Concepción is a symmetrical basaltic-to-dacitic stratovolcano that forms the NW half of the dumbbell-shaped island of Ometepe in Lake Nicaragua and is connected to neighboring Madera volcano by a narrow isthmus. A steep-walled summit crater is 250 m deep and has a higher western rim. N-S-trending fractures on the flanks have produced chains of spatter cones, cinder cones, lava domes, and maars located on the NW, NE, SE, and southern sides extending in some cases down to Lake Nicaragua. It was constructed above a basement of lake sediments, and the modern cone grew above a largely buried caldera, a small remnant of which forms a break in slope about halfway up the N flank. Frequent explosive eruptions during the past half century have increased the height of the summit significantly and have kept the upper part of the volcano unvegetated.
Information Contacts: Wilfried Strauch and Virginia Tenorio, Dirección General de Geofísica, Instituto Nicaragüense de Estudios Territoriales (INETER), Apartado 1761, Managua, Nicaragua (URL: http://www.ineter.gob.ni/).
Hekla
Iceland
63.983°N, 19.666°W; summit elev. 1490 m
All times are local (unless otherwise noted)
Fissure eruption; abundant lava flows produced
On 26 February 2000 the WSW-trending, elongated Hekla volcano erupted. A fissure 6-7 km long opened along the SW flank of the Hekla ridge, from which a discontinuous curtain of lava erupted starting at 1819. Just a few minutes later, at 1825, an ash plume reached a height of 11 km and was carried N by light winds. Based on the tremor amplitude the eruption reached peak intensity in the first hour of activity, then gradually declined.
Seismic networks maintained by the Science Institute at the University of Iceland and the Icelandic Meteorological Office recorded short-term precursors. Small earthquakes were first detected by seismographs at various locations during 1655-1707. These gradually increased and the first well-located earthquakes (M 1-2) started at 1729, centered 1-2 km SE of the summit at depths of a few kilometers. A network of borehole strainmeters operated by the Meteorological Office also detected precursory changes associated with magma movements. A decrease in strain build-up rate, signaling a release of magma pressure, was recorded by a strainmeter in a borehole ~15 km from the summit at 1817.
Notice was given to the National Civil Defense and the Civil Aviation Administration about 40 minutes before the eruption, and the public was alerted about the imminent eruption about 15 minutes before it began through national radio broadcasts. Continuous low-frequency tremor began at 1819, at the same time the eruptive cloud was spotted.
Ashfall was reported on 26 February from Grimsey Island, ~70 km off the N coast of Iceland and 300 km N of Hekla. Although small amounts of ash fell in inhabited areas of N Iceland, most fell in uninhabited areas of the island's interior. Seven hours after the eruption's onset the ash deposit 21 km N had a maximum thickness of 4-5 cm.
Lava flows on 27 February covered a large part of the SE flank. That evening a lava stream flowed N from the erupting fissure at a rate of several meters per hour. Another more active lava stream emanated from three craters near the S end of the fissure; the stream was several kilometers long and advancing at ~1 m/minute.
On 28 February an eruption cloud was deflected towards the S by northerly winds. However weather conditions precluded direct observations. Tremor amplitude continued to slowly decline, and the strength of the eruption was decreasing (figure 1). Two eruption clouds were seen at 0500, confirming that activity was ongoing. Although the craters were not visible in the daylight, the most active crater just S of the summit produced three lava streams down the S flanks. Activity in the N declined during the day on 28 February. At 0630 one lava flow had reached the Vatnafjoll mountains at Lambafell, 5 km S of the summit. Advancing at ~2-3 m/hour, the lava front was estimated to be 8-10 m wide. That evening observers watched Strombolian activity in three craters at the southernmost part of the fissure.
Ashfall was reported on the morning of 29 February 35-40 km S in Fljótshlíð. At 0500 volcanic tremor had started to increase and continued until 1000-1100. By about 0800 all activity in the summit had ceased. During the afternoon of 29 February activity at the southernmost end of the fissure increased again, producing eruption clouds ascending above the summit. In the darkness of the evening, three craters at the southernmost end of the fissure produced lava flowing SW. People watching the lava on the NE flanks reported that they could walk on the stopped flow there.
Vigorous Strombolian eruptions and lava flows on the fissure that cuts the SW slopes were seen during a reconnaissance flight on 1 March during 1100-1230. Four main vents and three smaller vents produced explosions at intervals of 4-5 minutes. At the base of the fissure a large tumuli had developed. The lava streams coming out through the opening of the tumuli joined a stream coming from overflows of the uppermost craters. The S-directed lava flows were fed by the crater closest to the summit. The lava field in the S had only advanced ~100 m since 28 February, but on 1 March it was growing toward the E. By 1 March lava had covered approximately 17 km2.
Increased activity was observed in the upper craters on 2 March, although bad weather persisted from 1200 on 1 March until midday on 3 March. There was also constant steaming from the SW craters, and, compared to 1 March, much larger steam clouds rising from the upper craters. At nightfall explosions were observed at ~30-minute intervals. Glowing lava streams were noted on the flank of the mountain on 2 March.
On 3 March a group of scientists reached the SW lava flow at 1300 and found that the lava front was ~10 m wide and advancing very slowly, ~1-2 m/day. While tracing the lava to the W the group noted that at some places the flow was spreading much faster, up to ~1 m/hour. Following the lava flow along its W side, the group reached its origin at the foot of the volcano, where it emerged from the end of the erupting fissure. At the origin, the estimated flow rate was 0.06 m/s, producing about 10 m3/s of lava. Due to the continuous degassing along the lava stream a blue mist was formed. The blue mist was also observed farther E along the flank of the volcano, indicating that lava was still flowing from the crater close to the summit area. The craters in this region fed the lava flow that moved S toward the Vatnafjoll glacier 10 km SE from Hekla. Later in the evening observers reported that lava was still flowing slowly towards Vatnafjoll. Explosive activity in the uppermost crater of the SW-fissure was characterized by small explosions at 10-20 minute intervals that produced white steam clouds with only trace amounts of ash.
Due to bad weather conditions on 4 March, no direct observations could be made of the eruption. Decreasing eruption tremor was detected. On 5 March the lava flow to the SW was still ongoing according to observations made in the afternoon. At sunset, a red pulsing glow was observed in the uppermost craters of the SW-fissure from the town of Selsundsfjall, 15 km SW. Small eruption clouds were observed on 6 March penetrating the weather clouds covering the summit of Hekla.
During a reconnaissance flight between 1730 and 1830 on 6 March the whole fissure was steaming vigorously and all of the lava flows appeared to have stopped. The lava stream in the SW had left behind an empty channel. Neither incandescence nor explosive activity were observed from the craters. Minor tremors continued on 6-7 March, but may have been related to lava degassing in the feeder dike.
At 0844 on 8 March the last eruptive tremor was detected on seismometers. Based on the end of detectable tremor, and with no signs of new eruptive products since 5 March, it was determined that the eruption ended on the morning of 8 March. Lava covered approximately 18 km2; the preliminary estimate of lava production was 0.11 km3.
Plume investigation. Sulfur dioxide (SO2) contained in plumes from Hekla was detected by the Earth Probe TOMS (Total Ozone Mapping Spectrometer) instrument. TOMS imagery at 1154 on 27 February showed that the volcanic cloud was a narrow plume arcing from the volcano in southern Iceland, then N to Greenland, and finally E towards Norway. The plume primarily contained SO2 because almost all of the ash fell out locally. On 28 February the TOMS imagery indicated that plume stretched out over the Barents Sea and possibly into eastern Russia. By 29 February the SO2 cloud had drifted E in a band along the Norwegian and Russian coasts of the Barents Sea.
During a transit flight on 28 February a SOLVE (SAGE III Ozone Loss and Validation Experiment) mission with an instrument-laden DC-8 aircraft flew through the plume shortly after the eruption ~11.3 km NNE of Iceland at 76°N and 5°W, just off the Greenland coastline. The plume extended up to ~13 km altitude, well into the lower stratosphere. Instruments also measured many in situ trace gases, SO2, HNO3, NO, NOy, O3, and aerosols (volatile and non-volatile), including their size distribution. From about 0508 until 0518 on 29 February the SOLVE aircraft again entered the volcanic cloud. The scientific team reported large enhancements in CN, NOy, HNO3, CO, and particle counts, ozone went to nearly zero, H2O jumped up, and there were strong scattering layers up to 13 km. The plume was a very impressive, orange, airfoil-shaped feature in the pre-dawn sky. The DC-8 engines needed an oil change and new filters after passing through the plume. A flight on 5 March detected enhanced aerosols and SO2 at 1301, but by that time the plume was so diluted that it represented no danger to the aircraft. During the three weeks following the initial encounter the DC-8 detected remnants of the plume trapped within the polar vortex. The resulting analysis concluded that volatile aerosols increased and the sizes of non-volatile large aerosols decreased.
Fluoride analysis. Ash from previous Hekla eruptions has often been the cause of fluorosis in grazing animals. However, during this time of the year most domestic animals are kept indoors, so fluorosis is not expected to become a problem. Freshly fallen ash was measured for soluble fluoride ions (F-). The result was 800-900 mg F/kg. Snow melted by the ash contained about 2,200 mg/l (ppm) of fluoride.
Geologic Background. One of Iceland's most prominent and active volcanoes, Hekla lies near the southern end of the eastern rift zone. Hekla occupies a rift-transform junction, and has produced basaltic andesites, in contrast to the tholeiitic basalts typical of Icelandic rift zone volcanoes. Vatnafjöll, a 40-km-long, 9-km-wide group of basaltic fissures and crater rows immediately SE of Hekla forms a part of the Hekla-Vatnafjöll volcanic system. A 5.5-km-long fissure, Heklugjá, cuts across the 1491-m-high Hekla volcano and is often active along its full length during major eruptions. Repeated eruptions along this rift, which is oblique to most rifting structures in the eastern volcanic zone, are responsible for Hekla's elongated ENE-WSW profile. Frequent large silicic explosive eruptions during historical time have deposited tephra throughout Iceland, providing valuable time markers used to date eruptions from other Icelandic volcanoes. Hekla tephras are generally rich in fluorine and are consequently very hazardous to grazing animals. Extensive lava flows from historical eruptions, which date back to 1104 CE, cover much of the volcano's flanks.
Information Contacts: Freysteinn Sigmundsson, Nordic Volcanological Institute, Grensásvegur 50, IS-108 Reykjavik, Iceland (URL: http://nordvulk.hi.is); Páll Einarsson, Science Institute, University of Iceland, Hofsvallagata 53, IS-107 Reykjavík, Iceland; Ragnar Stefánsson, Icelandic Meteorological Office, Bustadavegur 9, 150 Reykjavík, Iceland (URL: http://www.vedur.is/); Mark Schoeberl, Code 910, NASA/GSFC, Greenbelt, MD, 20771 USA; Michael Fromm, Computational Physics, Inc., 2750 Prosperity Ave., Suite 600, Fairfax, VA 22031 USA (URL: http://cloud1.arc.nasa.gov/solve/); Arlin Krueger, Code 916, NASA/GSFC, Greenbelt, MD, 20771 USA.
Iwatesan (Japan) — February 2000 Cite this Report
Iwatesan
Japan
39.853°N, 141.001°E; summit elev. 2038 m
All times are local (unless otherwise noted)
Tremor event and earthquake swarm on 12 November 1999
At 1800 on 18 October 1999, the National Coordination Committee for Prediction of Volcanic Eruptions reported that the volcano's fumarolic area had expanded and the amount of steam had increased in the western part of Iwate volcano. New fumaroles have been observed since May on the N slopes of Mts. Ubakura-yama and Kurokura-yama and in the western stream of Ojigokudani (inside the erosion caldera). This fumarolic activity has intermittently increased since July, and ground temperatures between Mts. Kurokura-yama and Ubakura-yama also increased with time. Analyses of fumarolic gas collected between Ojigokudani and Mt. Ubakura-yama in August and October revealed a magmatic component. Although GPS measurements showed the end of the elongation trend observed since July, relatively large volcanic earthquakes occurred during May and June. Deep-seated (~30 km depth) low-frequency earthquakes, relatively deep-seated (6-13 km depth) low-frequency earthquakes, and shallow high-frequency earthquakes occurred under the eastern cone of Iwate. However, the overall level of seismicity has decreased compared to 1998 (figure 5).
On the evening of 12 November JMA issued a Volcano Advisory on Iwate after a 4-minute volcanic tremor (M 2.1) saturated local instruments starting at 2054. The event hypocenter was located 2-3 km below the Ubakura-yama and Kurokura-yama areas of western Iwate (figure 6). An earthquake swarm continued for 2 hours after the tremor event at a rate of 16-20 events/hour. Inspection from the air the following day did not show any major change in fumarolic activity or any deposition of new volcanic ash.
On the evening of 16 November, the extended National Coordination Committee for Prediction of Volcanic Eruptions met in the city of Morioka, Iwate Prefecture, to review the events that occurred on the 12th. They noted that the tremor was similar in shape, amplitude, and duration to one (M 2.4) that occurred on 10 July 1999; hence it was considered likely that the two events occurred in the same place. Changes detected in tilt- and strain-meters located on the flank during the tremor were probably caused by subsurface ground faulting or fluid movement. After the tremor, however, no subsequent changes were observed. Neither the GPS-based, N-S traverse distance across the volcano nor the fumarole temperatures in the Ubakura-yama to Kurokura-yama region changed before or after the event. Fumarolic activity in western Iwate had increased since May as had the number of shallow earthquakes in the Ojigokudani area (erosion caldera). The tremor event on 12 November suggested a continuing possibility of a phreatic explosions in western Iwate.
Geologic Background. Viewed from the east, Iwatesan volcano has a symmetrical profile that invites comparison with Fuji, but on the west an older cone is visible containing an oval-shaped, 1.8 x 3 km caldera. After the growth of Nishi-Iwate volcano beginning about 700,000 years ago, activity migrated eastward to form Higashi-Iwate volcano. Iwate has collapsed seven times during the past 230,000 years, most recently between 739 and 1615 CE. The dominantly basaltic summit cone of Higashi-Iwate volcano, Yakushidake, is truncated by a 500-m-wide crater. It rises well above and buries the eastern rim of the caldera, which is breached by a narrow gorge on the NW. A central cone containing a 500-m-wide crater partially filled by a lake is located in the center of the oval-shaped caldera. A young lava flow from Yakushidake descended into the caldera, and a fresh-looking lava flow from the 1732 eruption traveled down the NE flank.
Information Contacts: Kazuo Sekine, Sendai District Meteorological Observatory, Japan Meteorological Agency, 1-3-15 Gorin, Miyagino-ku, Sendai 983, Japan; Hiroyuki Hamaguchi, Faculty of Science, Tohoku University, Sendai 980-8578 Japan (URL: http://www.sci.tohoku.ac.jp/); Setsuya Nakada, Volcano Research Center, ERI, University of Tokyo, Yayoi 1-1-1, Bunkyo-ku, Tokyo 113, Japan (URL: http://www.eri.u-tokyo.ac.jp/VRC/index_E.html); Jun-ichi Hirabayashi, Kusatsu-Shirane Volcano Observatory, Tokyo Institute of Technology, Kusatsu, Agatsuma-gun, Gunma 377-17 Japan.
Kirishimayama (Japan) — February 2000 Cite this Report
Kirishimayama
Japan
31.934°N, 130.862°E; summit elev. 1700 m
All times are local (unless otherwise noted)
Earthquake swarm during 6-15 November 1999
A Volcanic Advisory on Kirishima volcano (figure 4) was issued on 10 November 1999 by the Japan Meteorological Agency (JMA) after seismicity began increasing on 6 November. This is the first advisory at Kirishima since 27 August 1995 (BGVN 20:08 and 20:09). Earthquakes detected at a site 1.7 km SW of Shinmoe-dake totaled 666 during 6-15 November (table 1), peaking at 192 events on the 10th. No volcanic tremor was observed.
Table 1. Daily numbers of volcanic earthquake events at Kirishima, 5-15 November 1999. Courtesy of JMA.
| Date |
Volcanic Earthquakes |
| 05 Nov 1999 |
0 |
| 06 Nov 1999 |
12 |
| 07 Nov 1999 |
16 |
| 08 Nov 1999 |
40 |
| 09 Nov 1999 |
81 |
| 10 Nov 1999 |
192 |
| 11 Nov 1999 |
128 |
| 12 Nov 1999 |
69 |
| 13 Nov 1999 |
86 |
Geologic Background. Kirishimayama is a large group of more than 20 Quaternary volcanoes located north of Kagoshima Bay. The late-Pleistocene to Holocene dominantly andesitic group consists of stratovolcanoes, pyroclastic cones, maars, and underlying shield volcanoes located over an area of 20 x 30 km. The larger stratovolcanoes are scattered throughout the field, with the centrally located Karakunidake being the highest. Onamiike and Miike, the two largest maars, are located SW of Karakunidake and at its far eastern end, respectively. Holocene eruptions have been concentrated along an E-W line of vents from Miike to Ohachi, and at Shinmoedake to the NE. Frequent small-to-moderate explosive eruptions have been recorded since the 8th century.
Information Contacts: JMA-Fukuoka, Japan Meteorological Agency (JMA), 1-3-4 Ote-machi, Chiyoda-ku, Tokyo 100, Japan; Setsuya Nakada and Tsuneomi Kagiyama, Volcano Research Center, Earthquake Research Institute, University of Tokyo, Yayoi 1-1-1, Bunkyo-ku, Tokyo 113, Japan (URL: http://www.eri.u-tokyo.ac.jp/VRC/index_E.html).
Mayon (Philippines) — February 2000 Cite this Report
Mayon
Philippines
13.257°N, 123.685°E; summit elev. 2462 m
All times are local (unless otherwise noted)
Strong explosions, lava flows, and pyroclastic flows following dome growth
Volcanic unrest that began in May 1999, and intermittent explosive eruptions beginning in June 1999, eventually led to growth of a lava dome on 12 February 2000. By 23 February PHIVOLCS had recommended evacuation to 7 km from the summit in the SE and to 6 km for the rest of the volcano. The latter is a permanent danger zone.
At 2206 on 23 February the seismic network detected an explosion-type earthquake that coincided with rumbling and minor ejection of lava fragments from the summit. This earthquake was followed shortly by bright incandescence, indicating that lava emission and ejection had intensified. Low-frequency volcanic earthquakes then occurred beginning at 2217 and lasting until about 2326 when the seismographs began to record harmonic tremor. The tremor became pronounced at about 0034 on 24 February and was accompanied by minor lava fountaining to 50 m above the summit lava dome. The hazard status was raised to Alert Level 4 (hazardous eruption imminent, possible within days) at 0300 on 24 February. No additional evacuation was recommended, but residents within 8 km of the summit were advised to prepare for evacuation.
At 0826 on 24 February another explosion-type earthquake was recorded by the seismographs at Anoling, Sta. Misericordia, and Mayon Resthouse Observatory. The summit was obscured, but at 0829 a pyroclastic flow descended SE towards the Bonga Gully with a run-out distance of ~7.2 km, reaching the distal end of the Bonga fan. The hazard status was then raised to Alert Level 5, (hazardous eruption in progress). Because pyroclastic flows could continue to sweep down along well-incised gullies and channels, especially the Bonga Gully, PHIVOLCS recommended extension of the danger zone to 8 km along the SE sector of Mayon Volcano. Likewise, ashfall was expected mainly W, SW, and NW of the crater.
The SO2 emission rate increased on 24 February to 4,070-5,700 metric tons/day (t/d). Ground deformation measurements showed that the volcanic edifice swelled significantly in the previous two days, consistent with the growth of the lava dome.
By the morning of 25 February activity was mainly lava extrusion, with a flow channeled along the Bonga Gully. COSPEC readings conducted on 24 February reached 13,500 t/d. The abrupt increase in this value may be attributed to the series of highly gas-charged ash ejections comprising the volcanic plume.
Following a quiet interval that started at 1420 on 26 February, more vigorous activity resumed on the evening of the 27th. Seven ash-and-gas explosions occurred between 1950 and 2237, the most significant of which (at 2144 and 2237) were accompanied by lava fountaining with ejection of volcanic bombs. Large incandescent fragments were ejected to ~500 m above the crater rim. Ground deformation measurements showed that the edifice remained inflated. COSPEC readings of SO2 flux remained significantly above normal at 4,900 t/d. Explosion earthquakes and harmonic tremor accompanied the lava fountaining and persisted even when the activity had apparently subsided.
Explosive eruptions during 28 February-1 March. Mayon had another series of explosive eruptions during 0700 to 2100 on 28 February, with the most significant eruptions occurring at 1641, 1732, and 1940. The first explosion produced a 5-6-km-high eruption column and generated a large pyroclastic flow that descended the W portion of the Bonga Gully on the SE flank and entered the Mabinit channel to the S. This was followed by voluminous eruption clouds beginning at 1732 that rose to ~10 km above the summit and generated multiple pyroclastic flows to the SW, S, and SE. Vigorous explosions sustained the eruption column and discharged large volcanic fragments that splattered the upper portions of the cone. Thick ash clouds hovered around the volcano and created frequent lightning discharges.
Most of the ash clouds were eventually carried to the SW and W, affecting Ligao, Guinobatan, and Camalig. However, the pyroclastic flows did not travel beyond the present danger zones. The ash clouds contained high concentrations of sulfur dioxide, with COSPEC-recorded emission rates of 13,000 t/d, as expected for an eruption cloud. Aircraft were warned to avoid lingering ash clouds to the W of the volcano. The E side, towards the Legaspi airport, remained free from volcanic ash, debris, and SO2 emissions.
Electronic distance measurements revealed that the volcano's edifice remained inflated. Such inflation was thought to be caused by the ascent of magma as indicated by the near-continuous seismic tremor associated with active magma transport.
The series of major ash ejections and subsequent pyroclastic flows that occurred along Bonga Gully, Mabinit, and Miisi Channels started at 1641 on 28 February 2000. The maximum height estimated for the vertical ash plume was 12 km during the 1732 event. The approximate runout of the pyroclastic flows reached to ~5-6 km downslope. Severe ashfall occurred in the SW sector of the volcano, especially at Barangay Tumpa in Camalig and Barangays Maninila and Masarawag in Guinobatan. Lava fountaining with ballistic bombs was also frequently observed starting at 1732 with maximum heights estimated at 1 km.
After the vigorous activities late in the afternoon to early evening on 28 February, only quiet effusion of lava was noted during times when the summit was not obscured through the morning of 29 February.
Another series of ash ejections began at 1211 on 29 February. The largest event occurred at 1501 and produced a 14-km-high eruption column. This event also generated several pyroclastic flows that descended all sides of the volcano. Pyroclastic flows that were channeled by gullies in the SW, S, and SE reached up to 5-6 km from the summit. Smaller pyroclastic flows that followed gullies in other sectors stopped ~2-3 km from the crater. Ash from the tall eruption column and from pyroclastic flows drifted to the W and SW. The ash ejections were generally accompanied by rumbling sounds. Vigorous lava fountaining began at 1531 and ballistic projectiles fell within 1.5 km of the crater. Lava flows were observed on 1 March to have reached the 1,000 m elevation, or about 2.3 km from the summit.
COSPEC measurements on 29 February were hampered by thick ash cover. Ground deformation measurements made the morning of 29 February along the Buang and Masarawag EDM lines showed that the volcano edifice remain inflated. Significant potential was noted for lahars along major tributaries draining from the NW due to the presence of ash and pyroclastic-flow deposits, which could be eroded and remobilized during heavy rainfall.
Mayon exhibited another series of eruptions that began on 1 March and produced dense and highly convective ash columns that rose up to 7 km above the summit. Part of the eruption column would occasionally collapse to produce pyroclastic flows that traveled along major gullies around the volcano. Pyroclastic flows were observed along the main gullies facing Anoling. The largest of these pyroclastic flows occurred along Bonga Gully and traveled ~6 km from the crater, while smaller flows at other gullies descended some 4 km downslope. Explosive eruptions produced lava fountaining with discrete ballistic volcanic fragments hurled out to ~500 m above the crater rim. Frequent rumbling accompanied the explosions, which lasted until 1609. By the end of this episode of explosive activity, quiet lava extrusion followed and continued to be observed up to the present. Areas SW and W of the volcano were severely affected by ashfall with the most significant deposition in Camalig, Guinobatan, and Ligao. Minor ash and steam were continuously being generated by lava deposits from the summit crater and Bonga Gully and drifted to the SW and W areas by prevailing winds.
Lava emission phase. Mayon was relatively quiet during 2 March as the seismic network recorded short-duration harmonic tremors and some discrete low-frequency volcanic earthquakes. This departs from the continuous tremor recorded in the past days during periods of relative quiet. The volcano has apparently entered a phase of lava emission with sporadic episodes of minor ash puffs. Ash and steam emission from both the summit crater and new lava flow deposits produced a haze over the SW sector, particularly in the municipalities of Camalig, Guinobatan, and Ligao. SO2-flux measurements on 2 March yielded a value of 14,500 t/d. Ash clouds derived from the new lava flow deposits apparently produced a significant portion of this emission rate. Ground deformation measurements indicated that the volcano deflated slightly following the 1 March ash ejections.
Lava emission with sporadic episodes of minor ash puffs dominated the eruptive activity on 3 March. This relatively quiet state was reflected in the low-level but significant seismicity comprised by short-duration harmonic tremors and some discrete low-frequency volcanic earthquakes. Thick clouds covered the summit area, but below the cloud line and on the middle and lower slopes of the volcano ash clouds and steam emanated from the new lava flows and pyroclastic-flow deposits. A high emission rate of 8,900 t/d SO2 was measured by COSPEC. Much of the ash and steam clouds resulting from this degassing drifted to the W and SW sections of the volcano due to prevailing winds. The haze produced by fine ash suspended in the air temporarily precluded ground deformation measurements.
Potential exists for hot lahar flows due to the presence of highly erodible pyroclastic deposits, which may be remobilized during heavy rainfall. Gullies with confirmed pyroclastic-flow deposits in their headwaters, which may therefore be sites for future lahars, are the Mabinit and Matanag river channels in Legaspi City, Miisi channel in Daraga, Basud-Lidong channel in Sto. Domingo, San Vicente and Buang channels in Tabaco, and the Bulawan channel in Malilipot.
Short-duration harmonic tremors and low-frequency volcanic earthquakes continued on 4 March. This type of seismicity indicated that eruptive activity was limited to quiet lava emission. Ground deformation measurements showed that the volcano was still inflated in its lower portion, while the SO2 emission rate was determined to be at a minimum of 12,100 t/d. Preliminary estimates of the volume of deposits emplaced by the eruptions yielded at least 40 million cubic meters of lava flow and pyroclastic flow deposits. Lava flow deposits account for the major proportion of this estimate.
Activity for the next day was mainly characterized by gentle outpouring of lava. During cloudbreaks the night of 5-6 March, intense glow from the crater and from some portions of the advancing lava flow along the upper and middle Bonga gully were evident. Rockfalls and minor collapses along the length of the flow contributed to some localized ash and steam emission. However, the majority of the thick volcanic plume came from the summit crater which emitted about 8,300 t/d of SO2. The PHIVOLCS seismic network continued to record short-duration harmonic tremors and low-frequency volcanic earthquakes. Ground deformation measurements showed some slight inflation of the volcano on the lower NW flank. The very high sulfur dioxide emission rate, occurrence of tremor and volcanic earthquakes associated with magma ascent, and slight swelling of the Mayon edifice indicate that some ascent of magma is still ongoing. Due to cessation of explosive eruptions, the sky W and SW of the volcano was generally clear of ash.
During 6 March the volcano exhibited quiet lava effusion accompanied by intense crater glow and rolling incandescent materials along the upper and middle reaches of the Bonga Gully. Moderate to strong emission of steam drifted generally to the N from the summit crater. The high steam output also yielded an elevated SO2 emission rate of at least 8,800 t/d. Seismic activity consisted of 11 low-frequency volcanic earthquakes and 25 episodes of short-duration tremors. Slight inflation of the lower NW flank of the volcano continued.
At 0746 on 7 March, a parallel collapse of the new lava flow deposit in the upper middle slopes produced a voluminous secondary pyroclastic flow. The billowing ash cloud descended the Bonga Gully to the SE.
The seismic network recorded low-frequency volcanic earthquakes and short-duration harmonic tremors on 7 March. The measured SO2 gas emission rate of 3,900 t/d, although low compared to recent measurements, was still well above the volcano's baseline level. Likewise, ground deformation surveys showed that the edifice was slightly inflated. At night on 7-8 March, when the volcano's summit area was visible, intense crater glow continued.
A PHIVOLCS report on the morning of 9 March noted that since the last eruption of 1 March, a waning trend in Mayon's overall activity has been evident. The number of volcanic earthquakes decreased and remained at unremarkable levels. In addition, tremor associated with emission of lava from the crater ceased. Seismic activity only reflected sporadic surface disturbances such as occasional rockfalls caused by oversteepened slopes. The Electronic Distance Meter (EDM) and precise leveling surveys also showed a return to the baseline levels, indicating a probable deflation of the edifice. Mayon continued to vent a large amount of steam, but the SO2 component measured by COSPEC had decreased. Although the summit and isolated spots on the new lava flow deposits continued to glow at night, this incandescence was attributed to residual heat.
In view of these recent developments at Mayon, PHIVOLCS lowered the volcano status to Alert Level 4. On 9 March the 8-km-radius extended danger zone in the SE quadrant was reduced to 7 km. PHIVOLCS emphasized that the 6-km radius Permanent Danger Zones should remain evacuated at all times because of instability of new pyroclastic and lava deposits that may be dislodged towards the lower slopes with resultant secondary explosions and life-threatening secondary pyroclastic flows.
Geologic Background. Symmetrical Mayon, which rises above the Albay Gulf NW of Legazpi City, is the most active volcano of the Philippines. The steep upper slopes are capped by a small summit crater. Recorded eruptions since 1616 CE range from Strombolian to basaltic Plinian, with cyclical activity beginning with basaltic eruptions, followed by longer periods of andesitic lava flows. Eruptions occur predominately from the central conduit and have also produced lava flows that travel far down the flanks. Pyroclastic density currents and mudflows have commonly swept down many of the approximately 40 ravines that radiate from the summit and have often damaged populated lowland areas. A violent eruption in 1814 killed more than 1,200 people and devastated several towns.
Information Contacts: Raymundo S. Punongbayan and Ernesto Corpuz, Philippine Institute of Volcanology and Seismology (PHIVOLCS), C.P. Garcia St. Diliman, Quezon City Philippines (URL: http://www.phivolcs.dost. gov.ph/).
San Cristobal (Nicaragua) — February 2000 Cite this Report
San Cristobal
Nicaragua
12.702°N, 87.004°W; summit elev. 1745 m
All times are local (unless otherwise noted)
Continued frequent eruptions and ashfall through December 1999
A new eruption began at about 2200 on 20 November 1999 (figure 4) with a series of explosions that caused ashfall near the volcano. More than 100 people were evacuated from the Hacienda Las Rojas. A commercial airline pilot reported that the ash plume reached about 2.4-3 km altitude. As of the start of this increased activity, the Nicaraguan Institute of Territorial Studies (INETER) reported that volcanic tremor and sporadic minor ash emissions had occurred for more than a year.
The last previous significant eruptive activity at San Cristóbal began on the night of 19-20 May 1997 and spread fine ash on Chinandega, 18 km W (BGVN 22:05 and 22:06). On 30 October 1998 earth movements on the S flank of Casita volcano (4 km ESE of San Cristóbal) resulted from heavy hurricane rains, killing an estimated 1,560-1,680 people, with hundreds more displaced and several towns and settlements destroyed (BGVN 23:10). The following is based on INETER reports from November through the end of February 2000, with additional information based on crater visits in January and February and satellite imagery of a large eruption plume on 21 February.
Seismic tremor increased during the night of 19-20 November and quickly reached a maximum that was not matched at least through the end of December (figure 5). Tremor amplitude declined throughout 20 November, and then remained at levels of ~25-60% of the 20 November peak until a volcano-tectonic earthquake on 27 November.
Small explosions preceded emissions on 22 November. Activity decreased after the initial eruptions, but a lack of winds caused the ash and gases to remain near the volcano. Concentrations of CO2 and SO2 measured on 22 November at three different sites exceeded the permissible limits established by the World Health Organization (WHO). INETER inspections showed that expelled gas and ash have been accumulating in local communities. However, on 23 November a slight increase in the wind speed facilitated the transport of volcanic material as far as the city of Chinandega 10 km to the SW. That day an observation post was established near the summit of Casita, where INETER staff could make visual observations and measurements of eruption column heights.
Ash emanations during 24-27 November varied in frequency, and the observer at Casita saw ash columns to heights of 100-300 m above the crater during the same period. At 0920 on 27 November a small earthquake (M 2.3) occurred ~2 km underneath the volcano. Volcanic gas monitoring on 24 November showed a significant increase in the concentrations of SO2 in the San Rafael and Las Rojas areas. However, the concentration of CO2 showed a diminution compared to 23 November. Concentrations of SO2 and CO2 decreased again on the 25th, although in some communities the level of SO2 remained unchanged. A correlation spectrometer (COSPEC) for measuring SO2 flux was brought from the INSIVUMEH of Guatemala on 26 November, with the support of the Coordination Center for the Prevention of Natural Disasters in Central America (CEPREDENAC).
Seismic tremor amplitude remained fairly stable, around 30-50% of the 20 November peak, during 26 November through 13 December. Seismicity fluctuated, with periods of higher and lower amplitude; a corresponding fluctuation in the ash-and-gas emissions was noted. The amounts of gases emitted by the volcano also showed this correlation, with SO2-flux values that oscillated between 100 and 1,000 tons/day.
By 2 December ash emissions had decreased considerably, although low-level gas emissions remained continuous. There was a slight increase in emissions on 4 December, but activity remained low through the 13th. Higher wind speeds during this period helped keep gas concentrations low in local towns. Seismic tremor began to rise the night of 12-13 December to a high of 70% of the previous peak. On 14 December small amounts of volcanic ash fell in Chinandega. Tremor amplitude returned to ~40% of the peak on 15 December, then decreased to 20-30% of the peak by dawn on the 16th.
Lahars on 16 December 1999. The Civil defense and local residents reported that a mass-flow on the NW side of the volcano on 16 December stopped ~2 km from populated areas. On 21 December, two specialists visited the affected Rancherías region NW of San Cristóbal in the Municipality of Chinandega (Dpto. Chinandega) to investigate the event. According to the meteorological station of Chinandega, 7.9 mm of rain fell from 1824 until 2012; in the first hour strong rains were reported, and from 1920 there were light to moderate rains. Previous strong rains have produced erosion gullies on the slopes of the volcano.
Due to the recent eruptive activity, large amounts of ash and lapilli had accumulated in these gullies; these were mobilized by the rains into lahars. Several sources were identified between 1,400 and 1,500 m elevation. The mobilized material formed a debris flow containing ash and lapilli that carried blocks varying from centimeters to meters in size. The flow quickly cemented into an extremely hard deposit. The material eroded from the highest slopes of San Cristóbal moved along one main gully, leaving a very deep channel and, below 500 m elevation, an extended lobate deposit that reached within ~2 km of the community of Ranchería. The main flow had a length of ~7 km and variable widths between 10 and 150 m; deposit thickness varied from less than 10 cm up to 2 m at the terminus.
Similar events happened on the S slope of the volcano that same day. At least five lahars were visible from the Leon-Chinandega highway.
Minor ash emissions continue. Activity remained consistently low and unchanged until noon on 28 December when earthquakes began. These were centered SE of Casita with magnitudes between 2 and 3.5 and depths of a few kilometers. The occurrence of earthquakes near San Cristóbal is a new phenomenon in the current eruption. Ash emission also increased and small amounts fell in Chinandega.
Seismic tremor on 29 December increased to as high as 40% of the 20 November peak. Small amounts of ash fell in Chinandega and El Viejo. No significant changes in activity were noted on 30 December. Moderate ashfalls were reported near the volcano and in Chinandega. Depending on the wind direction, ashfall sporadically reached the communities of Higueral, 10.5 km NE, and Pelona, 9 km E.
Activity during January-February 2000. Small explosions continued during January with ash and gas emissions (figure 6) and 4,444 registered volcanic earthquakes. Seismicity was higher in the first 17 days of January, but the seismic tremor (RSAM) stayed constant. Between 17 and 23 February activity increased, causing significant ashfall in Chinandega. The number of registered volcanic earthquakes in February was of 1,784.
Alain Creusot visited the crater on 10 January and observed rhythmic, phreatic explosions, which included rock ejections and ash columns from three vents. At 0600 that day, a violent explosion threw bombs high above the crater rim. Creusot visited the crater again on 4 February and observed a 50-cm-deep ash layer over the crater area and 30-cm depths over the entire summit. Rhythmic phreatic explosions continued and new bombs were observed and sampled on the E crater rim (figure 7). These bombs apparently originated from a Strombolian explosion on 30 January. A third visit on 20 February showed a 1-m-deep ash layer in the crater area and 50-cm depths elsewhere in the summit area. Rocks 50 cm in size had been ejected.
Benjamin van Wyk de Vries noted that GOES images on 21 February showed a long plume extending from San Cristóbal to ~100 km over the Pacific Ocean. He also reported that this was the strongest ash eruption at San Cristóbal since the 1997 eruption. At 1100 on 24 February, a violent explosion threw bombs over the entire summit. A similar explosion and effects occurred at 0900 on the 25th.
Geologic Background. The San Cristóbal volcanic complex, consisting of five principal volcanic edifices, forms the NW end of the Marrabios Range. The symmetrical 1745-m-high youngest cone, named San Cristóbal (also known as El Viejo), is Nicaragua's highest volcano and is capped by a 500 x 600 m wide crater. El Chonco, with several flank lava domes, is located 4 km W of San Cristóbal; it and the eroded Moyotepe volcano, 4 km NE of San Cristóbal, are of Pleistocene age. Volcán Casita, containing an elongated summit crater, lies immediately east of San Cristóbal and was the site of a catastrophic landslide and lahar in 1998. The Plio-Pleistocene La Pelona caldera is located at the eastern end of the complex. Historical eruptions from San Cristóbal, consisting of small-to-moderate explosive activity, have been reported since the 16th century. Some other 16th-century eruptions attributed to Casita volcano are uncertain and may have been from other Marrabios Range volcanoes.
Information Contacts: Wilfried Strauch and Virginia Tenorio, Dirección General de Geofísica, Instituto Nicaragüense de Estudios Territoriales (INETER), Apartado 1761, Managua, Nicaragua (URL: http://www.ineter.gob.ni/); Alain Creusot, Instituto Nicaraguense de Energía, Managua, Nicaragua (URL: http://www.ine.gob.ni/); Benjamin van Wyk de Vries, Departement des Sciences de la Terre, Universite Blaise Pascal, 63038 Clermont-Ferrand, France.
Shishaldin (United States) — February 2000 Cite this Report
Shishaldin
United States
54.756°N, 163.97°W; summit elev. 2857 m
All times are local (unless otherwise noted)
Small phreatic explosions during September 1999-January 2000
The Alaska Volcano Observatory (AVO) reported on 21 January 2000 that investigations of recent seismic data had revealed evidence for small explosions at Shishaldin. Later detailed study of the seismic records showed that the activity may have begun in as early as late September. The numbers of explosions varied from several to over 200/day, but no steam or ash plumes were observed by airborne or ground observers. Also, no thermal anomaly was observed in satellite imagery, indicating that lava had not reached the surface. It was thought that the explosions were phreatic, caused by the flashing of water to steam; these events may represent a local hazard within a few hundred meters of the vent but do not pose a hazard to aircraft. Small explosions continued at a similar rate through 28 January.
Small low-frequency seismic events, present at Shishaldin since June 1999, gradually increased in amplitude after 28 January, with a noticeable increase during 2-3 February. Seismic data continued to show the presence of small phreatic explosions. Reports of steam plumes were received during the week ending on 2 February, with heights reaching as high as ~900 m above the summit. However, no thermal anomaly was observed in satellite imagery and no seismic tremor was identified; both were seen prior to the last eruptive episode in April and May 1999 (BGVN 24:03, 24:04, 24:08). Due to the increased activity, AVO raised the Level of Concern Color Code to Yellow on 3 February, indicating that the volcano is restless and an eruption may occur.
No appreciable number of seismic events were detected after 4 February; that was also the last day that small explosions were observed. Small low-frequency seismic events continued through 11 February, but at a slower rate and slightly lower amplitude. By 18 February seismic activity had declined significantly with no thermal anomalies or observations of unusual activity, so the hazard status was changed back to Green, indicating normal seismicity and surface activity.
Small low-frequency seismic events and very low-level tremor was recorded through 3 March, although at or below the levels observed in the months prior to the 19 April 1999 eruption. Low-level seismicity continued through the end of March. Vigorous steaming was reported in the second half of March, but no thermal anomaly observed in satellite imagery.
Geologic Background. The symmetrical glacier-covered Shishaldin in the Aleutian Islands is the westernmost of three large stratovolcanoes in the eastern half of Unimak Island. The Aleuts named the volcano Sisquk, meaning "mountain which points the way when I am lost." Constructed atop an older glacially dissected edifice, it is largely basaltic in composition. Remnants of an older edifice are exposed on the W and NE sides at 1,500-1,800 m elevation. There are over two dozen pyroclastic cones on its NW flank, which is covered by massive aa lava flows. Frequent explosive activity, primarily consisting of Strombolian ash eruptions from the small summit crater, but sometimes producing lava flows, has been recorded since the 18th century. A steam plume often rises from the summit crater.
Information Contacts: Alaska Volcano Observatory (AVO), a cooperative program of a) U.S. Geological Survey, 4200 University Drive, Anchorage, AK 99508-4667, USA (URL: http://www.avo.alaska.edu/), b) Geophysical Institute, University of Alaska, PO Box 757320, Fairbanks, AK 99775-7320, USA, and c) Alaska Division of Geological & Geophysical Surveys, 794 University Ave., Suite 200, Fairbanks, AK 99709, USA.
Telica (Nicaragua) — February 2000 Cite this Report
Telica
Nicaragua
12.606°N, 86.84°W; summit elev. 1036 m
All times are local (unless otherwise noted)
Lava lake seen in August; sporadic ash explosions August-December
As of late November 1999, microseismic activity had been occurring at Telica for more than a year. There were phreatic explosions in May and June 1999 (BGVN 24:06). An eruptive phase began in August 1999, generally producing only sporadic small and local ash falls. Intermittent gas-and-ash emissions continued to be reported through December 1999. One of the more vigorous events took place on 29 December, sending ash to several kilometers altitude and inducing falls detected 45 km away.
A noteworthy event began around 0200 on 10 August. Tremor and earthquakes increased abruptly. Small explosions took place in the crater, expelling gas and volcanic ash. Ash fell ~20 km WSW of Telica in the city of Chichigalpa. An interval of relative calm on 12 August lasted approximately one hour. It ended with the gas explosions and ash outbursts starting again at 1315 and continuing until 1515 with ongoing degassing afterwards. According to the summed seismic amplitudes (RSAM values), the greatest activity was between 2000 on 10 August until the morning of 11 August.
Observers saw a lava lake in the crater on 18 August. On that day, INETER's Wilfried Strauch and Armando Saballos, along with visiting North American specialists, climbed Telica to install GPS equipment. Taking advantage of periods of low degassing, they managed to observe the bottom of the new inner crater that had formed in the last few months (figure 11). To their surprise, they saw a lava lake there. In addition they listened to forceful jetting noises probably generated by the water contact with heated material.
On 21 August INETER's Virginia Tenorio and Julio Alvarez climbed the volcano and saw that the inner crater had enlarged; and, in addition they again heard jet-engine-like noises. Abundant escaping gases thwarted views into the inner crater so the visitors could not assess whether a lava lake remained. The same day between 0800 and 0900, residents who live on the SE flank of the volcano felt two rumblings from the volcano. Possibly, this caused the inner crater to enlarge even more.
Several days later seismic tremor increased, but the number of microearthquakes fluctuated, first dropping, then increasing again on the 25th. On 29 August seismic tremor began to drop substantially. Then, however, the number of microearthquakes increased. Telica's eruptive activity is typically associated with slightly increased tremor and over 200 to 300 microearthquakes per day.
During September, a month with 2,116 microearthquakes, gas emanations prevailed until the 10th. A seismic swarm at the beginning of October was followed by a series of explosions with tephra expulsions during 3-15 October. On the 5th, INETER staff on the crater's edge witnessed the discharge of both ash and lava (presumably in the form of bombs). The last similar lava-bearing explosion of this type was in 1988 (SEAN 13:01). On the 12th, W-flank residents reported that on the previous day (at about 1400 on the 11th) they had felt an unusually strong explosion shaking their houses. Later, they witnessed the fall of very fine gray ash. Observers also saw that the inner crater had grown wider than when seen in September. By 12 October the seismic amplitude had decreased to background levels. The number of earthquakes registered for October was 888.
During November the earthquake sum was comparatively low, 144, but that did not signify volcanic quiet. On 19 November, INETER's Julio Alvarez and Virginia Tenorio skirted the volcano along the León-Chinandega highway where they saw an ash column. Erminio Rojas, a farmer on Telica's S flank, told them that in the past few weeks the volcano had almost constantly been expelling gray ash. On 17 November he witnessed a very large explosion that caused an ashfall deposit reaching 2.5 cm thickness near his house, damaging his apples and beans. The observers further noticed that on the crater's SW a possible collapse feature had developed. Burned ash-covered plants lay in the area near the edge of the crater. Ash discharges on 17 November occasionally emitted a noise similar to a gunshot.
On 24 November, Civil defense of León reported a black cloud above Telica. An unusual seismic signal on 28 November prompted a visit to Telica by Tenorio and Strauch, along with Rafael Abelia of the Institute of Geomineras Investigations of Madrid, Spain. When they arrived at the volcano, the group found that a zone of disruption had spread over a great part of the N crater wall, and the edge of the crater was covered with a thick layer of fine dust. This indicated to them that there was no explosion and the cloud that the Civil Defense observed was due to the collapse of the N crater wall. COSPEC measurements conducted on 29 November indicated that the volcano was producing between 50 and 500 metric tons/day of SO2 per day.
During December 1999 there were 1,085 volcanic earthquakes, of which, four were located. INETER's seismic network located several earthquakes that took place underneath the volcano on 14 December with magnitudes between 2 and 2.5. During December, tremor stayed low until the 24th, when it was punctuated by sporadic degassing and smaller ash-bearing discharges. On the 25th, tremor began to rise slowly; on the 28th there occurred an abrupt increase in the seismic signal, four-fold larger than seen during previous days. The morning of 29 December seismicity was high. The same day reports were received describing almost continuous ash-bearing explosions, with WSW-directed tephra falls.
Two large explosions at 0900 on 29 December sent ash to heights of more than 1,000 m above the crater. Besides affecting cities adjacent the volcano, ash was later known to have affected the cities of Posoltega (~16 km SW), Chichigalpa (20 km WSW), Quezalguaque (20 km SSW), Chinandega (35 km WSW), and Corinto (~45 km SW). INETER noted that civil-aviation pilots reported that ash rose up to 5 km, although whether this was an altitude or the height over the 1-km-tall volcano remained undisclosed. Tremor initially stayed high on 30 December but dropped on 31 December. Activity continued into January 2000.
Geologic Background. Telica, one of Nicaragua's most active volcanoes, has erupted frequently since the beginning of the Spanish era. This volcano group consists of several interlocking cones and vents with a general NW alignment. Sixteenth-century eruptions were reported at symmetrical Santa Clara volcano at the SW end of the group. However, its eroded and breached crater has been covered by forests throughout historical time, and these eruptions may have originated from Telica, whose upper slopes in contrast are unvegetated. The steep-sided cone of Telica is truncated by a 700-m-wide double crater; the southern crater, the source of recent eruptions, is 120 m deep. El Liston, immediately E, has several nested craters. The fumaroles and boiling mudpots of Hervideros de San Jacinto, SE of Telica, form a prominent geothermal area frequented by tourists, and geothermal exploration has occurred nearby.
Information Contacts: Wilfried Strauch and Virginia Tenorio, Dirección General de Geofísica, Instituto Nicaragüense de Estudios Territoriales (INETER), Apartado 1761, Managua, Nicaragua (URL: http://www.ineter.gob.ni/).
Terceira (Portugal) — February 2000 Cite this Report
Terceira
Portugal
38.73°N, 27.32°W; summit elev. 1023 m
All times are local (unless otherwise noted)
Activity in 1999; submarine eruption plume during January-February 2000
The submarine eruption that started on December 1998 (BGVN 24:01 and 24:03) from multiple vents along the Serreta Volcanic Ridge, about 10 km W of Terceira Island, Azores, continued through March 2000. Vents along the ridge were very active between December 1998 and September 1999. Activity then declined to very low levels with rare surface manifestations through December 1999. Activity increased again in late January 2000.
Several times during 1999 basaltic lava balloons were observed floating in the eruptive area. These "balloons" are very hot, gas-rich, lava fragments produced from small submarine lava lakes/fountains. During ascent to the surface, magmatic gas exsolves from the hot fragments, increasing the volume of the balloon while the crust is glassy and expansible. Once at the surface, interaction between the hot blocks and seawater produce white steam columns that can be seen from land when meteorological conditions are favorable (figure 5). The blocks eventually sink after the gas escapes.
An oceanographic mission supported by the national Foundation for Science and Technology was carried out in April 1999 to study the geological/geophysical characteristics of the eruption and its impact on local ecosystems. Scientists from the University of Azores, University of Lisbon, University of Algarve, Instituto do Mar, and Instituito Hidrográfico used a remotely operated vehicle that crossed an impressive submarine volcanic plume just above an active eruptive center at about 380 m depth. This plume was formed by volcanic particles of ash and lapilli size along with gas bubbles and lava balloons up to 2 m in diameter.
On 28 January 2000 a yellowish spot was observed at the sea surface above the eruptive area due to the dispersion of a volcanic plume that rose from a new vent located at about 250 m depth (figure 6). The area of water discoloration caused by the plume was visible almost continuously for about a month, reaching a maximum diameter of 8 km on 24 February. The plume was generated by multiple eruptive pulses from different eruptive centers located within a few hundred meters of each other.
Seismicity along the ridge related to the eruption continued through the end of March, but at low levels. Since the beginning of this volcanic crisis the physical and chemical parameters of waters and fumarolic gases from Terceira Island have been monitored, with no changes detected. Another submarine eruption took place in this general location in June 1867. At that time five months of strong seismicity destroyed about 200 houses at Serreta.
Geologic Background. Terceira Island contains multiple stratovolcanoes constructed along a prominent ESE-WNW fissure zone that cuts across the island. Historically active Santa Barbara volcano at the western end of the island is truncated by two calderas, the youngest of which formed about 15,000 years ago. Comenditic lava domes fill and surround the caldera. Pico Alto lies north of the fissure zone in the north-central part of the island and contains a Pleistocene caldera largely filled by lava domes and lava flows. Guilherme Moniz caldera lies along the fissure zone immediately to the south, and 7-km-wide Cinquio Picos caldera is at the SE end of the island. Historical eruptions have occurred from Pico Alto, the fissure zone between Pico Alto and Santa Barbara, and from submarine vents west of Santa Barbara. Most Holocene eruptions have produced basaltic-to-rhyolitic lava flows from the fissure zone.
Information Contacts: J.L. Gaspar, G. Queiroz, J.M. Pacheco, T. Ferreira, R. Coutinho, M.H. Almeida, and N. Wallenstein, Centre of Volcanology of the Azores University (CVUA), Departamento de Geociencias, Rua da Mae de Deus, 9502 Ponta Delgada, Azores, Portugal (URL: http://www.uac.pt/).