Recently Published Bulletin Reports
Agung (Indonesia) Three eruptive events reported in April, May, and December 2022
Tengger Caldera (Indonesia) Minor ash emission in December 2023; persistent weak thermal anomaly in the Bromo crater
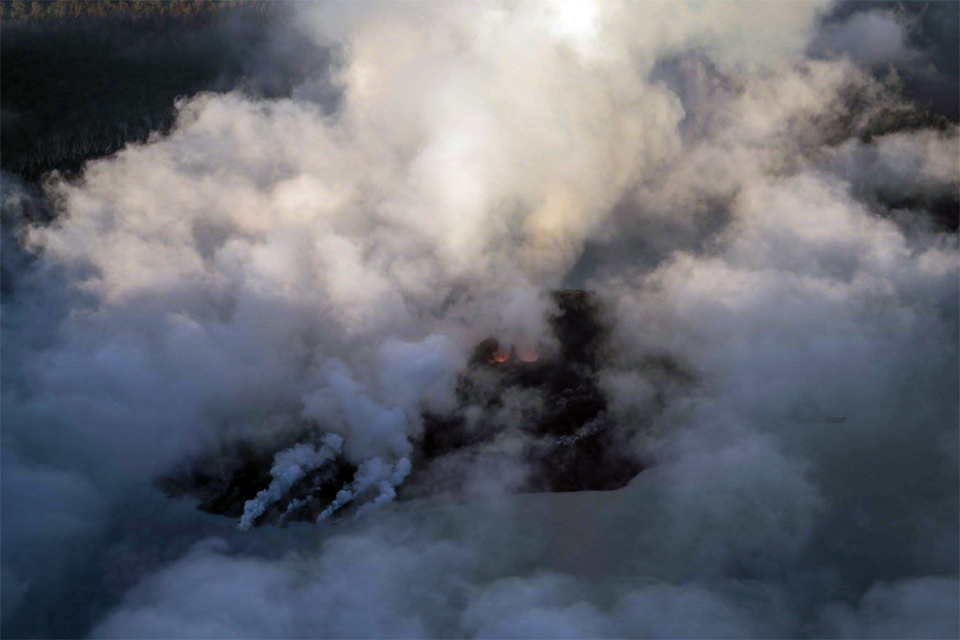
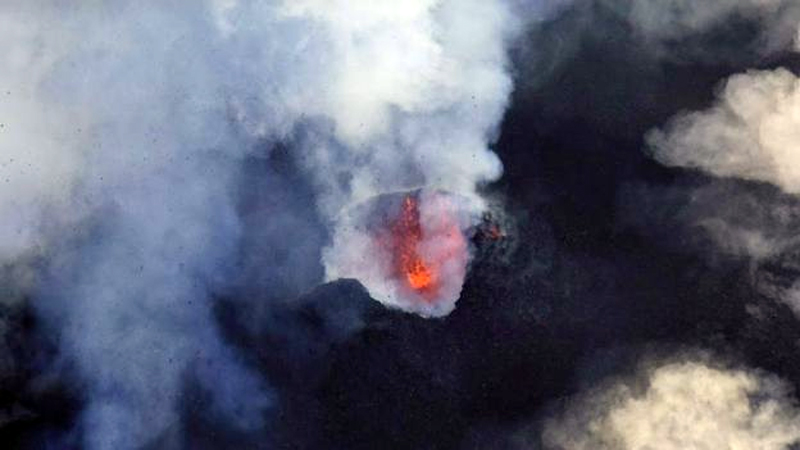
Saunders (United Kingdom) Persistent thermal anomalies from the summit crater lava lake during February 2023-January 2024
Shishaldin (United States) New eruption with significant Strombolian explosions, ash plumes, and ashfall
Ioto (Japan) New eruption with discolored water, ejecta, and floating pumice during October-December 2023
Purace (Colombia) Gas-and-ash emission on 16 November 2023
Etna (Italy) Strombolian explosions, lava fountains, and lava flows during July-August 2023
Suwanosejima (Japan) Eruption plumes, crater incandescence, and occasional explosions during July-October 2023
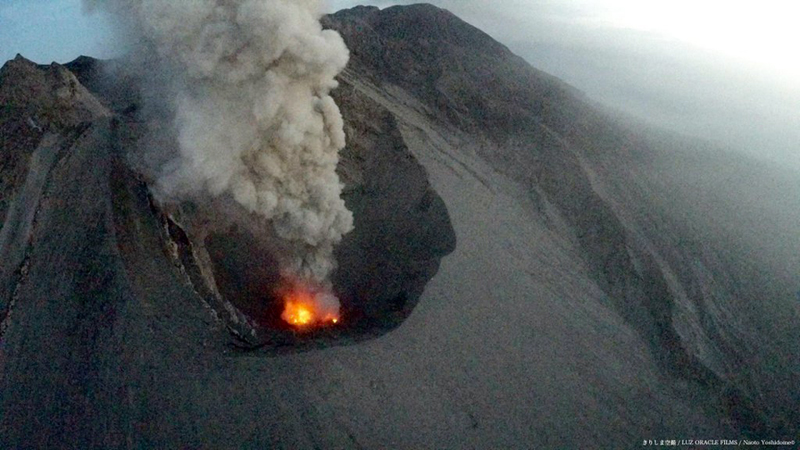
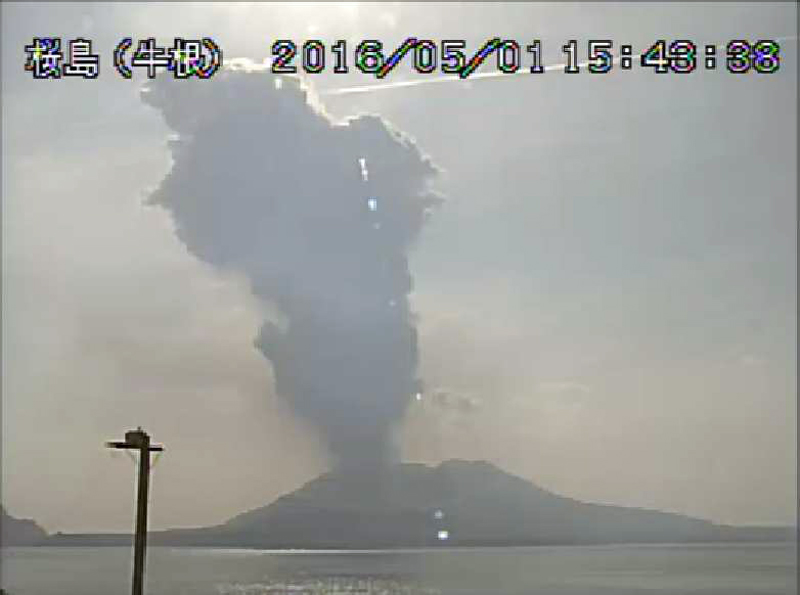
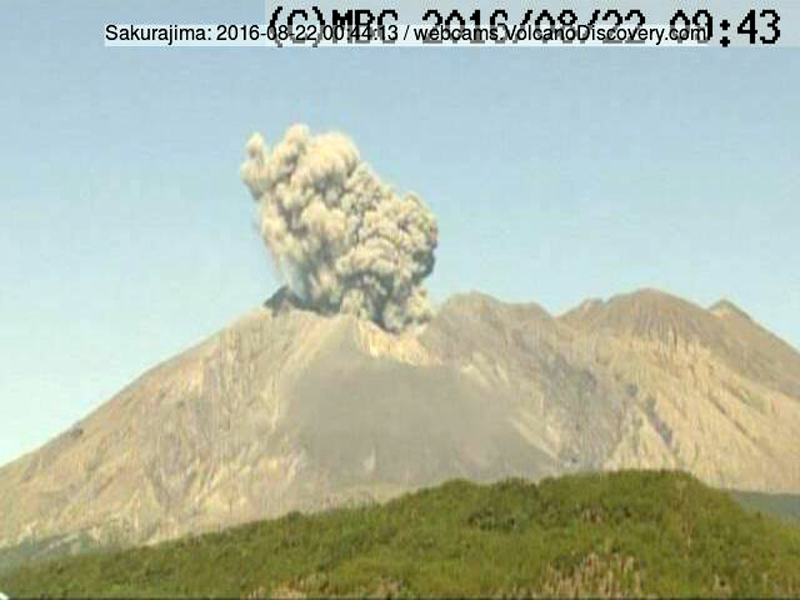
Aira (Japan) Explosions, ash plumes, ash fall, and crater incandescence during July-October 2023
Nishinoshima (Japan) Gray emissions during October 2023
Kilauea (United States) Strong lava fountains, lava flows, and spatter at Halema’uma’u during January-September 2023
Tinakula (Solomon Islands) Continued lava flows and thermal activity during June through November 2023
Agung (Indonesia) — January 2024  Cite this Report
Agung
Indonesia
8.343°S, 115.508°E; summit elev. 2997 m
All times are local (unless otherwise noted)
Three eruptive events reported in April, May, and December 2022
Mount Agung, located on the E end of the island of Bali, Indonesia, rises above the SE rim of the Batur caldera. The summit area extends 1.5 km E-W, with the highest point on the W and a steep-walled 800-m-wide crater on the E. Recorded eruptions date back to the early 19th century. A large and deadly explosive and effusive eruption occurred during 1963-64, which was characterized by voluminous ashfall, pyroclastic flows, and lahars that caused extensive damage and many fatalities. More recent activity was documented during November 2017-June 2019 that consisted of multiple explosions, significant ash plumes, lava flows at the summit crater, and incandescent ejecta. This report covers activity reported during April-May 2022 and December 2022 based on data from the Darwin Volcanic Ash Advisory Center (VAAC).
Activity during 2022 was relatively low and mainly consisted of a few ash plumes during April-May and December. An ash plume on 3 April rising to 3.7 km altitude (700 m above the summit) and drifting N was reported in a Darwin VAAC notice based on a ground report, with ash seen in HIMAWARI-8 visible imagery. Another ash plume was reported at 1120 on 27 May that rose to 5.5 km altitude (2.5 m above the summit); the plume was not visible in satellite or webcam images due to weather clouds. An eruption was reported based on seismic data at 0840 on 13 December, with an estimated plume altitude of 3.7 km; however, no ash was seen using satellite imagery in clear conditions before weather clouds obscured the summit.
Geologic Background. Symmetrical Agung stratovolcano, Bali's highest and most sacred mountain, towers over the eastern end of the island. The volcano, whose name means "Paramount," rises above the SE rim of the Batur caldera, and the northern and southern flanks extend to the coast. The summit area extends 1.5 km E-W, with the high point on the W and a steep-walled 800-m-wide crater on the E. The Pawon cone is located low on the SE flank. Only a few eruptions dating back to the early 19th century have been recorded in historical time. The 1963-64 eruption, one of the largest in the 20th century, produced voluminous ashfall along with devastating pyroclastic flows and lahars that caused extensive damage and many fatalities.
Information Contacts: Darwin Volcanic Ash Advisory Centre (VAAC), Bureau of Meteorology, Northern Territory Regional Office, PO Box 40050, Casuarina, NT 0811, Australia (URL: http://www.bom.gov.au/info/vaac/).
Tengger Caldera (Indonesia) — February 2024 Cite this Report
Tengger Caldera
Indonesia
7.942°S, 112.95°E; summit elev. 2329 m
All times are local (unless otherwise noted)
Minor ash emission in December 2023; persistent weak thermal anomaly in the Bromo crater
Tengger Caldera, located at the N end of a volcanic massif in Indonesia’s East Java, consists of five overlapping stratovolcanoes. The youngest and only active cone in the 16-km-wide caldera is Bromo, which typically produces gas-and-steam plumes, occasional ash plumes and explosions, and weak thermal signals (BGVN 44:05, 47:01). This report covers activity during January 2022-December 2023, consisting of mostly white gas-and-steam emissions and persistent weak thermal anomalies. Information was provided by the Pusat Vulkanologi dan Mitigasi Bencana Geologi (PVMBG, also known as Indonesian Center for Volcanology and Geological Hazard Mitigation, CVGHM) and satellite imagery. The Alert Level remained at 2 (on a scale of 1-4), and visitors were warned to stay at least 1 km from the crater.
Activity was generally low during the reporting period, similar to that in 2021. According to almost daily images from MAGMA Indonesia (a platform developed by PVMBG), white emissions and plumes rose from 50 to 900 m above the main crater during this period (figure 24). During several days in March and June 2022, white plumes reached heights of 1-1.2 km above the crater.
After an increase in activity at 2114 on 3 February 2023, a PVMBG team that was sent to observe white emissions rising as high as 300 m during 9-12 February and heard rumbling noises. A sulfur dioxide odor was also strong near the crater and measurements indicated that levels were above the healthy (non-hazardous) threshold of 5 parts per million; differential optical absorption spectroscopy (DOAS) measurements indicated an average flux of 190 metric tons per day on 11 February. Incandescence originating from a large fumarole in the NNW part of the crater was visible at night. The team observed that vegetation on the E caldera wall was yellow and withered. The seismic network recorded continuous tremor and deep and shallow volcanic earthquakes.
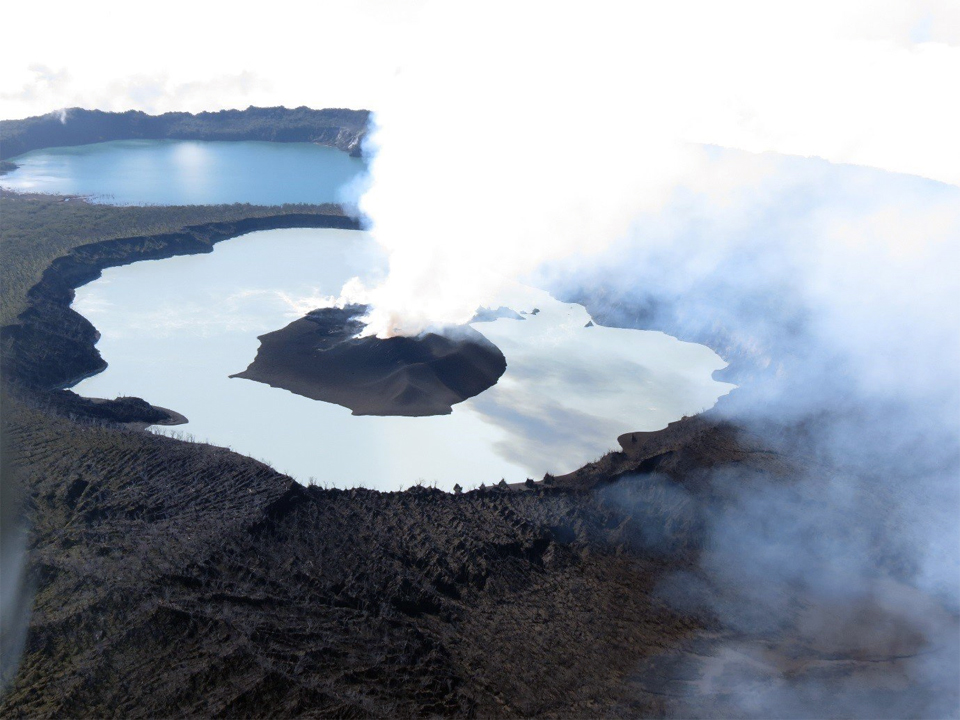
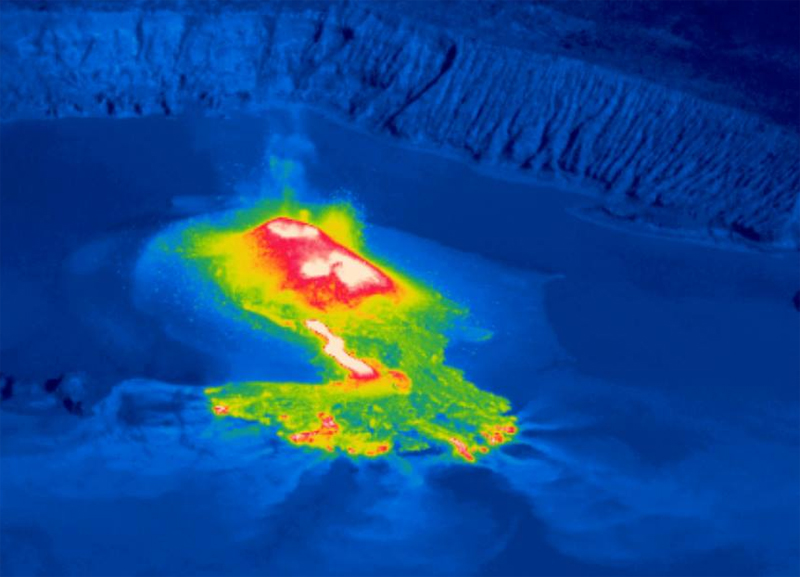
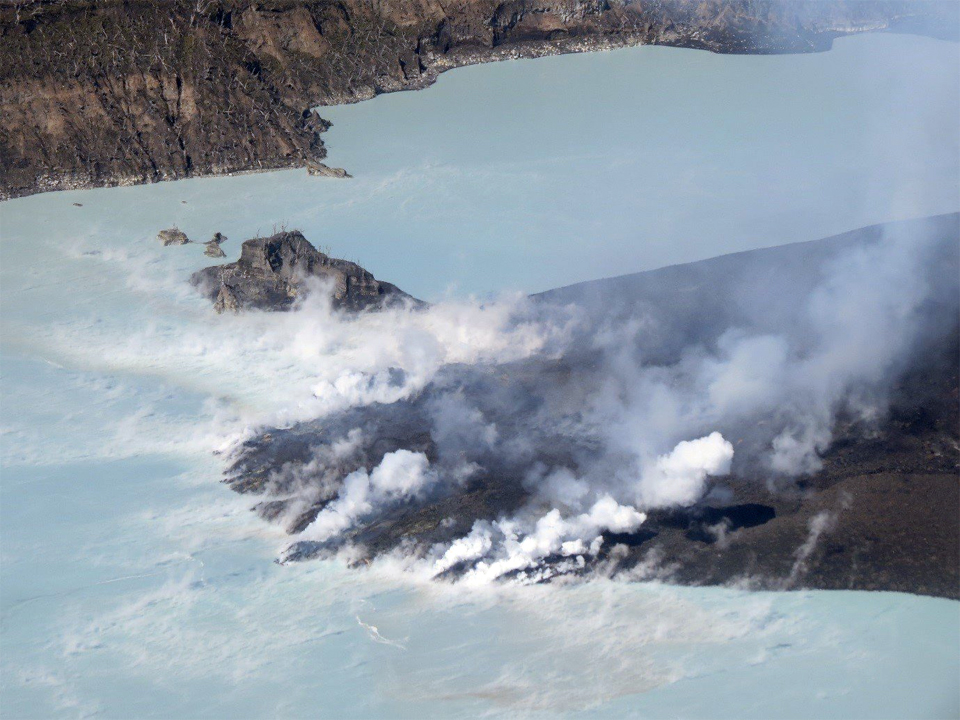
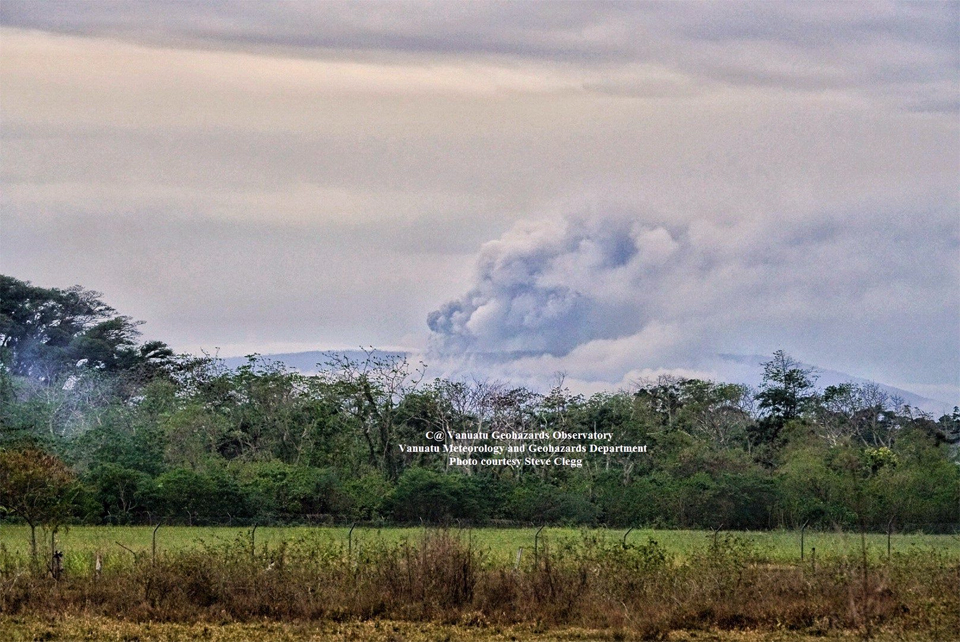
According to a PVMBG press release, activity increased on 13 December 2023 with white, gray, and brown emissions rising as high as 900 m above Bromo’s crater rim and drifting in multiple directions (figure 25). The report noted that tremor was continuous and was accompanied in December by three volcanic earthquakes. Deformation data indicated inflation in December. There was no observable difference in the persistent thermal anomaly in the crater between 11 and 16 December 2023.
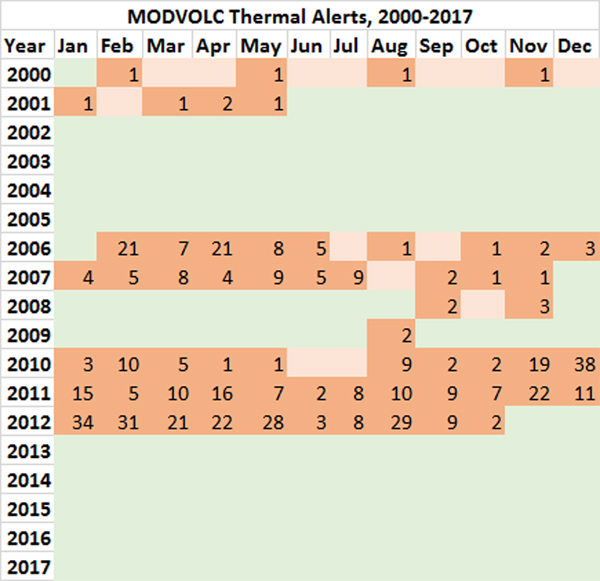
All clear views of the Bromo crater throughout this time, using Sentinel-2 infrared satellite images, showed a weak persistent thermal anomaly; none of the anomalies were strong enough to cause MODVOLC Thermal Alerts. A fire in the SE part of the caldera in early September 2023 resulted in a brief period of strong thermal anomalies.
Geologic Background. The 16-km-wide Tengger caldera is located at the northern end of a volcanic massif extending from Semeru volcano. The massive volcanic complex dates back to about 820,000 years ago and consists of five overlapping stratovolcanoes, each truncated by a caldera. Lava domes, pyroclastic cones, and a maar occupy the flanks of the massif. The Ngadisari caldera at the NE end of the complex formed about 150,000 years ago and is now drained through the Sapikerep valley. The most recent of the calderas is the 9 x 10 km wide Sandsea caldera at the SW end of the complex, which formed incrementally during the late Pleistocene and early Holocene. An overlapping cluster of post-caldera cones was constructed on the floor of the Sandsea caldera within the past several thousand years. The youngest of these is Bromo, one of Java's most active and most frequently visited volcanoes.
Information Contacts: Pusat Vulkanologi dan Mitigasi Bencana Geologi (PVMBG, also known as Indonesian Center for Volcanology and Geological Hazard Mitigation, CVGHM), Jalan Diponegoro 57, Bandung 40122, Indonesia (URL: http://www.vsi.esdm.go.id/); MAGMA Indonesia, Kementerian Energi dan Sumber Daya Mineral (URL: https://magma.esdm.go.id/v1); Copernicus Browser, Copernicus Data Space Ecosystem, European Space Agency (URL: https://dataspace.copernicus.eu/browser/); Hawai'i Institute of Geophysics and Planetology (HIGP) - MODVOLC Thermal Alerts System, School of Ocean and Earth Science and Technology (SOEST), Univ. of Hawai'i, 2525 Correa Road, Honolulu, HI 96822, USA (URL: http://modis.higp.hawaii.edu/).
Saunders (United Kingdom) — February 2024 Cite this Report
Saunders
United Kingdom
57.8°S, 26.483°W; summit elev. 843 m
All times are local (unless otherwise noted)
Persistent thermal anomalies from the summit crater lava lake during February 2023-January 2024
Saunders is one of eleven islands that comprise the South Sandwich Islands in the South Atlantic. The active Mount Michael volcano has been in almost continuous eruption since November 2014 (BGVN 48:02). Recent activity has resulted in intermittent thermal anomalies and gas-and-steam emissions (BGVN 47:03, 48:02). Visits are infrequent due to its remote location, and cloud cover often prevents satellite observations. Satellite thermal imagery and visual observation of incandescence during a research expedition in 2019 (BGVN 28:02 and 44:08) and a finding confirmed by a National Geographic Society research team that summited Michael in November 2022 reported the presence of a lava lake.
Although nearly constant cloud cover during February 2023 through January 2024 greatly limited satellite observations, thermal anomalies from the lava lake in the summit crater were detected on clear days, especially around 20-23 August 2023. Anomalies similar to previous years (eg. BGVN 48:02) were seen in both MIROVA (Middle InfraRed Observation of Volcanic Activity) data from MODIS instruments and in Sentinel 2 infrared imagery. The only notable sulfur dioxide plume detected near Saunders was on 25 September 2023, with the TROPOMI instrument aboard the Sentinel-5P satellite.
Geologic Background. Saunders Island consists of a large central volcanic edifice intersected by two seamount chains, as shown by bathymetric mapping (Leat et al., 2013). The young Mount Michael stratovolcano dominates the glacier-covered island, while two submarine plateaus, Harpers Bank and Saunders Bank, extend north. The symmetrical Michael has a 500-m-wide summit crater and a remnant of a somma rim to the SE. Tephra layers visible in ice cliffs surrounding the island are evidence of recent eruptions. Ash clouds were reported from the summit crater in 1819, and an effusive eruption was inferred to have occurred from a N-flank fissure around the end of the 19th century and beginning of the 20th century. A low ice-free lava platform, Blackstone Plain, is located on the north coast, surrounding a group of former sea stacks. A cluster of cones on the SE flank, the Ashen Hills, appear to have been modified since 1820 (LeMasurier and Thomson, 1990). Analysis of satellite imagery available since 1989 (Gray et al., 2019; MODVOLC) suggests frequent eruptive activity (when weather conditions allow), volcanic clouds, steam plumes, and thermal anomalies indicative of a persistent, or at least frequently active, lava lake in the summit crater. Due to this observational bias, there has been a presumption when defining eruptive periods that activity has been ongoing unless there is no evidence for at least 10 months.
Information Contacts: MIROVA (Middle InfraRed Observation of Volcanic Activity), a collaborative project between the Universities of Turin and Florence (Italy) supported by the Centre for Volcanic Risk of the Italian Civil Protection Department (URL: http://www.mirovaweb.it/); NASA Global Sulfur Dioxide Monitoring Page, Atmospheric Chemistry and Dynamics Laboratory, NASA Goddard Space Flight Center (NASA/GSFC), 8800 Greenbelt Road, Goddard MD 20771, USA (URL: https://so2.gsfc.nasa.gov/); Copernicus Browser (URL: https://dataspace.copernicus.eu/browser).
Shishaldin (United States) — December 2023 Cite this Report
Shishaldin
United States
54.756°N, 163.97°W; summit elev. 2857 m
All times are local (unless otherwise noted)
New eruption with significant Strombolian explosions, ash plumes, and ashfall
Shishaldin is located on the eastern half of Unimak Island, one of the Aleutian Islands. Frequent explosive activity, primarily consisting of Strombolian ash eruptions from the small summit crater, but sometimes producing lava flows, has been recorded since the 18th century. The previous eruption ended in May 2020 and was characterized by intermittent thermal activity, increased seismicity and surface temperatures, ash plumes, and ash deposits (BGVN 45:06). This report covers a new eruption during July through November 2023, which consisted of significant explosions, ash plumes, ashfall, and lava fountaining. Information comes from daily, weekly, and special reports from the Alaska Volcano Observatory (AVO) and various satellite data. AVO monitors the volcano using local seismic and infrasound sensors, satellite data, web cameras, and remote infrasound and lightning networks.
AVO reported that intermittent tremor and low-frequency earthquakes had gradually become more regular and consistent during 10-13 July. Strongly elevated surface temperatures at the summit were identified in satellite images during 10-13 July. On 11 July AVO raised the Aviation Color Code (ACC) to Yellow (the second color on a four-color scale) and Volcano Alert Level (VAL) to Advisory (the second level on a four-level scale) at 1439. Later in the day on 11 July summit crater incandescence was observed in webcam images. Observations of the summit suggested that lava was likely present at the crater, which prompted AVO to raise the ACC to Orange (the second highest color on a four-color scale) and the VAL to Watch (the second highest level on a four-level scale). The US Coast Guard conducted an overflight on 12 July and confirmed that lava was erupting from the summit. That same day, sulfur dioxide emissions were detected in satellite images.
A significant explosion began at 0109 on 14 July that produced an ash plume that rose to 9-12 km altitude and drifted S over the Pacific Ocean (figure 43). Webcam images and photos taken around 0700 from a ship SW off Unimak Island showed small lahar deposits, which were the result of the interaction of hot pyroclastic material and snow and ice on the flanks. There was also ashfall on the SW and N flanks. A smaller explosion at 0710 generated an ash plume that rose to 4.5 km altitude. Webcam images and pilot reports showed continued low-level ash emissions during the morning, rising to less than 4.6 km altitude; those emissions included a small ash plume near the summit around 1030 resulting from a small explosion.
Seismic tremor amplitude began increasing at around 1700 on 15 July; strongly elevated surface temperatures were also reported. An ash plume rose to 4.6 km altitude and drifted SSE at 2100, based on a satellite image. A continuous ash plume during 2150 through 2330 rose to 5 km altitude and extended 125 km S. At 2357 AVO raised the ACC to Red (the highest color on a four-color scale) and the VAL to Warning (the highest level on a four-level scale), noting that seismicity remained elevated for more than six hours and explosion signals were frequently detected by regional infrasound (pressure sensor) networks. Explosions generated an ash plume that rose to 4.9 km altitude and drifted as far as 500 km SE. Activity throughout the night declined and by 0735 the ACC was lowered to Orange and the VAL to Watch. High-resolution satellite images taken on 16 July showed pyroclastic deposits extending as far as 3 km from the vent; these deposits generated lahars that extended further down the drainages on the flanks. Ash deposits were mainly observed on the SSE flank and extended to the shore of Unimak Island. During 16-17 July lava continued to erupt at the summit, which caused strongly elevated surface temperatures that were visible in satellite imagery.
Lava effusion increased at 0100 on 18 July, as noted in elevated surface temperatures identified in satellite data, increasing seismic tremor, and activity detected on regional infrasound arrays. A significant ash plume at 0700 rose to 7 km altitude and continued until 0830, eventually reaching 9.1 km altitude and drifting SSE (figure 44). As a result, the ACC was raised to Red and the VAL to Warning. By 0930 the main plume detached, but residual low-level ash emissions continued for several hours, remaining below 3 km altitude and drifting S. The eruption gradually declined and by 1208 the ACC was lowered to Orange and the VAL was lowered to Watch. High-resolution satellite images showed ash deposits on the SW flank and pyroclastic deposits on the N, E, and S flanks, extending as far as 3 km from the vent; lahars triggered by the eruption extended farther down the flanks (figure 45). Lava continued to erupt from the summit crater on 19 July.
Elevated surface temperatures were detected in satellite images during 19-25 July, despite occasional weather cloud cover, which was consistent with increased lava effusion. During 22-23 July satellite observations acquired after the eruption from 18 July showed pyroclastic flow and lahar deposits extending as far as 3 km down the N, NW, and NE flanks and as far as 1.5 km down the S and SE flanks. Ash deposits covered the SW and NE flanks. No lava flows were observed outside the crater. On 22 July a sulfur dioxide plume was detected in satellite data midday that had an estimated mass of 10 kt. In a special notice issued at 1653 on 22 July AVO noted that eruptive activity had intensified over the previous six hours, which was characterized by an hours-long steady increase in seismic tremor, intermittent infrasound signals consistent with small explosions, and an increase in surface temperatures that were visible in satellite data. Pilots first reported low-level ash plumes at around 1900. At 2320 an ash plume had risen to 9 km altitude based on additional pilot reports and satellite images. The ACC was increased to Red and the VAL to Warning at 2343. Satellite images indicated growth of a significantly higher ash plume that rose to 11 km altitude continued until 0030 and drifted NE. During the early morning hours of 23 July ash plumes had declined to 4.6 k altitude. Seismic tremor peaked at 0030 on 23 July and began to rapidly decline at 0109; active ash emissions were no longer visible in satellite data by 0130. The ACC was lowered to Orange and the VAL to Watch at 0418; bursts of increased seismicity were recorded throughout the morning, but seismicity generally remained at low levels. Elevated surface temperatures were visible in satellite data until about 0600. On 24 July pilots reported seeing vigorous gas-and-steam plumes rising to about 3 km altitude; the plumes may have contained minor amounts of ash.
During 24-25 July low level seismicity and volcanic tremor were detected at low levels following the previous explosion on 23 July. Strongly elevated surface temperatures were observed at the summit crater in satellite data. Around 2200 on 25 July seismicity began to increase, followed by infrasound signals of explosions after 0200 on 26 July. An ash plume rose to 3 km altitude at 0500 and drifted ENE, along with an associated sulfur dioxide plume that drifted NE and had an estimated mass of 22 kt. Diffuse ash emissions were visible in satellite data and rose to 6.1-7.6 km altitude and extended 125 km from the volcano starting around 1130. These ash events were preceded by about seven hours of seismic tremor, infrasound detections of explosions, and five hours of increased surface temperatures visible in satellite data. Activity began to decline around 1327, which included low-frequency earthquakes and decreased volcanic tremor, and infrasound data no longer detected significant explosions. Surface temperatures remained elevated through the end of the month.
Seismicity, volcanic tremor, and ash emissions remained at low levels during early August. Satellite images on 1 August showed that some slumping had occurred on the E crater wall due to the recent explosive activity. Elevated surface temperatures continued, which was consistent with cooling lava. On 2 August small explosive events were detected, consistent with low-level Strombolian activity. Some episodes of volcanic tremor were reported, which reflected low-level ash emissions. Those ash emissions rose to less than 3 km altitude and drifted as far as 92.6 km N. Pilots that were located N of the volcano observed an ash plume that rose to 2.7 km altitude. Seismicity began to increase in intensity around 0900 on 3 August. Seismicity continued to increase throughout the day and through the night with strongly elevated surface temperatures, which suggested that lava was active at the surface.
An ash cloud that rose to 7.6-7.9 km altitude and drifted 60-75 km NE was visible in a satellite image at 0520 on 4 August. Pilots saw and reported the plume at 0836 (figure 46). By 0900 the plume had risen to 9.1 km altitude and extended over 100 km NE. AVO raised the ACC to Red and the VAL to Warning as a result. Seismic tremor levels peaked at 1400 and then sharply declined at 1500 to slightly elevated levels; the plume was sustained during the period of high tremor and drifted N and NE. The ACC was lowered to Orange and the VAL to Watch at 2055. During 5-14 August seismicity remained low and surface temperatures were elevated based on satellite data due to cooling lava. On 9 August a small lava flow was observed that extended from the crater rim to the upper NE flank. It had advanced to 55 m in length and appeared in satellite imagery on 11 August. Occasional gas-and-steam plumes were noted in webcam images. At 1827 AVO noted that seismic tremor had steadily increased during the afternoon and erupting lava was visible at the summit in satellite images.
Strong explosion signals were detected at 0200 on 15 August. An ash cloud that was visible in satellite data extended 100 km NE and may have risen as high as 11 km altitude around 0240. By 0335 satellite images showed the ash cloud rising to 7.6 km altitude and drifting NE. Significant seismicity and explosions were detected by the local AVO seismic and infrasound networks, and volcanic lightning was detected by the World Wide Lightning Location Network (WWLLN). A sulfur dioxide plume associated with the eruption drifted over the S Bering Sea and parts of Alaska and western Canada. Seismicity was significantly elevated during the eruption but had declined by 1322. A pilot reported that ash emissions continued, rising as high as 4.9 km altitude. Elevated surface temperatures detected in satellite data were caused by hot, eruptive material (pyroclastic debris and lava) that accumulated around the summit. Eruptive activity declined by 16 August and the associated sulfur dioxide plume had mostly dissipated; remnants continued to be identified in satellite images at least through 18 August. Surface temperatures remained elevated based on satellite images, indicating hot material on the upper parts of the volcano. Small explosions were detected in infrasound data on the morning of 19 August and were consistent with pilot reports of small, short-lived ash plumes that rose to about 4.3 km altitude. Low-level explosive activity was reported during 20-24 August, according to seismic and infrasound data, and weather clouds sometimes prevented views. Elevated surface temperatures were observed in satellite images, which indicated continued hot material on the upper parts of the volcano.
Seismic tremor began to increase at around 0300 on 25 August and was followed by elevated surface temperatures identified in satellite images, consistent with erupting lava. Small explosions were recorded in infrasound data. The ACC was raised to Red and the VAL to Warning at 1204 after a pilot reported an ash plume that rose to 9.1 km altitude. Seismicity peaked at 1630 and began to rapidly decline at around 1730. Ash plumes rose as high as 10 km altitude and drifted as far as 400 km NE. By 2020 the ash plumes had declined to 6.4 km altitude and continued to drift NE. Ash emissions were visible in satellite data until 0000 on 26 August and seismicity was at low levels. AVO lowered the ACC to Orange and the VAL to Watch at 0030. Minor explosive activity within the summit crater was detected during 26-28 August and strongly elevated surface temperatures were still visible in satellite imagery through the rest of the month. An AVO field crew working on Unimak Island observed a mass flow that descended the upper flanks beginning around 1720 on 27 August. The flow produced a short-lived ash cloud that rose to 4.5 km altitude and rapidly dissipated. The mass flow was likely caused by the collapse of spatter that accumulated on the summit crater rim.
Similar variable explosive activity was reported in September, although weather observations sometimes prevented observations. A moderate resolution satellite image from the afternoon of 1 September showed gas-and-steam emissions filling the summit crater and obscuring views of the vent. In addition, hot deposits from the previous 25-26 August explosive event were visible on the NE flank near the summit, based on a 1 September satellite image. On 2 and 4 September seismic and infrasound data showed signals of small, repetitive explosions. Variable gas-and-steam emissions from the summit were visible but there was no evidence of ash. Possible summit crater incandescence was visible in nighttime webcam images during 3-4 September.
Seismicity began to gradually increase at around 0300 on 5 September and activity escalated at around 0830. A pilot reported an ash plume that rose to 7.6 km altitude at 0842 and continued to rise as high as possibly 9.7 km altitude and drifted SSE based on satellite images (figure 47). The ACC was raised to Red and the VAL to Warning at 0900. In addition to strong tremor and sustained explosions, the eruption produced volcanic lightning that was detected by the WWLLN. Around 1100 seismicity decreased and satellite data confirmed that the altitude of the ash emissions had declined to 7.6 km altitude. By 1200 the lower-altitude portion of the ash plume had drifted 125 km E. Significant ash emissions ended by 1330 based on webcam images. The ACC was lowered to Orange and the VAL to Watch at 1440. Satellite images showed extensive pyroclastic debris flows on most of the flanks that extended 1.2-3.3 km from the crater rim.
During 6-13 September elevated surface temperatures continued to be observed in satellite data, seismicity remained elevated with weak but steady tremor, and small, low-frequency earthquakes and small explosions were reported, except on 12 September. On 6 September a low-level ash plume rose to 1.5-1.8 km altitude and drifted SSE. Occasional small and diffuse gas-and-steam emissions at the summit were visible in webcam images. Around 1800 on 13 September seismic tremor amplitudes began to increase, and small explosions were detected in seismic and infrasound data. Incandescent lava at the summit was seen in a webcam image taken at 0134 on 14 September during a period of elevated tremor. No ash emissions were reported during the period of elevated seismicity. Lava fountaining began around 0200, based on webcam images. Satellite-based radar observations showed that the lava fountaining activity led to the growth of a cone in the summit crater, which refilled most of the crater. By 0730 seismicity significantly declined and remained at low levels.
Seismic tremor began to increase around 0900 on 15 September and rapidly intensified. An explosive eruption began at around 1710, which prompted AVO to raise the ACC to Red and the VAL to Warning. Within about 30 minutes ash plumes drifted E below a weather cloud at 8.2 km altitude. The National Weather Service estimated that an ash-rich plume rose as high as 12.8 km altitude and produced volcanic lightning. The upper part of the ash plume detached from the vent around 1830 and drifted E, and was observed over the Gulf of Alaska. Around the same time, seismicity dramatically decreased. Trace ashfall was reported in the community of False Pass (38 km ENE) between 1800-2030 and also in King Cove and nearby marine waters. Activity declined at around 1830 although seismicity remained elevated, ash emissions, and ashfall continued until 2100. Lightning was again detected beginning around 1930, which suggested that ash emissions continued. Ongoing explosions were detected in infrasound data, at a lower level than during the most energetic phase of this event. Lightning was last detected at 2048. By 2124 the intensity of the eruption had decreased, and ash emissions were likely rising to less than 6.7 km altitude. Seismicity returned to pre-eruption levels. On 16 September the ACC was lowered to Orange and the VAL to Watch at 1244; the sulfur dioxide plume that was emitted from the previous eruption event was still visible over the northern Pacific Ocean. Elevated surface temperatures, gas-and-steam emissions from the vent, and new, small lahars were reported on the upper flanks based on satellite and webcam images. Minor deposits were reported on the flanks which were likely the result of collapse of previously accumulated lava near the summit crater.
Elevated seismicity with tremor, small earthquakes, and elevated surface temperatures were detected during 17-23 September. Minor gas-and-steam emissions were visible in webcam images. On 20 September small volcanic debris flows were reported on the upper flanks. On 21 September a small ash deposit was observed on the upper flanks extending to the NE based on webcam images. Seismic tremor increased significantly during 22-23 September. Regional infrasound sensors suggested that low-level eruptive activity was occurring within the summit crater by around 1800 on 23 September. Even though seismicity was at high levels, strongly elevated surface temperatures indicating lava at the surface were absent and no ash emissions were detected; weather clouds at 0.6-4.6 km altitude obscured views. At 0025 on 24 September AVO noted that seismicity continued at high levels and nearly continuous small infrasound signals began, likely from low-level eruptive activity. Strongly elevated surface temperatures were identified in satellite images by 0900 and persisted throughout the day; the higher temperatures along with infrasound and seismic data were consistent with lava erupting at the summit. Around 1700 similarly elevated surface temperatures were detected from the summit in satellite data, which suggested that more vigorous lava fountaining had started. Starting around 1800 low-level ash emissions rose to altitudes less than 4.6 km altitude and quickly dissipated.
Beginning at midnight on 25 September, a series of seismic signals consistent with volcanic flows were recorded on the N side of the volcano. A change in seismicity and infrasound signals occurred around 0535 and at 0540 a significant ash cloud formed and quickly reached 14 km altitude and drifted E along the Alaska Peninsula. The cloud generated at least 150 lightning strokes with thunder that could be heard by people in False Pass. Seismicity rapidly declined to near background levels around 0600. AVO increased the ACC to Red and the VAL to Warning at 0602. The ash cloud detached from the volcano at around 0700, rose to 11.6 km altitude, and drifted ESE. Trace to minor amounts of ashfall were reported by the communities of False Pass, King Cove, Cold Bay, and Sand Point around 0700. Ash emissions continued at lower altitudes of 6-7.6 km altitude at 0820. Small explosions at the vent area continued to be detected in infrasound data and likely represented low-level eruptive activity near the vent. Due to the significant decrease in seismicity and ash emissions the ACC was lowered to Orange and the VAL to Watch at 1234. Radar data showed significant collapses of the crater that occurred on 25 September. Satellite data also showed significant hot, degassing pyroclastic and lahar deposits on all flanks, including more extensive flows on the ENE and WSW sections below two new collapse scarps. Following the significant activity during 24-25 September, only low-level activity was observed. Seismicity decreased notably near the end of the strong activity on 25 September and continued to decrease through the end of the month, though tremor and small earthquakes were still reported. No explosive activity was detected in infrasound data through 2 October. Gas-and-steam emissions rose to 3.7 km altitude, as reported by pilots and seen in satellite images. Satellite data from 26 September showed that significant collapses had occurred at the summit crater and hot, steaming deposits from pyroclastic flows and lahars were present on all the flanks, particularly to the ENE and WSW. A small ash cloud was visible in webcam images on 27 September, likely from a collapse at the summit cone. High elevated surface temperatures were observed in satellite imagery during 27-28 September, which were likely the result of hot deposits on the flanks erupted on 25 September. Minor steaming at the summit crater and from an area on the upper flanks was visible in webcam images on 28 September.
During October, explosion events continued between periods of low activity. Seismicity significantly increased starting at around 2100 on 2 October; around the same time satellite images showed an increase in surface temperatures consistent with lava fountaining. Small, hot avalanches of rock and lava descended an unspecified flank. In addition, a distinct increase in infrasound, seismicity, and lightning detections was followed by an ash plume that rose to 12.2 km altitude and drifted S and E at 0520 on 3 October, based on satellite images. Nighttime webcam images showed incandescence due to lava fountaining at the summit and pyroclastic flows descending the NE flank. AVO reported that a notable explosive eruption started at 0547 and lasted until 0900 on 3 October, which prompted a rise in the ACC to Red and the VAL to Warning. Subsequent ash plumes rose to 6-7.6 km altitude by 0931. At 1036 the ACC was lowered back to Orange and the VAL to Watch since both seismic and infrasound data quieted substantially and were slightly above background levels. Gas-and-steam emissions were observed at the summit, based on webcam images. Trace amounts of ashfall were observed in Cold Bay. Resuspended ash was present at several kilometers altitude near the volcano. During the afternoon, low-level ash plumes were visible at the flanks, which appeared to be largely generated by rock avalanches off the summit crater following the explosive activity. These ash plumes rose to 3 km altitude and drifted W. Trace amounts of ashfall were reported by observers in Cold Bay and Unalaska and flights to these communities were disrupted by the ash cloud. Satellite images taken after the eruption showed evidence of pyroclastic flows and lahar deposits in drainages 2 km down the SW flank and about 3.2 km down the NE flank, and continued erosion of the crater rim. Small explosion craters at the end of the pyroclastic flows on the NE flank were noted for the first time, which may have resulted from gas-and-steam explosions when hot deposits interact with underlying ice.
During 4 October seismicity, including frequent small earthquakes, remained elevated, but was gradually declining. Ash plumes were produced for over eight hours until around 1400 that rose to below 3.7 km altitude. These ash plumes were primarily generated off the sides of the volcano where hot rock avalanches from the crater rim had entered drainages to the SW and NE. Two explosion craters were observed at the base of the NE deposits about 3.2 km from the crater rim. Webcam images showed the explosion craters were a source of persistent ash emissions; occasional collapse events also generated ash. Seismicity remained elevated with sulfur dioxide emissions that had a daily average of more than 1,000 tons per day, and frequent small earthquakes through the end of the month. Frequent elevated surface temperatures were identified in satellite images and gas-and-steam plumes were observed in webcam images, although weather conditions occasionally prevented clear views of the summit. Emissions were robust during 14-16 October and were likely generated by the interaction of hot material and snow and ice. During the afternoon of 21 October a strong gas-and-steam plume rose to 3-4.6 km altitude and extended 40 km WSW, based on satellite images and reports from pilots. On 31 October the ACC was lowered to Yellow and the VAL was lowered to Advisory.
Activity in November was characterized by elevated seismicity with ongoing seismic tremor and small, low-frequency earthquakes, elevated surface temperatures, and gas-and-steam emissions. There was an increase in seismic and infrasound tremor amplitudes starting at 1940 on 2 November. As a result, the ACC was again raised to Orange and the VAL was increased to Watch, although ash was not identified in satellite data. An ash cloud rose to 6.1 km altitude and drifted W according to satellite data at 2000. By 0831 on 3 November ash emissions were no longer visible in satellite images. On 6 and 9 November air pressure sensors detected signals consistent with small explosions. Small explosions were detected in infrasound data consistent with weak Strombolian activity on 19 and 21 November. Seismicity started to decrease on 21 November. On 25 November gas-and-steam emissions were emitted from the vent as well as from a scarp on the NE side of the volcano near the summit. A gas-and-steam plume extended about 50 km SSE and was observed in satellite and webcam images on 26 November. On 28 November small explosions were observed in seismic and local infrasound data and gas-and-steam emissions were visible from the summit and from the upper NE collapse scarp based on webcam images. Possible small explosions were observed in infrasound data on 30 November. Weakly elevated surface temperatures and a persistent gas-and-steam plume from the summit and collapse scarps on the upper flanks. A passing aircraft reported the gas-and-steam plume rose to 3-3.4 km altitude on 30 November, but no significant ash emissions were detected.
Satellite data. MODIS thermal anomaly data provided through MIROVA (Middle InfraRed Observation of Volcanic Activity) showed a strong pulse of thermal activity beginning in July 2023 that continued through November 2023 (figure 48). This strong activity was due to Strombolian explosions and lava fountaining events at the summit crater. According to data from MODVOLC thermal alerts, a total of 101 hotspots were detected near the summit crater in July (11-14, 16-19, 23-24 and 26), August (4, 25-26, and 29), September (5, 12, and 17), and October (3, 4, and 8). Infrared satellite data showed large lava flows descending primarily the northern and SE flanks during the reporting period (figure 49). Sulfur dioxide plumes often exceeded two Dobson Units (DUs) and drifted in different directions throughout the reporting period, based on satellite data from the TROPOMI instrument on the Sentinel-5P satellite (figure 50).
Geologic Background. The symmetrical glacier-covered Shishaldin in the Aleutian Islands is the westernmost of three large stratovolcanoes in the eastern half of Unimak Island. The Aleuts named the volcano Sisquk, meaning "mountain which points the way when I am lost." Constructed atop an older glacially dissected edifice, it is largely basaltic in composition. Remnants of an older edifice are exposed on the W and NE sides at 1,500-1,800 m elevation. There are over two dozen pyroclastic cones on its NW flank, which is covered by massive aa lava flows. Frequent explosive activity, primarily consisting of Strombolian ash eruptions from the small summit crater, but sometimes producing lava flows, has been recorded since the 18th century. A steam plume often rises from the summit crater.
Information Contacts: Alaska Volcano Observatory (AVO), a cooperative program of a) U.S. Geological Survey, 4200 University Drive, Anchorage, AK 99508-4667 USA (URL: https://avo.alaska.edu/), b) Geophysical Institute, University of Alaska, PO Box 757320, Fairbanks, AK 99775-7320, USA, and c) Alaska Division of Geological & Geophysical Surveys, 794 University Ave., Suite 200, Fairbanks, AK 99709, USA (URL: http://dggs.alaska.gov/); MIROVA (Middle InfraRed Observation of Volcanic Activity), a collaborative project between the Universities of Turin and Florence (Italy) supported by the Centre for Volcanic Risk of the Italian Civil Protection Department (URL: http://www.mirovaweb.it/); Hawai'i Institute of Geophysics and Planetology (HIGP) - MODVOLC Thermal Alerts System, School of Ocean and Earth Science and Technology (SOEST), Univ. of Hawai'i, 2525 Correa Road, Honolulu, HI 96822, USA (URL: http://modis.higp.hawaii.edu/); NASA Global Sulfur Dioxide Monitoring Page, Atmospheric Chemistry and Dynamics Laboratory, NASA Goddard Space Flight Center (NASA/GSFC), 8800 Greenbelt Road, Goddard, Maryland, USA (URL: https://so2.gsfc.nasa.gov/); Copernicus Browser, Copernicus Data Space Ecosystem, European Space Agency (URL: https://dataspace.copernicus.eu/browser/).
Ioto
Japan
24.751°N, 141.289°E; summit elev. 169 m
All times are local (unless otherwise noted)
New eruption with discolored water, ejecta, and floating pumice during October-December 2023
Ioto (Iwo-jima), located about 1,200 km S of Tokyo, lies within a 9-km-wide submarine caldera along the Izu-Bonin-Mariana volcanic arc. Previous eruptions date back to 1889 and have consisted of dominantly phreatic explosions, pumice deposits during 2001, and discolored water. A submarine eruption during July through December 2022 was characterized by discolored water, pumice deposits, and gas emissions (BGVN 48:01). This report covers a new eruption during October through December 2023, which consisted of explosions, black ejecta, discolored water, and floating pumice, based on information from the Japan Meteorological Association (JMA), the Japan Coast Guard (JCG), and satellite data.
JMA reported that an eruption had been occurring offshore of Okinahama on the SE side of the island since 21 October, which was characterized by volcanic tremor, according to the Japan Maritime Self-Defense Force (JMSDF) Iwo Jima Air Base (figure 22). According to an 18 October satellite image a plume of discolored water at the site of this new eruption extended NE (figure 23). During an overflight conducted on 30 October, a vent was identified about 1 km off the coast of Okinahama. Observers recorded explosions every few minutes that ejected dark material about 20 m above the ocean and as high as 150 m. Ejecta from the vent formed a black-colored island about 100 m in diameter, according to observations conducted from the air by the Earthquake Research Institute of the University of Tokyo in cooperation with the Mainichi newspaper (figure 24). Occasionally, large boulders measuring more than several meters in size were also ejected. Observations from the Advanced Land Observing Satellite Daichi-2 and Sentinel-2 satellite images also confirmed the formation of this island (figure 23). Brown discolored water and floating pumice were present surrounding the island.
The eruption continued during November. During an overflight on 3 November observers photographed the island and noted that material was ejected 169 m high, according to a news source. Explosions gradually became shorter, and, by the 3rd, they occurred every few seconds; dark and incandescent material were ejected about 800 m above the vent. On 4 November eruptions were accompanied by explosive sounds. Floating, brown-colored pumice was present in the water surrounding the island. There was a brief increase in the number of volcanic earthquakes during 8-14 November and 24-25 November. The eruption temporarily paused during 9-11 November and by 12 November eruptions resumed to the W of the island. On 10 November dark brown-to-dark yellow-green discolored water and a small amount of black floating material was observed (figure 25). A small eruption was reported on 18 November off the NE coast of the island, accompanied by white gas-and-steam plumes (figure 23). Another pause was recorded during 17-19 November, which then resumed on 20 November and continued erupting intermittently. According to a field survey conducted by the National Institute for Disaster Prevention Science and Technology on 19 November, a 30-m diameter crater was visible on the NE coast where landslides, hot water, and gray volcanic ash containing clay have occurred and been distributed previously. Erupted blocks about 10 cm in diameter were distributed about 90-120 m from the crater. JCG made observations during an overflight on 23 November and reported a phreatomagmatic eruption. Explosions at the main vent generated dark gas-and-ash plumes that rose to 200 m altitude and ejected large blocks that landed on the island and in the ocean (figure 26). Discolored water also surrounded the island. The size of the new island had grown to 450 m N-S x 200 m E-W by 23 November, according to JCG.
The eruption continued through 11 December, followed by a brief pause in activity, which then resumed on 31 December, according to JMA. Intermittent explosions produced 100-m-high black plumes at intervals of several minutes to 30 minutes during 1-10 December. Overflights were conducted on 4 and 15 December and reported that the water surrounding the new island was discolored to dark brown-to-dark yellow-green (figure 27). No floating material was reported during this time. In comparison to the observations made on 23 November, the new land had extended N and part of it had eroded away. In addition, analysis by the Geospatial Information Authority of Japan using SAR data from Daichi-2 also confirmed that the area of the new island continued to decrease between 4 and 15 December. Ejected material combined with wave erosion transformed the island into a “J” shape, 500-m-long and with the curved part about 200 m offshore of Ioto. The island was covered with brown ash and blocks, and the surrounding water was discolored to greenish-brown and contained an area of floating pumice. JCG reported from an overflight on 4 December that volcanic ash-like material found around the S vent on the NE part of the island was newly deposited since 10 November (figure 28). By 15 December the N part of the “J” shaped island had separated and migrated N, connecting to the Okinahama coast and the curved part of the “J” had eroded into two smaller islands (figure 27).
References. Ukawa, M., Fujita, E., Kobayashi, T., 2002, Recent volcanic activity of Iwo Jima and the 2001 eruption, Monthly Chikyu, Extra No. 39, 157-164.
Geologic Background. Ioto, in the Volcano Islands of Japan, lies within a 9-km-wide submarine caldera. The volcano is also known as Ogasawara-Iojima to distinguish it from several other "Sulfur Island" volcanoes in Japan. The triangular, low-elevation, 8-km-long island narrows toward its SW tip and has produced trachyandesitic and trachytic rocks that are more alkalic than those of other volcanoes in this arc. The island has undergone uplift for at least the past 700 years, accompanying resurgent doming of the caldera; a shoreline landed upon by Captain Cook's surveying crew in 1779 is now 40 m above sea level. The Motoyama plateau on the NE half of the island consists of submarine tuffs overlain by coral deposits and forms the island's high point. Many fumaroles are oriented along a NE-SW zone cutting through Motoyama. Numerous recorded phreatic eruptions, many from vents on the W and NW sides of the island, have accompanied the uplift.
Information Contacts: Japan Meteorological Agency (JMA), 1-3-4 Otemachi, Chiyoda-ku, Tokyo 100-8122, Japan (URL: http://www.jma.go.jp/jma/indexe.html); Japan Coast Guard (JCG) Volcano Database, Hydrographic and Oceanographic Department, 3-1-1, Kasumigaseki, Chiyoda-ku, Tokyo 100-8932, Japan (URL: https://www1.kaiho.mlit.go.jp/GIJUTSUKOKUSAI/kaiikiDB/kaiyo22-2.htm); Copernicus Browser, Copernicus Data Space Ecosystem, European Space Agency (URL: https://dataspace.copernicus.eu/browser/); Asahi, 5-3-2, Tsukiji, Chuo Ward, Tokyo, 104-8011, Japan (URL: https://www.asahi.com/ajw/articles/15048458).
Purace (Colombia) — December 2023 Cite this Report
Purace
Colombia
2.3095°N, 76.3948°W; summit elev. 4650 m
All times are local (unless otherwise noted)
Gas-and-ash emission on 16 November 2023
Puracé, located in Colombia, is a stratovolcano that contains a 500-m-wide summit crater. It is part of the Los Coconucos volcanic chain that is a NW-SE trending group of seven cones and craters. The most recent eruption occurred during March 2022 that was characterized by frequent seismicity and gas-and-steam emissions (BGVN 47:06). This report covers a brief eruption during November 2023 based on monthly reports from the Popayán Observatory, part of the Servicio Geologico Colombiano (SGC).
Activity during November 2022 through November 2023 primarily consisted of seismicity: VT-type events, LP-type events, HB-type events, and TR-type events (table 4). Maximum sulfur dioxide values were measured weekly and ranged from 259-5,854 tons per day (t/d) during November 2022 through April 2023. White gas-and-steam emissions were also occasionally reported.
SGC issued a report on 25 October that noted a significant increase in the number of earthquakes associated with rock fracturing. These earthquakes were located SE of the crater between Puracé and Piocollo at depths of 1-4 km. There were no reported variations in sulfur dioxide values, but SGC noted high carbon dioxide values, compared to those recorded in the first half of 2023.
SGC reported that at 1929 on 16 November the seismic network detected a signal that was possibly associated with a gas-and-ash emission, though it was not confirmed in webcam images due to limited visibility. On 17 November an observer confirmed ash deposits on the N flank. Webcam images showed an increase in degassing both inside the crater and from the NW flank, rising 700 m above the crater.
Table 4. Seismicity at Puracé during November 2022-November 2023. Volcano-tectonic (VT), long-period (LP), hybrid (HB), and tremor (TR) events are reported each month. Courtesy of SGC.
| Month |
Volcano-tectonic |
Long-period |
Hybrid |
Tremor |
| Nov 2022 |
429 |
2,023 |
5 |
831 |
| Dec 2022 |
423 |
1,390 |
9 |
834 |
| Jan 2023 |
719 |
1,622 |
0 |
957 |
| Feb 2023 |
598 |
1,701 |
2 |
1,124 |
| Mar 2023 |
331 |
2,408 |
147 |
607 |
| Apr 2023 |
614 |
4,427 |
33 |
148 |
| May 2023 |
620 |
3,717 |
170 |
109 |
| Jun 2023 |
467 |
3,293 |
86 |
148 |
| Jul 2023 |
1,116 |
5,809 |
183 |
542 |
| Aug 2023 |
692 |
2,927 |
94 |
321 |
| Sep 2023 |
887 |
1,505 |
82 |
848 |
| Oct 2023 |
2,373 |
2,949 |
135 |
692 |
| Nov 2023 |
1,212 |
2,302 |
69 |
293 |
Geologic Background. Puracé is an active andesitic volcano with a 600-m-diameter summit crater at the NW end of the Los Coconucos Volcanic Chain. This volcanic complex includes nine composite and five monogenetic volcanoes, extending from the Puracé crater more than 6 km SE to the summit of Pan de Azúcar stratovolcano. The dacitic massif which the complex is built on extends about 13 km NW-SE and 10 km NE-SW. Frequent small to moderate explosive eruptions reported since 1816 CE have modified the morphology of the summit crater, with the largest eruptions in 1849, 1869, and 1885.
Information Contacts: Servicio Geologico Colombiano (SGC), Diagonal 53 No. 34-53 - Bogotá D.C., Colombia (URL: https://www.sgc.gov.co/volcanes).
Etna
Italy
37.748°N, 14.999°E; summit elev. 3357 m
All times are local (unless otherwise noted)
Strombolian explosions, lava fountains, and lava flows during July-August 2023
Etna, located on the Italian island of Sicily, has had documented eruptions dating back to 1500 BCE. Activity typically originates from multiple cones at the summit, where several craters have formed and evolved. The currently active craters are Northeast Crater (NEC), Voragine (VOR), and Bocca Nuova (BN), and the Southeast Crater (SEC); VOR and BN were previously referred to as the “Central Crater”. The original Southeast crater formed in 1978, and a second eruptive site that opened on its SE flank in 2011 was named the New Southeast Crater (NSEC). Another eruptive site between the SEC and NSEC developed during early 2017 and was referred to as the "cono della sella" (saddle cone). The current eruption period began in November 2022 and has been characterized by intermittent Strombolian activity, lava flows, and ash plumes (BGVN 48:08). This report updates activity during July through October 2023, which includes primarily gas-and-steam emissions; during July and August Strombolian explosions, lava fountains, and lava flows were reported, based on weekly and special reports by the Osservatorio Etneo (OE), part of the Catania Branch of Italy's Istituo Nazionale di Geofisica e Vulcanologica (INGV) and satellite data.
Variable fumarolic degassing was reported at all summit craters (BN, VOR, NEC, and SEC) throughout the entire reporting period (table 15). The MIROVA (Middle InfraRed Observation of Volcanic Activity) volcano hotspot detection system based on the analysis of MODIS data showed frequent low-to-moderate power thermal anomalies during the reporting period (figure 399). During mid-August there was a pulse in activity that showed an increase in the power of the anomalies due to Strombolian activity, lava fountains, and lava flows. Infrared satellite imagery captured strong thermal anomalies at the central and southeast summit crater areas (figure 400). Accompanying thermal activity were occasional sulfur dioxide plumes that exceeded 2 Dobson Units (DUs) recorded by the TROPOMI instrument on the Sentinel-5P satellite (figure 401).
Table 15. Summary of activity at the four primary crater areas at the summit of Etna during July-October 2023. Information is from INGV weekly reports.
| Month |
Bocca Nuova (BN) |
Voragine (VOR) |
Northeast Crater (NEC) |
Southeast Crater (SEC) |
| Jul 2023 |
Continuous degassing. |
No observations. |
Weak gas emissions. |
Continuous degassing. Sporadic and weak-to-moderate ash emissions. Strombolian explosions. |
| Aug 2023 |
Continuous degassing. |
No observations. |
No observations. |
Continuous degassing. Occasional ash emissions. Strombolian activity, lava fountaining, and lava flows. |
| Sep 2023 |
Variable degassing. Crater incandescence. |
Weak fumarolic activity. |
Weak fumarolic activity. |
Variable degassing. |
| Oct 2023 |
Continuous degassing. |
Weak fumarolic activity. |
Weak fumarolic activity. |
Continuous degassing. |
Activity during July and August was relatively low and mainly consisted of degassing at the summit craters, particularly at SEC and BN. Cloudy weather prevented clear views of the summit during early July. During the night of 2 July some crater incandescence was visible at SEC. Explosive activity resumed at SEC during 9-10 July, which was characterized by sporadic and weak ash emissions that rapidly dispersed in the summit area (figure 402). INGV reported moderate Strombolian activity began at 2034 on 14 July and was confined to the inside of the crater and fed by a vent located in the E part of SEC. An ash emission was detected at 2037. A new vent opened on 15 July in the SE part of BN and began to produce continuous gas-and-steam emissions. During an inspection carried out on 28 July pulsating degassing, along with audible booms, were reported at two active vents in BN. Vigorous gas-and-steam emissions intermittently generated rings. On rare occasions, fine, reddish ash was emitted from BN1 and resuspended by the gas-and-steam emissions.
Around 2000 on 13 August INGV reported a sudden increase in volcanic tremor amplitude. Significant infrasonic activity coincided with the tremor increase. Incandescent flashes were visible through the cloud cover in webcam images of SEC (figure 403). Strombolian activity at SEC began to gradually intensify starting at 2040 as seismicity continued to increase. The Aviation Color Code (ACC) was raised to Yellow (the second lowest-level on a four-color scale) at 2126 and then to Orange (the second highest-level on a four-color scale) at 2129 due to above-background activity. The activity rapidly transitioned from Strombolian activity to lava fountains around 2333 that rose 300-400 m above the crater (figure 403). Activity was initially focused on the E vent of the crater, but then the vent located above the S flank of the cone also became active. A lava flow from this vent traveled SW into the drainage created on 10 February 2022, overlapping with previous flows from 10 and 21 February 2022 and 21 May 2023, moving between Monte Barbagallo and Monte Frumento Supino (figure 404). The lava flow was 350 m long, oriented NNE-SSW, and descended to an elevation of 2.8 km. Flows covered an area of 300,000 m2 and had an estimated volume of 900,000 m3. The ACC was raised to Red at 2241 based on strong explosive activity and ashfall in Rifugio Sapienza-Piano Vetore at 1.7 km elevation on the S flank. INGV reported that pyroclastic flows accompanied this activity.
Activity peaked between 0240 and 0330 on 14 August, when roughly 5-6 vents erupted lava fountains from the E to SW flank of SEC. The easternmost vents produced lava fountains that ejected material strongly to the E, which caused heavy fallout of incandescent pyroclastic material on the underlying flank, triggering small pyroclastic flows. This event was also accompanied by lightning both in the ash column and in the ash clouds that were generated by the pyroclastic flows. A fracture characterized by a series of collapse craters (pit craters) opened on the upper SW flank of SEC. An ash cloud rose a few kilometers above the crater and drifted S, causing ash and lapilli falls in Rifugio Sapienza and expanding toward Nicolosi, Mascalucia, Catania, and up to Syracuse. Ashfall resulted in operational problems at the Catania airport (50 km S), which lasted from 0238 until 2000. By 0420 the volcanic tremor amplitude values declined to background levels. After 0500 activity sharply decreased, although the ash cloud remained for several hours and drifted S. By late morning, activity had completely stopped. The ACC was lowered to Orange as volcanic ash was confined to the summit area. Sporadic, minor ash emissions continued throughout the day. At 1415 the ACC was lowered to Yellow and then to Green at 1417.
During the night of 14-15 August only occasional flashes were observed, which were more intense during avalanches of material inside the eruptive vents. Small explosions were detected at SEC at 2346 on 14 August and at 0900 on 26 August that each produced ash clouds which rapidly dispersed into the atmosphere (figure 405). According to a webcam image, an explosive event detected at 2344 at SEC generated a modest ash cloud that was rapidly dispersed by winds. The ACC was raised to Yellow at 2355 on 14 August due to increasing unrest and was lowered to Green at 0954 on 15 August.
Activity during September and October was relatively low and mainly characterized by variable degassing from BN and SEC. Intense, continuous, and pulsating degassing was accompanied by roaring sounds and flashes of incandescence at BN both from BN1 and the new pit crater that formed during late July (figure 406). The degassing from the new pit crater sometimes emitted vapor rings. Cloudy weather during 6-8 September prevented observations of the summit craters .
Geologic Background. Mount Etna, towering above Catania on the island of Sicily, has one of the world's longest documented records of volcanism, dating back to 1500 BCE. Historical lava flows of basaltic composition cover much of the surface of this massive volcano, whose edifice is the highest and most voluminous in Italy. The Mongibello stratovolcano, truncated by several small calderas, was constructed during the late Pleistocene and Holocene over an older shield volcano. The most prominent morphological feature of Etna is the Valle del Bove, a 5 x 10 km caldera open to the east. Two styles of eruptive activity typically occur, sometimes simultaneously. Persistent explosive eruptions, sometimes with minor lava emissions, take place from one or more summit craters. Flank vents, typically with higher effusion rates, are less frequently active and originate from fissures that open progressively downward from near the summit (usually accompanied by Strombolian eruptions at the upper end). Cinder cones are commonly constructed over the vents of lower-flank lava flows. Lava flows extend to the foot of the volcano on all sides and have reached the sea over a broad area on the SE flank.
Information Contacts: Sezione di Catania - Osservatorio Etneo, Istituto Nazionale di Geofisica e Vulcanologia (INGV), Sezione di Catania, Piazza Roma 2, 95123 Catania, Italy (URL: http://www.ct.ingv.it/it/); MIROVA (Middle InfraRed Observation of Volcanic Activity), a collaborative project between the Universities of Turin and Florence (Italy) supported by the Centre for Volcanic Risk of the Italian Civil Protection Department (URL: http://www.mirovaweb.it/); NASA Global Sulfur Dioxide Monitoring Page, Atmospheric Chemistry and Dynamics Laboratory, NASA Goddard Space Flight Center (NASA/GSFC), 8800 Greenbelt Road, Goddard MD 20771, USA (URL: https://so2.gsfc.nasa.gov/); Copernicus Browser, Copernicus Data Space Ecosystem, European Space Agency (URL: https://dataspace.copernicus.eu/browser/).
Suwanosejima (Japan) — December 2023 Cite this Report
Suwanosejima
Japan
29.638°N, 129.714°E; summit elev. 796 m
All times are local (unless otherwise noted)
Eruption plumes, crater incandescence, and occasional explosions during July-October 2023
Suwanosejima is an 8-km-long island that consists of a stratovolcano and two active summit craters, located in the northern Ryukyu Islands, Japan. Volcanism over the past century has been characterized by Strombolian explosions, ash plumes, and ashfall. The current eruption began in October 2004 and has more recently consisted of frequent eruption plumes, explosions, and incandescent ejecta (BGVN 48:07). This report covers similar activity of ash plumes, explosions, and crater incandescence during July through October 2023 using monthly reports from the Japan Meteorological Agency (JMA) and satellite data.
Thermal activity during the reporting period was relatively low; only one low-power thermal anomaly was detected during mid-July and one during early August, based on a MIROVA (Middle InfraRed Observation of Volcanic Activity) Log Radiative Power graph of the MODIS thermal anomaly data. On two clear weather days, a thermal anomaly was visible in infrared satellite images (figure 81).
Low-level activity was reported at the Otake crater during July and no explosions were detected. Eruption plumes rose as high as 1.8 km above the crater. On 13 July an ash plume rose 1.7 km above the crater rim, based on a webcam image. During the night of the 28th crater incandescence was visible in a webcam image. An eruptive event reported on 31 July produced an eruption plume that rose 2.1 km above the crater. Seismicity consisted of 11 volcanic earthquakes on the W flank, the number of which had decreased compared to June (28) and 68 volcanic earthquakes near the Otake crater, which had decreased from 722 in the previous month. According to observations conducted by the University of Tokyo Graduate School of Science, Kyoto University Disaster Prevention Research Institute, Toshima Village, and JMA, the amount of sulfur dioxide emissions released during the month was 400-800 tons per day (t/d).
Eruptive activity in the Otake crater continued during August and no explosions were reported. An eruptive event produced a plume that rose 1 km above the crater at 1447 on 12 August. Subsequent eruptive events were recorded at 0911 on 16 August, at 1303 on 20 August, and at 0317 on 21 August, which produced ash plumes that rose 1-1.1 km above the crater and drifted SE, SW, and W. On 22 August an ash plume was captured in a webcam image rising 1.4 km above the crater (figure 82). Multiple eruptive events were detected on 25 August at 0544, 0742, 0824, 1424, and 1704, which generated ash plumes that rose 1.1-1.2 km above the crater and drifted NE, W, and SW. On 28 August a small amount of ashfall was observed as far as 1.5 km from the crater. There were 17 volcanic earthquakes recorded on the W flank of the volcano and 79 recorded at the Otake crater during the month. The amount of sulfur dioxide emissions released during the month was 400-800 t/d.
Activity continued at the Otake crater during September. Occasionally, nighttime crater incandescence was observed in webcam images and ashfall was reported. An eruptive event at 1949 on 4 September produced an ash plume that rose 1 km above the crater and drifted SW. On 9 September several eruption events were detected at 0221, 0301, and 0333, which produced ash plumes that rose 1.1-1.4 km above the crater rim and drifted W; continuous ash emissions during 0404-0740 rose to a maximum height of 2 km above the crater rim (figure 83). More eruptive events were reported at 1437 on 10 September, at 0319 on 11 September, and at 0511 and 1228 on 15 September, which generated ash plumes that rose 1-1.8 km above the crater. During 25, 27, and 30 September, ash plumes rose as high as 1.3 km above the crater rim. JMA reported that large blocks were ejected as far as 300 m from the center of the crater. There were 18 volcanic earthquakes detected beneath the W flank and 82 volcanic earthquakes detected near the Otake crater. The amount of sulfur dioxide released during the month ranged from 600 to 1,600 t/d.
Activity during early-to-mid-October consisted of occasional explosions, a total number of 13, and ash plumes that rose as high as 1.9 km above the Otake crater rim on 29 October (figure 84). These explosions are the first to have occurred since June 2023. Continuous ash emissions were reported during 0510-0555 on 1 October. Explosions were recorded at 0304, 2141, and 2359 on 2 October, at 0112 on 3 October, and at 1326 on 6 October, which produced ash plumes that rose as high as 1 km above the crater rim and drifted SW and W. An explosion was noted at 0428 on 3 October, but emission details were unknown. A total of eight explosions were recorded by the seismic network at 1522 on 14 October, at 0337, 0433, 0555, 1008, and 1539 on 15 October, and at 0454 and 0517 on 16 October. Ash plumes from these explosions rose as high as 900 m above the crater and drifted SE. Eruptive events during 25-27 and 29-30 October generated plumes that rose as high as 1.9 km above the crater and drifted SE, S, and SW. Ash was deposited in Toshima village (3.5 km SSW). Eruptive activity occasionally ejected large volcanic blocks as far as 600 m from the crater. Nighttime crater incandescence was visible in webcams. Intermittent ashfall was reported as far as 1.5 km from the crater. There were 43 volcanic earthquakes detected on the W flank during the month, and 184 volcanic earthquakes detected near the Otake crater. The amount of sulfur dioxide emitted ranged between 400 and 900 t/d.
Geologic Background. The 8-km-long island of Suwanosejima in the northern Ryukyu Islands consists of an andesitic stratovolcano with two active summit craters. The summit is truncated by a large breached crater extending to the sea on the E flank that was formed by edifice collapse. One of Japan's most frequently active volcanoes, it was in a state of intermittent Strombolian activity from Otake, the NE summit crater, between 1949 and 1996, after which periods of inactivity lengthened. The largest recorded eruption took place in 1813-14, when thick scoria deposits covered residential areas, and the SW crater produced two lava flows that reached the western coast. At the end of the eruption the summit of Otake collapsed, forming a large debris avalanche and creating an open collapse scarp extending to the eastern coast. The island remained uninhabited for about 70 years after the 1813-1814 eruption. Lava flows reached the eastern coast of the island in 1884. Only about 50 people live on the island.
Information Contacts: Japan Meteorological Agency (JMA), 1-3-4 Otemachi, Chiyoda-ku, Tokyo 100-8122, Japan (URL: http://www.jma.go.jp/jma/indexe.html); MIROVA (Middle InfraRed Observation of Volcanic Activity), a collaborative project between the Universities of Turin and Florence (Italy) supported by the Centre for Volcanic Risk of the Italian Civil Protection Department (URL: http://www.mirovaweb.it/); Hawai'i Institute of Geophysics and Planetology (HIGP) - MODVOLC Thermal Alerts System, School of Ocean and Earth Science and Technology (SOEST), Univ. of Hawai'i, 2525 Correa Road, Honolulu, HI 96822, USA (URL: http://modis.higp.hawaii.edu/); Copernicus Browser, Copernicus Data Space Ecosystem, European Space Agency (URL: https://dataspace.copernicus.eu/browser/).
Aira
Japan
31.5772°N, 130.6589°E; summit elev. 1117 m
All times are local (unless otherwise noted)
Explosions, ash plumes, ash fall, and crater incandescence during July-October 2023
Aira caldera, located in the northern half of Kagoshima Bay, Japan, contains the post-caldera Sakurajima volcano. Eruptions typically originate from the Minamidake crater, and since the 8th century, ash deposits have been recorded in the city of Kagoshima (10 km W), one of Kyushu’s largest cities. The Minamidake summit cone and crater has had persistent activity since 1955; the Showa crater on the E flank has also been intermittently active since 2006. The current eruption period began during March 2017 and has recently been characterized by intermittent explosions, eruption plumes, and ashfall (BGVN 48:07). This report updates activity during July through October 2023 and describes explosive events, ash plumes, nighttime crater incandescence, and ashfall, according to monthly activity reports from the Japan Meteorological Agency (JMA) and satellite data.
Thermal activity remained at low levels during this reporting period, according to the MIROVA (Middle InfraRed Observation of Volcanic Activity) system (figure 149). There was a slight increase in the number of anomalies during September through October. Occasional thermal anomalies were visible in infrared satellite images mainly at the Minamidake crater (Vent A is located to the left and Vent B is located to the right) (figure 150).
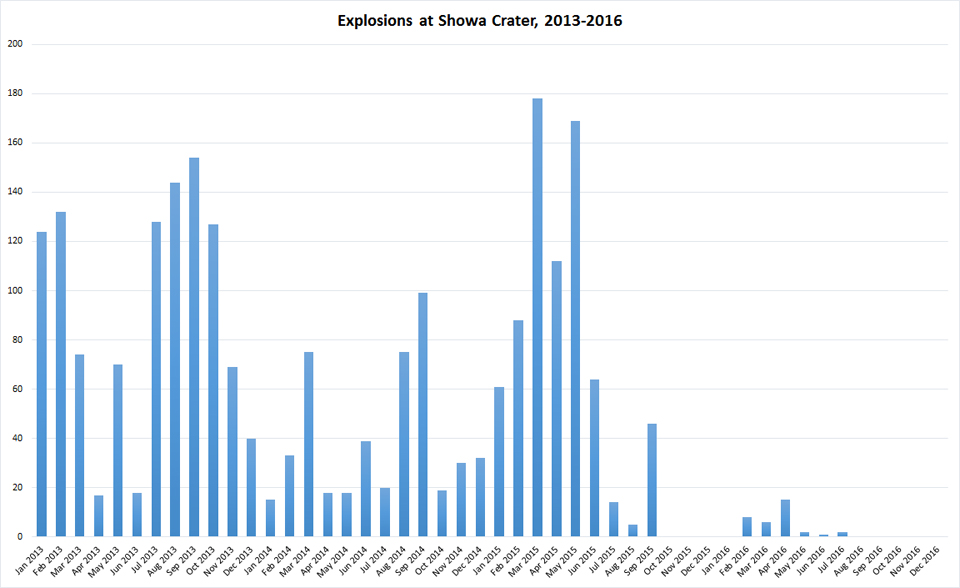
Table 30. Number of monthly explosive events, days of ashfall, area of ash covered, and sulfur dioxide emissions from Sakurajima’s Minamidake crater at Aira during July-October 2023. Note that smaller ash events are not listed. Ashfall days were measured at Kagoshima Local Meteorological Observatory and ashfall amounts represent material covering all the Kagoshima Prefecture. Data courtesy of JMA monthly reports.
| Month |
Explosive events |
Days of ashfall |
Ashfall amount (g/m2) |
SO2 emissions (tons/day) |
| Jul 2023 |
3 |
0 |
0 |
1,600-3,200 |
| Aug 2023 |
3 |
10 |
7 |
1,800-3,300 |
| Sep 2023 |
3 |
7 |
3 |
1,600-2,300 |
| Oct 2023 |
33 |
8 |
61 |
2,200-4,200 |
JMA reported that during July, there were eight eruptions, three of which were explosion events in the Showa crater. Large blocks were ejected as far as 600 m from the Showa crater. Very small eruptions were occasionally reported at the Minamidake crater. Nighttime incandescence was observed in both the Showa and Minamidake crater. Explosions were reported on 16 July at 2314 and on 17 July at 1224 and at 1232 (figure 151). Resulting eruption plumes rose 700-2,500 m above the crater and drifted N. On 23 July the number of volcanic earthquakes on the SW flank of the volcano increased. A strong Mw 3.1 volcanic earthquake was detected at 1054 on 26 July. The number of earthquakes recorded throughout the month was 545, which markedly increased from 73 in June. No ashfall was observed at the Kagoshima Regional Meteorological Observatory during July. According to a field survey conducted during the month, the daily amount of sulfur dioxide emissions was 1,600-3,200 tons per day (t/d).
There were three eruptions reported at the Minamidake crater during August, each of which were explosive. The explosions occurred on 9 August at 0345, on 13 August at 2205, and on 31 August at 0640, which generated ash plumes that rose 800-2,000 m above the crater and drifted W. There were two eruptions detected at Showa crater; on 4 August at 2150 ejecta traveled 800 m from the Showa crater and associated eruption plumes rose 2.3 km above the crater. The explosion at 2205 on 13 August generated an ash plume that rose 2 km above the crater and was accompanied by large blocks that were ejected 600 m from the Minamidake crater (figure 152). Nighttime crater incandescence was visible in a high-sensitivity surveillance camera at both craters. Seismicity consisted of 163 volcanic earthquakes, 84 of which were detected on the SW flank. According to the Kagoshima Regional Meteorological Observatory there was a total of 7 g/m2 of ashfall over the course of 10 days during the month. According to a field survey, the daily amount of sulfur dioxide emitted was 1,800-3,300 t/d.
During September, four eruptions were reported, three of which were explosion events. These events occurred at 1512 on 9 September, at 0018 on 11 September, and at 2211 on 13 September. Resulting ash plumes generally rose 800-1,100 m above the crater. An explosion produced an ash plume at 2211 on 13 September that rose as high as 1.7 km above the crater. Large volcanic blocks were ejected 600 m from the Minamidake crater. Smaller eruptions were occasionally observed at the Showa crater. Nighttime crater incandescence was visible at the Minamidake crater. Seismicity was characterized by 68 volcanic earthquakes, 28 of which were detected beneath the SW flank. According to the Kagoshima Regional Meteorological Observatory there was a total of 3 g/m2 of ashfall over the course of seven days during the month. A field survey reported that the daily amount of sulfur dioxide emitted was 1,600-2,300 t/d.
Eruptive activity during October consisted of 69 eruptions, 33 of which were described as explosive. These explosions occurred during 4 and 11-21 October and generated ash plumes that rose 500-3,600 m above the crater and drifted S, E, SE, and N. On 19 October at 1648 an explosion generated an ash plume that rose 3.6 km above the crater (figure 153). No eruptions were reported in the Showa crater; white gas-and-steam emissions rose 100 m above the crater from a vent on the N flank. Nighttime incandescence was observed at the Minamidake crater. On 24 October an eruption was reported from 0346 through 0430, which included an ash plume that rose 3.4 km above the crater. Ejected blocks traveled 1.2 km from the Minamidake crater. Following this eruption, small amounts of ashfall were observed from Arimura (4.5 km SE) and a varying amount in Kurokami (4 km E) (figure 154). The number of recorded volcanic earthquakes during the month was 190, of which 14 were located beneath the SW flank. Approximately 61 g/m2 of ashfall was reported over eight days of the month. According to a field survey, the daily amount of sulfur dioxide emitted was 2,200-4,200 t/d.
Geologic Background. The Aira caldera in the northern half of Kagoshima Bay contains the post-caldera Sakurajima volcano, one of Japan's most active. Eruption of the voluminous Ito pyroclastic flow accompanied formation of the 17 x 23 km caldera about 22,000 years ago. The smaller Wakamiko caldera was formed during the early Holocene in the NE corner of the caldera, along with several post-caldera cones. The construction of Sakurajima began about 13,000 years ago on the southern rim and built an island that was joined to the Osumi Peninsula during the major explosive and effusive eruption of 1914. Activity at the Kitadake summit cone ended about 4,850 years ago, after which eruptions took place at Minamidake. Frequent eruptions since the 8th century have deposited ash on the city of Kagoshima, located across Kagoshima Bay only 8 km from the summit. The largest recorded eruption took place during 1471-76.
Information Contacts: Japan Meteorological Agency (JMA), 1-3-4 Otemachi, Chiyoda-ku, Tokyo 100-8122, Japan (URL: http://www.jma.go.jp/jma/indexe.html); MIROVA (Middle InfraRed Observation of Volcanic Activity), a collaborative project between the Universities of Turin and Florence (Italy) supported by the Centre for Volcanic Risk of the Italian Civil Protection Department (URL: http://www.mirovaweb.it/); Copernicus Browser, Copernicus Data Space Ecosystem, European Space Agency (URL: https://dataspace.copernicus.eu/browser/).
Nishinoshima (Japan) — November 2023 Cite this Report
Nishinoshima
Japan
27.247°N, 140.874°E; summit elev. 100 m
All times are local (unless otherwise noted)
Gray emissions during October 2023
Nishinoshima is a small island in the Ogasawara Arc, about 1,000 km S of Tokyo, Japan. It contains prominent submarine peaks to the S, W, and NE. Recorded eruptions date back to 1973, with the current eruption period beginning in October 2022. Eruption plumes and fumarolic activity characterize recent activity (BGVN 48:10). This report covers the end of the eruption for September through October 2023, based on information from monthly reports of the Japan Meteorological Agency (JMA) monthly reports, and satellite data.
No eruptive activity was reported during September 2023, although JMA noted that the surface temperature was slightly elevated compared to the surrounding area since early March 2023. The Japan Coast Guard (JCG) conducted an overflight on 20 September and reported white gas-and-steam plumes rising 3 km above the central crater of the pyroclastic cone, as well as multiple white gas-and-steam emissions emanating from the N, E, and S flanks of the crater to the coastline. In addition, dark reddish brown-to-green discolored water was distributed around almost the entire circumference of the island.
Similar low-level activity was reported during October. Multiple white gas-and-steam emissions rose from the N, E, and S flanks of the central crater of the pyroclastic cone and along the coastline; these emissions were more intense compared to the previous overflight observations. Dark reddish brown-to-green discolored water remained visible around the circumference of the island. On 4 October aerial observations by JCG showed a small eruption consisting of continuous gas-and-steam emissions emanating from the central crater, with gray emissions rising to 1.5 km altitude (figure 129). According to observations from the marine weather observation vessel Keifu Maru on 26 October, white gas-and-steam emissions persisted from the center of the pyroclastic cone, as well as from the NW, SW, and SE coasts of the island for about five minutes. Slightly discolored water was visible up to about 1 km.
Frequent low-to-moderate power thermal anomalies were recorded in the MIROVA graph (Middle InfraRed Observation of Volcanic Activity) during September (figure 130). Occasional anomalies were detected during October, and fewer during November through December. A thermal anomaly was visible in the crater using infrared satellite imagery on 6, 8, 11, 16, 18, 21, and 23 September and 8, 13, 21, 26, and 28 October (figure 131).
Geologic Background. The small island of Nishinoshima was enlarged when several new islands coalesced during an eruption in 1973-74. Multiple eruptions that began in 2013 completely covered the previous exposed surface and continued to enlarge the island. The island is the summit of a massive submarine volcano that has prominent peaks to the S, W, and NE. The summit of the southern cone rises to within 214 m of the ocean surface 9 km SSE.
Information Contacts: Japan Meteorological Agency (JMA), 1-3-4 Otemachi, Chiyoda-ku, Tokyo 100-8122, Japan (URL: http://www.jma.go.jp/jma/indexe.html); MIROVA (Middle InfraRed Observation of Volcanic Activity), a collaborative project between the Universities of Turin and Florence (Italy) supported by the Centre for Volcanic Risk of the Italian Civil Protection Department (URL: http://www.mirovaweb.it/); Copernicus Browser, Copernicus Data Space Ecosystem, European Space Agency (URL: https://dataspace.copernicus.eu/browser/).
Kilauea (United States) — October 2023 Cite this Report
Kilauea
United States
19.421°N, 155.287°W; summit elev. 1222 m
All times are local (unless otherwise noted)
Strong lava fountains, lava flows, and spatter at Halema’uma’u during January-September 2023
Kīlauea is on the island of Hawai’i and overlaps the E flank of the Mauna Loa volcano. Its East Rift Zone (ERZ) has been intermittently active for at least 2,000 years. An extended eruption period began in January 1983 and was characterized by open lava lakes and lava flows from the summit caldera and the East Rift Zone. During May 2018 magma migrated into the Lower East Rift Zone (LERZ) and opened 24 fissures along a 6-km-long NE-trending fracture zone that produced lava flows traveling in multiple directions. As lava emerged from the fissures, the lava lake at Halema'uma'u drained and explosions sent ash plumes to several kilometers altitude (BGVN 43:10).
The current eruption period started during September 2021 and has been characterized by low-level lava effusions in the active Halema’uma’u lava lake (BGVN 48:01). This report covers three notable eruption periods during February, June, and September 2023 consisting of lava fountaining, lava flows, and spatter during January through September 2023 using information from daily reports, volcanic activity notices, and abundant photo, map, and video data from the US Geological Survey's (USGS) Hawaiian Volcano Observatory (HVO).
Activity during January 2023. Small earthquake swarms were recorded on 2 January 2023; increased seismicity and changes in the pattern of deformation were noted on the morning of 5 January. At around 1500 both the rate of deformation and seismicity drastically increased, which suggested magma movement toward the surface. HVO raised the Volcano Alert Level (VAL) to Watch (the second highest level on a four-level scale) and the Aviation Color Code (ACC) to Orange (the second highest color on a four-color scale) at 1520.
Multiple lava fountains and lava effusions from vents in the central eastern portion of the Halema’uma’u crater began on 5 January around 0434; activity was confined to the eastern half of the crater and within the basin of the western half of the crater, which was the focus of the eruption in 2021-2022 (figure 525). Incandescence was visible in webcam images at 1634 on 5 January, prompting HVO to raise the VAL to Warning (the highest level on a four-level scale) and the ACC to Red (the highest color on a four-color scale). Lava fountains initially rose as high as 50 m above the vent at the onset of the eruption (figure 526) but then declined to a more consistent 5-6 m height in the proceeding days. By 1930 that same day, lava had covered most of the crater floor (an area of about 1,200,000 m2) and the lava lake had a depth of 10 m. A higher-elevation island that formed during the initial phase of the December 2020 eruption remained exposed, appearing darker in images, along with a ring of older lava around the lava lake that was active prior to December 2022. Overnight during 5-6 January the lava fountains continued to rise 5 m high, and the lava effusion rate had slowed.
On 6 January at 0815 HVO lowered the VAL to Watch and the ACC to Orange due to the declining effusion rates. Sulfur dioxide emission rates ranged from 3,000-12,500 tonnes per day (t/d), the highest value of which was recorded on 6 January. Lava continued to erupt from the vents during 6-8 January, although the footprint of the active area had shrunk; a similar progression has been commonly observed during the early stages of recent eruptions at Halema’uma’u. On 9 January HVO reported one dominant lava fountain rising 6-7 m high in the E half of the crater. Lava flows built up the margins of the lake, causing the lake to be perched. On 10 January the eastern lava lake had an area of approximately 120,000 m2 that increased to 250,000 m2 by 17 January. During 13-31 January several small overflows occurred along the margins of the E lake. A smaller area of lava was active within the basin in the W half of the crater that had been the focus of activity during 2021-2022. On 19 January just after 0200 a small ooze-out was observed on the crater’s W edge.
Activity during February 2023. Activity continued in the E part of Halema’uma’u crater, as well as in a smaller basin in the W part of the 2021-2022 lava lake (figure 527). The E lava lake contained a single lava fountain and frequent overflows. HVO reported that during the morning of 1 February the large E lava lake began to cool and crust over in the center of the lake; two smaller areas of lava were observed on the N and S sides by the afternoon. The dominant lava fountain located in the S part of the lava lake paused for roughly 45 minutes at 2315 and resumed by midnight, rising 1-2 m. At 0100 on 2 February lava from the S part was effusing across the entire E lava lake area, covering the crusted over portion in the center of the lake and continuing across the majority of the previously measured 250,000 m2 by 0400. A small lava pond near the E lake produced an overflow around 0716 on 2 February. On 3 February some lava crust began to form against the N and E levees, which defined the 250,000 m2 eastern lava lake. The small S lava fountain remained active, rising 1-6 m high during 3-9 February; around 0400 on 5 February occasional bursts doubled the height of the lava fountain.
A large breakout occurred overnight during 2100 on 4 February to 0900 on 5 February on the N part of the crater floor, equal to or slightly larger in size than the E lava lake. A second, smaller lava fountain appeared in the same area of the E lava lake between 0300 and 0700 on 5 February and was temporarily active. This large breakout continued until 7 February. A small, brief breakout was reported in the S of the E lava lake around midnight on 7 February. In the W lake, as well as the smaller lava pond in the central portion of the crater floor, contained several overflows during 7-10 February and intermittent fountaining. Activity at the S small lava pond and the small S lava fountain within the E lake declined during 9-10 February. The lava pond in the central portion of the crater floor had nearly continuous, expansive flows during 10-13 February; channels from the small central lava pond seemed to flow into the larger E lake. During 13-18 February a small lava fountain was observed in the small lava pond in the central portion of the crater floor. Continuous overflows persisted during this time.
Activity in the eastern and central lakes began to decline in the late afternoon of 17 February. By 18 February HVO reported that the lava effusions had significantly declined, and that the eastern and central lakes were no longer erupting. The W lake in the basin remained active but at a greatly reduced level that continued to decline. HVO reported that this decrease in activity is attributed to notable deflationary tilt that began early on the morning of 17 February and lasted until early 19 February. By 19 February the W lake was mostly crusted over although some weak lava flows remained, which continued through 28 February. The sulfur dioxide emission rates ranged 250-2,800 t/d, the highest value of which was recorded on 6 February.
Activity during March 2023. The summit eruption at Halema’uma’u crater continued at greatly reduced levels compared to the previous two months. The E and central vents stopped effusing lava, and the W lava lake remained active with weak lava flows; the lake was mostly crusted over, although slowly circulating lava intermittently overturned the crust. By 6 March the lava lake in the W basin had stopped because the entire surface was crusted over. The only apparent surface eruptive activity during 5-6 March was minor ooze-outs of lava onto the crater floor, which had stopped by 7 March. Several hornitos on the crater floor still glowed through 12 March according to overnight webcam images, but they did not erupt any lava. A small ooze-out of lava was observed just after 1830 in the W lava lake on 8 March, which diminished overnight. The sulfur dioxide emission rate ranged from 155-321 t/d on 21 March. The VAL was lowered to Advisory, and the ACC was lowered to Yellow (the second lowest on a four-color scale) on 23 March due to a pause in the eruption since 7 March.
Activity during April-May 2023. The eruption at Halema’uma’u crater was paused; no lava effusions were visible on the crater floor. Sulfur dioxide emission rates ranged from 75-185 t/d, the highest of which was measured on 22 April. During May and June summit seismicity was elevated compared to seismicity that preceded the activity during January.
Activity during June 2023. Earthquake activity and changes in the patterns of ground deformation beneath the summit began during the evening of 6 June. The data indicated magma movement toward the surface, prompting HVO to raise the VAL to Watch and the ACC to Orange. At about 0444 on 7 June incandescence in Halema’uma’u crater was visible in webcam images, indicating that a new eruption had begun. HVO raised the VAL to Warning and the ACC to Red (the highest color on a four-color scale). Lava flowed from fissures that had opened on the crater floor. Multiple minor lava fountains were active in the central E portion of the Halema’uma’u crater, and one vent opened on the W wall of the caldera (figure 528). The eruptive vent on the SW wall of the crater continued to effuse into the lava lake in the far SW part of the crater (figure 529). The largest lava fountain consistently rose 15 m high; during the early phase of the eruption, fountain bursts rose as high as 60 m. Lava flows inundated much of the crater floor and added about 6 m depth of new lava within a few hours, covering approximately 10,000 m2. By 0800 on 7 June lava filled the crater floor to a depth of about 10 m. During 0800-0900 the sulfur dioxide emission rate was about 65,000 t/d. Residents of Pahala (30 km downwind of the summit) reported minor deposits of fine, gritty ash and Pele’s hair. A small spatter cone had formed at the vent on the SW wall by midday, and lava from the cone was flowing into the active lava lake. Fountain heights had decreased from the onset of the eruption and were 4-9 m high by 1600, with occasional higher bursts. Inflation switched to deflation and summit earthquake activity greatly diminished shortly after the eruption onset.
At 0837 on 8 June HVO lowered the VAL to Watch and the ACC to Orange because the initial high effusion rates had declined, and no infrastructure was threatened. The surface of the lava lake had dropped by about 2 m, likely due to gas loss by the morning of 8 June. The drop left a wall of cooled lava around the margins of the crater floor. Lava fountain heights decreased during 8-9 June but continued to rise to 10 m high. Active lava and vents covered much of the W half of Halema’uma’u crater in a broad, horseshoe-shape around a central, uplifted area (figure 530). The preliminary average effusion rate for the first 24 hours of the eruption was about 150 cubic meters per second, though the estimate did not account for vesiculated lava and variations in crater floor topography. The effusion rate during the very earliest phases of the eruption appeared significantly higher than the previous three summit eruptions based on the rapid coverage of the entire crater floor. An active lava lake, also referred to as the “western lava lake” was centered within the uplifted area and was fed by a vent in the NE corner. Two small active lava lakes were located just SE from the W lava lake and in the E portion of the crater floor.
During 8-9 June the lava in the central lava lake had a thickness of approximately 1.5 m, based on measurements from a laser rangefinder. During 9-12 June the height of the lava fountains decreased to 9 m high. HVO reported that the previously active lava lake in the E part of the crater appeared stagnant during 10-11 June. The surface of the W lake rose approximately 1 m overnight during 11-12 June, likely due to the construction of a levee around it. Only a few small fountains were active during 12-13 June; the extent of the active lava had retreated so that all activity was concentrated in the SW and central parts of Halema’uma’u crater. Intermittent spattering from the vent on the SW wall was visible in overnight webcam images during 13-18 June. On the morning of 14 June a weak lava effusion originated from near the western eruptive vent, but by 15 June there were no signs of continued activity. HVO reported that other eruptive vents in the SW lava lake had stopped during this time, following several days of waning activity; lava filled the lake by about 0.5 m. Lava circulation continued in the central lake and no active lava was reported in the northern or eastern parts of the crater. Around 0800 on 15 June the top of the SW wall spatter cone collapsed, which was followed by renewed and constant spattering from the top vent and a change in activity from the base vent; several new lava flows effused from the top of the cone, as well as from the pre-existing tube-fed flow from its base. Accumulation of lava on the floor resulted in a drop of the central basin relative to the crater floor, allowing several overflows from the SW lava lake to cascade into the basin during the night of 15 June into the morning of 16 June.
Renewed lava fountaining was reported at the eruptive vent on the SW side of the crater during 16-19 June, which effused lava into the far SW part of the crater. This activity was described as vigorous during midday on 16 June; a group of observatory geologists estimated that the lava was consistently ejected at least 10 m high, with some spatter ejected even higher and farther. Deposits from the fountain further heightened and widened the spatter cone built around the original eruptive vent in the lower section of the crater wall. Multiple lava flows from the base of the cone were fed into the SW lava lake and onto the southwestern-most block from the 2018 collapse within Halema’uma’u on 17 June (figure 531); by 18 June they focused into a single flow feeding into the SW lava lake. On the morning of 19 June a second lava flow from the base of the eruptive cone advanced into the SW lava lake.
Around 1600 on 19 June there was a rapid decline in lava fountaining and effusion at the eruptive vent on the SW side of the crater; vent activity had been vigorous up to that point (figure 532). Circulation in the lava lake also slowed, and the lava lake surface dropped by several meters. Overnight webcam images showed some previously eruptive lava still flowing onto the crater floor, which continued until those flows began to cool. By 21 June no lava was erupting in Halema’uma’u crater. Overnight webcam images during 29-30 June showed some incandescence from previously erupted lava flows as they continued to cool. Seismicity in the crater declined to low levels. Sulfur dioxide emission rates ranged 160-21,000 t/d throughout the month, the highest measurement of which was recorded on 8 June. On 30 June the VAL was lowered to Advisory (the second level on a four-level scale) and the ACC was lowered to Yellow. Gradual inflation was detected at summit tiltmeters during 19-30 June.
Activity during July-August 2023. During July, the eruption paused; no lava was erupting in Halema’uma’u crater. Nighttime webcam images showed some incandescence from previously erupted lava as it continued to cool on the crater floor. During the week of 14 August HVO reported that the rate in seismicity increased, with 467 earthquakes of Mw 3.2 and smaller occurring. Sulfur dioxide emission rates remained low, ranging from 75-86 t/d, the highest of which was recorded on 10 and 15 August. On 15 August beginning at 0730 and lasting for several hours, a swarm of approximately 50 earthquakes were detected at a depth of 2-3 km below the surface and about 2 km long directly S of Halema’uma’u crater. HVO reported that this was likely due to magma movement in the S caldera region. During 0130-0500 and 1700-2100 on 21 August two small earthquake swarms of approximately 20 and 25 earthquakes, respectively, occurred at the same location and at similar depths. Another swarm of 50 earthquakes were recorded during 0430-0830 on 23 August. Elevated seismicity continued in the S area through the end of the month.
Activity during September 2023. Elevated seismicity persisted in the S summit with occasional small, brief seismic swarms. Sulfur dioxide measurements were relatively low and were 70 t/d on 8 September. About 150 earthquakes occurred during 9-10 September, and tiltmeter and Global Positioning System (GPS) data showed inflation in the S portion of the crater.
At 0252 on 10 September HVO raised the VAL to Watch and the ACC to Orange due to increased earthquake activity and changes in ground deformation that indicated magma moving toward the surface. At 1515 the summit eruption resumed in the E part of the caldera based on field reports and webcam images. Fissures opened on the crater floor and produced multiple minor lava fountains and flows (figure 533). The VAL and ACC were raised to Warning and Red, respectively. Gas-and-steam plumes rose from the fissures and drifted downwind. A line of eruptive vents stretched approximately 1.4 km from the E part of the crater into the E wall of the down dropped block by 1900. The lava fountains at the onset of the eruption had an estimated 50 m height, which later rose 20-25 m high. Lava erupted from fissures on the down dropped block and expanded W toward Halema’uma’u crater. Data from a laser rangefinder recorded about 2.5 m thick of new lava added to the W part of the crater. Sulfur dioxide emissions were elevated in the eruptive area during 1600-1500 on 10 September, measuring at least 100,000 t/d.
At 0810 on 11 September HVO lowered the VAL and ACC back to Watch and Orange due to the style of eruption and the fissure location had stabilized. The initial extremely high effusion rates had declined (but remained at high levels) and no infrastructure was threatened. An eruption plume, mainly comprised of sulfur dioxide and particulates, rose as high as 3 km altitude. Several lava fountains were active on the W side of the down dropped block during 11-15 September, while the easternmost vents on the down dropped block and the westernmost vents in the crater became inactive on 11 September (figure 534). The remaining vents spanned approximately 750 m and trended roughly E-W. The fed channelized lava effusions flowed N and W into Halema’uma’u. The E rim of the crater was buried by new lava flows; pahoehoe lava flows covered most of the crater floor except areas of higher elevation in the SW part of the crater. The W part of the crater filled about 5 m since the start of the eruption, according to data from a laser rangefinder during 11-12 September. Lava fountaining continued, rising as high as 15 m by the morning of 12 September. During the morning of 13 September active lava flows were moving on the N and E parts of the crater. The area N of the eruptive vents that had active lava on its surface became perched and was about 3 m higher than the surrounding ground surface. By the morning of 14 September active lava was flowing on the W part of the down dropped block and the NE parts of the crater. The distances of the active flows progressively decreased. Spatter had accumulated on the S (downwind) side of the vents, forming ramparts about 20 m high.
Vigorous spattering was restricted to the westernmost large spatter cone with fountains rising 10-15 m high. Minor spattering occurred within the cone to the E of the main cone, but HVO noted that the fountains remained mostly below the rim of the cone. Lava continued to effuse from these cones and likely from several others as well, traveled N and W, confined to the W part of the down-dropped block and the NE parts of Halema’uma’u. Numerous ooze-outs of lava were visible over other parts of the crater floor at night. Laser range-finder measurements taken of the W part of the crater during 14-15 September showed that lava filled the crater by 10 m since the start of the eruption. Sulfur dioxide emissions remained elevated after the onset of the eruption, ranging 20,000-190,000 t/d during the eruption activity, the highest of which occurred on 10 September.
Field crews observed the eruptive activity on 15 September; they reported a notable decrease or stop in activity at several vents. Webcam images showed little to no fountaining since 0700 on 16 September, though intermittent spattering continued from the westernmost large cone throughout the night of 15-16 September. Thermal images showed that lava continued to flow onto the crater floor. On 16 September HVO reported that the eruption stopped around 1200 and that there was no observable activity anywhere overnight or on the morning of 17 September. HVO field crews reported that active lava was no longer flowing onto Halema’uma’u crater floor and was restricted to a ponded area N of the vents on the down dropped block. They reported that spattering stopped around 1115 on 16 September. Nighttime webcam images showed some incandescence on the crater floor as lava continued to cool. Field observations supported by geophysical data showed that eruptive tremor in the summit region decreased over 15-16 September and returned to pre-eruption levels by 1700 on 16 September. Sulfur dioxide emissions were measured at a rate of 800 t/d on 16 September while the eruption was waning, and 200 t/d on 17 September, which were markedly lower compared to measurements taken the previous week of 20,000-190,000 t/d.
Geologic Background. Kilauea overlaps the E flank of the massive Mauna Loa shield volcano in the island of Hawaii. Eruptions are prominent in Polynesian legends; written documentation since 1820 records frequent summit and flank lava flow eruptions interspersed with periods of long-term lava lake activity at Halemaumau crater in the summit caldera until 1924. The 3 x 5 km caldera was formed in several stages about 1,500 years ago and during the 18th century; eruptions have also originated from the lengthy East and Southwest rift zones, which extend to the ocean in both directions. About 90% of the surface of the basaltic shield volcano is formed of lava flows less than about 1,100 years old; 70% of the surface is younger than 600 years. The long-term eruption from the East rift zone between 1983 and 2018 produced lava flows covering more than 100 km2, destroyed hundreds of houses, and added new coastline.
Information Contacts: Hawaiian Volcano Observatory (HVO), U.S. Geological Survey, PO Box 51, Hawai'i National Park, HI 96718, USA (URL: http://hvo.wr.usgs.gov/).
Tinakula (Solomon Islands) — December 2023 Cite this Report
Tinakula
Solomon Islands
10.386°S, 165.804°E; summit elev. 796 m
All times are local (unless otherwise noted)
Continued lava flows and thermal activity during June through November 2023
Tinakula is a remote 3.5 km-wide island in the Solomon Islands, located 640 km ESE of the capital, Honiara. The current eruption period began in December 2018 and has more recently been characterized by intermittent lava flows and thermal activity (BGVN 48:06). This report covers similar activity during June through November 2023 using satellite data.
During clear weather days (20 July, 23 September, 23 October, and 12 November), infrared satellite imagery showed lava flows that mainly affected the W side of the island and were sometimes accompanied by gas-and-steam emissions (figure 54). The flow appeared more intense during July and September compared to October and November. According to the MODVOLC thermal alerts, there were a total of eight anomalies detected on 19 and 21 July, 28 and 30 October, and 16 November. Infrared MODIS satellite data processed by MIROVA (Middle InfraRed Observation of Volcanic Activity) detected a small cluster of thermal activity occurring during late July, followed by two anomalies during August, two during September, five during October, and five during November (figure 55).
Geologic Background. The small 3.5-km-wide island of Tinakula is the exposed summit of a massive stratovolcano at the NW end of the Santa Cruz islands. It has a breached summit crater that extends from the summit to below sea level. Landslides enlarged this scarp in 1965, creating an embayment on the NW coast. The Mendana cone is located on the SE side. The dominantly andesitic volcano has frequently been observed in eruption since the era of Spanish exploration began in 1595. In about 1840, an explosive eruption apparently produced pyroclastic flows that swept all sides of the island, killing its inhabitants. Recorded eruptions have frequently originated from a cone constructed within the large breached crater. These have left the upper flanks and the steep apron of lava flows and volcaniclastic debris within the breach unvegetated.
Information Contacts: MIROVA (Middle InfraRed Observation of Volcanic Activity), a collaborative project between the Universities of Turin and Florence (Italy) supported by the Centre for Volcanic Risk of the Italian Civil Protection Department (URL: http://www.mirovaweb.it/); Hawai'i Institute of Geophysics and Planetology (HIGP) - MODVOLC Thermal Alerts System, School of Ocean and Earth Science and Technology (SOEST), Univ. of Hawai'i, 2525 Correa Road, Honolulu, HI 96822, USA (URL: http://modis.higp.hawaii.edu/); Copernicus Browser, Copernicus Data Space Ecosystem, European Space Agency (URL: https://dataspace.copernicus.eu/browser/).
Search Bulletin Archive by Publication Date
Select a month and year from the drop-downs and click "Show Issue" to have that issue displayed in this tab.
The default month and year is the latest issue available.
Bulletin of the Global Volcanism Network - Volume 43, Number 02 (February 2018)
Aira (Japan)
Explosions gradually decrease in frequency during 2015-2016
Ambae (Vanuatu)
New eruption begins in early September 2017, forcing evacuation of thousands
Ambrym (Vanuatu)
Elevated seismicity in early August 2017-early November 2017, lava lakes remain
Fernandina (Ecuador)
Brief fissure eruption sends lava flow down the SW flank in early September 2017
Fuego (Guatemala)
Seven eruptive episodes during July-December 2017
Sheveluch (Russia)
Ash explosions, pyroclastic flows, and lava dome growth continue through January 2018
Stromboli (Italy)
Moderate increase in thermal energy and explosion rate, April-August 2017
Tinakula (Solomon Islands)
Short-lived ash emission and large SO2 plume 21-26 October 2017; historical eruption accounts
Tungurahua (Ecuador)
Ash emissions, explosions, and pyroclastic flows 26 February-16 March 2016; no further activity through 2017
Yasur (Vanuatu)
Typical ongoing eruptive activity and thermal anomalies through January 2018
Aira
Japan
31.5772°N, 130.6589°E; summit elev. 1117 m
All times are local (unless otherwise noted)
Explosions gradually decrease in frequency during 2015-2016
Sakurajima rises from Kagoshima Bay, which fills the Aira Caldera near the southern tip of Japan's Kyushu Island. Frequent explosive and occasional effusive activity has been ongoing for centuries. The Minamidake summit cone has been the location of persistent activity since 1955; the Showa crater on its E flank has been the most active site since 2006. Tens of explosions and ash-bearing emissions have been occurring monthly for the last several years and were continuous through October 2015. After a three-month break, activity resumed in February 2016 and lasted through August 2016. No further activity was reported through December 2016. The Japan Meteorological Agency (JMA) provided regular reports on activity, and the Tokyo VAAC (Volcanic Ash Advisory Center) issued hundreds of reports about ash plumes during 2015-2016.
The number of explosive events at the Showa crater of Sakurajima increased from January-May 2015. During the period, ash emissions commonly rose 3,000 m above the crater rim, and a few exceeded 4,000 m; tephra was often ejected 1.3 km and as far as 1.8 km from the crater. Incandescence was observed every week; multiple MODVOLC thermal alerts were reported monthly from January-June 2015. The Tokyo VAAC issued 845 reports between 1 January and 14 October 2015. The number of monthly explosions decreased sharply during June-August. Tiltmeter and strainmeter data indicated continuing inflation through mid-August when the inflation rate increased significantly for a brief period. This was followed by deflation for the remainder of 2015. Pyroclastic flows were reported in March, April, and June. Minor emissions occurred at Minamidake crater in May, June, and August. Activity increased at both craters during September, with the first substantial explosion at Minamidake in almost a year. An emission from Showa on 2 November 2015 was noted in a JMA weekly report, but its composition was not described; the last confirmed ash emission of the year was on 14 October 2015.
After three months of quiet, a substantial explosion at Showa in early February 2016 marked the beginning of a new eruptive episode that continued through the end of July, after which explosive activity ceased at Showa for the remainder of the year (figure 49). Minor emissions were reported at Minamidake through August 2016. Pyroclastic flows occurred in April and June from explosions at the Showa crater. Inflation was measured again beginning in April 2016 and continued through December 2016.
Activity during January-May 2015. JMA reported 61 explosions from the Showa crater during January 2015, twice the number recorded in December 2014 (figure 50). Explosions on 4 and 30 January sent ejecta as far as 1.8 km from the crater. The maximum plume height reported by JMA was 4,000 m above the crater rim on 23 January. Lapilli up to 2 cm in diameter from recent explosions were found in Kurokami (3.5 km E) and Arimura (3 km S) during JMA field visits on 16 and 30 January.
The number of explosions increased to 88 during February 2015, with events on 21 and 22 February sending tephra 1.8 km from the crater. Plumes rose as much as 3,500 m above the rim during the month. During a field survey on 4 March scientists observed ash deposits with fragments up to 2 cm in diameter, in an area 3 km S of Showa Crater. JMA reported that the largest number of explosions they have recorded in a month, 178, occurred at the crater in March. Numerous plumes rose 3,300 m above the crater. A small pyroclastic flow on 17 March traveled 600 m SE.
Seismicity below the island increased briefly between 31 March and 2 April 2015. An explosion on 17 April sent tephra 1.8 km from the crater rim. Two pyroclastic flows were reported on 18 and 28 April 2015; Showa crater had 112 explosions throughout the month. The pyroclastic flow on 28 April travelled 500 m down the SE flank. The highest ash plume rose 4,000 m on 24 April. JMA calculated that about 1.2 million tons of ash fell during April, the largest monthly amount recorded since 2006.
Several of the 169 explosions at the Showa crater during May 2015 produced ejecta that was deposited up to 1.8 km from the crater. Many explosions had plume heights exceeding 3,000 m. A small emission, rising 200 m, was observed from the Minamidaki crater on 12 May and was the first in several months. JMA scientists observed 2-cm-diameter tephra in the vicinity of Kurojin-cho, Kagoshima-shi on 14 May, likely from an explosion the previous day; significant ashfall covered the ground as well. The highest ash plume of the month rose 4,300 m above the Showa crater on 21 May 2015 (figures 51 and 52).
Activity during June-December 2015. Five of the 64 explosions recorded during June produced ejecta that landed up to 1.3 km from the Showa Crater (figure 53). A 3,300-m-high ash plume on 1 June was the highest for the month. After three explosions on 4 June, a small pyroclastic flow traveled 400 m down the E flank. A second small event on 22 June at Minamidake produced a gray plume that rose 200 m.
Activity decreased significantly beginning in July 2015, with 14 explosions reported from the Showa Crater, and declined further during August with only 5 explosions. A small explosion from the Minamidake crater on 16 July sent emissions likely containing ash (described as "non-white") to 200 m. A rapid increase in seismicity directly beneath Minamidake began on 15 August and lasted about 48 hours; along with tiltmeter and strainmeter observations of rapid inflation (figure 54), this led JMA to briefly raise the Alert Level from 3 (Do not approach the volcano) to 4 (Prepare to evacuate) an a scale of 1-5. They lowered it back to 3 on 1 September 2015. Only small explosions with tephra ejected up to 800 m were recorded during the rest of the August. Minor emissions occurred at Minamidake Crater on 30 August.
Incandescence at the Showa Crater was observed several times during September 2015; 46 explosive events were reported. The first significant explosions at the Minamidake summit crater since 7 November 2014 occurred on 13 and 28 September. The 28 September plume rose to 2,700 m above the crater rim. Tiltmeter data indicated no additional inflation since the rapid ground deformation of 15-16 August. The last explosive event of 2015 reported by JMA at the Showa crater was on 17 September and at the Minamidaki crater on 29 September.
The Tokyo VAAC reported an ash emission on 14 October 2015 that rose to 1.8 km and drifted SW. This was the last VAAC report until 5 February 2016. No explosions were recorded at the Showa crater in October, but minor ash emissions were reported on 14, 15, 21, 22, and 30 October. No activity was observed at Minamidake. Data from continuous GNSS (Global Navigation Satellite System) observations suggested that deflation began after the 15 August rapid inflation event.
A minor emission was reported by JMA from the Showa crater on 2 November 2015, the last emission reported for the year. After not having explosive activity since late September, JMA lowered the Alert Level to 2 (Do not approach the crater) on 25 November, reducing the exclusion area to 1 km around the two craters. Only steam plumes rising 50-200 m above the Showa crater and 50-600 m above the Minamidake crater were observed during December 2015.
Aerial observation on 2 December 2015 revealed 100-m-high steam plumes around the floor of the Showa crater. Thermal observations showed high heat flow around the edges and at the center of the crater floor, unchanged since the previous observation in August 2015; 200-m-high steam plumes around the Minamidake crater prevented observation of the crater floor.
Activity during 2016. No explosive activity was observed at Showa or Minamidake craters from October 2015 to 5 February 2016. JMA raised the Alert Level back to 3 after a substantial explosion on 5 February sent incandescent tephra up to 1.8 km from the Showa crater; lightning was observed in the ash cloud (figure 55). The Tokyo VAAC reported that an ash plume visible in satellite imagery was at 3 km altitude drifting SE. Multiple explosions continued from the Showa crater for the rest of February with ash plumes rising to 2.2 km above the crater, and tephra was frequently ejected 1.3 km from the crater. Four MODVOLC thermal alerts in February were the only alerts for 2016. At the Minamidake summit crater, minor emissions occurred on 8, 9, and 20 February with plumes rising 800 m above the crater rim.
Eight explosions at the Showa crater were reported by JMA, and six at the Minamidake summit crater during March 2016. Ash plumes at Minamidake on 4, 8, and 11 March rose 1,600-1,900 m above the crater rim; on 25 and 26 March they rose 2,000 m. Minor emissions were also noted on 14 and 15 March. Three explosions from the Showa Crater on 26 March sent ash plumes 2,700 m high (figure 56); tephra as large as 8 mm in diameter was found in areas 4 km E.
Activity increased during April 2016 with 51 emission events that included 15 explosions at Showa, and JMA reported inflation again after several months of stability. Reports of falling tephra, 2 cm in diameter, came from a town 3 km S after explosions were witnessed during 1-3 April. On 1 April, an explosion at Minamidake summit crater produced an ash plume which rose 800 m above its crater rim; another on 3 April rose 1,700 m. Minor emissions also occurred at Minamidake on 5, 6, and 9 April. Explosions on 6 and 8 April at Showa sent ash plumes 3,500-3,700 m high and tephra 1.3 km. During the 8 April explosion at Showa, a small pyroclastic flow traveled 400 m down the E flank, the first since June 2015. A 2,200-m-high ash plume rose from Showa crater on 17 April. Minor emissions that rose 800 m were detected at Minamidake on 20 and 28 April. Two explosions occurred on 27 April at Showa, followed by additional explosions on 28, 29, and 30 April; the events generated ash plumes that rose 3,000 m. Pyroclastic flows were generated during the events of 28 and 30 April; they each flowed about 500 m, SE and E, respectively.
A large explosion at the Showa crater on 1 May sent an ash plume to 4,100 m above the crater rim (figure 57). It was the first time since 21 May 2015 that a plume rose higher than 4,000 m. At the Minamidake summit crater, ash emissions on 1 and 13 May rose 3,500 and 3,700 m, respectively, the first plumes at Minamidake over 3,000 m since October 2009. An explosion on 8 May at Showa sent an ash plume over 3,300 m above the crater rim, and tephra reached 1,300 m from the crater. Numerous ash emissions continued throughout the month, some with plumes rising to 3,500 m. The Tokyo VAAC issued 26 reports between 13 and 22 May. Activity diminished toward the end of the month, but minor inflation continued.
Multiple ash emissions in early June 2016 produced plumes as high as 2,000 m above the Showa crater rim. An explosion on 3 June produced a pyroclastic flow that traveled 400 m SE, and tephra that was ejected 800 m from the crater. An emission at the Minamidake crater on 3 June rose 1,500m high. No further explosive activity was reported for June; only a minor emission from the Showa crater on 29 June. During the month, the Tokyo VAAC issued only six reports (during 2-3 June).
Two explosive events were recorded at Showa crater in July 2016. An explosion occurred on 2 July that produced a 1,200-m-high ash plume and sent large blocks 800 m from the crater. A substantial explosion on 26 July at Showa sent blocks 800 m from the crater, and produced an ash plume that rose 5,000 m. A minor amount of ashfall on the W and SW flanks of Sakurajima was observed, and ashfall was confirmed in a wide area from Kagoshima City (10 km W) to Hioki City (25 km NW). The Tokyo VAAC reported an ash plume drifting SW at 6.1 km altitude that day.
Minor emissions were observed at the Minamidake crater intermittently throughout August 2016, but no emissions or explosions were reported from Showa. The Tokyo VAAC reported a low-level ash plume on 22 August at 1.2 km altitude drifting 50 km SW (figure 58). This was the last VAAC report for 2016. Although there were no emissions or explosive activity reported from either crater during September-December 2016, inflation of the volcano continued, and thus the Alert Level remained at 3.
Geologic Background. The Aira caldera in the northern half of Kagoshima Bay contains the post-caldera Sakurajima volcano, one of Japan's most active. Eruption of the voluminous Ito pyroclastic flow accompanied formation of the 17 x 23 km caldera about 22,000 years ago. The smaller Wakamiko caldera was formed during the early Holocene in the NE corner of the caldera, along with several post-caldera cones. The construction of Sakurajima began about 13,000 years ago on the southern rim and built an island that was joined to the Osumi Peninsula during the major explosive and effusive eruption of 1914. Activity at the Kitadake summit cone ended about 4,850 years ago, after which eruptions took place at Minamidake. Frequent eruptions since the 8th century have deposited ash on the city of Kagoshima, located across Kagoshima Bay only 8 km from the summit. The largest recorded eruption took place during 1471-76.
Information Contacts: Japan Meteorological Agency (JMA), Otemachi, 1-3-4, Chiyoda-ku Tokyo 100-8122, Japan (URL: http://www.jma.go.jp/jma/indexe.html); Tokyo Volcanic Ash Advisory Center (VAAC), 1-3-4 Otemachi, Chiyoda-ku, Tokyo, Japan (URL: http://ds.data.jma.go.jp/svd/vaac/data/); Hawai'i Institute of Geophysics and Planetology (HIGP), MODVOLC Thermal Alerts System, School of Ocean and Earth Science and Technology (SOEST), Univ. of Hawai'i, 2525 Correa Road, Honolulu, HI 96822, USA (URL: http://modis.higp.hawaii.edu/); NASA Earth Observatory, EOS Project Science Office, NASA Goddard Space Flight Center, Goddard, Maryland, USA (URL: http://earthobservatory.nasa.gov/); Japan Aerospace Exploration Agency (JAXA) (URL: http://global.jaxa.jp/); Associated Press (URL: http://www.ap.org/); Tom Pfeiffer, Volcano Discovery (URL: http://www.volcanodiscovery.com/ ); Naoto Yoshidome, Twitter (URL: https://twitter.com); Minaminihon Broadcasting Co., Ltd (MBC). (http://www.mbc.co.jp/web-cam/).
Ambae
Vanuatu
15.389°S, 167.835°E; summit elev. 1496 m
All times are local (unless otherwise noted)
New eruption begins in early September 2017, forcing evacuation of thousands
Ambae (formerly called Aoba) is a large basaltic shield volcano in the New Hebrides arc that has generated periodic phreatic and pyroclastic explosions originating in the summit crater lakes Manaro Lakua and Voui during the last 25 years; the central edifice with the active summit craters is also commonly referred to as Lombenben, Manaro Voui, or simply the Manaro volcano. From late November 2005 to mid-February 2006 explosions from Lake Voui resulted in the formation of a pyroclastic cone in the lake. By late November 2006 the side of the cone was breached, and its central crater filled with lake water (figure 30, BGVN 31:12). The Vanuatu Meteorology and Geo-Hazards Department (VMGD) reported intermittent increases in degassing activity between 2006 and August 2017, and minor ash emissions during June-July 2011 and August 2016. An explosive eruption from a new pyroclastic cone in the lake began in mid-September 2017 and lasted through mid-November. This report summarizes activity between 2010 and the new eruption in September 2017 and provides details for the eruption through December 2017, with information provided primarily by the Vanuatu Geohazards Observatory of VMGD, the Wellington Volcanic Ash Advisory Center (VAAC), and satellite data from several sources.
Local ashfall around the pyroclastic cone in Lake Voui during June-July 2011 and August 2016 were the only eruptive events between February 2006 and September 2017, although intermittent SO2 emissions were noted throughout the period. Renewed explosive activity was reported beginning on 6 September 2017. Lava was first observed on 22 September emerging from a vent at the summit of the pyroclastic cone. Ash plumes and fountaining lava persisted for a few weeks as the pyroclastic cone increased in size. Activity became more intermittent by mid-October, but explosions still produced ash plumes; the highest was reported at 9.1 km altitude. Pulses of thermal activity suggesting lava flows continued through early November. The last ash emission of the year was reported on 23 November 2017, after which only steam and gas were noted.
Activity during 2010-August 2017. After several years of quiet since early 2006, substantial gas plumes were observed beginning in December 2009 and the Volcanic Alert Level was raised to 1 (on a 0-5 scale). Plumes of gas emissions were observed during 6-11 April 2010, and steam emissions were photographed during 3-4 June 2010 (figure 32).
Sulfur dioxide emissions were often elevated, and plumes were identified multiple times with satellite instruments during 2011 (figure 33). Local ashfall around the crater of the pyroclastic cone in Lake Voui was reported after explosions and seismicity on 4 June 2011; additional explosions occurred on 10 July 2011. Compared to January 2010, the cone was significantly eroded when photographed on 12 July 2011.
While no ash emissions or explosions were reported during 2012 from Ambae, SO2 plumes were recorded by satellite instruments every month except June and August (figure 34). Villagers in Ambanga reported a "phase of minor activity" beginning in December 2012. Increased SO2 plumes were recorded in satellite data during December as well (figure 35). Nearby Ambrym often produces large SO2 plumes which obscure SO2 emissions from Ambae.
Site observations during 30 January-2 February 2013 confirmed continuing degassing at Lake Voui, and remnants of the old pyroclastic cone still visible in the lake. The Aura satellite instrument detected SO2 emissions a number of times throughout 2013-2016 (figure 36), and VMGD noted continuing unrest multiple times during 2015.
VMGD reported that during 18-19 August 2016 a steam plume was accompanied by a small ash emission in the caldera area. The Vanuatu Volcanic Alert Level (VVAL) was raised from 1 to 2 on 21 August 2016 and remained there for just over a year. Changing conditions were first reported by VMGD on 30 August 2017.
Activity during September-December 2017. The Alert Level was raised to 3 on 6 September 2017, indicating that a minor eruption was occurring. A week later VMGD reminded residents of the 3 km danger zone around the lake and added a 1 km exclusion zone within that area (figure 37). Explosive activity began building a new pyroclastic cone in Lake Voui, and ash plumes generated local ashfall on the island.
On 22 September 2017, lava was observed at the surface by VMGD staff, there was a MODVOLC thermal alert, and a volcanic ash advisory was issued by the Wellington VAAC. The VAAC report estimated the ash plume observed in satellite data to be at an altitude of 3 km drifting E. On 23 September the VMGD stated that activity had continued to increase, prompting them to raise the VVAL to 4, indicating that a moderate eruption was taking place. They warned that ejecta and gas would affect an area within 6.5 km of Lake Voui, and many communities were at risk from various types of volcanic activity (figure 38). A dense plume of dark ash was photographed on 23 September by airplane travelers going to Ambae (figure 39).
Eruptive activity increased over the next few days. Larger explosions generated ash plumes that caused local ashfall. A photo taken on 24 September showed incandescent ejections and an ash plume rising from the pyroclastic cone (figure 40). The Wellington VAAC reported intermittent emissions that day at 2.4 km altitude drifting N, and again on 26 September at 2.1 km altitude drifting W. The New Zealand Defense Force conducted an overflight on 25 September 2017 and witnessed incandescence at the summit and lava flowing into the lake (figures 41, 42, and 43).
A 27 September a news article from ABC.net stated that about 8,000 residents had been evacuated from the northern and southern parts of the island to eastern and western areas. An overflight by the New Zealand Defence Force showed ongoing activity. Multiple MODVOLC thermal alerts were issued nearly every day from 22 September through 7 October.
Photographs and thermal infrared images taken by VMGD during observation flights on 30 September and 1 October 2017 showed explosions of tephra, and lava flowing from small vents into the lake (figures 44-48). The number of vents on the cone varied from 2 to 4 during the observation flights.
On 6 October 2017, the VMGD noted that there was no evidence of the eruption escalating; the Alert Level was lowered to 3 and residents and tourists were reminded to stay outside of the Red Zone, defined as a 3 km radius around the active cone. The Wellington VAAC reported ash emissions on 9 October visible in satellite imagery spreading N of the island as high as 3.7 km altitude. They reported low-level (2.4-4.6 km) ash plumes daily through 15 October. A short-lived eruption on 13 October produced an ash plume clearly visible in satellite imagery that rose to 9.1 km altitude.
Webcam observations and seismic analysis reported on 13 October by VMGD indicated ongoing minor explosive activity and ash emission from vents on the cone in Lake Voui over the previous several days (figure 49). Lava had apparently ceased flowing to the lake. The local population from Ambae and neighboring islands could still hear some of the explosions, see volcanic ash and gas plumes, and see incandescence at night. Multiple MODVOLC thermal alerts were issued on 15 and 16 October, and again during 19-23 October. Wellington VAAC reports during 22-23 October indicated intermittent low-level ash plumes at 2.4-3.7 km altitude moving E.
A new surge of activity created multiple MODVOLC thermal alerts between 27 October and 1 November 2017. The Wellington VAAC reported an ash plume on 29 October at 6.1 km altitude drifting SE. The activity ceased, and the plume dissipated by the end of the day. VMGD reported on 31 October that seismic activity was ongoing, and explosions could be seen in webcam photos; incandescence and explosions were also heard and seen from neighboring islands at night.
Webcam photos from 5 and 6 November showed that ash emissions and incandescent explosions continued (figures 50 and 51). The Wellington VAAC reported an ash emission rising to 4.3 km altitude and drifting W on 5 November. By the next day the altitude of the ash plume had dropped to 2.1 km. This was followed late on 6 November by an ash emission reported at 3.9 km altitude extending 25 km W and SW of the volcano, which continued through the next day. Another emission on 8 November drifted W at 3 km altitude for several hours before dissipating. Fourteen MODVOLC thermal alerts were issued on 5 November, and two more the next day. A final alert on 9 November was the last for 2017.
VGO reported on 8 November 2017 that the eruption had been continuing, and photos taken during the first week of the month confirmed that the pyroclastic cone in Lake Voui continued to grow in height and size, with frequent explosions and ash plumes. The Wellington VAAC reported a ground observation of an ongoing minor eruption on 21 November that produced an ash plume that rose to 1.8 km altitude. By the following day, the plume appeared to be mostly steam. A new eruption the next day (23 November) produced a plume estimated at 3.7 km altitude moving W. An ash emission later that day was estimated at 3 km altitude drifting N based on satellite imagery. It had dissipated by the following day, and there were no further VAAC reports issued during 2017.
By 7 December 2017, activity had decreased significantly, and emissions consisted of only steam and gas plumes; VMGD lowered the Alert Level from 3 to 2, and reduced the restricted area to within 2 km of the active vent in Lake Voui, noting that the eruption had ceased. The MIROVA plot of Log Radiative Power at Ambae (Aoba) correlates well with visual and thermal observations of activity between 23 September and early November 2017 (figure 52). Significant quantities of SO2 were released at Ambae during October-December 2017 (figure 53). SO2 emissions continued into December after the ash emissions ceased.
Geologic Background. The island of Ambae, also known as Aoba, is a massive 2,500 km3 basaltic shield that is the most voluminous volcano of the New Hebrides archipelago. A pronounced NE-SW-trending rift zone with numerous scoria cones gives the 16 x 38 km island an elongated form. A broad pyroclastic cone containing three crater lakes (Manaro Ngoru, Voui, and Manaro Lakua) is located at the summit within the youngest of at least two nested calderas, the largest of which is 6 km in diameter. That large central edifice is also called Manaro Voui or Lombenben volcano. Post-caldera explosive eruptions formed the summit craters about 360 years ago. A tuff cone was constructed within Lake Voui (or Vui) about 60 years later. The latest known flank eruption, about 300 years ago, destroyed the population of the Nduindui area near the western coast.
Information Contacts: Geo-Hazards Division, Vanuatu Meteorology and Geo-Hazards Department, Ministry of Climate Change Adaptation, Meteorology, Geo-Hazards, Energy, Environment and Disaster Management, Private Mail Bag 9054, Lini Highway, Port Vila, Vanuatu (URL: http://www.vmgd.gov.vu/, https://www.facebook.com/VanuatuGeohazardsObservatory/); Hawai'i Institute of Geophysics and Planetology (HIGP), MODVOLC Thermal Alerts System, School of Ocean and Earth Science and Technology (SOEST), Univ. of Hawai'i, 2525 Correa Road, Honolulu, HI 96822, USA (URL: http://modis.higp.hawaii.edu/); MIROVA (Middle InfraRed Observation of Volcanic Activity), a collaborative project between the Universities of Turin and Florence (Italy) supported by the Centre for Volcanic Risk of the Italian Civil Protection Department (URL: http://www.mirovaweb.it/); Wellington Volcanic Ash Advisory Centre (VAAC), Meteorological Service of New Zealand Ltd (MetService), PO Box 722, Wellington, New Zealand (URL: http://www.metservice.com/vaac/, http://www.ssd.noaa.gov/VAAC/OTH/NZ/messages.html); NASA Goddard Space Flight Center (NASA/GSFC), Global Sulfur Dioxide Monitoring Page, Atmospheric Chemistry and Dynamics Laboratory, 8800 Greenbelt Road, Goddard, Maryland, USA (URL: https://so2.gsfc.nasa.gov/); New Zealand Defence Force (URL: http://www.nzdf.mil.nz/); BBC News (URL: http://www.bbc.com/news); ABC News (http://abcnews.go.com/); Batik Bong Shem, Facebook (URL: https://www.facebook.com/batick.shem); Yumi Toktok Stret News, Facebook URL: https://www.facebook.com/ytsnews.today/); Geoff Reid NZ, Facebook (URL: https://www.facebook.com/GeoffReidNZ/).
Ambrym (Vanuatu) — February 2018 Cite this Report
Ambrym
Vanuatu
16.25°S, 168.12°E; summit elev. 1334 m
All times are local (unless otherwise noted)
Elevated seismicity in early August 2017-early November 2017, lava lakes remain
Occasional weak eruptions and low-level ash emissions are typical of activity at Ambrym. The most recent ash emission was on 3 April 2017 (BGVN 42:05). The current report summarizes activity from late April through December 2017.
On 30 August 2017, the Vanuatu Meteorology and Geo-Hazards Department (VMGD) reported that "drastic changes" at Ambrym prompted an increase in the Alert Level from 2 to 3 (on a scale of 0-5). Areas deemed hazardous were near and around the active vents (Benbow, Maben-Mbwelesu, Niri-Mbwelesu and Mbwelesu), and in downwind areas prone to ashfall. According to a news report (Radio New Zealand), a representative of VMGD indicated that the Alert Level change was based on increased seismicity detected since the beginning of August, but which became more notable on 25 August.
According to VMGD, aerial observations on 24 and 30 September, and 1 and 6 October, combined with analysis of seismic data, confirmed that minor eruptive activity within the caldera was characterized by hot volcanic gas and steam emissions. Areas deemed hazardous were within a 2-km radius from Benbow Crater and a 3-km radius from Marum Crater.
A news report (The Vanuatu Independent) quoted an official from VMGD as stating that on 8 November 2017 at 0500, the Niri-Mbwelesu eruptive vent emitted a minor ash plume. On 7 December 2017, VGO lowered the Alert Level to 2, noting that activity had stabilized by the end of November and was characterized by gas-and-steam emissions. Seismicity had also declined. The report reminded the public to stay outside of the Permanent Danger Zone, defined as a 1-km radius from Benbow Crater and a 2.7-km radius from Marum Crater.
During the reporting period, thermal anomalies based on MODIS satellite instruments and analyzed using the MODVOLC algorithm, continued to be numerous every month, possibly reflecting lava lakes in Benbow and Marum craters. The MIROVA (Middle InfraRed Observation of Volcanic Activity) system also detected numerous hotspots every month within 5 km of the volcano.
Geologic Background. Ambrym is a large basaltic volcano with a 12-km-wide caldera formed during a major Plinian eruption with dacitic pyroclastic flows about 1,900 years ago. A thick, almost exclusively pyroclastic sequence, initially dacitic then basaltic, overlies lava flows of a pre-caldera shield volcano. Post-caldera eruptions, primarily from Marum and Benbow cones, have partially filled the caldera floor and produced lava flows that ponded on the floor or overflowed through gaps in the caldera rim. Post-caldera eruptions have also formed a series of scoria cones and maars along a fissure system oriented ENE-WSW. Eruptions have been frequently reported since 1774, though mostly limited to extra-caldera eruptions that would have affected local populations. Since 1950 observations of eruptive activity from cones within the caldera or from flank vents have occurred almost yearly.
Information Contacts: Geo-Hazards Division, Vanuatu Meteorology and Geo-Hazards Department, Ministry of Climate Change Adaptation, Meteorology, Geo-Hazards, Energy, Environment and Disaster Management, Private Mail Bag 9054, Lini Highway, Port Vila, Vanuatu (URL: http://www.vmgd.gov.vu/, https://www.facebook.com/VanuatuGeohazardsObservatory/); Radio New Zealand (URL: https://www.radionz.co.nz); The Vanuatu Independent (URL: https://vanuatuindependent.com/); Hawai'i Institute of Geophysics and Planetology (HIGP), MODVOLC Thermal Alerts System, School of Ocean and Earth Science and Technology (SOEST), Univ. of Hawai'i, 2525 Correa Road, Honolulu, HI 96822, USA (URL: http://modis.higp.hawaii.edu/); Middle InfraRed Observation of Volcanic Activity (MIROVA), Mirova (collaborative project between the Universities of Turin and Florence, Italy)(URL: http://www.mirovaweb.it).
Fernandina (Ecuador) — February 2018 Cite this Report
Fernandina
Ecuador
0.37°S, 91.55°W; summit elev. 1476 m
All times are local (unless otherwise noted)
Brief fissure eruption sends lava flow down the SW flank in early September 2017
Eruptions at Fernandina Island in the Galapagos often occur from vents located around the caldera rim along boundary faults and fissures, and occasionally from side vents on the flank. The last eruption in 2009 generated fountaining basaltic lava along several fissure vents. Lava flowed down the SW flank and entered the sea for a few weeks during April 2009. A new eruption began on 4 September 2017 after eight years of no surface activity, and lasted for about one week. Information about this new eruption was provided by Ecuador's Institudo Geofisica, Escuela Politécnica Nacional (IG-EPN), the Dirección del Parque Nacional Galápagos (DPNG), the Washington Volcanic Ash Advisory Center (VAAC), and several sources of satellite data.
A brief fissure vent eruption began on 4 September 2017 at Fernandina, located at the SW rim of the caldera. Small amounts of ash were noted in the plume that rose 2.5 km, but most of the emission was steam and SO2. Vegetation fires were ignited on the SW flank, but lava did not reach the ocean. There was no sign of volcanic activity within the summit crater. A significant area with thermal anomalies was seen in infrared satellite data through 7 September.
Eruption of early September 2017. After eight years of little activity, Fernandina (La Cumbre) began a new eruptive phase on 4 September 2017, at approximately 1225 (Galápagos time) (figure 22). Inflation between March 2015 and September 2017 was 17 cm centered on the caldera; 5 cm of that inflation occurred in the last two months before the eruption (figure 23).
Seismic activity began with hybrid-type earthquakes (fractures with fluid movements) followed by Long Period (LP) earthquakes (fluid movements). The seismic network of the Geophysical Institute installed in the Galapagos began to detect activity at the volcano around 0955 on 4 September 2017. The beginning of the eruption was associated with a volcanic tremor that began at 1225. At 1428, an eruptive column was visible in satellite imagery, interpreted at an approximate height of 4,000 m above the crater, drifting WNW (figure 24).
The Washington VAAC reported that satellite imagery indicated a lava eruption which produced a plume of steam and gas that rose to 2,400 m above sea level and extended about 60 km W of the summit. While initially no ash was reported in the plume, a few hours later a new VAAC report suggested that minor ash was possibly present, although it was most likely primarily SO2. Satellite data reported by the NASA Goddard Space Flight Center showed SO2 emissions on 4-6 and 8 September (figure 25).
Thermal alerts indicative of fresh lava flows from the rim of the summit crater were first reported by MODVOLC on 4 September 2017 (UTC), and abundant through 7 September (figure 26). No thermal anomalies were recorded in MODVOLC data on 8 September. An additional group of alert pixels was recorded on 9 September, but it's not clear if they were caused by fresh lava flows or burning fires; a few more intermittent pixels were recorded through 20 September. The MIROVA system also captured a significant spike in heatflow at Fernandina during the same period (figure 27). Some of the anomalies measured by both systems were likely the result of the fires caused by the lava flows as well as the flows themselves.
Incandescence was first observed during the night of 4 September (figure 28). Lava flows apparently originated from a circumferential fissure near the fissure of the 2005 eruption on the SSW rim of the caldera. The lava flowed down the S and SW flanks but did not reach the sea. Active lava flows were observed during the night of 5 September (figure 29). The intensity of the eruption decreased significantly after about 48 hours.
A technical team from the Directorate of the Galapagos National Park (DPNG) made an aerial inspection using the seaplane Sea Wolf on 7 September 2017. They observed a radial fissure in the same area where the 2005 eruption occurred, and several lava flows. No recent volcanic activity or any landslides were seen inside the caldera. The lava flows had ceased movement, but there were isolated fires burning patches of vegetation surrounded by older lava flows (figures 30 and 31). The lava had traveled from the summit crater at about 1,200 m down to 500 m elevation. While lava was not observed flowing into the sea, coastal monitoring by the park rangers showed water vapor on the SW coast, so it was possible that lava had reached the ocean through subsurface lava tubes.
Geologic Background. Fernandina, the most active of Galápagos volcanoes and the one closest to the Galápagos mantle plume, is a basaltic shield volcano with a deep 5 x 6.5 km summit caldera. The volcano displays the classic "overturned soup bowl" profile of Galápagos shield volcanoes. Its caldera is elongated in a NW-SE direction and formed during several episodes of collapse. Circumferential fissures surround the caldera and were instrumental in growth of the volcano. Reporting has been poor in this uninhabited western end of the archipelago, and even a 1981 eruption was not witnessed at the time. In 1968 the caldera floor dropped 350 m following a major explosive eruption. Subsequent eruptions, mostly from vents located on or near the caldera boundary faults, have produced lava flows inside the caldera as well as those in 1995 that reached the coast from a SW-flank vent. Collapse of a nearly 1 km3 section of the east caldera wall during an eruption in 1988 produced a debris-avalanche deposit that covered much of the caldera floor and absorbed the caldera lake.
Information Contacts: Instituto Geofísico (IG-EPN), Escuela Politécnica Nacional, Casilla 17-01-2759, Quito, Ecuador (URL: http://www.igepn.edu.ec ); Dirección del Parque Nacional Galápagos (DPNG), Isla Santa Cruz, Galápagos, Ecuador (URL: http://www.galapagos.gob.ec/); MIROVA (Middle InfraRed Observation of Volcanic Activity), a collaborative project between the Universities of Turin and Florence (Italy) supported by the Centre for Volcanic Risk of the Italian Civil Protection Department (URL: http://www.mirovaweb.it/); Hawai'i Institute of Geophysics and Planetology (HIGP), MODVOLC Thermal Alerts System, School of Ocean and Earth Science and Technology (SOEST), Univ. of Hawai'i, 2525 Correa Road, Honolulu, HI 96822, USA (URL: http://modis.higp.hawaii.edu/); NASA Goddard Space Flight Center (NASA/GSFC), Global Sulfur Dioxide Monitoring Page, Atmospheric Chemistry and Dynamics Laboratory, 8800 Greenbelt Road, Goddard, Maryland, USA (URL: http://so2.gsfc.nasa.gov/index.html ); Galapagos Conservancy, (URL:https://www.galapagos.org).
Fuego (Guatemala) — February 2018 Cite this Report
Fuego
Guatemala
14.4748°N, 90.8806°W; summit elev. 3799 m
All times are local (unless otherwise noted)
Seven eruptive episodes during July-December 2017
Guatemala's Volcán de Fuego was continuously active throughout 2017, and has been erupting vigorously since 2002; historical observations of eruptions date back to 1531. These eruptions have resulted in major ashfalls, pyroclastic flows, lava flows, and damaging lahars. Reports of activity are provided by the Instituto Nacional de Sismologia, Vulcanología, Meteorología e Hidrologia (INSIVUMEH), and aviation alerts of ash plumes are issued by the Washington Volcanic Ash Advisory Center (VAAC). Satellite data from NASA, NOAA, and other sources provide valuable information about heat flow and gas emissions.
Activity remained high at Fuego throughout July-December 2017. Background levels of activity included frequent explosions (4-6 per hour) with incandescent material rising 150 m above the summit and sending blocks 200 m down the flanks. Block avalanches commonly traveled down the major ravines for hundreds of meters. Ash plumes regularly rose 500-1,000 m above the summit (4.3-4.8 km altitude); ashfall affected communities SW of the summit within 15 km every week. During the multiple short-lived (48-hour or less) eruptive episodes, the hourly explosion rates increased significantly (6-12 per hour), and incandescent material often rose 300 m above the summit; one or more lava flows would also travel more than a kilometer down major ravines. Higher ash plumes (often rising to 5-6 km altitude) during the eruptive episodes sent ash plumes drifting hundreds of kilometers in various directions causing ashfall in cities tens of kilometers away in various directions. Pyroclastic flows often accompanied the eruptive episodes. Seven episodes were reported by INSIVUMEH during July-December 2017 (table 17); they are clearly discernible as periods of higher heat flow in the MIROVA thermal anomaly data (figure 73) as well.
Table 17. Eruptive episodes at Fuego during July-December 2017. Information provided primarily by INSIVUMEH. Some ash plume information is from the Washington VAAC.
| Dates |
Episode |
Ash plume height |
Ash plume drift |
Ashfall areas |
Lava flow distances |
Lava flow drainages |
Pyroclastic flows |
| 11-12 Jul 2017 |
6 |
5.1 km |
35 km W |
10-20 km WSW |
2.3 km, 1.7 km |
Las Lajas, Santa Teresa |
-- |
| 07-08 Aug 2017 |
7 |
-- |
20 km W |
10-20 km W |
1.5 km, 700 m |
Ceniza, Santa Teresa |
-- |
| 19-21 Aug 2017 |
8 |
6.1 km |
75 km W, SW, WNW |
20 km WSW |
1.4 km, 1.2 km |
Ceniza, Santa Teresa (Seca) |
Santa Teresa |
| 12-13 Sep 2017 |
9 |
4.6 km |
65 km N |
10-20 km WSW |
1.3 km |
Seca (Santa Teresa) |
Seca (Santa Teresa) |
| 27-28 Sep 2017 |
10 |
4.7 km |
25 km W |
More than 30 km N, E |
800 m, 500 m |
Seca, Las Lajas |
-- |
| 05-07 Nov 2017 |
11 |
4.8 km |
25 km W, SW |
8-12 km SW |
1.2 km, 800 m |
Seca, Ceniza |
-- |
| 10-11 Dec 2017 |
12 |
5.0 km |
20 km S, SW |
20 km S, SW |
1.5 km |
Seca, Taniluyá, Ceniza |
-- |
Activity during July 2017. Activity increased at Fuego during July 2017, compared with the previous month. INSIVUMEH reported that explosions per hour increased during 6-7 July from 4-7 to 7-10; a lava flow also traveled 1.5 km down Las Lajas ravine. Incandescent material was ejected 100-200 m above the crater rim and caused avalanches of material that traveled down the Ceniza (SSW), Taniluyá (SW), Santa Teresa (SW), and Trinidad (S) drainages (figure 74). Ash plumes during 7-9 July caused ashfall in Santa Sofía (12 km SW), Morelia (9 km SW), Panimaché I and II (8 km SW), El Porvenir (8 km ENE), Sangre de Cristo (8 km WSW), and possibly San Pedro Yepocapa (8 km N).
The Washington VAAC reported dense ash emissions seen in satellite data on 10 July extending WNW 60 km from the summit at 4.6 km altitude. They noted that ashfall was reported 10 km SW from the summit the following morning. The 6th eruptive episode of the year occurred on 11-12 July 2017. Explosions generated ash plumes that rose as high as 1.3 km above the crater and drifted 35 km W, and shock waves rattled nearby structures. Ash fell in areas to the SW. Two lava flows were fed by lava fountains 150-250 m high; one flow traveled 2.3 km down the Las Lajas drainage and another traveled 1.7 km down the Santa Teresa (SW) drainage. The increased activity levels lasted for about 31 hours, with tens of explosions. Weak-to-moderate explosions continued afterwards, generating ash plumes that rose 850 m and drifted 6 km W.
Multiple explosions continued generating ash plumes and block avalanches during 13-14 July. On 16 July, a 30-m-wide, 2-m-deep, hot lahar descended tributaries of the Pantaleón (W) drainage, carrying blocks more than 2 m in diameter, branches, and tree trunks. The lahars again overtook the road between communities on the SW flank, isolating the village of Sangre de Cristo (8 km WSW) and the Palo Verde estate. The Washington VAAC estimated that the ash plumes released early on 16 July rose to 5.2 km altitude, and drifted SE from the summit. By afternoon they had risen to 5.8 km and were drifting SW, extending about 75 km. Explosions during 17-18 July produced dense ash plumes that drifted 15 km W and NW causing ashfall in Panimache, Morelia, and Santa Sofía. Satellite imagery on 19 July showed an ash plume extending 65 km WNW of the summit in a narrow band at 4.3 km altitude. Similar plumes were reported daily between 19-23 July at 4.3-4.9 km altitude drifting generally W up to about 50 km before dissipating (figure 75).
Activity during August 2017. MODVOLC thermal alerts that were issued on 28 and 30 July confirmed the continuing incandescent summit activity which produced block avalanches down the major drainages. Multiple daily alerts were also issued during 15 days of August. Coordinadora Nacional Para la Reduccion de Desastres (CONRED) reported increased activity on 4 August that included 300-m-high ejections of incandescent material and a lava flow that traveled 600 m down the Ceniza ravine. During 7-8 August two lava fountains rose 150 m high, prompting INSIVUMEH to announce the seventh effusive episode at Fuego in 2017. The fountains fed lava flows, 1.5 km and 700 m long, in the Ceniza and the Santa Teresa ravines (figure 76). Explosions (occurring at a rate of 6-8 per hour) produced ash plumes that drifted 20 km W, causing ashfall in Panimache, Morelia, Santa Sofía, El Porvenir, and Yepocapa. The Washington VAAC also noted increasing ash emissions on 7 August. Weather clouds prevented observations from satellite images on 7 and 8 August, but the VAAC reported a "" strong hotspot in infrared imagery on 8 August. Although the lava flow in the Ceniza drainage remained active, explosive activity decreased to an average of three explosions per hour the following week, with ash emissions rising to 4.4-4.6 km and drifting 10 or more km W and SW, bringing ashfall to communities on the W and SW flank.
Activity intensified again during 19-20 August, when constant explosions generated ash plumes that rose 2.3 km above the crater and drifted more than 50 km W and SW. INSIVUMEH reported that the eighth effusive episode at Fuego in 2017 began on 20 August and lasted for about 48 hours. Two lava fountains, each 300 m high, fed lava flows that traveled 1.4 km SSW down the Ceniza ravine and 1.2 km W down the Seca (Santa Teresa) ravine (figure 77). Incandescent block avalanches occurred throughout the crater. Pyroclastic flows (figure 78) were concentrated in the Santa Teresa ravine, possibly filling the drainage with deposits (similar to activity from 5 May) and increasing the chances for lahars. A bright hotspot was visible in satellite imagery from 19-21 August. Seismicity remained elevated through 21 August. During 21 August, the Washington VAAC reported the ash plume near 5.5 km altitude extending 75 km WNW. A remnant cloud of ash was detected in satellite imagery over 200 km WNW of the summit in extreme SE Mexico late on 21 August.
INSIVUMEH reported that on 25 August multiple lahars descended the Pantaleón, Cenizas, El Jute, and Las Lajas drainages on Fuego's W, SSW, and SE flanks. The lahar in the Pantaleón river (fed by the Santa Teresa and El Mineral rivers) was 35 m wide, 2.5-3 m deep, and carried trees and blocks more than 2-3 m in diameter. The Cenizas lahar was about 25 m wide, 3 m deep, and carried blocks up to 2 m in diameter. The lahars in El Jute and Las Lajas drainages were 20 m wide, 1.5 m deep, and carried tree debris and blocks up to 2 m in diameter.
Explosions during 26-29 August generated ash plumes that rose as high as 950 m above the crater and drifted 7-12 km SW, W, and NW. The Washington VAAC reported near continuous emissions of ash on 28 August moving WSW and extending about 100 km at 4.6 km altitude, rising to 5.8 km altitude the following day. Incandescent material was ejected 100-200 m above the crater rim and caused avalanches of material around the crater area. Explosions were audible within a 20-km radius, and shock waves vibrated local structures. Ash fell in areas downwind including Panimache I and II, Morelia, Finca Palo verde, Sangre de Cristo, and El Porvenir. On 29 August, lahars 10 m wide and 1.5 m deep again descended the Santa Teresa and El Mineral drainages, carrying tree debris and blocks up to 2 m in diameter.
Activity during September 2017. Lahars were reported in the Santa Teresa and El Mineral drainages intermittently during September. Ash emissions continued to cause ashfall in communities within 10 km W and SW throughout the month. Continuous ejection of incandescent blocks rose 200-300 m above the crater and sent material 300 m down the flanks. The Washington VAAC reported a continuous plume of ash detected in satellite imagery and in the webcam extending about 95 km WSW on 8 September at 4.6 km altitude. INISVUMEH reported that the increase in activity during 8 September fed a lava flow that traveled 800 m down Barranca Seca.
The ninth eruptive episode of 2017 began late on 12 September and lasted about 35 hours (figure 79). Pyroclastic flows descended the Seca (Santa Teresa) ravine on the W flank, along with a lava flow that traveled 1.3 km during the episode. Ashfall was reported in Morelia, Palo Verde Estate, Sangre de Cristo, El Porvenir, Santa Sofía, and Panimaché I and II. The Washington VAAC reported that an ash plume extended about 65 km N from the summit on 13 September at 4.6 km altitude. After several days of weather clouds obscuring the satellite images, they reported a plume drifting W on 17 September extending 95 km from the summit. A hotspot intermittently appeared during 13-17 September.
The Washington VAAC reported weak puffs of ash drifting N and quickly dissipating on 25 September, and another ash plume extending 15 km W on 28 September at 4.6 km. Hotspots were also observed both days in satellite images. INSIVUMEH reported eruptive episode 10 during 27-28 September, lasting about 40 hours. The ash plume generated during the episode drifted in multiple directions simultaneously (figure 80) and resulted in ashfall more than 30 km from the crater, primarily N and NE, in La Soledad (7 km N), Pastores (20 km NNE), San Miguel Dueñas (10 km NE) and Antigua Guatemala (20 km NE). The incandescent material reached 300 meters above the crater and fed two lava flows, the first went 300 m down the Seca Canyon, and the second traveled 500 m down Las Lajas Canyon.
Seven lahars were recorded during September in the main ravines of Fuego, on days 3, 4, 5, 6, 8, 27, and 29, as a result of the unusually large amount of rainfall during the month (1,059 mm) (figure 81). The larger ones at the beginning of the month contained blocks up to 3 m in diameter, and many were warm enough to generate steam with strong odors of SO2. Several roads were damaged.
Activity during October 2017. Overall activity was quieter during October 2017. Background levels of activity included incandescent material rising up to 250 m above the summit and falling a similar distance down the flanks, and ash plumes rising to 4.4-5.0 km altitude and drifting more than 25 km W, NW, and E. Eight to twelve explosions per hour were not uncommon, although 4-6 per hour were more typical. A few of the block avalanches traveled 2 km down the flanks. The communities that experienced persistent ashfall were all located 10-20 km SW, and included Morelia, Palo Verde Farm, Sangre de Cristo, El Porvenir, Santa Sofía, and Panimaché I and II. Due to the wind conditions and increased activity during the first week of October, ashfall was also reported farther away in Guatemala City (40 km NE), Antigua Guatemala, Villa Nueva (30 km ENE) and San Miguel Petapa (35 km ENE). INSIVUMEH reported three increases in explosive activity during the month on 2, 3, and 5 October, but they did not develop into eruptive episodes.
Four lahars were reported on 1, 2, and 4 October in the Seca and Mineral drainages. They carried blocks of volcanic rocks and debris as large as 3 m in diameter and were 6-12 m wide and 1-2 m deep. The Washington VAAC reported a series of explosions on 4 October, after which ash emissions were seen in multispectral imagery at 5.2 km altitude drifting SW that reached as far as 75 km. They reported occasional puffs of ash on 15 October extending up to 95 km W of the summit. By 17 October, imagery showed continuous emissions with an ash plume extending 95 km SSW from the summit before dissipating. A possible ash plume was reported by the Washington VAAC on 31 October extending 45 km W from the summit at 4.3 km altitude.
Activity during November 2017. There were numerous periods of intermittent ash emissions during November. Continuous emissions often drifted 65-100 km or more SW or W at altitudes around 4.6-5.2 km during periods of activity. INSIVUMEH reported that during 2-3 November tremor at Fuego increased. Explosions during the first week averaged 5-8 per hour and ash plumes rose as high as 1.3 km above the crater. Incandescent material was ejected 300 m above the crater, causing avalanches that were confined to the crater. The 11th eruptive episode in 2017 began on 5 November and lasted for two days. Lava flowed 1-1.2 km W down the Seca drainage and 800 m SSW down the Ceniza drainage. Avalanches of material from the ends of the lava flows descended the flanks and reached vegetated areas.
Ashfall was reported in areas downwind in the communities 8-12 km SW including Morelia, Santa Sofia, Palo Verde Farm, and Panimaché I and II throughout the month. Shockwaves from explosions often rattled windows and roofs around the volcano. Avalanche blocks were reported in the Cenizas, Trinidad, Taniluyá and Seca canyons. Multiple VAAC reports were issued on 25 days of November, and multiple daily MODVOLC thermal alerts were issued on 20 days of the month. On 10 November the emissions extended about 275 km WSW from the summit. A lahar during the third week descended the Seca and el Mineral drainages.
Activity during December 2017. Explosions averaged 4-8 per hour during most of December sending incandescent material 200-250 m above the crater. INSIVUMEH reported that the 12th eruptive episode at Fuego in 2017 began on 10 December and, based on seismicity, lasted for about 36 hours. Ash plumes from moderate-to-strong explosions rose as high as 1.2 km above the crater rim and drifted 20 km S and SW. Lava flowed as far as 1.5 km W down the Seca (Santa Teresa), SW down the Taniluyá, and SSW down the Ceniza ravines. Ash fell many times in the communities of La Rochela, San Andrés Osuna, Morelia, and Panimaché I and II. On 12 December there was an average of 10 explosions per hour, generating avalanches in the Ceniza and Taniluyá drainages and ashfall in nearby areas. Ashfall was also reported in San Miguel Dueñas, Alotenango, and Ciudad Vieja (13.5 km NE) on 14 December.
Multiple MODVOLC thermal alerts appeared on 20 days during December, and the Washington VAAC issued 91 reports of continuous or intermittent ash plume activity. During eruptive episode 12 on 11 December, they reported an intense hot spot seen at the crater in satellite imagery despite meteoric cloud cover. For most of the second half of December, either continuous or intermittent ash emissions drifted 100-150 km WNW from the summit before dissipating. The Washington VAAC reported an ash emission on 20 December drifting WNW at 5.8 km altitude that extended over 300 km from the summit. A remnant of the plume was observed almost 450 km away late on 20 December before dissipating. Plumes were repeatedly observed over 200 km from the summit during 20-25 December.
Geologic Background. Volcán Fuego, one of Central America's most active volcanoes, is also one of three large stratovolcanoes overlooking Guatemala's former capital, Antigua. The scarp of an older edifice, Meseta, lies between Fuego and Acatenango to the north. Construction of Meseta dates back to about 230,000 years and continued until the late Pleistocene or early Holocene. Collapse of Meseta may have produced the massive Escuintla debris-avalanche deposit, which extends about 50 km onto the Pacific coastal plain. Growth of the modern Fuego volcano followed, continuing the southward migration of volcanism that began at the mostly andesitic Acatenango. Eruptions at Fuego have become more mafic with time, and most historical activity has produced basaltic rocks. Frequent vigorous eruptions have been recorded since the onset of the Spanish era in 1524, and have produced major ashfalls, along with occasional pyroclastic flows and lava flows.
Information Contacts: Coordinadora Nacional para la Reducción de Desastres (CONRED), Av. Hincapié 21-72, Zona 13, Guatemala City, Guatemala (URL: http://conred.gob.gt/www/index.php ); Instituto Nacional de Sismologia, Vulcanologia, Meteorologia e Hydrologia (INSIVUMEH), Unit of Volcanology, Geologic Department of Investigation and Services, 7a Av. 14-57, Zona 13, Guatemala City, Guatemala (URL: http://www.insivumeh.gob.gt/ ); MIROVA (Middle InfraRed Observation of Volcanic Activity), a collaborative project between the Universities of Turin and Florence (Italy) supported by the Centre for Volcanic Risk of the Italian Civil Protection Department (URL: http://www.mirovaweb.it/); Hawai'i Institute of Geophysics and Planetology (HIGP), MODVOLC Thermal Alerts System, School of Ocean and Earth Science and Technology (SOEST), Univ. of Hawai'i, 2525 Correa Road, Honolulu, HI 96822, USA (URL: http://modis.higp.hawaii.edu/).
Sheveluch (Russia) — February 2018 Cite this Report
Sheveluch
Russia
56.653°N, 161.36°E; summit elev. 3283 m
All times are local (unless otherwise noted)
Ash explosions, pyroclastic flows, and lava dome growth continue through January 2018
An eruption at Sheveluch has been ongoing since 1999, and volcanic activity was previously described through August 2017 (BGVN 42:08). Ongoing activity consists of pyroclastic flows, explosions, and lava dome growth with a viscous lava flow in the N. Strong fumarole activity, ash explosions, hot avalanches and incandescence from the dome accompany this process. Explosions and ash flows were reported by Kamchatka Volcanic Eruption Response Team (KVERT) during the August 2017 through January 2018 period.
During this report period the Aviation Color Code (ACC) remained at Orange (the second highest level on a four-color scale), except for 10 January 2018 when it was briefly elevated to Red (highest level) and lowered back to Orange later the same day. Satellite infrared data also showed increased activity on this day. Ash plume altitudes ranged from a low of 5 km to a high of 11 km on 10 January 2018. The farthest lateral extent of the ash plume was reported at 990 km to the NE on 8 November 2017.
On 4 and 8 August 2017 large ash clouds reached altitudes of 6.5 km and approximately 10 km, respectively. Ashfall was reported in Klyuchi Village (50 km SW) on 8 August and drifted about 180 km E, NW, and NE during 12 and 15-16 August. On 7 September ash plumes rose to 8-10 km altitude and drifted NE, SE, and S; another ash plume was photographed on 8 September (figure 47). On 15-22 September ash plumes rose to 9-10 km altitude and drifted about 400 km NW, E, and SE. Explosions on 10 October generated ash plumes to 10 km altitude and drifted about 250 km N (figure 48). Plumes comprised of re-suspended ash drifted about 350 km SE on 12 October and about 230 km SE on 13 October.
Explosions on 2 and 8 November generated ash plumes that rose to an altitude of 8 km and drifted approximately 990 km NE. Weather prevented observations on the other days from 4-10, 12-17, and 19-24 November. A strong explosive event on 5 December generated ash plumes that rose to altitudes of 10.5 km and 5 km and drifted NE and E, respectively. Explosions on 26 December generated an ash plume that rose to an altitude of 8 km and drifted about 300 km NE.
On 10 January 2018 satellite images captured an ash cloud with a dimension of 192 x 132 km drifting 230 km NE from explosions rising to altitudes of 10-11 km. In response, KVERT raised the ACC to Red. Later that same day, satellite images showed the ash cloud expanded to 350 x 180 km in dimension and had drifted 400 km E; the ACC was lowered back to Orange. The 10 January explosions began at 1035 with resulting ash that drifted about 900 km E during 10-11 January.
Thermal anomalies. As reported by KVERT, satellite imagery continue to detect the existence of a thermal anomaly over Sheveluch. The anomaly was reported on 10-30 days every month from August 2017 through January 2018. Detections of the thermal anomaly were lower in certain months because cloudy conditions obscured satellite imagery. The MIROVA system detected numerous hotspots every month during August 2017-January 2018, most of which were about 5 km or less from the summit with mainly low to a few high power signatures in August, September 2017 and January 2018. Thermal anomalies based on MODIS satellite instruments analyzed using the MODVOLC algorithm were detected in 11-12 August 2017 and 10 January 2018 corresponding to the explosive eruptions on those days.
Geologic Background. The high, isolated massif of Sheveluch volcano (also spelled Shiveluch) rises above the lowlands NNE of the Kliuchevskaya volcano group. The 1,300 km3 andesitic volcano is one of Kamchatka's largest and most active volcanic structures, with at least 60 large eruptions during the Holocene. The summit of roughly 65,000-year-old Stary Shiveluch is truncated by a broad 9-km-wide late-Pleistocene caldera breached to the south. Many lava domes occur on its outer flanks. The Molodoy Shiveluch lava dome complex was constructed during the Holocene within the large open caldera; Holocene lava dome extrusion also took place on the flanks of Stary Shiveluch. Widespread tephra layers from these eruptions have provided valuable time markers for dating volcanic events in Kamchatka. Frequent collapses of dome complexes, most recently in 1964, have produced debris avalanches whose deposits cover much of the floor of the breached caldera.
Information Contacts: Kamchatka Volcanic Eruptions Response Team (KVERT), Far East Division, Russian Academy of Sciences, 9 Piip Blvd., Petropavlovsk-Kamchatsky, 683006, Russia (URL: http://www.kscnet.ru/ivs/kvert/); Institute of Volcanology and Seismology, Far Eastern Branch, Russian Academy of Sciences (IVS FEB RAS), 9 Piip Blvd., Petropavlovsk-Kamchatsky 683006, Russia (URL: http://www.kscnet.ru/ivs/eng/); Hawai'i Institute of Geophysics and Planetology (HIGP) - MODVOLC Thermal Alerts System, School of Ocean and Earth Science and Technology (SOEST), Univ. of Hawai'i, 2525 Correa Road, Honolulu, HI 96822, USA (URL: http://modis.higp.hawaii.edu/); MIROVA (Middle InfraRed Observation of Volcanic Activity), a collaborative project between the Universities of Turin and Florence (Italy) supported by the Centre for Volcanic Risk of the Italian Civil Protection Department (URL: http://www.mirovaweb.it/).
Stromboli (Italy) — February 2018 Cite this Report
Stromboli
Italy
38.789°N, 15.213°E; summit elev. 924 m
All times are local (unless otherwise noted)
Moderate increase in thermal energy and explosion rate, April-August 2017
Confirmed historical eruptions at Italy's Stromboli volcano go back 2,000 years as this island volcano in the Tyrrhenian Sea has been a natural beacon for eons with its near-constant fountains of lava. Eruptive activity at the summit consistently occurs from multiple vents at both a north crater area (N Area) and a southern crater group (S or CS Area) on the Terrazza Craterica at the head of the Sciara del Fuoco, a large scarp that runs from the summit down the NW side of the island (figures 102 and 103). Thermal and visual cameras placed on the nearby Pizzo Sopra La Fossa monitor activity at the Terrazza Craterica. Eruptive activity continued at low to moderate levels during 2015 and 2016, with intermittent periods of frequent explosions from both crater areas that sent ash, lapilli, and bombs across the Terrazza Craterica and onto the head of the Sciara del Fuoco (BGVN 42:07).
This report covers activity from January-October 2017. Activity similar to 2016 continued through March 2017 when an increase began in explosion rates. The increase peaked during June and then declined through August, returning to background levels in September (figures 104). Thermal energy increased beginning in early May and lasted through mid-August (figure 105). Multiple MODVOLC thermal alerts were issued for Stromboli between 4 May and 25 August 2017. Weekly reports of activity were provided by the Instituto Nazionale de Geofisica e Vulcanologia (INGV), Sezione de Catania, which monitors the gas geochemistry, deformation, and seismology, as well as the surficial activity.
Activity during January 2017 consisted of low to moderate intensity explosions from the southern crater area (S Area), and low intensity explosions at the northern crater area (N Area). Two vents in the S Area generated explosive activity. Modest explosions with ash and lapilli occurred regularly from the southernmost vent, and rare explosions were observed from the northernmost vent (figure 106). At the northern crater area (N Area) the southern vent was active, generating ash and lapilli that was ejected a few tens of meters from the vent. There were no explosions from the northern vent in the N Area.
There were no notable changes in activity until the second week of February 2017 when explosive activity returned to the northern vent of the N Area. During the third week of February, a gradual increase in the rate and intensity of the explosions at both areas was observed which lasted throughout the rest of the month (figure 107). Coarse pyroclastic material was ejected onto the Terrazza Craterica and occasionally onto the Sciara del Fuoco. The stronger explosions generated modest plumes of dilute ash that quickly dissipated.
During the first week of March 2017, the most active vents were the southernmost vent of the S Area and the northernmost vent of the N Area. The strongest explosions from the northern vent of the N Area produced dilute ash emissions and pyroclastic ejecta that landed on the upper part of the Sciara del Fuoco. By the third week of March, and through the end of the month, most of the activity had shifted to the vents in the N Area and diminished in the S Area. On 28 March, Etna Observatory personnel restored operations at both the infrared and visible cameras on the Pizzo sopra la Fossa which allowed for more detailed observations of the activity at the summit (figure 108).
Throughout April 2017, the N1 vent produced low (less than 80 m high) to medium (80-150 m) intensity explosions containing ash, lapilli, and bombs. The N2 vent showed sporadic low intensity explosive activity with occasional ash emissions until 20 April when more coarse (lapilli and bombs) material was ejected. Vent C showed continuous degassing throughout the month, and low intensity explosions began there during the third week of April, causing intense spattering on 29 April. The S1 vent showed sporadic and weak explosive activity of low intensity with the ejection of coarse material until the third week when activity ceased. Vent S2 showed explosive activity of medium-low intensity (less than 120 m high) of coarse material sometimes mixed with ash. Explosion rates were around 2-10 events per hour during the first half of the month, rising to 10-15 per hour for the second half of April.
In the N Area, the N1 and N2 vents continued with a similar level of activity throughout May 2017 (figure 109). Explosions of low to medium intensity sent coarse ejecta of lapilli and bombs up to 150 m high at N1 and 120 m high at N2. The rate of explosions in the N Area ranged from 4-12 per hour.
In the S Area, activity was more variable during May, and the rate of explosions ranged from 2-10 per hour. Vent C also continued with intense degassing and low-intensity explosions and spattering. On 13 May, two emission points were observed at vent C, one a few meters S of the other. Vent S1 showed no activity until late in the second week of May when low to moderate intensity explosions rose up to 150 m with coarse ejecta. During 14-15 May, a second vent opened a few meters north of S1, and simultaneous explosions from both S1 vents sent jets of gas and incandescent material into the air. Activity decreased to low intensity explosions (less than 80 m high) with ejecta during the third week, but then increased significantly during the last week of the month. Ejecta reached 200 m high from the S1 vents (figure 110). The southern S1 vent built a surrounding hornito and produced high and narrow jets of incandescent material, while the northern emission point produced more modest jets of gas and material. Vent S2 was quiet for most of May, producing only low-intensity explosions of coarse material sometimes mixed with ash for a few days near the beginning of the month.
An increase in activity during June 2017 was apparent at both the N and S Areas (figure 111). Video taken by drone and from the summit during 10-12 June shows periodic explosions with ash, lapilli, and bombs ejected around the Terrazza Craterica (See Information Contacts for link). Vent N1 was characterized by low to medium-high intensity explosive activity that ejected lapilli and bombs to 200 m and was sometimes accompanied by ash that drifted S over the island. N2 also showed variable activity which ranged from low to high intensity (ejecta rising over 200 m high) during the first week, and low to medium-high (ejecta rose to 150 m) for the rest of the month (figure 112). Numerous bombs and lapilli were deposited both inside and outside the crater rim. Intense spattering was reported at N2 on 11, 12, 18, 19, and 26 June. The explosion rate in the N Area was 9-18 per hour.
In the CS Area, sporadic low-intensity explosions (less than 80 m high) characterized vent C, with modest spattering reported on 11, 12, 13, 26, 30 June 2017. Activity at S1 continued from two vents simultaneously with low to medium intensity explosive activity (figure 113 and 114). The vent at S2 reactivated briefly on 3 June after about a month of quiet with weak spattering activity but was not active again during the month. The CS Area was characterized by an explosion frequency of 1-10 per hour.
During July 2017, thermal activity at the vents remained moderate to high; explosions at the N1 vent sent lapilli and bombs, sometimes mixed with ash, to 200 m above the vent. At vent N2, lapilli and bombs were ejected outside the crater rim, sometimes rolling down the Sciara del Fuoco to the ocean. The hourly frequency of explosions ranged from 5-18. At S1, both vents exploded simultaneously with lapilli, bombs and occasional ash rising to 150 m numerous times.
Beginning in the afternoon of 26 July, an explosive sequence at the CS Area lasting about 90 seconds was recorded with the thermal and visible image cameras on the Pizzo sopra la Fossa (figure 115). It began with explosions from vents C and S1, followed by a second explosion at S2. More explosions from C and S1 sent debris to the SE and were followed by fountaining to about 50 m from the vents for about a minute. INGV personnel witnessed 10-cm-diameter bombs on the SW side of the Pizzo at about 850 m elevation during a 30 July site visit.
A return to background activity during August consisted of explosions of varying intensity from low (less than 80 m) to medium-low (ejecta sometimes reached 120 m in height) at both the N and CS Area vents. Explosion frequency ranged from 2-11 per hour, decreasing significantly by the end of the month. Activity continued to diminish during September. Periodic spattering from vent C occurred. Only one vent was active in the CS Area during the month. A brief increase in intensity at vent N1 during 8-9 September sent ejecta over 150 m high. By the end of September, few explosions reached over 80 m in height. A brief episode of intense spattering at vent C on 24 September sent bombs and lapilli to 40 m above the vent. Explosion frequency averaged only 2-6 per hour by the end of September.
Continuous spattering, occasionally intense, from vent C continued during October. The vents in the N Area produced low to moderate intensity explosions, and one vent in the CS Area produced low intensity explosions. A strong explosive sequence in the CS Area lasted for about five minutes on 23 October 2017 (figure 116). The first explosion of the sequence came from vent C and lasted 30 seconds. It destroyed the hornito formed around the vent. About a minute later, two explosions occurred at the S1 vent, reaching about 120 m in height and dispersing to the SE. Another explosion at vent C about 3 minutes later sent ejecta 100 m high. The event ended with a series of small ash emissions that rose a few tens of meters. Low intensity activity continued from both areas through the end of October, with low explosion rates of around 2-6 per hour.
Geologic Background. Spectacular incandescent nighttime explosions at Stromboli have long attracted visitors to the "Lighthouse of the Mediterranean" in the NE Aeolian Islands. This volcano has lent its name to the frequent mild explosive activity that has characterized its eruptions throughout much of historical time. The small island is the emergent summit of a volcano that grew in two main eruptive cycles, the last of which formed the western portion of the island. The Neostromboli eruptive period took place between about 13,000 and 5,000 years ago. The active summit vents are located at the head of the Sciara del Fuoco, a prominent scarp that formed about 5,000 years ago due to a series of slope failures which extends to below sea level. The modern volcano has been constructed within this scarp, which funnels pyroclastic ejecta and lava flows to the NW. Essentially continuous mild Strombolian explosions, sometimes accompanied by lava flows, have been recorded for more than a millennium.
Information Contacts: Istituto Nazionale di Geofisica e Vulcanologia (INGV), Sezione di Catania, Piazza Roma 2, 95123 Catania, Italy, (URL: http://www.ct.ingv.it/en/); MIROVA (Middle InfraRed Observation of Volcanic Activity), a collaborative project between the Universities of Turin and Florence (Italy) supported by the Centre for Volcanic Risk of the Italian Civil Protection Department (URL: http://www.mirovaweb.it/); Hawai'i Institute of Geophysics and Planetology (HIGP), MODVOLC Thermal Alerts System, School of Ocean and Earth Science and Technology (SOEST), Univ. of Hawai'i, 2525 Correa Road, Honolulu, HI 96822, USA (URL: http://modis.higp.hawaii.edu/); Martin Rietze, Taubenstr. 1, D-82223 Eichenau, Germany (URL: https://mrietze.com/, https://www.youtube.com/channel/UC5LzAA_nyNWEUfpcUFOCpJw/videos, http://mrietze.com/web16/Stromb_Vesuv17.htm).
Tinakula (Solomon Islands) — February 2018 Cite this Report
Tinakula
Solomon Islands
10.386°S, 165.804°E; summit elev. 796 m
All times are local (unless otherwise noted)
Short-lived ash emission and large SO2 plume 21-26 October 2017; historical eruption accounts
Remote Tinakula lies 100 km NE of the Solomon Trench at the N end of the Santa Cruz Islands, part of the country of the Solomon Islands, which generally lie 400 km to the W. It has been uninhabited since an eruption with lava flows and ash explosions in 1971 when the small population was evacuated (CSLP 87-71). The nearest inhabitants live on Te Motu (Trevanion) Island (about 30 km S), Nupani (40 km N), and the Reef Islands (60 km E); they occasionally report explosion noises from Tinakula. Ashfall from larger explosions has historically reached these islands. The last reported evidence of activity came from MODVOLC thermal alerts between August 2010 and October 2012, and observations of incandescent lava blocks rolling into the sea in May 2012. A new eruptive episode with a large ash explosion and substantial SO2 plume during 21-26 October 2017 is reported below, along with newly available historical newspaper accounts of earlier eruptions.
Reports of ash plumes are issued by the Wellington Volcanic Ash Advisory Center (VAAC); the National Disaster Management Office (NDMO) of the Solomon Islands Government also issues situation reports when significant activity is reported. Satellite data from infrared, visual, and SO2 monitoring instruments are an important source of information for this remote volcano. News reports from local (and social) media are often the only sources of information for the smaller events. Recently identified 19th- and 20th-century newspaper accounts of eruptive activity witnessed by sailors passing nearby is a valuable new resource for previously unreported events.
Eruption of 21-26 October 2017. Reports of a substantial explosion with an ash plume from Tinakula appeared on social media and in the local press during 22-26 October 2017. Staff from the Lata Met Service Office approached the island by boat on 23 October to make direct observations (figures 17-19). A video clip from the Himawari8 Satellite showing the ash plume explosion was posted by Stephan Armbruster on Twitter on 22 October. The Solomon Islands NDMO issued a situation report on 26 October showing ashfall covering vegetation on the island. According to the NDMO, ashfall was concentrated on the island, although a small amount of ash drifted SE and was reported to briefly contaminate drinking water in several communities in the nearby Reef Islands (60 km ENE) . Ashfall was also reported on Fenualoa Island (50 km ENE) (Radio New Zealand). The eruption was categorized by NMDO as a VEI 3. A team of geologists from NDMO brought seismic monitoring equipment to Tinakula in early November, and measured a high frequency volcanic tremor on 5 November 2017.
The Wellington VAAC first reported an ash plume visible in satellite imagery shortly after midnight (UTC) on 21 October 2017. The plume was estimated to be at 4.6 km altitude and drifting N. About 90 minutes later they reported a second eruption with a much higher plume drifting SE at 10.7 km altitude using IR imagery cloud top temperatures to estimate the altitude. They reported ongoing ash emissions visible in satellite imagery drifting SE at 6.1 km altitude throughout the morning, dropping to 3 km altitude by the end of the day. The following day, 22 October, intermittent ash emissions were reported at 3.7 km altitude moving E. By that afternoon, they had dropped to 2.4 km, and had lowered to 1.8 km by late on 23 October. Ongoing low-level ash emission (2.1 km altitude) continued through 25 October; by early on 26 October, there was no further evidence of ongoing activity.
No MODVOLC thermal alerts were associated with this event, but there was a brief MIROVA signal from the MODIS infrared data during 20-23 October 2017 (figure 20). A major SO2 plume was released from Tinakula on 21 October, and a smaller one was recorded on 28 October as well (figure 21).
Summary of activity during 1971-2012. After the 1971 eruption, intermittent ash emissions, lava bombs, and pyroclastic flows were reported by geologists and sailors passing nearby in 1984, 1985, 1989-1990, 1995, and 1999. Infrared MODIS thermal data was first reported as MODVOLC thermal alerts beginning in 2000 and has provided satellite-based confirmation of thermal activity since then. Months with thermal activity included February 2000-May 2001, February 2006-November 2007, September-November 2008, August 2009, and January 2010-October 2012 (figure 22). No additional thermal alerts were issued through 2017. Since 2004, SO2 data has been gathered by satellite instruments and processed by NASA Goddard Space Flight Center; in February and April 2006 small SO2 plumes were recorded (figure 23).
Eruption reports during 1868-1932. Reports of eruptions at Tinakula between 1868 and 1932 have recently been found in 19th and 20th century newspaper accounts from Australia and New Zealand (table 6). The accounts describe incandescence, water discoloration of the sea, explosions, ash plumes, and lava flows extending from the summit to the ocean.
Table 6. Newly discovered historical newspaper accounts of volcanic activity from ships passing near Tinakula between 1868 and 1932. This is not a full eruptive history for the time period. Online links provided in the References section. Courtesy of Steve Hutcheon.
| Date |
Account |
Reference |
| 17 Oct 1868 |
Passed Volcano Island, one of the South (sic) Cruz group, on the 17th of October. It was then in active operation, vomiting forth immense volumes of fire and smoke. Note; Volcano Island is another name for Tinakula. |
The Age, Melbourne, 10 November 1868, page 2b; also in The Argus, Melbourne, 10 November 1868, page 4b |
| 9 Oct 1869 |
On the 9th October sighted three low islands, also Volcano Island; the discharge from the latter was plainly visible. |
The Empire, Sydney, 27 October 1869, page 2a |
| 29/30 Nov 1871 |
During the night, the active volcano, Tinakula, was passed. Large masses of red hot lava were emitted; and the sight is described as being very imposing and grand. |
The Sydney Morning Herald, 19 February 1872, page 6a |
| 20 Jun 1887 |
When his vessel was off the Santa Cruz group Mount Tinakula became an active volcano. It broke out at 4 o'clock on the morning of June 20 and viewed from the ship's deck presented a most grand spectacle. The water for miles round was of a pea green color and had the appearance of being very shallow. |
The Daily Telegraph, Sydney, NSW, 20 July 1887, page 4f |
| ~23 Aug 1910 |
Tinakula Island was found to be in an active state of eruption, and presented a fine sight. The ship Tambo departed Tarawa 19 August and arrived in Sydney on 31 August 1910. |
The Daily Telegraph, Sydney, NSW, 1 September 1910, page 7a |
| 2/3 May 1932 |
The steamer passed within half a mile of the active volcano of Tinakula. It was at night, and the passengers obtained a remarkable view of the red hot lava streams flowing from the summit, which is 2000 ft. high, to the water's edge. Three eruptions occurred while the vessel was within view of the island, each preceded by an explosion which sounded like thunder. |
The New Zealand Herald, Auckland, NZ, 27 June 1932, page 6a; The Auckland Star, 10 September 1932 page 1h (Supplement) |
References. The Age (Melbourne, Victoria) 10 November 1868, page 2b (URL: http://nla.gov.au/nla.news-article177002744).
The Empire (Sydney, NSW) 27 October 1869, page 2a, (URL: http://nla.gov.au/nla.news-article60895166).
The Sydney Morning Herald (NSW) 19 Februay 1872, page 6a (URL: http://nla.gov.au/nla.news-article13252748).
The Daily Telegraph (Sydney, NSW) 1887 20 July, page 4f (URL: http://nla.gov.au/nla.news-article239817295).
The Daily Telegraph (Sydney, NSW) 1 September 1910, page 7a (URL: http://nla.gov.au/nla.news-article237993807; http://nla.gov.au/nla.news-article15183461 ).
The New Zealand Herald (Auckland, NZ) 27 June 1932, page 6a (URL: https://paperspast.natlib.govt.nz/newspapers/NZH19320627.2.19 ).
The Auckland Star (NZ) 10 September 1932, page 1h (Supplement) (URL: https://paperspast.natlib.govt.nz/newspapers/AS19320910.2.180.6 ).
Geologic Background. The small 3.5-km-wide island of Tinakula is the exposed summit of a massive stratovolcano at the NW end of the Santa Cruz islands. It has a breached summit crater that extends from the summit to below sea level. Landslides enlarged this scarp in 1965, creating an embayment on the NW coast. The Mendana cone is located on the SE side. The dominantly andesitic volcano has frequently been observed in eruption since the era of Spanish exploration began in 1595. In about 1840, an explosive eruption apparently produced pyroclastic flows that swept all sides of the island, killing its inhabitants. Recorded eruptions have frequently originated from a cone constructed within the large breached crater. These have left the upper flanks and the steep apron of lava flows and volcaniclastic debris within the breach unvegetated.
Information Contacts: National Disaster Management Office (NDMO), Solomon Islands Government, Prince Philip Highway, Ranadi, Solomon Islands (URL: http://www.ndmo.gov.sb); Wellington Volcanic Ash Advisory Centre (VAAC), Meteorological Service of New Zealand Ltd (MetService), PO Box 722, Wellington, New Zealand (URL: http://www.metservice.com/vaac/, http://www.ssd.noaa.gov/VAAC/OTH/NZ/messages.html); Hawai'i Institute of Geophysics and Planetology (HIGP), MODVOLC Thermal Alerts System, School of Ocean and Earth Science and Technology (SOEST), Univ. of Hawai'i, 2525 Correa Road, Honolulu, HI 96822, USA (URL: http://modis.higp.hawaii.edu/); MIROVA (Middle InfraRed Observation of Volcanic Activity), a collaborative project between the Universities of Turin and Florence (Italy) supported by the Centre for Volcanic Risk of the Italian Civil Protection Department (URL: http://www.mirovaweb.it/); NASA Goddard Space Flight Center (NASA/GSFC), Global Sulfur Dioxide Monitoring Page, Atmospheric Chemistry and Dynamics Laboratory, 8800 Greenbelt Road, Goddard, Maryland, USA (URL: http://so2.gsfc.nasa.gov/index.html ); Radio New Zealand (URL: http://www.radionz.co.nz/international/pacific-news/342267/solomons-pm-calls-for-calm-in-communities-close-to-volcano); Solomon Islands Broadcasting Corporation, SIBC Voice of the Nation, Honiara, Solomon Islands (URL: http://www.sibconline.com.sb/no-its-not-snow-in-the-solomons-its-ash-from-the-tinakula-volcano/); Andy Prata, AIRES Atmospheric Industrial Research and Environmental Solutions, Melbourne, Australia (URL: https://www.aires.space/, https://twitter.com/andyprata/status/922177129944625157); Gamara Okzman Bencarson, Facebook.
Tungurahua (Ecuador) — February 2018 Cite this Report
Tungurahua
Ecuador
1.467°S, 78.442°W; summit elev. 5023 m
All times are local (unless otherwise noted)
Ash emissions, explosions, and pyroclastic flows 26 February-16 March 2016; no further activity through 2017
Episodic eruptive activity at Ecuador's Tungurahua has persisted since November 2011. Periods of activity over several weeks that included ash plumes, Strombolian activity, pyroclastic flows, and lava flows were often followed by quiescence for a similar time span. This type of activity continued throughout 2015 (BGVN 42:08, 42:12); Strombolian activity, significant ash emissions, and SO2 plumes in mid-November 2015 marked the last significant activity for that year. The next episode began in late February 2016 and is discussed below with information provided by the Observatorio del Volcán Tungurahua (OVT) of the Instituto Geofísico (IG-EPN) of Ecuador, aviation alerts from the Washington Volcanic Ash Advisory Center (VAAC), and other sources of satellite data.
The latest eruptive episode at Tungurahua lasted from 26 February-16 March 2016. Multiple explosions with ash plumes that rose 3-8 km were frequent. Incandescent blocks were ejected up to 1,500 m down most flanks. Pyroclastic flows affected many of the ravines, although no communities reported damage. Significant SO2 emissions were recorded by satellite data between 27 February-8 March. An inflationary trend was recorded from early March through late September 2016, after which a period of deflation began. Tungurahua had occasional seismic swarms after the eruption, but no reported surface activity for the remainder of 2016 and 2017.
IG reported an ash emission on 5 January 2016 that rose 2 km above the crater and drifted NE, causing minor ashfall in the Pondoa and Bilbao sectors. Otherwise, no volcanic activity was reported until a new episode began on 26 February 2016 with a seismic swarm followed by a series of explosions and ash plumes that rose 3-8 km above the crater (figures 96 and 97). Incandescent blocks were ejected up to a kilometer down the NW, W, and SW flanks (figure 98). Pyroclastic flows were also generated that descended through the gorges of Juive, La Hacienda, Mandur and Cusúa, reaching distances of 500-1,500 m (figure 99).
Continuous emissions with low to moderate ash content drifted W and SW on 27 February. The communities most affected by ashfall were Choglontus, Cotaló, El Manzano, Palitahua, Bilbao, Pillate, Juive, Ambato, Tisaleo, Riobamba, and Quero. The ash was mostly fine-grained, except in the area near Pillate and Choglontus, where the grain size reached up to 3 mm and consisted of reddish, black, gray, and beige fragments (figure 100). On the morning of 1 March 2015, several pyroclastic flows were observed descending through the Juive, Mandur, Achupashal, La Hacienda, and Romero ravines; they traveled 1.5-1.7 km (figure 101).
Ash emissions were constant throughout the first week in March (figures 102 and 103). During 1-5 March they drifted NW, SW and E, with ashfall reported in the towns of Pillate, Manzano, Choglontus, Palictahua and El Altar (figure 104). Incandescent blocks descended most of the flanks (figure 105). Beginning on 6 March, plumes drifted SW and S, with variable ash content. Pyroclastic flows along the W and NW flanks descended the Cusua, Juive, Mandur, Ashupashal, Romero, and Rhea drainages (figure 106), the farthest traveled went 2.2 km down the Ashupashal on 7 March. In addition to ash and other explosive debris, daily sulfur dioxide emissions were identified from 27 February-8 March 2016 by the OMI instrument on the Aura satellite (figure 107).
Beginning on 28 February, a strong inflationary trend (almost 3 cm) was observed in the GPS data at the Mazón (SW flank) station. Three inclinometers on the NW flank also indicated inflation during 28 February-4 March.
Episodic explosions on 8 March 2016 produced plumes with high ash contents that rose 6 km. Small pyroclastic flows descended the NW flank in the Mandur, Rea, Achupashal, and La Hacienda ravines. Sporadic emissions continued for most of the second week of March, with varying ash contents, reaching between 1.5 and 4 km above the crater and drifting to the SSW. Reports of ashfall were received in the sectors of Choglontús, Manzano, Pillate, El Altar, and Palitahua, and minor ashfall in Juive and Cusúa. Several ash plumes (figure 108) and a small pyroclastic flow were observed on 13 March 2016. The Manzano lookout reported loud noises on 14 March, and ashfall in the afternoon, but weather obscured views of emissions. Rainy weather on 16 March also obscured views, but Manzano, Chacauco, Cusúa, and Juive lookouts reported ashfall and explosions. There were no further reports from the observatory of ash emissions, ashfall, or explosions; only minor steam plumes were observed on clear days after 16 March 2016.
The Washington VAAC reported possible ash emissions on 31 March 2016, but information from OVT indicated no surface activity. Intense rain on 28 March generated a small lahar that descended through the La Pampa ravine. Significant rainfall on 2 April caused lahars to affect Vazcun, Juive, Pondoa, Bilbao, Achupashal, Chontapamba and Malpayacu drainages. Seismicity continued to decrease throughout April 2016. A small swarm of Long Period seismic events (LP's) occurred between 1 and 20 May that were associated with fluid movements. The Washington VAAC reported ash emissions on 3, 8, and 13 May, but OVT reported no surface activity during the entire month (figure 109).
In a Special Report released on 2 June 2016, IG-EPN noted a clear inflationary trend in data collected from two stations at Tungurahua since the end of the eruption in mid-March. The Retu inclinometer, located N of the crater, showed inflation on the radial axis of about 600 μrad (microradians), and about 200 μrad on the tangential axis. The same axis at the Mandur inclinometer (on the NW flank) had a smaller but distinct (~30 μrad) inflationary signal (figure 110).
A Washington VAAC report on 1 June 2016 noted that the Guayaquil Meteorological Weather Office (MWO) reported an ash plume at Tungurahua, but OVT confirmed no surface activity. A very small lahar was recorded in the La Pampa ravine on 2 June. Although there were rains of varying intensity many days during June, they did not generate significant lahars, except one of medium size that occurred on 21 June in the Achupashal ravine. The Washington VAAC noted a report from the Guayaquil MWO of an ash emission on 5 July, but it was not detected in satellite imagery, and the OVT reported no surface activity. There was no surface activity reported by OVT from July to mid-September (figure 111), and internal seismicity remained very low. Occasional rainy periods generated muddy water in the ravines, but no significant lahars were reported.
A significant increase in the number of LP seismic events began on 12 September 2016, and a small seismic swarm was recorded on 18 September (figure 112). Small fumaroles were visible at the edges of the crater on 15 and 16 September (figure 113). At this same time, the inflationary trend that had been ongoing since the eruption earlier in the year switched to deflation as measured at the Retu inclinometer.
Another increase in LP seismicity and tremors occurred on 24 September, but there were no reports of surface activity other than minor steam fumaroles. Seismicity remained elevated through early October; a one-hour tremor event was reported on 1 October. Seismicity decreased gradually over the following two weeks. Low-energy steam and gas emissions from fumaroles located on the S and SW flanks were observed during a flyover on 7 October 2016. This corresponded to the warmest areas revealed in the thermal image of the summit (figure 114). with a TMA (maximum apparent temperature) of 47.9°C and 36.5°C.
Re-suspended ash from high winds in mid-November 2016 caused several VAAC notices to be issued, but no new emissions were reported by OVT through the end of 2016.
Tungurahua remained quiet throughout 2017. A 90-minute seismic swarm on 8 January 2017 and a minor increase in seismicity in the second half of March were the only seismic events above background levels. There were no emissions except for occasional minor fumarolic activity around the crater rim. Periods of heavy rainfall occasionally produced muddy water in the ravines; the only lahars were reported during 5-6 January, late April and 15 November.
Geologic Background. Tungurahua, a steep-sided andesitic-dacitic stratovolcano that towers more than 3 km above its northern base, is one of Ecuador's most active volcanoes. Three major edifices have been sequentially constructed since the mid-Pleistocene over a basement of metamorphic rocks. Tungurahua II was built within the past 14,000 years following the collapse of the initial edifice. Tungurahua II collapsed about 3,000 years ago and produced a large debris-avalanche deposit to the west. The modern glacier-capped stratovolcano (Tungurahua III) was constructed within the landslide scarp. Historical eruptions have all originated from the summit crater, accompanied by strong explosions and sometimes by pyroclastic flows and lava flows that reached populated areas at the volcano's base. Prior to a long-term eruption beginning in 1999 that caused the temporary evacuation of the city of Baños at the foot of the volcano, the last major eruption had occurred from 1916 to 1918, although minor activity continued until 1925.
Information Contacts: Instituto Geofísico (IG), Escuela Politécnica Nacional, Casilla 17-01-2759, Quito, Ecuador (URL: http://www.igepn.edu.ec ); NASA Goddard Space Flight Center (NASA/GSFC), Global Sulfur Dioxide Monitoring Page, Atmospheric Chemistry and Dynamics Laboratory, 8800 Greenbelt Road, Goddard, Maryland, USA (URL: https://so2.gsfc.nasa.gov/); Washington Volcanic Ash Advisory Center (VAAC), Satellite Analysis Branch (SAB), NOAA/NESDIS OSPO, NOAA Science Center Room 401, 5200 Auth Rd, Camp Springs, MD 20746, USA (URL: www.ospo.noaa.gov/Products/atmosphere/vaac, archive at: http://www.ssd.noaa.gov/VAAC/archive.html).
Yasur
Vanuatu
19.532°S, 169.447°E; summit elev. 361 m
All times are local (unless otherwise noted)
Typical ongoing eruptive activity and thermal anomalies through January 2018
Regular monitoring reports about Yasur from the Vanuatu Meteorology and Geo-Hazards Department (VMGD) indicated that the centuries-long eruptive activity continued from mid-June 2017 through January 2018. VMGD volcano bulletins on 21 July, 30 August, 29 September, 31 October, and 8 December 2017, and 30 January 2018, stated that major unrest was continuing, and the Alert Level remained at 2 (on a scale of 0-4). Based on seismic data, explosions continued to be intense. Visitors were reminded of the closed 395-m-radius Permanent Exclusion Zone (figure 47) and that volcanic ash and gas could impact other areas near the volcano due to trade winds.
During the reporting period thermal anomalies based on MODIS satellite instruments analyzed using the MODVOLC algorithm were numerous every month. The MIROVA (Middle InfraRed Observation of Volcanic Activity) system also detected numerous hotspots every month (figure 48).
Geologic Background. Yasur has exhibited essentially continuous Strombolian and Vulcanian activity at least since Captain Cook observed ash eruptions in 1774. This style of activity may have continued for the past 800 years. Located at the SE tip of Tanna Island in Vanuatu, this pyroclastic cone has a nearly circular, 400-m-wide summit crater. The active cone is largely contained within the small Yenkahe caldera, and is the youngest of a group of Holocene volcanic centers constructed over the down-dropped NE flank of the Pleistocene Tukosmeru volcano. The Yenkahe horst is located within the Siwi ring fracture, a 4-km-wide open feature associated with eruption of the andesitic Siwi pyroclastic sequence. Active tectonism along the Yenkahe horst accompanying eruptions has raised Port Resolution harbor more than 20 m during the past century.
Information Contacts: Geo-Hazards Division, Vanuatu Meteorology and Geo-Hazards Department, Ministry of Climate Change Adaptation, Meteorology, Geo-Hazards, Energy, Environment and Disaster Management, Private Mail Bag 9054, Lini Highway, Port Vila, Vanuatu (URL: http://www.vmgd.gov.vu/, https://www.facebook.com/VanuatuGeohazardsObservatory/); Radio New Zealand (URL: https://www.radionz.co.nz); Hawai'i Institute of Geophysics and Planetology (HIGP) - MODVOLC Thermal Alerts System, School of Ocean and Earth Science and Technology (SOEST), Univ. of Hawai'i, 2525 Correa Road, Honolulu, HI 96822, USA (URL: http://modis.higp.hawaii.edu/); MIROVA (Middle InfraRed Observation of Volcanic Activity), a collaborative project between the Universities of Turin and Florence (Italy) supported by the Centre for Volcanic Risk of the Italian Civil Protection Department (URL: http://www.mirovaweb.it/).