Recently Published Bulletin Reports
Agung (Indonesia) Three eruptive events reported in April, May, and December 2022
Tengger Caldera (Indonesia) Minor ash emission in December 2023; persistent weak thermal anomaly in the Bromo crater
Saunders (United Kingdom) Persistent thermal anomalies from the summit crater lava lake during February 2023-January 2024
Shishaldin (United States) New eruption with significant Strombolian explosions, ash plumes, and ashfall
Ioto (Japan) New eruption with discolored water, ejecta, and floating pumice during October-December 2023
Purace (Colombia) Gas-and-ash emission on 16 November 2023
Aira (Japan) Explosions, ash plumes, ash fall, and crater incandescence during July-October 2023
Etna (Italy) Strombolian explosions, lava fountains, and lava flows during July-August 2023
Suwanosejima (Japan) Eruption plumes, crater incandescence, and occasional explosions during July-October 2023
Nishinoshima (Japan) Gray emissions during October 2023
Kilauea (United States) Strong lava fountains, lava flows, and spatter at Halema’uma’u during January-September 2023
Tinakula (Solomon Islands) Continued lava flows and thermal activity during June through November 2023
Agung (Indonesia) — January 2024  Cite this Report
Agung
Indonesia
8.343°S, 115.508°E; summit elev. 2997 m
All times are local (unless otherwise noted)
Three eruptive events reported in April, May, and December 2022
Mount Agung, located on the E end of the island of Bali, Indonesia, rises above the SE rim of the Batur caldera. The summit area extends 1.5 km E-W, with the highest point on the W and a steep-walled 800-m-wide crater on the E. Recorded eruptions date back to the early 19th century. A large and deadly explosive and effusive eruption occurred during 1963-64, which was characterized by voluminous ashfall, pyroclastic flows, and lahars that caused extensive damage and many fatalities. More recent activity was documented during November 2017-June 2019 that consisted of multiple explosions, significant ash plumes, lava flows at the summit crater, and incandescent ejecta. This report covers activity reported during April-May 2022 and December 2022 based on data from the Darwin Volcanic Ash Advisory Center (VAAC).
Activity during 2022 was relatively low and mainly consisted of a few ash plumes during April-May and December. An ash plume on 3 April rising to 3.7 km altitude (700 m above the summit) and drifting N was reported in a Darwin VAAC notice based on a ground report, with ash seen in HIMAWARI-8 visible imagery. Another ash plume was reported at 1120 on 27 May that rose to 5.5 km altitude (2.5 m above the summit); the plume was not visible in satellite or webcam images due to weather clouds. An eruption was reported based on seismic data at 0840 on 13 December, with an estimated plume altitude of 3.7 km; however, no ash was seen using satellite imagery in clear conditions before weather clouds obscured the summit.
Geologic Background. Symmetrical Agung stratovolcano, Bali's highest and most sacred mountain, towers over the eastern end of the island. The volcano, whose name means "Paramount," rises above the SE rim of the Batur caldera, and the northern and southern flanks extend to the coast. The summit area extends 1.5 km E-W, with the high point on the W and a steep-walled 800-m-wide crater on the E. The Pawon cone is located low on the SE flank. Only a few eruptions dating back to the early 19th century have been recorded in historical time. The 1963-64 eruption, one of the largest in the 20th century, produced voluminous ashfall along with devastating pyroclastic flows and lahars that caused extensive damage and many fatalities.
Information Contacts: Darwin Volcanic Ash Advisory Centre (VAAC), Bureau of Meteorology, Northern Territory Regional Office, PO Box 40050, Casuarina, NT 0811, Australia (URL: http://www.bom.gov.au/info/vaac/).
Tengger Caldera (Indonesia) — February 2024 Cite this Report
Tengger Caldera
Indonesia
7.942°S, 112.95°E; summit elev. 2329 m
All times are local (unless otherwise noted)
Minor ash emission in December 2023; persistent weak thermal anomaly in the Bromo crater
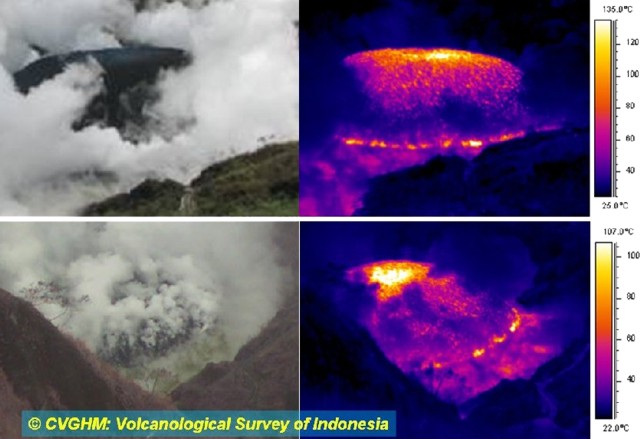
Tengger Caldera, located at the N end of a volcanic massif in Indonesia’s East Java, consists of five overlapping stratovolcanoes. The youngest and only active cone in the 16-km-wide caldera is Bromo, which typically produces gas-and-steam plumes, occasional ash plumes and explosions, and weak thermal signals (BGVN 44:05, 47:01). This report covers activity during January 2022-December 2023, consisting of mostly white gas-and-steam emissions and persistent weak thermal anomalies. Information was provided by the Pusat Vulkanologi dan Mitigasi Bencana Geologi (PVMBG, also known as Indonesian Center for Volcanology and Geological Hazard Mitigation, CVGHM) and satellite imagery. The Alert Level remained at 2 (on a scale of 1-4), and visitors were warned to stay at least 1 km from the crater.
Activity was generally low during the reporting period, similar to that in 2021. According to almost daily images from MAGMA Indonesia (a platform developed by PVMBG), white emissions and plumes rose from 50 to 900 m above the main crater during this period (figure 24). During several days in March and June 2022, white plumes reached heights of 1-1.2 km above the crater.
After an increase in activity at 2114 on 3 February 2023, a PVMBG team that was sent to observe white emissions rising as high as 300 m during 9-12 February and heard rumbling noises. A sulfur dioxide odor was also strong near the crater and measurements indicated that levels were above the healthy (non-hazardous) threshold of 5 parts per million; differential optical absorption spectroscopy (DOAS) measurements indicated an average flux of 190 metric tons per day on 11 February. Incandescence originating from a large fumarole in the NNW part of the crater was visible at night. The team observed that vegetation on the E caldera wall was yellow and withered. The seismic network recorded continuous tremor and deep and shallow volcanic earthquakes.
According to a PVMBG press release, activity increased on 13 December 2023 with white, gray, and brown emissions rising as high as 900 m above Bromo’s crater rim and drifting in multiple directions (figure 25). The report noted that tremor was continuous and was accompanied in December by three volcanic earthquakes. Deformation data indicated inflation in December. There was no observable difference in the persistent thermal anomaly in the crater between 11 and 16 December 2023.
All clear views of the Bromo crater throughout this time, using Sentinel-2 infrared satellite images, showed a weak persistent thermal anomaly; none of the anomalies were strong enough to cause MODVOLC Thermal Alerts. A fire in the SE part of the caldera in early September 2023 resulted in a brief period of strong thermal anomalies.
Geologic Background. The 16-km-wide Tengger caldera is located at the northern end of a volcanic massif extending from Semeru volcano. The massive volcanic complex dates back to about 820,000 years ago and consists of five overlapping stratovolcanoes, each truncated by a caldera. Lava domes, pyroclastic cones, and a maar occupy the flanks of the massif. The Ngadisari caldera at the NE end of the complex formed about 150,000 years ago and is now drained through the Sapikerep valley. The most recent of the calderas is the 9 x 10 km wide Sandsea caldera at the SW end of the complex, which formed incrementally during the late Pleistocene and early Holocene. An overlapping cluster of post-caldera cones was constructed on the floor of the Sandsea caldera within the past several thousand years. The youngest of these is Bromo, one of Java's most active and most frequently visited volcanoes.
Information Contacts: Pusat Vulkanologi dan Mitigasi Bencana Geologi (PVMBG, also known as Indonesian Center for Volcanology and Geological Hazard Mitigation, CVGHM), Jalan Diponegoro 57, Bandung 40122, Indonesia (URL: http://www.vsi.esdm.go.id/); MAGMA Indonesia, Kementerian Energi dan Sumber Daya Mineral (URL: https://magma.esdm.go.id/v1); Copernicus Browser, Copernicus Data Space Ecosystem, European Space Agency (URL: https://dataspace.copernicus.eu/browser/); Hawai'i Institute of Geophysics and Planetology (HIGP) - MODVOLC Thermal Alerts System, School of Ocean and Earth Science and Technology (SOEST), Univ. of Hawai'i, 2525 Correa Road, Honolulu, HI 96822, USA (URL: http://modis.higp.hawaii.edu/).
Saunders (United Kingdom) — February 2024 Cite this Report
Saunders
United Kingdom
57.8°S, 26.483°W; summit elev. 843 m
All times are local (unless otherwise noted)
Persistent thermal anomalies from the summit crater lava lake during February 2023-January 2024
Saunders is one of eleven islands that comprise the South Sandwich Islands in the South Atlantic. The active Mount Michael volcano has been in almost continuous eruption since November 2014 (BGVN 48:02). Recent activity has resulted in intermittent thermal anomalies and gas-and-steam emissions (BGVN 47:03, 48:02). Visits are infrequent due to its remote location, and cloud cover often prevents satellite observations. Satellite thermal imagery and visual observation of incandescence during a research expedition in 2019 (BGVN 28:02 and 44:08) and a finding confirmed by a National Geographic Society research team that summited Michael in November 2022 reported the presence of a lava lake.
Although nearly constant cloud cover during February 2023 through January 2024 greatly limited satellite observations, thermal anomalies from the lava lake in the summit crater were detected on clear days, especially around 20-23 August 2023. Anomalies similar to previous years (eg. BGVN 48:02) were seen in both MIROVA (Middle InfraRed Observation of Volcanic Activity) data from MODIS instruments and in Sentinel 2 infrared imagery. The only notable sulfur dioxide plume detected near Saunders was on 25 September 2023, with the TROPOMI instrument aboard the Sentinel-5P satellite.
Geologic Background. Saunders Island consists of a large central volcanic edifice intersected by two seamount chains, as shown by bathymetric mapping (Leat et al., 2013). The young Mount Michael stratovolcano dominates the glacier-covered island, while two submarine plateaus, Harpers Bank and Saunders Bank, extend north. The symmetrical Michael has a 500-m-wide summit crater and a remnant of a somma rim to the SE. Tephra layers visible in ice cliffs surrounding the island are evidence of recent eruptions. Ash clouds were reported from the summit crater in 1819, and an effusive eruption was inferred to have occurred from a N-flank fissure around the end of the 19th century and beginning of the 20th century. A low ice-free lava platform, Blackstone Plain, is located on the north coast, surrounding a group of former sea stacks. A cluster of cones on the SE flank, the Ashen Hills, appear to have been modified since 1820 (LeMasurier and Thomson, 1990). Analysis of satellite imagery available since 1989 (Gray et al., 2019; MODVOLC) suggests frequent eruptive activity (when weather conditions allow), volcanic clouds, steam plumes, and thermal anomalies indicative of a persistent, or at least frequently active, lava lake in the summit crater. Due to this observational bias, there has been a presumption when defining eruptive periods that activity has been ongoing unless there is no evidence for at least 10 months.
Information Contacts: MIROVA (Middle InfraRed Observation of Volcanic Activity), a collaborative project between the Universities of Turin and Florence (Italy) supported by the Centre for Volcanic Risk of the Italian Civil Protection Department (URL: http://www.mirovaweb.it/); NASA Global Sulfur Dioxide Monitoring Page, Atmospheric Chemistry and Dynamics Laboratory, NASA Goddard Space Flight Center (NASA/GSFC), 8800 Greenbelt Road, Goddard MD 20771, USA (URL: https://so2.gsfc.nasa.gov/); Copernicus Browser (URL: https://dataspace.copernicus.eu/browser).
Shishaldin (United States) — December 2023 Cite this Report
Shishaldin
United States
54.756°N, 163.97°W; summit elev. 2857 m
All times are local (unless otherwise noted)
New eruption with significant Strombolian explosions, ash plumes, and ashfall
Shishaldin is located on the eastern half of Unimak Island, one of the Aleutian Islands. Frequent explosive activity, primarily consisting of Strombolian ash eruptions from the small summit crater, but sometimes producing lava flows, has been recorded since the 18th century. The previous eruption ended in May 2020 and was characterized by intermittent thermal activity, increased seismicity and surface temperatures, ash plumes, and ash deposits (BGVN 45:06). This report covers a new eruption during July through November 2023, which consisted of significant explosions, ash plumes, ashfall, and lava fountaining. Information comes from daily, weekly, and special reports from the Alaska Volcano Observatory (AVO) and various satellite data. AVO monitors the volcano using local seismic and infrasound sensors, satellite data, web cameras, and remote infrasound and lightning networks.
AVO reported that intermittent tremor and low-frequency earthquakes had gradually become more regular and consistent during 10-13 July. Strongly elevated surface temperatures at the summit were identified in satellite images during 10-13 July. On 11 July AVO raised the Aviation Color Code (ACC) to Yellow (the second color on a four-color scale) and Volcano Alert Level (VAL) to Advisory (the second level on a four-level scale) at 1439. Later in the day on 11 July summit crater incandescence was observed in webcam images. Observations of the summit suggested that lava was likely present at the crater, which prompted AVO to raise the ACC to Orange (the second highest color on a four-color scale) and the VAL to Watch (the second highest level on a four-level scale). The US Coast Guard conducted an overflight on 12 July and confirmed that lava was erupting from the summit. That same day, sulfur dioxide emissions were detected in satellite images.
A significant explosion began at 0109 on 14 July that produced an ash plume that rose to 9-12 km altitude and drifted S over the Pacific Ocean (figure 43). Webcam images and photos taken around 0700 from a ship SW off Unimak Island showed small lahar deposits, which were the result of the interaction of hot pyroclastic material and snow and ice on the flanks. There was also ashfall on the SW and N flanks. A smaller explosion at 0710 generated an ash plume that rose to 4.5 km altitude. Webcam images and pilot reports showed continued low-level ash emissions during the morning, rising to less than 4.6 km altitude; those emissions included a small ash plume near the summit around 1030 resulting from a small explosion.
Seismic tremor amplitude began increasing at around 1700 on 15 July; strongly elevated surface temperatures were also reported. An ash plume rose to 4.6 km altitude and drifted SSE at 2100, based on a satellite image. A continuous ash plume during 2150 through 2330 rose to 5 km altitude and extended 125 km S. At 2357 AVO raised the ACC to Red (the highest color on a four-color scale) and the VAL to Warning (the highest level on a four-level scale), noting that seismicity remained elevated for more than six hours and explosion signals were frequently detected by regional infrasound (pressure sensor) networks. Explosions generated an ash plume that rose to 4.9 km altitude and drifted as far as 500 km SE. Activity throughout the night declined and by 0735 the ACC was lowered to Orange and the VAL to Watch. High-resolution satellite images taken on 16 July showed pyroclastic deposits extending as far as 3 km from the vent; these deposits generated lahars that extended further down the drainages on the flanks. Ash deposits were mainly observed on the SSE flank and extended to the shore of Unimak Island. During 16-17 July lava continued to erupt at the summit, which caused strongly elevated surface temperatures that were visible in satellite imagery.
Lava effusion increased at 0100 on 18 July, as noted in elevated surface temperatures identified in satellite data, increasing seismic tremor, and activity detected on regional infrasound arrays. A significant ash plume at 0700 rose to 7 km altitude and continued until 0830, eventually reaching 9.1 km altitude and drifting SSE (figure 44). As a result, the ACC was raised to Red and the VAL to Warning. By 0930 the main plume detached, but residual low-level ash emissions continued for several hours, remaining below 3 km altitude and drifting S. The eruption gradually declined and by 1208 the ACC was lowered to Orange and the VAL was lowered to Watch. High-resolution satellite images showed ash deposits on the SW flank and pyroclastic deposits on the N, E, and S flanks, extending as far as 3 km from the vent; lahars triggered by the eruption extended farther down the flanks (figure 45). Lava continued to erupt from the summit crater on 19 July.
Elevated surface temperatures were detected in satellite images during 19-25 July, despite occasional weather cloud cover, which was consistent with increased lava effusion. During 22-23 July satellite observations acquired after the eruption from 18 July showed pyroclastic flow and lahar deposits extending as far as 3 km down the N, NW, and NE flanks and as far as 1.5 km down the S and SE flanks. Ash deposits covered the SW and NE flanks. No lava flows were observed outside the crater. On 22 July a sulfur dioxide plume was detected in satellite data midday that had an estimated mass of 10 kt. In a special notice issued at 1653 on 22 July AVO noted that eruptive activity had intensified over the previous six hours, which was characterized by an hours-long steady increase in seismic tremor, intermittent infrasound signals consistent with small explosions, and an increase in surface temperatures that were visible in satellite data. Pilots first reported low-level ash plumes at around 1900. At 2320 an ash plume had risen to 9 km altitude based on additional pilot reports and satellite images. The ACC was increased to Red and the VAL to Warning at 2343. Satellite images indicated growth of a significantly higher ash plume that rose to 11 km altitude continued until 0030 and drifted NE. During the early morning hours of 23 July ash plumes had declined to 4.6 k altitude. Seismic tremor peaked at 0030 on 23 July and began to rapidly decline at 0109; active ash emissions were no longer visible in satellite data by 0130. The ACC was lowered to Orange and the VAL to Watch at 0418; bursts of increased seismicity were recorded throughout the morning, but seismicity generally remained at low levels. Elevated surface temperatures were visible in satellite data until about 0600. On 24 July pilots reported seeing vigorous gas-and-steam plumes rising to about 3 km altitude; the plumes may have contained minor amounts of ash.
During 24-25 July low level seismicity and volcanic tremor were detected at low levels following the previous explosion on 23 July. Strongly elevated surface temperatures were observed at the summit crater in satellite data. Around 2200 on 25 July seismicity began to increase, followed by infrasound signals of explosions after 0200 on 26 July. An ash plume rose to 3 km altitude at 0500 and drifted ENE, along with an associated sulfur dioxide plume that drifted NE and had an estimated mass of 22 kt. Diffuse ash emissions were visible in satellite data and rose to 6.1-7.6 km altitude and extended 125 km from the volcano starting around 1130. These ash events were preceded by about seven hours of seismic tremor, infrasound detections of explosions, and five hours of increased surface temperatures visible in satellite data. Activity began to decline around 1327, which included low-frequency earthquakes and decreased volcanic tremor, and infrasound data no longer detected significant explosions. Surface temperatures remained elevated through the end of the month.
Seismicity, volcanic tremor, and ash emissions remained at low levels during early August. Satellite images on 1 August showed that some slumping had occurred on the E crater wall due to the recent explosive activity. Elevated surface temperatures continued, which was consistent with cooling lava. On 2 August small explosive events were detected, consistent with low-level Strombolian activity. Some episodes of volcanic tremor were reported, which reflected low-level ash emissions. Those ash emissions rose to less than 3 km altitude and drifted as far as 92.6 km N. Pilots that were located N of the volcano observed an ash plume that rose to 2.7 km altitude. Seismicity began to increase in intensity around 0900 on 3 August. Seismicity continued to increase throughout the day and through the night with strongly elevated surface temperatures, which suggested that lava was active at the surface.
An ash cloud that rose to 7.6-7.9 km altitude and drifted 60-75 km NE was visible in a satellite image at 0520 on 4 August. Pilots saw and reported the plume at 0836 (figure 46). By 0900 the plume had risen to 9.1 km altitude and extended over 100 km NE. AVO raised the ACC to Red and the VAL to Warning as a result. Seismic tremor levels peaked at 1400 and then sharply declined at 1500 to slightly elevated levels; the plume was sustained during the period of high tremor and drifted N and NE. The ACC was lowered to Orange and the VAL to Watch at 2055. During 5-14 August seismicity remained low and surface temperatures were elevated based on satellite data due to cooling lava. On 9 August a small lava flow was observed that extended from the crater rim to the upper NE flank. It had advanced to 55 m in length and appeared in satellite imagery on 11 August. Occasional gas-and-steam plumes were noted in webcam images. At 1827 AVO noted that seismic tremor had steadily increased during the afternoon and erupting lava was visible at the summit in satellite images.
Strong explosion signals were detected at 0200 on 15 August. An ash cloud that was visible in satellite data extended 100 km NE and may have risen as high as 11 km altitude around 0240. By 0335 satellite images showed the ash cloud rising to 7.6 km altitude and drifting NE. Significant seismicity and explosions were detected by the local AVO seismic and infrasound networks, and volcanic lightning was detected by the World Wide Lightning Location Network (WWLLN). A sulfur dioxide plume associated with the eruption drifted over the S Bering Sea and parts of Alaska and western Canada. Seismicity was significantly elevated during the eruption but had declined by 1322. A pilot reported that ash emissions continued, rising as high as 4.9 km altitude. Elevated surface temperatures detected in satellite data were caused by hot, eruptive material (pyroclastic debris and lava) that accumulated around the summit. Eruptive activity declined by 16 August and the associated sulfur dioxide plume had mostly dissipated; remnants continued to be identified in satellite images at least through 18 August. Surface temperatures remained elevated based on satellite images, indicating hot material on the upper parts of the volcano. Small explosions were detected in infrasound data on the morning of 19 August and were consistent with pilot reports of small, short-lived ash plumes that rose to about 4.3 km altitude. Low-level explosive activity was reported during 20-24 August, according to seismic and infrasound data, and weather clouds sometimes prevented views. Elevated surface temperatures were observed in satellite images, which indicated continued hot material on the upper parts of the volcano.
Seismic tremor began to increase at around 0300 on 25 August and was followed by elevated surface temperatures identified in satellite images, consistent with erupting lava. Small explosions were recorded in infrasound data. The ACC was raised to Red and the VAL to Warning at 1204 after a pilot reported an ash plume that rose to 9.1 km altitude. Seismicity peaked at 1630 and began to rapidly decline at around 1730. Ash plumes rose as high as 10 km altitude and drifted as far as 400 km NE. By 2020 the ash plumes had declined to 6.4 km altitude and continued to drift NE. Ash emissions were visible in satellite data until 0000 on 26 August and seismicity was at low levels. AVO lowered the ACC to Orange and the VAL to Watch at 0030. Minor explosive activity within the summit crater was detected during 26-28 August and strongly elevated surface temperatures were still visible in satellite imagery through the rest of the month. An AVO field crew working on Unimak Island observed a mass flow that descended the upper flanks beginning around 1720 on 27 August. The flow produced a short-lived ash cloud that rose to 4.5 km altitude and rapidly dissipated. The mass flow was likely caused by the collapse of spatter that accumulated on the summit crater rim.
Similar variable explosive activity was reported in September, although weather observations sometimes prevented observations. A moderate resolution satellite image from the afternoon of 1 September showed gas-and-steam emissions filling the summit crater and obscuring views of the vent. In addition, hot deposits from the previous 25-26 August explosive event were visible on the NE flank near the summit, based on a 1 September satellite image. On 2 and 4 September seismic and infrasound data showed signals of small, repetitive explosions. Variable gas-and-steam emissions from the summit were visible but there was no evidence of ash. Possible summit crater incandescence was visible in nighttime webcam images during 3-4 September.
Seismicity began to gradually increase at around 0300 on 5 September and activity escalated at around 0830. A pilot reported an ash plume that rose to 7.6 km altitude at 0842 and continued to rise as high as possibly 9.7 km altitude and drifted SSE based on satellite images (figure 47). The ACC was raised to Red and the VAL to Warning at 0900. In addition to strong tremor and sustained explosions, the eruption produced volcanic lightning that was detected by the WWLLN. Around 1100 seismicity decreased and satellite data confirmed that the altitude of the ash emissions had declined to 7.6 km altitude. By 1200 the lower-altitude portion of the ash plume had drifted 125 km E. Significant ash emissions ended by 1330 based on webcam images. The ACC was lowered to Orange and the VAL to Watch at 1440. Satellite images showed extensive pyroclastic debris flows on most of the flanks that extended 1.2-3.3 km from the crater rim.
During 6-13 September elevated surface temperatures continued to be observed in satellite data, seismicity remained elevated with weak but steady tremor, and small, low-frequency earthquakes and small explosions were reported, except on 12 September. On 6 September a low-level ash plume rose to 1.5-1.8 km altitude and drifted SSE. Occasional small and diffuse gas-and-steam emissions at the summit were visible in webcam images. Around 1800 on 13 September seismic tremor amplitudes began to increase, and small explosions were detected in seismic and infrasound data. Incandescent lava at the summit was seen in a webcam image taken at 0134 on 14 September during a period of elevated tremor. No ash emissions were reported during the period of elevated seismicity. Lava fountaining began around 0200, based on webcam images. Satellite-based radar observations showed that the lava fountaining activity led to the growth of a cone in the summit crater, which refilled most of the crater. By 0730 seismicity significantly declined and remained at low levels.
Seismic tremor began to increase around 0900 on 15 September and rapidly intensified. An explosive eruption began at around 1710, which prompted AVO to raise the ACC to Red and the VAL to Warning. Within about 30 minutes ash plumes drifted E below a weather cloud at 8.2 km altitude. The National Weather Service estimated that an ash-rich plume rose as high as 12.8 km altitude and produced volcanic lightning. The upper part of the ash plume detached from the vent around 1830 and drifted E, and was observed over the Gulf of Alaska. Around the same time, seismicity dramatically decreased. Trace ashfall was reported in the community of False Pass (38 km ENE) between 1800-2030 and also in King Cove and nearby marine waters. Activity declined at around 1830 although seismicity remained elevated, ash emissions, and ashfall continued until 2100. Lightning was again detected beginning around 1930, which suggested that ash emissions continued. Ongoing explosions were detected in infrasound data, at a lower level than during the most energetic phase of this event. Lightning was last detected at 2048. By 2124 the intensity of the eruption had decreased, and ash emissions were likely rising to less than 6.7 km altitude. Seismicity returned to pre-eruption levels. On 16 September the ACC was lowered to Orange and the VAL to Watch at 1244; the sulfur dioxide plume that was emitted from the previous eruption event was still visible over the northern Pacific Ocean. Elevated surface temperatures, gas-and-steam emissions from the vent, and new, small lahars were reported on the upper flanks based on satellite and webcam images. Minor deposits were reported on the flanks which were likely the result of collapse of previously accumulated lava near the summit crater.
Elevated seismicity with tremor, small earthquakes, and elevated surface temperatures were detected during 17-23 September. Minor gas-and-steam emissions were visible in webcam images. On 20 September small volcanic debris flows were reported on the upper flanks. On 21 September a small ash deposit was observed on the upper flanks extending to the NE based on webcam images. Seismic tremor increased significantly during 22-23 September. Regional infrasound sensors suggested that low-level eruptive activity was occurring within the summit crater by around 1800 on 23 September. Even though seismicity was at high levels, strongly elevated surface temperatures indicating lava at the surface were absent and no ash emissions were detected; weather clouds at 0.6-4.6 km altitude obscured views. At 0025 on 24 September AVO noted that seismicity continued at high levels and nearly continuous small infrasound signals began, likely from low-level eruptive activity. Strongly elevated surface temperatures were identified in satellite images by 0900 and persisted throughout the day; the higher temperatures along with infrasound and seismic data were consistent with lava erupting at the summit. Around 1700 similarly elevated surface temperatures were detected from the summit in satellite data, which suggested that more vigorous lava fountaining had started. Starting around 1800 low-level ash emissions rose to altitudes less than 4.6 km altitude and quickly dissipated.
Beginning at midnight on 25 September, a series of seismic signals consistent with volcanic flows were recorded on the N side of the volcano. A change in seismicity and infrasound signals occurred around 0535 and at 0540 a significant ash cloud formed and quickly reached 14 km altitude and drifted E along the Alaska Peninsula. The cloud generated at least 150 lightning strokes with thunder that could be heard by people in False Pass. Seismicity rapidly declined to near background levels around 0600. AVO increased the ACC to Red and the VAL to Warning at 0602. The ash cloud detached from the volcano at around 0700, rose to 11.6 km altitude, and drifted ESE. Trace to minor amounts of ashfall were reported by the communities of False Pass, King Cove, Cold Bay, and Sand Point around 0700. Ash emissions continued at lower altitudes of 6-7.6 km altitude at 0820. Small explosions at the vent area continued to be detected in infrasound data and likely represented low-level eruptive activity near the vent. Due to the significant decrease in seismicity and ash emissions the ACC was lowered to Orange and the VAL to Watch at 1234. Radar data showed significant collapses of the crater that occurred on 25 September. Satellite data also showed significant hot, degassing pyroclastic and lahar deposits on all flanks, including more extensive flows on the ENE and WSW sections below two new collapse scarps. Following the significant activity during 24-25 September, only low-level activity was observed. Seismicity decreased notably near the end of the strong activity on 25 September and continued to decrease through the end of the month, though tremor and small earthquakes were still reported. No explosive activity was detected in infrasound data through 2 October. Gas-and-steam emissions rose to 3.7 km altitude, as reported by pilots and seen in satellite images. Satellite data from 26 September showed that significant collapses had occurred at the summit crater and hot, steaming deposits from pyroclastic flows and lahars were present on all the flanks, particularly to the ENE and WSW. A small ash cloud was visible in webcam images on 27 September, likely from a collapse at the summit cone. High elevated surface temperatures were observed in satellite imagery during 27-28 September, which were likely the result of hot deposits on the flanks erupted on 25 September. Minor steaming at the summit crater and from an area on the upper flanks was visible in webcam images on 28 September.
During October, explosion events continued between periods of low activity. Seismicity significantly increased starting at around 2100 on 2 October; around the same time satellite images showed an increase in surface temperatures consistent with lava fountaining. Small, hot avalanches of rock and lava descended an unspecified flank. In addition, a distinct increase in infrasound, seismicity, and lightning detections was followed by an ash plume that rose to 12.2 km altitude and drifted S and E at 0520 on 3 October, based on satellite images. Nighttime webcam images showed incandescence due to lava fountaining at the summit and pyroclastic flows descending the NE flank. AVO reported that a notable explosive eruption started at 0547 and lasted until 0900 on 3 October, which prompted a rise in the ACC to Red and the VAL to Warning. Subsequent ash plumes rose to 6-7.6 km altitude by 0931. At 1036 the ACC was lowered back to Orange and the VAL to Watch since both seismic and infrasound data quieted substantially and were slightly above background levels. Gas-and-steam emissions were observed at the summit, based on webcam images. Trace amounts of ashfall were observed in Cold Bay. Resuspended ash was present at several kilometers altitude near the volcano. During the afternoon, low-level ash plumes were visible at the flanks, which appeared to be largely generated by rock avalanches off the summit crater following the explosive activity. These ash plumes rose to 3 km altitude and drifted W. Trace amounts of ashfall were reported by observers in Cold Bay and Unalaska and flights to these communities were disrupted by the ash cloud. Satellite images taken after the eruption showed evidence of pyroclastic flows and lahar deposits in drainages 2 km down the SW flank and about 3.2 km down the NE flank, and continued erosion of the crater rim. Small explosion craters at the end of the pyroclastic flows on the NE flank were noted for the first time, which may have resulted from gas-and-steam explosions when hot deposits interact with underlying ice.
During 4 October seismicity, including frequent small earthquakes, remained elevated, but was gradually declining. Ash plumes were produced for over eight hours until around 1400 that rose to below 3.7 km altitude. These ash plumes were primarily generated off the sides of the volcano where hot rock avalanches from the crater rim had entered drainages to the SW and NE. Two explosion craters were observed at the base of the NE deposits about 3.2 km from the crater rim. Webcam images showed the explosion craters were a source of persistent ash emissions; occasional collapse events also generated ash. Seismicity remained elevated with sulfur dioxide emissions that had a daily average of more than 1,000 tons per day, and frequent small earthquakes through the end of the month. Frequent elevated surface temperatures were identified in satellite images and gas-and-steam plumes were observed in webcam images, although weather conditions occasionally prevented clear views of the summit. Emissions were robust during 14-16 October and were likely generated by the interaction of hot material and snow and ice. During the afternoon of 21 October a strong gas-and-steam plume rose to 3-4.6 km altitude and extended 40 km WSW, based on satellite images and reports from pilots. On 31 October the ACC was lowered to Yellow and the VAL was lowered to Advisory.
Activity in November was characterized by elevated seismicity with ongoing seismic tremor and small, low-frequency earthquakes, elevated surface temperatures, and gas-and-steam emissions. There was an increase in seismic and infrasound tremor amplitudes starting at 1940 on 2 November. As a result, the ACC was again raised to Orange and the VAL was increased to Watch, although ash was not identified in satellite data. An ash cloud rose to 6.1 km altitude and drifted W according to satellite data at 2000. By 0831 on 3 November ash emissions were no longer visible in satellite images. On 6 and 9 November air pressure sensors detected signals consistent with small explosions. Small explosions were detected in infrasound data consistent with weak Strombolian activity on 19 and 21 November. Seismicity started to decrease on 21 November. On 25 November gas-and-steam emissions were emitted from the vent as well as from a scarp on the NE side of the volcano near the summit. A gas-and-steam plume extended about 50 km SSE and was observed in satellite and webcam images on 26 November. On 28 November small explosions were observed in seismic and local infrasound data and gas-and-steam emissions were visible from the summit and from the upper NE collapse scarp based on webcam images. Possible small explosions were observed in infrasound data on 30 November. Weakly elevated surface temperatures and a persistent gas-and-steam plume from the summit and collapse scarps on the upper flanks. A passing aircraft reported the gas-and-steam plume rose to 3-3.4 km altitude on 30 November, but no significant ash emissions were detected.
Satellite data. MODIS thermal anomaly data provided through MIROVA (Middle InfraRed Observation of Volcanic Activity) showed a strong pulse of thermal activity beginning in July 2023 that continued through November 2023 (figure 48). This strong activity was due to Strombolian explosions and lava fountaining events at the summit crater. According to data from MODVOLC thermal alerts, a total of 101 hotspots were detected near the summit crater in July (11-14, 16-19, 23-24 and 26), August (4, 25-26, and 29), September (5, 12, and 17), and October (3, 4, and 8). Infrared satellite data showed large lava flows descending primarily the northern and SE flanks during the reporting period (figure 49). Sulfur dioxide plumes often exceeded two Dobson Units (DUs) and drifted in different directions throughout the reporting period, based on satellite data from the TROPOMI instrument on the Sentinel-5P satellite (figure 50).
Geologic Background. The symmetrical glacier-covered Shishaldin in the Aleutian Islands is the westernmost of three large stratovolcanoes in the eastern half of Unimak Island. The Aleuts named the volcano Sisquk, meaning "mountain which points the way when I am lost." Constructed atop an older glacially dissected edifice, it is largely basaltic in composition. Remnants of an older edifice are exposed on the W and NE sides at 1,500-1,800 m elevation. There are over two dozen pyroclastic cones on its NW flank, which is covered by massive aa lava flows. Frequent explosive activity, primarily consisting of Strombolian ash eruptions from the small summit crater, but sometimes producing lava flows, has been recorded since the 18th century. A steam plume often rises from the summit crater.
Information Contacts: Alaska Volcano Observatory (AVO), a cooperative program of a) U.S. Geological Survey, 4200 University Drive, Anchorage, AK 99508-4667 USA (URL: https://avo.alaska.edu/), b) Geophysical Institute, University of Alaska, PO Box 757320, Fairbanks, AK 99775-7320, USA, and c) Alaska Division of Geological & Geophysical Surveys, 794 University Ave., Suite 200, Fairbanks, AK 99709, USA (URL: http://dggs.alaska.gov/); MIROVA (Middle InfraRed Observation of Volcanic Activity), a collaborative project between the Universities of Turin and Florence (Italy) supported by the Centre for Volcanic Risk of the Italian Civil Protection Department (URL: http://www.mirovaweb.it/); Hawai'i Institute of Geophysics and Planetology (HIGP) - MODVOLC Thermal Alerts System, School of Ocean and Earth Science and Technology (SOEST), Univ. of Hawai'i, 2525 Correa Road, Honolulu, HI 96822, USA (URL: http://modis.higp.hawaii.edu/); NASA Global Sulfur Dioxide Monitoring Page, Atmospheric Chemistry and Dynamics Laboratory, NASA Goddard Space Flight Center (NASA/GSFC), 8800 Greenbelt Road, Goddard, Maryland, USA (URL: https://so2.gsfc.nasa.gov/); Copernicus Browser, Copernicus Data Space Ecosystem, European Space Agency (URL: https://dataspace.copernicus.eu/browser/).
Ioto
Japan
24.751°N, 141.289°E; summit elev. 169 m
All times are local (unless otherwise noted)
New eruption with discolored water, ejecta, and floating pumice during October-December 2023
Ioto (Iwo-jima), located about 1,200 km S of Tokyo, lies within a 9-km-wide submarine caldera along the Izu-Bonin-Mariana volcanic arc. Previous eruptions date back to 1889 and have consisted of dominantly phreatic explosions, pumice deposits during 2001, and discolored water. A submarine eruption during July through December 2022 was characterized by discolored water, pumice deposits, and gas emissions (BGVN 48:01). This report covers a new eruption during October through December 2023, which consisted of explosions, black ejecta, discolored water, and floating pumice, based on information from the Japan Meteorological Association (JMA), the Japan Coast Guard (JCG), and satellite data.
JMA reported that an eruption had been occurring offshore of Okinahama on the SE side of the island since 21 October, which was characterized by volcanic tremor, according to the Japan Maritime Self-Defense Force (JMSDF) Iwo Jima Air Base (figure 22). According to an 18 October satellite image a plume of discolored water at the site of this new eruption extended NE (figure 23). During an overflight conducted on 30 October, a vent was identified about 1 km off the coast of Okinahama. Observers recorded explosions every few minutes that ejected dark material about 20 m above the ocean and as high as 150 m. Ejecta from the vent formed a black-colored island about 100 m in diameter, according to observations conducted from the air by the Earthquake Research Institute of the University of Tokyo in cooperation with the Mainichi newspaper (figure 24). Occasionally, large boulders measuring more than several meters in size were also ejected. Observations from the Advanced Land Observing Satellite Daichi-2 and Sentinel-2 satellite images also confirmed the formation of this island (figure 23). Brown discolored water and floating pumice were present surrounding the island.
The eruption continued during November. During an overflight on 3 November observers photographed the island and noted that material was ejected 169 m high, according to a news source. Explosions gradually became shorter, and, by the 3rd, they occurred every few seconds; dark and incandescent material were ejected about 800 m above the vent. On 4 November eruptions were accompanied by explosive sounds. Floating, brown-colored pumice was present in the water surrounding the island. There was a brief increase in the number of volcanic earthquakes during 8-14 November and 24-25 November. The eruption temporarily paused during 9-11 November and by 12 November eruptions resumed to the W of the island. On 10 November dark brown-to-dark yellow-green discolored water and a small amount of black floating material was observed (figure 25). A small eruption was reported on 18 November off the NE coast of the island, accompanied by white gas-and-steam plumes (figure 23). Another pause was recorded during 17-19 November, which then resumed on 20 November and continued erupting intermittently. According to a field survey conducted by the National Institute for Disaster Prevention Science and Technology on 19 November, a 30-m diameter crater was visible on the NE coast where landslides, hot water, and gray volcanic ash containing clay have occurred and been distributed previously. Erupted blocks about 10 cm in diameter were distributed about 90-120 m from the crater. JCG made observations during an overflight on 23 November and reported a phreatomagmatic eruption. Explosions at the main vent generated dark gas-and-ash plumes that rose to 200 m altitude and ejected large blocks that landed on the island and in the ocean (figure 26). Discolored water also surrounded the island. The size of the new island had grown to 450 m N-S x 200 m E-W by 23 November, according to JCG.
The eruption continued through 11 December, followed by a brief pause in activity, which then resumed on 31 December, according to JMA. Intermittent explosions produced 100-m-high black plumes at intervals of several minutes to 30 minutes during 1-10 December. Overflights were conducted on 4 and 15 December and reported that the water surrounding the new island was discolored to dark brown-to-dark yellow-green (figure 27). No floating material was reported during this time. In comparison to the observations made on 23 November, the new land had extended N and part of it had eroded away. In addition, analysis by the Geospatial Information Authority of Japan using SAR data from Daichi-2 also confirmed that the area of the new island continued to decrease between 4 and 15 December. Ejected material combined with wave erosion transformed the island into a “J” shape, 500-m-long and with the curved part about 200 m offshore of Ioto. The island was covered with brown ash and blocks, and the surrounding water was discolored to greenish-brown and contained an area of floating pumice. JCG reported from an overflight on 4 December that volcanic ash-like material found around the S vent on the NE part of the island was newly deposited since 10 November (figure 28). By 15 December the N part of the “J” shaped island had separated and migrated N, connecting to the Okinahama coast and the curved part of the “J” had eroded into two smaller islands (figure 27).
References. Ukawa, M., Fujita, E., Kobayashi, T., 2002, Recent volcanic activity of Iwo Jima and the 2001 eruption, Monthly Chikyu, Extra No. 39, 157-164.
Geologic Background. Ioto, in the Volcano Islands of Japan, lies within a 9-km-wide submarine caldera. The volcano is also known as Ogasawara-Iojima to distinguish it from several other "Sulfur Island" volcanoes in Japan. The triangular, low-elevation, 8-km-long island narrows toward its SW tip and has produced trachyandesitic and trachytic rocks that are more alkalic than those of other volcanoes in this arc. The island has undergone uplift for at least the past 700 years, accompanying resurgent doming of the caldera; a shoreline landed upon by Captain Cook's surveying crew in 1779 is now 40 m above sea level. The Motoyama plateau on the NE half of the island consists of submarine tuffs overlain by coral deposits and forms the island's high point. Many fumaroles are oriented along a NE-SW zone cutting through Motoyama. Numerous recorded phreatic eruptions, many from vents on the W and NW sides of the island, have accompanied the uplift.
Information Contacts: Japan Meteorological Agency (JMA), 1-3-4 Otemachi, Chiyoda-ku, Tokyo 100-8122, Japan (URL: http://www.jma.go.jp/jma/indexe.html); Japan Coast Guard (JCG) Volcano Database, Hydrographic and Oceanographic Department, 3-1-1, Kasumigaseki, Chiyoda-ku, Tokyo 100-8932, Japan (URL: https://www1.kaiho.mlit.go.jp/GIJUTSUKOKUSAI/kaiikiDB/kaiyo22-2.htm); Copernicus Browser, Copernicus Data Space Ecosystem, European Space Agency (URL: https://dataspace.copernicus.eu/browser/); Asahi, 5-3-2, Tsukiji, Chuo Ward, Tokyo, 104-8011, Japan (URL: https://www.asahi.com/ajw/articles/15048458).
Purace (Colombia) — December 2023 Cite this Report
Purace
Colombia
2.3095°N, 76.3948°W; summit elev. 4650 m
All times are local (unless otherwise noted)
Gas-and-ash emission on 16 November 2023
Puracé, located in Colombia, is a stratovolcano that contains a 500-m-wide summit crater. It is part of the Los Coconucos volcanic chain that is a NW-SE trending group of seven cones and craters. The most recent eruption occurred during March 2022 that was characterized by frequent seismicity and gas-and-steam emissions (BGVN 47:06). This report covers a brief eruption during November 2023 based on monthly reports from the Popayán Observatory, part of the Servicio Geologico Colombiano (SGC).
Activity during November 2022 through November 2023 primarily consisted of seismicity: VT-type events, LP-type events, HB-type events, and TR-type events (table 4). Maximum sulfur dioxide values were measured weekly and ranged from 259-5,854 tons per day (t/d) during November 2022 through April 2023. White gas-and-steam emissions were also occasionally reported.
SGC issued a report on 25 October that noted a significant increase in the number of earthquakes associated with rock fracturing. These earthquakes were located SE of the crater between Puracé and Piocollo at depths of 1-4 km. There were no reported variations in sulfur dioxide values, but SGC noted high carbon dioxide values, compared to those recorded in the first half of 2023.
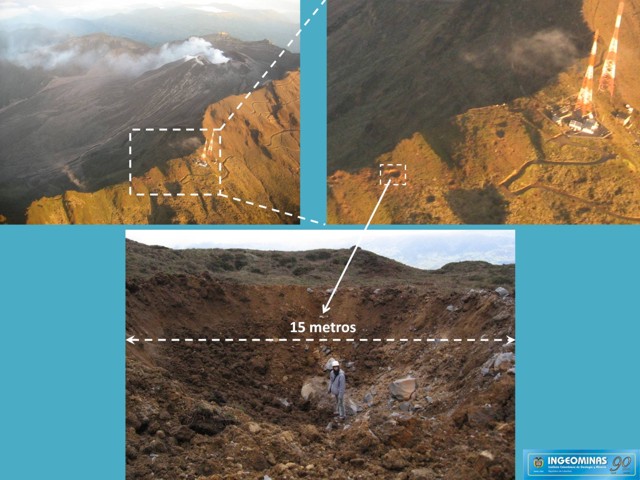
SGC reported that at 1929 on 16 November the seismic network detected a signal that was possibly associated with a gas-and-ash emission, though it was not confirmed in webcam images due to limited visibility. On 17 November an observer confirmed ash deposits on the N flank. Webcam images showed an increase in degassing both inside the crater and from the NW flank, rising 700 m above the crater.
Table 4. Seismicity at Puracé during November 2022-November 2023. Volcano-tectonic (VT), long-period (LP), hybrid (HB), and tremor (TR) events are reported each month. Courtesy of SGC.
| Month |
Volcano-tectonic |
Long-period |
Hybrid |
Tremor |
| Nov 2022 |
429 |
2,023 |
5 |
831 |
| Dec 2022 |
423 |
1,390 |
9 |
834 |
| Jan 2023 |
719 |
1,622 |
0 |
957 |
| Feb 2023 |
598 |
1,701 |
2 |
1,124 |
| Mar 2023 |
331 |
2,408 |
147 |
607 |
| Apr 2023 |
614 |
4,427 |
33 |
148 |
| May 2023 |
620 |
3,717 |
170 |
109 |
| Jun 2023 |
467 |
3,293 |
86 |
148 |
| Jul 2023 |
1,116 |
5,809 |
183 |
542 |
| Aug 2023 |
692 |
2,927 |
94 |
321 |
| Sep 2023 |
887 |
1,505 |
82 |
848 |
| Oct 2023 |
2,373 |
2,949 |
135 |
692 |
| Nov 2023 |
1,212 |
2,302 |
69 |
293 |
Geologic Background. Puracé is an active andesitic volcano with a 600-m-diameter summit crater at the NW end of the Los Coconucos Volcanic Chain. This volcanic complex includes nine composite and five monogenetic volcanoes, extending from the Puracé crater more than 6 km SE to the summit of Pan de Azúcar stratovolcano. The dacitic massif which the complex is built on extends about 13 km NW-SE and 10 km NE-SW. Frequent small to moderate explosive eruptions reported since 1816 CE have modified the morphology of the summit crater, with the largest eruptions in 1849, 1869, and 1885.
Information Contacts: Servicio Geologico Colombiano (SGC), Diagonal 53 No. 34-53 - Bogotá D.C., Colombia (URL: https://www.sgc.gov.co/volcanes).
Aira
Japan
31.5772°N, 130.6589°E; summit elev. 1117 m
All times are local (unless otherwise noted)
Explosions, ash plumes, ash fall, and crater incandescence during July-October 2023
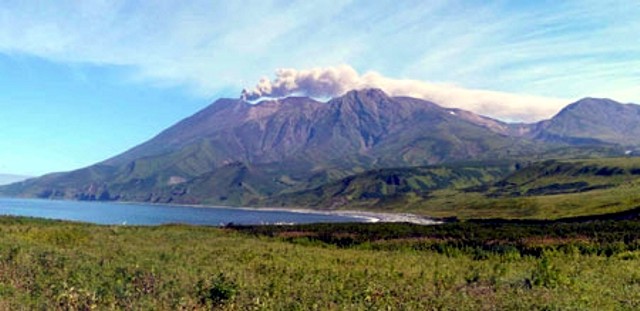
Aira caldera, located in the northern half of Kagoshima Bay, Japan, contains the post-caldera Sakurajima volcano. Eruptions typically originate from the Minamidake crater, and since the 8th century, ash deposits have been recorded in the city of Kagoshima (10 km W), one of Kyushu’s largest cities. The Minamidake summit cone and crater has had persistent activity since 1955; the Showa crater on the E flank has also been intermittently active since 2006. The current eruption period began during March 2017 and has recently been characterized by intermittent explosions, eruption plumes, and ashfall (BGVN 48:07). This report updates activity during July through October 2023 and describes explosive events, ash plumes, nighttime crater incandescence, and ashfall, according to monthly activity reports from the Japan Meteorological Agency (JMA) and satellite data.
Thermal activity remained at low levels during this reporting period, according to the MIROVA (Middle InfraRed Observation of Volcanic Activity) system (figure 149). There was a slight increase in the number of anomalies during September through October. Occasional thermal anomalies were visible in infrared satellite images mainly at the Minamidake crater (Vent A is located to the left and Vent B is located to the right) (figure 150).
Table 30. Number of monthly explosive events, days of ashfall, area of ash covered, and sulfur dioxide emissions from Sakurajima’s Minamidake crater at Aira during July-October 2023. Note that smaller ash events are not listed. Ashfall days were measured at Kagoshima Local Meteorological Observatory and ashfall amounts represent material covering all the Kagoshima Prefecture. Data courtesy of JMA monthly reports.
| Month |
Explosive events |
Days of ashfall |
Ashfall amount (g/m2) |
SO2 emissions (tons/day) |
| Jul 2023 |
3 |
0 |
0 |
1,600-3,200 |
| Aug 2023 |
3 |
10 |
7 |
1,800-3,300 |
| Sep 2023 |
3 |
7 |
3 |
1,600-2,300 |
| Oct 2023 |
33 |
8 |
61 |
2,200-4,200 |
JMA reported that during July, there were eight eruptions, three of which were explosion events in the Showa crater. Large blocks were ejected as far as 600 m from the Showa crater. Very small eruptions were occasionally reported at the Minamidake crater. Nighttime incandescence was observed in both the Showa and Minamidake crater. Explosions were reported on 16 July at 2314 and on 17 July at 1224 and at 1232 (figure 151). Resulting eruption plumes rose 700-2,500 m above the crater and drifted N. On 23 July the number of volcanic earthquakes on the SW flank of the volcano increased. A strong Mw 3.1 volcanic earthquake was detected at 1054 on 26 July. The number of earthquakes recorded throughout the month was 545, which markedly increased from 73 in June. No ashfall was observed at the Kagoshima Regional Meteorological Observatory during July. According to a field survey conducted during the month, the daily amount of sulfur dioxide emissions was 1,600-3,200 tons per day (t/d).
There were three eruptions reported at the Minamidake crater during August, each of which were explosive. The explosions occurred on 9 August at 0345, on 13 August at 2205, and on 31 August at 0640, which generated ash plumes that rose 800-2,000 m above the crater and drifted W. There were two eruptions detected at Showa crater; on 4 August at 2150 ejecta traveled 800 m from the Showa crater and associated eruption plumes rose 2.3 km above the crater. The explosion at 2205 on 13 August generated an ash plume that rose 2 km above the crater and was accompanied by large blocks that were ejected 600 m from the Minamidake crater (figure 152). Nighttime crater incandescence was visible in a high-sensitivity surveillance camera at both craters. Seismicity consisted of 163 volcanic earthquakes, 84 of which were detected on the SW flank. According to the Kagoshima Regional Meteorological Observatory there was a total of 7 g/m2 of ashfall over the course of 10 days during the month. According to a field survey, the daily amount of sulfur dioxide emitted was 1,800-3,300 t/d.
During September, four eruptions were reported, three of which were explosion events. These events occurred at 1512 on 9 September, at 0018 on 11 September, and at 2211 on 13 September. Resulting ash plumes generally rose 800-1,100 m above the crater. An explosion produced an ash plume at 2211 on 13 September that rose as high as 1.7 km above the crater. Large volcanic blocks were ejected 600 m from the Minamidake crater. Smaller eruptions were occasionally observed at the Showa crater. Nighttime crater incandescence was visible at the Minamidake crater. Seismicity was characterized by 68 volcanic earthquakes, 28 of which were detected beneath the SW flank. According to the Kagoshima Regional Meteorological Observatory there was a total of 3 g/m2 of ashfall over the course of seven days during the month. A field survey reported that the daily amount of sulfur dioxide emitted was 1,600-2,300 t/d.
Eruptive activity during October consisted of 69 eruptions, 33 of which were described as explosive. These explosions occurred during 4 and 11-21 October and generated ash plumes that rose 500-3,600 m above the crater and drifted S, E, SE, and N. On 19 October at 1648 an explosion generated an ash plume that rose 3.6 km above the crater (figure 153). No eruptions were reported in the Showa crater; white gas-and-steam emissions rose 100 m above the crater from a vent on the N flank. Nighttime incandescence was observed at the Minamidake crater. On 24 October an eruption was reported from 0346 through 0430, which included an ash plume that rose 3.4 km above the crater. Ejected blocks traveled 1.2 km from the Minamidake crater. Following this eruption, small amounts of ashfall were observed from Arimura (4.5 km SE) and a varying amount in Kurokami (4 km E) (figure 154). The number of recorded volcanic earthquakes during the month was 190, of which 14 were located beneath the SW flank. Approximately 61 g/m2 of ashfall was reported over eight days of the month. According to a field survey, the daily amount of sulfur dioxide emitted was 2,200-4,200 t/d.
Geologic Background. The Aira caldera in the northern half of Kagoshima Bay contains the post-caldera Sakurajima volcano, one of Japan's most active. Eruption of the voluminous Ito pyroclastic flow accompanied formation of the 17 x 23 km caldera about 22,000 years ago. The smaller Wakamiko caldera was formed during the early Holocene in the NE corner of the caldera, along with several post-caldera cones. The construction of Sakurajima began about 13,000 years ago on the southern rim and built an island that was joined to the Osumi Peninsula during the major explosive and effusive eruption of 1914. Activity at the Kitadake summit cone ended about 4,850 years ago, after which eruptions took place at Minamidake. Frequent eruptions since the 8th century have deposited ash on the city of Kagoshima, located across Kagoshima Bay only 8 km from the summit. The largest recorded eruption took place during 1471-76.
Information Contacts: Japan Meteorological Agency (JMA), 1-3-4 Otemachi, Chiyoda-ku, Tokyo 100-8122, Japan (URL: http://www.jma.go.jp/jma/indexe.html); MIROVA (Middle InfraRed Observation of Volcanic Activity), a collaborative project between the Universities of Turin and Florence (Italy) supported by the Centre for Volcanic Risk of the Italian Civil Protection Department (URL: http://www.mirovaweb.it/); Copernicus Browser, Copernicus Data Space Ecosystem, European Space Agency (URL: https://dataspace.copernicus.eu/browser/).
Etna
Italy
37.748°N, 14.999°E; summit elev. 3357 m
All times are local (unless otherwise noted)
Strombolian explosions, lava fountains, and lava flows during July-August 2023
Etna, located on the Italian island of Sicily, has had documented eruptions dating back to 1500 BCE. Activity typically originates from multiple cones at the summit, where several craters have formed and evolved. The currently active craters are Northeast Crater (NEC), Voragine (VOR), and Bocca Nuova (BN), and the Southeast Crater (SEC); VOR and BN were previously referred to as the “Central Crater”. The original Southeast crater formed in 1978, and a second eruptive site that opened on its SE flank in 2011 was named the New Southeast Crater (NSEC). Another eruptive site between the SEC and NSEC developed during early 2017 and was referred to as the "cono della sella" (saddle cone). The current eruption period began in November 2022 and has been characterized by intermittent Strombolian activity, lava flows, and ash plumes (BGVN 48:08). This report updates activity during July through October 2023, which includes primarily gas-and-steam emissions; during July and August Strombolian explosions, lava fountains, and lava flows were reported, based on weekly and special reports by the Osservatorio Etneo (OE), part of the Catania Branch of Italy's Istituo Nazionale di Geofisica e Vulcanologica (INGV) and satellite data.
Variable fumarolic degassing was reported at all summit craters (BN, VOR, NEC, and SEC) throughout the entire reporting period (table 15). The MIROVA (Middle InfraRed Observation of Volcanic Activity) volcano hotspot detection system based on the analysis of MODIS data showed frequent low-to-moderate power thermal anomalies during the reporting period (figure 399). During mid-August there was a pulse in activity that showed an increase in the power of the anomalies due to Strombolian activity, lava fountains, and lava flows. Infrared satellite imagery captured strong thermal anomalies at the central and southeast summit crater areas (figure 400). Accompanying thermal activity were occasional sulfur dioxide plumes that exceeded 2 Dobson Units (DUs) recorded by the TROPOMI instrument on the Sentinel-5P satellite (figure 401).
Table 15. Summary of activity at the four primary crater areas at the summit of Etna during July-October 2023. Information is from INGV weekly reports.
| Month |
Bocca Nuova (BN) |
Voragine (VOR) |
Northeast Crater (NEC) |
Southeast Crater (SEC) |
| Jul 2023 |
Continuous degassing. |
No observations. |
Weak gas emissions. |
Continuous degassing. Sporadic and weak-to-moderate ash emissions. Strombolian explosions. |
| Aug 2023 |
Continuous degassing. |
No observations. |
No observations. |
Continuous degassing. Occasional ash emissions. Strombolian activity, lava fountaining, and lava flows. |
| Sep 2023 |
Variable degassing. Crater incandescence. |
Weak fumarolic activity. |
Weak fumarolic activity. |
Variable degassing. |
| Oct 2023 |
Continuous degassing. |
Weak fumarolic activity. |
Weak fumarolic activity. |
Continuous degassing. |
Activity during July and August was relatively low and mainly consisted of degassing at the summit craters, particularly at SEC and BN. Cloudy weather prevented clear views of the summit during early July. During the night of 2 July some crater incandescence was visible at SEC. Explosive activity resumed at SEC during 9-10 July, which was characterized by sporadic and weak ash emissions that rapidly dispersed in the summit area (figure 402). INGV reported moderate Strombolian activity began at 2034 on 14 July and was confined to the inside of the crater and fed by a vent located in the E part of SEC. An ash emission was detected at 2037. A new vent opened on 15 July in the SE part of BN and began to produce continuous gas-and-steam emissions. During an inspection carried out on 28 July pulsating degassing, along with audible booms, were reported at two active vents in BN. Vigorous gas-and-steam emissions intermittently generated rings. On rare occasions, fine, reddish ash was emitted from BN1 and resuspended by the gas-and-steam emissions.
Around 2000 on 13 August INGV reported a sudden increase in volcanic tremor amplitude. Significant infrasonic activity coincided with the tremor increase. Incandescent flashes were visible through the cloud cover in webcam images of SEC (figure 403). Strombolian activity at SEC began to gradually intensify starting at 2040 as seismicity continued to increase. The Aviation Color Code (ACC) was raised to Yellow (the second lowest-level on a four-color scale) at 2126 and then to Orange (the second highest-level on a four-color scale) at 2129 due to above-background activity. The activity rapidly transitioned from Strombolian activity to lava fountains around 2333 that rose 300-400 m above the crater (figure 403). Activity was initially focused on the E vent of the crater, but then the vent located above the S flank of the cone also became active. A lava flow from this vent traveled SW into the drainage created on 10 February 2022, overlapping with previous flows from 10 and 21 February 2022 and 21 May 2023, moving between Monte Barbagallo and Monte Frumento Supino (figure 404). The lava flow was 350 m long, oriented NNE-SSW, and descended to an elevation of 2.8 km. Flows covered an area of 300,000 m2 and had an estimated volume of 900,000 m3. The ACC was raised to Red at 2241 based on strong explosive activity and ashfall in Rifugio Sapienza-Piano Vetore at 1.7 km elevation on the S flank. INGV reported that pyroclastic flows accompanied this activity.
Activity peaked between 0240 and 0330 on 14 August, when roughly 5-6 vents erupted lava fountains from the E to SW flank of SEC. The easternmost vents produced lava fountains that ejected material strongly to the E, which caused heavy fallout of incandescent pyroclastic material on the underlying flank, triggering small pyroclastic flows. This event was also accompanied by lightning both in the ash column and in the ash clouds that were generated by the pyroclastic flows. A fracture characterized by a series of collapse craters (pit craters) opened on the upper SW flank of SEC. An ash cloud rose a few kilometers above the crater and drifted S, causing ash and lapilli falls in Rifugio Sapienza and expanding toward Nicolosi, Mascalucia, Catania, and up to Syracuse. Ashfall resulted in operational problems at the Catania airport (50 km S), which lasted from 0238 until 2000. By 0420 the volcanic tremor amplitude values declined to background levels. After 0500 activity sharply decreased, although the ash cloud remained for several hours and drifted S. By late morning, activity had completely stopped. The ACC was lowered to Orange as volcanic ash was confined to the summit area. Sporadic, minor ash emissions continued throughout the day. At 1415 the ACC was lowered to Yellow and then to Green at 1417.
During the night of 14-15 August only occasional flashes were observed, which were more intense during avalanches of material inside the eruptive vents. Small explosions were detected at SEC at 2346 on 14 August and at 0900 on 26 August that each produced ash clouds which rapidly dispersed into the atmosphere (figure 405). According to a webcam image, an explosive event detected at 2344 at SEC generated a modest ash cloud that was rapidly dispersed by winds. The ACC was raised to Yellow at 2355 on 14 August due to increasing unrest and was lowered to Green at 0954 on 15 August.
Activity during September and October was relatively low and mainly characterized by variable degassing from BN and SEC. Intense, continuous, and pulsating degassing was accompanied by roaring sounds and flashes of incandescence at BN both from BN1 and the new pit crater that formed during late July (figure 406). The degassing from the new pit crater sometimes emitted vapor rings. Cloudy weather during 6-8 September prevented observations of the summit craters .
Geologic Background. Mount Etna, towering above Catania on the island of Sicily, has one of the world's longest documented records of volcanism, dating back to 1500 BCE. Historical lava flows of basaltic composition cover much of the surface of this massive volcano, whose edifice is the highest and most voluminous in Italy. The Mongibello stratovolcano, truncated by several small calderas, was constructed during the late Pleistocene and Holocene over an older shield volcano. The most prominent morphological feature of Etna is the Valle del Bove, a 5 x 10 km caldera open to the east. Two styles of eruptive activity typically occur, sometimes simultaneously. Persistent explosive eruptions, sometimes with minor lava emissions, take place from one or more summit craters. Flank vents, typically with higher effusion rates, are less frequently active and originate from fissures that open progressively downward from near the summit (usually accompanied by Strombolian eruptions at the upper end). Cinder cones are commonly constructed over the vents of lower-flank lava flows. Lava flows extend to the foot of the volcano on all sides and have reached the sea over a broad area on the SE flank.
Information Contacts: Sezione di Catania - Osservatorio Etneo, Istituto Nazionale di Geofisica e Vulcanologia (INGV), Sezione di Catania, Piazza Roma 2, 95123 Catania, Italy (URL: http://www.ct.ingv.it/it/); MIROVA (Middle InfraRed Observation of Volcanic Activity), a collaborative project between the Universities of Turin and Florence (Italy) supported by the Centre for Volcanic Risk of the Italian Civil Protection Department (URL: http://www.mirovaweb.it/); NASA Global Sulfur Dioxide Monitoring Page, Atmospheric Chemistry and Dynamics Laboratory, NASA Goddard Space Flight Center (NASA/GSFC), 8800 Greenbelt Road, Goddard MD 20771, USA (URL: https://so2.gsfc.nasa.gov/); Copernicus Browser, Copernicus Data Space Ecosystem, European Space Agency (URL: https://dataspace.copernicus.eu/browser/).
Suwanosejima (Japan) — December 2023 Cite this Report
Suwanosejima
Japan
29.638°N, 129.714°E; summit elev. 796 m
All times are local (unless otherwise noted)
Eruption plumes, crater incandescence, and occasional explosions during July-October 2023
Suwanosejima is an 8-km-long island that consists of a stratovolcano and two active summit craters, located in the northern Ryukyu Islands, Japan. Volcanism over the past century has been characterized by Strombolian explosions, ash plumes, and ashfall. The current eruption began in October 2004 and has more recently consisted of frequent eruption plumes, explosions, and incandescent ejecta (BGVN 48:07). This report covers similar activity of ash plumes, explosions, and crater incandescence during July through October 2023 using monthly reports from the Japan Meteorological Agency (JMA) and satellite data.
Thermal activity during the reporting period was relatively low; only one low-power thermal anomaly was detected during mid-July and one during early August, based on a MIROVA (Middle InfraRed Observation of Volcanic Activity) Log Radiative Power graph of the MODIS thermal anomaly data. On two clear weather days, a thermal anomaly was visible in infrared satellite images (figure 81).
Low-level activity was reported at the Otake crater during July and no explosions were detected. Eruption plumes rose as high as 1.8 km above the crater. On 13 July an ash plume rose 1.7 km above the crater rim, based on a webcam image. During the night of the 28th crater incandescence was visible in a webcam image. An eruptive event reported on 31 July produced an eruption plume that rose 2.1 km above the crater. Seismicity consisted of 11 volcanic earthquakes on the W flank, the number of which had decreased compared to June (28) and 68 volcanic earthquakes near the Otake crater, which had decreased from 722 in the previous month. According to observations conducted by the University of Tokyo Graduate School of Science, Kyoto University Disaster Prevention Research Institute, Toshima Village, and JMA, the amount of sulfur dioxide emissions released during the month was 400-800 tons per day (t/d).
Eruptive activity in the Otake crater continued during August and no explosions were reported. An eruptive event produced a plume that rose 1 km above the crater at 1447 on 12 August. Subsequent eruptive events were recorded at 0911 on 16 August, at 1303 on 20 August, and at 0317 on 21 August, which produced ash plumes that rose 1-1.1 km above the crater and drifted SE, SW, and W. On 22 August an ash plume was captured in a webcam image rising 1.4 km above the crater (figure 82). Multiple eruptive events were detected on 25 August at 0544, 0742, 0824, 1424, and 1704, which generated ash plumes that rose 1.1-1.2 km above the crater and drifted NE, W, and SW. On 28 August a small amount of ashfall was observed as far as 1.5 km from the crater. There were 17 volcanic earthquakes recorded on the W flank of the volcano and 79 recorded at the Otake crater during the month. The amount of sulfur dioxide emissions released during the month was 400-800 t/d.
Activity continued at the Otake crater during September. Occasionally, nighttime crater incandescence was observed in webcam images and ashfall was reported. An eruptive event at 1949 on 4 September produced an ash plume that rose 1 km above the crater and drifted SW. On 9 September several eruption events were detected at 0221, 0301, and 0333, which produced ash plumes that rose 1.1-1.4 km above the crater rim and drifted W; continuous ash emissions during 0404-0740 rose to a maximum height of 2 km above the crater rim (figure 83). More eruptive events were reported at 1437 on 10 September, at 0319 on 11 September, and at 0511 and 1228 on 15 September, which generated ash plumes that rose 1-1.8 km above the crater. During 25, 27, and 30 September, ash plumes rose as high as 1.3 km above the crater rim. JMA reported that large blocks were ejected as far as 300 m from the center of the crater. There were 18 volcanic earthquakes detected beneath the W flank and 82 volcanic earthquakes detected near the Otake crater. The amount of sulfur dioxide released during the month ranged from 600 to 1,600 t/d.
Activity during early-to-mid-October consisted of occasional explosions, a total number of 13, and ash plumes that rose as high as 1.9 km above the Otake crater rim on 29 October (figure 84). These explosions are the first to have occurred since June 2023. Continuous ash emissions were reported during 0510-0555 on 1 October. Explosions were recorded at 0304, 2141, and 2359 on 2 October, at 0112 on 3 October, and at 1326 on 6 October, which produced ash plumes that rose as high as 1 km above the crater rim and drifted SW and W. An explosion was noted at 0428 on 3 October, but emission details were unknown. A total of eight explosions were recorded by the seismic network at 1522 on 14 October, at 0337, 0433, 0555, 1008, and 1539 on 15 October, and at 0454 and 0517 on 16 October. Ash plumes from these explosions rose as high as 900 m above the crater and drifted SE. Eruptive events during 25-27 and 29-30 October generated plumes that rose as high as 1.9 km above the crater and drifted SE, S, and SW. Ash was deposited in Toshima village (3.5 km SSW). Eruptive activity occasionally ejected large volcanic blocks as far as 600 m from the crater. Nighttime crater incandescence was visible in webcams. Intermittent ashfall was reported as far as 1.5 km from the crater. There were 43 volcanic earthquakes detected on the W flank during the month, and 184 volcanic earthquakes detected near the Otake crater. The amount of sulfur dioxide emitted ranged between 400 and 900 t/d.
Geologic Background. The 8-km-long island of Suwanosejima in the northern Ryukyu Islands consists of an andesitic stratovolcano with two active summit craters. The summit is truncated by a large breached crater extending to the sea on the E flank that was formed by edifice collapse. One of Japan's most frequently active volcanoes, it was in a state of intermittent Strombolian activity from Otake, the NE summit crater, between 1949 and 1996, after which periods of inactivity lengthened. The largest recorded eruption took place in 1813-14, when thick scoria deposits covered residential areas, and the SW crater produced two lava flows that reached the western coast. At the end of the eruption the summit of Otake collapsed, forming a large debris avalanche and creating an open collapse scarp extending to the eastern coast. The island remained uninhabited for about 70 years after the 1813-1814 eruption. Lava flows reached the eastern coast of the island in 1884. Only about 50 people live on the island.
Information Contacts: Japan Meteorological Agency (JMA), 1-3-4 Otemachi, Chiyoda-ku, Tokyo 100-8122, Japan (URL: http://www.jma.go.jp/jma/indexe.html); MIROVA (Middle InfraRed Observation of Volcanic Activity), a collaborative project between the Universities of Turin and Florence (Italy) supported by the Centre for Volcanic Risk of the Italian Civil Protection Department (URL: http://www.mirovaweb.it/); Hawai'i Institute of Geophysics and Planetology (HIGP) - MODVOLC Thermal Alerts System, School of Ocean and Earth Science and Technology (SOEST), Univ. of Hawai'i, 2525 Correa Road, Honolulu, HI 96822, USA (URL: http://modis.higp.hawaii.edu/); Copernicus Browser, Copernicus Data Space Ecosystem, European Space Agency (URL: https://dataspace.copernicus.eu/browser/).
Nishinoshima (Japan) — November 2023 Cite this Report
Nishinoshima
Japan
27.247°N, 140.874°E; summit elev. 100 m
All times are local (unless otherwise noted)
Gray emissions during October 2023
Nishinoshima is a small island in the Ogasawara Arc, about 1,000 km S of Tokyo, Japan. It contains prominent submarine peaks to the S, W, and NE. Recorded eruptions date back to 1973, with the current eruption period beginning in October 2022. Eruption plumes and fumarolic activity characterize recent activity (BGVN 48:10). This report covers the end of the eruption for September through October 2023, based on information from monthly reports of the Japan Meteorological Agency (JMA) monthly reports, and satellite data.
No eruptive activity was reported during September 2023, although JMA noted that the surface temperature was slightly elevated compared to the surrounding area since early March 2023. The Japan Coast Guard (JCG) conducted an overflight on 20 September and reported white gas-and-steam plumes rising 3 km above the central crater of the pyroclastic cone, as well as multiple white gas-and-steam emissions emanating from the N, E, and S flanks of the crater to the coastline. In addition, dark reddish brown-to-green discolored water was distributed around almost the entire circumference of the island.
Similar low-level activity was reported during October. Multiple white gas-and-steam emissions rose from the N, E, and S flanks of the central crater of the pyroclastic cone and along the coastline; these emissions were more intense compared to the previous overflight observations. Dark reddish brown-to-green discolored water remained visible around the circumference of the island. On 4 October aerial observations by JCG showed a small eruption consisting of continuous gas-and-steam emissions emanating from the central crater, with gray emissions rising to 1.5 km altitude (figure 129). According to observations from the marine weather observation vessel Keifu Maru on 26 October, white gas-and-steam emissions persisted from the center of the pyroclastic cone, as well as from the NW, SW, and SE coasts of the island for about five minutes. Slightly discolored water was visible up to about 1 km.
Frequent low-to-moderate power thermal anomalies were recorded in the MIROVA graph (Middle InfraRed Observation of Volcanic Activity) during September (figure 130). Occasional anomalies were detected during October, and fewer during November through December. A thermal anomaly was visible in the crater using infrared satellite imagery on 6, 8, 11, 16, 18, 21, and 23 September and 8, 13, 21, 26, and 28 October (figure 131).
Geologic Background. The small island of Nishinoshima was enlarged when several new islands coalesced during an eruption in 1973-74. Multiple eruptions that began in 2013 completely covered the previous exposed surface and continued to enlarge the island. The island is the summit of a massive submarine volcano that has prominent peaks to the S, W, and NE. The summit of the southern cone rises to within 214 m of the ocean surface 9 km SSE.
Information Contacts: Japan Meteorological Agency (JMA), 1-3-4 Otemachi, Chiyoda-ku, Tokyo 100-8122, Japan (URL: http://www.jma.go.jp/jma/indexe.html); MIROVA (Middle InfraRed Observation of Volcanic Activity), a collaborative project between the Universities of Turin and Florence (Italy) supported by the Centre for Volcanic Risk of the Italian Civil Protection Department (URL: http://www.mirovaweb.it/); Copernicus Browser, Copernicus Data Space Ecosystem, European Space Agency (URL: https://dataspace.copernicus.eu/browser/).
Kilauea (United States) — October 2023 Cite this Report
Kilauea
United States
19.421°N, 155.287°W; summit elev. 1222 m
All times are local (unless otherwise noted)
Strong lava fountains, lava flows, and spatter at Halema’uma’u during January-September 2023
Kīlauea is on the island of Hawai’i and overlaps the E flank of the Mauna Loa volcano. Its East Rift Zone (ERZ) has been intermittently active for at least 2,000 years. An extended eruption period began in January 1983 and was characterized by open lava lakes and lava flows from the summit caldera and the East Rift Zone. During May 2018 magma migrated into the Lower East Rift Zone (LERZ) and opened 24 fissures along a 6-km-long NE-trending fracture zone that produced lava flows traveling in multiple directions. As lava emerged from the fissures, the lava lake at Halema'uma'u drained and explosions sent ash plumes to several kilometers altitude (BGVN 43:10).
The current eruption period started during September 2021 and has been characterized by low-level lava effusions in the active Halema’uma’u lava lake (BGVN 48:01). This report covers three notable eruption periods during February, June, and September 2023 consisting of lava fountaining, lava flows, and spatter during January through September 2023 using information from daily reports, volcanic activity notices, and abundant photo, map, and video data from the US Geological Survey's (USGS) Hawaiian Volcano Observatory (HVO).
Activity during January 2023. Small earthquake swarms were recorded on 2 January 2023; increased seismicity and changes in the pattern of deformation were noted on the morning of 5 January. At around 1500 both the rate of deformation and seismicity drastically increased, which suggested magma movement toward the surface. HVO raised the Volcano Alert Level (VAL) to Watch (the second highest level on a four-level scale) and the Aviation Color Code (ACC) to Orange (the second highest color on a four-color scale) at 1520.
Multiple lava fountains and lava effusions from vents in the central eastern portion of the Halema’uma’u crater began on 5 January around 0434; activity was confined to the eastern half of the crater and within the basin of the western half of the crater, which was the focus of the eruption in 2021-2022 (figure 525). Incandescence was visible in webcam images at 1634 on 5 January, prompting HVO to raise the VAL to Warning (the highest level on a four-level scale) and the ACC to Red (the highest color on a four-color scale). Lava fountains initially rose as high as 50 m above the vent at the onset of the eruption (figure 526) but then declined to a more consistent 5-6 m height in the proceeding days. By 1930 that same day, lava had covered most of the crater floor (an area of about 1,200,000 m2) and the lava lake had a depth of 10 m. A higher-elevation island that formed during the initial phase of the December 2020 eruption remained exposed, appearing darker in images, along with a ring of older lava around the lava lake that was active prior to December 2022. Overnight during 5-6 January the lava fountains continued to rise 5 m high, and the lava effusion rate had slowed.
On 6 January at 0815 HVO lowered the VAL to Watch and the ACC to Orange due to the declining effusion rates. Sulfur dioxide emission rates ranged from 3,000-12,500 tonnes per day (t/d), the highest value of which was recorded on 6 January. Lava continued to erupt from the vents during 6-8 January, although the footprint of the active area had shrunk; a similar progression has been commonly observed during the early stages of recent eruptions at Halema’uma’u. On 9 January HVO reported one dominant lava fountain rising 6-7 m high in the E half of the crater. Lava flows built up the margins of the lake, causing the lake to be perched. On 10 January the eastern lava lake had an area of approximately 120,000 m2 that increased to 250,000 m2 by 17 January. During 13-31 January several small overflows occurred along the margins of the E lake. A smaller area of lava was active within the basin in the W half of the crater that had been the focus of activity during 2021-2022. On 19 January just after 0200 a small ooze-out was observed on the crater’s W edge.
Activity during February 2023. Activity continued in the E part of Halema’uma’u crater, as well as in a smaller basin in the W part of the 2021-2022 lava lake (figure 527). The E lava lake contained a single lava fountain and frequent overflows. HVO reported that during the morning of 1 February the large E lava lake began to cool and crust over in the center of the lake; two smaller areas of lava were observed on the N and S sides by the afternoon. The dominant lava fountain located in the S part of the lava lake paused for roughly 45 minutes at 2315 and resumed by midnight, rising 1-2 m. At 0100 on 2 February lava from the S part was effusing across the entire E lava lake area, covering the crusted over portion in the center of the lake and continuing across the majority of the previously measured 250,000 m2 by 0400. A small lava pond near the E lake produced an overflow around 0716 on 2 February. On 3 February some lava crust began to form against the N and E levees, which defined the 250,000 m2 eastern lava lake. The small S lava fountain remained active, rising 1-6 m high during 3-9 February; around 0400 on 5 February occasional bursts doubled the height of the lava fountain.
A large breakout occurred overnight during 2100 on 4 February to 0900 on 5 February on the N part of the crater floor, equal to or slightly larger in size than the E lava lake. A second, smaller lava fountain appeared in the same area of the E lava lake between 0300 and 0700 on 5 February and was temporarily active. This large breakout continued until 7 February. A small, brief breakout was reported in the S of the E lava lake around midnight on 7 February. In the W lake, as well as the smaller lava pond in the central portion of the crater floor, contained several overflows during 7-10 February and intermittent fountaining. Activity at the S small lava pond and the small S lava fountain within the E lake declined during 9-10 February. The lava pond in the central portion of the crater floor had nearly continuous, expansive flows during 10-13 February; channels from the small central lava pond seemed to flow into the larger E lake. During 13-18 February a small lava fountain was observed in the small lava pond in the central portion of the crater floor. Continuous overflows persisted during this time.
Activity in the eastern and central lakes began to decline in the late afternoon of 17 February. By 18 February HVO reported that the lava effusions had significantly declined, and that the eastern and central lakes were no longer erupting. The W lake in the basin remained active but at a greatly reduced level that continued to decline. HVO reported that this decrease in activity is attributed to notable deflationary tilt that began early on the morning of 17 February and lasted until early 19 February. By 19 February the W lake was mostly crusted over although some weak lava flows remained, which continued through 28 February. The sulfur dioxide emission rates ranged 250-2,800 t/d, the highest value of which was recorded on 6 February.
Activity during March 2023. The summit eruption at Halema’uma’u crater continued at greatly reduced levels compared to the previous two months. The E and central vents stopped effusing lava, and the W lava lake remained active with weak lava flows; the lake was mostly crusted over, although slowly circulating lava intermittently overturned the crust. By 6 March the lava lake in the W basin had stopped because the entire surface was crusted over. The only apparent surface eruptive activity during 5-6 March was minor ooze-outs of lava onto the crater floor, which had stopped by 7 March. Several hornitos on the crater floor still glowed through 12 March according to overnight webcam images, but they did not erupt any lava. A small ooze-out of lava was observed just after 1830 in the W lava lake on 8 March, which diminished overnight. The sulfur dioxide emission rate ranged from 155-321 t/d on 21 March. The VAL was lowered to Advisory, and the ACC was lowered to Yellow (the second lowest on a four-color scale) on 23 March due to a pause in the eruption since 7 March.
Activity during April-May 2023. The eruption at Halema’uma’u crater was paused; no lava effusions were visible on the crater floor. Sulfur dioxide emission rates ranged from 75-185 t/d, the highest of which was measured on 22 April. During May and June summit seismicity was elevated compared to seismicity that preceded the activity during January.
Activity during June 2023. Earthquake activity and changes in the patterns of ground deformation beneath the summit began during the evening of 6 June. The data indicated magma movement toward the surface, prompting HVO to raise the VAL to Watch and the ACC to Orange. At about 0444 on 7 June incandescence in Halema’uma’u crater was visible in webcam images, indicating that a new eruption had begun. HVO raised the VAL to Warning and the ACC to Red (the highest color on a four-color scale). Lava flowed from fissures that had opened on the crater floor. Multiple minor lava fountains were active in the central E portion of the Halema’uma’u crater, and one vent opened on the W wall of the caldera (figure 528). The eruptive vent on the SW wall of the crater continued to effuse into the lava lake in the far SW part of the crater (figure 529). The largest lava fountain consistently rose 15 m high; during the early phase of the eruption, fountain bursts rose as high as 60 m. Lava flows inundated much of the crater floor and added about 6 m depth of new lava within a few hours, covering approximately 10,000 m2. By 0800 on 7 June lava filled the crater floor to a depth of about 10 m. During 0800-0900 the sulfur dioxide emission rate was about 65,000 t/d. Residents of Pahala (30 km downwind of the summit) reported minor deposits of fine, gritty ash and Pele’s hair. A small spatter cone had formed at the vent on the SW wall by midday, and lava from the cone was flowing into the active lava lake. Fountain heights had decreased from the onset of the eruption and were 4-9 m high by 1600, with occasional higher bursts. Inflation switched to deflation and summit earthquake activity greatly diminished shortly after the eruption onset.
At 0837 on 8 June HVO lowered the VAL to Watch and the ACC to Orange because the initial high effusion rates had declined, and no infrastructure was threatened. The surface of the lava lake had dropped by about 2 m, likely due to gas loss by the morning of 8 June. The drop left a wall of cooled lava around the margins of the crater floor. Lava fountain heights decreased during 8-9 June but continued to rise to 10 m high. Active lava and vents covered much of the W half of Halema’uma’u crater in a broad, horseshoe-shape around a central, uplifted area (figure 530). The preliminary average effusion rate for the first 24 hours of the eruption was about 150 cubic meters per second, though the estimate did not account for vesiculated lava and variations in crater floor topography. The effusion rate during the very earliest phases of the eruption appeared significantly higher than the previous three summit eruptions based on the rapid coverage of the entire crater floor. An active lava lake, also referred to as the “western lava lake” was centered within the uplifted area and was fed by a vent in the NE corner. Two small active lava lakes were located just SE from the W lava lake and in the E portion of the crater floor.
During 8-9 June the lava in the central lava lake had a thickness of approximately 1.5 m, based on measurements from a laser rangefinder. During 9-12 June the height of the lava fountains decreased to 9 m high. HVO reported that the previously active lava lake in the E part of the crater appeared stagnant during 10-11 June. The surface of the W lake rose approximately 1 m overnight during 11-12 June, likely due to the construction of a levee around it. Only a few small fountains were active during 12-13 June; the extent of the active lava had retreated so that all activity was concentrated in the SW and central parts of Halema’uma’u crater. Intermittent spattering from the vent on the SW wall was visible in overnight webcam images during 13-18 June. On the morning of 14 June a weak lava effusion originated from near the western eruptive vent, but by 15 June there were no signs of continued activity. HVO reported that other eruptive vents in the SW lava lake had stopped during this time, following several days of waning activity; lava filled the lake by about 0.5 m. Lava circulation continued in the central lake and no active lava was reported in the northern or eastern parts of the crater. Around 0800 on 15 June the top of the SW wall spatter cone collapsed, which was followed by renewed and constant spattering from the top vent and a change in activity from the base vent; several new lava flows effused from the top of the cone, as well as from the pre-existing tube-fed flow from its base. Accumulation of lava on the floor resulted in a drop of the central basin relative to the crater floor, allowing several overflows from the SW lava lake to cascade into the basin during the night of 15 June into the morning of 16 June.
Renewed lava fountaining was reported at the eruptive vent on the SW side of the crater during 16-19 June, which effused lava into the far SW part of the crater. This activity was described as vigorous during midday on 16 June; a group of observatory geologists estimated that the lava was consistently ejected at least 10 m high, with some spatter ejected even higher and farther. Deposits from the fountain further heightened and widened the spatter cone built around the original eruptive vent in the lower section of the crater wall. Multiple lava flows from the base of the cone were fed into the SW lava lake and onto the southwestern-most block from the 2018 collapse within Halema’uma’u on 17 June (figure 531); by 18 June they focused into a single flow feeding into the SW lava lake. On the morning of 19 June a second lava flow from the base of the eruptive cone advanced into the SW lava lake.
Around 1600 on 19 June there was a rapid decline in lava fountaining and effusion at the eruptive vent on the SW side of the crater; vent activity had been vigorous up to that point (figure 532). Circulation in the lava lake also slowed, and the lava lake surface dropped by several meters. Overnight webcam images showed some previously eruptive lava still flowing onto the crater floor, which continued until those flows began to cool. By 21 June no lava was erupting in Halema’uma’u crater. Overnight webcam images during 29-30 June showed some incandescence from previously erupted lava flows as they continued to cool. Seismicity in the crater declined to low levels. Sulfur dioxide emission rates ranged 160-21,000 t/d throughout the month, the highest measurement of which was recorded on 8 June. On 30 June the VAL was lowered to Advisory (the second level on a four-level scale) and the ACC was lowered to Yellow. Gradual inflation was detected at summit tiltmeters during 19-30 June.
Activity during July-August 2023. During July, the eruption paused; no lava was erupting in Halema’uma’u crater. Nighttime webcam images showed some incandescence from previously erupted lava as it continued to cool on the crater floor. During the week of 14 August HVO reported that the rate in seismicity increased, with 467 earthquakes of Mw 3.2 and smaller occurring. Sulfur dioxide emission rates remained low, ranging from 75-86 t/d, the highest of which was recorded on 10 and 15 August. On 15 August beginning at 0730 and lasting for several hours, a swarm of approximately 50 earthquakes were detected at a depth of 2-3 km below the surface and about 2 km long directly S of Halema’uma’u crater. HVO reported that this was likely due to magma movement in the S caldera region. During 0130-0500 and 1700-2100 on 21 August two small earthquake swarms of approximately 20 and 25 earthquakes, respectively, occurred at the same location and at similar depths. Another swarm of 50 earthquakes were recorded during 0430-0830 on 23 August. Elevated seismicity continued in the S area through the end of the month.
Activity during September 2023. Elevated seismicity persisted in the S summit with occasional small, brief seismic swarms. Sulfur dioxide measurements were relatively low and were 70 t/d on 8 September. About 150 earthquakes occurred during 9-10 September, and tiltmeter and Global Positioning System (GPS) data showed inflation in the S portion of the crater.
At 0252 on 10 September HVO raised the VAL to Watch and the ACC to Orange due to increased earthquake activity and changes in ground deformation that indicated magma moving toward the surface. At 1515 the summit eruption resumed in the E part of the caldera based on field reports and webcam images. Fissures opened on the crater floor and produced multiple minor lava fountains and flows (figure 533). The VAL and ACC were raised to Warning and Red, respectively. Gas-and-steam plumes rose from the fissures and drifted downwind. A line of eruptive vents stretched approximately 1.4 km from the E part of the crater into the E wall of the down dropped block by 1900. The lava fountains at the onset of the eruption had an estimated 50 m height, which later rose 20-25 m high. Lava erupted from fissures on the down dropped block and expanded W toward Halema’uma’u crater. Data from a laser rangefinder recorded about 2.5 m thick of new lava added to the W part of the crater. Sulfur dioxide emissions were elevated in the eruptive area during 1600-1500 on 10 September, measuring at least 100,000 t/d.
At 0810 on 11 September HVO lowered the VAL and ACC back to Watch and Orange due to the style of eruption and the fissure location had stabilized. The initial extremely high effusion rates had declined (but remained at high levels) and no infrastructure was threatened. An eruption plume, mainly comprised of sulfur dioxide and particulates, rose as high as 3 km altitude. Several lava fountains were active on the W side of the down dropped block during 11-15 September, while the easternmost vents on the down dropped block and the westernmost vents in the crater became inactive on 11 September (figure 534). The remaining vents spanned approximately 750 m and trended roughly E-W. The fed channelized lava effusions flowed N and W into Halema’uma’u. The E rim of the crater was buried by new lava flows; pahoehoe lava flows covered most of the crater floor except areas of higher elevation in the SW part of the crater. The W part of the crater filled about 5 m since the start of the eruption, according to data from a laser rangefinder during 11-12 September. Lava fountaining continued, rising as high as 15 m by the morning of 12 September. During the morning of 13 September active lava flows were moving on the N and E parts of the crater. The area N of the eruptive vents that had active lava on its surface became perched and was about 3 m higher than the surrounding ground surface. By the morning of 14 September active lava was flowing on the W part of the down dropped block and the NE parts of the crater. The distances of the active flows progressively decreased. Spatter had accumulated on the S (downwind) side of the vents, forming ramparts about 20 m high.
Vigorous spattering was restricted to the westernmost large spatter cone with fountains rising 10-15 m high. Minor spattering occurred within the cone to the E of the main cone, but HVO noted that the fountains remained mostly below the rim of the cone. Lava continued to effuse from these cones and likely from several others as well, traveled N and W, confined to the W part of the down-dropped block and the NE parts of Halema’uma’u. Numerous ooze-outs of lava were visible over other parts of the crater floor at night. Laser range-finder measurements taken of the W part of the crater during 14-15 September showed that lava filled the crater by 10 m since the start of the eruption. Sulfur dioxide emissions remained elevated after the onset of the eruption, ranging 20,000-190,000 t/d during the eruption activity, the highest of which occurred on 10 September.
Field crews observed the eruptive activity on 15 September; they reported a notable decrease or stop in activity at several vents. Webcam images showed little to no fountaining since 0700 on 16 September, though intermittent spattering continued from the westernmost large cone throughout the night of 15-16 September. Thermal images showed that lava continued to flow onto the crater floor. On 16 September HVO reported that the eruption stopped around 1200 and that there was no observable activity anywhere overnight or on the morning of 17 September. HVO field crews reported that active lava was no longer flowing onto Halema’uma’u crater floor and was restricted to a ponded area N of the vents on the down dropped block. They reported that spattering stopped around 1115 on 16 September. Nighttime webcam images showed some incandescence on the crater floor as lava continued to cool. Field observations supported by geophysical data showed that eruptive tremor in the summit region decreased over 15-16 September and returned to pre-eruption levels by 1700 on 16 September. Sulfur dioxide emissions were measured at a rate of 800 t/d on 16 September while the eruption was waning, and 200 t/d on 17 September, which were markedly lower compared to measurements taken the previous week of 20,000-190,000 t/d.
Geologic Background. Kilauea overlaps the E flank of the massive Mauna Loa shield volcano in the island of Hawaii. Eruptions are prominent in Polynesian legends; written documentation since 1820 records frequent summit and flank lava flow eruptions interspersed with periods of long-term lava lake activity at Halemaumau crater in the summit caldera until 1924. The 3 x 5 km caldera was formed in several stages about 1,500 years ago and during the 18th century; eruptions have also originated from the lengthy East and Southwest rift zones, which extend to the ocean in both directions. About 90% of the surface of the basaltic shield volcano is formed of lava flows less than about 1,100 years old; 70% of the surface is younger than 600 years. The long-term eruption from the East rift zone between 1983 and 2018 produced lava flows covering more than 100 km2, destroyed hundreds of houses, and added new coastline.
Information Contacts: Hawaiian Volcano Observatory (HVO), U.S. Geological Survey, PO Box 51, Hawai'i National Park, HI 96718, USA (URL: http://hvo.wr.usgs.gov/).
Tinakula (Solomon Islands) — December 2023 Cite this Report
Tinakula
Solomon Islands
10.386°S, 165.804°E; summit elev. 796 m
All times are local (unless otherwise noted)
Continued lava flows and thermal activity during June through November 2023
Tinakula is a remote 3.5 km-wide island in the Solomon Islands, located 640 km ESE of the capital, Honiara. The current eruption period began in December 2018 and has more recently been characterized by intermittent lava flows and thermal activity (BGVN 48:06). This report covers similar activity during June through November 2023 using satellite data.
During clear weather days (20 July, 23 September, 23 October, and 12 November), infrared satellite imagery showed lava flows that mainly affected the W side of the island and were sometimes accompanied by gas-and-steam emissions (figure 54). The flow appeared more intense during July and September compared to October and November. According to the MODVOLC thermal alerts, there were a total of eight anomalies detected on 19 and 21 July, 28 and 30 October, and 16 November. Infrared MODIS satellite data processed by MIROVA (Middle InfraRed Observation of Volcanic Activity) detected a small cluster of thermal activity occurring during late July, followed by two anomalies during August, two during September, five during October, and five during November (figure 55).
Geologic Background. The small 3.5-km-wide island of Tinakula is the exposed summit of a massive stratovolcano at the NW end of the Santa Cruz islands. It has a breached summit crater that extends from the summit to below sea level. Landslides enlarged this scarp in 1965, creating an embayment on the NW coast. The Mendana cone is located on the SE side. The dominantly andesitic volcano has frequently been observed in eruption since the era of Spanish exploration began in 1595. In about 1840, an explosive eruption apparently produced pyroclastic flows that swept all sides of the island, killing its inhabitants. Recorded eruptions have frequently originated from a cone constructed within the large breached crater. These have left the upper flanks and the steep apron of lava flows and volcaniclastic debris within the breach unvegetated.
Information Contacts: MIROVA (Middle InfraRed Observation of Volcanic Activity), a collaborative project between the Universities of Turin and Florence (Italy) supported by the Centre for Volcanic Risk of the Italian Civil Protection Department (URL: http://www.mirovaweb.it/); Hawai'i Institute of Geophysics and Planetology (HIGP) - MODVOLC Thermal Alerts System, School of Ocean and Earth Science and Technology (SOEST), Univ. of Hawai'i, 2525 Correa Road, Honolulu, HI 96822, USA (URL: http://modis.higp.hawaii.edu/); Copernicus Browser, Copernicus Data Space Ecosystem, European Space Agency (URL: https://dataspace.copernicus.eu/browser/).
Search Bulletin Archive by Publication Date
Select a month and year from the drop-downs and click "Show Issue" to have that issue displayed in this tab.
The default month and year is the latest issue available.
Bulletin of the Global Volcanism Network - Volume 33, Number 03 (March 2008)
Bagana (Papua New Guinea)
June 2007-March 2008, ongoing emissions including a pyroclastic flow
Chikurachki (Russia)
New eruption with significant ash plumes began in mid-August 2007
Erebus (Antarctica)
Significant eruptions tabulated for 2007
Galeras (Colombia)
Eruption of January 2008
Karkar (Papua New Guinea)
Seismic monitoring of increased fumarolic activity
Kelud (Indonesia)
Comparatively passive 2007 lava-dome emplacement in a crater lake
Monowai (New Zealand)
Eruption recorded on 8 February 2008
Montagu Island (United Kingdom)
December 2006 plume seen in satellite imagery
Rabaul (Papua New Guinea)
Main vent plugged; seismicity, deformation, explosions, and H2S all high
Sangay (Ecuador)
Conspicuous ash plumes, October 2006-December 2007
Ulawun (Papua New Guinea)
Mostly gentle emissions of white vapor; low-frequency earthquakes
Bagana (Papua New Guinea) — March 2008 Cite this Report
Bagana
Papua New Guinea
6.137°S, 155.196°E; summit elev. 1855 m
All times are local (unless otherwise noted)
June 2007-March 2008, ongoing emissions including a pyroclastic flow
Lava flows, pyroclastic flows, loud noises, and repeated forceful emissions were witnessed during June 2007-March 2008. Previously, there were brief periods of effusive activity and almost daily thermal anomalies during June 2006 through May 2007 (BGVN 32:04). Emissions during June 2007 consisted largely of steam of variable density.
On 12 June, there was a particularly forceful emission. Glow was observed on the night of 14 June. This kind of behavior continued into July. On 8 July observers saw glow and watched a single forceful release of pale gray ash.
On 14 July, Bagana generated a particularly forceful release that generated a pyroclastic flow. The release spewed out thick, dark-gray ash. The pyroclastic flow descended the S flank of the volcano stopping at the base near a small hot-spring-fed lake located at the head of the Torokina river. Since that event, rock falls from the edge of the active lava flow triggered thin ash clouds of light brown color from the S flank. This was accompanied by a loud roaring noise persisting into 15 July.
On 6 August, some emissions occasionally contained gray ash. The lava flow from the summit crater on the SE flank became active again and continued through 23 August. Thick white plumes escaped forcefully during 13-16 August. Ash clouds seen then were attributed to rock falls from collapse at the edges of the active lava flow. The Darwin VAAC reported that a diffuse plume rose to an altitude of 3.7 km on 23 August.
A particularly forceful emission occurred on 25 August and 12 September and the latter generated thin gray ash clouds directed over the SE flank.
Into October, the summit continued to release gentle emission of thin to thick white vapor. A weak to bright fluctuating glow was visible at night from 2-5 October and a continuous rumbling noise that lasted about an hour was heard on 5 October. On 6 October, there was a particularly forceful emission and the lava flow on the SE flank became active. Observers saw the lava flow emitting glow as it passed down the SE flank on 6-7, 10-12, and 17 October. Occasional thin pale gray ash clouds observed at the edges of the active lava flow were visible on 9-10, and 14-15 October. Based on satellite imagery, the Darwin VAAC reported that ash plumes drifted N then NW on 19 October.
White vapor escaped through November and into December. It was occasionally accompanied by plumes containing ash that were generated along the lava flow.
Two explosions sent forth ash plumes on 19 and 27 November. The SE-flank lavas descended almost continuously and lava fragments vented at the summit on 7 and 9 December. On 9 December an ash plume rose to an altitude of 2.8 km; another on 17 December rose to uncertain height; and one on 26-27 December rose to 3 km altitude and drifted W.
Activity in January through March was generally weak but persistent, with earthquakes absent. Satellite imagery and information from RVO led the Darwin VAAC to report a diffuse plume on 3 March. It rose to an altitude of less than 3 km and drifted SW. Later that day, an ash-and-steam plume drifted SW.
Throughout the reporting period, the MODVOLC satellite system typically detected multiple thermal anomalies monthly. The system uses MODIS (the Moderate Resolution Imaging Spectroradiometer) and a processing algorithm and staff at HIGP (see Information Contacts, below).
Geologic Background. Bagana volcano, in a remote portion of central Bougainville Island, is frequently active. This massive symmetrical cone was largely constructed by an accumulation of viscous andesitic lava flows. The entire edifice could have been constructed in about 300 years at its present rate of lava production. Eruptive activity is characterized by non-explosive effusion of viscous lava that maintains a small lava dome in the summit crater, although occasional explosive activity produces pyroclastic flows. Lava flows with tongue-shaped lobes up to 50 m thick and prominent levees descend the flanks on all sides.
Information Contacts: Herman Patia, Rabaul Volcano Observatory (RVO), P.O. Box 386, Rabaul, Papua New Guinea; Darwin Volcanic Ash Advisory Centre (VAAC), Bureau of Meteorology, Northern Territory Regional Office, PO Box 40050, Casuarina, Northern Territory 0811, Australia (URL: http://www.bom.gov.au/info/vaac/); Hawai'i Institute of Geophysics and Planetology (HIGP) Hot Spots System, University of Hawai'i, 2525 Correa Road, Honolulu, HI 96822, USA (URL: http://modis.higp.hawaii.edu/).
Chikurachki (Russia) — March 2008 Cite this Report
Chikurachki
Russia
50.324°N, 155.461°E; summit elev. 1781 m
All times are local (unless otherwise noted)
New eruption with significant ash plumes began in mid-August 2007
Olga Girina of the Kamchatka Volcanic Eruptions Response Team (KVERT) reported no eruptive activity at Chikurachki volcano [activity that began 4 March 2007 (BGVN 32:05)] after about 18 April 2007. The following report was based primarily on information found on the KVERT website. Chikurachki is not monitored with seismic instruments, but KVERT has satellite monitoring and receives occasional reports of visual observations (figure 5).
According to observations, no eruptive activity was noted on 12 and 14 August. However, visual information from Podgorny (20 km SSE) indicated that an eruption began on 18 August 2007 at 2200 UTC. Ashfall was noted in Podgorny at that time and on 19-20 August, and satellite data showed an ash plume extending about 120 km SE (figure 6). An ash plume extending about 100 km SE at an altitude of 5 km was observed by pilots on 20 August 20 at 0140 UTC. An ash plume extending about 160 km to the NNE at an altitude of 3 km and ashfall on Alaid volcano were noted by volcanologists on 21 August. Table 2 lists observations, when available, of the ash plume during this eruption.
Table 2. Ash plume observations for the eruption of Chikurachki beginning 18 August 2007. Clouds obscured the volcano on most days not noted. Courtesy of KVERT.
| Date |
Plume altitude |
Plume distance/direction |
Type of observation |
| 18 Aug 2007 |
-- |
-- |
Visual |
| 19-20 Aug 2007 |
2.4 km |
120 km SE |
Satellite |
| 20 Aug 2007 |
5 km |
100 km SE |
Visual |
| 21 Aug 2007 |
4-5 km |
160 km NE |
Visual, Satellite |
| 21-26 Aug 2007 |
1 km |
-- |
Visual |
| 28-30 Aug 2007 |
~3 km |
150-300 km NE |
Satellite |
| 31 Aug, 01 Sep 2007 |
~3 km |
30-160 km NE |
Satellite |
| 03 Sep 2007 |
-- |
S, SE |
Satellite |
| ~06 Sep 2007 |
3.2 km |
-- |
Visual |
| 07 Sep 2007 |
-- |
more than 80 km SE |
Satellite |
| 08 and 11 Sep 2007 |
2.3 km |
ESE |
Visual, Satellite (figure 5) |
| 18-19 Sep 2007 |
-- |
more than 110 km |
Satellite (figure 6) |
| 19-20 Sep 2007 |
-- |
more than 250 km E |
Visual |
| 21 Sep 2007 |
-- |
more than 75 km ESE |
Satellite |
| 04 Oct 2007 |
-- |
more than 100 m ESE |
Satellite |
| 07 and 10 Oct 2007 |
-- |
more than 50 km NE |
Satellite |
| 17-18 Oct 2007 |
-- |
more than 180 km NE |
Satellite |
| 20 Oct 2007 |
-- |
more than 50 km NW |
Satellite |
The eruption continued through at least 25 October 2007, and perhaps through 8 November. Clouds obscured the volcano on many days, making estimates of the continuity of this eruption and its ending date difficult. KVERT has reported no later plumes observed over Chikurachki to mid-April 2008. No thermal anomalies were measured by the MODIS satellites during 2007 or 2008 to 20 April.
Geologic Background. Chikurachki, the highest volcano on Paramushir Island in the northern Kuriles, is a relatively small cone constructed on a high Pleistocene edifice. Oxidized basaltic-to-andesitic scoria deposits covering the upper part of the cone give it a distinctive red color. Frequent basaltic Plinian eruptions have occurred during the Holocene. Lava flows have reached the sea and formed capes on the NW coast; several young lava flows are also present on the E flank beneath a scoria deposit. The Tatarinov group of six volcanic centers is located immediately to the south, and the Lomonosov cinder cone group, the source of an early Holocene lava flow that reached the saddle between it and Fuss Peak to the west, lies at the southern end of the N-S-trending Chikurachki-Tatarinov complex. The Tatarinov centers are extensively modified by erosion and have a more complex structure. Tephrochronology gives evidence of an eruption around 1690 CE from Tatarinov, although its southern cone contains a sulfur-encrusted crater with fumaroles that were active along the margin of a crater lake until 1959.
Information Contacts: Olga Girina, Kamchatka Volcanic Eruptions Response Team (KVERT), a cooperative program of the Institute of Volcanic Geology and Geochemistry, Far East Division, Russian Academy of Sciences, Piip Ave. 9, Petropavlovsk-Kamchatsky, 683006, Russia, the Kamchatka Experimental and Methodical Seismological Department (KEMSD), GS RAS (Russia), and the Alaska Volcano Observatory (USA) (URL: http://www.kscnet.ru/ivs/kvert/updates.shtml); Alaska Volcano Observatory (AVO), a cooperative program of the U.S. Geological Survey, 4200 University Drive, Anchorage, AK 99508-4667, USA (URL: http://www.avo.alaska.edu/), the Geophysical Institute, University of Alaska, PO Box 757320, Fairbanks, AK 99775-7320, USA, and the Alaska Division of Geological and Geophysical Surveys, 794 University Ave., Suite 200, Fairbanks, AK 99709, USA; NASA Earth Observatory Natural Hazards (URL: http://earthobservatory.nasa.gov/NaturalHazards/); KVERT Current Activity of Chikurachki (URL: http://www.kscnet.ru/ivs/kvert/current/chkr/).
Erebus (Antarctica) — March 2008 Cite this Report
Erebus
Antarctica
77.53°S, 167.17°E; summit elev. 3794 m
All times are local (unless otherwise noted)
Significant eruptions tabulated for 2007
The Mt. Erebus Volcano Observatory (MEVO) website activity log gives information on each eruption of the volcano detected. Daily activity that usually includes several eruptions. Erebus eruption sizes are measured in the pressure unit of Pascals (Pa) from the infrasonic overpressure (at Station E1S.IS1). The eruption size index scale is divided into events classified as small (0-19 Pa), medium (20-39 Pa), large (40-59 Pa), and very large (>= 60 Pa).
Table 2 lists large and very large eruptions for the period December 2006 through 23 October 2007 (BGVN 31:12 gave a similar list for the year 2006 through November). The absence of recorded eruptions from 13 April 2007 to 29 August 2007 is notable. No eruptions were reported on the website during 23 October 2007 to 29 April 2008.
Table 2. Eruptions recorded at Erebus in the instrumentally derived categories "large" and "very large" during December 2006-23 October 2007. Courtesy of MEVO.
| Month |
Large Eruptions |
Very Large Eruptions |
| Dec 2006 |
2 |
0 |
| Jan 2007 |
29 |
24 |
| Feb 2007 |
8 |
39 |
| Mar 2007 |
7 |
11 |
| Apr 2007 |
2 |
7 |
| May 2007 |
0 |
0 |
| Jun 2007 |
0 |
0 |
| Jul 2007 |
0 |
0 |
| Aug 2007 |
0 |
1 |
| Sep 2007 |
0 |
2 |
| Oct 2007 |
1 |
1 |
Thermal anomalies over Erebus, measured from the MODIS (Moderate Resolution Imaging Spectroradiometer) satellite images were analyzed by the Hawai'i Institute of Geophysics and Planetology (HIGP) MODVOLC algorithm. They commonly appeared throughout the 2007 due to the presence of a molten lava lake within the crater.
Geologic Background. Mount Erebus overlooks the McMurdo research station on Ross Island and is the largest of three major volcanoes forming the roughly triangular Ross Island. The summit of the dominantly phonolitic volcano has been modified by one or two generations of caldera formation. A summit plateau at about 3,200 m elevation marks the rim of the youngest caldera, which formed during the late-Pleistocene and within which the modern cone was constructed. An elliptical 500 x 600 m, 110-m-deep crater truncates the summit and contains an active lava lake within a 250-m-wide, 100-m-deep inner crater; other lava lakes are sometimes present. The glacier-covered volcano was erupting when first sighted by Captain James Ross in 1841. A persistent lava-lake, with minor explosions punctuated by occasional larger Strombolian explosions that eject bombs onto the crater rim, has been documented since 1972, but nearly continuous activity has probably been occurring for much longer.
Information Contacts: Philip R. Kyle and Kyle Jones, Mt. Erebus Volcano Observatory (MEVO), New Mexico Institute of Mining and Technology, Socorro, NM 87801, USA (URL: https://nmtearth.com/); Hawai'i Institute of Geophysics and Planetology (HIGP) MODIS Thermal Alerts, School of Ocean and Earth Science and Technology (SOEST), Univ of Hawai'i, 2525 Correa Road, Honolulu, HI 96822, USA (URL: http://modis.higp.hawaii.edu/).
Galeras
Colombia
1.22°N, 77.37°W; summit elev. 4276 m
All times are local (unless otherwise noted)
Eruption of January 2008
As reported in (BGVN 31:07) Galeras displayed dome growth and elevated seismicity from November 2005 through mid-August 2006; ~ 10,000 residents evacuated but the crisis later abated. The key source of this report was the Instituto Colombiano de Geologia y Mineria (INGEOMINAS). This report follows the August 2006 events and covers the period through April 2008.
In September 2006, INGEOMINAS recorded continuing low-level minor earthquakes, M 1.4, corresponding to the movement of fluids at depths between 4 and 8 km and low SO2 fluxes. A fly-over observed gas and steam emissions from the periphery of the active cone with diminished intensity through early November.
Beginning in late November and continuing through December 2006, an increase in the level of the volcanic activity occurred indicating the movement of solid material at focal depths to 9.6 km and at intensities to M 2.1. INGEOMINAS raised the Alert Level from 3 to 2 elevating the hazard status to "likely eruption in days or weeks" on 22 November 2006. The scale extends from 4 (lowest) to 1 ( highest hazard). The change was based on the increase in activity, behavior resembling characteristics that preceded earlier eruptions, i.e., increased earthquake activity associated with rock fractures within 2 km of the surface and weak gas emissions caused by the apparent capping of the lava dome.
On 2 March 2007, a tectonic earthquake was recorded ~ 2 km NNW of Galeras at M 3.5 and focal depth of 8.2 km. On 15 March, observations made with the support of the Colombian Air Force (FACE), showed continuing low rates of gas discharge continuing from secondary craters and fumaroles mainly located in the periphery of the main crater. On 20 March, because of decreased seismicity, low gas emissions, and no indication of changes below the surface of the dome, the Alert Level shifted towards less severe, from 2 to 3 (to "changes in the behavior of volcanic activity have been noted").
On 19 and 21 May 2007, two earthquakes registered, M 3.0 and M 2.1 respectively. These earthquakes were located SW of Galeras and felt by residents. The inclinometer to the SW of the active crater continued showing deformation indicating deeper volcanic activity.
Little volcanic activity occurred through September 2007. From October 2007 through January 2008, INGEOMINAS and the Washington Volcanic Ash Advisory Center reported an increase in gas-and steam plumes emitted from Galeras (table 8). During an overflight on 27 November, thermal images recorded by INGEOMINAS indicated an increase in temperatures at the point sources of emissions. The Alert Level remained at 3. Occasional gas and steam eruptions continued through January 2008.
Table 8. Summary of activity reported at Galeras from October 2007 through January 2008. Based on information from INGEOMINAS and the Washington Volcanic Ash Advisory Center.
| Date |
Event |
Maximum plume (km) |
Plume direction |
| 04 Oct-05 Oct 2007 |
Steam, ash |
5.8-6.3 |
N, NW |
| 29 Oct-04 Nov 2007 |
Steam, ash |
5.7 |
-- |
| 05 Nov-11 Nov 2007 |
Ash |
4.5-7.2 |
NW, W |
| 13 Nov 2007 |
Steam |
5.5 |
S |
| 21-23 Nov 2007 |
Steam and gas |
5.3 |
-- |
| 27 Nov 2007 |
Steam, gas, ash |
4.4 |
NW |
| 03 Dec 2007 |
Steam, gas, ash |
5.3 |
NW |
| 31 Dec 2007 |
Gas and ash |
4.9 |
NW |
| 12 Jan 2008 |
Steam, gas, ash |
6.3 |
-- |
On 11 January 2008, INGEOMINAS noted variations in seismicity associated with greater volumes of gas discharge. On 16-17 January, 5 tremors were recorded near the active cone. Early on 17 January, INGEOMINAS noted the similarity of these events to those preceding the eruptions of 1992, 1993, and 2004-2006.
Later, on the 17th, an explosive eruption was registered by the seismic network and prompted INGEOMINAS to raise the Alert Level from 3 ("changes in the behavior of volcanic activity have been noted") to 1 ("imminent eruption or in course"). The Washington VAAC reported that an ash plume rose to an altitude of 11 km and drifted W. According to a news article, small settlements to the N were ordered to evacuate; about 100 people moved to shelters.
About 2 km away from the main crater, military personnel saw blocks 1.5 m in diameter on a highway. Several impact craters of 17 January were spotted; the largest, ~ 15 m across and ~ 5 m deep (figure 111).
On 19 January 2008, INGEOMINAS lowered the Alert Level to 2 ("likely eruption in days of weeks") because seismic events decreased in occurrence and energy and on 21 January, INGEOMINAS further lowered the Alert Level to 3 and reported that the initial ash plume from the eruption drifted SW, then W. Through February and into March seismic activity remained low. However, in mid-March, a a cluster of earthquakes (several events in a relatively short time interval), associated mainly with movement of magmatic fluids to the interior of the volcanic system were recorded. Volcanic gas and steam columns were routinely observed between 200 and 450 m from the top of Galeras, with variable directions of dispersion depending on the wind direction. Seismicity decreased in early April and SO2 emissions remained low.
Geologic Background. Galeras, a stratovolcano with a large breached caldera located immediately west of the city of Pasto, is one of Colombia's most frequently active volcanoes. The dominantly andesitic complex has been active for more than 1 million years, and two major caldera collapse eruptions took place during the late Pleistocene. Long-term extensive hydrothermal alteration has contributed to large-scale edifice collapse on at least three occasions, producing debris avalanches that swept to the west and left a large open caldera inside which the modern cone has been constructed. Major explosive eruptions since the mid-Holocene have produced widespread tephra deposits and pyroclastic flows that swept all but the southern flanks. A central cone slightly lower than the caldera rim has been the site of numerous small-to-moderate eruptions since the time of the Spanish conquistadors.
Information Contacts: Diego Gomez Martinez, Observatorio Vulcanológico y Sismológico de Pasto (OVSP), INGEOMINAS, Carrera 31, 1807 Parque Infantil, PO Box 1795, Pasto, Colombia (URL: https://www2.sgc.gov.co/volcanes/index.html; Washington Volcanic Ash Advisory Center (VAAC), Satellite Analysis Branch (SAB), NOAA/NESDIS E/SP23, NOAA Science Center Room 401, 5200 Auth Road, Camp Springs, MD 20746, USA (URL: http://www.ospo.noaa.gov/Products/atmosphere/vaac/); Associated Press (URL: http://www.ap.org/).
Karkar (Papua New Guinea) — March 2008 Cite this Report
Karkar
Papua New Guinea
4.647°S, 145.976°E; summit elev. 1839 m
All times are local (unless otherwise noted)
Seismic monitoring of increased fumarolic activity
During late 2007 and continuing into 2008, it became clear the Karkar's vegetation had suffered and seismicity was significant (tens of earthquakes per day). Herman Patia of the Rabaul Volcano Observatory (RVO) reported that the Bagiai cone situated in the inner caldera of Karkar volcano continued to release thin to moderate white vapor while a RVO team was at the volcano from 27-31 December 2007. The white vapor plume was also visible from the mainland. Prior to the visit, communities on the W and SW had heard occasional roaring noises associated with the gas emission from the Bagiai cone. The last Bulletin (BGVN 25:11) discussed light ashfall ultimately attributed to Ulawun. In early November 2007, RVO had reported vegetation die-back and increased fumarolic activity at Bagiai cone on the floor of the inner caldera (figure 5). Latest images sent to RVO by Sir Peter Barter on 11 December 2007 indicated that vegetation on the SE flank had withered completely. According to RVO, the last eruption of Karkar was in 1979.
During the team's December visit, they deployed three portable seismic recorders on the NW, SW, and E sides of the island (figure 6, open triangles). Preliminary results indicated a total of 30 high-frequency (HF) earthquakes recorded during the 3 days of deployment. These events were interpreted as indicative of rock-breaking due to magma movement under the volcano. The overall seismicity was low.
Bagiai cone continued to release variable volumes of white vapor towards the end of January 2008. A second phase of seismic monitoring at Karkar was carried on from 24 January to 3 February 2008. (figure 6, filled triangles). The closest seismometer to the cone was placed ~ 3 km away Seismic activity was low, dominated by high-frequency earthquakes, but low-frequency earthquakes also occurred. About 15?20 earthquakes were recorded daily during the first 3 days of recording (24-28 January), the earthquakes occurring near Bagiai cone in the center of the inner caldera.
The two phases of seismic monitoring detected both high-frequency volcano-tectonic (VT) earthquakes and low-frequency earthquakes. VT earthquakes were taken to indicate magma intrusion underneath or near Karkar volcano and were detected during the December 2007 deployment by two of the three stations (KWAD and KKEV) on the E and SE side. Station KSUG did not record the HF earthquakes.
The seismic monitor installed about 3 km from Bagiai cone (KMAT), at a spot adjacent to the thermal activity, recorded LF earthquakes as well. LF earthquakes were presumed to be associated with movement of steam and gas and the hydrothermal activity at Bagiai cone.
To provide continuous seismic monitoring at Karkar, on 3 February 2008 a portable seismic recorder was installed 9 km N of the cone. RVO intends to download and analyze the data every 2 months.
For several weeks during late February into early March 2008, RVO scientists visited Karkar to monitor the increased seismic activity first monitored during December 2007. Once again, the group reported that thermal activity from within the cone had caused the vegetation to die and turn brown. On this visit, withered and dry vegetation could be observed on Bagiai's flanks. Seismicity was continuing, but at low levels. On this visit, three portable seismic recorders were deployed close to the summit area on the outer caldera, 3.5 km from Bagiai. They recorded 15-20 volcanic earthquakes per day.
There have been no thermal anomalies measured over Karkar by MODIS instruments since at least the beginning of 2007 through mid-April 2008.
Geologic Background. Karkar is a 19 x 25 km forest-covered island that is truncated by two nested summit calderas. The 5.5 km outer caldera was formed during one or more eruptions, the last of which occurred 9,000 years ago. The steep-walled 300-m-deep, 3.2 km diameter, inner caldera was formed sometime between 1,500 and 800 years ago. Cones are present on the N and S flanks of this basaltic-to-andesitic volcano; a linear array of small cones extends from the northern rim of the outer caldera nearly to the coast. Recorded eruptions date back to 1643 from Bagiai, a pyroclastic cone constructed within the inner caldera, the floor of which is covered by young, mostly unvegetated andesitic lava flows.
Information Contacts: Herman Patia, Rabaul Volcanological Observatory (RVO), P.O. Box 3386, Kokopo, Papua New Guinea; MODVOLC Hawai'i Institute of Geophysics and Planetology (HIGP) Thermal Alerts System, School of Ocean and Earth Science and Technology (SOEST), Univ. of Hawai'i, 2525 Correa Road, Honolulu, HI 96822, USA (URL: http://modis.higp.hawaii.edu/).
Kelud
Indonesia
7.935°S, 112.314°E; summit elev. 1730 m
All times are local (unless otherwise noted)
Comparatively passive 2007 lava-dome emplacement in a crater lake
The extrusion of a substantial dome into the center of the active crater lake at Kelut (also spelled Kelud) started in early November 2007. The volcano and lake are among the most historically active and dangerous in Indonesia (Thouret and others, 1998). They were studied by members of the Volcanological Survey of Indonesia (VSI), Alain Bernard, and colleagues. During about 15 years prior to the eruption, the crater lake showed considerable hydrothermal influence, with temperatures several degrees above the ambient air temperature of 19°C, but with near-neutral pH. Prior to this eruption, the lake was ~ 34 m deep, ~ 350 m in diameter, and it held ~ 2.1 x 10⁶ m3 of water (Bernard and Mazot, 2004).
Lava was clearly seen emerging from the center of the lake on 4 November 2007. The activity was passive, even at the contact between the dome and lake. Neither water nor substantial ash were thrown forcefully out of the lake and onto the flanks. The dome rose rapidly above the lake, building a steep construct surrounded by a placid but dwindling lake. A well-defined depression crossed the dome's center, dividing its top surface in two. A few undated photos showed a mildly explosive phase. During 29-30 November the still-erupting dome was stable. As of early May 2008, tentative reports suggested that dome extrusion had ceased or paused. A lake still existed at that point.
Setting, historical lahars, and morphology. The volcano resides in a densely populated part of Java (1,800 people/km2) and could threaten over 3 million residents (Bernard, 2000). Bernard (2000) also noted that Kelut's approximately 30 historical eruptions have caused over 15,000 deaths since 1500 AD. Kelut's last eruption occurred in 1990 (BGVN 15:01). One of the most detailed VSI reports on Kelud's pre-eruptive behavior was issued 30 October 2007 (Surono, 2007).
Although lahars were absent during the 2007 eruption, lahars were associated with eruptions in 1919 and 1966; post-1996 lahars came in response to rainfall (figure 2). To control lahars and related problems, decades before engineers had driven a complex series of drainage tunnels through the edifice's walls, draining much of the lake.
Lake chemistry. Active crater lakes such as Kelut's trap some fraction of the heat and fluids escaping the magmatic and hydrothermal system (Delmelle and Bernard, 1999), and their study has led to breakthroughs in eruption prediction. One example of this kind of study (figure 3) presents various heat and mass-balance factors in a model of Kelut's lake (Bernard and Mazot, 2004). Heat is derived from the enthalpy (E) of hydrothermal fluids (Ebrine + steam) and from solar and atmospheric radiation (Erad). Heat is lost by evaporation (Eevap), conduction (Econd), radiation (Erad), and by the overflow (Eover) of hot waters through the drainage tunnel.
Monitoring instrumentation is in place on and around the lake (figure 4). Fieldwork is also performed to measure the flux of CO2 emitted at the lake surface (figure 5). Numerous CO2-bearing gas bubbles rising to the surface were seen in July 2006. Bubbles were also widespread on bathymetric soundings (eg. detected at 50 and 200 kHz) in July 2007, and in some cases observers witnessed frequent discontinuous gas releases (puffing) from bottom fumaroles.
The CO2 flux from the lake's surface was measured by IR spectrophotometry using a Dr?ger Polytron instrument. Bernard's team modified a technique initially developed for monitoring the flux of gases in soil (Chiodini and others, 1996), applying this method by means of the floating accumulation chamber at multiple sites.
According to the VSI report, carbon dioxide (CO2) concentrations measured during 30 July to 2 August 2007 ranged from below 500 g/m2/d to hotspots of 12,000 g/m2/d, especially in the E portion of the lake. The overall flux of CO2 from the lake reached more than 500 tons/day on 11 September 2007, about ten times greater than measurements made in 2005 and 2006 (figure 6).
Data on lake chemistry (table 2) was compiled by Surono (2007) and Bernard (2000). The water chemistry of the active crater lake showed both stable and variable parameters. Comparatively stable ones included pH and during various time periods (including 2007), some chemical species. Among the largest perturbations were a sudden, almost two-fold rise in SO2 during September-October 2007; and a rapid increase in lake water temperature during November 2007. Soluble Cl stood over 1,000 ppm during 1993 and dropped sharply reaching a low of 67 ppm on 20 August 2007. It climbed after that, reaching 354 ppm in the last (11 November) measurement, a value taken about a week after the dome broke the lake surface.
Table 2. A compilation for Kelut's lake water showing temperature, pH, and chemical concentration data from VSI for 2007 (Surono, 2007) and Alain Bernard (2000) during 1993 to 2005. Some of the data presented here were rounded and the number of significant figures reduced. The 23 October 2007 Cl value was variously reported. Some of the original data were presumably collected at different locations and depths; and some of the original data included additional parameters such as total dissolved solids (see cited publications). Eruptions began on 3 November 2007, and the dome emerged above the lake surface on 4 November.
| Date |
Temp (°C) |
pH |
Na |
K |
Ca |
Mg |
HCO3 |
Cl |
SO4 |
B |
| 18 Dec 1993 |
42.8 |
5.9 |
700 |
92 |
105 |
55 |
238 |
1,297 |
631 |
11 |
| 01 Aug 1994 |
42.1 |
6.3 |
1,024 |
102 |
130 |
67 |
207 |
1,289 |
692 |
14 |
| 24 Sep 2002 |
33.2 |
6.5 |
342 |
39 |
135 |
80 |
435 |
289 |
670 |
4 |
| 04 Sep 2003 |
30.7 |
6.5 |
271 |
30 |
147 |
78 |
472 |
202 |
679 |
2.5 |
| 27 Apr 2005 |
32.2 |
6.6 |
198 |
23 |
121 |
71 |
330 |
139 |
571 |
2 |
| 20 Aug 2007 |
31.5 |
6.9 |
104 |
14 |
166 |
48 |
221 |
66.5 |
538 |
0.8 |
| 16 Sep 2007 |
33.2 |
6.4 |
106 |
16 |
184 |
52 |
294 |
120 |
1,083 |
1.1 |
| 25 Sep 2007 |
33.4 |
5.9 |
109 |
17 |
178 |
51 |
279 |
133 |
1,121 |
1.3 |
| 29 Sep 2007 |
36.1 |
5.9 |
109 |
17 |
179 |
45 |
279 |
137 |
1,121 |
1.5 |
| 23 Oct 2007 |
38.4 |
5.8 |
257 |
22 |
186 |
56 |
297 |
210 (173) |
1,119 |
1.3 |
| 28 Oct 2007 |
39.2 |
5.6 |
117 |
20 |
190 |
48 |
303 |
179 |
1,151 |
1.4 |
| 02 Nov 2007 |
~50 |
-- |
-- |
-- |
-- |
-- |
-- |
-- |
-- |
-- |
| 06 Nov 2007 |
77.5 |
6.7 |
124 |
21 |
200 |
48 |
170 |
294 |
542 |
1.7 |
| 11 Nov 2007 |
77.8 |
6.2 |
130 |
21 |
223 |
45 |
26.3 |
354 |
615 |
2.1 |
Monitoring, hazards status, and dome extrusion. Visual monitoring was carried out by means of a closed-circuit video monitor installed on Mount Lirang, as well as from photographs taken in or near the crater. During 15-28 September, gas emissions from the crater lake increased and spread over a zone within a radius of ~5 m. According to Surono (2007), pre-eruption CO2 fluxes from the lake were typically 50 metric tons/day. During August 2007 they rose to 333 tons/day; during late August to early September they reached 500 tons/day.
During 2006, the Darwin Volcanic Ash Advisory Center (VAAC) reported a pilot observation. An ash plume on 18 May 2006 allegedly reached an altitude of 5.5 km. On 17 October 2007 Kelut was the subject of further VAAC reports, first noting the elevation of the hazard status to 4 (the highest level, indicating an eruption imminent). On 23 October there was a brief noting evidence from a satellite of a eruption (to ~ 6 km altitude) but ground observers suggested that it was a meteorological cloud. A VAAC report on 4 November noted "ash not identifiable on satellite imagery." On 8 November an advisory noted the continued absence of identifiable ash.
Seismicity rose suddenly on 10 September 2007 (figure 7). It peaked on 16 October at all four seismic stations on or adjacent the volcano, at 510 events. The next day, the number of earthquakes still stood quite high, 151.
Cross sections showing hypocenters for 10-11 and 26-29 September 2007 depicted them broadly centered below the edifice but distributed around 2.5 km depth; they were initially absent in a zone about 2-3 km below the summit . During mid-October the hypocenters became more closely packed along a narrow vertical band beneath the edifice. They then filled a zone 0.7-1.2 km beneath the summit, with a few other hypocenters centered ~ 2 km below the summit. During 24-29 October, many hypocenters clustered ~ 6 km below the summit, but others strung out on or about a vertical line intersecting near the summit. The shallowest events plotted were then ~ 1 km below the summit. Reports also noted tremor was common during 24 October through 4 November.
VSI issued a series of increases in Kelut's hazard status (a scale of 1-4, figure 7). On 11 September 2007, VSI raised the status from 1 to 2. This corresponded to the CO2 flux mentioned above, a sudden jump in seismicity on 10 September (figure 7), and changes in both lake temperature and color, which shifted from its usual green, becoming yellow in some areas and blue-white in others. On 29 September, the status went from 2 to 3 based on visual observations, increased seismicity, deformation measurements, and further changes of crater lake water chemistry and temperature.
VSI brought the status to 4 on 16 October (figure 7). Factors included the sudden rise in seismicity, and the summit's inflation during 13-16 October. Before the crisis of 16 October the lake water was whitish green; after the crisis, dominantly green. VSI to recommend that villagers within a 10-km radius evacuate. According to a United Nations report, local authorities evacuated ~ 117,000 people within this radius. The UN report cited Indonesian media as stating that an eruption could affect as many as ~ 290,000 people (figure 8).
According to a news article, thousands returned to their homes on 17 October to tend to crops and animals, and to retrieve food. On 8 November the status fell to 3 and residents were allowed to return home. On 29 November the status fell from 3 to 2 following both decreased seismicity and a lack of deformation. At this stage, people were advised to remain at least 1.5 km from the lake.
During 24-31 October, a series of regional earthquakes occurred, dominated by shallow events and tremor. Seismicity intensified during 2-3 November, but then decreased on 4 November.
Dome emerges during 3-4 November 2007. On 3 November, VSI and news media mentioned plumes, and possibly some evidence of erupted solids entering the lake. Also, their buoy ceased functioning. On 4 November, white plumes rose to an altitude of 2.2 km and drifted N.
Plumes on the 4th came from a fresh black lava dome, protruding from the then turbid green lake. Monitoring cameras showed copious steam obscuring the dome. The exposed mass grew quickly. Although steaming continued, relative calm usually prevailed at both the dome and the lake. Although the dome steadily displaced the lake, the water did not undergo violent broad-scale boiling.
According to VSI, the temperature at the surface of the crater lake on 6 November had climbed to over 75°C. The newly exposed dome surface was 150-210°C. Plumes generally inhibited clear views.
On 8 November, VSI reported a decrease in seismicity, and deformation-monitoring suggested greater stability. An infrared camera (FLIR) captured images of the dome on 9 November as it emerged from the lake. The images revealed considerable radiant heat in the FLIR-sensitive wavelengths (figure 9).
According to a news article by Agence France Presse on 12 November, a volcanologist reported that the lava dome had reached 250 m in diameter and was 120 m above the lake surface.
November photos and videos. On 11 November, a plume rose to an altitude of 3.7 km and ashfall was reported in several areas. News accounts indicated that tremors continued and that Kelut was spewing ash and lava. More photos of the dome, particularly during 10-29 November, would be useful for understanding activity in this period.
An undated video provides views of a short-lived avalanche down from the new dome's upper walls. Based on the size of the dome then, the scene was probably captured in mid- to late November (it was posted on 7 December; Masdjawa, 2007). The avalanche initially contained on the order of 5-20 m3 of loose material, much of it incandescent in daylight. A large portion of this material bounced downslope into the steaming lake. When sufficient fragmental material entered the lake an intense phreatic eruption took place. The clouds rose vertically; they were initially jet black, but within tens of seconds became dominantly white steam, hiding the dome for ~ 1-2 minutes.
Daniel Brazilier visited during 25-26 November and saw mildly to moderately explosive activity; his photos appeared in Societe de Volcanologie Geneve reports (SVG, 2007). Many of his photos were taken during daylight from ~ 1.5 km away; they showed several explosions with billowing white-to-tan clouds. The foreground, the W crater wall, contained small amounts of tephra and some bombs. The billowing clouds appeared to contain minor ash; they vented from the dome upper area or side, and accompanied numerous steaming bombs, which from their arcing trails, seemed destined to land within the crater. Night photos disclosed large areas of incandescence on the W side.
Tom Pfeiffer took a series of remarkable photos on 29-30 November 2007, documenting a surprisingly large and clearly fast-growing dome. He posted over 60 photos on the Volcano Discovery website and elsewhere, and several of them appear here (figures 10, 11, and 12).
Note that Pfeiffer's photos are night-time shots with long exposures and thus the impression of large glowing areas implies more activity than really occurred at any one time. The dome had clearly crowded out the then green or brownish lake, which in the field of view had been reduced to an arcuate sliver. The extent of the lake on the dome's W and SW sides was unclear from his perspective.
Particularly on figures 10 and 11, the dome was rife with abundant glowing zones and numerous red traces due to incandescent dome rocks bouncing downslope. Abundant were glowing avalanche trails, and large rockfall scars. The photos also suggest possible lava seeps and narrow lava flows, although Tom Pfeiffer attributed most of the incandescence to mobile and solidified material, rather than narrow zones occupied by fluid moving lava.
A few of the glowing traces in the photos terminate upon entering the crater lake (figure 12). After their first contact with the water, some of those descending traces also seemingly shattered and bounced, producing one or more secondary arcs (akin to a skipping stone).
Pfeiffer described the scene as "filled with the noises of cracking lava, falling debris, and chilled lava blocks that splashed into the lake." He went on to note the lack of "explosions, or major ash emissions attached to the activity. The lava dome was simply growing quietly and not doing anything else than what is visible on the photos." He was struck by the observation "that the lake was simply there and NOT boiling. A sign how well rock insulates. Also, the upper 10 meters of the dome, its very top, were rather inactive, like the top of a mushroom being lifted up. The most active zones were just underneath that upper crust . . .."
References. Bernard A., and Mazot A., 2004, Geochemical evolution of the young crater lake of Kelud volcano in Indonesia: Proceedings of the Eleventh International Symposium on Water-Rock Interaction, Saratoga Springs, New York, USA, v. 1, p. 87-90.
Bernard, A., 2000, Geochemistry of the crater lake of Kelut volcano, Indonesia: Essay labeled "in preparation" on the http://www.ulb.ac.be/ website.
Bourdier, J. L., Pratomo, I., Thouret, J.C., Boudon, G. and Vincent, P.M., 1997. Observations, stratigraphy and eruptive processes of the 1990 eruption of Kelut volcano, Indonesia: J. Volcanol. Geotherm. Res., v. 79, p. 181-203.
Delmelle, P., and Bernard, A., 1999, Volcanic lakes, in Encyclopedia of volcanoes, H. Sigurdsson (ed.): Academic Press, p. 877-895.
Masdjawa, 2007, Kelud-Kubah Lava: Kelud_03.mpg (23.2 Mb), 2 min 20 sec; http://masdjawa.multiply.com/video/item/4
Rodolfo, K. S., 1999, The hazard from lahars and Jökulhaups, in Encyclopedia of volcanoes, H. Sigurdsson (ed.): Academic Press, p. 973-995.
Surono, 2007, Pusat Vulkanologi Dan Mitigasi Bencana Geologi, Pos Pengamatan Gunungapi Kelut (Hasil evaluasi tingkat kegiatan G. Kelut): Departemen Energi Dan Sumber Daya Mineral, Republik Indonesia, Badan Geologi, Nomor, 112/GK/X/2007, 30 Oktober 2007.
Thouret, J. C., Abdurachman, K. E., and Bourdier, J. L., 1998, Origin, characteristics, and behavior of lahars following the 1990 eruption of Kelud volcano, eastern Java (Indonesia): Bull. Volcanol., v. 59, p. 460-480.
Geologic Background. The relatively inconspicuous Kelud stratovolcano contains a summit crater lake that has been the source of some of Indonesia's most deadly eruptions. A cluster of summit lava domes cut by numerous craters has given the summit a very irregular profile. Satellitic cones and lava domes are also located low on the E, W, and SSW flanks. Eruptive activity has in general migrated in a clockwise direction around the summit vent complex. More than 30 eruptions have been recorded since 1000 CE. The ejection of water from the crater lake during the typically short but violent eruptions has created pyroclastic flows and lahars that have caused widespread fatalities and destruction. After more than 5,000 people were killed during an eruption in 1919, an engineering project to drain the crater lake lowered the surface by more than 50 m. The 1951 eruption deepened the crater by 70 m, leaving 50 million cubic meters of water after the damaged drainage tunnels were repaired. Following more than 200 deaths in the 1966 eruption, a new deeper tunnel was constructed, and the lake's volume before the 1990 eruption was only about 1 million cubic meters.
Information Contacts: Volcanological Survey of Indonesia, Center of Volcanology and Geological Hazard Mitigation, Saut Simatupang, 57, Bandung 40122, Indonesia (URL: http://vsi.esdm.go.id/); Alain Bernard, Free University of Brussels, CP 160/02, 50, avenue F, Roosevelt, 1050 Brussels, Belgium (URL: http://www.ulb.ac.be/sciences/cvl/); Relief Web, United Nations Office for the Coordination of Humanitarian Affairs, Resident Coordinator's Office, Jakarta, Indonesia (URL: https://reliefweb.int/, http://www.unocha.org/); Darwin Volcanic Ash Advisory Center, Bureau of Meteorology, Northern Territory Regional Office, PO Box 40050, Casuarina, Northern Territory 0811, Australia (URL: http://www.bom.gov.au/info/vaac/); Tom Pfeiffer, Volcano Discovery (URL: http://www.VolcanoDiscovery.com/); Daniel Brazilier, France.
Monowai (New Zealand) — March 2008 Cite this Report
Monowai
New Zealand
25.887°S, 177.188°W; summit elev. -132 m
All times are local (unless otherwise noted)
Eruption recorded on 8 February 2008
On 28 March 2008, reporter Michael Field noted that an eruption of the submarine volcano Monowai was taking place. Olivier Hyvernaud was quoted in the article as saying that they recorded on the Polynesian Seismic Network (Réseau Sismique Polynésien, or RSP) a "big acoustic event" on 8 February. [He also noted that the volcano was in an eruptive phase, but it was not clear if it was a strong eruption.] The news article went on to say that, according to geologist Cornel de Ronde, the French Polynesian RSP currently receives submarine hydrophone signals from Monowai eruptions more easily than stations in New Zealand. The article concluded that this activity went unnoticed as its location is off the main shipping routes.
Ian Wright of the New Zealand National Institute of Water and Atmospheric Research (NIWA) informed us about new volcano discoveries along the S-central Kermadec arc and some recent mapping results from Monowai. In recent years, New Zealand scientists have mapped, using soundings made by multibeam acoustic arrays, most of the Kermadec arc, with the consequent discovery and naming of a number of 'new' arc volcanoes. Some of the more recent work for the 30°-35°S latitude sector was published in Wright and others (2006). A second manuscript detailing the 25°-30°S latitude sector will be completed soon for publication by Graham and others.
Wright and his colleagues mapped Monowai using the multibeam system in 1998 and again in 2004, identifying drastic changes in morphology during that 6-year period. They found edifice collapse and cone regrowth. They interpreted these changes in morphology in the context of T-wave data recorded by Hyvernaud and his colleague Dominique Reymond [Wright and others, 2008 (in press); BGVN 32:01].
As indicated on figures 20 and 21, the group subsequently re-mapped Monowai in mid-2007 for a third time, again finding drastic changes coinciding with a period of ongoing and high T-wave activity. They are currently preparing a manuscript detailing these latter changes (Chadwick and others, in preparation). According to Bill Chadwick, while the research ship was on site conducting the 2007 survey and attempting some remotely operated vehicle (ROV) dives, scientists heard booming sounds and saw slicks and bubbles on the surface.
Bob Dziak of NOAA informed the Bulletin staff that Monowai T-phases are recorded on the NOAA East Pacific Rise hydrophone arrays, but analysis of data from those arrays await their retrieval of recording packages from ocean deployment sites. (In contrast, Hyvernaud of LDG in French Polynesia recovers data in real-time.) Dziak also mentioned that, from time to time, T-phase events from what is likely volcanic activity in the Izu-Bonin Mariana region are recorded by the NOAA real-time system in the North Pacific. He offered to provide a later Bulletin report.
A recent paper by de Rhonde and others (2008) noted that all the major submarine volcanic centers on the Kermadec intraoceanic arc NE of New Zealand (including Monowai) are hydrothermally active. The Monowai volcanic complex has two separate and extensive hydrothermal fields associated with the Monowai caldera and the Monowai cone, respectively.
References. Wright, I.C., Worthington, T.J., and Gamble, J.A., 2006, New multibeam mapping and geochemistry of the 30°-35°S sector, and overview, of southern Kermadec arc volcanism, Journal of Volcanology and Geothermal Research, v. 149, p. 263-296.
Wright, I. C., Chadwick, W., de Ronde, C. E. J., Reymond, D., Hyvernaud, O., Gennerich, H., Stoffers, P., Mackay, K., Dunkin, M., and Bannister, S., 2008 (in press), Collapse and reconstruction of Monowai submarine volcano, Kermadec arc, 1998-2004, Journal of Geophysical Research, doi:10.1029/2007JB005138.
de Ronde, C.E.J., Baker, E.T., Lupton, J.L., Sprovieri, M., Bruno, P.P., Faure, K., Leybourne, M.I., Walker, S.L., Italiano, F., Embley, R.W., Graham, I., Greene, R.R., Wright, I.C., and NZAPLUME III & Aeolian'07 shipboard parties, 2008, Contrasting examples of submarine hydrothermal venting along the Kermadec intraoceanic arc and the Aeolian island arc, Geophysical Research Abstracts, v. 10, EGU2008-A-05597, 2008 (SRef-ID: 1607-7962/gra/EGU2008-A-05597).
Geologic Background. Monowai, also known as Orion seamount, is a basaltic stratovolcano that rises from a depth of about 1,500 to within 100 m of the ocean surface about halfway between the Kermadec and Tonga island groups, at the southern end of the Tonga Ridge. Small cones occur on the N and W flanks, and an 8.5 x 11 km submarine caldera with a depth of more than 1,500 m lies to the NNE. Numerous eruptions have been identified using submarine acoustic signals since it was first recognized as a volcano in 1977. A shoal that had been reported in 1944 may have been a pumice raft or water disturbance due to degassing. Surface observations have included water discoloration, vigorous gas bubbling, and areas of upwelling water, sometimes accompanied by rumbling noises. It was named for one of the New Zealand Navy bathymetric survey ships that documented its morphology.
Information Contacts: Ian Wright, New Zealand National Institute of Water and Atmospheric Research (NIWA), Private Bag 14-901, Wellington, 6003, New Zealand; Cornel de Ronde, GNS Science, Lower Hutt, 5040 New Zealand; Olivier Hyvernaud and Dominique Reymond, Laboratoire de Géophysique, Commissariat a l'Energie Atomique (CEA/DASE/LDG), PO Box 640, Papeete, Tahiti, French Polynesia; GNS Science, Wairakei Research Center, Private Bag 2000, Taupo 3352, New Zealand (URL: http://www.gns.cri.nz/); Michael Field, Fairfax Media, Auckland, New Zealand; William Chadwick and Robert Dziak, NOAA and Cooperative Institute for Marine Resources Studies at Oregon State University, 2115 SE OSU Drive, Newport, OR 97365.
Montagu Island (United Kingdom) — March 2008 Cite this Report
Montagu Island
United Kingdom
58.445°S, 26.374°W; summit elev. 1370 m
All times are local (unless otherwise noted)
December 2006 plume seen in satellite imagery
An ASTER (Advanced Spaceborne Thermal Emission and Reflection Radiometry) satellite image became available, showing a Montagu Island plume blowing NNE on 17 December 2006 (figure 19). A persistent ash plume over Montagu was previously noted in October 2006 ASTER imagery (BGVN 31:11).
Thermal anomalies from Montagu were often detected by MODIS satellite instruments nearly weekly from at least 2006 until 20 September 2007. However, during that interval anomalies were absent for more than two months, from January 2007 through late March 2007. Anomalies were also absent from 21 September 2007 to 17 April 2008. The absence of anomalies could be due to lack of visibility, or the chilling of lava flows after the end of an eruptive phase.
Geologic Background. The largest of the South Sandwich Islands, Montagu consists of a massive shield volcano cut by a 6-km-wide ice-filled summit caldera. The summit of the 11 x 15 km island rises about 3,000 m from the sea floor between Bristol and Saunders Islands. Around 90% of the island is ice-covered; glaciers extending to the sea typically form vertical ice cliffs. The name Mount Belinda has been applied both to the high point at the southern end of the summit caldera and to the young central cone. Mount Oceanite, an isolated peak at the SE tip of the island, was the source of lava flows exposed at Mathias Point and Allen Point. There was no record of Holocene activity until MODIS satellite data, beginning in late 2001, revealed thermal anomalies consistent with lava lake activity. Apparent plumes and single anomalous pixels were observed intermittently on AVHRR images from March 1995 to February 1998, possibly indicating earlier volcanic activity.
Information Contacts: ASTER Volcano Archive (URL: http://ava.jpl.nasa.gov/); Hawai'i Institute of Geophysics and Planetology (HIGP) Thermal Alerts System, School of Ocean and Earth Science and Technology (SOEST), Univ. of Hawai'i, 2525 Correa Road, Honolulu, HI 96822, USA (URL: http://modis.higp.hawaii.edu/);.
Rabaul (Papua New Guinea) — March 2008 Cite this Report
Rabaul
Papua New Guinea
4.2459°S, 152.1937°E; summit elev. 688 m
All times are local (unless otherwise noted)
Main vent plugged; seismicity, deformation, explosions, and H2S all high
This report describes ash plumes (figure 48) and explosions (table 9) located at Tavurvur, a cone located on the NE flank of Rabaul caldera. Tavurvur's summit sits at ~ 240 m elevation. The largest nearby settlement is Rabaul Town. Throughout the course of this report, audible sounds such as roaring, glowing of the cone, incandescent events, and hydrogen-sulfide (H2S) odor were frequently reported. RVO interpreted high-frequency earthquakes as rocks breaking or explosion events, and low-frequency earthquakes driven by fluids, steam or gas (rarely liquid magma), their motions imparting a slower shaking or rocking to the ground.
Table 9. Summary of events at Rabaul's Tavurvur cone during August 2007 to April 2008. Not all events are reported here. Further details of some of the events can be found in the text. Some data such as plume height or direction of plume were not measured. Areas effected by ashfall can generally be found in the text. Courtesy of the Darwin VAAC.
| Date |
Plume height (km) |
Direction |
Notes and Comments |
| 01-07 Aug 2007 |
0.9-1.7 |
N, NW, W |
Thick, dark gray. Occasional emission of white vapors. Ashfall. |
| 14-20 Aug 2007 |
-- |
-- |
White vapors. Accompanied by blue vapor plumes. |
| 22-28 Aug 2007 |
3 |
-- |
-- |
| 03 Sep 2007 |
-- |
NW |
Gray ash. Fine ashfall. |
| 04 Sep 2007 |
2 |
WNW |
White vapor. |
| 20-24 Sep 2007 |
1.2 |
W, NW |
White vapor. Ashfall. |
| 25 Sep 2007 |
1.7 |
W |
-- |
| 02 Oct 2007 |
2.4 |
-- |
-- |
| 03 Oct 2007 |
1.7-2.7 |
NW |
Ashfall. |
| 04 Oct 2007 |
-- |
W |
Ashfall. |
| 08-23 Oct 2007 |
1.7-2.7 |
NNE, S |
Thick white, gray ash clouds. Occasional explosions, ashfall on large area. |
| 29-30 Oct 2007 |
2.7-3.7 |
-- |
Ashfall. |
| 10 Dec 2007 |
2 |
SSE, E, NW, W |
Thick dark ash clouds. Ashfall. |
| 11 Jan 2008 |
1.2-1.5 |
SE |
Ash plume. |
| 11-15 Jan 2008 |
0.9-1.2 |
SE, E, NE, N, W |
Ash vapor plume. Ashfall. |
| 18-20 Jan 2008 |
1.7 |
NE |
-- |
| 28 Jan 2008 |
1.7 |
W |
-- |
| 29-30 Jan 2008 |
1.7 |
SW, W, E |
Ash and gas plumes. |
| 01-03 Feb 2008 |
1.2 |
SSE |
Weak ash emissions. |
| Mid Feb 2008 |
1.2-1.7 |
NW, W, SW, S, SE, E |
Thick gray ash clouds. Long duration of ashfall. |
| 26 Feb 2008 |
3.7 |
SE, E |
Thick billowing ash plumes. Explosion caused ashfall. |
| 27 Feb-04 Mar 2008 |
0.9-2.2 |
W |
Ash and steam plumes. Ashfall. |
| 08-10 Mar 2008 |
1.2-1.7 |
NW, W, SW, S, SE |
Ash plumes. Ashfall. |
| 13 Mar 2008 |
2.5 |
NE |
Ashfall. |
| 16 Mar 2008 |
2 |
S, W |
Gray ash. Ashfall. |
| 17 Mar 2008 |
2.5 |
WNW |
High ashfall, rapid gas escape. |
| 18 Mar 2008 |
2 |
WNW |
-- |
| 19 Mar 2008 |
2 |
NW, N |
-- |
| 20 Mar 2008 |
2 |
NW, SSE |
Ashfall. |
| 21 Mar 2008 |
-- |
S |
Fine ashfall. |
| 22 Mar 2008 |
1 |
SW, W, NW |
Ashfall. |
| 23 Mar 2008 |
2.5 |
N, SE |
Ashfall. |
| 26 Mar 2008 |
1.5 |
SE |
Ashfall, disruption of aviation. |
| 27 Mar 2008 |
2 |
S |
Thick gray. |
| 28 Mar 2008 |
0.5-1.0 |
W, SW |
Gray. |
| 30 Mar 2008 |
1-2 |
N, NW |
Thick white vapor gray ash clouds. |
| 01 Apr 2008 |
0.5 |
-- |
Fluctuating between water vapor and dense gray ash. Occasional explosions. |
| 03 Apr 2008 |
1 |
SE |
Discrete puffs gray ash. Rarer explosions. |
| 07-09 Apr 2008 |
1 |
E |
Gray ash clouds. Ashfall. |
| 13 Apr 2008 |
1-1.5 |
W, NW |
Ashfall. |
| 28 Apr 2008 |
1-1.5 |
N |
Gray. |
Low eruptive activity such as reported in this issue have been periodically occurring since the powerful explosion in 1994. Our last report (BGVN 32:06) reported the six explosions that occurred in June and July (2007) at Tavurvur cone that produced shockwaves that rattled windows of houses in Rabaul Town and surrounding areas. The explosions also showered the flanks with lava fragments and conveyed ashfall and sulfurous odors to the NW.
RVO stated that there was no indication of any build up that might lead to significant eruptive activity like in October 2006. Ground deformation remains to be in a deflated but stable state. Seismic activity remains at a moderate to high level dominated by low-frequency earthquakes.
Throughout the entire period covered by these observations and reports, authorities have been regularly advising the public not to venture close to the volcano due to the possibility of rocks being expelled during the occasional eruptions.
Late July 2007. Rabaul Volcanic Observatory (RVO) described this time as marked by minor eruptions. The activity consisted of emission of thin to thick, white, and bluish vapor, which rose to an altitude of ~ 0.9 km and drifted NNW. Roaring noises were occasionally heard and incandescence was intermittently visible at the crater rim.
Red glow was visible at night, associated with a small lava dome centrally located within Tavurvur's wide vent. A weak smell of sulphur was evident on the downwind side of the vapor plume on 25 July. Occasional low roaring noise continued to be heard and a weak to bright red glow was visible above the crater rim on 28 and 29 July. On 30 July, a white plume with little ash content rose to an altitude of 2.7 km and drifted SW.
Seismicity was low but it and deformation were consistent with a dynamic and restless caldera. The real-time GPS at the caldera's center of the showed that centimeter-scale movements often occurred over a few hours. Small inflation events sometimes preceded activity by 6-12 hours. Only 17 low-frequency earthquakes were recorded between 22 and 27 July. One high-frequency earthquake was recorded on 26 July which originated NE of the caldera. Ground deformation continued to show a slow inflation trend with movement N.
August 2007. August activity was characterized by Tarvurvur emitting almost continuous ash and vapor plumes. During 1-7 August 2007, ashfall was reported at Rabaul Town (~ 6.5 km NW of the vent) and surrounding areas. Seismicity was generally moderate during the earlier part of August but increased to higher levels between 22-29 August. Activity was usually low frequency earthquakes, with occasional high-frequence earthquakes between 25-29 August. Five weak explosions were recorded on 27 August.
Ground deformation was stable until the middle of August when minor uplifts were noted. On 22 August, a marked uplift began and then subsided with the resumption of ash emissions. The subsidence continued until 28 August when a minor uplift began but subsided on 30 August.
A total of 1,087 low frequency earthquakes were recorded during 28-31 August. Three weak explosions were recorded on 30 August, but no high-frequency earthquakes were recorded. Ash emission persisted before declining significantly on the night of 30 August. A total of 150 low-frequency earthquakes were recorded on 31 August. After a momentary eruptive interlude took place at the end of August, blending into early September
September 2007. On 2 September, fine ashfall continued on Rabaul Town. Seismicity continued at a moderate level, dominated by bands of irregular tremor and discrete low-frequency earthquakes. A total of 886 low-frequency earthquakes were recorded during 1-5 September; no high-frequency events were recorded. During 6-10 September there was little or no ash emitted. Emissions consisted of billowing white fume when atmospheric conditions were humid or cool. During hot dry periods, observers saw clear air above the cone, with a white plume appearing several hundred meters higher. On 8 September, odors of H2S became noticeable downwind; this coincided with a blue tinge to the plume. Ground deformation measurements indicated an uplift. Emissions began again on 20 September, with ashfall in Rabaul Town and areas downwind, including Namanula Hill (3 km W). On 27 September, a large explosion was noted. During 30 September-2 October, incandescent fragments were ejected from the summit and rolled down the flanks.
October 2007. On 3 October ashfall was reported from areas downwind, including Rabaul Town. On 4 October ash plumes resulted in ashfall in Matupit Island (3.3 km SE), Malaguna. Incandescent fragments were ejected from the summit. On 5 October, vapor plumes with minor ash content were noted. During 8-23 October, occasional explosions produced ash plumes. Ashfall was reported at Namanula Hill and surrounding areas. Continuous weak glow was visible at night and incandescence at the summit was observed. The glow was bright on the night of 17 October. On 29-30 October ashfall was reported in Rabaul Town. Seismicity continued at moderate to moderately high level between the 17th and 20th. One high-frequency event was recorded on 21 October from NE of Rabaul.
November 2007. In late November, after five weeks of low-level activity, Tavurvur began to emit ash from a new vent on the NE crater rim. The new vent was formed as a result of the lava dome blocking the vent on the crater floor. The activity progressed and on 8-9 December emissions were thick white gray ash. The new dome has been the source of the continuous red glow visible at night.
December 2007. There was a slight increase in seismicity during December, but it was still low. The average daily number of low-frequency earthquakes was 20 during 1-3 December, before increasing to 55 during 4- 6 December, and 85 during 7- 8 December. The activity was accompanied by low-level sub-continuous signals. Two high-frequency earthquakes were recorded on 3 December which originated NE of the caldera. Ashfall continued downwind, including Rabaul Town. During 13-18 December, white plumes were observed and a strong smell of H2S gas was reported.
January 2008. January 2008 continued the December activity. White ash and vapor plumes continued from the Tavurvur cone. The eruptive activity came from vents based on the inner eastern wall. One vigorous coneless fumarole on the upper outer eastern flank occasionally erupted ash. Unfortunately, NW winds carried ash towards the Provincial Airport (5.3 km NW) on a few occasions, causing closures.
During 11-12 January slight ashfall was reported about 20 km SE of Tokua. On 17 January ashfall at Tokua, prompted Air Niugini to cancel some flights. During 18-20 January, the ash plumes were released at 10-20 minute intervals. Slight ashfall was reported in areas on the E coast. Incandescence from the center of the crater was visible at night throughout most of January.
Deformation-monitoring instruments indicated that uplift started on 23 January and peaked during 25-26 January with 2 cm of inflation. On 26 January, ashfall was quite heavy but died down on the morning of 27 January. Seismicity remained moderately high, with small sub-continuous low-frequency signals dominating. In the preceeding 24 hrs there were 400 low-frequency events and 3 explosion type signals, most of them were not associated with the seen emissions. There were no high-frequency or hybrid events. There were small explosion type signals, even when ash was not emitted. Deformation monitoring showed a slight uplift superimposed on the gradual 6 month long subsidence. On 29 January two small, instrumentally recorded, high-frequency events occured within the caldera, one between Tavurvur and Rabalanakia and the other just off the E coast of Vulcan (the first here since the '94 eruption). Deformation monitoring showed that the center of the caldera underwent a rapid centimetre scale uplift and matching deflation on 31 January.
February 2008. There was little variance in the activity at Tarvurur which was essentially a continuation of the January activity. Because of light winds, the plumes reached 1 km above Tavurvur. Drift was predominantly E. During 1-3 February ashfall was reported in Kokopo (20 km SE). On 4 February, a strong smell of H2S gas was reported from Rabaul Town (3-5 km NW). Incandescence from the center of the crater was visible almost every night.
Low-frequency seismicity was moderately high and increased slightly, with occasional low-frequency signals dominating. Some hybrid events were also recorded. Seismic activity did not always appear to be related to the observed events. Deformation monitoring showed that the center of the caldera remaining reasonable stable during the early part of the month, although the trend was towards inflation. On 5 February, deformation monitoring showed some small, but significant movements with horizontal strain greater than vertical. A slight deflation was noted.
Toward the middle of February, ashfall was reported everyday in areas downwind, including Matupit, Kokopo, and Rabaul Town, and surrounding areas. Incandescence at the summit was noted and incandescent material was propelled from a vent on the inner E wall of the crater. Seismic activity remained at moderate levels; but again, the activity did not always appear to be related to observed events. Deflation appeared to continue but only slightly. Occasional periods of high level seismic activity were dominated by low-frequency volcanic earthquakes. A total of over 1,570 events were recorded during 7-8 February. Ground deformation showed no significant movement although the trend after 9 February was towards inflation.
From 13-19 February, ashfall was reported in Barovon, Lalakua, Raluana, Kokopo, and surrounding villages. During 19-20 February, incandescence at the summit was accompanied by projections of lava fragments. Ground deformation as indicated by both the GPS and water-tube tiltmeter continued to indicate a trend towards inflation. On 25 February an explosion showered the flanks with lava fragments. On 26 February a large explosion occurred. The flanks were again showered with lava fragments. Ashfall was reported in Kokopo and surrounding areas.
March 2008. Tavurvur's activity during March was a continuation of the preceeding months. During 27 February-4 March ashfall was reported in areas downwind, including Matupit. A smell of H2S gas was again reported in Rabaul Town. During 3-7 March, incandescence at the summit. A slight smell of H2S was reported in areas to the S on 5 March. During 8-11 March, ash fall was reported in areas downwind, including Kokopo town (SE), and Rabaul Town (NW) on 11 and 13 March. Seismic activity often remained at a high level during March, but, the instrument's batteries died during 10-11 March. A total of over 980 events were recorded on 9 March. No high-frequency earthquakes were recorded. Deformation continued to indicate an inflationary trend after 8 March. On 13 March fine ash fell upon Rabaul Town. Ground deformation began towards an inflation trend after previous indications towards deflation. Unlike most plume eruptions, on 13 March sounds were not recorded. On 17 March moderate to heavy ash fall rained on Matupit island and surrounding areas.
At 1105 on 20 March a large explosion occurred showering the flanks with lava fragments. The shockwave rattled windows in Rabaul Town. At 1730 on 22 March 2008 an explosion occurred showering the flanks with lava fragments. During 22-23 March areas downwind had ashfall.
On 25 March 2008 ash clouds formed a broad fan from S at Barovon/Ialakua to Kokopo. The cloud drifted SE towards Tokua later that morning. During the morning on 26 March 2008 ash plumes caused Air Niugini flights into Tokua to be affected.
During 27 March into July 2007 overall deflation was 5 cm of subsidence, step-wise with small superimposed up lifts. RVO suggested that low-pressure intrusions were periodically rising in an open conduit causing the uplift before intersecting with the surface. The overall deflation implied that the deeper source was being depleted. The deformation measurements were made at Matupit. Constant expansion and degassing of magma in the recent weeks had apparently kept the conduit open. Pressure and debris have started to block the mouth of the vent by compaction and partial welding of molten material. This would lead to pressure build-up causing periodic explosions, in a plausible waning explosive phase.
April-May 2008. On 2 April ground deformation was stable with small and continued rapid fluctuations due to the repeating sealing and rupturing of the shallow conduit. Seismicity generally became moderate, but still generally dominated by low-frequency earthquakes. Activity was no longer preceded by notable explosions. The vent would be clear for a period of time. On 7 April a high-frequency event occurred NE of the caldera. On 9-10 April 9 mm of uplift occurred. On 11 April moderate ashfall was noted in Rabaul Town. Fine ashfall occurred in Matupit island. Seismic activity returned to a high level dominated by low-frequency earthquakes. On 11 April a total of 1,000 earthquakes were recorded. At 1100 on 22 April a modest explosion occurred. On 23 April 1-2 mm of non compacted flocculated pale ash was deposited in a sector from Malaguna E to S of Matupit. The cone was obscured to vision. On 28 April ground deformation was in a deflated but stable state. Ashfalls on 2 May left 3-4 cm in eastern Rabaul and 1-2 cm in western Rabaul.
Geologic Background. The low-lying Rabaul caldera on the tip of the Gazelle Peninsula at the NE end of New Britain forms a broad sheltered harbor utilized by what was the island's largest city prior to a major eruption in 1994. The outer flanks of the asymmetrical shield volcano are formed by thick pyroclastic-flow deposits. The 8 x 14 km caldera is widely breached on the east, where its floor is flooded by Blanche Bay and was formed about 1,400 years ago. An earlier caldera-forming eruption about 7,100 years ago is thought to have originated from Tavui caldera, offshore to the north. Three small stratovolcanoes lie outside the N and NE caldera rims. Post-caldera eruptions built basaltic-to-dacitic pyroclastic cones on the caldera floor near the NE and W caldera walls. Several of these, including Vulcan cone, which was formed during a large eruption in 1878, have produced major explosive activity during historical time. A powerful explosive eruption in 1994 occurred simultaneously from Vulcan and Tavurvur volcanoes and forced the temporary abandonment of Rabaul city.
Information Contacts: Steve Saunders and Herman Patia, Rabaul Volcanological Observatory (RVO), Department of Mining, Private Mail Bag, Port Moresby Post Office, National Capitol District, Papua New Guinea (URL: http://www.pngndc.gov.pg/); NASA Earth Observatory (URL: http://earthobservatory.nasa.gov/).
Sangay
Ecuador
2.005°S, 78.341°W; summit elev. 5286 m
All times are local (unless otherwise noted)
Conspicuous ash plumes, October 2006-December 2007
Our previous report on Sangay (BGVN 21:03) described occasional, but sometimes conspicuous, steam and/or ash plumes between January 2004 and January 2006. The current report continues coverage of plume emissions through December 2007.
Sangay has continued to erupt, sending ash plumes up to an altitude of about 11 km. A summary of plume activity is indicated in table 1. The information is from the Washington Volcanic Ash Advisory Center (VAAC), and is based on reports from the Guayaquil Meteorologic Watch Office, pilot reports, satellite imagery, and the Instituto Geofísico-Departamento de Geofísica (Escuela Politécnica Nacional). We did not receive any report of activity during the period February 2006 through September 2006, or during the first three months of 2008.
Table 1. Ash plume advisories about Sangay activity, October 2006 through December 2007. Courtesy of the Washington VAAC.
| Date |
Altitude (km) |
Bearing |
Remarks |
| 11 Oct 2006 |
2.7 |
W |
-- |
| 21 Oct 2006 |
6.7 |
-- |
-- |
| 22 Nov 2006 |
-- |
WNW |
Hotspot visible on satellite imagery |
| 02 Dec 2006 |
8.5 |
SW |
-- |
| 23 Dec 2006 |
7.6 |
-- |
-- |
| 01 Jan 2007 |
5.2 |
-- |
-- |
| 14 Jan 2007 |
6.1 |
SW |
-- |
| 28 Jan 2007 |
6.4 |
-- |
-- |
| 06 Feb 2007 |
9.1 |
SW |
-- |
| 06-10 Feb 2007 |
6.1-9 |
Several |
Hotspot at summit visible on satellite imagery |
| 13 Feb 2007 |
-- |
-- |
Hotspot at summit visible on satellite imagery |
| 23 Feb 2007 |
10.7 |
S |
-- |
| 25 Feb 2007 |
6.4 |
SW |
-- |
| 28 Feb 2007 |
7.6 |
-- |
-- |
| 02 Mar 2007 |
-- |
-- |
Weak hotspot visible on satellite imagery |
| 05 Mar 2007 |
5.2-6.1 |
W |
-- |
| 12-13 Mar 2007 |
7 |
W |
Hotspot visible on satellite imagery |
| 17 Mar 2007 |
5.2 |
-- |
Hotspot visible on satellite imagery |
| 04 May 2007 |
5.2-7.6 |
-- |
-- |
| 05 May 2007 |
-- |
W |
Possible narrow plume on satellite imagery |
| 24 May 2007 |
7.3 |
-- |
-- |
| 03 Jul 2007 |
5.2-7.9 |
W |
-- |
| 23 Jul 2007 |
5.5 |
W |
Ash not detected by satellite imagery |
| 24 Jul 2007 |
5.2 |
SW |
-- |
| 28 Jul 2007 |
6.7-8.2 |
-- |
Weak hotspot visible on satellite imagery, but ash not detected |
| 02 Aug 2007 |
5.5 |
W |
Ash not detected by satellite imagery |
| 19 Aug 2007 |
-- |
-- |
Clouds inhibited satellite imagery |
| 08-09 Sep 2007 |
-- |
-- |
Ash not detected by satellite imagery |
| 12 Oct 2007 |
7 |
W |
-- |
| 26 Dec 2007 |
6.1 |
SW |
-- |
| 26-27 Dec 2007 |
-- |
-- |
Thermal anomaly seen on satellite imagery |
According to a report from the Instituto Geofísico, activity at Sangay increased at the end of 2006 through the beginning of 2007. They reported that a thermal anomaly was detected by satellite imagery during several days in December 2006. During that time, mountain guides near the volcano observed the fall of incandescent rocks down the volcano's flanks at night and a recent deposit of ash that was sufficiently deep to affect birds, rabbits, and other small animals. The report indicated that the Instituto Geofísico has not installed monitoring instrumentation near Sangay because of a significant logistics problem in maintaining them in this inhospitable area, and also because the area is uninhabited and thus poses no direct human risk. However, the report notes that because ash emissions from Sangay may pose problems for aircraft in the S, SE, and SW parts of the country, the Instituto maintains contact with the civil aviation authority.
Geologic Background. The isolated Sangay volcano, located east of the Andean crest, is the southernmost of Ecuador's volcanoes and its most active. The steep-sided, glacier-covered, dominantly andesitic volcano grew within the open calderas of two previous edifices which were destroyed by collapse to the east, producing large debris avalanches that reached the Amazonian lowlands. The modern edifice dates back to at least 14,000 years ago. It towers above the tropical jungle on the east side; on the other sides flat plains of ash have been eroded by heavy rains into steep-walled canyons up to 600 m deep. The earliest report of an eruption was in 1628. Almost continuous eruptions were reported from 1728 until 1916, and again from 1934 to the present. The almost constant activity has caused frequent changes to the morphology of the summit crater complex.
Information Contacts: Washington Volcanic Ash Advisory Center, Satellite Analysis Branch (SAB), NOAA/NESDIS E/SP23, NOAA Science Center Room 401, 5200 Auth Rd, Camp Springs, MD 20746, USA (URL: http://www.ospo.noaa.gov/Products/atmosphere/vaac/); P. Ramón, Instituto Geofísico-Departamento de Geofísica (IG), Escuela Politécnica Nacional, Casilla 17-01-2759, Quito, Ecuador.
Ulawun (Papua New Guinea) — March 2008 Cite this Report
Ulawun
Papua New Guinea
5.05°S, 151.33°E; summit elev. 2334 m
All times are local (unless otherwise noted)
Mostly gentle emissions of white vapor; low-frequency earthquakes
This report updates activity through March 2008. Our last overview of Ulawun (BGVN 32:02) reported little activity of note other than frequent ash plumes from March 2006 to January 2007. Typical activity at Ulawun has consisted of gentle emission of thin-to-thick white vapor from the summit Based on satellite imagery and information from the Rabaul Volcano Observatory (RVO), the Darwin VAAC reported that diffuse plumes from Ulawun drifted N on 28 April 2007. On 1 May, an ash plume rose to an altitude of 4 km and drifted W.
[On 29 May 2007, RVO reported thick white vapor; there were no audible noises or night glow.] The two N valley vents remained quiet. Seismicity was at a low to moderate level dominated by low-frequency earthquakes. Through May, between 500 and 1,265 low frequency events were recorded daily with the most recorded on 28 and 29 May.
Similar conditions continued through the end of 2007 with only minor incidental variation. On 6 June, the elevated characteristics of the forceful emissions of 28-29 May were repeated. The daily total number of low-frequency earthquakes fluctuated between 400 and 1,042 events with the highest numbers recorded on 24 June (1,032) and 8 August (1,042). A high-frequency earthquake was recorded on 1 August. On 3 September forceful emissions were recorded sending the vapor plume ~ 1 km above the summit before being blown SE. On 25 December, based on satellite imagery observations, the Darwin VAAC reported that an ash-and-steam plume from Ulawun drifted W.
Low levels of activity continued from January through March 2008. Emissions consisted of thin to thick white vapor and with no audible noises and no glow visible at night. Seismicity continued at moderate level dominated by low frequency volcanic earthquakes. Variable amounts of white fume were emitted, sometimes forcefully. The two N valley vents continued to remain quiet.
Geologic Background. The symmetrical basaltic-to-andesitic Ulawun stratovolcano is the highest volcano of the Bismarck arc, and one of Papua New Guinea's most frequently active. The volcano, also known as the Father, rises above the N coast of the island of New Britain across a low saddle NE of Bamus volcano, the South Son. The upper 1,000 m is unvegetated. A prominent E-W escarpment on the south may be the result of large-scale slumping. Satellitic cones occupy the NW and E flanks. A steep-walled valley cuts the NW side, and a flank lava-flow complex lies to the south of this valley. Historical eruptions date back to the beginning of the 18th century. Twentieth-century eruptions were mildly explosive until 1967, but after 1970 several larger eruptions produced lava flows and basaltic pyroclastic flows, greatly modifying the summit crater.
Information Contacts: Herman Patia, Rabaul Volcano Observatory (RVO), P. O. Box 386, Rabaul, Papua New Guinea; Darwin Volcanic Ash Advisory Centre (VAAC), Commonwealth Bureau of Meteorology, Northern Territory Regional Office, PO Box 40050, Casuarina, NT 0811, Australia (URL: http://www.bom.gov.au/info/vaac/); US Air Force Weather Agency (AFWA), Satellite Applications Branch, Offutt AFB, NE 68113-4039, USA; Hawai'i Institute of Geophysics and Planetology (HIGP) Thermal Alerts System, School of Ocean and Earth Science and Technology (SOEST), Univ. of Hawai'i, 2525 Correa Road, Honolulu, HI 96822, USA (URL: http://modis.higp.hawaii.edu/); James Mori, Disaster Prevention Research Institute, Kyoto University, Uji, Kyoto 611-0011, Japan (URL: http://eqh.dpri.kyoto-u.ac.jp/~mori/).