Recently Published Bulletin Reports
Ambrym (Vanuatu) New effusive eruption during January 2024
Popocatepetl (Mexico) Daily gas-and-ash emissions, ashfall, and occasional explosions during August-November 2023
Reventador (Ecuador) Daily explosions, gas-and-ash emissions, and incandescent avalanches during August-November 2023
Erta Ale (Ethiopia) Strong lava lake activity and lava overflows during June-November 2023
Ubinas (Peru) New eruption with explosions and ash plumes during June-December 2023
Kanaga (United States) Small explosion on 18 December 2023
Klyuchevskoy (Russia) New eruption consisting of Strombolian activity, lava flows and fountains, and ash plumes during June-December 2023
Agung (Indonesia) Three eruptive events reported in April, May, and December 2022
Saunders (United Kingdom) Persistent thermal anomalies from the summit crater lava lake during February 2023-January 2024
Tengger Caldera (Indonesia) Minor ash emission in December 2023; persistent weak thermal anomaly in the Bromo crater
Shishaldin (United States) New eruption with significant Strombolian explosions, ash plumes, and ashfall
Ioto (Japan) New eruption with discolored water, ejecta, and floating pumice during October-December 2023
Ambrym (Vanuatu) — February 2024  Cite this Report
Ambrym
Vanuatu
16.25°S, 168.12°E; summit elev. 1334 m
All times are local (unless otherwise noted)
New effusive eruption during January 2024
Ambrym contains a 12-km-wide caldera and is part of the New Hebrides Arc, located in the Vanuatu archipelago. The two currently active craters within the caldera are Benbow and Marum, both of which have produced lava lakes, explosions, lava flows, and gas-and-ash emissions. The previous eruption occurred during late January 2022 and was characterized by ash plumes, sulfur dioxide plumes, and crater incandescence (BGVN 47:05). This report covers a new, short eruption during January 2024, which consisted of a lava effusion and an explosion. Information comes from the Vanuatu Meteorology and Geohazards Department (VMGD) and satellite data.
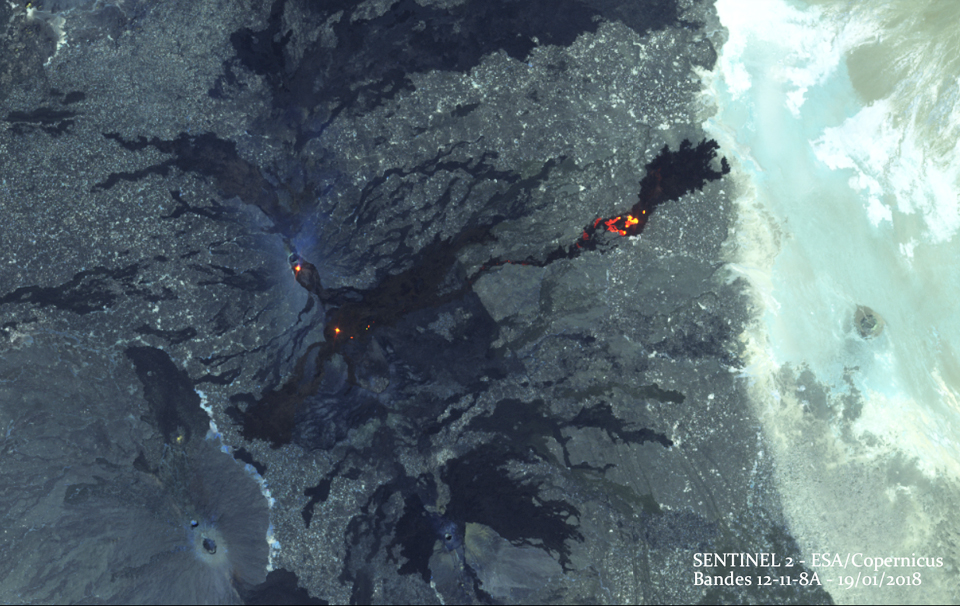
VMGD reported that at 2217 on 13 January an eruption began at Benbow Crater, based on webcam and seismic data. The eruption was characterized by a loud explosion, intense crater incandescence (figure 55), and gas-and-steam emissions. As a result, the Volcano Alert Level (VAL) was raised from 1 to 3 (on a scale of 0-5). A lava flow was reported in Benbow Crater, which lasted for four days. Satellite data showed that 1,116 tons of sulfur dioxide per day (t/d) were emitted on 14 January (figure 56). During the morning of 15 January, ground reports noted loud explosions and minor earthquakes. The sulfur dioxide flux on 15 January was 764 t/d. During 15-17 January activity decreased according to webcam images, seismic data, and field observations. No sulfur dioxide emissions were reported after 15 January. Gas-and-ash emissions also decreased, although they continued to be observed through 31 January, and crater incandescence was less intense (figure 57). The VAL was lowered to 2 on 17 January.
Geologic Background. Ambrym is a large basaltic volcano with a 12-km-wide caldera formed during a major Plinian eruption with dacitic pyroclastic flows about 1,900 years ago. A thick, almost exclusively pyroclastic sequence, initially dacitic then basaltic, overlies lava flows of a pre-caldera shield volcano. Post-caldera eruptions, primarily from Marum and Benbow cones, have partially filled the caldera floor and produced lava flows that ponded on the floor or overflowed through gaps in the caldera rim. Post-caldera eruptions have also formed a series of scoria cones and maars along a fissure system oriented ENE-WSW. Eruptions have been frequently reported since 1774, though mostly limited to extra-caldera eruptions that would have affected local populations. Since 1950 observations of eruptive activity from cones within the caldera or from flank vents have occurred almost yearly.
Information Contacts: Geo-Hazards Division, Vanuatu Meteorology and Geo-Hazards Department (VMGD), Ministry of Climate Change Adaptation, Meteorology, Geo-Hazards, Energy, Environment and Disaster Management, Private Mail Bag 9054, Lini Highway, Port Vila, Vanuatu (URL: http://www.vmgd.gov.vu/, https://www.facebook.com/VanuatuGeohazardsObservatory/); Copernicus Browser, Copernicus Data Space Ecosystem, European Space Agency (URL: https://dataspace.copernicus.eu/browser/).
Popocatepetl (Mexico) — January 2024 Cite this Report
Popocatepetl
Mexico
19.023°N, 98.622°W; summit elev. 5393 m
All times are local (unless otherwise noted)
Daily gas-and-ash emissions, ashfall, and occasional explosions during August-November 2023
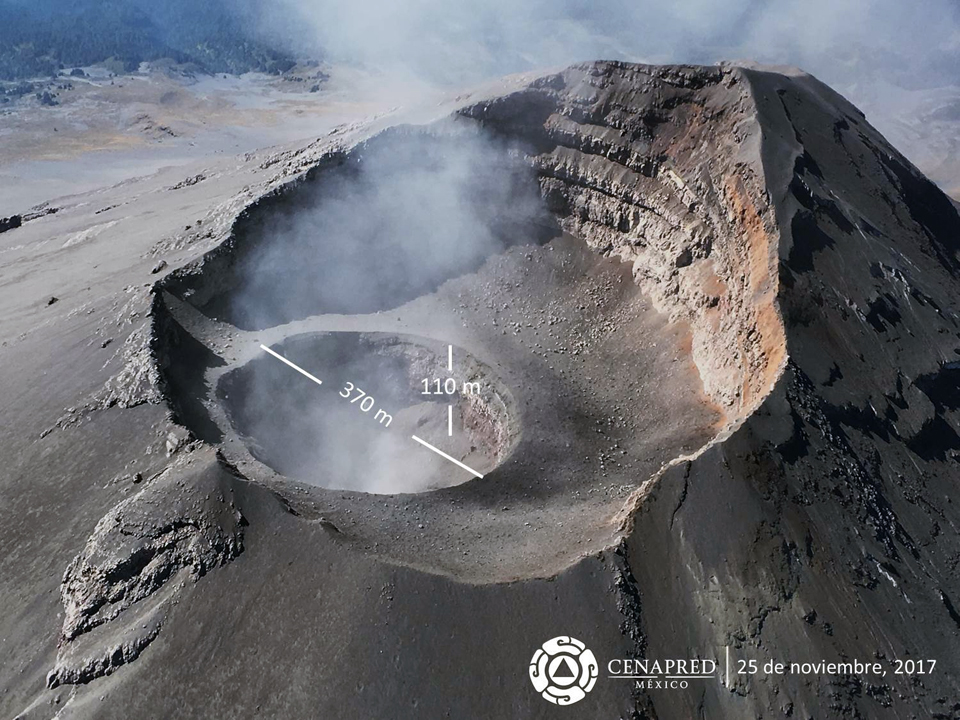
Popocatépetl, located 70 km SE of Mexica City, Mexico, contains a 400 x 600 m-wide summit crater. Records of activity date back to the 14th century; three Plinian eruptions, the most recent of which took place about 800 CE, have occurred since the mid-Holocene, accompanied by pyroclastic flows and voluminous lahars that swept basins below the volcano. The current eruption period began in January 2005, characterized by numerous episodes of lava dome growth and destruction within the summit crater. Recent activity has been characterized by daily gas-and-ash emissions, ashfall, and explosions (BGVN 48:09). This report covers similar activity during August through November 2023, according to daily reports from Mexico's Centro Nacional de Prevención de Desastres (CENAPRED) and various satellite data.
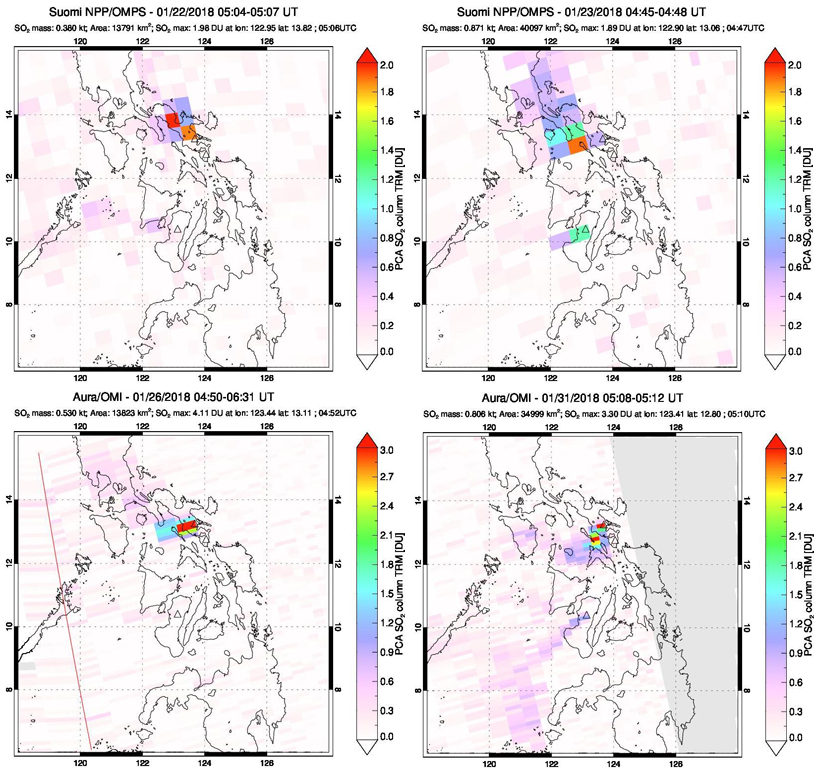
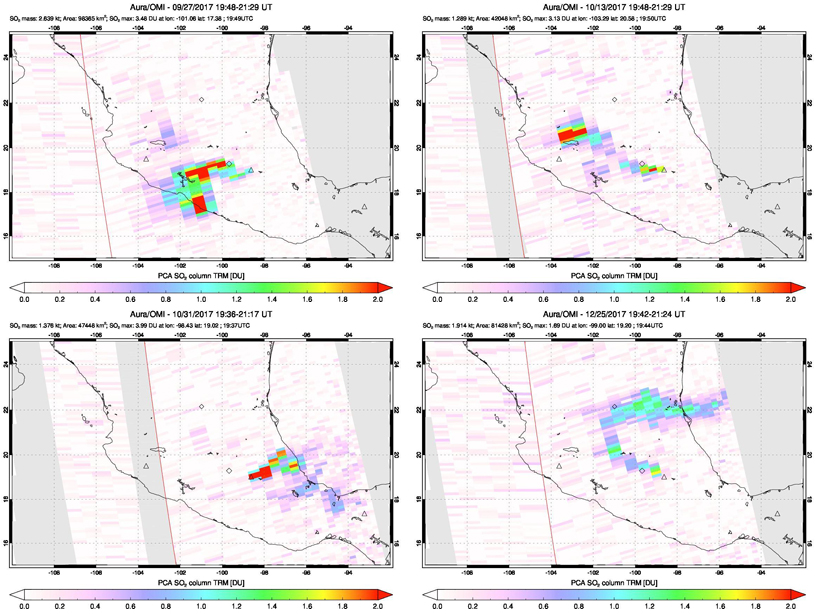
Daily gas-and-steam emissions, containing some amount of ash, continued during August through November 2023. CENAPRED reported the number of low-intensity gas-and-ash emissions or “exhalations” and the minutes of tremor, which sometimes included harmonic tremor in their daily reports (figure 220). A total of 21 volcano-tectonic (VT) tremors were detected throughout the reporting period. The average number of exhalations was 117 per day, with a maximum number of 640 on 25 September. Frequent sulfur dioxide plumes that exceeded two Dobson Units (DU) and drifted in multiple directions were visible in satellite data from the TROPOMI instrument on the Sentinel-5P satellite (figure 221).
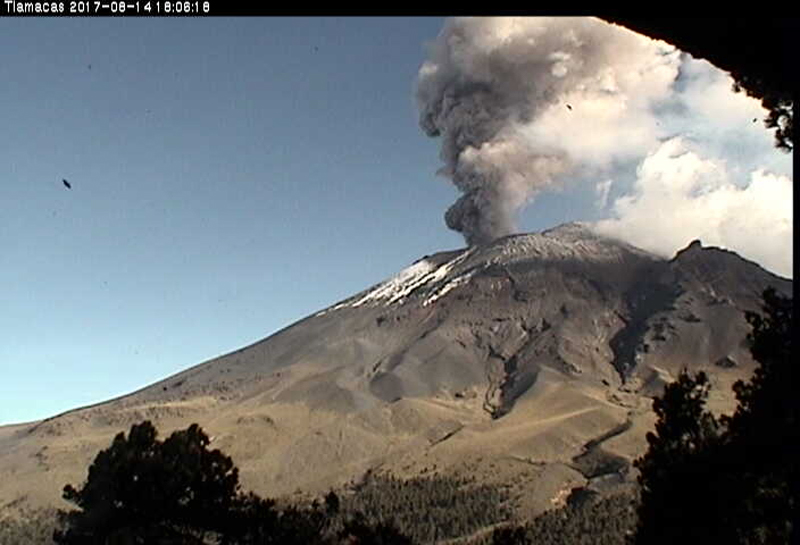
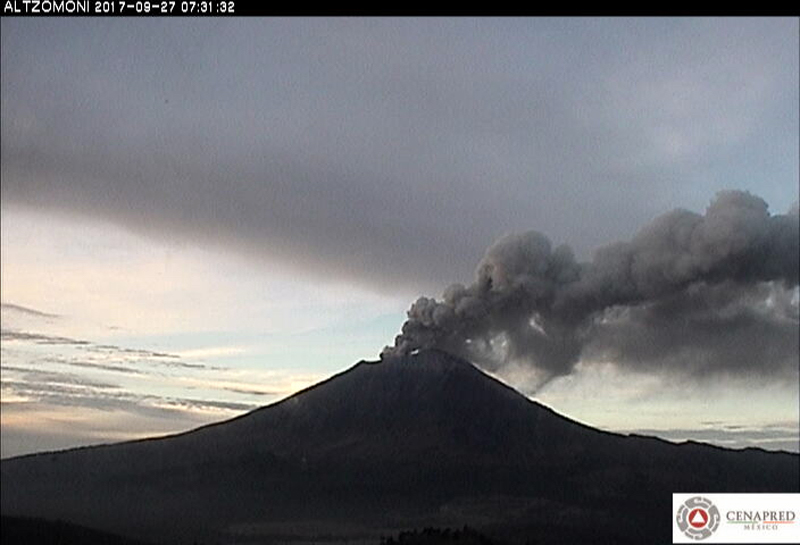
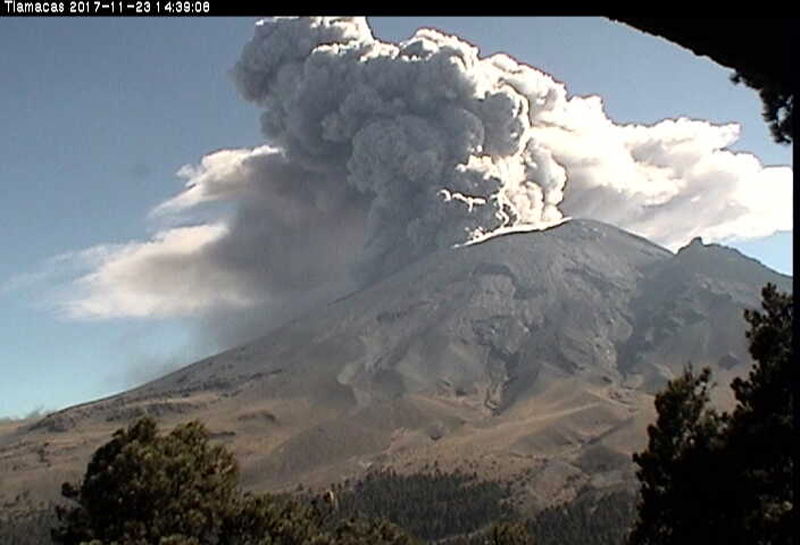
Activity during August was relatively low and mainly consisted of occasional explosions, ash emissions, and light ashfall. There were 30 explosions (25 minor explosions and four moderate explosions), and nine VT-type events detected. An average number of 60 exhalations occurred each day, which mostly consisted of water vapor, volcanic gases, and a small amount of ash. On 2 August the National Center for Communications and Civil Protection Operations (CENACOM) reported light ashfall in Ocuituco (22 km SW), Yecapixtla (31 km SW), Cuautla (43 km SW), and Villa de Ayala (47 km SW). On 7 August light ashfall was observed in Atlautla (16 km W). A minor explosion at 0305 on 11 August was accompanied by crater incandescence. Explosions at 0618 on 13 August produced a gas-and-ash plume that rose above the summit, and at 0736 another explosion produced a puff of gas-and-ash (figure 222). Two minor explosions were detected at 0223 and 0230 on 16 August that generated eruptive columns with low ash content rising 800 m and 700 m above the crater, respectively. On 24 August an eruptive event lasted 185 minutes and consisted of light ash emissions that did not exceed 300 m above the crater. According to the Washington VAAC, ash plumes identified in daily satellite images rose to 4.6-7.6 km altitude and drifted in multiple directions, the highest of which occurred on 29 August.
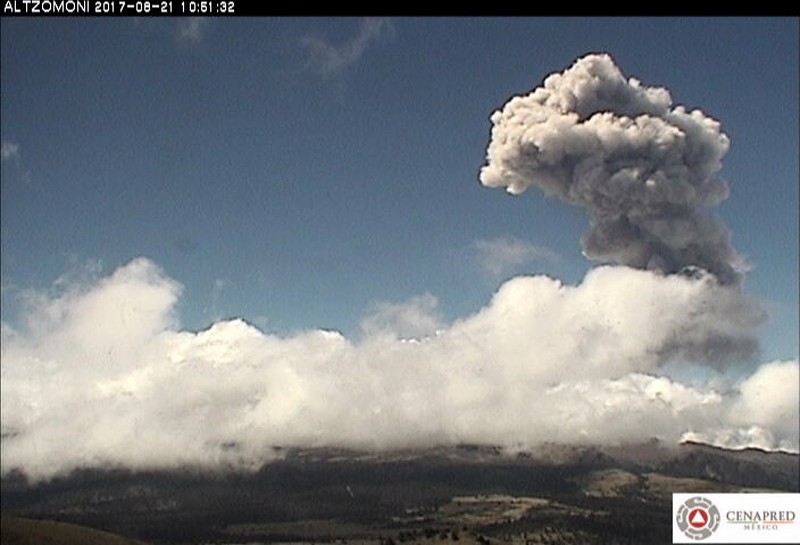
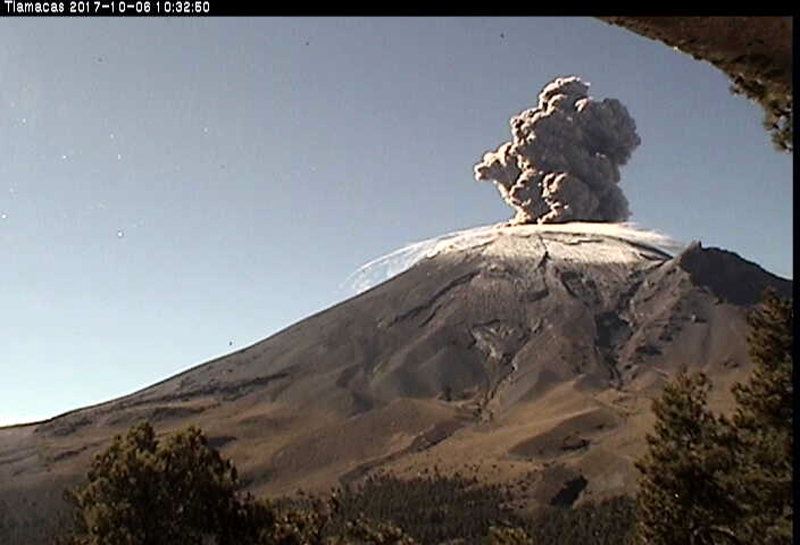
There was an average of 156 exhalations each day during September, a monthly total of seven VT-type events, and 29 explosions, 14 of which were minor and nine of which were moderate. A gas-and-ash plume rose to 2 km above the summit and drifted WSW at 1216 on 1 September. CENACOM reported at 1510 observations of ashfall in Ozumba (18 km W), Atlautla, Tepetlixpa (20 km W), and Ecatzingo (15 km SW), as well as in Morelos in Cuernavaca (65 km WSW), Temixco (67 km WSW), Huitzilac (67 km W), Tepoztlán (49 km W), and Jiutepec (59 km SW). The next day, gas-and-ash plumes rose to 2 km above the summit (figure 223). At 1100 ashfall was reported in Amecameca (15 km NW), Ayapango (24 km WNW), Ozumba, Juchitepec, Tenango del Aire (29 km WNW), Atlautla, and Tlalmanalco (27 km NW). A gas-and-ash plume rose to 1 km above the summit and drifted WNW at 1810. During 5-6, 8-9, 12, 14, 19, and 24-25 September ashfall was reported in Amecameca, Atlautla, Ozumba, Tenango del Aire, Tepetlixpa, Juchitepec, Cuernavaca, Ayala, Valle de Chalco (44 km NW), Ixtapaluca (42 km NW), La Paz (50 km NW), Chimalhuacán, Ecatepec, Nezahualcóyotl (60 km NW), Xochimilco (53 km SE), Huayapan, Tetela del Volcano (20 km SW), Yautepec (50 km WSW), Cuautla (43 km SW), Yecapixtla (30 km SW) and possibly Tlaltizapán (65 km SW), Tlaquiltenango, and Tepalcingo. According to the Washington VAAC, ash plumes identified in daily satellite images rose to 5.8-9.1 km altitude and drifted in multiple directions, the highest of which was identified during 1-2 August.
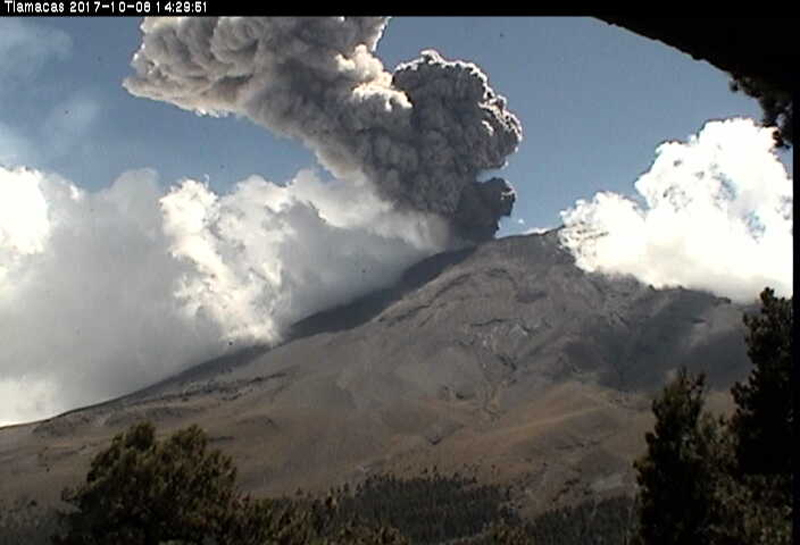
Activity during October and November was relatively low. An average of 179 exhalations consisting of gas-and-steam and ash emissions were reported during October and 73 during November. Only one VT-type event and two explosions were detected during October and four VT-type events and one explosion during November. A satellite image from 0101 on 14 October showed ash fanning out to the NW at 6.7 km altitude and an image from 0717 showed a continuously emitted ash plume drifting WNW and NW at the same altitude. Ash emissions at 1831 on 14 October were ongoing and visible in webcam images slowly drifting W at an altitude of 6.4 km altitude (figure 224). On 24 October a tremor sequence began at 0310 that generated a gas-and-ash plume that rose 800 m above the summit and drifted W. Another tremor sequence occurred during 1305-1900 on 25 October that consisted of continuous ash emissions. Ash plumes identified in daily satellite images rose to 5.5-8.5 km altitude and drifted in different directions during October, according to the Washington VAAC. The highest ash plume was detected on 23 October. During 10-13 November ash plumes rose to 6.7 km altitude and drifted N, NNW, NE, and NW. On 13 November a M 1.5 VT-type event was detected at 0339 and light ashfall was reported in Amecameca, Cocotitlán (34 km NW), and Tenango del Aire, and Ocuituco. On 14 November ash plumes rose to 6 km altitude and drifted N, NE, and SE and light ashfall was reported in Cuernavaca (64 km W). The Washington VAAC reported frequent ash plumes that rose to 5.8-7.9 km altitude and drifted in several directions; the highest ash plume was recorded on 28 November.
Satellite data. MODIS thermal anomaly data provided through MIROVA (Middle InfraRed Observation of Volcanic Activity) showed frequent low-to-moderate thermal anomalies during the reporting period (figure 225). The intensity of the anomalies was lower compared to previous months. According to data from MODVOLC thermal alerts, a total of ten hotspots were detected at the summit crater on 2 August and 2, 4, 9, 19, and 26 September. Thermal activity in the summit crater was visible in infrared satellite data and was sometimes accompanied by ash plumes, as shown on 17 November (figure 226).
Geologic Background. Volcán Popocatépetl, whose name is the Aztec word for smoking mountain, rises 70 km SE of Mexico City to form North America's 2nd-highest volcano. The glacier-clad stratovolcano contains a steep-walled, 400 x 600 m wide crater. The generally symmetrical volcano is modified by the sharp-peaked Ventorrillo on the NW, a remnant of an earlier volcano. At least three previous major cones were destroyed by gravitational failure during the Pleistocene, producing massive debris-avalanche deposits covering broad areas to the south. The modern volcano was constructed south of the late-Pleistocene to Holocene El Fraile cone. Three major Plinian eruptions, the most recent of which took place about 800 CE, have occurred since the mid-Holocene, accompanied by pyroclastic flows and voluminous lahars that swept basins below the volcano. Frequent historical eruptions, first recorded in Aztec codices, have occurred since Pre-Columbian time.
Information Contacts: Centro Nacional de Prevención de Desastres (CENAPRED), Av. Delfín Madrigal No.665. Coyoacan, México D.F. 04360, México (URL: http://www.cenapred.unam.mx/, Daily Report Archive https://www.gob.mx/cenapred/archivo/articulos); Washington Volcanic Ash Advisory Center (VAAC), Satellite Analysis Branch (SAB), NOAA/NESDIS OSPO, NOAA Science Center Room 401, 5200 Auth Rd, Camp Springs, MD 20746, USA (URL: www.ospo.noaa.gov/Products/atmosphere/vaac, archive at: http://www.ssd.noaa.gov/VAAC/archive.html); MIROVA (Middle InfraRed Observation of Volcanic Activity), a collaborative project between the Universities of Turin and Florence (Italy) supported by the Centre for Volcanic Risk of the Italian Civil Protection Department (URL: http://www.mirovaweb.it/); Hawai'i Institute of Geophysics and Planetology (HIGP) - MODVOLC Thermal Alerts System, School of Ocean and Earth Science and Technology (SOEST), Univ. of Hawai'i, 2525 Correa Road, Honolulu, HI 96822, USA (URL: http://modis.higp.hawaii.edu/); NASA Global Sulfur Dioxide Monitoring Page, Atmospheric Chemistry and Dynamics Laboratory, NASA Goddard Space Flight Center (NASA/GSFC), 8800 Greenbelt Road, Goddard, Maryland, USA (URL: https://so2.gsfc.nasa.gov/); Copernicus Browser, Copernicus Data Space Ecosystem, European Space Agency (URL: https://dataspace.copernicus.eu/browser/).
Reventador (Ecuador) — January 2024 Cite this Report
Reventador
Ecuador
0.077°S, 77.656°W; summit elev. 3562 m
All times are local (unless otherwise noted)
Daily explosions, gas-and-ash emissions, and incandescent avalanches during August-November 2023
Volcán El Reventador, located in Ecuador, is a stratovolcano with a 4-km-wide avalanche scarp open to the E that was formed by edifice collapse. The largest recorded eruption took place in 2002 producing a 17-km-high eruption column, pyroclastic flows that traveled as far as 8 km, and lava flows from summit and flank vents. Recorded eruptions date back to the 16th century and have been characterized by explosive events, lava flows, ash plumes, and lahars. Frequent lahars have built deposits on the scarp slope. The current eruption period began in July 2008 and has recently been characterized daily explosions, gas-and-ash emissions, and block avalanches (BGVN 48:08). This report covers similar activity during August through November 2023 using daily reports from Ecuador's Instituto Geofisico (IG-EPN) and satellite data.
During August through November 2023, IG-EPN reported daily explosions, gas-and-ash plumes that rose as high as 1.3 km above the crater, and frequent crater incandescence, often accompanied by incandescent block avalanches that affected one or multiple flanks. More daily explosions were detected during November, with an average total of 46 per day.
Table 19. Monthly summary of explosions and plume heights recorded at Reventador from August through November 2023. Data could not be collected for 29-30 September 2023 and 6-23 October 2023. Data courtesy of IG-EPN (August-November 2023 daily reports).
| Month |
Average number of explosions per day |
Max plume height above the crater rim (km) |
| Aug 2023 |
32 |
1.3 |
| Sep 2023 |
30 |
1 |
| Oct 2023 |
31 |
1.3 |
| Nov 2023 |
46 |
1.2 |
Activity during August consisted of 6-75 daily explosions, nighttime crater incandescence, and incandescent avalanches of material. Frequent seismicity was mainly characterized by long-period (LP) events, harmonic tremor (TRARM), tremor-type (TRE), and volcano tectonic (VT)-type events. Daily gas-and-ash emissions rose 200-1,300 m above the summit and drifted W, SW, NW, NE, N, and E, based on webcam and satellite images. The Washington VAAC also reported occasional ash plumes that rose 400-1,600 m above the crater and drifted NW. Avalanches of incandescent material were reported during 1-2, 6-7, 9-14, 16-17, 18-21, and 26-29 August, which traveled 500-900 m below the crater and affected multiple flanks (figure 180). During 24-25 August incandescent material was ejected 300 m above the crater.
Gas-and-ash emissions and seismicity characterized by LP, VT, TRARM, and TRE-type events continued during September; data were not available for 29-30 September. Daily gas-and-ash emissions rose 200-1,000 m above the crater and generally drifted W, NW, and SW (figure 181). Near-daily explosions ranged from 16-53 per day, often accompanied by incandescent avalanches, which affected one or multiple flanks and traveled 100-800 m below the crater. During 2-3 September incandescent material was ejected 200 m above the crater and was accompanied by blocks rolling down the flanks. During 16-17 September incandescent material was ejected 100-200 m above the crater and avalanches descended 600 m below the crater. During 21-22 and 24-26 September incandescent material was ejected 100-300 m above the crater. According to the Washington VAAC, ash plumes rose 700 m above the crater and drifted SW, W, and NW on 3, 16, and 20 September, respectfully.
During October, daily explosions, gas-and-ash plumes, and crater incandescence continued, with 16-40 explosions recorded each day (figure 182); data was not available for 6-23 October. Seismicity consisted of LP, TRE, and TRARM-type events. Gas-and-ash emissions rose 200-1,000 m above the crater and drifted W, SW, NW, SSW, NNW, and NE. The Washington VAAC reported that ash plumes rose 1-1.3 km above the crater and drifted W, SW, and NW during 1-5 October. During 30 September-1 October incandescent avalanches descended 700 m below the crater. Ejected material rose 200 m above the crater during 2-5 October and was accompanied by avalanches of material that traveled 250-600 m below the crater rim; incandescent avalanches were also reported during 23-29 October.
Daily explosions, LP, TRARM, VT, and TRE-type events, crater incandescence, and avalanches of material continued during November. There were 26-62 daily explosions detected throughout the month. Gas-and-ash emissions rose 300-1,200 m above the crater and drifted in different directions (figure 183). The Washington VAAC reported that ash plumes rose 700-1,620 m above the crater and drifted NW, W, WNW, SW, E, SE, and ESE. Frequent incandescent avalanches descended 500-1,000 m below the crater. Explosions ejected material 100-300 m above the crater during 4-7, 11-12, and 19-23 November.
Satellite data. MIROVA (Middle InfraRed Observation of Volcanic Activity) analysis of MODIS satellite data showed intermittent thermal anomalies of low-to-moderate power (figure 184). Thermal activity mainly consisted of incandescent avalanches descending the flanks due to the frequently detected explosions. The MODVOLC hotspot system identified a total of ten hotspots on 3 August, 7, 18, 12, 22, and 28 September, and 7, 9, and 19 November.
Geologic Background. Volcán El Reventador is the most frequently active of a chain of Ecuadorian volcanoes in the Cordillera Real, well east of the principal volcanic axis. The forested, dominantly andesitic stratovolcano has 4-km-wide avalanche scarp open to the E formed by edifice collapse. A young, unvegetated, cone rises from the amphitheater floor to a height comparable to the rim. It has been the source of numerous lava flows as well as explosive eruptions visible from Quito, about 90 km ESE. Frequent lahars in this region of heavy rainfall have left extensive deposits on the scarp slope. The largest recorded eruption took place in 2002, producing a 17-km-high eruption column, pyroclastic flows that traveled up to 8 km, and lava flows from summit and flank vents.
Information Contacts: Instituto Geofísico, Escuela Politécnica Nacional (IG-EPN), Casilla 17-01-2759, Quito, Ecuador (URL: http://www.igepn.edu.ec/); MIROVA (Middle InfraRed Observation of Volcanic Activity), a collaborative project between the Universities of Turin and Florence (Italy) supported by the Centre for Volcanic Risk of the Italian Civil Protection Department (URL: http://www.mirovaweb.it/); Hawai'i Institute of Geophysics and Planetology (HIGP) - MODVOLC Thermal Alerts System, School of Ocean and Earth Science and Technology (SOEST), Univ. of Hawai'i, 2525 Correa Road, Honolulu, HI 96822, USA (URL: http://modis.higp.hawaii.edu/).
Erta Ale (Ethiopia) — January 2024 Cite this Report
Erta Ale
Ethiopia
13.601°N, 40.666°E; summit elev. 585 m
All times are local (unless otherwise noted)
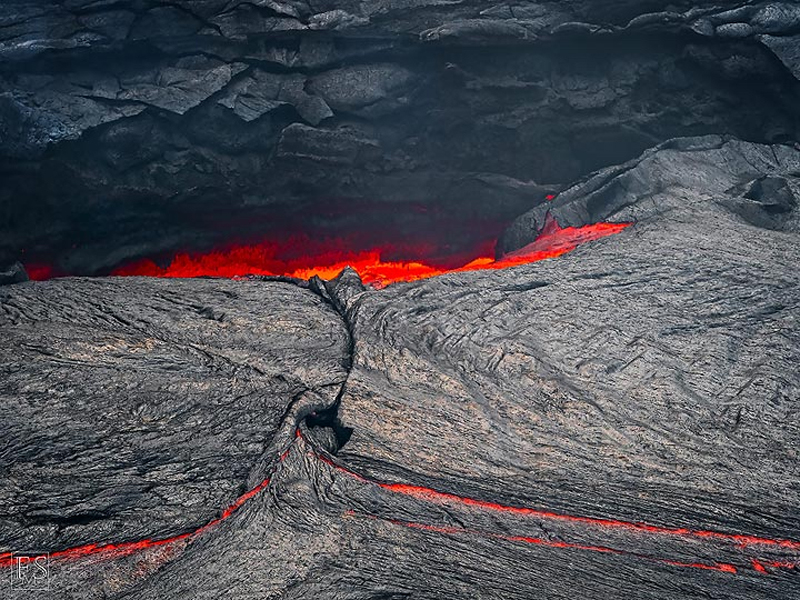
Strong lava lake activity and lava overflows during June-November 2023
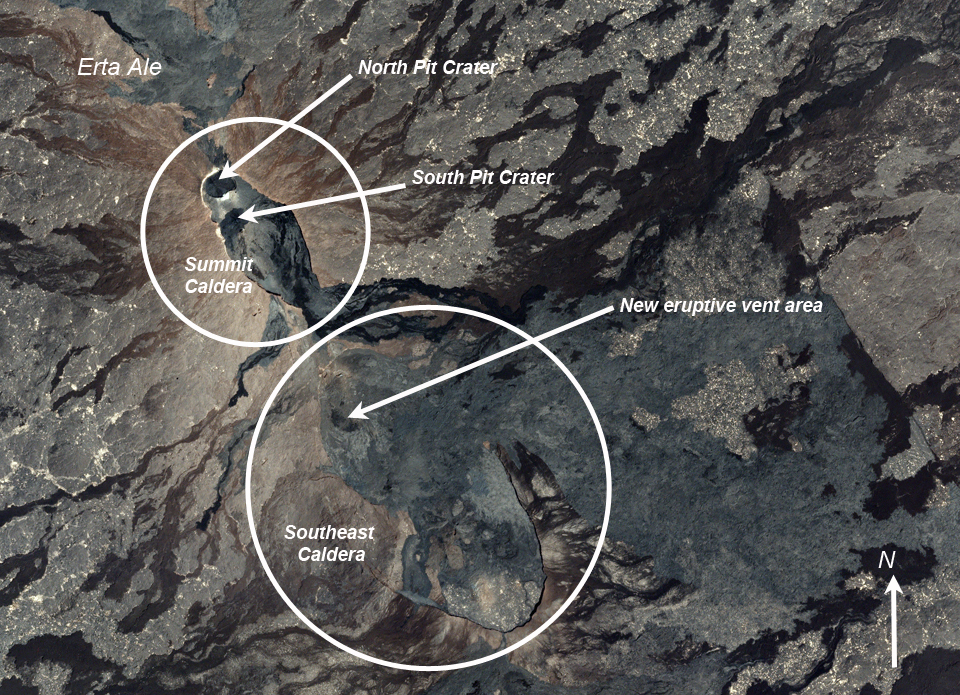
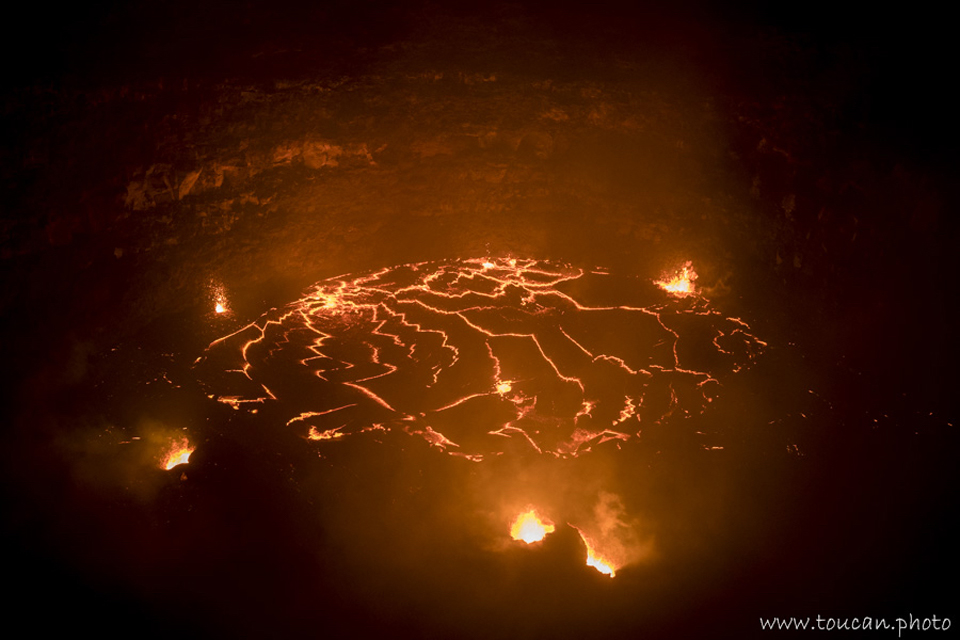
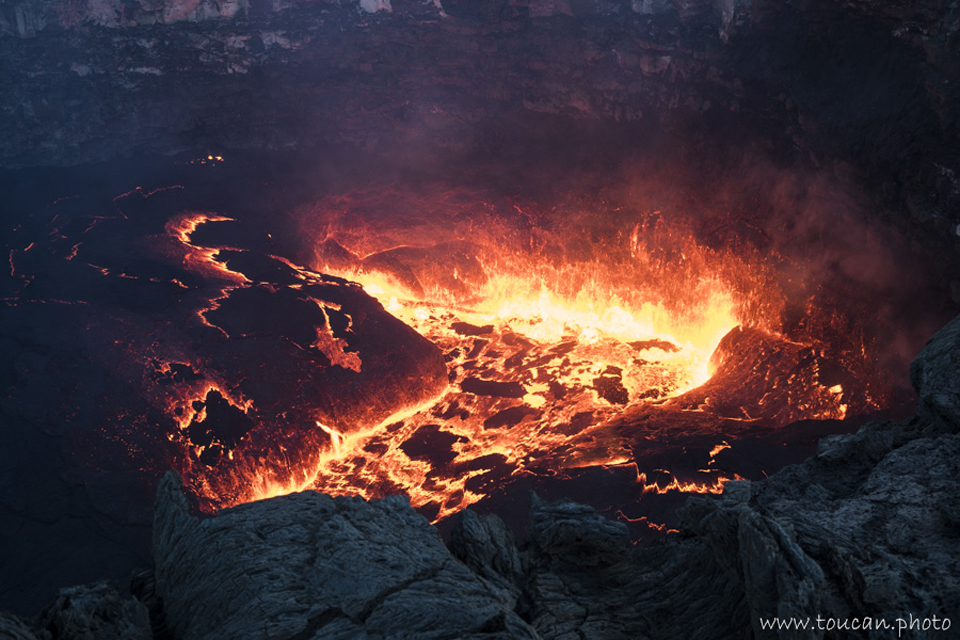
Erta Ale in Ethiopia has a 50-km-wide edifice that rises more than 600 m from below sea level in the Danakil depression. The summit caldera is 0.7 x 1.6 km and contains at least two pit craters (North and South). Another larger 1.8 x 3.1-km-wide depression is located SE of the summit and is bounded by curvilinear fault scarps on the SE side. Lava flows from fissures have traveled into the caldera and locally overflowed the crater rim. The current eruption has been ongoing since 1967, with at least one long-term active lava lake present in the summit caldera. Recent fissure eruptions from 2017 have occurred on the SE flank (BGVN 42:07). Recent activity has been characterized by minor thermal activity at the S crater and an active lava lake at the N crater (BGVN 48:06). This report covers strong lava lake activity primarily at the N pit crater during June through November 2023 using information from satellite infrared data.
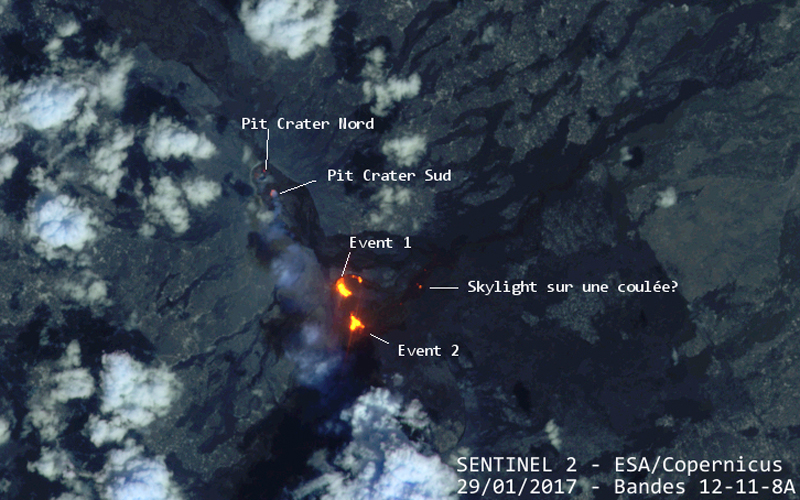
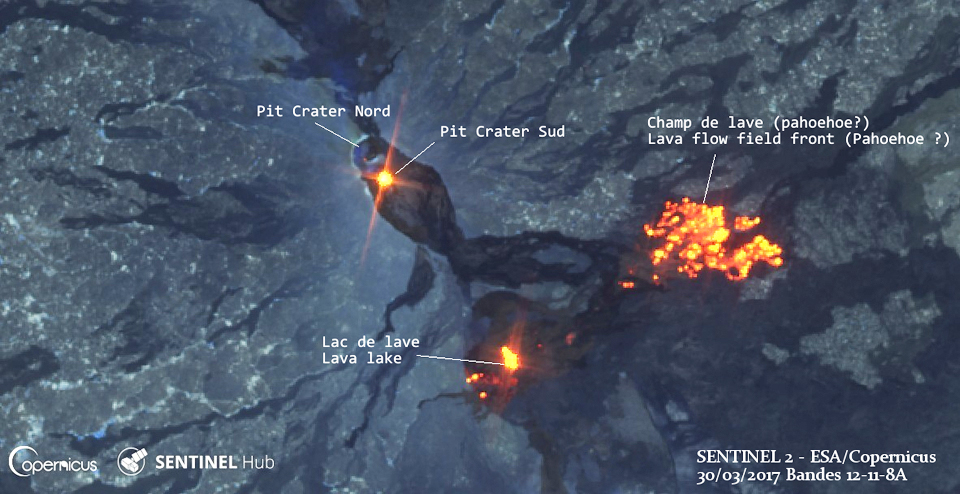
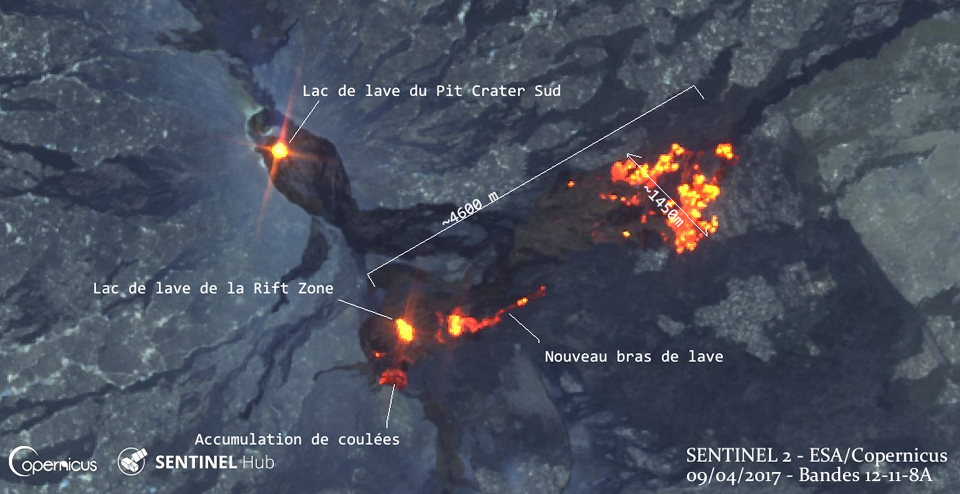
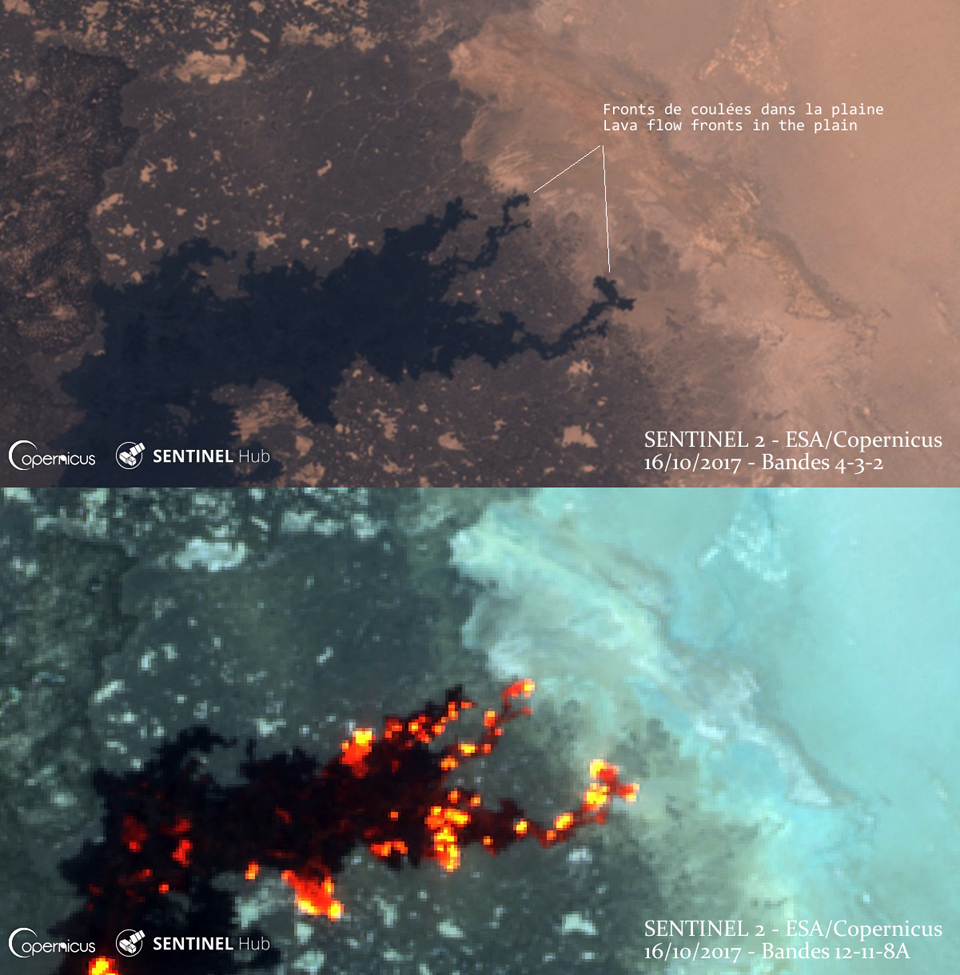
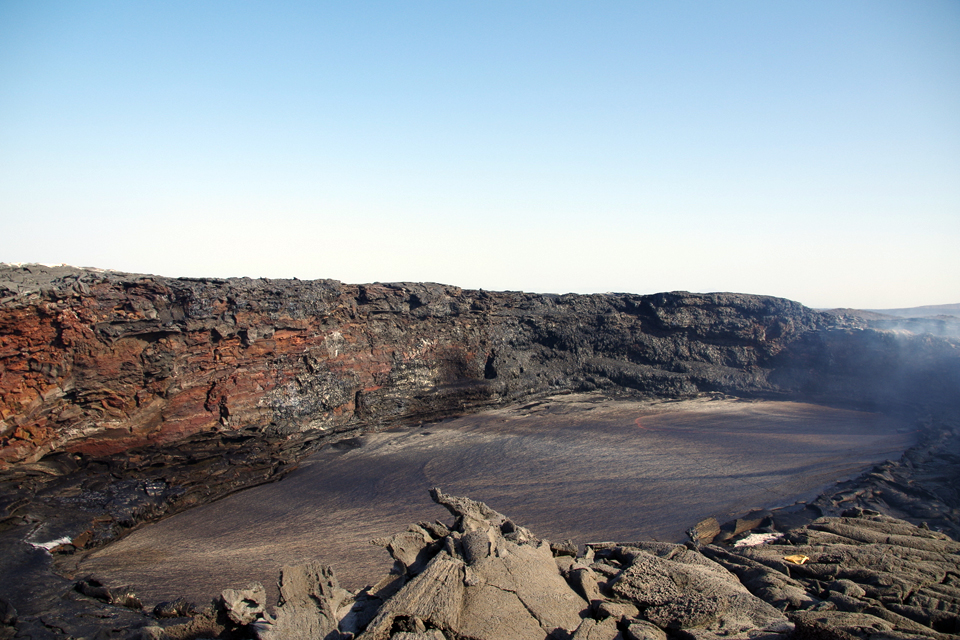
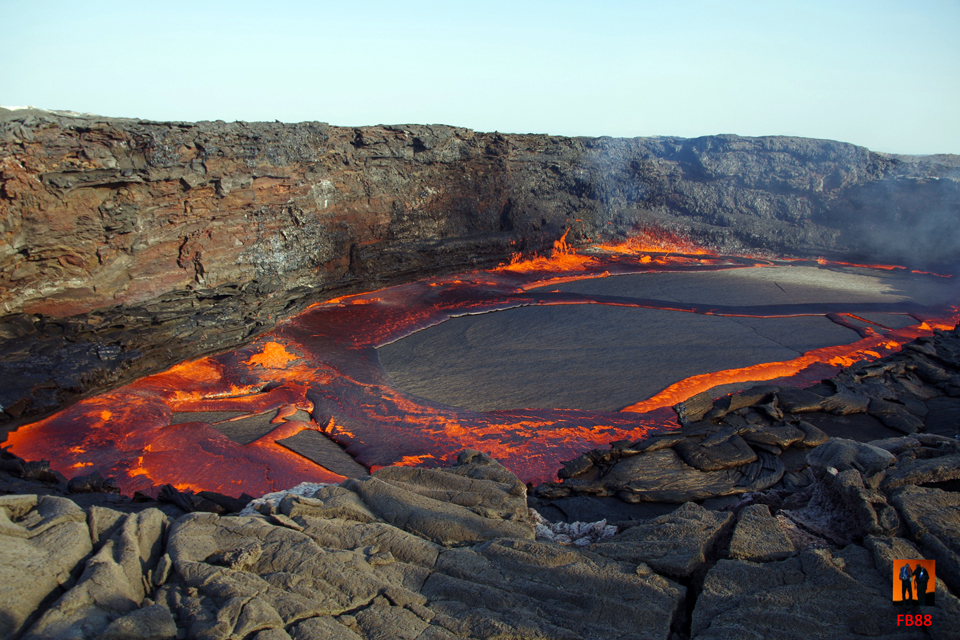
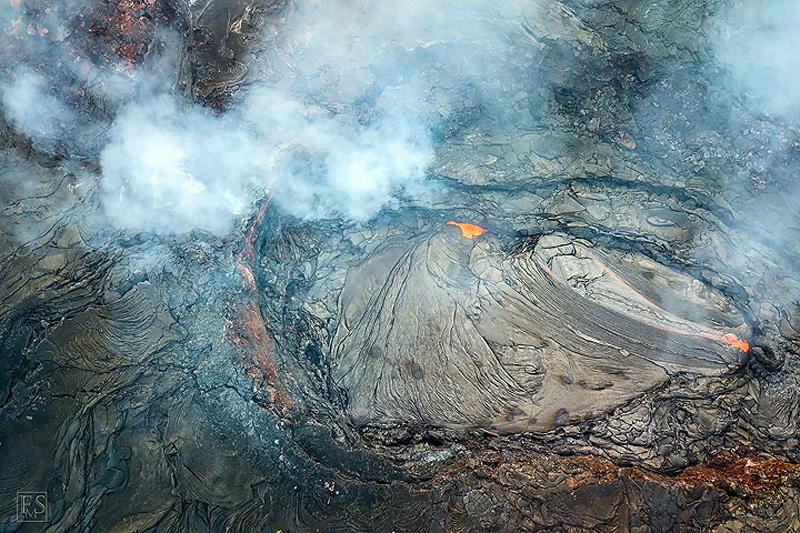
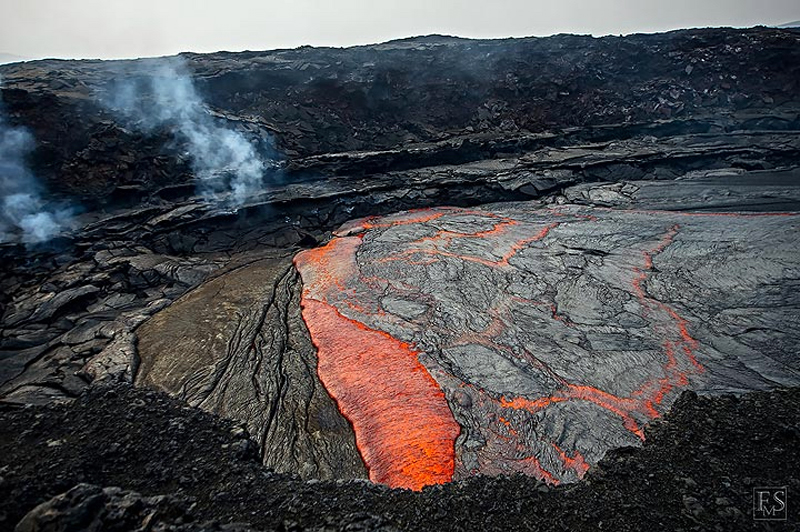
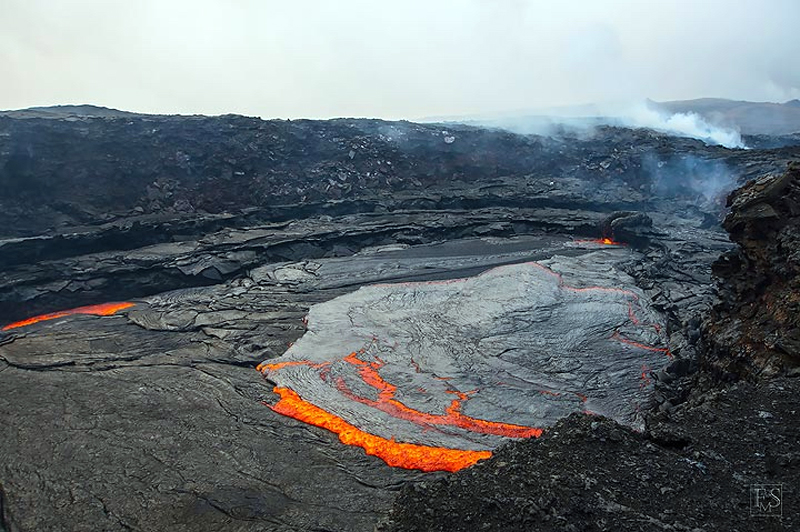
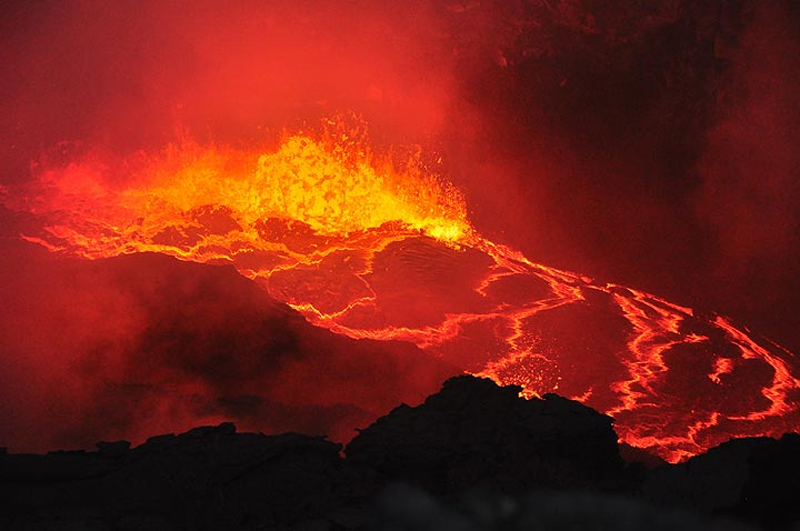
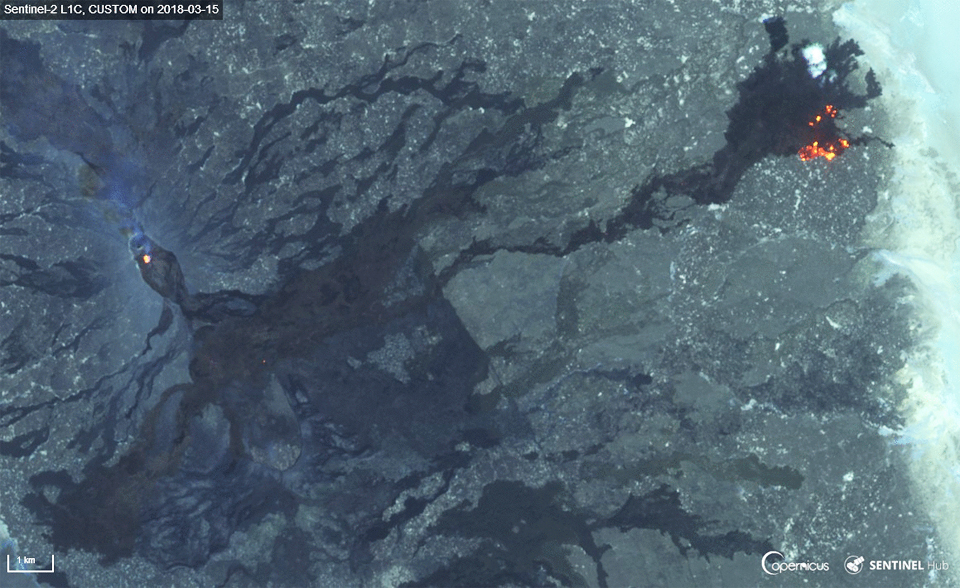
Infrared satellite images generally showed an active lava lake as the N pit crater and variable thermal activity at the S pit crater during the reporting period. On 7 June two strong thermal anomalies were detected at the S pit crater and two weaker anomalies were visible at the N pit crater. Those anomalies persisted throughout the month, although the intensity at each declined. On 2 July a possible lava lake was identified at the S pit crater, filling much of the crater. On 7 July both pit craters contained active lava lakes (figure 120). By 12 July the thermal activity decreased; two smaller anomalies were visible through the rest of the month at the S pit crater while the N pit crater showed evidence of cooling.
Renewed lava lake activity was identified at the N pit crater, based on a satellite image from 11 August, with two smaller anomalies visible at the S pit crater. By 16 August the lava lake in the N pit had begun to cool and only a small thermal anomaly was identified. Activity restarted on 21 August, filling much of the E and SE part of the N pit crater. The thermal activity at the N pit crater intensified on 31 August, particularly in the NW part of the crater. On 5 September lava filled much of the N pit crater, overflowing to the W and SW. During at least 10-20 September thermal activity at both craters were relatively low.
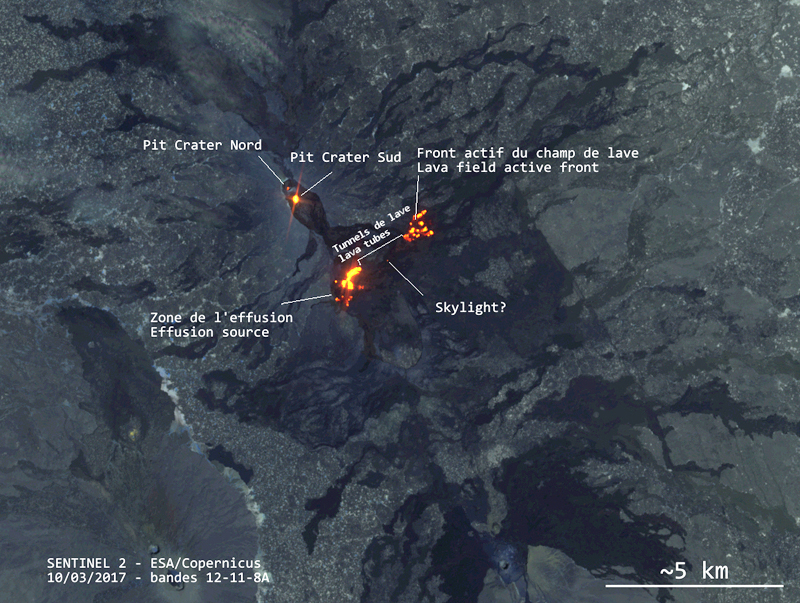
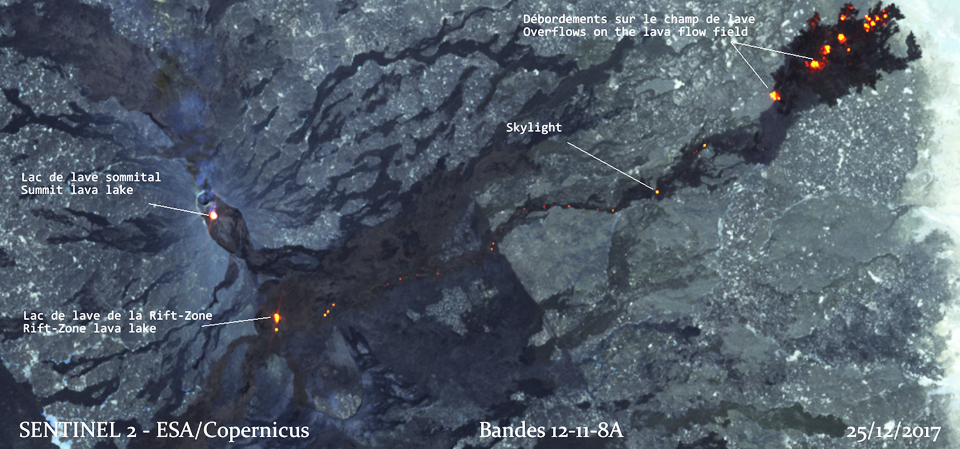
According to a satellite image on 25 September, strong thermal activity resumed when lava overflowed the N pit crater to the S, SW, and NE (figure 120). A satellite image taken on 5 October showed lava flows from the N had spilled into the S and begun to cool, accompanied by two weak thermal anomalies at the S pit crater. On 15 October lava flows again traveled SE and appeared to originate from the S pit crater (figure 120). Following these events, smaller thermal anomalies were visible on the SE rim of the N pit crater and within the S pit crater.
Lava was visible in the NW part of the N pit crater according to a satellite image taken on 4 November. By 9 November the intensity had decreased, and the lava appeared to cool through the rest of the month; young lava flows were visible along the W side of the S pit crater on 24 and 29 November. Lava flows occurred at the N pit crater trending NE-SW and along the E side on 29 November (figure 120).
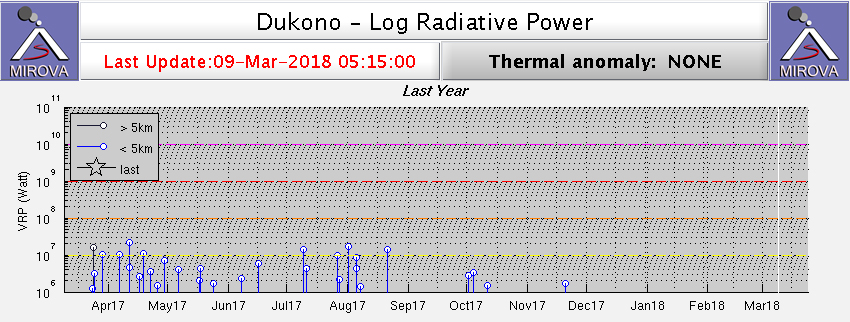
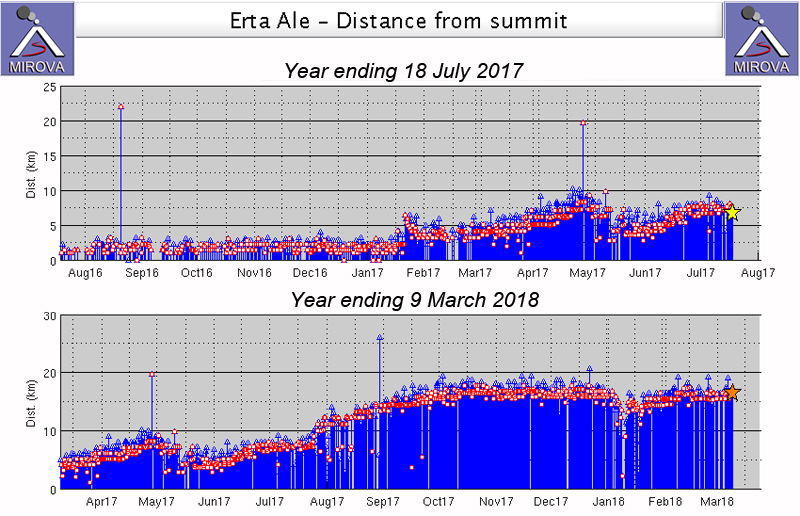
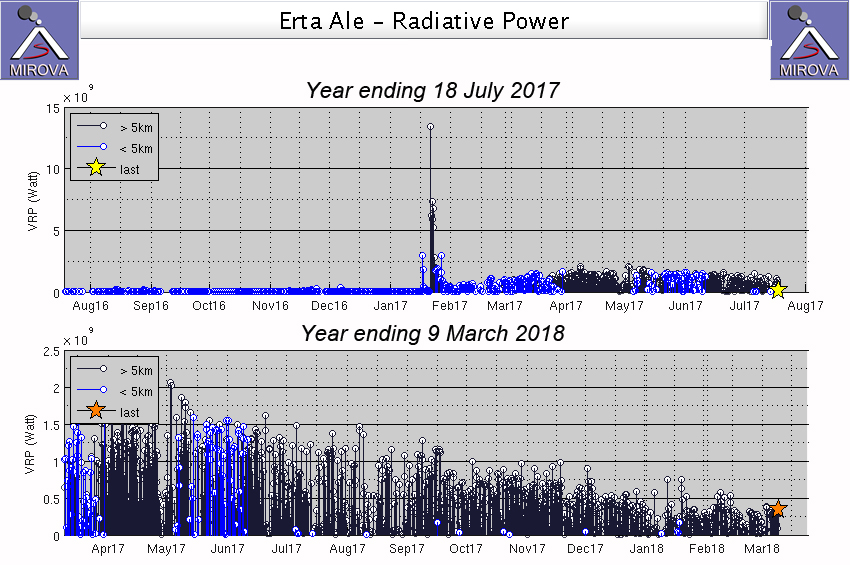
During the reporting period, the MIROVA (Middle InfraRed Observation of Volcanic Activity) thermal detection system recorded consistent activity during the first half of 2023 (figure 121). Beginning in June 2023, thermal activity increased and remained variable in intensity through the end of the year indicating the presence of an active lava lake and lava flows. The MODVOLC thermal detection system registered a total of 63 anomalies during 7, 8, and 23 July, 10 and 18 August, 3, 5, 16, 23, 24, and 25 September, 15 and 20 October, and 21, 24, 26, 28, and 30 November. Some of these stronger thermal anomalies were also detected in Sentinel-2 infrared satellite images that showed an active lava lake at the N pit crater and subsequent lava overflows from both pit craters (figure 120).
Geologic Background. The Erta Ale basaltic shield volcano in Ethiopia has a 50-km-wide edifice that rises more than 600 m from below sea level in the Danakil depression. The volcano includes a 0.7 x 1.6 km summit crater hosting steep-sided pit craters. Another larger 1.8 x 3.1 km wide depression elongated parallel to the trend of the Erta Ale range is located SE of the summit and is bounded by curvilinear fault scarps on the SE side. Basaltic lava flows from these fissures have poured into the caldera and locally overflowed its rim. The summit caldera usually also holds at least one long-term lava lake that has been active since at least 1967, and possibly since 1906. Recent fissure eruptions have occurred on the N flank.
Information Contacts: MIROVA (Middle InfraRed Observation of Volcanic Activity), a collaborative project between the Universities of Turin and Florence (Italy) supported by the Centre for Volcanic Risk of the Italian Civil Protection Department (URL: http://www.mirovaweb.it/); Hawai'i Institute of Geophysics and Planetology (HIGP) - MODVOLC Thermal Alerts System, School of Ocean and Earth Science and Technology (SOEST), Univ. of Hawai'i, 2525 Correa Road, Honolulu, HI 96822, USA (URL: http://modis.higp.hawaii.edu/); Copernicus Browser, Copernicus Data Space Ecosystem, European Space Agency (URL: https://dataspace.copernicus.eu/browser/).
Ubinas
Peru
16.345°S, 70.8972°W; summit elev. 5608 m
All times are local (unless otherwise noted)
New eruption with explosions and ash plumes during June-December 2023
Ubinas, located in Peru, has had 24 eruptions since 1550, which more recently have been characterized by explosions, ash plumes, and lahars (BGVN 45:03). This report covers a new eruption during June through December 2023 based on reports from Instituto Geofisico del Peru (IGP), Instituto Geológico Minero y Metalúrgico (INGEMMET), and satellite data.
IGP reported that seismic unrest began on 17 May, followed by an increase in seismicity during the second half of the month. There were 168 volcano-tectonic (VT) earthquakes detected, which are associated with rock fracturing processes, and 171 long-period (LP) earthquakes recorded during 16-24 May, which are associated with the movement of volcanic fluid.
Seismicity and fumarolic activity at the crater level continued to increase during June. During 1-18 June there was an average of 631 VT-type earthquakes and 829 LP earthquakes recorded. Webcams showed gas-and-steam emissions rising 500 m above the summit and drifting SE. In addition, the maximum value of emitted sulfur dioxide during this period was 337 tons/day. During 19-22 June an average of 315 VT-type events and 281 LP-type events and tremor were reported. On 20 June the Gobierno Regional de Moquegua raised the Volcano Alert Level (VAL) to Yellow (the second level on a four-color scale), based on recommendations from IGP. Webcam images showed ash emissions rising 1 km above the summit and drifting E at 0011 on 22 June, which IGP reported marked the start of a new eruption. Sporadic and diffuse gas-and-ash emissions continued to rise 800-1,500 m above the summit through the rest of the month and drifted mainly E, N, NW, W, SW, and NE. During 23-25 June there was an average of 402 VT-type earthquakes and 865 LP-type events detected. During 26-28 June the earthquakes associated with ash emissions, which have been observed since 22 June, decreased, indicating the end of the phreatic phase of the eruption, according to IGP. A thermal anomaly was detected in the crater for the first time on 26 June and was periodically visible through 4 July (figure 61). During 29-30 June there was an average of 173 VT-type earthquakes and 351 LP-type events recorded, and sulfur dioxide values ranged between 600 t/d and 1,150 t/d. During this same time, seismicity significantly increased, with 173 VT-type earthquakes, 351 LP-type events, and harmonic tremor which signified rising magma. The Gobierno Regional de Moquegua raised the Alert Level to Orange (the third level on a four-color scale) on 30 June based on the recommendation from IGP and INGEMMET.
Activity during July consisted of continued seismicity and gas-and-ash emissions. Gas-and-ash emissions rose as high as 5 km above the summit and drifted as far as 40 km in different directions during 1, 4-6, 16, 20-23, 26, and 29 July, based on webcam and satellite images. During 1-2 July an average of 72 VT-type earthquakes and 114 LP-type events were detected. In addition, during that time, ashfall was reported in Ubinas (6.5 km SSE) and Querapi (4.5 km SE). During 2-3 July INGEMMET reported gas-and-ash plumes rose 400 m above the summit and drifted SW, causing ashfall in downwind areas as far as 5 km. During 3-4 July there was an average of 69 VT-type earthquakes and 96 LP-type events reported. On 4 July starting around 0316 there were 16 seismic signals associated with explosive activity and ash emissions detected (figure 62). According to INGEMMET an explosion ejected ballistics and generated a gas-and-ash plume that rose 5.5 km above the summit and drifted SW and S. Ashfall was recorded in Querapi, Ubinas, Sacohaya (7 km SSE), Anascapa (11 km SE), San Miguel (10 km SE), Tonohaya (7 km SSE), Huatahua, Huarina, Escacha (9 km SE), and Matalaque (17 km SSE), and was most significant within 5 km of the volcano. IGP noted that ash fell within a radius of 20 km and deposits were 1 mm thick in towns in the district of Ubinas.
During 5-9 July an average of 67 VT-type events and 47 LP-type events were reported. A period of continuous gas-and-ash emissions occurred on 5 July, with plumes drifting more than 10 km SE and E. A total of 11 seismic signals associated with explosions also detected on 6, 16, 17, and 22 July. On 6 July explosions recorded at 0747 and 2330 produced gas-and-ash plumes that rose as high as 3.5 km above the summit and drifted as far as 30 km NW, NE, SE, and S. According to the Washington VAAC the explosion at 0747 produced a gas-and-ash plume that rose to 9.1 km altitude and drifted SW, which gradually dissipated, while a lower-altitude plume rose to 7.6 km altitude and drifted NE. Gobierno Regional de Moquegua declared a state of emergency for districts in the Moquegua region, along with Coalaque Chojata, Icuña, Lloque, Matalaque, Ubinas, and Yunga of the General Sánchez Cerro province, to be in effect for 60 days. On 7 July an ash plume rose to 7.3 km altitude and drifted E at 0320. At 0900 and 1520 gas-and-steam plumes with diffuse ash rose to 6.7 km altitude and drifted SE. Small ash emissions were visible in satellite and webcam images at 0920 and 1520 on 8 July and rose as high as 6.4 km altitude and drifted SE. During 10-16 July there was an average of 80 VT-type earthquakes and 93 LP-type events reported. INGEMMET reported that during 9-11 July sulfur dioxide emissions were low and remained around 300 t/d.
During 17-23 July an average of 46 VT-type events and 122 LP-type events were detected. On 20 July at 0530 an explosion generated an ash plume that rose 3-4.5 km above the crater and drifted 65 km toward Arequipa. An explosion on 21 July at 0922 produced a gas-and-ash plume that rose 5 km above the summit (figure 63). Ashfall was reported in Querapi, Ubinas, Tonohaya, Anascapa, Sacohaya, San Miguel, Escacha, Huatagua (14 km SE), Huarina, Escacha (9 km SE), Matalaque, Logén, Santa Lucía de Salinas, and Salinas de Moche. An explosion on 22 July at 1323 generated an ash plume that rose 5.5 km above the summit and drifted NE, E, and SE. During 24-30 July there were five volcanic explosions detected and an average of 60 VT-type events and 117 LP-type events. An explosion on 29 July at 0957 produced an ash plume that rose 2.5 km above the summit and drifted as far as 40 km NE, E, and SE. As a result, significant ashfall was reported in Ubinas and Matalaque.
During August, explosions, gas-and-ash emissions, and seismic earthquakes persisted. During 31 July to 6 August there was an average of 115 VT-type events and 124 LP-type events reported. Gas-and-ash emissions were observed during 1, 6, 10, 13-14, 17-18, 21, and 23 August and they drifted as far as 20 km in different directions; on 14 and 18 August continuous ash emissions extended as far as 40 km S, SE, and NE. An explosion was detected at 2110 on 1 August, which generated a gas-and-ash plume that rose 5.4 km above the summit and drifted SE and E. The explosion ejected blocks and incandescent material as far as 3 km from the crater onto the SW, S, and SE flanks. Ashfall was reported in Ubinas and Chojata (19 km ESE). Gas-and-ash emissions rose as high as 2 km above the summit and drifted in different directions through 5 August, sometimes causing ashfall within a 15-km-radius. An explosion at 0009 on 6 August ejected blocks and produced a gas-and-ash plume that rose 1.4 km above the summit and drifted SE and E, which caused ashfall in Ubinas and Chojata and other areas within a 30-km radius. During 7-13 August there was an average of 102 VT-type events and 60 LP-type events detected. INGEMMET reported that sulfur dioxide emissions were low on 7 August and averaged 400 t/d.
One volcanic explosion that was recorded on 10 August, producing gas-and-ash emissions that rose 2.4 km above the summit and drifted as far as 25 km SE and E. Ashfall was observed in Ubinas, Matalaque, and Chojata. During 10-11 and 13-14 August sulfur dioxide values increased slightly to moderate levels of 2,400-3,700 t/d. The average number of VT-type events was 104 and the number of LP-type events was 71 during 14-21 August. Two explosions were detected at 0141 and 0918 on 21 August, which produced gas-and-ash emissions that rose 3.5 km above the summit and drifted 50 km N, NE, W, and NW (figure 64). The explosion at 0918 generated an ash plume that caused ashfall in different areas of San Juan de Tarucani. During 22-27 August the average number of VT-type events was 229 and the average number of LP-type events was 54. An explosion was reported at 1757 on 25 August, which generated a gas-and-ash plume that rose 4.2 km above the summit and drifted in multiple directions as far as 25 km. During 28 August through 3 September gas-and-ash emissions rose 600 m above the summit and drifted as far as 5 km E and SE. During this time, there was an average of 78 VT-type events and 42 LP-type events.
Gas-and-steam emissions rose 600-2,600 m above the summit and drifted as far as 15 km in multiple directions during September. During 4-10 and 11-17 September there was an average of 183 VT-type events and 27 LP-type events, and 114 VT-type events and 86 LP-type events occurred, respectively. On 14 September an explosion at 1049 generated a gas-and-ash plume that rose 2.6 km above the summit and drifted as far as 15 km E, NE, SE, and S (figure 65). During 14-16 September an average of three hours of seismic tremor related to ash emissions was recorded each day. During 18-24 September the average number of VT-type events was 187 and the average number of LP-type events was 45. During 25 September and 1 October, there was an average number of 129 VT-type events and 52 LP-type events detected.
Relatively low activity was reported during October; during 2-9 October there was an average number of 155 VT-type events and 27 LP-type events recorded. On 1 October at 1656 seismic signals associated with ash emissions were recorded for an hour and thirty minutes; the ash plumes rose as high as 1 km above the summit and drifted more than 10 km E, S, and SW. On 4 October IGP reported that an ash plume drifted more than 15 km SW and S. Sulfur dioxide emissions were 1,250 t/d on that day. On 7 October a gas-and-ash plume rose 1.9 km above the summit and drifted NE, E, and SE. On 4 October the amount of sulfur dioxide emissions was 1,250 t/d. During 10-15 October there was an average number of 225 VT-type events and 34 LP-type events recorded. On 11 October at 1555 a single seismic signal associated with an ash pulse was recorded; the gas-and-ash emissions rose 700 m above the summit and drifted SW and W. There was an average of 204 VT-type events and 25 LP-type events detected during 16-22 October and 175 VT-type events and 17 LP-type events during 23-29 October. On 27 October at 0043 a gas-and-ash emission rose 500 m above the summit and drifted SE and E. A minor thermal anomaly was visible on the crater floor. During 30 October to 5 November there was an average of 95 VT-type events and 24 LP-type events detected.
Activity remained relatively low during November and December and consisted mainly of gas-and-steam emissions and seismicity. Gas-and-steam emissions rose 900-1,100 m above the summit and drifted mainly E, SE, N, and NE. IGP detected an average of 166 VT-type events and 38 LP-type events during 6-15 November, 151 VT-type events and 17 LP-type events during 16-30 November, 143 VT-type events and 23 LP-type events during 1-15 December, and 129 VT-type events and 21 LP-type events during 16-31 December. No explosions or ash emissions were recorded during November. The VAL was lowered to Yellow (the second level on a four-color scale) during the first week of November. According to the Washington VAAC an ash emission was identified in a satellite image at 0040 on 11 December that rose to 5.5 km altitude and drifted NW. Webcam images at 0620 and 1220 showed continuous gas-and-steam emissions possibly containing some ash rising as high as 7 km altitude. Webcam images during 10-31 December showed continuous gas-and-ash emissions that rose as high as 2.5 km above the summit and drifted up to 5 km NW, W, and SW. On 12 December continuous ash emissions drifted more than 10 km N and NW.
Geologic Background. The truncated appearance of Ubinas, Perú's most active volcano, is a result of a 1.4-km-wide crater at the summit. It is the northernmost of three young volcanoes located along a regional structural lineament about 50 km behind the main volcanic front. The growth and destruction of Ubinas I was followed by construction of Ubinas II beginning in the mid-Pleistocene. The upper slopes of the andesitic-to-rhyolitic Ubinas II stratovolcano are composed primarily of andesitic and trachyandesitic lava flows and steepen to nearly 45°. The steep-walled, 150-m-deep summit crater contains an ash cone with a 500-m-wide funnel-shaped vent that is 200 m deep. Debris-avalanche deposits from the collapse of the SE flank about 3,700 years ago extend 10 km from the volcano. Widespread Plinian pumice-fall deposits include one from about 1,000 years ago. Holocene lava flows are visible on the flanks, but activity documented since the 16th century has consisted of intermittent minor-to-moderate explosive eruptions.
Information Contacts: Instituto Geofisico del Peru (IGP), Calle Badajoz N° 169 Urb. Mayorazgo IV Etapa, Ate, Lima 15012, Perú (URL: https://www.gob.pe/igp); Observatorio Volcanologico del INGEMMET (Instituto Geológical Minero y Metalúrgico), Barrio Magisterial Nro. 2 B-16 Umacollo - Yanahuara Arequipa, Peru (URL: http://ovi.ingemmet.gob.pe); Gobierno Regional Moquegua, Sede Principal De Moquegua, R377+5RR, Los Chirimoyos, Moquegua 18001, Peru (URL: https://www.gob.pe/regionmoquegua); Washington Volcanic Ash Advisory Center (VAAC), Satellite Analysis Branch (SAB), NOAA/NESDIS OSPO, NOAA Science Center Room 401, 5200 Auth Rd, Camp Springs, MD 20746, USA (URL: www.ospo.noaa.gov/Products/atmosphere/vaac, archive at: http://www.ssd.noaa.gov/VAAC/archive.html); MIROVA (Middle InfraRed Observation of Volcanic Activity), a collaborative project between the Universities of Turin and Florence (Italy) supported by the Centre for Volcanic Risk of the Italian Civil Protection Department (URL: http://www.mirovaweb.it/); Copernicus Browser, Copernicus Data Space Ecosystem, European Space Agency (URL: https://dataspace.copernicus.eu/browser/).
Kanaga (United States) — January 2024 Cite this Report
Kanaga
United States
51.923°N, 177.168°W; summit elev. 1307 m
All times are local (unless otherwise noted)
Small explosion on 18 December 2023
Kanaga lies within the Kanaton caldera at the northern tip of Kanaga Island. The caldera rim forms a 760-m-high arcuate ridge south and east of Kanaga; a lake occupies part of the SE caldera floor. Most of its previous recorded eruptions are poorly documented, although they date back to 1763. Fumarolic activity at Kanaga occurs in a circular, 200-m-wide, 60-m-deep summit crater and produces vapor plumes sometimes seen on clear days from Adak, 50 km to the east. Its most recent eruption occurred in February 2012, which consisted of numerous small earthquakes, a possible weak ash cloud, and gas-and-steam emissions (BGVN 38:03). This report covers a new eruption during December 2023, based on information from the Alaska Volcano Observatory (AVO).
A small explosion was detected in local infrasound and seismic data at 2231 on 18 December, followed by elevated seismicity. No ash emissions were visible in partly cloudy satellite images. On 19 December the Volcano Alert Level (VAL) was raised to Advisory (the second level on a four-level scale) and the Aviation Color Code (ACC) was raised to Yellow (the second color on a four-color scale). The rate of seismicity significantly declined after the 18th, although it remained elevated through 30 December. Small, daily earthquakes occurred during 19-28 December. Satellite observations following the event showed a debris flow extending 1.5 km down the NW flank. Possible minor gas-and-steam emissions were visible in a webcam image on 20 December. Weakly elevated surface temperatures were identified in satellite data during 23-26 December. A series of cracks extending from the inner crater to the upper SE flank and debris deposits on the upper flanks were observed in satellite images on 27 December. AVO reported that these were likely formed during the 18 December event. Local webcam and seismic data were temporarily offline due to a power failure during 4-28 January.
On 28 January connection to the seismic stations and webcams was restored and webcam images showed gas-and-steam emissions at the summit. Occasional earthquakes were also detected each day. A period of weak seismic tremor was observed on 31 January. During February, the number of earthquakes declined. On 27 February AVO lowered the VAL to Normal (the lowest level on a four-level scale) and the ACC to Green (the lowest color on a four-color scale) due to decreased levels of seismicity and no new surface changes or elevated temperatures based on satellite and webcam data.
Geologic Background. Symmetrical Kanaga stratovolcano is situated within the Kanaton caldera at the northern tip of Kanaga Island. The caldera rim forms a 760-m-high arcuate ridge south and east of Kanaga; a lake occupies part of the SE caldera floor. The volume of subaerial dacitic tuff is smaller than would typically be associated with caldera collapse, and deposits of a massive submarine debris avalanche associated with edifice collapse extend nearly 30 km to the NNW. Several fresh lava flows from historical or late prehistorical time descend the flanks of Kanaga, in some cases to the sea. Historical eruptions, most of which are poorly documented, have been recorded since 1763. Kanaga is also noted petrologically for ultramafic inclusions within an outcrop of alkaline basalt SW of the volcano. Fumarolic activity occurs in a circular, 200-m-wide, 60-m-deep summit crater and produces vapor plumes sometimes seen on clear days from Adak, 50 km to the east.
Information Contacts: Alaska Volcano Observatory (AVO), a cooperative program of a) U.S. Geological Survey, 4200 University Drive, Anchorage, AK 99508-4667 USA (URL: https://avo.alaska.edu/), b) Geophysical Institute, University of Alaska, PO Box 757320, Fairbanks, AK 99775-7320, USA, and c) Alaska Division of Geological & Geophysical Surveys, 794 University Ave., Suite 200, Fairbanks, AK 99709, USA (URL: http://dggs.alaska.gov/).
Klyuchevskoy (Russia) — January 2024 Cite this Report
Klyuchevskoy
Russia
56.056°N, 160.642°E; summit elev. 4754 m
All times are local (unless otherwise noted)
New eruption consisting of Strombolian activity, lava flows and fountains, and ash plumes during June-December 2023
Klyuchevskoy, located on the Kamchatka Peninsula, has produced frequent moderate-volume explosive and effusive eruptions and more than 100 flank eruptions have occurred during the past 3,000 years. Eruptions recorded since the late 17th century have resulted in frequent changes to the morphology of the 700-m-wide summit crater. Eruptions over the past 400 years have primarily originated from the summit crater, although numerous major explosive and effusive eruptions have also occurred from flank craters. The previous eruption ended in November 2022 and consisted of Strombolian activity (BGVN 47:12). This report covers a new eruption during June through December 2023, characterized by Strombolian explosions, lava flows, and ash plumes. Information primarily comes from weekly and daily reports from the Kamchatkan Volcanic Eruption Response Team (KVERT) and various satellite data.
KVERT reported that a Strombolian eruption began at 2323 on 22 June. A thermal anomaly was visible in satellite data starting on 22 June (figure 75). As a result, the Aviation Color Code (ACC) was raised to Yellow (the second lowest level on a four-color scale). During 4-6 and 13 July small ash clouds were occasionally observed over the crater. On 19 July a new lava flow began to effuse along the Apakhonchich drainage on the SE flank, which continued through 19 August. Lava fountaining was reported on 21 July in addition to the active lava flow, which continued through 23 August and during 27-30 August. During 22-23 and 27-30 August the lava flow was active along the Apakhonchich drainage on the SE flank.
Similar activity was observed during September. Lava fountaining resumed on 2 September and continued through 31 October. In addition, on 2 September a lava flow began to effuse along the Kozyrevsky drainage on the SW flank. During 3-5 September resuspended ash plumes rose to 3-3.5 km altitude and extended as far as 170 km E by 1940 on 4 September. The ACC was raised to Orange (the third level on a four-color scale) at 1240 on 4 September. The ACC was briefly lowered back to Yellow at 1954 that same day before returning to Orange during 1532-1808 on 5 September due to resuspended ash plumes that rose to 3 km altitude and drifted 120 km E at 1500. KVERT reported that Strombolian activity continued, feeding the lava flows advancing down the Apakhonchichsky and Kozyrevsky drainages through most of the month. During 25 September through 16 October the lava flow was only active in the Apakhonchichisky drainage (figure 76). During 9-12 September resuspended ash plumes rose to 1.5-4 km altitude and extended 550 km E and SE. On 22 September resuspended ash plumes rose to 2-2.5 km altitude and drifted 50-90 km E, which prompted KVERT to raise the ACC to Orange; the ACC was lowered back to Yellow on 24 September. On 29 September phreatic explosions generated ash plumes that rose to 5.2-5.3 km altitude.
Activity during October continued with lava fountains, lava flows, and ash plumes. Strombolian activity with lava fountains continued at the crater and active lava flows alternately descended the Apakhonchichisky and Kozyrevsky drainages on the SE and S flanks (figure 77). During 11-12 October gas-and-steam plumes containing some ash rose to 5.5-6 km altitude and extended as far as 65 km NE and SE. The ACC was raised to Orange on 11 October. According to observers at the Kamchatka Volcanological Station, lava effusion was almost continuous, and incandescent material was ejected as high as 300 m above the crater rim. On 13 October at 1420 an ash plume rose to 5-5.5 km altitude and drifted 90-100 km SE. During 14-16 October gas-and-steam plumes containing some ash rose to 4-6 km altitude and drifted 40-145 km ESE and E. On 16 October lava on the SE flank melted the snow and ice, causing phreatic explosions and large collapses of material from the margins of the flow. At 1500 an ash plume rose to 6.5-7 km altitude and drifted 70 km ENE. On 17 October an ash plume was reported extending 360 km NE. Gray-red ashfall was observed in Klyuchi at 0700; this ash was resuspended from older material.
During 22-31 October phreatic explosions generated ash plumes mainly containing ash from collapses of previously deposited pyroclastic material that rose to 7 km altitude and extended as far as 280 km NE, E, SW, and S on 23 and 29 October the ash plumes rose to 8 km altitude. Ash plumes during 27-29 October rose to 8 km altitude and drifted as far as 300 km SE, ESE, and E. Lava fountains rose up to 500 m above the crater during 27-31 October. Scientists from the Kamchatka Volcanological Station visited the volcano on 28 October and reported that the cinder cone at the summit had grown. They also observed advancing lava on the E flank that extended about 2 km from the summit to 2,700 m elevation, incandescent ejecta 500 m above the crater, and avalanches in the Apakhonchichsky drainage. On 31 October activity intensified, and lava flows were reported moving in the Kretovsky, Kozyrevsky, and Apakhonchichisky drainages on the NW, SW, and SE flanks. At 0930 an ash plume rose to 7 km altitude and at first drifted 169 km SW and then 646 km SE. KVERT reported ash plumes rose to 14 km altitude and extended as far as 1,500 km SSE. The ACC was raised to Red (the highest level on a four-color scale). During 31 October to 1 November ash plumes rose as high as 14 km altitude and drifted as far as 2,255 km ESE.
Activity on 1 November intensified. The lava fountains rose as high as 1 km above the summit (figure 78) and fed the lava flows that were active on the Kretovsky, Kozyrevsky, and Apakhonchichsky drainages on the NW, SW, and SE flanks. Ash plumes rose to 10-14 km altitude and drifted as far as 1,500 km SSE (figure 79). According to the Kamchatka Volcanological Station, observers reported pyroclastic flows descending the flanks. Lahars descended the Studenoy River, blocking the Kozyrevsky-Petropavlovsk federal highway and descended the Krutenkaya River, blocking the road E of Klyuchi. According to news articles the ash plumes caused some flight cancellations and disruptions in the Aleutians, British Columbia (Canada), and along flight paths connecting the Unites States to Japan and South Korea. Ash plumes containing old ash from collapses in the Apakhonchichsky drainage due to phreatic explosions rose to 9.5-9.8 km altitude and drifted 192 km SW at 1400 and to 8.7 km altitude and drifted 192 km SW at 1710 on 1 November.
On 2 November ash plumes rose to 6-14 km altitude; the ash plume that rose to 14 km altitude decreased to 6.5 km altitude and drifted NNE by 2000 and continued to drift more than 3,000 km ESE and E. The ACC was lowered to Orange. On 3 November ash plumes rose to 5-8.2 km altitude and drifted 72-538 km ENE, NNE, and ESE; at 0850 an ash plume rose to 6-6.5 km altitude and drifted more than 3,000 km ESE throughout the day. During 4-6 and 8-10 November resuspended ash plumes associated with collapses of old pyroclastic material from the sides of the Apakhonchichsky drainage due to phreatic explosions rose to 4.5-5.5 km altitude and extended 114-258 km NE, ENE, and E. KVERT reported that the eruption stopped on 5 November and the lava flows had begun to cool. Resuspended ash plumes rose to 5-6 km altitude and drifted 60 km E at 0820 on 13 November and to 5 km and 4.5 km altitude at 1110 and 1430 and drifted 140 km E and 150 km ESE, respectively. On 15 November the ACC was lowered to Green.
Activity was relatively low during most of December. On 27 December Strombolian activity resumed based on a thermal anomaly visible in satellite data. On 30 December an ash plume rose to 6 km altitude and extended 195 km NW. The ACC was raised to Orange. On 31 December video and satellite data showed explosions that generated ash plumes that rose to 5-6.5 km altitude and drifted 50-230 km WNW and NW. Though a thermal anomaly persisted through 1 January 2024, no explosions were detected, so the ACC was lowered to Yellow.
Satellite data. Thermal activity was strong throughout the reporting period due to frequent lava fountaining and lava flows. MODIS thermal anomaly data provided through MIROVA (Middle InfraRed Observation of Volcanic Activity) showed strong activity during the entire reporting period, resulting from lava fountaining and lava flows (figure 80). According to data from MODVOLC thermal alerts, a total of 336 hotspots were detected in June (3), July (30), August (11), September (52), October (217), and November (23). Thermal activity was also visible in infrared satellite images, often showing a strong thermal anomaly at the summit crater and a lava flow affecting primarily the SE and SW flanks (figure 81).
Geologic Background. Klyuchevskoy is the highest and most active volcano on the Kamchatka Peninsula. Since its origin about 6,000 years ago, this symmetrical, basaltic stratovolcano has produced frequent moderate-volume explosive and effusive eruptions without major periods of inactivity. It rises above a saddle NE of Kamen volcano and lies SE of the broad Ushkovsky massif. More than 100 flank eruptions have occurred during approximately the past 3,000 years, with most lateral craters and cones occurring along radial fissures between the unconfined NE-to-SE flanks of the conical volcano between 500 and 3,600 m elevation. Eruptions recorded since the late 17th century have resulted in frequent changes to the morphology of the 700-m-wide summit crater. These eruptions over the past 400 years have originated primarily from the summit crater, but have also included numerous major explosive and effusive eruptions from flank craters.
Information Contacts: Kamchatka Volcanic Eruptions Response Team (KVERT), Far Eastern Branch, Russian Academy of Sciences, 9 Piip Blvd., Petropavlovsk-Kamchatsky, 683006, Russia (URL: http://www.kscnet.ru/ivs/kvert/); Kamchatka Volcanological Station, Kamchatka Branch of Geophysical Survey, (KB GS RAS), Klyuchi, Kamchatka Krai, Russia (URL: http://volkstat.ru/); MIROVA (Middle InfraRed Observation of Volcanic Activity), a collaborative project between the Universities of Turin and Florence (Italy) supported by the Centre for Volcanic Risk of the Italian Civil Protection Department (URL: http://www.mirovaweb.it/); Hawai'i Institute of Geophysics and Planetology (HIGP) - MODVOLC Thermal Alerts System, School of Ocean and Earth Science and Technology (SOEST), Univ. of Hawai'i, 2525 Correa Road, Honolulu, HI 96822, USA (URL: http://modis.higp.hawaii.edu/); Copernicus Browser, Copernicus Data Space Ecosystem, European Space Agency (URL: https://dataspace.copernicus.eu/browser/).
Agung (Indonesia) — January 2024 Cite this Report
Agung
Indonesia
8.343°S, 115.508°E; summit elev. 2997 m
All times are local (unless otherwise noted)
Three eruptive events reported in April, May, and December 2022
Mount Agung, located on the E end of the island of Bali, Indonesia, rises above the SE rim of the Batur caldera. The summit area extends 1.5 km E-W, with the highest point on the W and a steep-walled 800-m-wide crater on the E. Recorded eruptions date back to the early 19th century. A large and deadly explosive and effusive eruption occurred during 1963-64, which was characterized by voluminous ashfall, pyroclastic flows, and lahars that caused extensive damage and many fatalities. More recent activity was documented during November 2017-June 2019 that consisted of multiple explosions, significant ash plumes, lava flows at the summit crater, and incandescent ejecta. This report covers activity reported during April-May 2022 and December 2022 based on data from the Darwin Volcanic Ash Advisory Center (VAAC).
Activity during 2022 was relatively low and mainly consisted of a few ash plumes during April-May and December. An ash plume on 3 April rising to 3.7 km altitude (700 m above the summit) and drifting N was reported in a Darwin VAAC notice based on a ground report, with ash seen in HIMAWARI-8 visible imagery. Another ash plume was reported at 1120 on 27 May that rose to 5.5 km altitude (2.5 m above the summit); the plume was not visible in satellite or webcam images due to weather clouds. An eruption was reported based on seismic data at 0840 on 13 December, with an estimated plume altitude of 3.7 km; however, no ash was seen using satellite imagery in clear conditions before weather clouds obscured the summit.
Geologic Background. Symmetrical Agung stratovolcano, Bali's highest and most sacred mountain, towers over the eastern end of the island. The volcano, whose name means "Paramount," rises above the SE rim of the Batur caldera, and the northern and southern flanks extend to the coast. The summit area extends 1.5 km E-W, with the high point on the W and a steep-walled 800-m-wide crater on the E. The Pawon cone is located low on the SE flank. Only a few eruptions dating back to the early 19th century have been recorded in historical time. The 1963-64 eruption, one of the largest in the 20th century, produced voluminous ashfall along with devastating pyroclastic flows and lahars that caused extensive damage and many fatalities.
Information Contacts: Darwin Volcanic Ash Advisory Centre (VAAC), Bureau of Meteorology, Northern Territory Regional Office, PO Box 40050, Casuarina, NT 0811, Australia (URL: http://www.bom.gov.au/info/vaac/).
Saunders (United Kingdom) — February 2024 Cite this Report
Saunders
United Kingdom
57.8°S, 26.483°W; summit elev. 843 m
All times are local (unless otherwise noted)
Persistent thermal anomalies from the summit crater lava lake during February 2023-January 2024
Saunders is one of eleven islands that comprise the South Sandwich Islands in the South Atlantic. The active Mount Michael volcano has been in almost continuous eruption since November 2014 (BGVN 48:02). Recent activity has resulted in intermittent thermal anomalies and gas-and-steam emissions (BGVN 47:03, 48:02). Visits are infrequent due to its remote location, and cloud cover often prevents satellite observations. Satellite thermal imagery and visual observation of incandescence during a research expedition in 2019 (BGVN 28:02 and 44:08) and a finding confirmed by a National Geographic Society research team that summited Michael in November 2022 reported the presence of a lava lake.
Although nearly constant cloud cover during February 2023 through January 2024 greatly limited satellite observations, thermal anomalies from the lava lake in the summit crater were detected on clear days, especially around 20-23 August 2023. Anomalies similar to previous years (eg. BGVN 48:02) were seen in both MIROVA (Middle InfraRed Observation of Volcanic Activity) data from MODIS instruments and in Sentinel 2 infrared imagery. The only notable sulfur dioxide plume detected near Saunders was on 25 September 2023, with the TROPOMI instrument aboard the Sentinel-5P satellite.
Geologic Background. Saunders Island consists of a large central volcanic edifice intersected by two seamount chains, as shown by bathymetric mapping (Leat et al., 2013). The young Mount Michael stratovolcano dominates the glacier-covered island, while two submarine plateaus, Harpers Bank and Saunders Bank, extend north. The symmetrical Michael has a 500-m-wide summit crater and a remnant of a somma rim to the SE. Tephra layers visible in ice cliffs surrounding the island are evidence of recent eruptions. Ash clouds were reported from the summit crater in 1819, and an effusive eruption was inferred to have occurred from a N-flank fissure around the end of the 19th century and beginning of the 20th century. A low ice-free lava platform, Blackstone Plain, is located on the north coast, surrounding a group of former sea stacks. A cluster of cones on the SE flank, the Ashen Hills, appear to have been modified since 1820 (LeMasurier and Thomson, 1990). Analysis of satellite imagery available since 1989 (Gray et al., 2019; MODVOLC) suggests frequent eruptive activity (when weather conditions allow), volcanic clouds, steam plumes, and thermal anomalies indicative of a persistent, or at least frequently active, lava lake in the summit crater. Due to this observational bias, there has been a presumption when defining eruptive periods that activity has been ongoing unless there is no evidence for at least 10 months.
Information Contacts: MIROVA (Middle InfraRed Observation of Volcanic Activity), a collaborative project between the Universities of Turin and Florence (Italy) supported by the Centre for Volcanic Risk of the Italian Civil Protection Department (URL: http://www.mirovaweb.it/); NASA Global Sulfur Dioxide Monitoring Page, Atmospheric Chemistry and Dynamics Laboratory, NASA Goddard Space Flight Center (NASA/GSFC), 8800 Greenbelt Road, Goddard MD 20771, USA (URL: https://so2.gsfc.nasa.gov/); Copernicus Browser (URL: https://dataspace.copernicus.eu/browser).
Tengger Caldera (Indonesia) — February 2024 Cite this Report
Tengger Caldera
Indonesia
7.942°S, 112.95°E; summit elev. 2329 m
All times are local (unless otherwise noted)
Minor ash emission in December 2023; persistent weak thermal anomaly in the Bromo crater
Tengger Caldera, located at the N end of a volcanic massif in Indonesia’s East Java, consists of five overlapping stratovolcanoes. The youngest and only active cone in the 16-km-wide caldera is Bromo, which typically produces gas-and-steam plumes, occasional ash plumes and explosions, and weak thermal signals (BGVN 44:05, 47:01). This report covers activity during January 2022-December 2023, consisting of mostly white gas-and-steam emissions and persistent weak thermal anomalies. Information was provided by the Pusat Vulkanologi dan Mitigasi Bencana Geologi (PVMBG, also known as Indonesian Center for Volcanology and Geological Hazard Mitigation, CVGHM) and satellite imagery. The Alert Level remained at 2 (on a scale of 1-4), and visitors were warned to stay at least 1 km from the crater.
Activity was generally low during the reporting period, similar to that in 2021. According to almost daily images from MAGMA Indonesia (a platform developed by PVMBG), white emissions and plumes rose from 50 to 900 m above the main crater during this period (figure 24). During several days in March and June 2022, white plumes reached heights of 1-1.2 km above the crater.
After an increase in activity at 2114 on 3 February 2023, a PVMBG team that was sent to observe white emissions rising as high as 300 m during 9-12 February and heard rumbling noises. A sulfur dioxide odor was also strong near the crater and measurements indicated that levels were above the healthy (non-hazardous) threshold of 5 parts per million; differential optical absorption spectroscopy (DOAS) measurements indicated an average flux of 190 metric tons per day on 11 February. Incandescence originating from a large fumarole in the NNW part of the crater was visible at night. The team observed that vegetation on the E caldera wall was yellow and withered. The seismic network recorded continuous tremor and deep and shallow volcanic earthquakes.
According to a PVMBG press release, activity increased on 13 December 2023 with white, gray, and brown emissions rising as high as 900 m above Bromo’s crater rim and drifting in multiple directions (figure 25). The report noted that tremor was continuous and was accompanied in December by three volcanic earthquakes. Deformation data indicated inflation in December. There was no observable difference in the persistent thermal anomaly in the crater between 11 and 16 December 2023.
All clear views of the Bromo crater throughout this time, using Sentinel-2 infrared satellite images, showed a weak persistent thermal anomaly; none of the anomalies were strong enough to cause MODVOLC Thermal Alerts. A fire in the SE part of the caldera in early September 2023 resulted in a brief period of strong thermal anomalies.
Geologic Background. The 16-km-wide Tengger caldera is located at the northern end of a volcanic massif extending from Semeru volcano. The massive volcanic complex dates back to about 820,000 years ago and consists of five overlapping stratovolcanoes, each truncated by a caldera. Lava domes, pyroclastic cones, and a maar occupy the flanks of the massif. The Ngadisari caldera at the NE end of the complex formed about 150,000 years ago and is now drained through the Sapikerep valley. The most recent of the calderas is the 9 x 10 km wide Sandsea caldera at the SW end of the complex, which formed incrementally during the late Pleistocene and early Holocene. An overlapping cluster of post-caldera cones was constructed on the floor of the Sandsea caldera within the past several thousand years. The youngest of these is Bromo, one of Java's most active and most frequently visited volcanoes.
Information Contacts: Pusat Vulkanologi dan Mitigasi Bencana Geologi (PVMBG, also known as Indonesian Center for Volcanology and Geological Hazard Mitigation, CVGHM), Jalan Diponegoro 57, Bandung 40122, Indonesia (URL: http://www.vsi.esdm.go.id/); MAGMA Indonesia, Kementerian Energi dan Sumber Daya Mineral (URL: https://magma.esdm.go.id/v1); Copernicus Browser, Copernicus Data Space Ecosystem, European Space Agency (URL: https://dataspace.copernicus.eu/browser/); Hawai'i Institute of Geophysics and Planetology (HIGP) - MODVOLC Thermal Alerts System, School of Ocean and Earth Science and Technology (SOEST), Univ. of Hawai'i, 2525 Correa Road, Honolulu, HI 96822, USA (URL: http://modis.higp.hawaii.edu/).
Shishaldin (United States) — December 2023 Cite this Report
Shishaldin
United States
54.756°N, 163.97°W; summit elev. 2857 m
All times are local (unless otherwise noted)
New eruption with significant Strombolian explosions, ash plumes, and ashfall
Shishaldin is located on the eastern half of Unimak Island, one of the Aleutian Islands. Frequent explosive activity, primarily consisting of Strombolian ash eruptions from the small summit crater, but sometimes producing lava flows, has been recorded since the 18th century. The previous eruption ended in May 2020 and was characterized by intermittent thermal activity, increased seismicity and surface temperatures, ash plumes, and ash deposits (BGVN 45:06). This report covers a new eruption during July through November 2023, which consisted of significant explosions, ash plumes, ashfall, and lava fountaining. Information comes from daily, weekly, and special reports from the Alaska Volcano Observatory (AVO) and various satellite data. AVO monitors the volcano using local seismic and infrasound sensors, satellite data, web cameras, and remote infrasound and lightning networks.
AVO reported that intermittent tremor and low-frequency earthquakes had gradually become more regular and consistent during 10-13 July. Strongly elevated surface temperatures at the summit were identified in satellite images during 10-13 July. On 11 July AVO raised the Aviation Color Code (ACC) to Yellow (the second color on a four-color scale) and Volcano Alert Level (VAL) to Advisory (the second level on a four-level scale) at 1439. Later in the day on 11 July summit crater incandescence was observed in webcam images. Observations of the summit suggested that lava was likely present at the crater, which prompted AVO to raise the ACC to Orange (the second highest color on a four-color scale) and the VAL to Watch (the second highest level on a four-level scale). The US Coast Guard conducted an overflight on 12 July and confirmed that lava was erupting from the summit. That same day, sulfur dioxide emissions were detected in satellite images.
A significant explosion began at 0109 on 14 July that produced an ash plume that rose to 9-12 km altitude and drifted S over the Pacific Ocean (figure 43). Webcam images and photos taken around 0700 from a ship SW off Unimak Island showed small lahar deposits, which were the result of the interaction of hot pyroclastic material and snow and ice on the flanks. There was also ashfall on the SW and N flanks. A smaller explosion at 0710 generated an ash plume that rose to 4.5 km altitude. Webcam images and pilot reports showed continued low-level ash emissions during the morning, rising to less than 4.6 km altitude; those emissions included a small ash plume near the summit around 1030 resulting from a small explosion.
Seismic tremor amplitude began increasing at around 1700 on 15 July; strongly elevated surface temperatures were also reported. An ash plume rose to 4.6 km altitude and drifted SSE at 2100, based on a satellite image. A continuous ash plume during 2150 through 2330 rose to 5 km altitude and extended 125 km S. At 2357 AVO raised the ACC to Red (the highest color on a four-color scale) and the VAL to Warning (the highest level on a four-level scale), noting that seismicity remained elevated for more than six hours and explosion signals were frequently detected by regional infrasound (pressure sensor) networks. Explosions generated an ash plume that rose to 4.9 km altitude and drifted as far as 500 km SE. Activity throughout the night declined and by 0735 the ACC was lowered to Orange and the VAL to Watch. High-resolution satellite images taken on 16 July showed pyroclastic deposits extending as far as 3 km from the vent; these deposits generated lahars that extended further down the drainages on the flanks. Ash deposits were mainly observed on the SSE flank and extended to the shore of Unimak Island. During 16-17 July lava continued to erupt at the summit, which caused strongly elevated surface temperatures that were visible in satellite imagery.
Lava effusion increased at 0100 on 18 July, as noted in elevated surface temperatures identified in satellite data, increasing seismic tremor, and activity detected on regional infrasound arrays. A significant ash plume at 0700 rose to 7 km altitude and continued until 0830, eventually reaching 9.1 km altitude and drifting SSE (figure 44). As a result, the ACC was raised to Red and the VAL to Warning. By 0930 the main plume detached, but residual low-level ash emissions continued for several hours, remaining below 3 km altitude and drifting S. The eruption gradually declined and by 1208 the ACC was lowered to Orange and the VAL was lowered to Watch. High-resolution satellite images showed ash deposits on the SW flank and pyroclastic deposits on the N, E, and S flanks, extending as far as 3 km from the vent; lahars triggered by the eruption extended farther down the flanks (figure 45). Lava continued to erupt from the summit crater on 19 July.
Elevated surface temperatures were detected in satellite images during 19-25 July, despite occasional weather cloud cover, which was consistent with increased lava effusion. During 22-23 July satellite observations acquired after the eruption from 18 July showed pyroclastic flow and lahar deposits extending as far as 3 km down the N, NW, and NE flanks and as far as 1.5 km down the S and SE flanks. Ash deposits covered the SW and NE flanks. No lava flows were observed outside the crater. On 22 July a sulfur dioxide plume was detected in satellite data midday that had an estimated mass of 10 kt. In a special notice issued at 1653 on 22 July AVO noted that eruptive activity had intensified over the previous six hours, which was characterized by an hours-long steady increase in seismic tremor, intermittent infrasound signals consistent with small explosions, and an increase in surface temperatures that were visible in satellite data. Pilots first reported low-level ash plumes at around 1900. At 2320 an ash plume had risen to 9 km altitude based on additional pilot reports and satellite images. The ACC was increased to Red and the VAL to Warning at 2343. Satellite images indicated growth of a significantly higher ash plume that rose to 11 km altitude continued until 0030 and drifted NE. During the early morning hours of 23 July ash plumes had declined to 4.6 k altitude. Seismic tremor peaked at 0030 on 23 July and began to rapidly decline at 0109; active ash emissions were no longer visible in satellite data by 0130. The ACC was lowered to Orange and the VAL to Watch at 0418; bursts of increased seismicity were recorded throughout the morning, but seismicity generally remained at low levels. Elevated surface temperatures were visible in satellite data until about 0600. On 24 July pilots reported seeing vigorous gas-and-steam plumes rising to about 3 km altitude; the plumes may have contained minor amounts of ash.
During 24-25 July low level seismicity and volcanic tremor were detected at low levels following the previous explosion on 23 July. Strongly elevated surface temperatures were observed at the summit crater in satellite data. Around 2200 on 25 July seismicity began to increase, followed by infrasound signals of explosions after 0200 on 26 July. An ash plume rose to 3 km altitude at 0500 and drifted ENE, along with an associated sulfur dioxide plume that drifted NE and had an estimated mass of 22 kt. Diffuse ash emissions were visible in satellite data and rose to 6.1-7.6 km altitude and extended 125 km from the volcano starting around 1130. These ash events were preceded by about seven hours of seismic tremor, infrasound detections of explosions, and five hours of increased surface temperatures visible in satellite data. Activity began to decline around 1327, which included low-frequency earthquakes and decreased volcanic tremor, and infrasound data no longer detected significant explosions. Surface temperatures remained elevated through the end of the month.
Seismicity, volcanic tremor, and ash emissions remained at low levels during early August. Satellite images on 1 August showed that some slumping had occurred on the E crater wall due to the recent explosive activity. Elevated surface temperatures continued, which was consistent with cooling lava. On 2 August small explosive events were detected, consistent with low-level Strombolian activity. Some episodes of volcanic tremor were reported, which reflected low-level ash emissions. Those ash emissions rose to less than 3 km altitude and drifted as far as 92.6 km N. Pilots that were located N of the volcano observed an ash plume that rose to 2.7 km altitude. Seismicity began to increase in intensity around 0900 on 3 August. Seismicity continued to increase throughout the day and through the night with strongly elevated surface temperatures, which suggested that lava was active at the surface.
An ash cloud that rose to 7.6-7.9 km altitude and drifted 60-75 km NE was visible in a satellite image at 0520 on 4 August. Pilots saw and reported the plume at 0836 (figure 46). By 0900 the plume had risen to 9.1 km altitude and extended over 100 km NE. AVO raised the ACC to Red and the VAL to Warning as a result. Seismic tremor levels peaked at 1400 and then sharply declined at 1500 to slightly elevated levels; the plume was sustained during the period of high tremor and drifted N and NE. The ACC was lowered to Orange and the VAL to Watch at 2055. During 5-14 August seismicity remained low and surface temperatures were elevated based on satellite data due to cooling lava. On 9 August a small lava flow was observed that extended from the crater rim to the upper NE flank. It had advanced to 55 m in length and appeared in satellite imagery on 11 August. Occasional gas-and-steam plumes were noted in webcam images. At 1827 AVO noted that seismic tremor had steadily increased during the afternoon and erupting lava was visible at the summit in satellite images.
Strong explosion signals were detected at 0200 on 15 August. An ash cloud that was visible in satellite data extended 100 km NE and may have risen as high as 11 km altitude around 0240. By 0335 satellite images showed the ash cloud rising to 7.6 km altitude and drifting NE. Significant seismicity and explosions were detected by the local AVO seismic and infrasound networks, and volcanic lightning was detected by the World Wide Lightning Location Network (WWLLN). A sulfur dioxide plume associated with the eruption drifted over the S Bering Sea and parts of Alaska and western Canada. Seismicity was significantly elevated during the eruption but had declined by 1322. A pilot reported that ash emissions continued, rising as high as 4.9 km altitude. Elevated surface temperatures detected in satellite data were caused by hot, eruptive material (pyroclastic debris and lava) that accumulated around the summit. Eruptive activity declined by 16 August and the associated sulfur dioxide plume had mostly dissipated; remnants continued to be identified in satellite images at least through 18 August. Surface temperatures remained elevated based on satellite images, indicating hot material on the upper parts of the volcano. Small explosions were detected in infrasound data on the morning of 19 August and were consistent with pilot reports of small, short-lived ash plumes that rose to about 4.3 km altitude. Low-level explosive activity was reported during 20-24 August, according to seismic and infrasound data, and weather clouds sometimes prevented views. Elevated surface temperatures were observed in satellite images, which indicated continued hot material on the upper parts of the volcano.
Seismic tremor began to increase at around 0300 on 25 August and was followed by elevated surface temperatures identified in satellite images, consistent with erupting lava. Small explosions were recorded in infrasound data. The ACC was raised to Red and the VAL to Warning at 1204 after a pilot reported an ash plume that rose to 9.1 km altitude. Seismicity peaked at 1630 and began to rapidly decline at around 1730. Ash plumes rose as high as 10 km altitude and drifted as far as 400 km NE. By 2020 the ash plumes had declined to 6.4 km altitude and continued to drift NE. Ash emissions were visible in satellite data until 0000 on 26 August and seismicity was at low levels. AVO lowered the ACC to Orange and the VAL to Watch at 0030. Minor explosive activity within the summit crater was detected during 26-28 August and strongly elevated surface temperatures were still visible in satellite imagery through the rest of the month. An AVO field crew working on Unimak Island observed a mass flow that descended the upper flanks beginning around 1720 on 27 August. The flow produced a short-lived ash cloud that rose to 4.5 km altitude and rapidly dissipated. The mass flow was likely caused by the collapse of spatter that accumulated on the summit crater rim.
Similar variable explosive activity was reported in September, although weather observations sometimes prevented observations. A moderate resolution satellite image from the afternoon of 1 September showed gas-and-steam emissions filling the summit crater and obscuring views of the vent. In addition, hot deposits from the previous 25-26 August explosive event were visible on the NE flank near the summit, based on a 1 September satellite image. On 2 and 4 September seismic and infrasound data showed signals of small, repetitive explosions. Variable gas-and-steam emissions from the summit were visible but there was no evidence of ash. Possible summit crater incandescence was visible in nighttime webcam images during 3-4 September.
Seismicity began to gradually increase at around 0300 on 5 September and activity escalated at around 0830. A pilot reported an ash plume that rose to 7.6 km altitude at 0842 and continued to rise as high as possibly 9.7 km altitude and drifted SSE based on satellite images (figure 47). The ACC was raised to Red and the VAL to Warning at 0900. In addition to strong tremor and sustained explosions, the eruption produced volcanic lightning that was detected by the WWLLN. Around 1100 seismicity decreased and satellite data confirmed that the altitude of the ash emissions had declined to 7.6 km altitude. By 1200 the lower-altitude portion of the ash plume had drifted 125 km E. Significant ash emissions ended by 1330 based on webcam images. The ACC was lowered to Orange and the VAL to Watch at 1440. Satellite images showed extensive pyroclastic debris flows on most of the flanks that extended 1.2-3.3 km from the crater rim.
During 6-13 September elevated surface temperatures continued to be observed in satellite data, seismicity remained elevated with weak but steady tremor, and small, low-frequency earthquakes and small explosions were reported, except on 12 September. On 6 September a low-level ash plume rose to 1.5-1.8 km altitude and drifted SSE. Occasional small and diffuse gas-and-steam emissions at the summit were visible in webcam images. Around 1800 on 13 September seismic tremor amplitudes began to increase, and small explosions were detected in seismic and infrasound data. Incandescent lava at the summit was seen in a webcam image taken at 0134 on 14 September during a period of elevated tremor. No ash emissions were reported during the period of elevated seismicity. Lava fountaining began around 0200, based on webcam images. Satellite-based radar observations showed that the lava fountaining activity led to the growth of a cone in the summit crater, which refilled most of the crater. By 0730 seismicity significantly declined and remained at low levels.
Seismic tremor began to increase around 0900 on 15 September and rapidly intensified. An explosive eruption began at around 1710, which prompted AVO to raise the ACC to Red and the VAL to Warning. Within about 30 minutes ash plumes drifted E below a weather cloud at 8.2 km altitude. The National Weather Service estimated that an ash-rich plume rose as high as 12.8 km altitude and produced volcanic lightning. The upper part of the ash plume detached from the vent around 1830 and drifted E, and was observed over the Gulf of Alaska. Around the same time, seismicity dramatically decreased. Trace ashfall was reported in the community of False Pass (38 km ENE) between 1800-2030 and also in King Cove and nearby marine waters. Activity declined at around 1830 although seismicity remained elevated, ash emissions, and ashfall continued until 2100. Lightning was again detected beginning around 1930, which suggested that ash emissions continued. Ongoing explosions were detected in infrasound data, at a lower level than during the most energetic phase of this event. Lightning was last detected at 2048. By 2124 the intensity of the eruption had decreased, and ash emissions were likely rising to less than 6.7 km altitude. Seismicity returned to pre-eruption levels. On 16 September the ACC was lowered to Orange and the VAL to Watch at 1244; the sulfur dioxide plume that was emitted from the previous eruption event was still visible over the northern Pacific Ocean. Elevated surface temperatures, gas-and-steam emissions from the vent, and new, small lahars were reported on the upper flanks based on satellite and webcam images. Minor deposits were reported on the flanks which were likely the result of collapse of previously accumulated lava near the summit crater.
Elevated seismicity with tremor, small earthquakes, and elevated surface temperatures were detected during 17-23 September. Minor gas-and-steam emissions were visible in webcam images. On 20 September small volcanic debris flows were reported on the upper flanks. On 21 September a small ash deposit was observed on the upper flanks extending to the NE based on webcam images. Seismic tremor increased significantly during 22-23 September. Regional infrasound sensors suggested that low-level eruptive activity was occurring within the summit crater by around 1800 on 23 September. Even though seismicity was at high levels, strongly elevated surface temperatures indicating lava at the surface were absent and no ash emissions were detected; weather clouds at 0.6-4.6 km altitude obscured views. At 0025 on 24 September AVO noted that seismicity continued at high levels and nearly continuous small infrasound signals began, likely from low-level eruptive activity. Strongly elevated surface temperatures were identified in satellite images by 0900 and persisted throughout the day; the higher temperatures along with infrasound and seismic data were consistent with lava erupting at the summit. Around 1700 similarly elevated surface temperatures were detected from the summit in satellite data, which suggested that more vigorous lava fountaining had started. Starting around 1800 low-level ash emissions rose to altitudes less than 4.6 km altitude and quickly dissipated.
Beginning at midnight on 25 September, a series of seismic signals consistent with volcanic flows were recorded on the N side of the volcano. A change in seismicity and infrasound signals occurred around 0535 and at 0540 a significant ash cloud formed and quickly reached 14 km altitude and drifted E along the Alaska Peninsula. The cloud generated at least 150 lightning strokes with thunder that could be heard by people in False Pass. Seismicity rapidly declined to near background levels around 0600. AVO increased the ACC to Red and the VAL to Warning at 0602. The ash cloud detached from the volcano at around 0700, rose to 11.6 km altitude, and drifted ESE. Trace to minor amounts of ashfall were reported by the communities of False Pass, King Cove, Cold Bay, and Sand Point around 0700. Ash emissions continued at lower altitudes of 6-7.6 km altitude at 0820. Small explosions at the vent area continued to be detected in infrasound data and likely represented low-level eruptive activity near the vent. Due to the significant decrease in seismicity and ash emissions the ACC was lowered to Orange and the VAL to Watch at 1234. Radar data showed significant collapses of the crater that occurred on 25 September. Satellite data also showed significant hot, degassing pyroclastic and lahar deposits on all flanks, including more extensive flows on the ENE and WSW sections below two new collapse scarps. Following the significant activity during 24-25 September, only low-level activity was observed. Seismicity decreased notably near the end of the strong activity on 25 September and continued to decrease through the end of the month, though tremor and small earthquakes were still reported. No explosive activity was detected in infrasound data through 2 October. Gas-and-steam emissions rose to 3.7 km altitude, as reported by pilots and seen in satellite images. Satellite data from 26 September showed that significant collapses had occurred at the summit crater and hot, steaming deposits from pyroclastic flows and lahars were present on all the flanks, particularly to the ENE and WSW. A small ash cloud was visible in webcam images on 27 September, likely from a collapse at the summit cone. High elevated surface temperatures were observed in satellite imagery during 27-28 September, which were likely the result of hot deposits on the flanks erupted on 25 September. Minor steaming at the summit crater and from an area on the upper flanks was visible in webcam images on 28 September.
During October, explosion events continued between periods of low activity. Seismicity significantly increased starting at around 2100 on 2 October; around the same time satellite images showed an increase in surface temperatures consistent with lava fountaining. Small, hot avalanches of rock and lava descended an unspecified flank. In addition, a distinct increase in infrasound, seismicity, and lightning detections was followed by an ash plume that rose to 12.2 km altitude and drifted S and E at 0520 on 3 October, based on satellite images. Nighttime webcam images showed incandescence due to lava fountaining at the summit and pyroclastic flows descending the NE flank. AVO reported that a notable explosive eruption started at 0547 and lasted until 0900 on 3 October, which prompted a rise in the ACC to Red and the VAL to Warning. Subsequent ash plumes rose to 6-7.6 km altitude by 0931. At 1036 the ACC was lowered back to Orange and the VAL to Watch since both seismic and infrasound data quieted substantially and were slightly above background levels. Gas-and-steam emissions were observed at the summit, based on webcam images. Trace amounts of ashfall were observed in Cold Bay. Resuspended ash was present at several kilometers altitude near the volcano. During the afternoon, low-level ash plumes were visible at the flanks, which appeared to be largely generated by rock avalanches off the summit crater following the explosive activity. These ash plumes rose to 3 km altitude and drifted W. Trace amounts of ashfall were reported by observers in Cold Bay and Unalaska and flights to these communities were disrupted by the ash cloud. Satellite images taken after the eruption showed evidence of pyroclastic flows and lahar deposits in drainages 2 km down the SW flank and about 3.2 km down the NE flank, and continued erosion of the crater rim. Small explosion craters at the end of the pyroclastic flows on the NE flank were noted for the first time, which may have resulted from gas-and-steam explosions when hot deposits interact with underlying ice.
During 4 October seismicity, including frequent small earthquakes, remained elevated, but was gradually declining. Ash plumes were produced for over eight hours until around 1400 that rose to below 3.7 km altitude. These ash plumes were primarily generated off the sides of the volcano where hot rock avalanches from the crater rim had entered drainages to the SW and NE. Two explosion craters were observed at the base of the NE deposits about 3.2 km from the crater rim. Webcam images showed the explosion craters were a source of persistent ash emissions; occasional collapse events also generated ash. Seismicity remained elevated with sulfur dioxide emissions that had a daily average of more than 1,000 tons per day, and frequent small earthquakes through the end of the month. Frequent elevated surface temperatures were identified in satellite images and gas-and-steam plumes were observed in webcam images, although weather conditions occasionally prevented clear views of the summit. Emissions were robust during 14-16 October and were likely generated by the interaction of hot material and snow and ice. During the afternoon of 21 October a strong gas-and-steam plume rose to 3-4.6 km altitude and extended 40 km WSW, based on satellite images and reports from pilots. On 31 October the ACC was lowered to Yellow and the VAL was lowered to Advisory.
Activity in November was characterized by elevated seismicity with ongoing seismic tremor and small, low-frequency earthquakes, elevated surface temperatures, and gas-and-steam emissions. There was an increase in seismic and infrasound tremor amplitudes starting at 1940 on 2 November. As a result, the ACC was again raised to Orange and the VAL was increased to Watch, although ash was not identified in satellite data. An ash cloud rose to 6.1 km altitude and drifted W according to satellite data at 2000. By 0831 on 3 November ash emissions were no longer visible in satellite images. On 6 and 9 November air pressure sensors detected signals consistent with small explosions. Small explosions were detected in infrasound data consistent with weak Strombolian activity on 19 and 21 November. Seismicity started to decrease on 21 November. On 25 November gas-and-steam emissions were emitted from the vent as well as from a scarp on the NE side of the volcano near the summit. A gas-and-steam plume extended about 50 km SSE and was observed in satellite and webcam images on 26 November. On 28 November small explosions were observed in seismic and local infrasound data and gas-and-steam emissions were visible from the summit and from the upper NE collapse scarp based on webcam images. Possible small explosions were observed in infrasound data on 30 November. Weakly elevated surface temperatures and a persistent gas-and-steam plume from the summit and collapse scarps on the upper flanks. A passing aircraft reported the gas-and-steam plume rose to 3-3.4 km altitude on 30 November, but no significant ash emissions were detected.
Satellite data. MODIS thermal anomaly data provided through MIROVA (Middle InfraRed Observation of Volcanic Activity) showed a strong pulse of thermal activity beginning in July 2023 that continued through November 2023 (figure 48). This strong activity was due to Strombolian explosions and lava fountaining events at the summit crater. According to data from MODVOLC thermal alerts, a total of 101 hotspots were detected near the summit crater in July (11-14, 16-19, 23-24 and 26), August (4, 25-26, and 29), September (5, 12, and 17), and October (3, 4, and 8). Infrared satellite data showed large lava flows descending primarily the northern and SE flanks during the reporting period (figure 49). Sulfur dioxide plumes often exceeded two Dobson Units (DUs) and drifted in different directions throughout the reporting period, based on satellite data from the TROPOMI instrument on the Sentinel-5P satellite (figure 50).
Geologic Background. The symmetrical glacier-covered Shishaldin in the Aleutian Islands is the westernmost of three large stratovolcanoes in the eastern half of Unimak Island. The Aleuts named the volcano Sisquk, meaning "mountain which points the way when I am lost." Constructed atop an older glacially dissected edifice, it is largely basaltic in composition. Remnants of an older edifice are exposed on the W and NE sides at 1,500-1,800 m elevation. There are over two dozen pyroclastic cones on its NW flank, which is covered by massive aa lava flows. Frequent explosive activity, primarily consisting of Strombolian ash eruptions from the small summit crater, but sometimes producing lava flows, has been recorded since the 18th century. A steam plume often rises from the summit crater.
Information Contacts: Alaska Volcano Observatory (AVO), a cooperative program of a) U.S. Geological Survey, 4200 University Drive, Anchorage, AK 99508-4667 USA (URL: https://avo.alaska.edu/), b) Geophysical Institute, University of Alaska, PO Box 757320, Fairbanks, AK 99775-7320, USA, and c) Alaska Division of Geological & Geophysical Surveys, 794 University Ave., Suite 200, Fairbanks, AK 99709, USA (URL: http://dggs.alaska.gov/); MIROVA (Middle InfraRed Observation of Volcanic Activity), a collaborative project between the Universities of Turin and Florence (Italy) supported by the Centre for Volcanic Risk of the Italian Civil Protection Department (URL: http://www.mirovaweb.it/); Hawai'i Institute of Geophysics and Planetology (HIGP) - MODVOLC Thermal Alerts System, School of Ocean and Earth Science and Technology (SOEST), Univ. of Hawai'i, 2525 Correa Road, Honolulu, HI 96822, USA (URL: http://modis.higp.hawaii.edu/); NASA Global Sulfur Dioxide Monitoring Page, Atmospheric Chemistry and Dynamics Laboratory, NASA Goddard Space Flight Center (NASA/GSFC), 8800 Greenbelt Road, Goddard, Maryland, USA (URL: https://so2.gsfc.nasa.gov/); Copernicus Browser, Copernicus Data Space Ecosystem, European Space Agency (URL: https://dataspace.copernicus.eu/browser/).
Ioto
Japan
24.751°N, 141.289°E; summit elev. 169 m
All times are local (unless otherwise noted)
New eruption with discolored water, ejecta, and floating pumice during October-December 2023
Ioto (Iwo-jima), located about 1,200 km S of Tokyo, lies within a 9-km-wide submarine caldera along the Izu-Bonin-Mariana volcanic arc. Previous eruptions date back to 1889 and have consisted of dominantly phreatic explosions, pumice deposits during 2001, and discolored water. A submarine eruption during July through December 2022 was characterized by discolored water, pumice deposits, and gas emissions (BGVN 48:01). This report covers a new eruption during October through December 2023, which consisted of explosions, black ejecta, discolored water, and floating pumice, based on information from the Japan Meteorological Association (JMA), the Japan Coast Guard (JCG), and satellite data.
JMA reported that an eruption had been occurring offshore of Okinahama on the SE side of the island since 21 October, which was characterized by volcanic tremor, according to the Japan Maritime Self-Defense Force (JMSDF) Iwo Jima Air Base (figure 22). According to an 18 October satellite image a plume of discolored water at the site of this new eruption extended NE (figure 23). During an overflight conducted on 30 October, a vent was identified about 1 km off the coast of Okinahama. Observers recorded explosions every few minutes that ejected dark material about 20 m above the ocean and as high as 150 m. Ejecta from the vent formed a black-colored island about 100 m in diameter, according to observations conducted from the air by the Earthquake Research Institute of the University of Tokyo in cooperation with the Mainichi newspaper (figure 24). Occasionally, large boulders measuring more than several meters in size were also ejected. Observations from the Advanced Land Observing Satellite Daichi-2 and Sentinel-2 satellite images also confirmed the formation of this island (figure 23). Brown discolored water and floating pumice were present surrounding the island.
The eruption continued during November. During an overflight on 3 November observers photographed the island and noted that material was ejected 169 m high, according to a news source. Explosions gradually became shorter, and, by the 3rd, they occurred every few seconds; dark and incandescent material were ejected about 800 m above the vent. On 4 November eruptions were accompanied by explosive sounds. Floating, brown-colored pumice was present in the water surrounding the island. There was a brief increase in the number of volcanic earthquakes during 8-14 November and 24-25 November. The eruption temporarily paused during 9-11 November and by 12 November eruptions resumed to the W of the island. On 10 November dark brown-to-dark yellow-green discolored water and a small amount of black floating material was observed (figure 25). A small eruption was reported on 18 November off the NE coast of the island, accompanied by white gas-and-steam plumes (figure 23). Another pause was recorded during 17-19 November, which then resumed on 20 November and continued erupting intermittently. According to a field survey conducted by the National Institute for Disaster Prevention Science and Technology on 19 November, a 30-m diameter crater was visible on the NE coast where landslides, hot water, and gray volcanic ash containing clay have occurred and been distributed previously. Erupted blocks about 10 cm in diameter were distributed about 90-120 m from the crater. JCG made observations during an overflight on 23 November and reported a phreatomagmatic eruption. Explosions at the main vent generated dark gas-and-ash plumes that rose to 200 m altitude and ejected large blocks that landed on the island and in the ocean (figure 26). Discolored water also surrounded the island. The size of the new island had grown to 450 m N-S x 200 m E-W by 23 November, according to JCG.
The eruption continued through 11 December, followed by a brief pause in activity, which then resumed on 31 December, according to JMA. Intermittent explosions produced 100-m-high black plumes at intervals of several minutes to 30 minutes during 1-10 December. Overflights were conducted on 4 and 15 December and reported that the water surrounding the new island was discolored to dark brown-to-dark yellow-green (figure 27). No floating material was reported during this time. In comparison to the observations made on 23 November, the new land had extended N and part of it had eroded away. In addition, analysis by the Geospatial Information Authority of Japan using SAR data from Daichi-2 also confirmed that the area of the new island continued to decrease between 4 and 15 December. Ejected material combined with wave erosion transformed the island into a “J” shape, 500-m-long and with the curved part about 200 m offshore of Ioto. The island was covered with brown ash and blocks, and the surrounding water was discolored to greenish-brown and contained an area of floating pumice. JCG reported from an overflight on 4 December that volcanic ash-like material found around the S vent on the NE part of the island was newly deposited since 10 November (figure 28). By 15 December the N part of the “J” shaped island had separated and migrated N, connecting to the Okinahama coast and the curved part of the “J” had eroded into two smaller islands (figure 27).
References. Ukawa, M., Fujita, E., Kobayashi, T., 2002, Recent volcanic activity of Iwo Jima and the 2001 eruption, Monthly Chikyu, Extra No. 39, 157-164.
Geologic Background. Ioto, in the Volcano Islands of Japan, lies within a 9-km-wide submarine caldera. The volcano is also known as Ogasawara-Iojima to distinguish it from several other "Sulfur Island" volcanoes in Japan. The triangular, low-elevation, 8-km-long island narrows toward its SW tip and has produced trachyandesitic and trachytic rocks that are more alkalic than those of other volcanoes in this arc. The island has undergone uplift for at least the past 700 years, accompanying resurgent doming of the caldera; a shoreline landed upon by Captain Cook's surveying crew in 1779 is now 40 m above sea level. The Motoyama plateau on the NE half of the island consists of submarine tuffs overlain by coral deposits and forms the island's high point. Many fumaroles are oriented along a NE-SW zone cutting through Motoyama. Numerous recorded phreatic eruptions, many from vents on the W and NW sides of the island, have accompanied the uplift.
Information Contacts: Japan Meteorological Agency (JMA), 1-3-4 Otemachi, Chiyoda-ku, Tokyo 100-8122, Japan (URL: http://www.jma.go.jp/jma/indexe.html); Japan Coast Guard (JCG) Volcano Database, Hydrographic and Oceanographic Department, 3-1-1, Kasumigaseki, Chiyoda-ku, Tokyo 100-8932, Japan (URL: https://www1.kaiho.mlit.go.jp/GIJUTSUKOKUSAI/kaiikiDB/kaiyo22-2.htm); Copernicus Browser, Copernicus Data Space Ecosystem, European Space Agency (URL: https://dataspace.copernicus.eu/browser/); Asahi, 5-3-2, Tsukiji, Chuo Ward, Tokyo, 104-8011, Japan (URL: https://www.asahi.com/ajw/articles/15048458).
Search Bulletin Archive by Publication Date
Select a month and year from the drop-downs and click "Show Issue" to have that issue displayed in this tab.
The default month and year is the latest issue available.
Bulletin of the Global Volcanism Network - Volume 43, Number 04 (April 2018)
Dukono (Indonesia)
Ongoing ash explosions, thermal anomalies, and sulfur dioxide emissions through March 2018
Erta Ale (Ethiopia)
New eruptive event forms lava lake and multiple large flow fields 3 km S of South Pit Crater, January 2017-March 2018
Etna (Italy)
Persistent degassing from multiple vents; minor ash emissions and pyroclastic ejecta, September 2017-March 2018
Kadovar (Papua New Guinea)
First confirmed historical eruption, ash plumes, and lava flow, January-March 2018
Karymsky (Russia)
Eruptive activity that began in June 2017 stops after an explosion on 27 January 2018
Kusatsu-Shiranesan (Japan)
Phreatic explosion at Motoshiranesan cone on 23 January 2018 results in one fatality and several injuries
Mayon (Philippines)
Explosion on 13 January 2018 begins new eruptive episode; 5-km-high ash plume on 22 January
Popocatepetl (Mexico)
Ongoing steam, gas, and ash emissions along with intermittent explosions, August 2017-February 2018
Sinabung (Indonesia)
Large explosion with 16.8 km ash plume, 19 February 2018
Stromboli (Italy)
Intermittent explosions and 100-m-long lava flow, November 2017-February 2018
Dukono
Indonesia
1.6992°N, 127.8783°E; summit elev. 1273 m
All times are local (unless otherwise noted)
Ongoing ash explosions, thermal anomalies, and sulfur dioxide emissions through March 2018
The current eruption at Dukono has been ongoing since 1933, with frequent explosions and ash plumes between August 2014 and March 2017 (BGVN 42:06). Similar activity has continued during April 2017-March 2018. Monitoring of the volcano is the responsibility of the Pusat Vulkanologi dan Mitigasi Bencana Geologi (PVMBG), also known as the Center for Volcanology and Geological Hazard Mitigation (CVGHM).
Thermal measurements made by MODIS satellite instruments and processed by MIROVA show regular low-to-moderate thermal anomalies from April to October 2017 (figure 8), but none after December 2017 or in early 2018. MODVOLC analyses of thermal satellite data identified anomalies on 11 April, 29 April, 9 July, 1 August, and 21 August 2017.
Explosions were frequently reported by both PVMBG and the Darwin Volcanic Ash Advisory Centre (VAAC), with ash plumes rising only a few hundred meters above the Malupang Warirang crater and drifting in various directions (table 17). Some plumes during this reporting period drifted for more than 100 km, with the longest reaching 230 km W on 27 May 2017.
Table 17. Monthly summary of reported ash plumes from Dukono for March 2017-March 2018. The direction of drift for the ash plume through each month is highly variable; only notable significant plumes are listed. Data courtesy of Darwin VAAC and PVMBG.
| Month |
Plume Altitude (km) |
Notable Plume Drift |
| Apr 2017 |
1.8-2.4 |
-- |
| May 2017 |
1.8-2.4 |
230 km W (27 May) |
| Jun 2017 |
1.5-3.0 |
140 km E (07 Jun) |
| Jul 2017 |
1.5-2.7 |
-- |
| Aug 2017 |
1.8-2.1 |
150 km (17 Aug) |
| Sep 2017 |
1.5-2.4 |
-- |
| Oct 2017 |
1.5-2.1 |
140-170 km (08 Oct) |
| Nov 2017 |
1.8-2.3 |
170 km (04-05 Nov) |
| Dec 2017 |
1.8-2.1 |
-- |
| Jan 2018 |
2.1 |
-- |
| Feb 2018 |
1.5-2.1 |
-- |
| Mar 2018 |
1.5-3.0 |
-- |
According to NASA Goddard Space Flight Center, SO2 emissions are commonly detected from Dukono, but usually only at low levels, using the Ozone Monitoring Instrument (OMI) aboard NASA's Earth Observing System (EOS) Aura satellite and the Ozone Mapping and Profiler Suite (OMPS) aboard the NASA/NOAA Suomi National Polar-orbiting Partnership (SNPP) satellite. The strongest emissions captured in satellite data during this report period was on 6 March 2018 (figure 9).
Geologic Background. The Dukono complex in northern Halmahera is on an edifice with a broad, low profile containing multiple peaks and overlapping craters. Almost continuous explosive eruptions, sometimes accompanied by lava flows, have occurred since 1933. During a major eruption in 1550 CE, a lava flow filled in the strait between Halmahera and the Gunung Mamuya cone, 10 km NE. Malupang Wariang, 1 km SW of the summit crater complex, contains a 700 x 570 m crater that has also had reported eruptions.
Information Contacts: Pusat Vulkanologi dan Mitigasi Bencana Geologi (PVMBG, also known as Indonesian Center for Volcanology and Geological Hazard Mitigation, CVGHM), Jalan Diponegoro 57, Bandung 40122, Indonesia (URL: http://www.vsi.esdm.go.id/); Darwin Volcanic Ash Advisory Centre (VAAC), Bureau of Meteorology, Northern Territory Regional Office, PO Box 40050, Casuarina, NT 0811, Australia (URL: http://www.bom.gov.au/info/vaac/); Hawai'i Institute of Geophysics and Planetology (HIGP) - MODVOLC Thermal Alerts System, School of Ocean and Earth Science and Technology (SOEST), Univ. of Hawai'i, 2525 Correa Road, Honolulu, HI 96822, USA (URL: http://modis.higp.hawaii.edu/); MIROVA (Middle InfraRed Observation of Volcanic Activity), a collaborative project between the Universities of Turin and Florence (Italy) supported by the Centre for Volcanic Risk of the Italian Civil Protection Department (URL: http://www.mirovaweb.it/); NASA Goddard Space Flight Center (NASA/GSFC), Global Sulfur Dioxide Monitoring Page, Atmospheric Chemistry and Dynamics Laboratory, 8800 Greenbelt Road, Goddard, Maryland, USA (URL: https://so2.gsfc.nasa.gov/).
Erta Ale (Ethiopia) — April 2018 Cite this Report
Erta Ale
Ethiopia
13.601°N, 40.666°E; summit elev. 585 m
All times are local (unless otherwise noted)
New eruptive event forms lava lake and multiple large flow fields 3 km S of South Pit Crater, January 2017-March 2018
Ethiopia's Erta Ale basaltic shield volcano has had at least one active lava lake since the mid-1960s, and possibly much earlier. Two active craters (North Pit and South Pit) within the larger oval-shaped Summit Caldera have exhibited periodic lava fountaining and lava lake overflows over the years. A new eruptive event located about 3 km SE of the Summit Crater appeared on 21 January 2017. Activity at the eruption site increased during subsequent months, sending lava flows several kilometers NE and SW from a newly formed lava lake. This report discusses activity from February 2017 through March 2018 as the flows traveled as far as 16 km from the main vent. Information comes from satellite thermal and visual imagery, and photographs and reports from ground-based expeditions that periodically visit the site.
Summary of activity, February 2017-March 2018. The 21 January 2017 activity at Erta Ale was the first time a vent outside of the Summit Caldera has been observed (figure 50). The initial vent or vents created multiple lava flows that traveled generally NE and SW from their sources, creating at least one lava lake that persisted for about a year (figure 51). The flows began inside an older caldera at a location about 3 km SE of the South Pit Crater, but eventually overflowed the caldera rim in multiple directions. As the flow fields enlarged, thermal imagery captured hot-spots along the flows that were likely produced by breakouts, skylights into lava tunnels, and hornitos, as well as multiple surges of flows across the growing fields (figure 52). The imagery also showed the locations of the advancing flow fronts which had reached over 5 km SW of the source by August 2017 and over 16 km NE of the source by March 2018, eventually reaching the alluvial plain NE of Erta Ale. Thermal anomaly data indicated that the maximum thermal energy output happened in April 2017, gradually decreasing through March 2018. The far NE front of the northeast flow field was still active at end of March 2018.
When the new eruptive episode began, the lava lake at the South Pit Crater drained rapidly to around 80-100 m below the rim, according to visitors to the site a few weeks later. The crater was emitting a strong thermal signal by early March 2017 as the lake level rose again. Visitors in April witnessed a fluctuating lake level rising and falling by up to 20 m every 30 minutes over several days. The thermal signal remained strong at the South Pit Crater through March 2018. Due to significant political instability in the area, ground visits are intermittent, but high-quality photographs were taken in February 2017, December 2017, and January 2018 that show the new lava lake and parts of the new flow fields.
Activity during late January-March 2017. The new eruptive event at Erta Ale began in late January 2017 at the northern end of the Southeast Caldera located; the first lava flows observed were locatedabout 3 km SE from the main Summit Caldera (figure 45 (BGVN 42:07) and figure 50). Two separate vent areas appeared active initially. The northern vent sent lava flows to the NE for several kilometers and to the SW a much shorter distance. The southern vent sent a stream of lava to the S. By the end of January 2017 the North and South Pit Craters at the Summit Caldera were still thermally active, but the signals were much stronger from the new vent areas in the Southeast Caldera (figure 53). A faint thermal signal from about 5 km E of the northern vent suggested the extent of the new flows in that direction.
A small group of travelers led by Ethiopian geologist Enku Mulugeta visited Erta Ale during the first half of February 2017. They reported that within the main Summit Caldera, the hornito in the North Pit Crater had collapsed and the lava lake in the South Pit Crater was about 80-100 m below the caldera floor level. The eruption in the Southeast Caldera was still very active, and they photographed the sizable new lava field which contained numerous pahoehoe flows, actively spattering hornitos, and a large lava lake (figures 51, 52, and 54). During the following months activity remained high both at the new eruption site and at the Summit Caldera where the lava lake in the South Pit Crater gradually rose back up to about 50 m below the caldera floor. Culture Volcan annotated a series of Sentinel-2 satellite thermal images which show the progression of the lava flows through the following year.
By 10 March 2017 only the southern vent area was active inside the Southeast Caldera. It continued to feed the lava field; lava was actively flowing S from the vent towards the W rim of the Southeast Crater, and NE, breaking out from lava tubes which blocked the thermal signal until about 2.6 km NE of the vent (figure 55). Thermal signals from both the North and South Pit Craters were distinct and stronger than in late January.
A site visit to the South Pit Crater on 20 March 2017 demonstrated that the lake level had risen significantly since its drop in early February, and was once again actively convecting (figure 56). By the end of March 2017, satellite thermal imagery made clear the increasing thermal signal at the South Pit Crater, and in the Southeast Caldera, the major increase in effusion to the NE from the main vent. The width of the flow field had increased to about 1,400 m, and the farthest front was about 3,400 m NE from the vent (figure 57). The lava at the source measured about 180 x 75 m in size, suggesting a lava lake; a smaller overflow to the SW appeared to have reached the W rim of the Southeast Caldera by 30 March 2017 near the area where a new flow had first appeared in a 23 January 2017 satellite image (see figure 46, BGVN 42:07).
Activity during April-May 2017. In the next Sentinel-2 satellite image from 9 April (figure 58), the distance to the farthest front of the lava flow had increased to about 4,600 m from the lava lake, and a new flow had appeared a few hundred meters east of the lake that extended about 1,100 m ENE from its source. Lava also flowed SW from the source to the SW rim of the Southeast Crater, appearing to pond against and flow slightly beyond the rim.
A group visited Erta Ale during 11-15 April 2017 in collaboration with Addis Ababa University geologist Enku Mulugeta. They noted that fluctuating lava lake levels at the South Pit Crater were cycling every 30 minutes or so between 40 and 50 m below the caldera floor (figures 59 and 60). Lava tubes from the walls of the crater would feed the lake with fresh lava after it drained. Two coalesced hornitos, about 7 m high, were present in the NE part of the crater, emitting SO2 gas and occasional lava. At the North Crater Pit, noisy degassing of SO2 from several hornitos at the center of the solidified crust was apparent. Observers at the Southeast Caldera could see the lava lake with the top about 10 m below its crater rim, and minor fountaining during the night, but they were not able to get closer than about 700 m due to the active flows.
By the end of April 2017 satellite thermal imagery indicated that the northeast flow field at the Southeast Caldera extended more than 7 km NE from the lake and was curving towards the E (figure 61). The lava lake was still thermally active, as was the South Pit Crater to the NW.
Eleven days later, activity was quite different in the Southeast Caldera. Satellite imagery from 9 May 2017 (figure 62) showed a new, relatively narrow but bright lava flow moving NE for 2-3 km originating in a location slightly NE of the original lava lake; activity farther NE had diminished from the previous image. A subsequent image on 18 May looked similar, but by 19 May the narrow flow had been replaced by a much broader area of thermal anomaly in the region immediately E of the source. By 29 May 2017, the source of the lava appeared to have shifted several hundred meters SE of the earlier location, and a strong thermal signal once again extended NE across the northeast flow field from the new source for about two kilometers (figure 63).
Activity during June-August 2017. The rapidly changing flow field was significantly different again less than two weeks later in satellite imagery captured on 8 June 2017. Lava was flowing N, SE, and S across the northeast lava field, extending beyond the rim of the Southeast Caldera to the N and E. Another very strong thermal signal emerged from the SW corner of the Southeast Caldera where lava was flowing W and S outside the caldera rim forming a new southwest lava field (figure 64).
During June 2017, the most aggressive flow activity contributed to significant growth of the southwest lava field. By 28 June, infrared imaging detected flow fronts 4,500 m SW of the vent; they had extended to about 5,100 m, nearing the base of the SW flank of Erta Ale, by 5 July (figure 65). Flow activity also persisted in the northeast flow field with activity concentrated about 1.5 km NE of the vent on 28 June. Movement increased at the northeast flow field beginning in late June and it had extended to about 3.5 km NE of the lava lake by 5 July 2017.
Significant movement to the NE in the northeast flow field was apparent in satellite images beginning on 21 July 2017; the head of the flow had reached about 9.5 km from the lava lake by 28 July 2017, mostly focused in a narrow channel (figure 66). Activity decreased in the southwest flow field during July; the lava front had advanced only a few hundred meters by the end of July from its position on 5 July.
During August 2017, lava continued to flow from the Southeast Caldera lava lake in two directions. The northeast flow front extended to 12 km from the vent by 17 August and had reached over 14 km by 7 September. The southwest flow field, while it remained in roughly the same area, had a decreased but still significant thermal signature in early September, suggesting continued but diminished activity throughout the period (figures 67).
Activity during September-December 2017. In a Sentinel-2 satellite image from 26 September 2017, it was clear that the South Crater Pit was still thermally active, and that the southwest flow field had largely cooled with only a small area on its NW edge still producing a thermal anomaly (figure 68). In contrast, the northeast flow field had advanced about 1 km in the previous three weeks and was less than a kilometer from the edge of the valley alluvium. It finally reached the edge of the older lava field and began to advance across the alluvium NE of the volcano, more than 16 km from the lava lake, on 16 October 2017 (figure 69). Based on satellite imagery, Cultur Volcan interpreted that activity slowed significantly during November 2017, and while the thermal signal remained strong near the head of the flow, it did not advance significantly across the alluvium.
Visitors to the South Pit Crater in mid-December 2017 reported that its lava lake continued to be active and its level was about 60 m below the rim. They were also able to visit the Southeast Caldera lava lake, 2.7 km SE of the South Pit Crater, and take photographs from its rim; it was about 200 m long and 100 m wide and filled with slowly convecting lava (figures 70, 71). Satellite imagery from 25 December 2017 showed the active lake at the South Pit Crater, the active lake at the Southeast Caldera, and numerous skylights and overflows along the 16-km-long northeast flow field (figure 72).
Activity during January-March 2018. By mid-January 2018 thermal activity was concentrated a few kilometers back from the front of the northeast flow, about 12 km from the lava lake (figure 73). A Volcano Discovery tour group visited during 13-26 January 2018 and was able to access and photograph both the North and South Pit Craters and the new lake and flow fields around the Southeast Caldera with ground-based and aerial drone photography (figures 74-84).
By late March 2018 no thermal signal appeared in satellite imagery at the site of the Southeast Caldera lava lake, although the South Pit Crater was still visible. A large increase in the area of fresh flows and multiple thermal anomalies were present at the flow front of the northeast lava field 14-16 km from the former lava lake (figure 85). During the second half of March, the flow progressed several hundred meters out into the alluvial plain.
MIROVA thermal anomaly data. The MIROVA thermal anomaly data captures information about the distance of the anomalies from the summit as well as the radiative power released from Erta Ale. Both sets of information agree well with observations from the Sentinel-2 and Landsat satellite data. The plot of distance from the summit (figure 86) shows that during August 2016-mid-January 2017 the thermal anomalies were located very close to the summit point, representing heat flow from both the South and North Pit Craters within the Summit Caldera. Beginning on 21 January 2017, the jump in location of the anomalies corresponded with the beginning of the eruption in the Southeast Caldera. The MIROVA thermal anomalies progressed farther from the summit point during March and April 2017, when the northeast flow field was lengthening to the NE. The thermal signal jumps back closer to the summit point in early May corresponding to when new breakouts were spotted near the Southeast Caldera lava lake; the flows again traveled away from the lake during June and July 2017. Active lava flows from mid-August 2017 through March 2018 were visible in satellite imagery 12-16 km from the lava lake, which is reflected in the MIROVA data (figure 86).
The MIROVA data for the radiative power released from Erta Ale during August 2016-March 2018 also corresponds well with satellite and ground observations (figure 87). The levels of radiative power were moderate and constant during August 2016 to mid-January 2017 when only the lava lake and hornitos at the South and North Pit Craters were active (see also figure 47, BGVN 42:07). A moderate spike in the radiative power corresponds to the overflow of the South Pit Crater during 16-20 January 2017, followed by a large spike in radiative power on 21 January when the eruption started in the Southeast Caldera. This was followed by an extended period of increased radiative power as extensive flow fields formed in the Southeast Caldera. The graph is also able to distinguish the movement of the flows from near the Southeast Caldera lava lake to farther away and then near again during March-June 2017. The radiative power graph from 10 March 2017-9 March 2018 clearly shows a gradual decrease in the amount of radiative power over the period, suggesting a decline in flow activity, which corresponds well to satellite observations.
Geologic Background. The Erta Ale basaltic shield volcano in Ethiopia has a 50-km-wide edifice that rises more than 600 m from below sea level in the Danakil depression. The volcano includes a 0.7 x 1.6 km summit crater hosting steep-sided pit craters. Another larger 1.8 x 3.1 km wide depression elongated parallel to the trend of the Erta Ale range is located SE of the summit and is bounded by curvilinear fault scarps on the SE side. Basaltic lava flows from these fissures have poured into the caldera and locally overflowed its rim. The summit caldera usually also holds at least one long-term lava lake that has been active since at least 1967, and possibly since 1906. Recent fissure eruptions have occurred on the N flank.
Information Contacts: European Space Agency (ESA), Copernicus (URL: http://www.esa.int/Our_Activities/Observing_the_Earth/Copernicus; Robert Simon, Sr., Data Visualization Engineer, Planet Labs Inc. (URL: http://www.planet.com/) [Images used under https://creativecommons.org/licenses/by-sa/4.0/]; Cultur Volcan, Journal d'un volcanophile (URL: https://laculturevolcan.blogspot.com); Toucan Photo (URL: http://www.toucan.photo/); Tom Pfeiffer, Volcano Discovery (URL: http://www.volcanodiscovery.com/); MIROVA (Middle InfraRed Observation of Volcanic Activity), a collaborative project between the Universities of Turin and Florence (Italy) supported by the Centre for Volcanic Risk of the Italian Civil Protection Department (URL: http://www.mirovaweb.it/); Stefan Tommasini (URL: http://vulkane-und-natur.de/).
Etna
Italy
37.748°N, 14.999°E; summit elev. 3357 m
All times are local (unless otherwise noted)
Persistent degassing from multiple vents; minor ash emissions and pyroclastic ejecta, September 2017-March 2018
Italy's Mount Etna on the island of Sicily has had historically recorded eruptions for the past 3,500 years and has been erupting continuously since September 2013 through at least March 2018. Lava flows, explosive eruptions with ash plumes, and lava fountains commonly occur from its major summit crater areas that include the North East Crater (NEC), the Voragine-Bocca Nuova (or Central) complex (VOR-BN), the South East Crater (SEC) (formed in 1978), and the New South East Crater (NSEC) (formed in 2011). A new crater, referred to as the "Cono della sella" or CdS, emerged during early 2017 in the saddle between SEC and NSEC (figure 206).
The most recent eruptive episode began with ash emissions from a new vent in the saddle between NSEC and SEC on 20 January 2017, followed by Strombolian activity a few days later (BGVN 42:10). Activity intensified at the end of February when the first of several lava flows emerged from this and other adjacent vents. By mid-March 2017, Strombolian activity, ash emissions, and lava flows had created a cone higher than the adjacent NSEC and SEC cones, referred to as the "Cono della Sella" (CdS) or saddle cone. An effusive episode at the end of April 2017 sent flows down both the N and S flanks of the new cone from multiple vents. Intermittent Strombolian activity and persistent fumarolic activity continued from multiple crater areas, and minor ash emissions were observed a few times through August 2017. The Osservatorio Etneo (OE), which provides weekly reports and special updates on activity, is run by the Catania Branch of Italy's Istituo Nazionale di Geofisica e Vulcanologica (INGV). This report uses information from INGV to summarize events between September 2017 and March 2018.
Although still exhibiting intermittent volcanism, activity at Etna was at low levels during September 2017-March 2018. A comparison of the thermal activity of that period with the previous interval of November 2016-August 2017 (figure 186, BGVN 42:10) demonstrates the order of magnitude decrease from the earlier period (figure 207). Persistent degassing occurred throughout this interval, often with incandescent gas and periodic ash emissions resulting from continued subsidence around crater vents and from small explosive events. Ashfall was reported once in the cities S of Etna in mid-January 2018, and a minor episode of Strombolian activity and ash emissions took place at the eastern vent of NSEC in mid-February 2018.
Activity during September-December 2017. Active degassing at the beginning of September 2017 occurred from the vent at the E rim of the Voragine crater (VOR), and from the NW vent of Bocca Nuova (BN-1) (figure 208). At the Northeast Crater (NEC) and the SE Crater (SEC)-New South East Crater (NSEC) complex, which included the new "Cono del Sella" (CdS), there was widespread degassing from the fumarolic fields located in the bottoms and walls of the craters. Minor explosive activity was reported on 19 September 2017 from BN and NSEC, and nighttime incandescence was reported from the other craters. On 20 September small sporadic ash emissions were noted from NSEC and VOR. Incandescence at night was observed at the SEC-NSEC complex for the remainder of the month, and strong degassing continued at the VOR vent.
Occasional ash emissions were observed during the second week of October 2017 from the Cono della Sella (CdS) (figure 209). A minor ash emission was also reported on 16 October from the SEC-NSEC complex. Minor emissions of brown ash were reported from BN-1 during the last week of October. In the late afternoon of 26 October, a single explosion occurred at one of the three mouths of the Cono della Sella crater. The explosion generated a short jet of incandescent material and a small ash plume that quickly dispersed.
Cloudy weather during November resulted in limited visibility for much of the month. A small, isolated explosion containing minor ash occurred at SEC on 14 November 2017. During the third week of November, a new pit crater appeared at the bottom of NEC that measured 70 x 50 m (figure 210), and intense degassing was observed from BN-1. Frequent small ash emissions were reported from CdS during 24-26 November. In the last week of the month, pulsating degassing from the craters could be detected during periods of limited visibility, as well as a series of explosions with ash emissions from SEC.
Degassing from the summit craters persisted throughout December 2017 with intermittent incandescence observed from fumaroles at NSEC. A few ash emissions were recorded from CdS, including overnight on 14-15 December (figure 211).
Activity during January-March 2018. Similar activity continued throughout January 2018; a small ash emission was observed from CdS on 5 January, and a puff of brown ash emerged from NSEC the next day. Incandescence degassing also continued from the NSEC vents. During the second week of the month, 20 small explosive events were observed from the eastern vent at NSEC, although cloud cover obscured the summit for much of the time. Minor ash emissions continued from NSEC for the rest of the month, along with nighttime incandescence, especially strong from BN-1. On 22 January a modest ashfall affected the communities S of Etna including the city of Catania (27 km S); the lack of visibility prevented identification of which crater produced the ash. By the end of the month, the pit crater at the base of NEC had expanded, causing erosion of the inner E wall (figure 212). In spite of the low level of activity during this period, SO2 emissions were occasionally recorded with satellite instruments. The most significant SO2 plumes were measured during the last few days of January (figure 213).
Two weak ash emissions occurred at NSEC during the first week of February 2018. The frequency of explosions increased during 15-16 February to 1-2 events per hour, producing moderate amounts of brown-gray ash and incandescent pyroclastic material (figure 214); heightened activity lasted for several days. The explosions were heard 20 km E and S from the summit. Faint, non-explosive emissions of gray ash were observed on the morning of 17 February 2018 from NEC (figure 215).
Degassing continued at the summit craters for the remainder of February and throughout March 2018. During an inspection by INGV on 10 March, the expansion of the pit crater at the bottom of NEC was noted, as was continuing collapses of the internal walls which produced minor ash emissions. Activity at the E vent of NSEC included a minor ash emission on 2 March 2018; occasional ejection of incandescent pyroclastic material and modest ash emissions continued throughout the month (figure 216). The ash emissions occurred at irregular intervals, varying from a few tens of minutes to a few hours, more frequently in the last days of the month.
Geologic Background. Mount Etna, towering above Catania on the island of Sicily, has one of the world's longest documented records of volcanism, dating back to 1500 BCE. Historical lava flows of basaltic composition cover much of the surface of this massive volcano, whose edifice is the highest and most voluminous in Italy. The Mongibello stratovolcano, truncated by several small calderas, was constructed during the late Pleistocene and Holocene over an older shield volcano. The most prominent morphological feature of Etna is the Valle del Bove, a 5 x 10 km caldera open to the east. Two styles of eruptive activity typically occur, sometimes simultaneously. Persistent explosive eruptions, sometimes with minor lava emissions, take place from one or more summit craters. Flank vents, typically with higher effusion rates, are less frequently active and originate from fissures that open progressively downward from near the summit (usually accompanied by Strombolian eruptions at the upper end). Cinder cones are commonly constructed over the vents of lower-flank lava flows. Lava flows extend to the foot of the volcano on all sides and have reached the sea over a broad area on the SE flank.
Information Contacts: Sezione di Catania - Osservatorio Etneo, Istituto Nazionale di Geofisica e Vulcanologia (INGV), Sezione di Catania, Piazza Roma 2, 95123 Catania, Italy (URL: http://www.ct.ingv.it/it/ ); MIROVA (Middle InfraRed Observation of Volcanic Activity), a collaborative project between the Universities of Turin and Florence (Italy) supported by the Centre for Volcanic Risk of the Italian Civil Protection Department (URL: http://www.mirovaweb.it/); NASA Goddard Space Flight Center (NASA/GSFC), Global Sulfur Dioxide Monitoring Page, Atmospheric Chemistry and Dynamics Laboratory, 8800 Greenbelt Road, Goddard, Maryland, USA (URL: https://so2.gsfc.nasa.gov/).
Kadovar (Papua New Guinea) — April 2018 Cite this Report
Kadovar
Papua New Guinea
3.608°S, 144.588°E; summit elev. 365 m
All times are local (unless otherwise noted)
First confirmed historical eruption, ash plumes, and lava flow, January-March 2018
The first confirmed historical eruption at Kadovar began around mid-day local time on 5 January 2018, according to witnesses. The steeply-sloped island is approximately 1.4 km in diameter and is located about 25 km NNE from the mouth of the Sepik River on the mainland of Papua New Guinea (figure 1). This report covers activity from the beginning of the eruption on 5 January through March 2018. Information about the eruption is provided by the Rabaul Volcano Observatory (RVO), the Darwin Volcanic Ash Advisory Center (VAAC), satellite sources, news reports, and local observers. A possible eruption was witnessed by explorers in 1700; no other activity was reported until an outbreak of thermal activity in 1976 (NSEB 01:14-01:11, SEAN 03:09) and a short period of seismic unrest in 2015, according to RVO.
Ash and steam emissions from Kadovar were first reported on 5 January 2018. After about 24 hours, more than half of the island was covered by volcanic debris. Activity intensified over the next two weeks; RVO identified five distinct vents located at the summit and along the SE coast. Dense ash plumes and steam rose from the summit vents, and a slowly-extruding lava flow emerged from a vent near the shoreline on the SE flank. Persistent steam and intermittent ash plumes were produced from the summit vent through the end of March. The lava flow grew outward from the shore for tens of meters before collapsing in early February, but it reappeared a few days later. By the end of the first week of March 2018 the flow was about 17 m above sea level; its growth rate had slowed, adding only one meter by late March.
The NOAA/CIMSS Volcanic Cloud Monitoring system generated an alert for an ash cloud moving WNW, as imaged by S-NPP VIIRS, at 0330 UTC on 5 January 2018; Himawari-8 imagery subsequently showed that the eruption began around 0220 UTC. The Darwin VAAC reported two discrete ash plumes drifting W at 2.1 km altitude during the day. After local reports of the eruption Samaritan Airlines flew administrators from the Wewak district to investigate, enabling photographs of ash and steam emissions (figure 2).
The following day, 6 January 2018, photos from a Samaritan Air flight showed that dark gray ash and steam plumes rising from a crater on the SE side of the summit had intensified (figures 3 and 4). It was estimated that 50 or 60% of the island was covered in volcanic debris, which appeared to be primarily ash along with some pyroclastic flows. According to the International Federation of Red Cross and Red Crescent Societies (IFRC), the entire population of Kadovar, about 600 people who lived on the N side of the island, was relocated to nearby Blup Blup Island which is home to about 800 residents. RVO reported minor ashfall on Kairiru and Mushu islands (115 km WNW), and on mainland Papua New Guinea at Mt. Uru in Yangoru (130 km W), Woginara (140 km W), and the Wewak District (100 km W).
Also on 6 January 2018, missionary Brandon Buser set out from Wewak to visit Bam by boat. He observed the steam and ash plumes of Kadovar from about 75 km away. About 25 km W of the island, he felt falling ash. From a few hundred meters offshore he witnessed the ash and steam plumes rising from near the summit as he circled the S and E sides of the island (figures 5-8).
While preparing to head E to Bam, Buser witnessed an explosion that sent large plumes of ash and steam skyward from the SE flank, and a significant cloud of volcanic debris was ejected outward and down the SE flank; large boulders fell into the ocean. Heading rapidly E away from the eruption, he took additional photographs (figures 9-12).
The Darwin VAAC reported on 6 January 2018 that a continuous ash plume was identifiable in satellite imagery moving W and WNW at 2.1 km altitude. By 7 January, the plume could be identified about 220 km WNW in satellite images (figure 13). During their return trip from Bam on 8 January 2018, the missionaries again circled the island and noted that the eruption seemed to be occurring from different vents. The island was covered in ash, and they became covered with wet ash as they traveled under the drifting ash plume. The Darwin VAAC reported the plume drifting WNW extending about 185 km on 8 January. They also noted that the influence of the sea breeze was also spreading minor ash to the SW. Continuous ash emissions were observed by the Darwin VAAC through 11 January, drifting W and NW at 2.1 km altitude.
RVO reported a significant escalation in activity during 12-13 January 2018. An explosion during the previous night ejected large incandescent boulders from the fracture on the SE flank. Residents on Blup Blup (15 km N) could see incandescence high on the volcano's flank. During a flyover on 13 January, RVO noted variable steam and gas emissions rising to 1 km above the Main Crater and identified five distinct vents (figure 14). The SE Coastal Vent was very active with dense white steam emissions rising 600 m from the vent (figure 15). A dome of lava was visible at the base of the steam plume, but no incandescence was observed. The Southern Coastal Vent had been vigorously steaming a few days earlier, and RVO interpreted it to be the source of the incandescent blocks in the explosion a few days before.
Reports of continuous ash emissions at 2.1 km altitude drifting WNW from the Darwin VAAC resumed on 16 January. A brief emission to 3.7 km was also noted that day. Pilot reports on 17 and 18 January indicated that ash was still in the area as high as 3-3.7 km altitude drifting W. The reports of emissions from the Darwin VAAC continued through 24 January. Ash emissions were generally continuous at altitudes from 2.4 to 3 km, although low level emissions of primarily steam and gas were observed on 20 January that included intermittent phases of increased ash content. The plume drift direction was variable, with periods when ash drifted S and SE in addition to the generally prevailing NW and W directions.
During 18-22 January 2018, the Main Crater continued to produce moderate to dark gray ash plumes that rose 500-800 m above the summit, drifting locally S and SE, and a continuous steam plume from the SE Coastal Vent rose as high as 800 m above the island. An incandescent lava flow slowly extruded from the SE Coastal Vent. By the last week of January, the ash plumes were only rising about 100 m above the Main Crater and drifting W; weak incandescence was still observed at night. The white steam plume from the SE Coastal Vent rose closer to 400 m above the island. RVO estimated that the lava flow had risen to about 50 m above sea level and extended 150-200 m out from the coast.
In their report on 2 February 2018, RVO noted that the lava flow continued to grow. A distinct lobe had pushed out from the seaward nose of the flow, by about 20-30 m; it appeared to be channeled by levees which had developed at the flow's sides. At 1830 local time on 1 February, a collapse of the side of the flow facing Blup Blup was observed; it resulted in a plume of gray ash and then vigorous steaming at the collapse site, which also was incandescent at night. The main body of the flow significantly bulged upwards, with a distinct 'valley' visible between the bulge and the island's flank.
RVO reported that on 9 February the lava flow at the SE Coastal Vent had collapsed, causing 5-6 minor tsunamis less than 1 m high that were observed by residents on Blup Blup's E and W coasts. The waves were reported at 1050, before the main collapse of the dome. In a 12 February report, RVO noted that activity from Main Crater consisted of white plumes rising 20 m and drifting a few kilometers SE accompanied by weak nighttime crater incandescence. Activity renewed at the SE Coastal Vent shortly after the collapse of the flow on 9 February 2018; lava re-emerged a few days later, connecting a lava island to the coastline again. Continuous steam emissions from both the Main Crater and the SE Coastal Vent were interrupted by dark ash plumes on 16 and 20-22 February, and occasional explosions were heard by residents on nearby islands. Minor ashfall was reported on Blup Blup on 21 and 22 February.
Eruptive activity continued during March 2018, although at a slower rate. The Main Crater generally produced continuous emissions of white steam and intermittent explosions with dark ash plumes; incandescence was usually visible at night from Blup Blup. According to the Darwin VAAC, a pilot reported an ash plume at 3.9 km altitude drifting SE on 2 March; it was not visible in satellite imagery due to meteoric clouds. The lava flow extruding from the SE Coastal Vent continued to grow, creating a dome that grew from 7-8 m above sea level to 10-17 m above sea level by 8 March. Dark ash emissions from the vent and nighttime incandescence were common. The growth rate slowed later in the month, and only one meter of change was observed between 10 and 20 March.
Satellite data. The MIROVA project recorded thermal anomalies from Kadovar in early January and early March 2018 (figure 16). MODVOLC thermal alerts were issued on three days; 15 and 22 January, and 7 February 2018. During January, small SO2 plumes were recorded by NASA satellites on four occasions (figure 17).
Geologic Background. The 2-km-wide island of Kadovar is the emergent summit of a Bismarck Sea stratovolcano of Holocene age. It is part of the Schouten Islands, and lies off the coast of New Guinea, about 25 km N of the mouth of the Sepik River. Prior to an eruption that began in 2018, a lava dome formed the high point of the andesitic volcano, filling an arcuate landslide scarp open to the south; submarine debris-avalanche deposits occur in that direction. Thick lava flows with columnar jointing forms low cliffs along the coast. The youthful island lacks fringing or offshore reefs. A period of heightened thermal phenomena took place in 1976. An eruption began in January 2018 that included lava effusion from vents at the summit and at the E coast.
Information Contacts: Rabaul Volcano Observatory (RVO), Geohazards Management Division, Department of Mineral Policy and Geohazards Management (DMPGM), PO Box 3386, Kokopo, East New Britain Province, Papua New Guinea, Contact: steve_saunders@mineral.gov.pg, ima_itikarai@mineral.gov.pg; Darwin Volcanic Ash Advisory Centre (VAAC), Bureau of Meteorology, Northern Territory Regional Office, PO Box 40050, Casuarina, NT 0811, Australia (URL: http://www.bom.gov.au/info/vaac/); NASA Earth Observatory, EOS Project Science Office, NASA Goddard Space Flight Center, Goddard, Maryland, USA (URL: http://earthobservatory.nasa.gov/); NASA Goddard Space Flight Center (NASA/GSFC), Global Sulfur Dioxide Monitoring Page, Atmospheric Chemistry and Dynamics Laboratory, 8800 Greenbelt Road, Goddard, Maryland, USA (URL: https://so2.gsfc.nasa.gov/); NOAA, Cooperative Institute for Meteorological Satellite Studies (CIMSS), Space Science and Engineering Center (SSEC), University of Wisconsin-Madison, 1225 W. Dayton St., Madison, Wisconsin 53706, USA (URL: http://cimss.ssec.wisc.edu/); International Federation of Red Cross and Red Crescent Societies (IFRC) (URL: http://www.ifrc.org/); Samaritan Aviation (URL: http://samaviation.com/, https://www.facebook.com/samaritanaviation/); Brandon Buser (URL: https://ethnos360.org/missionaries/brandon-and-rachel-buser, https://www.facebook.com/brandon.buser.35); ABC News (URL: http://www.abc.net.au/news/2018-01-08/tsunami-warning-for-communities-near-erupting-png-volcano/9311544); Google Earth (URL: https://www.google.com/earth/).
Karymsky
Russia
54.049°N, 159.443°E; summit elev. 1513 m
All times are local (unless otherwise noted)
Eruptive activity that began in June 2017 stops after an explosion on 27 January 2018
Recent activity at Karymsky has consisted of ash explosions on 4 June and 20 September 2017, separated by a period of relative quiet (BGVN 42:11). The volcano was quiet after 20 September until another ash explosion on 4 December 2017. This report covers activity from 1 December 2017 through March 2018, using information compiled from the Kamchatka Volcanic Eruptions Response Team (KVERT) and the Tokyo Volcanic Ash Advisory Center (VAAC). According to KVERT, an explosion on 27 January 2018 was last through at least 31 March.
Based on satellite data, KVERT reported that an explosion began at about 0630 on 4 December 2017 and generated an ash cloud that rose to an altitude of 2.7 km and drifted 200 km E. An ash cloud 16 x 12 km in dimension was identified in satellite images about three hours after the explosion, 92 km E of the volcano. The Aviation Color Code was raised from Green to Orange (the second highest level on a four-color scale). A thermal anomaly was identified in satellite data during 3 and 5-6 December.
According to KVERT, another ash plume was identified in satellite data drifting 114 km ENE on 14 December. No further ash emissions were noted afterward; the Aviation Color Code was thus lowered on 24 December to Yellow.
A small ash cloud was identified in satellite imagery drifting near Karymsky on 18 January 2018, and a thermal anomaly was identified on 19 and 23 January. Gas-and-steam plumes drifted 30 km NE and NW on 21 and 25 January, and an ash plume drifted about 100 km NE on 23 January. An explosion at 1430 on 27 January generated ash plumes that rose to an altitude of 5.2 km and drifted 80 km NE-NNE, prompting KVERT to raise the Aviation Color Code to Orange.
Moderate gas-and-steam emissions continued during February and March. Thermal anomalies were detected in satellite images on 3, 9, and 18 February, and 23-26 March; during other days, the volcano was either quiet or obscured by clouds. The Aviation Color Code remained at Orange through the end of the reporting period.
Geologic Background. Karymsky, the most active volcano of Kamchatka's eastern volcanic zone, is a symmetrical stratovolcano constructed within a 5-km-wide caldera that formed during the early Holocene. The caldera cuts the south side of the Pleistocene Dvor volcano and is located outside the north margin of the large mid-Pleistocene Polovinka caldera, which contains the smaller Akademia Nauk and Odnoboky calderas. Most seismicity preceding Karymsky eruptions originated beneath Akademia Nauk caldera, located immediately south. The caldera enclosing Karymsky formed about 7600-7700 radiocarbon years ago; construction of the stratovolcano began about 2000 years later. The latest eruptive period began about 500 years ago, following a 2300-year quiescence. Much of the cone is mantled by lava flows less than 200 years old. Historical eruptions have been vulcanian or vulcanian-strombolian with moderate explosive activity and occasional lava flows from the summit crater.
Information Contacts: Kamchatka Volcanic Eruptions Response Team (KVERT), Far Eastern Branch, Russian Academy of Sciences, 9 Piip Blvd., Petropavlovsk-Kamchatsky, 683006, Russia (URL: http://www.kscnet.ru/ivs/kvert/); Tokyo Volcanic Ash Advisory Center (VAAC), 1-3-4 Otemachi, Chiyoda-ku, Tokyo, Japan (URL: http://ds.data.jma.go.jp/svd/vaac/data/).
Kusatsu-Shiranesan (Japan) — April 2018 Cite this Report
Kusatsu-Shiranesan
Japan
36.618°N, 138.528°E; summit elev. 2165 m
All times are local (unless otherwise noted)
Phreatic explosion at Motoshiranesan cone on 23 January 2018 results in one fatality and several injuries
The large Kusatsu-Shiranesan volcanic complex comprises three overlapping pyroclastic cones and numerous summit craters; it is located about 150 km NW of Tokyo in the Gunma Prefecture of central Japan. Intermittent short-lived historic activity has been reported from the northernmost Shiranesan cone since the beginning of the 19th century. An explosion at the southernmost Motoshiranesan cone in January 2018 resulted in one fatality and several injuries. Information about the event was gathered from the Japan Meteorological Agency (JMA) and various news sources.
Summary of activity during 1976-2014. Small phreatic explosions in the Mizugama and Yugama craters at the northernmost part of the Kusatsu-Shiranesan volcanic complex occurred in 1976, 1982, and 1983 (figure 14). Larger ash-bearing explosions in November and December 1983 sent tephra 30-40 km to communities downwind to the SE from the Yugama and adjacent Karagama craters on the Shiranesan cone. Intermittent increases in seismic activity near the Yugama crater coincided with water discoloration in the crater lake, and possible ejections of debris from hydrothermal activity in 1989 and 1996. Increased hydrothermal activity was noted on the N flank of Yugama during 2013-2014. Seismic swarms, deformation, thermal, and fumarolic activity increased briefly during early June 2014 in the area around the Yugama crater lake, but no eruption was observed. In late June 2014, JMA reported dying vegetation in a forested area 3 km SW of the Motoshiranesan summit area.
Activity during 2014-2017. Seismicity remained elevated from March to mid-August 2014 around the Yugama crater area. Ground deformation data suggested inflation between March 2014 and April 2015 in that area. Field surveys conducted on 4-5 and 10-11 November 2014 indicated fumarolic areas on the N and NE flanks of the Mizugama crater, but no other significant activity. Short-lived increases in seismicity were observed during January-February 2015. A field survey in May 2015 confirmed ongoing thermal activity on the N and NE wall of the Yugama crater, and the N and NE flank of the Mizugama crater. A small-amplitude, 2-minute-long tremor during late June 2015 was the first since January 2013; it was not accompanied by eruptive activity. The fumarolic activity on the N wall of the Yugama Crater was higher during a field survey in October 2015 than in had been the previous May.
Thermal activity was ongoing at Yugama and Mizugama craters during 2015-2017 along with intermittent fumarolic activity in the same general area, but no significant seismicity was reported. By June 2017 the decrease in the concentration of components derived from high-temperature volcanic gas in the lake, and the stable low-level seismicity in the area, led JMA to lower the warning level from 2 to 1 (on a 5 level scale) on 7 June 2017; they noted that the thermal activity continued around the Yugama crater throughout the rest of the year (figures 15-17).
Activity during January-March 2018. JMA reported that at 0959 on 23 January 2018 an eruption began at Kusatsu-Shiranesan coincident with the onset of volcanic tremor which prompted JMA to raise the Alert Level to 3 (on a scale of 1-5); there had been no prior indications of an impending eruption. Skiers at the popular Kusatsu Kokusai ski resort, located on the Ainomine cone, took video showing a plume of tephra and ejected bombs rising from vents around the Kagamiiki and adjacent crater at the summit of the Motoshiranesan cone (see Information Contacts for Mainichi for video link). Motoshiranesan is immediately adjacent S of the Ainomine cone and about 2 km SSE of the Yagama Crater on the Shiranesan cone where all previous historical activity had been reported (figures 14 and 18).
Photos and video posted in news articles showed tephra shooting tens of meters into the air, drifting E, and blanketing the nearby hillside (figure 19); JMA noted ashfall in Nakanojo-machi, in the Gunma Prefecture, about 8 km E. Tephra hit a gondola, shattering glass and injuring four skiers (figure 20). Material fell through the roof of a lodge, where about 100 people had already been evacuated. Ground Self-Defense Force troops were engaging in ski training at the time of the event; one member died from the impact of large tephra blocks, and seven others were injured.
The following day, on 24 January 2018, JMA noted that volcanic earthquakes were numerous but decreasing in number, and two 2-3-minute-long periods of volcanic tremor were detected at 1015 and 1049. Minor but elevated seismicity continued through 30 January, punctuated by periods of tremor. The largest fissure where the eruption occurred was oriented E-W, located just inside the N rim of the northernmost crater at the Motoshiranesan summit (figure 21). Kenji Nogami, a professor at the Tokyo Institute of Technology, confirmed that the event appeared to have been "a typical phreatic eruption" (Japan Times).
The Tokyo Volcanic Ash Advisory Center issued a single volcanic ash advisory on 23 January indicating a possible eruption, but it was not identifiable from satellite data. Observations made on 14 February 2018 confirmed the presence of the vents in the Kagamiike and adjacent crater, but there was no evidence of thermal activity and little fumarolic activity in the area (figure 22). Seismicity decreased steadily after the explosion on 23 January 2018 through the end of March 2018 and no further activity was reported (figure 23).
Geologic Background. The Kusatsu-Shiranesan complex, located immediately north of Asama volcano, consists of a series of overlapping pyroclastic cones and three crater lakes. The andesitic-to-dacitic volcano was formed in three eruptive stages beginning in the early to mid-Pleistocene. The Pleistocene Oshi pyroclastic flow produced extensive welded tuffs and non-welded pumice that covers much of the E, S, and SW flanks. The latest eruptive stage began about 14,000 years ago. Historical eruptions have consisted of phreatic explosions from the acidic crater lakes or their margins. Fumaroles and hot springs that dot the flanks have strongly acidified many rivers draining from the volcano. The crater was the site of active sulfur mining for many years during the 19th and 20th centuries.
Information Contacts: Japan Meteorological Agency (JMA), Otemachi, 1-3-4, Chiyoda-ku Tokyo 100-8122, Japan (URL: http://www.jma.go.jp/jma/indexe.html); The Mainichi (URL: http://mainichi.jp/english/, eruption video URL-https://mainichi.jp/movie/video/?id=121708141#cxrecs_s); The Japan Times (URL: https://www.japantimes.co.jp/); Cable News Network (CNN), Turner Broadcasting System, Inc. (URL: http://www.cnn.com/).
Mayon (Philippines) — April 2018 Cite this Report
Mayon
Philippines
13.257°N, 123.685°E; summit elev. 2462 m
All times are local (unless otherwise noted)
Explosion on 13 January 2018 begins new eruptive episode; 5-km-high ash plume on 22 January
Steep-sloped and symmetrical Mayon has recorded historical eruptions back to 1616 that range from Strombolian fountaining to basaltic and andesitic flows, as well as large ash plumes, and devastating pyroclastic flows and lahars. A lava dome that grew during August-October 2014 resulted in rockfalls, pyroclastic flows, and lava flows from the summit crater that led to evacuations in nearby communities (BGVN 41:03). Activity declined during November and December 2014 and remained low throughout 2015. By February 2016 the Alert Level was reduced to 0 (on a 0-5 scale) by the Philippine Institute of Volcanology and Seismology (PHIVOLCS) which monitors the volcano. A seismic swarm in August 2016, and the beginning of a new eruption in January 2018 are covered in this report with information provided primarily by PHIVOLCS.
After a brief seismic swarm in August 2016, Mayon remained quiet until a phreatic explosion on 13 January 2018 sent an ash plume 2,500 m above the summit and scattered ash over numerous nearby communities. The growth of a new lava dome sent lava flows down the flanks and ash plumes multiple kilometers above the summit during subsequent weeks. Lava fountaining produced incandescence at the summit for many weeks. Lava collapse events from the flow fronts sent pyroclastic density currents (PDC's) down multiple ravines during January and February 2018. Lava fountaining activity became nearly continuous at the beginning of February but began to taper off by mid-month. Flows had reached as far as 4.5 km down ravines, and lava-collapse generated pyroclastic density currents reached 5 km from the summit crater. The pyroclastic activity continued through February from the gravity-driven collapsing flow fronts even though fountaining and lava effusion had decreased. Brief periods of fountaining and gravity-driven lava flow were noted throughout March 2018, but activity had essentially ceased by month's end.
Activity during 2016-2017. Very low seismicity of 0-2 volcanic earthquakes per day was typical for January and early February 2016; the largest number recorded was 12 on 9 January. On 12 February 2016, PHIVOLCS noted that seismicity had remained at baseline levels of 0-2 earthquakes per day for the previous six months, indicating that rock fracturing associated with magmatic activity had diminished. Ground deformation information suggested a return to pre-2014 eruption positions, and low levels of SO2 flux had been consistent since November 2015. They reduced the Alert Level to 0.
Increasing SO2 flux above 1,000 tons/day beginning in July 2016 was accompanied by ground deformation measurements suggesting renewed inflation. A brief swarm of 146 earthquakes was recorded by the Mayon Volcano Observatory's seismic network from 3-6 August; they were located 10 km away on the SE flank. This change led PHIVOLCS to raise the Alert Level back to 1 on 8 September 2016. Seismicity and SO2 levels remained very low through the end of 2016, but GPS data suggested continued inflation. Slight inflation was recorded throughout 2017. Rare days of small seismic swarms of more than 10 earthquakes occurred during 2017, but otherwise seismicity and SO2 flux values remained within background levels.
Activity during January 2018. A sudden phreatic eruption at 1621 local time on 13 January 2018 sent a gray steam-and-ash plume 2,500 m above the summit that drifted SW. The activity lasted for a little under two hours. Traces of ash fell on the Barangays of Anoling (4 km SW), Sua (6 km SW), Quirangay (9 km SW), Tumpa (9 km SW), Ilawod (10 km SW), and Salugan (8 km SW) in the city of Camalig and in the Barangays of Tandarora (26 km WSW), Maninila (8 km SW), and Travesia (10 km SW) in the municipality of Guinobatan. Incandescence at the summit crater was first observed a few hours later. As a result, PHIVOLCS raised the Alert Level from 1 to 2 early the next day.
Two more phreatic explosions occurred the following morning (14 January) at 0849 and 1143 that each produced ash plumes, but they were largely obscured by summit clouds. Minor amounts of ash were reported in Camalig. By the evening, PHIVOLCS had raised the Alert Level again to 3 after three explosions, 158 rockfall events, and the observation of bright incandescence at the summit crater. By 2000 on 14 January they noted the growth of a new lava dome and the beginnings of a lava flow towards the southern flank.
Two lava collapse events on the morning on 15 January each lasted 5-10 minutes. They originated from the lava flow front and produced rockfall and small-volume pyroclastic density currents. Ash plumes drifted SW and rained ash on Travesia, Muladbucad Grande, Maninila, Masarawag, Poblacion, Iraya, Ilawod, Calzada, Inamnan Grande, Inamnan Pequeno, Maguiron, Quitago and Mauraro in the municipality of Guinobatan and on the Baranguays of Cabangan, Anoling, Sua, Tumpa, Quirangay, Gapo, and Sumlang, and Baranguays 1 to 7 in the municipality of Camalig. A degassing event at 1107 produced a grayish to dirty white ash column that rose to a maximum of height of approximately 1,000 m above the summit before drifting WSW.
Lava effusion continued from the summit during 16-21 January 2018 with flows down the Mi-isi and Bonga gullies and occasional short-duration lava fountaining. Tens of daily lava collapse events accompanied the growth of the flow in the Mi-isi gully which had reached about 3 km from the summit by 18 January. Debris from the growing summit dome also descended the Matanag and Buyuan Gullies. Pyroclastic density currents descended the Mi-isi, Matanag, and Buyuan Gullies. Ash plumes rose up to 2 km and drifted SW from the summit crater and caused ashfall in Camalig, Guinobatan, and Polangui (figures 26-28).
Activity increased on 22 January 2018 with lava fountains at the summit reaching 200-500 m high, the lava flow into the Mi-isi drainage extending beyond 3 km, and two new flows in the Bonga gully and upper Buyuan watershed. A dense 5-km-tall ash plume erupted at 1243 during a phreatomagmatic event that lasted for 8 minutes (figure 29). It generated pyroclastic density currents in several drainages within 4 km of the summit vent including Mi-isi, Bonga, Buyuan, Basud, San Andres, Buang, Anoling and other minor drainages. Ash was blown W and fell on the municipalities of Guinobatan, Camalig, Oas, Polangui and Iriga City. Five additional episodes of lava fountaining to 700 m occurred overnight that fed the Mi-isi and Bonga gully flows, and generated ash plumes to 2.5 and 3 km above the summit. This increase in activity led PHIVOLCS to raise the Alert Level to 4. By the following day, more than 50,000 people had evacuated to emergency shelters and civil aviation authorities temporarily closed airports in the cities of Legazpi and Naga.
Numerous episodes of intense lava fountains during the nights of 23-26 January each lasted from a few minutes to more than an hour. They generated 150-600 m high fountains and continued to feed the flows in the Mi-isa and Bonga gullies. Ash plumes also rose from 0.5-5 km above the crater. The Mi-isa gully flow remained at 3 km from the summit, and the Buyuan flow had reached 1 km by 24 January. Pyroclastic density currents in the Mi-isi, Lidong/Basud, and Buyuan drainages were also observed. The PDCs in the Buyuan drainage traveled more than 5 km from the summit crater (figures 30-33).
By the evening of 26 January 2018, the lava fountaining episodes had transitioned into aseismic lava effusion, feeding incandescent flows into the Bonga and Mi-isi gullies on the S flank, and advancing the flow in the Bonga significantly downslope to 1.8 km. Fewer fountaining episodes continued during 27-28 January. Heavy rainfall during 28-29 January remobilized deposits from pyroclastic density currents and generated sediment-laden stream flows in several channels (figure 34) and channel-confined lahars on the Binaan Channel.
A significant increase in lava effusion and fountaining at the summit during the evening of 29 January 2018 fed PDCs into the Mi-isi and Bonga Gullies, and resulted in significant ashfall in Camalig and Guinobatan to the SW. Intermittent lava fountaining to 200 m, flow-front collapses that generated PDC events, low-level ash emissions, and slow lava effusion from the summit crater continued during 30 January-4 February (figures 35 and 36). The Mi-isi and Basud lava flows had advanced to 3.2 and 3.6 km, respectively, from the summit crater by 1 February, and the Bonga-Buyuan flow had advanced 4.3 km by 3 February.
Activity during February-March 2018. Lava fountaining reached 550 m above the summit crater on 5 February and increased to near-continuous activity the next day. Lava flows and incandescent rockfalls were observed throughout the night in the Mi-isi and Bonga-Buyuan channels. High volumes of incandescent lava flows advanced to 3.2, 4.5, and approximately 3.0 km down the Mi-isi, Bonga-Buyuan and Basud channels. Pyroclastic density currents from the collapsing flow fronts reached 4.6, 4.4, and 4.2 km from the summit crater in the same drainages during 7 February. Near-continuous fountaining accompanied by steam plumes that rose up to 800 m continued through 10 February.
Lava fountaining became sporadic and weak beginning on 11 February. Heavy rainfall during 13 February generated channel-confined lahars in the Anoling channel. By 14 February, lava flows remained at 3.3 km, 4.5 km, and 900 m down the Mi-isi, Bonga and Basud gullies, and PDCs had deposited material to distances of 4.6, 4.5, and 4.2 km in the same drainages. Intermittent lava fountaining continued through 22 February. The fountains generally rose 100-600 m above the summit and were often audible more than 10 km from the summit.
Quieter lava effusion with fewer fountaining events was more typical behavior beginning on 23 February. Numerous episodes of lava-collapse pyroclastic density currents were visually observed on the Mi-isi, Basud, and Bonga-Buyuan Gullies within 2-4 kilometers of the summit crater during the second half of February. Deflation of the lower slopes that began on 20 February was recorded by electronic tiltmeter, consistent with the transition to seismically quieter lava effusion at the summit crater. However, the overall electronic tiltmeter and the continuous GPS data indicated that the volcano was still inflated relative to October and November 2017 levels.
Weak fountaining, lava effusion, and degassing were noted during 25-28 February. The sporadic fountains generated plumes that rose 800 m, and weak effusion continued to feed the flows in the drainages. Gravity-driven lava flow movement and degassing with ash plumes rising 600 m above the summit were the primary activity at Mayon on 1 March, although occasional lava fountaining events were still observed. Based on the decrease in activity at the summit, the decrease in seismicity, continued deflation, and significantly lower SO2 emissions, PHIVOLCS lowered the Alert Level to 3 on 6 March 2018.
Brief periods of weak fountaining and lava flows were observed during 7-24 March. The fountaining generated dark gray ash plumes that rose 100-300 m above the summit crater before drifting SW, and were sometimes audible more than 10 km from the summit crater. At night, lava flows continued moving downslope within 3.3, 4.5, and 1.9 km of the crater in the Mi-isi, Bonga, and Basud gullies. Steam plumes rose as high as 2.5 km above the summit before drifting SW on 7 March. Intermittent bluish steam-laden plumes rose to 700 m before drifting SW on 14 March. A slight inflation of the lower flanks beginning on 11 March 2018 was recorded by electronic tiltmeters through at least 22 March. Overall deformation data indicated that the edifice was still inflated relative to pre-eruption baselines.
Beginning around 24 March 2018, the primary activity consisted of intermittent lava collapse events in the Mi-isi gully located between 4-5 km from the summit and steam-laden plumes that drifted SW from the summit. Lava flow effusion at the crater was last detected on 18 March. Ground deformation since 20 February 2018 recorded deflation despite short-term episodes of inflation of its lower and middle slopes, and incandescence at the summit had diminished from intense to faint. Lava flows had begun to stabilize, producing fewer rockfalls and infrequent pyroclastic density currents, the last of which was observed on 27 March 2018. This continued decrease in activity led PHIVOLCS to lower the Alert Level to 2 on 29 March 2018.
VAAC, SO2, and MIROVA information. The Tokyo VAAC reported the first ash emission from Mayon on 13 January 2018 as a plume that rose to 5.2 km altitude and drifted SW. Many subsequent ash emissions were obscured by meteoric clouds and were only occasionally observed in satellite imagery. The ash plume from the large explosion on 22 January was observed in satellite imagery at 10.9 km altitude drifting NW. Numerous daily VAAC reports were issued through February; they were intermittent in March, ending on 23 March 2018. Plumes generally were reported at 5.2-7.6 km altitudes. Small sulfur dioxide plumes were captured by the OMI and OMPS satellite instruments on several days between 22 and 31 January 2018 (figure 37).
The MIROVA project thermal anomaly graph of log radiative power clearly captured the onset of activity at Mayon in mid-January 2018 (figure 38). Thermal activity increased through early February and then slowly decreased through mid-March 2018 when lava effusion ended.
Geologic Background. Symmetrical Mayon, which rises above the Albay Gulf NW of Legazpi City, is the most active volcano of the Philippines. The steep upper slopes are capped by a small summit crater. Recorded eruptions since 1616 CE range from Strombolian to basaltic Plinian, with cyclical activity beginning with basaltic eruptions, followed by longer periods of andesitic lava flows. Eruptions occur predominately from the central conduit and have also produced lava flows that travel far down the flanks. Pyroclastic density currents and mudflows have commonly swept down many of the approximately 40 ravines that radiate from the summit and have often damaged populated lowland areas. A violent eruption in 1814 killed more than 1,200 people and devastated several towns.
Information Contacts: Philippine Institute of Volcanology and Seismology (PHIVOLCS), Department of Science and Technology, University of the Philippines Campus, Diliman, Quezon City, Philippines (URL: http://www.phivolcs.dost.gov.ph/); Tokyo Volcanic Ash Advisory Center (VAAC), 1-3-4 Otemachi, Chiyoda-ku, Tokyo, Japan (URL: http://ds.data.jma.go.jp/svd/vaac/data/); MIROVA (Middle InfraRed Observation of Volcanic Activity), a collaborative project between the Universities of Turin and Florence (Italy) supported by the Centre for Volcanic Risk of the Italian Civil Protection Department (URL: http://www.mirovaweb.it/); NASA Earth Observatory, EOS Project Science Office, NASA Goddard Space Flight Center, Goddard, Maryland, USA (URL: http://earthobservatory.nasa.gov/); NASA Goddard Space Flight Center (NASA/GSFC), Global Sulfur Dioxide Monitoring Page, Atmospheric Chemistry and Dynamics Laboratory, 8800 Greenbelt Road, Goddard, Maryland, USA (URL: https://so2.gsfc.nasa.gov/); The Express (URL: https://www.express.co.uk); European Pressphoto Agency (EPA) (URL: http://www.epa.eu/); Getty Images (URL: https://www.gettyimages.com/); Agence France Presse (AFP) (URL: https://www.afp.com/).
Popocatepetl (Mexico) — April 2018 Cite this Report
Popocatepetl
Mexico
19.023°N, 98.622°W; summit elev. 5393 m
All times are local (unless otherwise noted)
Ongoing steam, gas, and ash emissions along with intermittent explosions, August 2017-February 2018
Located 60 km SE of Mexico City, frequent historical eruptions have been reported from Popocatépetl going back to the 14th century. Activity increased in the mid-1990s after about 50 years of quiescence, and the current eruption, which has been ongoing since January 2005, has included frequent ash plumes and numerous episodes of lava-dome growth and destruction within the 500-m-wide summit caldera. Multiple emissions of steam and gas occur daily, rising generally 1-4 km above the 5.4-km-elevation summit; many contain small amounts of ash. Larger, more explosive events that generate ashfall in neighboring communities often occur every week.
Activity through July 2017 was typical of the ongoing eruption with near-constant emissions of water vapor, gas, and minor ash, as well as multiple explosions every week with ash-plumes and incandescent blocks sent down the flanks (BGVN 42:09). This report covers similar activity through February 2018. Information about Popocatépetl comes from daily reports provided by México's Centro Nacional de Prevención de Desastres (CENAPRED); ash emissions are also reported by the Washington Volcanic Ash Advisory Center (VAAC). Satellite visible and thermal imagery and SO2 data also provide important observations.
Near-constant emissions of steam and gas, often with minor ash content, were typical activity for throughout August 2017-February 2018. Intermittent larger explosions with plumes of moderate ash content that generated ashfall in nearby communities were reported in most months, including several times during October and November 2017, reaching communities as far as 70 km away. Incandescence at the summit was often observed on clear nights, and Strombolian activity that sent incandescent blocks several hundred meters down the flanks occurred at least once each month during September 2017-January 2018. The tallest ash plumes during the period reached 9.1 km altitude in mid-October and 10.3 km altitude at the end of January 2018. Thermal anomalies were persistently detected in satellite data throughout the period, and SO2 plumes were recorded every month with satellite instruments.
Activity during August-September 2017. The Washington VAAC reported satellite observations of an ash plume extending 55 km W of the summit at 6.4 km altitude on 31 July 2017; the plume was mostly gas and steam with a small amount of ash. CENAPRED reported ashfall in Ozumba (18 km W) on 1 August from a plume that rose 2 km above the summit. They also noted numerous low-intensity explosions with steam, gas, and ash during 5-7 August. A small explosion early on 14 August produced a 500-m-high plume with minor ash content that drifted SW. Two explosions later in the day generated ash plumes that rose 0.8 and 1.5 km from the summit and drifted W (figure 94). Another explosion on 15 August produced a plume over 1 km in height with moderate ash content. On 21 August CENAPRED reported an ash plume that rose 4 km and drifted NW (figure 95). The Washington VAAC reported this plume extending 33 km W from the summit at 7.6 km altitude. Later in the day the ash cloud was observed about 230 km W of the summit, and a new cloud at a slightly lower altitude had drifted 45 km NW.
CENAPRED noted 22 explosions with ash during 25-26 August that drifted N and NW. They were observed in satellite imagery by the Washington VAAC at 7.6 km altitude. Eleven explosions with small amounts of ash were reported by CENAPRED on 27 August. There were daily explosions during 28-31 August, but weather clouds obscured views of the summit. Incandescence at the summit crater was observed on many clear nights during August.
During 1-11 September 2017 cloudy conditions generally prohibited observations of the summit, but low-intensity emissions of steam and gas were briefly observed, many containing minor ash. Five explosions with minor ash emissions were reported by CENAPRED on 12 September; the Washington VAAC noted the ash plume in satellite imagery at 6.7 km altitude drifting slowly N. CENAPRED reported 22 explosions with ash and incandescent rocks on the NE flank during 12-13 September.
The Washington VAAC reported ash plumes on 13 September at 8.2 km altitude, on 18 September at 6.4 km altitude drifting W, and on 23 September near 7 km altitude moving to the NNE. Numerous explosions were reported by CENAPRED during 27 and 28 September (figure 96). The Washington VAAC reported the dense ash plume from these explosions at 6.7 km altitude drifting WSW. It extended 130 km W of the volcano by early afternoon on 27 September. CENAPRED reported that an explosion late on 30 September sent incandescent fragments 0.8 km from the crater and produced a dense ash column that rose more than 2 km above the summit.
Activity during October-November 2017. The ash plume from the explosion late on 30 September 2017 was visible in satellite imagery the following morning located 15 km SW from the summit at 7.9 km altitude according to the Washington VAAC. CENAPRED reported three explosions on 2 October and five explosions the next day, causing ashfall in Atlautla (17 km W), Tepetlixpa (21 km W), and Ozumba. Three explosions on 5 October resulted in ashfall in Totolapan (32 km W), Tlalnepantla (40 km W), and Cuernavaca (64 km W), and closer to the volcano in Ecatzingo (15 km SW), Atlautla, and Tepetlixpa. Lahars were also observed on the W flank, but there were no reports of damage. Two more explosions on 6 October led to ashfall reported from Zacualpan de Amilpas (30 km SW) and Tetela del volcán (18 km SW) (figure 97). The Washington VAAC reported the 6 October emissions at 6.4 km altitude.
The first of two explosions on 7 October 2017, shortly after midnight, produced a plume that rose over 2 km and drifted SW with ashfall reported in Tetela del volcán; incandescent blocks were also sent down the flanks (figure 98). The second explosion produced an ash plume that rose 3 km and drifted NNE. The Washington VAAC reported continuing ash emissions during 7-11 October. Numerous plumes rose to 5.8-9.1 km altitude and drifted in several different directions; the plume extended 130 km SW from the summit on 10 October. CENAPRED reported three explosions on 8 October (figure 99) and two on 9 October. Numerous low-intensity exhalative events during 10-12 October produced ash plumes less than 1 km above the crater that drifted SW. Ashfall was reported in several communities during this time including Ozumba, México City (60 km NW), Milpa Alta (45 km NW), Xochimilco (56 km NW), Tlalpan (68 km NW), Coyoacán (66 km NW), Iztapalapa (57 km NW), Magdalena Contreras (72 km NW), and Iztacalco (64 km NW).
CENAPRED noted incandescence at the crater during most nights from 14 to 31 October, as well as steam, gas, and minor ash from hundreds of low-intensity emission events each day. The Washington VAAC reported ash emissions visible in satellite imagery on 16, 20-22, and 26 October drifting in several different directions at altitudes of 5.8-7.6 km. The plume observed on 22 October reached 60 km from the summit before dissipating. CENAPRED reported two explosions with ash plumes each day during 25-27 October. The Washington VAAC reported an ash plume on 29 October at 6.1 km altitude drifting E about 35 km from the summit, and another at 6.7 km the following day along with an infrared hotspot visible at the summit.
The Washington VAAC issued multiple daily ash advisories throughout November 2017. CENAPRED reported hundreds of daily low intensity emissions of gas and steam that often contained minor ash; the plumes generally rose about 1 km above the summit and most often drifted SW. They also observed incandescence at the crater on all clear nights. They reported Strombolian activity on 3 November in the early morning that lasted for several hours. Explosions early on 4 November resulted in minor ashfall in Yecapixtla (29 km SW) and Zacualpan de Amilpas and other areas to the SW. A Strombolian episode later that day lasted for about an hour and resulted in minor ashfall in Tetela del Volcán. Another explosion that night sent incandescent fragments 200 m down the flanks.
An explosion on 6 November sent an ash plume 2.5 km above the summit crater that drifted SW and sent incandescent fragments 500 m down the flank. Another explosion during the early morning of 7 November produced a 2-km-high ash plume. Moderate amounts of ash rose 1 km above the summit on 8 November. There were three explosions on 10 November; the largest produced a 3-km-high ash plume that drifted SW. Continuous low-level emission of gas and ash on 14 November resulted in ashfall reported in Totolapan, Yecapixtla, Ocuituco (23 km SW), Tetela del Volcán, and Ecatzingo. An explosion on 17 November sent an ash plume 2.5 km above the summit that drifted SW. During 18-19 November five explosions caused ash plumes to rise 2 km above the summit and incandescent blocks to fall down the E flank.
Around 1030 on 20 November, seismic activity increased and was accompanied by a constant plume of steam, gas, and moderate ash that rose about 1.5 km and drifted E. During 20-21 November eight explosions were reported, with five more the following day. During the afternoon of 23 November a continuous ash emission that lasted 90 minutes drifted SSE at 2 km above the summit, and spread ash over communities to the SSE including Huaquechula (30 km SSE), Tepeojuma (38 km SE), Atlixco (23 km SE), and Izúcar de Matamoros (50 km SE) (figure 100). Another significant ash emission during the afternoon of 24 November sent a column of ash to 4 km above the summit, drifting SSE; it lasted for almost two hours (figure 101). The Washington VAAC reported the plume at 8.5 km altitude. Ashfall was reported in San Pedro Benito Juárez (12 km SE) and Atlixco. Late that evening, an explosion sent incandescent fragments 1 km down the flanks and generated an ash plume that rose to 2.5 km above the summit and also drifted SSE.
A flyover by CENAPRED and the Federal Police on 25 November 2017 allowed evaluation of the changes in the summit crater from the recent explosions. They noted that the internal crater within the summit crater had increased its dimensions, reaching a diameter of 370 m and a depth of 110 m (figure 102). A 3-km-tall ash plume resulted from continuous emissions that began in the afternoon of 27 November and lasted for two hours. The Washington VAAC reported the plume at 7.9 km altitude. The plume drifted SSE, and dispersed ash over communities in that region including Tochimilco (16 km), Izucar de Matamoros, Atlixco, and Huaquechula.
Activity during December 2017-February 2018. The Washington VAAC issued multiple daily reports of ash emissions during 1-12 and 24-31 December 2017. CENAPRED noted hundreds of daily low-intensity emissions of gas and steam, most with small quantities of ash, throughout December, as well as multiple ash emissions on many days that rose generally 1-2.5 km above the summit. In the early morning of 2 December an explosion caused an ash plume to rise 2.5 km above the summit. A second plume rose 1 km later that day; they both drifted SSE. An explosion in the afternoon of 9 December sent an ash plume over 2.5 km above the summit that drifted NE. The Washington VAAC reported the plume at 7.6 km altitude. Later that evening Strombolian activity sent incandescent blocks down the flanks and generated an ash plume that drifted E. Incandescence was observed at the summit crater during the nights of 17-21 and 24-29 December. Continuous emissions of steam, gas, and moderate-density ash were reported drifting NW for about 90 minutes on 29 December. An explosion on 31 December at 1032 generated a 2-km-high ash plume that also drifted NW.
There were multiple daily reports of ash emissions issued by the Washington VAAC during most days of January 2018. CENAPRED noted hundreds of daily low-intensity emissions of gas and steam, many with small quantities of ash, throughout the month, as well as explosions with ash emissions on many days that generally rose 1-2.5 km above the summit. They also observed incandescence at the summit crater multiple days each week. Ongoing low-level emissions of steam, gas, and minor ash were reported during 4-5 January. During the evening of 5 January activity increased, and the ash plume rose to 800 m and drifted SE. In addition, incandescent blocks were ejected 200-300 m down the flanks for about two hours.
An explosion on 18 January 2018 generated an ash plume that rose 1.5 km above the summit and drifted E while incandescent blocks were ejected up to 700 m down the flanks. An episode of Strombolian activity in the early morning of 25 January produced an ash plume that rose 2 km above the summit and drifted N and NE, resulting in reports of ashfall in San Pedro Nexapa (14 km NE) and Amecameca (19 km NE). It lasted for about 2 hours. Four explosions were reported during the afternoon of 29 January and an explosion the following afternoon produced an ash plume that rose more than 3 km above the summit, and was dispersed to the NW. An explosion on 31 January also produced a substantial ash plume that the Washington VAAC reported at 10.3 km altitude moving NNE (figure 103).
Activity was somewhat quieter at Popocatépetl during February 2018. The Washington VAAC reported ash emissions on 14 days during the month. CENAPRED reported tens, not hundreds, of daily low-intensity emissions of gas and steam that often contained minor amounts of ash. They also noted one or more explosions with ash emissions on many days that rose generally 1-1.5 km above the summit and drifted in various directions. During many clear days they observed nearly constant emissions of steam, gas, and minor ash that reached 500-800 m above the summit. An explosion on 20 February produced an ash plume that rose 1.5 km above the summit. Continuous steam and gas emissions during 22-23 February were accompanied by minor incandescence intermittently observed at the summit.
Satellite data. Sulfur dioxide emissions were large enough to be recorded by satellite instruments several times every month during August 2017-February 2018 (figure 104). Variable wind directions and persistent emissions produced relatively long-lived plumes that dispersed over large areas of Mexico.
Thermal anomaly data provided by the MIROVA project are consistent with the visual record of persistent incandescent and explosive activity at the summit (figure 105). Multiple MODVOLC thermal alerts were also recorded every month from October 2017-February 2018.
Geologic Background. Volcán Popocatépetl, whose name is the Aztec word for smoking mountain, rises 70 km SE of Mexico City to form North America's 2nd-highest volcano. The glacier-clad stratovolcano contains a steep-walled, 400 x 600 m wide crater. The generally symmetrical volcano is modified by the sharp-peaked Ventorrillo on the NW, a remnant of an earlier volcano. At least three previous major cones were destroyed by gravitational failure during the Pleistocene, producing massive debris-avalanche deposits covering broad areas to the south. The modern volcano was constructed south of the late-Pleistocene to Holocene El Fraile cone. Three major Plinian eruptions, the most recent of which took place about 800 CE, have occurred since the mid-Holocene, accompanied by pyroclastic flows and voluminous lahars that swept basins below the volcano. Frequent historical eruptions, first recorded in Aztec codices, have occurred since Pre-Columbian time.
Information Contacts: Centro Nacional de Prevención de Desastres (CENAPRED), Av. Delfín Madrigal No.665. Coyoacan, México D.F. 04360, México (URL: http://www.cenapred.unam.mx/), Daily Report Archive http://www.cenapred.unam.mx:8080/reportesVolcanGobMX/BuscarReportesVolcan); Washington Volcanic Ash Advisory Center (VAAC), Satellite Analysis Branch (SAB), NOAA/NESDIS OSPO, NOAA Science Center Room 401, 5200 Auth Rd, Camp Springs, MD 20746, USA (URL: www.ospo.noaa.gov/Products/atmosphere/vaac, archive at: http://www.ssd.noaa.gov/VAAC/archive.html); MIROVA (Middle InfraRed Observation of Volcanic Activity), a collaborative project between the Universities of Turin and Florence (Italy) supported by the Centre for Volcanic Risk of the Italian Civil Protection Department (URL: http://www.mirovaweb.it/); Hawai'i Institute of Geophysics and Planetology (HIGP) - MODVOLC Thermal Alerts System, School of Ocean and Earth Science and Technology (SOEST), Univ. of Hawai'i, 2525 Correa Road, Honolulu, HI 96822, USA (URL: http://modis.higp.hawaii.edu/); NASA Goddard Space Flight Center (NASA/GSFC), Global Sulfur Dioxide Monitoring Page, Atmospheric Chemistry and Dynamics Laboratory, 8800 Greenbelt Road, Goddard, Maryland, USA (URL: https://so2.gsfc.nasa.gov/).
Sinabung (Indonesia) — April 2018 Cite this Report
Sinabung
Indonesia
3.17°N, 98.392°E; summit elev. 2460 m
All times are local (unless otherwise noted)
Large explosion with 16.8 km ash plume, 19 February 2018
Indonesia's Sinabung volcano has been highly active since its first confirmed Holocene eruption during August and September 2010; ash plumes initially rose up to 2 km above the summit, and falling ash and tephra caused fatalities and thousands of evacuations (BGVN 35:07). It remained quiet after the initial eruption until 15 September 2013, when a new eruptive phase began that has continued uninterrupted through February 2018. Ash plumes rising several kilometers, avalanche blocks falling several kilometers down the flanks, and deadly pyroclastic flows travelling more than 4 km have all been documented repeatedly during the last several years. Details of events during October 2017-March 2018, including the largest explosion to date on 19 February 2018, are covered in this report. Information is provided by, Pusat Vulkanologi dan Mitigasi Bencana Geologi (PVMBG), referred to by some agencies as CVGHM or the Indonesian Center of Volcanology and Geological Hazard Mitigation, the Darwin Volcanic Ash Advisory Centre (VAAC), and the Badan Nacional Penanggulangan Bencana (National Disaster Management Authority, BNPB). Additional information comes from satellite instruments and local observers.
When activity began in 2010, and again when eruptions resumed in 2013, many news accounts included statements that Sinabung had last been active 400 years ago, or even saying specifically that the last eruption was in 1600 CE. Those claims appear to have been caused by a misunderstanding related to the boundary time that Indonesian volcanologists use to categorize volcanoes. Those volcanoes with historical activity, defined as being about 400 years ago (corresponding to the beginning of the Dutch East India Company era), are in the "Type A" group. Those in the "Type B" group, including Sinabung prior to 2010, have not had reported activity in more than 400 years. Using charcoal associated with the most recent pyroclastic flow, Hendrasto et al. (2012) determined that the last previous eruptive activity was 1200 years before present using carbon dating techniques, or 740-880 CE (at 1 sigma).
Although activity remained high from October 2017 through March 2018, a gradual decline in the overall eruptive activity from the beginning of 2017 was apparent. The number of explosions per month generally declined, with no explosions reported during March 2018, for the first time since August 2013 (figure 45). The thermal anomaly record was similar; periods of high heat flow persisted through mid-November 2017, followed by a gradual reduction in the amount of thermal activity, although the intensity remained consistent, according to the MIROVA project (figure 46). Much of the heat flow was attributed to the dome growth at the summit; the dome was destroyed in the large explosion of 19 February 2018.
Throughout the period from October 2017 through 19 February 2018, steam plumes were constantly rising to heights of 1,000-2,400 m above the summit. Avalanche blocks were ejected daily down the E and S flanks from 500-3,500 m, and multiple pyroclastic flows each month traveled between 1,000 and 4,600 m down the SE flank. Tens of explosions occurred monthly, generating ash plumes that rose from 500 to 5,000 m above the summit. Explosive activity was more intermittent during February than the previous months, until 19 February when the largest explosion to date occurred; it included an ash plume that rose to at least 16.8 km altitude and at least ten pyroclastic flows. In spite of the size of the explosion, no injuries or fatalities were reported as most nearby communities had been evacuated from the ongoing activity. Activity decreased substantially during March 2018; there were no explosions, block avalanches, or pyroclastic flows reported, only steam plumes rising 1,000 m above the summit.
Activity during October 2017-January 2018. During October 2017, steam plume heights reached 1,500 m above the summit. Avalanche blocks traveled down the E and S flanks 500-2,500 m, and eight pyroclastic flows traveled 1,000-4,500 m down the SE and S flanks. Ash plume heights ranged from 500 to 3,600 m above the summit. The Darwin VAAC issued 38 aviation alerts during the month. On 1 October they reported an ash plume drifting both NW at 4.6 km altitude and NE at 3.7 km. The next day, the webcam observed an ash emission that rose to 5.5 km altitude. On 4 October an ash plume was spotted in the webcam rising to 5.8 km altitude and drifting ENE. Later that day it had detached from the volcano and was seen drifting NW in satellite imagery. An ash plume on 5 October rose to 3.9 km altitude and drifted ESE. Two ash emission were reported on 7 October; the first rose to 3 km altitude, the second rose to 4.3 km, they both dissipated quickly. On 8 October, three plumes were reported. The first rose to 4.6 km and drifted WSW, the second rose to 3 km and drifted S and the third rose to 3.4 km and also drifted S. The following day, an ash plume rose to 4.6 km and drifted E. BNPB stated that on 11 October, an event at Sinabung generated an ash plume that rose 1.5 km above the crater and drifted ESE, causing ashfall in several local villages. On 12 October an event produced an ash plume that rose 2 km above the crater and was followed by pyroclastic flows traveling 1.5 and 2 km down the S and ESE flanks, respectively.
PVMBG reported ash plumes rising to 3.7 km on 11, 12, and 13 October 2017. Later on 13 October the Jakarta MWO reported an ash plume at 4.3 km. The next day PVMBG reported an ash plume at 5.5 km altitude. A plume on 15 October rose to 3 km and drifted E. A steam plume on 16 October drifted down the SE flank before drifting SE no 16 October (figure 47). On 17 October, a discrete emission rose a few hundred meters above the summit drifted NE. Later that day, an ash plume was seen in the webcam moving SE at 3.4 km. On 18 October, two ash emissions were reported. The first rose to 3.7 km and drifted E, the second rose to 3.9 km and drifted W. An ash plume rose to 4.6 km altitude on 21 October, and to 3.9 km, drifting S, on 23 October. The next day, three ash plumes were reported; the first rose to 3 km, the second to 4.6 km, and the third to 3.7, all drifting E. After five days of quiet, the webcam observed ash plumes that rose to 4.3 km on 30 October, and to 3.9 km on 31 October. Only two MODVOLC thermal alerts were issued, on 20 and 27 October.
Steam plumes were higher during November 2017, rising 2,400 m above the summit. Block avalanches traveled 500-3,000 m down the E and S flanks most days, and ten pyroclastic flows traveled between 2,000-3,500 m down the ESE and S flanks. The ash plumes rose 700-3,200 m above the summit. The Darwin VAAC issued 41 aviation alerts in November. Near-daily ash plumes were observed mostly in the webcam and occasionally in satellite imagery. They generally rose to 3.4-4.9 km altitude; the most common drift directions were S and SW. A number of times, multiple ash plumes were reported in a single day. On 14 November, four ash plumes were observed. The first rose to 3.7 km, the second and third rose to 4.6 km and drifted S and SSW, the last rose to 3.9 km and also drifted SSW. On 20 November a discrete emission produced an ash plume that rose to 5.5 km altitude and drifted SSW. Three ash plumes were recorded the next day, rising 3.9-4.6 km and drifting in multiple directions under variable winds. An ash plume on 23 November was reported by PVMBG at 6.7 km altitude drifting W, the highest noted for the month. MODVOLC thermal alerts appeared twice on 5 November, once on 14 November, and three times on 17 November.
Activity during December 2017 was similar to the previous two months; steam plumes rose 2,000 m above the summit, block avalanches traveled 500-3,500 m down the E and S flanks numerous times, and nine pyroclastic flows descended the ESE and S flanks distances ranging from 2,000 to 4,600 m. Ash plume heights were from 700-4,000 m above the summit. The Darwin VAAC issued 43 aviation alerts in December 2017. They reported ash plume heights of 3.4-4.9 km altitude on most days. Every day during 10-19 December, ash plumes were reported at altitudes of 4.6-5.5 km drifting SW, E or SE. PVMBG reported ash plumes on 26, 27 and 28 December that rose to 3.9, 5.2, and 5.5 km, respectively. BNPB reported pyroclastic flows on 27 December that traveled 3.5-4.6 km SE, and ashfall was reported in many nearby villages including Sukanalu Village (20 km SE), Tonggal Town, Central Kuta, Gamber (4 km SE), Berastepu (4 km SE), and Jeraya (6 km SE). The highest ash plume of the month rose to 6.4 km altitude on 29 December and drifted E. This was followed by another discrete ash emission the same day that rose to 5.8 km and two plumes the next day that rose to 5.2 km and drifted W. There was only one MODVOLC thermal alert issued on 7 December.
The Darwin VAAC issued 56 aviation alerts for January 2018. Multiple discrete ash emissions were reported on most days. Plume altitudes generally ranged from 3.4 to 5.5 km. A 6.1 km altitude plume was visible in satellite imagery on 18 January (figure 48). The drift directions were highly variable throughout the month. Most plumes dissipated within six hours. Incandescent blocks were reported by PVMBG falling 500-1,500 m down the ESE flank on most days when the summit was visible. They also reported a pyroclastic flow on 27 January that traveled 2,500 m ESE from the summit (figure 49). Three MODVOLC thermal alerts were issued on 6 January, and one on 12 January.
Activity during February 2018. During most of February, steam plumes rose only 1,000 m above the summit, and avalanche blocks traveled 500-2,500 m down the ESE and S flanks. Far fewer ash emissions were reported than previous months, but the largest explosive event recorded to date took place on 19 February (figure 50). The Darwin VAAC issued 29 aviation alerts during February 2018. Short-lived ash emissions were reported on 1, 3, 5, 11, and 15 February. The ash plume heights ranged from 3.4-4.6 km altitude, and they drifted S or SW.
The large explosion was first reported by the Darwin VAAC at 0255 UTC on 19 February 2018. It produced an ash plume, which was clearly observed in satellite imagery (figure 51), that quickly rose to at least 16.8 km altitude and began drifting NW (figure 52). It also produced a large SO2 plume that was recorded by satellite instruments (figure 53). Over the next 15 hours the plume dispersed in three different directions at different altitudes. The highest part of the plume drifted NW at 13.7 km and was visible over 300 km from the summit. The lower part of the plume drifted S initially at 6.7 km and gradually lowered to 4.3 km; it was visible 75 km from the summit before dissipating. A middle part of the plume drifted NW at 9.1 km during the middle of the day. Three subsequent minor ash emissions were observed on 20 and 25 February that rose to 3.4 km altitude. There were no VAAC reports issued during March 2018. A MODVOLC thermal alert issued on 11 February was the last for several months.
As many as 10 pyroclastic flows were observed during the 19 February explosion, traveling as far as 4.9 km SSE and 3.5 km E (figures 54 and 55). Ash and tephra as large as a few millimeters in diameter fell in areas downwind, including Simpang Empat (7 km SE), the Namanteran district, Pqyung (5 km SSW), Tiganderket (7 km W), Munthe, Kutambaru (20 km NW), Perbaji (4 km SW), and Kutarayat (figure 56 and 57).
Villagers were temporarily evacuated from nearby villages, but were able to return a few days later (figure 58). Conditions in five districts were so dark that visibility was reduced to about 5 m. In addition, ashfall was recorded as far away as the town of Lhokseumawe, 260 km N. Magma Indonesia reported that the lava dome that had been growing at the summit for some time was destroyed in the 19 February explosion (figure 59). A PVMBG volcanologist reported the volume of the destroyed lava dome was at least 1.6 million cubic meters.
Reference: Hendrasto M, Surono, Budianto A, Kristianto, Triastuty H, Haerani N, Basuki A, Suparman Y, Primulyana S, Prambada O, Loeqman A, Indrastuti N, Andreas A S, Rosadi U, Adi S, Iguchi M, Ohkura T, Nakada S, Yoshimoto M, 2012. Evaluation of Volcanic Activity at Sinabung Volcano, After More Than 400 Years of Quiet. Journal of Disaster Research, vol. 7, no. 1, p. 37-44.
Geologic Background. Gunung Sinabung is a Pleistocene-to-Holocene stratovolcano with many lava flows on its flanks. The migration of summit vents along a N-S line gives the summit crater complex an elongated form. The youngest crater of this conical andesitic-to-dacitic edifice is at the southern end of the four overlapping summit craters. The youngest deposit is a SE-flank pyroclastic flow 14C dated by Hendrasto et al. (2012) at 740-880 CE. An unconfirmed eruption was noted in 1881, and solfataric activity was seen at the summit and upper flanks in 1912. No confirmed historical eruptions were recorded prior to explosive eruptions during August-September 2010 that produced ash plumes to 5 km above the summit.
Information Contacts: Pusat Vulkanologi dan Mitigasi Bencana Geologi (PVMBG, also known as Indonesian Center for Volcanology and Geological Hazard Mitigation, CVGHM), Jalan Diponegoro 57, Bandung 40122, Indonesia (URL: http://www.vsi.esdm.go.id/); Badan Nasional Penanggulangan Bencana (BNPB), National Disaster Management Agency, Graha BNPB - Jl. Scout Kav.38, East Jakarta 13120, Indonesia (URL: http://www.bnpb.go.id/); Sutopo Purwo Nugroho, Head of Information Data and Public Relations Center of BNPB via Twitter (URL: https://twitter.com/Sutopo_PN); MAGMA Indonesia, Kementerian Energi dan Sumber Daya Mineral (URL: https://magma.vsi.esdm.go.id/); Hawai'i Institute of Geophysics and Planetology (HIGP) - MODVOLC Thermal Alerts System, School of Ocean and Earth Science and Technology (SOEST), Univ. of Hawai'i, 2525 Correa Road, Honolulu, HI 96822, USA (URL: http://modis.higp.hawaii.edu/); MIROVA (Middle InfraRed Observation of Volcanic Activity), a collaborative project between the Universities of Turin and Florence (Italy) supported by the Centre for Volcanic Risk of the Italian Civil Protection Department (URL: http://www.mirovaweb.it/); NASA Earth Observatory, EOS Project Science Office, NASA Goddard Space Flight Center, Goddard, Maryland, USA (URL: http://earthobservatory.nasa.gov/); NASA Goddard Space Flight Center (NASA/GSFC), Global Sulfur Dioxide Monitoring Page, Atmospheric Chemistry and Dynamics Laboratory, 8800 Greenbelt Road, Goddard, Maryland, USA (URL: https://so2.gsfc.nasa.gov/); Associated Press (AP), Endro Rusharyanto, Photographer (URL: http://www.ap.org/); Reuters (http://www.reuters.com/).
Stromboli
Italy
38.789°N, 15.213°E; summit elev. 924 m
All times are local (unless otherwise noted)
Intermittent explosions and 100-m-long lava flow, November 2017-February 2018
Confirmed historical eruptions at Stromboli go back 2,000 years; this island volcano in the Tyrrhenian Sea has been a natural beacon with its near-constant fountains of lava for eons. Eruptive activity at the summit consistently occurs from multiple vents at both a north crater area (N Area) and a southern crater group (S or CS Area) on the Terrazza Craterica at the head of the Sciara del Fuoco, a large scarp that runs from the summit down the NW side of the island. Thermal and visual cameras that monitor activity at the vents are located on the nearby Pizzo Sopra La Fossa, above the Terrazza Craterica, and at a location closer to the summit craters.
Eruptive activity during January-October 2017 peaked during June and then declined through August, returning to background levels in September; it included intermittent periods of frequent explosions from both crater areas that sent ash, lapilli, and bombs across the Terrazza Craterica and onto the head of the Sciara del Fuoco (BGVN 43:02). This report covers similar activity from November 2017-February 2018. Weekly reports of activity were provided by Italy's Instituto Nazionale de Geofisica e Vulcanologia (INGV), Sezione de Catania, which monitors the gas geochemistry, deformation, and seismicity, as well as surficial activity.
An explosive sequence on 1 November 2017 followed less than two weeks after a similar event on 23 October (BGVN 43:02) in the CS Area, creating Strombolian activity that sent ejecta 300 m high. Intermittent explosions and spattering continued until the next large explosion on 1 December, also in the CS Area. A general increase in seismicity was recorded during December 2017; intense spattering in the N Area on 15 December formed a lava flow that traveled 100 m N from the rim of the vent before stopping. The number of explosive events remained high (more than 20 per hour) through December, when both the intensity and rate of activity declined significantly, reaching levels below 10 events per hour in early February, and remaining there for the rest of the month. The general levels of intensity in the N and CS Areas, apart from the larger explosive events, were variable throughout November 2017-February 2018, generally increasing during December and decreasing during January (table 3). This pattern of activity is also reflected in the variation of the thermal activity that was recorded in the MIROVA thermal data during that time (figure 117), and the MODVOLC thermal alert data which recorded two alerts in November, and 14 in December, but none after that through February 2018.
Table 3. General intensity and activity levels at the summit vents in the N Area and CS Area at Stromboli, November 2017-February 2018. Intensity values correspond to the height of the ejecta above the vent: Low = less than 80 m high, Med-Low = less than 120 m High, Medium = less than 150 m high, Med-High = sometimes to 200 m, High = over 200 m. Coarse ejecta consisted of lapilli and bombs, and fine ejecta was primarily ash and smaller lava fragments.
| Month |
N Area Activity |
N Area Intensity |
N Area Explosions/Hour |
CS Area Activity |
CS Area Intensity |
CS Area Explosions/Hour |
| Nov 2017 |
Explosions with lapilli and bombs at both vents N1 and N2, occasional vertical lava jets at N1 |
Mostly Low to Med-Low, Medium during last week |
5-12 |
Continuous degassing, explosions with lapilli and bombs, and intense spattering episodes at C, explosions with lapilli and bombs and vertical lava jets at S2, S1 only active during 1 Nov explosion |
Low and Med-Low |
1-7 |
| Dec 2017 |
Explosions with lapilli and bombs at both N1 and N2, mixed with ash at N1 during last week; intense spattering mid-month (lava flow) |
Variable, Low to High |
5-18 |
Continuous degassing interrupted by intense spattering and explosions at C, weakened by month's end; No activity at S1, explosions at S2 of lapilli and bombs mixed with meter-size fragments of lava during first half of month; predominantly fine ash mixed with coarse material during second half of month |
Med-Low at C; variable Low to High at S2 |
2-15 |
| Jan 2018 |
Explosions at N1 and N2; more lapilli and bombs during first half of month, mostly ash mixed with coarser material during second half of month |
Variable, Mostly Low to Medium, occasional High |
3-21 |
Continuous degassing activity interrupted sporadically by explosions of coarse material at C; No activity at S1 until incandescence and occasional ash during last week; explosions at S2 of predominantly fine ash occasionally mixed with coarse lapilli and bombs |
Variable, Low to Med-High |
1-10 |
| Feb 2018 |
Explosions of mostly coarse material (lapilli and bombs) sometimes mixed with ash from N1. More fine ash, less coarse material from N2. |
Med-Low at N1, Low at N2 |
2-9 |
Continuous degassing at C, two points of incandescence after mid-month; occasional incandescence and modest ash emissions at S1 during first half of month; Explosions of predominantly fine ash at S2 |
Low |
1-5 |
On 1 November 2017 at 0829 UTC a strong explosive sequence that lasted about 2 minutes was observed in the CS Area of the Terrazza Craterica (figure 118). The first explosion sent bombs and lapilli around the slopes of the terrace and the ejecta exceeded 300 m in height. Two more explosions followed soon after, sending material about 150 m into the air.
A survey by INGV scientists during 3-5 November 2017 evaluated the effects of this and the previous explosion on 23 October on the Terrazza Craterica. They noted that a large depression with a vent at the base, formed in the CS Area after the 23 October explosions, had been significantly enlarged during the 1 November explosions. Continuous spattering and strong incandescence were observed during the survey at the 4-m-wide C vent. They also observed that the explosive activity at S2 was produced by three emission points. They noted that the N1 site consisted of a single hornito and a secondary vent on the side flank (figure 119).
The 23 October 2017 explosions ejected light brown scoriaceous material S and SE, almost reaching the Pizzo Sopra La Fossa 300 m to the E. A wide band of lithic blocks was also observed on the N flank of the W part of the Valle della Luna, an open area located S of the Terrazza, over a ridge at a higher elevation. During the 1 November explosions abundant black scoriaceous material formed spatter that covered the entire Terrazza Craterica and reached the W wall of the Pizzo facing the craters. Some of this material additionally landed on the NW ridge of the Valle della Luna and on its N flank. Blocks as large as 2 m were ejected during the 1 November event, along with reddish debris that dispersed in a wide area of the Terrazza Craterica and onto the SE flank at the S end of the Pizzo.
Vent C exhibited continuous degassing activity interrupted by short spattering episodes observed mainly on 15 and 21 November 2017. During 20-24 November, a new vent opened between vents S2 and C, which was sporadically active with incandescence and small explosions of fine-grained material. Three emission points were active from the C vent area at the end of November (figure 120).
On 1 December 2017 at 1242 UTC a strong new explosive sequence in the CS crater area was recorded by the seismic network, although weather conditions permitted only observations of incandescence during the event. A large crater was noted a few days later in the area where the three emission points had been active at vent C. A general increase in seismic activity was observed beginning on 4 December that included increases in tremor amplitude, frequency and amplitude of VLP quakes, and the amplitude of explosion earthquakes. On 9 December, numerous explosions from vent S2 combined with strong winds and sent debris as far as the Pizzo Sopra La Fossa located 300 m E (figure 121).
The general increase in seismicity continued into the second week of December 2017. On 15 December 2017 intense spattering began at vent N1 at 1019 UTC. At 1330 the lava overflowed the crater rim and flowed N towards the Pianoro area, the N facing slope of the Terrazza Craterica, reaching about 100 m from the rim of N1 before stopping by 1530 that afternoon (figure 122).
A survey by INGV scientists on 15 December 2017 revealed that the biggest change caused by the 1 December explosion was the formation of a new cone at vent S2 (figure 123a) with an inner crater that was almost 40 m wide. Emissions of dark ash 2-3 times per hour were observed along with spattering and ejected blocks of lava. Vent C, which had been a small pit crater prior to the explosion (figure 123b), had become a small cone that was degassing from the crater, with two smaller lateral vents exhibiting weak but continuous spattering activity (figure 123c). Vent N2 was characterized by infrequent Strombolian activity (1-2 explosions per hour). Most of the activity on 15 December was at vent N1 (figure 123a, e), where INGV scientists observed a new vent with continuous and increasing spattering that soon formed a lava flow. The flow traveled quickly across the crater area. Between 1300 and 1420, 3-4 violent and prolonged explosions at N1 ejected lava fragments tens of meters from at least four emission points. The area was covered with abundant scoriaceous material with average dimensions of 5-6 cm, and numerous fragments of black scoriaceous spatter ranging in size from 20 to 40 cm long; a few were as large as 100 cm.
Activity diminished during January 2018; low- to medium-intensity explosions were typical in the N Area and degassing continued with intermittent explosive activity at the CS Area. During February 2018 activity decreased further with the overall explosion rate averaging generally less than 10 events per hour, a significant decline after the increases in activity that began in early November 2017 (figure 124).
Geologic Background. Spectacular incandescent nighttime explosions at Stromboli have long attracted visitors to the "Lighthouse of the Mediterranean" in the NE Aeolian Islands. This volcano has lent its name to the frequent mild explosive activity that has characterized its eruptions throughout much of historical time. The small island is the emergent summit of a volcano that grew in two main eruptive cycles, the last of which formed the western portion of the island. The Neostromboli eruptive period took place between about 13,000 and 5,000 years ago. The active summit vents are located at the head of the Sciara del Fuoco, a prominent scarp that formed about 5,000 years ago due to a series of slope failures which extends to below sea level. The modern volcano has been constructed within this scarp, which funnels pyroclastic ejecta and lava flows to the NW. Essentially continuous mild Strombolian explosions, sometimes accompanied by lava flows, have been recorded for more than a millennium.
Information Contacts: Istituto Nazionale di Geofisica e Vulcanologia (INGV), Sezione di Catania, Piazza Roma 2, 95123 Catania, Italy, (URL: http://www.ct.ingv.it/en/); MIROVA (Middle InfraRed Observation of Volcanic Activity), a collaborative project between the Universities of Turin and Florence (Italy) supported by the Centre for Volcanic Risk of the Italian Civil Protection Department (URL: http://www.mirovaweb.it/); Hawai'i Institute of Geophysics and Planetology (HIGP) - MODVOLC Thermal Alerts System, School of Ocean and Earth Science and Technology (SOEST), Univ. of Hawai'i, 2525 Correa Road, Honolulu, HI 96822, USA (URL: http://modis.higp.hawaii.edu/).