Recently Published Bulletin Reports
Ambrym (Vanuatu) New effusive eruption during January 2024
Popocatepetl (Mexico) Daily gas-and-ash emissions, ashfall, and occasional explosions during August-November 2023
Reventador (Ecuador) Daily explosions, gas-and-ash emissions, and incandescent avalanches during August-November 2023
Erta Ale (Ethiopia) Strong lava lake activity and lava overflows during June-November 2023
Ubinas (Peru) New eruption with explosions and ash plumes during June-December 2023
Kanaga (United States) Small explosion on 18 December 2023
Klyuchevskoy (Russia) New eruption consisting of Strombolian activity, lava flows and fountains, and ash plumes during June-December 2023
Agung (Indonesia) Three eruptive events reported in April, May, and December 2022
Saunders (United Kingdom) Persistent thermal anomalies from the summit crater lava lake during February 2023-January 2024
Tengger Caldera (Indonesia) Minor ash emission in December 2023; persistent weak thermal anomaly in the Bromo crater
Shishaldin (United States) New eruption with significant Strombolian explosions, ash plumes, and ashfall
Ioto (Japan) New eruption with discolored water, ejecta, and floating pumice during October-December 2023
Ambrym (Vanuatu) — February 2024  Cite this Report
Ambrym
Vanuatu
16.25°S, 168.12°E; summit elev. 1334 m
All times are local (unless otherwise noted)
New effusive eruption during January 2024
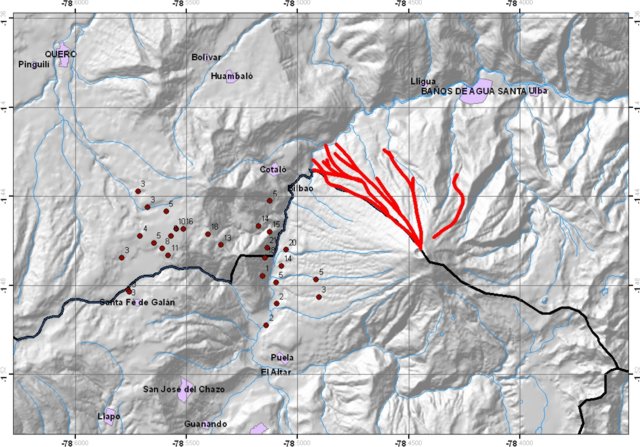
Ambrym contains a 12-km-wide caldera and is part of the New Hebrides Arc, located in the Vanuatu archipelago. The two currently active craters within the caldera are Benbow and Marum, both of which have produced lava lakes, explosions, lava flows, and gas-and-ash emissions. The previous eruption occurred during late January 2022 and was characterized by ash plumes, sulfur dioxide plumes, and crater incandescence (BGVN 47:05). This report covers a new, short eruption during January 2024, which consisted of a lava effusion and an explosion. Information comes from the Vanuatu Meteorology and Geohazards Department (VMGD) and satellite data.
VMGD reported that at 2217 on 13 January an eruption began at Benbow Crater, based on webcam and seismic data. The eruption was characterized by a loud explosion, intense crater incandescence (figure 55), and gas-and-steam emissions. As a result, the Volcano Alert Level (VAL) was raised from 1 to 3 (on a scale of 0-5). A lava flow was reported in Benbow Crater, which lasted for four days. Satellite data showed that 1,116 tons of sulfur dioxide per day (t/d) were emitted on 14 January (figure 56). During the morning of 15 January, ground reports noted loud explosions and minor earthquakes. The sulfur dioxide flux on 15 January was 764 t/d. During 15-17 January activity decreased according to webcam images, seismic data, and field observations. No sulfur dioxide emissions were reported after 15 January. Gas-and-ash emissions also decreased, although they continued to be observed through 31 January, and crater incandescence was less intense (figure 57). The VAL was lowered to 2 on 17 January.
Geologic Background. Ambrym is a large basaltic volcano with a 12-km-wide caldera formed during a major Plinian eruption with dacitic pyroclastic flows about 1,900 years ago. A thick, almost exclusively pyroclastic sequence, initially dacitic then basaltic, overlies lava flows of a pre-caldera shield volcano. Post-caldera eruptions, primarily from Marum and Benbow cones, have partially filled the caldera floor and produced lava flows that ponded on the floor or overflowed through gaps in the caldera rim. Post-caldera eruptions have also formed a series of scoria cones and maars along a fissure system oriented ENE-WSW. Eruptions have been frequently reported since 1774, though mostly limited to extra-caldera eruptions that would have affected local populations. Since 1950 observations of eruptive activity from cones within the caldera or from flank vents have occurred almost yearly.
Information Contacts: Geo-Hazards Division, Vanuatu Meteorology and Geo-Hazards Department (VMGD), Ministry of Climate Change Adaptation, Meteorology, Geo-Hazards, Energy, Environment and Disaster Management, Private Mail Bag 9054, Lini Highway, Port Vila, Vanuatu (URL: http://www.vmgd.gov.vu/, https://www.facebook.com/VanuatuGeohazardsObservatory/); Copernicus Browser, Copernicus Data Space Ecosystem, European Space Agency (URL: https://dataspace.copernicus.eu/browser/).
Popocatepetl (Mexico) — January 2024 Cite this Report
Popocatepetl
Mexico
19.023°N, 98.622°W; summit elev. 5393 m
All times are local (unless otherwise noted)
Daily gas-and-ash emissions, ashfall, and occasional explosions during August-November 2023
Popocatépetl, located 70 km SE of Mexica City, Mexico, contains a 400 x 600 m-wide summit crater. Records of activity date back to the 14th century; three Plinian eruptions, the most recent of which took place about 800 CE, have occurred since the mid-Holocene, accompanied by pyroclastic flows and voluminous lahars that swept basins below the volcano. The current eruption period began in January 2005, characterized by numerous episodes of lava dome growth and destruction within the summit crater. Recent activity has been characterized by daily gas-and-ash emissions, ashfall, and explosions (BGVN 48:09). This report covers similar activity during August through November 2023, according to daily reports from Mexico's Centro Nacional de Prevención de Desastres (CENAPRED) and various satellite data.
Daily gas-and-steam emissions, containing some amount of ash, continued during August through November 2023. CENAPRED reported the number of low-intensity gas-and-ash emissions or “exhalations” and the minutes of tremor, which sometimes included harmonic tremor in their daily reports (figure 220). A total of 21 volcano-tectonic (VT) tremors were detected throughout the reporting period. The average number of exhalations was 117 per day, with a maximum number of 640 on 25 September. Frequent sulfur dioxide plumes that exceeded two Dobson Units (DU) and drifted in multiple directions were visible in satellite data from the TROPOMI instrument on the Sentinel-5P satellite (figure 221).
Activity during August was relatively low and mainly consisted of occasional explosions, ash emissions, and light ashfall. There were 30 explosions (25 minor explosions and four moderate explosions), and nine VT-type events detected. An average number of 60 exhalations occurred each day, which mostly consisted of water vapor, volcanic gases, and a small amount of ash. On 2 August the National Center for Communications and Civil Protection Operations (CENACOM) reported light ashfall in Ocuituco (22 km SW), Yecapixtla (31 km SW), Cuautla (43 km SW), and Villa de Ayala (47 km SW). On 7 August light ashfall was observed in Atlautla (16 km W). A minor explosion at 0305 on 11 August was accompanied by crater incandescence. Explosions at 0618 on 13 August produced a gas-and-ash plume that rose above the summit, and at 0736 another explosion produced a puff of gas-and-ash (figure 222). Two minor explosions were detected at 0223 and 0230 on 16 August that generated eruptive columns with low ash content rising 800 m and 700 m above the crater, respectively. On 24 August an eruptive event lasted 185 minutes and consisted of light ash emissions that did not exceed 300 m above the crater. According to the Washington VAAC, ash plumes identified in daily satellite images rose to 4.6-7.6 km altitude and drifted in multiple directions, the highest of which occurred on 29 August.
There was an average of 156 exhalations each day during September, a monthly total of seven VT-type events, and 29 explosions, 14 of which were minor and nine of which were moderate. A gas-and-ash plume rose to 2 km above the summit and drifted WSW at 1216 on 1 September. CENACOM reported at 1510 observations of ashfall in Ozumba (18 km W), Atlautla, Tepetlixpa (20 km W), and Ecatzingo (15 km SW), as well as in Morelos in Cuernavaca (65 km WSW), Temixco (67 km WSW), Huitzilac (67 km W), Tepoztlán (49 km W), and Jiutepec (59 km SW). The next day, gas-and-ash plumes rose to 2 km above the summit (figure 223). At 1100 ashfall was reported in Amecameca (15 km NW), Ayapango (24 km WNW), Ozumba, Juchitepec, Tenango del Aire (29 km WNW), Atlautla, and Tlalmanalco (27 km NW). A gas-and-ash plume rose to 1 km above the summit and drifted WNW at 1810. During 5-6, 8-9, 12, 14, 19, and 24-25 September ashfall was reported in Amecameca, Atlautla, Ozumba, Tenango del Aire, Tepetlixpa, Juchitepec, Cuernavaca, Ayala, Valle de Chalco (44 km NW), Ixtapaluca (42 km NW), La Paz (50 km NW), Chimalhuacán, Ecatepec, Nezahualcóyotl (60 km NW), Xochimilco (53 km SE), Huayapan, Tetela del Volcano (20 km SW), Yautepec (50 km WSW), Cuautla (43 km SW), Yecapixtla (30 km SW) and possibly Tlaltizapán (65 km SW), Tlaquiltenango, and Tepalcingo. According to the Washington VAAC, ash plumes identified in daily satellite images rose to 5.8-9.1 km altitude and drifted in multiple directions, the highest of which was identified during 1-2 August.
Activity during October and November was relatively low. An average of 179 exhalations consisting of gas-and-steam and ash emissions were reported during October and 73 during November. Only one VT-type event and two explosions were detected during October and four VT-type events and one explosion during November. A satellite image from 0101 on 14 October showed ash fanning out to the NW at 6.7 km altitude and an image from 0717 showed a continuously emitted ash plume drifting WNW and NW at the same altitude. Ash emissions at 1831 on 14 October were ongoing and visible in webcam images slowly drifting W at an altitude of 6.4 km altitude (figure 224). On 24 October a tremor sequence began at 0310 that generated a gas-and-ash plume that rose 800 m above the summit and drifted W. Another tremor sequence occurred during 1305-1900 on 25 October that consisted of continuous ash emissions. Ash plumes identified in daily satellite images rose to 5.5-8.5 km altitude and drifted in different directions during October, according to the Washington VAAC. The highest ash plume was detected on 23 October. During 10-13 November ash plumes rose to 6.7 km altitude and drifted N, NNW, NE, and NW. On 13 November a M 1.5 VT-type event was detected at 0339 and light ashfall was reported in Amecameca, Cocotitlán (34 km NW), and Tenango del Aire, and Ocuituco. On 14 November ash plumes rose to 6 km altitude and drifted N, NE, and SE and light ashfall was reported in Cuernavaca (64 km W). The Washington VAAC reported frequent ash plumes that rose to 5.8-7.9 km altitude and drifted in several directions; the highest ash plume was recorded on 28 November.
Satellite data. MODIS thermal anomaly data provided through MIROVA (Middle InfraRed Observation of Volcanic Activity) showed frequent low-to-moderate thermal anomalies during the reporting period (figure 225). The intensity of the anomalies was lower compared to previous months. According to data from MODVOLC thermal alerts, a total of ten hotspots were detected at the summit crater on 2 August and 2, 4, 9, 19, and 26 September. Thermal activity in the summit crater was visible in infrared satellite data and was sometimes accompanied by ash plumes, as shown on 17 November (figure 226).
Geologic Background. Volcán Popocatépetl, whose name is the Aztec word for smoking mountain, rises 70 km SE of Mexico City to form North America's 2nd-highest volcano. The glacier-clad stratovolcano contains a steep-walled, 400 x 600 m wide crater. The generally symmetrical volcano is modified by the sharp-peaked Ventorrillo on the NW, a remnant of an earlier volcano. At least three previous major cones were destroyed by gravitational failure during the Pleistocene, producing massive debris-avalanche deposits covering broad areas to the south. The modern volcano was constructed south of the late-Pleistocene to Holocene El Fraile cone. Three major Plinian eruptions, the most recent of which took place about 800 CE, have occurred since the mid-Holocene, accompanied by pyroclastic flows and voluminous lahars that swept basins below the volcano. Frequent historical eruptions, first recorded in Aztec codices, have occurred since Pre-Columbian time.
Information Contacts: Centro Nacional de Prevención de Desastres (CENAPRED), Av. Delfín Madrigal No.665. Coyoacan, México D.F. 04360, México (URL: http://www.cenapred.unam.mx/, Daily Report Archive https://www.gob.mx/cenapred/archivo/articulos); Washington Volcanic Ash Advisory Center (VAAC), Satellite Analysis Branch (SAB), NOAA/NESDIS OSPO, NOAA Science Center Room 401, 5200 Auth Rd, Camp Springs, MD 20746, USA (URL: www.ospo.noaa.gov/Products/atmosphere/vaac, archive at: http://www.ssd.noaa.gov/VAAC/archive.html); MIROVA (Middle InfraRed Observation of Volcanic Activity), a collaborative project between the Universities of Turin and Florence (Italy) supported by the Centre for Volcanic Risk of the Italian Civil Protection Department (URL: http://www.mirovaweb.it/); Hawai'i Institute of Geophysics and Planetology (HIGP) - MODVOLC Thermal Alerts System, School of Ocean and Earth Science and Technology (SOEST), Univ. of Hawai'i, 2525 Correa Road, Honolulu, HI 96822, USA (URL: http://modis.higp.hawaii.edu/); NASA Global Sulfur Dioxide Monitoring Page, Atmospheric Chemistry and Dynamics Laboratory, NASA Goddard Space Flight Center (NASA/GSFC), 8800 Greenbelt Road, Goddard, Maryland, USA (URL: https://so2.gsfc.nasa.gov/); Copernicus Browser, Copernicus Data Space Ecosystem, European Space Agency (URL: https://dataspace.copernicus.eu/browser/).
Reventador (Ecuador) — January 2024 Cite this Report
Reventador
Ecuador
0.077°S, 77.656°W; summit elev. 3562 m
All times are local (unless otherwise noted)
Daily explosions, gas-and-ash emissions, and incandescent avalanches during August-November 2023
Volcán El Reventador, located in Ecuador, is a stratovolcano with a 4-km-wide avalanche scarp open to the E that was formed by edifice collapse. The largest recorded eruption took place in 2002 producing a 17-km-high eruption column, pyroclastic flows that traveled as far as 8 km, and lava flows from summit and flank vents. Recorded eruptions date back to the 16th century and have been characterized by explosive events, lava flows, ash plumes, and lahars. Frequent lahars have built deposits on the scarp slope. The current eruption period began in July 2008 and has recently been characterized daily explosions, gas-and-ash emissions, and block avalanches (BGVN 48:08). This report covers similar activity during August through November 2023 using daily reports from Ecuador's Instituto Geofisico (IG-EPN) and satellite data.
During August through November 2023, IG-EPN reported daily explosions, gas-and-ash plumes that rose as high as 1.3 km above the crater, and frequent crater incandescence, often accompanied by incandescent block avalanches that affected one or multiple flanks. More daily explosions were detected during November, with an average total of 46 per day.
Table 19. Monthly summary of explosions and plume heights recorded at Reventador from August through November 2023. Data could not be collected for 29-30 September 2023 and 6-23 October 2023. Data courtesy of IG-EPN (August-November 2023 daily reports).
| Month |
Average number of explosions per day |
Max plume height above the crater rim (km) |
| Aug 2023 |
32 |
1.3 |
| Sep 2023 |
30 |
1 |
| Oct 2023 |
31 |
1.3 |
| Nov 2023 |
46 |
1.2 |
Activity during August consisted of 6-75 daily explosions, nighttime crater incandescence, and incandescent avalanches of material. Frequent seismicity was mainly characterized by long-period (LP) events, harmonic tremor (TRARM), tremor-type (TRE), and volcano tectonic (VT)-type events. Daily gas-and-ash emissions rose 200-1,300 m above the summit and drifted W, SW, NW, NE, N, and E, based on webcam and satellite images. The Washington VAAC also reported occasional ash plumes that rose 400-1,600 m above the crater and drifted NW. Avalanches of incandescent material were reported during 1-2, 6-7, 9-14, 16-17, 18-21, and 26-29 August, which traveled 500-900 m below the crater and affected multiple flanks (figure 180). During 24-25 August incandescent material was ejected 300 m above the crater.
Gas-and-ash emissions and seismicity characterized by LP, VT, TRARM, and TRE-type events continued during September; data were not available for 29-30 September. Daily gas-and-ash emissions rose 200-1,000 m above the crater and generally drifted W, NW, and SW (figure 181). Near-daily explosions ranged from 16-53 per day, often accompanied by incandescent avalanches, which affected one or multiple flanks and traveled 100-800 m below the crater. During 2-3 September incandescent material was ejected 200 m above the crater and was accompanied by blocks rolling down the flanks. During 16-17 September incandescent material was ejected 100-200 m above the crater and avalanches descended 600 m below the crater. During 21-22 and 24-26 September incandescent material was ejected 100-300 m above the crater. According to the Washington VAAC, ash plumes rose 700 m above the crater and drifted SW, W, and NW on 3, 16, and 20 September, respectfully.
During October, daily explosions, gas-and-ash plumes, and crater incandescence continued, with 16-40 explosions recorded each day (figure 182); data was not available for 6-23 October. Seismicity consisted of LP, TRE, and TRARM-type events. Gas-and-ash emissions rose 200-1,000 m above the crater and drifted W, SW, NW, SSW, NNW, and NE. The Washington VAAC reported that ash plumes rose 1-1.3 km above the crater and drifted W, SW, and NW during 1-5 October. During 30 September-1 October incandescent avalanches descended 700 m below the crater. Ejected material rose 200 m above the crater during 2-5 October and was accompanied by avalanches of material that traveled 250-600 m below the crater rim; incandescent avalanches were also reported during 23-29 October.
Daily explosions, LP, TRARM, VT, and TRE-type events, crater incandescence, and avalanches of material continued during November. There were 26-62 daily explosions detected throughout the month. Gas-and-ash emissions rose 300-1,200 m above the crater and drifted in different directions (figure 183). The Washington VAAC reported that ash plumes rose 700-1,620 m above the crater and drifted NW, W, WNW, SW, E, SE, and ESE. Frequent incandescent avalanches descended 500-1,000 m below the crater. Explosions ejected material 100-300 m above the crater during 4-7, 11-12, and 19-23 November.
Satellite data. MIROVA (Middle InfraRed Observation of Volcanic Activity) analysis of MODIS satellite data showed intermittent thermal anomalies of low-to-moderate power (figure 184). Thermal activity mainly consisted of incandescent avalanches descending the flanks due to the frequently detected explosions. The MODVOLC hotspot system identified a total of ten hotspots on 3 August, 7, 18, 12, 22, and 28 September, and 7, 9, and 19 November.
Geologic Background. Volcán El Reventador is the most frequently active of a chain of Ecuadorian volcanoes in the Cordillera Real, well east of the principal volcanic axis. The forested, dominantly andesitic stratovolcano has 4-km-wide avalanche scarp open to the E formed by edifice collapse. A young, unvegetated, cone rises from the amphitheater floor to a height comparable to the rim. It has been the source of numerous lava flows as well as explosive eruptions visible from Quito, about 90 km ESE. Frequent lahars in this region of heavy rainfall have left extensive deposits on the scarp slope. The largest recorded eruption took place in 2002, producing a 17-km-high eruption column, pyroclastic flows that traveled up to 8 km, and lava flows from summit and flank vents.
Information Contacts: Instituto Geofísico, Escuela Politécnica Nacional (IG-EPN), Casilla 17-01-2759, Quito, Ecuador (URL: http://www.igepn.edu.ec/); MIROVA (Middle InfraRed Observation of Volcanic Activity), a collaborative project between the Universities of Turin and Florence (Italy) supported by the Centre for Volcanic Risk of the Italian Civil Protection Department (URL: http://www.mirovaweb.it/); Hawai'i Institute of Geophysics and Planetology (HIGP) - MODVOLC Thermal Alerts System, School of Ocean and Earth Science and Technology (SOEST), Univ. of Hawai'i, 2525 Correa Road, Honolulu, HI 96822, USA (URL: http://modis.higp.hawaii.edu/).
Erta Ale (Ethiopia) — January 2024 Cite this Report
Erta Ale
Ethiopia
13.601°N, 40.666°E; summit elev. 585 m
All times are local (unless otherwise noted)
Strong lava lake activity and lava overflows during June-November 2023
Erta Ale in Ethiopia has a 50-km-wide edifice that rises more than 600 m from below sea level in the Danakil depression. The summit caldera is 0.7 x 1.6 km and contains at least two pit craters (North and South). Another larger 1.8 x 3.1-km-wide depression is located SE of the summit and is bounded by curvilinear fault scarps on the SE side. Lava flows from fissures have traveled into the caldera and locally overflowed the crater rim. The current eruption has been ongoing since 1967, with at least one long-term active lava lake present in the summit caldera. Recent fissure eruptions from 2017 have occurred on the SE flank (BGVN 42:07). Recent activity has been characterized by minor thermal activity at the S crater and an active lava lake at the N crater (BGVN 48:06). This report covers strong lava lake activity primarily at the N pit crater during June through November 2023 using information from satellite infrared data.
Infrared satellite images generally showed an active lava lake as the N pit crater and variable thermal activity at the S pit crater during the reporting period. On 7 June two strong thermal anomalies were detected at the S pit crater and two weaker anomalies were visible at the N pit crater. Those anomalies persisted throughout the month, although the intensity at each declined. On 2 July a possible lava lake was identified at the S pit crater, filling much of the crater. On 7 July both pit craters contained active lava lakes (figure 120). By 12 July the thermal activity decreased; two smaller anomalies were visible through the rest of the month at the S pit crater while the N pit crater showed evidence of cooling.
Renewed lava lake activity was identified at the N pit crater, based on a satellite image from 11 August, with two smaller anomalies visible at the S pit crater. By 16 August the lava lake in the N pit had begun to cool and only a small thermal anomaly was identified. Activity restarted on 21 August, filling much of the E and SE part of the N pit crater. The thermal activity at the N pit crater intensified on 31 August, particularly in the NW part of the crater. On 5 September lava filled much of the N pit crater, overflowing to the W and SW. During at least 10-20 September thermal activity at both craters were relatively low.
According to a satellite image on 25 September, strong thermal activity resumed when lava overflowed the N pit crater to the S, SW, and NE (figure 120). A satellite image taken on 5 October showed lava flows from the N had spilled into the S and begun to cool, accompanied by two weak thermal anomalies at the S pit crater. On 15 October lava flows again traveled SE and appeared to originate from the S pit crater (figure 120). Following these events, smaller thermal anomalies were visible on the SE rim of the N pit crater and within the S pit crater.
Lava was visible in the NW part of the N pit crater according to a satellite image taken on 4 November. By 9 November the intensity had decreased, and the lava appeared to cool through the rest of the month; young lava flows were visible along the W side of the S pit crater on 24 and 29 November. Lava flows occurred at the N pit crater trending NE-SW and along the E side on 29 November (figure 120).
During the reporting period, the MIROVA (Middle InfraRed Observation of Volcanic Activity) thermal detection system recorded consistent activity during the first half of 2023 (figure 121). Beginning in June 2023, thermal activity increased and remained variable in intensity through the end of the year indicating the presence of an active lava lake and lava flows. The MODVOLC thermal detection system registered a total of 63 anomalies during 7, 8, and 23 July, 10 and 18 August, 3, 5, 16, 23, 24, and 25 September, 15 and 20 October, and 21, 24, 26, 28, and 30 November. Some of these stronger thermal anomalies were also detected in Sentinel-2 infrared satellite images that showed an active lava lake at the N pit crater and subsequent lava overflows from both pit craters (figure 120).
Geologic Background. The Erta Ale basaltic shield volcano in Ethiopia has a 50-km-wide edifice that rises more than 600 m from below sea level in the Danakil depression. The volcano includes a 0.7 x 1.6 km summit crater hosting steep-sided pit craters. Another larger 1.8 x 3.1 km wide depression elongated parallel to the trend of the Erta Ale range is located SE of the summit and is bounded by curvilinear fault scarps on the SE side. Basaltic lava flows from these fissures have poured into the caldera and locally overflowed its rim. The summit caldera usually also holds at least one long-term lava lake that has been active since at least 1967, and possibly since 1906. Recent fissure eruptions have occurred on the N flank.
Information Contacts: MIROVA (Middle InfraRed Observation of Volcanic Activity), a collaborative project between the Universities of Turin and Florence (Italy) supported by the Centre for Volcanic Risk of the Italian Civil Protection Department (URL: http://www.mirovaweb.it/); Hawai'i Institute of Geophysics and Planetology (HIGP) - MODVOLC Thermal Alerts System, School of Ocean and Earth Science and Technology (SOEST), Univ. of Hawai'i, 2525 Correa Road, Honolulu, HI 96822, USA (URL: http://modis.higp.hawaii.edu/); Copernicus Browser, Copernicus Data Space Ecosystem, European Space Agency (URL: https://dataspace.copernicus.eu/browser/).
Ubinas
Peru
16.345°S, 70.8972°W; summit elev. 5608 m
All times are local (unless otherwise noted)
New eruption with explosions and ash plumes during June-December 2023
Ubinas, located in Peru, has had 24 eruptions since 1550, which more recently have been characterized by explosions, ash plumes, and lahars (BGVN 45:03). This report covers a new eruption during June through December 2023 based on reports from Instituto Geofisico del Peru (IGP), Instituto Geológico Minero y Metalúrgico (INGEMMET), and satellite data.
IGP reported that seismic unrest began on 17 May, followed by an increase in seismicity during the second half of the month. There were 168 volcano-tectonic (VT) earthquakes detected, which are associated with rock fracturing processes, and 171 long-period (LP) earthquakes recorded during 16-24 May, which are associated with the movement of volcanic fluid.
Seismicity and fumarolic activity at the crater level continued to increase during June. During 1-18 June there was an average of 631 VT-type earthquakes and 829 LP earthquakes recorded. Webcams showed gas-and-steam emissions rising 500 m above the summit and drifting SE. In addition, the maximum value of emitted sulfur dioxide during this period was 337 tons/day. During 19-22 June an average of 315 VT-type events and 281 LP-type events and tremor were reported. On 20 June the Gobierno Regional de Moquegua raised the Volcano Alert Level (VAL) to Yellow (the second level on a four-color scale), based on recommendations from IGP. Webcam images showed ash emissions rising 1 km above the summit and drifting E at 0011 on 22 June, which IGP reported marked the start of a new eruption. Sporadic and diffuse gas-and-ash emissions continued to rise 800-1,500 m above the summit through the rest of the month and drifted mainly E, N, NW, W, SW, and NE. During 23-25 June there was an average of 402 VT-type earthquakes and 865 LP-type events detected. During 26-28 June the earthquakes associated with ash emissions, which have been observed since 22 June, decreased, indicating the end of the phreatic phase of the eruption, according to IGP. A thermal anomaly was detected in the crater for the first time on 26 June and was periodically visible through 4 July (figure 61). During 29-30 June there was an average of 173 VT-type earthquakes and 351 LP-type events recorded, and sulfur dioxide values ranged between 600 t/d and 1,150 t/d. During this same time, seismicity significantly increased, with 173 VT-type earthquakes, 351 LP-type events, and harmonic tremor which signified rising magma. The Gobierno Regional de Moquegua raised the Alert Level to Orange (the third level on a four-color scale) on 30 June based on the recommendation from IGP and INGEMMET.
Activity during July consisted of continued seismicity and gas-and-ash emissions. Gas-and-ash emissions rose as high as 5 km above the summit and drifted as far as 40 km in different directions during 1, 4-6, 16, 20-23, 26, and 29 July, based on webcam and satellite images. During 1-2 July an average of 72 VT-type earthquakes and 114 LP-type events were detected. In addition, during that time, ashfall was reported in Ubinas (6.5 km SSE) and Querapi (4.5 km SE). During 2-3 July INGEMMET reported gas-and-ash plumes rose 400 m above the summit and drifted SW, causing ashfall in downwind areas as far as 5 km. During 3-4 July there was an average of 69 VT-type earthquakes and 96 LP-type events reported. On 4 July starting around 0316 there were 16 seismic signals associated with explosive activity and ash emissions detected (figure 62). According to INGEMMET an explosion ejected ballistics and generated a gas-and-ash plume that rose 5.5 km above the summit and drifted SW and S. Ashfall was recorded in Querapi, Ubinas, Sacohaya (7 km SSE), Anascapa (11 km SE), San Miguel (10 km SE), Tonohaya (7 km SSE), Huatahua, Huarina, Escacha (9 km SE), and Matalaque (17 km SSE), and was most significant within 5 km of the volcano. IGP noted that ash fell within a radius of 20 km and deposits were 1 mm thick in towns in the district of Ubinas.
During 5-9 July an average of 67 VT-type events and 47 LP-type events were reported. A period of continuous gas-and-ash emissions occurred on 5 July, with plumes drifting more than 10 km SE and E. A total of 11 seismic signals associated with explosions also detected on 6, 16, 17, and 22 July. On 6 July explosions recorded at 0747 and 2330 produced gas-and-ash plumes that rose as high as 3.5 km above the summit and drifted as far as 30 km NW, NE, SE, and S. According to the Washington VAAC the explosion at 0747 produced a gas-and-ash plume that rose to 9.1 km altitude and drifted SW, which gradually dissipated, while a lower-altitude plume rose to 7.6 km altitude and drifted NE. Gobierno Regional de Moquegua declared a state of emergency for districts in the Moquegua region, along with Coalaque Chojata, Icuña, Lloque, Matalaque, Ubinas, and Yunga of the General Sánchez Cerro province, to be in effect for 60 days. On 7 July an ash plume rose to 7.3 km altitude and drifted E at 0320. At 0900 and 1520 gas-and-steam plumes with diffuse ash rose to 6.7 km altitude and drifted SE. Small ash emissions were visible in satellite and webcam images at 0920 and 1520 on 8 July and rose as high as 6.4 km altitude and drifted SE. During 10-16 July there was an average of 80 VT-type earthquakes and 93 LP-type events reported. INGEMMET reported that during 9-11 July sulfur dioxide emissions were low and remained around 300 t/d.
During 17-23 July an average of 46 VT-type events and 122 LP-type events were detected. On 20 July at 0530 an explosion generated an ash plume that rose 3-4.5 km above the crater and drifted 65 km toward Arequipa. An explosion on 21 July at 0922 produced a gas-and-ash plume that rose 5 km above the summit (figure 63). Ashfall was reported in Querapi, Ubinas, Tonohaya, Anascapa, Sacohaya, San Miguel, Escacha, Huatagua (14 km SE), Huarina, Escacha (9 km SE), Matalaque, Logén, Santa Lucía de Salinas, and Salinas de Moche. An explosion on 22 July at 1323 generated an ash plume that rose 5.5 km above the summit and drifted NE, E, and SE. During 24-30 July there were five volcanic explosions detected and an average of 60 VT-type events and 117 LP-type events. An explosion on 29 July at 0957 produced an ash plume that rose 2.5 km above the summit and drifted as far as 40 km NE, E, and SE. As a result, significant ashfall was reported in Ubinas and Matalaque.
During August, explosions, gas-and-ash emissions, and seismic earthquakes persisted. During 31 July to 6 August there was an average of 115 VT-type events and 124 LP-type events reported. Gas-and-ash emissions were observed during 1, 6, 10, 13-14, 17-18, 21, and 23 August and they drifted as far as 20 km in different directions; on 14 and 18 August continuous ash emissions extended as far as 40 km S, SE, and NE. An explosion was detected at 2110 on 1 August, which generated a gas-and-ash plume that rose 5.4 km above the summit and drifted SE and E. The explosion ejected blocks and incandescent material as far as 3 km from the crater onto the SW, S, and SE flanks. Ashfall was reported in Ubinas and Chojata (19 km ESE). Gas-and-ash emissions rose as high as 2 km above the summit and drifted in different directions through 5 August, sometimes causing ashfall within a 15-km-radius. An explosion at 0009 on 6 August ejected blocks and produced a gas-and-ash plume that rose 1.4 km above the summit and drifted SE and E, which caused ashfall in Ubinas and Chojata and other areas within a 30-km radius. During 7-13 August there was an average of 102 VT-type events and 60 LP-type events detected. INGEMMET reported that sulfur dioxide emissions were low on 7 August and averaged 400 t/d.
One volcanic explosion that was recorded on 10 August, producing gas-and-ash emissions that rose 2.4 km above the summit and drifted as far as 25 km SE and E. Ashfall was observed in Ubinas, Matalaque, and Chojata. During 10-11 and 13-14 August sulfur dioxide values increased slightly to moderate levels of 2,400-3,700 t/d. The average number of VT-type events was 104 and the number of LP-type events was 71 during 14-21 August. Two explosions were detected at 0141 and 0918 on 21 August, which produced gas-and-ash emissions that rose 3.5 km above the summit and drifted 50 km N, NE, W, and NW (figure 64). The explosion at 0918 generated an ash plume that caused ashfall in different areas of San Juan de Tarucani. During 22-27 August the average number of VT-type events was 229 and the average number of LP-type events was 54. An explosion was reported at 1757 on 25 August, which generated a gas-and-ash plume that rose 4.2 km above the summit and drifted in multiple directions as far as 25 km. During 28 August through 3 September gas-and-ash emissions rose 600 m above the summit and drifted as far as 5 km E and SE. During this time, there was an average of 78 VT-type events and 42 LP-type events.
Gas-and-steam emissions rose 600-2,600 m above the summit and drifted as far as 15 km in multiple directions during September. During 4-10 and 11-17 September there was an average of 183 VT-type events and 27 LP-type events, and 114 VT-type events and 86 LP-type events occurred, respectively. On 14 September an explosion at 1049 generated a gas-and-ash plume that rose 2.6 km above the summit and drifted as far as 15 km E, NE, SE, and S (figure 65). During 14-16 September an average of three hours of seismic tremor related to ash emissions was recorded each day. During 18-24 September the average number of VT-type events was 187 and the average number of LP-type events was 45. During 25 September and 1 October, there was an average number of 129 VT-type events and 52 LP-type events detected.
Relatively low activity was reported during October; during 2-9 October there was an average number of 155 VT-type events and 27 LP-type events recorded. On 1 October at 1656 seismic signals associated with ash emissions were recorded for an hour and thirty minutes; the ash plumes rose as high as 1 km above the summit and drifted more than 10 km E, S, and SW. On 4 October IGP reported that an ash plume drifted more than 15 km SW and S. Sulfur dioxide emissions were 1,250 t/d on that day. On 7 October a gas-and-ash plume rose 1.9 km above the summit and drifted NE, E, and SE. On 4 October the amount of sulfur dioxide emissions was 1,250 t/d. During 10-15 October there was an average number of 225 VT-type events and 34 LP-type events recorded. On 11 October at 1555 a single seismic signal associated with an ash pulse was recorded; the gas-and-ash emissions rose 700 m above the summit and drifted SW and W. There was an average of 204 VT-type events and 25 LP-type events detected during 16-22 October and 175 VT-type events and 17 LP-type events during 23-29 October. On 27 October at 0043 a gas-and-ash emission rose 500 m above the summit and drifted SE and E. A minor thermal anomaly was visible on the crater floor. During 30 October to 5 November there was an average of 95 VT-type events and 24 LP-type events detected.
Activity remained relatively low during November and December and consisted mainly of gas-and-steam emissions and seismicity. Gas-and-steam emissions rose 900-1,100 m above the summit and drifted mainly E, SE, N, and NE. IGP detected an average of 166 VT-type events and 38 LP-type events during 6-15 November, 151 VT-type events and 17 LP-type events during 16-30 November, 143 VT-type events and 23 LP-type events during 1-15 December, and 129 VT-type events and 21 LP-type events during 16-31 December. No explosions or ash emissions were recorded during November. The VAL was lowered to Yellow (the second level on a four-color scale) during the first week of November. According to the Washington VAAC an ash emission was identified in a satellite image at 0040 on 11 December that rose to 5.5 km altitude and drifted NW. Webcam images at 0620 and 1220 showed continuous gas-and-steam emissions possibly containing some ash rising as high as 7 km altitude. Webcam images during 10-31 December showed continuous gas-and-ash emissions that rose as high as 2.5 km above the summit and drifted up to 5 km NW, W, and SW. On 12 December continuous ash emissions drifted more than 10 km N and NW.
Geologic Background. The truncated appearance of Ubinas, Perú's most active volcano, is a result of a 1.4-km-wide crater at the summit. It is the northernmost of three young volcanoes located along a regional structural lineament about 50 km behind the main volcanic front. The growth and destruction of Ubinas I was followed by construction of Ubinas II beginning in the mid-Pleistocene. The upper slopes of the andesitic-to-rhyolitic Ubinas II stratovolcano are composed primarily of andesitic and trachyandesitic lava flows and steepen to nearly 45°. The steep-walled, 150-m-deep summit crater contains an ash cone with a 500-m-wide funnel-shaped vent that is 200 m deep. Debris-avalanche deposits from the collapse of the SE flank about 3,700 years ago extend 10 km from the volcano. Widespread Plinian pumice-fall deposits include one from about 1,000 years ago. Holocene lava flows are visible on the flanks, but activity documented since the 16th century has consisted of intermittent minor-to-moderate explosive eruptions.
Information Contacts: Instituto Geofisico del Peru (IGP), Calle Badajoz N° 169 Urb. Mayorazgo IV Etapa, Ate, Lima 15012, Perú (URL: https://www.gob.pe/igp); Observatorio Volcanologico del INGEMMET (Instituto Geológical Minero y Metalúrgico), Barrio Magisterial Nro. 2 B-16 Umacollo - Yanahuara Arequipa, Peru (URL: http://ovi.ingemmet.gob.pe); Gobierno Regional Moquegua, Sede Principal De Moquegua, R377+5RR, Los Chirimoyos, Moquegua 18001, Peru (URL: https://www.gob.pe/regionmoquegua); Washington Volcanic Ash Advisory Center (VAAC), Satellite Analysis Branch (SAB), NOAA/NESDIS OSPO, NOAA Science Center Room 401, 5200 Auth Rd, Camp Springs, MD 20746, USA (URL: www.ospo.noaa.gov/Products/atmosphere/vaac, archive at: http://www.ssd.noaa.gov/VAAC/archive.html); MIROVA (Middle InfraRed Observation of Volcanic Activity), a collaborative project between the Universities of Turin and Florence (Italy) supported by the Centre for Volcanic Risk of the Italian Civil Protection Department (URL: http://www.mirovaweb.it/); Copernicus Browser, Copernicus Data Space Ecosystem, European Space Agency (URL: https://dataspace.copernicus.eu/browser/).
Kanaga (United States) — January 2024 Cite this Report
Kanaga
United States
51.923°N, 177.168°W; summit elev. 1307 m
All times are local (unless otherwise noted)
Small explosion on 18 December 2023
Kanaga lies within the Kanaton caldera at the northern tip of Kanaga Island. The caldera rim forms a 760-m-high arcuate ridge south and east of Kanaga; a lake occupies part of the SE caldera floor. Most of its previous recorded eruptions are poorly documented, although they date back to 1763. Fumarolic activity at Kanaga occurs in a circular, 200-m-wide, 60-m-deep summit crater and produces vapor plumes sometimes seen on clear days from Adak, 50 km to the east. Its most recent eruption occurred in February 2012, which consisted of numerous small earthquakes, a possible weak ash cloud, and gas-and-steam emissions (BGVN 38:03). This report covers a new eruption during December 2023, based on information from the Alaska Volcano Observatory (AVO).
A small explosion was detected in local infrasound and seismic data at 2231 on 18 December, followed by elevated seismicity. No ash emissions were visible in partly cloudy satellite images. On 19 December the Volcano Alert Level (VAL) was raised to Advisory (the second level on a four-level scale) and the Aviation Color Code (ACC) was raised to Yellow (the second color on a four-color scale). The rate of seismicity significantly declined after the 18th, although it remained elevated through 30 December. Small, daily earthquakes occurred during 19-28 December. Satellite observations following the event showed a debris flow extending 1.5 km down the NW flank. Possible minor gas-and-steam emissions were visible in a webcam image on 20 December. Weakly elevated surface temperatures were identified in satellite data during 23-26 December. A series of cracks extending from the inner crater to the upper SE flank and debris deposits on the upper flanks were observed in satellite images on 27 December. AVO reported that these were likely formed during the 18 December event. Local webcam and seismic data were temporarily offline due to a power failure during 4-28 January.
On 28 January connection to the seismic stations and webcams was restored and webcam images showed gas-and-steam emissions at the summit. Occasional earthquakes were also detected each day. A period of weak seismic tremor was observed on 31 January. During February, the number of earthquakes declined. On 27 February AVO lowered the VAL to Normal (the lowest level on a four-level scale) and the ACC to Green (the lowest color on a four-color scale) due to decreased levels of seismicity and no new surface changes or elevated temperatures based on satellite and webcam data.
Geologic Background. Symmetrical Kanaga stratovolcano is situated within the Kanaton caldera at the northern tip of Kanaga Island. The caldera rim forms a 760-m-high arcuate ridge south and east of Kanaga; a lake occupies part of the SE caldera floor. The volume of subaerial dacitic tuff is smaller than would typically be associated with caldera collapse, and deposits of a massive submarine debris avalanche associated with edifice collapse extend nearly 30 km to the NNW. Several fresh lava flows from historical or late prehistorical time descend the flanks of Kanaga, in some cases to the sea. Historical eruptions, most of which are poorly documented, have been recorded since 1763. Kanaga is also noted petrologically for ultramafic inclusions within an outcrop of alkaline basalt SW of the volcano. Fumarolic activity occurs in a circular, 200-m-wide, 60-m-deep summit crater and produces vapor plumes sometimes seen on clear days from Adak, 50 km to the east.
Information Contacts: Alaska Volcano Observatory (AVO), a cooperative program of a) U.S. Geological Survey, 4200 University Drive, Anchorage, AK 99508-4667 USA (URL: https://avo.alaska.edu/), b) Geophysical Institute, University of Alaska, PO Box 757320, Fairbanks, AK 99775-7320, USA, and c) Alaska Division of Geological & Geophysical Surveys, 794 University Ave., Suite 200, Fairbanks, AK 99709, USA (URL: http://dggs.alaska.gov/).
Klyuchevskoy (Russia) — January 2024 Cite this Report
Klyuchevskoy
Russia
56.056°N, 160.642°E; summit elev. 4754 m
All times are local (unless otherwise noted)
New eruption consisting of Strombolian activity, lava flows and fountains, and ash plumes during June-December 2023
Klyuchevskoy, located on the Kamchatka Peninsula, has produced frequent moderate-volume explosive and effusive eruptions and more than 100 flank eruptions have occurred during the past 3,000 years. Eruptions recorded since the late 17th century have resulted in frequent changes to the morphology of the 700-m-wide summit crater. Eruptions over the past 400 years have primarily originated from the summit crater, although numerous major explosive and effusive eruptions have also occurred from flank craters. The previous eruption ended in November 2022 and consisted of Strombolian activity (BGVN 47:12). This report covers a new eruption during June through December 2023, characterized by Strombolian explosions, lava flows, and ash plumes. Information primarily comes from weekly and daily reports from the Kamchatkan Volcanic Eruption Response Team (KVERT) and various satellite data.
KVERT reported that a Strombolian eruption began at 2323 on 22 June. A thermal anomaly was visible in satellite data starting on 22 June (figure 75). As a result, the Aviation Color Code (ACC) was raised to Yellow (the second lowest level on a four-color scale). During 4-6 and 13 July small ash clouds were occasionally observed over the crater. On 19 July a new lava flow began to effuse along the Apakhonchich drainage on the SE flank, which continued through 19 August. Lava fountaining was reported on 21 July in addition to the active lava flow, which continued through 23 August and during 27-30 August. During 22-23 and 27-30 August the lava flow was active along the Apakhonchich drainage on the SE flank.
Similar activity was observed during September. Lava fountaining resumed on 2 September and continued through 31 October. In addition, on 2 September a lava flow began to effuse along the Kozyrevsky drainage on the SW flank. During 3-5 September resuspended ash plumes rose to 3-3.5 km altitude and extended as far as 170 km E by 1940 on 4 September. The ACC was raised to Orange (the third level on a four-color scale) at 1240 on 4 September. The ACC was briefly lowered back to Yellow at 1954 that same day before returning to Orange during 1532-1808 on 5 September due to resuspended ash plumes that rose to 3 km altitude and drifted 120 km E at 1500. KVERT reported that Strombolian activity continued, feeding the lava flows advancing down the Apakhonchichsky and Kozyrevsky drainages through most of the month. During 25 September through 16 October the lava flow was only active in the Apakhonchichisky drainage (figure 76). During 9-12 September resuspended ash plumes rose to 1.5-4 km altitude and extended 550 km E and SE. On 22 September resuspended ash plumes rose to 2-2.5 km altitude and drifted 50-90 km E, which prompted KVERT to raise the ACC to Orange; the ACC was lowered back to Yellow on 24 September. On 29 September phreatic explosions generated ash plumes that rose to 5.2-5.3 km altitude.
Activity during October continued with lava fountains, lava flows, and ash plumes. Strombolian activity with lava fountains continued at the crater and active lava flows alternately descended the Apakhonchichisky and Kozyrevsky drainages on the SE and S flanks (figure 77). During 11-12 October gas-and-steam plumes containing some ash rose to 5.5-6 km altitude and extended as far as 65 km NE and SE. The ACC was raised to Orange on 11 October. According to observers at the Kamchatka Volcanological Station, lava effusion was almost continuous, and incandescent material was ejected as high as 300 m above the crater rim. On 13 October at 1420 an ash plume rose to 5-5.5 km altitude and drifted 90-100 km SE. During 14-16 October gas-and-steam plumes containing some ash rose to 4-6 km altitude and drifted 40-145 km ESE and E. On 16 October lava on the SE flank melted the snow and ice, causing phreatic explosions and large collapses of material from the margins of the flow. At 1500 an ash plume rose to 6.5-7 km altitude and drifted 70 km ENE. On 17 October an ash plume was reported extending 360 km NE. Gray-red ashfall was observed in Klyuchi at 0700; this ash was resuspended from older material.
During 22-31 October phreatic explosions generated ash plumes mainly containing ash from collapses of previously deposited pyroclastic material that rose to 7 km altitude and extended as far as 280 km NE, E, SW, and S on 23 and 29 October the ash plumes rose to 8 km altitude. Ash plumes during 27-29 October rose to 8 km altitude and drifted as far as 300 km SE, ESE, and E. Lava fountains rose up to 500 m above the crater during 27-31 October. Scientists from the Kamchatka Volcanological Station visited the volcano on 28 October and reported that the cinder cone at the summit had grown. They also observed advancing lava on the E flank that extended about 2 km from the summit to 2,700 m elevation, incandescent ejecta 500 m above the crater, and avalanches in the Apakhonchichsky drainage. On 31 October activity intensified, and lava flows were reported moving in the Kretovsky, Kozyrevsky, and Apakhonchichisky drainages on the NW, SW, and SE flanks. At 0930 an ash plume rose to 7 km altitude and at first drifted 169 km SW and then 646 km SE. KVERT reported ash plumes rose to 14 km altitude and extended as far as 1,500 km SSE. The ACC was raised to Red (the highest level on a four-color scale). During 31 October to 1 November ash plumes rose as high as 14 km altitude and drifted as far as 2,255 km ESE.
Activity on 1 November intensified. The lava fountains rose as high as 1 km above the summit (figure 78) and fed the lava flows that were active on the Kretovsky, Kozyrevsky, and Apakhonchichsky drainages on the NW, SW, and SE flanks. Ash plumes rose to 10-14 km altitude and drifted as far as 1,500 km SSE (figure 79). According to the Kamchatka Volcanological Station, observers reported pyroclastic flows descending the flanks. Lahars descended the Studenoy River, blocking the Kozyrevsky-Petropavlovsk federal highway and descended the Krutenkaya River, blocking the road E of Klyuchi. According to news articles the ash plumes caused some flight cancellations and disruptions in the Aleutians, British Columbia (Canada), and along flight paths connecting the Unites States to Japan and South Korea. Ash plumes containing old ash from collapses in the Apakhonchichsky drainage due to phreatic explosions rose to 9.5-9.8 km altitude and drifted 192 km SW at 1400 and to 8.7 km altitude and drifted 192 km SW at 1710 on 1 November.
On 2 November ash plumes rose to 6-14 km altitude; the ash plume that rose to 14 km altitude decreased to 6.5 km altitude and drifted NNE by 2000 and continued to drift more than 3,000 km ESE and E. The ACC was lowered to Orange. On 3 November ash plumes rose to 5-8.2 km altitude and drifted 72-538 km ENE, NNE, and ESE; at 0850 an ash plume rose to 6-6.5 km altitude and drifted more than 3,000 km ESE throughout the day. During 4-6 and 8-10 November resuspended ash plumes associated with collapses of old pyroclastic material from the sides of the Apakhonchichsky drainage due to phreatic explosions rose to 4.5-5.5 km altitude and extended 114-258 km NE, ENE, and E. KVERT reported that the eruption stopped on 5 November and the lava flows had begun to cool. Resuspended ash plumes rose to 5-6 km altitude and drifted 60 km E at 0820 on 13 November and to 5 km and 4.5 km altitude at 1110 and 1430 and drifted 140 km E and 150 km ESE, respectively. On 15 November the ACC was lowered to Green.
Activity was relatively low during most of December. On 27 December Strombolian activity resumed based on a thermal anomaly visible in satellite data. On 30 December an ash plume rose to 6 km altitude and extended 195 km NW. The ACC was raised to Orange. On 31 December video and satellite data showed explosions that generated ash plumes that rose to 5-6.5 km altitude and drifted 50-230 km WNW and NW. Though a thermal anomaly persisted through 1 January 2024, no explosions were detected, so the ACC was lowered to Yellow.
Satellite data. Thermal activity was strong throughout the reporting period due to frequent lava fountaining and lava flows. MODIS thermal anomaly data provided through MIROVA (Middle InfraRed Observation of Volcanic Activity) showed strong activity during the entire reporting period, resulting from lava fountaining and lava flows (figure 80). According to data from MODVOLC thermal alerts, a total of 336 hotspots were detected in June (3), July (30), August (11), September (52), October (217), and November (23). Thermal activity was also visible in infrared satellite images, often showing a strong thermal anomaly at the summit crater and a lava flow affecting primarily the SE and SW flanks (figure 81).
Geologic Background. Klyuchevskoy is the highest and most active volcano on the Kamchatka Peninsula. Since its origin about 6,000 years ago, this symmetrical, basaltic stratovolcano has produced frequent moderate-volume explosive and effusive eruptions without major periods of inactivity. It rises above a saddle NE of Kamen volcano and lies SE of the broad Ushkovsky massif. More than 100 flank eruptions have occurred during approximately the past 3,000 years, with most lateral craters and cones occurring along radial fissures between the unconfined NE-to-SE flanks of the conical volcano between 500 and 3,600 m elevation. Eruptions recorded since the late 17th century have resulted in frequent changes to the morphology of the 700-m-wide summit crater. These eruptions over the past 400 years have originated primarily from the summit crater, but have also included numerous major explosive and effusive eruptions from flank craters.
Information Contacts: Kamchatka Volcanic Eruptions Response Team (KVERT), Far Eastern Branch, Russian Academy of Sciences, 9 Piip Blvd., Petropavlovsk-Kamchatsky, 683006, Russia (URL: http://www.kscnet.ru/ivs/kvert/); Kamchatka Volcanological Station, Kamchatka Branch of Geophysical Survey, (KB GS RAS), Klyuchi, Kamchatka Krai, Russia (URL: http://volkstat.ru/); MIROVA (Middle InfraRed Observation of Volcanic Activity), a collaborative project between the Universities of Turin and Florence (Italy) supported by the Centre for Volcanic Risk of the Italian Civil Protection Department (URL: http://www.mirovaweb.it/); Hawai'i Institute of Geophysics and Planetology (HIGP) - MODVOLC Thermal Alerts System, School of Ocean and Earth Science and Technology (SOEST), Univ. of Hawai'i, 2525 Correa Road, Honolulu, HI 96822, USA (URL: http://modis.higp.hawaii.edu/); Copernicus Browser, Copernicus Data Space Ecosystem, European Space Agency (URL: https://dataspace.copernicus.eu/browser/).
Agung (Indonesia) — January 2024 Cite this Report
Agung
Indonesia
8.343°S, 115.508°E; summit elev. 2997 m
All times are local (unless otherwise noted)
Three eruptive events reported in April, May, and December 2022
Mount Agung, located on the E end of the island of Bali, Indonesia, rises above the SE rim of the Batur caldera. The summit area extends 1.5 km E-W, with the highest point on the W and a steep-walled 800-m-wide crater on the E. Recorded eruptions date back to the early 19th century. A large and deadly explosive and effusive eruption occurred during 1963-64, which was characterized by voluminous ashfall, pyroclastic flows, and lahars that caused extensive damage and many fatalities. More recent activity was documented during November 2017-June 2019 that consisted of multiple explosions, significant ash plumes, lava flows at the summit crater, and incandescent ejecta. This report covers activity reported during April-May 2022 and December 2022 based on data from the Darwin Volcanic Ash Advisory Center (VAAC).
Activity during 2022 was relatively low and mainly consisted of a few ash plumes during April-May and December. An ash plume on 3 April rising to 3.7 km altitude (700 m above the summit) and drifting N was reported in a Darwin VAAC notice based on a ground report, with ash seen in HIMAWARI-8 visible imagery. Another ash plume was reported at 1120 on 27 May that rose to 5.5 km altitude (2.5 m above the summit); the plume was not visible in satellite or webcam images due to weather clouds. An eruption was reported based on seismic data at 0840 on 13 December, with an estimated plume altitude of 3.7 km; however, no ash was seen using satellite imagery in clear conditions before weather clouds obscured the summit.
Geologic Background. Symmetrical Agung stratovolcano, Bali's highest and most sacred mountain, towers over the eastern end of the island. The volcano, whose name means "Paramount," rises above the SE rim of the Batur caldera, and the northern and southern flanks extend to the coast. The summit area extends 1.5 km E-W, with the high point on the W and a steep-walled 800-m-wide crater on the E. The Pawon cone is located low on the SE flank. Only a few eruptions dating back to the early 19th century have been recorded in historical time. The 1963-64 eruption, one of the largest in the 20th century, produced voluminous ashfall along with devastating pyroclastic flows and lahars that caused extensive damage and many fatalities.
Information Contacts: Darwin Volcanic Ash Advisory Centre (VAAC), Bureau of Meteorology, Northern Territory Regional Office, PO Box 40050, Casuarina, NT 0811, Australia (URL: http://www.bom.gov.au/info/vaac/).
Saunders (United Kingdom) — February 2024 Cite this Report
Saunders
United Kingdom
57.8°S, 26.483°W; summit elev. 843 m
All times are local (unless otherwise noted)
Persistent thermal anomalies from the summit crater lava lake during February 2023-January 2024
Saunders is one of eleven islands that comprise the South Sandwich Islands in the South Atlantic. The active Mount Michael volcano has been in almost continuous eruption since November 2014 (BGVN 48:02). Recent activity has resulted in intermittent thermal anomalies and gas-and-steam emissions (BGVN 47:03, 48:02). Visits are infrequent due to its remote location, and cloud cover often prevents satellite observations. Satellite thermal imagery and visual observation of incandescence during a research expedition in 2019 (BGVN 28:02 and 44:08) and a finding confirmed by a National Geographic Society research team that summited Michael in November 2022 reported the presence of a lava lake.
Although nearly constant cloud cover during February 2023 through January 2024 greatly limited satellite observations, thermal anomalies from the lava lake in the summit crater were detected on clear days, especially around 20-23 August 2023. Anomalies similar to previous years (eg. BGVN 48:02) were seen in both MIROVA (Middle InfraRed Observation of Volcanic Activity) data from MODIS instruments and in Sentinel 2 infrared imagery. The only notable sulfur dioxide plume detected near Saunders was on 25 September 2023, with the TROPOMI instrument aboard the Sentinel-5P satellite.
Geologic Background. Saunders Island consists of a large central volcanic edifice intersected by two seamount chains, as shown by bathymetric mapping (Leat et al., 2013). The young Mount Michael stratovolcano dominates the glacier-covered island, while two submarine plateaus, Harpers Bank and Saunders Bank, extend north. The symmetrical Michael has a 500-m-wide summit crater and a remnant of a somma rim to the SE. Tephra layers visible in ice cliffs surrounding the island are evidence of recent eruptions. Ash clouds were reported from the summit crater in 1819, and an effusive eruption was inferred to have occurred from a N-flank fissure around the end of the 19th century and beginning of the 20th century. A low ice-free lava platform, Blackstone Plain, is located on the north coast, surrounding a group of former sea stacks. A cluster of cones on the SE flank, the Ashen Hills, appear to have been modified since 1820 (LeMasurier and Thomson, 1990). Analysis of satellite imagery available since 1989 (Gray et al., 2019; MODVOLC) suggests frequent eruptive activity (when weather conditions allow), volcanic clouds, steam plumes, and thermal anomalies indicative of a persistent, or at least frequently active, lava lake in the summit crater. Due to this observational bias, there has been a presumption when defining eruptive periods that activity has been ongoing unless there is no evidence for at least 10 months.
Information Contacts: MIROVA (Middle InfraRed Observation of Volcanic Activity), a collaborative project between the Universities of Turin and Florence (Italy) supported by the Centre for Volcanic Risk of the Italian Civil Protection Department (URL: http://www.mirovaweb.it/); NASA Global Sulfur Dioxide Monitoring Page, Atmospheric Chemistry and Dynamics Laboratory, NASA Goddard Space Flight Center (NASA/GSFC), 8800 Greenbelt Road, Goddard MD 20771, USA (URL: https://so2.gsfc.nasa.gov/); Copernicus Browser (URL: https://dataspace.copernicus.eu/browser).
Tengger Caldera (Indonesia) — February 2024 Cite this Report
Tengger Caldera
Indonesia
7.942°S, 112.95°E; summit elev. 2329 m
All times are local (unless otherwise noted)
Minor ash emission in December 2023; persistent weak thermal anomaly in the Bromo crater
Tengger Caldera, located at the N end of a volcanic massif in Indonesia’s East Java, consists of five overlapping stratovolcanoes. The youngest and only active cone in the 16-km-wide caldera is Bromo, which typically produces gas-and-steam plumes, occasional ash plumes and explosions, and weak thermal signals (BGVN 44:05, 47:01). This report covers activity during January 2022-December 2023, consisting of mostly white gas-and-steam emissions and persistent weak thermal anomalies. Information was provided by the Pusat Vulkanologi dan Mitigasi Bencana Geologi (PVMBG, also known as Indonesian Center for Volcanology and Geological Hazard Mitigation, CVGHM) and satellite imagery. The Alert Level remained at 2 (on a scale of 1-4), and visitors were warned to stay at least 1 km from the crater.
Activity was generally low during the reporting period, similar to that in 2021. According to almost daily images from MAGMA Indonesia (a platform developed by PVMBG), white emissions and plumes rose from 50 to 900 m above the main crater during this period (figure 24). During several days in March and June 2022, white plumes reached heights of 1-1.2 km above the crater.
After an increase in activity at 2114 on 3 February 2023, a PVMBG team that was sent to observe white emissions rising as high as 300 m during 9-12 February and heard rumbling noises. A sulfur dioxide odor was also strong near the crater and measurements indicated that levels were above the healthy (non-hazardous) threshold of 5 parts per million; differential optical absorption spectroscopy (DOAS) measurements indicated an average flux of 190 metric tons per day on 11 February. Incandescence originating from a large fumarole in the NNW part of the crater was visible at night. The team observed that vegetation on the E caldera wall was yellow and withered. The seismic network recorded continuous tremor and deep and shallow volcanic earthquakes.
According to a PVMBG press release, activity increased on 13 December 2023 with white, gray, and brown emissions rising as high as 900 m above Bromo’s crater rim and drifting in multiple directions (figure 25). The report noted that tremor was continuous and was accompanied in December by three volcanic earthquakes. Deformation data indicated inflation in December. There was no observable difference in the persistent thermal anomaly in the crater between 11 and 16 December 2023.
All clear views of the Bromo crater throughout this time, using Sentinel-2 infrared satellite images, showed a weak persistent thermal anomaly; none of the anomalies were strong enough to cause MODVOLC Thermal Alerts. A fire in the SE part of the caldera in early September 2023 resulted in a brief period of strong thermal anomalies.
Geologic Background. The 16-km-wide Tengger caldera is located at the northern end of a volcanic massif extending from Semeru volcano. The massive volcanic complex dates back to about 820,000 years ago and consists of five overlapping stratovolcanoes, each truncated by a caldera. Lava domes, pyroclastic cones, and a maar occupy the flanks of the massif. The Ngadisari caldera at the NE end of the complex formed about 150,000 years ago and is now drained through the Sapikerep valley. The most recent of the calderas is the 9 x 10 km wide Sandsea caldera at the SW end of the complex, which formed incrementally during the late Pleistocene and early Holocene. An overlapping cluster of post-caldera cones was constructed on the floor of the Sandsea caldera within the past several thousand years. The youngest of these is Bromo, one of Java's most active and most frequently visited volcanoes.
Information Contacts: Pusat Vulkanologi dan Mitigasi Bencana Geologi (PVMBG, also known as Indonesian Center for Volcanology and Geological Hazard Mitigation, CVGHM), Jalan Diponegoro 57, Bandung 40122, Indonesia (URL: http://www.vsi.esdm.go.id/); MAGMA Indonesia, Kementerian Energi dan Sumber Daya Mineral (URL: https://magma.esdm.go.id/v1); Copernicus Browser, Copernicus Data Space Ecosystem, European Space Agency (URL: https://dataspace.copernicus.eu/browser/); Hawai'i Institute of Geophysics and Planetology (HIGP) - MODVOLC Thermal Alerts System, School of Ocean and Earth Science and Technology (SOEST), Univ. of Hawai'i, 2525 Correa Road, Honolulu, HI 96822, USA (URL: http://modis.higp.hawaii.edu/).
Shishaldin (United States) — December 2023 Cite this Report
Shishaldin
United States
54.756°N, 163.97°W; summit elev. 2857 m
All times are local (unless otherwise noted)
New eruption with significant Strombolian explosions, ash plumes, and ashfall
Shishaldin is located on the eastern half of Unimak Island, one of the Aleutian Islands. Frequent explosive activity, primarily consisting of Strombolian ash eruptions from the small summit crater, but sometimes producing lava flows, has been recorded since the 18th century. The previous eruption ended in May 2020 and was characterized by intermittent thermal activity, increased seismicity and surface temperatures, ash plumes, and ash deposits (BGVN 45:06). This report covers a new eruption during July through November 2023, which consisted of significant explosions, ash plumes, ashfall, and lava fountaining. Information comes from daily, weekly, and special reports from the Alaska Volcano Observatory (AVO) and various satellite data. AVO monitors the volcano using local seismic and infrasound sensors, satellite data, web cameras, and remote infrasound and lightning networks.
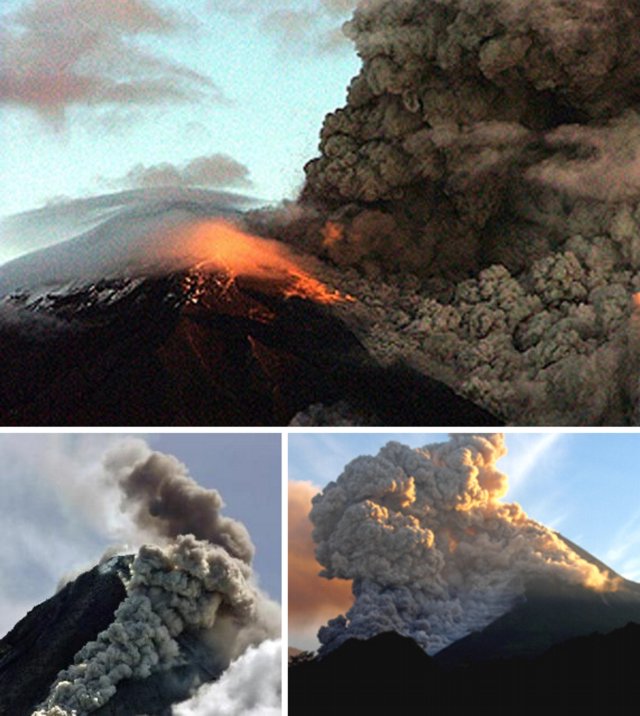
AVO reported that intermittent tremor and low-frequency earthquakes had gradually become more regular and consistent during 10-13 July. Strongly elevated surface temperatures at the summit were identified in satellite images during 10-13 July. On 11 July AVO raised the Aviation Color Code (ACC) to Yellow (the second color on a four-color scale) and Volcano Alert Level (VAL) to Advisory (the second level on a four-level scale) at 1439. Later in the day on 11 July summit crater incandescence was observed in webcam images. Observations of the summit suggested that lava was likely present at the crater, which prompted AVO to raise the ACC to Orange (the second highest color on a four-color scale) and the VAL to Watch (the second highest level on a four-level scale). The US Coast Guard conducted an overflight on 12 July and confirmed that lava was erupting from the summit. That same day, sulfur dioxide emissions were detected in satellite images.
A significant explosion began at 0109 on 14 July that produced an ash plume that rose to 9-12 km altitude and drifted S over the Pacific Ocean (figure 43). Webcam images and photos taken around 0700 from a ship SW off Unimak Island showed small lahar deposits, which were the result of the interaction of hot pyroclastic material and snow and ice on the flanks. There was also ashfall on the SW and N flanks. A smaller explosion at 0710 generated an ash plume that rose to 4.5 km altitude. Webcam images and pilot reports showed continued low-level ash emissions during the morning, rising to less than 4.6 km altitude; those emissions included a small ash plume near the summit around 1030 resulting from a small explosion.
Seismic tremor amplitude began increasing at around 1700 on 15 July; strongly elevated surface temperatures were also reported. An ash plume rose to 4.6 km altitude and drifted SSE at 2100, based on a satellite image. A continuous ash plume during 2150 through 2330 rose to 5 km altitude and extended 125 km S. At 2357 AVO raised the ACC to Red (the highest color on a four-color scale) and the VAL to Warning (the highest level on a four-level scale), noting that seismicity remained elevated for more than six hours and explosion signals were frequently detected by regional infrasound (pressure sensor) networks. Explosions generated an ash plume that rose to 4.9 km altitude and drifted as far as 500 km SE. Activity throughout the night declined and by 0735 the ACC was lowered to Orange and the VAL to Watch. High-resolution satellite images taken on 16 July showed pyroclastic deposits extending as far as 3 km from the vent; these deposits generated lahars that extended further down the drainages on the flanks. Ash deposits were mainly observed on the SSE flank and extended to the shore of Unimak Island. During 16-17 July lava continued to erupt at the summit, which caused strongly elevated surface temperatures that were visible in satellite imagery.
Lava effusion increased at 0100 on 18 July, as noted in elevated surface temperatures identified in satellite data, increasing seismic tremor, and activity detected on regional infrasound arrays. A significant ash plume at 0700 rose to 7 km altitude and continued until 0830, eventually reaching 9.1 km altitude and drifting SSE (figure 44). As a result, the ACC was raised to Red and the VAL to Warning. By 0930 the main plume detached, but residual low-level ash emissions continued for several hours, remaining below 3 km altitude and drifting S. The eruption gradually declined and by 1208 the ACC was lowered to Orange and the VAL was lowered to Watch. High-resolution satellite images showed ash deposits on the SW flank and pyroclastic deposits on the N, E, and S flanks, extending as far as 3 km from the vent; lahars triggered by the eruption extended farther down the flanks (figure 45). Lava continued to erupt from the summit crater on 19 July.
Elevated surface temperatures were detected in satellite images during 19-25 July, despite occasional weather cloud cover, which was consistent with increased lava effusion. During 22-23 July satellite observations acquired after the eruption from 18 July showed pyroclastic flow and lahar deposits extending as far as 3 km down the N, NW, and NE flanks and as far as 1.5 km down the S and SE flanks. Ash deposits covered the SW and NE flanks. No lava flows were observed outside the crater. On 22 July a sulfur dioxide plume was detected in satellite data midday that had an estimated mass of 10 kt. In a special notice issued at 1653 on 22 July AVO noted that eruptive activity had intensified over the previous six hours, which was characterized by an hours-long steady increase in seismic tremor, intermittent infrasound signals consistent with small explosions, and an increase in surface temperatures that were visible in satellite data. Pilots first reported low-level ash plumes at around 1900. At 2320 an ash plume had risen to 9 km altitude based on additional pilot reports and satellite images. The ACC was increased to Red and the VAL to Warning at 2343. Satellite images indicated growth of a significantly higher ash plume that rose to 11 km altitude continued until 0030 and drifted NE. During the early morning hours of 23 July ash plumes had declined to 4.6 k altitude. Seismic tremor peaked at 0030 on 23 July and began to rapidly decline at 0109; active ash emissions were no longer visible in satellite data by 0130. The ACC was lowered to Orange and the VAL to Watch at 0418; bursts of increased seismicity were recorded throughout the morning, but seismicity generally remained at low levels. Elevated surface temperatures were visible in satellite data until about 0600. On 24 July pilots reported seeing vigorous gas-and-steam plumes rising to about 3 km altitude; the plumes may have contained minor amounts of ash.
During 24-25 July low level seismicity and volcanic tremor were detected at low levels following the previous explosion on 23 July. Strongly elevated surface temperatures were observed at the summit crater in satellite data. Around 2200 on 25 July seismicity began to increase, followed by infrasound signals of explosions after 0200 on 26 July. An ash plume rose to 3 km altitude at 0500 and drifted ENE, along with an associated sulfur dioxide plume that drifted NE and had an estimated mass of 22 kt. Diffuse ash emissions were visible in satellite data and rose to 6.1-7.6 km altitude and extended 125 km from the volcano starting around 1130. These ash events were preceded by about seven hours of seismic tremor, infrasound detections of explosions, and five hours of increased surface temperatures visible in satellite data. Activity began to decline around 1327, which included low-frequency earthquakes and decreased volcanic tremor, and infrasound data no longer detected significant explosions. Surface temperatures remained elevated through the end of the month.
Seismicity, volcanic tremor, and ash emissions remained at low levels during early August. Satellite images on 1 August showed that some slumping had occurred on the E crater wall due to the recent explosive activity. Elevated surface temperatures continued, which was consistent with cooling lava. On 2 August small explosive events were detected, consistent with low-level Strombolian activity. Some episodes of volcanic tremor were reported, which reflected low-level ash emissions. Those ash emissions rose to less than 3 km altitude and drifted as far as 92.6 km N. Pilots that were located N of the volcano observed an ash plume that rose to 2.7 km altitude. Seismicity began to increase in intensity around 0900 on 3 August. Seismicity continued to increase throughout the day and through the night with strongly elevated surface temperatures, which suggested that lava was active at the surface.
An ash cloud that rose to 7.6-7.9 km altitude and drifted 60-75 km NE was visible in a satellite image at 0520 on 4 August. Pilots saw and reported the plume at 0836 (figure 46). By 0900 the plume had risen to 9.1 km altitude and extended over 100 km NE. AVO raised the ACC to Red and the VAL to Warning as a result. Seismic tremor levels peaked at 1400 and then sharply declined at 1500 to slightly elevated levels; the plume was sustained during the period of high tremor and drifted N and NE. The ACC was lowered to Orange and the VAL to Watch at 2055. During 5-14 August seismicity remained low and surface temperatures were elevated based on satellite data due to cooling lava. On 9 August a small lava flow was observed that extended from the crater rim to the upper NE flank. It had advanced to 55 m in length and appeared in satellite imagery on 11 August. Occasional gas-and-steam plumes were noted in webcam images. At 1827 AVO noted that seismic tremor had steadily increased during the afternoon and erupting lava was visible at the summit in satellite images.
Strong explosion signals were detected at 0200 on 15 August. An ash cloud that was visible in satellite data extended 100 km NE and may have risen as high as 11 km altitude around 0240. By 0335 satellite images showed the ash cloud rising to 7.6 km altitude and drifting NE. Significant seismicity and explosions were detected by the local AVO seismic and infrasound networks, and volcanic lightning was detected by the World Wide Lightning Location Network (WWLLN). A sulfur dioxide plume associated with the eruption drifted over the S Bering Sea and parts of Alaska and western Canada. Seismicity was significantly elevated during the eruption but had declined by 1322. A pilot reported that ash emissions continued, rising as high as 4.9 km altitude. Elevated surface temperatures detected in satellite data were caused by hot, eruptive material (pyroclastic debris and lava) that accumulated around the summit. Eruptive activity declined by 16 August and the associated sulfur dioxide plume had mostly dissipated; remnants continued to be identified in satellite images at least through 18 August. Surface temperatures remained elevated based on satellite images, indicating hot material on the upper parts of the volcano. Small explosions were detected in infrasound data on the morning of 19 August and were consistent with pilot reports of small, short-lived ash plumes that rose to about 4.3 km altitude. Low-level explosive activity was reported during 20-24 August, according to seismic and infrasound data, and weather clouds sometimes prevented views. Elevated surface temperatures were observed in satellite images, which indicated continued hot material on the upper parts of the volcano.
Seismic tremor began to increase at around 0300 on 25 August and was followed by elevated surface temperatures identified in satellite images, consistent with erupting lava. Small explosions were recorded in infrasound data. The ACC was raised to Red and the VAL to Warning at 1204 after a pilot reported an ash plume that rose to 9.1 km altitude. Seismicity peaked at 1630 and began to rapidly decline at around 1730. Ash plumes rose as high as 10 km altitude and drifted as far as 400 km NE. By 2020 the ash plumes had declined to 6.4 km altitude and continued to drift NE. Ash emissions were visible in satellite data until 0000 on 26 August and seismicity was at low levels. AVO lowered the ACC to Orange and the VAL to Watch at 0030. Minor explosive activity within the summit crater was detected during 26-28 August and strongly elevated surface temperatures were still visible in satellite imagery through the rest of the month. An AVO field crew working on Unimak Island observed a mass flow that descended the upper flanks beginning around 1720 on 27 August. The flow produced a short-lived ash cloud that rose to 4.5 km altitude and rapidly dissipated. The mass flow was likely caused by the collapse of spatter that accumulated on the summit crater rim.
Similar variable explosive activity was reported in September, although weather observations sometimes prevented observations. A moderate resolution satellite image from the afternoon of 1 September showed gas-and-steam emissions filling the summit crater and obscuring views of the vent. In addition, hot deposits from the previous 25-26 August explosive event were visible on the NE flank near the summit, based on a 1 September satellite image. On 2 and 4 September seismic and infrasound data showed signals of small, repetitive explosions. Variable gas-and-steam emissions from the summit were visible but there was no evidence of ash. Possible summit crater incandescence was visible in nighttime webcam images during 3-4 September.
Seismicity began to gradually increase at around 0300 on 5 September and activity escalated at around 0830. A pilot reported an ash plume that rose to 7.6 km altitude at 0842 and continued to rise as high as possibly 9.7 km altitude and drifted SSE based on satellite images (figure 47). The ACC was raised to Red and the VAL to Warning at 0900. In addition to strong tremor and sustained explosions, the eruption produced volcanic lightning that was detected by the WWLLN. Around 1100 seismicity decreased and satellite data confirmed that the altitude of the ash emissions had declined to 7.6 km altitude. By 1200 the lower-altitude portion of the ash plume had drifted 125 km E. Significant ash emissions ended by 1330 based on webcam images. The ACC was lowered to Orange and the VAL to Watch at 1440. Satellite images showed extensive pyroclastic debris flows on most of the flanks that extended 1.2-3.3 km from the crater rim.
During 6-13 September elevated surface temperatures continued to be observed in satellite data, seismicity remained elevated with weak but steady tremor, and small, low-frequency earthquakes and small explosions were reported, except on 12 September. On 6 September a low-level ash plume rose to 1.5-1.8 km altitude and drifted SSE. Occasional small and diffuse gas-and-steam emissions at the summit were visible in webcam images. Around 1800 on 13 September seismic tremor amplitudes began to increase, and small explosions were detected in seismic and infrasound data. Incandescent lava at the summit was seen in a webcam image taken at 0134 on 14 September during a period of elevated tremor. No ash emissions were reported during the period of elevated seismicity. Lava fountaining began around 0200, based on webcam images. Satellite-based radar observations showed that the lava fountaining activity led to the growth of a cone in the summit crater, which refilled most of the crater. By 0730 seismicity significantly declined and remained at low levels.
Seismic tremor began to increase around 0900 on 15 September and rapidly intensified. An explosive eruption began at around 1710, which prompted AVO to raise the ACC to Red and the VAL to Warning. Within about 30 minutes ash plumes drifted E below a weather cloud at 8.2 km altitude. The National Weather Service estimated that an ash-rich plume rose as high as 12.8 km altitude and produced volcanic lightning. The upper part of the ash plume detached from the vent around 1830 and drifted E, and was observed over the Gulf of Alaska. Around the same time, seismicity dramatically decreased. Trace ashfall was reported in the community of False Pass (38 km ENE) between 1800-2030 and also in King Cove and nearby marine waters. Activity declined at around 1830 although seismicity remained elevated, ash emissions, and ashfall continued until 2100. Lightning was again detected beginning around 1930, which suggested that ash emissions continued. Ongoing explosions were detected in infrasound data, at a lower level than during the most energetic phase of this event. Lightning was last detected at 2048. By 2124 the intensity of the eruption had decreased, and ash emissions were likely rising to less than 6.7 km altitude. Seismicity returned to pre-eruption levels. On 16 September the ACC was lowered to Orange and the VAL to Watch at 1244; the sulfur dioxide plume that was emitted from the previous eruption event was still visible over the northern Pacific Ocean. Elevated surface temperatures, gas-and-steam emissions from the vent, and new, small lahars were reported on the upper flanks based on satellite and webcam images. Minor deposits were reported on the flanks which were likely the result of collapse of previously accumulated lava near the summit crater.
Elevated seismicity with tremor, small earthquakes, and elevated surface temperatures were detected during 17-23 September. Minor gas-and-steam emissions were visible in webcam images. On 20 September small volcanic debris flows were reported on the upper flanks. On 21 September a small ash deposit was observed on the upper flanks extending to the NE based on webcam images. Seismic tremor increased significantly during 22-23 September. Regional infrasound sensors suggested that low-level eruptive activity was occurring within the summit crater by around 1800 on 23 September. Even though seismicity was at high levels, strongly elevated surface temperatures indicating lava at the surface were absent and no ash emissions were detected; weather clouds at 0.6-4.6 km altitude obscured views. At 0025 on 24 September AVO noted that seismicity continued at high levels and nearly continuous small infrasound signals began, likely from low-level eruptive activity. Strongly elevated surface temperatures were identified in satellite images by 0900 and persisted throughout the day; the higher temperatures along with infrasound and seismic data were consistent with lava erupting at the summit. Around 1700 similarly elevated surface temperatures were detected from the summit in satellite data, which suggested that more vigorous lava fountaining had started. Starting around 1800 low-level ash emissions rose to altitudes less than 4.6 km altitude and quickly dissipated.
Beginning at midnight on 25 September, a series of seismic signals consistent with volcanic flows were recorded on the N side of the volcano. A change in seismicity and infrasound signals occurred around 0535 and at 0540 a significant ash cloud formed and quickly reached 14 km altitude and drifted E along the Alaska Peninsula. The cloud generated at least 150 lightning strokes with thunder that could be heard by people in False Pass. Seismicity rapidly declined to near background levels around 0600. AVO increased the ACC to Red and the VAL to Warning at 0602. The ash cloud detached from the volcano at around 0700, rose to 11.6 km altitude, and drifted ESE. Trace to minor amounts of ashfall were reported by the communities of False Pass, King Cove, Cold Bay, and Sand Point around 0700. Ash emissions continued at lower altitudes of 6-7.6 km altitude at 0820. Small explosions at the vent area continued to be detected in infrasound data and likely represented low-level eruptive activity near the vent. Due to the significant decrease in seismicity and ash emissions the ACC was lowered to Orange and the VAL to Watch at 1234. Radar data showed significant collapses of the crater that occurred on 25 September. Satellite data also showed significant hot, degassing pyroclastic and lahar deposits on all flanks, including more extensive flows on the ENE and WSW sections below two new collapse scarps. Following the significant activity during 24-25 September, only low-level activity was observed. Seismicity decreased notably near the end of the strong activity on 25 September and continued to decrease through the end of the month, though tremor and small earthquakes were still reported. No explosive activity was detected in infrasound data through 2 October. Gas-and-steam emissions rose to 3.7 km altitude, as reported by pilots and seen in satellite images. Satellite data from 26 September showed that significant collapses had occurred at the summit crater and hot, steaming deposits from pyroclastic flows and lahars were present on all the flanks, particularly to the ENE and WSW. A small ash cloud was visible in webcam images on 27 September, likely from a collapse at the summit cone. High elevated surface temperatures were observed in satellite imagery during 27-28 September, which were likely the result of hot deposits on the flanks erupted on 25 September. Minor steaming at the summit crater and from an area on the upper flanks was visible in webcam images on 28 September.
During October, explosion events continued between periods of low activity. Seismicity significantly increased starting at around 2100 on 2 October; around the same time satellite images showed an increase in surface temperatures consistent with lava fountaining. Small, hot avalanches of rock and lava descended an unspecified flank. In addition, a distinct increase in infrasound, seismicity, and lightning detections was followed by an ash plume that rose to 12.2 km altitude and drifted S and E at 0520 on 3 October, based on satellite images. Nighttime webcam images showed incandescence due to lava fountaining at the summit and pyroclastic flows descending the NE flank. AVO reported that a notable explosive eruption started at 0547 and lasted until 0900 on 3 October, which prompted a rise in the ACC to Red and the VAL to Warning. Subsequent ash plumes rose to 6-7.6 km altitude by 0931. At 1036 the ACC was lowered back to Orange and the VAL to Watch since both seismic and infrasound data quieted substantially and were slightly above background levels. Gas-and-steam emissions were observed at the summit, based on webcam images. Trace amounts of ashfall were observed in Cold Bay. Resuspended ash was present at several kilometers altitude near the volcano. During the afternoon, low-level ash plumes were visible at the flanks, which appeared to be largely generated by rock avalanches off the summit crater following the explosive activity. These ash plumes rose to 3 km altitude and drifted W. Trace amounts of ashfall were reported by observers in Cold Bay and Unalaska and flights to these communities were disrupted by the ash cloud. Satellite images taken after the eruption showed evidence of pyroclastic flows and lahar deposits in drainages 2 km down the SW flank and about 3.2 km down the NE flank, and continued erosion of the crater rim. Small explosion craters at the end of the pyroclastic flows on the NE flank were noted for the first time, which may have resulted from gas-and-steam explosions when hot deposits interact with underlying ice.
During 4 October seismicity, including frequent small earthquakes, remained elevated, but was gradually declining. Ash plumes were produced for over eight hours until around 1400 that rose to below 3.7 km altitude. These ash plumes were primarily generated off the sides of the volcano where hot rock avalanches from the crater rim had entered drainages to the SW and NE. Two explosion craters were observed at the base of the NE deposits about 3.2 km from the crater rim. Webcam images showed the explosion craters were a source of persistent ash emissions; occasional collapse events also generated ash. Seismicity remained elevated with sulfur dioxide emissions that had a daily average of more than 1,000 tons per day, and frequent small earthquakes through the end of the month. Frequent elevated surface temperatures were identified in satellite images and gas-and-steam plumes were observed in webcam images, although weather conditions occasionally prevented clear views of the summit. Emissions were robust during 14-16 October and were likely generated by the interaction of hot material and snow and ice. During the afternoon of 21 October a strong gas-and-steam plume rose to 3-4.6 km altitude and extended 40 km WSW, based on satellite images and reports from pilots. On 31 October the ACC was lowered to Yellow and the VAL was lowered to Advisory.
Activity in November was characterized by elevated seismicity with ongoing seismic tremor and small, low-frequency earthquakes, elevated surface temperatures, and gas-and-steam emissions. There was an increase in seismic and infrasound tremor amplitudes starting at 1940 on 2 November. As a result, the ACC was again raised to Orange and the VAL was increased to Watch, although ash was not identified in satellite data. An ash cloud rose to 6.1 km altitude and drifted W according to satellite data at 2000. By 0831 on 3 November ash emissions were no longer visible in satellite images. On 6 and 9 November air pressure sensors detected signals consistent with small explosions. Small explosions were detected in infrasound data consistent with weak Strombolian activity on 19 and 21 November. Seismicity started to decrease on 21 November. On 25 November gas-and-steam emissions were emitted from the vent as well as from a scarp on the NE side of the volcano near the summit. A gas-and-steam plume extended about 50 km SSE and was observed in satellite and webcam images on 26 November. On 28 November small explosions were observed in seismic and local infrasound data and gas-and-steam emissions were visible from the summit and from the upper NE collapse scarp based on webcam images. Possible small explosions were observed in infrasound data on 30 November. Weakly elevated surface temperatures and a persistent gas-and-steam plume from the summit and collapse scarps on the upper flanks. A passing aircraft reported the gas-and-steam plume rose to 3-3.4 km altitude on 30 November, but no significant ash emissions were detected.
Satellite data. MODIS thermal anomaly data provided through MIROVA (Middle InfraRed Observation of Volcanic Activity) showed a strong pulse of thermal activity beginning in July 2023 that continued through November 2023 (figure 48). This strong activity was due to Strombolian explosions and lava fountaining events at the summit crater. According to data from MODVOLC thermal alerts, a total of 101 hotspots were detected near the summit crater in July (11-14, 16-19, 23-24 and 26), August (4, 25-26, and 29), September (5, 12, and 17), and October (3, 4, and 8). Infrared satellite data showed large lava flows descending primarily the northern and SE flanks during the reporting period (figure 49). Sulfur dioxide plumes often exceeded two Dobson Units (DUs) and drifted in different directions throughout the reporting period, based on satellite data from the TROPOMI instrument on the Sentinel-5P satellite (figure 50).
Geologic Background. The symmetrical glacier-covered Shishaldin in the Aleutian Islands is the westernmost of three large stratovolcanoes in the eastern half of Unimak Island. The Aleuts named the volcano Sisquk, meaning "mountain which points the way when I am lost." Constructed atop an older glacially dissected edifice, it is largely basaltic in composition. Remnants of an older edifice are exposed on the W and NE sides at 1,500-1,800 m elevation. There are over two dozen pyroclastic cones on its NW flank, which is covered by massive aa lava flows. Frequent explosive activity, primarily consisting of Strombolian ash eruptions from the small summit crater, but sometimes producing lava flows, has been recorded since the 18th century. A steam plume often rises from the summit crater.
Information Contacts: Alaska Volcano Observatory (AVO), a cooperative program of a) U.S. Geological Survey, 4200 University Drive, Anchorage, AK 99508-4667 USA (URL: https://avo.alaska.edu/), b) Geophysical Institute, University of Alaska, PO Box 757320, Fairbanks, AK 99775-7320, USA, and c) Alaska Division of Geological & Geophysical Surveys, 794 University Ave., Suite 200, Fairbanks, AK 99709, USA (URL: http://dggs.alaska.gov/); MIROVA (Middle InfraRed Observation of Volcanic Activity), a collaborative project between the Universities of Turin and Florence (Italy) supported by the Centre for Volcanic Risk of the Italian Civil Protection Department (URL: http://www.mirovaweb.it/); Hawai'i Institute of Geophysics and Planetology (HIGP) - MODVOLC Thermal Alerts System, School of Ocean and Earth Science and Technology (SOEST), Univ. of Hawai'i, 2525 Correa Road, Honolulu, HI 96822, USA (URL: http://modis.higp.hawaii.edu/); NASA Global Sulfur Dioxide Monitoring Page, Atmospheric Chemistry and Dynamics Laboratory, NASA Goddard Space Flight Center (NASA/GSFC), 8800 Greenbelt Road, Goddard, Maryland, USA (URL: https://so2.gsfc.nasa.gov/); Copernicus Browser, Copernicus Data Space Ecosystem, European Space Agency (URL: https://dataspace.copernicus.eu/browser/).
Ioto
Japan
24.751°N, 141.289°E; summit elev. 169 m
All times are local (unless otherwise noted)
New eruption with discolored water, ejecta, and floating pumice during October-December 2023
Ioto (Iwo-jima), located about 1,200 km S of Tokyo, lies within a 9-km-wide submarine caldera along the Izu-Bonin-Mariana volcanic arc. Previous eruptions date back to 1889 and have consisted of dominantly phreatic explosions, pumice deposits during 2001, and discolored water. A submarine eruption during July through December 2022 was characterized by discolored water, pumice deposits, and gas emissions (BGVN 48:01). This report covers a new eruption during October through December 2023, which consisted of explosions, black ejecta, discolored water, and floating pumice, based on information from the Japan Meteorological Association (JMA), the Japan Coast Guard (JCG), and satellite data.
JMA reported that an eruption had been occurring offshore of Okinahama on the SE side of the island since 21 October, which was characterized by volcanic tremor, according to the Japan Maritime Self-Defense Force (JMSDF) Iwo Jima Air Base (figure 22). According to an 18 October satellite image a plume of discolored water at the site of this new eruption extended NE (figure 23). During an overflight conducted on 30 October, a vent was identified about 1 km off the coast of Okinahama. Observers recorded explosions every few minutes that ejected dark material about 20 m above the ocean and as high as 150 m. Ejecta from the vent formed a black-colored island about 100 m in diameter, according to observations conducted from the air by the Earthquake Research Institute of the University of Tokyo in cooperation with the Mainichi newspaper (figure 24). Occasionally, large boulders measuring more than several meters in size were also ejected. Observations from the Advanced Land Observing Satellite Daichi-2 and Sentinel-2 satellite images also confirmed the formation of this island (figure 23). Brown discolored water and floating pumice were present surrounding the island.
The eruption continued during November. During an overflight on 3 November observers photographed the island and noted that material was ejected 169 m high, according to a news source. Explosions gradually became shorter, and, by the 3rd, they occurred every few seconds; dark and incandescent material were ejected about 800 m above the vent. On 4 November eruptions were accompanied by explosive sounds. Floating, brown-colored pumice was present in the water surrounding the island. There was a brief increase in the number of volcanic earthquakes during 8-14 November and 24-25 November. The eruption temporarily paused during 9-11 November and by 12 November eruptions resumed to the W of the island. On 10 November dark brown-to-dark yellow-green discolored water and a small amount of black floating material was observed (figure 25). A small eruption was reported on 18 November off the NE coast of the island, accompanied by white gas-and-steam plumes (figure 23). Another pause was recorded during 17-19 November, which then resumed on 20 November and continued erupting intermittently. According to a field survey conducted by the National Institute for Disaster Prevention Science and Technology on 19 November, a 30-m diameter crater was visible on the NE coast where landslides, hot water, and gray volcanic ash containing clay have occurred and been distributed previously. Erupted blocks about 10 cm in diameter were distributed about 90-120 m from the crater. JCG made observations during an overflight on 23 November and reported a phreatomagmatic eruption. Explosions at the main vent generated dark gas-and-ash plumes that rose to 200 m altitude and ejected large blocks that landed on the island and in the ocean (figure 26). Discolored water also surrounded the island. The size of the new island had grown to 450 m N-S x 200 m E-W by 23 November, according to JCG.
The eruption continued through 11 December, followed by a brief pause in activity, which then resumed on 31 December, according to JMA. Intermittent explosions produced 100-m-high black plumes at intervals of several minutes to 30 minutes during 1-10 December. Overflights were conducted on 4 and 15 December and reported that the water surrounding the new island was discolored to dark brown-to-dark yellow-green (figure 27). No floating material was reported during this time. In comparison to the observations made on 23 November, the new land had extended N and part of it had eroded away. In addition, analysis by the Geospatial Information Authority of Japan using SAR data from Daichi-2 also confirmed that the area of the new island continued to decrease between 4 and 15 December. Ejected material combined with wave erosion transformed the island into a “J” shape, 500-m-long and with the curved part about 200 m offshore of Ioto. The island was covered with brown ash and blocks, and the surrounding water was discolored to greenish-brown and contained an area of floating pumice. JCG reported from an overflight on 4 December that volcanic ash-like material found around the S vent on the NE part of the island was newly deposited since 10 November (figure 28). By 15 December the N part of the “J” shaped island had separated and migrated N, connecting to the Okinahama coast and the curved part of the “J” had eroded into two smaller islands (figure 27).
References. Ukawa, M., Fujita, E., Kobayashi, T., 2002, Recent volcanic activity of Iwo Jima and the 2001 eruption, Monthly Chikyu, Extra No. 39, 157-164.
Geologic Background. Ioto, in the Volcano Islands of Japan, lies within a 9-km-wide submarine caldera. The volcano is also known as Ogasawara-Iojima to distinguish it from several other "Sulfur Island" volcanoes in Japan. The triangular, low-elevation, 8-km-long island narrows toward its SW tip and has produced trachyandesitic and trachytic rocks that are more alkalic than those of other volcanoes in this arc. The island has undergone uplift for at least the past 700 years, accompanying resurgent doming of the caldera; a shoreline landed upon by Captain Cook's surveying crew in 1779 is now 40 m above sea level. The Motoyama plateau on the NE half of the island consists of submarine tuffs overlain by coral deposits and forms the island's high point. Many fumaroles are oriented along a NE-SW zone cutting through Motoyama. Numerous recorded phreatic eruptions, many from vents on the W and NW sides of the island, have accompanied the uplift.
Information Contacts: Japan Meteorological Agency (JMA), 1-3-4 Otemachi, Chiyoda-ku, Tokyo 100-8122, Japan (URL: http://www.jma.go.jp/jma/indexe.html); Japan Coast Guard (JCG) Volcano Database, Hydrographic and Oceanographic Department, 3-1-1, Kasumigaseki, Chiyoda-ku, Tokyo 100-8932, Japan (URL: https://www1.kaiho.mlit.go.jp/GIJUTSUKOKUSAI/kaiikiDB/kaiyo22-2.htm); Copernicus Browser, Copernicus Data Space Ecosystem, European Space Agency (URL: https://dataspace.copernicus.eu/browser/); Asahi, 5-3-2, Tsukiji, Chuo Ward, Tokyo, 104-8011, Japan (URL: https://www.asahi.com/ajw/articles/15048458).
Search Bulletin Archive by Publication Date
Select a month and year from the drop-downs and click "Show Issue" to have that issue displayed in this tab.
The default month and year is the latest issue available.
Bulletin of the Global Volcanism Network - Volume 31, Number 07 (July 2006)
Cleveland (United States)
Astronauts capture photo of 23 May eruption
Etna (Italy)
An upper E-flank fissure eruption lasting from 14 to 24 July 2006
Galeras (Colombia)
Ongoing dome growth and elevated seismicity, thousands evacuated in July 2006
Karthala (Union of the Comoros)
Seismic crisis on 28 May 2006 precedes lava lake eruption in Chahalé crater
Karymsky (Russia)
Ash plumes reaching 5 km; ongoing eruptions through at least mid-2006
Mayon (Philippines)
New eruptive pulse starting 13 July; lava flows; thousands evacuated
St. Helens (United States)
Eruption still extrudes dacitic dome lavas without energetic explosions
Sulu Range (Papua New Guinea)
Seismicity and emissions reported from volcano with no historical eruptions
Tungurahua (Ecuador)
14-15 July 2006 eruption, the strongest since onset of eruption in 1999
Cleveland (United States) — July 2006 Cite this Report
Cleveland
United States
52.825°N, 169.944°W; summit elev. 1730 m
All times are local (unless otherwise noted)
Astronauts capture photo of 23 May eruption
On 23 May 2006, the Alaska Volcano Observatory (AVO) received a report from the International Space Station indicating that a plume was observed moving W from Cleveland volcano at 2300 UTC (BGVN 31:06). A photograph of the plume taken from the International Space Station was released by the National Aeronautics and Space Administration (NASA) (figure 5).
Starting at about 2300 UTC, just before this image was taken, Cleveland underwent a short eruption. The volcanic plume was seen in Advanced Very High Resolution Radiometer (AVHRR) polar-orbiting satellite data beginning from 2307 UTC. By 0100 UTC on 24 May the ash plume had detached from the vent and was approximately 130 kilometers SW of the volcano. Satellite data showed a cloud height of about 6.1 km asl (table 1). The plume was no longer detectable in satellite imagery by 0057 UTC on 25 May. In response to the event, AVO raised the Level of Concern Color Code to 'Yellow.'
Table 1. Satellite observations of ash plume from Cleveland volcano. Courtesy of the Washington Volcanic Ash Advisory Center (VAAC).
| Date and Time (UTC) |
Plume altitude |
Direction and speed |
| 24 May 2006 (0200) |
8.2 km |
SW at 55 km/hour |
| 24 May 2006 (0800) |
6.7 km |
SW at 37-46 km/hour |
| 24 May 2006 (1400) |
6.1 km |
W at 37-46 km/hour |
The last eruption of Cleveland was 6 February 2006 (BGVN 31:01). Since 24 May 2006, no new information about ash emissions had been received, nor have indications of continuing activity been detected from satellite data for the volcano. This short-lived event was typical of recent Cleveland activity. On 7 August 2006, AVO downgraded the Level of Concern Color Code for Cleveland from 'Yellow' to 'Not Assigned." Because Cleveland is not monitored with real-time seismic instrumentation, during intervals of repose it does not receive an assignment of Color Code 'Green,' but instead is left 'Not Assigned.'
Geologic Background. The symmetrical Mount Cleveland stratovolcano is situated at the western end of the uninhabited Chuginadak Island. It lies SE across Carlisle Pass strait from Carlisle volcano and NE across Chuginadak Pass strait from Herbert volcano. Joined to the rest of Chuginadak Island by a low isthmus, The native name, Chuginadak, refers to the Aleut goddess of fire, who was thought to reside on the volcano. Numerous large lava flows descend the steep-sided flanks. It is possible that some 18th-to-19th century eruptions attributed to Carlisle should be ascribed to Cleveland (Miller et al., 1998). In 1944 it produced the only known fatality from an Aleutian eruption.
Information Contacts: National Aeronautics and Space Administration (NASA) Earth Observatory (URL: http://earthobservatory.nasa.gov/); Washington Volcanic Ash Advisory Center (VAAC) (URL: http://www.ospo.noaa.gov/Products/atmosphere/vaac/); Jeffery Williams, NASA, ISS Crew Earth Observations and the Image Science & Analysis Group, Johnson Space Center 2101 NASA Parkway, Houston, TX 77058, USA.
Etna
Italy
37.748°N, 14.999°E; summit elev. 3357 m
All times are local (unless otherwise noted)
An upper E-flank fissure eruption lasting from 14 to 24 July 2006
This report covers the new eruption from an E-flank fissure during mid July 2006. Previously, on 7 September 2004, an eruptive period began that lasted until March 2005 (BGVN 29:09, 30:01). From March 2005 until November quiet degassing took place at the summit craters; on 16 December 2005 an explosive sequence at the summit was accompanied by an ash emission from the Bocca Nuova crater (BGVN 30:12). This report is from Sonia Calvari of the Istituto Nazionale di Geofisica e Vulcanologia (INGV) and covers the interval through 26 July. Brief mention is made at the end of the report about another episode starting on 31 August and going into at least mid-September.
On 14 July 2006 at 2330 a fissure opened on the E flank of the Southeast Crater (SEC) summit cone. Two vents along the fissure produced a lava flow spreading E to the Valle del Bove (figure 110). A helicopter survey carried out on 16 July at 0730 showed a braided lava flow field up to 1.7 km long. Based on the surface area and approximate volume of this lava flow field, workers estimated a mean output rate of ~ 2.6 m3/s during the first 32 hours of eruption. During the opening phase of the eruptive fissure, moderate strombolian emissions occurred at a third upper vent, located at about 3,100 m on the E flank of the SEC, just below the wide depression that cuts its eastern flank. It produced minor ash fallout on Catania. The composition of the ash was 80% juvenile, with small amount of lithics probably due to the opening phase of the vents.
On 17 July, the lava flow field was situated on the W wall of the Valle del Bove, and the two main flow fronts reached about 2,100 m elevation, spreading N of the Serra Giannicola Piccola ridge. The lava discharge peaked on 20 July (figure 111), when an effusion rate of ~ 10 m3/s drove the lava flow advance to a maximum distance of ~3 km within the Valle del Bove. The lava flow front widened at the base of Monte Centenari, at 1,800 m elevation, located at least 15 km from the closest villages. The effusion rate on 23 July decreased to ~3 m3/s. At that time the lava channels had narrowed and levees had partially collapsed. The eruption appeared to end on 24 July.
On 26 July, observers on the rim of the NE Crater heard strong explosions, and saw lapilli fall. This crater, together with the south pit within Bocca Nuova, showed significant thermal anomalies during a helicopter survey carried out on 24 July.
In the early morning of 31 August, Strombolian activity resumed at SEC's summit. In the next two weeks SEC was the scene of a series of dramatic events. By 11 September, lava from the SE flank of the SEC had advanced to reach ~3 km ESE. The resulting ribbon of lava was in places over 200 m wide. More details will follow in a subsequent report.
Geologic Background. Mount Etna, towering above Catania on the island of Sicily, has one of the world's longest documented records of volcanism, dating back to 1500 BCE. Historical lava flows of basaltic composition cover much of the surface of this massive volcano, whose edifice is the highest and most voluminous in Italy. The Mongibello stratovolcano, truncated by several small calderas, was constructed during the late Pleistocene and Holocene over an older shield volcano. The most prominent morphological feature of Etna is the Valle del Bove, a 5 x 10 km caldera open to the east. Two styles of eruptive activity typically occur, sometimes simultaneously. Persistent explosive eruptions, sometimes with minor lava emissions, take place from one or more summit craters. Flank vents, typically with higher effusion rates, are less frequently active and originate from fissures that open progressively downward from near the summit (usually accompanied by Strombolian eruptions at the upper end). Cinder cones are commonly constructed over the vents of lower-flank lava flows. Lava flows extend to the foot of the volcano on all sides and have reached the sea over a broad area on the SE flank.
Information Contacts: Sonia Calvari, Istituto Nazionale di Geofisica e Vulcanologia Sezione di Catania, Piazza Roma 2, 95123 Catania, Italy (URL: http://www.ct.ingv.it/); Reuters (URL: http://today.reuters.com/).
Galeras
Colombia
1.22°N, 77.37°W; summit elev. 4276 m
All times are local (unless otherwise noted)
Ongoing dome growth and elevated seismicity, thousands evacuated in July 2006
On 24 November 2005 an eruption began at Galeras that resulted in local ash fall (BGVN 31:01and 31:03). This report discusses behavior through mid-August 2006.
Through December 2005 to the end of March 2006, the lava dome in the main crater continued to grow and seismicity remained elevated. Because of an increase in tremor at Galeras on 28 March 2006, Instituto Colombiano de Geología y Minería (INGEOMINAS) raised the Alert Level from 3 (changes in the behavior of volcanic activity have been noted) to 2 (likely eruption in days or weeks). Although the seismic activity apparently decreased on 29 March, Galeras remained at Alert Level 2.
INGEOMINAS reported that Galeras remained at a critical state during April and May 2006, with a partially solidified lava dome in the main crater. Seismicity, deformation, gas emissions, and temperatures all decreased. During 10-17 April, there were small gas emissions from the volcano. During 9-15 May, there were small gas and sporadic ash emissions. During 12-19 June, ash columns reached heights of 0.6-1.4 km above the summit.
According to Reuters and BBC reports, an increase in volcanic activity 12 July prompted the Colombian government to order the evacuation of ~ 10,000 people living near Galeras. INGEOMINAS reported an increase in seismic activity and at least two explosive eruptions. Ash accumulated in the towns of La Florida and Nariño, about 10 km N, and in the town of Genoy, 5 km NE. The Alert Level was increased from 2 (likely eruption in days to weeks) to 1 (eruption imminent or occurring). On 13 July, because of decreased activity, the Alert Level was lowered from 1 to 3. Approximately 2,000 people had been taken to shelters.
On 17 July, INGEOMINAS reported that after the 12 July eruption of Galeras, seismic activity decreased considerably. Observations of the dome and secondary craters in the W sector after 12 July showed minor physical changes. Weak gas plumes were observed without associated seismic activity. Through the first two weeks of August 2006, seismic activity remained at low levels. Gas and steam emissions from the main crater continued. Galeras remained at Alert Level 3 (changes in the behavior of volcanic activity have been noted).
Geologic Background. Galeras, a stratovolcano with a large breached caldera located immediately west of the city of Pasto, is one of Colombia's most frequently active volcanoes. The dominantly andesitic complex has been active for more than 1 million years, and two major caldera collapse eruptions took place during the late Pleistocene. Long-term extensive hydrothermal alteration has contributed to large-scale edifice collapse on at least three occasions, producing debris avalanches that swept to the west and left a large open caldera inside which the modern cone has been constructed. Major explosive eruptions since the mid-Holocene have produced widespread tephra deposits and pyroclastic flows that swept all but the southern flanks. A central cone slightly lower than the caldera rim has been the site of numerous small-to-moderate eruptions since the time of the Spanish conquistadors.
Information Contacts: Diego Gomez Martinez, Observatorio Vulcanológico y Sismológico de Pasto (OVSP), INGEOMINAS, Carrera 31, 1807 Parque Infantil, PO Box 1795, Pasto, Colombia (URL: https://www2.sgc.gov.co/volcanes/index.html; Washington Volcanic Ash Advisory Center (VAAC), Satellite Analysis Branch (SAB), NOAA/NESDIS E/SP23, NOAA Science Center Room 401, 5200 Auth Road, Camp Springs, MD 20746, USA (URL: http://www.ospo.noaa.gov/Products/atmosphere/vaac/); El Pais (URL: http://elpais-cali.terra.com.co/paisonline/); Reuters; British Broadcasting Company (BBC) (URL: http://www.bbc.co.uk/).
Karthala (Union of the Comoros) — July 2006 Cite this Report
Karthala
Union of the Comoros
11.7658°S, 43.3639°E; summit elev. 2350 m
All times are local (unless otherwise noted)
Seismic crisis on 28 May 2006 precedes lava lake eruption in Chahalé crater
On 28 May 2006, a magmatic eruption occurred inside the Chahalé caldera of Karthala volcano. Information in the previous report (BGVN 31:06) was based on newspaper accounts. This report comes from Hamidou Nassor, Julie Morin, Christopher Gomez, Magali Smietana, François Sauvestre, and Christopher Gomez. They noted some key references relating to Karthala, including a 2001 dissertation (Bachèlery and others, 1995; Krafft, 1982; and Nassor, 2001).
The 28 May 2006 crisis began with a few hours of elevated seismic activity, beginning around 1230 (local time). Three hours later, seismic stations recorded a small crisis that lasted for 6 hours and produced both SP and LP signals. Around 2107 the magmatic eruption began. Seismographs recorded a tremor only a few seconds later.
From the coast of the island a red cloud was visible above the volcano. Scientists at the Karthala observatory met with government representatives and confirmed a magmatic eruption. It was not yet known if the eruption had occurred on the caldera floor or inside the main crater. A trip to the volcano was necessary in order to assess the volcanic activity and determine the exact location of the eruption. Two hypotheses were proposed: (1) If the eruption was located in the N part of the caldera, the lava could flow outside the caldera, towards populated areas; (2) If the eruption was located inside the main crater, to the S, lava would remain inside the crater. The Comorian authorities helped the scientific team to get assistance from the South African Army (AMISEC) to fly over the volcano.
On the morning of 29 May 2006, the scientific team and AMISEC personnel flew over the volcano. They saw that the eruption was contained inside the main (Chahalé) crater, where the past three eruptions had occurred. A lava fountain was observed in the middle of the lava lake (figure 25). No lava flow was observed outside the caldera. Seismic records showed a tremor caused by the lava fountain; the fountain was apparently spurting since the beginning of the eruption.
On the morning of 31 May, the scientific team returned to Karthala with AMISEC forces. Part of the lake was still mobile and bubbling, but part had solidified on the surface in the SE and a few blocks were floating on the side of the lake (figure 26). No projectiles overshot the caldera rim.
On 1 June 2006 seismic monitoring indicated the end of the tremor phase. On 2 June scientists returned to the summit with AMISEC forces. They observed that the surface of the lava lake was solidified, but the deeper portions of the lake remained hot (figure 27).
References. Bachèlery, P., Damir, B.A., Desgrolard, F., Toutain, J.P, Coudray, J.P., Cheminée, J-L., Delmond, J.C., and Klein, J.L. 1995, L'éruption phréatique du Karthala (Grande Comore) en juillet 1991: C.R Acad. Sci. Paris, 320, série Iia, p. 691-698.
Krafft, M., 1982, L'éruption volcanique du Karthala en avril 1977 (Grande Comore, Océan Indien): C.R. Acad. Sci. Paris, t 294, série II, p. 753-758.
Nassor, H., 2001, Contribution ? l'étude du risque volcanique sur les grands volcans boucliers basaltiques: le Karthala et le Piton de la Fournaise: Ph.D. thesis, Univ. Reunion.
Geologic Background. The southernmost and largest of the two shield volcanoes forming Grand Comore Island (also known as Ngazidja Island), Karthala has two overlapping 3-4 km summit calderas generated by repeated collapse. Elongated rift zones extend NNW and SE from the summit of the basaltic shield, which has an asymmetrical profile that is steeper to the S. The lower SE rift zone forms the Massif du Badjini, a peninsula at the SE tip of the island. More than twenty eruptions have been recorded since the 19th century from the summit caldera and vents on the N and S flanks, producing many lava flows that reached the sea on both sides of the island. An 1860 CE lava flow from the summit caldera traveled ~13 km to the NW, reaching the W coast to the N of the capital city of Moroni.
Information Contacts: Hamidou Nassor (LSTUR) Université de la Réunion BP 7151, 15 Avenue, René Cassin, 97715 Saint-Denis; Julie Morin; Christopher Gomez, Laboratoire de géographie physique CNRS LGP; Magali Smietana, Universite de Rennes 1, France; Francois Sauvestre (CNDRS), BP 169, Moroni (URL: http://volcano.ipgp.jussieu.fr/karthala/stationkar.html).
Karymsky
Russia
54.049°N, 159.443°E; summit elev. 1513 m
All times are local (unless otherwise noted)
Ash plumes reaching 5 km; ongoing eruptions through at least mid-2006
During April, May and June 2006, intermittent eruptive activity at Karymsky continued. Pilots had previously reported ash emissions from Karymsky rising to 3-5 km altitude during January to April 2006, during which time Karymsky remained at Concern Color Code Orange (BGVN 31:04). The same color code stayed in effect through August 2006.
Based on interpretations of April-June 2006 seismic data, ash plumes rose to altitudes of between 3 and 8 km. Satellite imagery showed a large thermal anomaly at the volcano's crater from January to August 2006, and numerous ash plumes and deposits extended 10-200 km SE and E of the volcano.
During 10-16 June 2006, 400-600 shallow earthquakes occurred daily. Ash plumes up to 5 km altitude traveling SE were observed by pilots. On 19 June, the Advanced Spaceborne Thermal Emission and Reflection Radiometer (ASTER) on NASA's Terra satellite captured a false-color image of an ash plume from Karymsky (figure 12). During 21-27 June 200-700 shallow earthquakes occurred daily; during 23-30 June, 100-350 shallow earthquakes occurred daily.
According to the Tokyo VAAC, the Kamchatkan Experimental and Methodical Seismological Department (KEMSD) reported that during July 2006 ash plumes reached altitudes between 3 and 7 km. Approximately 100-350 shallow earthquakes occurred daily during 29 June to 3 July, and increased to 1,000 per day during 4-5 July.
Activity at Karymsky continued during 8-14 July, with 250-1000 shallow earthquakes occurring daily. Based on interpretations of seismic data, ash plumes reached altitudes of 5 km.
During August 2006, 100-300 shallow earthquakes occurred daily. Based on interpretations of seismic data, ash plumes reached altitudes of 3-3.7 km.
Geologic Background. Karymsky, the most active volcano of Kamchatka's eastern volcanic zone, is a symmetrical stratovolcano constructed within a 5-km-wide caldera that formed during the early Holocene. The caldera cuts the south side of the Pleistocene Dvor volcano and is located outside the north margin of the large mid-Pleistocene Polovinka caldera, which contains the smaller Akademia Nauk and Odnoboky calderas. Most seismicity preceding Karymsky eruptions originated beneath Akademia Nauk caldera, located immediately south. The caldera enclosing Karymsky formed about 7600-7700 radiocarbon years ago; construction of the stratovolcano began about 2000 years later. The latest eruptive period began about 500 years ago, following a 2300-year quiescence. Much of the cone is mantled by lava flows less than 200 years old. Historical eruptions have been vulcanian or vulcanian-strombolian with moderate explosive activity and occasional lava flows from the summit crater.
Information Contacts: Olga Girina, Kamchatka Volcanic Eruptions Response Team (KVERT), a cooperative program of the Institute of Volcanic Geology and Geochemistry, Far East Division, Russian Academy of Sciences, Piip Ave. 9, Petropavlovsk-Kamchatsky, 683006, Russia, the Kamchatka Experimental and Methodical Seismological Department (KEMSD), GS RAS (Russia), and the Alaska Volcano Observatory (USA); Alaska Volcano Observatory (AVO), a cooperative program of the U.S. Geological Survey, 4200 University Drive, Anchorage, AK 99508-4667, USA (URL: http://www.avo.alaska.edu/), the Geophysical Institute, University of Alaska, PO Box 757320, Fairbanks, AK 99775-7320, USA, and the Alaska Division of Geological and Geophysical Surveys, 794 University Ave., Suite 200, Fairbanks, AK 99709, USA; Tokyo Volcanic Ash Advisory Center (VAAC) (URL: https://ds.data.jma.go.jp/svd/vaac/data/).
Mayon
Philippines
13.257°N, 123.685°E; summit elev. 2462 m
All times are local (unless otherwise noted)
New eruptive pulse starting 13 July; lava flows; thousands evacuated
Mayon was last reported on in March 2006 (BGVN 31:03), discussing an eruption in February 2006. Low-level activity and seismicity prevailed through early July. This report covers an eruptive pulse that began on 13 July 2006 and continued through August 2006. On 13 July there were phreatic eruptions that produced light ashfall in the areas of Calbayog and Malilipot. At 2200 on 14 July, authorities raised the Alert Level from 1 to 3 due to moderate white steam drifting NE and lava flows extending 0.7-1.0 km from the summit onto the SE slopes. On 15 July, the lava flow continued its SE progression towards Bonga gully.
On 16 July, the 6 km radius hazard zone known as the Permanent Danger Zone (PDZ) established around the SE area, was extended to 7 km and during the period covered by this report the radius of the danger zone around the southern sector was extended to 8 km. On 18 July, the Philippine Institute of Volcanology and Seismology (PHIVOLCS) reported that the lava flow had reached 1 km in length and incandescent boulders had rolled 3 km towards the Bonga gully. Seismicity, reported SO2 fluxes, and posted alert levels appear in table 8.
Table 8. Mayon's reported seismicity, SO2 fluxes, and alert levels during 15 July 2006 to 24 August 2006. "?" indicates information not available. Courtesy of PHIVOLCS.
| Date |
Volcanic earthquakes |
Tremor episodes |
SO2 flux (t/d) |
Alert Level |
| 15 Jul 2006 |
-- |
111 |
2,211 |
3 |
| 17 Jul 2006 |
-- |
314 |
1,513 |
3 |
| 18 Jul 2006 |
-- |
-- |
-- |
3 |
| 19 Jul 2006 |
-- |
250 |
2,157 |
3 |
| 20 Jul 2006 |
-- |
-- |
-- |
-- |
| 21 Jul 2006 |
-- |
-- |
-- |
-- |
| 22 Jul 2006 |
-- |
-- |
-- |
-- |
| 23 Jul 2006 |
-- |
-- |
-- |
-- |
| 24 Jul 2006 |
11 |
324 |
7,020 |
3 |
| 25 Jul 2006 |
12 |
564 |
5,886 |
3 |
| 26 Jul 2006 |
7 |
316 |
9,275 |
3 |
| 27 Jul 2006 |
6 |
421 |
4,550 |
3 |
| 28 Jul 2006 |
8 |
423 |
8,724 |
3 |
| 29 Jul 2006 |
4 |
394 |
6,099 |
3 |
| 31 Jul 2006 |
-- |
388 |
12,548 |
3 |
| 01 Aug 2006 |
-- |
354 |
7,418 |
3 |
| 02 Aug 2006 |
16 |
450 |
7,050 |
3 |
| 03 Aug 2006 |
51 |
343 |
4,760 |
3 |
| 04 Aug 2006 |
18 |
354 |
2,965 |
3 |
| 05 Aug 2006 |
18 |
354 |
2,965 |
3 |
| 06 Aug 2006 |
12 |
371 |
1,919 |
3 |
| 07 Aug 2006 |
-- |
-- |
-- |
-- |
| 08 Aug 2006 |
109 |
344 |
12,745 |
4 |
| 09 Aug 2006 |
21 |
294 |
7,829 |
4 |
| 10 Aug 2006 |
3 |
501 |
6,573 |
4 |
| 11 Aug 2006 |
6 |
213 |
6,876 |
4 |
| 12 Aug 2006 |
6 |
191 |
3,423 |
4 |
| 13 Aug 2006 |
13 |
158 |
5,427 |
4 |
| 14 Aug 2006 |
16 |
152 |
3,493 |
4 |
| 16 Aug 2006 |
15 |
154 |
8,086 |
4 |
| 17 Aug 2006 |
5 |
130 |
2,937 |
4 |
| 18 Aug 2006 |
32 |
307 |
2,937 |
4 |
| 19 Aug 2006 |
22 |
240 |
2,712 |
4 |
| 20 Aug 2006 |
15 |
253 |
6,634 |
4 |
| 21 Aug 2006 |
15 |
274 |
5,390 |
4 |
| 22 Aug 2006 |
24 |
431 |
2,445 |
4 |
| 23 Aug 2006 |
10 |
316 |
5,215 |
4 |
| 24 Aug 2006 |
18 |
451 |
6,328 |
4 |
Pyroclastic flows on the SE slopes prompted approximately 100 families to evacuate on 20 July. On 22 July, lava flows advanced NE towards the Mabinit channel. By 24 July, lava flows had traveled SSE, ~4 km from the summit toward Bonga gully, and branched off to the W and E. Incandescent blocks shed from the toe and margins of the flows traveled SE and were visible at night. Additionally, on 24 July seismographs recorded more than 324 tremor episodes and 11 volcanic earthquakes. SO2 emissions from the summit crater reached 7,000 metric tons per day, several times larger than fluxes reported earlier.
PHIVOLCS reported lava flow advance in terms of straight-line distances, which progressed as follows: 26 July, 4.45 km; 27 July, 4.7 km; and 29 July, 5.4 km. During this time, SO2 rates remained high (table 8), suggesting fresh magma at shallow levels in the volcano. The number of tremor episodes and earthquakes also remained high. Tremor was thought to indicate near-continuous lava blocks detaching from the lava flows. Volcanic earthquakes were thought to reflect ascending magma. Figure 11 shows the lava flow front on 29 July.
On 29 July, light ash accumulation was reported about 12 km S and SE, in Daraga municipality and Legazpi City and vicinity, respectively. Emissions of sulfur-dioxide reached ~ 12,500 tons per day on 31 July, a record high for this reporting interval. By 1 August, in the SE sector of the Bonga gully, lava flows had advanced ~1.35 km, and in the SSE sector they had advanced a maximum distance of 5.8 km from the summit.
According to a Philippine Information Agency (PIA) press report, military and police checkpoints were set up on 2 August around the 6-km-radius PDZ to prohibit entry. A large lava deposit had grown on the SE flanks. The lava which faced Legazpi and Daraga, had piled up during the initial two weeks of the eruption and threatened to cross the PDZ. PHIVOLCS had reported that the advancing incandescent front of the lava flow was ~20 m high and 50 m wide (figure 12). PHIVOLCS estimated that the lava front could breach the 6-km-radius PDZ within two to three days.
An overflight of Mayon on 6 August revealed that lavas discharging from the summit crater extended along the Mabinit channel and spilled into the Bonga gully, E of the Mabinit channel. Due to the decreased supply of lava to the Mabinit channel, the flow there was expected to cease a short distance beyond the 6-km-radius PDZ. Six ash explosions sent ash columns up to 800 m above the summit, prompting PHIVOLCS to raise the alert level from 3 to 4, indicating an eruption is imminent. According to the Manila Bulletin Online, as many as 50,00 people in the Albay province were evacuated.
On 7 August, an advancing lava flow crossed 100 m beyond the 6-km-radius PDZ. According to the Manila Standard Today, authorities warned residents of more lava and fires as the lava flows crept along the Mabinit and Bonga gullies.
During 9-15 August, explosive activity continued at Mayon after a brief respite on 8 August. Based on interpretations of seismic data, minor explosions during 9-11 and 13-15 August were accompanied by lava extrusion and collapsing lava flow fronts that released blocks and small fragments. A drop in SO2 emissions on 9 August worried volcanologists that something had blocked the flow of magma in Mayon's conduit and could therefore cause a build up in pressure resulting in a larger eruption. Visual observations were commonly obscured by clouds. On 11 August an ash plume was seen drifting ESE. On 12 August, four explosions occurred; one produced a pyroclastic flow that traveled over the SE and E slopes and generated a plume that rose to an altitude of 500 m and then drifted NE. On 15 August, a brief break in the clouds allowed for a view and confirmed the presence of fresh pyroclastic deposits from activity in the previous days. Approximately 40,000 people remained in evacuation centers and authorities maintained an Extended Danger Zone at 8 km from the summit in the SE sector.
PHIVOLCS reported that explosions from Mayon continued during 16-19 August. On 17 August, ash-and-steam plumes drifted at least 5.3 km NE and reached the town Calbayog, where light ashfall was reported. Lava extrusion continued and on the SE slopes lava-flow fronts shed blocks and small fragments. On 18 August, the Mibinit and Bonga gully lava flows reached ~ 6.8 km SE from the summit. PHIVOLCS estimated the volume of erupted materials at between 36 and 41 million cubic meters.
Geologic Background. Symmetrical Mayon, which rises above the Albay Gulf NW of Legazpi City, is the most active volcano of the Philippines. The steep upper slopes are capped by a small summit crater. Recorded eruptions since 1616 CE range from Strombolian to basaltic Plinian, with cyclical activity beginning with basaltic eruptions, followed by longer periods of andesitic lava flows. Eruptions occur predominately from the central conduit and have also produced lava flows that travel far down the flanks. Pyroclastic density currents and mudflows have commonly swept down many of the approximately 40 ravines that radiate from the summit and have often damaged populated lowland areas. A violent eruption in 1814 killed more than 1,200 people and devastated several towns.
Information Contacts: Philippine Institute of Volcanology and Seismology (PHIVOLCS), PHIVOLCS Building, C.P. Garcia Avenue, U.P. Campus, Diliman, Quezon City, Philippines, Reuters Alert Network (URL: http://www.alertnet.org/thenews/newsdesk/MAN212904.htm); The Associated Press (URL: http://www.ap.org/); Manila Standard Today (URL: http://manilastandard.net/); Manila Bulletin Online (URL: http://www.mb.com.ph/).
St. Helens (United States) — July 2006 Cite this Report
St. Helens
United States
46.2°N, 122.18°W; summit elev. 2549 m
All times are local (unless otherwise noted)
Eruption still extrudes dacitic dome lavas without energetic explosions
The current and ongoing eruption of the St. Helens started on 11 October 2004. Extrusion of the growing lava dome has continued in the same quiescent mode exhibited over the past year, and levels of seismicity remained generally low, with low emissions of steam and volcanic gases and minor production of ash. From 1830 hours on 26 October 2004 to 15 August 2006, a total of 13,841 seismic triggers have occurred. Figures 65 and 66 summarize seismicity over the past year. A decade-long time-depth plot clearly shows the start of the current eruption (figure 67).
Pictures and movies taken in August 2006 with the Brutus camera (located on the E rim of the 1980 Mount St. Helens crater) showed continued extrusion of spine 7 on the growing lava dome (figure 68) (photos and movies are also available on the CVO website). Between 4-5 and 7-8 August a segment of the middle part of spine 7 temporarily stopped moving. At 1310 on 5 August a magnitude 3.6 earthquake occurred, and subsequent photographs showed that the "stuck" segment became unstuck. Motion again stopped sometime after 1310 on 7 August and much of 8 August, when a M 3.3 earthquake occurred at 2001 on 8 August. Clouds obscured the volcano from view on 9 August, but parted enough on 10 August to show that once again the segment became unstuck. One explanation by CVO scientists for these observations is that the large earthquakes were caused by parts of the spine sticking and then slipping.
Geologic Background. Prior to 1980, Mount St. Helens was a conical volcano sometimes known as the Fujisan of America. During the 1980 eruption the upper 400 m of the summit was removed by slope failure, leaving a 2 x 3.5 km breached crater now partially filled by a lava dome. There have been nine major eruptive periods beginning about 40-50,000 years ago, and it has been the most active volcano in the Cascade Range during the Holocene. Prior to 2,200 years ago, tephra, lava domes, and pyroclastic flows were erupted, forming the older edifice, but few lava flows extended beyond the base of the volcano. The modern edifice consists of basaltic as well as andesitic and dacitic products from summit and flank vents. Eruptions in the 19th century originated from the Goat Rocks area on the N flank, and were witnessed by early settlers.
Information Contacts: U.S. Geological Survey Cascades Volcano Observatory, Vancouver, WA (URL: https://volcanoes.usgs.gov/observatories/cvo/); The Pacific Northwest Seismograph Network, University of Washington Dept. of Earth and Space Sciences, Box 351310, Seattle, WA (URL: http://www.geophys.washington.edu/SEIS/PNSN/).
Sulu Range (Papua New Guinea) — July 2006 Cite this Report
Sulu Range
Papua New Guinea
5.5°S, 150.942°E; summit elev. 610 m
All times are local (unless otherwise noted)
Seismicity and emissions reported from volcano with no historical eruptions
On 7 July 2006, observers reported the first historical indication of volcanic activity in the Sulu Range of New Britain (in the nation of Papua New Guinea (PNG)). As shown on figure 1, the Sulu Range lies near the N coast of New Britain Island. This spot sits in the Province of West New Britain but in terms of geometry, lies closer to the middle of the island ~100 km E of the prominent, N-trending Willaumez Peninsula and ~200 km SW of Rabaul at the island's E end.
Rabaul Volcano Observatory (RVO) noted that ground observations at the Sulu Range, confirmed by aerial inspection, indicated that the emissions were coming from an area initially incorrectly disclosed as Mount Karai. (Karai is reportedly equivalent to Mount Ruckenberg, mentioned below.) Later reports correcting the initial vent location, stated that the eruption took place 2 km SW of Mount Karai between Ubia and Ululu volcanoes.
Considerable light on the Sulu Range and other volcanoes in the vicinity is shed by an Australian Bureau of Mineral Resources report by Johnson (1971). The coordinates and summit elevation given in the header above apply to the highest point in the Sulu Range, Mount Malopu (synonyms include "Malutu" and "Malobu").
Changes in our nomenclature. We indicate Walo hot springs on the lower map of figure 1, the only feature in this vicinity previously identified in our database on active volcanoes. Walo was listed as a thermal feature in the Melanesian portion of the Catalog of Active Volcanoes of the World (Fisher, 1957) and in Simkin and Siebert (1994). Walo rests in a low swampy area ~ 3 km W of the edge of the Sulu Range, which we apply broadly to a ~ 10 km diameter mountainous area with multiple peaks of ~ 500-600 m elevation. The highland areas associated with the Sulu Range's NE end contains a cone near the coast, which is labeled "Mount Ruckenberg (extinct volcano)" on the Bangula Sheet (Papua New Guinea 1:100,000 Topographic Survey, 1975).
The Sulu Range eruption has spurred restructuring of our naming conventions. Walo is now listed as a thermal feature associated with the larger volcanic field called the Sulu Range (and it preserves the Volcano Number that used to apply only to Walo, 0502-09=).
2006 eruption and earthquakes. RVO reported that there were indications as early as February 2006 that something was changing at Sulu Range because vegetation there was dying off. RVO noted that earthquakes began on 6 July and most river systems near Mount Karai had turned muddy due to the continuous shaking. Seismic activity was followed by the emission of puffs of white vapor from the area and loud booming and rumbling noises accompanied strong tremors.
Eruptions started with forceful dark emissions late on 7 and 8 July and decreased to moderate emissions by 10 July. At the settlement Bialla, ~20 km NE of the Sulu Range, tremors were felt. These were also picked up by the seismic stations at Garbuna and Ulawun (~100 km W and ENE, respectively).
In a report discussing 10-11 July, RVO reported that three villages N of Mount Karai had been evacuated. For the 10th, RVO described the activity as weak-to-moderate emission of white vapor with no evidence of ashfall and with occasional weak-to-moderate roaring noises accompanying the emissions. On the 11th, associated with earthquakes, white puffs discharged. Similar observations of white emissions prevailed through the 12th.
Earthquakes increased both in size and frequency of occurrence, and on 11 July at Bialla they took place every 10-20 minutes. Near Ubia volcano, seismicity was very elevated, with earthquakes every few minutes. At 0820 on 12 July a large earthquake of Modified Mercalli (MM) intensity VII or more occurred in the region. It disturbed the shoreline, which discolored the seawater; shaking also caused the sea surface to become choppy.
The USGS epicenter for the above-cited 12 July (local time) earthquake was listed at very nearly the same time (in UTC, on 11 July at 2222) with epicenter at 5.48°S, 150.83°E, a depth of 37 km and a body magnitude (mb) of 4.90. That spot lies 12 km NE of Sulu Range (using the coordinates listed in the header above). On a table of earthquakes the same day (11 July, UTC), seven others, mb 3.9-4.7 occurred within several hundred kilometers of Sulu Range. All took place earlier, but a pattern of substantial ongoing earthquakes also prevailed later as well.
RVO noted that from 1600 on 12 July to 0900 on 13 July high-frequency earthquakes occurring at the rate of one every minute were recorded on the seismograph deployed at Bialla. The earthquakes recorded were of varying (though unstated) magnitudes and towards 0900 decreased slightly to one every 30 minutes. Shortly afterwards, from 1000 to 1400 on 13 July, the seismograph was deployed in Kaiamu village on the small point immediately NW of the uplands portions of the Sulu Range, where it recorded continuous strings of high frequency earthquakes. Although the instrument was out of service after 1400 on the 13th, recording resumed that afternoon and seismic activity continued at a high level through 0900 on 15 July. During this time, the occurrence of felt earthquakes with maximum MM intensity V increased from one every 40-60 minutes to one every 2-3 minutes. Details of a subsequent decline in seismicity are sketchy.
The last reported visible emissions from the Sulu Range were on 12 July. By early August 2006 seismic activity had decreased to earthquakes of MM intensity I to II occurring at increasing intervals.
Again referring to USGS seismicity tables, the previously mentioned pattern of ongoing earthquakes on 11 July, generally mb 3.9-4.9, continued. An exception, the largest magnitude event during 9-18 July struck 31 km from Sulu Range, listed in UTC on 13 July at 2248; mb 5.1. It was at 39 km depth with epicenter ~12 km away. About 5 hours later a mb 4.7 event was recorded directly at volcano. On the 19th two larger earthquakes struck. One an Ms 6.4 centered 28 km away; the second, an Mw 5.90, 33 km away. These were the largest earthquakes within 50 km during 1 July to 11 September 2006.
References. Fisher N H, 1957, Melanesia: Catalog of Active Volcanoes of the World and Solfatara Fields, Rome, IAVCEI, v. 5, p. 1-105.
Johnson, R.W., 1971, Bamus volcano, Lake Hargy area, and Sulu Range, New Britain: Volcanic geology and petrology, Aust. Bur. Min. Res. Geol. Geophys. Rec, 1971/55, p. 1-36.
Papua New Guinea 1:100,000 Topographic Survey, 1975, Bangula Sheet, Sheet 9187, Series T601: Royal Australian Survey Corps (Reprinted by the National Mapping Bureau, 1985).
Simkin, T., and Siebert, L., 1994, Volcanoes of the World: Geoscience Press, Tucson, Arizona, 349 p. (ISBN 0-945005-12-1).
Geologic Background. The Sulu Range consists of a cluster of partially overlapping small stratovolcanoes and lava domes in north-central New Britain off Bangula Bay. The 610-m Mount Malopu at the southern end forms the high point of the basaltic-to-rhyolitic complex. Kaiamu maar forms a peninsula with a small lake extending about 1 km into Bangula Bay at the NW side of the Sulu Range. The Walo hydrothermal area, consisting of solfataras and mud pots, lies on the coastal plain west of the SW base of the Sulu Range. No historical eruptions are known from the Sulu Range, although some of the cones display a relatively undissected morphology. A vigorous new fumarolic vent opened in 2006, preceded by vegetation die-off, seismicity, and dust-producing landslides.
Information Contacts: Herman Patia and Steve Saunders, Rabaul Volcano Observatory (RVO), P.O. Box 386, Rabaul, Papua New Guinea.
Tungurahua (Ecuador) — July 2006 Cite this Report
Tungurahua
Ecuador
1.467°S, 78.442°W; summit elev. 5023 m
All times are local (unless otherwise noted)
14-15 July 2006 eruption, the strongest since onset of eruption in 1999
This report discusses Tungurahua's behavior during August 2005 through the end of July 2006. Material presented here was chiefly gleaned from a series of special reports issued in Spanish by the Instituto Geofísico of the Escuela Politécnica Nacional (IGEPN, hereafter IG). Daily reports for mid-2005 through early 2006 were dominated by descriptions of small plumes and minor ashfall; the reports also noted occasional small rain-generated lahars. For the most part 2005 was the quietest year since eruptions began in 1999, leading residents and volcanologists to ponder if emissions were terminating. This report omits much discussion of evacuations and hazard-status postings. Large eruptions with a Volcanic Explosivity Index (VEI) of 3 that continued into at least late August 2006 will be the subject of the next Bulletin report.
During late December 2005 seismometers detected sudden clusters of tremor and earthquakes. Intervals of quiet were broken by the arrival of signals with energy over a broad frequency range (figures 26 and 27). These signals and later manifestations at the surface in late March-early April were thought to be related to a new injection of magma. As a consequence, IG began to produce a series of special reports (table 10). Beginning in February 2006 and particularly during May-June 2006, the volcano was the scene of particularly significant events, including the largest detonations heard and seen since eruptions renewed in 1999. Other observations included a shift in eruptive style, and generation of some pyroclastic flows during the 14 July (VEI 2) eruption. Notable also were constant "roars" and vibrations of such strength and duration that they keep residents awake at night and caused some to voluntarily evacuate.
Table 10. A summary of special reports on Tungurahua issued by the IG during 2006 (reports numbered 1-8; See IG web page-Informes Especiales-Volcanicos).
| Date |
Special Report |
Key observation(s) |
| 18 Feb 2006 |
1 |
Moderate explosions and tephra falls in Puela (SW), Paillate (W), Ambato (NW) and Banos (N). |
| 07 Apr 2006 |
2 |
Episodes of strong volcanic tremor and increase in number of long-period seismic events, indicating new magma injection. |
| 25 Apr 2006 |
3 |
Notable banded tremor, the inferred product of new injected magma interacting with the hydrothermal system. |
| 12 May 2006 |
4 |
10 May-start of major increase in number of explosions, long-period seismic events and tremor episodes. Very strong detonations (12 per hour). Peak of energy release on 14 May, then decline. Aborted eruption. |
| 30 May 2006 |
5 |
Starting 16 May, significant decrease in activity and superficial manifestations. Explosions occur 2-3 times per day; columns of gases (water vapor mainly) with light ash content predominate. |
| 14 Jul 2006 |
6 |
Advisory of intensified eruptive activity; notable increase in emissions and strong detonations (at 2210 & 2250 UTC). Incandescent lava flung from crater. Strong ground movements reported on W flank. |
| 14 Jul 2006 |
8 |
Very strong detonations, period of calm, then ascent of 15-km-high, dark, ash-laden column. First pyroclastic flow (at 2250 UTC) and others to descend six valleys (quebradas) on the W-NW-N flanks. Intense lava fountaining; moderate ash and scoria fall to the W. |
| 15 Jul 2006 |
8 |
Unusually large discharges with a detonation (at 0559 UTC), leading to the largest registered since 1999. Plume rose to ~15 km altitude. The eruptive style later shifted to periodic detonations with intervals of calm. |
A map and table of commonly referred-to locations appeared in a previous issue (BGVN 29:01). Our last report on Tungurahua covered February 2004 to July 2005 (BGVN 30:06), during which time volcanic and seismic activity varied, but included some intervals with comparatively low activity and seismicity such as February to mid-July 2005.
Activity during June to mid-December 2005. From June 2005 through mid-December 2005, volcanic and seismic activity at Tungurahua was at relatively low levels. Low-energy plumes composed of gas, steam, and occasionally small amounts of ash were emitted frequently. Some noteworthy events during this interval follow.
On 7 June 2005, fine ash fell in the Puela sector, ~ 8 km SW. On 24 June, about an hour after an ash eruption, a narrow plume was identified in multispectral satellite imagery. The ash plume was at an altitude of ~ 5.5 km and extended 35-45 km W from the summit.
Ash plumes rose to an altitude of 5.8 km on 4 July. On 21 and 22 August, ash fell in the town of Bilbao, 8 km W of the volcano. On 25 August, ash fell NW of the volcano in the towns of Bilbao and Cusúa. On 1 September, ash fell ~ 8 km SW of the summit in the Puela sector.
On 10 September, a lahar affected an area near the new Baños-Penipe highway. On 14 September, a steam column with little ash reached ~ 300 m above the crater and drifted W; small amounts of ash fell in Puela. A small amount of ash fell in the towns of Cusúa and Bilbao during the morning of 21 September. Fumaroles on the outer edge of the crater were visible from Runtún (6 km NNE of the summit) after not being seen for 6 months. Steam-and-gas plumes rose ~ 1 km and drifted W. A pilot reported an ash plume on 29 September at an altitude of ~ 6.1 km.
During October, and November heavy rain caused lahars to travel down some of the gorges on the volcano's flanks. On 3 and 13 November lahars caused the temporary closure of the Baños-Riobamba highway, and a highway in Pampas. On 15 November ash plumes rose to ~ 9.1 km; on 23 November plumes rose to ~6.7 km.
On 13 December, lahars were generated at Tungurahua that traveled down the Juive (NNW) and Achupashal (W) gorges. On 14 December a steam-and-ash cloud rose ~ 1 km above the volcano. On 17 December, lahars were generated in the NW and W zone of the volcano. There were reports of lahars to the W in the Chontapamba sector that blocked the Baños-Penipe highway, in the Salado sector where the volume of water in the Vazcún increased by 70 percent, and in the NW (La Pampa) sector.
Return, incidence, and significance of broadband seismicity. An important variation in behavior was noted during late December 2005, with the appearance of long-period-earthquake swarms. The swarms preceded emissions and explosions. Such swarms were associated with mid-February 2006 ash-bearing explosions discussed below. After 21 March 2006, the swarms became yet more common and stronger. They were joined by low-frequency harmonic tremor.
Interpreted as related to the motion of magma, the tremor and swarms also seemed closely associated with lava fountains seen in the crater on 25 March 2006. Along with long-period earthquakes there were two episodes of high-amplitude tremor during 4-5 April 2006. Such seismicity had been absent for about a year. Small lava fountains witnessed on the night of 17 April 2006 were again preceded by long-period earthquakes and banded tremor.
As a result, IG distributed two special reports (##2 & 3). The latter contained a spectrogram for late April 2006, illustrating intervals of relative quiet (up to ~ 5 hours long) punctuated by broad-band signals (i.e. coincident earthquakes and tremor) sometimes in tight clusters lasting ~ 90 minutes.
January-May 2006. At the beginning of January 2006, explosions generated moderate amounts of ash, but seismicity remained low. Though clouds obscured the volcano during much of 18-24 January 2006, steam clouds with minor ash content were seen on 20 and 22 January. A discharge of muddy, sediment-laden water along W-flank valleys on 23-24 January blocked the highway. On 25 January light rain caused lahars to flow in the NW sector. The lahars descended a NNW-flank gorge from the village of Juive, causing the closure of the Baños-Penipe highway. Around 28 January, ash fell in the village of Puela. On 31 January, a steam-and-ash plume rose ~1 km above the volcano and drifted W. A small lahar closed a road in Pampas for 2 hours.
On 5 February at 0600, a moderate explosion sent a steam plume, with a small amount of ash, to ~ 1 km above the volcano; the plume drifted SW. Light rainfall on 7 February generated a lahar in the La Pampa area NW of the volcano.
During 6-14 February, several moderate-sized emissions of gas and ash occurred at Tungurahua, with plumes rising to ~ 500 m above the volcano. Long-period earthquakes increased in number on the 6th. An explosion around midnight on 12 February expelled incandescent volcanic material that traveled down the N flank of the volcano. A small amount of ash fell in the town of Puela, SW of the volcano.
IG issued a report (##1; Boletín Especial Volcán Tungurahua) on 18 February 2006 noting slight increases in activity that week. Explosions were moderate; however, ashfall occurred in some settlements bordering the volcano. IG summarized the week with a table similar to one below, with multiple cases of ash fall on local towns (table 11).
Table 11. A summary of Tungurahua's ash falls during an active interval, 13-18 February 2006, and the settlements affected. OVT stands for the Observatorio Volcán Tungurahua, a facility 13 km NW of the summit, down valley from the town of Patate. The report was issued at 1330 on the 18th, explaining why the entries only applied to the first half of that day. Courtesy of IG (special report ##1).
| Date |
Number of explosions |
Location and comment |
| 13 Feb 2006 |
1 |
Puela (~8 km SW of the summit), ashfall during the day. |
| 14 Feb 2006 |
4 |
Puela, ashfall during the afternoon. |
| 15 Feb 2006 |
4 |
No ashfall reported. |
| 16 Feb 2006 |
9 |
Runtun, ashfall at dawn; Observatory (OVT), Pelileo, Banos, and Garcia Moreno subjected to light ashfall in the morning; Bilbao, Cusua, Puela, Humbalo, Bolivar, and Pillate subjected to strong ashfall in the morning. |
| 17 Feb 2006 |
3 |
In Chacauco, Cusua, and Juive ash fell at dawn and part of the morning. In Pillate, Cotalo, Cusua, and Huambalo, ash in the morning. In Bilbao, ashfall all day; and Chogluntus, small ashfall during the afternoon. |
| 18 Feb 2006 |
1 |
Observations until about 1200. In Banos, OVT, Salasaca, Pondoa, Bilbao, San Juan, and Pelileo, ashfall at dawn. In Banos and Ambato, ashfall in both the morning and afternoon. |
Activity at Tungurahua during 28 February to 6 March consisted of low-level seismicity and emissions of steam and gas, with low ash content. An explosion on the 28th produced a plume composed of steam, gas, and some ash that reached ~ 3 km high.
In addition to the moderate explosions during 8-10 March, light drizzle produced muddy water in the gorges on the volcano's W flank. As a result the Baños-Penipe highway was closed for several hours. On 9 March, ash fell in the zone of Juive on the volcano's NW flank. On 10 March, ash fell in the towns of Pillate, Pondoa, Runtún, and Cusúa (on the W to NW to NNE flanks).
During 16-20 March, small-to-moderate explosions occurred at Tungurahua that consisted of gas, steam, and small amounts of ash. Plumes rose to ~ 3 km above the volcano. During 22-27 March, similar explosions consisted of gas, steam, and small amounts of ash. Plumes rose as high as ~ 1 km above the volcano on several days. An explosion on 26 March was accompanied by incandescent blocks that rolled down the volcano's NW flank.
On 18 February, small amounts of ashfall were reported at the observatory, Cotaló, Cusúa, and other settlements (table 11). On 19 February, rainfall generated a small mudflow SW of the volcano in the Quebrada Rea sector of Puela.
Table 12 summarizes observations associated with plumes and seismicity during 15 February to 8 May 2006. Many observations in that interval noted small-to-moderate explosions or other emissions. Ash plumes to 1-3 km above the volcano (6-8 km altitude) were typical.
Table 12. A compilation of some daily and weekly observations from Tungurahua during 15 February to 8 May 2006. Courtesy of IG.
| Date range |
Description of activity (plume heights in kilometers above the summit) |
| 15 Feb-19 Feb 2006 |
Ash plume as high as 3 km. |
| 26 Feb-27 Feb 2006 |
Steam and gas with low ash content; on the 26th, 1 plume to ~3 km; on the 27th, to 1 km. Both plumes drifted NW. |
| 28 Feb-06 Mar 2006 |
Steam and gas with low ash content; on the 28th, 1 plume to ~3 km. Low seismicity. |
| 08 Mar-10 Mar 2006 |
Several explosions with low ash content resulting in plumes under 2 km. |
| 16 Mar-20 Mar 2006 |
Small-to-moderate explosions consisting of gas, steam, and small amounts of ash. Plumes rose to ~3 km. |
| 22 Mar-27 Mar 2006 |
Small-to-moderate explosions consisting of gas, steam, and small amounts of ash. Plumes rose as high as ~1 km above the volcano on several days. |
| 29 Mar-02 Apr 2006 |
Small-to-moderate explosions consisting of gas, steam, and small amounts of ash. |
| 04 Apr-10 Apr 2006 |
Small-to-moderate explosions at Tungurahua consisting of gas, steam, and small amounts of ash. On the 9th, plumes rose to ~3 km. |
| 11 Apr-17 Apr 2006 |
Small-to-moderate explosions produced gas, steam, and small amounts of ash. On the 13th, plumes rose to ~2 km. High seismicity. |
| 19 Apr-23 Apr 2006 |
Small-to-moderate explosions produced gas, steam, and small amounts of ash. On the 19th, plumes rose to ~3 km. High seismicity. |
| 28 Apr-01 May 2006 |
Small-to-moderate explosions; gas, steam, and small amounts of ash. On the 28th, a plume rose to a maximum height of ~2 km. High seismicity. |
| 04 May-08 May 2006 |
Small-to-moderate explosions; gas, steam, and small amounts of ash. High seismicity, dominated by explosions and long-period earthquakes. |
During this 15 February to 8 May time interval ash affected localities as follows. During 29 March to 2 April, ash fell in the Bilbao, Choglontus, Puela, and Manzano sectors, and incandescent blocks rolled down the volcano's NW flank. Around 9 March, ash fell in the Baños, Guadalupe, Chogluntus, Bilbao, and Manzano sectors. Around 1500 on 9 March, several lahars traveled down W-flank gorges, disrupting traffic along the Baños-Penipe highway. An explosion on 26 March was accompanied by incandescent blocks that rolled down the NW flank. During 11-17 April, a small amount of ash fell in the Pondoa sector N of the volcano.
Increased activity starting 10 May 2006. Seismicity for mid-April 2006 to mid-August 2006 appears in figure 28. The figure shows the time sequence of hypocenters with various signal types given separate symbols. Between April and May there was a shallowing of event locations (indicated by the arrow on the left) from -4 km to +2 km. At that point, explosion signals suddenly began to dominate. Those explosion signals came from depths in the range from 0 to over +4 km depth. The 14 May seismic crisis seemingly ended without a large eruption. Explosion signals continued; however, they ceased dominating until around the time of the 14 July eruption when they again became the chief signal (circled area) just prior to the eruption breaking out at the surface.
IG put out special report ##4 with a cautionary tone. In the 48 hours starting around 10 May, there was a very important increase in activity. IG judged the anomalous, high-activity conditions as severe as previous ones during this crisis (specifically, equivalent to those of October-December 1999, August 2001, September 2002, and October 2003). The summary that follows largely omits the discussion of plausible scenarios aimed at public safety; however, the IG noted that if rapid escalation were to occur during the current unstable situation, they might not have time to issue alerts. They also noted that the eruption might calm.
During the roughly two-day interval, seismometers registered over 130 explosion signals, averaging about three explosions per hour, but with a maximum of 12 per hour. The general tendency was towards yet more increases in the number of explosion signals. The activity was accompanied by continuous signals described as harmonic tremor and emission-related tremor, and after 10 May these tremor signals were also more intense and frequent. In spite of the increase in explosion and tremor signals, emissions of magmatic gases (SO2) and ash stayed at relatively low levels.
First-hand observations during 10-12 May described extraordinarily loud explosions heard from 30-40 km away in Pillaro and from~ 31 km NW in Ambato, but absent 30 km SW in Riobamba. In settlements near the volcano, including Cusúa on the volcano's W foot, glass windows shattered. In some areas, roars were sufficiently intense that vibrations in windows and houses kept inhabitants awake at night. The intensities of eruptions from 10 May were reminiscent of the eruption's onset in 1999.
From the observatory in the Guadelupe sector (13 km NW of the cone) night observers saw the ejection and rolling descent of large glowing blocks of lava, and the crater gave off a permanent glow. However, ash emissions were considerably reduced; the chief component venting was steam with few other gases. The resulting outbursts were not continuous and they were too weak to form mushroom clouds. This was in contrast to other periods of high activity (e.g. August 2001, September 2002, and October 2003), when sustained ash-bearing eruption columns and ash falls were common.
IG special report ##4 noted that the tremor signals during a 48-hour interval after 10 May were the strongest recorded since the eruptions renewed in 1999. The number of explosions and their seismic energy were the highest recorded since the end of 2003, but was less than registered during November 1999 and mid-2000.
On 30 May IG issued its next special report (##5), which noted elevated eruptive activity during 8-14 May, but a clear decrease thereafter. During 10-21 May, the following instruments detected the stated numbers of explosions: seismometers, 801; and infrasonic recorders, 682. The peak in these explosions occurred on 14 May, a day when the instrument counts were as follows: seismometers, 221; infrasonic, 204. As in the previous report, inhabitants close to the volcano heard loud roars, and in some cases were sleepless due to vibrations heard or felt in their homes at night. These conditions convinced residents in Cusúa to move during the night. But starting the 16th, the number and intensity of explosions per day decreased drastically, with only 17 explosions recorded on the 16th, dropping in later days to 2 or 3 daily explosions. According to a local mayor, given the lack of noises and relative calm, evacuees from Cusúa returned home.
The lull in explosions coincided with ongoing fluctuations in seismicity. The IG interpreted this as a sign of continued instability linked to the motion of fluids at depth. The lull in explosion signals accompanied increased gas emissions, which gradually came to contain more and more ash. Small, local ash fall again began to occur. Starting 17 May it became common to see ash columns extending to 4 km above the summit, frequently blown NW.
Reports for the week following 17 May by the Washington VAAC also discussed the increasing ash plumes. On 18 May, an ash plume reached an altitude of 5.2 km above the crater and extended NW. The Washington VAAC also noted that on 19 May, the Instituto Geofísico observed an ash plume that reached an altitude of 12 km. On satellite imagery, ash plumes were visible on 20 and 23 May and extended SW. Hotspots were visible on satellite imagery 19, 20 and 23 May. The ash plume and incandescence on 23 May were also observed on the scene by Instituto Geofísico staff. On 25 May a significant meteorological advisory (SIGMET) indicated an ash plume to an altitude of 5 km. On 27 and 30 May, the VAAC reported that the Instituto Geofísico observed ash plumes at altitudes of 7.9 km and 5 km respectively. IG noted that behavior during the last few weeks of May seemed consistent with a gradual decrease from the state of elevated activity seen in mid-May.
Although satellite thermal data produced alerts during 8-14 May, these ceased later in the month. The reduced thermal flux was taken to suggest reduced manifestations in the crater during mid to late May. Coincident with that, deformation data suggested relative stability, particularly compared to the significant variations seen earlier in May.
During 28 June-4 July, small-to-moderate explosions at Tungurahua produced plumes composed of gas, steam, and small amounts of ash that reached 1.5 km above the summit. Light ashfall was reported in nearby localities during 29 June-2 July. On 29 June, reports of ground movement coincided with an explosive eruption that sent blocks of incandescent material as far as 1 km down the W flank.
During 5-11 July, seismic activity indicating explosions increased at Tungurahua. Incandescent blocks were ejected from the crater during 5 to 8 July, when blocks rolled approximately 1 km down the NW flank. Ash-and-steam plumes with moderate to no ash content were observed to reach maximum heights of 2.5 km above the summit and drifted to the W and NW.
Eruptive style changes after powerful discharges of mid-July 2006. On 14 and 15 July, IG issued its next special reports (##6, 7, and 8) documenting events surrounding the strongest eruption yet seen during the entire 1999-2006 eruptive process. The basis for the size assesment was made from the seismic record based on reduced displacement, sometimes called normalized or root-mean-square amplitude (a means to correct seismic data to a common reference point; McNutt, 2000) The largest discharge occurred at 0559 on 15 July.
On 14 July, seismicity was elevated above that seen in the previous several days. IG noted that at 1710 several large explosions were recorded on instruments, as well as heard by people. An eruption column formed, bearing moderate ash. It initially rose several kilometers but later was estimated to have attained ~ 15 km altitude. This was followed by 20 minutes of quiet. At 1733 a huge explosion presumably opened the conduit. Immediately local authorities were contacted and they evacuated people living on the lower NW-W flanks of the cone. Pyroclastic flows and explosion signals are notable in the seismic record (figure 29).
At 0050 on 14 July a pyroclastic flow poured down the NW flank (the Juive Grande drainage). An associated fine ashfall was noted 8 km SW in the town of Puela. Intense Strombolian activity ensued, including glowing blocks tossed 500 m above the crater that bounced downslope for considerable distances. Associated noises were particularly loud and heard widely, including in Ambato (30 km NW). Lookouts described these sounds as distinctive ("bramidos doble golpe;" roughly translated as 'double roars'), a new sound in the suite of those heard since 1999. In the Cusúa area, and up to 13 km NW in the sector of the Observatory of Guadelupe, residents felt intense ground movements.
At 1930 that day pumice fell on the W flank (the sector of Pillate) reaching a thickness of ~ 1 cm. About 10 minutes after the pumice fall, the IG issued the second special report (##7) on the 14 July events. It cautioned residents to remain away from the volcano's W side. The next special report (##8) noted that variations in activity prevailed through the end of 14 July, and that much of the first hour of 15 July brought decreased activity. Tremor continued on 15 July, often in episodes with durations of 4 to 5 minutes, separated by intervening calm intervals of similar duration.
After 0500 on 15 July the eruptive process changed, with the new regime characterized by sequences of abundant large explosions followed by intervals of calm lasting 30-40 minutes. A critical detonation occurred at 0559 on 15 July. On the basis of reduced displacement, it ranked as the largest since the eruption began in 1999. Other detonations with similar character followed the initial one. During 0500-0555 there were 20 large detonations. In assessing the 14-15 July eruptions, satellite analysis by both the Washington Volcanic Ash Advisory Center and the U.S. Air Force Weather Agency confirmed the highest ash-plume tops to altitudes of 15-16 km.
At sunup on 15 July observers found signs that a pyroclastic flow had descended a W-flank drainage (Achupashal valley, between Cusúa and Bilbao). The deposits filled the valley (to 5- to 10-m thickness). Small fires had ignited in the vegetation. A rockfall was also seen in the Bilbao area. Ash falls were reported, containing both ash and scoria fragments, affecting the cities of Penipe, Quero, Cevallo, Mocha, Riobamba, and Guaranda.
Additional fieldwork revealed that pyroclastic flows had traveled down at least six quebradas around the volcano, including Achupasal, Cusúa, Mandur, Hacienda, Juive Grande, and Vascún valleys (the latter, upslope from the western part of the touristic city of Baños).
Figures 30-33 depict the distribution of fresh deposits as well as some photos taken during the 14-15 July eruptions. Tilt and SO2 monitored at Tungurahua appear on figures 34 and 35. Satellite photos from 25 June and 18 July appeared on the NASA Earth Observatory website.
Reference. McNutt, S., 2000, Seismic monitoring, in Encyclopedia of Volcanoes: Academic Press (editor-in-chief, Haraldur Sigurdsson), p. 1095-1119, ISBN 0-12-643140-X.
Geologic Background. Tungurahua, a steep-sided andesitic-dacitic stratovolcano that towers more than 3 km above its northern base, is one of Ecuador's most active volcanoes. Three major edifices have been sequentially constructed since the mid-Pleistocene over a basement of metamorphic rocks. Tungurahua II was built within the past 14,000 years following the collapse of the initial edifice. Tungurahua II collapsed about 3,000 years ago and produced a large debris-avalanche deposit to the west. The modern glacier-capped stratovolcano (Tungurahua III) was constructed within the landslide scarp. Historical eruptions have all originated from the summit crater, accompanied by strong explosions and sometimes by pyroclastic flows and lava flows that reached populated areas at the volcano's base. Prior to a long-term eruption beginning in 1999 that caused the temporary evacuation of the city of Baños at the foot of the volcano, the last major eruption had occurred from 1916 to 1918, although minor activity continued until 1925.
Information Contacts: Geophysical Institute (IG), Escuela Politécnica Nacional, Apartado 17-01-2759, Quito, Ecuador (URL: http://www.igepn.edu.ec/).