Recently Published Bulletin Reports
Agung (Indonesia) Three eruptive events reported in April, May, and December 2022
Tengger Caldera (Indonesia) Minor ash emission in December 2023; persistent weak thermal anomaly in the Bromo crater
Saunders (United Kingdom) Persistent thermal anomalies from the summit crater lava lake during February 2023-January 2024
Shishaldin (United States) New eruption with significant Strombolian explosions, ash plumes, and ashfall
Ioto (Japan) New eruption with discolored water, ejecta, and floating pumice during October-December 2023
Purace (Colombia) Gas-and-ash emission on 16 November 2023
Etna (Italy) Strombolian explosions, lava fountains, and lava flows during July-August 2023
Suwanosejima (Japan) Eruption plumes, crater incandescence, and occasional explosions during July-October 2023
Aira (Japan) Explosions, ash plumes, ash fall, and crater incandescence during July-October 2023
Nishinoshima (Japan) Gray emissions during October 2023
Kilauea (United States) Strong lava fountains, lava flows, and spatter at Halema’uma’u during January-September 2023
Tinakula (Solomon Islands) Continued lava flows and thermal activity during June through November 2023
Agung (Indonesia) — January 2024  Cite this Report
Agung
Indonesia
8.343°S, 115.508°E; summit elev. 2997 m
All times are local (unless otherwise noted)
Three eruptive events reported in April, May, and December 2022
Mount Agung, located on the E end of the island of Bali, Indonesia, rises above the SE rim of the Batur caldera. The summit area extends 1.5 km E-W, with the highest point on the W and a steep-walled 800-m-wide crater on the E. Recorded eruptions date back to the early 19th century. A large and deadly explosive and effusive eruption occurred during 1963-64, which was characterized by voluminous ashfall, pyroclastic flows, and lahars that caused extensive damage and many fatalities. More recent activity was documented during November 2017-June 2019 that consisted of multiple explosions, significant ash plumes, lava flows at the summit crater, and incandescent ejecta. This report covers activity reported during April-May 2022 and December 2022 based on data from the Darwin Volcanic Ash Advisory Center (VAAC).
Activity during 2022 was relatively low and mainly consisted of a few ash plumes during April-May and December. An ash plume on 3 April rising to 3.7 km altitude (700 m above the summit) and drifting N was reported in a Darwin VAAC notice based on a ground report, with ash seen in HIMAWARI-8 visible imagery. Another ash plume was reported at 1120 on 27 May that rose to 5.5 km altitude (2.5 m above the summit); the plume was not visible in satellite or webcam images due to weather clouds. An eruption was reported based on seismic data at 0840 on 13 December, with an estimated plume altitude of 3.7 km; however, no ash was seen using satellite imagery in clear conditions before weather clouds obscured the summit.
Geologic Background. Symmetrical Agung stratovolcano, Bali's highest and most sacred mountain, towers over the eastern end of the island. The volcano, whose name means "Paramount," rises above the SE rim of the Batur caldera, and the northern and southern flanks extend to the coast. The summit area extends 1.5 km E-W, with the high point on the W and a steep-walled 800-m-wide crater on the E. The Pawon cone is located low on the SE flank. Only a few eruptions dating back to the early 19th century have been recorded in historical time. The 1963-64 eruption, one of the largest in the 20th century, produced voluminous ashfall along with devastating pyroclastic flows and lahars that caused extensive damage and many fatalities.
Information Contacts: Darwin Volcanic Ash Advisory Centre (VAAC), Bureau of Meteorology, Northern Territory Regional Office, PO Box 40050, Casuarina, NT 0811, Australia (URL: http://www.bom.gov.au/info/vaac/).
Tengger Caldera (Indonesia) — February 2024 Cite this Report
Tengger Caldera
Indonesia
7.942°S, 112.95°E; summit elev. 2329 m
All times are local (unless otherwise noted)
Minor ash emission in December 2023; persistent weak thermal anomaly in the Bromo crater
Tengger Caldera, located at the N end of a volcanic massif in Indonesia’s East Java, consists of five overlapping stratovolcanoes. The youngest and only active cone in the 16-km-wide caldera is Bromo, which typically produces gas-and-steam plumes, occasional ash plumes and explosions, and weak thermal signals (BGVN 44:05, 47:01). This report covers activity during January 2022-December 2023, consisting of mostly white gas-and-steam emissions and persistent weak thermal anomalies. Information was provided by the Pusat Vulkanologi dan Mitigasi Bencana Geologi (PVMBG, also known as Indonesian Center for Volcanology and Geological Hazard Mitigation, CVGHM) and satellite imagery. The Alert Level remained at 2 (on a scale of 1-4), and visitors were warned to stay at least 1 km from the crater.
Activity was generally low during the reporting period, similar to that in 2021. According to almost daily images from MAGMA Indonesia (a platform developed by PVMBG), white emissions and plumes rose from 50 to 900 m above the main crater during this period (figure 24). During several days in March and June 2022, white plumes reached heights of 1-1.2 km above the crater.
After an increase in activity at 2114 on 3 February 2023, a PVMBG team that was sent to observe white emissions rising as high as 300 m during 9-12 February and heard rumbling noises. A sulfur dioxide odor was also strong near the crater and measurements indicated that levels were above the healthy (non-hazardous) threshold of 5 parts per million; differential optical absorption spectroscopy (DOAS) measurements indicated an average flux of 190 metric tons per day on 11 February. Incandescence originating from a large fumarole in the NNW part of the crater was visible at night. The team observed that vegetation on the E caldera wall was yellow and withered. The seismic network recorded continuous tremor and deep and shallow volcanic earthquakes.
According to a PVMBG press release, activity increased on 13 December 2023 with white, gray, and brown emissions rising as high as 900 m above Bromo’s crater rim and drifting in multiple directions (figure 25). The report noted that tremor was continuous and was accompanied in December by three volcanic earthquakes. Deformation data indicated inflation in December. There was no observable difference in the persistent thermal anomaly in the crater between 11 and 16 December 2023.
All clear views of the Bromo crater throughout this time, using Sentinel-2 infrared satellite images, showed a weak persistent thermal anomaly; none of the anomalies were strong enough to cause MODVOLC Thermal Alerts. A fire in the SE part of the caldera in early September 2023 resulted in a brief period of strong thermal anomalies.
Geologic Background. The 16-km-wide Tengger caldera is located at the northern end of a volcanic massif extending from Semeru volcano. The massive volcanic complex dates back to about 820,000 years ago and consists of five overlapping stratovolcanoes, each truncated by a caldera. Lava domes, pyroclastic cones, and a maar occupy the flanks of the massif. The Ngadisari caldera at the NE end of the complex formed about 150,000 years ago and is now drained through the Sapikerep valley. The most recent of the calderas is the 9 x 10 km wide Sandsea caldera at the SW end of the complex, which formed incrementally during the late Pleistocene and early Holocene. An overlapping cluster of post-caldera cones was constructed on the floor of the Sandsea caldera within the past several thousand years. The youngest of these is Bromo, one of Java's most active and most frequently visited volcanoes.
Information Contacts: Pusat Vulkanologi dan Mitigasi Bencana Geologi (PVMBG, also known as Indonesian Center for Volcanology and Geological Hazard Mitigation, CVGHM), Jalan Diponegoro 57, Bandung 40122, Indonesia (URL: http://www.vsi.esdm.go.id/); MAGMA Indonesia, Kementerian Energi dan Sumber Daya Mineral (URL: https://magma.esdm.go.id/v1); Copernicus Browser, Copernicus Data Space Ecosystem, European Space Agency (URL: https://dataspace.copernicus.eu/browser/); Hawai'i Institute of Geophysics and Planetology (HIGP) - MODVOLC Thermal Alerts System, School of Ocean and Earth Science and Technology (SOEST), Univ. of Hawai'i, 2525 Correa Road, Honolulu, HI 96822, USA (URL: http://modis.higp.hawaii.edu/).
Saunders (United Kingdom) — February 2024 Cite this Report
Saunders
United Kingdom
57.8°S, 26.483°W; summit elev. 843 m
All times are local (unless otherwise noted)
Persistent thermal anomalies from the summit crater lava lake during February 2023-January 2024
Saunders is one of eleven islands that comprise the South Sandwich Islands in the South Atlantic. The active Mount Michael volcano has been in almost continuous eruption since November 2014 (BGVN 48:02). Recent activity has resulted in intermittent thermal anomalies and gas-and-steam emissions (BGVN 47:03, 48:02). Visits are infrequent due to its remote location, and cloud cover often prevents satellite observations. Satellite thermal imagery and visual observation of incandescence during a research expedition in 2019 (BGVN 28:02 and 44:08) and a finding confirmed by a National Geographic Society research team that summited Michael in November 2022 reported the presence of a lava lake.
Although nearly constant cloud cover during February 2023 through January 2024 greatly limited satellite observations, thermal anomalies from the lava lake in the summit crater were detected on clear days, especially around 20-23 August 2023. Anomalies similar to previous years (eg. BGVN 48:02) were seen in both MIROVA (Middle InfraRed Observation of Volcanic Activity) data from MODIS instruments and in Sentinel 2 infrared imagery. The only notable sulfur dioxide plume detected near Saunders was on 25 September 2023, with the TROPOMI instrument aboard the Sentinel-5P satellite.
Geologic Background. Saunders Island consists of a large central volcanic edifice intersected by two seamount chains, as shown by bathymetric mapping (Leat et al., 2013). The young Mount Michael stratovolcano dominates the glacier-covered island, while two submarine plateaus, Harpers Bank and Saunders Bank, extend north. The symmetrical Michael has a 500-m-wide summit crater and a remnant of a somma rim to the SE. Tephra layers visible in ice cliffs surrounding the island are evidence of recent eruptions. Ash clouds were reported from the summit crater in 1819, and an effusive eruption was inferred to have occurred from a N-flank fissure around the end of the 19th century and beginning of the 20th century. A low ice-free lava platform, Blackstone Plain, is located on the north coast, surrounding a group of former sea stacks. A cluster of cones on the SE flank, the Ashen Hills, appear to have been modified since 1820 (LeMasurier and Thomson, 1990). Analysis of satellite imagery available since 1989 (Gray et al., 2019; MODVOLC) suggests frequent eruptive activity (when weather conditions allow), volcanic clouds, steam plumes, and thermal anomalies indicative of a persistent, or at least frequently active, lava lake in the summit crater. Due to this observational bias, there has been a presumption when defining eruptive periods that activity has been ongoing unless there is no evidence for at least 10 months.
Information Contacts: MIROVA (Middle InfraRed Observation of Volcanic Activity), a collaborative project between the Universities of Turin and Florence (Italy) supported by the Centre for Volcanic Risk of the Italian Civil Protection Department (URL: http://www.mirovaweb.it/); NASA Global Sulfur Dioxide Monitoring Page, Atmospheric Chemistry and Dynamics Laboratory, NASA Goddard Space Flight Center (NASA/GSFC), 8800 Greenbelt Road, Goddard MD 20771, USA (URL: https://so2.gsfc.nasa.gov/); Copernicus Browser (URL: https://dataspace.copernicus.eu/browser).
Shishaldin (United States) — December 2023 Cite this Report
Shishaldin
United States
54.756°N, 163.97°W; summit elev. 2857 m
All times are local (unless otherwise noted)
New eruption with significant Strombolian explosions, ash plumes, and ashfall
Shishaldin is located on the eastern half of Unimak Island, one of the Aleutian Islands. Frequent explosive activity, primarily consisting of Strombolian ash eruptions from the small summit crater, but sometimes producing lava flows, has been recorded since the 18th century. The previous eruption ended in May 2020 and was characterized by intermittent thermal activity, increased seismicity and surface temperatures, ash plumes, and ash deposits (BGVN 45:06). This report covers a new eruption during July through November 2023, which consisted of significant explosions, ash plumes, ashfall, and lava fountaining. Information comes from daily, weekly, and special reports from the Alaska Volcano Observatory (AVO) and various satellite data. AVO monitors the volcano using local seismic and infrasound sensors, satellite data, web cameras, and remote infrasound and lightning networks.
AVO reported that intermittent tremor and low-frequency earthquakes had gradually become more regular and consistent during 10-13 July. Strongly elevated surface temperatures at the summit were identified in satellite images during 10-13 July. On 11 July AVO raised the Aviation Color Code (ACC) to Yellow (the second color on a four-color scale) and Volcano Alert Level (VAL) to Advisory (the second level on a four-level scale) at 1439. Later in the day on 11 July summit crater incandescence was observed in webcam images. Observations of the summit suggested that lava was likely present at the crater, which prompted AVO to raise the ACC to Orange (the second highest color on a four-color scale) and the VAL to Watch (the second highest level on a four-level scale). The US Coast Guard conducted an overflight on 12 July and confirmed that lava was erupting from the summit. That same day, sulfur dioxide emissions were detected in satellite images.
A significant explosion began at 0109 on 14 July that produced an ash plume that rose to 9-12 km altitude and drifted S over the Pacific Ocean (figure 43). Webcam images and photos taken around 0700 from a ship SW off Unimak Island showed small lahar deposits, which were the result of the interaction of hot pyroclastic material and snow and ice on the flanks. There was also ashfall on the SW and N flanks. A smaller explosion at 0710 generated an ash plume that rose to 4.5 km altitude. Webcam images and pilot reports showed continued low-level ash emissions during the morning, rising to less than 4.6 km altitude; those emissions included a small ash plume near the summit around 1030 resulting from a small explosion.
Seismic tremor amplitude began increasing at around 1700 on 15 July; strongly elevated surface temperatures were also reported. An ash plume rose to 4.6 km altitude and drifted SSE at 2100, based on a satellite image. A continuous ash plume during 2150 through 2330 rose to 5 km altitude and extended 125 km S. At 2357 AVO raised the ACC to Red (the highest color on a four-color scale) and the VAL to Warning (the highest level on a four-level scale), noting that seismicity remained elevated for more than six hours and explosion signals were frequently detected by regional infrasound (pressure sensor) networks. Explosions generated an ash plume that rose to 4.9 km altitude and drifted as far as 500 km SE. Activity throughout the night declined and by 0735 the ACC was lowered to Orange and the VAL to Watch. High-resolution satellite images taken on 16 July showed pyroclastic deposits extending as far as 3 km from the vent; these deposits generated lahars that extended further down the drainages on the flanks. Ash deposits were mainly observed on the SSE flank and extended to the shore of Unimak Island. During 16-17 July lava continued to erupt at the summit, which caused strongly elevated surface temperatures that were visible in satellite imagery.
Lava effusion increased at 0100 on 18 July, as noted in elevated surface temperatures identified in satellite data, increasing seismic tremor, and activity detected on regional infrasound arrays. A significant ash plume at 0700 rose to 7 km altitude and continued until 0830, eventually reaching 9.1 km altitude and drifting SSE (figure 44). As a result, the ACC was raised to Red and the VAL to Warning. By 0930 the main plume detached, but residual low-level ash emissions continued for several hours, remaining below 3 km altitude and drifting S. The eruption gradually declined and by 1208 the ACC was lowered to Orange and the VAL was lowered to Watch. High-resolution satellite images showed ash deposits on the SW flank and pyroclastic deposits on the N, E, and S flanks, extending as far as 3 km from the vent; lahars triggered by the eruption extended farther down the flanks (figure 45). Lava continued to erupt from the summit crater on 19 July.
Elevated surface temperatures were detected in satellite images during 19-25 July, despite occasional weather cloud cover, which was consistent with increased lava effusion. During 22-23 July satellite observations acquired after the eruption from 18 July showed pyroclastic flow and lahar deposits extending as far as 3 km down the N, NW, and NE flanks and as far as 1.5 km down the S and SE flanks. Ash deposits covered the SW and NE flanks. No lava flows were observed outside the crater. On 22 July a sulfur dioxide plume was detected in satellite data midday that had an estimated mass of 10 kt. In a special notice issued at 1653 on 22 July AVO noted that eruptive activity had intensified over the previous six hours, which was characterized by an hours-long steady increase in seismic tremor, intermittent infrasound signals consistent with small explosions, and an increase in surface temperatures that were visible in satellite data. Pilots first reported low-level ash plumes at around 1900. At 2320 an ash plume had risen to 9 km altitude based on additional pilot reports and satellite images. The ACC was increased to Red and the VAL to Warning at 2343. Satellite images indicated growth of a significantly higher ash plume that rose to 11 km altitude continued until 0030 and drifted NE. During the early morning hours of 23 July ash plumes had declined to 4.6 k altitude. Seismic tremor peaked at 0030 on 23 July and began to rapidly decline at 0109; active ash emissions were no longer visible in satellite data by 0130. The ACC was lowered to Orange and the VAL to Watch at 0418; bursts of increased seismicity were recorded throughout the morning, but seismicity generally remained at low levels. Elevated surface temperatures were visible in satellite data until about 0600. On 24 July pilots reported seeing vigorous gas-and-steam plumes rising to about 3 km altitude; the plumes may have contained minor amounts of ash.
During 24-25 July low level seismicity and volcanic tremor were detected at low levels following the previous explosion on 23 July. Strongly elevated surface temperatures were observed at the summit crater in satellite data. Around 2200 on 25 July seismicity began to increase, followed by infrasound signals of explosions after 0200 on 26 July. An ash plume rose to 3 km altitude at 0500 and drifted ENE, along with an associated sulfur dioxide plume that drifted NE and had an estimated mass of 22 kt. Diffuse ash emissions were visible in satellite data and rose to 6.1-7.6 km altitude and extended 125 km from the volcano starting around 1130. These ash events were preceded by about seven hours of seismic tremor, infrasound detections of explosions, and five hours of increased surface temperatures visible in satellite data. Activity began to decline around 1327, which included low-frequency earthquakes and decreased volcanic tremor, and infrasound data no longer detected significant explosions. Surface temperatures remained elevated through the end of the month.
Seismicity, volcanic tremor, and ash emissions remained at low levels during early August. Satellite images on 1 August showed that some slumping had occurred on the E crater wall due to the recent explosive activity. Elevated surface temperatures continued, which was consistent with cooling lava. On 2 August small explosive events were detected, consistent with low-level Strombolian activity. Some episodes of volcanic tremor were reported, which reflected low-level ash emissions. Those ash emissions rose to less than 3 km altitude and drifted as far as 92.6 km N. Pilots that were located N of the volcano observed an ash plume that rose to 2.7 km altitude. Seismicity began to increase in intensity around 0900 on 3 August. Seismicity continued to increase throughout the day and through the night with strongly elevated surface temperatures, which suggested that lava was active at the surface.
An ash cloud that rose to 7.6-7.9 km altitude and drifted 60-75 km NE was visible in a satellite image at 0520 on 4 August. Pilots saw and reported the plume at 0836 (figure 46). By 0900 the plume had risen to 9.1 km altitude and extended over 100 km NE. AVO raised the ACC to Red and the VAL to Warning as a result. Seismic tremor levels peaked at 1400 and then sharply declined at 1500 to slightly elevated levels; the plume was sustained during the period of high tremor and drifted N and NE. The ACC was lowered to Orange and the VAL to Watch at 2055. During 5-14 August seismicity remained low and surface temperatures were elevated based on satellite data due to cooling lava. On 9 August a small lava flow was observed that extended from the crater rim to the upper NE flank. It had advanced to 55 m in length and appeared in satellite imagery on 11 August. Occasional gas-and-steam plumes were noted in webcam images. At 1827 AVO noted that seismic tremor had steadily increased during the afternoon and erupting lava was visible at the summit in satellite images.
Strong explosion signals were detected at 0200 on 15 August. An ash cloud that was visible in satellite data extended 100 km NE and may have risen as high as 11 km altitude around 0240. By 0335 satellite images showed the ash cloud rising to 7.6 km altitude and drifting NE. Significant seismicity and explosions were detected by the local AVO seismic and infrasound networks, and volcanic lightning was detected by the World Wide Lightning Location Network (WWLLN). A sulfur dioxide plume associated with the eruption drifted over the S Bering Sea and parts of Alaska and western Canada. Seismicity was significantly elevated during the eruption but had declined by 1322. A pilot reported that ash emissions continued, rising as high as 4.9 km altitude. Elevated surface temperatures detected in satellite data were caused by hot, eruptive material (pyroclastic debris and lava) that accumulated around the summit. Eruptive activity declined by 16 August and the associated sulfur dioxide plume had mostly dissipated; remnants continued to be identified in satellite images at least through 18 August. Surface temperatures remained elevated based on satellite images, indicating hot material on the upper parts of the volcano. Small explosions were detected in infrasound data on the morning of 19 August and were consistent with pilot reports of small, short-lived ash plumes that rose to about 4.3 km altitude. Low-level explosive activity was reported during 20-24 August, according to seismic and infrasound data, and weather clouds sometimes prevented views. Elevated surface temperatures were observed in satellite images, which indicated continued hot material on the upper parts of the volcano.
Seismic tremor began to increase at around 0300 on 25 August and was followed by elevated surface temperatures identified in satellite images, consistent with erupting lava. Small explosions were recorded in infrasound data. The ACC was raised to Red and the VAL to Warning at 1204 after a pilot reported an ash plume that rose to 9.1 km altitude. Seismicity peaked at 1630 and began to rapidly decline at around 1730. Ash plumes rose as high as 10 km altitude and drifted as far as 400 km NE. By 2020 the ash plumes had declined to 6.4 km altitude and continued to drift NE. Ash emissions were visible in satellite data until 0000 on 26 August and seismicity was at low levels. AVO lowered the ACC to Orange and the VAL to Watch at 0030. Minor explosive activity within the summit crater was detected during 26-28 August and strongly elevated surface temperatures were still visible in satellite imagery through the rest of the month. An AVO field crew working on Unimak Island observed a mass flow that descended the upper flanks beginning around 1720 on 27 August. The flow produced a short-lived ash cloud that rose to 4.5 km altitude and rapidly dissipated. The mass flow was likely caused by the collapse of spatter that accumulated on the summit crater rim.
Similar variable explosive activity was reported in September, although weather observations sometimes prevented observations. A moderate resolution satellite image from the afternoon of 1 September showed gas-and-steam emissions filling the summit crater and obscuring views of the vent. In addition, hot deposits from the previous 25-26 August explosive event were visible on the NE flank near the summit, based on a 1 September satellite image. On 2 and 4 September seismic and infrasound data showed signals of small, repetitive explosions. Variable gas-and-steam emissions from the summit were visible but there was no evidence of ash. Possible summit crater incandescence was visible in nighttime webcam images during 3-4 September.
Seismicity began to gradually increase at around 0300 on 5 September and activity escalated at around 0830. A pilot reported an ash plume that rose to 7.6 km altitude at 0842 and continued to rise as high as possibly 9.7 km altitude and drifted SSE based on satellite images (figure 47). The ACC was raised to Red and the VAL to Warning at 0900. In addition to strong tremor and sustained explosions, the eruption produced volcanic lightning that was detected by the WWLLN. Around 1100 seismicity decreased and satellite data confirmed that the altitude of the ash emissions had declined to 7.6 km altitude. By 1200 the lower-altitude portion of the ash plume had drifted 125 km E. Significant ash emissions ended by 1330 based on webcam images. The ACC was lowered to Orange and the VAL to Watch at 1440. Satellite images showed extensive pyroclastic debris flows on most of the flanks that extended 1.2-3.3 km from the crater rim.
During 6-13 September elevated surface temperatures continued to be observed in satellite data, seismicity remained elevated with weak but steady tremor, and small, low-frequency earthquakes and small explosions were reported, except on 12 September. On 6 September a low-level ash plume rose to 1.5-1.8 km altitude and drifted SSE. Occasional small and diffuse gas-and-steam emissions at the summit were visible in webcam images. Around 1800 on 13 September seismic tremor amplitudes began to increase, and small explosions were detected in seismic and infrasound data. Incandescent lava at the summit was seen in a webcam image taken at 0134 on 14 September during a period of elevated tremor. No ash emissions were reported during the period of elevated seismicity. Lava fountaining began around 0200, based on webcam images. Satellite-based radar observations showed that the lava fountaining activity led to the growth of a cone in the summit crater, which refilled most of the crater. By 0730 seismicity significantly declined and remained at low levels.
Seismic tremor began to increase around 0900 on 15 September and rapidly intensified. An explosive eruption began at around 1710, which prompted AVO to raise the ACC to Red and the VAL to Warning. Within about 30 minutes ash plumes drifted E below a weather cloud at 8.2 km altitude. The National Weather Service estimated that an ash-rich plume rose as high as 12.8 km altitude and produced volcanic lightning. The upper part of the ash plume detached from the vent around 1830 and drifted E, and was observed over the Gulf of Alaska. Around the same time, seismicity dramatically decreased. Trace ashfall was reported in the community of False Pass (38 km ENE) between 1800-2030 and also in King Cove and nearby marine waters. Activity declined at around 1830 although seismicity remained elevated, ash emissions, and ashfall continued until 2100. Lightning was again detected beginning around 1930, which suggested that ash emissions continued. Ongoing explosions were detected in infrasound data, at a lower level than during the most energetic phase of this event. Lightning was last detected at 2048. By 2124 the intensity of the eruption had decreased, and ash emissions were likely rising to less than 6.7 km altitude. Seismicity returned to pre-eruption levels. On 16 September the ACC was lowered to Orange and the VAL to Watch at 1244; the sulfur dioxide plume that was emitted from the previous eruption event was still visible over the northern Pacific Ocean. Elevated surface temperatures, gas-and-steam emissions from the vent, and new, small lahars were reported on the upper flanks based on satellite and webcam images. Minor deposits were reported on the flanks which were likely the result of collapse of previously accumulated lava near the summit crater.
Elevated seismicity with tremor, small earthquakes, and elevated surface temperatures were detected during 17-23 September. Minor gas-and-steam emissions were visible in webcam images. On 20 September small volcanic debris flows were reported on the upper flanks. On 21 September a small ash deposit was observed on the upper flanks extending to the NE based on webcam images. Seismic tremor increased significantly during 22-23 September. Regional infrasound sensors suggested that low-level eruptive activity was occurring within the summit crater by around 1800 on 23 September. Even though seismicity was at high levels, strongly elevated surface temperatures indicating lava at the surface were absent and no ash emissions were detected; weather clouds at 0.6-4.6 km altitude obscured views. At 0025 on 24 September AVO noted that seismicity continued at high levels and nearly continuous small infrasound signals began, likely from low-level eruptive activity. Strongly elevated surface temperatures were identified in satellite images by 0900 and persisted throughout the day; the higher temperatures along with infrasound and seismic data were consistent with lava erupting at the summit. Around 1700 similarly elevated surface temperatures were detected from the summit in satellite data, which suggested that more vigorous lava fountaining had started. Starting around 1800 low-level ash emissions rose to altitudes less than 4.6 km altitude and quickly dissipated.
Beginning at midnight on 25 September, a series of seismic signals consistent with volcanic flows were recorded on the N side of the volcano. A change in seismicity and infrasound signals occurred around 0535 and at 0540 a significant ash cloud formed and quickly reached 14 km altitude and drifted E along the Alaska Peninsula. The cloud generated at least 150 lightning strokes with thunder that could be heard by people in False Pass. Seismicity rapidly declined to near background levels around 0600. AVO increased the ACC to Red and the VAL to Warning at 0602. The ash cloud detached from the volcano at around 0700, rose to 11.6 km altitude, and drifted ESE. Trace to minor amounts of ashfall were reported by the communities of False Pass, King Cove, Cold Bay, and Sand Point around 0700. Ash emissions continued at lower altitudes of 6-7.6 km altitude at 0820. Small explosions at the vent area continued to be detected in infrasound data and likely represented low-level eruptive activity near the vent. Due to the significant decrease in seismicity and ash emissions the ACC was lowered to Orange and the VAL to Watch at 1234. Radar data showed significant collapses of the crater that occurred on 25 September. Satellite data also showed significant hot, degassing pyroclastic and lahar deposits on all flanks, including more extensive flows on the ENE and WSW sections below two new collapse scarps. Following the significant activity during 24-25 September, only low-level activity was observed. Seismicity decreased notably near the end of the strong activity on 25 September and continued to decrease through the end of the month, though tremor and small earthquakes were still reported. No explosive activity was detected in infrasound data through 2 October. Gas-and-steam emissions rose to 3.7 km altitude, as reported by pilots and seen in satellite images. Satellite data from 26 September showed that significant collapses had occurred at the summit crater and hot, steaming deposits from pyroclastic flows and lahars were present on all the flanks, particularly to the ENE and WSW. A small ash cloud was visible in webcam images on 27 September, likely from a collapse at the summit cone. High elevated surface temperatures were observed in satellite imagery during 27-28 September, which were likely the result of hot deposits on the flanks erupted on 25 September. Minor steaming at the summit crater and from an area on the upper flanks was visible in webcam images on 28 September.
During October, explosion events continued between periods of low activity. Seismicity significantly increased starting at around 2100 on 2 October; around the same time satellite images showed an increase in surface temperatures consistent with lava fountaining. Small, hot avalanches of rock and lava descended an unspecified flank. In addition, a distinct increase in infrasound, seismicity, and lightning detections was followed by an ash plume that rose to 12.2 km altitude and drifted S and E at 0520 on 3 October, based on satellite images. Nighttime webcam images showed incandescence due to lava fountaining at the summit and pyroclastic flows descending the NE flank. AVO reported that a notable explosive eruption started at 0547 and lasted until 0900 on 3 October, which prompted a rise in the ACC to Red and the VAL to Warning. Subsequent ash plumes rose to 6-7.6 km altitude by 0931. At 1036 the ACC was lowered back to Orange and the VAL to Watch since both seismic and infrasound data quieted substantially and were slightly above background levels. Gas-and-steam emissions were observed at the summit, based on webcam images. Trace amounts of ashfall were observed in Cold Bay. Resuspended ash was present at several kilometers altitude near the volcano. During the afternoon, low-level ash plumes were visible at the flanks, which appeared to be largely generated by rock avalanches off the summit crater following the explosive activity. These ash plumes rose to 3 km altitude and drifted W. Trace amounts of ashfall were reported by observers in Cold Bay and Unalaska and flights to these communities were disrupted by the ash cloud. Satellite images taken after the eruption showed evidence of pyroclastic flows and lahar deposits in drainages 2 km down the SW flank and about 3.2 km down the NE flank, and continued erosion of the crater rim. Small explosion craters at the end of the pyroclastic flows on the NE flank were noted for the first time, which may have resulted from gas-and-steam explosions when hot deposits interact with underlying ice.
During 4 October seismicity, including frequent small earthquakes, remained elevated, but was gradually declining. Ash plumes were produced for over eight hours until around 1400 that rose to below 3.7 km altitude. These ash plumes were primarily generated off the sides of the volcano where hot rock avalanches from the crater rim had entered drainages to the SW and NE. Two explosion craters were observed at the base of the NE deposits about 3.2 km from the crater rim. Webcam images showed the explosion craters were a source of persistent ash emissions; occasional collapse events also generated ash. Seismicity remained elevated with sulfur dioxide emissions that had a daily average of more than 1,000 tons per day, and frequent small earthquakes through the end of the month. Frequent elevated surface temperatures were identified in satellite images and gas-and-steam plumes were observed in webcam images, although weather conditions occasionally prevented clear views of the summit. Emissions were robust during 14-16 October and were likely generated by the interaction of hot material and snow and ice. During the afternoon of 21 October a strong gas-and-steam plume rose to 3-4.6 km altitude and extended 40 km WSW, based on satellite images and reports from pilots. On 31 October the ACC was lowered to Yellow and the VAL was lowered to Advisory.
Activity in November was characterized by elevated seismicity with ongoing seismic tremor and small, low-frequency earthquakes, elevated surface temperatures, and gas-and-steam emissions. There was an increase in seismic and infrasound tremor amplitudes starting at 1940 on 2 November. As a result, the ACC was again raised to Orange and the VAL was increased to Watch, although ash was not identified in satellite data. An ash cloud rose to 6.1 km altitude and drifted W according to satellite data at 2000. By 0831 on 3 November ash emissions were no longer visible in satellite images. On 6 and 9 November air pressure sensors detected signals consistent with small explosions. Small explosions were detected in infrasound data consistent with weak Strombolian activity on 19 and 21 November. Seismicity started to decrease on 21 November. On 25 November gas-and-steam emissions were emitted from the vent as well as from a scarp on the NE side of the volcano near the summit. A gas-and-steam plume extended about 50 km SSE and was observed in satellite and webcam images on 26 November. On 28 November small explosions were observed in seismic and local infrasound data and gas-and-steam emissions were visible from the summit and from the upper NE collapse scarp based on webcam images. Possible small explosions were observed in infrasound data on 30 November. Weakly elevated surface temperatures and a persistent gas-and-steam plume from the summit and collapse scarps on the upper flanks. A passing aircraft reported the gas-and-steam plume rose to 3-3.4 km altitude on 30 November, but no significant ash emissions were detected.
Satellite data. MODIS thermal anomaly data provided through MIROVA (Middle InfraRed Observation of Volcanic Activity) showed a strong pulse of thermal activity beginning in July 2023 that continued through November 2023 (figure 48). This strong activity was due to Strombolian explosions and lava fountaining events at the summit crater. According to data from MODVOLC thermal alerts, a total of 101 hotspots were detected near the summit crater in July (11-14, 16-19, 23-24 and 26), August (4, 25-26, and 29), September (5, 12, and 17), and October (3, 4, and 8). Infrared satellite data showed large lava flows descending primarily the northern and SE flanks during the reporting period (figure 49). Sulfur dioxide plumes often exceeded two Dobson Units (DUs) and drifted in different directions throughout the reporting period, based on satellite data from the TROPOMI instrument on the Sentinel-5P satellite (figure 50).
Geologic Background. The symmetrical glacier-covered Shishaldin in the Aleutian Islands is the westernmost of three large stratovolcanoes in the eastern half of Unimak Island. The Aleuts named the volcano Sisquk, meaning "mountain which points the way when I am lost." Constructed atop an older glacially dissected edifice, it is largely basaltic in composition. Remnants of an older edifice are exposed on the W and NE sides at 1,500-1,800 m elevation. There are over two dozen pyroclastic cones on its NW flank, which is covered by massive aa lava flows. Frequent explosive activity, primarily consisting of Strombolian ash eruptions from the small summit crater, but sometimes producing lava flows, has been recorded since the 18th century. A steam plume often rises from the summit crater.
Information Contacts: Alaska Volcano Observatory (AVO), a cooperative program of a) U.S. Geological Survey, 4200 University Drive, Anchorage, AK 99508-4667 USA (URL: https://avo.alaska.edu/), b) Geophysical Institute, University of Alaska, PO Box 757320, Fairbanks, AK 99775-7320, USA, and c) Alaska Division of Geological & Geophysical Surveys, 794 University Ave., Suite 200, Fairbanks, AK 99709, USA (URL: http://dggs.alaska.gov/); MIROVA (Middle InfraRed Observation of Volcanic Activity), a collaborative project between the Universities of Turin and Florence (Italy) supported by the Centre for Volcanic Risk of the Italian Civil Protection Department (URL: http://www.mirovaweb.it/); Hawai'i Institute of Geophysics and Planetology (HIGP) - MODVOLC Thermal Alerts System, School of Ocean and Earth Science and Technology (SOEST), Univ. of Hawai'i, 2525 Correa Road, Honolulu, HI 96822, USA (URL: http://modis.higp.hawaii.edu/); NASA Global Sulfur Dioxide Monitoring Page, Atmospheric Chemistry and Dynamics Laboratory, NASA Goddard Space Flight Center (NASA/GSFC), 8800 Greenbelt Road, Goddard, Maryland, USA (URL: https://so2.gsfc.nasa.gov/); Copernicus Browser, Copernicus Data Space Ecosystem, European Space Agency (URL: https://dataspace.copernicus.eu/browser/).
Ioto
Japan
24.751°N, 141.289°E; summit elev. 169 m
All times are local (unless otherwise noted)
New eruption with discolored water, ejecta, and floating pumice during October-December 2023
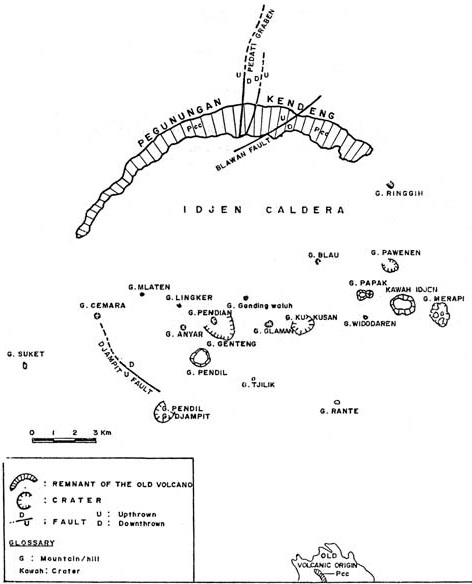
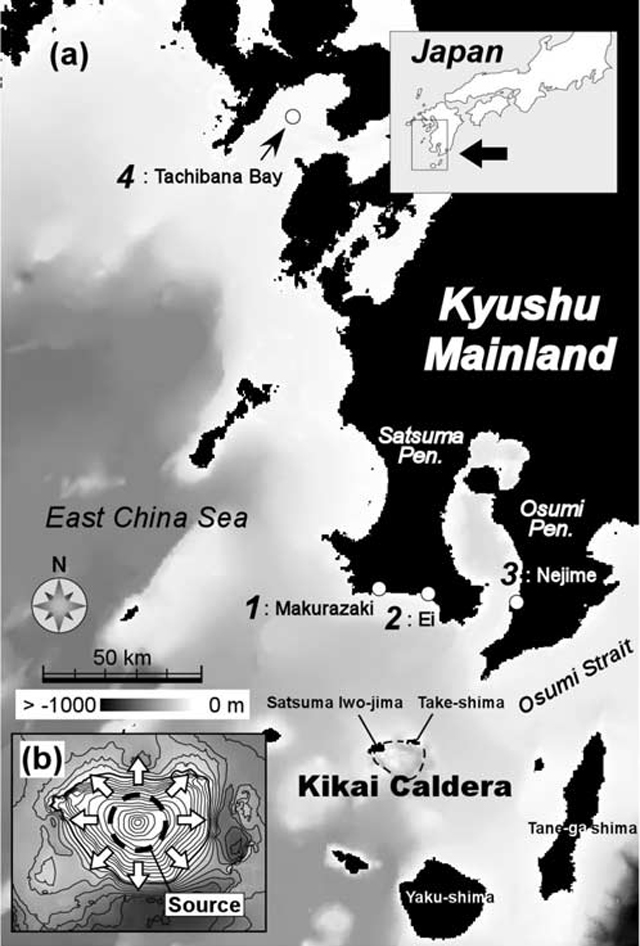
Ioto (Iwo-jima), located about 1,200 km S of Tokyo, lies within a 9-km-wide submarine caldera along the Izu-Bonin-Mariana volcanic arc. Previous eruptions date back to 1889 and have consisted of dominantly phreatic explosions, pumice deposits during 2001, and discolored water. A submarine eruption during July through December 2022 was characterized by discolored water, pumice deposits, and gas emissions (BGVN 48:01). This report covers a new eruption during October through December 2023, which consisted of explosions, black ejecta, discolored water, and floating pumice, based on information from the Japan Meteorological Association (JMA), the Japan Coast Guard (JCG), and satellite data.
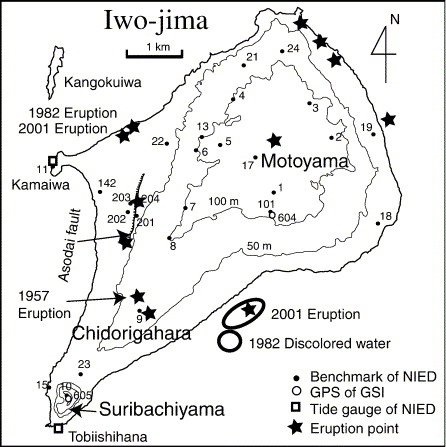
JMA reported that an eruption had been occurring offshore of Okinahama on the SE side of the island since 21 October, which was characterized by volcanic tremor, according to the Japan Maritime Self-Defense Force (JMSDF) Iwo Jima Air Base (figure 22). According to an 18 October satellite image a plume of discolored water at the site of this new eruption extended NE (figure 23). During an overflight conducted on 30 October, a vent was identified about 1 km off the coast of Okinahama. Observers recorded explosions every few minutes that ejected dark material about 20 m above the ocean and as high as 150 m. Ejecta from the vent formed a black-colored island about 100 m in diameter, according to observations conducted from the air by the Earthquake Research Institute of the University of Tokyo in cooperation with the Mainichi newspaper (figure 24). Occasionally, large boulders measuring more than several meters in size were also ejected. Observations from the Advanced Land Observing Satellite Daichi-2 and Sentinel-2 satellite images also confirmed the formation of this island (figure 23). Brown discolored water and floating pumice were present surrounding the island.
The eruption continued during November. During an overflight on 3 November observers photographed the island and noted that material was ejected 169 m high, according to a news source. Explosions gradually became shorter, and, by the 3rd, they occurred every few seconds; dark and incandescent material were ejected about 800 m above the vent. On 4 November eruptions were accompanied by explosive sounds. Floating, brown-colored pumice was present in the water surrounding the island. There was a brief increase in the number of volcanic earthquakes during 8-14 November and 24-25 November. The eruption temporarily paused during 9-11 November and by 12 November eruptions resumed to the W of the island. On 10 November dark brown-to-dark yellow-green discolored water and a small amount of black floating material was observed (figure 25). A small eruption was reported on 18 November off the NE coast of the island, accompanied by white gas-and-steam plumes (figure 23). Another pause was recorded during 17-19 November, which then resumed on 20 November and continued erupting intermittently. According to a field survey conducted by the National Institute for Disaster Prevention Science and Technology on 19 November, a 30-m diameter crater was visible on the NE coast where landslides, hot water, and gray volcanic ash containing clay have occurred and been distributed previously. Erupted blocks about 10 cm in diameter were distributed about 90-120 m from the crater. JCG made observations during an overflight on 23 November and reported a phreatomagmatic eruption. Explosions at the main vent generated dark gas-and-ash plumes that rose to 200 m altitude and ejected large blocks that landed on the island and in the ocean (figure 26). Discolored water also surrounded the island. The size of the new island had grown to 450 m N-S x 200 m E-W by 23 November, according to JCG.
The eruption continued through 11 December, followed by a brief pause in activity, which then resumed on 31 December, according to JMA. Intermittent explosions produced 100-m-high black plumes at intervals of several minutes to 30 minutes during 1-10 December. Overflights were conducted on 4 and 15 December and reported that the water surrounding the new island was discolored to dark brown-to-dark yellow-green (figure 27). No floating material was reported during this time. In comparison to the observations made on 23 November, the new land had extended N and part of it had eroded away. In addition, analysis by the Geospatial Information Authority of Japan using SAR data from Daichi-2 also confirmed that the area of the new island continued to decrease between 4 and 15 December. Ejected material combined with wave erosion transformed the island into a “J” shape, 500-m-long and with the curved part about 200 m offshore of Ioto. The island was covered with brown ash and blocks, and the surrounding water was discolored to greenish-brown and contained an area of floating pumice. JCG reported from an overflight on 4 December that volcanic ash-like material found around the S vent on the NE part of the island was newly deposited since 10 November (figure 28). By 15 December the N part of the “J” shaped island had separated and migrated N, connecting to the Okinahama coast and the curved part of the “J” had eroded into two smaller islands (figure 27).
References. Ukawa, M., Fujita, E., Kobayashi, T., 2002, Recent volcanic activity of Iwo Jima and the 2001 eruption, Monthly Chikyu, Extra No. 39, 157-164.
Geologic Background. Ioto, in the Volcano Islands of Japan, lies within a 9-km-wide submarine caldera. The volcano is also known as Ogasawara-Iojima to distinguish it from several other "Sulfur Island" volcanoes in Japan. The triangular, low-elevation, 8-km-long island narrows toward its SW tip and has produced trachyandesitic and trachytic rocks that are more alkalic than those of other volcanoes in this arc. The island has undergone uplift for at least the past 700 years, accompanying resurgent doming of the caldera; a shoreline landed upon by Captain Cook's surveying crew in 1779 is now 40 m above sea level. The Motoyama plateau on the NE half of the island consists of submarine tuffs overlain by coral deposits and forms the island's high point. Many fumaroles are oriented along a NE-SW zone cutting through Motoyama. Numerous recorded phreatic eruptions, many from vents on the W and NW sides of the island, have accompanied the uplift.
Information Contacts: Japan Meteorological Agency (JMA), 1-3-4 Otemachi, Chiyoda-ku, Tokyo 100-8122, Japan (URL: http://www.jma.go.jp/jma/indexe.html); Japan Coast Guard (JCG) Volcano Database, Hydrographic and Oceanographic Department, 3-1-1, Kasumigaseki, Chiyoda-ku, Tokyo 100-8932, Japan (URL: https://www1.kaiho.mlit.go.jp/GIJUTSUKOKUSAI/kaiikiDB/kaiyo22-2.htm); Copernicus Browser, Copernicus Data Space Ecosystem, European Space Agency (URL: https://dataspace.copernicus.eu/browser/); Asahi, 5-3-2, Tsukiji, Chuo Ward, Tokyo, 104-8011, Japan (URL: https://www.asahi.com/ajw/articles/15048458).
Purace (Colombia) — December 2023 Cite this Report
Purace
Colombia
2.3095°N, 76.3948°W; summit elev. 4650 m
All times are local (unless otherwise noted)
Gas-and-ash emission on 16 November 2023
Puracé, located in Colombia, is a stratovolcano that contains a 500-m-wide summit crater. It is part of the Los Coconucos volcanic chain that is a NW-SE trending group of seven cones and craters. The most recent eruption occurred during March 2022 that was characterized by frequent seismicity and gas-and-steam emissions (BGVN 47:06). This report covers a brief eruption during November 2023 based on monthly reports from the Popayán Observatory, part of the Servicio Geologico Colombiano (SGC).
Activity during November 2022 through November 2023 primarily consisted of seismicity: VT-type events, LP-type events, HB-type events, and TR-type events (table 4). Maximum sulfur dioxide values were measured weekly and ranged from 259-5,854 tons per day (t/d) during November 2022 through April 2023. White gas-and-steam emissions were also occasionally reported.
SGC issued a report on 25 October that noted a significant increase in the number of earthquakes associated with rock fracturing. These earthquakes were located SE of the crater between Puracé and Piocollo at depths of 1-4 km. There were no reported variations in sulfur dioxide values, but SGC noted high carbon dioxide values, compared to those recorded in the first half of 2023.
SGC reported that at 1929 on 16 November the seismic network detected a signal that was possibly associated with a gas-and-ash emission, though it was not confirmed in webcam images due to limited visibility. On 17 November an observer confirmed ash deposits on the N flank. Webcam images showed an increase in degassing both inside the crater and from the NW flank, rising 700 m above the crater.
Table 4. Seismicity at Puracé during November 2022-November 2023. Volcano-tectonic (VT), long-period (LP), hybrid (HB), and tremor (TR) events are reported each month. Courtesy of SGC.
| Month |
Volcano-tectonic |
Long-period |
Hybrid |
Tremor |
| Nov 2022 |
429 |
2,023 |
5 |
831 |
| Dec 2022 |
423 |
1,390 |
9 |
834 |
| Jan 2023 |
719 |
1,622 |
0 |
957 |
| Feb 2023 |
598 |
1,701 |
2 |
1,124 |
| Mar 2023 |
331 |
2,408 |
147 |
607 |
| Apr 2023 |
614 |
4,427 |
33 |
148 |
| May 2023 |
620 |
3,717 |
170 |
109 |
| Jun 2023 |
467 |
3,293 |
86 |
148 |
| Jul 2023 |
1,116 |
5,809 |
183 |
542 |
| Aug 2023 |
692 |
2,927 |
94 |
321 |
| Sep 2023 |
887 |
1,505 |
82 |
848 |
| Oct 2023 |
2,373 |
2,949 |
135 |
692 |
| Nov 2023 |
1,212 |
2,302 |
69 |
293 |
Geologic Background. Puracé is an active andesitic volcano with a 600-m-diameter summit crater at the NW end of the Los Coconucos Volcanic Chain. This volcanic complex includes nine composite and five monogenetic volcanoes, extending from the Puracé crater more than 6 km SE to the summit of Pan de Azúcar stratovolcano. The dacitic massif which the complex is built on extends about 13 km NW-SE and 10 km NE-SW. Frequent small to moderate explosive eruptions reported since 1816 CE have modified the morphology of the summit crater, with the largest eruptions in 1849, 1869, and 1885.
Information Contacts: Servicio Geologico Colombiano (SGC), Diagonal 53 No. 34-53 - Bogotá D.C., Colombia (URL: https://www.sgc.gov.co/volcanes).
Etna
Italy
37.748°N, 14.999°E; summit elev. 3357 m
All times are local (unless otherwise noted)
Strombolian explosions, lava fountains, and lava flows during July-August 2023
Etna, located on the Italian island of Sicily, has had documented eruptions dating back to 1500 BCE. Activity typically originates from multiple cones at the summit, where several craters have formed and evolved. The currently active craters are Northeast Crater (NEC), Voragine (VOR), and Bocca Nuova (BN), and the Southeast Crater (SEC); VOR and BN were previously referred to as the “Central Crater”. The original Southeast crater formed in 1978, and a second eruptive site that opened on its SE flank in 2011 was named the New Southeast Crater (NSEC). Another eruptive site between the SEC and NSEC developed during early 2017 and was referred to as the "cono della sella" (saddle cone). The current eruption period began in November 2022 and has been characterized by intermittent Strombolian activity, lava flows, and ash plumes (BGVN 48:08). This report updates activity during July through October 2023, which includes primarily gas-and-steam emissions; during July and August Strombolian explosions, lava fountains, and lava flows were reported, based on weekly and special reports by the Osservatorio Etneo (OE), part of the Catania Branch of Italy's Istituo Nazionale di Geofisica e Vulcanologica (INGV) and satellite data.
Variable fumarolic degassing was reported at all summit craters (BN, VOR, NEC, and SEC) throughout the entire reporting period (table 15). The MIROVA (Middle InfraRed Observation of Volcanic Activity) volcano hotspot detection system based on the analysis of MODIS data showed frequent low-to-moderate power thermal anomalies during the reporting period (figure 399). During mid-August there was a pulse in activity that showed an increase in the power of the anomalies due to Strombolian activity, lava fountains, and lava flows. Infrared satellite imagery captured strong thermal anomalies at the central and southeast summit crater areas (figure 400). Accompanying thermal activity were occasional sulfur dioxide plumes that exceeded 2 Dobson Units (DUs) recorded by the TROPOMI instrument on the Sentinel-5P satellite (figure 401).
Table 15. Summary of activity at the four primary crater areas at the summit of Etna during July-October 2023. Information is from INGV weekly reports.
| Month |
Bocca Nuova (BN) |
Voragine (VOR) |
Northeast Crater (NEC) |
Southeast Crater (SEC) |
| Jul 2023 |
Continuous degassing. |
No observations. |
Weak gas emissions. |
Continuous degassing. Sporadic and weak-to-moderate ash emissions. Strombolian explosions. |
| Aug 2023 |
Continuous degassing. |
No observations. |
No observations. |
Continuous degassing. Occasional ash emissions. Strombolian activity, lava fountaining, and lava flows. |
| Sep 2023 |
Variable degassing. Crater incandescence. |
Weak fumarolic activity. |
Weak fumarolic activity. |
Variable degassing. |
| Oct 2023 |
Continuous degassing. |
Weak fumarolic activity. |
Weak fumarolic activity. |
Continuous degassing. |
Activity during July and August was relatively low and mainly consisted of degassing at the summit craters, particularly at SEC and BN. Cloudy weather prevented clear views of the summit during early July. During the night of 2 July some crater incandescence was visible at SEC. Explosive activity resumed at SEC during 9-10 July, which was characterized by sporadic and weak ash emissions that rapidly dispersed in the summit area (figure 402). INGV reported moderate Strombolian activity began at 2034 on 14 July and was confined to the inside of the crater and fed by a vent located in the E part of SEC. An ash emission was detected at 2037. A new vent opened on 15 July in the SE part of BN and began to produce continuous gas-and-steam emissions. During an inspection carried out on 28 July pulsating degassing, along with audible booms, were reported at two active vents in BN. Vigorous gas-and-steam emissions intermittently generated rings. On rare occasions, fine, reddish ash was emitted from BN1 and resuspended by the gas-and-steam emissions.
Around 2000 on 13 August INGV reported a sudden increase in volcanic tremor amplitude. Significant infrasonic activity coincided with the tremor increase. Incandescent flashes were visible through the cloud cover in webcam images of SEC (figure 403). Strombolian activity at SEC began to gradually intensify starting at 2040 as seismicity continued to increase. The Aviation Color Code (ACC) was raised to Yellow (the second lowest-level on a four-color scale) at 2126 and then to Orange (the second highest-level on a four-color scale) at 2129 due to above-background activity. The activity rapidly transitioned from Strombolian activity to lava fountains around 2333 that rose 300-400 m above the crater (figure 403). Activity was initially focused on the E vent of the crater, but then the vent located above the S flank of the cone also became active. A lava flow from this vent traveled SW into the drainage created on 10 February 2022, overlapping with previous flows from 10 and 21 February 2022 and 21 May 2023, moving between Monte Barbagallo and Monte Frumento Supino (figure 404). The lava flow was 350 m long, oriented NNE-SSW, and descended to an elevation of 2.8 km. Flows covered an area of 300,000 m2 and had an estimated volume of 900,000 m3. The ACC was raised to Red at 2241 based on strong explosive activity and ashfall in Rifugio Sapienza-Piano Vetore at 1.7 km elevation on the S flank. INGV reported that pyroclastic flows accompanied this activity.
Activity peaked between 0240 and 0330 on 14 August, when roughly 5-6 vents erupted lava fountains from the E to SW flank of SEC. The easternmost vents produced lava fountains that ejected material strongly to the E, which caused heavy fallout of incandescent pyroclastic material on the underlying flank, triggering small pyroclastic flows. This event was also accompanied by lightning both in the ash column and in the ash clouds that were generated by the pyroclastic flows. A fracture characterized by a series of collapse craters (pit craters) opened on the upper SW flank of SEC. An ash cloud rose a few kilometers above the crater and drifted S, causing ash and lapilli falls in Rifugio Sapienza and expanding toward Nicolosi, Mascalucia, Catania, and up to Syracuse. Ashfall resulted in operational problems at the Catania airport (50 km S), which lasted from 0238 until 2000. By 0420 the volcanic tremor amplitude values declined to background levels. After 0500 activity sharply decreased, although the ash cloud remained for several hours and drifted S. By late morning, activity had completely stopped. The ACC was lowered to Orange as volcanic ash was confined to the summit area. Sporadic, minor ash emissions continued throughout the day. At 1415 the ACC was lowered to Yellow and then to Green at 1417.
During the night of 14-15 August only occasional flashes were observed, which were more intense during avalanches of material inside the eruptive vents. Small explosions were detected at SEC at 2346 on 14 August and at 0900 on 26 August that each produced ash clouds which rapidly dispersed into the atmosphere (figure 405). According to a webcam image, an explosive event detected at 2344 at SEC generated a modest ash cloud that was rapidly dispersed by winds. The ACC was raised to Yellow at 2355 on 14 August due to increasing unrest and was lowered to Green at 0954 on 15 August.
Activity during September and October was relatively low and mainly characterized by variable degassing from BN and SEC. Intense, continuous, and pulsating degassing was accompanied by roaring sounds and flashes of incandescence at BN both from BN1 and the new pit crater that formed during late July (figure 406). The degassing from the new pit crater sometimes emitted vapor rings. Cloudy weather during 6-8 September prevented observations of the summit craters .
Geologic Background. Mount Etna, towering above Catania on the island of Sicily, has one of the world's longest documented records of volcanism, dating back to 1500 BCE. Historical lava flows of basaltic composition cover much of the surface of this massive volcano, whose edifice is the highest and most voluminous in Italy. The Mongibello stratovolcano, truncated by several small calderas, was constructed during the late Pleistocene and Holocene over an older shield volcano. The most prominent morphological feature of Etna is the Valle del Bove, a 5 x 10 km caldera open to the east. Two styles of eruptive activity typically occur, sometimes simultaneously. Persistent explosive eruptions, sometimes with minor lava emissions, take place from one or more summit craters. Flank vents, typically with higher effusion rates, are less frequently active and originate from fissures that open progressively downward from near the summit (usually accompanied by Strombolian eruptions at the upper end). Cinder cones are commonly constructed over the vents of lower-flank lava flows. Lava flows extend to the foot of the volcano on all sides and have reached the sea over a broad area on the SE flank.
Information Contacts: Sezione di Catania - Osservatorio Etneo, Istituto Nazionale di Geofisica e Vulcanologia (INGV), Sezione di Catania, Piazza Roma 2, 95123 Catania, Italy (URL: http://www.ct.ingv.it/it/); MIROVA (Middle InfraRed Observation of Volcanic Activity), a collaborative project between the Universities of Turin and Florence (Italy) supported by the Centre for Volcanic Risk of the Italian Civil Protection Department (URL: http://www.mirovaweb.it/); NASA Global Sulfur Dioxide Monitoring Page, Atmospheric Chemistry and Dynamics Laboratory, NASA Goddard Space Flight Center (NASA/GSFC), 8800 Greenbelt Road, Goddard MD 20771, USA (URL: https://so2.gsfc.nasa.gov/); Copernicus Browser, Copernicus Data Space Ecosystem, European Space Agency (URL: https://dataspace.copernicus.eu/browser/).
Suwanosejima (Japan) — December 2023 Cite this Report
Suwanosejima
Japan
29.638°N, 129.714°E; summit elev. 796 m
All times are local (unless otherwise noted)
Eruption plumes, crater incandescence, and occasional explosions during July-October 2023
Suwanosejima is an 8-km-long island that consists of a stratovolcano and two active summit craters, located in the northern Ryukyu Islands, Japan. Volcanism over the past century has been characterized by Strombolian explosions, ash plumes, and ashfall. The current eruption began in October 2004 and has more recently consisted of frequent eruption plumes, explosions, and incandescent ejecta (BGVN 48:07). This report covers similar activity of ash plumes, explosions, and crater incandescence during July through October 2023 using monthly reports from the Japan Meteorological Agency (JMA) and satellite data.
Thermal activity during the reporting period was relatively low; only one low-power thermal anomaly was detected during mid-July and one during early August, based on a MIROVA (Middle InfraRed Observation of Volcanic Activity) Log Radiative Power graph of the MODIS thermal anomaly data. On two clear weather days, a thermal anomaly was visible in infrared satellite images (figure 81).
Low-level activity was reported at the Otake crater during July and no explosions were detected. Eruption plumes rose as high as 1.8 km above the crater. On 13 July an ash plume rose 1.7 km above the crater rim, based on a webcam image. During the night of the 28th crater incandescence was visible in a webcam image. An eruptive event reported on 31 July produced an eruption plume that rose 2.1 km above the crater. Seismicity consisted of 11 volcanic earthquakes on the W flank, the number of which had decreased compared to June (28) and 68 volcanic earthquakes near the Otake crater, which had decreased from 722 in the previous month. According to observations conducted by the University of Tokyo Graduate School of Science, Kyoto University Disaster Prevention Research Institute, Toshima Village, and JMA, the amount of sulfur dioxide emissions released during the month was 400-800 tons per day (t/d).
Eruptive activity in the Otake crater continued during August and no explosions were reported. An eruptive event produced a plume that rose 1 km above the crater at 1447 on 12 August. Subsequent eruptive events were recorded at 0911 on 16 August, at 1303 on 20 August, and at 0317 on 21 August, which produced ash plumes that rose 1-1.1 km above the crater and drifted SE, SW, and W. On 22 August an ash plume was captured in a webcam image rising 1.4 km above the crater (figure 82). Multiple eruptive events were detected on 25 August at 0544, 0742, 0824, 1424, and 1704, which generated ash plumes that rose 1.1-1.2 km above the crater and drifted NE, W, and SW. On 28 August a small amount of ashfall was observed as far as 1.5 km from the crater. There were 17 volcanic earthquakes recorded on the W flank of the volcano and 79 recorded at the Otake crater during the month. The amount of sulfur dioxide emissions released during the month was 400-800 t/d.
Activity continued at the Otake crater during September. Occasionally, nighttime crater incandescence was observed in webcam images and ashfall was reported. An eruptive event at 1949 on 4 September produced an ash plume that rose 1 km above the crater and drifted SW. On 9 September several eruption events were detected at 0221, 0301, and 0333, which produced ash plumes that rose 1.1-1.4 km above the crater rim and drifted W; continuous ash emissions during 0404-0740 rose to a maximum height of 2 km above the crater rim (figure 83). More eruptive events were reported at 1437 on 10 September, at 0319 on 11 September, and at 0511 and 1228 on 15 September, which generated ash plumes that rose 1-1.8 km above the crater. During 25, 27, and 30 September, ash plumes rose as high as 1.3 km above the crater rim. JMA reported that large blocks were ejected as far as 300 m from the center of the crater. There were 18 volcanic earthquakes detected beneath the W flank and 82 volcanic earthquakes detected near the Otake crater. The amount of sulfur dioxide released during the month ranged from 600 to 1,600 t/d.
Activity during early-to-mid-October consisted of occasional explosions, a total number of 13, and ash plumes that rose as high as 1.9 km above the Otake crater rim on 29 October (figure 84). These explosions are the first to have occurred since June 2023. Continuous ash emissions were reported during 0510-0555 on 1 October. Explosions were recorded at 0304, 2141, and 2359 on 2 October, at 0112 on 3 October, and at 1326 on 6 October, which produced ash plumes that rose as high as 1 km above the crater rim and drifted SW and W. An explosion was noted at 0428 on 3 October, but emission details were unknown. A total of eight explosions were recorded by the seismic network at 1522 on 14 October, at 0337, 0433, 0555, 1008, and 1539 on 15 October, and at 0454 and 0517 on 16 October. Ash plumes from these explosions rose as high as 900 m above the crater and drifted SE. Eruptive events during 25-27 and 29-30 October generated plumes that rose as high as 1.9 km above the crater and drifted SE, S, and SW. Ash was deposited in Toshima village (3.5 km SSW). Eruptive activity occasionally ejected large volcanic blocks as far as 600 m from the crater. Nighttime crater incandescence was visible in webcams. Intermittent ashfall was reported as far as 1.5 km from the crater. There were 43 volcanic earthquakes detected on the W flank during the month, and 184 volcanic earthquakes detected near the Otake crater. The amount of sulfur dioxide emitted ranged between 400 and 900 t/d.
Geologic Background. The 8-km-long island of Suwanosejima in the northern Ryukyu Islands consists of an andesitic stratovolcano with two active summit craters. The summit is truncated by a large breached crater extending to the sea on the E flank that was formed by edifice collapse. One of Japan's most frequently active volcanoes, it was in a state of intermittent Strombolian activity from Otake, the NE summit crater, between 1949 and 1996, after which periods of inactivity lengthened. The largest recorded eruption took place in 1813-14, when thick scoria deposits covered residential areas, and the SW crater produced two lava flows that reached the western coast. At the end of the eruption the summit of Otake collapsed, forming a large debris avalanche and creating an open collapse scarp extending to the eastern coast. The island remained uninhabited for about 70 years after the 1813-1814 eruption. Lava flows reached the eastern coast of the island in 1884. Only about 50 people live on the island.
Information Contacts: Japan Meteorological Agency (JMA), 1-3-4 Otemachi, Chiyoda-ku, Tokyo 100-8122, Japan (URL: http://www.jma.go.jp/jma/indexe.html); MIROVA (Middle InfraRed Observation of Volcanic Activity), a collaborative project between the Universities of Turin and Florence (Italy) supported by the Centre for Volcanic Risk of the Italian Civil Protection Department (URL: http://www.mirovaweb.it/); Hawai'i Institute of Geophysics and Planetology (HIGP) - MODVOLC Thermal Alerts System, School of Ocean and Earth Science and Technology (SOEST), Univ. of Hawai'i, 2525 Correa Road, Honolulu, HI 96822, USA (URL: http://modis.higp.hawaii.edu/); Copernicus Browser, Copernicus Data Space Ecosystem, European Space Agency (URL: https://dataspace.copernicus.eu/browser/).
Aira
Japan
31.5772°N, 130.6589°E; summit elev. 1117 m
All times are local (unless otherwise noted)
Explosions, ash plumes, ash fall, and crater incandescence during July-October 2023
Aira caldera, located in the northern half of Kagoshima Bay, Japan, contains the post-caldera Sakurajima volcano. Eruptions typically originate from the Minamidake crater, and since the 8th century, ash deposits have been recorded in the city of Kagoshima (10 km W), one of Kyushu’s largest cities. The Minamidake summit cone and crater has had persistent activity since 1955; the Showa crater on the E flank has also been intermittently active since 2006. The current eruption period began during March 2017 and has recently been characterized by intermittent explosions, eruption plumes, and ashfall (BGVN 48:07). This report updates activity during July through October 2023 and describes explosive events, ash plumes, nighttime crater incandescence, and ashfall, according to monthly activity reports from the Japan Meteorological Agency (JMA) and satellite data.
Thermal activity remained at low levels during this reporting period, according to the MIROVA (Middle InfraRed Observation of Volcanic Activity) system (figure 149). There was a slight increase in the number of anomalies during September through October. Occasional thermal anomalies were visible in infrared satellite images mainly at the Minamidake crater (Vent A is located to the left and Vent B is located to the right) (figure 150).
Table 30. Number of monthly explosive events, days of ashfall, area of ash covered, and sulfur dioxide emissions from Sakurajima’s Minamidake crater at Aira during July-October 2023. Note that smaller ash events are not listed. Ashfall days were measured at Kagoshima Local Meteorological Observatory and ashfall amounts represent material covering all the Kagoshima Prefecture. Data courtesy of JMA monthly reports.
| Month |
Explosive events |
Days of ashfall |
Ashfall amount (g/m2) |
SO2 emissions (tons/day) |
| Jul 2023 |
3 |
0 |
0 |
1,600-3,200 |
| Aug 2023 |
3 |
10 |
7 |
1,800-3,300 |
| Sep 2023 |
3 |
7 |
3 |
1,600-2,300 |
| Oct 2023 |
33 |
8 |
61 |
2,200-4,200 |
JMA reported that during July, there were eight eruptions, three of which were explosion events in the Showa crater. Large blocks were ejected as far as 600 m from the Showa crater. Very small eruptions were occasionally reported at the Minamidake crater. Nighttime incandescence was observed in both the Showa and Minamidake crater. Explosions were reported on 16 July at 2314 and on 17 July at 1224 and at 1232 (figure 151). Resulting eruption plumes rose 700-2,500 m above the crater and drifted N. On 23 July the number of volcanic earthquakes on the SW flank of the volcano increased. A strong Mw 3.1 volcanic earthquake was detected at 1054 on 26 July. The number of earthquakes recorded throughout the month was 545, which markedly increased from 73 in June. No ashfall was observed at the Kagoshima Regional Meteorological Observatory during July. According to a field survey conducted during the month, the daily amount of sulfur dioxide emissions was 1,600-3,200 tons per day (t/d).
There were three eruptions reported at the Minamidake crater during August, each of which were explosive. The explosions occurred on 9 August at 0345, on 13 August at 2205, and on 31 August at 0640, which generated ash plumes that rose 800-2,000 m above the crater and drifted W. There were two eruptions detected at Showa crater; on 4 August at 2150 ejecta traveled 800 m from the Showa crater and associated eruption plumes rose 2.3 km above the crater. The explosion at 2205 on 13 August generated an ash plume that rose 2 km above the crater and was accompanied by large blocks that were ejected 600 m from the Minamidake crater (figure 152). Nighttime crater incandescence was visible in a high-sensitivity surveillance camera at both craters. Seismicity consisted of 163 volcanic earthquakes, 84 of which were detected on the SW flank. According to the Kagoshima Regional Meteorological Observatory there was a total of 7 g/m2 of ashfall over the course of 10 days during the month. According to a field survey, the daily amount of sulfur dioxide emitted was 1,800-3,300 t/d.
During September, four eruptions were reported, three of which were explosion events. These events occurred at 1512 on 9 September, at 0018 on 11 September, and at 2211 on 13 September. Resulting ash plumes generally rose 800-1,100 m above the crater. An explosion produced an ash plume at 2211 on 13 September that rose as high as 1.7 km above the crater. Large volcanic blocks were ejected 600 m from the Minamidake crater. Smaller eruptions were occasionally observed at the Showa crater. Nighttime crater incandescence was visible at the Minamidake crater. Seismicity was characterized by 68 volcanic earthquakes, 28 of which were detected beneath the SW flank. According to the Kagoshima Regional Meteorological Observatory there was a total of 3 g/m2 of ashfall over the course of seven days during the month. A field survey reported that the daily amount of sulfur dioxide emitted was 1,600-2,300 t/d.
Eruptive activity during October consisted of 69 eruptions, 33 of which were described as explosive. These explosions occurred during 4 and 11-21 October and generated ash plumes that rose 500-3,600 m above the crater and drifted S, E, SE, and N. On 19 October at 1648 an explosion generated an ash plume that rose 3.6 km above the crater (figure 153). No eruptions were reported in the Showa crater; white gas-and-steam emissions rose 100 m above the crater from a vent on the N flank. Nighttime incandescence was observed at the Minamidake crater. On 24 October an eruption was reported from 0346 through 0430, which included an ash plume that rose 3.4 km above the crater. Ejected blocks traveled 1.2 km from the Minamidake crater. Following this eruption, small amounts of ashfall were observed from Arimura (4.5 km SE) and a varying amount in Kurokami (4 km E) (figure 154). The number of recorded volcanic earthquakes during the month was 190, of which 14 were located beneath the SW flank. Approximately 61 g/m2 of ashfall was reported over eight days of the month. According to a field survey, the daily amount of sulfur dioxide emitted was 2,200-4,200 t/d.
Geologic Background. The Aira caldera in the northern half of Kagoshima Bay contains the post-caldera Sakurajima volcano, one of Japan's most active. Eruption of the voluminous Ito pyroclastic flow accompanied formation of the 17 x 23 km caldera about 22,000 years ago. The smaller Wakamiko caldera was formed during the early Holocene in the NE corner of the caldera, along with several post-caldera cones. The construction of Sakurajima began about 13,000 years ago on the southern rim and built an island that was joined to the Osumi Peninsula during the major explosive and effusive eruption of 1914. Activity at the Kitadake summit cone ended about 4,850 years ago, after which eruptions took place at Minamidake. Frequent eruptions since the 8th century have deposited ash on the city of Kagoshima, located across Kagoshima Bay only 8 km from the summit. The largest recorded eruption took place during 1471-76.
Information Contacts: Japan Meteorological Agency (JMA), 1-3-4 Otemachi, Chiyoda-ku, Tokyo 100-8122, Japan (URL: http://www.jma.go.jp/jma/indexe.html); MIROVA (Middle InfraRed Observation of Volcanic Activity), a collaborative project between the Universities of Turin and Florence (Italy) supported by the Centre for Volcanic Risk of the Italian Civil Protection Department (URL: http://www.mirovaweb.it/); Copernicus Browser, Copernicus Data Space Ecosystem, European Space Agency (URL: https://dataspace.copernicus.eu/browser/).
Nishinoshima (Japan) — November 2023 Cite this Report
Nishinoshima
Japan
27.247°N, 140.874°E; summit elev. 100 m
All times are local (unless otherwise noted)
Gray emissions during October 2023
Nishinoshima is a small island in the Ogasawara Arc, about 1,000 km S of Tokyo, Japan. It contains prominent submarine peaks to the S, W, and NE. Recorded eruptions date back to 1973, with the current eruption period beginning in October 2022. Eruption plumes and fumarolic activity characterize recent activity (BGVN 48:10). This report covers the end of the eruption for September through October 2023, based on information from monthly reports of the Japan Meteorological Agency (JMA) monthly reports, and satellite data.
No eruptive activity was reported during September 2023, although JMA noted that the surface temperature was slightly elevated compared to the surrounding area since early March 2023. The Japan Coast Guard (JCG) conducted an overflight on 20 September and reported white gas-and-steam plumes rising 3 km above the central crater of the pyroclastic cone, as well as multiple white gas-and-steam emissions emanating from the N, E, and S flanks of the crater to the coastline. In addition, dark reddish brown-to-green discolored water was distributed around almost the entire circumference of the island.
Similar low-level activity was reported during October. Multiple white gas-and-steam emissions rose from the N, E, and S flanks of the central crater of the pyroclastic cone and along the coastline; these emissions were more intense compared to the previous overflight observations. Dark reddish brown-to-green discolored water remained visible around the circumference of the island. On 4 October aerial observations by JCG showed a small eruption consisting of continuous gas-and-steam emissions emanating from the central crater, with gray emissions rising to 1.5 km altitude (figure 129). According to observations from the marine weather observation vessel Keifu Maru on 26 October, white gas-and-steam emissions persisted from the center of the pyroclastic cone, as well as from the NW, SW, and SE coasts of the island for about five minutes. Slightly discolored water was visible up to about 1 km.
Frequent low-to-moderate power thermal anomalies were recorded in the MIROVA graph (Middle InfraRed Observation of Volcanic Activity) during September (figure 130). Occasional anomalies were detected during October, and fewer during November through December. A thermal anomaly was visible in the crater using infrared satellite imagery on 6, 8, 11, 16, 18, 21, and 23 September and 8, 13, 21, 26, and 28 October (figure 131).
Geologic Background. The small island of Nishinoshima was enlarged when several new islands coalesced during an eruption in 1973-74. Multiple eruptions that began in 2013 completely covered the previous exposed surface and continued to enlarge the island. The island is the summit of a massive submarine volcano that has prominent peaks to the S, W, and NE. The summit of the southern cone rises to within 214 m of the ocean surface 9 km SSE.
Information Contacts: Japan Meteorological Agency (JMA), 1-3-4 Otemachi, Chiyoda-ku, Tokyo 100-8122, Japan (URL: http://www.jma.go.jp/jma/indexe.html); MIROVA (Middle InfraRed Observation of Volcanic Activity), a collaborative project between the Universities of Turin and Florence (Italy) supported by the Centre for Volcanic Risk of the Italian Civil Protection Department (URL: http://www.mirovaweb.it/); Copernicus Browser, Copernicus Data Space Ecosystem, European Space Agency (URL: https://dataspace.copernicus.eu/browser/).
Kilauea (United States) — October 2023 Cite this Report
Kilauea
United States
19.421°N, 155.287°W; summit elev. 1222 m
All times are local (unless otherwise noted)
Strong lava fountains, lava flows, and spatter at Halema’uma’u during January-September 2023
Kīlauea is on the island of Hawai’i and overlaps the E flank of the Mauna Loa volcano. Its East Rift Zone (ERZ) has been intermittently active for at least 2,000 years. An extended eruption period began in January 1983 and was characterized by open lava lakes and lava flows from the summit caldera and the East Rift Zone. During May 2018 magma migrated into the Lower East Rift Zone (LERZ) and opened 24 fissures along a 6-km-long NE-trending fracture zone that produced lava flows traveling in multiple directions. As lava emerged from the fissures, the lava lake at Halema'uma'u drained and explosions sent ash plumes to several kilometers altitude (BGVN 43:10).
The current eruption period started during September 2021 and has been characterized by low-level lava effusions in the active Halema’uma’u lava lake (BGVN 48:01). This report covers three notable eruption periods during February, June, and September 2023 consisting of lava fountaining, lava flows, and spatter during January through September 2023 using information from daily reports, volcanic activity notices, and abundant photo, map, and video data from the US Geological Survey's (USGS) Hawaiian Volcano Observatory (HVO).
Activity during January 2023. Small earthquake swarms were recorded on 2 January 2023; increased seismicity and changes in the pattern of deformation were noted on the morning of 5 January. At around 1500 both the rate of deformation and seismicity drastically increased, which suggested magma movement toward the surface. HVO raised the Volcano Alert Level (VAL) to Watch (the second highest level on a four-level scale) and the Aviation Color Code (ACC) to Orange (the second highest color on a four-color scale) at 1520.
Multiple lava fountains and lava effusions from vents in the central eastern portion of the Halema’uma’u crater began on 5 January around 0434; activity was confined to the eastern half of the crater and within the basin of the western half of the crater, which was the focus of the eruption in 2021-2022 (figure 525). Incandescence was visible in webcam images at 1634 on 5 January, prompting HVO to raise the VAL to Warning (the highest level on a four-level scale) and the ACC to Red (the highest color on a four-color scale). Lava fountains initially rose as high as 50 m above the vent at the onset of the eruption (figure 526) but then declined to a more consistent 5-6 m height in the proceeding days. By 1930 that same day, lava had covered most of the crater floor (an area of about 1,200,000 m2) and the lava lake had a depth of 10 m. A higher-elevation island that formed during the initial phase of the December 2020 eruption remained exposed, appearing darker in images, along with a ring of older lava around the lava lake that was active prior to December 2022. Overnight during 5-6 January the lava fountains continued to rise 5 m high, and the lava effusion rate had slowed.
On 6 January at 0815 HVO lowered the VAL to Watch and the ACC to Orange due to the declining effusion rates. Sulfur dioxide emission rates ranged from 3,000-12,500 tonnes per day (t/d), the highest value of which was recorded on 6 January. Lava continued to erupt from the vents during 6-8 January, although the footprint of the active area had shrunk; a similar progression has been commonly observed during the early stages of recent eruptions at Halema’uma’u. On 9 January HVO reported one dominant lava fountain rising 6-7 m high in the E half of the crater. Lava flows built up the margins of the lake, causing the lake to be perched. On 10 January the eastern lava lake had an area of approximately 120,000 m2 that increased to 250,000 m2 by 17 January. During 13-31 January several small overflows occurred along the margins of the E lake. A smaller area of lava was active within the basin in the W half of the crater that had been the focus of activity during 2021-2022. On 19 January just after 0200 a small ooze-out was observed on the crater’s W edge.
Activity during February 2023. Activity continued in the E part of Halema’uma’u crater, as well as in a smaller basin in the W part of the 2021-2022 lava lake (figure 527). The E lava lake contained a single lava fountain and frequent overflows. HVO reported that during the morning of 1 February the large E lava lake began to cool and crust over in the center of the lake; two smaller areas of lava were observed on the N and S sides by the afternoon. The dominant lava fountain located in the S part of the lava lake paused for roughly 45 minutes at 2315 and resumed by midnight, rising 1-2 m. At 0100 on 2 February lava from the S part was effusing across the entire E lava lake area, covering the crusted over portion in the center of the lake and continuing across the majority of the previously measured 250,000 m2 by 0400. A small lava pond near the E lake produced an overflow around 0716 on 2 February. On 3 February some lava crust began to form against the N and E levees, which defined the 250,000 m2 eastern lava lake. The small S lava fountain remained active, rising 1-6 m high during 3-9 February; around 0400 on 5 February occasional bursts doubled the height of the lava fountain.
A large breakout occurred overnight during 2100 on 4 February to 0900 on 5 February on the N part of the crater floor, equal to or slightly larger in size than the E lava lake. A second, smaller lava fountain appeared in the same area of the E lava lake between 0300 and 0700 on 5 February and was temporarily active. This large breakout continued until 7 February. A small, brief breakout was reported in the S of the E lava lake around midnight on 7 February. In the W lake, as well as the smaller lava pond in the central portion of the crater floor, contained several overflows during 7-10 February and intermittent fountaining. Activity at the S small lava pond and the small S lava fountain within the E lake declined during 9-10 February. The lava pond in the central portion of the crater floor had nearly continuous, expansive flows during 10-13 February; channels from the small central lava pond seemed to flow into the larger E lake. During 13-18 February a small lava fountain was observed in the small lava pond in the central portion of the crater floor. Continuous overflows persisted during this time.
Activity in the eastern and central lakes began to decline in the late afternoon of 17 February. By 18 February HVO reported that the lava effusions had significantly declined, and that the eastern and central lakes were no longer erupting. The W lake in the basin remained active but at a greatly reduced level that continued to decline. HVO reported that this decrease in activity is attributed to notable deflationary tilt that began early on the morning of 17 February and lasted until early 19 February. By 19 February the W lake was mostly crusted over although some weak lava flows remained, which continued through 28 February. The sulfur dioxide emission rates ranged 250-2,800 t/d, the highest value of which was recorded on 6 February.
Activity during March 2023. The summit eruption at Halema’uma’u crater continued at greatly reduced levels compared to the previous two months. The E and central vents stopped effusing lava, and the W lava lake remained active with weak lava flows; the lake was mostly crusted over, although slowly circulating lava intermittently overturned the crust. By 6 March the lava lake in the W basin had stopped because the entire surface was crusted over. The only apparent surface eruptive activity during 5-6 March was minor ooze-outs of lava onto the crater floor, which had stopped by 7 March. Several hornitos on the crater floor still glowed through 12 March according to overnight webcam images, but they did not erupt any lava. A small ooze-out of lava was observed just after 1830 in the W lava lake on 8 March, which diminished overnight. The sulfur dioxide emission rate ranged from 155-321 t/d on 21 March. The VAL was lowered to Advisory, and the ACC was lowered to Yellow (the second lowest on a four-color scale) on 23 March due to a pause in the eruption since 7 March.
Activity during April-May 2023. The eruption at Halema’uma’u crater was paused; no lava effusions were visible on the crater floor. Sulfur dioxide emission rates ranged from 75-185 t/d, the highest of which was measured on 22 April. During May and June summit seismicity was elevated compared to seismicity that preceded the activity during January.
Activity during June 2023. Earthquake activity and changes in the patterns of ground deformation beneath the summit began during the evening of 6 June. The data indicated magma movement toward the surface, prompting HVO to raise the VAL to Watch and the ACC to Orange. At about 0444 on 7 June incandescence in Halema’uma’u crater was visible in webcam images, indicating that a new eruption had begun. HVO raised the VAL to Warning and the ACC to Red (the highest color on a four-color scale). Lava flowed from fissures that had opened on the crater floor. Multiple minor lava fountains were active in the central E portion of the Halema’uma’u crater, and one vent opened on the W wall of the caldera (figure 528). The eruptive vent on the SW wall of the crater continued to effuse into the lava lake in the far SW part of the crater (figure 529). The largest lava fountain consistently rose 15 m high; during the early phase of the eruption, fountain bursts rose as high as 60 m. Lava flows inundated much of the crater floor and added about 6 m depth of new lava within a few hours, covering approximately 10,000 m2. By 0800 on 7 June lava filled the crater floor to a depth of about 10 m. During 0800-0900 the sulfur dioxide emission rate was about 65,000 t/d. Residents of Pahala (30 km downwind of the summit) reported minor deposits of fine, gritty ash and Pele’s hair. A small spatter cone had formed at the vent on the SW wall by midday, and lava from the cone was flowing into the active lava lake. Fountain heights had decreased from the onset of the eruption and were 4-9 m high by 1600, with occasional higher bursts. Inflation switched to deflation and summit earthquake activity greatly diminished shortly after the eruption onset.
At 0837 on 8 June HVO lowered the VAL to Watch and the ACC to Orange because the initial high effusion rates had declined, and no infrastructure was threatened. The surface of the lava lake had dropped by about 2 m, likely due to gas loss by the morning of 8 June. The drop left a wall of cooled lava around the margins of the crater floor. Lava fountain heights decreased during 8-9 June but continued to rise to 10 m high. Active lava and vents covered much of the W half of Halema’uma’u crater in a broad, horseshoe-shape around a central, uplifted area (figure 530). The preliminary average effusion rate for the first 24 hours of the eruption was about 150 cubic meters per second, though the estimate did not account for vesiculated lava and variations in crater floor topography. The effusion rate during the very earliest phases of the eruption appeared significantly higher than the previous three summit eruptions based on the rapid coverage of the entire crater floor. An active lava lake, also referred to as the “western lava lake” was centered within the uplifted area and was fed by a vent in the NE corner. Two small active lava lakes were located just SE from the W lava lake and in the E portion of the crater floor.
During 8-9 June the lava in the central lava lake had a thickness of approximately 1.5 m, based on measurements from a laser rangefinder. During 9-12 June the height of the lava fountains decreased to 9 m high. HVO reported that the previously active lava lake in the E part of the crater appeared stagnant during 10-11 June. The surface of the W lake rose approximately 1 m overnight during 11-12 June, likely due to the construction of a levee around it. Only a few small fountains were active during 12-13 June; the extent of the active lava had retreated so that all activity was concentrated in the SW and central parts of Halema’uma’u crater. Intermittent spattering from the vent on the SW wall was visible in overnight webcam images during 13-18 June. On the morning of 14 June a weak lava effusion originated from near the western eruptive vent, but by 15 June there were no signs of continued activity. HVO reported that other eruptive vents in the SW lava lake had stopped during this time, following several days of waning activity; lava filled the lake by about 0.5 m. Lava circulation continued in the central lake and no active lava was reported in the northern or eastern parts of the crater. Around 0800 on 15 June the top of the SW wall spatter cone collapsed, which was followed by renewed and constant spattering from the top vent and a change in activity from the base vent; several new lava flows effused from the top of the cone, as well as from the pre-existing tube-fed flow from its base. Accumulation of lava on the floor resulted in a drop of the central basin relative to the crater floor, allowing several overflows from the SW lava lake to cascade into the basin during the night of 15 June into the morning of 16 June.
Renewed lava fountaining was reported at the eruptive vent on the SW side of the crater during 16-19 June, which effused lava into the far SW part of the crater. This activity was described as vigorous during midday on 16 June; a group of observatory geologists estimated that the lava was consistently ejected at least 10 m high, with some spatter ejected even higher and farther. Deposits from the fountain further heightened and widened the spatter cone built around the original eruptive vent in the lower section of the crater wall. Multiple lava flows from the base of the cone were fed into the SW lava lake and onto the southwestern-most block from the 2018 collapse within Halema’uma’u on 17 June (figure 531); by 18 June they focused into a single flow feeding into the SW lava lake. On the morning of 19 June a second lava flow from the base of the eruptive cone advanced into the SW lava lake.
Around 1600 on 19 June there was a rapid decline in lava fountaining and effusion at the eruptive vent on the SW side of the crater; vent activity had been vigorous up to that point (figure 532). Circulation in the lava lake also slowed, and the lava lake surface dropped by several meters. Overnight webcam images showed some previously eruptive lava still flowing onto the crater floor, which continued until those flows began to cool. By 21 June no lava was erupting in Halema’uma’u crater. Overnight webcam images during 29-30 June showed some incandescence from previously erupted lava flows as they continued to cool. Seismicity in the crater declined to low levels. Sulfur dioxide emission rates ranged 160-21,000 t/d throughout the month, the highest measurement of which was recorded on 8 June. On 30 June the VAL was lowered to Advisory (the second level on a four-level scale) and the ACC was lowered to Yellow. Gradual inflation was detected at summit tiltmeters during 19-30 June.
Activity during July-August 2023. During July, the eruption paused; no lava was erupting in Halema’uma’u crater. Nighttime webcam images showed some incandescence from previously erupted lava as it continued to cool on the crater floor. During the week of 14 August HVO reported that the rate in seismicity increased, with 467 earthquakes of Mw 3.2 and smaller occurring. Sulfur dioxide emission rates remained low, ranging from 75-86 t/d, the highest of which was recorded on 10 and 15 August. On 15 August beginning at 0730 and lasting for several hours, a swarm of approximately 50 earthquakes were detected at a depth of 2-3 km below the surface and about 2 km long directly S of Halema’uma’u crater. HVO reported that this was likely due to magma movement in the S caldera region. During 0130-0500 and 1700-2100 on 21 August two small earthquake swarms of approximately 20 and 25 earthquakes, respectively, occurred at the same location and at similar depths. Another swarm of 50 earthquakes were recorded during 0430-0830 on 23 August. Elevated seismicity continued in the S area through the end of the month.
Activity during September 2023. Elevated seismicity persisted in the S summit with occasional small, brief seismic swarms. Sulfur dioxide measurements were relatively low and were 70 t/d on 8 September. About 150 earthquakes occurred during 9-10 September, and tiltmeter and Global Positioning System (GPS) data showed inflation in the S portion of the crater.
At 0252 on 10 September HVO raised the VAL to Watch and the ACC to Orange due to increased earthquake activity and changes in ground deformation that indicated magma moving toward the surface. At 1515 the summit eruption resumed in the E part of the caldera based on field reports and webcam images. Fissures opened on the crater floor and produced multiple minor lava fountains and flows (figure 533). The VAL and ACC were raised to Warning and Red, respectively. Gas-and-steam plumes rose from the fissures and drifted downwind. A line of eruptive vents stretched approximately 1.4 km from the E part of the crater into the E wall of the down dropped block by 1900. The lava fountains at the onset of the eruption had an estimated 50 m height, which later rose 20-25 m high. Lava erupted from fissures on the down dropped block and expanded W toward Halema’uma’u crater. Data from a laser rangefinder recorded about 2.5 m thick of new lava added to the W part of the crater. Sulfur dioxide emissions were elevated in the eruptive area during 1600-1500 on 10 September, measuring at least 100,000 t/d.
At 0810 on 11 September HVO lowered the VAL and ACC back to Watch and Orange due to the style of eruption and the fissure location had stabilized. The initial extremely high effusion rates had declined (but remained at high levels) and no infrastructure was threatened. An eruption plume, mainly comprised of sulfur dioxide and particulates, rose as high as 3 km altitude. Several lava fountains were active on the W side of the down dropped block during 11-15 September, while the easternmost vents on the down dropped block and the westernmost vents in the crater became inactive on 11 September (figure 534). The remaining vents spanned approximately 750 m and trended roughly E-W. The fed channelized lava effusions flowed N and W into Halema’uma’u. The E rim of the crater was buried by new lava flows; pahoehoe lava flows covered most of the crater floor except areas of higher elevation in the SW part of the crater. The W part of the crater filled about 5 m since the start of the eruption, according to data from a laser rangefinder during 11-12 September. Lava fountaining continued, rising as high as 15 m by the morning of 12 September. During the morning of 13 September active lava flows were moving on the N and E parts of the crater. The area N of the eruptive vents that had active lava on its surface became perched and was about 3 m higher than the surrounding ground surface. By the morning of 14 September active lava was flowing on the W part of the down dropped block and the NE parts of the crater. The distances of the active flows progressively decreased. Spatter had accumulated on the S (downwind) side of the vents, forming ramparts about 20 m high.
Vigorous spattering was restricted to the westernmost large spatter cone with fountains rising 10-15 m high. Minor spattering occurred within the cone to the E of the main cone, but HVO noted that the fountains remained mostly below the rim of the cone. Lava continued to effuse from these cones and likely from several others as well, traveled N and W, confined to the W part of the down-dropped block and the NE parts of Halema’uma’u. Numerous ooze-outs of lava were visible over other parts of the crater floor at night. Laser range-finder measurements taken of the W part of the crater during 14-15 September showed that lava filled the crater by 10 m since the start of the eruption. Sulfur dioxide emissions remained elevated after the onset of the eruption, ranging 20,000-190,000 t/d during the eruption activity, the highest of which occurred on 10 September.
Field crews observed the eruptive activity on 15 September; they reported a notable decrease or stop in activity at several vents. Webcam images showed little to no fountaining since 0700 on 16 September, though intermittent spattering continued from the westernmost large cone throughout the night of 15-16 September. Thermal images showed that lava continued to flow onto the crater floor. On 16 September HVO reported that the eruption stopped around 1200 and that there was no observable activity anywhere overnight or on the morning of 17 September. HVO field crews reported that active lava was no longer flowing onto Halema’uma’u crater floor and was restricted to a ponded area N of the vents on the down dropped block. They reported that spattering stopped around 1115 on 16 September. Nighttime webcam images showed some incandescence on the crater floor as lava continued to cool. Field observations supported by geophysical data showed that eruptive tremor in the summit region decreased over 15-16 September and returned to pre-eruption levels by 1700 on 16 September. Sulfur dioxide emissions were measured at a rate of 800 t/d on 16 September while the eruption was waning, and 200 t/d on 17 September, which were markedly lower compared to measurements taken the previous week of 20,000-190,000 t/d.
Geologic Background. Kilauea overlaps the E flank of the massive Mauna Loa shield volcano in the island of Hawaii. Eruptions are prominent in Polynesian legends; written documentation since 1820 records frequent summit and flank lava flow eruptions interspersed with periods of long-term lava lake activity at Halemaumau crater in the summit caldera until 1924. The 3 x 5 km caldera was formed in several stages about 1,500 years ago and during the 18th century; eruptions have also originated from the lengthy East and Southwest rift zones, which extend to the ocean in both directions. About 90% of the surface of the basaltic shield volcano is formed of lava flows less than about 1,100 years old; 70% of the surface is younger than 600 years. The long-term eruption from the East rift zone between 1983 and 2018 produced lava flows covering more than 100 km2, destroyed hundreds of houses, and added new coastline.
Information Contacts: Hawaiian Volcano Observatory (HVO), U.S. Geological Survey, PO Box 51, Hawai'i National Park, HI 96718, USA (URL: http://hvo.wr.usgs.gov/).
Tinakula (Solomon Islands) — December 2023 Cite this Report
Tinakula
Solomon Islands
10.386°S, 165.804°E; summit elev. 796 m
All times are local (unless otherwise noted)
Continued lava flows and thermal activity during June through November 2023
Tinakula is a remote 3.5 km-wide island in the Solomon Islands, located 640 km ESE of the capital, Honiara. The current eruption period began in December 2018 and has more recently been characterized by intermittent lava flows and thermal activity (BGVN 48:06). This report covers similar activity during June through November 2023 using satellite data.
During clear weather days (20 July, 23 September, 23 October, and 12 November), infrared satellite imagery showed lava flows that mainly affected the W side of the island and were sometimes accompanied by gas-and-steam emissions (figure 54). The flow appeared more intense during July and September compared to October and November. According to the MODVOLC thermal alerts, there were a total of eight anomalies detected on 19 and 21 July, 28 and 30 October, and 16 November. Infrared MODIS satellite data processed by MIROVA (Middle InfraRed Observation of Volcanic Activity) detected a small cluster of thermal activity occurring during late July, followed by two anomalies during August, two during September, five during October, and five during November (figure 55).
Geologic Background. The small 3.5-km-wide island of Tinakula is the exposed summit of a massive stratovolcano at the NW end of the Santa Cruz islands. It has a breached summit crater that extends from the summit to below sea level. Landslides enlarged this scarp in 1965, creating an embayment on the NW coast. The Mendana cone is located on the SE side. The dominantly andesitic volcano has frequently been observed in eruption since the era of Spanish exploration began in 1595. In about 1840, an explosive eruption apparently produced pyroclastic flows that swept all sides of the island, killing its inhabitants. Recorded eruptions have frequently originated from a cone constructed within the large breached crater. These have left the upper flanks and the steep apron of lava flows and volcaniclastic debris within the breach unvegetated.
Information Contacts: MIROVA (Middle InfraRed Observation of Volcanic Activity), a collaborative project between the Universities of Turin and Florence (Italy) supported by the Centre for Volcanic Risk of the Italian Civil Protection Department (URL: http://www.mirovaweb.it/); Hawai'i Institute of Geophysics and Planetology (HIGP) - MODVOLC Thermal Alerts System, School of Ocean and Earth Science and Technology (SOEST), Univ. of Hawai'i, 2525 Correa Road, Honolulu, HI 96822, USA (URL: http://modis.higp.hawaii.edu/); Copernicus Browser, Copernicus Data Space Ecosystem, European Space Agency (URL: https://dataspace.copernicus.eu/browser/).
Search Bulletin Archive by Publication Date
Select a month and year from the drop-downs and click "Show Issue" to have that issue displayed in this tab.
The default month and year is the latest issue available.
Bulletin of the Global Volcanism Network - Volume 37, Number 07 (July 2012)
Ijen (Indonesia)
2012 high seismicity, blasts, and subaqueous emissions; maps of complex
Ioto (Japan)
Mud ejections and small phreatic eruptions during early 2012
Kikai (Japan)
Low level tremor and frequent white plumes during October 2010-June 2012
Kirishimayama (Japan)
Gradual decline in activity following explosive 2011 eruptions
Obituary Notices (Unknown)
Death of volcanologist Herman Patia Principal Volcanologist at the Rabaul Volcano Observatory
Ruiz, Nevado del (Colombia)
1988-2006 monitoring captures seismic swarms, deformation, and radon emissions
Tongariro (New Zealand)
Seismicity preceded phreatic explosion; associated rainfall-fed lahar
Ijen
Indonesia
8.058°S, 114.242°E; summit elev. 2769 m
All times are local (unless otherwise noted)
2012 high seismicity, blasts, and subaqueous emissions; maps of complex
This report first documents earthquakes at or near Kawah Ijen and minor emissions within its crater lake during mid-December 2011 to mid-2012. These earthquakes and emissions were ongoing at press time.
The second and third subsections below present maps and background relating to the Ijen complex. As discussed in earlier reports, Ijen is the name often applied to the larger complex consisting of a large caldera and associated cones. Kawah Ijen is the name of the intracaldera cone that contains a crater with an acid briny lake 700 x 800 m in diameter. The coordinates cited in the header and Summary for this volcano refer to the approximate center of the lake (see photos of the lake in Photo Gallery and figure 4 in BGVN 32:02; Demelle and others, 2000; Takano and others, 2004). Kawah Ijen, the active vent of the complex, is known for hydrothermal and phreatic behavior in its crater lake. During this reporting interval an intrusion appears to have risen to a shallow depth beneath the crater lake. Subaqueous sulfur-bearing emissions seemingly occurred on the lake floor.
The last subsection briefly calls attention to sulfur mining near Kawah Ijen's crater lake. Laborers carry heavy loads of native sulfur across steep terrain as they breathe air rich in volcanic gases. Recent dental studies cited in this subsection compared the teeth and gums of laborers to residents living nearby who endured less exposure to the volcanic gases. They found that the laborers suffered more tooth and gum disorders.
Mid-December 2011 to mid-2012. According to a summary of activity by the Center for Volcanology and Geological Hazard Mitigation (CVGHM) and the USGS Volcano Disaster Assistance Program (VDAP), Ijen volcano has been in a state of heightened unrest centered at Kawah Ijen since May 2011, a time when teams installed, tested, and conducted training on the use of upgraded seismic instrumentation. As previously reported in BGVN 36:12, increased seismicity and fumarole temperatures caused CVGHM to raise the Alert Level from 1 to 2 (on a scale of 1-4) on 15 December 2011.
On 18 December, after observing further increases in both seismicity and degassing, CVGHM established Alert Level 3. In the next few months, scientists documented four periods of significant unrest. They occurred on 20 and 30 December 2011, 4 January 2012, and 2 March 2012.
On 1 January 2012, CVGHM recorded a swarm of earthquakes, raising concerns of renewed pressure in the then-inferred shallow magmatic system. The agency's reports also noted shifts in the rates of recent high-frequency earthquakes (believed to be associated with breaking rocks). Increases occurred in both low-frequency earthquakes and tremor (both believed to be associated with the movement of fluids). At the crater lake, debris (probably native sulfur) seen floating on the surface was judged as likely derived from emissions vented into the ~180-m-deep lake (Takano and others, 2004). Congruent with that interpretation, sulfurous-gas emissions measured just over the lake surface were very high at the time.
On 8 February 2012, after decreases in seismicity, and visual and thermal signs of unrest at Kawah Ijen, CVGHM lowered the Alert Level to 2.
Sharp increases in seismicity prevailed after 2 March 2012, which spurred CVGHM to raise the Alert Level to 3 on 12 March. Elevated crater lake temperatures (up to 43°C at 5 m depth) and gas plumes to 100-200 m above the summit had been reported. These observations led CVGHM and VDAP to suggest an intrusion of magma had reached the point where it caused perturbations to the extensive hydrothermal system in the shallow conduit and crater lake.
During 1-30 April 2012 white plumes from Kawah Ijen rose 100-200 m above the crater, and during 1-11 May diffuse white plumes rose 50-100 m above the crater. During this time and through 13 May, the amplitude and number of earthquakes gradually decreased and the crater lake water temperature decreased by 8°C. On 13 May 2012, CVGHM again lowered the Alert Level to 2. Later, on 24 July 2012, they again raised the Alert Level to 3. Authorities posted a 1.5-km-radius no-entry zone around the lake's center.
Visual and seismic observations published in CVGHM's report of 24 July 2012 indicated repeated hot air-blasts during 1-24 July. The blasts sent plumes rising to 50-100 m over the summit, and registered seismically as follows: 1-7 July, 8 blasts; 8-14 July, 12; 15-21 July, 40; and 22-24 July, 32. During those same intervals volcanic earthquakes occurred between 36 and 273 times per interval, with the maximum occurring during 15-21 July, the same interval as the largest number of air-blasts (but not the highest average rate of air blasts per day, which occurred during 22-24 July). Various other earthquake types were recorded in the same report. Although background seismicity typically had amplitudes in the range 0.5-5 mm, many of the larger amplitude air-blasts reached 20-40 mm with durations up to 18 seconds.
Maps, hazards, and Ijen's Merapi. The Ijen complex resides at the E end of Java just across the strait from Bali (figure 13, inset map). Kawah Ijen sits at the E end of the complex within the caldera (figure 13, main map).
Figures 14 and 15 illustrate foreseen hazardous areas and the regional context, including cities around the Ijen complex. The circles shown on both maps are centered around the Kawah Ijen cone and its crater lake.
Both figures 14 and 15 emphasize the attendant lahar hazards. Regarding floods and lahars, the crater lake at Kawah Ijen has a volume of ~30 million cubic meters, all or part of which could be expelled in an eruption or breakout due to crater-wall failure, an event that could send acidic brines down one or more of the drainages. About 5,000 people live within 10 km of the lake but farther away, many thousands more would be at risk in the event of large lahars.
The port cities to the N have a population of ~1.5 million and lie near the mouth of a river representing the main drainage from within the caldera, including the controlled outflow from the crater lake (figures 14 and 15).
As seen on a relief map (figure 16), Merapi (on the far E side of the caldera) forms the highest point in the complex, 2,799 m (and reflects the summit elevation value we typically provide for the complex). Merapi is the same name applied to the better-known, regularly erupting volcano in Central Java near the city of Yogyakarta. Another potential confusion is the volcano Marapi on the island of Sumatra.
Figure 16 shows the Kendeng mountains defining the caldera's arcuate topographic margin bounding the N (with elevations up to 1,559 m). The lowest point of the caldera's N rim (~850 m) occurs near Blawan village at the breach in the caldera wall. Starting at the SE, the major cones on or near the S margin (on this map) are Merapi (2,799 m, and on its flanks, Kawah Ijen at 2,386 m), Rante, and the closely spaced Pendil Djampit.
Just N of Pendil Djampit lies a fault with offset down towards the caldera (figure 17). It trends NW and curves to the N, helping to establish the path of the inferred SW caldera margin (figure 13).
A separate volcano in the GVP database, Raung (Raoeng) stratovolcano (3,332 m), forms a distant topographic feature well to the W of the flat caldera floor and SW boundary (figures 13, 16, and 17). As here defined, Raung includes two other remote cones as subfeatures. One is the cone located to Raung's NE, Soeket (Suket) stratovolcano (2,950 m). Both Suket and Raung lie along the western topographic divide for the drainage basin that feeds into the Ijen complex.
Model of the crater-lake system. Given the recent concerns about activity in Kawah Ijen's crater lake, a simple model of the shallow crust in this area provides a way to help visualize conditions and processes in the subsurface. Figure 18 shows the general situation as put forth in a simple sketch by Alain Bernard (van Bergen and others, 2000).
van Bergen and others (2000) made the following remarks: "The lake chemistry is determined by dissolution of magmatic volatiles, fluid-rock interaction, evaporation of the lake water, dilution by meteoric water and recycling of lake water through seepage into the subsurface hydrothermal system. The lake acts as [a] chemical condenser for volatiles and as a calorimeter trapping heat supplied by a shallow magmatic reservoir. Magmatic volatiles can be supplied to the crater lake system by direct injection of magmatic vapours (SO2, H2S, HCl, and HF) via subaqueous fumaroles or via hot brines entering at the lake bottom."
van Hinsberg and others (2010) stated the following: "The crater lake of Kawah Ijen volcano represents the largest body of natural hyperacidic brine in the world (Delmelle and Bernard, 1994) and has been present since at least 1789 (cf. Bosch, 1858). It is characterised by a singularly high dissolved element load (>100 g/L) and very low pH. Fluids from the crater lake seep through [Kawah Ijen's] western flank to form the acid Banyu Pahit river, the water of which is eventually used for irrigation 40 km downstream [to the N] of the lake in the coastal plain of Asambagus."
Sulfur mining. A strongly active solfatara field (fumaroles that are characteristically sulfurous) is present in the SE part of Kawah Ijen's crater near the lakeshore, where sulfur-mining activities have existed for many decades (see figure 8 in BGVN 32:09). Local workers channel some of the fumarolic gases and molten condensates through pipes and out onto the ground. Once the liquid cools and hardens, workers break the solid sulfur into large pieces and load it into baskets for manual transport out of the crater. According to Wikipedia, miners carry loads of sulfur ore blocks ranging from 75 to 90 kg up a steep trail to the crater rim and then 3 km down the mountain to a weighing station. That and many other web sites show photos of the mining process. Among the more recent photos of the scene are those by Oliver Grunewald (2010) on the 'boston.com' web site. He points out that few of the miners possess gas masks.
Two dental studies of miners concluded that they had both higher incidence of dental erosion to the enamel on their teeth (Pranani and Wibisono, 2008) and the gum disease gingivitis (Anitasari and Wibisono, 2008). Both studies attribute these problems to exposure to sulfuric acid fumes. The studies were small (30 miners) and for comparison (control groups) used similar numbers of residents who lived around the mine but did not work as miners.
References. Anitasari, S. and Wibisono, G., 2008, Relationship between the length of sulphuric acid fumes exposure and the grade of gingivitis, Studies on the Sulphur Miners at Mount Ijen Banyuwangi East Java, Fakultas Kedokteran, Disusun oleh:NIM: G2A004170, Fakultas Kedokteran, Universitas Diponegoro, Semaran, 18 pp.
Bosch, C.J., 1858. Uitbarstingen der vulkanen Idjin en Raun (Banjoewangi). Tijdschrift voor Indische Taal-, Land- en Volkenkunde, Deel 7, 265–286.
Delmelle, P., Bernard, A., Kusakabe, M., Fischer, T.P., and Takanod, B., 2006, Geochemistry of the magmatic–hydrothermal system of Kawah Ijen volcano, East Java, Indonesia, J. of Volcanology and Geothermal Research, Vol. 97, Issues 1-4, April 2000, pp. 31-53.
Grunewald, O., 2010, Kawah Ijen at night, Updated 8 December 2010, Accessed 7 Sept 2012 (URL: http://www.boston.com/bigpicture/2010/12/kawah_ijen_by_night.html).
Topogr. Dienst, 1937, Atlas van Tropisch Nederland, original reproduced on Wikipedia Commons web site (http://commons.wikipedia.org/wiki/File:Ijen.JPG) entitled 'Ijen', Updated 17 June 2012, Accessed 29 August 2012.
Mulyana, A.R., Effendi, W., Karim, A., and Rukada, T., 2006, [Ijen hazards map, figure 14 (further citation details currently unavailable)].
Pranani, D. and Wibisono, G., 2008, The influence of sulphuric acid fumes exposure on the incidence of dental erosion, Study on sulphuric miner in Mount Ijen, Banyuwangi, East Java, Dyah Pranani, NIM: G2a004055, Fakultas Kedokteran, Universitas Diponegoro Semarang, 18 pp.
Takano, B., Suzuki, K., Sugimori, K., Ohba, T., Fazlullin, S.M., Bernard, A., Sumarti, S., Sukhyar, R., and Hirabayashi, M., 2004, Bathymetric and geochemical investigation of Kawah Ijen Crater Lake, East Java, Indonesia, J. of Volcanology and Geothermal Research, vol. 135, Issue 4, pp. 299–329.
van Bergen, M.J., Bernard, A., Sumarti, S., Sriwana, T., and Sitorus, K., 2000, Crater lakes of Java: Dieng, Kelud and Ijen, Excursion Guidebook, IAVCEI General Assembly, Bali 2000, 43 p.
van Hinsberg, V., Berlo, K., and van Bergen, M.J., 2010, Extreme alteration by hyperacidic brines at Kawah Ijen volcano, East Java, Indonesia: I. Textural and mineralogical imprint, J. of Volcanology and Geothermal Research, Vol. 198, Issues 1–2, pp. 253–263.
Geologic Background. The Ijen volcano complex at the eastern end of Java consists of a group of small stratovolcanoes constructed within the 20-km-wide Ijen (Kendeng) caldera. The north caldera wall forms a prominent arcuate ridge, but elsewhere the rim was buried by post-caldera volcanoes, including Gunung Merapi, which forms the high point of the complex. Immediately west of the Gunung Merapi stratovolcano is the historically active Kawah Ijen crater, which contains a nearly 1-km-wide, turquoise-colored, acid lake. Kawah Ijen is the site of a labor-intensive mining operation in which baskets of sulfur are hand-carried from the crater floor. Many other post-caldera cones and craters are located within the caldera or along its rim. The largest concentration of cones forms an E-W zone across the southern side of the caldera. Coffee plantations cover much of the caldera floor; nearby waterfalls and hot springs are tourist destinations.
Information Contacts: Center of Volcanology and Geological Hazard Mitigation (CVGHM), Jalan Diponegoro 57, Bandung 40122, Indonesia (URL: http://www.vsi.esdm.go.id/); Volcano Disaster Assistance Program (VDAP), US Geological Survey (USGS), 1300 SE Cardinal Court, Bldg. 10, Suite 100, Vancouver, WA 98683.
Ioto
Japan
24.751°N, 141.289°E; summit elev. 169 m
All times are local (unless otherwise noted)
Mud ejections and small phreatic eruptions during early 2012
This report first briefly notes an article discussing deformation at Ioto (also called Iwo-jima), an island located within a submerged caldera ~1,200 km S of Tokyo. Ozawa and others (2007) discuss both complex deformation measured during 2006-2007 and the extremely high rate of uplift during the last few hundred years. The rest of this report is devoted to observations by the Japan Meteorological Association (JMA) and other agencies at Ioto during October 2010 to May 2012, including more deformation, small emissions of hot mud and steam, and discolored seawater that suggested a NE flank submarine eruption.
Our previous report on Ioto (Iwo-jima), discussed a submarine eruption off the SE coast that occurred in September 2001, and a small phreatic eruption at Idogahama, a beach on the NW coast of the island, in October 2001 (BGVN 26:09). Ioto is mildly seismically active with many fumaroles and occasional phreatic explosions, but the volcano has not experienced a magmatic eruption in 400 years (Newhall and Dzurisin, 1988; Lowenstern and others, 2006; Yokoyama and Nazzaro, 2002; and Ukawa and others, 2006).
The locations of the major volcanoes of Japan, including the island of Ioto, are shown in figure 5. Figure 6 is a map of Ioto, summarizing its topography and past eruption sites.
Deformation. Ozawa and others (2007) noted that the overall pattern of deformation seen in the last several hundred years averaged to ~0.25 m of uplift per year, but often exceeded uplift rates of 1 m per year. They plotted uplift and subsidence during January 2006-late 2007 from satellite radar interferometry. Concluding that the deformation pattern is very complicated both spatially and temporally, the authors noted that "In August of 2006, subsidence which had continued from 2003 rapidly changed to uplift, and an increase of seismicity was also observed simultaneously." They divided the uplift during August 2006-late 2007 into 3 stages. The authors used gravity and magnetic data to constrain the shape of the shallow intruding magma under the island's main edifice (Motoyama, also spelled Moto-yama) centered in the bulbous NE portion of the island (figure 6). They described the intruding magma body as having a funnel shape, narrowing towards the bottom and centered about the main topographic high. The authors' modeling suggested that the block of material trapped within the funnel was variously displaced during each of the deformation stages, shifting the block depending on where the magma pooled.
JMA reports. The following material summarizes activity from October 2010 to May 2012, based on monthly volcanic activity reports from JMA. JMA reports on Ioto between November 2001 and September 2010 are not available in English; translations into English resumed in October 2010.
In October 2010, Japan's National Research Institute for Earth Science and Disaster Prevention (NIED) reported that seismicity remained at a low level. GPS observations by the Geospatial Information Authority of Japan (GSI) indicated that an episode of uplift that had ceased around October 2009 resumed in May 2010. N-S baseline displacement (extension) accelerated during late September-early October 2010, accompanied by an eastward deformation in the central part of the island. The uplift slowed after mid-November 2010. This upheaval followed one that occurred during August 2006-October 2009.
During 29-30 January 2011, aerial observations were conducted in cooperation with the Japan Maritime Self-Defense Force (JMSDF). No change in the distribution of thermal anomalies or emissions was detected since the last observation in July 2010.
According to NIED and GSI, both shallow seismicity and the rate of uplift at Ioto increased in February 2011 and continued through at least January 2012. GPS measurements showed a rapid southward displacement at the S part of island. Moreover, between 26 August and 2 September 2011, a local westward displacement was observed SW and SE of Motoyama.
A field survey during 16-18 November 2011 revealed that the water level in Asodai crater (along the fault of the same name, figure 6) had risen compared with the last observation during 29-30 January 2011. The temperature of the muddy water at the bottom of the pit was estimated to be ~100°C, the same as that observed in January 2011. Associated discharges reached a maximum height of 20 m above the crater. No change in the distribution of thermal anomalies or emissions was detected since the last observation in January 2011.
On 10 February 2012, JMSDF reported a mud ejection at an old crater (another depression along the Asodai fault, a spot sometimes called "Million Dollar Hole"). According to field surveys on 14 and 15 February, three major ejection sites were aligned in the N-S direction, the deepest being about 13 m. Mud was ejected to distances of up to 100 m NE of the main vent. No seismicity was observed to be associated with this event, but JMA believed a very small phreatic explosion probably occurred during early February. The maximum temperature of the mud was 96.6°C. Another mud ejection occurred on 7 March in the same area, and mud was ejected up to 60 m WNW. Ash emissions also rose from Asodai, but not from Idogahama.
During another field survey from 7 to 9 March 2012, further mud ejections were noted from the same area as the previous events on the island's W side. In addition, a very small phreatic eruption was noted, with tremor (90-minute duration) and intermittent ejections of steam plumes, mud, and small rocks. Emissions rose 20 m above the crater, and small amounts of ash rose more than 10 m and scattered within 20 m in every direction. During that time, the water level in Asodai crater was higher than that observed during the 16-18 November observation.
During 5-6 April 2012, volcanic tremor and intermittent earthquakes were recorded, and two apparently very small phreatic eruptions were reported. This was accompanied by intermittent noises and emissions at the old crater to the W of the island. According to GSI, ground deformation and seismic activity were greater than usual during 27-28 April, but both subsided after 4 May.
During 29-30 April, the ocean NE of the island was discolored, suggesting an offshore underwater eruption. An aerial observation conducted by the Japan Coast Guard (JCG) on 16 May revealed that discoloration persisted, but in smaller areas. On the N part of the island, steam plumes rose to heights of up to 10 m on 30 April.
During May 2012, ground deformation was almost static. Seismic activity diminished, and no volcanic tremors were observed. Based on camera monitoring, emissions from Asodai crater were low, and no emissions were noted in Idogahama.
References. Lowenstern, J.B., Smith, R.B., and Hill, D.P., 2006, Monitoring super-volcanoes: geophysical and geochemical signals at Yellowstone and other large caldera systems, Phil. Trans. R. Soc. A 364, p. 2055-2072.
Yokoyama, I., and Nazzaro, A., 2002, Anomalous crustal movements with low seismic efficiency-Campi Flegrei, Italy and some examples in Japan, Annals of Geophysics, v. 45, no. 6, p. 709-722.
Newhall, C.G., and Dzurisin, D., 1988, Historical unrest at large calderas of the world, U.S. Geological Survey Bulletin 1855: 1108 p, 2 vol, pgs. 509-520.
Ukawa, M., Fujita, E., Ueda, H., Kumagai, T., Nakajima, H., and Morita, H., 2006, Long-term geodetic measurements of large scale deformation at Iwo-jima caldera, Japan, J. of Volcanology and Geothermal Research, v. 150, p. 98-118.
Ozawa, T., Ueda, H., Ukawa, M., and Miyazaki, S., 2007, Temporal change in crustal deformation related to volcanic activity of Iwo-jima observed by PALSAR/InSAR, Proceedings of the First Joint PI Symposium of ALOS, Data Nodes for ALOS Science Program (DIS 10).
Geologic Background. Ioto, in the Volcano Islands of Japan, lies within a 9-km-wide submarine caldera. The volcano is also known as Ogasawara-Iojima to distinguish it from several other "Sulfur Island" volcanoes in Japan. The triangular, low-elevation, 8-km-long island narrows toward its SW tip and has produced trachyandesitic and trachytic rocks that are more alkalic than those of other volcanoes in this arc. The island has undergone uplift for at least the past 700 years, accompanying resurgent doming of the caldera; a shoreline landed upon by Captain Cook's surveying crew in 1779 is now 40 m above sea level. The Motoyama plateau on the NE half of the island consists of submarine tuffs overlain by coral deposits and forms the island's high point. Many fumaroles are oriented along a NE-SW zone cutting through Motoyama. Numerous recorded phreatic eruptions, many from vents on the W and NW sides of the island, have accompanied the uplift.
Information Contacts: Japan Meteorological Agency (JMA), Otemachi, 1-3-4, Chiyoda-ku Tokyo 100-8122, Japan (URL: http://www.jma.go.jp/); Japan’s National Research Institute for Earth Science and Disaster Prevention (NIED), 3-1, Tennodai, Tsukuba, Ibaraki, 305-0006, Japan (URL: http://www.bosai.go.jp/e/); Geospatial Information Authority of Japan (GSI) (URL: http://www.gsi.go.jp/ENGLISH/); Japan Maritime Self-Defense Force (JMSDF) (URL: http://www.mod.go.jp/msdf/formal/english/index.html); Japan Coast Guard (JCG) (URL: http://www.kaiho.mlit.go.jp/e/index_e.htm).
Kikai
Japan
30.793°N, 130.305°E; summit elev. 704 m
All times are local (unless otherwise noted)
Low level tremor and frequent white plumes during October 2010-June 2012
Kikai was the scene of ongoing steaming and modest seismic unrest during October 2010-June 2012. As background, Kikai (also called Satsuma-Iwo-jima and Tokara-Iwo-jima), an island on the NW rim of the submerged Kikai caldera (figure 1), experienced chiefly low-level seismicity between 2002 and 2004 punctuated by stronger earthquakes and tremor, and three small eruptions during May-June 2002, June-August 2003, and March-September 2004 (BGVN 28:04 and 30:07). Almost daily plumes, most of which were white, occurred between late 2002 and at least January 2005 (BGVN 30:07).
Recent monthly reports of volcanic activity from the Japan Meteorological Agency (JMA) translated into English resumed in October 2010. Thus, in this report, we lack JMA reports between January 2005 and September 2010 and only summarize and tabulate activity after October 2010 and as late as June 2012.
In an effort to gather other information, we searched for MODVOLC thermal alerts at Kikai and found none during January 2005 to late September 2012. Only one alert appeared in the past decade. That weak alert occurred on 2 August 2003 at a point along the coast well to the NE of the crater. This was unlikely the result of eruptive causes owing to the location and extended absence of alerts at the crater and dome. Near-source thermal photography (noted by JMA and mentioned below) revealed subtle thermal anomalies suggesting elevated temperatures over parts of the dome.
According to JMA, seismicity was relatively low during October 2010-June 2012. Slight increases occurred during 28-31 October 2010 and on 21 August 2011 (Table 3). White-plumes appeared at Iodake summit crater, and their size remained above background throughout the reporting period (Table 3). An occasional night-time glow was visible with a high-sensitivity camera, during at least January-April 2011, July-August 2011, February 2012, and May-June 2012.
Table 3. Monthly summary of seismicity and plume observations at Kikai during October 2010-June 2012. All reported plumes were described as white. All reported volcanic tremor was of small amplitude and short duration. Seismicity in October 2010 was low (as shown) except for occasional increases on 28, 30 and 31 October. The tremor during February 2011 was the first to occur since February 2010. '-' indicates data not reported. Data courtesy of JMA.
| Date |
Number of tremor events |
Number of earthquakes ("low" through June 2011) |
Avg. plume height (maximum height) above Iodake crater (m) |
| Oct 2010 |
0 |
Low |
-- (--) |
| Nov 2010 |
0 |
Low |
200 (300) |
| Dec 2010 |
0 |
Low |
100 (300) |
| Jan 2011 |
0 |
Low |
100 (300) |
| Feb 2011 |
1 |
Low |
100 (300) |
| Mar 2011 |
1 |
Low |
|
| Apr 2011 |
1 |
Low |
|
| May 2011 |
1 |
Low |
|
| Jun 2011 |
1 |
Low |
|
| Jul 2011 |
8 |
202 |
|
| Aug 2011 |
0 |
244 |
|
| Sep 2011 |
0 |
119 |
|
| Oct 2011 |
2 |
169 |
|
| Nov 2011 |
0 |
159 |
-- (600) |
| Dec 2011 |
0 |
167 |
-- (300) |
| Jan 2012 |
0 |
209 |
-- (300) |
| Feb 2012 |
0 |
189 |
-- (200) |
| Mar 2012 |
1 |
201 |
-- (400) |
| Apr 2012 |
1 |
126 |
-- (300) |
| May 2012 |
0 |
212 |
-- (600) |
| Jun 2012 |
1 |
204 |
-- (300) |
Aerial infrared observations on 14 December 2010 and during November-December 2011 found that the distribution of thermal anomalies in the crater had not changed since previous observations in April 2008 and on 22 December 2009. In addition, according to the Japanese Coast Guard, the summit crater did not visibly change between observations on 22 October 2010 and 19 January 2011. According to a field survey on 26 November 2011, the sulfur-dioxide flux averaged 800 tons per day. In December 2011, discolored water, apparently caused by volcanic activity, was observed near the coast. No remarkable crustal change was observed by GPS during Janurary 2012-June 2012.
The journal Earth, Planets and Space produced an edition in 2002 with 16 articles devoted to Kikai caldera, Satsuma-Iwo-jima, and related topics (Shinohara and others, 2002). A video entitled "Satsuma-Iwojima, Japan" uploaded to Youtube in September 2008 shows a steaming fumarole with bright yellow (sulfur?) incrustations (str4hler, 2008).
References. Maeno, F. and Imamura, F., 2007, Numerical investigations of tsunamis generated by pyroclastic flows from the Kikai caldera, Japan, Geophysical Research Letters, Vol. 34, L23303 (DOI: 10.1029/2007GL031222).
Shinohara, H., Iguchi, M., Hedenquist, J.W., and Koyaguchi, T., 2002, Preface to special volume, Earth, Planets and Space, Vol. 54 (No. 3), pp. 173-174.
str4hler, 2008, [Video] Satsuma-Iwojima, Japan. Accessed 21 September 2012, uploaded to Youtube on 16 September 2008 (URL: http://www.youtube.com/watch?v=jyIhaEQAPlw).
Geologic Background. Multiple eruption centers have exhibited recent activity at Kikai, a mostly submerged, 19-km-wide caldera near the northern end of the Ryukyu Islands south of Kyushu. It was the source of one of the world's largest Holocene eruptions about 6,300 years ago when rhyolitic pyroclastic flows traveled across the sea for a total distance of 100 km to southern Kyushu, and ashfall reached the northern Japanese island of Hokkaido. The eruption devastated southern and central Kyushu, which remained uninhabited for several centuries. Post-caldera eruptions formed Iodake (or Iwo-dake) lava dome and Inamuradake scoria cone, as well as submarine lava domes. Recorded eruptions have occurred at or near Satsuma-Iojima (also known as Tokara-Iojima), a small 3 x 6 km island forming part of the NW caldera rim. Showa-Iojima lava dome (also known as Iojima-Shinto), a small island 2 km E of Satsuma-Iojima, was formed during submarine eruptions in 1934 and 1935. Mild-to-moderate explosive eruptions have occurred during the past few decades from Iodake, a rhyolitic lava dome at the eastern end of Satsuma-Iojima.
Information Contacts: Japan Meteorological Agency (JMA), Otemachi, 1-3-4, Chiyoda-ku Tokyo 100-8122, Japan (URL: http://www.jma.go.jp/); MODVOLC, Hawai’i Institute of Geophysics and Planetology (HIGP), MODVOLC Thermal Alerts System, School of Ocean and Earth Science and Technology (SOEST), Univ. of Hawai’i, 2525 Correa Road, Honolulu, HI 96822, USA (URL: http://modis.higp.hawaii.edu/).
Kirishimayama (Japan) — July 2012 Cite this Report
Kirishimayama
Japan
31.934°N, 130.862°E; summit elev. 1700 m
All times are local (unless otherwise noted)
Gradual decline in activity following explosive 2011 eruptions
The early 2011 eruption of Shinmoe-dake (Shinmoedake) volcano of the Kirishima Volcanic Group was characterized by sub-Plinian and Vulcanian explosions and an ~600-m-diameter lava dome that was extruded into the crater (BGVN 35:12 and 36:07, reports covering through July 2011). Fewer eruptions occurred during an ensuing decline in activity, where plumes only rose to up to 1 km above the summit. No explosions (defined as accompanying an air shock larger than 20 Pa and explosive earthquake signals) were reported by the Japan Meteorological Agency (JMA) after 11 May 2011 and through June 2012. This report discusses diminishing plume emissions and seismicity during September 2011-June 2012, and supplies more context on the entire eruptive episode. The material in this report is based on JMA monthly reports, which are now available in English with coverage starting in October 2010.
2011 eruption wanes. After the explosive eruptions during January-February 2011, eruptions (ash emissions) at Shinmoe-dake occurred through 7 September 2011. After that, JMA reported no further eruptions at least through June 2012; gas-and-steam plumes rose to a maximum of ~600 m above the crater of Shinmoe-dake after 7 September 2011 (figure (18).
Elevated seismicity continued following the cease of explosive eruptions in May 2011, but a substantial protracted decline too place during August-November 2011. In May and June 2012, JMA reported that seismicity had returned to background levels seen prior to the onset of the early 2011 explosive activity, and they reported an absence of measured tremor over the same two months (figures 18 and 19).
JMA reported that GPS baseline extension indicated "magma supply to a deeper chamber several kilometers northwest of the crater" through December 2011; the baseline extension slowed after December. JMA initially reported almost no change after January 2012, but during June 2012 the baseline distance between Ebino (~16 km NNW) and Makizono (~14 km WSW) shortened.
Observation flights conducted through various collaborations between the Japan Ground, Air, and Maritime Self-Defense Forces (JGSDF, JASDF, and JMSDF, respectively) and the Ministry of Land, Infrastructure, Transportation and Tourism (MLIT) allowed frequent aerial photography and infrared thermal measurements of the crater and edifice of Shinmoe-dake. The diameter of the lava dome within the crater remained ~600 m as of June 2012 (indicating little-to-no growth since 30 January 2011). Infrared thermal photography revealed little thermal structure to the dome, but highlighted comparatively high-temperature areas at its margins. A fissure (described as a "crack" by JMA) located on the W slope of the edifice was occasionally reported to emit plumes, and exhibited an elevated temperature compared with the rest of the edifice (figure 20). Similar aerial and thermal observations were reported as late as 10 May 2012.
The Alert Level remained at 3 (on a scale from 1-5) at the end of June 2012.
Geologic Background. Kirishimayama is a large group of more than 20 Quaternary volcanoes located north of Kagoshima Bay. The late-Pleistocene to Holocene dominantly andesitic group consists of stratovolcanoes, pyroclastic cones, maars, and underlying shield volcanoes located over an area of 20 x 30 km. The larger stratovolcanoes are scattered throughout the field, with the centrally located Karakunidake being the highest. Onamiike and Miike, the two largest maars, are located SW of Karakunidake and at its far eastern end, respectively. Holocene eruptions have been concentrated along an E-W line of vents from Miike to Ohachi, and at Shinmoedake to the NE. Frequent small-to-moderate explosive eruptions have been recorded since the 8th century.
Information Contacts: Japan Meteorological Agency (JMA), Otemachi, 1-3-4, Chiyoda-ku Tokyo 100-8122, Japan (URL: http://www.jma.go.jp/); Japan Ground Self-Defense Force (JGSDF) (URL: http://www.mod.go.jp/gsdf/english/index.html); Japan Air Self-Defense Force (JASDF) (URL: http://www.mod.go.jp/asdf/English_page/organization/formation01/); Japan Maritime Self-Defense Force (JMSDF) (URL: http://www.mod.go.jp/msdf/formal/english/index.html); Ministry of Land, Infrastructure, Transportation and Tourism (MLIT) (URL: http://www.mlit.go.jp/en/index.html).
Obituary Notices (Unknown) — July 2012 Cite this Report
Obituary Notices
Unknown
Unknown, Unknown; summit elev. m
All times are local (unless otherwise noted)
Death of volcanologist Herman Patia Principal Volcanologist at the Rabaul Volcano Observatory
One of the first homegrown volcanologists in Papua New Guinea (PNG), Herman Patia (figure 1), grew up the youngest of nine children in Gunanba, a village at the Eastern end of New Britain Island and S of Rabaul caldera. He died on 18 June 2012, two days short of his 50th birthday, in Rabaul Town after a month of unstated illness (Itikarai, 2012, which this obituary summarizes). Patia completed all his early schooling through his BS degree in PNG. He completed an MS degree at the Australian National University with a thesis on Rabaul’s petrology and geochemistry (Patia, 2004). He continued to write papers, including co-authorship on the workshop report cited below (Johnson and others, 2010).
Patia began work at Rabaul Volcano Observatory (RVO) in 1986 and rose to the position of Principal Volcanologist. RVO monitors the country’s 57 known Holocene volcanoes, some of which are quite active and close to settlements. Like many scientists working at volcano observatories, Patia’s contributions were multifaceted, spanning from research and publishing to volcano monitoring, and from mapping and hazards assessment to raising community awareness. PNG volcanoes draw international interest, and visitors recall benefitting from Herman’s advice and assistance. He was widely known as someone with both technical competence as well as an amiable, good-natured disposition.
More than once, duty dictated an immediate response to a sudden crisis, putting Patia in situations that could entail considerable risk. For example, in responding to a crisis at Langila in the early 1990’s, he and his then RVO colleague Patrice de Saint Ours survived a close call while monitoring behavior at the summit. A sudden explosion discharged incandescent lava fragments at close range. They escaped by running down the volcano’s ash- and scoria-covered flank, hot lava fragments burning holes in Patia’s backpack.
References. Itikarai, I., 2012, Patia parts with his volcanoes, Papua New Guinea Weekend Online Courier, June 2012.
Johnson, R.W., Itikarai, I., Patia, H., and McKee, C., 2010, Rabaul Volcano Workshop Report; Volcanic systems of the Northeastern Gazelle Peninsula, Papua New Guinea: synopsis, evaluation, and a model for Rabaul volcano, Rabaul Observatory Twinning Program, Dept. Of Mineral Policy and Geohazards Management (DMPGM), Government. of Papua New Guinea and Australian Agency for International Development (AusAID), Australian Government, 84 p., ISBN 978-1-921672-89-7.
Keith-Reid, R., 2007, Profile: Detecting Volcanoes-Meet volcanologist Herman Patia, Islands Business International.
Patia, H., 2004, Petrology and geochemistry of the recent eruption history at Rabaul Caldera, Papua New Guinea: implications for magmatic processes and recurring volcanic activity. Unpubl. Masters of Philosophy thesis, Australian National University, Canberra, 111 pp. (Available at https://digitalcollections.anu.edu.au/handle/1885/7345).
Geologic Background. Obituary notices for volcanologists are sometimes written when scientists are killed during an eruption or have had a special relationship with the Global Volcanism Program.
Information Contacts:
Nevado del Ruiz (Colombia) — July 2012 Cite this Report
Nevado del Ruiz
Colombia
4.892°N, 75.324°W; summit elev. 5279 m
All times are local (unless otherwise noted)
1988-2006 monitoring captures seismic swarms, deformation, and radon emissions
Our last report on Nevado del Ruiz (BGVN 27:05) focused on a swarm of earthquakes that occurred in June 2002, when the Instituto Colombiano de Geología y Minería (INGEOMINAS) raised the Alert Level to II ("Orange", on a scale from I-IV, where the highest Alert Level is I, "Red"). Monthly reports from the INGEOMINAS Manizales Observatory became available online beginning in March 2006 and continued through the time period covered in this report, March-December 2006. We also include the long-term datasets of deformation recorded from 1988 to 2006 and radon-gas monitoring from 2002 to 2006.
INGEOMINAS characterized overall activity at Nevado del Ruiz from March to December 2006 as limited to small earthquakes, minor rockfalls, and intermittent vapor plumes. They measured continuous deformation trends (primarily from 3 tilt stations), and low levels of radon-gas emissions with a peak in March 2006 at two stations. No Alert Level was defined for this time period.
Seismicity during 2006. INGEOMINAS reported that low seismicity generally prevailed from March through December 2006; 217-673 events occurred per month at depths of 6-10 km below the summit with maximum local magnitudes of 0.95-2.3. Long period (LP) events occurred slightly more often than volcano-tectonic (VT) events; 1-5 hybrid events were detected each month except in December when these events were absent. Tremor was recorded only once in September and twice in October.
Two small VT earthquake swarms were recorded, one in March and the other in May. The swarm on 9 March occurred as a cluster of events 2-4 km deep centered to the SE of the crater (figure 49). The swarm on 29 May was characterized by ~20 events located SE of the crater with magnitudes less than 1.02.
Rockfalls, ice movement, and debris flows were also detected by the seismic network from March to December 2006. For these kinds of events, typically more than 250-600 per month were detected; however, fewer events were detected in April and June, 61 and 47 events respectively.
Vapor plumes in 2006. During most of 2006 vapor plumes were visible from the summit area of Nevado del Ruiz. Often appearing intermittently, these plumes were white or white-to-gray colored and reached 100-600 m over the crater rim. Plume emissions have been associated with the fumaroles within the summit crater.
Deformation summary. The deformation network at Nevado del Ruiz in March 2006 contained 12 dry tiltmeter stations (Piraña, Rubí, Bis, Molinos, Tumbas, Refugio, Nereidas, Pequeño, Pijao, Arenales, Alfombrales, and Recio) and four stations for leveling campaigns (Piraña, Bis, Tumbas, and Nereidas; figure 50). This network was developed to cover the W and N flanks; the S and E flanks did not have network coverage during this reporting period. Fieldwork was planned to include leveling at sites Arenales, Alfombrales, and Recio since they had not been occupied for several years. Four tilt stations showed inflation and deflation trends (Bis, Nereidas, Refugio, and Tumbas) and are discussed in the text below.
Tilt station Bis was established in late 1988 on the NW flank ~5.7 km NW of the active crater (figure 50). As seen on figure 51, inflation had been recorded at Bis from 1988 through 1999 with a cumulative tilt increase of as much as 40-60 microradians (µrad; figure 51). Since the beginning of 2000 until the end of 2004, this station recorded stable conditions with a small amount (4 µrad) of inflation. From 2004 through March 2006 there was another significant increase in the inflation trend; a cumulative 22 µrad N component and 15 µrad E component inflation.
Tilt station Nereidas was installed 4.6 km SW of the active crater and measured significant changes primarily from late March 1993 to March 2006. Inflation and deflation trends were recorded, 13 µrad N and 11 µrad E, respectively.
Station Refugio, located 2.6 km NW of the active crater, has primarily recorded stable conditions since 1990.
Station Tumbas was located on the NW flank of the volcano ~4.8 km from the crater. This station has shown deflation from both components since 2000. Since February 2005 the cumulative deflation of the N component was 7 µrad and 13 µrad in the E component. From 2005 to March 2006 there were fluctuations from this station within the measurable range of the tiltmeters.
Long-term radon gas measurements. Radon monitoring at Nevado del Ruiz has been based on six stations. In particular, INGEOMINAS has long records from stations Gualí and Hotel Termales since 2002 and 2003, respectively (figure 52). The locations of the radon gas sampling stations were not disclosed, however a 1986 map of instrumentation places the Hotel Termales (labeled "Termales" with a square and "X")and Río Gualí (marked with a circle near the river) stations within 12 km to the NW of the summit crater (figure 53). In March 2006, results from three radon monitoring sites suggested to INGEOMINAS that there was a possible correlation with the earthquake swarms detected on 9 March 2006. Stations Río Gualí, Gualí, and Rubí recorded an increase in radon emission on 5 March while stations Condor and Cajones maintained low levels (55 pico Curies per Liter, pCi/L). From April through December 2006, no major changes were noted in radon gas emissions.
Geologic Background. Nevado del Ruiz is a broad, glacier-covered volcano in central Colombia that covers more than 200 km2. Three major edifices, composed of andesitic and dacitic lavas and andesitic pyroclastics, have been constructed since the beginning of the Pleistocene. The modern cone consists of a broad cluster of lava domes built within the caldera of an older edifice. The 1-km-wide, 240-m-deep Arenas crater occupies the summit. The prominent La Olleta pyroclastic cone located on the SW flank may also have been active in historical time. Steep headwalls of massive landslides cut the flanks. Melting of its summit icecap during historical eruptions, which date back to the 16th century, has resulted in devastating lahars, including one in 1985 that was South America's deadliest eruption.
Information Contacts: Instituto Colombiano de Geología y Minería (INGEOMINAS), Volcanological and Seismological Observatory, Avenida 12 Octubre 15-47, Manizales, Colombia (URL: https://www2.sgc.gov.co/volcanes/index.html).
Tongariro (New Zealand) — July 2012 Cite this Report
Tongariro
New Zealand
39.157°S, 175.632°E; summit elev. 1978 m
All times are local (unless otherwise noted)
Seismicity preceded phreatic explosion; associated rainfall-fed lahar
Elevated seismicity in July 2012 preceded a phreatic eruption at Tongariro on 6 August. The eruption ejected blocks of old lava from the crater area, and triggered a debris flow down a drainage on a flank of the volcano. Six days later, heavy rainfall remobilized some of the debris flow and generated a small flood/lahar that crossed a state highway. This report summarizes GeoNet alert bulletins and Taupo Civil Defense postings concerning the phreatic explosion and associated events (through 17 August 2012).
Precursory seismicity. GeoNet reported elevated numbers of volcanic earthquakes (M < 2.5) beginning on 13 July (figure 2). Seismicity then declined until 18 July, when volcanic earthquakes returned, increasing in magnitude and abundance through 20 July. The earthquakes were clustered between Emerald Lake and the SE shore of Lake Rotoaira at 2-7 km depth; a subset of the earthquakes were tightly clustered between Blue Lake and Te Maari (Te Mari) Craters within the same depth range (figures 2 and 3). As a result, the Volcano Alert Level was raised from 0 to 1 (on a scale from 0-5) and the Avation Colour Code was raised from Green to Yellow (on a four color scale; Green-Yellow-Orange-Red) on 20 July.
By 23 July, GeoNet had deployed four portable seismometers and had sampled springs and fumaroles. They reported that provisional analyses of gas samples indicated a marked increase in volcanic gases above typical mixtures of hydrothermal and volcanic gas signatures (see subsection "Ash and gas analyses" for detail). By 31 July, GeoNet had also installed a GPS instrument to monitor any deformation.
Phreatic eruption. At 2352 on 6 August, a phreatic eruption occurred from a vent located within the Te Maari Craters area. An explosion generated seismic signals that lasted a few minutes, followed by a series of discrete small earthquakes during the next few tens of minutes. Within 35 minutes, GeoNet posted an Alert Bulletin announcing that ashfall had been reported; the Volcano Alert Level was raised to 2 and the Aviation Colour Code was raised to Red. Taupo Civil Defense responded by closing State Highways 1 and 46 (to the E and N of Tongariro, respectively).
Approximately one hour after the eruption, the Cooperative Institute for Meteorological Satellite Studies (CIMSS) observed in satellite imagery that an ash plume was drifting more than 50 km E from Tongariro (figure 4). They also reported that airports had cancelled flights at Gisborne (210 km ENE), Rotorua (120 km NNE), Taupo (60 km NE), and Palmerston North (135 km S).
GeoNet reported that no volcanic tremor occurred before or after the event, and the Aviation Colour Code was reduced to Orange ~12 hours later (about 1200 on 7 August), and reduced again the next day (1500 on 8 August).
GeoNet conducted an observation flight on 8 August and photographed a variety of features discussed and illustrated in more detail below. They included: (1) a new vent area residing in a small crater, and associated steaming fissures, (2) a debris flow, and (3) impact craters.
The new vent(s) are located in the Upper Te Maari Craters area (figure 5a); low clouds prevented scientists from viewing areas higher than the lowest parts of Upper Te Maari Crater. Photographs of the area revealed a nearby steaming eruptive fissure, and more intense steaming in areas of ground that had been steaming prior to the eruption (figure 5b).
A debris flow generated by the phreatic eruption comprised rock and soil debris that blocked a stream valley draining NW from the Te Maari Craters area (figure 6). GeoNet reported water ponding around the edges, and ash that had been remobilized into slurry flows. GeoNet noted that areas of the debris flow (especially in the upper sections) had eroded into the substrate (figure 6a).
The explosion ejected blocks of lava up to 2 km from the Te Maari Craters area, leaving impact craters in vegetation and ground surfaces (figure 7). All blocks were angular, and none were steaming or surrounded by burnt vegetation; GeoNet thus concluded that the blocks comprised old (non-juvenile) lava(s) ejected from the vent area.
Ash and gas analyses. Textural analyses indicated that the ash emitted during the 6 August explosion contained little-to-no fresh (juvenile) lava, suggesting that the eruption was primarily steam driven (phreatic). GeoNet also reported that analysis of the fluorine content of the ash indicated that, except in the immediate vicinity of the volcano, there were little health or agricultural concerns.
For 9 August, GeoNet reported emissions of 2,100 tons/day of SO2, 3,900 tons/day of CO2, and 364 tons/day of H2S from vents. Sulfur (H2S) smells were reported in downwind locations during 11-12 August, and further reports were filed from the Manawatu region on 15 August. GeoNet attributed the sulfur odors to "passive degassing of magma beneath the surface of Tongariro."
Heavy rains spawn minor lahar. In concert with the 11 August release of a new, updated hazard map of Tongariro (figure 8), GeoNet warned motorists not to stop their vehicles along Highway 46 (N of Tongariro) due to hazards in that area. Following heavy rains the next morning, a minor flood/lahar crossed State Highway 46 near the S tip of Lake Rotoaira (at a location ~6 km W of Rangipo). According to the New Zealand Herald, a driver described 13-cm-deep mud crossing the road at 0830 that day. Scientists at GNS Science stressed that the lahar was not a direct result of an eruptive process, and a resident reported that the area was commonly washed out during heavy rains.
Ten days after the phreatic explosion, GeoNet reduced the Volcano Alert Level to 1, stating that minor eruptive activity, required for Volcanic Alert Level 2, had ceased. The Aviation Colour Code remained at Yellow as of 24 August 2012.
Geologic Background. Tongariro is a large volcanic massif, located immediately NE of Ruapehu volcano, that is composed of more than a dozen composite cones constructed over a period of 275,000 years. Vents along a NE-trending zone extending from Saddle Cone (below Ruapehu) to Te Maari crater (including vents at the present-day location of Ngauruhoe) were active during several hundred years around 10,000 years ago, producing the largest known eruptions at the Tongariro complex during the Holocene. North Crater stratovolcano is truncated by a broad, shallow crater filled by a solidified lava lake that is cut on the NW side by a small explosion crater. The youngest cone, Ngauruhoe, is also the highest peak.
Information Contacts: GeoNet, a collaboration between theEarthquake Commission and GNS Science (URL: http://www.geonet.org.nz/); GNS Science, Wairakei Research Center, Private Bag 2000, Taupo 3352, New Zealand (URL: http://www.gns.cri.nz/); Earthquake Commission (EQC), PO Box 790, Wellington, New Zealand (URL: http://www.eqc.govt.nz/); The Cooperative Institute for Meteorological Satellite Studes (CIMSS), a collaboration between theUniversity of Wisonsin-Madison, theNational Oceanic and Atmospheric Administration, and theNational Aeronautics and Space Administration, Space Science and Engineering Center, 1225 W. Dayton St., Madison, WI 53706 (URL: http://cimss.ssec.wisc.edu/); University of Wisconsin-Madison (UW-Madison) (URL: http://www.wisc.edu/); National Oceanic and Atmospheric Administration (NOAA) (URL: http://www.noaa.gov/about-noaa.html); National Aeronautics and Space Administration (NASA) (URL: http://www.nasa.gov/); New Zealand Herald (URL: http://www.nzherald.co.nz/).