Recently Published Bulletin Reports
Agung (Indonesia) Three eruptive events reported in April, May, and December 2022
Tengger Caldera (Indonesia) Minor ash emission in December 2023; persistent weak thermal anomaly in the Bromo crater
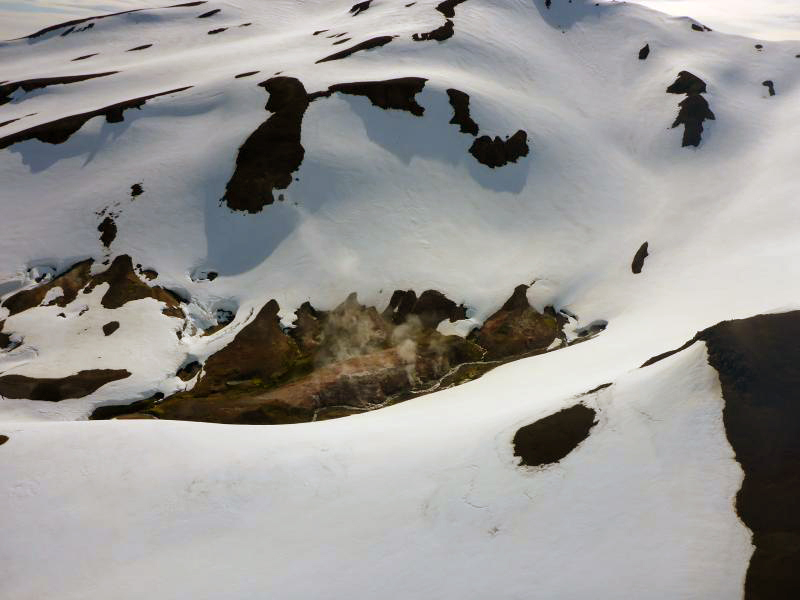
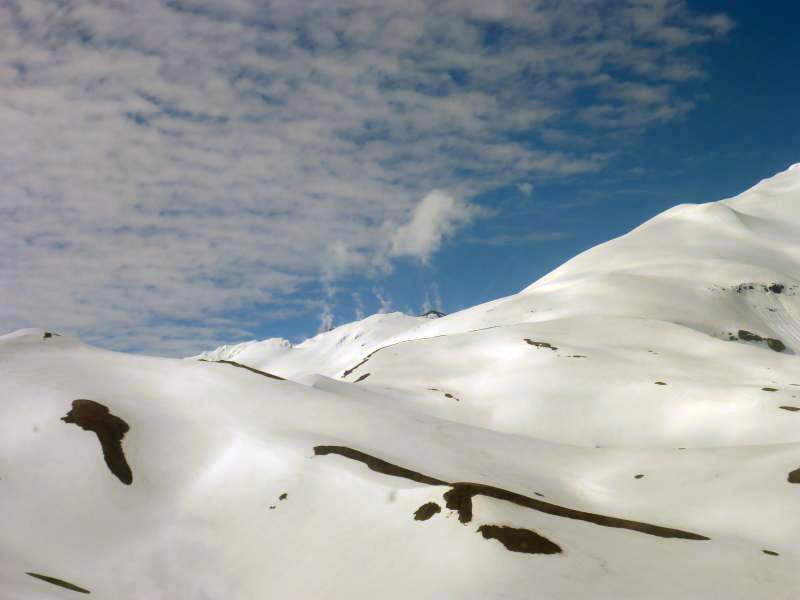
Saunders (United Kingdom) Persistent thermal anomalies from the summit crater lava lake during February 2023-January 2024
Shishaldin (United States) New eruption with significant Strombolian explosions, ash plumes, and ashfall
Ioto (Japan) New eruption with discolored water, ejecta, and floating pumice during October-December 2023
Purace (Colombia) Gas-and-ash emission on 16 November 2023
Suwanosejima (Japan) Eruption plumes, crater incandescence, and occasional explosions during July-October 2023
Etna (Italy) Strombolian explosions, lava fountains, and lava flows during July-August 2023
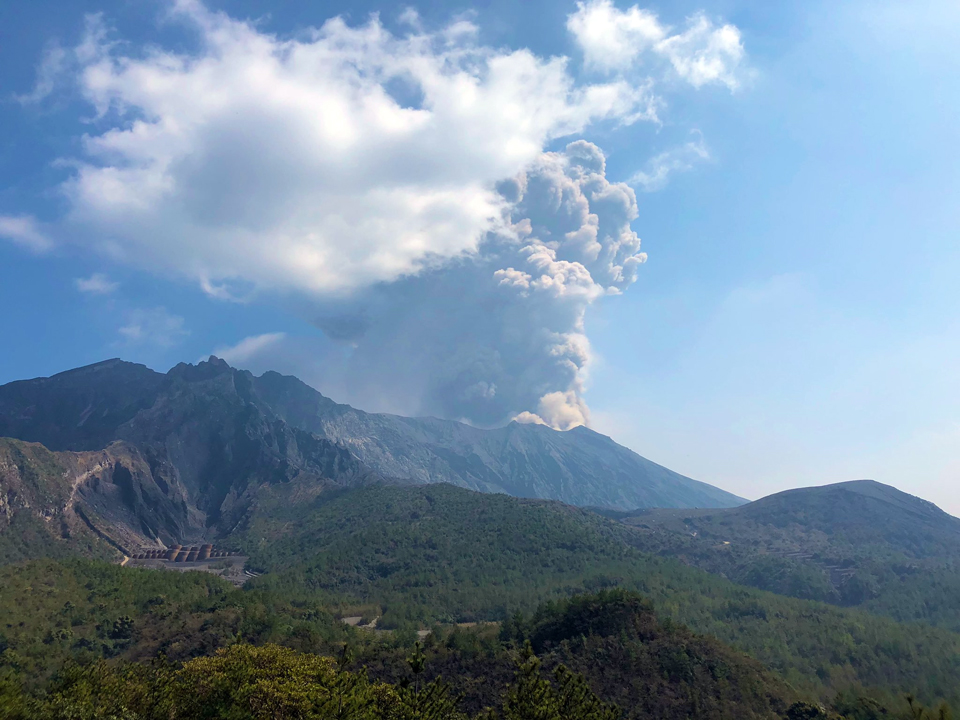
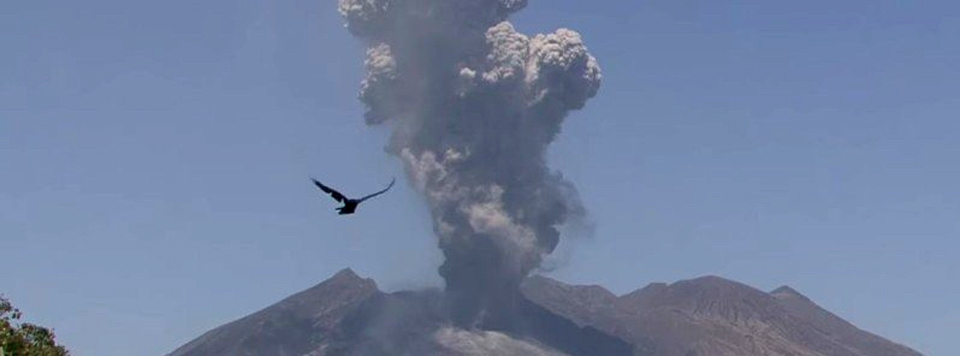
Aira (Japan) Explosions, ash plumes, ash fall, and crater incandescence during July-October 2023
Nishinoshima (Japan) Gray emissions during October 2023
Kilauea (United States) Strong lava fountains, lava flows, and spatter at Halema’uma’u during January-September 2023
Tinakula (Solomon Islands) Continued lava flows and thermal activity during June through November 2023
Agung (Indonesia) — January 2024  Cite this Report
Agung
Indonesia
8.343°S, 115.508°E; summit elev. 2997 m
All times are local (unless otherwise noted)
Three eruptive events reported in April, May, and December 2022
Mount Agung, located on the E end of the island of Bali, Indonesia, rises above the SE rim of the Batur caldera. The summit area extends 1.5 km E-W, with the highest point on the W and a steep-walled 800-m-wide crater on the E. Recorded eruptions date back to the early 19th century. A large and deadly explosive and effusive eruption occurred during 1963-64, which was characterized by voluminous ashfall, pyroclastic flows, and lahars that caused extensive damage and many fatalities. More recent activity was documented during November 2017-June 2019 that consisted of multiple explosions, significant ash plumes, lava flows at the summit crater, and incandescent ejecta. This report covers activity reported during April-May 2022 and December 2022 based on data from the Darwin Volcanic Ash Advisory Center (VAAC).
Activity during 2022 was relatively low and mainly consisted of a few ash plumes during April-May and December. An ash plume on 3 April rising to 3.7 km altitude (700 m above the summit) and drifting N was reported in a Darwin VAAC notice based on a ground report, with ash seen in HIMAWARI-8 visible imagery. Another ash plume was reported at 1120 on 27 May that rose to 5.5 km altitude (2.5 m above the summit); the plume was not visible in satellite or webcam images due to weather clouds. An eruption was reported based on seismic data at 0840 on 13 December, with an estimated plume altitude of 3.7 km; however, no ash was seen using satellite imagery in clear conditions before weather clouds obscured the summit.
Geologic Background. Symmetrical Agung stratovolcano, Bali's highest and most sacred mountain, towers over the eastern end of the island. The volcano, whose name means "Paramount," rises above the SE rim of the Batur caldera, and the northern and southern flanks extend to the coast. The summit area extends 1.5 km E-W, with the high point on the W and a steep-walled 800-m-wide crater on the E. The Pawon cone is located low on the SE flank. Only a few eruptions dating back to the early 19th century have been recorded in historical time. The 1963-64 eruption, one of the largest in the 20th century, produced voluminous ashfall along with devastating pyroclastic flows and lahars that caused extensive damage and many fatalities.
Information Contacts: Darwin Volcanic Ash Advisory Centre (VAAC), Bureau of Meteorology, Northern Territory Regional Office, PO Box 40050, Casuarina, NT 0811, Australia (URL: http://www.bom.gov.au/info/vaac/).
Tengger Caldera (Indonesia) — February 2024 Cite this Report
Tengger Caldera
Indonesia
7.942°S, 112.95°E; summit elev. 2329 m
All times are local (unless otherwise noted)
Minor ash emission in December 2023; persistent weak thermal anomaly in the Bromo crater
Tengger Caldera, located at the N end of a volcanic massif in Indonesia’s East Java, consists of five overlapping stratovolcanoes. The youngest and only active cone in the 16-km-wide caldera is Bromo, which typically produces gas-and-steam plumes, occasional ash plumes and explosions, and weak thermal signals (BGVN 44:05, 47:01). This report covers activity during January 2022-December 2023, consisting of mostly white gas-and-steam emissions and persistent weak thermal anomalies. Information was provided by the Pusat Vulkanologi dan Mitigasi Bencana Geologi (PVMBG, also known as Indonesian Center for Volcanology and Geological Hazard Mitigation, CVGHM) and satellite imagery. The Alert Level remained at 2 (on a scale of 1-4), and visitors were warned to stay at least 1 km from the crater.
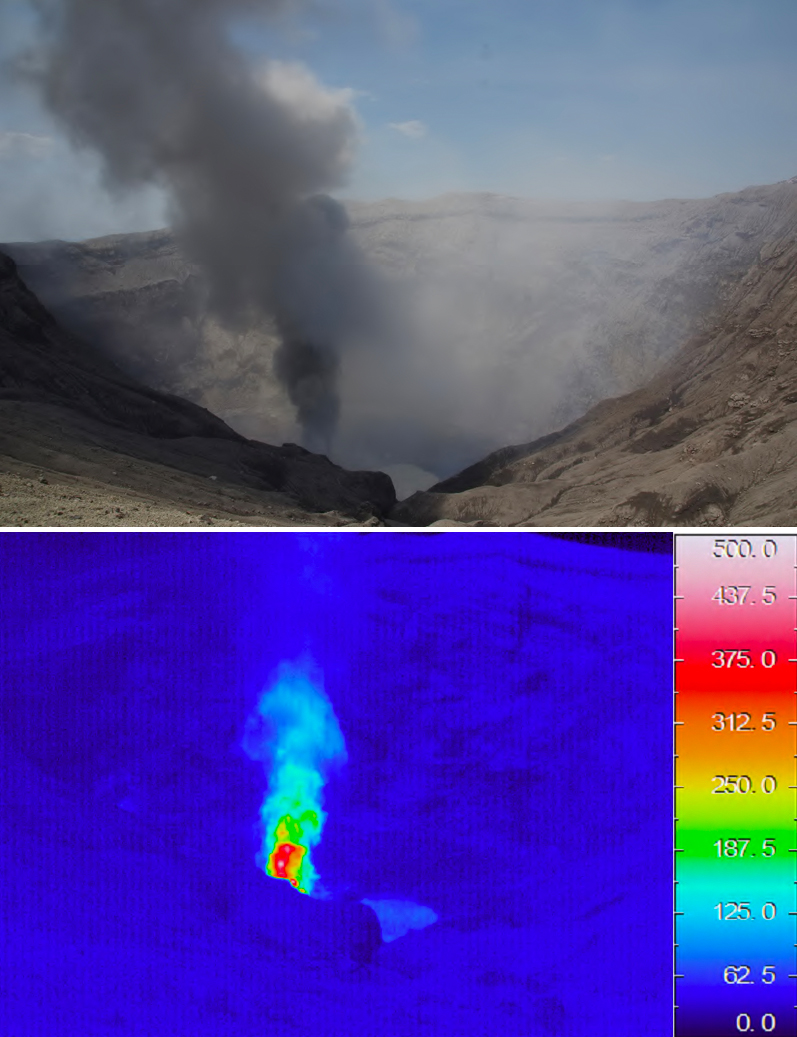
Activity was generally low during the reporting period, similar to that in 2021. According to almost daily images from MAGMA Indonesia (a platform developed by PVMBG), white emissions and plumes rose from 50 to 900 m above the main crater during this period (figure 24). During several days in March and June 2022, white plumes reached heights of 1-1.2 km above the crater.
After an increase in activity at 2114 on 3 February 2023, a PVMBG team that was sent to observe white emissions rising as high as 300 m during 9-12 February and heard rumbling noises. A sulfur dioxide odor was also strong near the crater and measurements indicated that levels were above the healthy (non-hazardous) threshold of 5 parts per million; differential optical absorption spectroscopy (DOAS) measurements indicated an average flux of 190 metric tons per day on 11 February. Incandescence originating from a large fumarole in the NNW part of the crater was visible at night. The team observed that vegetation on the E caldera wall was yellow and withered. The seismic network recorded continuous tremor and deep and shallow volcanic earthquakes.
According to a PVMBG press release, activity increased on 13 December 2023 with white, gray, and brown emissions rising as high as 900 m above Bromo’s crater rim and drifting in multiple directions (figure 25). The report noted that tremor was continuous and was accompanied in December by three volcanic earthquakes. Deformation data indicated inflation in December. There was no observable difference in the persistent thermal anomaly in the crater between 11 and 16 December 2023.
All clear views of the Bromo crater throughout this time, using Sentinel-2 infrared satellite images, showed a weak persistent thermal anomaly; none of the anomalies were strong enough to cause MODVOLC Thermal Alerts. A fire in the SE part of the caldera in early September 2023 resulted in a brief period of strong thermal anomalies.
Geologic Background. The 16-km-wide Tengger caldera is located at the northern end of a volcanic massif extending from Semeru volcano. The massive volcanic complex dates back to about 820,000 years ago and consists of five overlapping stratovolcanoes, each truncated by a caldera. Lava domes, pyroclastic cones, and a maar occupy the flanks of the massif. The Ngadisari caldera at the NE end of the complex formed about 150,000 years ago and is now drained through the Sapikerep valley. The most recent of the calderas is the 9 x 10 km wide Sandsea caldera at the SW end of the complex, which formed incrementally during the late Pleistocene and early Holocene. An overlapping cluster of post-caldera cones was constructed on the floor of the Sandsea caldera within the past several thousand years. The youngest of these is Bromo, one of Java's most active and most frequently visited volcanoes.
Information Contacts: Pusat Vulkanologi dan Mitigasi Bencana Geologi (PVMBG, also known as Indonesian Center for Volcanology and Geological Hazard Mitigation, CVGHM), Jalan Diponegoro 57, Bandung 40122, Indonesia (URL: http://www.vsi.esdm.go.id/); MAGMA Indonesia, Kementerian Energi dan Sumber Daya Mineral (URL: https://magma.esdm.go.id/v1); Copernicus Browser, Copernicus Data Space Ecosystem, European Space Agency (URL: https://dataspace.copernicus.eu/browser/); Hawai'i Institute of Geophysics and Planetology (HIGP) - MODVOLC Thermal Alerts System, School of Ocean and Earth Science and Technology (SOEST), Univ. of Hawai'i, 2525 Correa Road, Honolulu, HI 96822, USA (URL: http://modis.higp.hawaii.edu/).
Saunders (United Kingdom) — February 2024 Cite this Report
Saunders
United Kingdom
57.8°S, 26.483°W; summit elev. 843 m
All times are local (unless otherwise noted)
Persistent thermal anomalies from the summit crater lava lake during February 2023-January 2024
Saunders is one of eleven islands that comprise the South Sandwich Islands in the South Atlantic. The active Mount Michael volcano has been in almost continuous eruption since November 2014 (BGVN 48:02). Recent activity has resulted in intermittent thermal anomalies and gas-and-steam emissions (BGVN 47:03, 48:02). Visits are infrequent due to its remote location, and cloud cover often prevents satellite observations. Satellite thermal imagery and visual observation of incandescence during a research expedition in 2019 (BGVN 28:02 and 44:08) and a finding confirmed by a National Geographic Society research team that summited Michael in November 2022 reported the presence of a lava lake.
Although nearly constant cloud cover during February 2023 through January 2024 greatly limited satellite observations, thermal anomalies from the lava lake in the summit crater were detected on clear days, especially around 20-23 August 2023. Anomalies similar to previous years (eg. BGVN 48:02) were seen in both MIROVA (Middle InfraRed Observation of Volcanic Activity) data from MODIS instruments and in Sentinel 2 infrared imagery. The only notable sulfur dioxide plume detected near Saunders was on 25 September 2023, with the TROPOMI instrument aboard the Sentinel-5P satellite.
Geologic Background. Saunders Island consists of a large central volcanic edifice intersected by two seamount chains, as shown by bathymetric mapping (Leat et al., 2013). The young Mount Michael stratovolcano dominates the glacier-covered island, while two submarine plateaus, Harpers Bank and Saunders Bank, extend north. The symmetrical Michael has a 500-m-wide summit crater and a remnant of a somma rim to the SE. Tephra layers visible in ice cliffs surrounding the island are evidence of recent eruptions. Ash clouds were reported from the summit crater in 1819, and an effusive eruption was inferred to have occurred from a N-flank fissure around the end of the 19th century and beginning of the 20th century. A low ice-free lava platform, Blackstone Plain, is located on the north coast, surrounding a group of former sea stacks. A cluster of cones on the SE flank, the Ashen Hills, appear to have been modified since 1820 (LeMasurier and Thomson, 1990). Analysis of satellite imagery available since 1989 (Gray et al., 2019; MODVOLC) suggests frequent eruptive activity (when weather conditions allow), volcanic clouds, steam plumes, and thermal anomalies indicative of a persistent, or at least frequently active, lava lake in the summit crater. Due to this observational bias, there has been a presumption when defining eruptive periods that activity has been ongoing unless there is no evidence for at least 10 months.
Information Contacts: MIROVA (Middle InfraRed Observation of Volcanic Activity), a collaborative project between the Universities of Turin and Florence (Italy) supported by the Centre for Volcanic Risk of the Italian Civil Protection Department (URL: http://www.mirovaweb.it/); NASA Global Sulfur Dioxide Monitoring Page, Atmospheric Chemistry and Dynamics Laboratory, NASA Goddard Space Flight Center (NASA/GSFC), 8800 Greenbelt Road, Goddard MD 20771, USA (URL: https://so2.gsfc.nasa.gov/); Copernicus Browser (URL: https://dataspace.copernicus.eu/browser).
Shishaldin (United States) — December 2023 Cite this Report
Shishaldin
United States
54.756°N, 163.97°W; summit elev. 2857 m
All times are local (unless otherwise noted)
New eruption with significant Strombolian explosions, ash plumes, and ashfall
Shishaldin is located on the eastern half of Unimak Island, one of the Aleutian Islands. Frequent explosive activity, primarily consisting of Strombolian ash eruptions from the small summit crater, but sometimes producing lava flows, has been recorded since the 18th century. The previous eruption ended in May 2020 and was characterized by intermittent thermal activity, increased seismicity and surface temperatures, ash plumes, and ash deposits (BGVN 45:06). This report covers a new eruption during July through November 2023, which consisted of significant explosions, ash plumes, ashfall, and lava fountaining. Information comes from daily, weekly, and special reports from the Alaska Volcano Observatory (AVO) and various satellite data. AVO monitors the volcano using local seismic and infrasound sensors, satellite data, web cameras, and remote infrasound and lightning networks.
AVO reported that intermittent tremor and low-frequency earthquakes had gradually become more regular and consistent during 10-13 July. Strongly elevated surface temperatures at the summit were identified in satellite images during 10-13 July. On 11 July AVO raised the Aviation Color Code (ACC) to Yellow (the second color on a four-color scale) and Volcano Alert Level (VAL) to Advisory (the second level on a four-level scale) at 1439. Later in the day on 11 July summit crater incandescence was observed in webcam images. Observations of the summit suggested that lava was likely present at the crater, which prompted AVO to raise the ACC to Orange (the second highest color on a four-color scale) and the VAL to Watch (the second highest level on a four-level scale). The US Coast Guard conducted an overflight on 12 July and confirmed that lava was erupting from the summit. That same day, sulfur dioxide emissions were detected in satellite images.
A significant explosion began at 0109 on 14 July that produced an ash plume that rose to 9-12 km altitude and drifted S over the Pacific Ocean (figure 43). Webcam images and photos taken around 0700 from a ship SW off Unimak Island showed small lahar deposits, which were the result of the interaction of hot pyroclastic material and snow and ice on the flanks. There was also ashfall on the SW and N flanks. A smaller explosion at 0710 generated an ash plume that rose to 4.5 km altitude. Webcam images and pilot reports showed continued low-level ash emissions during the morning, rising to less than 4.6 km altitude; those emissions included a small ash plume near the summit around 1030 resulting from a small explosion.
Seismic tremor amplitude began increasing at around 1700 on 15 July; strongly elevated surface temperatures were also reported. An ash plume rose to 4.6 km altitude and drifted SSE at 2100, based on a satellite image. A continuous ash plume during 2150 through 2330 rose to 5 km altitude and extended 125 km S. At 2357 AVO raised the ACC to Red (the highest color on a four-color scale) and the VAL to Warning (the highest level on a four-level scale), noting that seismicity remained elevated for more than six hours and explosion signals were frequently detected by regional infrasound (pressure sensor) networks. Explosions generated an ash plume that rose to 4.9 km altitude and drifted as far as 500 km SE. Activity throughout the night declined and by 0735 the ACC was lowered to Orange and the VAL to Watch. High-resolution satellite images taken on 16 July showed pyroclastic deposits extending as far as 3 km from the vent; these deposits generated lahars that extended further down the drainages on the flanks. Ash deposits were mainly observed on the SSE flank and extended to the shore of Unimak Island. During 16-17 July lava continued to erupt at the summit, which caused strongly elevated surface temperatures that were visible in satellite imagery.
Lava effusion increased at 0100 on 18 July, as noted in elevated surface temperatures identified in satellite data, increasing seismic tremor, and activity detected on regional infrasound arrays. A significant ash plume at 0700 rose to 7 km altitude and continued until 0830, eventually reaching 9.1 km altitude and drifting SSE (figure 44). As a result, the ACC was raised to Red and the VAL to Warning. By 0930 the main plume detached, but residual low-level ash emissions continued for several hours, remaining below 3 km altitude and drifting S. The eruption gradually declined and by 1208 the ACC was lowered to Orange and the VAL was lowered to Watch. High-resolution satellite images showed ash deposits on the SW flank and pyroclastic deposits on the N, E, and S flanks, extending as far as 3 km from the vent; lahars triggered by the eruption extended farther down the flanks (figure 45). Lava continued to erupt from the summit crater on 19 July.
Elevated surface temperatures were detected in satellite images during 19-25 July, despite occasional weather cloud cover, which was consistent with increased lava effusion. During 22-23 July satellite observations acquired after the eruption from 18 July showed pyroclastic flow and lahar deposits extending as far as 3 km down the N, NW, and NE flanks and as far as 1.5 km down the S and SE flanks. Ash deposits covered the SW and NE flanks. No lava flows were observed outside the crater. On 22 July a sulfur dioxide plume was detected in satellite data midday that had an estimated mass of 10 kt. In a special notice issued at 1653 on 22 July AVO noted that eruptive activity had intensified over the previous six hours, which was characterized by an hours-long steady increase in seismic tremor, intermittent infrasound signals consistent with small explosions, and an increase in surface temperatures that were visible in satellite data. Pilots first reported low-level ash plumes at around 1900. At 2320 an ash plume had risen to 9 km altitude based on additional pilot reports and satellite images. The ACC was increased to Red and the VAL to Warning at 2343. Satellite images indicated growth of a significantly higher ash plume that rose to 11 km altitude continued until 0030 and drifted NE. During the early morning hours of 23 July ash plumes had declined to 4.6 k altitude. Seismic tremor peaked at 0030 on 23 July and began to rapidly decline at 0109; active ash emissions were no longer visible in satellite data by 0130. The ACC was lowered to Orange and the VAL to Watch at 0418; bursts of increased seismicity were recorded throughout the morning, but seismicity generally remained at low levels. Elevated surface temperatures were visible in satellite data until about 0600. On 24 July pilots reported seeing vigorous gas-and-steam plumes rising to about 3 km altitude; the plumes may have contained minor amounts of ash.
During 24-25 July low level seismicity and volcanic tremor were detected at low levels following the previous explosion on 23 July. Strongly elevated surface temperatures were observed at the summit crater in satellite data. Around 2200 on 25 July seismicity began to increase, followed by infrasound signals of explosions after 0200 on 26 July. An ash plume rose to 3 km altitude at 0500 and drifted ENE, along with an associated sulfur dioxide plume that drifted NE and had an estimated mass of 22 kt. Diffuse ash emissions were visible in satellite data and rose to 6.1-7.6 km altitude and extended 125 km from the volcano starting around 1130. These ash events were preceded by about seven hours of seismic tremor, infrasound detections of explosions, and five hours of increased surface temperatures visible in satellite data. Activity began to decline around 1327, which included low-frequency earthquakes and decreased volcanic tremor, and infrasound data no longer detected significant explosions. Surface temperatures remained elevated through the end of the month.
Seismicity, volcanic tremor, and ash emissions remained at low levels during early August. Satellite images on 1 August showed that some slumping had occurred on the E crater wall due to the recent explosive activity. Elevated surface temperatures continued, which was consistent with cooling lava. On 2 August small explosive events were detected, consistent with low-level Strombolian activity. Some episodes of volcanic tremor were reported, which reflected low-level ash emissions. Those ash emissions rose to less than 3 km altitude and drifted as far as 92.6 km N. Pilots that were located N of the volcano observed an ash plume that rose to 2.7 km altitude. Seismicity began to increase in intensity around 0900 on 3 August. Seismicity continued to increase throughout the day and through the night with strongly elevated surface temperatures, which suggested that lava was active at the surface.
An ash cloud that rose to 7.6-7.9 km altitude and drifted 60-75 km NE was visible in a satellite image at 0520 on 4 August. Pilots saw and reported the plume at 0836 (figure 46). By 0900 the plume had risen to 9.1 km altitude and extended over 100 km NE. AVO raised the ACC to Red and the VAL to Warning as a result. Seismic tremor levels peaked at 1400 and then sharply declined at 1500 to slightly elevated levels; the plume was sustained during the period of high tremor and drifted N and NE. The ACC was lowered to Orange and the VAL to Watch at 2055. During 5-14 August seismicity remained low and surface temperatures were elevated based on satellite data due to cooling lava. On 9 August a small lava flow was observed that extended from the crater rim to the upper NE flank. It had advanced to 55 m in length and appeared in satellite imagery on 11 August. Occasional gas-and-steam plumes were noted in webcam images. At 1827 AVO noted that seismic tremor had steadily increased during the afternoon and erupting lava was visible at the summit in satellite images.
Strong explosion signals were detected at 0200 on 15 August. An ash cloud that was visible in satellite data extended 100 km NE and may have risen as high as 11 km altitude around 0240. By 0335 satellite images showed the ash cloud rising to 7.6 km altitude and drifting NE. Significant seismicity and explosions were detected by the local AVO seismic and infrasound networks, and volcanic lightning was detected by the World Wide Lightning Location Network (WWLLN). A sulfur dioxide plume associated with the eruption drifted over the S Bering Sea and parts of Alaska and western Canada. Seismicity was significantly elevated during the eruption but had declined by 1322. A pilot reported that ash emissions continued, rising as high as 4.9 km altitude. Elevated surface temperatures detected in satellite data were caused by hot, eruptive material (pyroclastic debris and lava) that accumulated around the summit. Eruptive activity declined by 16 August and the associated sulfur dioxide plume had mostly dissipated; remnants continued to be identified in satellite images at least through 18 August. Surface temperatures remained elevated based on satellite images, indicating hot material on the upper parts of the volcano. Small explosions were detected in infrasound data on the morning of 19 August and were consistent with pilot reports of small, short-lived ash plumes that rose to about 4.3 km altitude. Low-level explosive activity was reported during 20-24 August, according to seismic and infrasound data, and weather clouds sometimes prevented views. Elevated surface temperatures were observed in satellite images, which indicated continued hot material on the upper parts of the volcano.
Seismic tremor began to increase at around 0300 on 25 August and was followed by elevated surface temperatures identified in satellite images, consistent with erupting lava. Small explosions were recorded in infrasound data. The ACC was raised to Red and the VAL to Warning at 1204 after a pilot reported an ash plume that rose to 9.1 km altitude. Seismicity peaked at 1630 and began to rapidly decline at around 1730. Ash plumes rose as high as 10 km altitude and drifted as far as 400 km NE. By 2020 the ash plumes had declined to 6.4 km altitude and continued to drift NE. Ash emissions were visible in satellite data until 0000 on 26 August and seismicity was at low levels. AVO lowered the ACC to Orange and the VAL to Watch at 0030. Minor explosive activity within the summit crater was detected during 26-28 August and strongly elevated surface temperatures were still visible in satellite imagery through the rest of the month. An AVO field crew working on Unimak Island observed a mass flow that descended the upper flanks beginning around 1720 on 27 August. The flow produced a short-lived ash cloud that rose to 4.5 km altitude and rapidly dissipated. The mass flow was likely caused by the collapse of spatter that accumulated on the summit crater rim.
Similar variable explosive activity was reported in September, although weather observations sometimes prevented observations. A moderate resolution satellite image from the afternoon of 1 September showed gas-and-steam emissions filling the summit crater and obscuring views of the vent. In addition, hot deposits from the previous 25-26 August explosive event were visible on the NE flank near the summit, based on a 1 September satellite image. On 2 and 4 September seismic and infrasound data showed signals of small, repetitive explosions. Variable gas-and-steam emissions from the summit were visible but there was no evidence of ash. Possible summit crater incandescence was visible in nighttime webcam images during 3-4 September.
Seismicity began to gradually increase at around 0300 on 5 September and activity escalated at around 0830. A pilot reported an ash plume that rose to 7.6 km altitude at 0842 and continued to rise as high as possibly 9.7 km altitude and drifted SSE based on satellite images (figure 47). The ACC was raised to Red and the VAL to Warning at 0900. In addition to strong tremor and sustained explosions, the eruption produced volcanic lightning that was detected by the WWLLN. Around 1100 seismicity decreased and satellite data confirmed that the altitude of the ash emissions had declined to 7.6 km altitude. By 1200 the lower-altitude portion of the ash plume had drifted 125 km E. Significant ash emissions ended by 1330 based on webcam images. The ACC was lowered to Orange and the VAL to Watch at 1440. Satellite images showed extensive pyroclastic debris flows on most of the flanks that extended 1.2-3.3 km from the crater rim.
During 6-13 September elevated surface temperatures continued to be observed in satellite data, seismicity remained elevated with weak but steady tremor, and small, low-frequency earthquakes and small explosions were reported, except on 12 September. On 6 September a low-level ash plume rose to 1.5-1.8 km altitude and drifted SSE. Occasional small and diffuse gas-and-steam emissions at the summit were visible in webcam images. Around 1800 on 13 September seismic tremor amplitudes began to increase, and small explosions were detected in seismic and infrasound data. Incandescent lava at the summit was seen in a webcam image taken at 0134 on 14 September during a period of elevated tremor. No ash emissions were reported during the period of elevated seismicity. Lava fountaining began around 0200, based on webcam images. Satellite-based radar observations showed that the lava fountaining activity led to the growth of a cone in the summit crater, which refilled most of the crater. By 0730 seismicity significantly declined and remained at low levels.
Seismic tremor began to increase around 0900 on 15 September and rapidly intensified. An explosive eruption began at around 1710, which prompted AVO to raise the ACC to Red and the VAL to Warning. Within about 30 minutes ash plumes drifted E below a weather cloud at 8.2 km altitude. The National Weather Service estimated that an ash-rich plume rose as high as 12.8 km altitude and produced volcanic lightning. The upper part of the ash plume detached from the vent around 1830 and drifted E, and was observed over the Gulf of Alaska. Around the same time, seismicity dramatically decreased. Trace ashfall was reported in the community of False Pass (38 km ENE) between 1800-2030 and also in King Cove and nearby marine waters. Activity declined at around 1830 although seismicity remained elevated, ash emissions, and ashfall continued until 2100. Lightning was again detected beginning around 1930, which suggested that ash emissions continued. Ongoing explosions were detected in infrasound data, at a lower level than during the most energetic phase of this event. Lightning was last detected at 2048. By 2124 the intensity of the eruption had decreased, and ash emissions were likely rising to less than 6.7 km altitude. Seismicity returned to pre-eruption levels. On 16 September the ACC was lowered to Orange and the VAL to Watch at 1244; the sulfur dioxide plume that was emitted from the previous eruption event was still visible over the northern Pacific Ocean. Elevated surface temperatures, gas-and-steam emissions from the vent, and new, small lahars were reported on the upper flanks based on satellite and webcam images. Minor deposits were reported on the flanks which were likely the result of collapse of previously accumulated lava near the summit crater.
Elevated seismicity with tremor, small earthquakes, and elevated surface temperatures were detected during 17-23 September. Minor gas-and-steam emissions were visible in webcam images. On 20 September small volcanic debris flows were reported on the upper flanks. On 21 September a small ash deposit was observed on the upper flanks extending to the NE based on webcam images. Seismic tremor increased significantly during 22-23 September. Regional infrasound sensors suggested that low-level eruptive activity was occurring within the summit crater by around 1800 on 23 September. Even though seismicity was at high levels, strongly elevated surface temperatures indicating lava at the surface were absent and no ash emissions were detected; weather clouds at 0.6-4.6 km altitude obscured views. At 0025 on 24 September AVO noted that seismicity continued at high levels and nearly continuous small infrasound signals began, likely from low-level eruptive activity. Strongly elevated surface temperatures were identified in satellite images by 0900 and persisted throughout the day; the higher temperatures along with infrasound and seismic data were consistent with lava erupting at the summit. Around 1700 similarly elevated surface temperatures were detected from the summit in satellite data, which suggested that more vigorous lava fountaining had started. Starting around 1800 low-level ash emissions rose to altitudes less than 4.6 km altitude and quickly dissipated.
Beginning at midnight on 25 September, a series of seismic signals consistent with volcanic flows were recorded on the N side of the volcano. A change in seismicity and infrasound signals occurred around 0535 and at 0540 a significant ash cloud formed and quickly reached 14 km altitude and drifted E along the Alaska Peninsula. The cloud generated at least 150 lightning strokes with thunder that could be heard by people in False Pass. Seismicity rapidly declined to near background levels around 0600. AVO increased the ACC to Red and the VAL to Warning at 0602. The ash cloud detached from the volcano at around 0700, rose to 11.6 km altitude, and drifted ESE. Trace to minor amounts of ashfall were reported by the communities of False Pass, King Cove, Cold Bay, and Sand Point around 0700. Ash emissions continued at lower altitudes of 6-7.6 km altitude at 0820. Small explosions at the vent area continued to be detected in infrasound data and likely represented low-level eruptive activity near the vent. Due to the significant decrease in seismicity and ash emissions the ACC was lowered to Orange and the VAL to Watch at 1234. Radar data showed significant collapses of the crater that occurred on 25 September. Satellite data also showed significant hot, degassing pyroclastic and lahar deposits on all flanks, including more extensive flows on the ENE and WSW sections below two new collapse scarps. Following the significant activity during 24-25 September, only low-level activity was observed. Seismicity decreased notably near the end of the strong activity on 25 September and continued to decrease through the end of the month, though tremor and small earthquakes were still reported. No explosive activity was detected in infrasound data through 2 October. Gas-and-steam emissions rose to 3.7 km altitude, as reported by pilots and seen in satellite images. Satellite data from 26 September showed that significant collapses had occurred at the summit crater and hot, steaming deposits from pyroclastic flows and lahars were present on all the flanks, particularly to the ENE and WSW. A small ash cloud was visible in webcam images on 27 September, likely from a collapse at the summit cone. High elevated surface temperatures were observed in satellite imagery during 27-28 September, which were likely the result of hot deposits on the flanks erupted on 25 September. Minor steaming at the summit crater and from an area on the upper flanks was visible in webcam images on 28 September.
During October, explosion events continued between periods of low activity. Seismicity significantly increased starting at around 2100 on 2 October; around the same time satellite images showed an increase in surface temperatures consistent with lava fountaining. Small, hot avalanches of rock and lava descended an unspecified flank. In addition, a distinct increase in infrasound, seismicity, and lightning detections was followed by an ash plume that rose to 12.2 km altitude and drifted S and E at 0520 on 3 October, based on satellite images. Nighttime webcam images showed incandescence due to lava fountaining at the summit and pyroclastic flows descending the NE flank. AVO reported that a notable explosive eruption started at 0547 and lasted until 0900 on 3 October, which prompted a rise in the ACC to Red and the VAL to Warning. Subsequent ash plumes rose to 6-7.6 km altitude by 0931. At 1036 the ACC was lowered back to Orange and the VAL to Watch since both seismic and infrasound data quieted substantially and were slightly above background levels. Gas-and-steam emissions were observed at the summit, based on webcam images. Trace amounts of ashfall were observed in Cold Bay. Resuspended ash was present at several kilometers altitude near the volcano. During the afternoon, low-level ash plumes were visible at the flanks, which appeared to be largely generated by rock avalanches off the summit crater following the explosive activity. These ash plumes rose to 3 km altitude and drifted W. Trace amounts of ashfall were reported by observers in Cold Bay and Unalaska and flights to these communities were disrupted by the ash cloud. Satellite images taken after the eruption showed evidence of pyroclastic flows and lahar deposits in drainages 2 km down the SW flank and about 3.2 km down the NE flank, and continued erosion of the crater rim. Small explosion craters at the end of the pyroclastic flows on the NE flank were noted for the first time, which may have resulted from gas-and-steam explosions when hot deposits interact with underlying ice.
During 4 October seismicity, including frequent small earthquakes, remained elevated, but was gradually declining. Ash plumes were produced for over eight hours until around 1400 that rose to below 3.7 km altitude. These ash plumes were primarily generated off the sides of the volcano where hot rock avalanches from the crater rim had entered drainages to the SW and NE. Two explosion craters were observed at the base of the NE deposits about 3.2 km from the crater rim. Webcam images showed the explosion craters were a source of persistent ash emissions; occasional collapse events also generated ash. Seismicity remained elevated with sulfur dioxide emissions that had a daily average of more than 1,000 tons per day, and frequent small earthquakes through the end of the month. Frequent elevated surface temperatures were identified in satellite images and gas-and-steam plumes were observed in webcam images, although weather conditions occasionally prevented clear views of the summit. Emissions were robust during 14-16 October and were likely generated by the interaction of hot material and snow and ice. During the afternoon of 21 October a strong gas-and-steam plume rose to 3-4.6 km altitude and extended 40 km WSW, based on satellite images and reports from pilots. On 31 October the ACC was lowered to Yellow and the VAL was lowered to Advisory.
Activity in November was characterized by elevated seismicity with ongoing seismic tremor and small, low-frequency earthquakes, elevated surface temperatures, and gas-and-steam emissions. There was an increase in seismic and infrasound tremor amplitudes starting at 1940 on 2 November. As a result, the ACC was again raised to Orange and the VAL was increased to Watch, although ash was not identified in satellite data. An ash cloud rose to 6.1 km altitude and drifted W according to satellite data at 2000. By 0831 on 3 November ash emissions were no longer visible in satellite images. On 6 and 9 November air pressure sensors detected signals consistent with small explosions. Small explosions were detected in infrasound data consistent with weak Strombolian activity on 19 and 21 November. Seismicity started to decrease on 21 November. On 25 November gas-and-steam emissions were emitted from the vent as well as from a scarp on the NE side of the volcano near the summit. A gas-and-steam plume extended about 50 km SSE and was observed in satellite and webcam images on 26 November. On 28 November small explosions were observed in seismic and local infrasound data and gas-and-steam emissions were visible from the summit and from the upper NE collapse scarp based on webcam images. Possible small explosions were observed in infrasound data on 30 November. Weakly elevated surface temperatures and a persistent gas-and-steam plume from the summit and collapse scarps on the upper flanks. A passing aircraft reported the gas-and-steam plume rose to 3-3.4 km altitude on 30 November, but no significant ash emissions were detected.
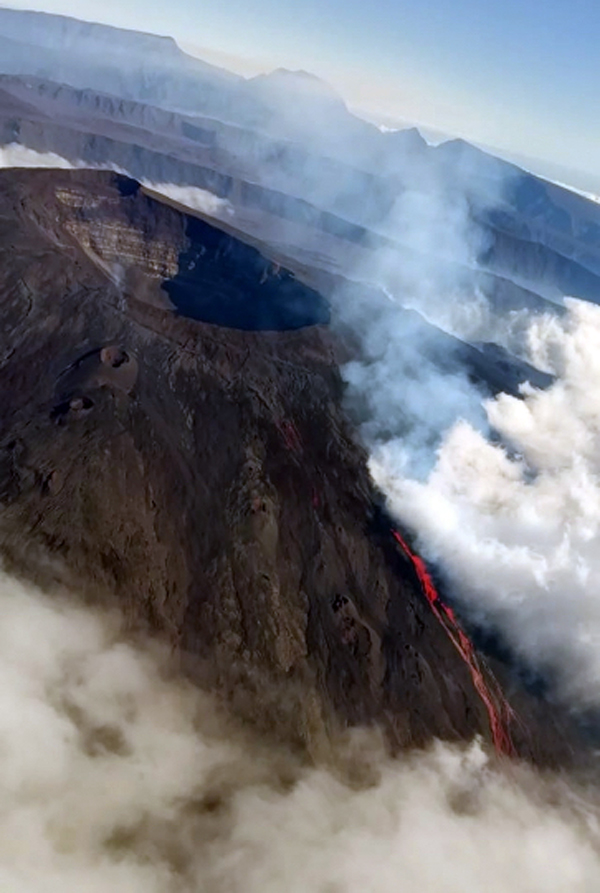
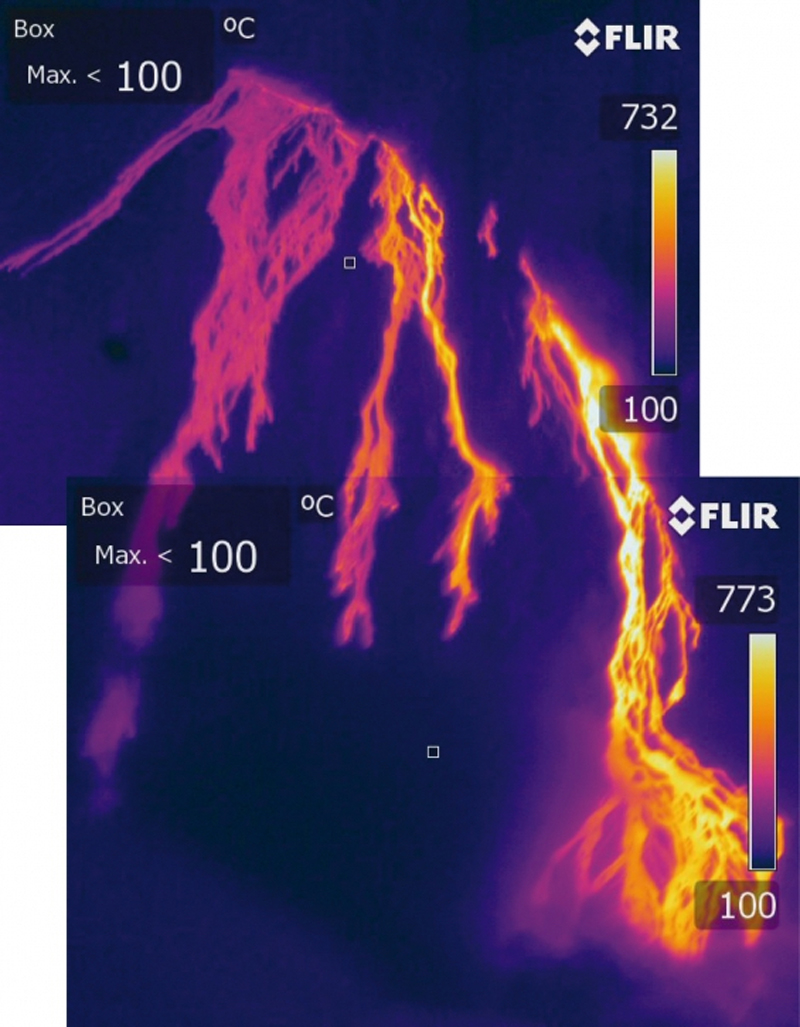
Satellite data. MODIS thermal anomaly data provided through MIROVA (Middle InfraRed Observation of Volcanic Activity) showed a strong pulse of thermal activity beginning in July 2023 that continued through November 2023 (figure 48). This strong activity was due to Strombolian explosions and lava fountaining events at the summit crater. According to data from MODVOLC thermal alerts, a total of 101 hotspots were detected near the summit crater in July (11-14, 16-19, 23-24 and 26), August (4, 25-26, and 29), September (5, 12, and 17), and October (3, 4, and 8). Infrared satellite data showed large lava flows descending primarily the northern and SE flanks during the reporting period (figure 49). Sulfur dioxide plumes often exceeded two Dobson Units (DUs) and drifted in different directions throughout the reporting period, based on satellite data from the TROPOMI instrument on the Sentinel-5P satellite (figure 50).
Geologic Background. The symmetrical glacier-covered Shishaldin in the Aleutian Islands is the westernmost of three large stratovolcanoes in the eastern half of Unimak Island. The Aleuts named the volcano Sisquk, meaning "mountain which points the way when I am lost." Constructed atop an older glacially dissected edifice, it is largely basaltic in composition. Remnants of an older edifice are exposed on the W and NE sides at 1,500-1,800 m elevation. There are over two dozen pyroclastic cones on its NW flank, which is covered by massive aa lava flows. Frequent explosive activity, primarily consisting of Strombolian ash eruptions from the small summit crater, but sometimes producing lava flows, has been recorded since the 18th century. A steam plume often rises from the summit crater.
Information Contacts: Alaska Volcano Observatory (AVO), a cooperative program of a) U.S. Geological Survey, 4200 University Drive, Anchorage, AK 99508-4667 USA (URL: https://avo.alaska.edu/), b) Geophysical Institute, University of Alaska, PO Box 757320, Fairbanks, AK 99775-7320, USA, and c) Alaska Division of Geological & Geophysical Surveys, 794 University Ave., Suite 200, Fairbanks, AK 99709, USA (URL: http://dggs.alaska.gov/); MIROVA (Middle InfraRed Observation of Volcanic Activity), a collaborative project between the Universities of Turin and Florence (Italy) supported by the Centre for Volcanic Risk of the Italian Civil Protection Department (URL: http://www.mirovaweb.it/); Hawai'i Institute of Geophysics and Planetology (HIGP) - MODVOLC Thermal Alerts System, School of Ocean and Earth Science and Technology (SOEST), Univ. of Hawai'i, 2525 Correa Road, Honolulu, HI 96822, USA (URL: http://modis.higp.hawaii.edu/); NASA Global Sulfur Dioxide Monitoring Page, Atmospheric Chemistry and Dynamics Laboratory, NASA Goddard Space Flight Center (NASA/GSFC), 8800 Greenbelt Road, Goddard, Maryland, USA (URL: https://so2.gsfc.nasa.gov/); Copernicus Browser, Copernicus Data Space Ecosystem, European Space Agency (URL: https://dataspace.copernicus.eu/browser/).
Ioto
Japan
24.751°N, 141.289°E; summit elev. 169 m
All times are local (unless otherwise noted)
New eruption with discolored water, ejecta, and floating pumice during October-December 2023
Ioto (Iwo-jima), located about 1,200 km S of Tokyo, lies within a 9-km-wide submarine caldera along the Izu-Bonin-Mariana volcanic arc. Previous eruptions date back to 1889 and have consisted of dominantly phreatic explosions, pumice deposits during 2001, and discolored water. A submarine eruption during July through December 2022 was characterized by discolored water, pumice deposits, and gas emissions (BGVN 48:01). This report covers a new eruption during October through December 2023, which consisted of explosions, black ejecta, discolored water, and floating pumice, based on information from the Japan Meteorological Association (JMA), the Japan Coast Guard (JCG), and satellite data.
JMA reported that an eruption had been occurring offshore of Okinahama on the SE side of the island since 21 October, which was characterized by volcanic tremor, according to the Japan Maritime Self-Defense Force (JMSDF) Iwo Jima Air Base (figure 22). According to an 18 October satellite image a plume of discolored water at the site of this new eruption extended NE (figure 23). During an overflight conducted on 30 October, a vent was identified about 1 km off the coast of Okinahama. Observers recorded explosions every few minutes that ejected dark material about 20 m above the ocean and as high as 150 m. Ejecta from the vent formed a black-colored island about 100 m in diameter, according to observations conducted from the air by the Earthquake Research Institute of the University of Tokyo in cooperation with the Mainichi newspaper (figure 24). Occasionally, large boulders measuring more than several meters in size were also ejected. Observations from the Advanced Land Observing Satellite Daichi-2 and Sentinel-2 satellite images also confirmed the formation of this island (figure 23). Brown discolored water and floating pumice were present surrounding the island.
The eruption continued during November. During an overflight on 3 November observers photographed the island and noted that material was ejected 169 m high, according to a news source. Explosions gradually became shorter, and, by the 3rd, they occurred every few seconds; dark and incandescent material were ejected about 800 m above the vent. On 4 November eruptions were accompanied by explosive sounds. Floating, brown-colored pumice was present in the water surrounding the island. There was a brief increase in the number of volcanic earthquakes during 8-14 November and 24-25 November. The eruption temporarily paused during 9-11 November and by 12 November eruptions resumed to the W of the island. On 10 November dark brown-to-dark yellow-green discolored water and a small amount of black floating material was observed (figure 25). A small eruption was reported on 18 November off the NE coast of the island, accompanied by white gas-and-steam plumes (figure 23). Another pause was recorded during 17-19 November, which then resumed on 20 November and continued erupting intermittently. According to a field survey conducted by the National Institute for Disaster Prevention Science and Technology on 19 November, a 30-m diameter crater was visible on the NE coast where landslides, hot water, and gray volcanic ash containing clay have occurred and been distributed previously. Erupted blocks about 10 cm in diameter were distributed about 90-120 m from the crater. JCG made observations during an overflight on 23 November and reported a phreatomagmatic eruption. Explosions at the main vent generated dark gas-and-ash plumes that rose to 200 m altitude and ejected large blocks that landed on the island and in the ocean (figure 26). Discolored water also surrounded the island. The size of the new island had grown to 450 m N-S x 200 m E-W by 23 November, according to JCG.
The eruption continued through 11 December, followed by a brief pause in activity, which then resumed on 31 December, according to JMA. Intermittent explosions produced 100-m-high black plumes at intervals of several minutes to 30 minutes during 1-10 December. Overflights were conducted on 4 and 15 December and reported that the water surrounding the new island was discolored to dark brown-to-dark yellow-green (figure 27). No floating material was reported during this time. In comparison to the observations made on 23 November, the new land had extended N and part of it had eroded away. In addition, analysis by the Geospatial Information Authority of Japan using SAR data from Daichi-2 also confirmed that the area of the new island continued to decrease between 4 and 15 December. Ejected material combined with wave erosion transformed the island into a “J” shape, 500-m-long and with the curved part about 200 m offshore of Ioto. The island was covered with brown ash and blocks, and the surrounding water was discolored to greenish-brown and contained an area of floating pumice. JCG reported from an overflight on 4 December that volcanic ash-like material found around the S vent on the NE part of the island was newly deposited since 10 November (figure 28). By 15 December the N part of the “J” shaped island had separated and migrated N, connecting to the Okinahama coast and the curved part of the “J” had eroded into two smaller islands (figure 27).
References. Ukawa, M., Fujita, E., Kobayashi, T., 2002, Recent volcanic activity of Iwo Jima and the 2001 eruption, Monthly Chikyu, Extra No. 39, 157-164.
Geologic Background. Ioto, in the Volcano Islands of Japan, lies within a 9-km-wide submarine caldera. The volcano is also known as Ogasawara-Iojima to distinguish it from several other "Sulfur Island" volcanoes in Japan. The triangular, low-elevation, 8-km-long island narrows toward its SW tip and has produced trachyandesitic and trachytic rocks that are more alkalic than those of other volcanoes in this arc. The island has undergone uplift for at least the past 700 years, accompanying resurgent doming of the caldera; a shoreline landed upon by Captain Cook's surveying crew in 1779 is now 40 m above sea level. The Motoyama plateau on the NE half of the island consists of submarine tuffs overlain by coral deposits and forms the island's high point. Many fumaroles are oriented along a NE-SW zone cutting through Motoyama. Numerous recorded phreatic eruptions, many from vents on the W and NW sides of the island, have accompanied the uplift.
Information Contacts: Japan Meteorological Agency (JMA), 1-3-4 Otemachi, Chiyoda-ku, Tokyo 100-8122, Japan (URL: http://www.jma.go.jp/jma/indexe.html); Japan Coast Guard (JCG) Volcano Database, Hydrographic and Oceanographic Department, 3-1-1, Kasumigaseki, Chiyoda-ku, Tokyo 100-8932, Japan (URL: https://www1.kaiho.mlit.go.jp/GIJUTSUKOKUSAI/kaiikiDB/kaiyo22-2.htm); Copernicus Browser, Copernicus Data Space Ecosystem, European Space Agency (URL: https://dataspace.copernicus.eu/browser/); Asahi, 5-3-2, Tsukiji, Chuo Ward, Tokyo, 104-8011, Japan (URL: https://www.asahi.com/ajw/articles/15048458).
Purace (Colombia) — December 2023 Cite this Report
Purace
Colombia
2.3095°N, 76.3948°W; summit elev. 4650 m
All times are local (unless otherwise noted)
Gas-and-ash emission on 16 November 2023
Puracé, located in Colombia, is a stratovolcano that contains a 500-m-wide summit crater. It is part of the Los Coconucos volcanic chain that is a NW-SE trending group of seven cones and craters. The most recent eruption occurred during March 2022 that was characterized by frequent seismicity and gas-and-steam emissions (BGVN 47:06). This report covers a brief eruption during November 2023 based on monthly reports from the Popayán Observatory, part of the Servicio Geologico Colombiano (SGC).
Activity during November 2022 through November 2023 primarily consisted of seismicity: VT-type events, LP-type events, HB-type events, and TR-type events (table 4). Maximum sulfur dioxide values were measured weekly and ranged from 259-5,854 tons per day (t/d) during November 2022 through April 2023. White gas-and-steam emissions were also occasionally reported.
SGC issued a report on 25 October that noted a significant increase in the number of earthquakes associated with rock fracturing. These earthquakes were located SE of the crater between Puracé and Piocollo at depths of 1-4 km. There were no reported variations in sulfur dioxide values, but SGC noted high carbon dioxide values, compared to those recorded in the first half of 2023.
SGC reported that at 1929 on 16 November the seismic network detected a signal that was possibly associated with a gas-and-ash emission, though it was not confirmed in webcam images due to limited visibility. On 17 November an observer confirmed ash deposits on the N flank. Webcam images showed an increase in degassing both inside the crater and from the NW flank, rising 700 m above the crater.
Table 4. Seismicity at Puracé during November 2022-November 2023. Volcano-tectonic (VT), long-period (LP), hybrid (HB), and tremor (TR) events are reported each month. Courtesy of SGC.
| Month |
Volcano-tectonic |
Long-period |
Hybrid |
Tremor |
| Nov 2022 |
429 |
2,023 |
5 |
831 |
| Dec 2022 |
423 |
1,390 |
9 |
834 |
| Jan 2023 |
719 |
1,622 |
0 |
957 |
| Feb 2023 |
598 |
1,701 |
2 |
1,124 |
| Mar 2023 |
331 |
2,408 |
147 |
607 |
| Apr 2023 |
614 |
4,427 |
33 |
148 |
| May 2023 |
620 |
3,717 |
170 |
109 |
| Jun 2023 |
467 |
3,293 |
86 |
148 |
| Jul 2023 |
1,116 |
5,809 |
183 |
542 |
| Aug 2023 |
692 |
2,927 |
94 |
321 |
| Sep 2023 |
887 |
1,505 |
82 |
848 |
| Oct 2023 |
2,373 |
2,949 |
135 |
692 |
| Nov 2023 |
1,212 |
2,302 |
69 |
293 |
Geologic Background. Puracé is an active andesitic volcano with a 600-m-diameter summit crater at the NW end of the Los Coconucos Volcanic Chain. This volcanic complex includes nine composite and five monogenetic volcanoes, extending from the Puracé crater more than 6 km SE to the summit of Pan de Azúcar stratovolcano. The dacitic massif which the complex is built on extends about 13 km NW-SE and 10 km NE-SW. Frequent small to moderate explosive eruptions reported since 1816 CE have modified the morphology of the summit crater, with the largest eruptions in 1849, 1869, and 1885.
Information Contacts: Servicio Geologico Colombiano (SGC), Diagonal 53 No. 34-53 - Bogotá D.C., Colombia (URL: https://www.sgc.gov.co/volcanes).
Suwanosejima (Japan) — December 2023 Cite this Report
Suwanosejima
Japan
29.638°N, 129.714°E; summit elev. 796 m
All times are local (unless otherwise noted)
Eruption plumes, crater incandescence, and occasional explosions during July-October 2023
Suwanosejima is an 8-km-long island that consists of a stratovolcano and two active summit craters, located in the northern Ryukyu Islands, Japan. Volcanism over the past century has been characterized by Strombolian explosions, ash plumes, and ashfall. The current eruption began in October 2004 and has more recently consisted of frequent eruption plumes, explosions, and incandescent ejecta (BGVN 48:07). This report covers similar activity of ash plumes, explosions, and crater incandescence during July through October 2023 using monthly reports from the Japan Meteorological Agency (JMA) and satellite data.
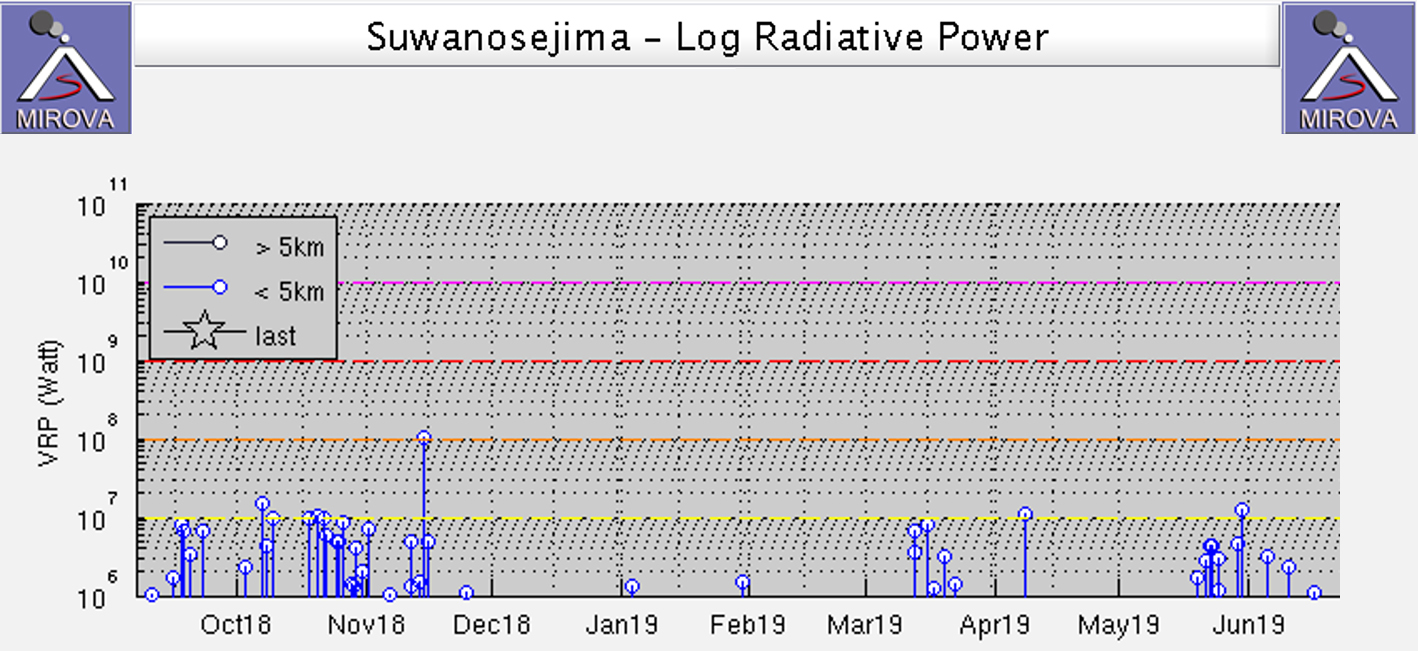
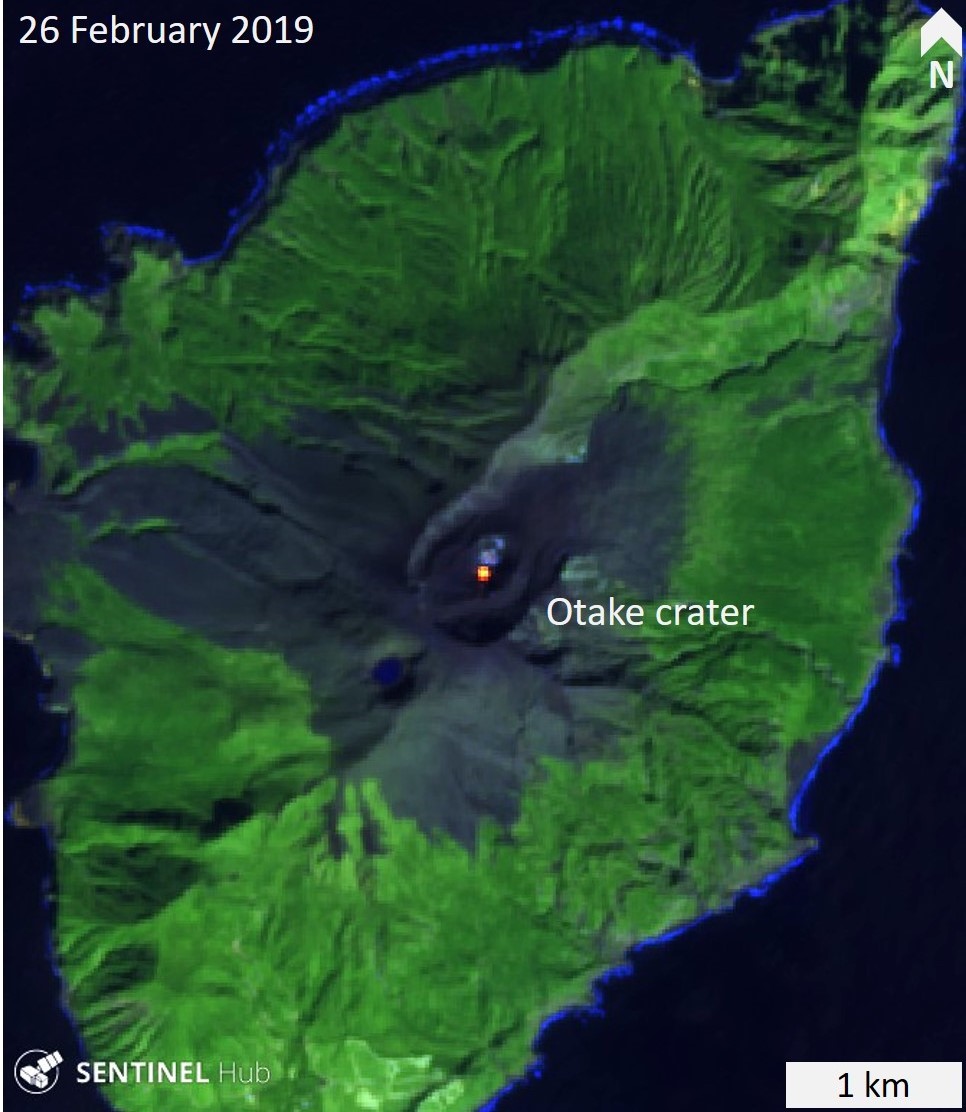
Thermal activity during the reporting period was relatively low; only one low-power thermal anomaly was detected during mid-July and one during early August, based on a MIROVA (Middle InfraRed Observation of Volcanic Activity) Log Radiative Power graph of the MODIS thermal anomaly data. On two clear weather days, a thermal anomaly was visible in infrared satellite images (figure 81).
Low-level activity was reported at the Otake crater during July and no explosions were detected. Eruption plumes rose as high as 1.8 km above the crater. On 13 July an ash plume rose 1.7 km above the crater rim, based on a webcam image. During the night of the 28th crater incandescence was visible in a webcam image. An eruptive event reported on 31 July produced an eruption plume that rose 2.1 km above the crater. Seismicity consisted of 11 volcanic earthquakes on the W flank, the number of which had decreased compared to June (28) and 68 volcanic earthquakes near the Otake crater, which had decreased from 722 in the previous month. According to observations conducted by the University of Tokyo Graduate School of Science, Kyoto University Disaster Prevention Research Institute, Toshima Village, and JMA, the amount of sulfur dioxide emissions released during the month was 400-800 tons per day (t/d).
Eruptive activity in the Otake crater continued during August and no explosions were reported. An eruptive event produced a plume that rose 1 km above the crater at 1447 on 12 August. Subsequent eruptive events were recorded at 0911 on 16 August, at 1303 on 20 August, and at 0317 on 21 August, which produced ash plumes that rose 1-1.1 km above the crater and drifted SE, SW, and W. On 22 August an ash plume was captured in a webcam image rising 1.4 km above the crater (figure 82). Multiple eruptive events were detected on 25 August at 0544, 0742, 0824, 1424, and 1704, which generated ash plumes that rose 1.1-1.2 km above the crater and drifted NE, W, and SW. On 28 August a small amount of ashfall was observed as far as 1.5 km from the crater. There were 17 volcanic earthquakes recorded on the W flank of the volcano and 79 recorded at the Otake crater during the month. The amount of sulfur dioxide emissions released during the month was 400-800 t/d.
Activity continued at the Otake crater during September. Occasionally, nighttime crater incandescence was observed in webcam images and ashfall was reported. An eruptive event at 1949 on 4 September produced an ash plume that rose 1 km above the crater and drifted SW. On 9 September several eruption events were detected at 0221, 0301, and 0333, which produced ash plumes that rose 1.1-1.4 km above the crater rim and drifted W; continuous ash emissions during 0404-0740 rose to a maximum height of 2 km above the crater rim (figure 83). More eruptive events were reported at 1437 on 10 September, at 0319 on 11 September, and at 0511 and 1228 on 15 September, which generated ash plumes that rose 1-1.8 km above the crater. During 25, 27, and 30 September, ash plumes rose as high as 1.3 km above the crater rim. JMA reported that large blocks were ejected as far as 300 m from the center of the crater. There were 18 volcanic earthquakes detected beneath the W flank and 82 volcanic earthquakes detected near the Otake crater. The amount of sulfur dioxide released during the month ranged from 600 to 1,600 t/d.
Activity during early-to-mid-October consisted of occasional explosions, a total number of 13, and ash plumes that rose as high as 1.9 km above the Otake crater rim on 29 October (figure 84). These explosions are the first to have occurred since June 2023. Continuous ash emissions were reported during 0510-0555 on 1 October. Explosions were recorded at 0304, 2141, and 2359 on 2 October, at 0112 on 3 October, and at 1326 on 6 October, which produced ash plumes that rose as high as 1 km above the crater rim and drifted SW and W. An explosion was noted at 0428 on 3 October, but emission details were unknown. A total of eight explosions were recorded by the seismic network at 1522 on 14 October, at 0337, 0433, 0555, 1008, and 1539 on 15 October, and at 0454 and 0517 on 16 October. Ash plumes from these explosions rose as high as 900 m above the crater and drifted SE. Eruptive events during 25-27 and 29-30 October generated plumes that rose as high as 1.9 km above the crater and drifted SE, S, and SW. Ash was deposited in Toshima village (3.5 km SSW). Eruptive activity occasionally ejected large volcanic blocks as far as 600 m from the crater. Nighttime crater incandescence was visible in webcams. Intermittent ashfall was reported as far as 1.5 km from the crater. There were 43 volcanic earthquakes detected on the W flank during the month, and 184 volcanic earthquakes detected near the Otake crater. The amount of sulfur dioxide emitted ranged between 400 and 900 t/d.
Geologic Background. The 8-km-long island of Suwanosejima in the northern Ryukyu Islands consists of an andesitic stratovolcano with two active summit craters. The summit is truncated by a large breached crater extending to the sea on the E flank that was formed by edifice collapse. One of Japan's most frequently active volcanoes, it was in a state of intermittent Strombolian activity from Otake, the NE summit crater, between 1949 and 1996, after which periods of inactivity lengthened. The largest recorded eruption took place in 1813-14, when thick scoria deposits covered residential areas, and the SW crater produced two lava flows that reached the western coast. At the end of the eruption the summit of Otake collapsed, forming a large debris avalanche and creating an open collapse scarp extending to the eastern coast. The island remained uninhabited for about 70 years after the 1813-1814 eruption. Lava flows reached the eastern coast of the island in 1884. Only about 50 people live on the island.
Information Contacts: Japan Meteorological Agency (JMA), 1-3-4 Otemachi, Chiyoda-ku, Tokyo 100-8122, Japan (URL: http://www.jma.go.jp/jma/indexe.html); MIROVA (Middle InfraRed Observation of Volcanic Activity), a collaborative project between the Universities of Turin and Florence (Italy) supported by the Centre for Volcanic Risk of the Italian Civil Protection Department (URL: http://www.mirovaweb.it/); Hawai'i Institute of Geophysics and Planetology (HIGP) - MODVOLC Thermal Alerts System, School of Ocean and Earth Science and Technology (SOEST), Univ. of Hawai'i, 2525 Correa Road, Honolulu, HI 96822, USA (URL: http://modis.higp.hawaii.edu/); Copernicus Browser, Copernicus Data Space Ecosystem, European Space Agency (URL: https://dataspace.copernicus.eu/browser/).
Etna
Italy
37.748°N, 14.999°E; summit elev. 3357 m
All times are local (unless otherwise noted)
Strombolian explosions, lava fountains, and lava flows during July-August 2023
Etna, located on the Italian island of Sicily, has had documented eruptions dating back to 1500 BCE. Activity typically originates from multiple cones at the summit, where several craters have formed and evolved. The currently active craters are Northeast Crater (NEC), Voragine (VOR), and Bocca Nuova (BN), and the Southeast Crater (SEC); VOR and BN were previously referred to as the “Central Crater”. The original Southeast crater formed in 1978, and a second eruptive site that opened on its SE flank in 2011 was named the New Southeast Crater (NSEC). Another eruptive site between the SEC and NSEC developed during early 2017 and was referred to as the "cono della sella" (saddle cone). The current eruption period began in November 2022 and has been characterized by intermittent Strombolian activity, lava flows, and ash plumes (BGVN 48:08). This report updates activity during July through October 2023, which includes primarily gas-and-steam emissions; during July and August Strombolian explosions, lava fountains, and lava flows were reported, based on weekly and special reports by the Osservatorio Etneo (OE), part of the Catania Branch of Italy's Istituo Nazionale di Geofisica e Vulcanologica (INGV) and satellite data.
Variable fumarolic degassing was reported at all summit craters (BN, VOR, NEC, and SEC) throughout the entire reporting period (table 15). The MIROVA (Middle InfraRed Observation of Volcanic Activity) volcano hotspot detection system based on the analysis of MODIS data showed frequent low-to-moderate power thermal anomalies during the reporting period (figure 399). During mid-August there was a pulse in activity that showed an increase in the power of the anomalies due to Strombolian activity, lava fountains, and lava flows. Infrared satellite imagery captured strong thermal anomalies at the central and southeast summit crater areas (figure 400). Accompanying thermal activity were occasional sulfur dioxide plumes that exceeded 2 Dobson Units (DUs) recorded by the TROPOMI instrument on the Sentinel-5P satellite (figure 401).
Table 15. Summary of activity at the four primary crater areas at the summit of Etna during July-October 2023. Information is from INGV weekly reports.
| Month |
Bocca Nuova (BN) |
Voragine (VOR) |
Northeast Crater (NEC) |
Southeast Crater (SEC) |
| Jul 2023 |
Continuous degassing. |
No observations. |
Weak gas emissions. |
Continuous degassing. Sporadic and weak-to-moderate ash emissions. Strombolian explosions. |
| Aug 2023 |
Continuous degassing. |
No observations. |
No observations. |
Continuous degassing. Occasional ash emissions. Strombolian activity, lava fountaining, and lava flows. |
| Sep 2023 |
Variable degassing. Crater incandescence. |
Weak fumarolic activity. |
Weak fumarolic activity. |
Variable degassing. |
| Oct 2023 |
Continuous degassing. |
Weak fumarolic activity. |
Weak fumarolic activity. |
Continuous degassing. |
Activity during July and August was relatively low and mainly consisted of degassing at the summit craters, particularly at SEC and BN. Cloudy weather prevented clear views of the summit during early July. During the night of 2 July some crater incandescence was visible at SEC. Explosive activity resumed at SEC during 9-10 July, which was characterized by sporadic and weak ash emissions that rapidly dispersed in the summit area (figure 402). INGV reported moderate Strombolian activity began at 2034 on 14 July and was confined to the inside of the crater and fed by a vent located in the E part of SEC. An ash emission was detected at 2037. A new vent opened on 15 July in the SE part of BN and began to produce continuous gas-and-steam emissions. During an inspection carried out on 28 July pulsating degassing, along with audible booms, were reported at two active vents in BN. Vigorous gas-and-steam emissions intermittently generated rings. On rare occasions, fine, reddish ash was emitted from BN1 and resuspended by the gas-and-steam emissions.
Around 2000 on 13 August INGV reported a sudden increase in volcanic tremor amplitude. Significant infrasonic activity coincided with the tremor increase. Incandescent flashes were visible through the cloud cover in webcam images of SEC (figure 403). Strombolian activity at SEC began to gradually intensify starting at 2040 as seismicity continued to increase. The Aviation Color Code (ACC) was raised to Yellow (the second lowest-level on a four-color scale) at 2126 and then to Orange (the second highest-level on a four-color scale) at 2129 due to above-background activity. The activity rapidly transitioned from Strombolian activity to lava fountains around 2333 that rose 300-400 m above the crater (figure 403). Activity was initially focused on the E vent of the crater, but then the vent located above the S flank of the cone also became active. A lava flow from this vent traveled SW into the drainage created on 10 February 2022, overlapping with previous flows from 10 and 21 February 2022 and 21 May 2023, moving between Monte Barbagallo and Monte Frumento Supino (figure 404). The lava flow was 350 m long, oriented NNE-SSW, and descended to an elevation of 2.8 km. Flows covered an area of 300,000 m2 and had an estimated volume of 900,000 m3. The ACC was raised to Red at 2241 based on strong explosive activity and ashfall in Rifugio Sapienza-Piano Vetore at 1.7 km elevation on the S flank. INGV reported that pyroclastic flows accompanied this activity.
Activity peaked between 0240 and 0330 on 14 August, when roughly 5-6 vents erupted lava fountains from the E to SW flank of SEC. The easternmost vents produced lava fountains that ejected material strongly to the E, which caused heavy fallout of incandescent pyroclastic material on the underlying flank, triggering small pyroclastic flows. This event was also accompanied by lightning both in the ash column and in the ash clouds that were generated by the pyroclastic flows. A fracture characterized by a series of collapse craters (pit craters) opened on the upper SW flank of SEC. An ash cloud rose a few kilometers above the crater and drifted S, causing ash and lapilli falls in Rifugio Sapienza and expanding toward Nicolosi, Mascalucia, Catania, and up to Syracuse. Ashfall resulted in operational problems at the Catania airport (50 km S), which lasted from 0238 until 2000. By 0420 the volcanic tremor amplitude values declined to background levels. After 0500 activity sharply decreased, although the ash cloud remained for several hours and drifted S. By late morning, activity had completely stopped. The ACC was lowered to Orange as volcanic ash was confined to the summit area. Sporadic, minor ash emissions continued throughout the day. At 1415 the ACC was lowered to Yellow and then to Green at 1417.
During the night of 14-15 August only occasional flashes were observed, which were more intense during avalanches of material inside the eruptive vents. Small explosions were detected at SEC at 2346 on 14 August and at 0900 on 26 August that each produced ash clouds which rapidly dispersed into the atmosphere (figure 405). According to a webcam image, an explosive event detected at 2344 at SEC generated a modest ash cloud that was rapidly dispersed by winds. The ACC was raised to Yellow at 2355 on 14 August due to increasing unrest and was lowered to Green at 0954 on 15 August.
Activity during September and October was relatively low and mainly characterized by variable degassing from BN and SEC. Intense, continuous, and pulsating degassing was accompanied by roaring sounds and flashes of incandescence at BN both from BN1 and the new pit crater that formed during late July (figure 406). The degassing from the new pit crater sometimes emitted vapor rings. Cloudy weather during 6-8 September prevented observations of the summit craters .
Geologic Background. Mount Etna, towering above Catania on the island of Sicily, has one of the world's longest documented records of volcanism, dating back to 1500 BCE. Historical lava flows of basaltic composition cover much of the surface of this massive volcano, whose edifice is the highest and most voluminous in Italy. The Mongibello stratovolcano, truncated by several small calderas, was constructed during the late Pleistocene and Holocene over an older shield volcano. The most prominent morphological feature of Etna is the Valle del Bove, a 5 x 10 km caldera open to the east. Two styles of eruptive activity typically occur, sometimes simultaneously. Persistent explosive eruptions, sometimes with minor lava emissions, take place from one or more summit craters. Flank vents, typically with higher effusion rates, are less frequently active and originate from fissures that open progressively downward from near the summit (usually accompanied by Strombolian eruptions at the upper end). Cinder cones are commonly constructed over the vents of lower-flank lava flows. Lava flows extend to the foot of the volcano on all sides and have reached the sea over a broad area on the SE flank.
Information Contacts: Sezione di Catania - Osservatorio Etneo, Istituto Nazionale di Geofisica e Vulcanologia (INGV), Sezione di Catania, Piazza Roma 2, 95123 Catania, Italy (URL: http://www.ct.ingv.it/it/); MIROVA (Middle InfraRed Observation of Volcanic Activity), a collaborative project between the Universities of Turin and Florence (Italy) supported by the Centre for Volcanic Risk of the Italian Civil Protection Department (URL: http://www.mirovaweb.it/); NASA Global Sulfur Dioxide Monitoring Page, Atmospheric Chemistry and Dynamics Laboratory, NASA Goddard Space Flight Center (NASA/GSFC), 8800 Greenbelt Road, Goddard MD 20771, USA (URL: https://so2.gsfc.nasa.gov/); Copernicus Browser, Copernicus Data Space Ecosystem, European Space Agency (URL: https://dataspace.copernicus.eu/browser/).
Aira
Japan
31.5772°N, 130.6589°E; summit elev. 1117 m
All times are local (unless otherwise noted)
Explosions, ash plumes, ash fall, and crater incandescence during July-October 2023
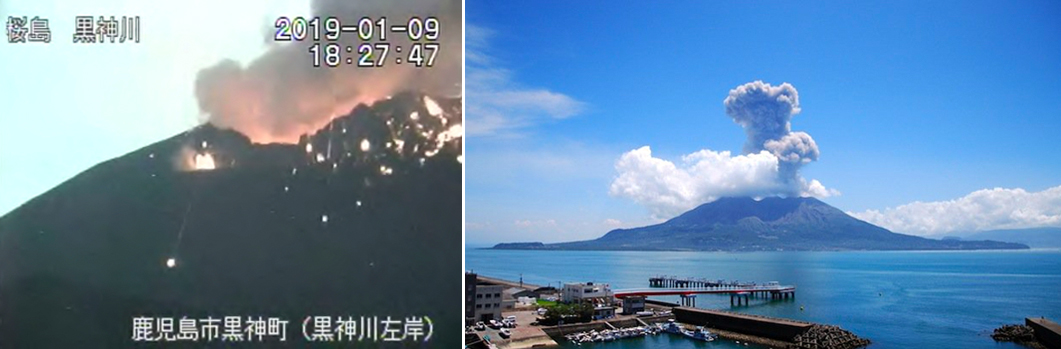
Aira caldera, located in the northern half of Kagoshima Bay, Japan, contains the post-caldera Sakurajima volcano. Eruptions typically originate from the Minamidake crater, and since the 8th century, ash deposits have been recorded in the city of Kagoshima (10 km W), one of Kyushu’s largest cities. The Minamidake summit cone and crater has had persistent activity since 1955; the Showa crater on the E flank has also been intermittently active since 2006. The current eruption period began during March 2017 and has recently been characterized by intermittent explosions, eruption plumes, and ashfall (BGVN 48:07). This report updates activity during July through October 2023 and describes explosive events, ash plumes, nighttime crater incandescence, and ashfall, according to monthly activity reports from the Japan Meteorological Agency (JMA) and satellite data.
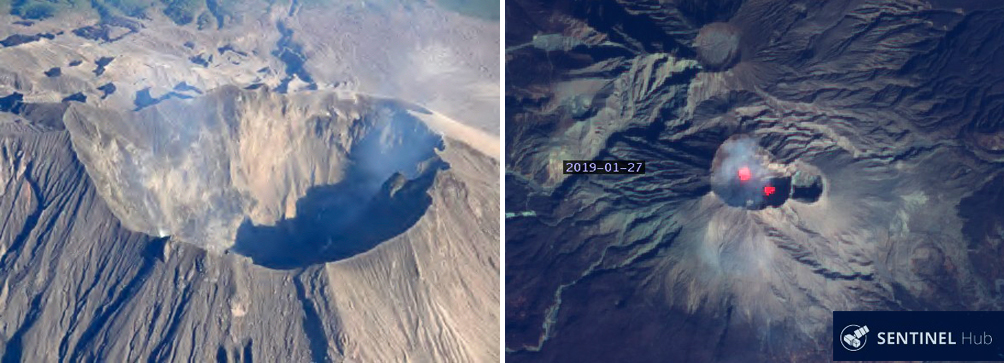
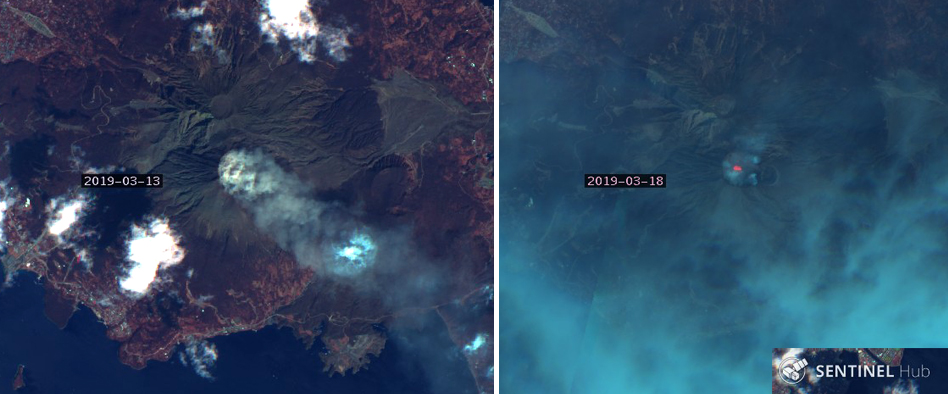
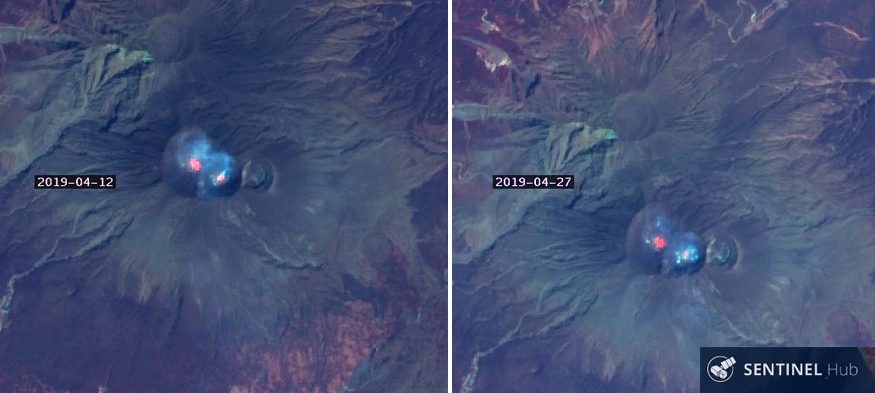
Thermal activity remained at low levels during this reporting period, according to the MIROVA (Middle InfraRed Observation of Volcanic Activity) system (figure 149). There was a slight increase in the number of anomalies during September through October. Occasional thermal anomalies were visible in infrared satellite images mainly at the Minamidake crater (Vent A is located to the left and Vent B is located to the right) (figure 150).
Table 30. Number of monthly explosive events, days of ashfall, area of ash covered, and sulfur dioxide emissions from Sakurajima’s Minamidake crater at Aira during July-October 2023. Note that smaller ash events are not listed. Ashfall days were measured at Kagoshima Local Meteorological Observatory and ashfall amounts represent material covering all the Kagoshima Prefecture. Data courtesy of JMA monthly reports.
| Month |
Explosive events |
Days of ashfall |
Ashfall amount (g/m2) |
SO2 emissions (tons/day) |
| Jul 2023 |
3 |
0 |
0 |
1,600-3,200 |
| Aug 2023 |
3 |
10 |
7 |
1,800-3,300 |
| Sep 2023 |
3 |
7 |
3 |
1,600-2,300 |
| Oct 2023 |
33 |
8 |
61 |
2,200-4,200 |
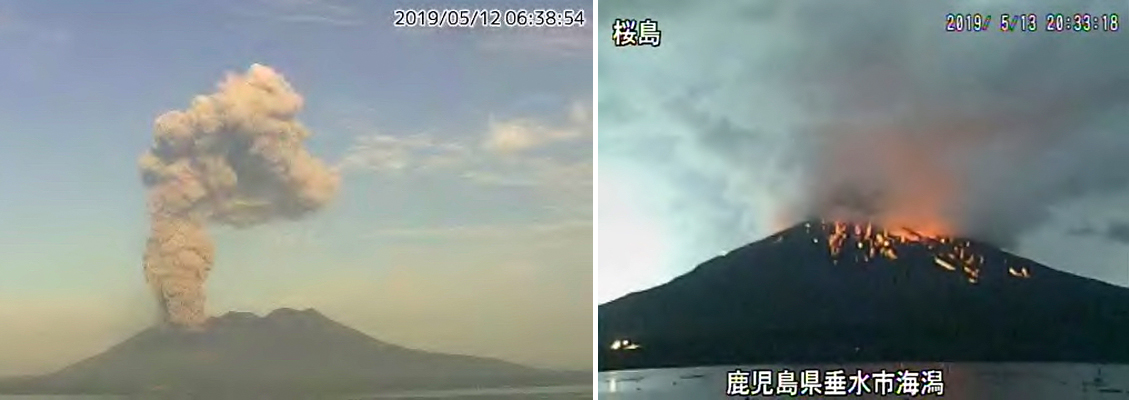
JMA reported that during July, there were eight eruptions, three of which were explosion events in the Showa crater. Large blocks were ejected as far as 600 m from the Showa crater. Very small eruptions were occasionally reported at the Minamidake crater. Nighttime incandescence was observed in both the Showa and Minamidake crater. Explosions were reported on 16 July at 2314 and on 17 July at 1224 and at 1232 (figure 151). Resulting eruption plumes rose 700-2,500 m above the crater and drifted N. On 23 July the number of volcanic earthquakes on the SW flank of the volcano increased. A strong Mw 3.1 volcanic earthquake was detected at 1054 on 26 July. The number of earthquakes recorded throughout the month was 545, which markedly increased from 73 in June. No ashfall was observed at the Kagoshima Regional Meteorological Observatory during July. According to a field survey conducted during the month, the daily amount of sulfur dioxide emissions was 1,600-3,200 tons per day (t/d).
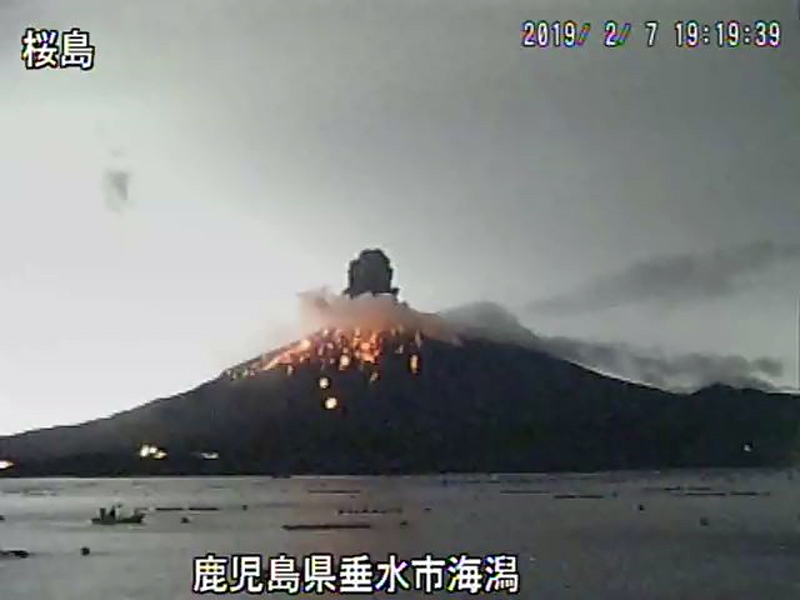
There were three eruptions reported at the Minamidake crater during August, each of which were explosive. The explosions occurred on 9 August at 0345, on 13 August at 2205, and on 31 August at 0640, which generated ash plumes that rose 800-2,000 m above the crater and drifted W. There were two eruptions detected at Showa crater; on 4 August at 2150 ejecta traveled 800 m from the Showa crater and associated eruption plumes rose 2.3 km above the crater. The explosion at 2205 on 13 August generated an ash plume that rose 2 km above the crater and was accompanied by large blocks that were ejected 600 m from the Minamidake crater (figure 152). Nighttime crater incandescence was visible in a high-sensitivity surveillance camera at both craters. Seismicity consisted of 163 volcanic earthquakes, 84 of which were detected on the SW flank. According to the Kagoshima Regional Meteorological Observatory there was a total of 7 g/m2 of ashfall over the course of 10 days during the month. According to a field survey, the daily amount of sulfur dioxide emitted was 1,800-3,300 t/d.
During September, four eruptions were reported, three of which were explosion events. These events occurred at 1512 on 9 September, at 0018 on 11 September, and at 2211 on 13 September. Resulting ash plumes generally rose 800-1,100 m above the crater. An explosion produced an ash plume at 2211 on 13 September that rose as high as 1.7 km above the crater. Large volcanic blocks were ejected 600 m from the Minamidake crater. Smaller eruptions were occasionally observed at the Showa crater. Nighttime crater incandescence was visible at the Minamidake crater. Seismicity was characterized by 68 volcanic earthquakes, 28 of which were detected beneath the SW flank. According to the Kagoshima Regional Meteorological Observatory there was a total of 3 g/m2 of ashfall over the course of seven days during the month. A field survey reported that the daily amount of sulfur dioxide emitted was 1,600-2,300 t/d.
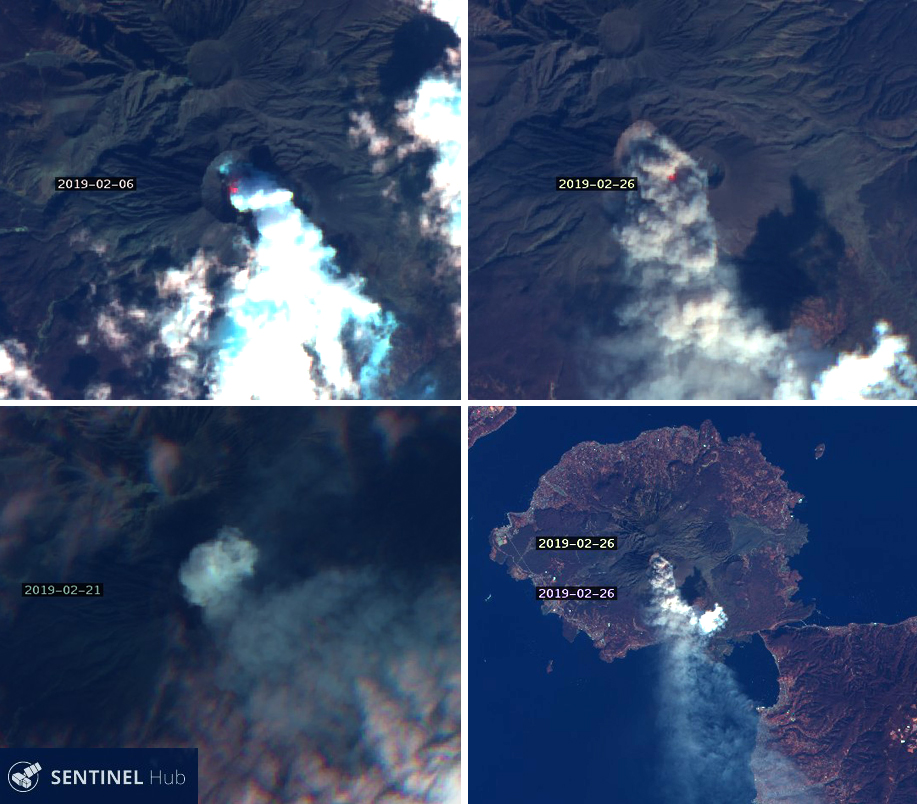
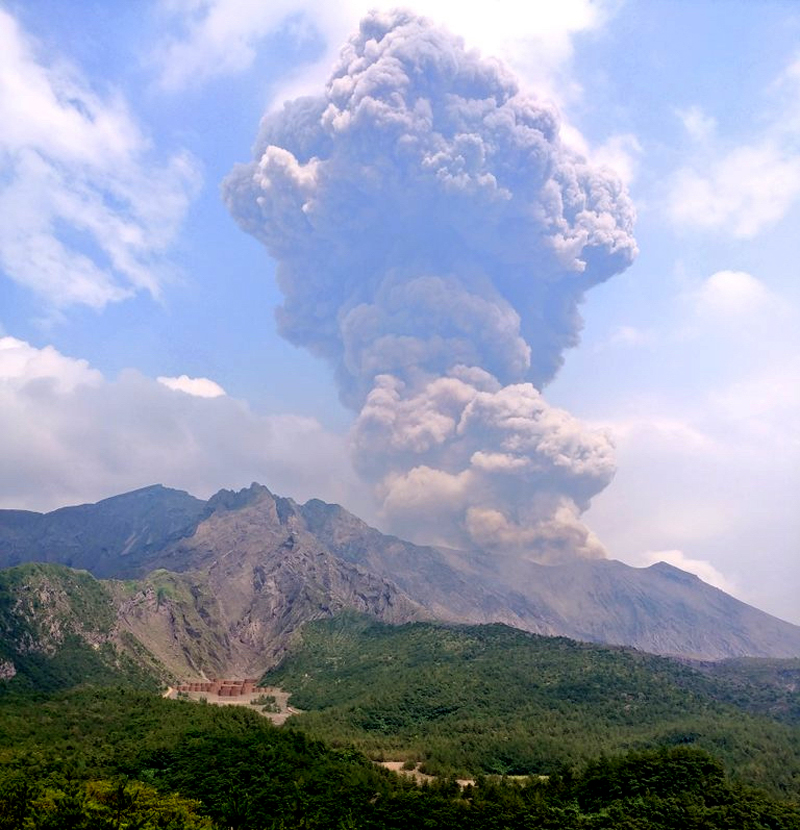
Eruptive activity during October consisted of 69 eruptions, 33 of which were described as explosive. These explosions occurred during 4 and 11-21 October and generated ash plumes that rose 500-3,600 m above the crater and drifted S, E, SE, and N. On 19 October at 1648 an explosion generated an ash plume that rose 3.6 km above the crater (figure 153). No eruptions were reported in the Showa crater; white gas-and-steam emissions rose 100 m above the crater from a vent on the N flank. Nighttime incandescence was observed at the Minamidake crater. On 24 October an eruption was reported from 0346 through 0430, which included an ash plume that rose 3.4 km above the crater. Ejected blocks traveled 1.2 km from the Minamidake crater. Following this eruption, small amounts of ashfall were observed from Arimura (4.5 km SE) and a varying amount in Kurokami (4 km E) (figure 154). The number of recorded volcanic earthquakes during the month was 190, of which 14 were located beneath the SW flank. Approximately 61 g/m2 of ashfall was reported over eight days of the month. According to a field survey, the daily amount of sulfur dioxide emitted was 2,200-4,200 t/d.
Geologic Background. The Aira caldera in the northern half of Kagoshima Bay contains the post-caldera Sakurajima volcano, one of Japan's most active. Eruption of the voluminous Ito pyroclastic flow accompanied formation of the 17 x 23 km caldera about 22,000 years ago. The smaller Wakamiko caldera was formed during the early Holocene in the NE corner of the caldera, along with several post-caldera cones. The construction of Sakurajima began about 13,000 years ago on the southern rim and built an island that was joined to the Osumi Peninsula during the major explosive and effusive eruption of 1914. Activity at the Kitadake summit cone ended about 4,850 years ago, after which eruptions took place at Minamidake. Frequent eruptions since the 8th century have deposited ash on the city of Kagoshima, located across Kagoshima Bay only 8 km from the summit. The largest recorded eruption took place during 1471-76.
Information Contacts: Japan Meteorological Agency (JMA), 1-3-4 Otemachi, Chiyoda-ku, Tokyo 100-8122, Japan (URL: http://www.jma.go.jp/jma/indexe.html); MIROVA (Middle InfraRed Observation of Volcanic Activity), a collaborative project between the Universities of Turin and Florence (Italy) supported by the Centre for Volcanic Risk of the Italian Civil Protection Department (URL: http://www.mirovaweb.it/); Copernicus Browser, Copernicus Data Space Ecosystem, European Space Agency (URL: https://dataspace.copernicus.eu/browser/).
Nishinoshima (Japan) — November 2023 Cite this Report
Nishinoshima
Japan
27.247°N, 140.874°E; summit elev. 100 m
All times are local (unless otherwise noted)
Gray emissions during October 2023
Nishinoshima is a small island in the Ogasawara Arc, about 1,000 km S of Tokyo, Japan. It contains prominent submarine peaks to the S, W, and NE. Recorded eruptions date back to 1973, with the current eruption period beginning in October 2022. Eruption plumes and fumarolic activity characterize recent activity (BGVN 48:10). This report covers the end of the eruption for September through October 2023, based on information from monthly reports of the Japan Meteorological Agency (JMA) monthly reports, and satellite data.
No eruptive activity was reported during September 2023, although JMA noted that the surface temperature was slightly elevated compared to the surrounding area since early March 2023. The Japan Coast Guard (JCG) conducted an overflight on 20 September and reported white gas-and-steam plumes rising 3 km above the central crater of the pyroclastic cone, as well as multiple white gas-and-steam emissions emanating from the N, E, and S flanks of the crater to the coastline. In addition, dark reddish brown-to-green discolored water was distributed around almost the entire circumference of the island.
Similar low-level activity was reported during October. Multiple white gas-and-steam emissions rose from the N, E, and S flanks of the central crater of the pyroclastic cone and along the coastline; these emissions were more intense compared to the previous overflight observations. Dark reddish brown-to-green discolored water remained visible around the circumference of the island. On 4 October aerial observations by JCG showed a small eruption consisting of continuous gas-and-steam emissions emanating from the central crater, with gray emissions rising to 1.5 km altitude (figure 129). According to observations from the marine weather observation vessel Keifu Maru on 26 October, white gas-and-steam emissions persisted from the center of the pyroclastic cone, as well as from the NW, SW, and SE coasts of the island for about five minutes. Slightly discolored water was visible up to about 1 km.
Frequent low-to-moderate power thermal anomalies were recorded in the MIROVA graph (Middle InfraRed Observation of Volcanic Activity) during September (figure 130). Occasional anomalies were detected during October, and fewer during November through December. A thermal anomaly was visible in the crater using infrared satellite imagery on 6, 8, 11, 16, 18, 21, and 23 September and 8, 13, 21, 26, and 28 October (figure 131).
Geologic Background. The small island of Nishinoshima was enlarged when several new islands coalesced during an eruption in 1973-74. Multiple eruptions that began in 2013 completely covered the previous exposed surface and continued to enlarge the island. The island is the summit of a massive submarine volcano that has prominent peaks to the S, W, and NE. The summit of the southern cone rises to within 214 m of the ocean surface 9 km SSE.
Information Contacts: Japan Meteorological Agency (JMA), 1-3-4 Otemachi, Chiyoda-ku, Tokyo 100-8122, Japan (URL: http://www.jma.go.jp/jma/indexe.html); MIROVA (Middle InfraRed Observation of Volcanic Activity), a collaborative project between the Universities of Turin and Florence (Italy) supported by the Centre for Volcanic Risk of the Italian Civil Protection Department (URL: http://www.mirovaweb.it/); Copernicus Browser, Copernicus Data Space Ecosystem, European Space Agency (URL: https://dataspace.copernicus.eu/browser/).
Kilauea (United States) — October 2023 Cite this Report
Kilauea
United States
19.421°N, 155.287°W; summit elev. 1222 m
All times are local (unless otherwise noted)
Strong lava fountains, lava flows, and spatter at Halema’uma’u during January-September 2023
Kīlauea is on the island of Hawai’i and overlaps the E flank of the Mauna Loa volcano. Its East Rift Zone (ERZ) has been intermittently active for at least 2,000 years. An extended eruption period began in January 1983 and was characterized by open lava lakes and lava flows from the summit caldera and the East Rift Zone. During May 2018 magma migrated into the Lower East Rift Zone (LERZ) and opened 24 fissures along a 6-km-long NE-trending fracture zone that produced lava flows traveling in multiple directions. As lava emerged from the fissures, the lava lake at Halema'uma'u drained and explosions sent ash plumes to several kilometers altitude (BGVN 43:10).
The current eruption period started during September 2021 and has been characterized by low-level lava effusions in the active Halema’uma’u lava lake (BGVN 48:01). This report covers three notable eruption periods during February, June, and September 2023 consisting of lava fountaining, lava flows, and spatter during January through September 2023 using information from daily reports, volcanic activity notices, and abundant photo, map, and video data from the US Geological Survey's (USGS) Hawaiian Volcano Observatory (HVO).
Activity during January 2023. Small earthquake swarms were recorded on 2 January 2023; increased seismicity and changes in the pattern of deformation were noted on the morning of 5 January. At around 1500 both the rate of deformation and seismicity drastically increased, which suggested magma movement toward the surface. HVO raised the Volcano Alert Level (VAL) to Watch (the second highest level on a four-level scale) and the Aviation Color Code (ACC) to Orange (the second highest color on a four-color scale) at 1520.
Multiple lava fountains and lava effusions from vents in the central eastern portion of the Halema’uma’u crater began on 5 January around 0434; activity was confined to the eastern half of the crater and within the basin of the western half of the crater, which was the focus of the eruption in 2021-2022 (figure 525). Incandescence was visible in webcam images at 1634 on 5 January, prompting HVO to raise the VAL to Warning (the highest level on a four-level scale) and the ACC to Red (the highest color on a four-color scale). Lava fountains initially rose as high as 50 m above the vent at the onset of the eruption (figure 526) but then declined to a more consistent 5-6 m height in the proceeding days. By 1930 that same day, lava had covered most of the crater floor (an area of about 1,200,000 m2) and the lava lake had a depth of 10 m. A higher-elevation island that formed during the initial phase of the December 2020 eruption remained exposed, appearing darker in images, along with a ring of older lava around the lava lake that was active prior to December 2022. Overnight during 5-6 January the lava fountains continued to rise 5 m high, and the lava effusion rate had slowed.
On 6 January at 0815 HVO lowered the VAL to Watch and the ACC to Orange due to the declining effusion rates. Sulfur dioxide emission rates ranged from 3,000-12,500 tonnes per day (t/d), the highest value of which was recorded on 6 January. Lava continued to erupt from the vents during 6-8 January, although the footprint of the active area had shrunk; a similar progression has been commonly observed during the early stages of recent eruptions at Halema’uma’u. On 9 January HVO reported one dominant lava fountain rising 6-7 m high in the E half of the crater. Lava flows built up the margins of the lake, causing the lake to be perched. On 10 January the eastern lava lake had an area of approximately 120,000 m2 that increased to 250,000 m2 by 17 January. During 13-31 January several small overflows occurred along the margins of the E lake. A smaller area of lava was active within the basin in the W half of the crater that had been the focus of activity during 2021-2022. On 19 January just after 0200 a small ooze-out was observed on the crater’s W edge.
Activity during February 2023. Activity continued in the E part of Halema’uma’u crater, as well as in a smaller basin in the W part of the 2021-2022 lava lake (figure 527). The E lava lake contained a single lava fountain and frequent overflows. HVO reported that during the morning of 1 February the large E lava lake began to cool and crust over in the center of the lake; two smaller areas of lava were observed on the N and S sides by the afternoon. The dominant lava fountain located in the S part of the lava lake paused for roughly 45 minutes at 2315 and resumed by midnight, rising 1-2 m. At 0100 on 2 February lava from the S part was effusing across the entire E lava lake area, covering the crusted over portion in the center of the lake and continuing across the majority of the previously measured 250,000 m2 by 0400. A small lava pond near the E lake produced an overflow around 0716 on 2 February. On 3 February some lava crust began to form against the N and E levees, which defined the 250,000 m2 eastern lava lake. The small S lava fountain remained active, rising 1-6 m high during 3-9 February; around 0400 on 5 February occasional bursts doubled the height of the lava fountain.
A large breakout occurred overnight during 2100 on 4 February to 0900 on 5 February on the N part of the crater floor, equal to or slightly larger in size than the E lava lake. A second, smaller lava fountain appeared in the same area of the E lava lake between 0300 and 0700 on 5 February and was temporarily active. This large breakout continued until 7 February. A small, brief breakout was reported in the S of the E lava lake around midnight on 7 February. In the W lake, as well as the smaller lava pond in the central portion of the crater floor, contained several overflows during 7-10 February and intermittent fountaining. Activity at the S small lava pond and the small S lava fountain within the E lake declined during 9-10 February. The lava pond in the central portion of the crater floor had nearly continuous, expansive flows during 10-13 February; channels from the small central lava pond seemed to flow into the larger E lake. During 13-18 February a small lava fountain was observed in the small lava pond in the central portion of the crater floor. Continuous overflows persisted during this time.
Activity in the eastern and central lakes began to decline in the late afternoon of 17 February. By 18 February HVO reported that the lava effusions had significantly declined, and that the eastern and central lakes were no longer erupting. The W lake in the basin remained active but at a greatly reduced level that continued to decline. HVO reported that this decrease in activity is attributed to notable deflationary tilt that began early on the morning of 17 February and lasted until early 19 February. By 19 February the W lake was mostly crusted over although some weak lava flows remained, which continued through 28 February. The sulfur dioxide emission rates ranged 250-2,800 t/d, the highest value of which was recorded on 6 February.
Activity during March 2023. The summit eruption at Halema’uma’u crater continued at greatly reduced levels compared to the previous two months. The E and central vents stopped effusing lava, and the W lava lake remained active with weak lava flows; the lake was mostly crusted over, although slowly circulating lava intermittently overturned the crust. By 6 March the lava lake in the W basin had stopped because the entire surface was crusted over. The only apparent surface eruptive activity during 5-6 March was minor ooze-outs of lava onto the crater floor, which had stopped by 7 March. Several hornitos on the crater floor still glowed through 12 March according to overnight webcam images, but they did not erupt any lava. A small ooze-out of lava was observed just after 1830 in the W lava lake on 8 March, which diminished overnight. The sulfur dioxide emission rate ranged from 155-321 t/d on 21 March. The VAL was lowered to Advisory, and the ACC was lowered to Yellow (the second lowest on a four-color scale) on 23 March due to a pause in the eruption since 7 March.
Activity during April-May 2023. The eruption at Halema’uma’u crater was paused; no lava effusions were visible on the crater floor. Sulfur dioxide emission rates ranged from 75-185 t/d, the highest of which was measured on 22 April. During May and June summit seismicity was elevated compared to seismicity that preceded the activity during January.
Activity during June 2023. Earthquake activity and changes in the patterns of ground deformation beneath the summit began during the evening of 6 June. The data indicated magma movement toward the surface, prompting HVO to raise the VAL to Watch and the ACC to Orange. At about 0444 on 7 June incandescence in Halema’uma’u crater was visible in webcam images, indicating that a new eruption had begun. HVO raised the VAL to Warning and the ACC to Red (the highest color on a four-color scale). Lava flowed from fissures that had opened on the crater floor. Multiple minor lava fountains were active in the central E portion of the Halema’uma’u crater, and one vent opened on the W wall of the caldera (figure 528). The eruptive vent on the SW wall of the crater continued to effuse into the lava lake in the far SW part of the crater (figure 529). The largest lava fountain consistently rose 15 m high; during the early phase of the eruption, fountain bursts rose as high as 60 m. Lava flows inundated much of the crater floor and added about 6 m depth of new lava within a few hours, covering approximately 10,000 m2. By 0800 on 7 June lava filled the crater floor to a depth of about 10 m. During 0800-0900 the sulfur dioxide emission rate was about 65,000 t/d. Residents of Pahala (30 km downwind of the summit) reported minor deposits of fine, gritty ash and Pele’s hair. A small spatter cone had formed at the vent on the SW wall by midday, and lava from the cone was flowing into the active lava lake. Fountain heights had decreased from the onset of the eruption and were 4-9 m high by 1600, with occasional higher bursts. Inflation switched to deflation and summit earthquake activity greatly diminished shortly after the eruption onset.
At 0837 on 8 June HVO lowered the VAL to Watch and the ACC to Orange because the initial high effusion rates had declined, and no infrastructure was threatened. The surface of the lava lake had dropped by about 2 m, likely due to gas loss by the morning of 8 June. The drop left a wall of cooled lava around the margins of the crater floor. Lava fountain heights decreased during 8-9 June but continued to rise to 10 m high. Active lava and vents covered much of the W half of Halema’uma’u crater in a broad, horseshoe-shape around a central, uplifted area (figure 530). The preliminary average effusion rate for the first 24 hours of the eruption was about 150 cubic meters per second, though the estimate did not account for vesiculated lava and variations in crater floor topography. The effusion rate during the very earliest phases of the eruption appeared significantly higher than the previous three summit eruptions based on the rapid coverage of the entire crater floor. An active lava lake, also referred to as the “western lava lake” was centered within the uplifted area and was fed by a vent in the NE corner. Two small active lava lakes were located just SE from the W lava lake and in the E portion of the crater floor.
During 8-9 June the lava in the central lava lake had a thickness of approximately 1.5 m, based on measurements from a laser rangefinder. During 9-12 June the height of the lava fountains decreased to 9 m high. HVO reported that the previously active lava lake in the E part of the crater appeared stagnant during 10-11 June. The surface of the W lake rose approximately 1 m overnight during 11-12 June, likely due to the construction of a levee around it. Only a few small fountains were active during 12-13 June; the extent of the active lava had retreated so that all activity was concentrated in the SW and central parts of Halema’uma’u crater. Intermittent spattering from the vent on the SW wall was visible in overnight webcam images during 13-18 June. On the morning of 14 June a weak lava effusion originated from near the western eruptive vent, but by 15 June there were no signs of continued activity. HVO reported that other eruptive vents in the SW lava lake had stopped during this time, following several days of waning activity; lava filled the lake by about 0.5 m. Lava circulation continued in the central lake and no active lava was reported in the northern or eastern parts of the crater. Around 0800 on 15 June the top of the SW wall spatter cone collapsed, which was followed by renewed and constant spattering from the top vent and a change in activity from the base vent; several new lava flows effused from the top of the cone, as well as from the pre-existing tube-fed flow from its base. Accumulation of lava on the floor resulted in a drop of the central basin relative to the crater floor, allowing several overflows from the SW lava lake to cascade into the basin during the night of 15 June into the morning of 16 June.
Renewed lava fountaining was reported at the eruptive vent on the SW side of the crater during 16-19 June, which effused lava into the far SW part of the crater. This activity was described as vigorous during midday on 16 June; a group of observatory geologists estimated that the lava was consistently ejected at least 10 m high, with some spatter ejected even higher and farther. Deposits from the fountain further heightened and widened the spatter cone built around the original eruptive vent in the lower section of the crater wall. Multiple lava flows from the base of the cone were fed into the SW lava lake and onto the southwestern-most block from the 2018 collapse within Halema’uma’u on 17 June (figure 531); by 18 June they focused into a single flow feeding into the SW lava lake. On the morning of 19 June a second lava flow from the base of the eruptive cone advanced into the SW lava lake.
Around 1600 on 19 June there was a rapid decline in lava fountaining and effusion at the eruptive vent on the SW side of the crater; vent activity had been vigorous up to that point (figure 532). Circulation in the lava lake also slowed, and the lava lake surface dropped by several meters. Overnight webcam images showed some previously eruptive lava still flowing onto the crater floor, which continued until those flows began to cool. By 21 June no lava was erupting in Halema’uma’u crater. Overnight webcam images during 29-30 June showed some incandescence from previously erupted lava flows as they continued to cool. Seismicity in the crater declined to low levels. Sulfur dioxide emission rates ranged 160-21,000 t/d throughout the month, the highest measurement of which was recorded on 8 June. On 30 June the VAL was lowered to Advisory (the second level on a four-level scale) and the ACC was lowered to Yellow. Gradual inflation was detected at summit tiltmeters during 19-30 June.
Activity during July-August 2023. During July, the eruption paused; no lava was erupting in Halema’uma’u crater. Nighttime webcam images showed some incandescence from previously erupted lava as it continued to cool on the crater floor. During the week of 14 August HVO reported that the rate in seismicity increased, with 467 earthquakes of Mw 3.2 and smaller occurring. Sulfur dioxide emission rates remained low, ranging from 75-86 t/d, the highest of which was recorded on 10 and 15 August. On 15 August beginning at 0730 and lasting for several hours, a swarm of approximately 50 earthquakes were detected at a depth of 2-3 km below the surface and about 2 km long directly S of Halema’uma’u crater. HVO reported that this was likely due to magma movement in the S caldera region. During 0130-0500 and 1700-2100 on 21 August two small earthquake swarms of approximately 20 and 25 earthquakes, respectively, occurred at the same location and at similar depths. Another swarm of 50 earthquakes were recorded during 0430-0830 on 23 August. Elevated seismicity continued in the S area through the end of the month.
Activity during September 2023. Elevated seismicity persisted in the S summit with occasional small, brief seismic swarms. Sulfur dioxide measurements were relatively low and were 70 t/d on 8 September. About 150 earthquakes occurred during 9-10 September, and tiltmeter and Global Positioning System (GPS) data showed inflation in the S portion of the crater.
At 0252 on 10 September HVO raised the VAL to Watch and the ACC to Orange due to increased earthquake activity and changes in ground deformation that indicated magma moving toward the surface. At 1515 the summit eruption resumed in the E part of the caldera based on field reports and webcam images. Fissures opened on the crater floor and produced multiple minor lava fountains and flows (figure 533). The VAL and ACC were raised to Warning and Red, respectively. Gas-and-steam plumes rose from the fissures and drifted downwind. A line of eruptive vents stretched approximately 1.4 km from the E part of the crater into the E wall of the down dropped block by 1900. The lava fountains at the onset of the eruption had an estimated 50 m height, which later rose 20-25 m high. Lava erupted from fissures on the down dropped block and expanded W toward Halema’uma’u crater. Data from a laser rangefinder recorded about 2.5 m thick of new lava added to the W part of the crater. Sulfur dioxide emissions were elevated in the eruptive area during 1600-1500 on 10 September, measuring at least 100,000 t/d.
At 0810 on 11 September HVO lowered the VAL and ACC back to Watch and Orange due to the style of eruption and the fissure location had stabilized. The initial extremely high effusion rates had declined (but remained at high levels) and no infrastructure was threatened. An eruption plume, mainly comprised of sulfur dioxide and particulates, rose as high as 3 km altitude. Several lava fountains were active on the W side of the down dropped block during 11-15 September, while the easternmost vents on the down dropped block and the westernmost vents in the crater became inactive on 11 September (figure 534). The remaining vents spanned approximately 750 m and trended roughly E-W. The fed channelized lava effusions flowed N and W into Halema’uma’u. The E rim of the crater was buried by new lava flows; pahoehoe lava flows covered most of the crater floor except areas of higher elevation in the SW part of the crater. The W part of the crater filled about 5 m since the start of the eruption, according to data from a laser rangefinder during 11-12 September. Lava fountaining continued, rising as high as 15 m by the morning of 12 September. During the morning of 13 September active lava flows were moving on the N and E parts of the crater. The area N of the eruptive vents that had active lava on its surface became perched and was about 3 m higher than the surrounding ground surface. By the morning of 14 September active lava was flowing on the W part of the down dropped block and the NE parts of the crater. The distances of the active flows progressively decreased. Spatter had accumulated on the S (downwind) side of the vents, forming ramparts about 20 m high.
Vigorous spattering was restricted to the westernmost large spatter cone with fountains rising 10-15 m high. Minor spattering occurred within the cone to the E of the main cone, but HVO noted that the fountains remained mostly below the rim of the cone. Lava continued to effuse from these cones and likely from several others as well, traveled N and W, confined to the W part of the down-dropped block and the NE parts of Halema’uma’u. Numerous ooze-outs of lava were visible over other parts of the crater floor at night. Laser range-finder measurements taken of the W part of the crater during 14-15 September showed that lava filled the crater by 10 m since the start of the eruption. Sulfur dioxide emissions remained elevated after the onset of the eruption, ranging 20,000-190,000 t/d during the eruption activity, the highest of which occurred on 10 September.
Field crews observed the eruptive activity on 15 September; they reported a notable decrease or stop in activity at several vents. Webcam images showed little to no fountaining since 0700 on 16 September, though intermittent spattering continued from the westernmost large cone throughout the night of 15-16 September. Thermal images showed that lava continued to flow onto the crater floor. On 16 September HVO reported that the eruption stopped around 1200 and that there was no observable activity anywhere overnight or on the morning of 17 September. HVO field crews reported that active lava was no longer flowing onto Halema’uma’u crater floor and was restricted to a ponded area N of the vents on the down dropped block. They reported that spattering stopped around 1115 on 16 September. Nighttime webcam images showed some incandescence on the crater floor as lava continued to cool. Field observations supported by geophysical data showed that eruptive tremor in the summit region decreased over 15-16 September and returned to pre-eruption levels by 1700 on 16 September. Sulfur dioxide emissions were measured at a rate of 800 t/d on 16 September while the eruption was waning, and 200 t/d on 17 September, which were markedly lower compared to measurements taken the previous week of 20,000-190,000 t/d.
Geologic Background. Kilauea overlaps the E flank of the massive Mauna Loa shield volcano in the island of Hawaii. Eruptions are prominent in Polynesian legends; written documentation since 1820 records frequent summit and flank lava flow eruptions interspersed with periods of long-term lava lake activity at Halemaumau crater in the summit caldera until 1924. The 3 x 5 km caldera was formed in several stages about 1,500 years ago and during the 18th century; eruptions have also originated from the lengthy East and Southwest rift zones, which extend to the ocean in both directions. About 90% of the surface of the basaltic shield volcano is formed of lava flows less than about 1,100 years old; 70% of the surface is younger than 600 years. The long-term eruption from the East rift zone between 1983 and 2018 produced lava flows covering more than 100 km2, destroyed hundreds of houses, and added new coastline.
Information Contacts: Hawaiian Volcano Observatory (HVO), U.S. Geological Survey, PO Box 51, Hawai'i National Park, HI 96718, USA (URL: http://hvo.wr.usgs.gov/).
Tinakula (Solomon Islands) — December 2023 Cite this Report
Tinakula
Solomon Islands
10.386°S, 165.804°E; summit elev. 796 m
All times are local (unless otherwise noted)
Continued lava flows and thermal activity during June through November 2023
Tinakula is a remote 3.5 km-wide island in the Solomon Islands, located 640 km ESE of the capital, Honiara. The current eruption period began in December 2018 and has more recently been characterized by intermittent lava flows and thermal activity (BGVN 48:06). This report covers similar activity during June through November 2023 using satellite data.
During clear weather days (20 July, 23 September, 23 October, and 12 November), infrared satellite imagery showed lava flows that mainly affected the W side of the island and were sometimes accompanied by gas-and-steam emissions (figure 54). The flow appeared more intense during July and September compared to October and November. According to the MODVOLC thermal alerts, there were a total of eight anomalies detected on 19 and 21 July, 28 and 30 October, and 16 November. Infrared MODIS satellite data processed by MIROVA (Middle InfraRed Observation of Volcanic Activity) detected a small cluster of thermal activity occurring during late July, followed by two anomalies during August, two during September, five during October, and five during November (figure 55).
Geologic Background. The small 3.5-km-wide island of Tinakula is the exposed summit of a massive stratovolcano at the NW end of the Santa Cruz islands. It has a breached summit crater that extends from the summit to below sea level. Landslides enlarged this scarp in 1965, creating an embayment on the NW coast. The Mendana cone is located on the SE side. The dominantly andesitic volcano has frequently been observed in eruption since the era of Spanish exploration began in 1595. In about 1840, an explosive eruption apparently produced pyroclastic flows that swept all sides of the island, killing its inhabitants. Recorded eruptions have frequently originated from a cone constructed within the large breached crater. These have left the upper flanks and the steep apron of lava flows and volcaniclastic debris within the breach unvegetated.
Information Contacts: MIROVA (Middle InfraRed Observation of Volcanic Activity), a collaborative project between the Universities of Turin and Florence (Italy) supported by the Centre for Volcanic Risk of the Italian Civil Protection Department (URL: http://www.mirovaweb.it/); Hawai'i Institute of Geophysics and Planetology (HIGP) - MODVOLC Thermal Alerts System, School of Ocean and Earth Science and Technology (SOEST), Univ. of Hawai'i, 2525 Correa Road, Honolulu, HI 96822, USA (URL: http://modis.higp.hawaii.edu/); Copernicus Browser, Copernicus Data Space Ecosystem, European Space Agency (URL: https://dataspace.copernicus.eu/browser/).
Search Bulletin Archive by Publication Date
Select a month and year from the drop-downs and click "Show Issue" to have that issue displayed in this tab.
The default month and year is the latest issue available.
Bulletin of the Global Volcanism Network - Volume 44, Number 07 (July 2019)
Aira (Japan)
Explosions with ejecta and ash plumes continue weekly during January-June 2019
Asosan (Japan)
Multiple brief ash emission events during April and May 2019; minor ashfall in adjacent villages
Ebeko (Russia)
Continuing frequent moderate explosions though May 2019; ashfall in Severo-Kurilsk
Fournaise, Piton de la (France)
Eruptive episodes in February-March and June 2019; multiple fissures and lava flows
Great Sitkin (United States)
Small steam explosions in early June 2019
Ibu (Indonesia)
Frequent ash plumes and small lava flows active in the crater through June 2019
Klyuchevskoy (Russia)
Weak thermal anomalies and moderate Strombolian-type eruptions in September 2018-June 2019
Sangay (Ecuador)
Explosion on 26 March 2019; activity from 10 May through June produced ash plumes, lava flows, and pyroclastic flows
Suwanosejima (Japan)
Small ash plumes continued during January through June 2019
Tinakula (Solomon Islands)
Thermal anomalies in satellite data December 2018-June 2019; ship visit January 2019
Aira
Japan
31.5772°N, 130.6589°E; summit elev. 1117 m
All times are local (unless otherwise noted)
Explosions with ejecta and ash plumes continue weekly during January-June 2019
Sakurajima rises from Kagoshima Bay, which fills the Aira Caldera near the southern tip of Japan's Kyushu Island. Frequent explosive and occasional effusive activity has been ongoing for centuries. The Minamidake summit cone has been the location of persistent activity since 1955; the Showa crater on its E flank has also been intermittently active since 2006. Numerous explosions and ash-bearing emissions have been occurring each month at either Minamidake or Showa crater since the latest eruptive episode began in late March 2017. This report covers ongoing activity from January through June 2019; the Japan Meteorological Agency (JMA) provides regular reports on activity, and the Tokyo VAAC (Volcanic Ash Advisory Center) issues tens of reports each month about the frequent ash plumes.
From January to June 2019, ash plumes and explosions were usually reported multiple times each week. The quietest month was June with only five eruptive events; the most active was March with 29 (table 21). Ash plumes rose from a few hundred meters to 3,500 m above the summit during the period. Large blocks of incandescent ejecta traveled as far as 1,700 m from the Minamidake crater during explosions in February and April. All the activity originated in the Minamidake crater; the adjacent Showa crater only had a mild thermal anomaly and fumarole throughout the period. Satellite imagery identified thermal anomalies inside the Minamidake crater several times each month.
Table 21. Monthly summary of eruptive events recorded at Sakurajima's Minamidake crater in Aira caldera, January-June 2019. The number of events that were explosive in nature are in parentheses. No events were recorded at the Showa crater during this time. Data courtesy of JMA (January to June 2019 monthly reports).
| Month |
Ash emissions (explosive) |
Max. plume height above crater |
Max. ejecta distance from crater |
| Jan 2019 |
8 (6) |
2.1 km |
1.1 km |
| Feb 2019 |
15 (11) |
2.3 km |
1.7 km |
| Mar 2019 |
29 (12) |
3.5 km |
1.3 km |
| Apr 2019 |
10 (5) |
2.2 km |
1.7 km |
| May 2019 |
15 (9) |
2.9 km |
1.3 km |
| Jun 2019 |
5 (2) |
2.2 km |
1.3 km |
There were eight eruptive events reported by JMA during January 2019 at the Minamidake summit crater of Sakurajima. They occurred on 3, 6, 7, 9, 17, and 19 January (figure 76). Ash plume heights ranged from 600 to 2,100 m above the summit. The largest explosion, on 9 January, generated an ash plume that rose 2,100 m above the summit crater and drifted E. In addition, incandescent ejecta was sent 800-1,100 m from the summit. Incandescence was visible at the summit on most clear nights. During an overflight on 18 January no significant changes were noted at the crater (figure 77). Infrared thermal imaging done on 29 January indicated a weak thermal anomaly in the vicinity of the Showa crater on the SE side of Minamidake crater. The Kagoshima Regional Meteorological Observatory (KRMO) (11 km WSW) recorded ashfall there during four days of the month. Satellite imagery indicated thermal anomalies inside Minamidake on 7 and 27 January (figure 77).
Activity increased during February 2019, with 15 eruptive events reported on days 1, 3, 7, 8, 10, 13, 14, 17, 22, 24, and 27. Ash plume heights ranged from 600-2,300 m above the summit, and ejecta was reported 300 to 1,700 m from the crater in various events (figure 78). KRMO reported two days of ashfall during February. Satellite imagery identified thermal anomalies at the crater on 6 and 26 February, and ash plumes on 21 and 26 February (figure 79).
The number of eruptive events continued to increase during March 2019; there were 29 events reported on numerous days (figures 80 and 81). An explosion on 14 March produced an ash plume that rose 3,500 m above the summit and drifted E. It also produced ejecta that landed 800-1,100 m from the crater. During an overflight on 26 March a fumarole was the only activity in Showa crater. KRMO reported 14 days of ashfall during the month. Satellite imagery identified an ash plume on 13 March and a thermal anomaly on 18 March (figure 82).
A decline in activity to only ten eruptive events on days 7, 13, 17, 22, and 25 was reported by JMA for April 2019. An explosion on 7 April sent ejecta up to 1,700 m from the crater. Another explosion on 13 April produced an ash plume that rose 2,200 m above the summit. Most of the eruptive events at Sakurajima last for less than 30 minutes; on 22 April two events lasted for almost an hour each producing ash plumes that rose 1,400 m above the summit. Ashfall at KRMO was reported during seven days in April. Two distinct thermal anomalies were visible inside the Minamidake crater on both 12 and 27 April (figure 83).
There were 15 eruptive events during May 2019. An event that lasted for two hours on 12 May produced an ash plume that rose 2,900 m from the summit and drifted NE (figure 84). The Meteorological Observatory reported 14 days with ashfall during the month. Two thermal anomalies were present in satellite imagery in the Minamidake crater on both 17 and 22 May.
During June 2019 five eruptive events were reported, on 11, 13, and 24 June; the event on 11 June lasted for almost two hours, sent ash 2,200 m above the summit, and produced ejecta that landed up to 1,100 m from the crater (figure 85). Five days of ashfall were reported by KRMO.
Geologic Background. The Aira caldera in the northern half of Kagoshima Bay contains the post-caldera Sakurajima volcano, one of Japan's most active. Eruption of the voluminous Ito pyroclastic flow accompanied formation of the 17 x 23 km caldera about 22,000 years ago. The smaller Wakamiko caldera was formed during the early Holocene in the NE corner of the caldera, along with several post-caldera cones. The construction of Sakurajima began about 13,000 years ago on the southern rim and built an island that was joined to the Osumi Peninsula during the major explosive and effusive eruption of 1914. Activity at the Kitadake summit cone ended about 4,850 years ago, after which eruptions took place at Minamidake. Frequent eruptions since the 8th century have deposited ash on the city of Kagoshima, located across Kagoshima Bay only 8 km from the summit. The largest recorded eruption took place during 1471-76.
Information Contacts: Japan Meteorological Agency (JMA), Otemachi, 1-3-4, Chiyoda-ku Tokyo 100-8122, Japan (URL: http://www.jma.go.jp/jma/indexe.html); Tokyo Volcanic Ash Advisory Center (VAAC), 1-3-4 Otemachi, Chiyoda-ku, Tokyo, Japan (URL: http://ds.data.jma.go.jp/svd/vaac/data/); Sentinel Hub Playground (URL: https://www.sentinel-hub.com/explore/sentinel-playground); Mike Day, Minnesota, Twitter (URL: https://twitter.com/MikeDaySMM, photo at https://twitter.com/MikeDaySMM/status/1083489400451989505/photo/1); Kratü, Twitter (URL: https://twitter.com/TalesOfKratue, photo at https://twitter.com/TalesOfKratue/status/1101469595414589441/photo/1); Tim Board, Japan, Twitter (URL: https://twitter.com/Hawkworld_, photo at https://twitter.com/Hawkworld_/status/1107789108754038789); Aone Wakatsuke, Twitter (URL: https://twitter.com/AoneWakatsuki, photo at https://twitter.com/AoneWakatsuki/status/1138420031258210305/photo/3).
Asosan
Japan
32.8849°N, 131.085°E; summit elev. 1592 m
All times are local (unless otherwise noted)
Multiple brief ash emission events during April and May 2019; minor ashfall in adjacent villages
Japan's 24-km-wide Asosan caldera on the island of Kyushu has been active throughout the Holocene. Nakadake has been the most active of 17 central cones within the caldera for 2,000 years. Historical eruptions have been primarily basaltic to basaltic-andesitic ash eruptions, with periodic Strombolian activity, all from Nakadake Crater 1. The most recent major eruptive episode began in late November 2014 and continued through 1 May 2016. Another eruption, with the largest ash plume in 20 years, occurred on 8 October 2016. Asosan remained quiet until renewed activity from Crater 1 began in mid-April 2019; it is covered in this report, through the end of June 2019. The Japan Meteorological Agency (JMA) provides monthly reports of activity; the Tokyo Volcanic Ash Advisory Center (VAAC) issues aviation alerts reporting on possible ash plumes.
Asosan remained quiet during 2017 and 2018 with steam plumes rising a few hundred meters from Crater 1 and low levels of SO2 emissions; a warm acidic lake was present within the crater. Fumarolic activity from two areas on the S and SW wall of the crater rim generated occasional thermal anomalies in satellite data and incandescence at night. A brief period of increased seismicity was reported in mid-March 2019. An increase in seismic amplitude on 14 April 2019 preceded a small explosion on 16 April; it produced an ash plume which rose 200 m above the crater rim and drifted NW. It was followed by additional small explosions on 19 April. A new explosion on 3 May produced minor ashfall in adjacent communities; ash emissions were reported multiple times during May with plumes reaching 1,400 m above the crater rim. No additional ash emissions were reported in June.
Activity during 2017 and 2018. JMA reported that no eruptions occurred during 2017. Amplitudes of volcanic tremor increased somewhat during March but were generally low for the rest of the year. The earthquake hypocenters were mostly located near the active crater at around sea level. SO2 emissions were slightly less than 1,000 tons per day (t/d) from January through April; for the rest of the year they ranged from 600 to 2,500 t/d. The Alert Level had been lowered from 2 to 1 on 7 February 2017 where it remained throughout the year. Steam plumes generally rose no more than 600 m above the active crater rim (figure 42). JMA noted that from January to June they often observed crater incandescence at night with a high-sensitivity surveillance camera; Sentinel-2 satellite images also captured thermal anomalies a few times (figure 43). The green lake inside the crater persisted throughout the year with water temperatures of 50-60°C. Two fumaroles were present with high-temperature gas emissions on the SW and S crater walls. Temperatures at the S crater wall were over 600°C from February to May; they decreased to 320-560°C during the rest of the year (figure 44). Sulfur deposits were visible around the SW crater wall fumarole during July.
The Alert Level did not change at Asosan during 2018, and no eruptions were reported. Sulfur dioxide emissions fluctuated between 400 and 1,800 t/d throughout the year. Steam plumes generally rose less than 500 m above the active crater (figure 45); incandescence was observed at night during May-October and sometimes observed in satellite imagery as thermal anomalies (figure 46). The temperature of the green lake inside the crater ranged from 58 to 75°C throughout the year. The thermal anomaly on the S wall of the crater was consistently in the 300-500°C range, and had a high temperature in April of 580°C; in December the high temperature had risen to 738°C (figure 47). A brief increase in the number of isolated tremors occurred during March, with 1,044 reported on 4 March, exceeding the previous maximum of 1,000 on 27 October 2014. Seismicity also increased briefly during June, with more than 400 events reported each day on 8, 18, and 20 June. The Minami Aso village Yoshioka fumarole zone, located about 5 km W of Nakadake Crater 1, continued to produce modest steam plumes throughout 2017 and 2018 (figure 48).
Activity during January-June 2019. Steam plumes rose to 800 m above the crater rim during January 2019. Overall activity increased slightly during February; SO2 emissions peaked at 2,200 t/d early in the month; they ranged from 800 to 1,800 t/d for most of the month. The amplitude of volcanic tremor also increased slightly during February. A further increase in tremor amplitude on 11 March 2019 prompted JMA to raise the Alert Level from 1 to 2 the following morning. Volcanic tremor amplitude decreased on 15 March; JMA determined that activity had decreased, and the Alert Level was lowered back to 1 on 29 March 2019. The amount of water in the crater decreased significantly between 27 February and 20 March, exposing part of the crater floor.
The surface temperature of the lake rose during the first part of 2019; it was 78°C in February and 84°C in March. Steam plumes rose to 1,200 m above the crater rim during March and April. SO2 emissions rose to 4,500 t/d on 12 March but dropped to a lower range of 1,300-2,400 for the rest of the month. Another surge in SO2 emissions on 12 April 2019 to 3,600 t/d prompted a special report from JMA the following day. SO2 emissions varied from about 1,700 to 4,100 t/d during the month; values remained high during the second half of the month. JMA noted that the color of the water in the lake inside Nakadake Crater 1 changed from green to gray after 4 April. Fountains of muddy water were periodically observed; they reached 15 m high on 9 April. The temperatures of both the lake (82°C) and around the two fumarole areas (S area about 530°C, SW area about 310°C) remained constant during April and similar to March.
A large increase in the amplitude of volcanic tremor early on 14 April 2019 prompted JMA to raise the Alert Level from 1 to 2 later in the day. The epicenters of the earthquakes were very shallow, located within 1 km beneath the crater. A small eruption occurred at 1828 on 16 April at Nakadake Crater 1; it produced a gray and white plume that rose 200 m above the crater rim and was the first eruption since 8 October 2016 (figure 49). Incandescence was observed inside the crater on 3 and 17 April. The amplitude of seismic tremors decreased on 18 April. Three very small eruptions on 19 April produced ash and steam plumes that rose 500 m above the crater rim. During a site visit that day JMA measured a high-temperature area that produced incandescence from the bottom of the crater at night (figure 50).
A new eruption began at 1540 on 3 May that lasted until 0620 on 5 May (figure 51). Initially the ash plume rose 600 m above the crater rim, but a few hours later the volume of ash increased, and the plume reached 2 km above the crater rim for a brief period. Incandescence was visible from the webcam. The Tokyo VAAC reported the ash plume at 3 km altitude drifting SE on 3 May. Later in the day it rose to 3.7 km altitude and drifted SW. During a field survey the following day (4 May) JMA reported a steam and ash plume rising from the center of the active crater. The infrared thermal imaging camera recorded the temperature of the plume at about 500°C (figure 52).
Ash fell on the S flank, and a small amount of ashfall on 4 May was confirmed by evidence on a car windshield in Takamori Town (6 km S), Kumamoto Prefecture (figure 53). Ashfall was also reported in Takamori-machi, Minami Aso village (9 km SW), and part of Yamato-cho (25 km SW), also in the Kumamoto Prefecture. SO2 emissions were measured as high as 4,000 t/d on 4 May. Additional explosions with ash plumes were reported from Asosan on 9, 12-16, 29, and 31 May; the plumes rose from 200 to 1,400 m above the crater rim but were not visible in satellite imagery. The TROPOMI instrument on the Sentinel-5 satellite captured SO2 plumes on 3 and 26 May 2019 (figure 54).
Steam plumes rose to 1,700 m above the crater rim during June 2019 (figure 55). During field visits on 6 and 25 June diffuse ash emissions were observed rising from the center of the active crater, but they did not extend significantly above the crater rim (figure 56). The maximum temperature of the plume was measured at about 340°C with a thermal imaging camera. Almost all of the water in the crater bottom had evaporated since early May; incandescence continued to be observed within the crater at night with the high-resolution webcam (figure 57).
Geologic Background. The 24-km-wide Asosan caldera was formed during four major explosive eruptions from 300,000 to 90,000 years ago. These produced voluminous pyroclastic flows that covered much of Kyushu. The last of these, the Aso-4 eruption, produced more than 600 km3 of airfall tephra and pyroclastic-flow deposits. A group of 17 central cones was constructed in the middle of the caldera, one of which, Nakadake, is one of Japan's most active volcanoes. It was the location of Japan's first documented historical eruption in 553 CE. The Nakadake complex has remained active throughout the Holocene. Several other cones have been active during the Holocene, including the Kometsuka scoria cone as recently as about 210 CE. Historical eruptions have largely consisted of basaltic to basaltic andesite ash emission with periodic strombolian and phreatomagmatic activity. The summit crater of Nakadake is accessible by toll road and cable car, and is one of Kyushu's most popular tourist destinations.
Information Contacts: Japan Meteorological Agency (JMA), Otemachi, 1-3-4, Chiyoda-ku Tokyo 100-8122, Japan (URL: http://www.jma.go.jp/jma/indexe.html); Tokyo Volcanic Ash Advisory Center (VAAC), 1-3-4 Otemachi, Chiyoda-ku, Tokyo, Japan (URL: http://ds.data.jma.go.jp/svd/vaac/data/); Sentinel Hub Playground (URL: https://www.sentinel-hub.com/explore/sentinel-playground); Global Sulfur Dioxide Monitoring Page, Atmospheric Chemistry and Dynamics Laboratory, NASA Goddard Space Flight Center (NASA/GSFC), 8800 Greenbelt Road, Goddard, Maryland, USA (URL: https://so2.gsfc.nasa.gov/).
Ebeko
Russia
50.686°N, 156.014°E; summit elev. 1103 m
All times are local (unless otherwise noted)
Continuing frequent moderate explosions though May 2019; ashfall in Severo-Kurilsk
The Ebeko volcano, located on the northern end of the Paramushir Island in the Kuril Islands, consists of many craters, lakes, and thermal features and has been frequently erupting since late February 2017. Typical activity includes ash plumes, explosive eruptions, and gas-and-steam activity. The previous report through November 2018 (BGVN 43:12) described frequent ash explosions that sometimes caused ashfall in Severo-Kurilsk (7 km E). The primary source of information is the Kamchatka Volcanic Eruptions Response Team (KVERT). This report updates the volcanic activity at Ebeko for December 2018 through May 2019.
Frequent moderate explosive activity continued after November 2018. Volcanologists in Severo-Kurilsk observed explosions sending up ash, which drifted N, NE, and E, resulting in ash falls on Severo-Kurilsk on 28 different days between December 2018 and March 2019. On 25 December 2018 an explosion sent ash up to a maximum altitude of 4.5 km and then drifted N for about 5 km. Explosions occurring on 8-10 March 2019 sent ash up to an altitude of 4 km, resulting in ashfall on Severo-Kurilsk on 9-10 March 2019. An ash plume from these explosions rose to a height of 2.5 km and drifted to a maximum distance of 30 km ENE.
Satellite data analyzed by KVERT registered 12 thermal anomalies from December 2018 through May 2019. According to satellite data analyzed by MIROVA (Middle InfraRed Observation of Volcanic Activity), only one thermal anomaly was recorded from December 2018-May 2019, and no hotspot pixels were recognized using satellite thermal data from the MODVOLC algorithm.
Geologic Background. The flat-topped summit of the central cone of Ebeko volcano, one of the most active in the Kuril Islands, occupies the northern end of Paramushir Island. Three summit craters located along a SSW-NNE line form Ebeko volcano proper, at the northern end of a complex of five volcanic cones. Blocky lava flows extend west from Ebeko and SE from the neighboring Nezametnyi cone. The eastern part of the southern crater contains strong solfataras and a large boiling spring. The central crater is filled by a lake about 20 m deep whose shores are lined with steaming solfataras; the northern crater lies across a narrow, low barrier from the central crater and contains a small, cold crescentic lake. Historical activity, recorded since the late-18th century, has been restricted to small-to-moderate explosive eruptions from the summit craters. Intense fumarolic activity occurs in the summit craters, on the outer flanks of the cone, and in lateral explosion craters.
Information Contacts: Kamchatka Volcanic Eruptions Response Team (KVERT), Far Eastern Branch, Russian Academy of Sciences, 9 Piip Blvd., Petropavlovsk-Kamchatsky, 683006, Russia (URL: http://www.kscnet.ru/ivs/kvert/); MIROVA (Middle InfraRed Observation of Volcanic Activity), a collaborative project between the Universities of Turin and Florence (Italy) supported by the Centre for Volcanic Risk of the Italian Civil Protection Department (URL: http://www.mirovaweb.it/); Hawai'i Institute of Geophysics and Planetology (HIGP) - MODVOLC Thermal Alerts System, School of Ocean and Earth Science and Technology (SOEST), Univ. of Hawai'i, 2525 Correa Road, Honolulu, HI 96822, USA (URL: http://modis.higp.hawaii.edu/).
Piton de la Fournaise (France) — July 2019 Cite this Report
Piton de la Fournaise
France
21.244°S, 55.708°E; summit elev. 2632 m
All times are local (unless otherwise noted)
Eruptive episodes in February-March and June 2019; multiple fissures and lava flows
Short pulses of intermittent eruptive activity have characterized Piton de la Fournaise, the large basaltic shield volcano on La Réunion Island in the western Indian Ocean, for several thousand years. For the last 20 years, frequent effusive basaltic eruptions have occurred on average twice per year. The activity is characterized by lava fountains and lava flows, and occasional explosive eruptions that shower blocks over the summit area and produce ash plumes. Almost all of the recent activity has occurred within the Enclos Fouqué caldera, although past eruptions in 1977, 1986, and 1998 have occurred at vents outside of the caldera. Four separate eruptive episodes were reported during 2018; from 3-4 April, 27 April-1 June, 13 July, and 15 September-1 November (BGVN 43:12, 43:09). Two episodes from 2019 during February-March and June are covered in this report, with information provided primarily by the Observatoire Volcanologique du Piton de la Fournaise (OVPF) as well as satellite instruments.
Piton de la Fournaise experienced two eruptions during November 2018-June 2019. The first lasted from 18 February to 10 March 2019, and the second episode was 11-13 June. The episode in February-March consisted of multiple fissures opening on the E flank of the Dolomieu crater on 18 February with lava flows that traveled several hundred meters. After a brief pause, one new fissure opened nearby on 19 February and produced up to 3 million m3 of lava in a little over four days. Although the flow rate then declined, the eruption continued until 10 March. During the last three days, 7-10 March, two new fissures opened nearby and produced large volumes of lava, bringing the total eruptive volume to about 14.5 million m3. After little activity during April and May, a small eruption occurred on the SSE outer slope of Dolomieu crater that lasted for about 48 hours on 11-13 June; multiple small flows traveled about 1,000 m down the steep flank before ceasing. The MIROVA thermal anomaly graph of log radiative power clearly showed the abruptness of the beginning and ends of the last three eruptive episodes at Piton de la Fournaise from August 2018 through June 2019 (figure 165).
Activity during November 2018-March 2019. Following the end of the 15 September-1 November 2018 eruption, seismic activity immediately below the summit remained low (with only 20 shallow and two deep earthquakes during November). The inflationary signal recorded since the beginning of September stopped, and the OVPF deformation networks did not record any significant deformation. There were 35 shallow earthquakes (0-2 km depth) below the summit crater during December, and one deep earthquake. Only 12 shallow earthquakes and one deep earthquake (greater than 2 km below the surface) were reported in January.
OVPF reported an increase in CO2 concentrations beginning in December 2018, and noted the beginning of inflation on 13 February 2019. A seismic swarm of 379 earthquakes accompanied by minor but rapid deformation (less than 1 cm) was reported on 16 February 2019. A new seismic swarm of 208 earthquakes began early on 18 February with a much larger ground deformation (10 cm of elongation of the summit zone). A volcanic tremor indicative of the arrival of magma near the surface began at 0948 that morning. Webcams indicated that eruptive fissures had opened in the NE part of the Enclos Fouqué caldera. The onset of the eruption was marked by a sudden drop in CO2 flux which then stabilized. The eruptive sites were confirmed visually around 1130. Three fissures with actively flowing lava opened on the E flank of Dolomieu Crater; the fountains of lava were less than 30 m high. The front of the longest flow had reached 1,900 m elevation after one hour. The eruption lasted a little over 12 hours and was over by 2200 that evening; it covered about 150-200 m of the hiking trail to the summit.
Seismicity remained high after the event ended, and at 1500 on 19 February 2019 another seismic swarm of 511 deep earthquakes located under the E flank at about 2.5 km depth occurred. It was not accompanied by a significant amount of deformation. At 1710 tremor signals appeared on the observatory seismographs and the first gas plumes and lava ejection were observed at 1750 and 1912, respectively. During an overflight the next day (20 February), OVPF team members observed the new eruptive site at an elevation of 1,800 m at the foot of Piton Madoré. One fissure and one fountain were active at 0620 on 20 February and the flow front was at 1,300 m elevation (figure 166). During the night of 20-21 February the flow front crossed over the "Grandes Pentes" area in the eastern half of the Enclos Fouque (figure 167).
OVPF reported on 22 February 2019 that 22 shallow earthquakes had been reported since the eruption began on 19 February. Surface flow rates estimated from satellite data, via the HOTVOLC system (OPGC - University of Auvergne), were between 2.5 and 15 m3/s. The quantity of lava emitted between 19 and 22 February was between 1 and 3 million m3. OVPF observed the growth of an eruptive cone that was filled with a small lava lake producing ejecta during a morning overflight on 22 February. A channelized flow moved downstream from the cone and split into two lobes about 1 km from (and 200 m below) the cone (figure 168). The split in the flow occurred near the Guyanin crater. The N flowing lobe, about 50 m wide, had an actively flowing front located at 1,320 m elevation; the incandescent flow was travelling over a recent flow (likely from the previous night). The S-flowing lobe spread to 200 m wide and split into two tongues 300 m SE of Guyanin crater.
Incandescent ejecta from the cone was captured in a webcam image overnight on 22-23 February 2019 (figure 169). The rate of advance of the flow slowed significantly by 24 February, but the intensity of the eruptive tremor remained relatively constant. Mapping of the lava flow on 28 February carried out by the OI2 platform (OPGC - University Clermont Auvergne) from satellite data confirmed the slow progress of the flow after 24 February (300 m in 5 days) (figure 170). The flow front was located at 1,200 m elevation, and only the N arm was active; the lava had traveled about 2.2 km from the vent by 28 February.
Between 28 February and 1 March 2019 a third lobe of lava appeared flowing NE from the vent on the N side of the new flow area; it split into two lobes sometime on 1 March. Very little new lava was recorded on the other lobes. By 4 March the flow rate estimated by satellite data was about 7.5 m3/s. During a site visit on the morning of 5 March OVPF scientists sampled the N lobe of the flow and bombs and tephra near the cone, and acquired infrared and visible images. They noted the continued growth of the cone which still had an open vent at the summit and a base 100 m in diameter. It was 25 m high with a 50-m-wide eruptive vent at the top (figure 171). High-temperature gas emissions and strong Strombolian activity issued from the vent. Steam emissions were present around the base of the cone, suggesting the presence of lava tunnels. A single lobe of lava flowed N from the cone.
A new fissure that opened about 150 m from the main vent on the NW flank of Piton Madoré was first observed on the morning of 6 March (figure 172); OVPF concluded that it had opened late on 5 March. A small cone was forming and a new flow traveled N from the main eruptive site. At least six new emission points were noted the following morning (7 March) around the Piton Madoré. Poor weather prevented confirmation by aerial reconnaissance that day, but in a site visit on 8 March OVPF scientists determined that the new fissure from 5 March remained active; a small cone about 10 m high had two flow lobes on the W and N sides (figure 173). A fissure that opened on 7 March was located 300 m S of the 19 February vent and oriented E-W. It was very active on the morning of 8 March with two 50-m-high lava fountains (figure 174). Samples collected by OVPF indicated that the vents of 5 and 7 March produced lava of different compositions.
There was a strong increase in the eruptive tremor intensity on 7 March, related to the opening of the two new fissures on 5 and 7 March (figure 175). As a result, the surface flow estimates made from satellite data increased significantly to high values greater than 50 m3/s, with the average values on 7-8 March of around 20-25 m3/s. The increased flow rates resulted in the flows traveling much greater distances. By the morning of 9 March the active flow had reached 650-700 m above sea level. The flow front had traveled about 1 km in 24 hours. Strong seismicity had been increasing under the summit zone for the previous 48 hours. After a phase of very strong surface activity observed overnight on 9-10 March that included lava fountains 50-100 m high (figure 176), surface activity ceased around 0630 on 10 March, and seismic activity decreased significantly. OVPF noted that sudden increases in seismicity and flow rates near the end of an eruption have occurred at about half of the eruptions at Piton de la Fournaise in recent years. Lava volumes emitted on the surface between 18 February and 10 March 2019 were estimated at about 14.5 million m3 (figure 177).
Significant SO2 plumes were captured by the TROPOMI instrument on the Sentinel 5-P satellite throughout the 18 February-10 March eruption (figure 178). After the surface eruption ceased, shallow seismicity continued at a lower rate of about 12 earthquakes per day. The end of the eruption (7-10 March) was accompanied by a marked deflation, interpreted by OVPF as the rapid emptying of the magma reservoir. Following the end of the eruption, inflation resumed for the rest of March but then ceased. Seismicity continued at a lower level during April with an average of six shallow earthquakes per day.
Activity during May-June 2019. OVPF reported slight inflation near the summit beginning in early May, and an increase in CO2 concentration in the soil near Plaine des Cafres and Plaine des Palmistes. Strong shallow seismicity reappeared on 27 May 2019 and recurred on 30 and 31 May. Two small seismic swarms were measured on 31 May in the early morning. A new seismic swarm beginning at 0603 on 11 June accompanied by rapid deformation suggested a new eruption was imminent. A tremor near the summit area was first noted at 0635 local time; the webcams indicated a plume of gas, but poor visibility prevented evidence of fresh lava. Around 0930 that morning OVPF confirmed that five fissures had opened on the outer SSE slope of Dolomieu crater at elevations ranging from 2480 to 2025 m (figure 179). The flow fronts were not visible due to weather. Lava fountains under 30 m in height and lava flows were present in the three lowest fissures. The flows traveled rapidly down the steep flank of the crater (figure 180).
The intensity of the eruptive tremor decreased throughout the day, and by 1530 only the lowest elevation fissure was still active (figure 181). The next afternoon (12 June) images in the OVPF webcam located in Piton des Cascades indicated the flow front was at about 1,200-1,300 m elevation. Seismographs indicated that the eruption stopped around 1200 on 13 June. Poor weather obscured visibility of the flow activity. Seismic activity decreased following the eruption, but appeared to increase again beginning on 21 June, with 10 events detected on 30 June. SO2 plumes were recorded in satellite data on 11 and 12 June 2019.
Geologic Background. Piton de la Fournaise is a massive basaltic shield volcano on the French island of Réunion in the western Indian Ocean. Much of its more than 530,000-year history overlapped with eruptions of the deeply dissected Piton des Neiges shield volcano to the NW. Three scarps formed at about 250,000, 65,000, and less than 5,000 years ago by progressive eastward slumping, leaving caldera-sized embayments open to the E and SE. Numerous pyroclastic cones are present on the floor of the scarps and their outer flanks. Most recorded eruptions have originated from the summit and flanks of Dolomieu, a 400-m-high lava shield that has grown within the youngest scarp, which is about 9 km wide and about 13 km from the western wall to the ocean on the E side. More than 150 eruptions, most of which have produced fluid basaltic lava flows, have occurred since the 17th century. Only six eruptions, in 1708, 1774, 1776, 1800, 1977, and 1986, have originated from fissures outside the scarps.
Information Contacts: Observatoire Volcanologique du Piton de la Fournaise, Institut de Physique du Globe de Paris, 14 route nationale 3, 27 ème km, 97418 La Plaine des Cafres, La Réunion, France (URL: http://www.ipgp.fr/fr); MIROVA (Middle InfraRed Observation of Volcanic Activity), a collaborative project between the Universities of Turin and Florence (Italy) supported by the Centre for Volcanic Risk of the Italian Civil Protection Department (URL: http://www.mirovaweb.it/); Global Sulfur Dioxide Monitoring Page, Atmospheric Chemistry and Dynamics Laboratory, NASA Goddard Space Flight Center (NASA/GSFC), 8800 Greenbelt Road, Goddard, Maryland, USA (URL: https://so2.gsfc.nasa.gov/).
Great Sitkin (United States) — July 2019 Cite this Report
Great Sitkin
United States
52.076°N, 176.13°W; summit elev. 1740 m
All times are local (unless otherwise noted)
Small steam explosions in early June 2019
The Great Sitkin volcano is located about 40 km NE of Adak Island in the Aleutian Islands and has had a few short-lived eruptions over the past 100 years. Prior to the latest activity in early June 2019 described below, small phreatic explosions occurred in June and August 2018 (BGVN 43:09). An eruption in 1974 produced a lava dome in the center of the crater. The Alaska Volcano Observatory (AVO) is the primary source of information for this September 2018-June 2019 reporting period.
Low-level unrest occurred from September 2018 through February 2019 with slightly elevated seismic activity (figure 6). Small explosions were seismically detected by AVO on 30 October, 5 and 16 November, and 11 December 2018, but they were not seen in regional infrasound data and satellite data did not show an ash cloud.
On 1, 7, and 9 June 2019, AVO reported small steam explosions as well as slightly elevated seismic activity. Steam plumes and surficial evidence of an explosion were not observed during these events. On 18 June 2019 weakly elevated surface temperatures were recorded, field crews working on Adak observed some steam emissions, and a gas flight was conducted. Elevated concentrations of carbon dioxide detected above the lava dome were likely associated with the steam explosions earlier in the month (figures 7 and 8). From 23 June through the end of the month seismicity began to decline back to background levels.
Geologic Background. The Great Sitkin volcano forms much of the northern side of Great Sitkin Island. A younger volcano capped by a small, 0.8 x 1.2 km ice-filled summit caldera was constructed within a large late-Pleistocene or early Holocene scarp formed by massive edifice failure that truncated an older edifice and produced a submarine debris avalanche. Deposits from this and an even older debris avalanche from a source to the south cover a broad area of the ocean floor north of the volcano. The summit lies along the eastern rim of the younger collapse scarp. Deposits from an earlier caldera-forming eruption of unknown age cover the flanks of the island to a depth up to 6 m. The small younger caldera was partially filled by lava domes emplaced in 1945 and 1974, and five small older flank lava domes, two of which lie on the coastline, were constructed along northwest- and NNW-trending lines. Hot springs, mud pots, and fumaroles occur near the head of Big Fox Creek, south of the volcano. Eruptions have been recorded since the late-19th century.
Information Contacts: Alaska Volcano Observatory (AVO), a cooperative program of a) U.S. Geological Survey, 4200 University Drive, Anchorage, AK 99508-4667 USA (URL: https://avo.alaska.edu/), b) Geophysical Institute, University of Alaska, PO Box 757320, Fairbanks, AK 99775-7320, USA, and c) Alaska Division of Geological & Geophysical Surveys, 794 University Ave., Suite 200, Fairbanks, AK 99709, USA (URL: http://dggs.alaska.gov/).
Ibu
Indonesia
1.4941°N, 127.6324°E; summit elev. 1357 m
All times are local (unless otherwise noted)
Frequent ash plumes and small lava flows active in the crater through June 2019
Ibu volcano on Halmahera island in Indonesia began the current eruption episode on 5 April 2008. Since then, activity has largely consisted of small ash plumes with less frequent lava flows, lava dome growth, avalanches, and larger ash plumes up to 5.5 km above the crater. This report summarizes activity during December 2018 through June 2019 and is based on Volcano Observatory Notice for Aviation (VONA) reports by MAGMA Indonesia, reports by Pusat Vulkanologi dan Mitigasi Bencana Geologi (PVMBG) and Badan Nasional Penanggulangan Bencana (BNPB), and various satellite data.
During December PVMBG reported ash plumes ranging from 200 to 800 m above the crater. There were 11 MODVOLC thermal alerts that registered during 1-12 December. An explosion on 12 January 2019 produced an ash plume that reached 800 m above the crater and dispersed to the S (figure 15). A report released for this event by Sutopo at BNPB said that Ibu had erupted almost every day over the past three months; an example given was of activity on 10 January consisting of 80 explosions. There were four MODVOLC thermal alerts through the month.
Throughout February explosions frequently produced ash plumes as high as 800 m above the crater, and nine MODVOLC thermal alerts were issued. Daily reports showed variable plume heights of 200-800 m most days throughout the month. Wind directions varied and dispersed the plumes in all directions. A VONA released at 1850 on 6 February reported an ash plume that rose to 1,925 m altitude (around 600 m above the summit) and dispersed S. Activity continued through March with the Darwin VAAC and PVMBG reporting explosions producing ash plumes to heights of 200-800 m above the crater and dispersing in various directions. There were ten MODVOLC alerts through the month.
Similar activity continued through April, May, and June, with ash plumes reaching 200-800 m above the crater. There were 12, 6, and 15 MODVOLC Alerts in April, May, and June, respectively.
Planet Scope satellite images show activity at a two vents near the center of the crater that were producing small lava flows from February through June (figure 16). Thermal anomalies were frequent during December 2018 through June 2019 across MODVOLC, MIROVA, and Sentinel-2 infrared data (figures 17 and 18). Sentinel-2 data showed minor variation in the location of thermal anomalies within the crater, possibly indicating lava flow activity, and MIROVA data showed relatively constant activity with a few reductions in thermal activity during January and February.
Geologic Background. The truncated summit of Gunung Ibu stratovolcano along the NW coast of Halmahera Island has large nested summit craters. The inner crater, 1 km wide and 400 m deep, has contained several small crater lakes. The 1.2-km-wide outer crater is breached on the N, creating a steep-walled valley. A large cone grew ENE of the summit, and a smaller one to the WSW has fed a lava flow down the W flank. A group of maars is located below the N and W flanks. The first observed and recorded eruption was a small explosion from the summit crater in 1911. Eruptive activity began again in December 1998, producing a lava dome that eventually covered much of the floor of the inner summit crater along with ongoing explosive ash emissions.
Information Contacts: Pusat Vulkanologi dan Mitigasi Bencana Geologi (PVMBG, also known as Indonesian Center for Volcanology and Geological Hazard Mitigation, CVGHM), Jalan Diponegoro 57, Bandung 40122, Indonesia (URL: http://www.vsi.esdm.go.id/); Badan Nasional Penanggulangan Bencana (BNPB), National Disaster Management Agency, Graha BNPB - Jl. Scout Kav.38, East Jakarta 13120, Indonesia (URL: http://www.bnpb.go.id/); MAGMA Indonesia, Kementerian Energi dan Sumber Daya Mineral (URL: https://magma.vsi.esdm.go.id/); Darwin Volcanic Ash Advisory Centre (VAAC), Bureau of Meteorology, Northern Territory Regional Office, PO Box 40050, Casuarina, NT 0811, Australia (URL: http://www.bom.gov.au/info/vaac/); Hawai'i Institute of Geophysics and Planetology (HIGP) - MODVOLC Thermal Alerts System, School of Ocean and Earth Science and Technology (SOEST), Univ. of Hawai'i, 2525 Correa Road, Honolulu, HI 96822, USA (URL: http://modis.higp.hawaii.edu/); MIROVA (Middle InfraRed Observation of Volcanic Activity), a collaborative project between the Universities of Turin and Florence (Italy) supported by the Centre for Volcanic Risk of the Italian Civil Protection Department (URL: http://www.mirovaweb.it/); Sentinel Hub Playground (URL: https://www.sentinel-hub.com/explore/sentinel-playground); Planet Labs, Inc. (URL: https://www.planet.com/).
Klyuchevskoy (Russia) — July 2019 Cite this Report
Klyuchevskoy
Russia
56.056°N, 160.642°E; summit elev. 4754 m
All times are local (unless otherwise noted)
Weak thermal anomalies and moderate Strombolian-type eruptions in September 2018-June 2019
Klyuchevskoy has had alternating eruptive and less active periods since August 2015. Activity has included lava flows, a growing cinder cone, thermal anomalies, gas-and-steam plumes, and ash explosions. Though some eruptions occur near the summit crater, major explosive and effusive eruptions have also occurred from flank craters (BGVN 42:04 and 43:05). Intermittent moderate gas-and-steam and ash emissions were previously reported from mid-February to mid-August 2018. The Kamchatka Volcanic Eruptions Response Team (KVERT) is the primary source of information for this September 2018-June 2019 reporting period.
KVERT reported that moderate gas-and-steam activity and weak thermal anomalies occurred intermittently from the beginning of September 2018 through mid-April 2019. [On 9 April a small ash plume was observed, according to KVERT. The Tokyo VAAC reported an ash plume on 12 April that rose 5.2 km altitude and extended NE.] On 21-22 April webcam data showed a gas-and-steam plume extending about 160 km SE (figure 31). Moderate Strombolian-type volcanism began late April 2019 and continued intermittently through June 2019. On 11-12 June webcam data showed explosions that sent ash up to a maximum altitude of 6 km, with the resulting ash plume extending about 200 km WNW.
Thermal anomalies were noted by KVERT during two days in September 2018, six days in April 2019, eleven days in May 2019, and six days in June 2019. MIROVA (Middle InfraRed Observation of Volcanic Activity) analysis of MODIS satellite data showed infrequent weak thermal anomalies December 2018 through early May 2019.
Geologic Background. Klyuchevskoy is the highest and most active volcano on the Kamchatka Peninsula. Since its origin about 6,000 years ago, this symmetrical, basaltic stratovolcano has produced frequent moderate-volume explosive and effusive eruptions without major periods of inactivity. It rises above a saddle NE of Kamen volcano and lies SE of the broad Ushkovsky massif. More than 100 flank eruptions have occurred during approximately the past 3,000 years, with most lateral craters and cones occurring along radial fissures between the unconfined NE-to-SE flanks of the conical volcano between 500 and 3,600 m elevation. Eruptions recorded since the late 17th century have resulted in frequent changes to the morphology of the 700-m-wide summit crater. These eruptions over the past 400 years have originated primarily from the summit crater, but have also included numerous major explosive and effusive eruptions from flank craters.
Information Contacts: Kamchatka Volcanic Eruptions Response Team (KVERT), Far Eastern Branch, Russian Academy of Sciences, 9 Piip Blvd., Petropavlovsk-Kamchatsky, 683006, Russia (URL: http://www.kscnet.ru/ivs/kvert/); Tokyo Volcanic Ash Advisory Center (VAAC), 1-3-4 Otemachi, Chiyoda-ku, Tokyo 100-8122, Japan (URL: http://ds.data.jma.go.jp/svd/vaac/data/); MIROVA (Middle InfraRed Observation of Volcanic Activity), a collaborative project between the Universities of Turin and Florence (Italy) supported by the Centre for Volcanic Risk of the Italian Civil Protection Department (URL: http://www.mirovaweb.it/).
Sangay
Ecuador
2.005°S, 78.341°W; summit elev. 5286 m
All times are local (unless otherwise noted)
Explosion on 26 March 2019; activity from 10 May through June produced ash plumes, lava flows, and pyroclastic flows
Sangay is the southernmost active volcano in Ecuador, with confirmed historical eruptions going back to 1628. The previous eruption occurred during August and December and was characterized by ash plumes reaching 2,500 m above the crater. Lava flows and pyroclastic flows descended the eastern and southern flanks. This report summarizes activity during January through July 2019 and is based on reports by Instituto Geofísico (IG-EPN), Washington Volcanic Ash Advisory Center (VAAC), and various satellite data.
After the December 2018 eruption there was a larger reduction in seismicity, down to one event per day. During January, February, and most of March there was no recorded activity and low seismicity until the Washington VAAC reported an ash plume at 0615 on 26 March. The ash plume rose to a height of around 1 km and dispersed to the SW as seen in GOES 16 satellite imagery as a dark plume within white meteorological clouds. There was no seismic data available due to technical problems with the station.
More persistent eruptive activity began on 10 May with thermal alerts (figure 33) and an ash plume at 0700 that dispersed to the W. An explosion was recorded at 1938 on 11 May, producing an ash plume and incandescent material down the flank (figure 34). Two M 2 earthquakes were detected between 3.5 and 9 km below the crater on 10 May, possibly corresponding to explosive activity. By 17 May there were two active eruptive centers, the central crater and the Ñuñurcu dome (figure 35).
Activity at the central crater by 21 May was characterized by sporadic explosive eruptions that ejected hot ballistic ejecta (blocks) with velocities over 400 km/hour; after landing on the flanks the blocks travelled out to 2.5 km from the crater. Ash plumes reached heights between 0.9-2.3 km above the crater and dispersed mainly to the W and NW; gas plumes also dispersed to the W. The Ñuñurcu dome is located around 190 m SSE of the central crater and by 21 May had produced a lava flow over 470 m long with a maximum width of 175 m and an estimated minimum volume of 300,000 to 600,000 m3. Small pyroclastic flows and rockfalls resulted from collapse of the lava flow front, depositing material over a broad area on the E-SE flanks (figure 36). One pyroclastic flow reached 340 m and covered an area of 14,300 m2. During the 17 May observation flight the lava flow surface reached 277°C.
At the end of June activity was continuing at the central crater and Ñuñurco Dome. At least three lava flows had been generated from the dome down the SE flank and pyroclastic flows continued to form from the flow fronts (figure 37). Pyroclastic material had been washed into the Upano river and steam was observed in the Volcán River possibly due to the presence of hot rocks. Ash plumes continued through June reaching heights of 800 m above the crater (figure 38), but no ashfall had been reported in nearby communities.
Geologic Background. The isolated Sangay volcano, located east of the Andean crest, is the southernmost of Ecuador's volcanoes and its most active. The steep-sided, glacier-covered, dominantly andesitic volcano grew within the open calderas of two previous edifices which were destroyed by collapse to the east, producing large debris avalanches that reached the Amazonian lowlands. The modern edifice dates back to at least 14,000 years ago. It towers above the tropical jungle on the east side; on the other sides flat plains of ash have been eroded by heavy rains into steep-walled canyons up to 600 m deep. The earliest report of an eruption was in 1628. Almost continuous eruptions were reported from 1728 until 1916, and again from 1934 to the present. The almost constant activity has caused frequent changes to the morphology of the summit crater complex.
Information Contacts: Instituto Geofísico (IG-EPN), Escuela Politécnica Nacional, Casilla 17-01-2759, Quito, Ecuador (URL: http://www.igepn.edu.ec); Washington Volcanic Ash Advisory Center (VAAC), Satellite Analysis Branch (SAB), NOAA/NESDIS OSPO, NOAA Science Center Room 401, 5200 Auth Rd, Camp Springs, MD 20746, USA (URL: www.ospo.noaa.gov/Products/atmosphere/vaac, archive at: http://www.ssd.noaa.gov/VAAC/archive.html); Hawai'i Institute of Geophysics and Planetology (HIGP) - MODVOLC Thermal Alerts System, School of Ocean and Earth Science and Technology (SOEST), Univ. of Hawai'i, 2525 Correa Road, Honolulu, HI 96822, USA (URL: http://modis.higp.hawaii.edu/); MIROVA (Middle InfraRed Observation of Volcanic Activity), a collaborative project between the Universities of Turin and Florence (Italy) supported by the Centre for Volcanic Risk of the Italian Civil Protection Department (URL: http://www.mirovaweb.it/); Sentinel Hub Playground (URL: https://www.sentinel-hub.com/explore/sentinel-playground).
Suwanosejima (Japan) — July 2019 Cite this Report
Suwanosejima
Japan
29.638°N, 129.714°E; summit elev. 796 m
All times are local (unless otherwise noted)
Small ash plumes continued during January through June 2019
Suwanosejima is an active volcanic island south of Japan in the Ryuku islands with recent activity centered at Otake crater. The current eruption began in October 2004 and activity has mostly consisted of small ash plumes, ballistic ejecta, and visible incandescence at night. This report summarizes activity during January through June 2019 and is based on reports by the Japan Meteorological Agency (JMA), and various satellite data.
Thermal activity recorded by the MIROVA system was low through January and February after a decline in November (figure 36), shown in Sentined-2 thermal infrared imagery as originating at a vent in the Otake crater (figure 37). During January an explosive event was observed at 1727 on the 3rd, producing a gray plume that rose 600 m above the crater. A white gas-and-steam plume rose to 1.5 km above the crater and nighttime incandescence was observed throughout the month. Reduced activity continued through February with no reported explosive eruptions and light gray plumes up to 900 m above the crater. Incandescence continued to be recorded at night using a sensitive surveillance camera.
There was an increase in thermal energy detected by the MIROVA system in mid-March and there was a MODVOLC thermal alert on the 15th. Occasional small explosions occurred but no larger explosive events were recorded. A white plume was noted on the 27th rising to 900 m above the crater and an event at 1048 on the 30th produced a light-gray plume that rose to 800 m. Incandescence was only observed using a sensitive camera at night (figure 38).
No explosive events were observed through April. A white gas-and-steam plume rose to 1,200 m above the crater on the 19th and incandescence continued intermittently. Minor explosions were recorded on 5, 30, and 31 May, but no larger explosive events were observed during the month. The event on the 30th produced ash plume that reached 1.1 km above the crater. Similar activity continued through June with one explosive event occurring on the 2nd. Overall, there was a reduction in the number of ash plumes erupted during this period compared to previous months (figure 39).
Geologic Background. The 8-km-long island of Suwanosejima in the northern Ryukyu Islands consists of an andesitic stratovolcano with two active summit craters. The summit is truncated by a large breached crater extending to the sea on the E flank that was formed by edifice collapse. One of Japan's most frequently active volcanoes, it was in a state of intermittent Strombolian activity from Otake, the NE summit crater, between 1949 and 1996, after which periods of inactivity lengthened. The largest recorded eruption took place in 1813-14, when thick scoria deposits covered residential areas, and the SW crater produced two lava flows that reached the western coast. At the end of the eruption the summit of Otake collapsed, forming a large debris avalanche and creating an open collapse scarp extending to the eastern coast. The island remained uninhabited for about 70 years after the 1813-1814 eruption. Lava flows reached the eastern coast of the island in 1884. Only about 50 people live on the island.
Information Contacts: Japan Meteorological Agency (JMA), Otemachi, 1-3-4, Chiyoda-ku Tokyo 100-8122, Japan (URL: http://www.jma.go.jp/jma/indexe.html); Hawai'i Institute of Geophysics and Planetology (HIGP) - MODVOLC Thermal Alerts System, School of Ocean and Earth Science and Technology (SOEST), Univ. of Hawai'i, 2525 Correa Road, Honolulu, HI 96822, USA (URL: http://modis.higp.hawaii.edu/); MIROVA (Middle InfraRed Observation of Volcanic Activity), a collaborative project between the Universities of Turin and Florence (Italy) supported by the Centre for Volcanic Risk of the Italian Civil Protection Department (URL: http://www.mirovaweb.it/); Sentinel Hub Playground (URL: https://www.sentinel-hub.com/explore/sentinel-playground).
Tinakula (Solomon Islands) — July 2019 Cite this Report
Tinakula
Solomon Islands
10.386°S, 165.804°E; summit elev. 796 m
All times are local (unless otherwise noted)
Thermal anomalies in satellite data December 2018-June 2019; ship visit January 2019
Remote Tinakula lies 100 km NE of the Solomon Trench at the N end of the Santa Cruz Islands, which are part of the country of the Solomon Islands located 400 km to the W. It has been uninhabited since an eruption with lava flows and ash explosions in 1971 when the small population was evacuated (CSLP 87-71). The nearest communities live on Te Motu (Trevanion) Island (about 30 km S), Nupani (40 km N), and the Reef Islands (60 km E); residents occasionally report noises from explosions at Tinakula. Ashfall from larger explosions has historically reached these islands. The most recent eruptive episode was a large ash explosion and substantial SO2 plume during 21-26 October 2017; satellite imagery suggested that a flow of some type traveled down the scarp on the W flank. Renewed thermal activity that was recognized in satellite imagery beginning in December 2018 continued intermittently through June 2019 and is covered in this report. Satellite imagery and thermal data are the primary sources of information for this volcano. It is occasionally visited by members of the National Disaster Management Office (NDMO) of the Solomon Islands Government, tourists, and research vessels who are able to capture ground-based information.
Satellite images from December 2018 to February 2019 show thermal anomalies at the summit vent. Excellent ship-based photographs of the island on 24-25 January 2019 provided by a crewmember from the R/V Petrel identify numerous volcanic features and show a steam-and-gas plume at the vent. Satellite images from April and May 2019 show thermal anomalies at both the summit vent and along the W flank scarp suggesting flow activity during that time.
A stream of incandescence on the NW flank of Tinakula in a Sentinel 2 satellite image on 24 October 2017 confirmed that some type of high-temperature flow accompanied the explosions and eruptive activity of 21-25 October 2017 (BGVN 43:02). Satellite imagery during most of 2018 recorded steam plumes drifting in several directions from the summit, but no thermal activity (figure 24). There was no further evidence of activity in satellite visible or thermal data until almost exactly one year later when the MIROVA project recorded two thermal alerts in the third week of October 2018 (figure 25). Satellite images from that week were cloudy and did not confirm any surface activity.
The first satellite imagery confirming renewed thermal activity appeared on 8 December 2018, around the same time as a small MIROVA anomaly. After that, several images during January and February 2019 confirmed moderately strong thermal activity at the summit (figure 26). Whether the anomalies were the result of active lava effusion or strong incandescent gases from the summit vent is uncertain.
Visual confirmation of activity at Tinakula is rare, but the research vessel R/V Petrel sailed past the volcano on 24 and 25 January 2019 and a crewmember provided detailed images of the W flank and vent area. The summit vent is located at the top of a W facing scarp, and steam is frequently observed rising from the vent (figures 27). Recent flows and volcaniclastic deposits were visible in the ravine on the W flank (figures 28 and 29). Fresh-looking lava was also visible near the summit vent on top of older deposits (figure 30). Eroded volcaniclastic deposits near the base of the scarp on the W flank were visible on top of older veined and layered volcanic rocks (figure 31). Crewmembers on the vessel R/V Petrel could clearly see an incandescent glow from the summit crater at night (figure 32).
During April and May 2019, both the MIROVA project and MODVOLC measured a number of thermal anomalies (figure 33) using MODIS satellite data. MODVOLC alerts were issued on 4 and 20 April, and 11, 18, and 27 May. Sentinel-2 satellite images during the period confirmed that a flow on the W flank was a likely source of the thermal energy in addition to the summit vent (figure 34). Thermal anomalies appeared again at the end of June in MIROVA data, but no satellite images showed anomalies at that time.
Geologic Background. The small 3.5-km-wide island of Tinakula is the exposed summit of a massive stratovolcano at the NW end of the Santa Cruz islands. It has a breached summit crater that extends from the summit to below sea level. Landslides enlarged this scarp in 1965, creating an embayment on the NW coast. The Mendana cone is located on the SE side. The dominantly andesitic volcano has frequently been observed in eruption since the era of Spanish exploration began in 1595. In about 1840, an explosive eruption apparently produced pyroclastic flows that swept all sides of the island, killing its inhabitants. Recorded eruptions have frequently originated from a cone constructed within the large breached crater. These have left the upper flanks and the steep apron of lava flows and volcaniclastic debris within the breach unvegetated.
Information Contacts: MIROVA (Middle InfraRed Observation of Volcanic Activity), a collaborative project between the Universities of Turin and Florence (Italy) supported by the Centre for Volcanic Risk of the Italian Civil Protection Department (URL: http://www.mirovaweb.it/); Hawai'i Institute of Geophysics and Planetology (HIGP) - MODVOLC Thermal Alerts System, School of Ocean and Earth Science and Technology (SOEST), Univ. of Hawai'i, 2525 Correa Road, Honolulu, HI 96822, USA (URL: http://modis.higp.hawaii.edu/); Sentinel Hub Playground (URL: https://www.sentinel-hub.com/explore/sentinel-playground); Vulcan Inc. (URL: https://www.vulcan.com/), additional details about the R/V Petrel (URL: https://www.paulallen.com/).