Recently Published Bulletin Reports
Erebus (Antarctica) Lava lake remains active; most thermal alerts recorded since 2019
Rincon de la Vieja (Costa Rica) Frequent phreatic explosions during July-December 2023
Bezymianny (Russia) Explosion on 18 October 2023 sends ash plume 8 km high; lava flows and incandescent avalanches
Kilauea (United States) Low-level lava effusions in the lava lake at Halema’uma’u during July-December 2022
Nyamulagira (DR Congo) Lava flows and thermal activity during May-October 2023
Bagana (Papua New Guinea) Explosions, ash plumes, ashfall, and lava flows during April-September 2023
Mayon (Philippines) Lava flows, pyroclastic flows, ash emissions, and seismicity during April-September 2023
Nishinoshima (Japan) Eruption plumes and gas-and-steam plumes during May-August 2023
Krakatau (Indonesia) White gas-and-steam plumes and occasional ash plumes during May-August 2023
Villarrica (Chile) Strombolian activity, gas-and-ash emissions, and crater incandescence during April-September 2023
Merapi (Indonesia) Frequent incandescent avalanches during April-September 2023
Ebeko (Russia) Moderate explosive activity with ash plumes continued during June-November 2023
Erebus (Antarctica) — January 2024  Cite this Report
Erebus
Antarctica
77.53°S, 167.17°E; summit elev. 3794 m
All times are local (unless otherwise noted)
Lava lake remains active; most thermal alerts recorded since 2019
The lava lake in the summit crater of Erebus has been active since at least 1972. Located in Antarctica overlooking the McMurdo Station on Ross Island, it is the southernmost active volcano on the planet. Because of the remote location, activity is primarily monitored by satellites. This report covers activity during 2023.
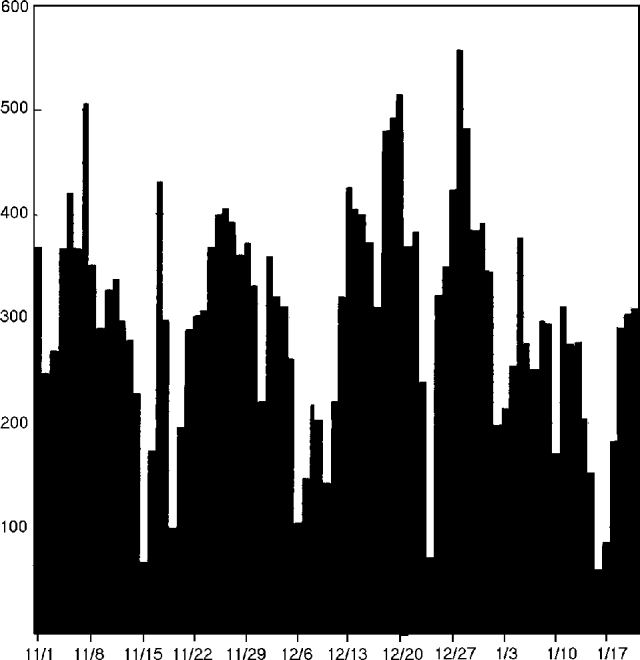
The number of thermal alerts recorded by the Hawai'i Institute of Geophysics and Planetology’s MODVOLC Thermal Alerts System increased considerably in 2023 compared to the years 2020-2022 (table 9). In contrast to previous years, the MODIS instruments aboard the Aqua and Terra satellites captured data from Erebus every month during 2023. Consistent with previous years, the lowest number of anomalous pixels were recorded in January, November, and December.
Table 9. Number of monthly MODIS-MODVOLC thermal alert pixels recorded at Erebus during 2017-2023. See BGVN 42:06 for data from 2000 through 2016. The table was compiled using data provided by the HIGP – MODVOLC Thermal Alerts System.
| Year |
Jan |
Feb |
Mar |
Apr |
May |
Jun |
Jul |
Aug |
Sep |
Oct |
Nov |
Dec |
SUM |
| 2017 |
0 |
21 |
9 |
0 |
0 |
1 |
11 |
61 |
76 |
52 |
0 |
3 |
234 |
| 2018 |
0 |
21 |
58 |
182 |
55 |
17 |
137 |
172 |
103 |
29 |
0 |
0 |
774 |
| 2019 |
2 |
21 |
162 |
151 |
55 |
56 |
75 |
53 |
29 |
19 |
1 |
0 |
624 |
| 2020 |
0 |
2 |
16 |
18 |
4 |
4 |
1 |
3 |
18 |
3 |
1 |
6 |
76 |
| 2021 |
0 |
9 |
1 |
0 |
2 |
56 |
46 |
47 |
35 |
52 |
5 |
3 |
256 |
| 2022 |
1 |
13 |
55 |
22 |
15 |
32 |
39 |
19 |
31 |
11 |
0 |
0 |
238 |
| 2023 |
2 |
33 |
49 |
82 |
41 |
32 |
70 |
64 |
42 |
17 |
5 |
11 |
448 |
Sentinel-2 infrared images showed one or two prominent heat sources within the summit crater, accompanied by adjacent smaller sources, similar to recent years (see BGVN 46:01, 47:02, and 48:01). A unique image was obtained on 25 November 2023 by the OLI-2 (Operational Land Imager-2) on Landsat 9, showing the upper part of the volcano surrounded by clouds (figure 32).
Geologic Background. Mount Erebus, the world's southernmost historically active volcano, overlooks the McMurdo research station on Ross Island. It is the largest of three major volcanoes forming the crudely triangular Ross Island. The summit of the dominantly phonolitic volcano has been modified by one or two generations of caldera formation. A summit plateau at about 3,200 m elevation marks the rim of the youngest caldera, which formed during the late-Pleistocene and within which the modern cone was constructed. An elliptical 500 x 600 m wide, 110-m-deep crater truncates the summit and contains an active lava lake within a 250-m-wide, 100-m-deep inner crater; other lava lakes are sometimes present. The glacier-covered volcano was erupting when first sighted by Captain James Ross in 1841. Continuous lava-lake activity with minor explosions, punctuated by occasional larger Strombolian explosions that eject bombs onto the crater rim, has been documented since 1972, but has probably been occurring for much of the volcano's recent history.
Information Contacts: Hawai'i Institute of Geophysics and Planetology (HIGP) - MODVOLC Thermal Alerts System, School of Ocean and Earth Science and Technology (SOEST), Univ. of Hawai'i, 2525 Correa Road, Honolulu, HI 96822, USA (URL: http://modis.higp.hawaii.edu/); Copernicus Browser, Copernicus Data Space Ecosystem, European Space Agency (URL: https://dataspace.copernicus.eu/browser/); NASA Earth Observatory, EOS Project Science Office, NASA Goddard Space Flight Center, Goddard, Maryland, USA (URL: https://earthobservatory.nasa.gov/images/152134/erebus-breaks-through).
Rincon de la Vieja (Costa Rica) — January 2024 Cite this Report
Rincon de la Vieja
Costa Rica
10.83°N, 85.324°W; summit elev. 1916 m
All times are local (unless otherwise noted)
Frequent phreatic explosions during July-December 2023
Rincón de la Vieja is a volcanic complex in Costa Rica with a hot convecting acid lake that exhibits frequent weak phreatic explosions, gas-and-steam emissions, and occasional elevated sulfur dioxide levels (BGVN 45:10, 46:03, 46:11). The current eruption period began June 2021. This report covers activity during July-December 2023 and is based on weekly bulletins and occasional daily reports from the Observatorio Vulcanologico Sismologica de Costa Rica-Universidad Nacional (OVSICORI-UNA).
Numerous weak phreatic explosions continued during July-December 2023, along with gas-and-steam emissions and plumes that rose as high as 3 km above the crater rim. Many weekly OVSICORI-UNA bulletins included the previous week's number of explosions and emissions (table 9). For many explosions, the time of explosion was given (table 10). Frequent seismic activity (long-period earthquakes, volcano-tectonic earthquakes, and tremor) accompanied the phreatic activity.
Table 9. Number of reported weekly phreatic explosions and gas-and-steam emissions at Rincón de la Vieja, July-December 2023. Counts are reported for the week before the Weekly Bulletin date; not all reports included these data. Courtesy of OVSICORI-UNA.
| OVSICORI Weekly Bulletin |
Number of explosions |
Number of emissions |
| 28 Jul 2023 |
6 |
14 |
| 4 Aug 2023 |
10 |
12 |
| 1 Sep 2023 |
13 |
11 |
| 22 Sep 2023 |
12 |
13 |
| 29 Sep 2023 |
6 |
11 |
| 6 Oct 2023 |
12 |
5 |
| 13 Oct 2023 |
7 |
9 |
| 20 Oct 2023 |
1 |
15 |
| 27 Oct 2023 |
3 |
23 |
| 3 Nov 2023 |
3 |
10 |
| 17 Nov 2023 |
0 |
Some |
| 24 Nov 2023 |
0 |
14 |
| 8 Dec 2023 |
4 |
16 |
| 22 Dec 2023 |
8 |
18 |
Table 10. Summary of activity at Rincón de la Vieja during July-December 2023. Weak phreatic explosions and gas emissions are noted where the time of explosion was indicated in the weekly or daily bulletins. Height of plumes or emissions are distance above the crater rim. Courtesy of OVSICORI-UNA.
| Date |
Time |
Description of Activity |
| 1 Jul 2023 |
0156 |
Explosion. |
| 2 Jul 2023 |
0305 |
Explosion. |
| 4 Jul 2023 |
0229, 0635 |
Event at 0635 produced a gas-and-steam plume that rose 700 m and drifted W; seen by residents in Liberia (21 km SW). |
| 9 Jul 2023 |
1843 |
Explosion. |
| 21 Jul 2023 |
0705 |
Explosion. |
| 26 Jul 2023 |
1807 |
Explosion. |
| 28 Jul 2023 |
0802 |
Explosion generated a gas-and-steam plume that rose 500 m. |
| 30 Jul 2023 |
1250 |
Explosion. |
| 31 Jul 2023 |
2136 |
Explosion. |
| 11 Aug 2023 |
0828 |
Explosion. |
| 18 Aug 2023 |
1304 |
Explosion. |
| 21 Aug 2023 |
1224 |
Explosion generated gas-and-steam plumes rose 500-600 m. |
| 22 Aug 2023 |
0749 |
Explosion generated gas-and-steam plumes rose 500-600 m. |
| 24 Aug 2023 |
1900 |
Explosion. |
| 25 Aug 2023 |
0828 |
Event produced a steam-and-gas plume that rose 3 km and drifted NW. |
| 27-28 Aug 2023 |
0813 |
Four small events; the event at 0813 on 28 August lasted two minutes and generated a steam-and-gas plume that rose 2.5 km. |
| 1 Sep 2023 |
1526 |
Explosion generated plume that rose 2 km and ejected material onto the flanks. |
| 2-3 Sep 2023 |
- |
Small explosions detected in infrasound data. |
| 4 Sep 2023 |
1251 |
Gas-and-steam plume rose 1 km and drifted W. |
| 7 Nov 2023 |
1113 |
Explosion. |
| 8 Nov 2023 |
0722 |
Explosion. |
| 12 Nov 2023 |
0136 |
Small gas emissions. |
| 14 Nov 2023 |
0415 |
Small gas emissions. |
According to OVSICORI-UNA, during July-October the average weekly sulfur dioxide (SO2) flux ranged from 68 to 240 tonnes/day. However, in mid-November the flux increased to as high as 334 tonnes/day, the highest value measured in recent years. The high SO2 flux in mid-November was also detected by the TROPOMI instrument on the Sentinel-5P satellite (figure 43).
Geologic Background. Rincón de la Vieja, the largest volcano in NW Costa Rica, is a remote volcanic complex in the Guanacaste Range. The volcano consists of an elongated, arcuate NW-SE-trending ridge constructed within the 15-km-wide early Pleistocene Guachipelín caldera, whose rim is exposed on the south side. Sometimes known as the "Colossus of Guanacaste," it has an estimated volume of 130 km3 and contains at least nine major eruptive centers. Activity has migrated to the SE, where the youngest-looking craters are located. The twin cone of Santa María volcano, the highest peak of the complex, is located at the eastern end of a smaller, 5-km-wide caldera and has a 500-m-wide crater. A Plinian eruption producing the 0.25 km3 Río Blanca tephra about 3,500 years ago was the last major magmatic eruption. All subsequent eruptions, including numerous historical eruptions possibly dating back to the 16th century, have been from the prominent active crater containing a 500-m-wide acid lake located ENE of Von Seebach crater.
Information Contacts: Observatorio Vulcanológico Sismológica de Costa Rica-Universidad Nacional (OVSICORI-UNA), Apartado 86-3000, Heredia, Costa Rica (URL: http://www.ovsicori.una.ac.cr/); NASA Global Sulfur Dioxide Monitoring Page, Atmospheric Chemistry and Dynamics Laboratory, NASA Goddard Space Flight Center (NASA/GSFC), 8800 Greenbelt Road, Goddard MD 20771, USA (URL: https://so2.gsfc.nasa.gov/).
Bezymianny (Russia) — November 2023 Cite this Report
Bezymianny
Russia
55.972°N, 160.595°E; summit elev. 2882 m
All times are local (unless otherwise noted)
Explosion on 18 October 2023 sends ash plume 8 km high; lava flows and incandescent avalanches
Bezymianny, located on Russia’s Kamchatka Peninsula, has had eruptions since 1955 characterized by dome growth, explosions, pyroclastic flows, ash plumes, and ashfall. Activity during November 2022-April 2023 included gas-and-steam emissions, lava dome collapses generating avalanches, and persistent thermal activity. Similar eruptive activity continued from May through October 2023, described here based on information from weekly and daily reports of the Kamchatka Volcano Eruptions Response Team (KVERT), notices from Tokyo VAAC (Volcanic Ash Advisory Center), and from satellite data.
Overall activity decreased after the strong period of activity in late March through April 2023, which included ash explosions during 29 March and 7-8 April 2023 that sent plumes as high as 10-12 km altitude, along with dome growth and lava flows (BGVN 48:05). This reduced activity can be seen in the MIROVA thermal detection system graph (figure 56), which was consistent with data from the MODVOLC thermal detection system and with Sentinel-2 satellite images that showed persistent hotspots in the summit crater when conditions allowed observations. A renewed period of strong activity began in mid-October 2023.
Activity increased significantly on 17 October 2023 when large collapses began during 0700-0830 on the E flanks of the lava dome and continued to after 0930 the next day (figure 57). Ash plumes rose to an altitude of 4.5-5 km, extending 220 km NNE by 18 October. A large explosion at 1630 on 18 October produced an ash plume that rose to an altitude of 11 km (8 km above the summit) and drifted NNE and then NW, extending 900 km NW within two days at an altitude of 8 km. Minor ashfall was noted in Kozyrevsk (45 km WNW). At 0820 on 20 October an ash plume was identified in satellite images drifting 100 km ENE at altitudes of 4-4.5 km.
Lava flows and hot avalanches from the dome down the SE flank continued over the next few days, including 23 October when clear conditions allowed good observations (figures 58 and 59). A large thermal anomaly was observed over the volcano through 24 October, and in the summit crater on 30 October (figure 60). Strong fumarolic activity continued, with numerous avalanches and occasional incandescence. By the last week of October, volcanic activity had decreased to a level consistent with that earlier in the reporting period.
Aviation warnings were frequently updated during 17-20 October. KVERT issued a Volcano Observatory Notice for Aviation (VONA) on 17 October at 1419 and 1727 (0219 and 0527 UTC) raising the Aviation Color Code (ACC) from Yellow to Orange (second highest level). The next day, KVERT issued a VONA at 1705 (0505 UTC) raising the ACC to Red (highest level) but lowered it back to Orange at 2117 (0917 UTC). After another decrease to Yellow and back to Orange, the ACC was reduced to Yellow on 20 October at 1204 (0004 UTC). In addition, the Tokyo VAAC issued a series of Volcanic Ash Advisories beginning on 16 October and continuing through 30 October.
Geologic Background. The modern Bezymianny, much smaller than its massive neighbors Kamen and Kliuchevskoi on the Kamchatka Peninsula, was formed about 4,700 years ago over a late-Pleistocene lava-dome complex and an edifice built about 11,000-7,000 years ago. Three periods of intensified activity have occurred during the past 3,000 years. The latest period, which was preceded by a 1,000-year quiescence, began with the dramatic 1955-56 eruption. This eruption, similar to that of St. Helens in 1980, produced a large open crater that was formed by collapse of the summit and an associated lateral blast. Subsequent episodic but ongoing lava-dome growth, accompanied by intermittent explosive activity and pyroclastic flows, has largely filled the 1956 crater.
Information Contacts: Kamchatka Volcanic Eruptions Response Team (KVERT), Far Eastern Branch, Russian Academy of Sciences, 9 Piip Blvd., Petropavlovsk-Kamchatsky, 683006, Russia (URL: http://www.kscnet.ru/ivs/kvert/); Kamchatka Volcanological Station, Kamchatka Branch of Geophysical Survey, (KB GS RAS), Klyuchi, Kamchatka Krai, Russia (URL: http://volkstat.ru/); Tokyo Volcanic Ash Advisory Center (VAAC), 1-3-4 Otemachi, Chiyoda-ku, Tokyo 100-8122, Japan (URL: http://ds.data.jma.go.jp/svd/vaac/data/); Hawai'i Institute of Geophysics and Planetology (HIGP) - MODVOLC Thermal Alerts System, School of Ocean and Earth Science and Technology (SOEST), Univ. of Hawai'i, 2525 Correa Road, Honolulu, HI 96822, USA (URL: http://modis.higp.hawaii.edu/); MIROVA (Middle InfraRed Observation of Volcanic Activity), a collaborative project between the Universities of Turin and Florence (Italy) supported by the Centre for Volcanic Risk of the Italian Civil Protection Department (URL: http://www.mirovaweb.it/); Copernicus Browser, Copernicus Data Space Ecosystem, European Space Agency (URL: https://dataspace.copernicus.eu/browser/).chr
Kilauea (United States) — January 2023 Cite this Report
Kilauea
United States
19.421°N, 155.287°W; summit elev. 1222 m
All times are local (unless otherwise noted)
Low-level lava effusions in the lava lake at Halema’uma’u during July-December 2022
Kīlauea is the southeastern-most volcano in Hawaii and overlaps the E flank of the Mauna Loa volcano. Its East Rift Zone (ERZ) has been intermittently active for at least 2,000 years. An extended eruption period began in January 1983 and was characterized by open lava lakes and lava flows from the summit caldera and the East Rift Zone. During May 2018 magma migrated into the Lower East Rift Zone (LERZ) and opened 24 fissures along a 6-km-long NE-trending fracture zone that produced lava flows traveling in multiple directions. As lava emerged from the fissures, the lava lake at Halema'uma'u drained and explosions sent ash plumes to several kilometers altitude (BGVN 43:10).
The current eruption period started during September 2021 and has recently been characterized by lava effusions, spatter, and sulfur dioxide emissions in the active Halema’uma’u lava lake (BGVN 47:08). Lava effusions, some spatter, and sulfur dioxide emissions have continued during this reporting period of July through December 2022 using daily reports, volcanic activity notices, and abundant photo, map, and video data from the US Geological Survey's (USGS) Hawaiian Volcano Observatory (HVO).
Summary of activity during July-December 2022. Low-level effusions have continued at the western vent of the Halema’uma’u crater during July through early December 2022. Occasional weak ooze-outs (also called lava break outs) would occur along the margins of the crater floor. The overall level of the active lava lake throughout the reporting period gradually increased due to infilling, however it stagnated in mid-September (table 13). During September through November, activity began to decline, though lava effusions persisted at the western vent. By 9 December, the active part of the lava lake had completely crusted over, and incandescence was no longer visible.
Table 13. Summary of measurements taken during overflights at Kīlauea that show a gradual increase in the active lava lake level and the volume of lava effused since 29 September 2021. Lower activity was reported during September-October. Data collected during July-December 2022. Courtesy of HVO.
| Date: |
Level of the active lava lake (m): |
Cumulative volume of lava effused (million cubic meters): |
| 7 Jul 2022 |
130 |
95 |
| 19 Jul 2022 |
133 |
98 |
| 4 Aug 2022 |
136 |
102 |
| 16 Aug 2022 |
137 |
104 |
| 12 Sep 2022 |
143 |
111 |
| 5 Oct 2022 |
143 |
111 |
| 28 Oct 2022 |
143 |
111 |
Activity during July 2022. Lava effusions were reported from the western vent in the Halema’uma’u crater, along with occasional weak ooze-outs along the margins of the crater floor. The height of the lava lake was variable due to deflation-inflation tilt events; for example, the lake level dropped approximately 3-4 m during a summit deflation-inflation event reported on 1 July. Webcam images taken during the night of 6-12 July showed intermittent low-level spattering at the western vent that rose less than 10 m above the vent (figure 519). Measurements made during an overflight on 7 July indicated that the crater floor was infilled about 130 m and that 95 million cubic meters of lava had been effused since 29 September 2021. A single, relatively small lava ooze-out was active to the S of the lava lake. Around midnight on 8 July there were two brief periods of lava overflow onto the lake margins. On 9 July lava ooze-outs were reported near the SE and NE edges of the crater floor and during 10-11 July they occurred near the E, NE, and NW edges. On 16 July crater incandescence was reported, though the ooze-outs and spattering were not visible. On 18 July overnight webcam images showed incandescence in the western vent complex and two ooze-outs were reported around 0000 and 0200 on 19 July. By 0900 there were active ooze-outs along the SW edge of the crater floor. Measurements made from an overflight on 19 July indicated that the crater floor was infilled about 133 m and 98 million cubic meters of lava had erupted since 29 September 2021 (figure 520). On 20 July around 1600 active ooze-outs were visible along the N edge of the crater, which continued through the next day. Extensive ooze-outs occurred along the W margin during 24 July until 1900; on 26 July minor ooze-outs were noted along the N margin. Minor spattering was visible on 29 July along the E margin of the lake. The sulfur dioxide emission rates ranged 650-2,800 tons per day (t/d), the higher of which was measured on 8 July (figure 519).
Activity during August 2022. The eruption continued in the Halema’uma’u crater at the western vent. According to HVO the lava in the active lake remained at the level of the bounding levees. Occasional minor ooze-outs were observed along the margins of the crater floor. Strong nighttime crater incandescence was visible after midnight on 6 August over the western vent cone. During 6-7 August scattered small lava lobes were active along the crater floor and incandescence persisted above the western vent through 9 August. During 7-9 August HVO reported a single lava effusion source was active along the NW margin of the crater floor. Measurements from an overflight on 4 August indicated that the crater floor was infilled about 136 m total and that 102 million cubic meters of lava had been erupted since the start of the eruption. Lava breakouts were reported along the N, NE, E, S, and W margins of the crater during 10-16 August. Another overflight survey conducted on 16 August indicated that the crater floor infilled about 137 m and 104 million cubic meters of lava had been erupted since September 2021. Measured sulfur dioxide emissions rates ranged 1,150-2,450 t/d, the higher of which occurred on 8 August.
Activity during September 2022. During September, lava effusion continued from the western vent into the active lava lake and onto the crater floor. Intermittent minor ooze-outs were reported through the month. A small ooze-out was visible on the W crater floor margin at 0220 on 2 September, which showed decreasing surface activity throughout the day, but remained active through 3 September. On 3 September around 1900 a lava outbreak occurred along the NW margin of the crater floor but had stopped by the evening of 4 September. Field crews monitoring the summit lava lake on 9 September observed spattering on the NE margin of the lake that rose no higher than 10 m, before falling back onto the lava lake crust (figure 521). Overflight measurements on 12 September indicated that the crater floor was infilled a total of 143 m and 111 million cubic meters of lava had been erupted since September 2021. Extensive breakouts in the W and N part of the crater floor were reported at 1600 on 20 September and continued into 26 September. The active part of the lava lake dropped by 10 m while other parts of the crater floor dropped by several meters. Summit tiltmeters recorded a summit seismic swarm of more than 80 earthquakes during 1500-1800 on 21 September, which occurred about 1.5 km below Halema’uma’u; a majority of these were less than Mw 2. By 22 September the active part of the lava lake was infilled about 2 m. On 23 September the western vent areas exhibited several small spatter cones with incandescent openings, along with weak, sporadic spattering (figure 522). The sulfur dioxide emission rate ranged from 930 t/d to 2,000 t/d, the higher of which was measured on 6 September.
Activity during October 2022. Activity during October declined slightly compared to previous months, though lava effusions persisted from the western vent into the active lava lake and onto the crater floor during October (figure 523). Slight variations in the lava lake were noted throughout the month. HVO reported that around 0600 on 3 October the level of the lava lake has lowered slightly. Overflight measurements taken on 5 October indicated that the crater floor was infilled a total of about 143 m and that 111 million cubic meters of lava had been effused since September 2021. During 6-7 October the lake gradually rose 0.5 m. Sulfur dioxide measurements made on 22 October had an emission rate of 700 t/d. Another overflight taken on 28 October showed that there was little to no change in the elevation of the crater floor: the crater floor was infilled a total of 143 m and 111 million cubic meters of lava had erupted since the start of the eruption.
Activity during November 2022. Activity remained low during November, though HVO reported that lava from the western vent continued to effuse into the active lava lake and onto the crater floor throughout the month. The rate of sulfur dioxide emissions during November ranged from 300-600 t/d, the higher amount of which occurred on 9 November.
Activity during December 2022. Similar low activity was reported during December, with lava effusing from the western vent into the active lava lake and onto the crater floor. During 4-5 December the active part of the lava lake was slightly variable in elevation and fluctuated within 1 m. On 9 December HVO reported that lava was no longer erupting from the western vent in the Halema’uma’u crater and that sulfur dioxide emissions had returned to near pre-eruption background levels; during 10-11 December, the lava lake had completely crusted over, and no incandescence was visible (figure 524). Time lapse camera images covering the 4-10 December showed that the crater floor showed weak deflation and no inflation. Some passive events of crustal overturning were reported during 14-15 December, which brought fresh incandescent lava to the lake surface. The sulfur dioxide emission rate was approximately 200 t/d on 14 December. A smaller overturn event on 17 December and another that occurred around 0000 and into the morning of 20 December were also detected. A small seismic swarm was later detected on 30 December.
Geologic Background. Kilauea overlaps the E flank of the massive Mauna Loa shield volcano in the island of Hawaii. Eruptions are prominent in Polynesian legends; written documentation since 1820 records frequent summit and flank lava flow eruptions interspersed with periods of long-term lava lake activity at Halemaumau crater in the summit caldera until 1924. The 3 x 5 km caldera was formed in several stages about 1,500 years ago and during the 18th century; eruptions have also originated from the lengthy East and Southwest rift zones, which extend to the ocean in both directions. About 90% of the surface of the basaltic shield volcano is formed of lava flows less than about 1,100 years old; 70% of the surface is younger than 600 years. The long-term eruption from the East rift zone between 1983 and 2018 produced lava flows covering more than 100 km2, destroyed hundreds of houses, and added new coastline.
Information Contacts: Hawaiian Volcano Observatory (HVO), U.S. Geological Survey, PO Box 51, Hawai'i National Park, HI 96718, USA (URL: http://hvo.wr.usgs.gov/).
Nyamulagira (DR Congo) — November 2023 Cite this Report
Nyamulagira
DR Congo
1.408°S, 29.2°E; summit elev. 3058 m
All times are local (unless otherwise noted)
Lava flows and thermal activity during May-October 2023
Nyamulagira (also known as Nyamuragira) is a shield volcano in the Democratic Republic of Congo with the summit truncated by a small 2 x 2.3 km caldera with walls up to about 100 m high. Documented eruptions have occurred within the summit caldera, as well as from numerous flank fissures and cinder cones. The current eruption period began in April 2018 and has more recently been characterized by summit crater lava flows and thermal activity (BGVN 48:05). This report describes lava flows and variable thermal activity during May through October 2023, based on information from the Observatoire Volcanologique de Goma (OVG) and various satellite data.
Lava lake activity continued during May. The MIROVA (Middle InfraRed Observation of Volcanic Activity) system recorded moderate-to-strong thermal activity throughout the reporting period; activity was more intense during May and October and relatively weaker from June through September (figure 95). The MODVOLC thermal algorithm, detected a total of 209 thermal alerts. There were 143 hotspots detected during May, eight during June, nine during September, and 49 during October. This activity was also reflected in infrared satellite images, where a lava flow was visible in the NW part of the crater on 7 May and strong activity was seen in the center of the crater on 4 October (figure 96). Another infrared satellite image taken on 12 May showed still active lava flows along the NW margin of the crater. According to OVG lava effusions were active during 7-29 May and moved to the N and NW parts of the crater beginning on 9 May. Strong summit crater incandescence was visible from Goma (27 km S) during the nights of 17, 19, and 20 May (figure 97). On 17 May there was an increase in eruptive activity, which peaked at 0100 on 20 May. Notable sulfur dioxide plumes drifted NW and W during 19-20 May (figure 98). Drone footage acquired in partnership with the USGS (United States Geological Survey) on 20 May captured images of narrow lava flows that traveled about 100 m down the W flank (figure 99). Data from the Rumangabo seismic station indicated a decreasing trend in activity during 17-21 May. Although weather clouds prevented clear views of the summit, a strong thermal signature on the NW flank was visible in an infrared satellite image on 22 May, based on an infrared satellite image. On 28 May the lava flows on the upper W flank began to cool and solidify. By 29 May seismicity returned to levels similar to those recorded before the 17 May increase. Lava effusion continued but was confined to the summit crater; periodic crater incandescence was observed.
Low-level activity was noted during June through October. On 1 June OVG reported that seismicity remained at lower levels and that crater incandescence had been absent for three days, though infrared satellite imagery showed continued lava effusion in the summit crater. The lava flows on the flanks covered an estimated 0.6 km2. Satellite imagery continued to show thermal activity confined to the lava lake through October (figure 96), although no lava flows or significant sulfur dioxide emissions were reported.
Geologic Background. Africa's most active volcano, Nyamulagira (also known as Nyamuragira), is a massive high-potassium basaltic shield about 25 km N of Lake Kivu and 13 km NNW of the steep-sided Nyiragongo volcano. The summit is truncated by a small 2 x 2.3 km caldera that has walls up to about 100 m high. Documented eruptions have occurred within the summit caldera, as well as from the numerous flank fissures and cinder cones. A lava lake in the summit crater, active since at least 1921, drained in 1938, at the time of a major flank eruption. Recent lava flows extend down the flanks more than 30 km from the summit as far as Lake Kivu; extensive lava flows from this volcano have covered 1,500 km2 of the western branch of the East African Rift.
Information Contacts: Observatoire Volcanologique de Goma (OVG), Departement de Geophysique, Centre de Recherche en Sciences Naturelles, Lwiro, D.S. Bukavu, DR Congo; Hawai'i Institute of Geophysics and Planetology (HIGP) - MODVOLC Thermal Alerts System, School of Ocean and Earth Science and Technology (SOEST), Univ. of Hawai'i, 2525 Correa Road, Honolulu, HI 96822, USA (URL: http://modis.higp.hawaii.edu/); MIROVA (Middle InfraRed Observation of Volcanic Activity), a collaborative project between the Universities of Turin and Florence (Italy) supported by the Centre for Volcanic Risk of the Italian Civil Protection Department (URL: http://www.mirovaweb.it/); NASA Global Sulfur Dioxide Monitoring Page, Atmospheric Chemistry and Dynamics Laboratory, NASA Goddard Space Flight Center (NASA/GSFC), 8800 Greenbelt Road, Goddard, Maryland, USA (URL: https://so2.gsfc.nasa.gov/); Copernicus Browser, Copernicus Data Space Ecosystem, European Space Agency (URL: https://dataspace.copernicus.eu/browser/); Charles Balagizi, Goma Volcano Observatory, Departement de Geophysique, Centre de Recherche en Sciences Naturelles, Lwiro, D.S. Bukavu, DR Congo.
Bagana (Papua New Guinea) — October 2023 Cite this Report
Bagana
Papua New Guinea
6.137°S, 155.196°E; summit elev. 1855 m
All times are local (unless otherwise noted)
Explosions, ash plumes, ashfall, and lava flows during April-September 2023
The remote volcano of Bagana is located in central Bougainville Island, Papua New Guinea. Recorded eruptions date back to 1842 and activity has consisted of effusive activity that has built a small lava dome in the summit crater and occasional explosions that produced pyroclastic flows. The most recent eruption has been ongoing since February 2000 and has produced occasional explosions, ash plumes, and lava flows. More recently, activity has been characterized by ongoing effusive activity and ash emissions (BGVN 48:04). This report updates activity from April through September 2023 that has consisted of explosions, ash plumes, ashfall, and lava flows, using information from the Darwin Volcanic Ash Advisory Center (VAAC) and satellite data.
An explosive eruption was reported on 7 July that generated a large gas-and-ash plume to high altitudes and caused significant ashfall in local communities; the eruption plume had reached upper tropospheric (16-18 km altitude) altitudes by 2200, according to satellite images. Sulfur dioxide plumes were detected in satellite images on 8 July and indicated that the plume was likely a mixture of gas, ice, and ash. A report issued by the Autonomous Bougainville Government (ABG) (Torokina District, Education Section) on 10 July noted that significant ash began falling during 2000-2100 on 7 July and covered most areas in the Vuakovi, Gotana (9 km SW), Koromaketo, Laruma (25 km W) and Atsilima (27 km NW) villages. Pyroclastic flows also occurred, according to ground-based reports; small deposits confined to one drainage were inspected by RVO during an overflight on 17 July and were confirmed to be from the 7 July event. Ashfall continued until 10 July and covered vegetation, which destroyed bushes and gardens and contaminated rivers and streams.
RVO reported another eruption on 14 July. The Darwin VAAC stated that an explosive event started around 0830 on 15 July and produced an ash plume that rose to 16.5 km altitude by 1000 and drifted N, according to satellite images. The plume continued to drift N and remained visible through 1900, and by 2150 it had dissipated.
Ashfall likely from both the 7 and 15 July events impacted about 8,111 people in Torokina (20 km SW), including Tsito/Vuakovi, Gotana, Koromaketo, Kenaia, Longkogari, Kenbaki, Piva (13 km SW), and Atsinima, and in the Tsitovi district, according to ABG. Significant ashfall was also reported in Ruruvu (22 km N) in the Wakunai District of Central Bougainville, though the thickness of these deposits could not be confirmed. An evacuation was called for the villages in Wakunai, where heavy ashfall had contaminated water sources; the communities of Ruruvu, Togarau, Kakarapaia, Karauturi, Atao, and Kuritaturi were asked to evacuate to a disaster center at the Wakunai District Station, and communities in Torokina were asked to evacuate to the Piva District station. According to a news article, more than 7,000 people needed temporary accommodations, with about 1,000 people in evacuation shelters. Ashfall had deposited over a broad area, contaminating water supplies, affecting crops, and collapsing some roofs and houses in rural areas. Schools were temporarily shut down. Intermittent ash emissions continued through the end of July and drifted NNW, NW, and SW. Fine ashfall was reported on the coast of Torokina, and ash plumes also drifted toward Laruma and Atsilima.
A small explosive eruption occurred at 2130 on 28 July that ejected material from the crater vents, according to reports from Torokina, in addition to a lava flow that contained two lobes. A second explosion was detected at 2157. Incandescence from the lava flow was visible from Piva as it descended the W flank around 2000 on 29 July (figure 47). The Darwin VAAC reported that a strong thermal anomaly was visible in satellite images during 30-31 July and that ash emissions rose to 2.4 km altitude and drifted WSW on 30 July. A ground report from RVO described localized emissions at 0900 on 31 July.
The Darwin VAAC reported that ash plumes were identified in satellite imagery at 0800 and 1220 on 12 August and rose to 2.1 km and 3 km altitude and drifted NW and W, respectively. A news report stated that aid was sent to more than 6,300 people that were adversely affected by the eruption. Photos taken during 17-19 August showed ash emissions rising no higher than 1 km above the summit and drifting SE. A small explosion generated an ash plume during the morning of 19 August. Deposits from small pyroclastic flows were also captured in the photos. Satellite images captured lava flows and pyroclastic flow deposits. Two temporary seismic stations were installed near Bagana on 17 August at distances of 7 km WSW (Vakovi station) and 11 km SW (Kepox station). The Kepox station immediately started to record continuous, low-frequency background seismicity.
Satellite data. Little to no thermal activity was detected during April through mid-July 2023; only one anomaly was recorded during early April and one during early June, according to MIROVA (Middle InfraRed Observation of Volcanic Activity) data (figure 48). Thermal activity increased in both power and frequency during mid-July through September, although there were still some short gaps in detected activity. MODVOLC also detected increased thermal activity during August; thermal hotspots were detected a total of five times on 19, 20, and 27 August. Weak thermal anomalies were also captured in infrared satellite images on clear weather days throughout the reporting period on 7, 12, and 17 April, 27 May, 1, 6, 16, and 31 July, and 19 September (figure 48); a strong thermal anomaly was visible on 31 July. Distinct sulfur dioxide plumes that drifted generally NW were intermittently captured by the TROPOMI instrument on the Sentinel-5P satellite and sometimes exceeded two Dobson Units (DUs) (figure 49).
Geologic Background. Bagana volcano, in a remote portion of central Bougainville Island, is frequently active. This massive symmetrical cone was largely constructed by an accumulation of viscous andesitic lava flows. The entire edifice could have been constructed in about 300 years at its present rate of lava production. Eruptive activity is characterized by non-explosive effusion of viscous lava that maintains a small lava dome in the summit crater, although occasional explosive activity produces pyroclastic flows. Lava flows with tongue-shaped lobes up to 50 m thick and prominent levees descend the flanks on all sides.
Information Contacts: Rabaul Volcano Observatory (RVO), Geohazards Management Division, Department of Mineral Policy and Geohazards Management (DMPGM), PO Box 3386, Kokopo, East New Britain Province, Papua New Guinea; Darwin Volcanic Ash Advisory Centre (VAAC), Bureau of Meteorology, Northern Territory Regional Office, PO Box 40050, Casuarina, NT 0811, Australia (URL: http://www.bom.gov.au/info/vaac/); MIROVA (Middle InfraRed Observation of Volcanic Activity), a collaborative project between the Universities of Turin and Florence (Italy) supported by the Centre for Volcanic Risk of the Italian Civil Protection Department (URL: http://www.mirovaweb.it/); Hawai'i Institute of Geophysics and Planetology (HIGP) - MODVOLC Thermal Alerts System, School of Ocean and Earth Science and Technology (SOEST), Univ. of Hawai'i, 2525 Correa Road, Honolulu, HI 96822, USA (URL: http://modis.higp.hawaii.edu/); NASA Global Sulfur Dioxide Monitoring Page, Atmospheric Chemistry and Dynamics Laboratory, NASA Goddard Space Flight Center (NASA/GSFC), 8800 Greenbelt Road, Goddard, Maryland, USA (URL: https://so2.gsfc.nasa.gov/); Copernicus Browser, Copernicus Data Space Ecosystem, European Space Agency (URL: https://dataspace.copernicus.eu/browser/); Autonomous Bougainville Government, P.O Box 322, Buka, AROB, PNG (URL: https://abg.gov.pg/); Andrew Tupper (Twitter: @andrewcraigtupp); Simon Carn, Geological and Mining Engineering and Sciences, Michigan Technological University, 1400 Townsend Drive, Houghton, MI 49931, USA (URL: http://www.volcarno.com/, Twitter: @simoncarn); Radio NZ (URL: https://www.rnz.co.nz/news/pacific/494464/more-than-7-000-people-in-bougainville-need-temporary-accommodation-after-eruption); USAID, 1300 Pennsylvania Ave, NW, Washington DC 20004, USA (URL: https://www.usaid.gov/pacific-islands/press-releases/aug-08-2023-united-states-provides-immediate-emergency-assistance-support-communities-affected-mount-bagana-volcanic-eruptions).
Mayon (Philippines) — October 2023 Cite this Report
Mayon
Philippines
13.257°N, 123.685°E; summit elev. 2462 m
All times are local (unless otherwise noted)
Lava flows, pyroclastic flows, ash emissions, and seismicity during April-September 2023
Mayon is located in the Philippines and has steep upper slopes capped by a small summit crater. Historical eruptions date back to 1616 CE that have been characterized by Strombolian eruptions, lava flows, pyroclastic flows, and mudflows. Eruptions mostly originated from a central conduit. Pyroclastic flows and mudflows have commonly descended many of the approximately 40 drainages that surround the volcano. The most recent eruption occurred during June through October 2022 and consisted of lava dome growth and gas-and-steam emissions (BGVN 47:12). A new eruption was reported during late April 2023 and has included lava flows, pyroclastic density currents, ash emissions, and seismicity. This report covers activity during April through September 2023 based on daily bulletins from the Philippine Institute of Volcanology and Seismology (PHIVOLCS).
During April through September 2023, PHIVOLCS reported near-daily rockfall events, frequent volcanic earthquakes, and sulfur dioxide measurements. Gas-and-steam emissions rose 100-900 m above the crater and drifted in different directions. Nighttime crater incandescence was often visible during clear weather and was accompanied by incandescent avalanches of material. Activity notably increased during June when lava flows were reported on the S, SE, and E flanks (figure 52). The MIROVA graph (Middle InfraRed Observation of Volcanic Activity) showed strong thermal activity coincident with these lava flows, which remained active through September (figure 53). According to the MODVOLC thermal algorithm, a total of 110 thermal alerts were detected during the reporting period: 17 during June, 40 during July, 27 during August, and 26 during September. During early June, pyroclastic density currents (PDCs) started to occur more frequently.
Low activity was reported during much of April and May; gas-and-steam emissions rose 100-900 m above the crater and generally drifted in different directions. A total of 52 rockfall events and 18 volcanic earthquakes were detected during April and 147 rockfall events and 13 volcanic events during May. Sulfur dioxide flux measurements ranged between 400-576 tons per day (t/d) during April, the latter of which was measured on 29 April and between 162-343 t/d during May, the latter of which was measured on 13 May.
Activity during June increased, characterized by lava flows, pyroclastic density currents (PDCs), crater incandescence and incandescent rockfall events, gas-and-steam emissions, and continued seismicity. Weather clouds often prevented clear views of the summit, but during clear days, moderate gas-and-steam emissions rose 100-2,500 m above the crater and drifted in multiple directions. A total of 6,237 rockfall events and 288 volcanic earthquakes were detected. The rockfall events often deposited material on the S and SE flanks within 700-1,500 m of the summit crater and ash from the events drifted SW, S, SE, NE, and E. Sulfur dioxide emissions ranged between 149-1,205 t/d, the latter of which was measured on 10 June. Short-term observations from EDM and electronic tiltmeter monitoring indicated that the upper slopes were inflating since February 2023. Longer-term ground deformation parameters based on EDM, precise leveling, continuous GPS, and electronic tilt monitoring indicated that the volcano remained inflated, especially on the NW and SE flanks. At 1000 on 5 June the Volcano Alert Level (VAL) was raised to 2 (on a 0-5 scale). PHIVOLCS noted that although low-level volcanic earthquakes, ground deformation, and volcanic gas emissions indicated unrest, the steep increase in rockfall frequency may indicate increased dome activity.
A total of 151 dome-collapse PDCs occurred during 8-9 and 11-30 June, traveled 500-2,000 m, and deposited material on the S flank within 2 km of the summit crater. During 8-9 June the VAL was raised to 3. At approximately 1947 on 11 June lava flow activity was reported; two lobes traveled within 500 m from the crater and deposited material on the S (Mi-isi), SE (Bonga), and E (Basud) flanks. Weak seismicity accompanied the lava flow and slight inflation on the upper flanks. This lava flow remained active through 30 June, moving down the S and SE flank as far as 2.5 km and 1.8 km, respectively and depositing material up to 3.3 km from the crater. During 15-16 June traces of ashfall from the PDCs were reported in Sitio Buga, Nabonton, City of Ligao and Purok, and San Francisco, Municipality of Guinobatan. During 28-29 June there were two PDCs generated by the collapse of the lava flow front, which generated a light-brown ash plume 1 km high. Satellite monitors detected significant concentrations of sulfur dioxide beginning on 29 June. On 30 June PDCs primarily affected the Basud Gully on the E flank, the largest of which occurred at 1301 and lasted eight minutes, based on the seismic record. Four PDCs generated between 1800 and 2000 that lasted approximately four minutes each traveled 3-4 km on the E flank and generated an ash plume that rose 1 km above the crater and drifted N and NW. Ashfall was recorded in Tabaco City.
Similar strong activity continued during July; slow lava effusion remained active on the S and SE flanks and traveled as far as 2.8 km and 2.8 km, respectively and material was deposited as far as 4 km from the crater. There was a total of 6,983 rockfall events and 189 PDCs that affected the S, SE, and E flanks. The volcano network detected a total of 2,124 volcanic earthquakes. Continuous gas-and-steam emissions rose 200-2,000 m above the crater and drifted in multiple directions. Sulfur dioxide emissions averaged 792-4,113 t/d, the latter of which was measured on 28 July. During 2-4 July three PDCs were generated from the collapse of the lava flow and resulting light brown plumes rose 200-300 m above the crater. Continuous tremor pulses were reported beginning at 1547 on 3 July through 7 July at 1200, at 2300 on 8 July and going through 0300 on 10 July, and at 2300 on 16 July, as recorded by the seismic network. During 6-9 July there were 10 lava flow-collapse-related PDCs that generated light brown plumes 300-500 m above the crater. During 10-11 July light ashfall was reported in some areas of Mabinit, Legazpi City, Budiao and Salvacion, Daraga, and Camalig, Albay. By 18 July the lava flow advanced 600 m on the E flank as well.
During 1733 on 18 July and 0434 on 19 July PHIVOLCS reported 30 “ashing” events, which are degassing events accompanied by audible thunder-like sounds and entrained ash at the crater, which produced short, dark plumes that drifted SW. These events each lasted 20-40 seconds, and plume heights ranged from 150-300 m above the crater, as recorded by seismic, infrasound, visual, and thermal monitors. Three more ashing events occurred during 19-20 July. Short-term observations from electronic tilt and GPS monitoring indicate deflation on the E lower flanks in early July and inflation on the NW middle flanks during the third week of July. Longer-term ground deformation parameters from EDM, precise leveling, continuous GPS, and electronic tilt monitoring indicated that the volcano was still generally inflated relative to baseline levels. A short-lived lava pulse lasted 28 seconds at 1956 on 21 July, which was accompanied by seismic and infrasound signals. By 22 July, the only lava flow that remained active was on the SE flank, and continued to extend 3.4 km, while those on the S and E flanks weakened markedly. One ashing event was detected during 30-31 July, whereas there were 57 detected during 31 July-1 August; according to PHIVOLCS beginning at approximately 1800 on 31 July eruptive activity was dominated by phases of intermittent ashing, as well as increased in the apparent rates of lava effusion from the summit crater. The ashing phases consisted of discrete events recorded as low-frequency volcanic earthquakes (LFVQ) typically 30 seconds in duration, based on seismic and infrasound signals. Gray ash plume rose 100 m above the crater and generally drifted NE. Shortly after these ashing events began, new lava began to effuse rapidly from the crater, feeding the established flowed on the SE, E, and E flanks and generating frequent rockfall events.
Intensified unrest persisted during August. There was a total of 4,141 rockfall events, 2,881 volcanic earthquakes, which included volcanic tremor events, 32 ashing events, and 101 PDCs detected throughout the month. On clear weather days, gas-and-steam emissions rose 300-1,500 m above the crater and drifted in different directions (figure 54). Sulfur dioxide emissions averaged 735-4,756 t/d, the higher value of which was measured on 16 August. During 1-2 August the rate of lava effusion decreased, but continued to feed the flows on the SE, S, and E flanks, maintaining their advances to 3.4 km, 2.8 km, and 1.1 km from the crater, respectively (figure 55). Rockfall and PDCs generated by collapses at the lava flow margins and from the summit dome deposited material within 4 km of the crater. During 3-4 August there were 10 tremor events detected that lasted 1-4 minutes. Short-lived lava pulse lasted 35 seconds and was accompanied by seismic and infrasound signals at 0442 on 6 August. Seven collapses were recorded at the front of the lava flow during 12-14 August.
During September, similar activity of slow lava effusion, PDCs, gas-and-steam emissions, and seismicity continued. There was a total of 4,452 rockfall events, 329 volcanic earthquakes, which included volcanic tremor events, two ashing events, and 85 PDCs recorded throughout the month. On clear weather days, gas-and-steam emissions rose 100-1,500 m above the crater and drifted in multiple directions. Sulfur dioxide emissions averaged 609-2,252 t/d, the higher average of which was measured on 6 September. Slow lava effusion continued advancing on the SE, S, and E flanks, maintaining lengths of 3.4 km, 2.8 km, and 1.1 km, respectively. Rockfall and PDC events generated by collapses along the lava flow margins and at the summit dome deposited material within 4 km of the crater.
Geologic Background. Symmetrical Mayon, which rises above the Albay Gulf NW of Legazpi City, is the most active volcano of the Philippines. The steep upper slopes are capped by a small summit crater. Recorded eruptions since 1616 CE range from Strombolian to basaltic Plinian, with cyclical activity beginning with basaltic eruptions, followed by longer periods of andesitic lava flows. Eruptions occur predominately from the central conduit and have also produced lava flows that travel far down the flanks. Pyroclastic density currents and mudflows have commonly swept down many of the approximately 40 ravines that radiate from the summit and have often damaged populated lowland areas. A violent eruption in 1814 killed more than 1,200 people and devastated several towns.
Information Contacts: Philippine Institute of Volcanology and Seismology (PHIVOLCS), Department of Science and Technology, University of the Philippines Campus, Diliman, Quezon City, Philippines (URL: http://www.phivolcs.dost.gov.ph/); MIROVA (Middle InfraRed Observation of Volcanic Activity), a collaborative project between the Universities of Turin and Florence (Italy) supported by the Centre for Volcanic Risk of the Italian Civil Protection Department (URL: http://www.mirovaweb.it/); Hawai'i Institute of Geophysics and Planetology (HIGP) - MODVOLC Thermal Alerts System, School of Ocean and Earth Science and Technology (SOEST), Univ. of Hawai'i, 2525 Correa Road, Honolulu, HI 96822, USA (URL: http://modis.higp.hawaii.edu/); Copernicus Browser, Copernicus Data Space Ecosystem, European Space Agency (URL: https://dataspace.copernicus.eu/browser/); William Rogers, Legazpi City, Albay Province, Philippines.
Nishinoshima (Japan) — October 2023 Cite this Report
Nishinoshima
Japan
27.247°N, 140.874°E; summit elev. 100 m
All times are local (unless otherwise noted)
Eruption plumes and gas-and-steam plumes during May-August 2023
Nishinoshima, located about 1,000 km S of Tokyo, is a small island in the Ogasawara Arc in Japan. The island is the summit of a massive submarine volcano that has prominent submarine peaks to the S, W, and NE. Eruptions date back to 1973 and the current eruption period began in October 2022. Recent activity has consisted of small ash plumes and fumarolic activity (BGVN 48:07). This report covers activity during May through August 2023, using information from monthly reports of the Japan Meteorological Agency (JMA) monthly reports and satellite data.
Activity during May through June was relatively low. The Japan Coast Guard (JCG) did overflights on 14 and 22 June and reported white gas-and-steam emissions rising 600 m and 1,200 m from the central crater of the pyroclastic cone, respectively (figure 125). In addition, multiple white gas-and-steam emissions rose from the inner rim of the W side of the crater and from the SE flank of the pyroclastic cone. Discolored brown-to-green water was observed around almost the entire perimeter of the island; on 22 June light green discolored water was observed off the S coast of the island.
Observations from the Himawari meteorological satellite confirmed an eruption on 9 and 10 July. An eruption plume rose 1.6 km above the crater and drifted N around 1300 on 9 July. Satellite images acquired at 1420 and 2020 on 9 July and at 0220 on 10 July showed continuing emissions that rose 1.3-1.6 km above the crater and drifted NE and N. The Tokyo VAAC reported that an ash plume seen by a pilot and identified in a satellite image at 0630 on 21 July rose to 3 km altitude and drifted S.
Aerial observations conducted by JCG on 8 August showed a white-and-gray plume rising from the central crater of the pyroclastic cone, and multiple white gas-and-steam emissions were rising from the inner edge of the western crater and along the NW-SE flanks of the island (figure 126). Brown-to-green discolored water was also noted around the perimeter of the island.
Intermittent low-to-moderate power thermal anomalies were recorded in the MIROVA graph (Middle InfraRed Observation of Volcanic Activity), showing an increase in both frequency and power beginning in July (figure 127). This increase in activity coincides with eruptive activity on 9 and 10 July, characterized by eruption plumes. According to the MODVOLC thermal alert algorithm, one thermal hotspot was recorded on 20 July. Weak thermal anomalies were also detected in infrared satellite imagery, accompanied by strong gas-and-steam plumes (figure 128).
Geologic Background. The small island of Nishinoshima was enlarged when several new islands coalesced during an eruption in 1973-74. Multiple eruptions that began in 2013 completely covered the previous exposed surface and continued to enlarge the island. The island is the summit of a massive submarine volcano that has prominent peaks to the S, W, and NE. The summit of the southern cone rises to within 214 m of the ocean surface 9 km SSE.
Information Contacts: Japan Meteorological Agency (JMA), 1-3-4 Otemachi, Chiyoda-ku, Tokyo 100-8122, Japan (URL: http://www.jma.go.jp/jma/indexe.html); Tokyo Volcanic Ash Advisory Center (VAAC), 1-3-4 Otemachi, Chiyoda-ku, Tokyo 100-8122, Japan (URL: http://ds.data.jma.go.jp/svd/vaac/data/); MIROVA (Middle InfraRed Observation of Volcanic Activity), a collaborative project between the Universities of Turin and Florence (Italy) supported by the Centre for Volcanic Risk of the Italian Civil Protection Department (URL: http://www.mirovaweb.it/); Copernicus Browser, Copernicus Data Space Ecosystem, European Space Agency (URL: https://dataspace.copernicus.eu/browser/).
Krakatau (Indonesia) — October 2023 Cite this Report
Krakatau
Indonesia
6.1009°S, 105.4233°E; summit elev. 285 m
All times are local (unless otherwise noted)
White gas-and-steam plumes and occasional ash plumes during May-August 2023
Krakatau is located in the Sunda Strait between Java and Sumatra, Indonesia. Caldera collapse during the catastrophic 1883 eruption destroyed Danan and Perbuwatan cones and left only a remnant of Rakata. The post-collapse cone of Anak Krakatau (Child of Krakatau) was constructed within the 1883 caldera at a point between the former Danan and Perbuwatan cones; it has been the site of frequent eruptions since 1927. The current eruption period began in May 2021 and has recently consisted of Strombolian eruptions and ash plumes (BGVN 48:07). This report describes lower levels of activity consisting of ash and white gas-and-steam plumes during May through August 2023, based on information provided by the Indonesian Center for Volcanology and Geological Hazard Mitigation, referred to as Pusat Vulkanologi dan Mitigasi Bencana Geologi (PVMBG), MAGMA Indonesia, and satellite data.
Activity was relatively low during May and June. Daily white gas-and-steam emissions rose 25-200 m above the crater and drifted in different directions. Five ash plumes were detected at 0519 on 10 May, 1241 on 11 May, 0920 on 12 May, 2320 on 12 May, and at 0710 on 13 May, and rose 1-2.5 km above the crater and drifted SW. A webcam image taken on 12 May showed ejection of incandescent material above the vent. A total of nine ash plumes were detected during 6-11 June: at 1434 and 00220 on 6 and 7 June the ash plumes rose 500 m above the crater and drifted NW, at 1537 on 8 June the ash plume rose 1 km above the crater and drifted SW, at 0746 and at 0846 on 9 June the ash plumes rose 800 m and 3 km above the crater and drifted SW, respectively, at 0423, 1431, and 1750 on 10 June the ash plumes rose 2 km, 1.5 km, and 3.5 km above the crater and drifted NW, respectively, and at 0030 on 11 June an ash plume rose 2 km above the crater and drifted NW. Webcam images taken on 10 and 11 June at 0455 and 0102, respectively, showed incandescent material ejected above the vent. On 19 June an ash plume at 0822 rose 1.5 km above the crater and drifted SE.
Similar low activity of white gas-and-steam emissions and few ash plumes were reported during July and August. Daily white gas-and-steam emissions rose 25-300 m above the crater and drifted in multiple directions. Three ash plumes were reported at 0843, 0851, and 0852 on 20 July that rose 500-2,000 m above the crater and drifted NW.
The MIROVA (Middle InfraRed Observation of Volcanic Activity) graph of MODIS thermal anomaly data showed intermittent low-to-moderate power thermal anomalies during May through August 2023 (figure 140). Although activity was often obscured by weather clouds, a thermal anomaly was visible in an infrared satellite image of the crater on 12 May, accompanied by an eruption plume that drifted SW (figure 141).
Geologic Background. The renowned Krakatau (frequently mis-named as Krakatoa) volcano lies in the Sunda Strait between Java and Sumatra. Collapse of an older edifice, perhaps in 416 or 535 CE, formed a 7-km-wide caldera. Remnants of that volcano are preserved in Verlaten and Lang Islands; subsequently the Rakata, Danan, and Perbuwatan cones were formed, coalescing to create the pre-1883 Krakatau Island. Caldera collapse during the catastrophic 1883 eruption destroyed Danan and Perbuwatan, and left only a remnant of Rakata. This eruption caused more than 36,000 fatalities, most as a result of tsunamis that swept the adjacent coastlines of Sumatra and Java. Pyroclastic surges traveled 40 km across the Sunda Strait and reached the Sumatra coast. After a quiescence of less than a half century, the post-collapse cone of Anak Krakatau (Child of Krakatau) was constructed within the 1883 caldera at a point between the former Danan and Perbuwatan cones. Anak Krakatau has been the site of frequent eruptions since 1927.
Information Contacts: Pusat Vulkanologi dan Mitigasi Bencana Geologi (PVMBG, also known as Indonesian Center for Volcanology and Geological Hazard Mitigation, CVGHM), Jalan Diponegoro 57, Bandung 40122, Indonesia (URL: http://www.vsi.esdm.go.id/); MAGMA Indonesia, Kementerian Energi dan Sumber Daya Mineral (URL: https://magma.esdm.go.id/v1); MIROVA (Middle InfraRed Observation of Volcanic Activity), a collaborative project between the Universities of Turin and Florence (Italy) supported by the Centre for Volcanic Risk of the Italian Civil Protection Department (URL: http://www.mirovaweb.it/); Copernicus Browser, Copernicus Data Space Ecosystem, European Space Agency (URL: https://dataspace.copernicus.eu/browser/).
Villarrica (Chile) — October 2023 Cite this Report
Villarrica
Chile
39.42°S, 71.93°W; summit elev. 2847 m
All times are local (unless otherwise noted)
Strombolian activity, gas-and-ash emissions, and crater incandescence during April-September 2023
Villarrica, in central Chile, consists of a 2-km-wide caldera that formed about 3,500 years ago and is located at the base of the presently active cone at the NW margin of a 6-km-wide caldera. Historical eruptions eruptions date back to 1558 and have been characterized by mild-to-moderate explosive activity with occasional lava effusions. The current eruption period began in December 2014 and has recently consisted of nighttime crater incandescence, ash emissions, and seismicity (BGVN 48:04). This report covers activity during April through September 2023 and describes occasional Strombolian activity, gas-and-ash emissions, and nighttime crater incandescence. Information for this report primarily comes from the Southern Andes Volcano Observatory (Observatorio Volcanológico de Los Andes del Sur, OVDAS), part of Chile's National Service of Geology and Mining (Servicio Nacional de Geología y Minería, SERNAGEOMIN) and satellite data.
Seismicity during April consisted of long period (LP) events and tremor (TRE); a total of 9,413 LP-type events and 759 TR-type events were detected throughout the month. Nighttime crater incandescence persisted and was visible in the degassing column. Sulfur dioxide data was obtained using Differential Absorption Optical Spectroscopy Equipment (DOAS) that showed an average value of 1,450 ± 198 tons per day (t/d) during 1-15 April and 1,129 ± 201 t/d during 16-30 April, with a maximum daily value of 2,784 t/d on 9 April. Gas-and-steam emissions of variable intensities rose above the active crater as high as 1.3 km above the crater on 13 April. Strombolian explosions were not observed and there was a slight decrease in the lava lake level.
There were 14,123 LP-type events and 727 TR-type events detected during May. According to sulfur dioxide measurements taken with DOAS equipment, the active crater emitted an average value of 1,826 ± 482 t/d during 1-15 May and 912 ± 41 t/d during 16-30 May, with a daily maximum value of 5,155 t/d on 13 May. Surveillance cameras showed continuous white gas-and-steam emissions that rose as high as 430 m above the crater on 27 May. Nighttime incandescence illuminated the gas column less than 300 m above the crater rim was and no pyroclastic emissions were reported. A landslide was identified on 13 May on the E flank of the volcano 50 m from the crater rim and extending 300 m away; SERNAGEOMIN noted that this event may have occurred on 12 May. During the morning of 27 and 28 May minor Strombolian explosions characterized by incandescent ejecta were recorded at the crater rim; the last reported Strombolian explosions had occurred at the end of March.
Seismic activity during June consisted of five volcano-tectonic (VT)-type events, 21,606 LP-type events, and 2,085 TR-type events. The average value of sulfur dioxide flux obtained by DOAS equipment was 1,420 ± 217 t/d during 1-15 June and 2,562 ± 804 t/d, with a maximum daily value of 4,810 t/d on 17 June. White gas-and-steam emissions rose less than 480 m above the crater; frequent nighttime crater incandescence was reflected in the degassing plume. On 12 June an emission rose 100 m above the crater and drifted NNW. On 15 June one or several emissions resulted in ashfall to the NE as far as 5.5 km from the crater, based on a Skysat satellite image. Several Strombolian explosions occurred within the crater; activity on 15 June was higher energy and ejected blocks 200-300 m on the NE slope. Surveillance cameras showed white gas-and-steam emissions rising 480 m above the crater on 16 June. On 19 and 24 June low-intensity Strombolian activity was observed, ejecting material as far as 200 m from the center of the crater to the E.
During July, seismicity included 29,319 LP-type events, 3,736 TR-type events, and two VT-type events. DOAS equipment recorded two days of sulfur dioxide emissions of 4,220 t/d and 1,009 t/d on 1 and 13 July, respectively. Constant nighttime incandescence was also recorded and was particularly noticeable when accompanied by eruptive columns on 12 and 16 July. Minor explosive events were detected in the crater. According to Skysat satellite images taken on 12, 13, and 16 July, ashfall deposits were identified 155 m S of the crater. According to POVI, incandescence was visible from two vents on the crater floor around 0336 on 12 July. Gas-and-ash emissions rose as high as 1.2 km above the crater on 13 July and drifted E and NW. A series of gas-and-steam pulses containing some ash deposited material on the upper E flank around 1551 on 13 July. During 16-31 July, average sulfur dioxide emissions of 1,679 ± 406 t/d were recorded, with a maximum daily value of 2,343 t/d on 28 July. Fine ash emissions were also reported on 16, 17, and 23 July.
Seismicity persisted during August, characterized by 27,011 LP-type events, 3,323 TR-type events, and three VT-type events. The average value of sulfur dioxide measurements taken during 1-15 August was 1,642 ± 270 t/d and 2,207 ± 4,549 t/d during 16-31 August, with a maximum daily value of 3,294 t/d on 27 August. Nighttime crater incandescence remained visible in degassing columns. White gas-and-steam emissions rose 480 m above the crater on 6 August. According to a Skysat satellite image from 6 August, ash accumulation was observed proximal to the crater and was mainly distributed toward the E slope. White gas-and-steam emissions rose 320 m above the crater on 26 August. Nighttime incandescence and Strombolian activity that generated ash emissions were reported on 27 August.
Seismicity during September was characterized by five VT-type events, 12,057 LP-type events, and 2,058 TR-type events. Nighttime incandescence persisted. On 2 September an ash emission rose 180 m above the crater and drifted SE at 1643 (figure 125) and a white gas-and-steam plume rose 320 m above the crater. According to the Buenos Aires VAAC, periods of continuous gas-and-ash emissions were visible in webcam images from 1830 on 2 September to 0110 on 3 September. Strombolian activity was observed on 2 September and during the early morning of 3 September, the latter event of which generated an ash emission that rose 60 m above the crater and drifted 100 m from the center of the crater to the NE and SW. Ashfall was reported to the SE and S as far as 750 m from the crater. The lava lake was active during 3-4 September and lava fountaining was visible for the first time since 26 March 2023, according to POVI. Fountains captured in webcam images at 2133 on 3 September and at 0054 on 4 September rose as high as 60 m above the crater rim and ejected material onto the upper W flank. Sulfur dioxide flux of 1,730 t/d and 1,281 t/d was measured on 3 and 4 September, respectively, according to data obtained by DOAS equipment.
Strong Strombolian activity and larger gas-and-ash plumes were reported during 18-20 September. On 18 September activity was also associated with energetic LP-type events and notable sulfur dioxide fluxes (as high as 4,277 t/d). On 19 September Strombolian activity and incandescence were observed. On 20 September at 0914 ash emissions rose 50 m above the crater and drifted SSE, accompanied by Strombolian activity that ejected material less than 100 m SSE, causing fall deposits on that respective flank. SERNAGEOMIN reported that a Planet Scope satellite image taken on 20 September showed the lava lake in the crater, measuring 32 m x 35 m and an area of 0.001 km2. Several ash emissions were recorded at 0841, 0910, 1251, 1306, 1312, 1315, and 1324 on 23 September and rose less than 150 m above the crater. The sulfur dioxide flux value was 698 t/d on 23 September and 1,097 t/d on 24 September. On 24 September the Volcanic Alert Level (VAL) was raised to Orange (the third level on a four-color scale). SENAPRED maintained the Alert Level at Yellow (the middle level on a three-color scale) for the communities of Villarrica, Pucón (16 km N), Curarrehue, and Panguipulli.
During 24-25 September there was an increase in seismic energy (observed at TR-events) and acoustic signals, characterized by 1 VT-type event, 213 LP-type events, and 124 TR-type events. Mainly white gas-and-steam emissions, in addition to occasional fine ash emissions were recorded. During the early morning of 25 September Strombolian explosions were reported and ejected material 250 m in all directions, though dominantly toward the NW. On 25 September the average value of sulfur dioxide flux was 760 t/d. Seismicity during 25-30 September consisted of five VT-type events, 1,937 LP-type events, and 456 TR-type events.
During 25-29 September moderate Strombolian activity was observed and ejected material as far as the crater rim. In addition, ash pulses lasting roughly 50 minutes were observed around 0700 and dispersed ENE. During 26-27 September a TR episode lasted 6.5 hours and was accompanied by discrete acoustic signals. Satellite images from 26 September showed a spatter cone on the crater floor with one vent that measured 10 x 14 m and a smaller vent about 35 m NE of the cone. SERNAGEOMIN reported an abundant number of bomb-sized blocks up to 150 m from the crater, as well as impact marks on the snow, which indicated explosive activity. A low-altitude ash emission was observed drifting NW around 1140 on 28 September, based on webcam images. Between 0620 and 0850 on 29 September an ash emission rose 60 m above the crater and drifted NW. During an overflight taken around 1000 on 29 September scientists observed molten material in the vent, a large accumulation of pyroclasts inside the crater, and energetic degassing, some of which contained a small amount of ash. Block-sized pyroclasts were deposited on the internal walls and near the crater, and a distal ash deposit was also visible. The average sulfur dioxide flux measured on 28 September was 344 t/d. Satellite images taken on 29 September ashfall was deposited roughly 3 km WNW from the crater and nighttime crater incandescence remained visible. The average sulfur dioxide flux value from 29 September was 199 t/d. On 30 September at 0740 a pulsating ash emission rose 1.1 km above the crater and drifted NNW (figure 126). Deposits on the S flank extended as far as 4.5 km from the crater rim, based on satellite images from 30 September.
Infrared MODIS satellite data processed by MIROVA (Middle InfraRed Observation of Volcanic Activity) showed intermittent thermal activity during April through September, with slightly stronger activity detected during late September (figure 127). Small clusters of thermal activity were detected during mid-June, early July, early August, and late September. According to the MODVOLC thermal alert system, a total of four thermal hotspots were detected on 7 July and 3 and 23 September. This activity was also intermittently captured in infrared satellite imagery on clear weather days (figure 128).
Geologic Background. The glacier-covered Villarrica stratovolcano, in the northern Lakes District of central Chile, is ~15 km south of the city of Pucon. A 2-km-wide caldera that formed about 3,500 years ago is located at the base of the presently active, dominantly basaltic to basaltic andesite cone at the NW margin of a 6-km-wide Pleistocene caldera. More than 30 scoria cones and fissure vents are present on the flanks. Plinian eruptions and pyroclastic flows that have extended up to 20 km from the volcano were produced during the Holocene. Lava flows up to 18 km long have issued from summit and flank vents. Eruptions documented since 1558 CE have consisted largely of mild-to-moderate explosive activity with occasional lava effusion. Glaciers cover 40 km2 of the volcano, and lahars have damaged towns on its flanks.
Information Contacts: Servicio Nacional de Geología y Minería (SERNAGEOMIN), Observatorio Volcanológico de Los Andes del Sur (OVDAS), Avda Sta María No. 0104, Santiago, Chile (URL: http://www.sernageomin.cl/); Proyecto Observación Villarrica Internet (POVI) (URL: http://www.povi.cl/); Sistema y Servicio Nacional de Prevención y Repuesta Ante Desastres (SENAPRED), Av. Beauchef 1671, Santiago, Chile (URL: https://web.senapred.cl/); Buenos Aires Volcanic Ash Advisory Center (VAAC), Servicio Meteorológico Nacional-Fuerza Aérea Argentina, 25 de mayo 658, Buenos Aires, Argentina (URL: http://www.smn.gov.ar/vaac/buenosaires/inicio.php); MIROVA (Middle InfraRed Observation of Volcanic Activity), a collaborative project between the Universities of Turin and Florence (Italy) supported by the Centre for Volcanic Risk of the Italian Civil Protection Department (URL: http://www.mirovaweb.it/); Hawai'i Institute of Geophysics and Planetology (HIGP) - MODVOLC Thermal Alerts System, School of Ocean and Earth Science and Technology (SOEST), Univ. of Hawai'i, 2525 Correa Road, Honolulu, HI 96822, USA (URL: http://modis.higp.hawaii.edu/); Copernicus Browser, Copernicus Data Space Ecosystem, European Space Agency (URL: https://dataspace.copernicus.eu/browser/).
Merapi (Indonesia) — October 2023 Cite this Report
Merapi
Indonesia
7.54°S, 110.446°E; summit elev. 2910 m
All times are local (unless otherwise noted)
Frequent incandescent avalanches during April-September 2023
Merapi, located just north of the major city of Yogyakarta in central Java, Indonesia, has had activity within the last 20 years characterized by pyroclastic flows and lahars accompanying growth and collapse of the steep-sided active summit lava dome. The current eruption period began in late December 2020 and has more recently consisted of ash plumes, intermittent incandescent avalanches of material, and pyroclastic flows (BGVN 48:04). This report covers activity during April through September 2023, based on information from Balai Penyelidikan dan Pengembangan Teknologi Kebencanaan Geologi (BPPTKG), the Center for Research and Development of Geological Disaster Technology, a branch of PVMBG which specifically monitors Merapi. Additional information comes from the Pusat Vulkanologi dan Mitigasi Bencana Geologi (PVMBG, also known as Indonesian Center for Volcanology and Geological Hazard Mitigation, CVGHM), MAGMA Indonesia, the Darwin Volcanic Ash Advisory Centre (VAAC), and various satellite data.
Activity during April through September 2023 primarily consisted of incandescent avalanches of material that mainly affected the SW and W flanks and traveled as far as 2.3 km from the summit (table 25) and white gas-and-steam emissions that rose 10-1,000 m above the crater.
Table 25. Monthly summary of avalanches and avalanche distances recorded at Merapi during April through September 2023. The number of reported avalanches does not include instances where possible avalanches were heard but could not be visually confirmed as a result of inclement weather. Data courtesy of BPPTKG (April-September 2023 daily reports).
| Month |
Average number of avalanches per day |
Distance avalanches traveled (m) |
| Apr 2023 |
19 |
1,200-2,000 |
| May 2023 |
22 |
500-2,000 |
| Jun 2023 |
18 |
1,200-2,000 |
| Jul 2023 |
30 |
300-2,000 |
| Aug 2023 |
25 |
400-2,300 |
| Sep 2023 |
23 |
600-2,000 |
BPPTKG reported that during April and May white gas-and-steam emissions rose 10-750 m above the crater, incandescent avalanches descended 500-2,000 m on the SW and W flanks (figure 135). Cloudy weather often prevented clear views of the summit, and sometimes avalanches could not be confirmed. According to a webcam image, a pyroclastic flow was visible on 17 April at 0531. During the week of 28 April and 4 May a pyroclastic flow was reported on the SW flank, traveling up to 2.5 km. According to a drone overflight taken on 17 May the SW lava dome volume was an estimated 2,372,800 cubic meters and the dome in the main crater was an estimated 2,337,300 cubic meters.
During June and July similar activity persisted with white gas-and-steam emissions rising 10-350 m above the crater and frequent incandescent avalanches that traveled 300-2,000 m down the SW, W, and S flanks (figure 136). Based on an analysis of aerial photos taken on 24 June the volume of the SW lava dome was approximately 2.5 million cubic meters. A pyroclastic flow was observed on 5 July that traveled 2.7 km on the SW flank. According to the Darwin VAAC multiple minor ash plumes were identified in satellite images on 19 July that rose to 3.7 km altitude and drifted S and SW. During 22, 25, and 26 July a total of 17 avalanches descended as far as 1.8 km on the S flank.
Frequent white gas-and-steam emissions continued during August and September, rising 10-450 m above the crater. Incandescent avalanches mainly affected the SW and W flanks and traveled 400-2,300 m from the vent (figure 137). An aerial survey conducted on 10 August was analyzed and reported that estimates of the SW dome volume was 2,764,300 cubic meters and the dome in the main crater was 2,369,800 cubic meters.
Frequent and moderate-power thermal activity continued throughout the reporting period, according to a MIROVA (Middle InfraRed Observation of Volcanic Activity) analysis of MODIS satellite data (figure 138). There was an increase in the number of detected anomalies during mid-May. The MODVOLC thermal algorithm recorded a total of 47 thermal hotspots: six during April, nine during May, eight during June, 15 during July, four during August, and five during September. Some of this activity was captured in infrared satellite imagery on clear weather days, sometimes accompanied by incandescent material on the SW flank (figure 139).
Geologic Background. Merapi, one of Indonesia's most active volcanoes, lies in one of the world's most densely populated areas and dominates the landscape immediately north of the major city of Yogyakarta. It is the youngest and southernmost of a volcanic chain extending NNW to Ungaran volcano. Growth of Old Merapi during the Pleistocene ended with major edifice collapse perhaps about 2,000 years ago, leaving a large arcuate scarp cutting the eroded older Batulawang volcano. Subsequent growth of the steep-sided Young Merapi edifice, its upper part unvegetated due to frequent activity, began SW of the earlier collapse scarp. Pyroclastic flows and lahars accompanying growth and collapse of the steep-sided active summit lava dome have devastated cultivated lands on the western-to-southern flanks and caused many fatalities.
Information Contacts: Balai Penyelidikan dan Pengembangan Teknologi Kebencanaan Geologi (BPPTKG), Center for Research and Development of Geological Disaster Technology (URL: http://merapi.bgl.esdm.go.id/, Twitter: @BPPTKG); MAGMA Indonesia, Kementerian Energi dan Sumber Daya Mineral (URL: https://magma.esdm.go.id/v1); Pusat Vulkanologi dan Mitigasi Bencana Geologi (PVMBG, also known as Indonesian Center for Volcanology and Geological Hazard Mitigation, CVGHM), Jalan Diponegoro 57, Bandung 40122, Indonesia (URL: http://www.vsi.esdm.go.id/); Darwin Volcanic Ash Advisory Centre (VAAC), Bureau of Meteorology, Northern Territory Regional Office, PO Box 40050, Casuarina, NT 0811, Australia (URL: http://www.bom.gov.au/info/vaac/); MIROVA (Middle InfraRed Observation of Volcanic Activity), a collaborative project between the Universities of Turin and Florence (Italy) supported by the Centre for Volcanic Risk of the Italian Civil Protection Department (URL: http://www.mirovaweb.it/); Hawai'i Institute of Geophysics and Planetology (HIGP) - MODVOLC Thermal Alerts System, School of Ocean and Earth Science and Technology (SOEST), Univ. of Hawai'i, 2525 Correa Road, Honolulu, HI 96822, USA (URL: http://modis.higp.hawaii.edu/); Copernicus Browser, Copernicus Data Space Ecosystem, European Space Agency (URL: https://dataspace.copernicus.eu/browser/); Øystein Lund Andersen (URL: https://www.oysteinlundandersen.com/, https://twitter.com/oysteinvolcano).
Ebeko
Russia
50.686°N, 156.014°E; summit elev. 1103 m
All times are local (unless otherwise noted)
Moderate explosive activity with ash plumes continued during June-November 2023
Ebeko, located on the N end of Paramushir Island in Russia’s Kuril Islands just S of the Kamchatka Peninsula, consists of three summit craters along a SSW-NNE line at the northern end of a complex of five volcanic cones. Observed eruptions date back to the late 18th century and have been characterized as small-to-moderate explosions from the summit crater, accompanied by intense fumarolic activity. The current eruptive period began in June 2022, consisting of frequent explosions, ash plumes, and thermal activity (BGVN 47:10, 48:06). This report covers similar activity during June-November 2023, based on information from the Kamchatka Volcanic Eruptions Response Team (KVERT) and satellite data.
Moderate explosive activity continued during June-November 2023 (figures 50 and 51). According to visual data from Severo-Kurilsk, explosions sent ash 2-3.5 km above the summit (3-4.5 km altitude) during most days during June through mid-September. Activity after mid-September was slightly weaker, with ash usually reaching less than 2 km above the summit. According to KVERT the volcano in October and November was, with a few exceptions, either quiet or obscured by clouds that prevented satellite observations. KVERT issued Volcano Observatory Notices for Aviation (VONA) on 8 and 12 June, 13 and 22 July, 3 and 21 August, and 31 October warning of potential aviation hazards from ash plumes drifting 3-15 km from the volcano. Based on satellite data, KVERT reported a persistent thermal anomaly whenever weather clouds permitted viewing.
Geologic Background. The flat-topped summit of the central cone of Ebeko volcano, one of the most active in the Kuril Islands, occupies the northern end of Paramushir Island. Three summit craters located along a SSW-NNE line form Ebeko volcano proper, at the northern end of a complex of five volcanic cones. Blocky lava flows extend west from Ebeko and SE from the neighboring Nezametnyi cone. The eastern part of the southern crater contains strong solfataras and a large boiling spring. The central crater is filled by a lake about 20 m deep whose shores are lined with steaming solfataras; the northern crater lies across a narrow, low barrier from the central crater and contains a small, cold crescentic lake. Historical activity, recorded since the late-18th century, has been restricted to small-to-moderate explosive eruptions from the summit craters. Intense fumarolic activity occurs in the summit craters, on the outer flanks of the cone, and in lateral explosion craters.
Information Contacts: Kamchatka Volcanic Eruptions Response Team (KVERT), Far Eastern Branch, Russian Academy of Sciences, 9 Piip Blvd., Petropavlovsk-Kamchatsky, 683006, Russia (URL: http://www.kscnet.ru/ivs/kvert/).
Search Bulletin Archive by Publication Date
Select a month and year from the drop-downs and click "Show Issue" to have that issue displayed in this tab.
The default month and year is the latest issue available.
Bulletin of the Global Volcanism Network - Volume 15, Number 01 (January 1990)
Managing Editor: Lindsay McClelland
Arenal (Costa Rica)
Continuous tephra emission; blocks and bombs to 1,200 m from the crater; small nuées ardentes; flank lava flows
Bagana (Papua New Guinea)
Continued slow summit lava extrusion; new lava pulses every 4-5 days
Dawson Strait Group (Papua New Guinea)
Felt swarm of A- and B-type earthquakes; divers film submarine vents and hear booming and roaring
Etna (Italy)
Renewed Southeast Crater Strombolian activity; flank tephra fall and small lava flows; increased seismicity and SO2
Fournaise, Piton de la (France)
Nineteen hours of lava fountaining from central crater fissure after 3 months of seismicity
Fuego (Guatemala)
Strong gas plume extends several tens of kilometers from the summit crater
Galeras (Colombia)
Ash emission and increased seismicity; earthquake swarm 3-5 km W of the crater
Kelud (Indonesia)
Explosive eruption produces heavy tephra falls, pyroclastic flows, and lahars; more than 30 people killed
Kilauea (United States)
Lava production stops for three days but resumes with more vigor; seismicity suggests E Rift crustal adjustment
Klyuchevskoy (Russia)
Strong summit explosions cause ashfalls 375 km away; SE flank lava fountains feed lava flow
Langila (Papua New Guinea)
Occasional Vulcanian explosions recorded; weak red glow; vapor emission
Lascar (Chile)
Landsat data show persistent thermal anomaly despite deflation of lava dome
Llaima (Chile)
Continued fumarolic activity from northern and southern cones
Long Valley (United States)
Continued swarm-like activity on S margin of resurgent dome and S moat; brief swarm at Mammoth Mountain
Lonquimay (Chile)
Lava emission slows from base of Navidad Cone; slumping follows partial collapse of lava drainage channel
Manam (Papua New Guinea)
Weak white vapor emission from both craters; rumbling
Pacaya (Guatemala)
Gas bursts and minor Strombolian spattering but no lava flows
Poas (Costa Rica)
Phreatic eruptions from small remaining crater lake; small liquid sulfur pools; low-frequency seismicity
Rabaul (Papua New Guinea)
Seismicity and deformation decline; unrest since October summarized
Redoubt (United States)
Month-old lava dome destroyed by strong explosions; 3rd, small dome removed by new explosions six days later
Ruapehu (New Zealand)
Phreatic eruptions from crater lake preceded by three hours of increased tremor
Ruiz, Nevado del (Colombia)
Four high-frequency seismic swarms N of the crater; weak tremor pulses but no ash emission; SO2 emission low
Santa Maria (Guatemala)
Occasional low-density ash ejections; small lava flow spawns rock avalanches
Ulawun (Papua New Guinea)
Weak vapor emission; 10-hour seismic swarm follows M 4.2 earthquake 25 km away
Arenal (Costa Rica) — January 1990 Cite this Report
Arenal
Costa Rica
10.463°N, 84.703°W; summit elev. 1670 m
All times are local (unless otherwise noted)
Continuous tephra emission; blocks and bombs to 1,200 m from the crater; small nuées ardentes; flank lava flows
Continuous gas and tephra emission was accompanied by sporadic Strombolian eruptions. Blocks and bombs fell as much as 1,200 m from the active crater (C) to 880 m elevation. The activity occasionally produced small nuées ardentes, such as one observed on 9 November at 0230 that traveled some 400 m down the S flank from Crater C. Lava flows moved down the NE, N, and NW flanks. Some of the flows covered and burned vegetation on parts of the NE and N flanks. Fumarolic activity continued from the summit crater (D).
Winds carried ash columns toward the NW, W, and SW flanks, the area most affected by gases. During November, the mean pH of rain in this area was 3.8. Vegetation on the E flank continued to be affected by gases, acid rain, and falling blocks. The combination of vegetation damage, steep slopes, poorly consolidated material, and heavy precipitation has caused strong erosion, producing small cold avalanches in the canyons Calle de Arenas, Guillermina, and Río Agua Caliente.
During observations by geologists 9-10 January, loud explosions (Type 1 in 14:06) were heard, on average, about every 1.5 hours. Ash columns associated with five of the explosions were seen through breaks in the cloud cover. The loudest explosion during the period, on 10 January at 1720, was associated with the largest observed ash column, which rose ~1 km and was videotaped from the N side of Lake Arenal, ~20 km from the volcano. On 9 January at 2240, another Type 1 eruption ejected incandescent blocks and bombs onto the upper 2/3 of the N flank. A lava flow from the summit area descended the N flank, spalling blocks from its surface and levees.
Geologic Background. Conical Volcán Arenal is the youngest stratovolcano in Costa Rica and one of its most active. The 1670-m-high andesitic volcano towers above the eastern shores of Lake Arenal, which has been enlarged by a hydroelectric project. Arenal lies along a volcanic chain that has migrated to the NW from the late-Pleistocene Los Perdidos lava domes through the Pleistocene-to-Holocene Chato volcano, which contains a 500-m-wide, lake-filled summit crater. The earliest known eruptions of Arenal took place about 7000 years ago, and it was active concurrently with Cerro Chato until the activity of Chato ended about 3500 years ago. Growth of Arenal has been characterized by periodic major explosive eruptions at several-hundred-year intervals and periods of lava effusion that armor the cone. An eruptive period that began with a major explosive eruption in 1968 ended in December 2010; continuous explosive activity accompanied by slow lava effusion and the occasional emission of pyroclastic flows characterized the eruption from vents at the summit and on the upper western flank.
Information Contacts: E. Fernández, E. Duarte, V. Barboza, J. Barquero, and J. Bravo, OVSICORI; S. Halsor, Wilkes Univ, USA; C. Chesner, Eastern Illinois Univ, USA.
Bagana (Papua New Guinea) — January 1990 Cite this Report
Bagana
Papua New Guinea
6.137°S, 155.196°E; summit elev. 1855 m
All times are local (unless otherwise noted)
Continued slow summit lava extrusion; new lava pulses every 4-5 days
"Mild but steady eruptive activity continued as a result of slow extrusion of blocky lava in the summit crater. The main visible activity consisted of frequent rockfalls of (night-glowing) rock avalanches from the summit onto all flanks of the volcano. New pulses of lava were seen spilling onto the SE flank and into the [1966-75] lava channel at 4-5-day intervals. Abundant fumaroles are present within the crater which is weakly glowing at night. Two low explosions were reported on the 10th and 27th. Seismicity continued to be dominated by rockfall events (several tens/day), but occasional B-type events were also recorded. Seismic monitoring . . . ceased on the 24th, due to the loss of telemetry as the result of the current civil disturbance . . . ."
Geologic Background. Bagana volcano, in a remote portion of central Bougainville Island, is frequently active. This massive symmetrical cone was largely constructed by an accumulation of viscous andesitic lava flows. The entire edifice could have been constructed in about 300 years at its present rate of lava production. Eruptive activity is characterized by non-explosive effusion of viscous lava that maintains a small lava dome in the summit crater, although occasional explosive activity produces pyroclastic flows. Lava flows with tongue-shaped lobes up to 50 m thick and prominent levees descend the flanks on all sides.
Information Contacts: I. Itikarai and P. de Saint-Ours, RVO.
Dawson Strait Group (Papua New Guinea) — January 1990 Cite this Report
Dawson Strait Group
Papua New Guinea
9.62°S, 150.88°E; summit elev. 500 m
All times are local (unless otherwise noted)
Felt swarm of A- and B-type earthquakes; divers film submarine vents and hear booming and roaring
"A swarm of earthquakes took place in the Esa'Ala area in mid-December 1989. Earthquakes were felt with intensities MM III-V by villagers at Esa'Ala, Dobu Island, and on SE Fergusson Island at Oiau, Deidei, and Numa Numa. The local volcano observatory at Esa'Ala noted felt events on the 10th (26 events), 11th (12), 12th (6), and the 13th (3).
"Reports received at RVO on 11 and 13 December prompted a 5-day on-site inspection and local seismic recording by three RVO officers, 13-18 December. When local recording resumed at Esa'Ala Volcano Observatory (on the 13th), 30 sharp volcano-tectonic earthquakes (A-type with S-P
Table 1. Number of A- and B-type events recorded at the Esa 'Ala Observatory, 13-17 December 1989.
| Date |
A-type |
B-type |
| 13 Dec 1989 |
30 |
57 |
| 14 Dec 1989 |
25 |
55 |
| 15 Dec 1989 |
23 |
27 |
| 16 Dec 1989 |
12 |
16 |
| 17 Dec 1989 |
16 |
9 |
"The deployment of two portable seismographs at Numa Numa and Waiope Island, together with the seismograph at the Esa'Ala Volcano Observatory, allowed location of some of the larger earthquakes. Of the five earthquakes located, three occurred in the Dobu passage, another under Dobu Island, and the 5th between Dobu Island and Neumara Island (figure 1). These locations lie [near the outline] of an inferred submerged caldera.
"The strongest earthquake caused minor landslides from 4-30-m cliffs of pyroclastic deposits along the N and E shores of Dobu Island, and one landslide inland, from a steep gulley on the E flank of Dobu. Ground cracks, 1-4 m inland and 0.5-2 cm wide, reported at Kenaie village on the NE side of Dobu Island were related to the collapse of marine cliffs parallel to their edges.
"Off the N coast of Dobu Island on the afternoon of the 11th, a team of professional divers filmed and photographed very turbulent springs (28°C) and degassing vents through sand holes up to 1 m in diameter, at a depth of 6 m of water. They also reported subcontinuous booming and roaring underwater sounds (at an estimated 30-40 db level).
"The December 1989 earthquake swarm was the first episode of unrest [in this area] since April 1969. At that time (1969), over a period of a few days, 5-7 shocks were felt daily, accompanied by noises. This prompted spontaneous evacuation of villagers on Dobu Island and around Oiau Volcano. Recording at the time was from one station only (ESA). On the basis of the S-P interval (1-1.4 seconds) and reports of earthquake intensities, the swarm was presumed to have originated from the Dobu Passage."
Geologic Background. The Dawson Straits, located between eastern Fergusson and western Normanby Islands in the D'Entrecasteaux island group, contains a volcanic field with several centers that define a possible partly submerged caldera. There have been no historical eruptions, but morphology suggests an extremely young age for some lava flows, and the area displays vigorous thermal activity. The most prominent volcanic centers are Mounts Lamonai and Oiau, located about 10 km apart on the SW tip of Fergusson Island. The summit of Lamonai is capped by a steep-walled crater, and rhyolitic lava flows are exposed on the NE side of the cone. The dominantly volcaniclastic Oiau cone has also produced obsidian lava flows. Dobu Island to the south is formed of coalescing volcanic centers and likewise has produced youthful rhyolitic obsidian flows.
Information Contacts: I. Itikarai and P. de Saint-Ours, RVO.
Etna
Italy
37.748°N, 14.999°E; summit elev. 3357 m
All times are local (unless otherwise noted)
Renewed Southeast Crater Strombolian activity; flank tephra fall and small lava flows; increased seismicity and SO2
Summit activity. (S. Calvari, M. Coltelli, O. Consoli, M. Pompilio and V. Scribano.) Eruptive activity that resumed in December at Southeast Crater continued in January, with explosive episodes of Strombolian activity and lava fountaining 4-5, 12, and 14-15 January. The first episode of Strombolian activity deposited 1 to a few cm of ash on the NW flank. Lava poured from the S crater rim, reaching the 1971 eruptive craters (at least 200 m from the vent). A smaller amount of tephra ejected by similar activity on 12 January was carried a few hundred meters WNW by the wind. Lava spilled over the N crater rim, producing a flow 1.5 km long and 20-30 m wide that traveled NE along the September-October fracture system to ~ 2,700 m altitude. When activity ceased, Southeast Crater was completely obstructed by a solidified crust of lava.
The next day, Strombolian activity gradually increased, reaching maximum intensity on the morning of the 15th. Observations from a helicopter on 16 January revealed a new lava flow 50-100 m wide (apparently erupted 15 January) that had flowed over the E crater rim and traveled about 2.5 km SE down the Valle del Bove, stopping at ~2,000 m altitude (S of Sierra Gianicola Piccola).
Sporadic Strombolian explosions with variable intensities resumed 19 January and continued throughout the month. Bad weather prevented field surveys at the other active summit craters, but observations by helicopter showed degassing at the two central vents (Bocca Nuova and La Voragine) and Northeast Crater.
Seismic activity. (E. Privitera, C. Cardaci, O. Cocina, V. Longo, A. Montalto, D. Patane, A. Pellegrino, and S. Spampinato.) January seismicity increased from previous months. Tremor amplitude fluctuated, with increases on 5, 11-12 and 14-15 January, associated with strong explosive activity and lava emission at Southeast Crater. The number of low-frequency events of M<=1 increased from the single shock recorded in December, often becoming more numerous before and after variations in tremor amplitude. A large increase in the number of low-frequency shocks was recorded 19-20 January, but was not accompanied by variation in the tremor amplitude or an increase in energy release. A sequence of 18 events on the NNW side of the volcano at 10-15 km depth had a large energy release. At least nine events reached or exceeded M 2, with 2 main shocks (at 1200 and 1336 on the 28th) reaching M 2.7.
Ground deformation. (A. Bonaccorso, O. Campisi, G. Falzone, B. Puglisi, and R. Velardita.) January tilt recorded at the SPC and CDV borehole tilt stations on the volcano's S flank showed no significant variation from the previous month. EDM surveys across the fracture on the S side (along SP92) and on the N part of the Etna Sud trilateration network showed variations within instrumental error limits.
Summit crater SO2 flux. (T. Caltabiano and R. Romano.) Samples collected from the summit craters on 8, 12, 16-18, 24, and 31 January showed increased SO2 emission preceding eruptive activity. Emissions rose from ~4,000 t/d on 29 December to ~ 26,000 t/d measured 16 January following Southeast Crater explosive and effusive activity on the 14-15th. Emissions returned to moderate values on 17 January (~5,000 t/d) and remained near that level during measurments on 18, 24, and 31 January.
Geologic Background. Mount Etna, towering above Catania on the island of Sicily, has one of the world's longest documented records of volcanism, dating back to 1500 BCE. Historical lava flows of basaltic composition cover much of the surface of this massive volcano, whose edifice is the highest and most voluminous in Italy. The Mongibello stratovolcano, truncated by several small calderas, was constructed during the late Pleistocene and Holocene over an older shield volcano. The most prominent morphological feature of Etna is the Valle del Bove, a 5 x 10 km caldera open to the east. Two styles of eruptive activity typically occur, sometimes simultaneously. Persistent explosive eruptions, sometimes with minor lava emissions, take place from one or more summit craters. Flank vents, typically with higher effusion rates, are less frequently active and originate from fissures that open progressively downward from near the summit (usually accompanied by Strombolian eruptions at the upper end). Cinder cones are commonly constructed over the vents of lower-flank lava flows. Lava flows extend to the foot of the volcano on all sides and have reached the sea over a broad area on the SE flank.
Information Contacts: R. Santacroce, IIV.
Piton de la Fournaise (France) — January 1990 Cite this Report
Piton de la Fournaise
France
21.244°S, 55.708°E; summit elev. 2632 m
All times are local (unless otherwise noted)
Nineteen hours of lava fountaining from central crater fissure after 3 months of seismicity
[This preliminary report is supplemented by detailed information in 15:2]. An eruption began on 18 January at 1124 from the SE area of the central (Dolomieu) crater and from its upper SE flank. The eruption was preceded by three months of significant seismicity. Vigorous 50-100-m fountaining from roughly NW-SE-trending fractures was observed until about 1500. Activity had completely stopped by 0630 on 19 January.
Geologic Background. Piton de la Fournaise is a massive basaltic shield volcano on the French island of Réunion in the western Indian Ocean. Much of its more than 530,000-year history overlapped with eruptions of the deeply dissected Piton des Neiges shield volcano to the NW. Three scarps formed at about 250,000, 65,000, and less than 5,000 years ago by progressive eastward slumping, leaving caldera-sized embayments open to the E and SE. Numerous pyroclastic cones are present on the floor of the scarps and their outer flanks. Most recorded eruptions have originated from the summit and flanks of Dolomieu, a 400-m-high lava shield that has grown within the youngest scarp, which is about 9 km wide and about 13 km from the western wall to the ocean on the E side. More than 150 eruptions, most of which have produced fluid basaltic lava flows, have occurred since the 17th century. Only six eruptions, in 1708, 1774, 1776, 1800, 1977, and 1986, have originated from fissures outside the scarps.
Information Contacts: J. Toutain, P. Taochi, J-L. Cheminée, IPGP; P. Bachelery, Univ de la Réunion.
Fuego (Guatemala) — January 1990 Cite this Report
Fuego
Guatemala
14.4748°N, 90.8806°W; summit elev. 3799 m
All times are local (unless otherwise noted)
Strong gas plume extends several tens of kilometers from the summit crater
Geologists observed a vigorous and persistent gas plume that extended several tens of kilometers W from Fuego's summit crater during work at neighboring Acatenango on 6 January between 0900 and 1400. Frequent rock avalanches occurred in the upper parts of Barranca Honda, a steep E flank canyon.
Geologic Background. Volcán Fuego, one of Central America's most active volcanoes, is also one of three large stratovolcanoes overlooking Guatemala's former capital, Antigua. The scarp of an older edifice, Meseta, lies between Fuego and Acatenango to the north. Construction of Meseta dates back to about 230,000 years and continued until the late Pleistocene or early Holocene. Collapse of Meseta may have produced the massive Escuintla debris-avalanche deposit, which extends about 50 km onto the Pacific coastal plain. Growth of the modern Fuego volcano followed, continuing the southward migration of volcanism that began at the mostly andesitic Acatenango. Eruptions at Fuego have become more mafic with time, and most historical activity has produced basaltic rocks. Frequent vigorous eruptions have been recorded since the onset of the Spanish era in 1524, and have produced major ashfalls, along with occasional pyroclastic flows and lava flows.
Information Contacts: S. Halsor, Wilkes Univ; C. Chesner, Eastern Illinois Univ.
Galeras (Colombia) — January 1990 Cite this Report
Galeras
Colombia
1.22°N, 77.37°W; summit elev. 4276 m
All times are local (unless otherwise noted)
Ash emission and increased seismicity; earthquake swarm 3-5 km W of the crater
The number of high- and low-frequency earthquakes increased in January (see figure 18). Pulses of spasmodic tremor accompanied ash emission on the 7th. A swarm of high-frequency events occurred W of the crater at depths of 3-5 km on the 10th (figure 14). The electronic tiltmeter showed an increase of 3 µrad on 26 January, coinciding with an M 2 earthquake beneath the tiltmeter station. Gas emission was not measured in January.
Geologic Background. Galeras, a stratovolcano with a large breached caldera located immediately west of the city of Pasto, is one of Colombia's most frequently active volcanoes. The dominantly andesitic complex has been active for more than 1 million years, and two major caldera collapse eruptions took place during the late Pleistocene. Long-term extensive hydrothermal alteration has contributed to large-scale edifice collapse on at least three occasions, producing debris avalanches that swept to the west and left a large open caldera inside which the modern cone has been constructed. Major explosive eruptions since the mid-Holocene have produced widespread tephra deposits and pyroclastic flows that swept all but the southern flanks. A central cone slightly lower than the caldera rim has been the site of numerous small-to-moderate eruptions since the time of the Spanish conquistadors.
Information Contacts: INGEOMINAS, Pasto; INGEOMINAS, Manizales.
Kelud (Indonesia) — January 1990 Cite this Report
Kelud
Indonesia
7.935°S, 112.314°E; summit elev. 1730 m
All times are local (unless otherwise noted)
Explosive eruption produces heavy tephra falls, pyroclastic flows, and lahars; more than 30 people killed
A strong explosive eruption on 10 February produced a large cloud and heavy tephra falls. Although evacuation began before the onset of the eruption, more than 30 people were reported killed in the densely populated area near the volcano.
Local seismicity increased to ~10x the normal rate between the middle and end of November, then returned to background levels. A second episode of increased seismicity occurred during the second and third weeks of January, accompanied by a rise in crater lake temperature from 32 to 38°C. Enhanced earthquake activity was again detected 7 February, and lake temperature peaked at 39-41°C. Measurements on 8 February indicated that lake pH had decreased to 4.2 from its usual 4.9, and hydrophones in the lake recorded noise at 3x normal levels. However, seismicity and hydrophone noise declined that day and remained relatively quiet until the onset of the eruption. During the night of 9-10 February, transmission from the lake instruments (via the ARGOS satellite) ceased. VSI issued an evacuation warning on 10 February at 1000. Press sources estimated the number of evacuees at 60,000.
The eruption began 10 February at 1141, with the strongest explosive phase at 1250, and activity continued until 1700. Pyroclastic flows traveled [5-6] km down the steep-walled valley on the E flank (from the breach in the summit crater), filling it to a depth of ~10 m. The crater lake was emptied during the eruption. However, most of the damage and casualties were attributed to heavy tephra falls that reached 20-30 cm thickness. In Nglegok (~55 km SW of the volcano) residents reported falls of fist-sized tephra, with some material that was head-sized. About 15 cm of ash accumulated at Blitar, ~25 km SW of the summit. Ashfalls were also reported from Malang, ~35 km E of Kelut. The weight of the tephra caused houses to collapse, trapping their occupants. As of 20 February, the official death toll had risen to 32, with >500 homes and 50 schools destroyed and many others damaged.
Tracking of the plume by satellite was made difficult by heavy weather cloud activity in the area. Imagery from Japan's GMS satellite at 1300 showed a bright cloud 53 km across centered over the volcano. At 1347, a NOAA polar orbiter image revealed that the plume, still roughly circular and centered over the volcano, had grown to ~160 km in diameter. Preliminary temperature analysis suggested that the top of the dense cloud was at ~12 km altitude, although diffuse material could have extended higher. By 1600, GMS data indicated that the plume had drifted slightly WSW and was ~310 km long. Very diffuse-appearing material could be seen extending to the NW coast of Australia, ~1,400 km from Kelut, on a NOAA polar orbiter image the next day at 1347. Dispersed remnants of the plume could be traced on GMS images until 1900.
Small explosions with associated glow and/or lightning were continuing during the night of 11-12 February, accompanied by strong seismic activity. A second strong explosive episode occurred between 1512 and 1827 on 12 February. Incandescent tephra rose 7 km above the crater. Rains triggered a major lahar on 15 February that moved downslope at 40-60 km/hour, inundating parts of subdistricts ~16 km NNW (Kepung) and 17 and 28 km NW (Ploso Klaten and Guran) of the summit, forcing residents to flee to high ground. Further heavy rains during the night of 16-17 February forced 50,000 Kepung subdistrict residents to flee. Minor eruptive activity for ~2 hours that night sent thick ash clouds to ~600 m above the vent. Additional lahars the next day moved downslope at ~45 km/hour, destroying hundreds of hectares of agricultural land.
Further Reference. Sudradjat, Adjat, 1991, A preliminary account of the 1990 eruption of the Kelut volcano: Geol. Jahrbuch, v. A127, p. 447-462.
Geologic Background. The relatively inconspicuous Kelud stratovolcano contains a summit crater lake that has been the source of some of Indonesia's most deadly eruptions. A cluster of summit lava domes cut by numerous craters has given the summit a very irregular profile. Satellitic cones and lava domes are also located low on the E, W, and SSW flanks. Eruptive activity has in general migrated in a clockwise direction around the summit vent complex. More than 30 eruptions have been recorded since 1000 CE. The ejection of water from the crater lake during the typically short but violent eruptions has created pyroclastic flows and lahars that have caused widespread fatalities and destruction. After more than 5,000 people were killed during an eruption in 1919, an engineering project to drain the crater lake lowered the surface by more than 50 m. The 1951 eruption deepened the crater by 70 m, leaving 50 million cubic meters of water after the damaged drainage tunnels were repaired. Following more than 200 deaths in the 1966 eruption, a new deeper tunnel was constructed, and the lake's volume before the 1990 eruption was only about 1 million cubic meters.
Information Contacts: VSI; Y. Sawada, JMA; O. Karst, SAB; U.S. Embassy, Jakarta; T. Casadevall, USGS; Jakarta Post; UPI.
Kilauea (United States) — January 1990 Cite this Report
Kilauea
United States
19.421°N, 155.287°W; summit elev. 1222 m
All times are local (unless otherwise noted)
Lava production stops for three days but resumes with more vigor; seismicity suggests E Rift crustal adjustment
The eruption . . . continued in January. Tube-fed lava flowed into the sea at one active entry and surface breakouts occurred upslope. The pond level remained ~32 m below Kupaianaha's N rim throughout the month. Glowing vents in the talus pile on the crater floor of Pu`u `O`o . . . were reported on the 7th, the only day during the month when weather conditions allowed observations.
On 12 January, a 50-100-m inflated area formed over the lava tube at the 575 m (1,900 ft) elevation. The bulge ruptured the next morning and produced aa lava that flowed SE across Kupaianaha's lava field (figure 66). By the 14th, the flow had formed a tube and had a pahoehoe front. It entered the forest on 17 January, moving between the 1977 aa flow and the December 1986 Kupaianaha flow (which destroyed 17 homes in and near Kalapana Gardens). The new flow, ~100-150 m wide, was advancing slowly near the 230 m (750 ft) elevation by the end of the month.
Minor surface breakouts at 480-360 m (1,600-1,200 ft) elevation fed small hummocky pahoehoe flows along the W margin of the flow field. A long-lived surface breakout from the main tube at the 180 m (600 ft) elevation (active since late October) sent flows W into Royal Gardens, destroying a house (just below Orchid St.). Surface flows on the coastal plain were limited to the area immediately inland of the Poupou entry . . . , where moderate littoral explosions hurled spatter 10-15 m into the air and built a 2-3-m littoral cone.
Eruption tremor continued at low levels . . . near Pu`u `O`o and Kupaianaha. Tremor of relatively steady amplitude was punctuated by intermittent high-frequency bursts of seismic energy related to crustal adjustments near both the Kalalua (KLC, ~1 km from Kupaianaha) and Steam Cracks (STC, a few kilometers from Pu'u 0'o) seismometers. The most significant of these were two strong 15-minute avalanches registered on the STC instrument at 0240 on 18 January and at 1305 on 21 January. Shallow microearthquake activity in the East rift zone and at the summit was average throughout the month. The daily number of intermediate-depth (5-15 km) long-period events was erratic, with > 100/day occurring 12-14 and 16-18 January. A gradual increase from levels of tens/day to approaching 100/day began 27 January.
Addendum: The first hiatus . . . since April 1988 occurred 7-9 February [but see 15:2]. Kupaianaha's magma supply decreased on the 6th and the flow that had formed 13 January stagnated. By the next day, tremor had generally declined, all flows had stopped, and only small pahoehoe lobes were active around margins of crusted lava in Kupaianaha. Activity resumed late on the 9th, with strong night glow from Pu`u `O`o and a slight increase in tremor. By the next day, lava had returned to Pu`u `O`o and Kupaianaha, and had reoccupied the tube system, with several surface breakouts forming vigorous pahoehoe flows.
Geologic Background. Kilauea overlaps the E flank of the massive Mauna Loa shield volcano in the island of Hawaii. Eruptions are prominent in Polynesian legends; written documentation since 1820 records frequent summit and flank lava flow eruptions interspersed with periods of long-term lava lake activity at Halemaumau crater in the summit caldera until 1924. The 3 x 5 km caldera was formed in several stages about 1,500 years ago and during the 18th century; eruptions have also originated from the lengthy East and Southwest rift zones, which extend to the ocean in both directions. About 90% of the surface of the basaltic shield volcano is formed of lava flows less than about 1,100 years old; 70% of the surface is younger than 600 years. The long-term eruption from the East rift zone between 1983 and 2018 produced lava flows covering more than 100 km2, destroyed hundreds of houses, and added new coastline.
Information Contacts: C. Heliker and P. Okubo, HVO.
Klyuchevskoy (Russia) — January 1990 Cite this Report
Klyuchevskoy
Russia
56.056°N, 160.642°E; summit elev. 4754 m
All times are local (unless otherwise noted)
Strong summit explosions cause ashfalls 375 km away; SE flank lava fountains feed lava flow
Explosive activity from summit and flank vents emitted ash and lava October-December 1989 and January 1990. Up to 5 ejections/minute from three vents in the summit crater sent ash to 2 km above the summit in December, with a visible plume stretching 20 km from the volcano. Lava fountaining, 30-50 m high from SE flank vents at 4100-4200 m altitude, fed two lava flows that moved SE and E to 2,500 m altitude. Violent explosive activity from the summit crater resumed 29 January, ejecting a 6-km ash plume that extended 60 km from the volcano [see also 15:3]. An incandescent cloud 600-1,500 m high pulsated at the base of the plume, which generated lightning at its top. Ashfall on the Bering Islands (~375 km SE of the volcano) was reported 1 February. Activity also occurred from a SE-flank crater.
Geologic Background. Klyuchevskoy is the highest and most active volcano on the Kamchatka Peninsula. Since its origin about 6,000 years ago, this symmetrical, basaltic stratovolcano has produced frequent moderate-volume explosive and effusive eruptions without major periods of inactivity. It rises above a saddle NE of Kamen volcano and lies SE of the broad Ushkovsky massif. More than 100 flank eruptions have occurred during approximately the past 3,000 years, with most lateral craters and cones occurring along radial fissures between the unconfined NE-to-SE flanks of the conical volcano between 500 and 3,600 m elevation. Eruptions recorded since the late 17th century have resulted in frequent changes to the morphology of the 700-m-wide summit crater. These eruptions over the past 400 years have originated primarily from the summit crater, but have also included numerous major explosive and effusive eruptions from flank craters.
Information Contacts: B. Ivanov and E. Zhdanova, IV.
Langila (Papua New Guinea) — January 1990 Cite this Report
Langila
Papua New Guinea
5.525°S, 148.42°E; summit elev. 1330 m
All times are local (unless otherwise noted)
Occasional Vulcanian explosions recorded; weak red glow; vapor emission
"Activity remained at a moderate level throughout January. Weak red glow was observed over Crater 2 on every clear night of the month. Vapour was released in weak to moderate amounts. The seismicity consisted of numerous daily B-type events of small amplitude and an occasional Vulcanian explosion shock. Crater 3 was inactive except for weak fumarolic emissions."
Geologic Background. Langila, one of the most active volcanoes of New Britain, consists of a group of four small overlapping composite basaltic-andesitic cones on the lower E flank of the extinct Talawe volcano in the Cape Gloucester area of NW New Britain. A rectangular, 2.5-km-long crater is breached widely to the SE; Langila was constructed NE of the breached crater of Talawe. An extensive lava field reaches the coast on the N and NE sides of Langila. Frequent mild-to-moderate explosive eruptions, sometimes accompanied by lava flows, have been recorded since the 19th century from three active craters at the summit. The youngest and smallest crater (no. 3 crater) was formed in 1960 and has a diameter of 150 m.
Information Contacts: I. Itikarai and P. de Saint-Ours, RVO.
Lascar
Chile
23.37°S, 67.73°W; summit elev. 5592 m
All times are local (unless otherwise noted)
Landsat data show persistent thermal anomaly despite deflation of lava dome
Landsat TM data recorded on 28 November and 14 December show the continued presence of a short-wavelength infrared thermal anomaly in the center of the active crater, despite the deflation of the lava dome that had occurred by 19 October. A roughly circular area four 30 x 30 m pixels in diameter was radiant in TM bands 5 (1.55-1.75 mm in wavelength) and 7 (2.08-2.35 mm) on both images. Several pixels were saturated in both bands, but there was no thermal radiance for the next shorter wavelength (band 4, 0.76-0.09 mm). Temperatures and radiant flux have not yet been calculated, but the general appearance of the data is similar to that of November 1987. There had been no Landsat TM observations of Lascar since then, but it seemed likely that the radiant anomaly has persisted for 5 years, since the first TM image of the volcano was recorded in December 1984.
Geologic Background. Láscar is the most active volcano of the northern Chilean Andes. The andesitic-to-dacitic stratovolcano contains six overlapping summit craters. Prominent lava flows descend its NW flanks. An older, higher stratovolcano 5 km E, Volcán Aguas Calientes, displays a well-developed summit crater and a probable Holocene lava flow near its summit (de Silva and Francis, 1991). Láscar consists of two major edifices; activity began at the eastern volcano and then shifted to the western cone. The largest eruption took place about 26,500 years ago, and following the eruption of the Tumbres scoria flow about 9000 years ago, activity shifted back to the eastern edifice, where three overlapping craters were formed. Frequent small-to-moderate explosive eruptions have been recorded since the mid-19th century, along with periodic larger eruptions that produced ashfall hundreds of kilometers away. The largest historical eruption took place in 1993, producing pyroclastic flows to 8.5 km NW of the summit and ashfall in Buenos Aires.
Information Contacts: D. Rothery, Open Univ.
Llaima
Chile
38.692°S, 71.729°W; summit elev. 3125 m
All times are local (unless otherwise noted)
Continued fumarolic activity from northern and southern cones
Ground and aerial observations on 20 January showed water vapor and other gases emerging from the main northern summit crater, while fumaroles on the summit of the southern cone emitted only water vapor. Water vapor fumaroles were also present on the southern summit's upper SE flank, where an older crater had collapsed and was breached to the SE during the February 1957 eruption. Fumaroles on the southern summit have been increasing in number and intensity since 1984.
Geologic Background. Llaima, one of Chile's largest and most active volcanoes, contains two main historically active craters, one at the summit and the other, Pichillaima, to the SE. The massive, dominantly basaltic-to-andesitic, stratovolcano has a volume of 400 km3. A Holocene edifice built primarily of accumulated lava flows was constructed over an 8-km-wide caldera that formed about 13,200 years ago, following the eruption of the 24 km3 Curacautín Ignimbrite. More than 40 scoria cones dot the volcano's flanks. Following the end of an explosive stage about 7200 years ago, construction of the present edifice began, characterized by Strombolian, Hawaiian, and infrequent subplinian eruptions. Frequent moderate explosive eruptions with occasional lava flows have been recorded since the 17th century.
Information Contacts: H. Moreno, Univ de Chile; J. Naranjo, SERNAGEOMIN, Santiago.
Long Valley (United States) — January 1990 Cite this Report
Long Valley
United States
37.7°N, 118.87°W; summit elev. 3390 m
All times are local (unless otherwise noted)
Continued swarm-like activity on S margin of resurgent dome and S moat; brief swarm at Mammoth Mountain
"Swarm-like activity of magnitude greater than or equal to 2 earthquakes along the S margin of the resurgent dome and S moat continued to increase through January and early February (figure 11). During the same period, Mammoth Mountain, on the SW rim of the caldera, remained relatively quiet except for a brief burst of activity beneath the mountain's N flank on 19 January that included a locally felt earthquake of about M 3." A preliminary report on the Mammoth Mountain swarm will appear in the April issue of the Bulletin of the Seismological Society of America (see Reference, below).
"Activity within the caldera continues to occur in much the same area as the recurring swarms of the early 1980's, although the current activity shows a tendency to be concentrated somewhat farther N beneath the resurgent dome and along its W and E margins. Focal depths range from roughly 8 to <3 km as during the earlier activity. This increased swarm activity within the caldera no doubt reflects the 5-fold increase in extensional strain rate across the resurgent dome, detected by repeated measurements of the 2-color geodimeter network that spans the central section of the caldera. The strain rate increase began in September and has continued through January at a rate of ~5 microstrain/year."
Reference. Hill, D.P., Ellsworth, W.L., Johnston, M.J.S., Langbein, J.O., Oppenheimer, D.H., Pitt, A.M., Reasenberg, P.A., Sorey, M.L., and McNutt, S.R., 1990, The 1989 Earthquake Swarm Beneath Mammoth Mountain, California: An Initial Look at the 4 May through 30 Sep Activity: Bulletin of the Seismological Society of America, v. 80, p. 325-339.
Geologic Background. The large 17 x 32 km Long Valley caldera east of the central Sierra Nevada Range formed as a result of the voluminous Bishop Tuff eruption about 760,000 years ago. Resurgent doming in the central part of the caldera occurred shortly afterwards, followed by rhyolitic eruptions from the caldera moat and the eruption of rhyodacite from outer ring fracture vents, ending about 50,000 years ago. During early resurgent doming the caldera was filled with a large lake that left strandlines on the caldera walls and the resurgent dome island; the lake eventually drained through the Owens River Gorge. The caldera remains thermally active, with many hot springs and fumaroles, and has had significant deformation, seismicity, and other unrest in recent years. The late-Pleistocene to Holocene Inyo Craters cut the NW topographic rim of the caldera, and along with Mammoth Mountain on the SW topographic rim, are west of the structural caldera and are chemically and tectonically distinct from the Long Valley magmatic system.
Information Contacts: D. Hill, USGS Menlo Park.
Lonquimay (Chile) — January 1990 Cite this Report
Lonquimay
Chile
38.379°S, 71.586°W; summit elev. 2832 m
All times are local (unless otherwise noted)
Lava emission slows from base of Navidad Cone; slumping follows partial collapse of lava drainage channel
During observations on 10 January from 1200 to 1530, lava emission continued from the vent at the NE foot of Navidad Cone. The black aa lava had a surface velocity of 70 m/hour as it moved through a pre-existing channel, which widened progressively from 7 to 12 m over a distance of 50 m from the source. The vent was triangle-shaped, 7 m wide and 4-5 m high, elongating within to a glowing tunnel that had not been exposed during 20 November fieldwork. Activity in the main crater was limited to fumarolic emission that varied gradually from white-yellowish to blue. A vapor cloud was distinctly visible 300-500 m above the cone.
Geologists climbed to the cone's summit on 20 January between 1145 and 1630. Blue fumarolic emissions were continuous from the central crater, nested within the eastern part of the formerly horseshoe-shaped main crater. Annular fractures surrounding the central crater had been emitting vapor on 20 November, but vapor emission had ceased by 20 January after a period of relatively dry weather. Collapse had occurred along some of the fractures, widening the funnel-shaped crater to 60-70 m. A hole 3-4 m in diameter, formerly the main steam jet vent, was clearly visible in the N inner wall, without gas emission.
Between 10 and 20 January, the rate of lava production had clearly decreased, and the 14-m-high wall of the drainage channel had partially collapsed. This process triggered discontinuous slumping of flank material directly above the vent, producing dense dust clouds. The slumped debris was transported on the lava surface, aligned in arched transverse ridges representing different slumping episodes. By the end of field observations at 1630 on 20 January, these materials had been carried as much as 500 m from the vent. An overflight the same day at about 1730 showed that advance had ceased along the entire flow front, including the lobe in the Lolco River valley, which remained 10.7 km from the vent as on 20 November.
Major and trace element analyses of lava and bombs sampled in July and November show no significant variation, being very similar to samples from early in the eruption (Moreno and Gardeweg, 1989).
Geologic Background. Lonquimay is a small, flat-topped, symmetrical stratovolcano of late-Pleistocene to dominantly Holocene age immediately SE of Tolguaca volcano. A glacier fills its summit crater and flows down the S flank. It is dominantly andesitic, but basalt and dacite are also found. The prominent NE-SW Cordón Fissural Oriental fissure zone cuts across the entire volcano. A series of NE-flank vents and scoria cones were built along an E-W fissure, some of which have been the source of voluminous lava flows, including those during 1887-90 and 1988-90, that extended out to 10 km.
Information Contacts: J. Naranjo, SERNAGEOMIN, Santiago; H. Moreno, Univ de Chile.
Manam (Papua New Guinea) — January 1990 Cite this Report
Manam
Papua New Guinea
4.08°S, 145.037°E; summit elev. 1807 m
All times are local (unless otherwise noted)
Weak white vapor emission from both craters; rumbling
"Activity remained at a low level in January, as it has for the last 6 months. Emissions from both Southern and Main Craters consisted mainly of weak white vapour. Rumbling noises were occasionally heard on the 2nd. There was no significant tilt change."
Geologic Background. The 10-km-wide island of Manam, lying 13 km off the northern coast of mainland Papua New Guinea, is one of the country's most active volcanoes. Four large radial valleys extend from the unvegetated summit of the conical basaltic-andesitic stratovolcano to its lower flanks. These valleys channel lava flows and pyroclastic avalanches that have sometimes reached the coast. Five small satellitic centers are located near the island's shoreline on the northern, southern, and western sides. Two summit craters are present; both are active, although most observed eruptions have originated from the southern crater, concentrating eruptive products during much of the past century into the SE valley. Frequent eruptions, typically of mild-to-moderate scale, have been recorded since 1616. Occasional larger eruptions have produced pyroclastic flows and lava flows that reached flat-lying coastal areas and entered the sea, sometimes impacting populated areas.
Information Contacts: I. Itikarai and P. de Saint-Ours, RVO.
Pacaya (Guatemala) — January 1990 Cite this Report
Pacaya
Guatemala
14.382°N, 90.601°W; summit elev. 2569 m
All times are local (unless otherwise noted)
Gas bursts and minor Strombolian spattering but no lava flows
Gas bursts from MacKenney Crater's inner crater vent were observed during fieldwork between 1500 and 1730 on 4 January. The gas bursts, of varying intensity and duration, occurred about every 15 minutes. Some were accompanied by Strombolian spattering; the most energetic lasted several seconds and ejected spatter to 40 m height. A mound of agglutinated spatter was centered around the 1-m-wide vent. The inner crater was about 60 m in diameter and 30 m deep, with its S wall against the inner wall of MacKenney Crater. Rockfalls were frequent on the steep inner crater walls. Near the inner crater rim, the floor of MacKenney Crater was muddy and strewn with small blocks of spatter. Residents of the area said that this part of the crater floor had recently been occupied by a small lake. Active fumaroles were abundant along the upper E wall of MacKenney Crater. No active lava flows were evident.
Geologic Background. Eruptions from Pacaya are frequently visible from Guatemala City, the nation's capital. This complex basaltic volcano was constructed just outside the southern topographic rim of the 14 x 16 km Pleistocene Amatitlán caldera. A cluster of dacitic lava domes occupies the southern caldera floor. The post-caldera Pacaya massif includes the older Pacaya Viejo and Cerro Grande stratovolcanoes and the currently active Mackenney stratovolcano. Collapse of Pacaya Viejo between 600 and 1,500 years ago produced a debris-avalanche deposit that extends 25 km onto the Pacific coastal plain and left an arcuate scarp inside which the modern Pacaya volcano (Mackenney cone) grew. The NW-flank Cerro Chino crater was last active in the 19th century. During the past several decades, activity has consisted of frequent Strombolian eruptions with intermittent lava flow extrusion that has partially filled in the caldera moat and covered the flanks of Mackenney cone, punctuated by occasional larger explosive eruptions that partially destroy the summit.
Information Contacts: S. Halsor, Wilkes Univ; C. Chesner, Eastern Illinois Univ.
Poas (Costa Rica) — January 1990 Cite this Report
Poas
Costa Rica
10.2°N, 84.233°W; summit elev. 2697 m
All times are local (unless otherwise noted)
Phreatic eruptions from small remaining crater lake; small liquid sulfur pools; low-frequency seismicity
The level of the crater lake descended 1.5 m between November 1989 and January 1990. Its mean temperature was about 80°C and mean pH was 0.5. Degassing was continuous, and winds carried gases toward the W and SW flanks. Ejecta from phreatic eruptions reached 50 m height before falling back into the lake. Seismicity remained at low frequency (<3 Hz), with 9,434 recorded events in November (314/day), 10,164 in December (328/day), and 5,115 through 21 January (243/day) (figure 25). Geologists attributed the shallow, low-frequency seismicity to the volcano's continued degassing. Fumarolic activity continued on the remnants of the 1953-55 dome.
Geologists visited the volcano on 12 January. The roughly circular crater lake was about 75 m in diameter and appeared to be only a few meters deep. Its water was grayish-green, had a high concentration of mud, and contained small pools and ribbons of yellow or green liquid sulfur. Water temperature was 77°C. Vigorous boiling occurred at three sites associated with occasional geyser activity; one geyser event ejected lake water to 45 m height. Dense gas plumes and thin concentric bands of liquid sulfur were also associated with the boiling zones.
Geologic Background. The broad vegetated edifice of Poás, one of the most active volcanoes of Costa Rica, contains three craters along a N-S line. The frequently visited multi-hued summit crater lakes of the basaltic-to-dacitic volcano are easily accessible by vehicle from the nearby capital city of San José. A N-S-trending fissure cutting the complex stratovolcano extends to the lower N flank, where it has produced the Congo stratovolcano and several lake-filled maars. The southernmost of the two summit crater lakes, Botos, last erupted about 7,500 years ago. The more prominent geothermally heated northern lake, Laguna Caliente, is one of the world's most acidic natural lakes, with a pH of near zero. It has been the site of frequent phreatic and phreatomagmatic eruptions since an eruption was reported in 1828. Eruptions often include geyser-like ejections of crater-lake water.
Information Contacts: E. Fernández, E. Duarte, V. Barboza, J. Barquero, and J. Bravo, OVSICORI; S. Halsor, Wilkes Univ; C. Chesner, Eastern Illinois Univ.
Rabaul (Papua New Guinea) — January 1990 Cite this Report
Rabaul
Papua New Guinea
4.2459°S, 152.1937°E; summit elev. 688 m
All times are local (unless otherwise noted)
Seismicity and deformation decline; unrest since October summarized
"January marked the end of a period of minor, short-term unrest that started in October 1989 and was comparable to August-November 1988 activity. Seismicity in January (401 recorded events) had declined markedly since December (table 2). The background level ranged from 1 to 15 events/day, compared to 5-40/day in December. Three small earthquake swarms occurred January 1-2 (69 events), 13 (39), and 23 (79) from the N (Greet Harbour) and E (Blanche Bay) sides of the caldera (table 2 and figure 11). The increased rate of ground deformation recorded in December apparently stabilized in January, although a complete survey is required to assess the amount of caldera-wide elevation and tilt change (table 2)."
Table 2a. Summary of monthly seismicity during the October 1989-January 1990 period of unrest at Rabaul. Courtesy of RVO.
| Date |
Events/Month |
Swarms |
Magnitude (ML) |
| Jan-Sep 1989 |
100-200 |
0 |
less than 1.5 |
| Oct 1989 |
346 |
2 |
less than 2.0 |
| Nov 1989 |
546 |
4 |
2.3 and 3.0 |
| Dec 1989 |
886 |
4 |
2.1 and 2.3 |
| Jan 1990 |
401 |
3 |
3.1 |
Table 2b. Summary of local earthquake swarms during the October 1989-January 1990 period of unrest at Rabaul. Courtesy of RVO.
| Date |
Number of Events (felt) |
Location |
Magnitude (ML) |
| 20-21 Oct 1989 |
67 |
Greet Harbour |
less than or = 2.0 |
| 24 Oct 1989 |
83 |
Greet Harbour |
less than or = 2.0 |
| 12 Nov 1989 |
36 |
Greet Harbour |
less than or = 2.0 |
| 17-18 Nov 1989 |
138 (5) |
Sulphur Creek - Beehive |
2.3 |
| 20 Nov 1989 |
39 (3) |
Karavia Bay and Blanche Bay |
3.0 |
| 24 Nov 1989 |
84 |
Greet Harbour |
less than or = 2.0 |
| 12 Dec 1989 |
52 |
Vulcan |
less than or = 2.0 |
| 13 Dec 1989 |
121 |
Greet Harbour and Blanche Bay |
less than or = 2.0 |
| 18 Dec 1989 |
45 (1) |
Vulcan |
2.1 |
| 24 Dec 1989 |
76 (1) |
Greet Harbour |
2.3 |
| 01-02 Jan 1990 |
69 (2) |
Greet Harbour |
3.1 |
| 13 Jan 1990 |
39 |
Greet Harbour |
less than or = 2.0 |
| 23 Jan 1990 |
79 (1) |
Greet Harbour and Blanche Bay |
less than or = 2.5 |
Table 2c. Summary of ground deformation at at Matupit Island during the October 1989-January 1990 period of unrest at Rabaul. Courtesy of RVO.
| Date |
Location |
Description |
| Jan-Jul 1989 |
Matupit Island |
less than or = 10 mm subsidence |
| Jul-Sep 1989 |
Matupit Island |
no change |
| Sep-Dec 1989 |
Matupit Island |
less than or = 10 mm uplift |
| Dec-Jan 1990 |
Matupit Island |
greater than or = 20 mm uplift |
Table 2d. Summary of tilt changes during the October 1989-January 1990 period of unrest at Rabaul. Courtesy of RVO.
| Date |
Location |
Description |
| Jan-Sep 1989 |
Greet Harbour |
no significant changes |
| Jan-Sep 1989 |
Vulcan |
less than or = 20 µrads deflation |
| Oct-Nov 1989 |
Matupit Island & Vulcan |
less than or = 10 µrads inflation |
| Dec 1989 |
Sulphur Point and Baluan |
10-20 µrads inflation |
| Jan 1990 |
Greet Harbour |
greater than or = 10 µrads inflation |
Geologic Background. The low-lying Rabaul caldera on the tip of the Gazelle Peninsula at the NE end of New Britain forms a broad sheltered harbor utilized by what was the island's largest city prior to a major eruption in 1994. The outer flanks of the asymmetrical shield volcano are formed by thick pyroclastic-flow deposits. The 8 x 14 km caldera is widely breached on the east, where its floor is flooded by Blanche Bay and was formed about 1,400 years ago. An earlier caldera-forming eruption about 7,100 years ago is thought to have originated from Tavui caldera, offshore to the north. Three small stratovolcanoes lie outside the N and NE caldera rims. Post-caldera eruptions built basaltic-to-dacitic pyroclastic cones on the caldera floor near the NE and W caldera walls. Several of these, including Vulcan cone, which was formed during a large eruption in 1878, have produced major explosive activity during historical time. A powerful explosive eruption in 1994 occurred simultaneously from Vulcan and Tavurvur volcanoes and forced the temporary abandonment of Rabaul city.
Information Contacts: I. Itikarai and P. de Saint-Ours, RVO.
Redoubt (United States) — January 1990 Cite this Report
Redoubt
United States
60.485°N, 152.742°W; summit elev. 3108 m
All times are local (unless otherwise noted)
Month-old lava dome destroyed by strong explosions; 3rd, small dome removed by new explosions six days later
AVO's detailed summary of the eruption through late January appears in the 13 February issue of EOS, accompanied by a second paper on satellite observation of the December plumes (see References, below).
Airfall tephra. Initial tephra studies suggest that airfall deposits have been relatively modest. At 8-11 km from the crater, most sectors showed 4-6 or more tephra layers in the snowpack, from <1 to 20 cm thick. One of the 15 December explosions generated pumiceous tephra, including fist-sized bombs that melted their way into the snow. Other explosive episodes appeared to have been dominated by accretionary lapilli and fine lithic ash.
8 January plume data. A monitoring aircraft operated by the Univ of Washington reached the 8 January plume about 2 1/2 hours after the onset of activity. Dimensions of the plume were measured with upward-looking lidar over the Kenai Peninsula (60.96°N, 151.17°W to 60.81°N, 150.02°W) between 1246 and 1257. The base of the plume was at about 3.85 km altitude and its top at 9.0-9.7 km, with the main mass of material at approximately 6.4 km. Mass median diameter of particles was about 7 µm. Inter-eruptive emissions monitored from the same aircraft before 8 January were SO2-rich, perhaps totaling several thousand metric tons/day, but attempts to collect COSPEC data failed because of low sun angles.
Lava extrusion and minor venting, mid January-mid February. A new lava dome was first seen during an overflight on 18 January, although seismic evidence suggested the onset of extrusion by 13 January, before the 16 January explosion. Vigorous vapor emission limited observations of the dome in late January, and growth was difficult to discern. Rockfalls off the dome were extensive, but no new lobes or fissures were evident. It appeared to be slightly less than 100 m high and roughly 1/4-1/3 the size of the late December dome, which had an estimated volume of 25 x 106 m3. Additional breakage of the glacier that remained above the vent was indicated by new crevasses and ice avalanches into the crater. Ice blocks descended in stairstep fashion toward the dome from a vertical icewall. Most of the vapor emission originated from the area between the ice and the dome, obscuring the near-dome region and the interaction between ice and lava. A stream of meltwater flowed from the crater.
A minor seismic event began at 2315 on 7 February and lasted for about 20 minutes, suggesting vigorous steam venting. It was detected only by the summit station, indicating that little if any ash was ejected. The dome appeared nearly unchanged during an overflight the next day. Shallow earthquake activity recorded near the summit increased 12 February, suggesting a higher rate of dome growth. A tremor-like episode on the seismic station nearest the summit began at 0305 on 13 February and lasted nearly 30 minutes. The seismicity was probably associated with vigorous gas venting, perhaps including a little ash. Shallow summit-area seismicity declined somewhat that day, but remained elevated, as dome growth apparently continued.
Explosive episode, 15 February. A moderately large explosive episode that began at 0403 on 15 February produced a steam and ash column that rose to more than 10 km altitude and was carried rapidly SE by 160 km/hour winds. A spectacular display of lightning and thunder that lasted for about an hour awakened many people on the Kenai Peninsula. Satellite data 7 minutes after the onset of explosive activity showed a possible low-level pyroclastic flow or surge extending 7-10 km from the crater on Redoubt's NW quadrant. The temperature of the warmest 1 x 1 km pixel in this area was +25°C, with ambient air reported below -10°. By 0500, satellite images showed a plume extending about 120 km SE with an average width of more than 70 km. Plume temperatures of -49°C yielded an estimated altitude of 10.5-11.5 km for the top of the dense portion of the cloud. Airline pilots reported ash to 12 km altitude in the Homer area (roughly 120 km SE of Redoubt) and more than 1 cm of ash on Homer's airport runway. Anchorage's international airport remained open, but the FAA warned aircraft to avoid the area near the volcano. Most personnel were evacuated from the Drift River oil facility, but the 4 remaining crew members reported an increased flow of silty water in both the Drift River and Rust Slough, a small-capacity stream W of the oil facility into which much of the Drift River's flow was diverted by earlier mudflow-induced channel changes. The seismic station nearest the summit was destroyed, presumably by lightning, but seismicity decreased to low levels on flank stations 18 minutes after the onset of the eruption.
An overflight the next day revealed that at least 75% of the lava dome had been destroyed. Pyroclastic flows had swept across the glacier's Piedmont lobe, and had entered small, previously unaffected drainages. A pyroclastic surge had moved about 2500 m up the N wall of the steep canyon that leads from Redoubt's breached crater. Flood deposits, slightly less extensive than those of 2 January, were primarily dark brown sediment, locally containing abundant 1-2 m boulders. Water had flowed around an L-shaped levee on the upriver side of the oil facility, and a small amount of water had penetrated the containment dike protecting the southernmost of the facility's 7 storage tanks, but no oil was spilled. Aerial observations on 18 February showed that a small new dome, with a volume of less than 1 x 10⁶ m3, had begun to grow in the vent area. [See also 15:2].
Explosive episode, 21 February. Another vigorous explosion occurred on 21 February, beginning at [0032] and lasting for about [12] minutes. Winds carried the plume rapidly NE, and by 0300 satellite images showed its front 700 km from the volcano, where it was about 80 km wide. Pilots reported that the base of the cloud was at about 7.5-9 km altitude E of Anchorage, and NOAA estimated that its top was at about 9-11.5 km. Light ashfalls were reported at Kenai (80 km E of Redoubt), Nikishka (80 km NE), Hope (175 km ENE), and Girdwood (200 km ENE). [See also 15:2].
References. Alaska Volcano Observatory Staff, 1990, The 1989-1990 Eruption of Redoubt volcano: EOS, v. 71, no. 7, p. 265, 272-275.
Kienle, J., Dean, K.G., Garbeil, H., and Rose, W.I., 1990, Satellite surveillance of volcanic ash plumes, application to aircraft safety: EOS, v. 71, no. 7, p. 266.
Geologic Background. Redoubt is a glacier-covered stratovolcano with a breached summit crater in Lake Clark National Park about 170 km SW of Anchorage. Next to Mount Spurr, Redoubt has been the most active Holocene volcano in the upper Cook Inlet. The volcano was constructed beginning about 890,000 years ago over Mesozoic granitic rocks of the Alaska-Aleutian Range batholith. Collapse of the summit 13,000-10,500 years ago produced a major debris avalanche that reached Cook Inlet. Holocene activity has included the emplacement of a large debris avalanche and clay-rich lahars that dammed Lake Crescent on the south side and reached Cook Inlet about 3,500 years ago. Eruptions during the past few centuries have affected only the Drift River drainage on the north. Historical eruptions have originated from a vent at the north end of the 1.8-km-wide breached summit crater. The 1989-90 eruption had severe economic impact on the Cook Inlet region and affected air traffic far beyond the volcano.
Information Contacts: AVO Staff; SAB; W. Scott, CVO; R. Ferek, Univ of Washington; UPI; AP.
Ruapehu (New Zealand) — January 1990 Cite this Report
Ruapehu
New Zealand
39.28°S, 175.57°E; summit elev. 2797 m
All times are local (unless otherwise noted)
Phreatic eruptions from crater lake preceded by three hours of increased tremor
The first phreatic eruptions since July 1989 began in January, with episodes on the 7th (1215-1230), 12th (1100 and 1355), and 14th (1000, 1200, and 1232). The eruption at 1232 on the 14th sent water to 3-5 m and a nearby rockfall suggested that it may have been preceded by a small earthquake.
Intermittent 2-Hz tremor was recorded 30 December 1989-12 January 1990, and 5 hours of 1-Hz tremor, believed to reflect a deeper source, began on 10 January at 2300. Tremor amplitude increased ~3 hours before the 7 January eruption, but no changes accompanied the eruption, and geologists did not believe that the tremor increase was significant. A new episode of lake heating began around 5 January as Crater Lake's temperature rose from ~15°C on the 5th to 27° on the 11th.
When B. Scott flew over Ruapehu on 7 January at about 0915, a black slick, 100 m in diameter, covered the center of Crater Lake. The remainder of the lake was uniformly gray except for an area (50-100 m wide) of blue-green water extending from the NW through the NE quadrant. Later that day between 1215 and 1230, the first phreatic eruption ejected steam and water to 50-60 m, with a steam cloud 200 m in diameter. The activity turned the lake gray and formed a sulfur strand on the shore.
During 11 January fieldwork, sulfur strands up to 5 m from the lake's edge (~0.75 m above the current lake level) gave further evidence of the 7 January eruption. Lake temperatures of 25.3 and 26.8°C were measured at two locations. The lake was battleship gray and minor upwelling at the N vents formed a yellow slick. Upwelling over the main vent that produced a dark area strengthened by midafternoon, and at 1611 a 10-20-second audible burst of upwelling occurred.
Geologic Background. Ruapehu, one of New Zealand's most active volcanoes, is a complex stratovolcano constructed during at least four cone-building episodes dating back to about 200,000 years ago. The dominantly andesitic 110 km3 volcanic massif is elongated in a NNE-SSW direction and surrounded by another 100 km3 ring plain of volcaniclastic debris, including the NW-flank Murimoto debris-avalanche deposit. A series of subplinian eruptions took place between about 22,600 and 10,000 years ago, but pyroclastic flows have been infrequent. The broad summait area and flank contain at least six vents active during the Holocene. Frequent mild-to-moderate explosive eruptions have been recorded from the Te Wai a-Moe (Crater Lake) vent, and tephra characteristics suggest that the crater lake may have formed as recently as 3,000 years ago. Lahars resulting from phreatic eruptions at the summit crater lake are a hazard to a ski area on the upper flanks and lower river valleys.
Information Contacts: P. Otway, DSIR Wairakei.
Nevado del Ruiz (Colombia) — January 1990 Cite this Report
Nevado del Ruiz
Colombia
4.892°N, 75.324°W; summit elev. 5279 m
All times are local (unless otherwise noted)
Four high-frequency seismic swarms N of the crater; weak tremor pulses but no ash emission; SO2 emission low
Seismicity was at low levels during the first ten days of January, then the number and energy release of high-frequency events increased significantly. Swarms of high-frequency events, mostly centered in a zone ~6 km N of the crater at ~6 km depth, caused four energy release peaks (figure 36). A small number of low-frequency events were recorded during the month. Short pulses of low-energy tremor were not associated with ash emission. Deformation measurements showed no significant changes in January. Five SO2 measurements during January yielded an average of 980 t/d, only about half that of the previous month.
Geologic Background. Nevado del Ruiz is a broad, glacier-covered volcano in central Colombia that covers more than 200 km2. Three major edifices, composed of andesitic and dacitic lavas and andesitic pyroclastics, have been constructed since the beginning of the Pleistocene. The modern cone consists of a broad cluster of lava domes built within the caldera of an older edifice. The 1-km-wide, 240-m-deep Arenas crater occupies the summit. The prominent La Olleta pyroclastic cone located on the SW flank may also have been active in historical time. Steep headwalls of massive landslides cut the flanks. Melting of its summit icecap during historical eruptions, which date back to the 16th century, has resulted in devastating lahars, including one in 1985 that was South America's deadliest eruption.
Information Contacts: C. Carvajal, INGEOMINAS, Manizales.
Santa Maria (Guatemala) — January 1990 Cite this Report
Santa Maria
Guatemala
14.757°N, 91.552°W; summit elev. 3745 m
All times are local (unless otherwise noted)
Occasional low-density ash ejections; small lava flow spawns rock avalanches
Geologists noted several low-density ash ejections from Caliente Vent during 1 1/2 hours of observations beginning at 0945 on 3 January. The largest, at 1010, produced a gas/ash plume 1,000 m high. Subsequent episodes were smaller, ejecting plumes to a few hundred meters above the vent. A small lava flow that was emerging from Caliente Vent moved slowly down the dome's upper SE flank. The flow was a few tens of meters long, with associated rock avalanche deposits extending several hundred meters from its front. Recent avalanche deposits were also visible S and SW of the vent.
Caliente Vent, on the E side of Santiaguito dome, has been the site of continuous lava extrusion since 1975. A strong explosion from the Caliente Vent area on 19 July 1989 may have been the source of small lower stratospheric aerosol layers detected at several sites in August and September (see Atmospheric Effects, 14:8-9).
Geologic Background. Symmetrical, forest-covered Santa María volcano is part of a chain of large stratovolcanoes that rise above the Pacific coastal plain of Guatemala. The sharp-topped, conical profile is cut on the SW flank by a 1.5-km-wide crater. The oval-shaped crater extends from just below the summit to the lower flank, and was formed during a catastrophic eruption in 1902. The renowned Plinian eruption of 1902 that devastated much of SW Guatemala followed a long repose period after construction of the large basaltic andesite stratovolcano. The massive dacitic Santiaguito lava-dome complex has been growing at the base of the 1902 crater since 1922. Compound dome growth at Santiaguito has occurred episodically from four vents, with activity progressing E towards the most recent, Caliente. Dome growth has been accompanied by almost continuous minor explosions, with periodic lava extrusion, larger explosions, pyroclastic flows, and lahars.
Information Contacts: S. Halsor, Wilkes Univ; C. Chesner, Eastern Illinois Univ.
Ulawun (Papua New Guinea) — January 1990 Cite this Report
Ulawun
Papua New Guinea
5.05°S, 151.33°E; summit elev. 2334 m
All times are local (unless otherwise noted)
Weak vapor emission; 10-hour seismic swarm follows M 4.2 earthquake 25 km away
"Activity was at a low level throughout January, as it has been since July 1989. The summit crater emitted white vapour in weak to moderate amounts. The seismicity was also at a very low level, with only a few volcanic (B-type) events of very small amplitude/day. On the 4th, however, an earthquake (ML 4.2) originating 25 km away provoked the onset of a 10-hour swarm of small B-type events (~150) that ended abruptly after a string of a dozen larger events."
Geologic Background. The symmetrical basaltic-to-andesitic Ulawun stratovolcano is the highest volcano of the Bismarck arc, and one of Papua New Guinea's most frequently active. The volcano, also known as the Father, rises above the N coast of the island of New Britain across a low saddle NE of Bamus volcano, the South Son. The upper 1,000 m is unvegetated. A prominent E-W escarpment on the south may be the result of large-scale slumping. Satellitic cones occupy the NW and E flanks. A steep-walled valley cuts the NW side, and a flank lava-flow complex lies to the south of this valley. Historical eruptions date back to the beginning of the 18th century. Twentieth-century eruptions were mildly explosive until 1967, but after 1970 several larger eruptions produced lava flows and basaltic pyroclastic flows, greatly modifying the summit crater.
Information Contacts: I. Itikarai and P. de Saint-Ours, RVO.