Recently Published Bulletin Reports
Erebus (Antarctica) Lava lake remains active; most thermal alerts recorded since 2019
Rincon de la Vieja (Costa Rica) Frequent phreatic explosions during July-December 2023
Bezymianny (Russia) Explosion on 18 October 2023 sends ash plume 8 km high; lava flows and incandescent avalanches
Kilauea (United States) Low-level lava effusions in the lava lake at Halema’uma’u during July-December 2022
Nyamulagira (DR Congo) Lava flows and thermal activity during May-October 2023
Bagana (Papua New Guinea) Explosions, ash plumes, ashfall, and lava flows during April-September 2023
Mayon (Philippines) Lava flows, pyroclastic flows, ash emissions, and seismicity during April-September 2023
Nishinoshima (Japan) Eruption plumes and gas-and-steam plumes during May-August 2023
Krakatau (Indonesia) White gas-and-steam plumes and occasional ash plumes during May-August 2023
Villarrica (Chile) Strombolian activity, gas-and-ash emissions, and crater incandescence during April-September 2023
Merapi (Indonesia) Frequent incandescent avalanches during April-September 2023
Ebeko (Russia) Moderate explosive activity with ash plumes continued during June-November 2023
Erebus (Antarctica) — January 2024  Cite this Report
Erebus
Antarctica
77.53°S, 167.17°E; summit elev. 3794 m
All times are local (unless otherwise noted)
Lava lake remains active; most thermal alerts recorded since 2019
The lava lake in the summit crater of Erebus has been active since at least 1972. Located in Antarctica overlooking the McMurdo Station on Ross Island, it is the southernmost active volcano on the planet. Because of the remote location, activity is primarily monitored by satellites. This report covers activity during 2023.
The number of thermal alerts recorded by the Hawai'i Institute of Geophysics and Planetology’s MODVOLC Thermal Alerts System increased considerably in 2023 compared to the years 2020-2022 (table 9). In contrast to previous years, the MODIS instruments aboard the Aqua and Terra satellites captured data from Erebus every month during 2023. Consistent with previous years, the lowest number of anomalous pixels were recorded in January, November, and December.
Table 9. Number of monthly MODIS-MODVOLC thermal alert pixels recorded at Erebus during 2017-2023. See BGVN 42:06 for data from 2000 through 2016. The table was compiled using data provided by the HIGP – MODVOLC Thermal Alerts System.
| Year |
Jan |
Feb |
Mar |
Apr |
May |
Jun |
Jul |
Aug |
Sep |
Oct |
Nov |
Dec |
SUM |
| 2017 |
0 |
21 |
9 |
0 |
0 |
1 |
11 |
61 |
76 |
52 |
0 |
3 |
234 |
| 2018 |
0 |
21 |
58 |
182 |
55 |
17 |
137 |
172 |
103 |
29 |
0 |
0 |
774 |
| 2019 |
2 |
21 |
162 |
151 |
55 |
56 |
75 |
53 |
29 |
19 |
1 |
0 |
624 |
| 2020 |
0 |
2 |
16 |
18 |
4 |
4 |
1 |
3 |
18 |
3 |
1 |
6 |
76 |
| 2021 |
0 |
9 |
1 |
0 |
2 |
56 |
46 |
47 |
35 |
52 |
5 |
3 |
256 |
| 2022 |
1 |
13 |
55 |
22 |
15 |
32 |
39 |
19 |
31 |
11 |
0 |
0 |
238 |
| 2023 |
2 |
33 |
49 |
82 |
41 |
32 |
70 |
64 |
42 |
17 |
5 |
11 |
448 |
Sentinel-2 infrared images showed one or two prominent heat sources within the summit crater, accompanied by adjacent smaller sources, similar to recent years (see BGVN 46:01, 47:02, and 48:01). A unique image was obtained on 25 November 2023 by the OLI-2 (Operational Land Imager-2) on Landsat 9, showing the upper part of the volcano surrounded by clouds (figure 32).
Geologic Background. Mount Erebus, the world's southernmost historically active volcano, overlooks the McMurdo research station on Ross Island. It is the largest of three major volcanoes forming the crudely triangular Ross Island. The summit of the dominantly phonolitic volcano has been modified by one or two generations of caldera formation. A summit plateau at about 3,200 m elevation marks the rim of the youngest caldera, which formed during the late-Pleistocene and within which the modern cone was constructed. An elliptical 500 x 600 m wide, 110-m-deep crater truncates the summit and contains an active lava lake within a 250-m-wide, 100-m-deep inner crater; other lava lakes are sometimes present. The glacier-covered volcano was erupting when first sighted by Captain James Ross in 1841. Continuous lava-lake activity with minor explosions, punctuated by occasional larger Strombolian explosions that eject bombs onto the crater rim, has been documented since 1972, but has probably been occurring for much of the volcano's recent history.
Information Contacts: Hawai'i Institute of Geophysics and Planetology (HIGP) - MODVOLC Thermal Alerts System, School of Ocean and Earth Science and Technology (SOEST), Univ. of Hawai'i, 2525 Correa Road, Honolulu, HI 96822, USA (URL: http://modis.higp.hawaii.edu/); Copernicus Browser, Copernicus Data Space Ecosystem, European Space Agency (URL: https://dataspace.copernicus.eu/browser/); NASA Earth Observatory, EOS Project Science Office, NASA Goddard Space Flight Center, Goddard, Maryland, USA (URL: https://earthobservatory.nasa.gov/images/152134/erebus-breaks-through).
Rincon de la Vieja (Costa Rica) — January 2024 Cite this Report
Rincon de la Vieja
Costa Rica
10.83°N, 85.324°W; summit elev. 1916 m
All times are local (unless otherwise noted)
Frequent phreatic explosions during July-December 2023
Rincón de la Vieja is a volcanic complex in Costa Rica with a hot convecting acid lake that exhibits frequent weak phreatic explosions, gas-and-steam emissions, and occasional elevated sulfur dioxide levels (BGVN 45:10, 46:03, 46:11). The current eruption period began June 2021. This report covers activity during July-December 2023 and is based on weekly bulletins and occasional daily reports from the Observatorio Vulcanologico Sismologica de Costa Rica-Universidad Nacional (OVSICORI-UNA).
Numerous weak phreatic explosions continued during July-December 2023, along with gas-and-steam emissions and plumes that rose as high as 3 km above the crater rim. Many weekly OVSICORI-UNA bulletins included the previous week's number of explosions and emissions (table 9). For many explosions, the time of explosion was given (table 10). Frequent seismic activity (long-period earthquakes, volcano-tectonic earthquakes, and tremor) accompanied the phreatic activity.
Table 9. Number of reported weekly phreatic explosions and gas-and-steam emissions at Rincón de la Vieja, July-December 2023. Counts are reported for the week before the Weekly Bulletin date; not all reports included these data. Courtesy of OVSICORI-UNA.
| OVSICORI Weekly Bulletin |
Number of explosions |
Number of emissions |
| 28 Jul 2023 |
6 |
14 |
| 4 Aug 2023 |
10 |
12 |
| 1 Sep 2023 |
13 |
11 |
| 22 Sep 2023 |
12 |
13 |
| 29 Sep 2023 |
6 |
11 |
| 6 Oct 2023 |
12 |
5 |
| 13 Oct 2023 |
7 |
9 |
| 20 Oct 2023 |
1 |
15 |
| 27 Oct 2023 |
3 |
23 |
| 3 Nov 2023 |
3 |
10 |
| 17 Nov 2023 |
0 |
Some |
| 24 Nov 2023 |
0 |
14 |
| 8 Dec 2023 |
4 |
16 |
| 22 Dec 2023 |
8 |
18 |
Table 10. Summary of activity at Rincón de la Vieja during July-December 2023. Weak phreatic explosions and gas emissions are noted where the time of explosion was indicated in the weekly or daily bulletins. Height of plumes or emissions are distance above the crater rim. Courtesy of OVSICORI-UNA.
| Date |
Time |
Description of Activity |
| 1 Jul 2023 |
0156 |
Explosion. |
| 2 Jul 2023 |
0305 |
Explosion. |
| 4 Jul 2023 |
0229, 0635 |
Event at 0635 produced a gas-and-steam plume that rose 700 m and drifted W; seen by residents in Liberia (21 km SW). |
| 9 Jul 2023 |
1843 |
Explosion. |
| 21 Jul 2023 |
0705 |
Explosion. |
| 26 Jul 2023 |
1807 |
Explosion. |
| 28 Jul 2023 |
0802 |
Explosion generated a gas-and-steam plume that rose 500 m. |
| 30 Jul 2023 |
1250 |
Explosion. |
| 31 Jul 2023 |
2136 |
Explosion. |
| 11 Aug 2023 |
0828 |
Explosion. |
| 18 Aug 2023 |
1304 |
Explosion. |
| 21 Aug 2023 |
1224 |
Explosion generated gas-and-steam plumes rose 500-600 m. |
| 22 Aug 2023 |
0749 |
Explosion generated gas-and-steam plumes rose 500-600 m. |
| 24 Aug 2023 |
1900 |
Explosion. |
| 25 Aug 2023 |
0828 |
Event produced a steam-and-gas plume that rose 3 km and drifted NW. |
| 27-28 Aug 2023 |
0813 |
Four small events; the event at 0813 on 28 August lasted two minutes and generated a steam-and-gas plume that rose 2.5 km. |
| 1 Sep 2023 |
1526 |
Explosion generated plume that rose 2 km and ejected material onto the flanks. |
| 2-3 Sep 2023 |
- |
Small explosions detected in infrasound data. |
| 4 Sep 2023 |
1251 |
Gas-and-steam plume rose 1 km and drifted W. |
| 7 Nov 2023 |
1113 |
Explosion. |
| 8 Nov 2023 |
0722 |
Explosion. |
| 12 Nov 2023 |
0136 |
Small gas emissions. |
| 14 Nov 2023 |
0415 |
Small gas emissions. |
According to OVSICORI-UNA, during July-October the average weekly sulfur dioxide (SO2) flux ranged from 68 to 240 tonnes/day. However, in mid-November the flux increased to as high as 334 tonnes/day, the highest value measured in recent years. The high SO2 flux in mid-November was also detected by the TROPOMI instrument on the Sentinel-5P satellite (figure 43).
Geologic Background. Rincón de la Vieja, the largest volcano in NW Costa Rica, is a remote volcanic complex in the Guanacaste Range. The volcano consists of an elongated, arcuate NW-SE-trending ridge constructed within the 15-km-wide early Pleistocene Guachipelín caldera, whose rim is exposed on the south side. Sometimes known as the "Colossus of Guanacaste," it has an estimated volume of 130 km3 and contains at least nine major eruptive centers. Activity has migrated to the SE, where the youngest-looking craters are located. The twin cone of Santa María volcano, the highest peak of the complex, is located at the eastern end of a smaller, 5-km-wide caldera and has a 500-m-wide crater. A Plinian eruption producing the 0.25 km3 Río Blanca tephra about 3,500 years ago was the last major magmatic eruption. All subsequent eruptions, including numerous historical eruptions possibly dating back to the 16th century, have been from the prominent active crater containing a 500-m-wide acid lake located ENE of Von Seebach crater.
Information Contacts: Observatorio Vulcanológico Sismológica de Costa Rica-Universidad Nacional (OVSICORI-UNA), Apartado 86-3000, Heredia, Costa Rica (URL: http://www.ovsicori.una.ac.cr/); NASA Global Sulfur Dioxide Monitoring Page, Atmospheric Chemistry and Dynamics Laboratory, NASA Goddard Space Flight Center (NASA/GSFC), 8800 Greenbelt Road, Goddard MD 20771, USA (URL: https://so2.gsfc.nasa.gov/).
Bezymianny (Russia) — November 2023 Cite this Report
Bezymianny
Russia
55.972°N, 160.595°E; summit elev. 2882 m
All times are local (unless otherwise noted)
Explosion on 18 October 2023 sends ash plume 8 km high; lava flows and incandescent avalanches
Bezymianny, located on Russia’s Kamchatka Peninsula, has had eruptions since 1955 characterized by dome growth, explosions, pyroclastic flows, ash plumes, and ashfall. Activity during November 2022-April 2023 included gas-and-steam emissions, lava dome collapses generating avalanches, and persistent thermal activity. Similar eruptive activity continued from May through October 2023, described here based on information from weekly and daily reports of the Kamchatka Volcano Eruptions Response Team (KVERT), notices from Tokyo VAAC (Volcanic Ash Advisory Center), and from satellite data.
Overall activity decreased after the strong period of activity in late March through April 2023, which included ash explosions during 29 March and 7-8 April 2023 that sent plumes as high as 10-12 km altitude, along with dome growth and lava flows (BGVN 48:05). This reduced activity can be seen in the MIROVA thermal detection system graph (figure 56), which was consistent with data from the MODVOLC thermal detection system and with Sentinel-2 satellite images that showed persistent hotspots in the summit crater when conditions allowed observations. A renewed period of strong activity began in mid-October 2023.
Activity increased significantly on 17 October 2023 when large collapses began during 0700-0830 on the E flanks of the lava dome and continued to after 0930 the next day (figure 57). Ash plumes rose to an altitude of 4.5-5 km, extending 220 km NNE by 18 October. A large explosion at 1630 on 18 October produced an ash plume that rose to an altitude of 11 km (8 km above the summit) and drifted NNE and then NW, extending 900 km NW within two days at an altitude of 8 km. Minor ashfall was noted in Kozyrevsk (45 km WNW). At 0820 on 20 October an ash plume was identified in satellite images drifting 100 km ENE at altitudes of 4-4.5 km.
Lava flows and hot avalanches from the dome down the SE flank continued over the next few days, including 23 October when clear conditions allowed good observations (figures 58 and 59). A large thermal anomaly was observed over the volcano through 24 October, and in the summit crater on 30 October (figure 60). Strong fumarolic activity continued, with numerous avalanches and occasional incandescence. By the last week of October, volcanic activity had decreased to a level consistent with that earlier in the reporting period.
Aviation warnings were frequently updated during 17-20 October. KVERT issued a Volcano Observatory Notice for Aviation (VONA) on 17 October at 1419 and 1727 (0219 and 0527 UTC) raising the Aviation Color Code (ACC) from Yellow to Orange (second highest level). The next day, KVERT issued a VONA at 1705 (0505 UTC) raising the ACC to Red (highest level) but lowered it back to Orange at 2117 (0917 UTC). After another decrease to Yellow and back to Orange, the ACC was reduced to Yellow on 20 October at 1204 (0004 UTC). In addition, the Tokyo VAAC issued a series of Volcanic Ash Advisories beginning on 16 October and continuing through 30 October.
Geologic Background. The modern Bezymianny, much smaller than its massive neighbors Kamen and Kliuchevskoi on the Kamchatka Peninsula, was formed about 4,700 years ago over a late-Pleistocene lava-dome complex and an edifice built about 11,000-7,000 years ago. Three periods of intensified activity have occurred during the past 3,000 years. The latest period, which was preceded by a 1,000-year quiescence, began with the dramatic 1955-56 eruption. This eruption, similar to that of St. Helens in 1980, produced a large open crater that was formed by collapse of the summit and an associated lateral blast. Subsequent episodic but ongoing lava-dome growth, accompanied by intermittent explosive activity and pyroclastic flows, has largely filled the 1956 crater.
Information Contacts: Kamchatka Volcanic Eruptions Response Team (KVERT), Far Eastern Branch, Russian Academy of Sciences, 9 Piip Blvd., Petropavlovsk-Kamchatsky, 683006, Russia (URL: http://www.kscnet.ru/ivs/kvert/); Kamchatka Volcanological Station, Kamchatka Branch of Geophysical Survey, (KB GS RAS), Klyuchi, Kamchatka Krai, Russia (URL: http://volkstat.ru/); Tokyo Volcanic Ash Advisory Center (VAAC), 1-3-4 Otemachi, Chiyoda-ku, Tokyo 100-8122, Japan (URL: http://ds.data.jma.go.jp/svd/vaac/data/); Hawai'i Institute of Geophysics and Planetology (HIGP) - MODVOLC Thermal Alerts System, School of Ocean and Earth Science and Technology (SOEST), Univ. of Hawai'i, 2525 Correa Road, Honolulu, HI 96822, USA (URL: http://modis.higp.hawaii.edu/); MIROVA (Middle InfraRed Observation of Volcanic Activity), a collaborative project between the Universities of Turin and Florence (Italy) supported by the Centre for Volcanic Risk of the Italian Civil Protection Department (URL: http://www.mirovaweb.it/); Copernicus Browser, Copernicus Data Space Ecosystem, European Space Agency (URL: https://dataspace.copernicus.eu/browser/).chr
Kilauea (United States) — January 2023 Cite this Report
Kilauea
United States
19.421°N, 155.287°W; summit elev. 1222 m
All times are local (unless otherwise noted)
Low-level lava effusions in the lava lake at Halema’uma’u during July-December 2022
Kīlauea is the southeastern-most volcano in Hawaii and overlaps the E flank of the Mauna Loa volcano. Its East Rift Zone (ERZ) has been intermittently active for at least 2,000 years. An extended eruption period began in January 1983 and was characterized by open lava lakes and lava flows from the summit caldera and the East Rift Zone. During May 2018 magma migrated into the Lower East Rift Zone (LERZ) and opened 24 fissures along a 6-km-long NE-trending fracture zone that produced lava flows traveling in multiple directions. As lava emerged from the fissures, the lava lake at Halema'uma'u drained and explosions sent ash plumes to several kilometers altitude (BGVN 43:10).
The current eruption period started during September 2021 and has recently been characterized by lava effusions, spatter, and sulfur dioxide emissions in the active Halema’uma’u lava lake (BGVN 47:08). Lava effusions, some spatter, and sulfur dioxide emissions have continued during this reporting period of July through December 2022 using daily reports, volcanic activity notices, and abundant photo, map, and video data from the US Geological Survey's (USGS) Hawaiian Volcano Observatory (HVO).
Summary of activity during July-December 2022. Low-level effusions have continued at the western vent of the Halema’uma’u crater during July through early December 2022. Occasional weak ooze-outs (also called lava break outs) would occur along the margins of the crater floor. The overall level of the active lava lake throughout the reporting period gradually increased due to infilling, however it stagnated in mid-September (table 13). During September through November, activity began to decline, though lava effusions persisted at the western vent. By 9 December, the active part of the lava lake had completely crusted over, and incandescence was no longer visible.
Table 13. Summary of measurements taken during overflights at Kīlauea that show a gradual increase in the active lava lake level and the volume of lava effused since 29 September 2021. Lower activity was reported during September-October. Data collected during July-December 2022. Courtesy of HVO.
| Date: |
Level of the active lava lake (m): |
Cumulative volume of lava effused (million cubic meters): |
| 7 Jul 2022 |
130 |
95 |
| 19 Jul 2022 |
133 |
98 |
| 4 Aug 2022 |
136 |
102 |
| 16 Aug 2022 |
137 |
104 |
| 12 Sep 2022 |
143 |
111 |
| 5 Oct 2022 |
143 |
111 |
| 28 Oct 2022 |
143 |
111 |
Activity during July 2022. Lava effusions were reported from the western vent in the Halema’uma’u crater, along with occasional weak ooze-outs along the margins of the crater floor. The height of the lava lake was variable due to deflation-inflation tilt events; for example, the lake level dropped approximately 3-4 m during a summit deflation-inflation event reported on 1 July. Webcam images taken during the night of 6-12 July showed intermittent low-level spattering at the western vent that rose less than 10 m above the vent (figure 519). Measurements made during an overflight on 7 July indicated that the crater floor was infilled about 130 m and that 95 million cubic meters of lava had been effused since 29 September 2021. A single, relatively small lava ooze-out was active to the S of the lava lake. Around midnight on 8 July there were two brief periods of lava overflow onto the lake margins. On 9 July lava ooze-outs were reported near the SE and NE edges of the crater floor and during 10-11 July they occurred near the E, NE, and NW edges. On 16 July crater incandescence was reported, though the ooze-outs and spattering were not visible. On 18 July overnight webcam images showed incandescence in the western vent complex and two ooze-outs were reported around 0000 and 0200 on 19 July. By 0900 there were active ooze-outs along the SW edge of the crater floor. Measurements made from an overflight on 19 July indicated that the crater floor was infilled about 133 m and 98 million cubic meters of lava had erupted since 29 September 2021 (figure 520). On 20 July around 1600 active ooze-outs were visible along the N edge of the crater, which continued through the next day. Extensive ooze-outs occurred along the W margin during 24 July until 1900; on 26 July minor ooze-outs were noted along the N margin. Minor spattering was visible on 29 July along the E margin of the lake. The sulfur dioxide emission rates ranged 650-2,800 tons per day (t/d), the higher of which was measured on 8 July (figure 519).
Activity during August 2022. The eruption continued in the Halema’uma’u crater at the western vent. According to HVO the lava in the active lake remained at the level of the bounding levees. Occasional minor ooze-outs were observed along the margins of the crater floor. Strong nighttime crater incandescence was visible after midnight on 6 August over the western vent cone. During 6-7 August scattered small lava lobes were active along the crater floor and incandescence persisted above the western vent through 9 August. During 7-9 August HVO reported a single lava effusion source was active along the NW margin of the crater floor. Measurements from an overflight on 4 August indicated that the crater floor was infilled about 136 m total and that 102 million cubic meters of lava had been erupted since the start of the eruption. Lava breakouts were reported along the N, NE, E, S, and W margins of the crater during 10-16 August. Another overflight survey conducted on 16 August indicated that the crater floor infilled about 137 m and 104 million cubic meters of lava had been erupted since September 2021. Measured sulfur dioxide emissions rates ranged 1,150-2,450 t/d, the higher of which occurred on 8 August.
Activity during September 2022. During September, lava effusion continued from the western vent into the active lava lake and onto the crater floor. Intermittent minor ooze-outs were reported through the month. A small ooze-out was visible on the W crater floor margin at 0220 on 2 September, which showed decreasing surface activity throughout the day, but remained active through 3 September. On 3 September around 1900 a lava outbreak occurred along the NW margin of the crater floor but had stopped by the evening of 4 September. Field crews monitoring the summit lava lake on 9 September observed spattering on the NE margin of the lake that rose no higher than 10 m, before falling back onto the lava lake crust (figure 521). Overflight measurements on 12 September indicated that the crater floor was infilled a total of 143 m and 111 million cubic meters of lava had been erupted since September 2021. Extensive breakouts in the W and N part of the crater floor were reported at 1600 on 20 September and continued into 26 September. The active part of the lava lake dropped by 10 m while other parts of the crater floor dropped by several meters. Summit tiltmeters recorded a summit seismic swarm of more than 80 earthquakes during 1500-1800 on 21 September, which occurred about 1.5 km below Halema’uma’u; a majority of these were less than Mw 2. By 22 September the active part of the lava lake was infilled about 2 m. On 23 September the western vent areas exhibited several small spatter cones with incandescent openings, along with weak, sporadic spattering (figure 522). The sulfur dioxide emission rate ranged from 930 t/d to 2,000 t/d, the higher of which was measured on 6 September.
Activity during October 2022. Activity during October declined slightly compared to previous months, though lava effusions persisted from the western vent into the active lava lake and onto the crater floor during October (figure 523). Slight variations in the lava lake were noted throughout the month. HVO reported that around 0600 on 3 October the level of the lava lake has lowered slightly. Overflight measurements taken on 5 October indicated that the crater floor was infilled a total of about 143 m and that 111 million cubic meters of lava had been effused since September 2021. During 6-7 October the lake gradually rose 0.5 m. Sulfur dioxide measurements made on 22 October had an emission rate of 700 t/d. Another overflight taken on 28 October showed that there was little to no change in the elevation of the crater floor: the crater floor was infilled a total of 143 m and 111 million cubic meters of lava had erupted since the start of the eruption.
Activity during November 2022. Activity remained low during November, though HVO reported that lava from the western vent continued to effuse into the active lava lake and onto the crater floor throughout the month. The rate of sulfur dioxide emissions during November ranged from 300-600 t/d, the higher amount of which occurred on 9 November.
Activity during December 2022. Similar low activity was reported during December, with lava effusing from the western vent into the active lava lake and onto the crater floor. During 4-5 December the active part of the lava lake was slightly variable in elevation and fluctuated within 1 m. On 9 December HVO reported that lava was no longer erupting from the western vent in the Halema’uma’u crater and that sulfur dioxide emissions had returned to near pre-eruption background levels; during 10-11 December, the lava lake had completely crusted over, and no incandescence was visible (figure 524). Time lapse camera images covering the 4-10 December showed that the crater floor showed weak deflation and no inflation. Some passive events of crustal overturning were reported during 14-15 December, which brought fresh incandescent lava to the lake surface. The sulfur dioxide emission rate was approximately 200 t/d on 14 December. A smaller overturn event on 17 December and another that occurred around 0000 and into the morning of 20 December were also detected. A small seismic swarm was later detected on 30 December.
Geologic Background. Kilauea overlaps the E flank of the massive Mauna Loa shield volcano in the island of Hawaii. Eruptions are prominent in Polynesian legends; written documentation since 1820 records frequent summit and flank lava flow eruptions interspersed with periods of long-term lava lake activity at Halemaumau crater in the summit caldera until 1924. The 3 x 5 km caldera was formed in several stages about 1,500 years ago and during the 18th century; eruptions have also originated from the lengthy East and Southwest rift zones, which extend to the ocean in both directions. About 90% of the surface of the basaltic shield volcano is formed of lava flows less than about 1,100 years old; 70% of the surface is younger than 600 years. The long-term eruption from the East rift zone between 1983 and 2018 produced lava flows covering more than 100 km2, destroyed hundreds of houses, and added new coastline.
Information Contacts: Hawaiian Volcano Observatory (HVO), U.S. Geological Survey, PO Box 51, Hawai'i National Park, HI 96718, USA (URL: http://hvo.wr.usgs.gov/).
Nyamulagira (DR Congo) — November 2023 Cite this Report
Nyamulagira
DR Congo
1.408°S, 29.2°E; summit elev. 3058 m
All times are local (unless otherwise noted)
Lava flows and thermal activity during May-October 2023
Nyamulagira (also known as Nyamuragira) is a shield volcano in the Democratic Republic of Congo with the summit truncated by a small 2 x 2.3 km caldera with walls up to about 100 m high. Documented eruptions have occurred within the summit caldera, as well as from numerous flank fissures and cinder cones. The current eruption period began in April 2018 and has more recently been characterized by summit crater lava flows and thermal activity (BGVN 48:05). This report describes lava flows and variable thermal activity during May through October 2023, based on information from the Observatoire Volcanologique de Goma (OVG) and various satellite data.
Lava lake activity continued during May. The MIROVA (Middle InfraRed Observation of Volcanic Activity) system recorded moderate-to-strong thermal activity throughout the reporting period; activity was more intense during May and October and relatively weaker from June through September (figure 95). The MODVOLC thermal algorithm, detected a total of 209 thermal alerts. There were 143 hotspots detected during May, eight during June, nine during September, and 49 during October. This activity was also reflected in infrared satellite images, where a lava flow was visible in the NW part of the crater on 7 May and strong activity was seen in the center of the crater on 4 October (figure 96). Another infrared satellite image taken on 12 May showed still active lava flows along the NW margin of the crater. According to OVG lava effusions were active during 7-29 May and moved to the N and NW parts of the crater beginning on 9 May. Strong summit crater incandescence was visible from Goma (27 km S) during the nights of 17, 19, and 20 May (figure 97). On 17 May there was an increase in eruptive activity, which peaked at 0100 on 20 May. Notable sulfur dioxide plumes drifted NW and W during 19-20 May (figure 98). Drone footage acquired in partnership with the USGS (United States Geological Survey) on 20 May captured images of narrow lava flows that traveled about 100 m down the W flank (figure 99). Data from the Rumangabo seismic station indicated a decreasing trend in activity during 17-21 May. Although weather clouds prevented clear views of the summit, a strong thermal signature on the NW flank was visible in an infrared satellite image on 22 May, based on an infrared satellite image. On 28 May the lava flows on the upper W flank began to cool and solidify. By 29 May seismicity returned to levels similar to those recorded before the 17 May increase. Lava effusion continued but was confined to the summit crater; periodic crater incandescence was observed.
Low-level activity was noted during June through October. On 1 June OVG reported that seismicity remained at lower levels and that crater incandescence had been absent for three days, though infrared satellite imagery showed continued lava effusion in the summit crater. The lava flows on the flanks covered an estimated 0.6 km2. Satellite imagery continued to show thermal activity confined to the lava lake through October (figure 96), although no lava flows or significant sulfur dioxide emissions were reported.
Geologic Background. Africa's most active volcano, Nyamulagira (also known as Nyamuragira), is a massive high-potassium basaltic shield about 25 km N of Lake Kivu and 13 km NNW of the steep-sided Nyiragongo volcano. The summit is truncated by a small 2 x 2.3 km caldera that has walls up to about 100 m high. Documented eruptions have occurred within the summit caldera, as well as from the numerous flank fissures and cinder cones. A lava lake in the summit crater, active since at least 1921, drained in 1938, at the time of a major flank eruption. Recent lava flows extend down the flanks more than 30 km from the summit as far as Lake Kivu; extensive lava flows from this volcano have covered 1,500 km2 of the western branch of the East African Rift.
Information Contacts: Observatoire Volcanologique de Goma (OVG), Departement de Geophysique, Centre de Recherche en Sciences Naturelles, Lwiro, D.S. Bukavu, DR Congo; Hawai'i Institute of Geophysics and Planetology (HIGP) - MODVOLC Thermal Alerts System, School of Ocean and Earth Science and Technology (SOEST), Univ. of Hawai'i, 2525 Correa Road, Honolulu, HI 96822, USA (URL: http://modis.higp.hawaii.edu/); MIROVA (Middle InfraRed Observation of Volcanic Activity), a collaborative project between the Universities of Turin and Florence (Italy) supported by the Centre for Volcanic Risk of the Italian Civil Protection Department (URL: http://www.mirovaweb.it/); NASA Global Sulfur Dioxide Monitoring Page, Atmospheric Chemistry and Dynamics Laboratory, NASA Goddard Space Flight Center (NASA/GSFC), 8800 Greenbelt Road, Goddard, Maryland, USA (URL: https://so2.gsfc.nasa.gov/); Copernicus Browser, Copernicus Data Space Ecosystem, European Space Agency (URL: https://dataspace.copernicus.eu/browser/); Charles Balagizi, Goma Volcano Observatory, Departement de Geophysique, Centre de Recherche en Sciences Naturelles, Lwiro, D.S. Bukavu, DR Congo.
Bagana (Papua New Guinea) — October 2023 Cite this Report
Bagana
Papua New Guinea
6.137°S, 155.196°E; summit elev. 1855 m
All times are local (unless otherwise noted)
Explosions, ash plumes, ashfall, and lava flows during April-September 2023
The remote volcano of Bagana is located in central Bougainville Island, Papua New Guinea. Recorded eruptions date back to 1842 and activity has consisted of effusive activity that has built a small lava dome in the summit crater and occasional explosions that produced pyroclastic flows. The most recent eruption has been ongoing since February 2000 and has produced occasional explosions, ash plumes, and lava flows. More recently, activity has been characterized by ongoing effusive activity and ash emissions (BGVN 48:04). This report updates activity from April through September 2023 that has consisted of explosions, ash plumes, ashfall, and lava flows, using information from the Darwin Volcanic Ash Advisory Center (VAAC) and satellite data.
An explosive eruption was reported on 7 July that generated a large gas-and-ash plume to high altitudes and caused significant ashfall in local communities; the eruption plume had reached upper tropospheric (16-18 km altitude) altitudes by 2200, according to satellite images. Sulfur dioxide plumes were detected in satellite images on 8 July and indicated that the plume was likely a mixture of gas, ice, and ash. A report issued by the Autonomous Bougainville Government (ABG) (Torokina District, Education Section) on 10 July noted that significant ash began falling during 2000-2100 on 7 July and covered most areas in the Vuakovi, Gotana (9 km SW), Koromaketo, Laruma (25 km W) and Atsilima (27 km NW) villages. Pyroclastic flows also occurred, according to ground-based reports; small deposits confined to one drainage were inspected by RVO during an overflight on 17 July and were confirmed to be from the 7 July event. Ashfall continued until 10 July and covered vegetation, which destroyed bushes and gardens and contaminated rivers and streams.
RVO reported another eruption on 14 July. The Darwin VAAC stated that an explosive event started around 0830 on 15 July and produced an ash plume that rose to 16.5 km altitude by 1000 and drifted N, according to satellite images. The plume continued to drift N and remained visible through 1900, and by 2150 it had dissipated.
Ashfall likely from both the 7 and 15 July events impacted about 8,111 people in Torokina (20 km SW), including Tsito/Vuakovi, Gotana, Koromaketo, Kenaia, Longkogari, Kenbaki, Piva (13 km SW), and Atsinima, and in the Tsitovi district, according to ABG. Significant ashfall was also reported in Ruruvu (22 km N) in the Wakunai District of Central Bougainville, though the thickness of these deposits could not be confirmed. An evacuation was called for the villages in Wakunai, where heavy ashfall had contaminated water sources; the communities of Ruruvu, Togarau, Kakarapaia, Karauturi, Atao, and Kuritaturi were asked to evacuate to a disaster center at the Wakunai District Station, and communities in Torokina were asked to evacuate to the Piva District station. According to a news article, more than 7,000 people needed temporary accommodations, with about 1,000 people in evacuation shelters. Ashfall had deposited over a broad area, contaminating water supplies, affecting crops, and collapsing some roofs and houses in rural areas. Schools were temporarily shut down. Intermittent ash emissions continued through the end of July and drifted NNW, NW, and SW. Fine ashfall was reported on the coast of Torokina, and ash plumes also drifted toward Laruma and Atsilima.
A small explosive eruption occurred at 2130 on 28 July that ejected material from the crater vents, according to reports from Torokina, in addition to a lava flow that contained two lobes. A second explosion was detected at 2157. Incandescence from the lava flow was visible from Piva as it descended the W flank around 2000 on 29 July (figure 47). The Darwin VAAC reported that a strong thermal anomaly was visible in satellite images during 30-31 July and that ash emissions rose to 2.4 km altitude and drifted WSW on 30 July. A ground report from RVO described localized emissions at 0900 on 31 July.
The Darwin VAAC reported that ash plumes were identified in satellite imagery at 0800 and 1220 on 12 August and rose to 2.1 km and 3 km altitude and drifted NW and W, respectively. A news report stated that aid was sent to more than 6,300 people that were adversely affected by the eruption. Photos taken during 17-19 August showed ash emissions rising no higher than 1 km above the summit and drifting SE. A small explosion generated an ash plume during the morning of 19 August. Deposits from small pyroclastic flows were also captured in the photos. Satellite images captured lava flows and pyroclastic flow deposits. Two temporary seismic stations were installed near Bagana on 17 August at distances of 7 km WSW (Vakovi station) and 11 km SW (Kepox station). The Kepox station immediately started to record continuous, low-frequency background seismicity.
Satellite data. Little to no thermal activity was detected during April through mid-July 2023; only one anomaly was recorded during early April and one during early June, according to MIROVA (Middle InfraRed Observation of Volcanic Activity) data (figure 48). Thermal activity increased in both power and frequency during mid-July through September, although there were still some short gaps in detected activity. MODVOLC also detected increased thermal activity during August; thermal hotspots were detected a total of five times on 19, 20, and 27 August. Weak thermal anomalies were also captured in infrared satellite images on clear weather days throughout the reporting period on 7, 12, and 17 April, 27 May, 1, 6, 16, and 31 July, and 19 September (figure 48); a strong thermal anomaly was visible on 31 July. Distinct sulfur dioxide plumes that drifted generally NW were intermittently captured by the TROPOMI instrument on the Sentinel-5P satellite and sometimes exceeded two Dobson Units (DUs) (figure 49).
Geologic Background. Bagana volcano, in a remote portion of central Bougainville Island, is frequently active. This massive symmetrical cone was largely constructed by an accumulation of viscous andesitic lava flows. The entire edifice could have been constructed in about 300 years at its present rate of lava production. Eruptive activity is characterized by non-explosive effusion of viscous lava that maintains a small lava dome in the summit crater, although occasional explosive activity produces pyroclastic flows. Lava flows with tongue-shaped lobes up to 50 m thick and prominent levees descend the flanks on all sides.
Information Contacts: Rabaul Volcano Observatory (RVO), Geohazards Management Division, Department of Mineral Policy and Geohazards Management (DMPGM), PO Box 3386, Kokopo, East New Britain Province, Papua New Guinea; Darwin Volcanic Ash Advisory Centre (VAAC), Bureau of Meteorology, Northern Territory Regional Office, PO Box 40050, Casuarina, NT 0811, Australia (URL: http://www.bom.gov.au/info/vaac/); MIROVA (Middle InfraRed Observation of Volcanic Activity), a collaborative project between the Universities of Turin and Florence (Italy) supported by the Centre for Volcanic Risk of the Italian Civil Protection Department (URL: http://www.mirovaweb.it/); Hawai'i Institute of Geophysics and Planetology (HIGP) - MODVOLC Thermal Alerts System, School of Ocean and Earth Science and Technology (SOEST), Univ. of Hawai'i, 2525 Correa Road, Honolulu, HI 96822, USA (URL: http://modis.higp.hawaii.edu/); NASA Global Sulfur Dioxide Monitoring Page, Atmospheric Chemistry and Dynamics Laboratory, NASA Goddard Space Flight Center (NASA/GSFC), 8800 Greenbelt Road, Goddard, Maryland, USA (URL: https://so2.gsfc.nasa.gov/); Copernicus Browser, Copernicus Data Space Ecosystem, European Space Agency (URL: https://dataspace.copernicus.eu/browser/); Autonomous Bougainville Government, P.O Box 322, Buka, AROB, PNG (URL: https://abg.gov.pg/); Andrew Tupper (Twitter: @andrewcraigtupp); Simon Carn, Geological and Mining Engineering and Sciences, Michigan Technological University, 1400 Townsend Drive, Houghton, MI 49931, USA (URL: http://www.volcarno.com/, Twitter: @simoncarn); Radio NZ (URL: https://www.rnz.co.nz/news/pacific/494464/more-than-7-000-people-in-bougainville-need-temporary-accommodation-after-eruption); USAID, 1300 Pennsylvania Ave, NW, Washington DC 20004, USA (URL: https://www.usaid.gov/pacific-islands/press-releases/aug-08-2023-united-states-provides-immediate-emergency-assistance-support-communities-affected-mount-bagana-volcanic-eruptions).
Mayon (Philippines) — October 2023 Cite this Report
Mayon
Philippines
13.257°N, 123.685°E; summit elev. 2462 m
All times are local (unless otherwise noted)
Lava flows, pyroclastic flows, ash emissions, and seismicity during April-September 2023
Mayon is located in the Philippines and has steep upper slopes capped by a small summit crater. Historical eruptions date back to 1616 CE that have been characterized by Strombolian eruptions, lava flows, pyroclastic flows, and mudflows. Eruptions mostly originated from a central conduit. Pyroclastic flows and mudflows have commonly descended many of the approximately 40 drainages that surround the volcano. The most recent eruption occurred during June through October 2022 and consisted of lava dome growth and gas-and-steam emissions (BGVN 47:12). A new eruption was reported during late April 2023 and has included lava flows, pyroclastic density currents, ash emissions, and seismicity. This report covers activity during April through September 2023 based on daily bulletins from the Philippine Institute of Volcanology and Seismology (PHIVOLCS).
During April through September 2023, PHIVOLCS reported near-daily rockfall events, frequent volcanic earthquakes, and sulfur dioxide measurements. Gas-and-steam emissions rose 100-900 m above the crater and drifted in different directions. Nighttime crater incandescence was often visible during clear weather and was accompanied by incandescent avalanches of material. Activity notably increased during June when lava flows were reported on the S, SE, and E flanks (figure 52). The MIROVA graph (Middle InfraRed Observation of Volcanic Activity) showed strong thermal activity coincident with these lava flows, which remained active through September (figure 53). According to the MODVOLC thermal algorithm, a total of 110 thermal alerts were detected during the reporting period: 17 during June, 40 during July, 27 during August, and 26 during September. During early June, pyroclastic density currents (PDCs) started to occur more frequently.
Low activity was reported during much of April and May; gas-and-steam emissions rose 100-900 m above the crater and generally drifted in different directions. A total of 52 rockfall events and 18 volcanic earthquakes were detected during April and 147 rockfall events and 13 volcanic events during May. Sulfur dioxide flux measurements ranged between 400-576 tons per day (t/d) during April, the latter of which was measured on 29 April and between 162-343 t/d during May, the latter of which was measured on 13 May.
Activity during June increased, characterized by lava flows, pyroclastic density currents (PDCs), crater incandescence and incandescent rockfall events, gas-and-steam emissions, and continued seismicity. Weather clouds often prevented clear views of the summit, but during clear days, moderate gas-and-steam emissions rose 100-2,500 m above the crater and drifted in multiple directions. A total of 6,237 rockfall events and 288 volcanic earthquakes were detected. The rockfall events often deposited material on the S and SE flanks within 700-1,500 m of the summit crater and ash from the events drifted SW, S, SE, NE, and E. Sulfur dioxide emissions ranged between 149-1,205 t/d, the latter of which was measured on 10 June. Short-term observations from EDM and electronic tiltmeter monitoring indicated that the upper slopes were inflating since February 2023. Longer-term ground deformation parameters based on EDM, precise leveling, continuous GPS, and electronic tilt monitoring indicated that the volcano remained inflated, especially on the NW and SE flanks. At 1000 on 5 June the Volcano Alert Level (VAL) was raised to 2 (on a 0-5 scale). PHIVOLCS noted that although low-level volcanic earthquakes, ground deformation, and volcanic gas emissions indicated unrest, the steep increase in rockfall frequency may indicate increased dome activity.
A total of 151 dome-collapse PDCs occurred during 8-9 and 11-30 June, traveled 500-2,000 m, and deposited material on the S flank within 2 km of the summit crater. During 8-9 June the VAL was raised to 3. At approximately 1947 on 11 June lava flow activity was reported; two lobes traveled within 500 m from the crater and deposited material on the S (Mi-isi), SE (Bonga), and E (Basud) flanks. Weak seismicity accompanied the lava flow and slight inflation on the upper flanks. This lava flow remained active through 30 June, moving down the S and SE flank as far as 2.5 km and 1.8 km, respectively and depositing material up to 3.3 km from the crater. During 15-16 June traces of ashfall from the PDCs were reported in Sitio Buga, Nabonton, City of Ligao and Purok, and San Francisco, Municipality of Guinobatan. During 28-29 June there were two PDCs generated by the collapse of the lava flow front, which generated a light-brown ash plume 1 km high. Satellite monitors detected significant concentrations of sulfur dioxide beginning on 29 June. On 30 June PDCs primarily affected the Basud Gully on the E flank, the largest of which occurred at 1301 and lasted eight minutes, based on the seismic record. Four PDCs generated between 1800 and 2000 that lasted approximately four minutes each traveled 3-4 km on the E flank and generated an ash plume that rose 1 km above the crater and drifted N and NW. Ashfall was recorded in Tabaco City.
Similar strong activity continued during July; slow lava effusion remained active on the S and SE flanks and traveled as far as 2.8 km and 2.8 km, respectively and material was deposited as far as 4 km from the crater. There was a total of 6,983 rockfall events and 189 PDCs that affected the S, SE, and E flanks. The volcano network detected a total of 2,124 volcanic earthquakes. Continuous gas-and-steam emissions rose 200-2,000 m above the crater and drifted in multiple directions. Sulfur dioxide emissions averaged 792-4,113 t/d, the latter of which was measured on 28 July. During 2-4 July three PDCs were generated from the collapse of the lava flow and resulting light brown plumes rose 200-300 m above the crater. Continuous tremor pulses were reported beginning at 1547 on 3 July through 7 July at 1200, at 2300 on 8 July and going through 0300 on 10 July, and at 2300 on 16 July, as recorded by the seismic network. During 6-9 July there were 10 lava flow-collapse-related PDCs that generated light brown plumes 300-500 m above the crater. During 10-11 July light ashfall was reported in some areas of Mabinit, Legazpi City, Budiao and Salvacion, Daraga, and Camalig, Albay. By 18 July the lava flow advanced 600 m on the E flank as well.
During 1733 on 18 July and 0434 on 19 July PHIVOLCS reported 30 “ashing” events, which are degassing events accompanied by audible thunder-like sounds and entrained ash at the crater, which produced short, dark plumes that drifted SW. These events each lasted 20-40 seconds, and plume heights ranged from 150-300 m above the crater, as recorded by seismic, infrasound, visual, and thermal monitors. Three more ashing events occurred during 19-20 July. Short-term observations from electronic tilt and GPS monitoring indicate deflation on the E lower flanks in early July and inflation on the NW middle flanks during the third week of July. Longer-term ground deformation parameters from EDM, precise leveling, continuous GPS, and electronic tilt monitoring indicated that the volcano was still generally inflated relative to baseline levels. A short-lived lava pulse lasted 28 seconds at 1956 on 21 July, which was accompanied by seismic and infrasound signals. By 22 July, the only lava flow that remained active was on the SE flank, and continued to extend 3.4 km, while those on the S and E flanks weakened markedly. One ashing event was detected during 30-31 July, whereas there were 57 detected during 31 July-1 August; according to PHIVOLCS beginning at approximately 1800 on 31 July eruptive activity was dominated by phases of intermittent ashing, as well as increased in the apparent rates of lava effusion from the summit crater. The ashing phases consisted of discrete events recorded as low-frequency volcanic earthquakes (LFVQ) typically 30 seconds in duration, based on seismic and infrasound signals. Gray ash plume rose 100 m above the crater and generally drifted NE. Shortly after these ashing events began, new lava began to effuse rapidly from the crater, feeding the established flowed on the SE, E, and E flanks and generating frequent rockfall events.
Intensified unrest persisted during August. There was a total of 4,141 rockfall events, 2,881 volcanic earthquakes, which included volcanic tremor events, 32 ashing events, and 101 PDCs detected throughout the month. On clear weather days, gas-and-steam emissions rose 300-1,500 m above the crater and drifted in different directions (figure 54). Sulfur dioxide emissions averaged 735-4,756 t/d, the higher value of which was measured on 16 August. During 1-2 August the rate of lava effusion decreased, but continued to feed the flows on the SE, S, and E flanks, maintaining their advances to 3.4 km, 2.8 km, and 1.1 km from the crater, respectively (figure 55). Rockfall and PDCs generated by collapses at the lava flow margins and from the summit dome deposited material within 4 km of the crater. During 3-4 August there were 10 tremor events detected that lasted 1-4 minutes. Short-lived lava pulse lasted 35 seconds and was accompanied by seismic and infrasound signals at 0442 on 6 August. Seven collapses were recorded at the front of the lava flow during 12-14 August.
During September, similar activity of slow lava effusion, PDCs, gas-and-steam emissions, and seismicity continued. There was a total of 4,452 rockfall events, 329 volcanic earthquakes, which included volcanic tremor events, two ashing events, and 85 PDCs recorded throughout the month. On clear weather days, gas-and-steam emissions rose 100-1,500 m above the crater and drifted in multiple directions. Sulfur dioxide emissions averaged 609-2,252 t/d, the higher average of which was measured on 6 September. Slow lava effusion continued advancing on the SE, S, and E flanks, maintaining lengths of 3.4 km, 2.8 km, and 1.1 km, respectively. Rockfall and PDC events generated by collapses along the lava flow margins and at the summit dome deposited material within 4 km of the crater.
Geologic Background. Symmetrical Mayon, which rises above the Albay Gulf NW of Legazpi City, is the most active volcano of the Philippines. The steep upper slopes are capped by a small summit crater. Recorded eruptions since 1616 CE range from Strombolian to basaltic Plinian, with cyclical activity beginning with basaltic eruptions, followed by longer periods of andesitic lava flows. Eruptions occur predominately from the central conduit and have also produced lava flows that travel far down the flanks. Pyroclastic density currents and mudflows have commonly swept down many of the approximately 40 ravines that radiate from the summit and have often damaged populated lowland areas. A violent eruption in 1814 killed more than 1,200 people and devastated several towns.
Information Contacts: Philippine Institute of Volcanology and Seismology (PHIVOLCS), Department of Science and Technology, University of the Philippines Campus, Diliman, Quezon City, Philippines (URL: http://www.phivolcs.dost.gov.ph/); MIROVA (Middle InfraRed Observation of Volcanic Activity), a collaborative project between the Universities of Turin and Florence (Italy) supported by the Centre for Volcanic Risk of the Italian Civil Protection Department (URL: http://www.mirovaweb.it/); Hawai'i Institute of Geophysics and Planetology (HIGP) - MODVOLC Thermal Alerts System, School of Ocean and Earth Science and Technology (SOEST), Univ. of Hawai'i, 2525 Correa Road, Honolulu, HI 96822, USA (URL: http://modis.higp.hawaii.edu/); Copernicus Browser, Copernicus Data Space Ecosystem, European Space Agency (URL: https://dataspace.copernicus.eu/browser/); William Rogers, Legazpi City, Albay Province, Philippines.
Nishinoshima (Japan) — October 2023 Cite this Report
Nishinoshima
Japan
27.247°N, 140.874°E; summit elev. 100 m
All times are local (unless otherwise noted)
Eruption plumes and gas-and-steam plumes during May-August 2023
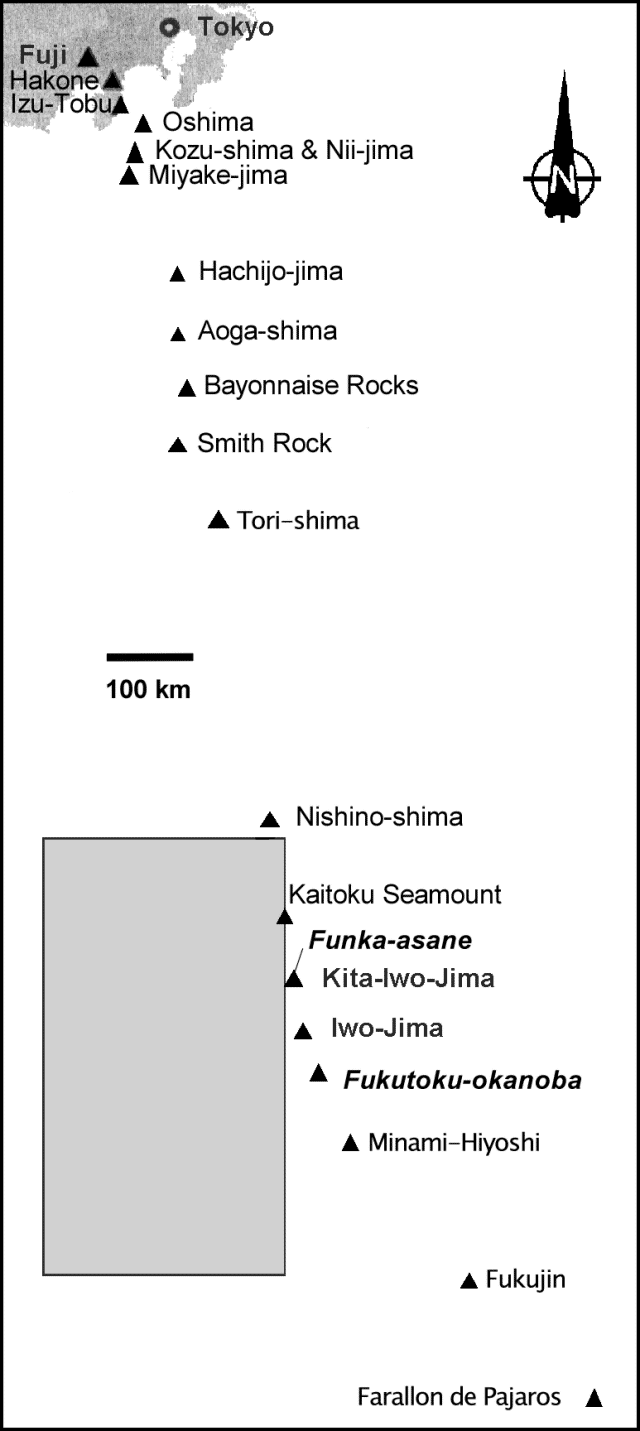
Nishinoshima, located about 1,000 km S of Tokyo, is a small island in the Ogasawara Arc in Japan. The island is the summit of a massive submarine volcano that has prominent submarine peaks to the S, W, and NE. Eruptions date back to 1973 and the current eruption period began in October 2022. Recent activity has consisted of small ash plumes and fumarolic activity (BGVN 48:07). This report covers activity during May through August 2023, using information from monthly reports of the Japan Meteorological Agency (JMA) monthly reports and satellite data.
Activity during May through June was relatively low. The Japan Coast Guard (JCG) did overflights on 14 and 22 June and reported white gas-and-steam emissions rising 600 m and 1,200 m from the central crater of the pyroclastic cone, respectively (figure 125). In addition, multiple white gas-and-steam emissions rose from the inner rim of the W side of the crater and from the SE flank of the pyroclastic cone. Discolored brown-to-green water was observed around almost the entire perimeter of the island; on 22 June light green discolored water was observed off the S coast of the island.
Observations from the Himawari meteorological satellite confirmed an eruption on 9 and 10 July. An eruption plume rose 1.6 km above the crater and drifted N around 1300 on 9 July. Satellite images acquired at 1420 and 2020 on 9 July and at 0220 on 10 July showed continuing emissions that rose 1.3-1.6 km above the crater and drifted NE and N. The Tokyo VAAC reported that an ash plume seen by a pilot and identified in a satellite image at 0630 on 21 July rose to 3 km altitude and drifted S.
Aerial observations conducted by JCG on 8 August showed a white-and-gray plume rising from the central crater of the pyroclastic cone, and multiple white gas-and-steam emissions were rising from the inner edge of the western crater and along the NW-SE flanks of the island (figure 126). Brown-to-green discolored water was also noted around the perimeter of the island.
Intermittent low-to-moderate power thermal anomalies were recorded in the MIROVA graph (Middle InfraRed Observation of Volcanic Activity), showing an increase in both frequency and power beginning in July (figure 127). This increase in activity coincides with eruptive activity on 9 and 10 July, characterized by eruption plumes. According to the MODVOLC thermal alert algorithm, one thermal hotspot was recorded on 20 July. Weak thermal anomalies were also detected in infrared satellite imagery, accompanied by strong gas-and-steam plumes (figure 128).
Geologic Background. The small island of Nishinoshima was enlarged when several new islands coalesced during an eruption in 1973-74. Multiple eruptions that began in 2013 completely covered the previous exposed surface and continued to enlarge the island. The island is the summit of a massive submarine volcano that has prominent peaks to the S, W, and NE. The summit of the southern cone rises to within 214 m of the ocean surface 9 km SSE.
Information Contacts: Japan Meteorological Agency (JMA), 1-3-4 Otemachi, Chiyoda-ku, Tokyo 100-8122, Japan (URL: http://www.jma.go.jp/jma/indexe.html); Tokyo Volcanic Ash Advisory Center (VAAC), 1-3-4 Otemachi, Chiyoda-ku, Tokyo 100-8122, Japan (URL: http://ds.data.jma.go.jp/svd/vaac/data/); MIROVA (Middle InfraRed Observation of Volcanic Activity), a collaborative project between the Universities of Turin and Florence (Italy) supported by the Centre for Volcanic Risk of the Italian Civil Protection Department (URL: http://www.mirovaweb.it/); Copernicus Browser, Copernicus Data Space Ecosystem, European Space Agency (URL: https://dataspace.copernicus.eu/browser/).
Krakatau (Indonesia) — October 2023 Cite this Report
Krakatau
Indonesia
6.1009°S, 105.4233°E; summit elev. 285 m
All times are local (unless otherwise noted)
White gas-and-steam plumes and occasional ash plumes during May-August 2023
Krakatau is located in the Sunda Strait between Java and Sumatra, Indonesia. Caldera collapse during the catastrophic 1883 eruption destroyed Danan and Perbuwatan cones and left only a remnant of Rakata. The post-collapse cone of Anak Krakatau (Child of Krakatau) was constructed within the 1883 caldera at a point between the former Danan and Perbuwatan cones; it has been the site of frequent eruptions since 1927. The current eruption period began in May 2021 and has recently consisted of Strombolian eruptions and ash plumes (BGVN 48:07). This report describes lower levels of activity consisting of ash and white gas-and-steam plumes during May through August 2023, based on information provided by the Indonesian Center for Volcanology and Geological Hazard Mitigation, referred to as Pusat Vulkanologi dan Mitigasi Bencana Geologi (PVMBG), MAGMA Indonesia, and satellite data.
Activity was relatively low during May and June. Daily white gas-and-steam emissions rose 25-200 m above the crater and drifted in different directions. Five ash plumes were detected at 0519 on 10 May, 1241 on 11 May, 0920 on 12 May, 2320 on 12 May, and at 0710 on 13 May, and rose 1-2.5 km above the crater and drifted SW. A webcam image taken on 12 May showed ejection of incandescent material above the vent. A total of nine ash plumes were detected during 6-11 June: at 1434 and 00220 on 6 and 7 June the ash plumes rose 500 m above the crater and drifted NW, at 1537 on 8 June the ash plume rose 1 km above the crater and drifted SW, at 0746 and at 0846 on 9 June the ash plumes rose 800 m and 3 km above the crater and drifted SW, respectively, at 0423, 1431, and 1750 on 10 June the ash plumes rose 2 km, 1.5 km, and 3.5 km above the crater and drifted NW, respectively, and at 0030 on 11 June an ash plume rose 2 km above the crater and drifted NW. Webcam images taken on 10 and 11 June at 0455 and 0102, respectively, showed incandescent material ejected above the vent. On 19 June an ash plume at 0822 rose 1.5 km above the crater and drifted SE.
Similar low activity of white gas-and-steam emissions and few ash plumes were reported during July and August. Daily white gas-and-steam emissions rose 25-300 m above the crater and drifted in multiple directions. Three ash plumes were reported at 0843, 0851, and 0852 on 20 July that rose 500-2,000 m above the crater and drifted NW.
The MIROVA (Middle InfraRed Observation of Volcanic Activity) graph of MODIS thermal anomaly data showed intermittent low-to-moderate power thermal anomalies during May through August 2023 (figure 140). Although activity was often obscured by weather clouds, a thermal anomaly was visible in an infrared satellite image of the crater on 12 May, accompanied by an eruption plume that drifted SW (figure 141).
Geologic Background. The renowned Krakatau (frequently mis-named as Krakatoa) volcano lies in the Sunda Strait between Java and Sumatra. Collapse of an older edifice, perhaps in 416 or 535 CE, formed a 7-km-wide caldera. Remnants of that volcano are preserved in Verlaten and Lang Islands; subsequently the Rakata, Danan, and Perbuwatan cones were formed, coalescing to create the pre-1883 Krakatau Island. Caldera collapse during the catastrophic 1883 eruption destroyed Danan and Perbuwatan, and left only a remnant of Rakata. This eruption caused more than 36,000 fatalities, most as a result of tsunamis that swept the adjacent coastlines of Sumatra and Java. Pyroclastic surges traveled 40 km across the Sunda Strait and reached the Sumatra coast. After a quiescence of less than a half century, the post-collapse cone of Anak Krakatau (Child of Krakatau) was constructed within the 1883 caldera at a point between the former Danan and Perbuwatan cones. Anak Krakatau has been the site of frequent eruptions since 1927.
Information Contacts: Pusat Vulkanologi dan Mitigasi Bencana Geologi (PVMBG, also known as Indonesian Center for Volcanology and Geological Hazard Mitigation, CVGHM), Jalan Diponegoro 57, Bandung 40122, Indonesia (URL: http://www.vsi.esdm.go.id/); MAGMA Indonesia, Kementerian Energi dan Sumber Daya Mineral (URL: https://magma.esdm.go.id/v1); MIROVA (Middle InfraRed Observation of Volcanic Activity), a collaborative project between the Universities of Turin and Florence (Italy) supported by the Centre for Volcanic Risk of the Italian Civil Protection Department (URL: http://www.mirovaweb.it/); Copernicus Browser, Copernicus Data Space Ecosystem, European Space Agency (URL: https://dataspace.copernicus.eu/browser/).
Villarrica (Chile) — October 2023 Cite this Report
Villarrica
Chile
39.42°S, 71.93°W; summit elev. 2847 m
All times are local (unless otherwise noted)
Strombolian activity, gas-and-ash emissions, and crater incandescence during April-September 2023
Villarrica, in central Chile, consists of a 2-km-wide caldera that formed about 3,500 years ago and is located at the base of the presently active cone at the NW margin of a 6-km-wide caldera. Historical eruptions eruptions date back to 1558 and have been characterized by mild-to-moderate explosive activity with occasional lava effusions. The current eruption period began in December 2014 and has recently consisted of nighttime crater incandescence, ash emissions, and seismicity (BGVN 48:04). This report covers activity during April through September 2023 and describes occasional Strombolian activity, gas-and-ash emissions, and nighttime crater incandescence. Information for this report primarily comes from the Southern Andes Volcano Observatory (Observatorio Volcanológico de Los Andes del Sur, OVDAS), part of Chile's National Service of Geology and Mining (Servicio Nacional de Geología y Minería, SERNAGEOMIN) and satellite data.
Seismicity during April consisted of long period (LP) events and tremor (TRE); a total of 9,413 LP-type events and 759 TR-type events were detected throughout the month. Nighttime crater incandescence persisted and was visible in the degassing column. Sulfur dioxide data was obtained using Differential Absorption Optical Spectroscopy Equipment (DOAS) that showed an average value of 1,450 ± 198 tons per day (t/d) during 1-15 April and 1,129 ± 201 t/d during 16-30 April, with a maximum daily value of 2,784 t/d on 9 April. Gas-and-steam emissions of variable intensities rose above the active crater as high as 1.3 km above the crater on 13 April. Strombolian explosions were not observed and there was a slight decrease in the lava lake level.
There were 14,123 LP-type events and 727 TR-type events detected during May. According to sulfur dioxide measurements taken with DOAS equipment, the active crater emitted an average value of 1,826 ± 482 t/d during 1-15 May and 912 ± 41 t/d during 16-30 May, with a daily maximum value of 5,155 t/d on 13 May. Surveillance cameras showed continuous white gas-and-steam emissions that rose as high as 430 m above the crater on 27 May. Nighttime incandescence illuminated the gas column less than 300 m above the crater rim was and no pyroclastic emissions were reported. A landslide was identified on 13 May on the E flank of the volcano 50 m from the crater rim and extending 300 m away; SERNAGEOMIN noted that this event may have occurred on 12 May. During the morning of 27 and 28 May minor Strombolian explosions characterized by incandescent ejecta were recorded at the crater rim; the last reported Strombolian explosions had occurred at the end of March.
Seismic activity during June consisted of five volcano-tectonic (VT)-type events, 21,606 LP-type events, and 2,085 TR-type events. The average value of sulfur dioxide flux obtained by DOAS equipment was 1,420 ± 217 t/d during 1-15 June and 2,562 ± 804 t/d, with a maximum daily value of 4,810 t/d on 17 June. White gas-and-steam emissions rose less than 480 m above the crater; frequent nighttime crater incandescence was reflected in the degassing plume. On 12 June an emission rose 100 m above the crater and drifted NNW. On 15 June one or several emissions resulted in ashfall to the NE as far as 5.5 km from the crater, based on a Skysat satellite image. Several Strombolian explosions occurred within the crater; activity on 15 June was higher energy and ejected blocks 200-300 m on the NE slope. Surveillance cameras showed white gas-and-steam emissions rising 480 m above the crater on 16 June. On 19 and 24 June low-intensity Strombolian activity was observed, ejecting material as far as 200 m from the center of the crater to the E.
During July, seismicity included 29,319 LP-type events, 3,736 TR-type events, and two VT-type events. DOAS equipment recorded two days of sulfur dioxide emissions of 4,220 t/d and 1,009 t/d on 1 and 13 July, respectively. Constant nighttime incandescence was also recorded and was particularly noticeable when accompanied by eruptive columns on 12 and 16 July. Minor explosive events were detected in the crater. According to Skysat satellite images taken on 12, 13, and 16 July, ashfall deposits were identified 155 m S of the crater. According to POVI, incandescence was visible from two vents on the crater floor around 0336 on 12 July. Gas-and-ash emissions rose as high as 1.2 km above the crater on 13 July and drifted E and NW. A series of gas-and-steam pulses containing some ash deposited material on the upper E flank around 1551 on 13 July. During 16-31 July, average sulfur dioxide emissions of 1,679 ± 406 t/d were recorded, with a maximum daily value of 2,343 t/d on 28 July. Fine ash emissions were also reported on 16, 17, and 23 July.
Seismicity persisted during August, characterized by 27,011 LP-type events, 3,323 TR-type events, and three VT-type events. The average value of sulfur dioxide measurements taken during 1-15 August was 1,642 ± 270 t/d and 2,207 ± 4,549 t/d during 16-31 August, with a maximum daily value of 3,294 t/d on 27 August. Nighttime crater incandescence remained visible in degassing columns. White gas-and-steam emissions rose 480 m above the crater on 6 August. According to a Skysat satellite image from 6 August, ash accumulation was observed proximal to the crater and was mainly distributed toward the E slope. White gas-and-steam emissions rose 320 m above the crater on 26 August. Nighttime incandescence and Strombolian activity that generated ash emissions were reported on 27 August.
Seismicity during September was characterized by five VT-type events, 12,057 LP-type events, and 2,058 TR-type events. Nighttime incandescence persisted. On 2 September an ash emission rose 180 m above the crater and drifted SE at 1643 (figure 125) and a white gas-and-steam plume rose 320 m above the crater. According to the Buenos Aires VAAC, periods of continuous gas-and-ash emissions were visible in webcam images from 1830 on 2 September to 0110 on 3 September. Strombolian activity was observed on 2 September and during the early morning of 3 September, the latter event of which generated an ash emission that rose 60 m above the crater and drifted 100 m from the center of the crater to the NE and SW. Ashfall was reported to the SE and S as far as 750 m from the crater. The lava lake was active during 3-4 September and lava fountaining was visible for the first time since 26 March 2023, according to POVI. Fountains captured in webcam images at 2133 on 3 September and at 0054 on 4 September rose as high as 60 m above the crater rim and ejected material onto the upper W flank. Sulfur dioxide flux of 1,730 t/d and 1,281 t/d was measured on 3 and 4 September, respectively, according to data obtained by DOAS equipment.
Strong Strombolian activity and larger gas-and-ash plumes were reported during 18-20 September. On 18 September activity was also associated with energetic LP-type events and notable sulfur dioxide fluxes (as high as 4,277 t/d). On 19 September Strombolian activity and incandescence were observed. On 20 September at 0914 ash emissions rose 50 m above the crater and drifted SSE, accompanied by Strombolian activity that ejected material less than 100 m SSE, causing fall deposits on that respective flank. SERNAGEOMIN reported that a Planet Scope satellite image taken on 20 September showed the lava lake in the crater, measuring 32 m x 35 m and an area of 0.001 km2. Several ash emissions were recorded at 0841, 0910, 1251, 1306, 1312, 1315, and 1324 on 23 September and rose less than 150 m above the crater. The sulfur dioxide flux value was 698 t/d on 23 September and 1,097 t/d on 24 September. On 24 September the Volcanic Alert Level (VAL) was raised to Orange (the third level on a four-color scale). SENAPRED maintained the Alert Level at Yellow (the middle level on a three-color scale) for the communities of Villarrica, Pucón (16 km N), Curarrehue, and Panguipulli.
During 24-25 September there was an increase in seismic energy (observed at TR-events) and acoustic signals, characterized by 1 VT-type event, 213 LP-type events, and 124 TR-type events. Mainly white gas-and-steam emissions, in addition to occasional fine ash emissions were recorded. During the early morning of 25 September Strombolian explosions were reported and ejected material 250 m in all directions, though dominantly toward the NW. On 25 September the average value of sulfur dioxide flux was 760 t/d. Seismicity during 25-30 September consisted of five VT-type events, 1,937 LP-type events, and 456 TR-type events.
During 25-29 September moderate Strombolian activity was observed and ejected material as far as the crater rim. In addition, ash pulses lasting roughly 50 minutes were observed around 0700 and dispersed ENE. During 26-27 September a TR episode lasted 6.5 hours and was accompanied by discrete acoustic signals. Satellite images from 26 September showed a spatter cone on the crater floor with one vent that measured 10 x 14 m and a smaller vent about 35 m NE of the cone. SERNAGEOMIN reported an abundant number of bomb-sized blocks up to 150 m from the crater, as well as impact marks on the snow, which indicated explosive activity. A low-altitude ash emission was observed drifting NW around 1140 on 28 September, based on webcam images. Between 0620 and 0850 on 29 September an ash emission rose 60 m above the crater and drifted NW. During an overflight taken around 1000 on 29 September scientists observed molten material in the vent, a large accumulation of pyroclasts inside the crater, and energetic degassing, some of which contained a small amount of ash. Block-sized pyroclasts were deposited on the internal walls and near the crater, and a distal ash deposit was also visible. The average sulfur dioxide flux measured on 28 September was 344 t/d. Satellite images taken on 29 September ashfall was deposited roughly 3 km WNW from the crater and nighttime crater incandescence remained visible. The average sulfur dioxide flux value from 29 September was 199 t/d. On 30 September at 0740 a pulsating ash emission rose 1.1 km above the crater and drifted NNW (figure 126). Deposits on the S flank extended as far as 4.5 km from the crater rim, based on satellite images from 30 September.
Infrared MODIS satellite data processed by MIROVA (Middle InfraRed Observation of Volcanic Activity) showed intermittent thermal activity during April through September, with slightly stronger activity detected during late September (figure 127). Small clusters of thermal activity were detected during mid-June, early July, early August, and late September. According to the MODVOLC thermal alert system, a total of four thermal hotspots were detected on 7 July and 3 and 23 September. This activity was also intermittently captured in infrared satellite imagery on clear weather days (figure 128).
Geologic Background. The glacier-covered Villarrica stratovolcano, in the northern Lakes District of central Chile, is ~15 km south of the city of Pucon. A 2-km-wide caldera that formed about 3,500 years ago is located at the base of the presently active, dominantly basaltic to basaltic andesite cone at the NW margin of a 6-km-wide Pleistocene caldera. More than 30 scoria cones and fissure vents are present on the flanks. Plinian eruptions and pyroclastic flows that have extended up to 20 km from the volcano were produced during the Holocene. Lava flows up to 18 km long have issued from summit and flank vents. Eruptions documented since 1558 CE have consisted largely of mild-to-moderate explosive activity with occasional lava effusion. Glaciers cover 40 km2 of the volcano, and lahars have damaged towns on its flanks.
Information Contacts: Servicio Nacional de Geología y Minería (SERNAGEOMIN), Observatorio Volcanológico de Los Andes del Sur (OVDAS), Avda Sta María No. 0104, Santiago, Chile (URL: http://www.sernageomin.cl/); Proyecto Observación Villarrica Internet (POVI) (URL: http://www.povi.cl/); Sistema y Servicio Nacional de Prevención y Repuesta Ante Desastres (SENAPRED), Av. Beauchef 1671, Santiago, Chile (URL: https://web.senapred.cl/); Buenos Aires Volcanic Ash Advisory Center (VAAC), Servicio Meteorológico Nacional-Fuerza Aérea Argentina, 25 de mayo 658, Buenos Aires, Argentina (URL: http://www.smn.gov.ar/vaac/buenosaires/inicio.php); MIROVA (Middle InfraRed Observation of Volcanic Activity), a collaborative project between the Universities of Turin and Florence (Italy) supported by the Centre for Volcanic Risk of the Italian Civil Protection Department (URL: http://www.mirovaweb.it/); Hawai'i Institute of Geophysics and Planetology (HIGP) - MODVOLC Thermal Alerts System, School of Ocean and Earth Science and Technology (SOEST), Univ. of Hawai'i, 2525 Correa Road, Honolulu, HI 96822, USA (URL: http://modis.higp.hawaii.edu/); Copernicus Browser, Copernicus Data Space Ecosystem, European Space Agency (URL: https://dataspace.copernicus.eu/browser/).
Merapi (Indonesia) — October 2023 Cite this Report
Merapi
Indonesia
7.54°S, 110.446°E; summit elev. 2910 m
All times are local (unless otherwise noted)
Frequent incandescent avalanches during April-September 2023
Merapi, located just north of the major city of Yogyakarta in central Java, Indonesia, has had activity within the last 20 years characterized by pyroclastic flows and lahars accompanying growth and collapse of the steep-sided active summit lava dome. The current eruption period began in late December 2020 and has more recently consisted of ash plumes, intermittent incandescent avalanches of material, and pyroclastic flows (BGVN 48:04). This report covers activity during April through September 2023, based on information from Balai Penyelidikan dan Pengembangan Teknologi Kebencanaan Geologi (BPPTKG), the Center for Research and Development of Geological Disaster Technology, a branch of PVMBG which specifically monitors Merapi. Additional information comes from the Pusat Vulkanologi dan Mitigasi Bencana Geologi (PVMBG, also known as Indonesian Center for Volcanology and Geological Hazard Mitigation, CVGHM), MAGMA Indonesia, the Darwin Volcanic Ash Advisory Centre (VAAC), and various satellite data.
Activity during April through September 2023 primarily consisted of incandescent avalanches of material that mainly affected the SW and W flanks and traveled as far as 2.3 km from the summit (table 25) and white gas-and-steam emissions that rose 10-1,000 m above the crater.
Table 25. Monthly summary of avalanches and avalanche distances recorded at Merapi during April through September 2023. The number of reported avalanches does not include instances where possible avalanches were heard but could not be visually confirmed as a result of inclement weather. Data courtesy of BPPTKG (April-September 2023 daily reports).
| Month |
Average number of avalanches per day |
Distance avalanches traveled (m) |
| Apr 2023 |
19 |
1,200-2,000 |
| May 2023 |
22 |
500-2,000 |
| Jun 2023 |
18 |
1,200-2,000 |
| Jul 2023 |
30 |
300-2,000 |
| Aug 2023 |
25 |
400-2,300 |
| Sep 2023 |
23 |
600-2,000 |
BPPTKG reported that during April and May white gas-and-steam emissions rose 10-750 m above the crater, incandescent avalanches descended 500-2,000 m on the SW and W flanks (figure 135). Cloudy weather often prevented clear views of the summit, and sometimes avalanches could not be confirmed. According to a webcam image, a pyroclastic flow was visible on 17 April at 0531. During the week of 28 April and 4 May a pyroclastic flow was reported on the SW flank, traveling up to 2.5 km. According to a drone overflight taken on 17 May the SW lava dome volume was an estimated 2,372,800 cubic meters and the dome in the main crater was an estimated 2,337,300 cubic meters.
During June and July similar activity persisted with white gas-and-steam emissions rising 10-350 m above the crater and frequent incandescent avalanches that traveled 300-2,000 m down the SW, W, and S flanks (figure 136). Based on an analysis of aerial photos taken on 24 June the volume of the SW lava dome was approximately 2.5 million cubic meters. A pyroclastic flow was observed on 5 July that traveled 2.7 km on the SW flank. According to the Darwin VAAC multiple minor ash plumes were identified in satellite images on 19 July that rose to 3.7 km altitude and drifted S and SW. During 22, 25, and 26 July a total of 17 avalanches descended as far as 1.8 km on the S flank.
Frequent white gas-and-steam emissions continued during August and September, rising 10-450 m above the crater. Incandescent avalanches mainly affected the SW and W flanks and traveled 400-2,300 m from the vent (figure 137). An aerial survey conducted on 10 August was analyzed and reported that estimates of the SW dome volume was 2,764,300 cubic meters and the dome in the main crater was 2,369,800 cubic meters.
Frequent and moderate-power thermal activity continued throughout the reporting period, according to a MIROVA (Middle InfraRed Observation of Volcanic Activity) analysis of MODIS satellite data (figure 138). There was an increase in the number of detected anomalies during mid-May. The MODVOLC thermal algorithm recorded a total of 47 thermal hotspots: six during April, nine during May, eight during June, 15 during July, four during August, and five during September. Some of this activity was captured in infrared satellite imagery on clear weather days, sometimes accompanied by incandescent material on the SW flank (figure 139).
Geologic Background. Merapi, one of Indonesia's most active volcanoes, lies in one of the world's most densely populated areas and dominates the landscape immediately north of the major city of Yogyakarta. It is the youngest and southernmost of a volcanic chain extending NNW to Ungaran volcano. Growth of Old Merapi during the Pleistocene ended with major edifice collapse perhaps about 2,000 years ago, leaving a large arcuate scarp cutting the eroded older Batulawang volcano. Subsequent growth of the steep-sided Young Merapi edifice, its upper part unvegetated due to frequent activity, began SW of the earlier collapse scarp. Pyroclastic flows and lahars accompanying growth and collapse of the steep-sided active summit lava dome have devastated cultivated lands on the western-to-southern flanks and caused many fatalities.
Information Contacts: Balai Penyelidikan dan Pengembangan Teknologi Kebencanaan Geologi (BPPTKG), Center for Research and Development of Geological Disaster Technology (URL: http://merapi.bgl.esdm.go.id/, Twitter: @BPPTKG); MAGMA Indonesia, Kementerian Energi dan Sumber Daya Mineral (URL: https://magma.esdm.go.id/v1); Pusat Vulkanologi dan Mitigasi Bencana Geologi (PVMBG, also known as Indonesian Center for Volcanology and Geological Hazard Mitigation, CVGHM), Jalan Diponegoro 57, Bandung 40122, Indonesia (URL: http://www.vsi.esdm.go.id/); Darwin Volcanic Ash Advisory Centre (VAAC), Bureau of Meteorology, Northern Territory Regional Office, PO Box 40050, Casuarina, NT 0811, Australia (URL: http://www.bom.gov.au/info/vaac/); MIROVA (Middle InfraRed Observation of Volcanic Activity), a collaborative project between the Universities of Turin and Florence (Italy) supported by the Centre for Volcanic Risk of the Italian Civil Protection Department (URL: http://www.mirovaweb.it/); Hawai'i Institute of Geophysics and Planetology (HIGP) - MODVOLC Thermal Alerts System, School of Ocean and Earth Science and Technology (SOEST), Univ. of Hawai'i, 2525 Correa Road, Honolulu, HI 96822, USA (URL: http://modis.higp.hawaii.edu/); Copernicus Browser, Copernicus Data Space Ecosystem, European Space Agency (URL: https://dataspace.copernicus.eu/browser/); Øystein Lund Andersen (URL: https://www.oysteinlundandersen.com/, https://twitter.com/oysteinvolcano).
Ebeko
Russia
50.686°N, 156.014°E; summit elev. 1103 m
All times are local (unless otherwise noted)
Moderate explosive activity with ash plumes continued during June-November 2023
Ebeko, located on the N end of Paramushir Island in Russia’s Kuril Islands just S of the Kamchatka Peninsula, consists of three summit craters along a SSW-NNE line at the northern end of a complex of five volcanic cones. Observed eruptions date back to the late 18th century and have been characterized as small-to-moderate explosions from the summit crater, accompanied by intense fumarolic activity. The current eruptive period began in June 2022, consisting of frequent explosions, ash plumes, and thermal activity (BGVN 47:10, 48:06). This report covers similar activity during June-November 2023, based on information from the Kamchatka Volcanic Eruptions Response Team (KVERT) and satellite data.
Moderate explosive activity continued during June-November 2023 (figures 50 and 51). According to visual data from Severo-Kurilsk, explosions sent ash 2-3.5 km above the summit (3-4.5 km altitude) during most days during June through mid-September. Activity after mid-September was slightly weaker, with ash usually reaching less than 2 km above the summit. According to KVERT the volcano in October and November was, with a few exceptions, either quiet or obscured by clouds that prevented satellite observations. KVERT issued Volcano Observatory Notices for Aviation (VONA) on 8 and 12 June, 13 and 22 July, 3 and 21 August, and 31 October warning of potential aviation hazards from ash plumes drifting 3-15 km from the volcano. Based on satellite data, KVERT reported a persistent thermal anomaly whenever weather clouds permitted viewing.
Geologic Background. The flat-topped summit of the central cone of Ebeko volcano, one of the most active in the Kuril Islands, occupies the northern end of Paramushir Island. Three summit craters located along a SSW-NNE line form Ebeko volcano proper, at the northern end of a complex of five volcanic cones. Blocky lava flows extend west from Ebeko and SE from the neighboring Nezametnyi cone. The eastern part of the southern crater contains strong solfataras and a large boiling spring. The central crater is filled by a lake about 20 m deep whose shores are lined with steaming solfataras; the northern crater lies across a narrow, low barrier from the central crater and contains a small, cold crescentic lake. Historical activity, recorded since the late-18th century, has been restricted to small-to-moderate explosive eruptions from the summit craters. Intense fumarolic activity occurs in the summit craters, on the outer flanks of the cone, and in lateral explosion craters.
Information Contacts: Kamchatka Volcanic Eruptions Response Team (KVERT), Far Eastern Branch, Russian Academy of Sciences, 9 Piip Blvd., Petropavlovsk-Kamchatsky, 683006, Russia (URL: http://www.kscnet.ru/ivs/kvert/).
Search Bulletin Archive by Publication Date
Select a month and year from the drop-downs and click "Show Issue" to have that issue displayed in this tab.
The default month and year is the latest issue available.
Bulletin of the Global Volcanism Network - Volume 24, Number 11 (November 1999)
Managing Editor: Richard Wunderman
Additional Reports (Unknown)
Japan: Hydro-acoustic signals of a possible eruption detected
Bezymianny (Russia)
Frequent fumarolic plumes, but no seismicity
Etna (Italy)
Vigorous eruptions at Bocca Nuova send lava flows 5 km down the W flank
False Reports (Unknown)
Turkey: UFO adherent claims new volcano in Sea of Marmara
Gorely (Russia)
Shallow earthquake swarm in October
Guagua Pichincha (Ecuador)
Dome growth and explosive eruptions; dramatic increase in LP earthquakes
Karymsky (Russia)
Eruptive activity gradually decreases, then stops in late December
Klyuchevskoy (Russia)
Variable fumarolic plumes and episodes of increased seismicity
Lengai, Ol Doinyo (Tanzania)
Very active hornito in the N part of the crater
Negro, Cerro (Nicaragua)
Explosive eruptions starting on 5 August
San Salvador (El Salvador)
Minor volcano-tectonic seismicity detected
Sheveluch (Russia)
Intermittent explosions from the dome; fumarolic plumes
Tungurahua (Ecuador)
Explosions continue; 1998-99 summary; ~25,000 people displaced for months
Whakaari/White Island (New Zealand)
Fumarolic activity continues; new crater lake
Additional Reports (Unknown) — November 1999 Cite this Report
Additional Reports
Unknown
Unknown, Unknown; summit elev. m
All times are local (unless otherwise noted)
Japan: Hydro-acoustic signals of a possible eruption detected
Robert Dziak at the NOAA/Pacific Marine Environmental Laboratory in Newport, Oregon reported that the large-aperture hydrophone array deployed throughout the north Pacific Ocean basin has been detecting extremely loud, tremor-like signals since May 1998. The best preliminary estimates of the signal sources lie ~1,000 km S of Honshu Island, Japan along the Volcano Island chain (astride the Bonin trench, figure 1).
Dziak believes these tremors to be volcanic in origin. The signals are characterized by a high amplitude fundamental around 10 Hz and the next three harmonics (20, 30, and 40 Hz). Typically signals appear as discrete packets lasting 4-5 minutes, with a brief ~30 second quiescence period, followed by the beginning of the next signal packet. For the duration of each signal packet, the spectral peaks typically increase monotonically by 5-10 Hz while maintaining their harmonic spacing. Similar distinctive characteristics have been previously identified in volcanic tremor records from both seismic and airborne acoustic measurements at Arenal Volcano in Costa Rica (Garces et al., 1998) and at Pavlof Volcano, Alaska (Garces and Hansen, 1998).
Unfortunately, the source of these signals is outside the optimum coverage area for the NOAA array, so the estimated locations are not accurate; the best preliminary estimates place the signal source in a box at 22-27°N and 138-141°E that lies W of the Bonin arc (figure 1).
The tremor has been occurring intermittently since May 1998, and was still being recorded as of late December 1999. During this period, intense tremor activity was recorded on 30 different days. The signals have for the most part been occurring continuously (with quiet times ranging from several days to several weeks) since first detected. Specific periods of peak amplitude and duration in 1998 and 1999 are presented in table 1. Signals measured on 10-12 December 1999 were the loudest yet detected.
Table 1. Dates of the strongest hydro-acoustic signals registered on the NOAA large-aperture hydrophone array compared to observation dates of discolored seawater over Fukutoku-okanoba and the Funka-asane vent of Kita-Iwo-jima. Hydro-acoustic data courtesy of R. Dziak; seawater observations courtesy of Yasuo Otani, Japan Maritime Safety Agency and Japan Meteorological Agency.
| Periods of peak tremors from hydro-acoustic data |
Discolored Seawater at Fukutoku-okanoba |
Discolored Seawater at Kita-Iwo-jima (Funka-asane) |
| 16-18 Aug 1998 |
-- |
-- |
| 31 Aug 1998 |
-- |
-- |
| -- |
16 Oct 1998 |
-- |
| -- |
28 Oct 1998 |
-- |
| -- |
14 Dec 1998 |
-- |
| -- |
16 Dec 1998 |
-- |
| -- |
12-13 Jan 1999 |
-- |
| 22 Apr 1999 |
-- |
-- |
| 20-27 Aug 1999 |
-- |
-- |
| -- |
-- |
07 Sep 1999 |
| -- |
08 Sep 1999 |
-- |
| 10-11 Oct 1999 |
-- |
-- |
| -- |
22 Nov 1999 |
-- |
| -- |
10-12 Dec 1999 |
-- |
Yasuo Otani of the Hydrographic Department of Japan has provided subsequent information (courtesy of Yukio Hayakawa) regarding periods of discolored sea water seen over Fukutoku-okanoba (24.3°N, 141.5°E). The latter is a known volcanic area located S of Iwo-Jima (24.75°N, 141.33°E) on the fringes of the area delineated above by Dziak. These dates are also presented in the second column of table 1; however, there does not appear to be an obvious correlation between the two data sets. On the other hand, what is not yet known is the density of visual observations, in effect, the number of observations of these sites when surface discolorations were absent. Without such details, trying to correlate the two data sets could be biased by sampling density.
Japan Meteorological Agency reports provided one other case of sea surface discoloration, at Funka-asane, but this lone observation also failed to show any temporal correlation and has the same limitations of sampling bias mentioned above. Funka-asane, a submarine vent ~2 km NW of Kita-Iwo-jima (25.43°N, 141.23°E), is just E of the preliminary box delineated by the acoustical data.
Olivier Hyvernaud at the Geophysical Laboratory in Tahiti had found no evidence of volcanic T-waves from the region in question through the end of 1999.
The area of the preliminary box is large, and could include many other volcanic centers. Given all of the uncertainty, anyone having possibly related data or comments is urged to contact Robert Dziak or the Smithsonian's Global Volcanism Network.
References. Garces, M.A., Hagerty, M.T., Schwartz, S.Y., 1998, Magma acoustics and time-varying melt properties at Arenal Volcano, Costa Rica: Geophysical Research Letters, v. 25, no. 13, p. 2293-6.
Garces, M.A., Hansen, R.A., 1998, Wave form analysis of seismoacoustic signals radiated during the fall 1996 eruption of Pavlof volcano, Alaska: Geophysical Research Letters, v. 25, no.7, p. 1051-4.
Geologic Background. Reports of floating pumice from an unknown source, hydroacoustic signals, or possible eruption plumes seen in satellite imagery.
Information Contacts: Robert P. Dziak, Oregon State University/NOAA, Hatfield Marine Science Center, 2115 SE OSU Drive, Newport, OR 97365 USA (URL: http://newport.pmel.noaa.gov/); Yasuo Otani, Coastal Surveys and Cartography Division, Hydrographic Department, Maritime Safety Agency, 3-1 Tsukiji, 5-Chome, Chuo-ku, Tokyo 104-0045, Japan; Olivier Hyvernaud, Laboratoire de Géophysique, BP 640 Pamatai, Tahiti, French Polynesia.
Bezymianny (Russia) — November 1999 Cite this Report
Bezymianny
Russia
55.972°N, 160.595°E; summit elev. 2882 m
All times are local (unless otherwise noted)
Frequent fumarolic plumes, but no seismicity
Fumarolic plumes generally rising 50-300 m above the volcano were often observed during clear weather in August-December 1999, but views were frequently obscured by meteorological clouds. Weak fumarolic activity without a significant plume was detected on a few other occasions during this period. Plumes were observed on the following days: 9-10, 16, and 20-23 August; 2, 12, 22, 26, and 28 September; 22-24, 25-27, and 29-31 October; 1, 5, 11-12, 19, 22-23, 26, and 29 November; 2-3, 24, 25, and 28 December. Depending on local conditions, the plumes often extended 5-10 km downwind, usually E and SE. Others were blown S, NW, or NE. The longest plume during this period was on 26 August when it extended 15 km NE. No seismicity was registered under the volcano from 10 August through the end of December 1999. On October 6, a shallow earthquake was registered under the volcano.
Geologic Background. The modern Bezymianny, much smaller than its massive neighbors Kamen and Kliuchevskoi on the Kamchatka Peninsula, was formed about 4,700 years ago over a late-Pleistocene lava-dome complex and an edifice built about 11,000-7,000 years ago. Three periods of intensified activity have occurred during the past 3,000 years. The latest period, which was preceded by a 1,000-year quiescence, began with the dramatic 1955-56 eruption. This eruption, similar to that of St. Helens in 1980, produced a large open crater that was formed by collapse of the summit and an associated lateral blast. Subsequent episodic but ongoing lava-dome growth, accompanied by intermittent explosive activity and pyroclastic flows, has largely filled the 1956 crater.
Information Contacts: Olga Chubarova, Kamchatka Volcanic Eruptions Response Team (KVERT), Institute of Volcanic Geology and Geochemistry, Piip Ave. 9, Petropavlovsk-Kamchatsky, 683006, Russia; Tom Miller, Alaska Volcano Observatory (AVO), a cooperative program of a) U.S. Geological Survey, 4200 University Drive, Anchorage, AK 99508-4667, USA (URL: http://www.avo.alaska.edu/), b) Geophysical Institute, University of Alaska, PO Box 757320, Fairbanks, AK 99775-7320, USA, and c) Alaska Division of Geological & Geophysical Surveys, 794 University Ave., Suite 200, Fairbanks, AK 99709, USA.
Etna
Italy
37.748°N, 14.999°E; summit elev. 3357 m
All times are local (unless otherwise noted)
Vigorous eruptions at Bocca Nuova send lava flows 5 km down the W flank
Following the gradual reactivation of the summit craters since June 1999 and eruptive episodes at the Voragine on 4 September and at the Bocca Nuova (BN) on 20 September, the activity shifted to the Northeast Crater (NEC) and then to the BN in early October. During the second half of October, the BN crater produced spectacular Strombolian activity, episodes of high lava fountaining, and lava overflows onto the W flank of the volcano, the first flows in that area since 1964. Lava flows on the W flank interrupted two dirt roads and burned a small portion of forest, but presented no threat to inhabited areas downslope. After 3 November, the activity declined to low levels.
The information for the following report, covering October-November 1999, was compiled by Boris Behncke at the University of Catania (DSGUC), Marco Fulle, Roberto Carniel, and Jürg Alean. Additional information was provided by Jean-Claude Tanguy. The compilation is based on personal visits to the summit, observations from Catania, and many other sources cited in the text.
Vigorous Strombolian activity occurred at the NEC during the first week of October. When the summit area was visited by Behncke, Roberto Scandone and Lisetta Giacomelli (Dipartimento di Fisica, Università "Roma Tre"), and Angelo Amara (Catania University) on 1 October, strong explosions ejected bombs up to 100 m above the crater rim, and ash emissions were frequent. Similar activity was observed during a summit visit by Behncke and others on 6 October. Brownish-gray ash plumes were frequent, and some of the Strombolian bursts were densely charged with small bombs.
Eruptive activity resumed within the BN on the afternoon of 5 October, after about two weeks of relative calm. After nightfall, Giuseppe Scarpinati (Italian correspondent of L'Association Volcanologique Européenne, LAVE) observed strong explosions from his home in Acireale (~18 km SE from the summit). Huge incandescent bombs were ejected to halfway down the S flank of the main summit cone. Scarpinati noted fluctuating glow at the NEC and increased effusion at the ESE base of the Southeast Crater (SEC) cone. Powerful explosions from the BN were continuing the next morning as Behncke and two students from the University of Trier visited Piano Provenzana on the N flank (~6 km from the BN). Explosions occurred at intervals of ~10 minutes, with minor activity between the explosions. Many bombs were ejected far beyond the crater rim. The source of this activity was probably at the SE eruptive center, which had been buried under lava on 20-21 September.
Vigorous eruptive activity continued at NEC and BN through 11 October. Dark ash-laden plumes commonly rose every few minutes from the NEC. Bombs were ejected from the BN to a distance of several hundred meters, and some bursts rose more than 300 m above the crater. Eruptive activity resumed within the Voragine and continued at least through the following day (information from Sandro Privitera, DSGUC, and Jean-Claude Tanguy).
On the afternoon of 12 October Behncke and Amara were ~250 m from the W rim of the BN, where activity was vigorous, with ejections of dense jets of bombs to hundreds of meters above the crater rim. Eruptive activity occurred from at least four locations within the crater. At 1830 there was the first in a series of powerful detonations that ejected abundant lithics along with incandescent bombs and a tephra-laden plume to ~500 m above the crater rim. The explosions initiated about 30 minutes of more intense activity from three locations in the W and NW part of the crater.
NEC emitted dark dense ash plumes almost continuously. After nightfall only ~10 percent of the emissions ejected incandescent bombs; other emissions appeared to eject mainly lithics. While near the front of the 22 July 1998 lava flow on the dirt road that connects the N and S routes to the summit (named "summit road" in the following paragraphs), several explosions from the Voragine were heard. At the ESE base of SEC cone lava was still issuing quietly after more than 8 months. The effusion rate was estimated at ~1 m3/s; during the previous four weeks, ~2.5 x 10⁶ m3 had been added to the more than 40 x 106 m3 of lava emitted between 4 February and early September 1999.
Strong ash emission from the NEC on the morning of 13 October continued in a pulsating manner into the early afternoon of the following day. At the BN, however, near-continuous ejections of incandescent bombs caused rapid filling of the crater. On the evening of 15 October, vigorous eruptive activity occurred at the Voragine and loud detonations were audible as far as Catania.
Lava was fountaining in BN on the evening of 16 October, but strong explosions resumed the next morning (17 October). Fulle watched the activity from the summit road and reported that continuous lava jetting to several hundred meters above the crater rim occurred from several vents, and bombs dropped onto the outer flanks of the main summit cone. Sometime around 2015 a small portion of the W rim collapsed, allowing lava to move rapidly down the steep slope, crossing the summit road. On the early morning of 18 October, the farthest flow front had reached ~1,900 m elevation and stopped before reaching the Forestale dirt road (figure 82). Lava was reported to flow vigorously through the breach on the W side of the BN on the evening of 18 October, but the fronts did not extend as far downslope as the first major flows.
At about noon on 19 October, Behncke and Scarpinati reached the summit area and observed near-continuous ejections of large bombs high above the rim of the BN. Movement of the lava flow on the W flank had slowed significantly, and only the central portion of the flow was moving. The lava field had many overlapping flow units with a total width of ~100 m at the summit road crossing. Between 1200 and 1230 activity increased until fountaining from the more southerly of the two vents became virtually continuous; frequent large blasts from the other vent dropped bombs up to 150 m beyond the crater rim. A short time later a new flow with a front ~3 m high advanced rapidly through the central flow channel, on top of the still-moving earlier lava. From points along the N margin of the lava field the summit of a pyroclastic cone growing within the BN could be seen rising above the crater rim. Explosive activity consisted of only a few ash-rich emissions between 1630 and 1730. After sunset the active flows were brightly incandescent over their entire length, and BN produced bursts of huge incandescent bombs every 2-10 seconds.
After continuing vigorously until the early morning of 20 October, the activity from the eruptive vents in the W and NW part of the BN ceased, and the lava overflow through the notch in the W crater rim stopped. Sometime near dawn, forceful expulsions of ash began from the SE vent, which had shown little activity the previous week. The low levels of activity permitted volcanologists from the U.K. to reach the rim of the BN and observe at least three vents with mild Strombolian activity and sizeable pyroclastic cones around them. On 21 October at 0300, intense eruptive activity apparently resumed, with renewed lava overflow onto the W flank. A new lobe on the S margin of the flow-field covered more of the summit road and extended to ~2,400 m elevation.
On the morning of 22 October, Scarpinati, from his home in Acireale, observed mild Strombolian activity (one explosion every 15-20 seconds) at the BN and more vigorous spattering at the vents on the ESE base of the SEC cone. By 1130 another episode of high lava fountaining and overflow from BN was in progress. From Catania jets of incandescent material to several hundred meters above the crater rim were visible, and a dense, ash-poor column of yellowish gas rose at least 4 km above the summit. Fulle witnessed the activity from a distance of a few hundred meters, and reported that a N-S fissure ~200 m long in the W part of the BN ejected a virtually continuous sheet of very fluid lava with jets rising up to 500 m high. A torrent of lava ran halfway down the W flank of the main summit cone at a speed of ~50 m/minute, carrying incandescent blocks more than 10 m across. An overflow may have also occurred on the NNW side of the BN. After 1230 the activity and the volume of overflowing lava diminished, but sporadic explosions threw large bombs hundreds of meters beyond the crater rim until 1700. Between 2000 and 2100 Behncke and Scarpinati visited the ESE base of the SEC cone where lava emission from at least three vents continued, and incandescent gas was emitted forcefully from two large hornitos that had grown earlier that day. Flowing lava was seen ~500 m NE and E from the active vents.
On 23 October another episode of high lava fountaining at the BN and overflow onto the W flank began at about 1000. This activity culminated at about 1045 but was less intense than the episode of the previous day. Relatively mild Strombolian activity persisted through the evening of 24 October, and small volumes of lava flowed onto the W flank. During the afternoon, Fulle and Carniel observed explosions (mostly ash) from four vents on the fissure in BN, and from a vent in the SE sector of the BN. During the night loud explosions at intervals of several minutes rattled windows and doors in towns 24 and 28 km NE.
On the morning of 25 October ash was emitted sporadically from BN until by about 1130 continuous fountaining was in progress. Broad jets of lava generally rose 100-200 m above the crater rim, but occasional jets soared to 500 m height. Lava again descended the W flank. A large pyroclastic cone near the vent that produced most of the fountaining (in the NW part of the BN) was ~30 m above the NW crater rim. Fulle and Carniel observed that the activity occurred from a number of vents along a N-S trending fissure in the W part of the BN. At 1145 Fulle observed that lava was overflowing the rim near the SW vent, covering the southern edge of the previous lava field.
From 1235 to 1300 the flank of the BN was affected by intense deformation, with the opening of several fractures and a series of collapses. Within a few minutes (peaking around 1320) a wide sector of the WNW crater rim was pushed up and out by lava within the crater. Minor collapses occurred for about 30 minutes while vigorous lava fountaining continued. The avalanches resulting from the collapses spilled several hundred meters down the W flank and produced brownish plumes. Movie clips taken by Carniel of the deformation and avalanches are available at Stromboli On-line. Lava flowing through the new breach was repeatedly covered with debris but continued to flow, carrying boulders up to 20 m in diameter. On the N side of the BN the mass of fluid bombs transformed into a rootless lava flow that advanced along the flow emplaced on 22 October, but extended farther downslope. The episode ended by about 1630, but was followed by a series of strong isolated explosions. By 1900, the main vent in the BN produced frequent Strombolian bursts, and lava flow through the breach in the crater rim continued at a reduced rate.
Observations made that evening revealed that a new lava flow with at least seven active branches had descended the W flank, and the farthest flow front had extended to ~1,900 m elevation. By about 1810 the front of the longest branch began moving through a small patch of forest a few hundred meters above the Forestale Road. The new lava flow was slightly N of the flows produced during the preceding week, with the longest branch extending almost 5 km from the BN, thus being one of the longest flows ever produced by a summit eruption.
On the morning of 26 October, the activity consisted mostly of isolated ash-rich explosions from the southernmost fissure vent in the W part of the BN. Towards the evening the activity became more continuous and there was mild Strombolian activity. Fulle and Carniel reported that up to five vents along the fissure were active. Explosions also occurred from two vents in the SE part of the BN where little activity had been observed the previous week.
On 27 October jets of lava rose tens of meters above two main vents in the W part of the BN, and a new large pyroclastic cone was growing around the northernmost vent. Lava continued to overflow on the W side of the crater, with active flow fronts to ~2,600 m elevation. Between 0015 and 1045, Fulle, Carniel, and Tom Pfeiffer (University of Arhus) observed intense activity, mostly in the NW sector of the BN. From 1230 onwards the explosions of the NW vent of the BN became increasingly stronger. Between 1400 and 1415 some of the largest explosions showered bombs over the whole main summit cone, and a scoria fall was noticed at the Torre del Filosofo mountain hut. At 1433 strong explosions of dark ash occurred at the NEC. The activity of the BN remained strong all afternoon. New lava spilled down the W flank, and at about 1700, the farthest flow front cut the Forestale road at about 1,800 m elevation, immediately S of Monte Nunziata (the main scoria cone of the 1843 eruption), and entered a patch of dense forest. Early the next morning the front of the main flow had extended ~200 m below the Forestale road, to ~1,730 m elevation; by 29 October the flow had stopped.
Vigorous lava jetting from the BN was observed at about 0600 on 29 October by Giovanni Sturiale (DSGUC). Activity observed by Sturiale, Behncke, Pfeiffer, and Vincenzo Polizotto (University of Catania) later that day included incandescent bombs from the NW vent, forceful ejections of dark gray ash and blocks from the SE vents, and vigorous Strombolian activity at the NW vent where the top of the new pyroclastic cone was projecting a few tens of meters above the crater rim. A variety of lava flows were seen on the W flank. Vigorous pulsating lava jetting from the NW vent was continuing at about 2230.
On 30 October, Pfeiffer revisited the summit area and reported that relatively mild Strombolian activity continued throughout the day. The entire Voragine area was covered with bombs, and the Voragine itself "had ceased to exist" because the 4 September 1999 crater was filled to within ~40 m of its rim. The active cone at the NW vent in the BN was very close to the location of the former "diaframma," of which no trace was visible. Emission of blocks and ash from the SE vents in the BN continued. During an overflight by Tanguy at about 1300, a bright red vent lay in the middle of the NW-trending BN fissure. Small lava flows were seen on the upper W slopes and a scoria cone was being built around the NW vent. NEC and SEC emitted a moderate white plume. After sunset a large red glow on the W flank indicated renewed strong effusive activity.
On the evening of 31 October, Scarpinati observed from Acireale that vigorous lava spattering had resumed at the ESE base of the SEC cone, while Strombolian activity at the BN was continuing. Scarpinati visited the area on 1 November and described voluminous lava flows running towards the Valle del Bove, and spattering from a group of hornitos. Effusive activity at the ESE base of the SEC cone showed a marked decrease after 2 November. On the 6th, Scarpinati observed trickles of lava flowing from these vents, but none thereafter.
On 1 November, Behncke and others climbed to the SW side of the BN where vigorous Strombolian activity continued from the NW vent, and occasional weak Strombolian bursts occurred from a vent farther S. Lava again extruded from below the uplifted block of 25 October. The southernmost of the three active lava lobes ran along the S margin of the lava field, cutting another 10 m of the summit road. Explosive activity at the NW vent produced jets up to 300 m high, but ~90 percent of the bombs fell back into the crater, enlarging the pyroclastic cone. On the evening of 3 November BN produced continuous jets of lava up to 300 m high, the last major eruptive episode of the sequence initiated on 5 October. Activity ceased after 0400 on 4 November, and after that the BN produced only weak intermittent Strombolian activity through about 15 November.
The volume of lava erupted from the BN between 17 October and 3 November is probably in the range of 15-20 x 106 m3. Tanguy estimated that the lava flows of 27 October alone amounted to ~5 x 10⁶ m3, and similar flows were erupted on at least three other occasions. This places the October-November activity from the BN among the largest summit eruptions recorded at Etna during the past 200 years. The BN, which had been a 400-m-diameter pit about 150 m deep in 1995, was completely filled, and a sizeable pyroclastic cone was built in its N part, partly burying the "diaframma," the former wall separating this crater from the Voragine. Post-eruption collapse and subsidence caused the partial destruction of this cone and the formation of two pits at the main NW and SE vents of the BN, and the lava-covered plateau filling the former crater subsided by several meters towards its center. On the W side of the main summit cone, the accumulation of new lava caused a considerable buildup of this flank. The Voragine was largely filled by pyroclastics from the NW vent of the BN, with only a shallow depression remaining in its central part.
Geologic Background. Mount Etna, towering above Catania on the island of Sicily, has one of the world's longest documented records of volcanism, dating back to 1500 BCE. Historical lava flows of basaltic composition cover much of the surface of this massive volcano, whose edifice is the highest and most voluminous in Italy. The Mongibello stratovolcano, truncated by several small calderas, was constructed during the late Pleistocene and Holocene over an older shield volcano. The most prominent morphological feature of Etna is the Valle del Bove, a 5 x 10 km caldera open to the east. Two styles of eruptive activity typically occur, sometimes simultaneously. Persistent explosive eruptions, sometimes with minor lava emissions, take place from one or more summit craters. Flank vents, typically with higher effusion rates, are less frequently active and originate from fissures that open progressively downward from near the summit (usually accompanied by Strombolian eruptions at the upper end). Cinder cones are commonly constructed over the vents of lower-flank lava flows. Lava flows extend to the foot of the volcano on all sides and have reached the sea over a broad area on the SE flank.
Information Contacts: Boris Behncke, Dipartimento di Scienze Geologiche, Palazzo delle Scienze, Università di Catania (DSGUC), Corso Italia 55, 95129 Catania, Italy; Roberto Carniel, Dipartimento di Georisorse e Territorio, Università di Udine, Via Cotonificio 114, 33100 Udine, Italy (URL: http://www.swisseduc.ch/stromboli/); Jürg Alean, Kantonsschule Zürcher Unterland, CH-8180 Bülach, Switzerland; Marco Fulle, Osservatorio Astronomico di Trieste, Via Tiepolo 11, 34131 Trieste, Italy; Jean-Claude Tanguy, Université Paris 6 and IPGP, Observatoire de Saint-Maur, 4, avenue de Neptune, 94107 Saint-Maur des Fossés Cedex, France.
False Reports (Unknown) — November 1999 Cite this Report
False Reports
Unknown
Unknown, Unknown; summit elev. m
All times are local (unless otherwise noted)
Turkey: UFO adherent claims new volcano in Sea of Marmara
Following the Ms 7.8 earthquake in Turkey on 17 August (BGVN 24:08) an Email message originating in Turkey was circulated, claiming that volcanic activity was observed coincident with the earthquake and suggesting a new (magmatic) volcano in the Sea of Marmara [40.683°N, 29.1°E]. For reasons outlined below, and in the absence of further evidence, editors of the Bulletin consider this a false report.
The report stated that fishermen near the village of Cinarcik, at the E end of the Sea of Marmara "saw the sea turned red with fireballs" shortly after the onset of the earthquake. They later found dead fish that appeared "fried." Their nets were "burned" while under water and contained samples of rocks alleged to look "magmatic."
No samples of the fish were preserved. A tectonic scientist in Istanbul speculated that hot water released by the earthquake from the many hot springs along the coast in that area may have killed some fish (although they would be boiled rather than fried).
The phenomenon called earthquake lights could explain the "fireballs" reportedly seen by the fishermen. Such effects have been reasonably established associated with large earthquakes, although their origin remains poorly understood. In addition to deformation-triggered piezoelectric effects, earthquake lights have sometimes been explained as due to the release of methane gas in areas of mass wasting (even under water). Omlin and others (1999), for example, found gas hydrate and methane releases associated with mud volcanoes in coastal submarine environments.
The astronomer and author Thomas Gold (Gold, 1998) has a website (Gold, 2000) where he presents a series of alleged quotes from witnesses of earthquakes. We include three such quotes here (along with Gold's dates, attributions, and other comments):
(A) Lima, 30 March 1828. "Water in the bay 'hissed as if hot iron was immersed in it,' bubbles and dead fish rose to the surface, and the anchor chain of HMS Volage was partially fused while lying in the mud on the bottom." (Attributed to Bagnold, 1829; the anchor chain is reported to be on display in the London Navy Museum.)
(B) Romania, 10 November 1940. ". . . a thick layer like a translucid gas above the surface of the soil . . . irregular gas fires . . . flames in rhythm with the movements of the soil . . . flashes like lightning from the floor to the summit of Mt Tampa . . . flames issuing from rocks, which crumbled, with flashes also issuing from non-wooded mountainsides." (Phrases used in eyewitness accounts collected by Demetrescu and Petrescu, 1941).
(C) Sungpan-Pingwu (China), 16, 22, and 23 August 1976. "From March of 1976, various large anomalies were observed over a broad region. . . . At the Wanchia commune of Chungching County, outbursts of natural gas from rock fissures ignited and were difficult to extinguish even by dumping dirt over the fissures. . . . Chu Chieh Cho, of the Provincial Seismological Bureau, related personally seeing a fireball 75 km from the epicenter on the night of 21 July while in the company of three professional seismologists."
Yalciner and others (1999) made a study of coastal areas along the Sea of Marmara after the Izmet earthquake. They found evidence for one or more tsunamis with maximum runups of 2.0-2.5 m. Preliminary modeling of the earthquake's response failed to reproduce the observed runups; the areas of maximum runup instead appeared to correspond most closely with several local mass-failure events. This observation together with the magnitude of the earthquake, and bottom soundings from marine geophysical teams, suggested mass wasting may have been fairly common on the floor of the Sea of Marmara.
Despite a wide range of poorly understood, dramatic processes associated with earthquakes (Izmet 1999 apparently included), there remains little evidence for volcanism around the time of the earthquake. The nearest Holocene volcano lies ~200 km SW of the report location. Neither Turkish geologists nor scientists from other countries in Turkey to study the 17 August earthquake reported any volcanism. The report said the fisherman found "magmatic" rocks; it is unlikely they would be familiar with this term.
The motivation and credibility of the report's originator, Erol Erkmen, are unknown. Certainly, the difficulty in translating from Turkish to English may have caused some problems in understanding. Erkmen is associated with a website devoted to reporting UFO activity in Turkey. Photographs of a "magmatic rock" sample were sent to the Bulletin, but they only showed dark rocks photographed devoid of a scale on a featureless background. The rocks shown did not appear to be vesicular or glassy. What was most significant to Bulletin editors was the report author's progressive reluctance to provide samples or encourage follow-up investigation with local scientists. Without the collaboration of trained scientists on the scene this report cannot be validated.
References. Omlin, A, Damm, E., Mienert, J., and Lukas, D., 1999, In-situ detection of methane releases adjacent to gas hydrate fields on the Norwegian margin: (Abstract) Fall AGU meeting 1999, Eos, American Geophysical Union.
Yalciner, A.C., Borrero, J., Kukano, U., Watts, P., Synolakis, C. E., and Imamura, F., 1999, Field survey of 1999 Izmit tsunami and modeling effort of new tsunami generation mechanism: (Abstract) Fall AGU meeting 1999, Eos, American Geophysical Union.
Gold, T., 1998, The deep hot biosphere: Springer Verlag, 256 p., ISBN: 0387985468.
Gold, T., 2000, Eye-witness accounts of several major earthquakes (URL: http://www.people.cornell.edu/ pages/tg21/eyewit.html).
Geologic Background. False or otherwise incorrect reports of volcanic activity.
Information Contacts: Erol Erkmen, Tuvpo Project Alp.
Gorely
Russia
52.5549°N, 158.0358°E; summit elev. 1799 m
All times are local (unless otherwise noted)
Shallow earthquake swarm in October
At 1832 on 22 October, a 10-minute series of shallow earthquakes was recorded at the volcano. The last Gorely eruptive activity occurred in 1980-81 (SEAN 05:07) and 1984-86 (SEAN 10:01).
Geologic Background. Gorely volcano consists of five small overlapping stratovolcanoes constructed along a WNW-ESE line within a large 9 x 13 km caldera. The caldera formed about 38,000-40,000 years ago accompanied by the eruption of about 100 km3 of tephra. The massive complex includes about 40 cinder cones, some of which contain acid or freshwater crater lakes; three major rift zones cut the complex. Another Holocene stratovolcano is located on the SW flank. Activity during the Holocene was characterized by frequent mild-to-moderate explosive eruptions along with a half dozen episodes of major lava extrusion. Early Holocene explosive activity, along with lava flows filled in much of the caldera. Quiescent periods became longer between 6,000 and 2,000 years ago, after which the activity was mainly explosive. About 600-650 years ago intermittent strong explosions and lava flow effusion accompanied frequent eruptions. Historical eruptions have consisted of moderate Vulcanian and phreatic explosions.
Information Contacts: Olga Chubarova, Kamchatka Volcanic Eruptions Response Team (KVERT), Institute of Volcanic Geology and Geochemistry, Piip Ave. 9, Petropavlovsk-Kamchatsky, 683006, Russia; Tom Miller, Alaska Volcano Observatory (AVO), a cooperative program of a) U.S. Geological Survey, 4200 University Drive, Anchorage, AK 99508-4667, USA (URL: http://www.avo.alaska.edu/), b) Geophysical Institute, University of Alaska, PO Box 757320, Fairbanks, AK 99775-7320, USA, and c) Alaska Division of Geological & Geophysical Surveys, 794 University Ave., Suite 200, Fairbanks, AK 99709, USA.
Guagua Pichincha (Ecuador) — November 1999 Cite this Report
Guagua Pichincha
Ecuador
0.171°S, 78.598°W; summit elev. 4784 m
All times are local (unless otherwise noted)
Dome growth and explosive eruptions; dramatic increase in LP earthquakes
This report covers 22 November through 24 December 1999, an interval when long-period earthquakes increased precipitously. The dome in the caldera's western sector continued to produce explosions, lava extrusions, and rockfalls. November 1999 marked the 32nd month since the unrest began; occasional ashfalls and associated disruptions (minor ashfall, airport closures, hundreds of evacuated refugees) have had a significant impact on Quito residents.
Seismicity. Earthquake hypocenter maps appearing on the Geophysical Institute's website showed the vast majority of earthquakes clustering beneath the crater area; in some cases these clusters also spread W with gradually decreasing density. The website also included a diagrammatic cross section through the crater (figure 20) illustrating the inferred plumbing system, including some typical depths for various kinds of earthquakes. On the inset, the diagram shows an inferred shallow aquifer within the edifice that intersects the active conduit and presumably contributes to the repeated phreatic eruptions.
During November 1999 phreatic explosions took place 41 times. Many months during the crisis had fewer than 20 explosions per month, and the November 1999 value was the second highest of the crisis. The highest monthly total occurred during October 1999, a count of 53 explosions.
Seismicity had been escalating rapidly during September-October 1999 (see plot, BGVN 24:10). A precipitous climb in long-period (LP) earthquakes continued during November, reaching dramatic levels (table 7); in September long-period earthquakes occurred ~12,000 times, in October ~15,000 times, and in November ~44,000 times. For another comparison, LP counts earlier in the crisis (July 1998-August 1999) generally remained below 200 earthquakes per month. Thus, compared to this broader interval, the November 1999 count of LP events reflected more than a 200-fold increase. In addition, November's LP earthquakes exceeded the sum for LP events during the previous 16 months.
Table 7. Monthly earthquake counts at Guagua Pichincha representing two key time intervals. The "upper threshold" refers to the highest values registered during the earlier parts of the crisis, July 1998-August 1999. The next three columns indicate the monthly counts during September-November 1999, an interval with the highest numbers of earthquakes yet seen during the current crisis. Courtesy of the Geophysical Institute.
| Earthquake Type |
Earlier upper threshold |
Sep 1999 |
Oct 1999 |
Nov 1999 |
| Long-period (LP) |
200 |
11,972 |
15,075 |
43,738 |
| Multi-phase (MP) |
2,099 |
130 |
15,024 |
6,182 |
| Volcano-tectonic (VT) |
160 |
1,331 |
1,701 |
104 |
| Sum (LP + MP) |
12,102 |
30,099 |
49,920 |
-- |
A change in the relative numbers of events appears to have occurred beginning in September 1999. From then on, LP events occurred with either similar abundance to MP events, or in some cases LP events became dominant. The total of MP plus LP events (table 2) continued to increase through November 1999.
On the other hand, the escalation in Multiphase (MP) and volcano-tectonic (VT) earthquakes has diminished since the anomalously high values seen in September and October 1999 (table 7, and BGVN 24:10). Compared to earlier in this crisis, MP earthquake counts underwent a sudden peak in October at ~15,000 events; in November there were ~6,000 MP events. VT earthquake counts underwent a less pronounced peak in September and October with ~1,300 and ~1,700 respective events. November VT earthquakes totaled only 104, a value still within the upper end of the monthly counts seen for the bulk of the crisis.
As a result of ongoing dome growth, rockfall-associated seismicity increased. The highest days in September-November had daily LP counts of 250-300 per day. Peaks in dome-growth events approached or exceeded 100 events/day for sustained intervals both during early October and late November 1999.
Daily observations. Tens of daily phreatic explosions were common. Counted seismically, these events appeared so numerous that generally only large ones received much mention in the daily reports (summarized in table 8). On many days visibility into the caldera remained limited because of clouds and fog.
Table 8. Summary of the more important explosions reported at Guagua Pichincha during 22 November-22 December 1999. The explosions discussed here were selected by choosing the Institute's daily reports where the seismically determined parameter of reduced displacement (RD) was reported. Courtesy of the Geophysical Institute.
| Date |
Reduced displacement (RD) and related activity and impacts |
| 24 Nov 1999 |
Two important explosions, the first of which at 0328 led to ashfall in N Quito visible on clean surfaces such as the exteriors of vehicles. The second explosion took place at 1233 with a RD of 17.7 cm2. The second sent a column to 10 km altitude blowing E (towards Quito). Ash fell (see text). The 1233 explosion vented from the W caldera margin; the associated seismic signal was shallow, 0.9 km. An additional four disturbances occurred between 0840 and 0906 associated with collapse of rocks and consequent emissions in the new dome's W sector; the plumes related to these events rose ~2 km. Still other explosions noted this day had variable RDs: 12.9, 11.8, 2.4, and 1.0 cm2. |
| 25 Nov 1999 |
Ash fell on N Quito after explosions at 0528 and 2027 with respective RDs of 15 and 25 cm2. |
| 26 Nov 1999 |
An emission with RD of 4.6 cm2 issued an ash-laden column that rose 2 km and dispersed to the SE. |
| 27 Nov 1999 |
An emission at 2114 had a RD of 19.6 cm2 and sent an ash column more than 2 km upward; it blew to the W and SW. Heavy cloud cover made it hard to observe the plume, however. Some ash fall was reported in Quito. |
| 29 Nov 1999 |
An eruption at 1134 had a RD of 18.9 cm2 and sent an ash column to ~8 km. The next day field crews found block-and-ash flows and mud flows deposited by this eruption on the W flank in the Rio Cristal. |
| 02 Dec 1999 |
Two series of explosions took place, the first during 1723-1800 and the second, 2013-2200. An explosion at 2200 had the larger RD, 27.2 cm2. Although clouds obscured the crater, these explosions were thought to have been very destructive to the new dome. |
| 09 Dec 1999 |
An eruption with RD of 12 cm2 was termed small; it followed a 10.5-hour interval with 15 eruption signals. |
| 10 Dec 1999 |
An explosion with a RD of 26.6 cm2 and subsequent discovery of new pyroclastic flow deposits along the Rio Cristal. Later, at 1713, an explosion with RD of 18 cm2 sent a column to ~7.6 km altitude that was blown to the W and SW. |
| 11 Dec 1999 |
Three RDs reported, 15, 16, and 12 cm2, produced by explosions in the early morning hours. Portions of the collapsed dome descended the Rio Cristal and there was some fracturing within the crater's older and newer domes. |
| 14 Dec 1999 |
Several small explosions with RDs under 6 cm2. Rockfall seismic signals were common. |
| 15-16 Dec 1999 |
Comparatively low-energy explosions with RDs under 4 cm2. |
| 17 Dec 1999 |
Three morning explosions after 0730 with successive RDs of 15.5, 23, and 20 cm2. A white mushroom cloud rose to ~8 km altitude above the volcano. Beginning about 1000 a light rain of ash fell on Quito, particularly the north and central parts of the city. The airport shut down in the morning but reopened after 1310. On the W flank mudflows had been spotted carrying blocks up to 3 m in diameter. An additional press release noted a large eruption at 1504 with an RD of 24 cm2 and a resulting column to 8 km above the summit. This was followed by a larger eruption at 1627 with an RD of 28 cm2. By a small margin, this ranked as the largest RD of the reporting interval. After the former eruption close to 14 hours of continuous tremor began. Available wind data around the time of these eruptions suggested that some ash would fall on the Capital, and the next day's report noted light ashfall (thickness unstated but probably under a few millimeters) of fine pumiceous ash in Quito's northern and central zones; on the flanks of the edifice there were tephra clasts of 2-5 cm diameter. |
| 19 Dec 1999 |
Minor explosions with RDs under 3 cm2. |
Two explosions on 24 November resulted in significant ashfall on inhabited areas. The latter explosion, around noon, sent a plume to 10 km altitude. Fine ash fell in areas N of Quito, blanketing zones that included the airport, which closed. The ash also affected numerous settlements within a few tens of kilometers N to NE of the summit (including Carcelén, 14.5 km NE; Cotocollao, 9.4 km N; Quito Tenis, 13.5 km NE; and at locations not found on available maps, at la Roldós, La Carolina, Mariscal, and el Ejido). The greatest thicknesses of ash reportedly fell between Jipijapa (unlocated) and la Mariana de Jesús (20.9 km NE).
More events took place the next day, and in the morning ashfalls were reported in Quito's northwestern neighborhoods. The ash lingered in the air well into the next day as a result of disturbances by traffic and cleanup.
An inspection of the W flank on 24 November revealed that during the past week the Cristal river had been inundated by lahars 400 m wide and 10 m deep, although the point of measurement was at an unstated distance from the summit. They were still hot, at least in places, and contained some component of pyroclastic flows bearing carbonized tree-trunks in addition to blocks from the dome. On 30 November observers visiting the Cristal river noted a 1-day-old block-and-ashflow deposit. In the same sector on 8 and 10 December field crews again linked observed zones of burned and singed leaves to probable pyroclastic flows.
On 17 December a white mushroom cloud preceded a dark, ash-bearing one that rose 8-9 km above the volcano. On 18 December, light ash again fell on Quito landing mainly in its central and northern zones. Portions of the cone's flanks received pumice 2-5 cm in diameter. Strong sulfur smells were noted by S-flank residents in Lloa.
An overflight on 21 December enabled the dome height to be estimated at 50-100 m from the base of the caldera. On the dome's W side observers identified a spine, possibly the same one as seen in November. Dark coffee-colored rocks were observed along the E margin of the new dome.
GOES-8 satellite imagery captured plumes on several occasions. For example, it recorded an explosion at about 1140 on 29 November. NOAA analysts estimated the ash plume rose to an altitude of 10-12 km and drifted S toward Tungurahua volcano (which was also producing a faint ash plume). The same ash plume was noted using the "split window" technique, wherein infrared channel 5 (13 µm) is subtracted from infrared channel 4 (11 µm), which often discriminates airborne silicates such as dust and volcanic ash from other features in an image.
During comparatively passive intervals with adequate visibility, daily reports typically described several distinct plumes emitted from the following sources: a) the "aligned" fumaroles (in Spanish, "las alineadas"), b) the fumaroles on the caldera's W border near the head of the Cristal river, c) fumaroles escaping from the 1981 crater, and d) emissions from the top of the new dome. Fumaroles designated as "a" and "b" had plumes that typically reached several hundred meters from base to top; "c" fumaroles typically had plumes that reached tens of meter from base to top.
Radiosondes. According to the Washington Volcanic Ash Advisory Center at NOAA's Satellite Analysis Branch (SAB), during late 1999 and early 2000 authorities in Quito have been launching weather balloons twice a day. The resulting upper atmospheric air movements generally appear on the Geophysical Institute's website. Because these data have been occasionally internally inconsistent in azimuth, they have not yet been incorporated into the modeled data nor the plume trajectory modeling. The SAB has repeatedly seen highly variable winds in the region.
News reports. A brief review of news reports during the past few months revealed numerous stories, some of which were listed on an Ecuadorian Embassy website. ABC News discussed the effects on the explosions of 5-7 October (BGVN 24:09); previously unmentioned in the Bulletin was that the explosion of 5 October caused respiratory problems for many area residents and the death of one man. Four others were injured clearing ash from the roofs of their homes. Quito's Marshal Sucre airport closed for multiple days during the crisis. This not only causes travel problems, but inevitably some commercial aircraft that remain on the ground require cleaning to regain flight worthiness. ABC News also reported that the 24-26 November eruptions that forced one closure of the airport had also caused the Ministry of Education to shut down schools for a few days.
A series of 17-22 November articles in the online Diario Hoy newspaper discussed conditions confronted by 500 refugees from Lloa and neighboring areas living in the largest of several tent cities in a pass above their town. The tent city's amenities included electrical power, water, bathroom facilities, and trash collection; tents came equipped with stoves and beds. The city also provided medical and dental services. Other tent cities provided refuge for ~300 more people. Guards limited access into Lloa, and the town itself was patrolled by the military.
Hoy Digital reported that Quito's mayor, Roque Sevilla, delivered Motorola radios to each one of the leaders of the 35 neighborhoods located on the volcano's slopes as a means of maintaining constant communication with the emergency system locally referred to as "911." The article also mentioned a project developed with the support of the German embassy and the firm Siemens that consists of a system of warning sirens intended to alert citizens of impending danger.
Geologic Background. Guagua Pichincha and the older Pleistocene Rucu Pichincha stratovolcanoes form a broad volcanic massif that rises immediately W of Ecuador's capital city, Quito. A lava dome grew at the head of a 6-km-wide scarp formed during a late-Pleistocene slope failure ~50,000 years ago. Subsequent late-Pleistocene and Holocene eruptions from the central vent consisted of explosive activity with pyroclastic flows accompanied by periodic growth and destruction of the lava dome. Many minor eruptions have been recorded since the mid-1500's; the largest took place in 1660, when ash fell over a 1,000 km radius and accumulated to 30 cm depth in Quito. Pyroclastic flows and surges also occurred, primarily to then W, and affected agricultural activity.
Information Contacts: Geophysical Institute (Instituto Geofísico), Escuela Politécnica Nacional, Apartado 17-01-2759, Quito, Ecuador; Embassy of Ecuador, 2535 15th Street NW, Washington, D.C. 20009 USA (URL: http://www.ecuador.org/); Washington Volcanic Ash Advisory Center, NOAA Satellite Services Division, NESDIS E/SP23, NOAA Science Center, Room 401, 5200 Auth Road, Camp Springs, MD 20746, USA (URL: http://www.ssd.noaa.gov/); ABC News (URL: http://abcnews.go.com/); Diario Hoy, Ecuador (URL: http://www.hoy.com.ec/).
Karymsky (Russia) — November 1999 Cite this Report
Karymsky
Russia
54.049°N, 159.443°E; summit elev. 1513 m
All times are local (unless otherwise noted)
Eruptive activity gradually decreases, then stops in late December
The low-level strombolian eruptive activity that has characterized the volcano for more than three years gradually decreased after August until seismicity returned to background levels, and by late December there were no explosions. The eruption began on 2 January 1996 (BGVN 21:01) following an eruption from the Akademia Nauk caldera lake the previous day.
During the week of 9-15 August, steam-and-ash plumes were observed in satellite imagery extending as far as 75 km downwind at an altitude of 500-1,000 m above the crater. The number of gas-and-ash explosions was still more than 300/day the next week, with the plume rising 300-600 m above the volcano. During the last week of August through 5 September, the number of explosions was more than 75/day, with plumes to heights of 300-1,000 m above the volcano. Visual observations by KVERT staff on 1 and 5 September confirmed that explosive activity occurred every 10-20 minutes.
The number of gas-and-ash explosions decreased from 130 on 6 September to 80 on the 12th, but the plumes continued to rise 300-1,000 m above the volcano. That rate continued until the week of 20-26 September, when the average number of daily explosions decreased to 60. The number of explosions was 60-75/day during the next two-week reporting periods, through 10 October. During the week of 11-17 October the explosion rate decreased once again, to 20-35/day, although plume heights remained at 300-1,000 m. The number of explosions increased slightly, to 20-50/day, during 5-18 November, but then dropped the following week to 10-20/day and then only 2-5/day. During the week ending on 2 December, gas and ash explosions numbered 1-10/day.
The nearest seismic station (KRY) was out of order during 4-18 December. According to the regional seismic network, no strong events occurred during that period. The station was restored to operation on 19 December. As of 30 December seismicity at the volcano had decreased to background levels. About 1-2 local earthquakes occur every day and the volcano has returned to its normal state. At the end of December seismicity was at background levels of about 1-2 local earthquakes/day.
Geologic Background. Karymsky, the most active volcano of Kamchatka's eastern volcanic zone, is a symmetrical stratovolcano constructed within a 5-km-wide caldera that formed during the early Holocene. The caldera cuts the south side of the Pleistocene Dvor volcano and is located outside the north margin of the large mid-Pleistocene Polovinka caldera, which contains the smaller Akademia Nauk and Odnoboky calderas. Most seismicity preceding Karymsky eruptions originated beneath Akademia Nauk caldera, located immediately south. The caldera enclosing Karymsky formed about 7600-7700 radiocarbon years ago; construction of the stratovolcano began about 2000 years later. The latest eruptive period began about 500 years ago, following a 2300-year quiescence. Much of the cone is mantled by lava flows less than 200 years old. Historical eruptions have been vulcanian or vulcanian-strombolian with moderate explosive activity and occasional lava flows from the summit crater.
Information Contacts: Olga Chubarova, Kamchatka Volcanic Eruptions Response Team (KVERT), Institute of Volcanic Geology and Geochemistry, Piip Ave. 9, Petropavlovsk-Kamchatsky, 683006, Russia; Tom Miller, Alaska Volcano Observatory (AVO), a cooperative program of a) U.S. Geological Survey, 4200 University Drive, Anchorage, AK 99508-4667, USA (URL: http://www.avo.alaska.edu/), b) Geophysical Institute, University of Alaska, PO Box 757320, Fairbanks, AK 99775-7320, USA, and c) Alaska Division of Geological & Geophysical Surveys, 794 University Ave., Suite 200, Fairbanks, AK 99709, USA.
Klyuchevskoy (Russia) — November 1999 Cite this Report
Klyuchevskoy
Russia
56.056°N, 160.642°E; summit elev. 4754 m
All times are local (unless otherwise noted)
Variable fumarolic plumes and episodes of increased seismicity
Highly variable activity continued throughout August-December 1999. Typical daily activity observed during clear weather consisted of a small fumarolic plume rising 50-200 m above the crater and extending a few kilometers downwind, usually E or SE. Seismicity was generally at background levels, consisting of shallow earthquakes with some periods of tremor. However, higher gas-and-steam plumes were frequently seen and two episodes of increased seismicity were detected. The volcano was frequently obscured by clouds.
Tremors and shallow earthquakes were registered during 9-15 August. Typical small fumarolic plumes were seen on 9-10, 13-14, 16, 21-26, and 28 August, and 2, 4-5, 7-8, and 12 September. On 30-31 August a gas-and-steam plume rose 500-1,500 m above the crater. On 15 September a gas-and-steam plume rose 600 m, and on 16 September the plume rose 200 m extending 5 km E. Mainly shallow earthquakes were registered from 19 September through 24 October. Gas-and-steam plumes rose up to 500 m during 19-26 and 28 September, and 3, 5, 7, 11, 20-21, and 24 October, extending as far as 5 km E or SE. During the afternoon of 15 October there was a 6.5-hour-long series of shallow earthquakes. On 22-23 October a fumarolic plume rose 700-1,000 m and extended 5-20 km to the E and SE.
Seismicity, consisting of shallow earthquakes and tremor, was above background levels during much of the period from 25 October until 17 December. Only small fumarolic plumes 50-300 m high were seen on 25 and 27 October, but on 26 October a plume rose 1,000 m above the volcano and extended 40 km NE. Small fumarolic plumes to 300 m extending 5 km SE were seen on 29-31 October and 4 November, with smaller typical plumes on 5, 7-8, and 10-11 November. Shallow earthquakes and volcanic tremor were recorded especially on 15, 21, and 25 November, when a gas-and-steam plume rose 1,000 m and extended more than 7 km NE. Typical smaller fumarolic plumes were seen on 12, 16, 18-19, 22-24, 26, and 28 November, and on 1, 3, and 10 December. On 29 November and 1 December gas-and-steam plumes rose 1,500 m above the volcano and extended more than 20 km SE. A fumarolic plume on 8 December rose 2,500 m.
During December 17-29 seismicity at the volcano returned to background levels. Small plumes were recorded on 17, 19-21, 25, and 28 December. Another plume on the 23rd rose 700 m.
Geologic Background. Klyuchevskoy is the highest and most active volcano on the Kamchatka Peninsula. Since its origin about 6,000 years ago, this symmetrical, basaltic stratovolcano has produced frequent moderate-volume explosive and effusive eruptions without major periods of inactivity. It rises above a saddle NE of Kamen volcano and lies SE of the broad Ushkovsky massif. More than 100 flank eruptions have occurred during approximately the past 3,000 years, with most lateral craters and cones occurring along radial fissures between the unconfined NE-to-SE flanks of the conical volcano between 500 and 3,600 m elevation. Eruptions recorded since the late 17th century have resulted in frequent changes to the morphology of the 700-m-wide summit crater. These eruptions over the past 400 years have originated primarily from the summit crater, but have also included numerous major explosive and effusive eruptions from flank craters.
Information Contacts: Olga Chubarova, Kamchatka Volcanic Eruptions Response Team (KVERT), Institute of Volcanic Geology and Geochemistry, Piip Ave. 9, Petropavlovsk-Kamchatsky, 683006, Russia; Tom Miller, Alaska Volcano Observatory (AVO), a cooperative program of a) U.S. Geological Survey, 4200 University Drive, Anchorage, AK 99508-4667, USA (URL: http://www.avo.alaska.edu/), b) Geophysical Institute, University of Alaska, PO Box 757320, Fairbanks, AK 99775-7320, USA, and c) Alaska Division of Geological & Geophysical Surveys, 794 University Ave., Suite 200, Fairbanks, AK 99709, USA.
Ol Doinyo Lengai (Tanzania) — November 1999 Cite this Report
Ol Doinyo Lengai
Tanzania
2.764°S, 35.914°E; summit elev. 2962 m
All times are local (unless otherwise noted)
Very active hornito in the N part of the crater
The following report resulted from a visit to the crater of Ol Doinyo Lengai during 23 July-7 August. Prior to the visit and according to a local source (Burra Ami Gadiye), lava breaching the NW crater rim on 18 July flowed down the flank of the volcano and was visible at night from Ngare Sero village, ~10 km N. When the visitor's crater observations began at 1100 on 23 July, this lava flow from the NW crater rim breach had cooled and was becoming white from weathering, but it was clearly the most recent lava in the crater. Its source was hornito T40 (figure 63) based on comparisons of 1998 and 1999 photographs by C. Weber. From 2 to 6 August, an intermittent lava lake 3 m in diameter also existed inside T37N1 at a depth of 20 m.
The conical part of T40 was 85 m around at its base and 12 m tall. The N side of the hornito's cone was walled by a low overhanging rim and its S side was covered by a high half-dome. The hornito also included a large, 6-m-deep crater. A small lava pond at the N end of the crater ejected 16-20 spatters per minute through 24-25 July. Twice on 26 July parts of the half-dome and the cone's summit collapsed into the crater.
During 27-28 July lava gradually rose inside the crater of T40 and formed a 4 x 6 m lake and several ponds. By 29 July the lake was ~12 m long and 7 m wide. In a pattern repeating every 15-20 minutes a surge of fresh lava boiled up from the NE corner of the lake, raising the level by 0.5 m. Lava flowed out of the lake to the NW through a subterranean tunnel but did not escape onto the main crater floor.
Although this pattern persisted for some time, at 1400 on 30 July an abrupt increase in activity produced high lava spatters that fell on the N flank of T40. Fresh lava swept into the lake from the N like breaking ocean waves and strong ground tremor shook the N flank of the cone. This activity continued through 31 July, when the lake rose to ~60 cm below the lowest point along the vent rim. Spatter gradually built up the N wall of the crater by more than 1 m and formed a large hood overhanging the area of most intense degassing.
At 0045 on 1 August, a hole developed in the hornito's new crater wall. Lava escaped and moved N as short aa flows up to 60 cm thick. Lava ceased to escape by 0600 but similar eruptions recurred through 1300 on 2 August. Intense degassing later destroyed the hood covering the N part of the lake, but splashing built a thick covering of spatter on the N flank of the cone and reconstructed the hood. Around 0300 on 3 August a new vent opened low on the NW flank of T40 where the strongest tremor had been during the previous few days. An aa lava flow 20 cm thick moved 73 m NW. By 0800 the eruption had ended and the lake level dropped by 2 m. By 0600 on 4 August the lake temporarily disappeared, leaving a solid crater floor 2.5 m below the rim. Lava reappeared about noon but only occupied a 2 m2 area at the crater's N end; the lava frequently overflowed from the pond and produced many small lava flows that covered most of the hornito's crater floor. At 2345 solid lava covering the new vent on the NW flank of T40 blew off; explosions occurred at a rate of 18-20/minute and constructed a new spatter cone. During repose periods, the activity shifted to the lava lake, creating high spatters that reached the summit of T40. After explosions ended at 0800 on 5 August, the new cone was 3 m tall with a circular summit vent 60 cm in diameter. Lava was bubbling in the vent at a depth of 1 m (figure 64).
At 2000 on 5 August pahoehoe lava flowed rapidly across the NE rim of T40 and moved E for 55 m. At 0645 the next morning, more lava escaped the lake through a hole in the NE rim of T40 and covered much of the previous night's flow. Beginning at 1800 on 6 August the lake repeatedly overflowed the hornito's NE rim, later overflowing the NW rim. Around 0400 on 7 August a hole that opened 1 m below the NE rim of T40 gradually enlarged and drained ~60 m3 of lava from the lake forming an open NE-directed lava channel 60 cm wide. By 0800 on 7 August the hole was 1 m high and 0.5 m wide. When observations ended at 0815, lava was nearing the NE crater wall and subsequent reporting noted that lava never reached the breach in the E crater rim, stopping short by 70 m. It was later learned from Guillaume Delpech, a French geology student, that during his visit to T40 on 9 August, the lava lake level inside the hornito varied between 3 and 4 m below its rim. No lava flowed outside of T40 and the spatter cone was inactive.
Christoph Weber made temperature measurements using a digital thermometer (TM 914C with a stab feeler standard K-type) during the crater visit (table 2). The instrument was used in the 0-1200 Celsius mode, taking readings by inserting the feeler 15 cm into the lava. Calibration was made by the Delta-T method: values are ± 6°C in the 0-750°C range. Most values shown were maxima recorded from a series of at least five repeat measurements.
Table 2. Temperature estimates from 60 measurements at Ol Doinyo Lengai made during 23 July-7 August 1999. See text for method used. Courtesy of Christoph Weber.
| Date |
Location |
Estimated temperature (°C) |
| 28 Aug 1999 |
T40 lava lake |
529 |
| 01 Sep 1999 |
Pahoehoe (in open channel, 3 m below the lava lake) |
519 |
| 01 Sep 1999 |
End of a 60-cm-thick aa flow |
516 |
| 28 Aug 1999 |
Fumarole near base of T49 |
82 |
Activity during early September 1999. Bruno Hermier visited the crater in early September and made the following observations. On the afternoon of 6 September only the northernmost hornito (T40) seemed to be active. A lava flow was estimated to be about two days old. Two E-W fissures cross the western half of the crater emitting fumaroles that deposit sulfur. The fissures are perpendicular to the N-S trend of the volcano and radiate from the hornitos. On 7 September at 0900 some spatter came from the top of the 7-m-high T40 hornito. The spatter became larger, creating a pond of lava visible at the top of the hornito. It began to overflow on all sides of the hornito for 15 minutes before the lava level dropped. This cycle repeated until 1300, after which only a low hissing noise was perceptible. Interestingly, a foam filled the hornito. The spatter that splashed on the sides of the chimney and the fluid that overflowed the rim instantaneously lost 75 percent of their volume as gas exsolved. The remaining 25 percent cooled or flowed as black carbonatite. The extremely fluid flows (consistency of oil or hot tar) were only a few centimeters thick, but extended 50-100 m. No additional activity was seen through the evening of 9 September.
Geologic Background. The symmetrical Ol Doinyo Lengai is the only volcano known to have erupted carbonatite tephras and lavas in historical time. The prominent stratovolcano, known to the Maasai as "The Mountain of God," rises abruptly above the broad plain south of Lake Natron in the Gregory Rift Valley. The cone-building stage ended about 15,000 years ago and was followed by periodic ejection of natrocarbonatitic and nephelinite tephra during the Holocene. Historical eruptions have consisted of smaller tephra ejections and emission of numerous natrocarbonatitic lava flows on the floor of the summit crater and occasionally down the upper flanks. The depth and morphology of the northern crater have changed dramatically during the course of historical eruptions, ranging from steep crater walls about 200 m deep in the mid-20th century to shallow platforms mostly filling the crater. Long-term lava effusion in the summit crater beginning in 1983 had by the turn of the century mostly filled the northern crater; by late 1998 lava had begun overflowing the crater rim.
Information Contacts: Frederick Belton, 3555 Philsdale Ave., Memphis, TN 38111 USA (URL: http://oldoinyolengai.pbworks.com/); Celia Nyamweru, Department of Anthropology, St. Lawrence University, Canton, NY 13617 USA (URL: http://blogs.stlawu.edu/lengai/); Christoph Weber, Friesenstrasse 20, 42107 Wuppertal, Germany; Bruno Hermier, France.
Cerro Negro (Nicaragua) — November 1999 Cite this Report
Cerro Negro
Nicaragua
12.506°N, 86.702°W; summit elev. 728 m
All times are local (unless otherwise noted)
Explosive eruptions starting on 5 August
During the night of 4-5 August 1999, strong seismic activity occurred near Cerro Negro and the earthquakes with magnitudes up to 4.8 were felt throughout NW Nicaragua, especially in the big cities of León (20 km away, where many people could not sleep because of the seismic events) and Chinandega (40 km away). The strongest event was even felt 70 km away in Managua. The Nicaraguan seismic network recorded hundreds of earthquakes and strong seismic tremor at the seismic station at the volcano and at the MIRAMAR station (7 km away).
Three notices were received from the GOES alarm network concerning Cerro Negro. Distinct hot spots, indicating small plumes over the volcano, were detected on infrared satellite imagery at 0055, 0155, and 0235 on 5 August.
Explosive eruptions began at about 1000 on 5 August 1999. Ash clouds at heights of about 7,000 m were reported by aircraft. Ashfall was reported from some places SW of the volcano. The activity issued from four new vents outside the main crater, very near to the parasitic crater Cristo Rey, on the S flank of Cerro Negro. The vents formed cones ~40 m high during the day.
Wilfried Strauch visited the volcano that afternoon and observed explosions every few seconds, sometimes generating lava fountains ~300 m high. The activity alternated among the different new cones. No significant amounts of volcanic ash were emitted at this time. Local residents ~1 km from the volcano reported that seismicity was extremely strong during the night. Fissures appeared in the soil near their houses, releasing vapor.
INETER informed Civil Defense and other institutions on the night of 4 August about the seismic activity. Civil Defense officers visited the volcano early in the morning of 5 August, but could not yet detect signs of volcanic activity. When they got the information about the beginning of the eruption they proceeded with the evacuation of nearby villages, involving several hundreds of people.
Volcanic ash advisory statements on 6 August indicated that well-defined hot spots were still occasionally visible on GOES-8 multi-spectral imagery through 1615. No ash was visible in the imagery at that time, and thick clouds moved over the area later in the day. Imagery obtained under clear skies at 1015 on 7 August revealed no ash or hot spot.
Geologic Background. Nicaragua's youngest volcano, Cerro Negro, was created following an eruption that began in April 1850 about 2 km NW of the summit of Las Pilas volcano. It is the largest, southernmost, and most recent of a group of four youthful cinder cones constructed along a NNW-SSE-trending line in the central Marrabios Range. Strombolian-to-subplinian eruptions at intervals of a few years to several decades have constructed a roughly 250-m-high basaltic cone and an associated lava field constrained by topography to extend primarily NE and SW. Cone and crater morphology have varied significantly during its short eruptive history. Although it lies in a relatively unpopulated area, occasional heavy ashfalls have damaged crops and buildings.
Information Contacts: Wilfried Strauch, Instituto Nicaraguense de Estudios Territoriales (INETER), Division of Geophysics, Apartado 2110, Managua, Nicaragua; Benjamin van Wyk de Vries, Magmas et volcans Observatoire du Physique du Globe, Departement des Sciences de la Terre, Université Blaise Pascal, 5 Rue Kessler, 63038 Clermont-Ferrand, France (URL: http://modis.higp.hawaii.edu/); Washington Volcanic Ash Advisory Center, NOAA Satellite Services Division, NESDIS E/SP23, NOAA Science Center, Room 401, 5200 Auth Road, Camp Springs, MD 20746, USA (URL: http://www.ssd.noaa.gov/).
San Salvador (El Salvador) — November 1999 Cite this Report
San Salvador
El Salvador
13.734°N, 89.294°W; summit elev. 1893 m
All times are local (unless otherwise noted)
Minor volcano-tectonic seismicity detected
In August, several stations of the seismic network at San Salvador volcano recorded a few volcano-tectonic events 5 km from the crater. Local scientists investigated a fumarolic field, but nothing abnormal was found.
Geologic Background. The massive compound San Salvador volcano dominates the landscape W of El Salvador's capital city of San Salvador. The dominantly andesitic Boquerón stratovolcano has grown within a 6-km-wide caldera whose rim is partially exposed at Picacho and Jabalí peaks, which themselves were formed by collapse of an older edifice about 40,000 years ago. The summit of Boquerón is truncated by a steep-walled crater 1.5 km wide and ~500 m deep that formed during a major eruption around 800 years ago. It contained a crater lake prior to an eruption during 1917 that formed a small cinder cone on the crater floor; a major N-flank lava flow also erupted in this year. Three fracture zones that extend beyond the base of the volcano have been the locus for numerous flank eruptions, including two that formed maars on the WNW and SE sides. Most of the four historical eruptions recorded since the 16th century have originated from flank vents, including two in the 17th century from the NW-flank cone of El Playón, during which explosions and a lava flow damaged inhabited areas.
Information Contacts: Douglas Hernandez, Centro de Investigaciones Geotecnicas, Apartado Postal 109, San Salvador, El Salvador.
Sheveluch (Russia) — November 1999 Cite this Report
Sheveluch
Russia
56.653°N, 161.36°E; summit elev. 3283 m
All times are local (unless otherwise noted)
Intermittent explosions from the dome; fumarolic plumes
The volcano was frequently obscured by clouds during August-December 1999, but small fumarolic gas-and-steam plumes rising 50-200 m were often observed during clear weather. Higher fumarolic plumes were seen on three days in late November-early December. Four short explosions generated ash-bearing plumes during August-December that were confirmed visually. As many as five additional dome explosions were identified seismically.
On 11 and 13-14 August, fumarolic plumes rose 50-200 m above the crater. On 15 August a 5-minute ash explosion sent a plume to 800 m above the crater. On 17 and 23 August, fumarolic plumes rose 200-600 m; on the 30th a similar plume rose 1,200 m. On 4-5, 12, and 23-25 September, fumarolic plumes rose 50-200 m, extending 5 km E or SE. Similar plumes were seen on 7, 11, 23, and 25-26 October. On the morning of 27 October a short-lived ash explosion was observed, with an accompanying 20-minute burst of seismic activity. According to a Japanese satellite image taken about 3.5 hours later, an ash plume extended NE at an altitude of 6,900 m. Overall seismicity remained about at background levels until the end of October.
Seismicity was above background levels in late October through mid-November, when the hazard status was increased to "Yellow." On the morning of 31 October a 20-minute series of shallow earthquakes and tremor may have been associated with explosions on the dome; however, at daylight only a small fumarolic plume was seen. According to visual reports from Klyuchi town, on the late morning of 1 November a short explosive eruption sent an ash plume to an altitude of 5.5-6.0 km and extended S; an accompanying increase in seismicity occurred. On 2 November a fumarolic plume rose 50 m. On 8 and 10 November, three 20-50-minute-long series of shallow earthquakes and tremor were recorded that may have been associated with dome explosions. On 11 November a fumarolic plume rose 200 m.
A 5-minute-long series of shallow earthquakes and tremor was recorded on the morning of 17 November that may have been associated with an explosion on the dome. On 12, 16, 19, and 22 November fumarolic plumes rose 200 m. On the morning of 24 November a gas-and-ash plume rose 3 km above the crater. Plumes rising 1-2 km above the crater were also observed on the evening of 27 November and the afternoon of 2 December. All three of these larger plumes disappeared within one hour. Smaller fumarolic plumes, to 50-200 m above the crater, were seen again on 26 and 29-30 November, and 1-2, 10, 17, and 20-21 December. On the morning of 27 December a possible gas-and-ash plume was registered.
Geologic Background. The high, isolated massif of Sheveluch volcano (also spelled Shiveluch) rises above the lowlands NNE of the Kliuchevskaya volcano group. The 1,300 km3 andesitic volcano is one of Kamchatka's largest and most active volcanic structures, with at least 60 large eruptions during the Holocene. The summit of roughly 65,000-year-old Stary Shiveluch is truncated by a broad 9-km-wide late-Pleistocene caldera breached to the south. Many lava domes occur on its outer flanks. The Molodoy Shiveluch lava dome complex was constructed during the Holocene within the large open caldera; Holocene lava dome extrusion also took place on the flanks of Stary Shiveluch. Widespread tephra layers from these eruptions have provided valuable time markers for dating volcanic events in Kamchatka. Frequent collapses of dome complexes, most recently in 1964, have produced debris avalanches whose deposits cover much of the floor of the breached caldera.
Information Contacts: Olga Chubarova, Kamchatka Volcanic Eruptions Response Team (KVERT), Institute of Volcanic Geology and Geochemistry, Piip Ave. 9, Petropavlovsk-Kamchatsky, 683006, Russia; Tom Miller, Alaska Volcano Observatory (AVO), a cooperative program of a) U.S. Geological Survey, 4200 University Drive, Anchorage, AK 99508-4667, USA (URL: http://www.avo.alaska.edu/), b) Geophysical Institute, University of Alaska, PO Box 757320, Fairbanks, AK 99775-7320, USA, and c) Alaska Division of Geological & Geophysical Surveys, 794 University Ave., Suite 200, Fairbanks, AK 99709, USA.
Tungurahua (Ecuador) — November 1999 Cite this Report
Tungurahua
Ecuador
1.467°S, 78.442°W; summit elev. 5023 m
All times are local (unless otherwise noted)
Explosions continue; 1998-99 summary; ~25,000 people displaced for months
Frequent explosive eruptions continued at Tungurahua volcano through 30 November (figure 1 and table 2). Ash plumes rose to maximum heights of about 5 km above the summit. Daily explosions increased during the month, reaching a peak during 16-25 November before decreasing slightly (figures 2 and 3). On 19 November 0.5 mm of ash fell on Baños, 9 km NNE of the summit at an elevation of ~1,850 m. Two millimeters of ash fell on the town of Runtún farther up slope at ~2,350 m elevation and ~6.2 km NE of the summit.
Table 2. Explosions and other activity at Tungurahua as described in daily reports, 31 October to 30 November 1999. Courtesy of the Geophysical Institute.
| Date |
Number of Explosions |
Observations |
| 31 Oct 1999 |
28 |
Night observations of incandescent emissions falling on upper cone; an ash-bearing plume rose ~3 km about the summit. |
| 01 Nov 1999 |
21 |
A 3 km plume deposited ash in Banos and 31 km SW of the summit in Riobamba. |
| 02 Nov 1999 |
22 |
On two occasions, plumes rose to ~5 km above the summit; windows vibrated 12 km from the summit. |
| 03 Nov 1999 |
34 |
Ash deposited 32 km NW of the summit in Ambato. |
| 04 Nov 1999 |
25 |
Plumes up to 5-km tall were produced; vibrations and explosions continued; sulfur smell noted in the city of Banos; harmonic tremor recorded. |
| 05 Nov 1999 |
22 |
Weather clouds covered the plumes. |
| 06 Nov 1999 |
32 |
Dense, 3-5 km plumes were seen during the day. |
| 07 Nov 1999 |
27 |
~1.5 km plume dispersed to the N and S. |
| 08 Nov 1999 |
24 |
Blocky pyroclastic flows with over 1 km runout distances. |
| 09 Nov 1999 |
19 |
-- |
| 10 Nov 1999 |
27 |
-- |
| 11 Nov 1999 |
29 |
Ash columns to 1.5 km height. |
| 12 Nov 1999 |
28 |
Ash column to ~10 km altitude (~5 km above the summit); blowing E. |
| 13 Nov 1999 |
15 |
Plume to about 2 km produced containing minor ash and directed NW. |
| 14 Nov 1999 |
25 |
Plume heights unstated but plume visible to NNW on satellite imagery. |
| 15 Nov 1999 |
37 |
Morning eruptions discharged ash plumes that moved NNW. |
| 16 Nov 1999 |
43 |
Airborne observations of an ash-rich plume ascending to 5-km above the summit and blowing NW; a satellite image also showed the plume at ~5 km altitude. |
| 17 Nov 1999 |
55 |
A consistent 1-km-tall ash plume directed to the N. |
| 18 Nov 1999 |
83 |
Loud booming noises; continuous series of ~5-km-tall, W-directed plumes. |
| 19 Nov 1999 |
64 |
Morning eruptions, plume blowing SW; in the past few days there was ~0.5 mm of ash deposited in Banos and up to ~2 mm deposited in Runtun (see text). |
| 20 Nov 1999 |
47 |
A strong rain produced mud flows; some crossed roads; reports stated one mudflow was 20 m wide (see text). |
| 21 Nov 1999 |
67 |
-- |
| 22 Nov 1999 |
55 |
A large quantity of blocks and incandescent material found on sides of volcano; 1-2 km plume produced and inclined to the NE. |
| 23 Nov 1999 |
96 |
Emissions rose to 1 km over the summit. |
| 24 Nov 1999 |
102 |
Up to ~2-km-tall plumes of vapor and ash directed to the E. |
| 25 Nov 1999 |
97 |
Taller plumes reached 3-4 km height; ~3,300 tons/day SO2 emitted in an interval with a constant 1-km-tall plume. |
| 26 Nov 1999 |
35 |
An explosion of vapor and ash rose 1 km above the summit of the volcano; a ~5-km-tall plume formed; 1 cm ash accumulated in one sector during the past weeks. |
| 27 Nov 1999 |
16 |
4 km ash-bearing column rose after the explosion. |
| 28 Nov 1999 |
13 |
A 500-m-tall vapor column was seen. |
| 29 Nov 1999 |
46 |
An explosion produced a 4-km-tall column; loud noises heard. |
| 30 Nov 1999 |
62 |
Observers noted strong thunder sounds; vibrations felt ~10 km away. |
A pronounced peak in monthly earthquakes during August-September diminished rapidly in October and still farther in November (figure 4). The greatest number of monthly earthquakes were volcano-tectonic, in a pattern that became prominent in September 1998 and prevailed until October 1999. The ratio of multiphase to long-period earthquakes showed significant variability. In some months (eg., February, March, May, June, and September 1999) the multiphase events dominated. August 1999 showed the extreme reversal of this pattern with 436 long-period and 58 multiphase events. The last two months shown on figure 4, October and November, portrayed a similar though less pronounced reversal in their relative abundance of the multiphase events. These months also displayed a comparative scarcity of volcano-tectonic events.
SO2 flux during the crisis (figure 5) showed wide variability. Comparatively high fluxes were measured prior to the eruption. On the eruptions first day, 5 October, measured SO2-flux values reached 9,000-10,000 metric tons/day (t/d) (BGVN 24:09). The highest fluxes, seen during mid-September through early November, also showed rough, though inexact correlations with the seismic and explosion patterns.
Two mud flows were reported on 20 November. They occurred after a strong rain that washed large tree trunks and rocks into a main highway in Baños. One of these mudflows was 20 m wide; another earlier in the day blocked part of a different highway in Baños.
1998-99 activity divided into five stages. In January 2000 the Geophysical Institute issued a summary report that divided 1998-99 activity into five stages. The first stage, December-May 1998, included swarms of small predominantly volcano-tectonic earthquakes. Tremor also continued, presumably associated with a phreatic source; this kind of tremor has been detected since 1993 and is thus here referred to as persistent or long-lived tremor.
The second stage, May 1998-15 July 1999, was an interval when seismic swarms (including volcano-tectonic (VT), long period (LP), and hybrid or multiphase (MP) earthquakes) became more energetic. Small explosion signals began to register from greater-than-shallow depths. The preponderance of VT earthquakes was interpreted as a result of stress beneath the edifice due to intruding magma. Stable-frequency tremor at that time underwent a slight increase in amplitude.
In the third stage, which began after 15 July 1999, tremor included higher frequency signals. Geophysicists noted a series of many small earthquakes of all kinds that continued until mid-December. At the end of July came the first reports of strong sulfurous odors in the vicinity of the crater. In the meantime, SO2 fluxes rose from essentially zero to 3,200 t/d (figure 5).
During 24-28 July and 8-10 September LP earthquake swarms struck with significant energy. Seismicity continued to rise considerably during August and early September. An alert was declared on 8 September 1999.
The fourth stage began 14 September 1999 when low-frequency tremor appeared, presumably associated with degassing and ascending magma. The persistent tremor increased in amplitude. On 14 September a column of vapor 2 km tall was observed. On 15 September the alert status rose to yellow. Later and until 25 October tremor reached extraordinarily high amplitudes and contained three dominant frequencies: 1, 1.7, and 2-2.5 Hz.
The first explosive activity was reported on 5 October (BGVN 24:09), when blocks and ash were ejected at 0721, 0738, and 0743 hours. This emission was associated with a comparatively big explosive seismic signal with a reduced displacement of 25 cm2 and high SO2 fluxes. The next day an ash plume rose to 2 km above the summit; small airfall ash deposits were found in Quero, Bilbao (where the thickness was given as 2 mm), and probably in Ambato. Subsequent Geophysical Institute reports described small ash-bearing or "dark" plumes to 0.5-5 km above the summit.
On 13 October observers first noted incandescence. SO2 fluxes rose to over 10,000 t/d (figure 5). Deformation at one of the tilt stations on the SW underwent significant changes. Activity increased on 16 October when an ash plume reached ~5 km above the summit and blew W. During the previous night's darkness observers saw incandescent ash and blocks deposited on the upper flanks of the volcano. On 16 October the alert status was raised from yellow to orange, prompting evacuations of Baños and settlements along Tungurahua's W and SW flanks (see below).
During the fifth stage, which began after 25 October, the persistent tremor remained near the levels seen in the third stage. Low-frequency tremor also continued. SO2 fluxes dropped to 3,500-4,000 tons/day in mid-November. Magmatic explosions became common in this stage. At night observers saw pyroclasts descending 1-2 km below the summit. Ash-charged plumes rose 3-5 km above the summit. During 1999 the Geophysical Institute tallied 2,030 explosions and emissions, 2,542 VT earthquakes, 4,086 LP earthquakes, and 1,038 MP earthquakes.
Geography and hazards. Baños sits in a narrow valley on the N margin of the volcano 75 miles S of Quito and 9 km NE of Tungurahua's summit. Baños lies along the Pastaza river (draining the N flanks) below the Chambo river (draining the W flanks over the NW to SW sector). This geography leaves Baños open to "high hazard for directed blasts and fallback pyroclastic flows" as well as lahars (Hall and others, 1999). Within this hazard zone, ~4.5 km downstream, sits the Agoyan dam, an important source of hydroelectric power.
Tungurahua is very dangerous because it has 3 km of vertical relief, 30°slopes, a record of previous sector collapses and a comparatively high propensity for future collapses, a pre-evacuation at-risk population of ~25,000 people, a major hydroelectric dam on its NNE margin, and a record of relatively violent, sudden andesitic eruptions with pyroclastic flows (Hall and others, 1999). The same authors noted that the volume of magma emitted by Tungurahua during the last 2,300 years has been ~3.45 km3. This gives it a magma flux rate similar to that at Merapi during the last century and 2- to 3-fold larger than the estimated rates seen in the Central Andes during the Late Cenozoic.
Evacuations. The newspaper El Universo reported that on 16 October when Tungurahua's volcanic activity increased and its hazard status first rose to orange, evacuations followed at cities closest to the volcano, including Baños. On 21 October the United Nations (UN) reported that the evacuations relocated "22,000 persons from some 60 locations." El Universo noted that at one point nearing the end of the evacuation one hundred buses were used.
As of late October some of the residents had moved to Ambato, 32 km NW of the volcano. Official sources indicated that 1,200-1,500 evacuees went to temporary shelters in the provinces of Tungurahua, Chimborazo, and Pastaza. Besides Ambato, individual cities that took refugees included Puyo (45 km E of the summit) and Shell (41 km E). About 100 families found shelter in a religious foundation and 200 families on a farm belonging to the Polytechnic Institute of Chimborazo. The UN further reported that ~600 military police and personnel have been deployed to the affected region to protect abandoned property. Access into this area was to be strictly prohibited.
The UN reported that 4,000 livestock, 100,000 fowl, and the animals from the zoological garden in Baños had also been evacuated. According to the Associated Press, a government census found that 40,000 chickens died from respiratory infections during early October.
According to the Associated Press, Baños had been evacuated for two months when on 13 December a caravan of residents briefly returned. During this brief visit, one resident entered his home and found it intact, although most parts of the house lay covered in ash. Residents faced an uncertain future because they did not know exactly when they would be able to return. The governor of Tungurahua province, Ignacio Vargas said, "This won't be permanent. We will have to wait until the eruption ends so that everyone can return to his normal activities."
Because of economic problems associated with leaving their homes and livelihoods, Baños area residents have been bypassing the military to plant crops and tend their farms. According to early January ABC News reports there have even been skirmishes between residents and the military. The eruptions are occurring in the context of tension and conflict between the military and some Unions and other groups as the country's economy has worsened.
Reference.: Hall, M., Robin, C., Beate, B., Mothes, P., Monzier, M., 1999. Tungurahua Volcano, Ecuador: structure, eruptive history and hazards: Journal of Volcanology and Geothermal Research, v. 91, p. 1-21.
Geologic Background. Tungurahua, a steep-sided andesitic-dacitic stratovolcano that towers more than 3 km above its northern base, is one of Ecuador's most active volcanoes. Three major edifices have been sequentially constructed since the mid-Pleistocene over a basement of metamorphic rocks. Tungurahua II was built within the past 14,000 years following the collapse of the initial edifice. Tungurahua II collapsed about 3,000 years ago and produced a large debris-avalanche deposit to the west. The modern glacier-capped stratovolcano (Tungurahua III) was constructed within the landslide scarp. Historical eruptions have all originated from the summit crater, accompanied by strong explosions and sometimes by pyroclastic flows and lava flows that reached populated areas at the volcano's base. Prior to a long-term eruption beginning in 1999 that caused the temporary evacuation of the city of Baños at the foot of the volcano, the last major eruption had occurred from 1916 to 1918, although minor activity continued until 1925.
Information Contacts: Instituto Geofísico, Escuela Politécnica Nacional, Apartado 17-01-2759, Quito, Ecuador; Embassy of Ecuador, 2535 15th Street NW, Washington, DC 20009 USA (URL: http//www.ecuador.org/); United Nations Office for the Coordination of Humanitarian Affairs (OCHA), Palais des Nations, 1211 Geneva 10, Switzerland; El Universo, Quito, Ecuador (URL: http://www.eluniverso.com/); Associated Press, International Headquarters, 50 Rockefeller Plaza, New York, NY 10020 USA (URL: http://www.ap.org/); ABC News (URL: http://abcnews.go.com/).
Whakaari/White Island (New Zealand) — November 1999 Cite this Report
Whakaari/White Island
New Zealand
37.52°S, 177.18°E; summit elev. 294 m
All times are local (unless otherwise noted)
Fumarolic activity continues; new crater lake
No eruptions have occurred at White Island since the minor ash emissions in July-August 1999 from the PeeJay vent area. This report includes observations following a visit on 23 November to service the seismic installation, conduct a deformation survey, collect volcanic gas samples, and assess the general status of volcanic activity on the island.
During the visit a weak steam-and-gas plume was rising 300-500 m. This plume originated from fumarolic vents NW of the former PeeJay vents. Since the last surveillance visit in July a crater lake has developed on the floor of 1978/90 Crater Complex, inundating Metra Crater and parts of the PeeJay vent area. A series of strand lines around the crater lake edge indicated a recent drop in the lake level. Small collapse pits had recently formed near the lakeshore, below the Sag area, and may have accompanied the recent drop in lake level. The lake is a lime green color, with minor convection evident. A temperature of 45°C was measured, down slightly from the previous measurements.
The strongest fumarolic vents were on the NW side of the PeeJay vents area, emerging from the vent wall, which is ~10-15 m high. There were three prominent vents, which were emitting steam and gas that were weakly transparent at the vent. At times the steam and gas plume appeared a yellow color. The emissions were audible from 2-300 m distance. Temperatures of Main Crater fumaroles ranged from 103-115°C, and are similar to previous measurements this year.
A ground-deformation survey was also made. Eight pegs were replaced, as these were damaged during the April-July 1999 eruptions. The survey results showed that subsidence continued at the E-SE margin of the 1978/90 Crater Complex, but at a lesser rate than observed in 1998. Over the remainder of the Main Crater floor weak subsidence was also apparent at many of the marks.
Geologic Background. The uninhabited Whakaari/White Island is the 2 x 2.4 km emergent summit of a 16 x 18 km submarine volcano in the Bay of Plenty about 50 km offshore of North Island. The island consists of two overlapping andesitic-to-dacitic stratovolcanoes. The SE side of the crater is open at sea level, with the recent activity centered about 1 km from the shore close to the rear crater wall. Volckner Rocks, sea stacks that are remnants of a lava dome, lie 5 km NW. Descriptions of volcanism since 1826 have included intermittent moderate phreatic, phreatomagmatic, and Strombolian eruptions; activity there also forms a prominent part of Maori legends. The formation of many new vents during the 19th and 20th centuries caused rapid changes in crater floor topography. Collapse of the crater wall in 1914 produced a debris avalanche that buried buildings and workers at a sulfur-mining project. Explosive activity in December 2019 took place while tourists were present, resulting in many fatalities. The official government name Whakaari/White Island is a combination of the full Maori name of Te Puia o Whakaari ("The Dramatic Volcano") and White Island (referencing the constant steam plume) given by Captain James Cook in 1769.
Information Contacts: Brad Scott, Wairakei Research Center, Institute of Geological and Nuclear Sciences (IGNS), Private Bag 2000, Wairakei, New Zealand (URL: http://www.gns.cri.nz/).