Recently Published Bulletin Reports
Erebus (Antarctica) Lava lake remains active; most thermal alerts recorded since 2019
Rincon de la Vieja (Costa Rica) Frequent phreatic explosions during July-December 2023
Bezymianny (Russia) Explosion on 18 October 2023 sends ash plume 8 km high; lava flows and incandescent avalanches
Kilauea (United States) Low-level lava effusions in the lava lake at Halema’uma’u during July-December 2022
Nyamulagira (DR Congo) Lava flows and thermal activity during May-October 2023
Bagana (Papua New Guinea) Explosions, ash plumes, ashfall, and lava flows during April-September 2023
Mayon (Philippines) Lava flows, pyroclastic flows, ash emissions, and seismicity during April-September 2023
Nishinoshima (Japan) Eruption plumes and gas-and-steam plumes during May-August 2023
Krakatau (Indonesia) White gas-and-steam plumes and occasional ash plumes during May-August 2023
Merapi (Indonesia) Frequent incandescent avalanches during April-September 2023
Villarrica (Chile) Strombolian activity, gas-and-ash emissions, and crater incandescence during April-September 2023
Ebeko (Russia) Moderate explosive activity with ash plumes continued during June-November 2023
Erebus (Antarctica) — January 2024  Cite this Report
Erebus
Antarctica
77.53°S, 167.17°E; summit elev. 3794 m
All times are local (unless otherwise noted)
Lava lake remains active; most thermal alerts recorded since 2019
The lava lake in the summit crater of Erebus has been active since at least 1972. Located in Antarctica overlooking the McMurdo Station on Ross Island, it is the southernmost active volcano on the planet. Because of the remote location, activity is primarily monitored by satellites. This report covers activity during 2023.
The number of thermal alerts recorded by the Hawai'i Institute of Geophysics and Planetology’s MODVOLC Thermal Alerts System increased considerably in 2023 compared to the years 2020-2022 (table 9). In contrast to previous years, the MODIS instruments aboard the Aqua and Terra satellites captured data from Erebus every month during 2023. Consistent with previous years, the lowest number of anomalous pixels were recorded in January, November, and December.
Table 9. Number of monthly MODIS-MODVOLC thermal alert pixels recorded at Erebus during 2017-2023. See BGVN 42:06 for data from 2000 through 2016. The table was compiled using data provided by the HIGP – MODVOLC Thermal Alerts System.
| Year |
Jan |
Feb |
Mar |
Apr |
May |
Jun |
Jul |
Aug |
Sep |
Oct |
Nov |
Dec |
SUM |
| 2017 |
0 |
21 |
9 |
0 |
0 |
1 |
11 |
61 |
76 |
52 |
0 |
3 |
234 |
| 2018 |
0 |
21 |
58 |
182 |
55 |
17 |
137 |
172 |
103 |
29 |
0 |
0 |
774 |
| 2019 |
2 |
21 |
162 |
151 |
55 |
56 |
75 |
53 |
29 |
19 |
1 |
0 |
624 |
| 2020 |
0 |
2 |
16 |
18 |
4 |
4 |
1 |
3 |
18 |
3 |
1 |
6 |
76 |
| 2021 |
0 |
9 |
1 |
0 |
2 |
56 |
46 |
47 |
35 |
52 |
5 |
3 |
256 |
| 2022 |
1 |
13 |
55 |
22 |
15 |
32 |
39 |
19 |
31 |
11 |
0 |
0 |
238 |
| 2023 |
2 |
33 |
49 |
82 |
41 |
32 |
70 |
64 |
42 |
17 |
5 |
11 |
448 |
Sentinel-2 infrared images showed one or two prominent heat sources within the summit crater, accompanied by adjacent smaller sources, similar to recent years (see BGVN 46:01, 47:02, and 48:01). A unique image was obtained on 25 November 2023 by the OLI-2 (Operational Land Imager-2) on Landsat 9, showing the upper part of the volcano surrounded by clouds (figure 32).
Geologic Background. Mount Erebus, the world's southernmost historically active volcano, overlooks the McMurdo research station on Ross Island. It is the largest of three major volcanoes forming the crudely triangular Ross Island. The summit of the dominantly phonolitic volcano has been modified by one or two generations of caldera formation. A summit plateau at about 3,200 m elevation marks the rim of the youngest caldera, which formed during the late-Pleistocene and within which the modern cone was constructed. An elliptical 500 x 600 m wide, 110-m-deep crater truncates the summit and contains an active lava lake within a 250-m-wide, 100-m-deep inner crater; other lava lakes are sometimes present. The glacier-covered volcano was erupting when first sighted by Captain James Ross in 1841. Continuous lava-lake activity with minor explosions, punctuated by occasional larger Strombolian explosions that eject bombs onto the crater rim, has been documented since 1972, but has probably been occurring for much of the volcano's recent history.
Information Contacts: Hawai'i Institute of Geophysics and Planetology (HIGP) - MODVOLC Thermal Alerts System, School of Ocean and Earth Science and Technology (SOEST), Univ. of Hawai'i, 2525 Correa Road, Honolulu, HI 96822, USA (URL: http://modis.higp.hawaii.edu/); Copernicus Browser, Copernicus Data Space Ecosystem, European Space Agency (URL: https://dataspace.copernicus.eu/browser/); NASA Earth Observatory, EOS Project Science Office, NASA Goddard Space Flight Center, Goddard, Maryland, USA (URL: https://earthobservatory.nasa.gov/images/152134/erebus-breaks-through).
Rincon de la Vieja (Costa Rica) — January 2024 Cite this Report
Rincon de la Vieja
Costa Rica
10.83°N, 85.324°W; summit elev. 1916 m
All times are local (unless otherwise noted)
Frequent phreatic explosions during July-December 2023
Rincón de la Vieja is a volcanic complex in Costa Rica with a hot convecting acid lake that exhibits frequent weak phreatic explosions, gas-and-steam emissions, and occasional elevated sulfur dioxide levels (BGVN 45:10, 46:03, 46:11). The current eruption period began June 2021. This report covers activity during July-December 2023 and is based on weekly bulletins and occasional daily reports from the Observatorio Vulcanologico Sismologica de Costa Rica-Universidad Nacional (OVSICORI-UNA).
Numerous weak phreatic explosions continued during July-December 2023, along with gas-and-steam emissions and plumes that rose as high as 3 km above the crater rim. Many weekly OVSICORI-UNA bulletins included the previous week's number of explosions and emissions (table 9). For many explosions, the time of explosion was given (table 10). Frequent seismic activity (long-period earthquakes, volcano-tectonic earthquakes, and tremor) accompanied the phreatic activity.
Table 9. Number of reported weekly phreatic explosions and gas-and-steam emissions at Rincón de la Vieja, July-December 2023. Counts are reported for the week before the Weekly Bulletin date; not all reports included these data. Courtesy of OVSICORI-UNA.
| OVSICORI Weekly Bulletin |
Number of explosions |
Number of emissions |
| 28 Jul 2023 |
6 |
14 |
| 4 Aug 2023 |
10 |
12 |
| 1 Sep 2023 |
13 |
11 |
| 22 Sep 2023 |
12 |
13 |
| 29 Sep 2023 |
6 |
11 |
| 6 Oct 2023 |
12 |
5 |
| 13 Oct 2023 |
7 |
9 |
| 20 Oct 2023 |
1 |
15 |
| 27 Oct 2023 |
3 |
23 |
| 3 Nov 2023 |
3 |
10 |
| 17 Nov 2023 |
0 |
Some |
| 24 Nov 2023 |
0 |
14 |
| 8 Dec 2023 |
4 |
16 |
| 22 Dec 2023 |
8 |
18 |
Table 10. Summary of activity at Rincón de la Vieja during July-December 2023. Weak phreatic explosions and gas emissions are noted where the time of explosion was indicated in the weekly or daily bulletins. Height of plumes or emissions are distance above the crater rim. Courtesy of OVSICORI-UNA.
| Date |
Time |
Description of Activity |
| 1 Jul 2023 |
0156 |
Explosion. |
| 2 Jul 2023 |
0305 |
Explosion. |
| 4 Jul 2023 |
0229, 0635 |
Event at 0635 produced a gas-and-steam plume that rose 700 m and drifted W; seen by residents in Liberia (21 km SW). |
| 9 Jul 2023 |
1843 |
Explosion. |
| 21 Jul 2023 |
0705 |
Explosion. |
| 26 Jul 2023 |
1807 |
Explosion. |
| 28 Jul 2023 |
0802 |
Explosion generated a gas-and-steam plume that rose 500 m. |
| 30 Jul 2023 |
1250 |
Explosion. |
| 31 Jul 2023 |
2136 |
Explosion. |
| 11 Aug 2023 |
0828 |
Explosion. |
| 18 Aug 2023 |
1304 |
Explosion. |
| 21 Aug 2023 |
1224 |
Explosion generated gas-and-steam plumes rose 500-600 m. |
| 22 Aug 2023 |
0749 |
Explosion generated gas-and-steam plumes rose 500-600 m. |
| 24 Aug 2023 |
1900 |
Explosion. |
| 25 Aug 2023 |
0828 |
Event produced a steam-and-gas plume that rose 3 km and drifted NW. |
| 27-28 Aug 2023 |
0813 |
Four small events; the event at 0813 on 28 August lasted two minutes and generated a steam-and-gas plume that rose 2.5 km. |
| 1 Sep 2023 |
1526 |
Explosion generated plume that rose 2 km and ejected material onto the flanks. |
| 2-3 Sep 2023 |
- |
Small explosions detected in infrasound data. |
| 4 Sep 2023 |
1251 |
Gas-and-steam plume rose 1 km and drifted W. |
| 7 Nov 2023 |
1113 |
Explosion. |
| 8 Nov 2023 |
0722 |
Explosion. |
| 12 Nov 2023 |
0136 |
Small gas emissions. |
| 14 Nov 2023 |
0415 |
Small gas emissions. |
According to OVSICORI-UNA, during July-October the average weekly sulfur dioxide (SO2) flux ranged from 68 to 240 tonnes/day. However, in mid-November the flux increased to as high as 334 tonnes/day, the highest value measured in recent years. The high SO2 flux in mid-November was also detected by the TROPOMI instrument on the Sentinel-5P satellite (figure 43).
Geologic Background. Rincón de la Vieja, the largest volcano in NW Costa Rica, is a remote volcanic complex in the Guanacaste Range. The volcano consists of an elongated, arcuate NW-SE-trending ridge constructed within the 15-km-wide early Pleistocene Guachipelín caldera, whose rim is exposed on the south side. Sometimes known as the "Colossus of Guanacaste," it has an estimated volume of 130 km3 and contains at least nine major eruptive centers. Activity has migrated to the SE, where the youngest-looking craters are located. The twin cone of Santa María volcano, the highest peak of the complex, is located at the eastern end of a smaller, 5-km-wide caldera and has a 500-m-wide crater. A Plinian eruption producing the 0.25 km3 Río Blanca tephra about 3,500 years ago was the last major magmatic eruption. All subsequent eruptions, including numerous historical eruptions possibly dating back to the 16th century, have been from the prominent active crater containing a 500-m-wide acid lake located ENE of Von Seebach crater.
Information Contacts: Observatorio Vulcanológico Sismológica de Costa Rica-Universidad Nacional (OVSICORI-UNA), Apartado 86-3000, Heredia, Costa Rica (URL: http://www.ovsicori.una.ac.cr/); NASA Global Sulfur Dioxide Monitoring Page, Atmospheric Chemistry and Dynamics Laboratory, NASA Goddard Space Flight Center (NASA/GSFC), 8800 Greenbelt Road, Goddard MD 20771, USA (URL: https://so2.gsfc.nasa.gov/).
Bezymianny (Russia) — November 2023 Cite this Report
Bezymianny
Russia
55.972°N, 160.595°E; summit elev. 2882 m
All times are local (unless otherwise noted)
Explosion on 18 October 2023 sends ash plume 8 km high; lava flows and incandescent avalanches
Bezymianny, located on Russia’s Kamchatka Peninsula, has had eruptions since 1955 characterized by dome growth, explosions, pyroclastic flows, ash plumes, and ashfall. Activity during November 2022-April 2023 included gas-and-steam emissions, lava dome collapses generating avalanches, and persistent thermal activity. Similar eruptive activity continued from May through October 2023, described here based on information from weekly and daily reports of the Kamchatka Volcano Eruptions Response Team (KVERT), notices from Tokyo VAAC (Volcanic Ash Advisory Center), and from satellite data.
Overall activity decreased after the strong period of activity in late March through April 2023, which included ash explosions during 29 March and 7-8 April 2023 that sent plumes as high as 10-12 km altitude, along with dome growth and lava flows (BGVN 48:05). This reduced activity can be seen in the MIROVA thermal detection system graph (figure 56), which was consistent with data from the MODVOLC thermal detection system and with Sentinel-2 satellite images that showed persistent hotspots in the summit crater when conditions allowed observations. A renewed period of strong activity began in mid-October 2023.
Activity increased significantly on 17 October 2023 when large collapses began during 0700-0830 on the E flanks of the lava dome and continued to after 0930 the next day (figure 57). Ash plumes rose to an altitude of 4.5-5 km, extending 220 km NNE by 18 October. A large explosion at 1630 on 18 October produced an ash plume that rose to an altitude of 11 km (8 km above the summit) and drifted NNE and then NW, extending 900 km NW within two days at an altitude of 8 km. Minor ashfall was noted in Kozyrevsk (45 km WNW). At 0820 on 20 October an ash plume was identified in satellite images drifting 100 km ENE at altitudes of 4-4.5 km.
Lava flows and hot avalanches from the dome down the SE flank continued over the next few days, including 23 October when clear conditions allowed good observations (figures 58 and 59). A large thermal anomaly was observed over the volcano through 24 October, and in the summit crater on 30 October (figure 60). Strong fumarolic activity continued, with numerous avalanches and occasional incandescence. By the last week of October, volcanic activity had decreased to a level consistent with that earlier in the reporting period.
Aviation warnings were frequently updated during 17-20 October. KVERT issued a Volcano Observatory Notice for Aviation (VONA) on 17 October at 1419 and 1727 (0219 and 0527 UTC) raising the Aviation Color Code (ACC) from Yellow to Orange (second highest level). The next day, KVERT issued a VONA at 1705 (0505 UTC) raising the ACC to Red (highest level) but lowered it back to Orange at 2117 (0917 UTC). After another decrease to Yellow and back to Orange, the ACC was reduced to Yellow on 20 October at 1204 (0004 UTC). In addition, the Tokyo VAAC issued a series of Volcanic Ash Advisories beginning on 16 October and continuing through 30 October.
Geologic Background. The modern Bezymianny, much smaller than its massive neighbors Kamen and Kliuchevskoi on the Kamchatka Peninsula, was formed about 4,700 years ago over a late-Pleistocene lava-dome complex and an edifice built about 11,000-7,000 years ago. Three periods of intensified activity have occurred during the past 3,000 years. The latest period, which was preceded by a 1,000-year quiescence, began with the dramatic 1955-56 eruption. This eruption, similar to that of St. Helens in 1980, produced a large open crater that was formed by collapse of the summit and an associated lateral blast. Subsequent episodic but ongoing lava-dome growth, accompanied by intermittent explosive activity and pyroclastic flows, has largely filled the 1956 crater.
Information Contacts: Kamchatka Volcanic Eruptions Response Team (KVERT), Far Eastern Branch, Russian Academy of Sciences, 9 Piip Blvd., Petropavlovsk-Kamchatsky, 683006, Russia (URL: http://www.kscnet.ru/ivs/kvert/); Kamchatka Volcanological Station, Kamchatka Branch of Geophysical Survey, (KB GS RAS), Klyuchi, Kamchatka Krai, Russia (URL: http://volkstat.ru/); Tokyo Volcanic Ash Advisory Center (VAAC), 1-3-4 Otemachi, Chiyoda-ku, Tokyo 100-8122, Japan (URL: http://ds.data.jma.go.jp/svd/vaac/data/); Hawai'i Institute of Geophysics and Planetology (HIGP) - MODVOLC Thermal Alerts System, School of Ocean and Earth Science and Technology (SOEST), Univ. of Hawai'i, 2525 Correa Road, Honolulu, HI 96822, USA (URL: http://modis.higp.hawaii.edu/); MIROVA (Middle InfraRed Observation of Volcanic Activity), a collaborative project between the Universities of Turin and Florence (Italy) supported by the Centre for Volcanic Risk of the Italian Civil Protection Department (URL: http://www.mirovaweb.it/); Copernicus Browser, Copernicus Data Space Ecosystem, European Space Agency (URL: https://dataspace.copernicus.eu/browser/).chr
Kilauea (United States) — January 2023 Cite this Report
Kilauea
United States
19.421°N, 155.287°W; summit elev. 1222 m
All times are local (unless otherwise noted)
Low-level lava effusions in the lava lake at Halema’uma’u during July-December 2022
Kīlauea is the southeastern-most volcano in Hawaii and overlaps the E flank of the Mauna Loa volcano. Its East Rift Zone (ERZ) has been intermittently active for at least 2,000 years. An extended eruption period began in January 1983 and was characterized by open lava lakes and lava flows from the summit caldera and the East Rift Zone. During May 2018 magma migrated into the Lower East Rift Zone (LERZ) and opened 24 fissures along a 6-km-long NE-trending fracture zone that produced lava flows traveling in multiple directions. As lava emerged from the fissures, the lava lake at Halema'uma'u drained and explosions sent ash plumes to several kilometers altitude (BGVN 43:10).
The current eruption period started during September 2021 and has recently been characterized by lava effusions, spatter, and sulfur dioxide emissions in the active Halema’uma’u lava lake (BGVN 47:08). Lava effusions, some spatter, and sulfur dioxide emissions have continued during this reporting period of July through December 2022 using daily reports, volcanic activity notices, and abundant photo, map, and video data from the US Geological Survey's (USGS) Hawaiian Volcano Observatory (HVO).
Summary of activity during July-December 2022. Low-level effusions have continued at the western vent of the Halema’uma’u crater during July through early December 2022. Occasional weak ooze-outs (also called lava break outs) would occur along the margins of the crater floor. The overall level of the active lava lake throughout the reporting period gradually increased due to infilling, however it stagnated in mid-September (table 13). During September through November, activity began to decline, though lava effusions persisted at the western vent. By 9 December, the active part of the lava lake had completely crusted over, and incandescence was no longer visible.
Table 13. Summary of measurements taken during overflights at Kīlauea that show a gradual increase in the active lava lake level and the volume of lava effused since 29 September 2021. Lower activity was reported during September-October. Data collected during July-December 2022. Courtesy of HVO.
| Date: |
Level of the active lava lake (m): |
Cumulative volume of lava effused (million cubic meters): |
| 7 Jul 2022 |
130 |
95 |
| 19 Jul 2022 |
133 |
98 |
| 4 Aug 2022 |
136 |
102 |
| 16 Aug 2022 |
137 |
104 |
| 12 Sep 2022 |
143 |
111 |
| 5 Oct 2022 |
143 |
111 |
| 28 Oct 2022 |
143 |
111 |
Activity during July 2022. Lava effusions were reported from the western vent in the Halema’uma’u crater, along with occasional weak ooze-outs along the margins of the crater floor. The height of the lava lake was variable due to deflation-inflation tilt events; for example, the lake level dropped approximately 3-4 m during a summit deflation-inflation event reported on 1 July. Webcam images taken during the night of 6-12 July showed intermittent low-level spattering at the western vent that rose less than 10 m above the vent (figure 519). Measurements made during an overflight on 7 July indicated that the crater floor was infilled about 130 m and that 95 million cubic meters of lava had been effused since 29 September 2021. A single, relatively small lava ooze-out was active to the S of the lava lake. Around midnight on 8 July there were two brief periods of lava overflow onto the lake margins. On 9 July lava ooze-outs were reported near the SE and NE edges of the crater floor and during 10-11 July they occurred near the E, NE, and NW edges. On 16 July crater incandescence was reported, though the ooze-outs and spattering were not visible. On 18 July overnight webcam images showed incandescence in the western vent complex and two ooze-outs were reported around 0000 and 0200 on 19 July. By 0900 there were active ooze-outs along the SW edge of the crater floor. Measurements made from an overflight on 19 July indicated that the crater floor was infilled about 133 m and 98 million cubic meters of lava had erupted since 29 September 2021 (figure 520). On 20 July around 1600 active ooze-outs were visible along the N edge of the crater, which continued through the next day. Extensive ooze-outs occurred along the W margin during 24 July until 1900; on 26 July minor ooze-outs were noted along the N margin. Minor spattering was visible on 29 July along the E margin of the lake. The sulfur dioxide emission rates ranged 650-2,800 tons per day (t/d), the higher of which was measured on 8 July (figure 519).
Activity during August 2022. The eruption continued in the Halema’uma’u crater at the western vent. According to HVO the lava in the active lake remained at the level of the bounding levees. Occasional minor ooze-outs were observed along the margins of the crater floor. Strong nighttime crater incandescence was visible after midnight on 6 August over the western vent cone. During 6-7 August scattered small lava lobes were active along the crater floor and incandescence persisted above the western vent through 9 August. During 7-9 August HVO reported a single lava effusion source was active along the NW margin of the crater floor. Measurements from an overflight on 4 August indicated that the crater floor was infilled about 136 m total and that 102 million cubic meters of lava had been erupted since the start of the eruption. Lava breakouts were reported along the N, NE, E, S, and W margins of the crater during 10-16 August. Another overflight survey conducted on 16 August indicated that the crater floor infilled about 137 m and 104 million cubic meters of lava had been erupted since September 2021. Measured sulfur dioxide emissions rates ranged 1,150-2,450 t/d, the higher of which occurred on 8 August.
Activity during September 2022. During September, lava effusion continued from the western vent into the active lava lake and onto the crater floor. Intermittent minor ooze-outs were reported through the month. A small ooze-out was visible on the W crater floor margin at 0220 on 2 September, which showed decreasing surface activity throughout the day, but remained active through 3 September. On 3 September around 1900 a lava outbreak occurred along the NW margin of the crater floor but had stopped by the evening of 4 September. Field crews monitoring the summit lava lake on 9 September observed spattering on the NE margin of the lake that rose no higher than 10 m, before falling back onto the lava lake crust (figure 521). Overflight measurements on 12 September indicated that the crater floor was infilled a total of 143 m and 111 million cubic meters of lava had been erupted since September 2021. Extensive breakouts in the W and N part of the crater floor were reported at 1600 on 20 September and continued into 26 September. The active part of the lava lake dropped by 10 m while other parts of the crater floor dropped by several meters. Summit tiltmeters recorded a summit seismic swarm of more than 80 earthquakes during 1500-1800 on 21 September, which occurred about 1.5 km below Halema’uma’u; a majority of these were less than Mw 2. By 22 September the active part of the lava lake was infilled about 2 m. On 23 September the western vent areas exhibited several small spatter cones with incandescent openings, along with weak, sporadic spattering (figure 522). The sulfur dioxide emission rate ranged from 930 t/d to 2,000 t/d, the higher of which was measured on 6 September.
Activity during October 2022. Activity during October declined slightly compared to previous months, though lava effusions persisted from the western vent into the active lava lake and onto the crater floor during October (figure 523). Slight variations in the lava lake were noted throughout the month. HVO reported that around 0600 on 3 October the level of the lava lake has lowered slightly. Overflight measurements taken on 5 October indicated that the crater floor was infilled a total of about 143 m and that 111 million cubic meters of lava had been effused since September 2021. During 6-7 October the lake gradually rose 0.5 m. Sulfur dioxide measurements made on 22 October had an emission rate of 700 t/d. Another overflight taken on 28 October showed that there was little to no change in the elevation of the crater floor: the crater floor was infilled a total of 143 m and 111 million cubic meters of lava had erupted since the start of the eruption.
Activity during November 2022. Activity remained low during November, though HVO reported that lava from the western vent continued to effuse into the active lava lake and onto the crater floor throughout the month. The rate of sulfur dioxide emissions during November ranged from 300-600 t/d, the higher amount of which occurred on 9 November.
Activity during December 2022. Similar low activity was reported during December, with lava effusing from the western vent into the active lava lake and onto the crater floor. During 4-5 December the active part of the lava lake was slightly variable in elevation and fluctuated within 1 m. On 9 December HVO reported that lava was no longer erupting from the western vent in the Halema’uma’u crater and that sulfur dioxide emissions had returned to near pre-eruption background levels; during 10-11 December, the lava lake had completely crusted over, and no incandescence was visible (figure 524). Time lapse camera images covering the 4-10 December showed that the crater floor showed weak deflation and no inflation. Some passive events of crustal overturning were reported during 14-15 December, which brought fresh incandescent lava to the lake surface. The sulfur dioxide emission rate was approximately 200 t/d on 14 December. A smaller overturn event on 17 December and another that occurred around 0000 and into the morning of 20 December were also detected. A small seismic swarm was later detected on 30 December.
Geologic Background. Kilauea overlaps the E flank of the massive Mauna Loa shield volcano in the island of Hawaii. Eruptions are prominent in Polynesian legends; written documentation since 1820 records frequent summit and flank lava flow eruptions interspersed with periods of long-term lava lake activity at Halemaumau crater in the summit caldera until 1924. The 3 x 5 km caldera was formed in several stages about 1,500 years ago and during the 18th century; eruptions have also originated from the lengthy East and Southwest rift zones, which extend to the ocean in both directions. About 90% of the surface of the basaltic shield volcano is formed of lava flows less than about 1,100 years old; 70% of the surface is younger than 600 years. The long-term eruption from the East rift zone between 1983 and 2018 produced lava flows covering more than 100 km2, destroyed hundreds of houses, and added new coastline.
Information Contacts: Hawaiian Volcano Observatory (HVO), U.S. Geological Survey, PO Box 51, Hawai'i National Park, HI 96718, USA (URL: http://hvo.wr.usgs.gov/).
Nyamulagira (DR Congo) — November 2023 Cite this Report
Nyamulagira
DR Congo
1.408°S, 29.2°E; summit elev. 3058 m
All times are local (unless otherwise noted)
Lava flows and thermal activity during May-October 2023
Nyamulagira (also known as Nyamuragira) is a shield volcano in the Democratic Republic of Congo with the summit truncated by a small 2 x 2.3 km caldera with walls up to about 100 m high. Documented eruptions have occurred within the summit caldera, as well as from numerous flank fissures and cinder cones. The current eruption period began in April 2018 and has more recently been characterized by summit crater lava flows and thermal activity (BGVN 48:05). This report describes lava flows and variable thermal activity during May through October 2023, based on information from the Observatoire Volcanologique de Goma (OVG) and various satellite data.
Lava lake activity continued during May. The MIROVA (Middle InfraRed Observation of Volcanic Activity) system recorded moderate-to-strong thermal activity throughout the reporting period; activity was more intense during May and October and relatively weaker from June through September (figure 95). The MODVOLC thermal algorithm, detected a total of 209 thermal alerts. There were 143 hotspots detected during May, eight during June, nine during September, and 49 during October. This activity was also reflected in infrared satellite images, where a lava flow was visible in the NW part of the crater on 7 May and strong activity was seen in the center of the crater on 4 October (figure 96). Another infrared satellite image taken on 12 May showed still active lava flows along the NW margin of the crater. According to OVG lava effusions were active during 7-29 May and moved to the N and NW parts of the crater beginning on 9 May. Strong summit crater incandescence was visible from Goma (27 km S) during the nights of 17, 19, and 20 May (figure 97). On 17 May there was an increase in eruptive activity, which peaked at 0100 on 20 May. Notable sulfur dioxide plumes drifted NW and W during 19-20 May (figure 98). Drone footage acquired in partnership with the USGS (United States Geological Survey) on 20 May captured images of narrow lava flows that traveled about 100 m down the W flank (figure 99). Data from the Rumangabo seismic station indicated a decreasing trend in activity during 17-21 May. Although weather clouds prevented clear views of the summit, a strong thermal signature on the NW flank was visible in an infrared satellite image on 22 May, based on an infrared satellite image. On 28 May the lava flows on the upper W flank began to cool and solidify. By 29 May seismicity returned to levels similar to those recorded before the 17 May increase. Lava effusion continued but was confined to the summit crater; periodic crater incandescence was observed.
Low-level activity was noted during June through October. On 1 June OVG reported that seismicity remained at lower levels and that crater incandescence had been absent for three days, though infrared satellite imagery showed continued lava effusion in the summit crater. The lava flows on the flanks covered an estimated 0.6 km2. Satellite imagery continued to show thermal activity confined to the lava lake through October (figure 96), although no lava flows or significant sulfur dioxide emissions were reported.
Geologic Background. Africa's most active volcano, Nyamulagira (also known as Nyamuragira), is a massive high-potassium basaltic shield about 25 km N of Lake Kivu and 13 km NNW of the steep-sided Nyiragongo volcano. The summit is truncated by a small 2 x 2.3 km caldera that has walls up to about 100 m high. Documented eruptions have occurred within the summit caldera, as well as from the numerous flank fissures and cinder cones. A lava lake in the summit crater, active since at least 1921, drained in 1938, at the time of a major flank eruption. Recent lava flows extend down the flanks more than 30 km from the summit as far as Lake Kivu; extensive lava flows from this volcano have covered 1,500 km2 of the western branch of the East African Rift.
Information Contacts: Observatoire Volcanologique de Goma (OVG), Departement de Geophysique, Centre de Recherche en Sciences Naturelles, Lwiro, D.S. Bukavu, DR Congo; Hawai'i Institute of Geophysics and Planetology (HIGP) - MODVOLC Thermal Alerts System, School of Ocean and Earth Science and Technology (SOEST), Univ. of Hawai'i, 2525 Correa Road, Honolulu, HI 96822, USA (URL: http://modis.higp.hawaii.edu/); MIROVA (Middle InfraRed Observation of Volcanic Activity), a collaborative project between the Universities of Turin and Florence (Italy) supported by the Centre for Volcanic Risk of the Italian Civil Protection Department (URL: http://www.mirovaweb.it/); NASA Global Sulfur Dioxide Monitoring Page, Atmospheric Chemistry and Dynamics Laboratory, NASA Goddard Space Flight Center (NASA/GSFC), 8800 Greenbelt Road, Goddard, Maryland, USA (URL: https://so2.gsfc.nasa.gov/); Copernicus Browser, Copernicus Data Space Ecosystem, European Space Agency (URL: https://dataspace.copernicus.eu/browser/); Charles Balagizi, Goma Volcano Observatory, Departement de Geophysique, Centre de Recherche en Sciences Naturelles, Lwiro, D.S. Bukavu, DR Congo.
Bagana (Papua New Guinea) — October 2023 Cite this Report
Bagana
Papua New Guinea
6.137°S, 155.196°E; summit elev. 1855 m
All times are local (unless otherwise noted)
Explosions, ash plumes, ashfall, and lava flows during April-September 2023
The remote volcano of Bagana is located in central Bougainville Island, Papua New Guinea. Recorded eruptions date back to 1842 and activity has consisted of effusive activity that has built a small lava dome in the summit crater and occasional explosions that produced pyroclastic flows. The most recent eruption has been ongoing since February 2000 and has produced occasional explosions, ash plumes, and lava flows. More recently, activity has been characterized by ongoing effusive activity and ash emissions (BGVN 48:04). This report updates activity from April through September 2023 that has consisted of explosions, ash plumes, ashfall, and lava flows, using information from the Darwin Volcanic Ash Advisory Center (VAAC) and satellite data.
An explosive eruption was reported on 7 July that generated a large gas-and-ash plume to high altitudes and caused significant ashfall in local communities; the eruption plume had reached upper tropospheric (16-18 km altitude) altitudes by 2200, according to satellite images. Sulfur dioxide plumes were detected in satellite images on 8 July and indicated that the plume was likely a mixture of gas, ice, and ash. A report issued by the Autonomous Bougainville Government (ABG) (Torokina District, Education Section) on 10 July noted that significant ash began falling during 2000-2100 on 7 July and covered most areas in the Vuakovi, Gotana (9 km SW), Koromaketo, Laruma (25 km W) and Atsilima (27 km NW) villages. Pyroclastic flows also occurred, according to ground-based reports; small deposits confined to one drainage were inspected by RVO during an overflight on 17 July and were confirmed to be from the 7 July event. Ashfall continued until 10 July and covered vegetation, which destroyed bushes and gardens and contaminated rivers and streams.
RVO reported another eruption on 14 July. The Darwin VAAC stated that an explosive event started around 0830 on 15 July and produced an ash plume that rose to 16.5 km altitude by 1000 and drifted N, according to satellite images. The plume continued to drift N and remained visible through 1900, and by 2150 it had dissipated.
Ashfall likely from both the 7 and 15 July events impacted about 8,111 people in Torokina (20 km SW), including Tsito/Vuakovi, Gotana, Koromaketo, Kenaia, Longkogari, Kenbaki, Piva (13 km SW), and Atsinima, and in the Tsitovi district, according to ABG. Significant ashfall was also reported in Ruruvu (22 km N) in the Wakunai District of Central Bougainville, though the thickness of these deposits could not be confirmed. An evacuation was called for the villages in Wakunai, where heavy ashfall had contaminated water sources; the communities of Ruruvu, Togarau, Kakarapaia, Karauturi, Atao, and Kuritaturi were asked to evacuate to a disaster center at the Wakunai District Station, and communities in Torokina were asked to evacuate to the Piva District station. According to a news article, more than 7,000 people needed temporary accommodations, with about 1,000 people in evacuation shelters. Ashfall had deposited over a broad area, contaminating water supplies, affecting crops, and collapsing some roofs and houses in rural areas. Schools were temporarily shut down. Intermittent ash emissions continued through the end of July and drifted NNW, NW, and SW. Fine ashfall was reported on the coast of Torokina, and ash plumes also drifted toward Laruma and Atsilima.
A small explosive eruption occurred at 2130 on 28 July that ejected material from the crater vents, according to reports from Torokina, in addition to a lava flow that contained two lobes. A second explosion was detected at 2157. Incandescence from the lava flow was visible from Piva as it descended the W flank around 2000 on 29 July (figure 47). The Darwin VAAC reported that a strong thermal anomaly was visible in satellite images during 30-31 July and that ash emissions rose to 2.4 km altitude and drifted WSW on 30 July. A ground report from RVO described localized emissions at 0900 on 31 July.
The Darwin VAAC reported that ash plumes were identified in satellite imagery at 0800 and 1220 on 12 August and rose to 2.1 km and 3 km altitude and drifted NW and W, respectively. A news report stated that aid was sent to more than 6,300 people that were adversely affected by the eruption. Photos taken during 17-19 August showed ash emissions rising no higher than 1 km above the summit and drifting SE. A small explosion generated an ash plume during the morning of 19 August. Deposits from small pyroclastic flows were also captured in the photos. Satellite images captured lava flows and pyroclastic flow deposits. Two temporary seismic stations were installed near Bagana on 17 August at distances of 7 km WSW (Vakovi station) and 11 km SW (Kepox station). The Kepox station immediately started to record continuous, low-frequency background seismicity.
Satellite data. Little to no thermal activity was detected during April through mid-July 2023; only one anomaly was recorded during early April and one during early June, according to MIROVA (Middle InfraRed Observation of Volcanic Activity) data (figure 48). Thermal activity increased in both power and frequency during mid-July through September, although there were still some short gaps in detected activity. MODVOLC also detected increased thermal activity during August; thermal hotspots were detected a total of five times on 19, 20, and 27 August. Weak thermal anomalies were also captured in infrared satellite images on clear weather days throughout the reporting period on 7, 12, and 17 April, 27 May, 1, 6, 16, and 31 July, and 19 September (figure 48); a strong thermal anomaly was visible on 31 July. Distinct sulfur dioxide plumes that drifted generally NW were intermittently captured by the TROPOMI instrument on the Sentinel-5P satellite and sometimes exceeded two Dobson Units (DUs) (figure 49).
Geologic Background. Bagana volcano, in a remote portion of central Bougainville Island, is frequently active. This massive symmetrical cone was largely constructed by an accumulation of viscous andesitic lava flows. The entire edifice could have been constructed in about 300 years at its present rate of lava production. Eruptive activity is characterized by non-explosive effusion of viscous lava that maintains a small lava dome in the summit crater, although occasional explosive activity produces pyroclastic flows. Lava flows with tongue-shaped lobes up to 50 m thick and prominent levees descend the flanks on all sides.
Information Contacts: Rabaul Volcano Observatory (RVO), Geohazards Management Division, Department of Mineral Policy and Geohazards Management (DMPGM), PO Box 3386, Kokopo, East New Britain Province, Papua New Guinea; Darwin Volcanic Ash Advisory Centre (VAAC), Bureau of Meteorology, Northern Territory Regional Office, PO Box 40050, Casuarina, NT 0811, Australia (URL: http://www.bom.gov.au/info/vaac/); MIROVA (Middle InfraRed Observation of Volcanic Activity), a collaborative project between the Universities of Turin and Florence (Italy) supported by the Centre for Volcanic Risk of the Italian Civil Protection Department (URL: http://www.mirovaweb.it/); Hawai'i Institute of Geophysics and Planetology (HIGP) - MODVOLC Thermal Alerts System, School of Ocean and Earth Science and Technology (SOEST), Univ. of Hawai'i, 2525 Correa Road, Honolulu, HI 96822, USA (URL: http://modis.higp.hawaii.edu/); NASA Global Sulfur Dioxide Monitoring Page, Atmospheric Chemistry and Dynamics Laboratory, NASA Goddard Space Flight Center (NASA/GSFC), 8800 Greenbelt Road, Goddard, Maryland, USA (URL: https://so2.gsfc.nasa.gov/); Copernicus Browser, Copernicus Data Space Ecosystem, European Space Agency (URL: https://dataspace.copernicus.eu/browser/); Autonomous Bougainville Government, P.O Box 322, Buka, AROB, PNG (URL: https://abg.gov.pg/); Andrew Tupper (Twitter: @andrewcraigtupp); Simon Carn, Geological and Mining Engineering and Sciences, Michigan Technological University, 1400 Townsend Drive, Houghton, MI 49931, USA (URL: http://www.volcarno.com/, Twitter: @simoncarn); Radio NZ (URL: https://www.rnz.co.nz/news/pacific/494464/more-than-7-000-people-in-bougainville-need-temporary-accommodation-after-eruption); USAID, 1300 Pennsylvania Ave, NW, Washington DC 20004, USA (URL: https://www.usaid.gov/pacific-islands/press-releases/aug-08-2023-united-states-provides-immediate-emergency-assistance-support-communities-affected-mount-bagana-volcanic-eruptions).
Mayon (Philippines) — October 2023 Cite this Report
Mayon
Philippines
13.257°N, 123.685°E; summit elev. 2462 m
All times are local (unless otherwise noted)
Lava flows, pyroclastic flows, ash emissions, and seismicity during April-September 2023
Mayon is located in the Philippines and has steep upper slopes capped by a small summit crater. Historical eruptions date back to 1616 CE that have been characterized by Strombolian eruptions, lava flows, pyroclastic flows, and mudflows. Eruptions mostly originated from a central conduit. Pyroclastic flows and mudflows have commonly descended many of the approximately 40 drainages that surround the volcano. The most recent eruption occurred during June through October 2022 and consisted of lava dome growth and gas-and-steam emissions (BGVN 47:12). A new eruption was reported during late April 2023 and has included lava flows, pyroclastic density currents, ash emissions, and seismicity. This report covers activity during April through September 2023 based on daily bulletins from the Philippine Institute of Volcanology and Seismology (PHIVOLCS).
During April through September 2023, PHIVOLCS reported near-daily rockfall events, frequent volcanic earthquakes, and sulfur dioxide measurements. Gas-and-steam emissions rose 100-900 m above the crater and drifted in different directions. Nighttime crater incandescence was often visible during clear weather and was accompanied by incandescent avalanches of material. Activity notably increased during June when lava flows were reported on the S, SE, and E flanks (figure 52). The MIROVA graph (Middle InfraRed Observation of Volcanic Activity) showed strong thermal activity coincident with these lava flows, which remained active through September (figure 53). According to the MODVOLC thermal algorithm, a total of 110 thermal alerts were detected during the reporting period: 17 during June, 40 during July, 27 during August, and 26 during September. During early June, pyroclastic density currents (PDCs) started to occur more frequently.
Low activity was reported during much of April and May; gas-and-steam emissions rose 100-900 m above the crater and generally drifted in different directions. A total of 52 rockfall events and 18 volcanic earthquakes were detected during April and 147 rockfall events and 13 volcanic events during May. Sulfur dioxide flux measurements ranged between 400-576 tons per day (t/d) during April, the latter of which was measured on 29 April and between 162-343 t/d during May, the latter of which was measured on 13 May.
Activity during June increased, characterized by lava flows, pyroclastic density currents (PDCs), crater incandescence and incandescent rockfall events, gas-and-steam emissions, and continued seismicity. Weather clouds often prevented clear views of the summit, but during clear days, moderate gas-and-steam emissions rose 100-2,500 m above the crater and drifted in multiple directions. A total of 6,237 rockfall events and 288 volcanic earthquakes were detected. The rockfall events often deposited material on the S and SE flanks within 700-1,500 m of the summit crater and ash from the events drifted SW, S, SE, NE, and E. Sulfur dioxide emissions ranged between 149-1,205 t/d, the latter of which was measured on 10 June. Short-term observations from EDM and electronic tiltmeter monitoring indicated that the upper slopes were inflating since February 2023. Longer-term ground deformation parameters based on EDM, precise leveling, continuous GPS, and electronic tilt monitoring indicated that the volcano remained inflated, especially on the NW and SE flanks. At 1000 on 5 June the Volcano Alert Level (VAL) was raised to 2 (on a 0-5 scale). PHIVOLCS noted that although low-level volcanic earthquakes, ground deformation, and volcanic gas emissions indicated unrest, the steep increase in rockfall frequency may indicate increased dome activity.
A total of 151 dome-collapse PDCs occurred during 8-9 and 11-30 June, traveled 500-2,000 m, and deposited material on the S flank within 2 km of the summit crater. During 8-9 June the VAL was raised to 3. At approximately 1947 on 11 June lava flow activity was reported; two lobes traveled within 500 m from the crater and deposited material on the S (Mi-isi), SE (Bonga), and E (Basud) flanks. Weak seismicity accompanied the lava flow and slight inflation on the upper flanks. This lava flow remained active through 30 June, moving down the S and SE flank as far as 2.5 km and 1.8 km, respectively and depositing material up to 3.3 km from the crater. During 15-16 June traces of ashfall from the PDCs were reported in Sitio Buga, Nabonton, City of Ligao and Purok, and San Francisco, Municipality of Guinobatan. During 28-29 June there were two PDCs generated by the collapse of the lava flow front, which generated a light-brown ash plume 1 km high. Satellite monitors detected significant concentrations of sulfur dioxide beginning on 29 June. On 30 June PDCs primarily affected the Basud Gully on the E flank, the largest of which occurred at 1301 and lasted eight minutes, based on the seismic record. Four PDCs generated between 1800 and 2000 that lasted approximately four minutes each traveled 3-4 km on the E flank and generated an ash plume that rose 1 km above the crater and drifted N and NW. Ashfall was recorded in Tabaco City.
Similar strong activity continued during July; slow lava effusion remained active on the S and SE flanks and traveled as far as 2.8 km and 2.8 km, respectively and material was deposited as far as 4 km from the crater. There was a total of 6,983 rockfall events and 189 PDCs that affected the S, SE, and E flanks. The volcano network detected a total of 2,124 volcanic earthquakes. Continuous gas-and-steam emissions rose 200-2,000 m above the crater and drifted in multiple directions. Sulfur dioxide emissions averaged 792-4,113 t/d, the latter of which was measured on 28 July. During 2-4 July three PDCs were generated from the collapse of the lava flow and resulting light brown plumes rose 200-300 m above the crater. Continuous tremor pulses were reported beginning at 1547 on 3 July through 7 July at 1200, at 2300 on 8 July and going through 0300 on 10 July, and at 2300 on 16 July, as recorded by the seismic network. During 6-9 July there were 10 lava flow-collapse-related PDCs that generated light brown plumes 300-500 m above the crater. During 10-11 July light ashfall was reported in some areas of Mabinit, Legazpi City, Budiao and Salvacion, Daraga, and Camalig, Albay. By 18 July the lava flow advanced 600 m on the E flank as well.
During 1733 on 18 July and 0434 on 19 July PHIVOLCS reported 30 “ashing” events, which are degassing events accompanied by audible thunder-like sounds and entrained ash at the crater, which produced short, dark plumes that drifted SW. These events each lasted 20-40 seconds, and plume heights ranged from 150-300 m above the crater, as recorded by seismic, infrasound, visual, and thermal monitors. Three more ashing events occurred during 19-20 July. Short-term observations from electronic tilt and GPS monitoring indicate deflation on the E lower flanks in early July and inflation on the NW middle flanks during the third week of July. Longer-term ground deformation parameters from EDM, precise leveling, continuous GPS, and electronic tilt monitoring indicated that the volcano was still generally inflated relative to baseline levels. A short-lived lava pulse lasted 28 seconds at 1956 on 21 July, which was accompanied by seismic and infrasound signals. By 22 July, the only lava flow that remained active was on the SE flank, and continued to extend 3.4 km, while those on the S and E flanks weakened markedly. One ashing event was detected during 30-31 July, whereas there were 57 detected during 31 July-1 August; according to PHIVOLCS beginning at approximately 1800 on 31 July eruptive activity was dominated by phases of intermittent ashing, as well as increased in the apparent rates of lava effusion from the summit crater. The ashing phases consisted of discrete events recorded as low-frequency volcanic earthquakes (LFVQ) typically 30 seconds in duration, based on seismic and infrasound signals. Gray ash plume rose 100 m above the crater and generally drifted NE. Shortly after these ashing events began, new lava began to effuse rapidly from the crater, feeding the established flowed on the SE, E, and E flanks and generating frequent rockfall events.
Intensified unrest persisted during August. There was a total of 4,141 rockfall events, 2,881 volcanic earthquakes, which included volcanic tremor events, 32 ashing events, and 101 PDCs detected throughout the month. On clear weather days, gas-and-steam emissions rose 300-1,500 m above the crater and drifted in different directions (figure 54). Sulfur dioxide emissions averaged 735-4,756 t/d, the higher value of which was measured on 16 August. During 1-2 August the rate of lava effusion decreased, but continued to feed the flows on the SE, S, and E flanks, maintaining their advances to 3.4 km, 2.8 km, and 1.1 km from the crater, respectively (figure 55). Rockfall and PDCs generated by collapses at the lava flow margins and from the summit dome deposited material within 4 km of the crater. During 3-4 August there were 10 tremor events detected that lasted 1-4 minutes. Short-lived lava pulse lasted 35 seconds and was accompanied by seismic and infrasound signals at 0442 on 6 August. Seven collapses were recorded at the front of the lava flow during 12-14 August.
During September, similar activity of slow lava effusion, PDCs, gas-and-steam emissions, and seismicity continued. There was a total of 4,452 rockfall events, 329 volcanic earthquakes, which included volcanic tremor events, two ashing events, and 85 PDCs recorded throughout the month. On clear weather days, gas-and-steam emissions rose 100-1,500 m above the crater and drifted in multiple directions. Sulfur dioxide emissions averaged 609-2,252 t/d, the higher average of which was measured on 6 September. Slow lava effusion continued advancing on the SE, S, and E flanks, maintaining lengths of 3.4 km, 2.8 km, and 1.1 km, respectively. Rockfall and PDC events generated by collapses along the lava flow margins and at the summit dome deposited material within 4 km of the crater.
Geologic Background. Symmetrical Mayon, which rises above the Albay Gulf NW of Legazpi City, is the most active volcano of the Philippines. The steep upper slopes are capped by a small summit crater. Recorded eruptions since 1616 CE range from Strombolian to basaltic Plinian, with cyclical activity beginning with basaltic eruptions, followed by longer periods of andesitic lava flows. Eruptions occur predominately from the central conduit and have also produced lava flows that travel far down the flanks. Pyroclastic density currents and mudflows have commonly swept down many of the approximately 40 ravines that radiate from the summit and have often damaged populated lowland areas. A violent eruption in 1814 killed more than 1,200 people and devastated several towns.
Information Contacts: Philippine Institute of Volcanology and Seismology (PHIVOLCS), Department of Science and Technology, University of the Philippines Campus, Diliman, Quezon City, Philippines (URL: http://www.phivolcs.dost.gov.ph/); MIROVA (Middle InfraRed Observation of Volcanic Activity), a collaborative project between the Universities of Turin and Florence (Italy) supported by the Centre for Volcanic Risk of the Italian Civil Protection Department (URL: http://www.mirovaweb.it/); Hawai'i Institute of Geophysics and Planetology (HIGP) - MODVOLC Thermal Alerts System, School of Ocean and Earth Science and Technology (SOEST), Univ. of Hawai'i, 2525 Correa Road, Honolulu, HI 96822, USA (URL: http://modis.higp.hawaii.edu/); Copernicus Browser, Copernicus Data Space Ecosystem, European Space Agency (URL: https://dataspace.copernicus.eu/browser/); William Rogers, Legazpi City, Albay Province, Philippines.
Nishinoshima (Japan) — October 2023 Cite this Report
Nishinoshima
Japan
27.247°N, 140.874°E; summit elev. 100 m
All times are local (unless otherwise noted)
Eruption plumes and gas-and-steam plumes during May-August 2023
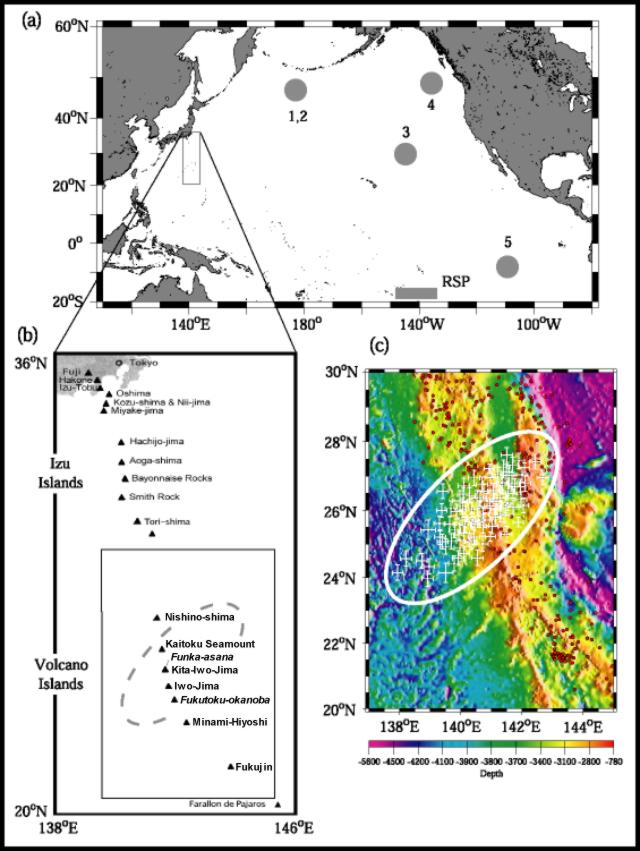
Nishinoshima, located about 1,000 km S of Tokyo, is a small island in the Ogasawara Arc in Japan. The island is the summit of a massive submarine volcano that has prominent submarine peaks to the S, W, and NE. Eruptions date back to 1973 and the current eruption period began in October 2022. Recent activity has consisted of small ash plumes and fumarolic activity (BGVN 48:07). This report covers activity during May through August 2023, using information from monthly reports of the Japan Meteorological Agency (JMA) monthly reports and satellite data.
Activity during May through June was relatively low. The Japan Coast Guard (JCG) did overflights on 14 and 22 June and reported white gas-and-steam emissions rising 600 m and 1,200 m from the central crater of the pyroclastic cone, respectively (figure 125). In addition, multiple white gas-and-steam emissions rose from the inner rim of the W side of the crater and from the SE flank of the pyroclastic cone. Discolored brown-to-green water was observed around almost the entire perimeter of the island; on 22 June light green discolored water was observed off the S coast of the island.
Observations from the Himawari meteorological satellite confirmed an eruption on 9 and 10 July. An eruption plume rose 1.6 km above the crater and drifted N around 1300 on 9 July. Satellite images acquired at 1420 and 2020 on 9 July and at 0220 on 10 July showed continuing emissions that rose 1.3-1.6 km above the crater and drifted NE and N. The Tokyo VAAC reported that an ash plume seen by a pilot and identified in a satellite image at 0630 on 21 July rose to 3 km altitude and drifted S.
Aerial observations conducted by JCG on 8 August showed a white-and-gray plume rising from the central crater of the pyroclastic cone, and multiple white gas-and-steam emissions were rising from the inner edge of the western crater and along the NW-SE flanks of the island (figure 126). Brown-to-green discolored water was also noted around the perimeter of the island.
Intermittent low-to-moderate power thermal anomalies were recorded in the MIROVA graph (Middle InfraRed Observation of Volcanic Activity), showing an increase in both frequency and power beginning in July (figure 127). This increase in activity coincides with eruptive activity on 9 and 10 July, characterized by eruption plumes. According to the MODVOLC thermal alert algorithm, one thermal hotspot was recorded on 20 July. Weak thermal anomalies were also detected in infrared satellite imagery, accompanied by strong gas-and-steam plumes (figure 128).
Geologic Background. The small island of Nishinoshima was enlarged when several new islands coalesced during an eruption in 1973-74. Multiple eruptions that began in 2013 completely covered the previous exposed surface and continued to enlarge the island. The island is the summit of a massive submarine volcano that has prominent peaks to the S, W, and NE. The summit of the southern cone rises to within 214 m of the ocean surface 9 km SSE.
Information Contacts: Japan Meteorological Agency (JMA), 1-3-4 Otemachi, Chiyoda-ku, Tokyo 100-8122, Japan (URL: http://www.jma.go.jp/jma/indexe.html); Tokyo Volcanic Ash Advisory Center (VAAC), 1-3-4 Otemachi, Chiyoda-ku, Tokyo 100-8122, Japan (URL: http://ds.data.jma.go.jp/svd/vaac/data/); MIROVA (Middle InfraRed Observation of Volcanic Activity), a collaborative project between the Universities of Turin and Florence (Italy) supported by the Centre for Volcanic Risk of the Italian Civil Protection Department (URL: http://www.mirovaweb.it/); Copernicus Browser, Copernicus Data Space Ecosystem, European Space Agency (URL: https://dataspace.copernicus.eu/browser/).
Krakatau (Indonesia) — October 2023 Cite this Report
Krakatau
Indonesia
6.1009°S, 105.4233°E; summit elev. 285 m
All times are local (unless otherwise noted)
White gas-and-steam plumes and occasional ash plumes during May-August 2023
Krakatau is located in the Sunda Strait between Java and Sumatra, Indonesia. Caldera collapse during the catastrophic 1883 eruption destroyed Danan and Perbuwatan cones and left only a remnant of Rakata. The post-collapse cone of Anak Krakatau (Child of Krakatau) was constructed within the 1883 caldera at a point between the former Danan and Perbuwatan cones; it has been the site of frequent eruptions since 1927. The current eruption period began in May 2021 and has recently consisted of Strombolian eruptions and ash plumes (BGVN 48:07). This report describes lower levels of activity consisting of ash and white gas-and-steam plumes during May through August 2023, based on information provided by the Indonesian Center for Volcanology and Geological Hazard Mitigation, referred to as Pusat Vulkanologi dan Mitigasi Bencana Geologi (PVMBG), MAGMA Indonesia, and satellite data.
Activity was relatively low during May and June. Daily white gas-and-steam emissions rose 25-200 m above the crater and drifted in different directions. Five ash plumes were detected at 0519 on 10 May, 1241 on 11 May, 0920 on 12 May, 2320 on 12 May, and at 0710 on 13 May, and rose 1-2.5 km above the crater and drifted SW. A webcam image taken on 12 May showed ejection of incandescent material above the vent. A total of nine ash plumes were detected during 6-11 June: at 1434 and 00220 on 6 and 7 June the ash plumes rose 500 m above the crater and drifted NW, at 1537 on 8 June the ash plume rose 1 km above the crater and drifted SW, at 0746 and at 0846 on 9 June the ash plumes rose 800 m and 3 km above the crater and drifted SW, respectively, at 0423, 1431, and 1750 on 10 June the ash plumes rose 2 km, 1.5 km, and 3.5 km above the crater and drifted NW, respectively, and at 0030 on 11 June an ash plume rose 2 km above the crater and drifted NW. Webcam images taken on 10 and 11 June at 0455 and 0102, respectively, showed incandescent material ejected above the vent. On 19 June an ash plume at 0822 rose 1.5 km above the crater and drifted SE.
Similar low activity of white gas-and-steam emissions and few ash plumes were reported during July and August. Daily white gas-and-steam emissions rose 25-300 m above the crater and drifted in multiple directions. Three ash plumes were reported at 0843, 0851, and 0852 on 20 July that rose 500-2,000 m above the crater and drifted NW.
The MIROVA (Middle InfraRed Observation of Volcanic Activity) graph of MODIS thermal anomaly data showed intermittent low-to-moderate power thermal anomalies during May through August 2023 (figure 140). Although activity was often obscured by weather clouds, a thermal anomaly was visible in an infrared satellite image of the crater on 12 May, accompanied by an eruption plume that drifted SW (figure 141).
Geologic Background. The renowned Krakatau (frequently mis-named as Krakatoa) volcano lies in the Sunda Strait between Java and Sumatra. Collapse of an older edifice, perhaps in 416 or 535 CE, formed a 7-km-wide caldera. Remnants of that volcano are preserved in Verlaten and Lang Islands; subsequently the Rakata, Danan, and Perbuwatan cones were formed, coalescing to create the pre-1883 Krakatau Island. Caldera collapse during the catastrophic 1883 eruption destroyed Danan and Perbuwatan, and left only a remnant of Rakata. This eruption caused more than 36,000 fatalities, most as a result of tsunamis that swept the adjacent coastlines of Sumatra and Java. Pyroclastic surges traveled 40 km across the Sunda Strait and reached the Sumatra coast. After a quiescence of less than a half century, the post-collapse cone of Anak Krakatau (Child of Krakatau) was constructed within the 1883 caldera at a point between the former Danan and Perbuwatan cones. Anak Krakatau has been the site of frequent eruptions since 1927.
Information Contacts: Pusat Vulkanologi dan Mitigasi Bencana Geologi (PVMBG, also known as Indonesian Center for Volcanology and Geological Hazard Mitigation, CVGHM), Jalan Diponegoro 57, Bandung 40122, Indonesia (URL: http://www.vsi.esdm.go.id/); MAGMA Indonesia, Kementerian Energi dan Sumber Daya Mineral (URL: https://magma.esdm.go.id/v1); MIROVA (Middle InfraRed Observation of Volcanic Activity), a collaborative project between the Universities of Turin and Florence (Italy) supported by the Centre for Volcanic Risk of the Italian Civil Protection Department (URL: http://www.mirovaweb.it/); Copernicus Browser, Copernicus Data Space Ecosystem, European Space Agency (URL: https://dataspace.copernicus.eu/browser/).
Merapi (Indonesia) — October 2023 Cite this Report
Merapi
Indonesia
7.54°S, 110.446°E; summit elev. 2910 m
All times are local (unless otherwise noted)
Frequent incandescent avalanches during April-September 2023
Merapi, located just north of the major city of Yogyakarta in central Java, Indonesia, has had activity within the last 20 years characterized by pyroclastic flows and lahars accompanying growth and collapse of the steep-sided active summit lava dome. The current eruption period began in late December 2020 and has more recently consisted of ash plumes, intermittent incandescent avalanches of material, and pyroclastic flows (BGVN 48:04). This report covers activity during April through September 2023, based on information from Balai Penyelidikan dan Pengembangan Teknologi Kebencanaan Geologi (BPPTKG), the Center for Research and Development of Geological Disaster Technology, a branch of PVMBG which specifically monitors Merapi. Additional information comes from the Pusat Vulkanologi dan Mitigasi Bencana Geologi (PVMBG, also known as Indonesian Center for Volcanology and Geological Hazard Mitigation, CVGHM), MAGMA Indonesia, the Darwin Volcanic Ash Advisory Centre (VAAC), and various satellite data.
Activity during April through September 2023 primarily consisted of incandescent avalanches of material that mainly affected the SW and W flanks and traveled as far as 2.3 km from the summit (table 25) and white gas-and-steam emissions that rose 10-1,000 m above the crater.
Table 25. Monthly summary of avalanches and avalanche distances recorded at Merapi during April through September 2023. The number of reported avalanches does not include instances where possible avalanches were heard but could not be visually confirmed as a result of inclement weather. Data courtesy of BPPTKG (April-September 2023 daily reports).
| Month |
Average number of avalanches per day |
Distance avalanches traveled (m) |
| Apr 2023 |
19 |
1,200-2,000 |
| May 2023 |
22 |
500-2,000 |
| Jun 2023 |
18 |
1,200-2,000 |
| Jul 2023 |
30 |
300-2,000 |
| Aug 2023 |
25 |
400-2,300 |
| Sep 2023 |
23 |
600-2,000 |
BPPTKG reported that during April and May white gas-and-steam emissions rose 10-750 m above the crater, incandescent avalanches descended 500-2,000 m on the SW and W flanks (figure 135). Cloudy weather often prevented clear views of the summit, and sometimes avalanches could not be confirmed. According to a webcam image, a pyroclastic flow was visible on 17 April at 0531. During the week of 28 April and 4 May a pyroclastic flow was reported on the SW flank, traveling up to 2.5 km. According to a drone overflight taken on 17 May the SW lava dome volume was an estimated 2,372,800 cubic meters and the dome in the main crater was an estimated 2,337,300 cubic meters.
During June and July similar activity persisted with white gas-and-steam emissions rising 10-350 m above the crater and frequent incandescent avalanches that traveled 300-2,000 m down the SW, W, and S flanks (figure 136). Based on an analysis of aerial photos taken on 24 June the volume of the SW lava dome was approximately 2.5 million cubic meters. A pyroclastic flow was observed on 5 July that traveled 2.7 km on the SW flank. According to the Darwin VAAC multiple minor ash plumes were identified in satellite images on 19 July that rose to 3.7 km altitude and drifted S and SW. During 22, 25, and 26 July a total of 17 avalanches descended as far as 1.8 km on the S flank.
Frequent white gas-and-steam emissions continued during August and September, rising 10-450 m above the crater. Incandescent avalanches mainly affected the SW and W flanks and traveled 400-2,300 m from the vent (figure 137). An aerial survey conducted on 10 August was analyzed and reported that estimates of the SW dome volume was 2,764,300 cubic meters and the dome in the main crater was 2,369,800 cubic meters.
Frequent and moderate-power thermal activity continued throughout the reporting period, according to a MIROVA (Middle InfraRed Observation of Volcanic Activity) analysis of MODIS satellite data (figure 138). There was an increase in the number of detected anomalies during mid-May. The MODVOLC thermal algorithm recorded a total of 47 thermal hotspots: six during April, nine during May, eight during June, 15 during July, four during August, and five during September. Some of this activity was captured in infrared satellite imagery on clear weather days, sometimes accompanied by incandescent material on the SW flank (figure 139).
Geologic Background. Merapi, one of Indonesia's most active volcanoes, lies in one of the world's most densely populated areas and dominates the landscape immediately north of the major city of Yogyakarta. It is the youngest and southernmost of a volcanic chain extending NNW to Ungaran volcano. Growth of Old Merapi during the Pleistocene ended with major edifice collapse perhaps about 2,000 years ago, leaving a large arcuate scarp cutting the eroded older Batulawang volcano. Subsequent growth of the steep-sided Young Merapi edifice, its upper part unvegetated due to frequent activity, began SW of the earlier collapse scarp. Pyroclastic flows and lahars accompanying growth and collapse of the steep-sided active summit lava dome have devastated cultivated lands on the western-to-southern flanks and caused many fatalities.
Information Contacts: Balai Penyelidikan dan Pengembangan Teknologi Kebencanaan Geologi (BPPTKG), Center for Research and Development of Geological Disaster Technology (URL: http://merapi.bgl.esdm.go.id/, Twitter: @BPPTKG); MAGMA Indonesia, Kementerian Energi dan Sumber Daya Mineral (URL: https://magma.esdm.go.id/v1); Pusat Vulkanologi dan Mitigasi Bencana Geologi (PVMBG, also known as Indonesian Center for Volcanology and Geological Hazard Mitigation, CVGHM), Jalan Diponegoro 57, Bandung 40122, Indonesia (URL: http://www.vsi.esdm.go.id/); Darwin Volcanic Ash Advisory Centre (VAAC), Bureau of Meteorology, Northern Territory Regional Office, PO Box 40050, Casuarina, NT 0811, Australia (URL: http://www.bom.gov.au/info/vaac/); MIROVA (Middle InfraRed Observation of Volcanic Activity), a collaborative project between the Universities of Turin and Florence (Italy) supported by the Centre for Volcanic Risk of the Italian Civil Protection Department (URL: http://www.mirovaweb.it/); Hawai'i Institute of Geophysics and Planetology (HIGP) - MODVOLC Thermal Alerts System, School of Ocean and Earth Science and Technology (SOEST), Univ. of Hawai'i, 2525 Correa Road, Honolulu, HI 96822, USA (URL: http://modis.higp.hawaii.edu/); Copernicus Browser, Copernicus Data Space Ecosystem, European Space Agency (URL: https://dataspace.copernicus.eu/browser/); Øystein Lund Andersen (URL: https://www.oysteinlundandersen.com/, https://twitter.com/oysteinvolcano).
Villarrica (Chile) — October 2023 Cite this Report
Villarrica
Chile
39.42°S, 71.93°W; summit elev. 2847 m
All times are local (unless otherwise noted)
Strombolian activity, gas-and-ash emissions, and crater incandescence during April-September 2023
Villarrica, in central Chile, consists of a 2-km-wide caldera that formed about 3,500 years ago and is located at the base of the presently active cone at the NW margin of a 6-km-wide caldera. Historical eruptions eruptions date back to 1558 and have been characterized by mild-to-moderate explosive activity with occasional lava effusions. The current eruption period began in December 2014 and has recently consisted of nighttime crater incandescence, ash emissions, and seismicity (BGVN 48:04). This report covers activity during April through September 2023 and describes occasional Strombolian activity, gas-and-ash emissions, and nighttime crater incandescence. Information for this report primarily comes from the Southern Andes Volcano Observatory (Observatorio Volcanológico de Los Andes del Sur, OVDAS), part of Chile's National Service of Geology and Mining (Servicio Nacional de Geología y Minería, SERNAGEOMIN) and satellite data.
Seismicity during April consisted of long period (LP) events and tremor (TRE); a total of 9,413 LP-type events and 759 TR-type events were detected throughout the month. Nighttime crater incandescence persisted and was visible in the degassing column. Sulfur dioxide data was obtained using Differential Absorption Optical Spectroscopy Equipment (DOAS) that showed an average value of 1,450 ± 198 tons per day (t/d) during 1-15 April and 1,129 ± 201 t/d during 16-30 April, with a maximum daily value of 2,784 t/d on 9 April. Gas-and-steam emissions of variable intensities rose above the active crater as high as 1.3 km above the crater on 13 April. Strombolian explosions were not observed and there was a slight decrease in the lava lake level.
There were 14,123 LP-type events and 727 TR-type events detected during May. According to sulfur dioxide measurements taken with DOAS equipment, the active crater emitted an average value of 1,826 ± 482 t/d during 1-15 May and 912 ± 41 t/d during 16-30 May, with a daily maximum value of 5,155 t/d on 13 May. Surveillance cameras showed continuous white gas-and-steam emissions that rose as high as 430 m above the crater on 27 May. Nighttime incandescence illuminated the gas column less than 300 m above the crater rim was and no pyroclastic emissions were reported. A landslide was identified on 13 May on the E flank of the volcano 50 m from the crater rim and extending 300 m away; SERNAGEOMIN noted that this event may have occurred on 12 May. During the morning of 27 and 28 May minor Strombolian explosions characterized by incandescent ejecta were recorded at the crater rim; the last reported Strombolian explosions had occurred at the end of March.
Seismic activity during June consisted of five volcano-tectonic (VT)-type events, 21,606 LP-type events, and 2,085 TR-type events. The average value of sulfur dioxide flux obtained by DOAS equipment was 1,420 ± 217 t/d during 1-15 June and 2,562 ± 804 t/d, with a maximum daily value of 4,810 t/d on 17 June. White gas-and-steam emissions rose less than 480 m above the crater; frequent nighttime crater incandescence was reflected in the degassing plume. On 12 June an emission rose 100 m above the crater and drifted NNW. On 15 June one or several emissions resulted in ashfall to the NE as far as 5.5 km from the crater, based on a Skysat satellite image. Several Strombolian explosions occurred within the crater; activity on 15 June was higher energy and ejected blocks 200-300 m on the NE slope. Surveillance cameras showed white gas-and-steam emissions rising 480 m above the crater on 16 June. On 19 and 24 June low-intensity Strombolian activity was observed, ejecting material as far as 200 m from the center of the crater to the E.
During July, seismicity included 29,319 LP-type events, 3,736 TR-type events, and two VT-type events. DOAS equipment recorded two days of sulfur dioxide emissions of 4,220 t/d and 1,009 t/d on 1 and 13 July, respectively. Constant nighttime incandescence was also recorded and was particularly noticeable when accompanied by eruptive columns on 12 and 16 July. Minor explosive events were detected in the crater. According to Skysat satellite images taken on 12, 13, and 16 July, ashfall deposits were identified 155 m S of the crater. According to POVI, incandescence was visible from two vents on the crater floor around 0336 on 12 July. Gas-and-ash emissions rose as high as 1.2 km above the crater on 13 July and drifted E and NW. A series of gas-and-steam pulses containing some ash deposited material on the upper E flank around 1551 on 13 July. During 16-31 July, average sulfur dioxide emissions of 1,679 ± 406 t/d were recorded, with a maximum daily value of 2,343 t/d on 28 July. Fine ash emissions were also reported on 16, 17, and 23 July.
Seismicity persisted during August, characterized by 27,011 LP-type events, 3,323 TR-type events, and three VT-type events. The average value of sulfur dioxide measurements taken during 1-15 August was 1,642 ± 270 t/d and 2,207 ± 4,549 t/d during 16-31 August, with a maximum daily value of 3,294 t/d on 27 August. Nighttime crater incandescence remained visible in degassing columns. White gas-and-steam emissions rose 480 m above the crater on 6 August. According to a Skysat satellite image from 6 August, ash accumulation was observed proximal to the crater and was mainly distributed toward the E slope. White gas-and-steam emissions rose 320 m above the crater on 26 August. Nighttime incandescence and Strombolian activity that generated ash emissions were reported on 27 August.
Seismicity during September was characterized by five VT-type events, 12,057 LP-type events, and 2,058 TR-type events. Nighttime incandescence persisted. On 2 September an ash emission rose 180 m above the crater and drifted SE at 1643 (figure 125) and a white gas-and-steam plume rose 320 m above the crater. According to the Buenos Aires VAAC, periods of continuous gas-and-ash emissions were visible in webcam images from 1830 on 2 September to 0110 on 3 September. Strombolian activity was observed on 2 September and during the early morning of 3 September, the latter event of which generated an ash emission that rose 60 m above the crater and drifted 100 m from the center of the crater to the NE and SW. Ashfall was reported to the SE and S as far as 750 m from the crater. The lava lake was active during 3-4 September and lava fountaining was visible for the first time since 26 March 2023, according to POVI. Fountains captured in webcam images at 2133 on 3 September and at 0054 on 4 September rose as high as 60 m above the crater rim and ejected material onto the upper W flank. Sulfur dioxide flux of 1,730 t/d and 1,281 t/d was measured on 3 and 4 September, respectively, according to data obtained by DOAS equipment.
Strong Strombolian activity and larger gas-and-ash plumes were reported during 18-20 September. On 18 September activity was also associated with energetic LP-type events and notable sulfur dioxide fluxes (as high as 4,277 t/d). On 19 September Strombolian activity and incandescence were observed. On 20 September at 0914 ash emissions rose 50 m above the crater and drifted SSE, accompanied by Strombolian activity that ejected material less than 100 m SSE, causing fall deposits on that respective flank. SERNAGEOMIN reported that a Planet Scope satellite image taken on 20 September showed the lava lake in the crater, measuring 32 m x 35 m and an area of 0.001 km2. Several ash emissions were recorded at 0841, 0910, 1251, 1306, 1312, 1315, and 1324 on 23 September and rose less than 150 m above the crater. The sulfur dioxide flux value was 698 t/d on 23 September and 1,097 t/d on 24 September. On 24 September the Volcanic Alert Level (VAL) was raised to Orange (the third level on a four-color scale). SENAPRED maintained the Alert Level at Yellow (the middle level on a three-color scale) for the communities of Villarrica, Pucón (16 km N), Curarrehue, and Panguipulli.
During 24-25 September there was an increase in seismic energy (observed at TR-events) and acoustic signals, characterized by 1 VT-type event, 213 LP-type events, and 124 TR-type events. Mainly white gas-and-steam emissions, in addition to occasional fine ash emissions were recorded. During the early morning of 25 September Strombolian explosions were reported and ejected material 250 m in all directions, though dominantly toward the NW. On 25 September the average value of sulfur dioxide flux was 760 t/d. Seismicity during 25-30 September consisted of five VT-type events, 1,937 LP-type events, and 456 TR-type events.
During 25-29 September moderate Strombolian activity was observed and ejected material as far as the crater rim. In addition, ash pulses lasting roughly 50 minutes were observed around 0700 and dispersed ENE. During 26-27 September a TR episode lasted 6.5 hours and was accompanied by discrete acoustic signals. Satellite images from 26 September showed a spatter cone on the crater floor with one vent that measured 10 x 14 m and a smaller vent about 35 m NE of the cone. SERNAGEOMIN reported an abundant number of bomb-sized blocks up to 150 m from the crater, as well as impact marks on the snow, which indicated explosive activity. A low-altitude ash emission was observed drifting NW around 1140 on 28 September, based on webcam images. Between 0620 and 0850 on 29 September an ash emission rose 60 m above the crater and drifted NW. During an overflight taken around 1000 on 29 September scientists observed molten material in the vent, a large accumulation of pyroclasts inside the crater, and energetic degassing, some of which contained a small amount of ash. Block-sized pyroclasts were deposited on the internal walls and near the crater, and a distal ash deposit was also visible. The average sulfur dioxide flux measured on 28 September was 344 t/d. Satellite images taken on 29 September ashfall was deposited roughly 3 km WNW from the crater and nighttime crater incandescence remained visible. The average sulfur dioxide flux value from 29 September was 199 t/d. On 30 September at 0740 a pulsating ash emission rose 1.1 km above the crater and drifted NNW (figure 126). Deposits on the S flank extended as far as 4.5 km from the crater rim, based on satellite images from 30 September.
Infrared MODIS satellite data processed by MIROVA (Middle InfraRed Observation of Volcanic Activity) showed intermittent thermal activity during April through September, with slightly stronger activity detected during late September (figure 127). Small clusters of thermal activity were detected during mid-June, early July, early August, and late September. According to the MODVOLC thermal alert system, a total of four thermal hotspots were detected on 7 July and 3 and 23 September. This activity was also intermittently captured in infrared satellite imagery on clear weather days (figure 128).
Geologic Background. The glacier-covered Villarrica stratovolcano, in the northern Lakes District of central Chile, is ~15 km south of the city of Pucon. A 2-km-wide caldera that formed about 3,500 years ago is located at the base of the presently active, dominantly basaltic to basaltic andesite cone at the NW margin of a 6-km-wide Pleistocene caldera. More than 30 scoria cones and fissure vents are present on the flanks. Plinian eruptions and pyroclastic flows that have extended up to 20 km from the volcano were produced during the Holocene. Lava flows up to 18 km long have issued from summit and flank vents. Eruptions documented since 1558 CE have consisted largely of mild-to-moderate explosive activity with occasional lava effusion. Glaciers cover 40 km2 of the volcano, and lahars have damaged towns on its flanks.
Information Contacts: Servicio Nacional de Geología y Minería (SERNAGEOMIN), Observatorio Volcanológico de Los Andes del Sur (OVDAS), Avda Sta María No. 0104, Santiago, Chile (URL: http://www.sernageomin.cl/); Proyecto Observación Villarrica Internet (POVI) (URL: http://www.povi.cl/); Sistema y Servicio Nacional de Prevención y Repuesta Ante Desastres (SENAPRED), Av. Beauchef 1671, Santiago, Chile (URL: https://web.senapred.cl/); Buenos Aires Volcanic Ash Advisory Center (VAAC), Servicio Meteorológico Nacional-Fuerza Aérea Argentina, 25 de mayo 658, Buenos Aires, Argentina (URL: http://www.smn.gov.ar/vaac/buenosaires/inicio.php); MIROVA (Middle InfraRed Observation of Volcanic Activity), a collaborative project between the Universities of Turin and Florence (Italy) supported by the Centre for Volcanic Risk of the Italian Civil Protection Department (URL: http://www.mirovaweb.it/); Hawai'i Institute of Geophysics and Planetology (HIGP) - MODVOLC Thermal Alerts System, School of Ocean and Earth Science and Technology (SOEST), Univ. of Hawai'i, 2525 Correa Road, Honolulu, HI 96822, USA (URL: http://modis.higp.hawaii.edu/); Copernicus Browser, Copernicus Data Space Ecosystem, European Space Agency (URL: https://dataspace.copernicus.eu/browser/).
Ebeko
Russia
50.686°N, 156.014°E; summit elev. 1103 m
All times are local (unless otherwise noted)
Moderate explosive activity with ash plumes continued during June-November 2023
Ebeko, located on the N end of Paramushir Island in Russia’s Kuril Islands just S of the Kamchatka Peninsula, consists of three summit craters along a SSW-NNE line at the northern end of a complex of five volcanic cones. Observed eruptions date back to the late 18th century and have been characterized as small-to-moderate explosions from the summit crater, accompanied by intense fumarolic activity. The current eruptive period began in June 2022, consisting of frequent explosions, ash plumes, and thermal activity (BGVN 47:10, 48:06). This report covers similar activity during June-November 2023, based on information from the Kamchatka Volcanic Eruptions Response Team (KVERT) and satellite data.
Moderate explosive activity continued during June-November 2023 (figures 50 and 51). According to visual data from Severo-Kurilsk, explosions sent ash 2-3.5 km above the summit (3-4.5 km altitude) during most days during June through mid-September. Activity after mid-September was slightly weaker, with ash usually reaching less than 2 km above the summit. According to KVERT the volcano in October and November was, with a few exceptions, either quiet or obscured by clouds that prevented satellite observations. KVERT issued Volcano Observatory Notices for Aviation (VONA) on 8 and 12 June, 13 and 22 July, 3 and 21 August, and 31 October warning of potential aviation hazards from ash plumes drifting 3-15 km from the volcano. Based on satellite data, KVERT reported a persistent thermal anomaly whenever weather clouds permitted viewing.
Geologic Background. The flat-topped summit of the central cone of Ebeko volcano, one of the most active in the Kuril Islands, occupies the northern end of Paramushir Island. Three summit craters located along a SSW-NNE line form Ebeko volcano proper, at the northern end of a complex of five volcanic cones. Blocky lava flows extend west from Ebeko and SE from the neighboring Nezametnyi cone. The eastern part of the southern crater contains strong solfataras and a large boiling spring. The central crater is filled by a lake about 20 m deep whose shores are lined with steaming solfataras; the northern crater lies across a narrow, low barrier from the central crater and contains a small, cold crescentic lake. Historical activity, recorded since the late-18th century, has been restricted to small-to-moderate explosive eruptions from the summit craters. Intense fumarolic activity occurs in the summit craters, on the outer flanks of the cone, and in lateral explosion craters.
Information Contacts: Kamchatka Volcanic Eruptions Response Team (KVERT), Far Eastern Branch, Russian Academy of Sciences, 9 Piip Blvd., Petropavlovsk-Kamchatsky, 683006, Russia (URL: http://www.kscnet.ru/ivs/kvert/).
Search Bulletin Archive by Publication Date
Select a month and year from the drop-downs and click "Show Issue" to have that issue displayed in this tab.
The default month and year is the latest issue available.
Bulletin of the Global Volcanism Network - Volume 28, Number 06 (June 2003)
Managing Editor: Richard Wunderman
Additional Reports (Unknown)
Japan: Hydroacoustic signals detected during 1998-2002 in the Volcano Islands
Anatahan (United States)
Small lava dome in inner crater destroyed by explosion; activity declines
Colima (Mexico)
Year-long eruption ended in late February 2003 after eight lava flows
Deception Island (Antarctica)
Fieldwork shows moderate seismicity and stable fumarole temperatures
Dieng Volcanic Complex (Indonesia)
Plume emissions and modest seismicity through early July 2002
Dukono (Indonesia)
Ash eruptions in February, June, and July 2003
Fournaise, Piton de la (France)
Lava flows in Dolomieu crater; eruption ends 7 July
Iliwerung (Indonesia)
Increase in felt earthquakes during October 2001
Kanlaon (Philippines)
Ash-and-steam explosions between 23 May and 4 July; minor ashfall on 8 June
Kelud (Indonesia)
Crater lake temperature drops in early 2001; no activity reported
Lewotobi (Indonesia)
Minor explosion and ashfall on 30 May
Lopevi (Vanuatu)
June ash plumes to altitudes of 2.5-12 km; small lava flow
Reventador (Ecuador)
Lahars, mudflows, and steam emissions continue through mid-July
Soufriere Hills (United Kingdom)
Dome growth, pyroclastic flows, and rockfalls through June
Additional Reports (Unknown) — June 2003 Cite this Report
Additional Reports
Unknown
Unknown, Unknown; summit elev. m
All times are local (unless otherwise noted)
Japan: Hydroacoustic signals detected during 1998-2002 in the Volcano Islands
Robert Dziak and Christopher Fox at the National Oceanic and Atmospheric Administration's Pacific Marine Environmental Laboratory (NOAA PMEL), reported that a continuous series of low-frequency, long-duration signals were recorded beginning on 18 April 1998, and then during the next 3.3 years by omnidirectional hydrophones deployed throughout the Pacific basin (see BGVN 24:11, 24:12, and 25:05). These hydroacoustic signals were detected 21 different times from April 1998 through December 1999. After a 6-month hiatus, the signals were detected 26 more times from June 2000 through August 2001 (figure 5). The authors concluded that the signals came from a source in the Volcano Islands.
Dziak and Fox (2002) reported that "The character of the acoustic signals recorded from the Volcano Islands resembles tremor recorded during episodes of magmatic activity at subaerial volcanoes, suggesting that a significant magmatic, and potentially eruptive, process took place in the Volcano Islands between April 1998 and August 2001 and may occur again. To the authors' knowledge, the character of the Volcano Islands harmonic tremor with a 10-Hz fundamental and multiple overtones has not been previously recorded from a submarine volcano. Additionally, detection of harmonic tremor at teleseismic distances (>30°) is a rare occurrence for either a subaerial or submarine volcano."
Matt Fowler (Oregon State University) provided the following information on harmonic tremors from S of Japan from October 2000 to September 2002; all the tremor signals are from the same general area (figure 5) and have roughly the same frequency-time characteristics. Data through August 2001 were also reported by Dziak and Fox (2002). Possible tremors were detected on 18 and 28-31 October, 5, 9, 13, and 19 November 2000. Definite tremors were identified on 17, 22, and 30 December 2000, 13 January 2001, and 15-20 February 2001. During 21-23 February 2001 the tremors became well defined. Over the next few months tremors were only detected during 18-22 March, on 17, 21, and 24 April, and on 16 and 21 June. After another quiet interval, tremor signals were again recorded on 12, 14, 19, 22, and 30 July, and 8-10, 20, and 29 August 2001; tremors on 20 August were "excessively loud." No tremors were detected again until 26 February 2002, followed by a quiet interval until 16-19 and 31 March. Activity increased again during April-May 2002 with tremors recorded on 1, 2, 18, 20, 22, and 23 April, and 2-3, 13-16, and 21 May; "exceptionally loud" tremors occurred on 2-3 May. Additional tremors were detected on 9 June, 6-13 August, 15 August ("exceptionally loud"), and 19 September 2002.
Reference. Dziak, R.P., and Fox, C.G., 2002, Evidence of harmonic tremor from a submarine volcano detected across the Pacific Ocean basin: Journal of Geophysical Research, v. 107, no. B5, p. ESE 1-1 - 1-12.
Geologic Background. Reports of floating pumice from an unknown source, hydroacoustic signals, or possible eruption plumes seen in satellite imagery.
Information Contacts: Robert P. Dziak and Matt Fowler, Cooperative Institute for Marine Resource Studies, Hatfield Marine Science Center, Oregon State University/NOAA, 2115 SE OSU Drive, Newport, OR 97365 USA (URL: http://www.pmel.noaa.gov/).
Anatahan (United States) — June 2003 Cite this Report
Anatahan
United States
16.35°N, 145.67°E; summit elev. 790 m
All times are local (unless otherwise noted)
Small lava dome in inner crater destroyed by explosion; activity declines
The first historical eruption of the small volcanic island Anatahan began at about 1700 on 10 May 2003 (BGVN 28:04). The island is in the Commonwealth of the Northern Mariana Islands (CNMI) and has been uninhabited since it was evacuated on 29 May 1993 as the result of an earthquake swarm (BGVN 18:05 and 18:08). Shortly after the eruption began, the Emergency Management Office (EMO) of CNMI invited U.S. Geological Survey (USGS) scientists to provide assistance in tracking the volcano's activity and assessing potential hazards. This report discusses a seismically detected phreatic stage during 10-20 May followed by a new lava discharge on 4 June. After mid-July seismicity and volcanism declined.
Records from a broadband seismograph installed by Washington University 6.5 km W of the Anatahan crater on 6 May 2003 were retrieved on 20 May. F.A. Trusdell and R. White (USGS) reviewed the records and plotted estimate of the numbers of volcano-tectonic (VT) events and their maximum magnitudes, and an estimate of the background and/or tremor level for 9-11 May 2003 (figure 8). No VT events or tremor appeared during 6-9 May. Unrecorded precursory activity may have occurred prior to the seismograph installation. Trusdell and White described their findings as follows in their report of 5 June 2003.
"Beginning on May 10, the number of hourly events increases from 0-1 the first couple of hours to 20-33 by [1400 and 1500 hours local time]—then surges to more than 100 events/hr beginning at [1600]. These events are all VTs, with impulsive P and S phases that decay rapidly. The largest events didn't exceed about M 2 on May 10. The spectra are broadband with dominant frequencies between 8 and 10 Hz, the higher frequencies probably attenuated by the 6.5 km travel path (the distance between the crater and the Washington University seismograph). Note that late on the 10th, the number of events begins to decrease rapidly and about this same time, the amplitude of the largest events increases rapidly. The largest VT of all (through the last record available, of May 20) had a magnitude of about M 3.1 and occurred a little after noon on the 11th. After that event, both the numbers and amplitudes of the VTs dropped off rapidly (and remained very low through the last record available, on May 20.
"The background noise level remained very low until [1700] on May 10, when the level increased by 2.5x and by [1800] the tremor level was ~6x above the background level. We infer that the rising tremor level corresponds to the approximate onset of gas and ash emission into the atmosphere. The [Washington VAAC (Volcanic Ash Advisory Center)] estimates that the ash first appeared about [1730]. The tremor level increased further and peaked on May 11.
"Notes on May 11-20: The tremor level remained very high for a couple of days before decreasing by about half (10 arbitrary units on the figure) by May 20. By about May 15, unambiguous LP's [(long-period events)] begin to appear. By May 19 and 20, there appear brief moments (several seconds) when the tremor level drops to near background immediately prior to the largest LP's which often contain air phases. Even the largest LP's are not particularly large, maybe M 2-2.5. All of this activity from May 10-20 is compatible with an aggressive phreatic stage."
The spiny surface of a lava flow was first observed in the inner crater on 4 June. The flow appeared to form a mound-shaped lava dome, but its volume is unknown. Scientists also noted the presence of new fault scarps and slump features within the E crater, as well as additional faulting to its W. Such features commonly develop around active vents due to the rise and subsequent eruption of magma. On 5 June the EMO seismic station was repaired and ash samples were collected from the site. Through 12 June, the seismic records showed only continuous ground shaking (tremor) to varying degrees. The most intense periods of tremor lasted 3-10 hours and occurred about every 24-36 hours. On 12 June, three LP earthquakes were recorded, the largest about M 2. Other earthquakes followed on the late afternoon and early evening of 13 June.
Two strong explosions on 14 June removed much of the small new dome in the inner crater. Just before noon on that day, earthquakes began to occur every 1-2 minutes. For the next two days, several episodes of intense tremor and earthquakes lasting ~1.5 hours occurred about every 12 hours. These episodes of increased seismic activity accompanied strong ash emissions from the E crater, with eruption columns higher than 2 km. Quiet intervals in which the eruption column consisted of little ash were accompanied by continuous low tremor. At 1613 on 16 June observers noticed that the light-colored, steam-dominated, eruption cloud got darker and rose very quickly (20-40 seconds) to ~2.5 km altitude (figure 9). At this time, the seismic amplitude went from "small" to "large" (a 5-10x increase). Since 16 June seismic activity has consisted only of low-level tremor, and even that low level was gradually shrinking.
As of 9 July the eruption continued to wane, as shown by decreasing amplitudes of volcanic tremor. Observations from a helicopter on that day revealed only white steam low in the E crater and a minor amount of light brown fume without ash emission.
Geologic Background. The elongate, 9-km-long island of Anatahan in the central Mariana Islands consists of a large stratovolcano with a 2.3 x 5 km compound summit caldera. The larger western portion of the caldera is 2.3 x 3 km wide, and its western rim forms the island's high point. Ponded lava flows overlain by pyroclastic deposits fill the floor of the western caldera, whose SW side is cut by a fresh-looking smaller crater. The 2-km-wide eastern portion of the caldera contained a steep-walled inner crater whose floor prior to the 2003 eruption was only 68 m above sea level. A submarine cone, named NE Anatahan, rises to within 460 m of the sea surface on the NE flank, and numerous other submarine vents are found on the NE-to-SE flanks. Sparseness of vegetation on the most recent lava flows had indicated that they were of Holocene age, but the first historical eruption did not occur until May 2003, when a large explosive eruption took place forming a new crater inside the eastern caldera.
Information Contacts: Juan Takai Camacho and Ramon Chong, Commonwealth of the Northern Mariana Islands Emergency Management Office, P.O. Box 10007, Saipan, MP 96950 USA (URL: http://www.cnmihsem.gov.mp/); Frank Trusdell, U.S. Geological Survey, Hawaiian Volcano Observatory (HVO), PO Box 51, Hawaii National Park, HI 96718, USA (URL: https://volcanoes.usgs.gov/nmi/activity/); Randal A. White, U.S. Geological Survey, 345 Middlefield Road, MS 910, Menlo Park, CA 94025 USA.
Colima
Mexico
19.514°N, 103.62°W; summit elev. 3850 m
All times are local (unless otherwise noted)
Year-long eruption ended in late February 2003 after eight lava flows
Effusive activity that began at Colima on 14 February 2002 (BGVN 27:05 and 27:11) had stopped by the end of February 2003. Eight lava flows were emitted during this eruption (figure 64). The total volume of effusive material was calculated to be ~8.3 x 10⁶ m3. That number includes the lava dome (2 x 10⁶ m3) and lava flows (4.3 x 10⁶ m3), in addition to pyroclastic-flow and rockfalls deposits (2 x 10⁶ m3). A plot showing the daily number of rockfalls reflects the level of activity over the course of the eruption (figure 65).
Weak gas explosions occurred in March 2003. As of April there were still observations of night glow at the summit, degassing, and 10-20 daily seismic events. However, no deformation had been noted.
Geologic Background. The Colima complex is the most prominent volcanic center of the western Mexican Volcanic Belt. It consists of two southward-younging volcanoes, Nevado de Colima (the high point of the complex) on the north and the historically active Volcán de Colima at the south. A group of late-Pleistocene cinder cones is located on the floor of the Colima graben west and east of the complex. Volcán de Colima (also known as Volcán Fuego) is a youthful stratovolcano constructed within a 5-km-wide scarp, breached to the south, that has been the source of large debris avalanches. Major slope failures have occurred repeatedly from both the Nevado and Colima cones, producing thick debris-avalanche deposits on three sides of the complex. Frequent recorded eruptions date back to the 16th century. Occasional major explosive eruptions have destroyed the summit (most recently in 1913) and left a deep, steep-sided crater that was slowly refilled and then overtopped by lava dome growth.
Information Contacts: Observatorio Vulcanológico de la Universidad de Colima, Colima, Col., 28045, México (URL: https://portal.ucol.mx/cueiv/).
Deception Island (Antarctica) — June 2003 Cite this Report
Deception Island
Antarctica
62.9567°S, 60.6367°W; summit elev. 602 m
All times are local (unless otherwise noted)
Fieldwork shows moderate seismicity and stable fumarole temperatures
While fieldwork was conducted during 1 December 2002-18 April 2003, Spanish and Argentine scientists measured Deceptions Island's seismicity, thermal activity, and gas emissions. Gravimetric field surveys, geodetic measurements, and geological studies were also carried out.
Monitoring during 2002-2003. During the 2002-2003 Antarctic summer the scientists installed two dense seismic antennas in trigger mode and four continuous-recording short-period stations (figure 19). Each of the antennae were composed of eight short-period seismometers with apertures of ~250 m. One was located at the Argentinean Base and the other in Pendulum Cove. Three vertical-component seismometers were located on the N side of Fumarole Bay, at the beach between Murature Point and Cross Hill, and near 70'Craters. Finally, a three-component seismic station was installed near the Spanish Station.
The recorded seismicity included volcano-tectonic earthquakes (VT), long-period events (LP), and a few episodes of volcanic tremor. More than 56 VT and 700 LP events were recorded, 54 of them with hybrid character; 55 recorded tremor episodes had durations ranging from less than one hour to eight hours. The recording period could be divided into two different phases on the basis of the degree of activity. The first, from 22 December until the beginning of March, was characterized by a relatively high level of activity with frequent VT earthquakes, LP events, and volcanic tremors. The second phase, from the beginning of March until 4 April, was characterized by a similar rate of VT earthquakes but fewer LP events and tremor. This observation supported the idea that LP seismicity might be related to seasonal thaw water. Most earthquakes were centered on the island, in accord with their VT designation. Compared to previous surveys, the 2002-2003 level of seismicity was considered to be moderate
Temperatures of fumaroles and hot soils remained stable at 99-101°C in Fumarole Bay, 95°C in Caliente Hill, 65°C in Whalers Bay, 41°C in Telefon Bay, and 72°C in Pendulum Cove (figure 19). Fumarolic activity was also monitored, with radon measurements being made for the first time. Standard wet-analysis techniques revealed that the composition of gas obtained from the vents at Fumarole Bay was similar to that of recent years, namely H2O(v) (70-95%), CO2 (7-29%), H2S (0.12-0.39%), and SO2 (0.01-0.07%). Elemental sulfur was seen around the vent outlets, and pyrite with lapilli coatings were found at a few centimeters depth.
Geologic Background. Ring-shaped Deception Island, at the SW end of the South Shetland Islands, NE of Graham Land Peninsula, was constructed along the axis of the Bransfield Rift spreading center. A narrow passageway named Neptunes Bellows provides an entrance to a natural harbor within the 8.5 x 10 km caldera that was utilized as an Antarctic whaling station. Numerous vents along ring fractures circling the low 14-km-wide island have been reported active for more than 200 years. Maars line the shores of 190-m-deep Port Foster caldera bay. Among the largest of these maars is 1-km-wide Whalers Bay, at the entrance to the harbor. Eruptions during the past 8,700 years have been dated from ash layers in lake sediments on the Antarctic Peninsula and neighboring islands.
Information Contacts: A.T. Caselli, M.R. Agusto, and L. Ferreyra, Universidad de Buenos Aires-Instituto Antártico Argentino, Ciudad Universitaria, Pab.2, (1428) Buenos Aires, Argentina; Jesús Ibáñez, Daria Zandomeneghi, Daniel Stich, Francisco Carrión, and Javier Almendros, Instituto Andaluz de Geofísica, Universidad de Granada, 18071-Granada, Spain.
Dieng Volcanic Complex (Indonesia) — June 2003 Cite this Report
Dieng Volcanic Complex
Indonesia
7.2°S, 109.879°E; summit elev. 2565 m
All times are local (unless otherwise noted)
Plume emissions and modest seismicity through early July 2002
Seismicity and plume frequency increased at Dieng beginning in April 2002 (BGVN 27:05). During 27 May-7 July 2002, the Volcanological Survey of Indonesia (VSI) reported higher-than-normal activity. Deep and shallow earthquakes were recorded, along with tectonic events (table 3). During 27 May-9 June, VSI reported a white plume from Sileri crater up to 50 m high. Observations in mid-June revealed a mud ejection from Sikidang crater. Dieng remained at Alert Level 2 (on a scale of 1-4). No further reports were issued through at least May 2003.
Table 3. Earthquakes recorded at Dieng during 27 May-7 July 2002. Courtesy VSI.
| Date |
Deep volcanic |
Shallow volcanic |
Distant tectonic |
| 27 May-02 Jun 2002 |
1 |
25 |
1 |
| 03 Jun-09 Jun 2002 |
1 |
38 |
1 |
| 10 Jun-16 Jun 2002 |
13 |
14 |
1 |
| 17 Jun-23 Jun 2002 |
-- |
18 |
3 |
| 24 Jun-30 Jun 2002 |
-- |
7 |
2 |
| 01 Jul-07 Jul 2002 |
-- |
3 |
-- |
Geologic Background. The Dieng plateau in the highlands of central Java is renowned both for the variety of its volcanic scenery and as a sacred area housing Java's oldest Hindu temples, dating back to the 9th century CE. The Dieng Volcanic Complex consists of multiple stratovolcanoes and more than 20 small Pleistocene-to-Holocene craters and cones over a 6 x 14 km area. Prahu stratovolcano was truncated by a large Pleistocene caldera, which was subsequently filled by a series of cones, lava domes, and craters, many containing lakes. Lava flows cover much of the plateau, but observed activity has been restricted to minor phreatic eruptions. Gas emissions are a hazard at several craters and have caused fatalities. There are abundant thermal features and high heat flow across the area.
Information Contacts: Dali Ahmad, Volcanological Survey of Indonesia (VSI), Jalan Diponegoro No. 57, Bandung 40122, Indonesia (URL: http://www.vsi.esdm.go.id/).
Dukono
Indonesia
1.6992°N, 127.8783°E; summit elev. 1273 m
All times are local (unless otherwise noted)
Ash eruptions in February, June, and July 2003
According to the Volcanological Survey of Indonesia (VSI), Dukono erupted at 0105 on 22 February 2003. A gray-black ash cloud rose to 500 m and drifted E and then S. During 1200-1355 fiery flashes were observed for ~30 minutes, and on 28 February activity returned to normal.
The Darwin VAAC reported that an ash plume was visible on NOAA and GOES 9 imagery beginning on 8 June at 1625. The ash plume reached ~4.5 km altitude and drifted NE. On 9 June ashfall reached the Galela area, as far as 7 km from the summit. Explosive activity decreased, but a blasting sound was still frequent. The Alert Level was set at 2 (on a scale of 1-4). As of 10 June the plume was visible on satellite imagery extending ~75 km N.
During 3-8 July activity preceded by gas emissions from the crater was observed and a gas plume rose 25-75 m. Ash explosions during 9-14 July produced ash columns 800-900 m high, accompanied by a continuous strong blasting sound. Ash fell around the Mamuya and Galela areas. A white-gray ash plume emitted during the week of 15-23 July rose 375 m. On 22 July, an ash explosion from the crater in clear, calm conditions, formed an ash column that reached a maximum height of 1,000 m.
Geologic Background. The Dukono complex in northern Halmahera is on an edifice with a broad, low profile containing multiple peaks and overlapping craters. Almost continuous explosive eruptions, sometimes accompanied by lava flows, have occurred since 1933. During a major eruption in 1550 CE, a lava flow filled in the strait between Halmahera and the Gunung Mamuya cone, 10 km NE. Malupang Wariang, 1 km SW of the summit crater complex, contains a 700 x 570 m crater that has also had reported eruptions.
Information Contacts: Volcanological Survey of Indonesia (VSI), Jalan Diponegoro No. 57, Bandung 40122, Indonesia (URL: http://www.vsi.esdm.go.id/); Darwin Volcanic Ash Advisory Centre (VAAC), Bureau of Meteorology, Northern Territory Regional Office, PO Box 40050, Casuarina, NT 0811, Australia (URL: http://www.bom.gov.au/info/vaac/).
Piton de la Fournaise (France) — June 2003 Cite this Report
Piton de la Fournaise
France
21.244°S, 55.708°E; summit elev. 2632 m
All times are local (unless otherwise noted)
Lava flows in Dolomieu crater; eruption ends 7 July
Reports from the Observatoire Volcanologique du Piton de la Fournaise (OVPF) indicated ongoing eruptive activity from late May to 6 June 2003 (BGVN 28:05). The activity was characterized by sporadic seismicity, degassing from fissures, and lava flows. Inflation of Piton de la Fournaise was observed beginning in March 2003, without later indications of deflation as of July 2003. Eruptive activity within Dolomieu crater continued until 7 July.
Eruptive tremor had completely disappeared by 8 June, and on the 10th that phase of the eruption was considered to be finished. About thirty small earthquakes were observed, caused by minor collapses. The extensometric network continued to show an opening of cracks at Magne and Chateau-Fort. On 10 June, 71 earthquakes were observed, the strongest of which had magnitudes of 1.4-2.0. The earthquakes were located ~400 m under Dolomieu in the SW part near the site of the 30 May-4 June eruption. Extensometers continued to indicate swelling of the volcano, but no summit inflation was observed during the eruption.
On 13 June at 0308 new eruption tremor appeared within Dolomieu crater. A helicopter overflight confirmed that the eruption continued from the same site as the first two eruptive phases. Such a scenario was expected because the extensometer network showed continuous opening of the monitored fissures. Seismicity on 12 June had decreased compared to the previous two days, with a lack of very low amplitude earthquakes. That day eruptive tremor began without being preceded by even a small earthquake.
During the morning of 14 June eruption tremor was stable and practically constant; other seismic events did not register. On 15 June at 0600, the tremor entirely disappeared. Crater observations showed that lava flows had extended to the N wall of Dolomieu crater, covering almost half of the crater floor as of 16 June (figure 72). After a cessation of several days, the eruption began again on 21 June at about 2330. After a progressive increase of tremor in the hours that followed, the situation stabilized, and the tremor then strongly decreased.
On 24 June the eruption was still in progress. The tremor increased strongly in the night and reached the maximum level of the preceding eruptive phases. Observations on 26 June showed two small openings in front of the principal cone. The first showed degassing, and the second, which was almost closed, emitted sporadic weak projections. Within 100 m of the cone an emission of a very fluid and degassed lava had produced significant flows. On 27 June the tremor had strongly diminished.
After 0630 on 28 June highly variable tremor related to "gas pistons," or regular degassing, was observed on a scale not previously seen at Piton de la Fournaise. Some lava flows in Dolomieu remained active. A small cone opposite the Piton kaf degassed strongly in time with the other gas explosions.
On 1and 2 July, no change in eruptive activity was observed. The tremor varied with a time interval of 12-13 minutes between total stop and maximum tremor amplitude. The eruption continued on 3 July, but on 4 July the tremor had diminished, and the tremor variations observed in past days were less pronounced. No lava projections were seen in the crater during this phase, and volcanic earthquakes were not detected until one occurred on 3 July. The eruption ended on 7 July.
Geologic Background. Piton de la Fournaise is a massive basaltic shield volcano on the French island of Réunion in the western Indian Ocean. Much of its more than 530,000-year history overlapped with eruptions of the deeply dissected Piton des Neiges shield volcano to the NW. Three scarps formed at about 250,000, 65,000, and less than 5,000 years ago by progressive eastward slumping, leaving caldera-sized embayments open to the E and SE. Numerous pyroclastic cones are present on the floor of the scarps and their outer flanks. Most recorded eruptions have originated from the summit and flanks of Dolomieu, a 400-m-high lava shield that has grown within the youngest scarp, which is about 9 km wide and about 13 km from the western wall to the ocean on the E side. More than 150 eruptions, most of which have produced fluid basaltic lava flows, have occurred since the 17th century. Only six eruptions, in 1708, 1774, 1776, 1800, 1977, and 1986, have originated from fissures outside the scarps.
Information Contacts: Observatoire Volcanologique du Piton de la Fournaise (OVPF), Institut de Physique du Globe de Paris, 14 RN3, le 27Km, 97418 La Plaine des Cafres, La Réunion, France (URL: http://www.ipgp.fr/fr/ovpf/observatoire-volcanologique-piton-de-fournaise).
Iliwerung (Indonesia) — June 2003 Cite this Report
Iliwerung
Indonesia
8.532°S, 123.573°E; summit elev. 583 m
All times are local (unless otherwise noted)
Increase in felt earthquakes during October 2001
During 17-26 October 2001 the Volcanological Survey of Indonesia reported an increase in felt earthquakes. A total of 2-11 events occurred per day, with Mercalli magnitudes of I-II. The earthquakes S and P wave arrival times differed by between 1 and 35 seconds. Visual and instrumental monitoring revealed a lack of significant changes. The Alert Level was increased from 1 to 2 (on a scale of 1-4). No further reports were issued through at least May 2003.
Geologic Background. Constructed on the southern rim of the Lerek caldera, Iliwerung forms a prominent south-facing peninsula on Lembata (formerly Lomblen) Island. Craters and lava domes have formed along N-S and NW-SE lines on the complex volcano; activity has been observed at vents from the summit to the submarine SE flank. The summit lava dome was formed during an eruption in 1870. In 1948 the Iligripe lava dome grew on the E flank at 120 m elevation. Beginning in 1973-74, when three ephemeral islands were formed, submarine eruptions began on the lower ESE flank at a vent named Hobal; several other eruptions have since taken place at this vent.
Information Contacts: Dali Ahmad, Volcanological Survey of Indonesia (VSI), Jalan Diponegoro No. 57, Bandung 40122, Indonesia (URL: http://www.vsi.esdm.go.id/).
Kanlaon (Philippines) — June 2003 Cite this Report
Kanlaon
Philippines
10.4096°N, 123.13°E; summit elev. 2422 m
All times are local (unless otherwise noted)
Ash-and-steam explosions between 23 May and 4 July; minor ashfall on 8 June
Following an ash emission from Canlaon on 17 March 2003 (BGVN 28:03), the Philippine Institute of Volcanology and Seismology (PHIVOLCS) raised the hazard status to Alert Level 1 (on a scale of 0-5), which signified possible ash explosions in the coming days or weeks. There was another ash emission on 23 May.
Beginning on 1 June, the seismic network detected an average of five low-frequency volcanic earthquakes per day. Moderate steaming was noted, which is unusual for Canlaon because steam is typically wispy or nonexistent during normal and quiet conditions.
Brief bursts of ash and steam reaching 100 m above the active crater were observed on 1, 3, 4, 5, 6, 7, and 8 June. An ash emission during 0645-0700 on 8 June deposited traces of ash at Canlaon City proper and in the barangays of Masulog and Linutangan. Eight low-frequency volcanic earthquakes and four low-frequency short-duration harmonic tremors were recorded in the 24-hour period prior to the event. In addition, PHIVOLCS seismographs in Cabagnaan (6 km SW of the active crater) and Canlaon City (8.7 km SE) detected episodes of low-frequency tremor.
Small ash ejections continued after 8 June. Ash-and-steam columns rose to 1,000 m before drifting SSE and SE. Ash explosions on 13 June between 0647 and 0756 were recorded at Cabagnaan as low-frequency short-duration harmonic tremors. The explosions produced voluminous dirty-white steam which rose to ~500 m and drifted SSE and ESE. Six low-frequency volcanic earthquakes and three low-frequency short-duration harmonic tremors were detected the 24 hours prior to the event.
Two small steam-driven explosions occurred during 0820-0835 and 1020-1030 on 17 June. The ejected ash-and-steam columns rose to ~400 m above the summit crater and drifted NNE. In the 24-hour period prior to the explosions, the volcano's seismic network detected eight low-frequency volcanic earthquakes, two high-frequency volcanic earthquakes, and one low-frequency short-duration harmonic tremor.
A mild ash ejection at 1422 on 18 June was recorded as a low-frequency volcanic earthquake. A grayish ash-and-steam cloud rose ~ 400 m above the summit crater before drifting SE. Only two low-frequency volcanic earthquakes and one short-duration harmonic tremor preceded the explosion. Mild ash explosions occurred during 0701-0707, 0743-0750, and 1420-1430. These explosions produced voluminous ash-and-steam clouds that rose 400 m above the summit crater before drifting NW. The events were reflected in seismic records as low-frequency volcanic earthquakes. In the 24-hour period prior to the events, two low-frequency earthquakes, one high-frequency volcanic earthquake, and one short-duration harmonic tremor were recorded by the seismic network.
The volcano continued to manifest moderate steaming and ash emission activity with an ash column rising ~900 m above the summit crater at 0515 on 4 July. In the 24-hour period prior to the event the seismic network recorded five low-frequency volcanic earthquakes and two low-frequency short-duration harmonic tremors.
The hazard status during June and July remained at Alert Level 1, and PHIVOLCS reminded the public to avoid entering the 4-km-radius Permanent Danger Zone. The absence of longer duration harmonic tremor suggested to PHIVOLCS that there was no magma movement or intrusion, indicating that the explosions were possibly a result of reactivation of a shallow hydrothermal system.
Geologic Background. Kanlaon volcano (also spelled Canlaon) forms the highest point on the Philippine island of Negros. The massive andesitic stratovolcano is covered with fissure-controlled pyroclastic cones and craters, many of which are filled by lakes. The largest debris avalanche known in the Philippines traveled 33 km SW from Kanlaon. The summit contains a 2-km-wide, elongated northern caldera with a crater lake and a smaller but higher active vent, Lugud crater, to the south. Eruptions recorded since 1866 have typically consisted of phreatic explosions of small-to-moderate size that produce minor local ashfall.
Information Contacts: Philippine Institute of Volcanology and Seismology (PHIVOLCS), Department of Science and Technology, PHIVOLCS Building, C.P. Garcia Avenue, University of the Philippines Campus, Diliman, Quezon City, Philippines (URL: http://www.phivolcs. dost.gov.ph/).
Kelud
Indonesia
7.935°S, 112.314°E; summit elev. 1730 m
All times are local (unless otherwise noted)
Crater lake temperature drops in early 2001; no activity reported
During 6 March-9 April 2001 at Kelut, the temperature of the crater lake decreased from 50 to 48°C. Tectonic earthquakes were recorded during mid-March 2001, with two occurring per week during 12-23 March. Visual and instrumental observations showed no significant changes. Kelut remained at Alert Level 2 (on a scale of 1-4). No further reports were issued through at least May 2003.
Geologic Background. The relatively inconspicuous Kelud stratovolcano contains a summit crater lake that has been the source of some of Indonesia's most deadly eruptions. A cluster of summit lava domes cut by numerous craters has given the summit a very irregular profile. Satellitic cones and lava domes are also located low on the E, W, and SSW flanks. Eruptive activity has in general migrated in a clockwise direction around the summit vent complex. More than 30 eruptions have been recorded since 1000 CE. The ejection of water from the crater lake during the typically short but violent eruptions has created pyroclastic flows and lahars that have caused widespread fatalities and destruction. After more than 5,000 people were killed during an eruption in 1919, an engineering project to drain the crater lake lowered the surface by more than 50 m. The 1951 eruption deepened the crater by 70 m, leaving 50 million cubic meters of water after the damaged drainage tunnels were repaired. Following more than 200 deaths in the 1966 eruption, a new deeper tunnel was constructed, and the lake's volume before the 1990 eruption was only about 1 million cubic meters.
Information Contacts: Dali Ahmad, Volcanological Survey of Indonesia (VSI), Jalan Diponegoro No. 57, Bandung 40122, Indonesia (URL: http://www.vsi.esdm.go.id/).
Lewotobi (Indonesia) — June 2003 Cite this Report
Lewotobi
Indonesia
8.542°S, 122.775°E; summit elev. 1703 m
All times are local (unless otherwise noted)
Minor explosion and ashfall on 30 May
An explosion on 12 October 2002 at Lewotobi Lakilaki, one of the twin stratovolcanoes that comprise Lewotobi, produced an ash column that rose ~500 m above the volcano (BGVN 27:11). Through at least 24 November, a "thin white low-pressure ash plume" rose 150-250 m above the summit.
No further reports were issued until May 2003, when the Volcanological Survey of Indonesia reported an explosion at 1650 on 30 May 2003. The resulting ash column reached 200 m above the summit and caused ashfall at the observatory, ~5 km from the crater. Visual and seismic data showed no significant increases during the week prior to the explosion (table 1). On 1 June, two explosion earthquakes and two tremor earthquakes were recorded. The hazard status was set at Alert Level 2 (on a scale of 1-4).
Table 1. Seismicity and height of the gas plume at Lewotobi during 20 May-15 June 2003. Courtesy VSI.
| Date |
Volcanic EQ |
Tectonic EQ |
Ash Emissions |
Tremor |
Plume Height(s) |
| 20 May 2003 |
2 |
1 |
-- |
-- |
25 m |
| 21 May 2003 |
0 |
0 |
-- |
-- |
-- |
| 22 May 2003 |
4 |
1 |
-- |
-- |
25 m |
| 23 May 2003 |
9 |
5 |
-- |
-- |
25 m |
| 24 May 2003 |
6 |
3 |
-- |
-- |
25 m |
| 25 May 2003 |
5 |
1 |
-- |
-- |
25 m |
| 26 May 2003 |
0 |
0 |
-- |
-- |
25 m |
| 27 May 2003 |
2 |
6 |
-- |
-- |
25 m |
| 28 May 2003 |
0 |
2 |
-- |
-- |
-- |
| 29 May 2003 |
2 |
0 |
-- |
-- |
-- |
| 30 May 2003 |
6 |
3 |
-- |
-- |
200 m |
| 31 May 2003 |
6 |
0 |
-- |
-- |
-- |
| 01 Jun 2003 |
3 |
1 |
-- |
-- |
-- |
| 02-08 Jun 2003 |
13 |
12 |
29 |
20 |
300 m |
| 09-15 Jun 2003 |
24 |
9 |
40 |
33 |
75 m |
Activity during the week of 2-8 June 2003 was marked by explosions and ash emissions. Ash plumes reached a maximum height of 300 m above the summit. Seven explosions were recorded accompanied by a blasting sound on 3, 5, and 6 June. Ash fell at Bawalatang, Duang, and Boru villages. Shallow volcanic earthquakes were recorded, but were fewer in number compared to the previous week; there was no record of deep volcanic earthquakes, although tectonic earthquakes were recorded.
During the week of 9-15 June, activity was marked by ash emissions, with an ash plume reaching a maximum height of 75 m above the summit. Tremor events were also observed, with the tremor showing an amplitude of 0.5-7 mm. There were no deep volcanic earthquakes recorded, although the numbers of shallow volcanic earthquakes, tremor and ash emissions increased.
Geologic Background. The Lewotobi edifice in eastern Flores Island is composed of the two adjacent Lewotobi Laki-laki and Lewotobi Perempuan stratovolcanoes (the "husband and wife"). Their summits are less than 2 km apart along a NW-SE line. The conical Laki-laki to the NW has been frequently active during the 19th and 20th centuries, while the taller and broader Perempuan has had observed eruptions in 1921 and 1935. Small lava domes have grown during the 20th century in both of the summit craters, which are open to the north. A prominent cone, Iliwokar, occurs on the E flank of Perampuan.
Information Contacts: Dali Ahmad, Volcanological Survey of Indonesia (VSI), Jalan Diponegoro No. 57, Bandung 40122, Indonesia (URL: http://www.vsi.esdm.go.id/).
Lopevi
Vanuatu
16.507°S, 168.346°E; summit elev. 1413 m
All times are local (unless otherwise noted)
June ash plumes to altitudes of 2.5-12 km; small lava flow
On 8-9 June 2003, a volcanic ash advisory was issued for Lopevi. The Port Vila tower in Vanuatu reported that at 0055 on 8 June, an ash cloud with a thick plume rose to above 12 km altitude and drifted SE. The plume was not visible on satellite images. Later reports from pilots at 2311 indicated that the activity had subsided, with no further signs of an ash cloud. At 0330 on 9 June, the Port Vila tower reported another thick black ash cloud rising to 2.7 km, with a diameter of ~18 km, drifting SE. Observations of volcanic activity were not possible after that time.
The eruption continued through at least 14 June. An airport in Vanuatu reported to the Wellington VAAC that a thick plume rose to ~7.5 km altitude on 11 June. The plume drifted SE and was ~9 km in diameter. They reported that on 13 June a ~9-km-diameter plume rose to ~2.5 km altitude. Also, on 14 June an ash cloud was at a height of ~2.5 km altitude and a thin lava flow was visible on the volcano's W flank.
A news article from the Australian Broadcasting Corporation stated that the eruption was causing acid rain to fall on island villages in Vanuatu that are close to the volcano. Local disaster management personnel warned residents of the islands of Paama, Epi, and villages in SE Ambrym to secure their rain-based water supplies.
Geologic Background. The small 7-km-wide conical island of Lopevi, known locally as Vanei Vollohulu, is one of Vanuatu's most active volcanoes. A small summit crater containing a cinder cone is breached to the NW and tops an older cone that is rimmed by the remnant of a larger crater. The basaltic-to-andesitic volcano has been active during historical time at both summit and flank vents, primarily along a NW-SE-trending fissure that cuts across the island, producing moderate explosive eruptions and lava flows that reached the coast. Historical eruptions at the 1413-m-high volcano date back to the mid-19th century. The island was evacuated following major eruptions in 1939 and 1960. The latter eruption, from a NW-flank fissure vent, produced a pyroclastic flow that swept to the sea and a lava flow that formed a new peninsula on the western coast.
Information Contacts: Wellington Volcanic Ash Advisory Center (VAAC), MetService, PO Box 722, Wellington, New Zealand (URL: http://vaac.metservice.com/); Australian Broadcasting Company, ABC Ultimo Centre, 700 Harris Street, GPO Box 9994, Sydney, NSW 2001, Australia (URL: http://www.abc.net.au/).
Reventador (Ecuador) — June 2003 Cite this Report
Reventador
Ecuador
0.077°S, 77.656°W; summit elev. 3562 m
All times are local (unless otherwise noted)
Lahars, mudflows, and steam emissions continue through mid-July
After a 26-year repose without signs of unusual activity, Reventador burst unexpectedly into a VEI 4 eruption on 3 November 2002 (BGVN 27:11). A preliminary evaluation indicated that this was one of Ecuador's most powerful eruptions of the past 100 years. The following report provides an update on activity since March 2003 (BGVN 28:02) through mid-July 2003. Available seismic records are incomplete for this period (table 3). However, by late April all types of recorded seismic events had declined to very low levels.
Table 3. Summary of seismic activity at Reventador, 8 March-13 July 2003. Note that data are incomplete. Courtesy of the Instituto Geofísico.
| Date |
Long-period |
Hybrid |
Volcano-tectonic |
| 08-14 Mar 2003 |
120 avg./day |
-- |
15 avg./day |
| 24-31 Mar 2003 |
50-60/day |
-- |
20-30/day |
| 01-06 Apr 2003 |
42-98/day |
26-65/day |
5-13/day |
| 07-12 Apr 2003 |
63.5 avg./day |
30 avg./day |
2.33 avg./day |
| 13 Apr 2003 |
58 |
-- |
6 |
| 14 Apr 2003 |
29 |
-- |
3 |
| 15 Apr 2003 |
35 |
-- |
8 |
| 16 Apr 2003 |
37 |
-- |
6 |
| 17 Apr 2003 |
31 |
-- |
8 |
| 18 Apr 2003 |
22 |
-- |
8 |
| 19 Apr 2003 |
20 |
-- |
6 |
| 28 Apr-02 May 2003 |
0 |
-- |
0 |
| 03 May 2003 |
1 |
-- |
1 |
| 04 May 2003 |
0 |
-- |
0 |
| 30 Jun-06 Jul 2003 |
1 |
-- |
4 |
| 07-13 Jul 2003 |
2 |
-- |
2 |
Heavy rains in March 2003 mixed with ash on Reventador's flanks, causing mudflows and lahars that disrupted traffic along routes crossing rivers draining the volcano (figure 12). A gas column reached 300-500 m above the summit early in the month. Low-level seismicity was characterized by bands of harmonic tremor and a few isolated earthquakes; long-period (LP) seismic events were possibly associated with gas discharges. The seismic station in Copete registered high-frequency signals associated with lahars; however, only a few lahars were observed. Activity during the last week of March was characterized by persistent low-energy emissions of white steam and yellowish gases. Seismicity was also low during this time. The reference seismic station was moved nearer to the volcano, allowing detection of smaller magnitude earthquakes.
When the weather permitted in April and May 2003, observers saw continuous low-level emissions of white steam and yellow gases rising several hundreds of meters above the volcano's cone. This was corroborated by the seismicity recorded at station LAVA2 (inside the caldera near the lava front). Rains have been frequent, generally of short duration, and accompanied by some lahars. Low-frequency tremor on 12 April was recorded at LAVA2 (0.9 Hz) and CONE (1.3 Hz), in the caldera NE of the cone near the head of the Rio Reventador. During April, rivers swelled with water and mud that blocked river crossings. Seismicity was characterized by a fairly constant number of long-period (LP)/hybrid and volcano-tectonic (VT) events, with a slight diminution in the number of LPs (table 1). Lahars on 18-19 April produced significant flooding in Rio Reventador and Rio Marker. Seismic activity stayed at very low levels.
On 1 May strong rains in the area of the volcano generated mud flows or lahars that destroyed the highway in the Rio Reventador sector. Heavy rainfall of up to 200 mm in less than 24 hours on 6 May led to the remobilization of ash from the November 2002 eruption. Lahars traveled down the SE flank via the Rio Marker and Rio Reventador gorges. Seismic signals indicated that lahars occurred in seven main pulses, with the longest pulse lasting ~2 hours. Lahars crushed a portion of the petroleum pipeline on the SE flank and dragged it 22 m. Lahars also destroyed a bridge and blocked a highway. On 8 May, satellite images showed a plume that extended ~50 km NW.
During much of June and July 2003, the volcano was not visible due to cloudiness. Seismic activity during June was characterized by bands of continuous tremor, some related to increased volume of the rivers and/or mud flows. On 19 June, a steam plume reached a height of ~300 m. Seismic tremor was associated with flowing gas and observed emissions. Small seismic events (magnitudes less than 3.4) occurred on 23 and 25 June. During 30 June-1 July a gas column was observed that rose ~200 m and drifted W. Seismicity was at low levels in early July, but continuous tremor occurred associated with degassing.
Geologic Background. Volcán El Reventador is the most frequently active of a chain of Ecuadorian volcanoes in the Cordillera Real, well east of the principal volcanic axis. The forested, dominantly andesitic stratovolcano has 4-km-wide avalanche scarp open to the E formed by edifice collapse. A young, unvegetated, cone rises from the amphitheater floor to a height comparable to the rim. It has been the source of numerous lava flows as well as explosive eruptions visible from Quito, about 90 km ESE. Frequent lahars in this region of heavy rainfall have left extensive deposits on the scarp slope. The largest recorded eruption took place in 2002, producing a 17-km-high eruption column, pyroclastic flows that traveled up to 8 km, and lava flows from summit and flank vents.
Information Contacts: Geophysical Institute, National Polytechnical School, Campamento, San Rafael, Ecuador (URL: http://www.igepn.edu.ec/).
Soufriere Hills (United Kingdom) — June 2003 Cite this Report
Soufriere Hills
United Kingdom
16.72°N, 62.18°W; summit elev. 915 m
All times are local (unless otherwise noted)
Dome growth, pyroclastic flows, and rockfalls through June
Seismic activity at Soufrière Hills during May-June 2003 was moderate to high, especially during May, and dominated by rockfalls. Most activity was focused on the N and NE flanks of the dome, with rockfalls and pyroclastic flows entering the Tar River Valley and occasionally White's Ghaut. During most of June activity remained, but was at substantially decreased levels. Brief views of the summit in June revealed that the extrusive lobe on the E side persisted.
The Washington VAAC issued daily notices to the aviation community regarding ash clouds that rose to low levels above the summit. Seismicity during the report period was dominated by rockfalls (table 46), particularly during May. Average daily SO2 emission rates varied throughout the report period (table 47) from 240 to 860 metric tons/day.
Table 46. Summary of weekly seismicity at Soufrière Hills during 2 May-4 July 2003. Courtesy MVO.
| Date |
Rockfall |
Hybrid |
Long-period |
Long-period / Rockfall |
Volcano-tectonic |
| 02 May-09 May 2003 |
767 |
7 |
138 |
88 |
2 |
| 09 May-16 May 2003 |
580 |
7 |
65 |
55 |
-- |
| 16 May-23 May 2003 |
774 |
8 |
81 |
75 |
2 |
| 23 May-30 May 2003 |
404 |
1 |
41 |
45 |
-- |
| 30 May-06 Jun 2003 |
445 |
5 |
40 |
34 |
1 |
| 06 Jun-13 Jun 2003 |
79 |
6 |
16 |
8 |
2 |
| 13 Jun-20 Jun 2003 |
48 |
55 |
-- |
10 |
-- |
| 20 Jun-27 Jun 2003 |
54 |
135 |
2 |
4 |
1 |
| 27 Jun-04 Jul 2003 |
193 |
37 |
7 |
61 |
-- |
Table 47. Range of average daily SO2 emission rates measured at Soufrière Hills during 2 May-4 July 2003. Courtesy MVO.
| Date |
SO2 emissions (tons/day) |
| 02 May-09 May 2003 |
440-850 |
| 09 May-16 May 2003 |
484-820 |
| 16 May-23 May 2003 |
300-730 |
| 23 May-30 May 2003 |
480-860 |
| 30 May-06 Jun 2003 |
390-560 |
| 05 Jun 2003 |
Fourier transform infrared spectrometer measurements show HCl:SO2 mass ratio = 2.80 in the plume. |
| 06 Jun-13 Jun 2003 |
350-520 |
| 13 Jun-20 Jun 2003 |
295-457 |
| 20 Jun-27 Jun 2003 |
215-505 |
| 27 Jun-04 Jul 2003 |
240-840 |
Throughout the report period, authorities prohibited access to all areas S of the Belham Valley, to Waterworks, Happy Hill, Lower Friths, Old Towne, and to Bramble airport and beyond. A maritime exclusion zone around the S part of the island extended 3.7 km beyond the coastline from Trant's Bay in the E to Lime Kiln Bay on the W coast.
Activity during May 2003. Most of the activity in May was focused on the NE flank of the dome, producing rockfalls and pyroclastic flows in the Tar River Valley and occasionally in White's Ghaut. Brief views of the summit dome on 12 May indicated that the direction of growth had switched towards the NE. On 12-13 May several pyroclastic flows were observed on the N and NW flanks of the dome in the area of Farrell's Plain and in the upper reaches of Tyre's Ghaut. During 16-23 May, rockfalls and pyroclastic flows continued along the N side of the Tar River Valley and White's Ghaut with a number of pyroclastic flows reaching the tops of Farrell's Plain, Tyre's Ghaut, and Tuitt's Ghaut. Pulses of vigorous ash-venting were observed on the summit during clear periods, and intense glow was seen on the summit and NE flanks during the nights of 20-21 May. Clear views of the summit region during an observation flight on 29 May showed that the NE lobe, which had developed over the previous few weeks, was broken up and the summit was irregular and blocky. Lava-dome growth was more centralized, building vertically and accumulating debris in the summit region.
Activity during June 2003. The dome's E and NE flanks continued producing rockfalls and pyroclastic flows into the Tar River Valley, and occasionally White's Ghaut or Tuitt's Ghaut. On the morning of 3 June, a period of increased activity on the NW flank of the dome produced many rockfalls; three pyroclastic flows entered Tyre's Ghaut. Clear views of the summit on 5 June revealed that the active lobe had a well-developed whale-back shape inclined gently upwards towards the E from the summit center. Activity decreased to low levels during the week of 6-13 June and remained low until the last week of the month. Brief views of the summit revealed that the well-developed extrusion lobe on the E side persisted. The focus of activity continued to be on the E and NE flanks of the dome, producing sporadic rockfalls and a few pyroclastic flows in the Tar River Valley, White's Ghaut, and Tuitt's Ghaut. Hybrid earthquakes developed into a diffuse swarm on 22-23 June, with some of the larger events at depths of ~3 km beneath the lava dome. During the last week of June pyroclastic flow and rockfall activity was focused on the N flank with most flows entering Tuitt's Ghaut, and to a lesser extent, Tyre's and White's ghauts. Sporadic flows also occurred in the Gages area on the W side of the dome.
Geologic Background. The complex, dominantly andesitic Soufrière Hills volcano occupies the southern half of the island of Montserrat. The summit area consists primarily of a series of lava domes emplaced along an ESE-trending zone. The volcano is flanked by Pleistocene complexes to the north and south. English's Crater, a 1-km-wide crater breached widely to the east by edifice collapse, was formed about 2000 years ago as a result of the youngest of several collapse events producing submarine debris-avalanche deposits. Block-and-ash flow and surge deposits associated with dome growth predominate in flank deposits, including those from an eruption that likely preceded the 1632 CE settlement of the island, allowing cultivation on recently devegetated land to near the summit. Non-eruptive seismic swarms occurred at 30-year intervals in the 20th century, but no historical eruptions were recorded until 1995. Long-term small-to-moderate ash eruptions beginning in that year were later accompanied by lava-dome growth and pyroclastic flows that forced evacuation of the southern half of the island and ultimately destroyed the capital city of Plymouth, causing major social and economic disruption.
Information Contacts: Montserrat Volcano Observatory (MVO), Mongo Hill, Montserrat, West Indies (URL: http://www. mvo.ms/); Washington Volcanic Ash Advisory Center (VAAC), Satellite Analysis Branch (SAB), NOAA/NESDIS E/SP23, NOAA Science Center Room 401, 5200 Auth Road, Camp Springs, MD 20746, USA (URL: http://www.ospo.noaa.gov/Products/atmosphere/vaac/).