Recently Published Bulletin Reports
Erebus (Antarctica) Lava lake remains active; most thermal alerts recorded since 2019
Rincon de la Vieja (Costa Rica) Frequent phreatic explosions during July-December 2023
Bezymianny (Russia) Explosion on 18 October 2023 sends ash plume 8 km high; lava flows and incandescent avalanches
Kilauea (United States) Low-level lava effusions in the lava lake at Halema’uma’u during July-December 2022
Nyamulagira (DR Congo) Lava flows and thermal activity during May-October 2023
Bagana (Papua New Guinea) Explosions, ash plumes, ashfall, and lava flows during April-September 2023
Mayon (Philippines) Lava flows, pyroclastic flows, ash emissions, and seismicity during April-September 2023
Nishinoshima (Japan) Eruption plumes and gas-and-steam plumes during May-August 2023
Krakatau (Indonesia) White gas-and-steam plumes and occasional ash plumes during May-August 2023
Villarrica (Chile) Strombolian activity, gas-and-ash emissions, and crater incandescence during April-September 2023
Merapi (Indonesia) Frequent incandescent avalanches during April-September 2023
Ebeko (Russia) Moderate explosive activity with ash plumes continued during June-November 2023
Erebus (Antarctica) — January 2024  Cite this Report
Erebus
Antarctica
77.53°S, 167.17°E; summit elev. 3794 m
All times are local (unless otherwise noted)
Lava lake remains active; most thermal alerts recorded since 2019
The lava lake in the summit crater of Erebus has been active since at least 1972. Located in Antarctica overlooking the McMurdo Station on Ross Island, it is the southernmost active volcano on the planet. Because of the remote location, activity is primarily monitored by satellites. This report covers activity during 2023.
The number of thermal alerts recorded by the Hawai'i Institute of Geophysics and Planetology’s MODVOLC Thermal Alerts System increased considerably in 2023 compared to the years 2020-2022 (table 9). In contrast to previous years, the MODIS instruments aboard the Aqua and Terra satellites captured data from Erebus every month during 2023. Consistent with previous years, the lowest number of anomalous pixels were recorded in January, November, and December.
Table 9. Number of monthly MODIS-MODVOLC thermal alert pixels recorded at Erebus during 2017-2023. See BGVN 42:06 for data from 2000 through 2016. The table was compiled using data provided by the HIGP – MODVOLC Thermal Alerts System.
| Year |
Jan |
Feb |
Mar |
Apr |
May |
Jun |
Jul |
Aug |
Sep |
Oct |
Nov |
Dec |
SUM |
| 2017 |
0 |
21 |
9 |
0 |
0 |
1 |
11 |
61 |
76 |
52 |
0 |
3 |
234 |
| 2018 |
0 |
21 |
58 |
182 |
55 |
17 |
137 |
172 |
103 |
29 |
0 |
0 |
774 |
| 2019 |
2 |
21 |
162 |
151 |
55 |
56 |
75 |
53 |
29 |
19 |
1 |
0 |
624 |
| 2020 |
0 |
2 |
16 |
18 |
4 |
4 |
1 |
3 |
18 |
3 |
1 |
6 |
76 |
| 2021 |
0 |
9 |
1 |
0 |
2 |
56 |
46 |
47 |
35 |
52 |
5 |
3 |
256 |
| 2022 |
1 |
13 |
55 |
22 |
15 |
32 |
39 |
19 |
31 |
11 |
0 |
0 |
238 |
| 2023 |
2 |
33 |
49 |
82 |
41 |
32 |
70 |
64 |
42 |
17 |
5 |
11 |
448 |
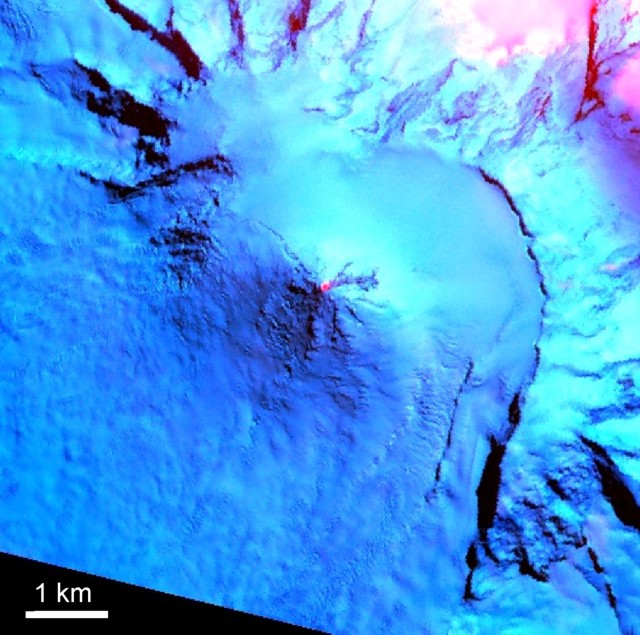
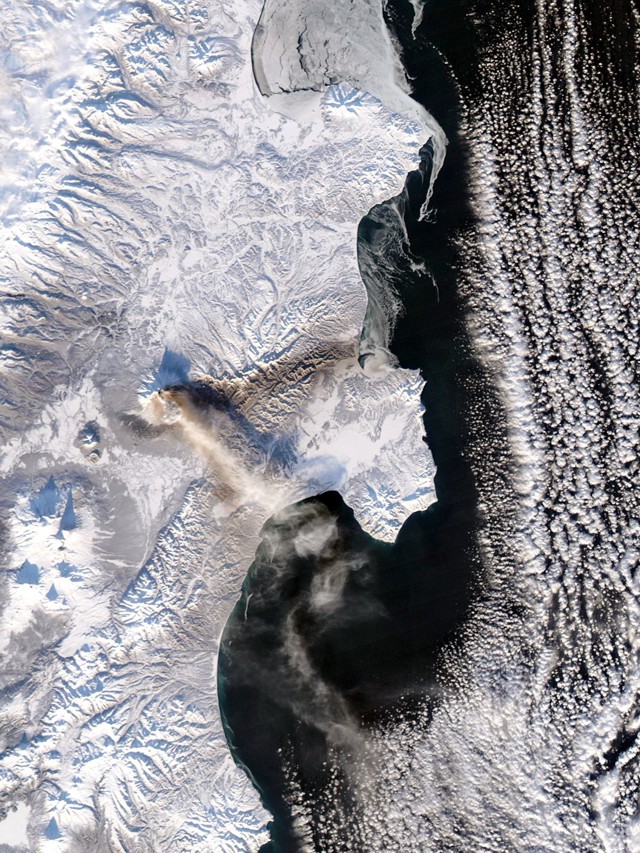
Sentinel-2 infrared images showed one or two prominent heat sources within the summit crater, accompanied by adjacent smaller sources, similar to recent years (see BGVN 46:01, 47:02, and 48:01). A unique image was obtained on 25 November 2023 by the OLI-2 (Operational Land Imager-2) on Landsat 9, showing the upper part of the volcano surrounded by clouds (figure 32).
Geologic Background. Mount Erebus, the world's southernmost historically active volcano, overlooks the McMurdo research station on Ross Island. It is the largest of three major volcanoes forming the crudely triangular Ross Island. The summit of the dominantly phonolitic volcano has been modified by one or two generations of caldera formation. A summit plateau at about 3,200 m elevation marks the rim of the youngest caldera, which formed during the late-Pleistocene and within which the modern cone was constructed. An elliptical 500 x 600 m wide, 110-m-deep crater truncates the summit and contains an active lava lake within a 250-m-wide, 100-m-deep inner crater; other lava lakes are sometimes present. The glacier-covered volcano was erupting when first sighted by Captain James Ross in 1841. Continuous lava-lake activity with minor explosions, punctuated by occasional larger Strombolian explosions that eject bombs onto the crater rim, has been documented since 1972, but has probably been occurring for much of the volcano's recent history.
Information Contacts: Hawai'i Institute of Geophysics and Planetology (HIGP) - MODVOLC Thermal Alerts System, School of Ocean and Earth Science and Technology (SOEST), Univ. of Hawai'i, 2525 Correa Road, Honolulu, HI 96822, USA (URL: http://modis.higp.hawaii.edu/); Copernicus Browser, Copernicus Data Space Ecosystem, European Space Agency (URL: https://dataspace.copernicus.eu/browser/); NASA Earth Observatory, EOS Project Science Office, NASA Goddard Space Flight Center, Goddard, Maryland, USA (URL: https://earthobservatory.nasa.gov/images/152134/erebus-breaks-through).
Rincon de la Vieja (Costa Rica) — January 2024 Cite this Report
Rincon de la Vieja
Costa Rica
10.83°N, 85.324°W; summit elev. 1916 m
All times are local (unless otherwise noted)
Frequent phreatic explosions during July-December 2023
Rincón de la Vieja is a volcanic complex in Costa Rica with a hot convecting acid lake that exhibits frequent weak phreatic explosions, gas-and-steam emissions, and occasional elevated sulfur dioxide levels (BGVN 45:10, 46:03, 46:11). The current eruption period began June 2021. This report covers activity during July-December 2023 and is based on weekly bulletins and occasional daily reports from the Observatorio Vulcanologico Sismologica de Costa Rica-Universidad Nacional (OVSICORI-UNA).
Numerous weak phreatic explosions continued during July-December 2023, along with gas-and-steam emissions and plumes that rose as high as 3 km above the crater rim. Many weekly OVSICORI-UNA bulletins included the previous week's number of explosions and emissions (table 9). For many explosions, the time of explosion was given (table 10). Frequent seismic activity (long-period earthquakes, volcano-tectonic earthquakes, and tremor) accompanied the phreatic activity.
Table 9. Number of reported weekly phreatic explosions and gas-and-steam emissions at Rincón de la Vieja, July-December 2023. Counts are reported for the week before the Weekly Bulletin date; not all reports included these data. Courtesy of OVSICORI-UNA.
| OVSICORI Weekly Bulletin |
Number of explosions |
Number of emissions |
| 28 Jul 2023 |
6 |
14 |
| 4 Aug 2023 |
10 |
12 |
| 1 Sep 2023 |
13 |
11 |
| 22 Sep 2023 |
12 |
13 |
| 29 Sep 2023 |
6 |
11 |
| 6 Oct 2023 |
12 |
5 |
| 13 Oct 2023 |
7 |
9 |
| 20 Oct 2023 |
1 |
15 |
| 27 Oct 2023 |
3 |
23 |
| 3 Nov 2023 |
3 |
10 |
| 17 Nov 2023 |
0 |
Some |
| 24 Nov 2023 |
0 |
14 |
| 8 Dec 2023 |
4 |
16 |
| 22 Dec 2023 |
8 |
18 |
Table 10. Summary of activity at Rincón de la Vieja during July-December 2023. Weak phreatic explosions and gas emissions are noted where the time of explosion was indicated in the weekly or daily bulletins. Height of plumes or emissions are distance above the crater rim. Courtesy of OVSICORI-UNA.
| Date |
Time |
Description of Activity |
| 1 Jul 2023 |
0156 |
Explosion. |
| 2 Jul 2023 |
0305 |
Explosion. |
| 4 Jul 2023 |
0229, 0635 |
Event at 0635 produced a gas-and-steam plume that rose 700 m and drifted W; seen by residents in Liberia (21 km SW). |
| 9 Jul 2023 |
1843 |
Explosion. |
| 21 Jul 2023 |
0705 |
Explosion. |
| 26 Jul 2023 |
1807 |
Explosion. |
| 28 Jul 2023 |
0802 |
Explosion generated a gas-and-steam plume that rose 500 m. |
| 30 Jul 2023 |
1250 |
Explosion. |
| 31 Jul 2023 |
2136 |
Explosion. |
| 11 Aug 2023 |
0828 |
Explosion. |
| 18 Aug 2023 |
1304 |
Explosion. |
| 21 Aug 2023 |
1224 |
Explosion generated gas-and-steam plumes rose 500-600 m. |
| 22 Aug 2023 |
0749 |
Explosion generated gas-and-steam plumes rose 500-600 m. |
| 24 Aug 2023 |
1900 |
Explosion. |
| 25 Aug 2023 |
0828 |
Event produced a steam-and-gas plume that rose 3 km and drifted NW. |
| 27-28 Aug 2023 |
0813 |
Four small events; the event at 0813 on 28 August lasted two minutes and generated a steam-and-gas plume that rose 2.5 km. |
| 1 Sep 2023 |
1526 |
Explosion generated plume that rose 2 km and ejected material onto the flanks. |
| 2-3 Sep 2023 |
- |
Small explosions detected in infrasound data. |
| 4 Sep 2023 |
1251 |
Gas-and-steam plume rose 1 km and drifted W. |
| 7 Nov 2023 |
1113 |
Explosion. |
| 8 Nov 2023 |
0722 |
Explosion. |
| 12 Nov 2023 |
0136 |
Small gas emissions. |
| 14 Nov 2023 |
0415 |
Small gas emissions. |
According to OVSICORI-UNA, during July-October the average weekly sulfur dioxide (SO2) flux ranged from 68 to 240 tonnes/day. However, in mid-November the flux increased to as high as 334 tonnes/day, the highest value measured in recent years. The high SO2 flux in mid-November was also detected by the TROPOMI instrument on the Sentinel-5P satellite (figure 43).
Geologic Background. Rincón de la Vieja, the largest volcano in NW Costa Rica, is a remote volcanic complex in the Guanacaste Range. The volcano consists of an elongated, arcuate NW-SE-trending ridge constructed within the 15-km-wide early Pleistocene Guachipelín caldera, whose rim is exposed on the south side. Sometimes known as the "Colossus of Guanacaste," it has an estimated volume of 130 km3 and contains at least nine major eruptive centers. Activity has migrated to the SE, where the youngest-looking craters are located. The twin cone of Santa María volcano, the highest peak of the complex, is located at the eastern end of a smaller, 5-km-wide caldera and has a 500-m-wide crater. A Plinian eruption producing the 0.25 km3 Río Blanca tephra about 3,500 years ago was the last major magmatic eruption. All subsequent eruptions, including numerous historical eruptions possibly dating back to the 16th century, have been from the prominent active crater containing a 500-m-wide acid lake located ENE of Von Seebach crater.
Information Contacts: Observatorio Vulcanológico Sismológica de Costa Rica-Universidad Nacional (OVSICORI-UNA), Apartado 86-3000, Heredia, Costa Rica (URL: http://www.ovsicori.una.ac.cr/); NASA Global Sulfur Dioxide Monitoring Page, Atmospheric Chemistry and Dynamics Laboratory, NASA Goddard Space Flight Center (NASA/GSFC), 8800 Greenbelt Road, Goddard MD 20771, USA (URL: https://so2.gsfc.nasa.gov/).
Bezymianny (Russia) — November 2023 Cite this Report
Bezymianny
Russia
55.972°N, 160.595°E; summit elev. 2882 m
All times are local (unless otherwise noted)
Explosion on 18 October 2023 sends ash plume 8 km high; lava flows and incandescent avalanches
Bezymianny, located on Russia’s Kamchatka Peninsula, has had eruptions since 1955 characterized by dome growth, explosions, pyroclastic flows, ash plumes, and ashfall. Activity during November 2022-April 2023 included gas-and-steam emissions, lava dome collapses generating avalanches, and persistent thermal activity. Similar eruptive activity continued from May through October 2023, described here based on information from weekly and daily reports of the Kamchatka Volcano Eruptions Response Team (KVERT), notices from Tokyo VAAC (Volcanic Ash Advisory Center), and from satellite data.
Overall activity decreased after the strong period of activity in late March through April 2023, which included ash explosions during 29 March and 7-8 April 2023 that sent plumes as high as 10-12 km altitude, along with dome growth and lava flows (BGVN 48:05). This reduced activity can be seen in the MIROVA thermal detection system graph (figure 56), which was consistent with data from the MODVOLC thermal detection system and with Sentinel-2 satellite images that showed persistent hotspots in the summit crater when conditions allowed observations. A renewed period of strong activity began in mid-October 2023.
Activity increased significantly on 17 October 2023 when large collapses began during 0700-0830 on the E flanks of the lava dome and continued to after 0930 the next day (figure 57). Ash plumes rose to an altitude of 4.5-5 km, extending 220 km NNE by 18 October. A large explosion at 1630 on 18 October produced an ash plume that rose to an altitude of 11 km (8 km above the summit) and drifted NNE and then NW, extending 900 km NW within two days at an altitude of 8 km. Minor ashfall was noted in Kozyrevsk (45 km WNW). At 0820 on 20 October an ash plume was identified in satellite images drifting 100 km ENE at altitudes of 4-4.5 km.
Lava flows and hot avalanches from the dome down the SE flank continued over the next few days, including 23 October when clear conditions allowed good observations (figures 58 and 59). A large thermal anomaly was observed over the volcano through 24 October, and in the summit crater on 30 October (figure 60). Strong fumarolic activity continued, with numerous avalanches and occasional incandescence. By the last week of October, volcanic activity had decreased to a level consistent with that earlier in the reporting period.
Aviation warnings were frequently updated during 17-20 October. KVERT issued a Volcano Observatory Notice for Aviation (VONA) on 17 October at 1419 and 1727 (0219 and 0527 UTC) raising the Aviation Color Code (ACC) from Yellow to Orange (second highest level). The next day, KVERT issued a VONA at 1705 (0505 UTC) raising the ACC to Red (highest level) but lowered it back to Orange at 2117 (0917 UTC). After another decrease to Yellow and back to Orange, the ACC was reduced to Yellow on 20 October at 1204 (0004 UTC). In addition, the Tokyo VAAC issued a series of Volcanic Ash Advisories beginning on 16 October and continuing through 30 October.
Geologic Background. The modern Bezymianny, much smaller than its massive neighbors Kamen and Kliuchevskoi on the Kamchatka Peninsula, was formed about 4,700 years ago over a late-Pleistocene lava-dome complex and an edifice built about 11,000-7,000 years ago. Three periods of intensified activity have occurred during the past 3,000 years. The latest period, which was preceded by a 1,000-year quiescence, began with the dramatic 1955-56 eruption. This eruption, similar to that of St. Helens in 1980, produced a large open crater that was formed by collapse of the summit and an associated lateral blast. Subsequent episodic but ongoing lava-dome growth, accompanied by intermittent explosive activity and pyroclastic flows, has largely filled the 1956 crater.
Information Contacts: Kamchatka Volcanic Eruptions Response Team (KVERT), Far Eastern Branch, Russian Academy of Sciences, 9 Piip Blvd., Petropavlovsk-Kamchatsky, 683006, Russia (URL: http://www.kscnet.ru/ivs/kvert/); Kamchatka Volcanological Station, Kamchatka Branch of Geophysical Survey, (KB GS RAS), Klyuchi, Kamchatka Krai, Russia (URL: http://volkstat.ru/); Tokyo Volcanic Ash Advisory Center (VAAC), 1-3-4 Otemachi, Chiyoda-ku, Tokyo 100-8122, Japan (URL: http://ds.data.jma.go.jp/svd/vaac/data/); Hawai'i Institute of Geophysics and Planetology (HIGP) - MODVOLC Thermal Alerts System, School of Ocean and Earth Science and Technology (SOEST), Univ. of Hawai'i, 2525 Correa Road, Honolulu, HI 96822, USA (URL: http://modis.higp.hawaii.edu/); MIROVA (Middle InfraRed Observation of Volcanic Activity), a collaborative project between the Universities of Turin and Florence (Italy) supported by the Centre for Volcanic Risk of the Italian Civil Protection Department (URL: http://www.mirovaweb.it/); Copernicus Browser, Copernicus Data Space Ecosystem, European Space Agency (URL: https://dataspace.copernicus.eu/browser/).chr
Kilauea (United States) — January 2023 Cite this Report
Kilauea
United States
19.421°N, 155.287°W; summit elev. 1222 m
All times are local (unless otherwise noted)
Low-level lava effusions in the lava lake at Halema’uma’u during July-December 2022
Kīlauea is the southeastern-most volcano in Hawaii and overlaps the E flank of the Mauna Loa volcano. Its East Rift Zone (ERZ) has been intermittently active for at least 2,000 years. An extended eruption period began in January 1983 and was characterized by open lava lakes and lava flows from the summit caldera and the East Rift Zone. During May 2018 magma migrated into the Lower East Rift Zone (LERZ) and opened 24 fissures along a 6-km-long NE-trending fracture zone that produced lava flows traveling in multiple directions. As lava emerged from the fissures, the lava lake at Halema'uma'u drained and explosions sent ash plumes to several kilometers altitude (BGVN 43:10).
The current eruption period started during September 2021 and has recently been characterized by lava effusions, spatter, and sulfur dioxide emissions in the active Halema’uma’u lava lake (BGVN 47:08). Lava effusions, some spatter, and sulfur dioxide emissions have continued during this reporting period of July through December 2022 using daily reports, volcanic activity notices, and abundant photo, map, and video data from the US Geological Survey's (USGS) Hawaiian Volcano Observatory (HVO).
Summary of activity during July-December 2022. Low-level effusions have continued at the western vent of the Halema’uma’u crater during July through early December 2022. Occasional weak ooze-outs (also called lava break outs) would occur along the margins of the crater floor. The overall level of the active lava lake throughout the reporting period gradually increased due to infilling, however it stagnated in mid-September (table 13). During September through November, activity began to decline, though lava effusions persisted at the western vent. By 9 December, the active part of the lava lake had completely crusted over, and incandescence was no longer visible.
Table 13. Summary of measurements taken during overflights at Kīlauea that show a gradual increase in the active lava lake level and the volume of lava effused since 29 September 2021. Lower activity was reported during September-October. Data collected during July-December 2022. Courtesy of HVO.
| Date: |
Level of the active lava lake (m): |
Cumulative volume of lava effused (million cubic meters): |
| 7 Jul 2022 |
130 |
95 |
| 19 Jul 2022 |
133 |
98 |
| 4 Aug 2022 |
136 |
102 |
| 16 Aug 2022 |
137 |
104 |
| 12 Sep 2022 |
143 |
111 |
| 5 Oct 2022 |
143 |
111 |
| 28 Oct 2022 |
143 |
111 |
Activity during July 2022. Lava effusions were reported from the western vent in the Halema’uma’u crater, along with occasional weak ooze-outs along the margins of the crater floor. The height of the lava lake was variable due to deflation-inflation tilt events; for example, the lake level dropped approximately 3-4 m during a summit deflation-inflation event reported on 1 July. Webcam images taken during the night of 6-12 July showed intermittent low-level spattering at the western vent that rose less than 10 m above the vent (figure 519). Measurements made during an overflight on 7 July indicated that the crater floor was infilled about 130 m and that 95 million cubic meters of lava had been effused since 29 September 2021. A single, relatively small lava ooze-out was active to the S of the lava lake. Around midnight on 8 July there were two brief periods of lava overflow onto the lake margins. On 9 July lava ooze-outs were reported near the SE and NE edges of the crater floor and during 10-11 July they occurred near the E, NE, and NW edges. On 16 July crater incandescence was reported, though the ooze-outs and spattering were not visible. On 18 July overnight webcam images showed incandescence in the western vent complex and two ooze-outs were reported around 0000 and 0200 on 19 July. By 0900 there were active ooze-outs along the SW edge of the crater floor. Measurements made from an overflight on 19 July indicated that the crater floor was infilled about 133 m and 98 million cubic meters of lava had erupted since 29 September 2021 (figure 520). On 20 July around 1600 active ooze-outs were visible along the N edge of the crater, which continued through the next day. Extensive ooze-outs occurred along the W margin during 24 July until 1900; on 26 July minor ooze-outs were noted along the N margin. Minor spattering was visible on 29 July along the E margin of the lake. The sulfur dioxide emission rates ranged 650-2,800 tons per day (t/d), the higher of which was measured on 8 July (figure 519).
Activity during August 2022. The eruption continued in the Halema’uma’u crater at the western vent. According to HVO the lava in the active lake remained at the level of the bounding levees. Occasional minor ooze-outs were observed along the margins of the crater floor. Strong nighttime crater incandescence was visible after midnight on 6 August over the western vent cone. During 6-7 August scattered small lava lobes were active along the crater floor and incandescence persisted above the western vent through 9 August. During 7-9 August HVO reported a single lava effusion source was active along the NW margin of the crater floor. Measurements from an overflight on 4 August indicated that the crater floor was infilled about 136 m total and that 102 million cubic meters of lava had been erupted since the start of the eruption. Lava breakouts were reported along the N, NE, E, S, and W margins of the crater during 10-16 August. Another overflight survey conducted on 16 August indicated that the crater floor infilled about 137 m and 104 million cubic meters of lava had been erupted since September 2021. Measured sulfur dioxide emissions rates ranged 1,150-2,450 t/d, the higher of which occurred on 8 August.
Activity during September 2022. During September, lava effusion continued from the western vent into the active lava lake and onto the crater floor. Intermittent minor ooze-outs were reported through the month. A small ooze-out was visible on the W crater floor margin at 0220 on 2 September, which showed decreasing surface activity throughout the day, but remained active through 3 September. On 3 September around 1900 a lava outbreak occurred along the NW margin of the crater floor but had stopped by the evening of 4 September. Field crews monitoring the summit lava lake on 9 September observed spattering on the NE margin of the lake that rose no higher than 10 m, before falling back onto the lava lake crust (figure 521). Overflight measurements on 12 September indicated that the crater floor was infilled a total of 143 m and 111 million cubic meters of lava had been erupted since September 2021. Extensive breakouts in the W and N part of the crater floor were reported at 1600 on 20 September and continued into 26 September. The active part of the lava lake dropped by 10 m while other parts of the crater floor dropped by several meters. Summit tiltmeters recorded a summit seismic swarm of more than 80 earthquakes during 1500-1800 on 21 September, which occurred about 1.5 km below Halema’uma’u; a majority of these were less than Mw 2. By 22 September the active part of the lava lake was infilled about 2 m. On 23 September the western vent areas exhibited several small spatter cones with incandescent openings, along with weak, sporadic spattering (figure 522). The sulfur dioxide emission rate ranged from 930 t/d to 2,000 t/d, the higher of which was measured on 6 September.
Activity during October 2022. Activity during October declined slightly compared to previous months, though lava effusions persisted from the western vent into the active lava lake and onto the crater floor during October (figure 523). Slight variations in the lava lake were noted throughout the month. HVO reported that around 0600 on 3 October the level of the lava lake has lowered slightly. Overflight measurements taken on 5 October indicated that the crater floor was infilled a total of about 143 m and that 111 million cubic meters of lava had been effused since September 2021. During 6-7 October the lake gradually rose 0.5 m. Sulfur dioxide measurements made on 22 October had an emission rate of 700 t/d. Another overflight taken on 28 October showed that there was little to no change in the elevation of the crater floor: the crater floor was infilled a total of 143 m and 111 million cubic meters of lava had erupted since the start of the eruption.
Activity during November 2022. Activity remained low during November, though HVO reported that lava from the western vent continued to effuse into the active lava lake and onto the crater floor throughout the month. The rate of sulfur dioxide emissions during November ranged from 300-600 t/d, the higher amount of which occurred on 9 November.
Activity during December 2022. Similar low activity was reported during December, with lava effusing from the western vent into the active lava lake and onto the crater floor. During 4-5 December the active part of the lava lake was slightly variable in elevation and fluctuated within 1 m. On 9 December HVO reported that lava was no longer erupting from the western vent in the Halema’uma’u crater and that sulfur dioxide emissions had returned to near pre-eruption background levels; during 10-11 December, the lava lake had completely crusted over, and no incandescence was visible (figure 524). Time lapse camera images covering the 4-10 December showed that the crater floor showed weak deflation and no inflation. Some passive events of crustal overturning were reported during 14-15 December, which brought fresh incandescent lava to the lake surface. The sulfur dioxide emission rate was approximately 200 t/d on 14 December. A smaller overturn event on 17 December and another that occurred around 0000 and into the morning of 20 December were also detected. A small seismic swarm was later detected on 30 December.
Geologic Background. Kilauea overlaps the E flank of the massive Mauna Loa shield volcano in the island of Hawaii. Eruptions are prominent in Polynesian legends; written documentation since 1820 records frequent summit and flank lava flow eruptions interspersed with periods of long-term lava lake activity at Halemaumau crater in the summit caldera until 1924. The 3 x 5 km caldera was formed in several stages about 1,500 years ago and during the 18th century; eruptions have also originated from the lengthy East and Southwest rift zones, which extend to the ocean in both directions. About 90% of the surface of the basaltic shield volcano is formed of lava flows less than about 1,100 years old; 70% of the surface is younger than 600 years. The long-term eruption from the East rift zone between 1983 and 2018 produced lava flows covering more than 100 km2, destroyed hundreds of houses, and added new coastline.
Information Contacts: Hawaiian Volcano Observatory (HVO), U.S. Geological Survey, PO Box 51, Hawai'i National Park, HI 96718, USA (URL: http://hvo.wr.usgs.gov/).
Nyamulagira (DR Congo) — November 2023 Cite this Report
Nyamulagira
DR Congo
1.408°S, 29.2°E; summit elev. 3058 m
All times are local (unless otherwise noted)
Lava flows and thermal activity during May-October 2023
Nyamulagira (also known as Nyamuragira) is a shield volcano in the Democratic Republic of Congo with the summit truncated by a small 2 x 2.3 km caldera with walls up to about 100 m high. Documented eruptions have occurred within the summit caldera, as well as from numerous flank fissures and cinder cones. The current eruption period began in April 2018 and has more recently been characterized by summit crater lava flows and thermal activity (BGVN 48:05). This report describes lava flows and variable thermal activity during May through October 2023, based on information from the Observatoire Volcanologique de Goma (OVG) and various satellite data.
Lava lake activity continued during May. The MIROVA (Middle InfraRed Observation of Volcanic Activity) system recorded moderate-to-strong thermal activity throughout the reporting period; activity was more intense during May and October and relatively weaker from June through September (figure 95). The MODVOLC thermal algorithm, detected a total of 209 thermal alerts. There were 143 hotspots detected during May, eight during June, nine during September, and 49 during October. This activity was also reflected in infrared satellite images, where a lava flow was visible in the NW part of the crater on 7 May and strong activity was seen in the center of the crater on 4 October (figure 96). Another infrared satellite image taken on 12 May showed still active lava flows along the NW margin of the crater. According to OVG lava effusions were active during 7-29 May and moved to the N and NW parts of the crater beginning on 9 May. Strong summit crater incandescence was visible from Goma (27 km S) during the nights of 17, 19, and 20 May (figure 97). On 17 May there was an increase in eruptive activity, which peaked at 0100 on 20 May. Notable sulfur dioxide plumes drifted NW and W during 19-20 May (figure 98). Drone footage acquired in partnership with the USGS (United States Geological Survey) on 20 May captured images of narrow lava flows that traveled about 100 m down the W flank (figure 99). Data from the Rumangabo seismic station indicated a decreasing trend in activity during 17-21 May. Although weather clouds prevented clear views of the summit, a strong thermal signature on the NW flank was visible in an infrared satellite image on 22 May, based on an infrared satellite image. On 28 May the lava flows on the upper W flank began to cool and solidify. By 29 May seismicity returned to levels similar to those recorded before the 17 May increase. Lava effusion continued but was confined to the summit crater; periodic crater incandescence was observed.
Low-level activity was noted during June through October. On 1 June OVG reported that seismicity remained at lower levels and that crater incandescence had been absent for three days, though infrared satellite imagery showed continued lava effusion in the summit crater. The lava flows on the flanks covered an estimated 0.6 km2. Satellite imagery continued to show thermal activity confined to the lava lake through October (figure 96), although no lava flows or significant sulfur dioxide emissions were reported.
Geologic Background. Africa's most active volcano, Nyamulagira (also known as Nyamuragira), is a massive high-potassium basaltic shield about 25 km N of Lake Kivu and 13 km NNW of the steep-sided Nyiragongo volcano. The summit is truncated by a small 2 x 2.3 km caldera that has walls up to about 100 m high. Documented eruptions have occurred within the summit caldera, as well as from the numerous flank fissures and cinder cones. A lava lake in the summit crater, active since at least 1921, drained in 1938, at the time of a major flank eruption. Recent lava flows extend down the flanks more than 30 km from the summit as far as Lake Kivu; extensive lava flows from this volcano have covered 1,500 km2 of the western branch of the East African Rift.
Information Contacts: Observatoire Volcanologique de Goma (OVG), Departement de Geophysique, Centre de Recherche en Sciences Naturelles, Lwiro, D.S. Bukavu, DR Congo; Hawai'i Institute of Geophysics and Planetology (HIGP) - MODVOLC Thermal Alerts System, School of Ocean and Earth Science and Technology (SOEST), Univ. of Hawai'i, 2525 Correa Road, Honolulu, HI 96822, USA (URL: http://modis.higp.hawaii.edu/); MIROVA (Middle InfraRed Observation of Volcanic Activity), a collaborative project between the Universities of Turin and Florence (Italy) supported by the Centre for Volcanic Risk of the Italian Civil Protection Department (URL: http://www.mirovaweb.it/); NASA Global Sulfur Dioxide Monitoring Page, Atmospheric Chemistry and Dynamics Laboratory, NASA Goddard Space Flight Center (NASA/GSFC), 8800 Greenbelt Road, Goddard, Maryland, USA (URL: https://so2.gsfc.nasa.gov/); Copernicus Browser, Copernicus Data Space Ecosystem, European Space Agency (URL: https://dataspace.copernicus.eu/browser/); Charles Balagizi, Goma Volcano Observatory, Departement de Geophysique, Centre de Recherche en Sciences Naturelles, Lwiro, D.S. Bukavu, DR Congo.
Bagana (Papua New Guinea) — October 2023 Cite this Report
Bagana
Papua New Guinea
6.137°S, 155.196°E; summit elev. 1855 m
All times are local (unless otherwise noted)
Explosions, ash plumes, ashfall, and lava flows during April-September 2023
The remote volcano of Bagana is located in central Bougainville Island, Papua New Guinea. Recorded eruptions date back to 1842 and activity has consisted of effusive activity that has built a small lava dome in the summit crater and occasional explosions that produced pyroclastic flows. The most recent eruption has been ongoing since February 2000 and has produced occasional explosions, ash plumes, and lava flows. More recently, activity has been characterized by ongoing effusive activity and ash emissions (BGVN 48:04). This report updates activity from April through September 2023 that has consisted of explosions, ash plumes, ashfall, and lava flows, using information from the Darwin Volcanic Ash Advisory Center (VAAC) and satellite data.
An explosive eruption was reported on 7 July that generated a large gas-and-ash plume to high altitudes and caused significant ashfall in local communities; the eruption plume had reached upper tropospheric (16-18 km altitude) altitudes by 2200, according to satellite images. Sulfur dioxide plumes were detected in satellite images on 8 July and indicated that the plume was likely a mixture of gas, ice, and ash. A report issued by the Autonomous Bougainville Government (ABG) (Torokina District, Education Section) on 10 July noted that significant ash began falling during 2000-2100 on 7 July and covered most areas in the Vuakovi, Gotana (9 km SW), Koromaketo, Laruma (25 km W) and Atsilima (27 km NW) villages. Pyroclastic flows also occurred, according to ground-based reports; small deposits confined to one drainage were inspected by RVO during an overflight on 17 July and were confirmed to be from the 7 July event. Ashfall continued until 10 July and covered vegetation, which destroyed bushes and gardens and contaminated rivers and streams.
RVO reported another eruption on 14 July. The Darwin VAAC stated that an explosive event started around 0830 on 15 July and produced an ash plume that rose to 16.5 km altitude by 1000 and drifted N, according to satellite images. The plume continued to drift N and remained visible through 1900, and by 2150 it had dissipated.
Ashfall likely from both the 7 and 15 July events impacted about 8,111 people in Torokina (20 km SW), including Tsito/Vuakovi, Gotana, Koromaketo, Kenaia, Longkogari, Kenbaki, Piva (13 km SW), and Atsinima, and in the Tsitovi district, according to ABG. Significant ashfall was also reported in Ruruvu (22 km N) in the Wakunai District of Central Bougainville, though the thickness of these deposits could not be confirmed. An evacuation was called for the villages in Wakunai, where heavy ashfall had contaminated water sources; the communities of Ruruvu, Togarau, Kakarapaia, Karauturi, Atao, and Kuritaturi were asked to evacuate to a disaster center at the Wakunai District Station, and communities in Torokina were asked to evacuate to the Piva District station. According to a news article, more than 7,000 people needed temporary accommodations, with about 1,000 people in evacuation shelters. Ashfall had deposited over a broad area, contaminating water supplies, affecting crops, and collapsing some roofs and houses in rural areas. Schools were temporarily shut down. Intermittent ash emissions continued through the end of July and drifted NNW, NW, and SW. Fine ashfall was reported on the coast of Torokina, and ash plumes also drifted toward Laruma and Atsilima.
A small explosive eruption occurred at 2130 on 28 July that ejected material from the crater vents, according to reports from Torokina, in addition to a lava flow that contained two lobes. A second explosion was detected at 2157. Incandescence from the lava flow was visible from Piva as it descended the W flank around 2000 on 29 July (figure 47). The Darwin VAAC reported that a strong thermal anomaly was visible in satellite images during 30-31 July and that ash emissions rose to 2.4 km altitude and drifted WSW on 30 July. A ground report from RVO described localized emissions at 0900 on 31 July.
The Darwin VAAC reported that ash plumes were identified in satellite imagery at 0800 and 1220 on 12 August and rose to 2.1 km and 3 km altitude and drifted NW and W, respectively. A news report stated that aid was sent to more than 6,300 people that were adversely affected by the eruption. Photos taken during 17-19 August showed ash emissions rising no higher than 1 km above the summit and drifting SE. A small explosion generated an ash plume during the morning of 19 August. Deposits from small pyroclastic flows were also captured in the photos. Satellite images captured lava flows and pyroclastic flow deposits. Two temporary seismic stations were installed near Bagana on 17 August at distances of 7 km WSW (Vakovi station) and 11 km SW (Kepox station). The Kepox station immediately started to record continuous, low-frequency background seismicity.
Satellite data. Little to no thermal activity was detected during April through mid-July 2023; only one anomaly was recorded during early April and one during early June, according to MIROVA (Middle InfraRed Observation of Volcanic Activity) data (figure 48). Thermal activity increased in both power and frequency during mid-July through September, although there were still some short gaps in detected activity. MODVOLC also detected increased thermal activity during August; thermal hotspots were detected a total of five times on 19, 20, and 27 August. Weak thermal anomalies were also captured in infrared satellite images on clear weather days throughout the reporting period on 7, 12, and 17 April, 27 May, 1, 6, 16, and 31 July, and 19 September (figure 48); a strong thermal anomaly was visible on 31 July. Distinct sulfur dioxide plumes that drifted generally NW were intermittently captured by the TROPOMI instrument on the Sentinel-5P satellite and sometimes exceeded two Dobson Units (DUs) (figure 49).
Geologic Background. Bagana volcano, in a remote portion of central Bougainville Island, is frequently active. This massive symmetrical cone was largely constructed by an accumulation of viscous andesitic lava flows. The entire edifice could have been constructed in about 300 years at its present rate of lava production. Eruptive activity is characterized by non-explosive effusion of viscous lava that maintains a small lava dome in the summit crater, although occasional explosive activity produces pyroclastic flows. Lava flows with tongue-shaped lobes up to 50 m thick and prominent levees descend the flanks on all sides.
Information Contacts: Rabaul Volcano Observatory (RVO), Geohazards Management Division, Department of Mineral Policy and Geohazards Management (DMPGM), PO Box 3386, Kokopo, East New Britain Province, Papua New Guinea; Darwin Volcanic Ash Advisory Centre (VAAC), Bureau of Meteorology, Northern Territory Regional Office, PO Box 40050, Casuarina, NT 0811, Australia (URL: http://www.bom.gov.au/info/vaac/); MIROVA (Middle InfraRed Observation of Volcanic Activity), a collaborative project between the Universities of Turin and Florence (Italy) supported by the Centre for Volcanic Risk of the Italian Civil Protection Department (URL: http://www.mirovaweb.it/); Hawai'i Institute of Geophysics and Planetology (HIGP) - MODVOLC Thermal Alerts System, School of Ocean and Earth Science and Technology (SOEST), Univ. of Hawai'i, 2525 Correa Road, Honolulu, HI 96822, USA (URL: http://modis.higp.hawaii.edu/); NASA Global Sulfur Dioxide Monitoring Page, Atmospheric Chemistry and Dynamics Laboratory, NASA Goddard Space Flight Center (NASA/GSFC), 8800 Greenbelt Road, Goddard, Maryland, USA (URL: https://so2.gsfc.nasa.gov/); Copernicus Browser, Copernicus Data Space Ecosystem, European Space Agency (URL: https://dataspace.copernicus.eu/browser/); Autonomous Bougainville Government, P.O Box 322, Buka, AROB, PNG (URL: https://abg.gov.pg/); Andrew Tupper (Twitter: @andrewcraigtupp); Simon Carn, Geological and Mining Engineering and Sciences, Michigan Technological University, 1400 Townsend Drive, Houghton, MI 49931, USA (URL: http://www.volcarno.com/, Twitter: @simoncarn); Radio NZ (URL: https://www.rnz.co.nz/news/pacific/494464/more-than-7-000-people-in-bougainville-need-temporary-accommodation-after-eruption); USAID, 1300 Pennsylvania Ave, NW, Washington DC 20004, USA (URL: https://www.usaid.gov/pacific-islands/press-releases/aug-08-2023-united-states-provides-immediate-emergency-assistance-support-communities-affected-mount-bagana-volcanic-eruptions).
Mayon (Philippines) — October 2023 Cite this Report
Mayon
Philippines
13.257°N, 123.685°E; summit elev. 2462 m
All times are local (unless otherwise noted)
Lava flows, pyroclastic flows, ash emissions, and seismicity during April-September 2023
Mayon is located in the Philippines and has steep upper slopes capped by a small summit crater. Historical eruptions date back to 1616 CE that have been characterized by Strombolian eruptions, lava flows, pyroclastic flows, and mudflows. Eruptions mostly originated from a central conduit. Pyroclastic flows and mudflows have commonly descended many of the approximately 40 drainages that surround the volcano. The most recent eruption occurred during June through October 2022 and consisted of lava dome growth and gas-and-steam emissions (BGVN 47:12). A new eruption was reported during late April 2023 and has included lava flows, pyroclastic density currents, ash emissions, and seismicity. This report covers activity during April through September 2023 based on daily bulletins from the Philippine Institute of Volcanology and Seismology (PHIVOLCS).
During April through September 2023, PHIVOLCS reported near-daily rockfall events, frequent volcanic earthquakes, and sulfur dioxide measurements. Gas-and-steam emissions rose 100-900 m above the crater and drifted in different directions. Nighttime crater incandescence was often visible during clear weather and was accompanied by incandescent avalanches of material. Activity notably increased during June when lava flows were reported on the S, SE, and E flanks (figure 52). The MIROVA graph (Middle InfraRed Observation of Volcanic Activity) showed strong thermal activity coincident with these lava flows, which remained active through September (figure 53). According to the MODVOLC thermal algorithm, a total of 110 thermal alerts were detected during the reporting period: 17 during June, 40 during July, 27 during August, and 26 during September. During early June, pyroclastic density currents (PDCs) started to occur more frequently.
Low activity was reported during much of April and May; gas-and-steam emissions rose 100-900 m above the crater and generally drifted in different directions. A total of 52 rockfall events and 18 volcanic earthquakes were detected during April and 147 rockfall events and 13 volcanic events during May. Sulfur dioxide flux measurements ranged between 400-576 tons per day (t/d) during April, the latter of which was measured on 29 April and between 162-343 t/d during May, the latter of which was measured on 13 May.
Activity during June increased, characterized by lava flows, pyroclastic density currents (PDCs), crater incandescence and incandescent rockfall events, gas-and-steam emissions, and continued seismicity. Weather clouds often prevented clear views of the summit, but during clear days, moderate gas-and-steam emissions rose 100-2,500 m above the crater and drifted in multiple directions. A total of 6,237 rockfall events and 288 volcanic earthquakes were detected. The rockfall events often deposited material on the S and SE flanks within 700-1,500 m of the summit crater and ash from the events drifted SW, S, SE, NE, and E. Sulfur dioxide emissions ranged between 149-1,205 t/d, the latter of which was measured on 10 June. Short-term observations from EDM and electronic tiltmeter monitoring indicated that the upper slopes were inflating since February 2023. Longer-term ground deformation parameters based on EDM, precise leveling, continuous GPS, and electronic tilt monitoring indicated that the volcano remained inflated, especially on the NW and SE flanks. At 1000 on 5 June the Volcano Alert Level (VAL) was raised to 2 (on a 0-5 scale). PHIVOLCS noted that although low-level volcanic earthquakes, ground deformation, and volcanic gas emissions indicated unrest, the steep increase in rockfall frequency may indicate increased dome activity.
A total of 151 dome-collapse PDCs occurred during 8-9 and 11-30 June, traveled 500-2,000 m, and deposited material on the S flank within 2 km of the summit crater. During 8-9 June the VAL was raised to 3. At approximately 1947 on 11 June lava flow activity was reported; two lobes traveled within 500 m from the crater and deposited material on the S (Mi-isi), SE (Bonga), and E (Basud) flanks. Weak seismicity accompanied the lava flow and slight inflation on the upper flanks. This lava flow remained active through 30 June, moving down the S and SE flank as far as 2.5 km and 1.8 km, respectively and depositing material up to 3.3 km from the crater. During 15-16 June traces of ashfall from the PDCs were reported in Sitio Buga, Nabonton, City of Ligao and Purok, and San Francisco, Municipality of Guinobatan. During 28-29 June there were two PDCs generated by the collapse of the lava flow front, which generated a light-brown ash plume 1 km high. Satellite monitors detected significant concentrations of sulfur dioxide beginning on 29 June. On 30 June PDCs primarily affected the Basud Gully on the E flank, the largest of which occurred at 1301 and lasted eight minutes, based on the seismic record. Four PDCs generated between 1800 and 2000 that lasted approximately four minutes each traveled 3-4 km on the E flank and generated an ash plume that rose 1 km above the crater and drifted N and NW. Ashfall was recorded in Tabaco City.
Similar strong activity continued during July; slow lava effusion remained active on the S and SE flanks and traveled as far as 2.8 km and 2.8 km, respectively and material was deposited as far as 4 km from the crater. There was a total of 6,983 rockfall events and 189 PDCs that affected the S, SE, and E flanks. The volcano network detected a total of 2,124 volcanic earthquakes. Continuous gas-and-steam emissions rose 200-2,000 m above the crater and drifted in multiple directions. Sulfur dioxide emissions averaged 792-4,113 t/d, the latter of which was measured on 28 July. During 2-4 July three PDCs were generated from the collapse of the lava flow and resulting light brown plumes rose 200-300 m above the crater. Continuous tremor pulses were reported beginning at 1547 on 3 July through 7 July at 1200, at 2300 on 8 July and going through 0300 on 10 July, and at 2300 on 16 July, as recorded by the seismic network. During 6-9 July there were 10 lava flow-collapse-related PDCs that generated light brown plumes 300-500 m above the crater. During 10-11 July light ashfall was reported in some areas of Mabinit, Legazpi City, Budiao and Salvacion, Daraga, and Camalig, Albay. By 18 July the lava flow advanced 600 m on the E flank as well.
During 1733 on 18 July and 0434 on 19 July PHIVOLCS reported 30 “ashing” events, which are degassing events accompanied by audible thunder-like sounds and entrained ash at the crater, which produced short, dark plumes that drifted SW. These events each lasted 20-40 seconds, and plume heights ranged from 150-300 m above the crater, as recorded by seismic, infrasound, visual, and thermal monitors. Three more ashing events occurred during 19-20 July. Short-term observations from electronic tilt and GPS monitoring indicate deflation on the E lower flanks in early July and inflation on the NW middle flanks during the third week of July. Longer-term ground deformation parameters from EDM, precise leveling, continuous GPS, and electronic tilt monitoring indicated that the volcano was still generally inflated relative to baseline levels. A short-lived lava pulse lasted 28 seconds at 1956 on 21 July, which was accompanied by seismic and infrasound signals. By 22 July, the only lava flow that remained active was on the SE flank, and continued to extend 3.4 km, while those on the S and E flanks weakened markedly. One ashing event was detected during 30-31 July, whereas there were 57 detected during 31 July-1 August; according to PHIVOLCS beginning at approximately 1800 on 31 July eruptive activity was dominated by phases of intermittent ashing, as well as increased in the apparent rates of lava effusion from the summit crater. The ashing phases consisted of discrete events recorded as low-frequency volcanic earthquakes (LFVQ) typically 30 seconds in duration, based on seismic and infrasound signals. Gray ash plume rose 100 m above the crater and generally drifted NE. Shortly after these ashing events began, new lava began to effuse rapidly from the crater, feeding the established flowed on the SE, E, and E flanks and generating frequent rockfall events.
Intensified unrest persisted during August. There was a total of 4,141 rockfall events, 2,881 volcanic earthquakes, which included volcanic tremor events, 32 ashing events, and 101 PDCs detected throughout the month. On clear weather days, gas-and-steam emissions rose 300-1,500 m above the crater and drifted in different directions (figure 54). Sulfur dioxide emissions averaged 735-4,756 t/d, the higher value of which was measured on 16 August. During 1-2 August the rate of lava effusion decreased, but continued to feed the flows on the SE, S, and E flanks, maintaining their advances to 3.4 km, 2.8 km, and 1.1 km from the crater, respectively (figure 55). Rockfall and PDCs generated by collapses at the lava flow margins and from the summit dome deposited material within 4 km of the crater. During 3-4 August there were 10 tremor events detected that lasted 1-4 minutes. Short-lived lava pulse lasted 35 seconds and was accompanied by seismic and infrasound signals at 0442 on 6 August. Seven collapses were recorded at the front of the lava flow during 12-14 August.
During September, similar activity of slow lava effusion, PDCs, gas-and-steam emissions, and seismicity continued. There was a total of 4,452 rockfall events, 329 volcanic earthquakes, which included volcanic tremor events, two ashing events, and 85 PDCs recorded throughout the month. On clear weather days, gas-and-steam emissions rose 100-1,500 m above the crater and drifted in multiple directions. Sulfur dioxide emissions averaged 609-2,252 t/d, the higher average of which was measured on 6 September. Slow lava effusion continued advancing on the SE, S, and E flanks, maintaining lengths of 3.4 km, 2.8 km, and 1.1 km, respectively. Rockfall and PDC events generated by collapses along the lava flow margins and at the summit dome deposited material within 4 km of the crater.
Geologic Background. Symmetrical Mayon, which rises above the Albay Gulf NW of Legazpi City, is the most active volcano of the Philippines. The steep upper slopes are capped by a small summit crater. Recorded eruptions since 1616 CE range from Strombolian to basaltic Plinian, with cyclical activity beginning with basaltic eruptions, followed by longer periods of andesitic lava flows. Eruptions occur predominately from the central conduit and have also produced lava flows that travel far down the flanks. Pyroclastic density currents and mudflows have commonly swept down many of the approximately 40 ravines that radiate from the summit and have often damaged populated lowland areas. A violent eruption in 1814 killed more than 1,200 people and devastated several towns.
Information Contacts: Philippine Institute of Volcanology and Seismology (PHIVOLCS), Department of Science and Technology, University of the Philippines Campus, Diliman, Quezon City, Philippines (URL: http://www.phivolcs.dost.gov.ph/); MIROVA (Middle InfraRed Observation of Volcanic Activity), a collaborative project between the Universities of Turin and Florence (Italy) supported by the Centre for Volcanic Risk of the Italian Civil Protection Department (URL: http://www.mirovaweb.it/); Hawai'i Institute of Geophysics and Planetology (HIGP) - MODVOLC Thermal Alerts System, School of Ocean and Earth Science and Technology (SOEST), Univ. of Hawai'i, 2525 Correa Road, Honolulu, HI 96822, USA (URL: http://modis.higp.hawaii.edu/); Copernicus Browser, Copernicus Data Space Ecosystem, European Space Agency (URL: https://dataspace.copernicus.eu/browser/); William Rogers, Legazpi City, Albay Province, Philippines.
Nishinoshima (Japan) — October 2023 Cite this Report
Nishinoshima
Japan
27.247°N, 140.874°E; summit elev. 100 m
All times are local (unless otherwise noted)
Eruption plumes and gas-and-steam plumes during May-August 2023
Nishinoshima, located about 1,000 km S of Tokyo, is a small island in the Ogasawara Arc in Japan. The island is the summit of a massive submarine volcano that has prominent submarine peaks to the S, W, and NE. Eruptions date back to 1973 and the current eruption period began in October 2022. Recent activity has consisted of small ash plumes and fumarolic activity (BGVN 48:07). This report covers activity during May through August 2023, using information from monthly reports of the Japan Meteorological Agency (JMA) monthly reports and satellite data.
Activity during May through June was relatively low. The Japan Coast Guard (JCG) did overflights on 14 and 22 June and reported white gas-and-steam emissions rising 600 m and 1,200 m from the central crater of the pyroclastic cone, respectively (figure 125). In addition, multiple white gas-and-steam emissions rose from the inner rim of the W side of the crater and from the SE flank of the pyroclastic cone. Discolored brown-to-green water was observed around almost the entire perimeter of the island; on 22 June light green discolored water was observed off the S coast of the island.
Observations from the Himawari meteorological satellite confirmed an eruption on 9 and 10 July. An eruption plume rose 1.6 km above the crater and drifted N around 1300 on 9 July. Satellite images acquired at 1420 and 2020 on 9 July and at 0220 on 10 July showed continuing emissions that rose 1.3-1.6 km above the crater and drifted NE and N. The Tokyo VAAC reported that an ash plume seen by a pilot and identified in a satellite image at 0630 on 21 July rose to 3 km altitude and drifted S.
Aerial observations conducted by JCG on 8 August showed a white-and-gray plume rising from the central crater of the pyroclastic cone, and multiple white gas-and-steam emissions were rising from the inner edge of the western crater and along the NW-SE flanks of the island (figure 126). Brown-to-green discolored water was also noted around the perimeter of the island.
Intermittent low-to-moderate power thermal anomalies were recorded in the MIROVA graph (Middle InfraRed Observation of Volcanic Activity), showing an increase in both frequency and power beginning in July (figure 127). This increase in activity coincides with eruptive activity on 9 and 10 July, characterized by eruption plumes. According to the MODVOLC thermal alert algorithm, one thermal hotspot was recorded on 20 July. Weak thermal anomalies were also detected in infrared satellite imagery, accompanied by strong gas-and-steam plumes (figure 128).
Geologic Background. The small island of Nishinoshima was enlarged when several new islands coalesced during an eruption in 1973-74. Multiple eruptions that began in 2013 completely covered the previous exposed surface and continued to enlarge the island. The island is the summit of a massive submarine volcano that has prominent peaks to the S, W, and NE. The summit of the southern cone rises to within 214 m of the ocean surface 9 km SSE.
Information Contacts: Japan Meteorological Agency (JMA), 1-3-4 Otemachi, Chiyoda-ku, Tokyo 100-8122, Japan (URL: http://www.jma.go.jp/jma/indexe.html); Tokyo Volcanic Ash Advisory Center (VAAC), 1-3-4 Otemachi, Chiyoda-ku, Tokyo 100-8122, Japan (URL: http://ds.data.jma.go.jp/svd/vaac/data/); MIROVA (Middle InfraRed Observation of Volcanic Activity), a collaborative project between the Universities of Turin and Florence (Italy) supported by the Centre for Volcanic Risk of the Italian Civil Protection Department (URL: http://www.mirovaweb.it/); Copernicus Browser, Copernicus Data Space Ecosystem, European Space Agency (URL: https://dataspace.copernicus.eu/browser/).
Krakatau (Indonesia) — October 2023 Cite this Report
Krakatau
Indonesia
6.1009°S, 105.4233°E; summit elev. 285 m
All times are local (unless otherwise noted)
White gas-and-steam plumes and occasional ash plumes during May-August 2023
Krakatau is located in the Sunda Strait between Java and Sumatra, Indonesia. Caldera collapse during the catastrophic 1883 eruption destroyed Danan and Perbuwatan cones and left only a remnant of Rakata. The post-collapse cone of Anak Krakatau (Child of Krakatau) was constructed within the 1883 caldera at a point between the former Danan and Perbuwatan cones; it has been the site of frequent eruptions since 1927. The current eruption period began in May 2021 and has recently consisted of Strombolian eruptions and ash plumes (BGVN 48:07). This report describes lower levels of activity consisting of ash and white gas-and-steam plumes during May through August 2023, based on information provided by the Indonesian Center for Volcanology and Geological Hazard Mitigation, referred to as Pusat Vulkanologi dan Mitigasi Bencana Geologi (PVMBG), MAGMA Indonesia, and satellite data.
Activity was relatively low during May and June. Daily white gas-and-steam emissions rose 25-200 m above the crater and drifted in different directions. Five ash plumes were detected at 0519 on 10 May, 1241 on 11 May, 0920 on 12 May, 2320 on 12 May, and at 0710 on 13 May, and rose 1-2.5 km above the crater and drifted SW. A webcam image taken on 12 May showed ejection of incandescent material above the vent. A total of nine ash plumes were detected during 6-11 June: at 1434 and 00220 on 6 and 7 June the ash plumes rose 500 m above the crater and drifted NW, at 1537 on 8 June the ash plume rose 1 km above the crater and drifted SW, at 0746 and at 0846 on 9 June the ash plumes rose 800 m and 3 km above the crater and drifted SW, respectively, at 0423, 1431, and 1750 on 10 June the ash plumes rose 2 km, 1.5 km, and 3.5 km above the crater and drifted NW, respectively, and at 0030 on 11 June an ash plume rose 2 km above the crater and drifted NW. Webcam images taken on 10 and 11 June at 0455 and 0102, respectively, showed incandescent material ejected above the vent. On 19 June an ash plume at 0822 rose 1.5 km above the crater and drifted SE.
Similar low activity of white gas-and-steam emissions and few ash plumes were reported during July and August. Daily white gas-and-steam emissions rose 25-300 m above the crater and drifted in multiple directions. Three ash plumes were reported at 0843, 0851, and 0852 on 20 July that rose 500-2,000 m above the crater and drifted NW.
The MIROVA (Middle InfraRed Observation of Volcanic Activity) graph of MODIS thermal anomaly data showed intermittent low-to-moderate power thermal anomalies during May through August 2023 (figure 140). Although activity was often obscured by weather clouds, a thermal anomaly was visible in an infrared satellite image of the crater on 12 May, accompanied by an eruption plume that drifted SW (figure 141).
Geologic Background. The renowned Krakatau (frequently mis-named as Krakatoa) volcano lies in the Sunda Strait between Java and Sumatra. Collapse of an older edifice, perhaps in 416 or 535 CE, formed a 7-km-wide caldera. Remnants of that volcano are preserved in Verlaten and Lang Islands; subsequently the Rakata, Danan, and Perbuwatan cones were formed, coalescing to create the pre-1883 Krakatau Island. Caldera collapse during the catastrophic 1883 eruption destroyed Danan and Perbuwatan, and left only a remnant of Rakata. This eruption caused more than 36,000 fatalities, most as a result of tsunamis that swept the adjacent coastlines of Sumatra and Java. Pyroclastic surges traveled 40 km across the Sunda Strait and reached the Sumatra coast. After a quiescence of less than a half century, the post-collapse cone of Anak Krakatau (Child of Krakatau) was constructed within the 1883 caldera at a point between the former Danan and Perbuwatan cones. Anak Krakatau has been the site of frequent eruptions since 1927.
Information Contacts: Pusat Vulkanologi dan Mitigasi Bencana Geologi (PVMBG, also known as Indonesian Center for Volcanology and Geological Hazard Mitigation, CVGHM), Jalan Diponegoro 57, Bandung 40122, Indonesia (URL: http://www.vsi.esdm.go.id/); MAGMA Indonesia, Kementerian Energi dan Sumber Daya Mineral (URL: https://magma.esdm.go.id/v1); MIROVA (Middle InfraRed Observation of Volcanic Activity), a collaborative project between the Universities of Turin and Florence (Italy) supported by the Centre for Volcanic Risk of the Italian Civil Protection Department (URL: http://www.mirovaweb.it/); Copernicus Browser, Copernicus Data Space Ecosystem, European Space Agency (URL: https://dataspace.copernicus.eu/browser/).
Villarrica (Chile) — October 2023 Cite this Report
Villarrica
Chile
39.42°S, 71.93°W; summit elev. 2847 m
All times are local (unless otherwise noted)
Strombolian activity, gas-and-ash emissions, and crater incandescence during April-September 2023
Villarrica, in central Chile, consists of a 2-km-wide caldera that formed about 3,500 years ago and is located at the base of the presently active cone at the NW margin of a 6-km-wide caldera. Historical eruptions eruptions date back to 1558 and have been characterized by mild-to-moderate explosive activity with occasional lava effusions. The current eruption period began in December 2014 and has recently consisted of nighttime crater incandescence, ash emissions, and seismicity (BGVN 48:04). This report covers activity during April through September 2023 and describes occasional Strombolian activity, gas-and-ash emissions, and nighttime crater incandescence. Information for this report primarily comes from the Southern Andes Volcano Observatory (Observatorio Volcanológico de Los Andes del Sur, OVDAS), part of Chile's National Service of Geology and Mining (Servicio Nacional de Geología y Minería, SERNAGEOMIN) and satellite data.
Seismicity during April consisted of long period (LP) events and tremor (TRE); a total of 9,413 LP-type events and 759 TR-type events were detected throughout the month. Nighttime crater incandescence persisted and was visible in the degassing column. Sulfur dioxide data was obtained using Differential Absorption Optical Spectroscopy Equipment (DOAS) that showed an average value of 1,450 ± 198 tons per day (t/d) during 1-15 April and 1,129 ± 201 t/d during 16-30 April, with a maximum daily value of 2,784 t/d on 9 April. Gas-and-steam emissions of variable intensities rose above the active crater as high as 1.3 km above the crater on 13 April. Strombolian explosions were not observed and there was a slight decrease in the lava lake level.
There were 14,123 LP-type events and 727 TR-type events detected during May. According to sulfur dioxide measurements taken with DOAS equipment, the active crater emitted an average value of 1,826 ± 482 t/d during 1-15 May and 912 ± 41 t/d during 16-30 May, with a daily maximum value of 5,155 t/d on 13 May. Surveillance cameras showed continuous white gas-and-steam emissions that rose as high as 430 m above the crater on 27 May. Nighttime incandescence illuminated the gas column less than 300 m above the crater rim was and no pyroclastic emissions were reported. A landslide was identified on 13 May on the E flank of the volcano 50 m from the crater rim and extending 300 m away; SERNAGEOMIN noted that this event may have occurred on 12 May. During the morning of 27 and 28 May minor Strombolian explosions characterized by incandescent ejecta were recorded at the crater rim; the last reported Strombolian explosions had occurred at the end of March.
Seismic activity during June consisted of five volcano-tectonic (VT)-type events, 21,606 LP-type events, and 2,085 TR-type events. The average value of sulfur dioxide flux obtained by DOAS equipment was 1,420 ± 217 t/d during 1-15 June and 2,562 ± 804 t/d, with a maximum daily value of 4,810 t/d on 17 June. White gas-and-steam emissions rose less than 480 m above the crater; frequent nighttime crater incandescence was reflected in the degassing plume. On 12 June an emission rose 100 m above the crater and drifted NNW. On 15 June one or several emissions resulted in ashfall to the NE as far as 5.5 km from the crater, based on a Skysat satellite image. Several Strombolian explosions occurred within the crater; activity on 15 June was higher energy and ejected blocks 200-300 m on the NE slope. Surveillance cameras showed white gas-and-steam emissions rising 480 m above the crater on 16 June. On 19 and 24 June low-intensity Strombolian activity was observed, ejecting material as far as 200 m from the center of the crater to the E.
During July, seismicity included 29,319 LP-type events, 3,736 TR-type events, and two VT-type events. DOAS equipment recorded two days of sulfur dioxide emissions of 4,220 t/d and 1,009 t/d on 1 and 13 July, respectively. Constant nighttime incandescence was also recorded and was particularly noticeable when accompanied by eruptive columns on 12 and 16 July. Minor explosive events were detected in the crater. According to Skysat satellite images taken on 12, 13, and 16 July, ashfall deposits were identified 155 m S of the crater. According to POVI, incandescence was visible from two vents on the crater floor around 0336 on 12 July. Gas-and-ash emissions rose as high as 1.2 km above the crater on 13 July and drifted E and NW. A series of gas-and-steam pulses containing some ash deposited material on the upper E flank around 1551 on 13 July. During 16-31 July, average sulfur dioxide emissions of 1,679 ± 406 t/d were recorded, with a maximum daily value of 2,343 t/d on 28 July. Fine ash emissions were also reported on 16, 17, and 23 July.
Seismicity persisted during August, characterized by 27,011 LP-type events, 3,323 TR-type events, and three VT-type events. The average value of sulfur dioxide measurements taken during 1-15 August was 1,642 ± 270 t/d and 2,207 ± 4,549 t/d during 16-31 August, with a maximum daily value of 3,294 t/d on 27 August. Nighttime crater incandescence remained visible in degassing columns. White gas-and-steam emissions rose 480 m above the crater on 6 August. According to a Skysat satellite image from 6 August, ash accumulation was observed proximal to the crater and was mainly distributed toward the E slope. White gas-and-steam emissions rose 320 m above the crater on 26 August. Nighttime incandescence and Strombolian activity that generated ash emissions were reported on 27 August.
Seismicity during September was characterized by five VT-type events, 12,057 LP-type events, and 2,058 TR-type events. Nighttime incandescence persisted. On 2 September an ash emission rose 180 m above the crater and drifted SE at 1643 (figure 125) and a white gas-and-steam plume rose 320 m above the crater. According to the Buenos Aires VAAC, periods of continuous gas-and-ash emissions were visible in webcam images from 1830 on 2 September to 0110 on 3 September. Strombolian activity was observed on 2 September and during the early morning of 3 September, the latter event of which generated an ash emission that rose 60 m above the crater and drifted 100 m from the center of the crater to the NE and SW. Ashfall was reported to the SE and S as far as 750 m from the crater. The lava lake was active during 3-4 September and lava fountaining was visible for the first time since 26 March 2023, according to POVI. Fountains captured in webcam images at 2133 on 3 September and at 0054 on 4 September rose as high as 60 m above the crater rim and ejected material onto the upper W flank. Sulfur dioxide flux of 1,730 t/d and 1,281 t/d was measured on 3 and 4 September, respectively, according to data obtained by DOAS equipment.
Strong Strombolian activity and larger gas-and-ash plumes were reported during 18-20 September. On 18 September activity was also associated with energetic LP-type events and notable sulfur dioxide fluxes (as high as 4,277 t/d). On 19 September Strombolian activity and incandescence were observed. On 20 September at 0914 ash emissions rose 50 m above the crater and drifted SSE, accompanied by Strombolian activity that ejected material less than 100 m SSE, causing fall deposits on that respective flank. SERNAGEOMIN reported that a Planet Scope satellite image taken on 20 September showed the lava lake in the crater, measuring 32 m x 35 m and an area of 0.001 km2. Several ash emissions were recorded at 0841, 0910, 1251, 1306, 1312, 1315, and 1324 on 23 September and rose less than 150 m above the crater. The sulfur dioxide flux value was 698 t/d on 23 September and 1,097 t/d on 24 September. On 24 September the Volcanic Alert Level (VAL) was raised to Orange (the third level on a four-color scale). SENAPRED maintained the Alert Level at Yellow (the middle level on a three-color scale) for the communities of Villarrica, Pucón (16 km N), Curarrehue, and Panguipulli.
During 24-25 September there was an increase in seismic energy (observed at TR-events) and acoustic signals, characterized by 1 VT-type event, 213 LP-type events, and 124 TR-type events. Mainly white gas-and-steam emissions, in addition to occasional fine ash emissions were recorded. During the early morning of 25 September Strombolian explosions were reported and ejected material 250 m in all directions, though dominantly toward the NW. On 25 September the average value of sulfur dioxide flux was 760 t/d. Seismicity during 25-30 September consisted of five VT-type events, 1,937 LP-type events, and 456 TR-type events.
During 25-29 September moderate Strombolian activity was observed and ejected material as far as the crater rim. In addition, ash pulses lasting roughly 50 minutes were observed around 0700 and dispersed ENE. During 26-27 September a TR episode lasted 6.5 hours and was accompanied by discrete acoustic signals. Satellite images from 26 September showed a spatter cone on the crater floor with one vent that measured 10 x 14 m and a smaller vent about 35 m NE of the cone. SERNAGEOMIN reported an abundant number of bomb-sized blocks up to 150 m from the crater, as well as impact marks on the snow, which indicated explosive activity. A low-altitude ash emission was observed drifting NW around 1140 on 28 September, based on webcam images. Between 0620 and 0850 on 29 September an ash emission rose 60 m above the crater and drifted NW. During an overflight taken around 1000 on 29 September scientists observed molten material in the vent, a large accumulation of pyroclasts inside the crater, and energetic degassing, some of which contained a small amount of ash. Block-sized pyroclasts were deposited on the internal walls and near the crater, and a distal ash deposit was also visible. The average sulfur dioxide flux measured on 28 September was 344 t/d. Satellite images taken on 29 September ashfall was deposited roughly 3 km WNW from the crater and nighttime crater incandescence remained visible. The average sulfur dioxide flux value from 29 September was 199 t/d. On 30 September at 0740 a pulsating ash emission rose 1.1 km above the crater and drifted NNW (figure 126). Deposits on the S flank extended as far as 4.5 km from the crater rim, based on satellite images from 30 September.
Infrared MODIS satellite data processed by MIROVA (Middle InfraRed Observation of Volcanic Activity) showed intermittent thermal activity during April through September, with slightly stronger activity detected during late September (figure 127). Small clusters of thermal activity were detected during mid-June, early July, early August, and late September. According to the MODVOLC thermal alert system, a total of four thermal hotspots were detected on 7 July and 3 and 23 September. This activity was also intermittently captured in infrared satellite imagery on clear weather days (figure 128).
Geologic Background. The glacier-covered Villarrica stratovolcano, in the northern Lakes District of central Chile, is ~15 km south of the city of Pucon. A 2-km-wide caldera that formed about 3,500 years ago is located at the base of the presently active, dominantly basaltic to basaltic andesite cone at the NW margin of a 6-km-wide Pleistocene caldera. More than 30 scoria cones and fissure vents are present on the flanks. Plinian eruptions and pyroclastic flows that have extended up to 20 km from the volcano were produced during the Holocene. Lava flows up to 18 km long have issued from summit and flank vents. Eruptions documented since 1558 CE have consisted largely of mild-to-moderate explosive activity with occasional lava effusion. Glaciers cover 40 km2 of the volcano, and lahars have damaged towns on its flanks.
Information Contacts: Servicio Nacional de Geología y Minería (SERNAGEOMIN), Observatorio Volcanológico de Los Andes del Sur (OVDAS), Avda Sta María No. 0104, Santiago, Chile (URL: http://www.sernageomin.cl/); Proyecto Observación Villarrica Internet (POVI) (URL: http://www.povi.cl/); Sistema y Servicio Nacional de Prevención y Repuesta Ante Desastres (SENAPRED), Av. Beauchef 1671, Santiago, Chile (URL: https://web.senapred.cl/); Buenos Aires Volcanic Ash Advisory Center (VAAC), Servicio Meteorológico Nacional-Fuerza Aérea Argentina, 25 de mayo 658, Buenos Aires, Argentina (URL: http://www.smn.gov.ar/vaac/buenosaires/inicio.php); MIROVA (Middle InfraRed Observation of Volcanic Activity), a collaborative project between the Universities of Turin and Florence (Italy) supported by the Centre for Volcanic Risk of the Italian Civil Protection Department (URL: http://www.mirovaweb.it/); Hawai'i Institute of Geophysics and Planetology (HIGP) - MODVOLC Thermal Alerts System, School of Ocean and Earth Science and Technology (SOEST), Univ. of Hawai'i, 2525 Correa Road, Honolulu, HI 96822, USA (URL: http://modis.higp.hawaii.edu/); Copernicus Browser, Copernicus Data Space Ecosystem, European Space Agency (URL: https://dataspace.copernicus.eu/browser/).
Merapi (Indonesia) — October 2023 Cite this Report
Merapi
Indonesia
7.54°S, 110.446°E; summit elev. 2910 m
All times are local (unless otherwise noted)
Frequent incandescent avalanches during April-September 2023
Merapi, located just north of the major city of Yogyakarta in central Java, Indonesia, has had activity within the last 20 years characterized by pyroclastic flows and lahars accompanying growth and collapse of the steep-sided active summit lava dome. The current eruption period began in late December 2020 and has more recently consisted of ash plumes, intermittent incandescent avalanches of material, and pyroclastic flows (BGVN 48:04). This report covers activity during April through September 2023, based on information from Balai Penyelidikan dan Pengembangan Teknologi Kebencanaan Geologi (BPPTKG), the Center for Research and Development of Geological Disaster Technology, a branch of PVMBG which specifically monitors Merapi. Additional information comes from the Pusat Vulkanologi dan Mitigasi Bencana Geologi (PVMBG, also known as Indonesian Center for Volcanology and Geological Hazard Mitigation, CVGHM), MAGMA Indonesia, the Darwin Volcanic Ash Advisory Centre (VAAC), and various satellite data.
Activity during April through September 2023 primarily consisted of incandescent avalanches of material that mainly affected the SW and W flanks and traveled as far as 2.3 km from the summit (table 25) and white gas-and-steam emissions that rose 10-1,000 m above the crater.
Table 25. Monthly summary of avalanches and avalanche distances recorded at Merapi during April through September 2023. The number of reported avalanches does not include instances where possible avalanches were heard but could not be visually confirmed as a result of inclement weather. Data courtesy of BPPTKG (April-September 2023 daily reports).
| Month |
Average number of avalanches per day |
Distance avalanches traveled (m) |
| Apr 2023 |
19 |
1,200-2,000 |
| May 2023 |
22 |
500-2,000 |
| Jun 2023 |
18 |
1,200-2,000 |
| Jul 2023 |
30 |
300-2,000 |
| Aug 2023 |
25 |
400-2,300 |
| Sep 2023 |
23 |
600-2,000 |
BPPTKG reported that during April and May white gas-and-steam emissions rose 10-750 m above the crater, incandescent avalanches descended 500-2,000 m on the SW and W flanks (figure 135). Cloudy weather often prevented clear views of the summit, and sometimes avalanches could not be confirmed. According to a webcam image, a pyroclastic flow was visible on 17 April at 0531. During the week of 28 April and 4 May a pyroclastic flow was reported on the SW flank, traveling up to 2.5 km. According to a drone overflight taken on 17 May the SW lava dome volume was an estimated 2,372,800 cubic meters and the dome in the main crater was an estimated 2,337,300 cubic meters.
During June and July similar activity persisted with white gas-and-steam emissions rising 10-350 m above the crater and frequent incandescent avalanches that traveled 300-2,000 m down the SW, W, and S flanks (figure 136). Based on an analysis of aerial photos taken on 24 June the volume of the SW lava dome was approximately 2.5 million cubic meters. A pyroclastic flow was observed on 5 July that traveled 2.7 km on the SW flank. According to the Darwin VAAC multiple minor ash plumes were identified in satellite images on 19 July that rose to 3.7 km altitude and drifted S and SW. During 22, 25, and 26 July a total of 17 avalanches descended as far as 1.8 km on the S flank.
Frequent white gas-and-steam emissions continued during August and September, rising 10-450 m above the crater. Incandescent avalanches mainly affected the SW and W flanks and traveled 400-2,300 m from the vent (figure 137). An aerial survey conducted on 10 August was analyzed and reported that estimates of the SW dome volume was 2,764,300 cubic meters and the dome in the main crater was 2,369,800 cubic meters.
Frequent and moderate-power thermal activity continued throughout the reporting period, according to a MIROVA (Middle InfraRed Observation of Volcanic Activity) analysis of MODIS satellite data (figure 138). There was an increase in the number of detected anomalies during mid-May. The MODVOLC thermal algorithm recorded a total of 47 thermal hotspots: six during April, nine during May, eight during June, 15 during July, four during August, and five during September. Some of this activity was captured in infrared satellite imagery on clear weather days, sometimes accompanied by incandescent material on the SW flank (figure 139).
Geologic Background. Merapi, one of Indonesia's most active volcanoes, lies in one of the world's most densely populated areas and dominates the landscape immediately north of the major city of Yogyakarta. It is the youngest and southernmost of a volcanic chain extending NNW to Ungaran volcano. Growth of Old Merapi during the Pleistocene ended with major edifice collapse perhaps about 2,000 years ago, leaving a large arcuate scarp cutting the eroded older Batulawang volcano. Subsequent growth of the steep-sided Young Merapi edifice, its upper part unvegetated due to frequent activity, began SW of the earlier collapse scarp. Pyroclastic flows and lahars accompanying growth and collapse of the steep-sided active summit lava dome have devastated cultivated lands on the western-to-southern flanks and caused many fatalities.
Information Contacts: Balai Penyelidikan dan Pengembangan Teknologi Kebencanaan Geologi (BPPTKG), Center for Research and Development of Geological Disaster Technology (URL: http://merapi.bgl.esdm.go.id/, Twitter: @BPPTKG); MAGMA Indonesia, Kementerian Energi dan Sumber Daya Mineral (URL: https://magma.esdm.go.id/v1); Pusat Vulkanologi dan Mitigasi Bencana Geologi (PVMBG, also known as Indonesian Center for Volcanology and Geological Hazard Mitigation, CVGHM), Jalan Diponegoro 57, Bandung 40122, Indonesia (URL: http://www.vsi.esdm.go.id/); Darwin Volcanic Ash Advisory Centre (VAAC), Bureau of Meteorology, Northern Territory Regional Office, PO Box 40050, Casuarina, NT 0811, Australia (URL: http://www.bom.gov.au/info/vaac/); MIROVA (Middle InfraRed Observation of Volcanic Activity), a collaborative project between the Universities of Turin and Florence (Italy) supported by the Centre for Volcanic Risk of the Italian Civil Protection Department (URL: http://www.mirovaweb.it/); Hawai'i Institute of Geophysics and Planetology (HIGP) - MODVOLC Thermal Alerts System, School of Ocean and Earth Science and Technology (SOEST), Univ. of Hawai'i, 2525 Correa Road, Honolulu, HI 96822, USA (URL: http://modis.higp.hawaii.edu/); Copernicus Browser, Copernicus Data Space Ecosystem, European Space Agency (URL: https://dataspace.copernicus.eu/browser/); Øystein Lund Andersen (URL: https://www.oysteinlundandersen.com/, https://twitter.com/oysteinvolcano).
Ebeko
Russia
50.686°N, 156.014°E; summit elev. 1103 m
All times are local (unless otherwise noted)
Moderate explosive activity with ash plumes continued during June-November 2023
Ebeko, located on the N end of Paramushir Island in Russia’s Kuril Islands just S of the Kamchatka Peninsula, consists of three summit craters along a SSW-NNE line at the northern end of a complex of five volcanic cones. Observed eruptions date back to the late 18th century and have been characterized as small-to-moderate explosions from the summit crater, accompanied by intense fumarolic activity. The current eruptive period began in June 2022, consisting of frequent explosions, ash plumes, and thermal activity (BGVN 47:10, 48:06). This report covers similar activity during June-November 2023, based on information from the Kamchatka Volcanic Eruptions Response Team (KVERT) and satellite data.
Moderate explosive activity continued during June-November 2023 (figures 50 and 51). According to visual data from Severo-Kurilsk, explosions sent ash 2-3.5 km above the summit (3-4.5 km altitude) during most days during June through mid-September. Activity after mid-September was slightly weaker, with ash usually reaching less than 2 km above the summit. According to KVERT the volcano in October and November was, with a few exceptions, either quiet or obscured by clouds that prevented satellite observations. KVERT issued Volcano Observatory Notices for Aviation (VONA) on 8 and 12 June, 13 and 22 July, 3 and 21 August, and 31 October warning of potential aviation hazards from ash plumes drifting 3-15 km from the volcano. Based on satellite data, KVERT reported a persistent thermal anomaly whenever weather clouds permitted viewing.
Geologic Background. The flat-topped summit of the central cone of Ebeko volcano, one of the most active in the Kuril Islands, occupies the northern end of Paramushir Island. Three summit craters located along a SSW-NNE line form Ebeko volcano proper, at the northern end of a complex of five volcanic cones. Blocky lava flows extend west from Ebeko and SE from the neighboring Nezametnyi cone. The eastern part of the southern crater contains strong solfataras and a large boiling spring. The central crater is filled by a lake about 20 m deep whose shores are lined with steaming solfataras; the northern crater lies across a narrow, low barrier from the central crater and contains a small, cold crescentic lake. Historical activity, recorded since the late-18th century, has been restricted to small-to-moderate explosive eruptions from the summit craters. Intense fumarolic activity occurs in the summit craters, on the outer flanks of the cone, and in lateral explosion craters.
Information Contacts: Kamchatka Volcanic Eruptions Response Team (KVERT), Far Eastern Branch, Russian Academy of Sciences, 9 Piip Blvd., Petropavlovsk-Kamchatsky, 683006, Russia (URL: http://www.kscnet.ru/ivs/kvert/).
Search Bulletin Archive by Publication Date
Select a month and year from the drop-downs and click "Show Issue" to have that issue displayed in this tab.
The default month and year is the latest issue available.
Bulletin of the Global Volcanism Network - Volume 31, Number 11 (November 2006)
Managing Editor: Richard Wunderman
Atka Volcanic Complex (United States)
Minor plumes bearing steam and ash throughout November-December 2006
Bezymianny (Russia)
Ongoing dome growth; 23-25 December pyroclastic flows
Cayambe (Ecuador)
Seismic swarms occur erratically in 2004 and 2005
Heard (Australia)
ASTER images show hotspot for possible lava lake and flow 8 December
Karymsky (Russia)
Moderate ash explosions and continued dome growth
Lascar (Chile)
Crater changes after May; minor explosions during September and October 2006
Montagu Island (United Kingdom)
Explosive and possible effusive activity continues in December 2006
Northern EPR at 9.8°N (Undersea Features)
Lava erupted along at least 18 km of ridge axis
Sheveluch (Russia)
Ash plumes rising to ~ 10 km in December
Atka Volcanic Complex (United States) — November 2006 Cite this Report
Atka Volcanic Complex
United States
52.331°N, 174.139°W; summit elev. 1518 m
All times are local (unless otherwise noted)
Minor plumes bearing steam and ash throughout November-December 2006
[What follows is a corrected report taking advantage of new information.]
2005 activity. Korovin... has been relatively quiet since 23 February [2005], when it emitted minor though abruptly discharged steam and ash (BGVN 31:02). At that time, an initial ash burst rose to an altitude of ~ 2.4 km and was followed by several smaller ash-and-steam bursts, but no ashfall was reported in Atka village (figure 2). There were no reports of accompanying volcanic odors, earthquakes, or larger volcanic explosions.
Early 2006 activity. Earlier this year, seismicity indicating unrest was noted in January and February (BGVN 31:02). From 24 February-3 March 2006, seismicity at Korovin was slightly above background levels. During that time frame, the Alaska Volcano Observatory (AVO) raised the concern color code at Korovin from Green to Yellow. The concern color code was then but reduced it to Green on 8 March 2006 .
Late 2006 activity. An increase in seismicity during July 2006 represented a transition from prior low activity, meanwhile volcanic activity remained mild during that time (figure 3).
This report also covers further minor events during September through December. During September and October, episodes of volcanic tremor increased in number, strength, and duration. On 28 October, residents of Atka village observed and photographed steam emissions to several hundred meters above the volcano.
For the duration of November and December, seismic levels remained above background levels. In late November satellite information showed a light dusting of ash on the E flank of the main crater along with several plumes and/or their shadows visible along the N side of the crater. Satellite radar images indicated uplift of the volcano; the area of uplift was consistent with locations of earthquake activity and the effects were interpreted as the result of magma injection. Cloud cover permitted only erratic satellite observation during November and December. On 11 and 21 December 2006, Atka residents again witnessed steam plumes, on the latter date possibly containing ash.
Geologic Background. The Atka Volcanic Complex consists of a central shield and Pleistocene caldera and four notable volcanic cones. A major explosive dacitic eruption accompanied formation of the caldera about 500,000 to 300,000 years ago; approximately half of the caldera rime remains, open towards the NW. The Sarichef cone, ~5 km ESE of the caldera rim, retains a symmetrical profile, unlike most other heavily eroded features outside the caldera to the S and W. The Kliuchef stratovolcano grew within the caldera and exhibits five eruptive vents striking NE, including two at the summit, that have been active in the Holocene. A 700-m-diameter crater 1 km NE of the summit may have been the source vent for a large 1812 CE eruption. Hot springs and fumaroles are located on the flanks of Kliuchef and in a glacial valley to the SW. The most frequently active volcano of the complex is Korovin, at the NE tip of Atka Island about 5 km N of Kliuchef. An 800-m-diameter crater on the SE side of the summit contains a deep circular pit that sometimes contains a crater lake thought to be the source of phreatic ash explosions. The smaller Konia cone, slightly offset to the E, lies between Kliuchef and Korovin. Most of the lava flows in the complex are basaltic, though some dacitic flows are also present.
Information Contacts: Alaska Volcano Observatory (AVO), a cooperative program of the U.S. Geological Survey, 4200 University Drive, Anchorage, AK 99508-4667, USA (URL: http://www.avo.alaska.edu/), Geophysical Institute, University of Alaska, PO Box 757320, Fairbanks, AK 99775-7320, USA, and Alaska Division of Geological & Geophysical Surveys, 794 University Ave., Suite 200, Fairbanks, AK 99709, USA.
Bezymianny (Russia) — November 2006 Cite this Report
Bezymianny
Russia
55.972°N, 160.595°E; summit elev. 2882 m
All times are local (unless otherwise noted)
Ongoing dome growth; 23-25 December pyroclastic flows
Except for brief heightened activity at the end of December 2006, moderate volcanic activity and seismicity has prevailed at Bezymianny since the extensive eruption in May 2006, last reported on in BGVN 31:04. This report covers activity following the 9 May 2006 explosion to the start of January 2007.
The Kamchatkan Volcano Eruption Response Team (KVERT) raised the Concern Color Code to red, the highest level, in response to the 9 May 2006 eruption (BGVN 31:04). They lowered it on 10 May to orange, and again, on 11 May to yellow, where it remained until the end of December. By 11 May, seismicity remained at or below background levels. Two shallow earthquakes were recorded on 15 and 19-20 May; five shallow earthquakes were recorded during 27-30 May. Similar low levels of seismicity were recorded during June to November 2006, with seismic activity exceeding background levels only on 14 August and 25, 27, and 30 November.
Growth of the lava dome continued during June to December 2006. Video data on 28-29 May showed weak gas-and-steam plumes. A thermal anomaly was noted during the latter part of the month (specifically, on 16-18, 23-25, 27, and 29 May). Video data showed gas-and-steam plumes rising to ~ 7.5 km altitude on 5 June and to ~ 4.0 km altitude the week of 16 June. Weak gas-and-steam plumes were observed 16 and 19-20 June. Thermal anomalies were often noted, with particularly large ones on 24 and 29 June. On days of good visibility, video data consistently showed fumarolic activity at the lava dome. An increase in size of two explosive craters at the dome's summit and a new lava flow on the dome's SW flank, thought to have resulted from the 9 May 2006 eruption, were observed on 31 July.
Seismic activity was above background levels during much of December and dramatically increased the week of 24 December. Several shallow earthquakes were registered during the weeks of 8, 15, and 22 December.
On 6 and 10 December, respectively, gas-and-steam plumes rose to ~ 4.5 and 3.5 km altitude. Satellite data recorded a thermal anomaly over the dome during the weeks of 8, 15, 22 December and on 29-31 December. The number of hot avalanches per day grew from 4-6 in previous days to 15 on 23 December.
On 23 December, starting at 2352, an explosive eruption occurred, producing ash and pyroclastic flows; a resulting ash plume rose ~ 4.5-6 km altitude and extended NE. In response to the eruption, on 24 December KVERT raised the level of Concern Color Code from yellow to orange.
Another explosive eruption started between 0917-1020 on 24 December and ended on 25 December 2006. A large eruptive column rose to ~ 13 km altitude and developed into a big umbrella cloud. According to satellite data, ash clouds extended ~ 850 km NE on the 24 and 25 December. Late on 24 December, the Concern Color Code was raised to red. According to the Russian News Agency NOVOSTI, Russian government officials instructed residents of a village 40 km E of the volcano where ash fallout occurred to avoid leaving their houses.
About 30 local seismic events occurred at the volcano during 1020-2000 on 24 December. Volcanic seismicity returned to background levels at 2000 on 24 December. According to seismic data on 25 December, two hot avalanches took place. In addition, a large thermal anomaly occurred at the lava dome. Visual and video data on 26-27 December showed moderate fumarolic activity. Photographs, taken by volcanologists who flew around the volcano in a helicopter, revealed that a portion of the lava dome was destroyed during the 24 December eruption. The Concern Color Code was lowered to orange on 25 December, and subsequently to yellow on 29 December, where it remained in early January 2007. According to satellite data collected on 31 December and 3 January, fresh deposits of pyroclastic flows extended 7-8 km SE from the volcano.
Seismic activity stood slightly above background levels on 2 January, and at background levels on the other days. According to visual and video data, moderate fumarolic activity occurred on 29-31 December, although the volcano was often obscured by clouds. A thermal anomaly was noted on 3 January.
Geologic Background. The modern Bezymianny, much smaller than its massive neighbors Kamen and Kliuchevskoi on the Kamchatka Peninsula, was formed about 4,700 years ago over a late-Pleistocene lava-dome complex and an edifice built about 11,000-7,000 years ago. Three periods of intensified activity have occurred during the past 3,000 years. The latest period, which was preceded by a 1,000-year quiescence, began with the dramatic 1955-56 eruption. This eruption, similar to that of St. Helens in 1980, produced a large open crater that was formed by collapse of the summit and an associated lateral blast. Subsequent episodic but ongoing lava-dome growth, accompanied by intermittent explosive activity and pyroclastic flows, has largely filled the 1956 crater.
Information Contacts: Olga A. Girina, Kamchatka Volcanic Eruptions Response Team (KVERT), a cooperative program of the Institute of Volcanic Geology and Geochemistry, Far East Division, Russian Academy of Sciences, Piip Ave. 9, Petropavlovsk-Kamchatsky, 683006, Russia, GS RAS (Russia), and the Alaska Volcano Observatory (AVO), a cooperative program of the U.S. Geological Survey, 4200 University Drive, Anchorage, AK 99508-4667, USA (URL: http://www.avo.alaska.edu/), the Geophysical Institute, University of Alaska, PO Box 757320, Fairbanks, AK 99775-7320, USA, and the Alaska Division of Geological and Geophysical Surveys, 794 University Ave., Suite 200, Fairbanks, AK 99709, USA; Russian News & Information Agency NOVOSTI, 4, Zubovsky Bulvar, 119021, Moscow, Russia (URL: http://en.rian.ru/).
Cayambe (Ecuador) — November 2006 Cite this Report
Cayambe
Ecuador
0.029°N, 77.986°W; summit elev. 5790 m
All times are local (unless otherwise noted)
Seismic swarms occur erratically in 2004 and 2005
During 2004, Cayambe's seismicity increased three times, on 25-31 January, on 25 February-5 March, and on 4-12 October. Our previous report on Cayambe discussed events through November 2003 (BGVN 28:11).
The first seismic swarm began on 25 January 2004 when the number of volcano-tectonic (VT) earthquakes increased, with seismic activity occurring in bands lasting 2-3 hours. The events were small in magnitude and were located ~ 1-4 km below the SW flank. At 1934 on 27 January, a magnitude 3.4 earthquake was recorded. On 29 January, the activity peaked with 148 earthquakes reported. Seismicity thereafter decreased to normal base-line levels.
The second earthquake swarm began on 25 February with an increased number of VT earthquakes. Like the January events, these earthquakes were of low magnitude. The largest event occurred on 29 February at 1059 measuring M 3.1. The events were localized primarily below the E flank with peak activity on 2 March, when 271 earthquakes were registered. The energy released by this cluster was far larger than the one in January and was almost comparable to activity in March 2003 (figure 2).
On 12 March, a small increase in activity was recorded, and on the morning of 15 March, a M 3.6 earthquake was recorded on the S flank. Residents reported no felt earthquakes.
On 4 October, there was a slight increase in the number of events registered with a total of 18 events, 17 of which were hybrid events. At 2333 on 6 October a M 3.4 event was recorded. These earthquakes were located in the S zone of the volcano edifice. Two seismic swarms on 8 October consisted of 177 VT earthquakes. The first swarm registered at 0500 and lasted an hour. The second swarm began at 1130 and lasted approximately 9 hours. Some of these events were located in the SW flank. After the seismic anomalies on 4 and 6- 8 October, activity returned to normal base-line levels.
Apart from the swarms between September and October, the seismicity appears to have changed, with the number of VT events diminishing by one-half in relation to those previously recorded, whereas the number of hybrid events tripled. Later, long-period LP events were again observed, which is characteristic of this volcano returning to normal levels.
The internal seismic activity at Cayambe is characterized by the generation of 10 events per day on average. Nevertheless, this type of activity has alternated with sporadic seismic swarms consisting of hundreds of events lasting several days, after which activity returns to the base-line level. These types of seismic swarms were recorded in December 2002, March 2003, and in January, March, and October of 2004 (figure 3), with similar characteristics and averaging 2 days in duration. Scientists inferred the cause of the observed seismicity as related to motion of fluids in the interior of the edifice. Thermal images obtained during 2004 did not contain anomalies.
During 16-18 September 2005 a short seismic episode occurred with earthquakes on the SW flank, ranging from 135 to 330 events per day. The earthquakes reached a maximum magnitude of 3.6.
Geologic Background. The massive compound andesitic-dacitic Cayambe stratovolcano is located on the western edge of the Cordillera Real, east of the Inter-Andean Valley. The volcano, whose southern flank is on the equator, is capped by extensive glaciers. The modern Nevado Cayambe, constructed to the east of older Pleistocene volcanic complexes, contains two summit lava domes about 1.5 km apart. Several other lava domes on the upper flanks have been the source of pyroclastic flows that reached the lower flanks. A prominent Holocene pyroclastic cone on the lower E flank, La Virgen, fed thick andesitic lava flows that traveled about 10 km E. Nevado Cayambe has also produced frequent explosive eruptions beginning about 4,000 years ago, with the most recent known activity during 1785-86.
Information Contacts: Instituto Geofisico (IG), Escuela Politécnica Nacional, Apartado 17-01-2759, Quito, Ecuador (URL: http://www.igepn.edu.ec/).
Heard (Australia) — November 2006 Cite this Report
Heard
Australia
53.106°S, 73.513°E; summit elev. 2745 m
All times are local (unless otherwise noted)
ASTER images show hotspot for possible lava lake and flow 8 December
Matt Patrick reported that Heard Island continued to display evidence of activity in its summit crater (continuing the phase which began in May 2006, BGVN 31:05). Figure 10 presents an ASTER image (Bands 9-3-2) from 8 December 2006 showing a hotspot at the summit, presumably a lava lake, with a recently emplaced lava flow extending 700 m E.
Table 2 lists the thermal anomalies recorded by the Hawai'i Institute of Geophysics and Planetology (HIGP) during 25 June 2006 (as last reported in the BGVN 31:05) to mid December 2006. The table lists 27 thermal anomalies during 25 June to 15 December 2006. There is no MODVOLC thermal anomaly on 8 December, the date of the ASTER image in the previous figure.
Table 2. Thermal anomalies from mid-June to mid-December 2006 from MODIS satellites. Courtesy of HIGP Thermal Alerts Team.
| Date |
Time (UTC) |
Pixels |
Satellite |
| 25 Jun 2006 |
1850 |
1 |
Terra |
| 17 Jul 2006 |
2000 |
1 |
Aqua |
| 06 Aug 2006 |
1935 |
1 |
Aqua |
| 13 Aug 2006 |
0425 |
1 |
Terra |
| 13 Aug 2006 |
1755 |
1 |
Terra |
| 13 Aug 2006 |
1940 |
1 |
Aqua |
| 15 Aug 2006 |
1930 |
1 |
Aqua |
| 22 Aug 2006 |
1935 |
2 |
Aqua |
| 10 Sep 2006 |
1820 |
2 |
Terra |
| 12 Sep 2006 |
1805 |
1 |
Terra |
| 20 Sep 2006 |
0930 |
1 |
Aqua |
| 21 Sep 2006 |
1800 |
1 |
Terra |
| 21 Sep 2006 |
1950 |
1 |
Aqua |
| 11 Oct 2006 |
1735 |
1 |
Terra |
| 11 Oct 2006 |
1925 |
2 |
Aqua |
| 24 Oct 2006 |
0920 |
1 |
Aqua |
| 27 Oct 2006 |
1735 |
2 |
Terra |
| 27 Oct 2006 |
1925 |
1 |
Aqua |
| 02 Nov 2006 |
1835 |
1 |
Terra |
| 07 Nov 2006 |
1715 |
2 |
Terra |
| 07 Nov 2006 |
1905 |
4 |
Aqua |
| 17 Nov 2006 |
0830 |
1 |
Aqua |
| 24 Nov 2006 |
0430 |
2 |
Terra |
| 25 Nov 2006 |
0920 |
1 |
Aqua |
| 26 Nov 2006 |
1750 |
2 |
Terra |
| 15 Dec 2006 |
1820 |
1 |
Terra |
| 15 Dec 2006 |
2005 |
1 |
Aqua |
Matt Patrick noted that it is not surprising that the ASTER image showed a thermal anomaly but MODVOLC did not. First, because ASTER has infrared bands at 30-90 m, it is inherently more sensitive to thermal anomalies than the 1-km MODIS bands (MODVOLC uses MODIS data). Second, the MODVOLC algorithm has a threshold which sometimes disregards low-level eruptive activity in order to avoid false alarms. The anomaly in the ASTER image was not particularly large or intense, so it is not surprising it did not show up in MODVOLC.
Geologic Background. Heard Island on the Kerguelen Plateau in the southern Indian Ocean consists primarily of the emergent portion of two volcanic structures. The large glacier-covered composite basaltic-to-trachytic cone of Big Ben comprises most of the island, and the smaller Mt. Dixon lies at the NW tip of the island across a narrow isthmus. Little is known about the structure of Big Ben because of its extensive ice cover. The active Mawson Peak forms the island's high point and lies within a 5-6 km wide caldera breached to the SW side of Big Ben. Small satellitic scoria cones are mostly located on the northern coast. Several subglacial eruptions have been reported at this isolated volcano, but observations are infrequent and additional activity may have occurred.
Information Contacts: Matthew Patrick, Dept. of Geological and Mining Engineering and Sciences, Michigan Technological University, 1400 Townsend Drive, Houghton, MI 49931, USA; Hawai'i Institute of Geophysics and Planetology (HIGP) Thermal Alerts Team, School of Ocean and Earth Science and Technology (SOEST), Univ. of Hawai'i, 2525 Correa Road, Honolulu, HI 96822, USA (URL: http://modis.higp.hawaii.edu/).
Karymsky (Russia) — November 2006 Cite this Report
Karymsky
Russia
54.049°N, 159.443°E; summit elev. 1513 m
All times are local (unless otherwise noted)
Moderate ash explosions and continued dome growth
During late 2006 and into January 2007, ash explosions occurred from the summit crater at Karymsky, continuation of activity observed since the beginning of January 2006 (BGVN 31:04 and 31:07). This report covers activity during August 2006 to early January 2007.
The Kamchatka Volcanic Eruptions Response Team (KVERT) maintained the level of Concern Color Code at orange during the period of reporting, except for the temporary change to yellow during 8-15 September. Throughout this period the dome was a consistent source of thermal anomalies.
Ash plumes reached to ~3.0-3.7 km altitude throughout August 2006. Seismicity rose, with a maximum of 500 local shallow earthquakes per day the week of 18 August, and then lowered to 30-70 earthquakes per day the last week of August. Spasmodic tremor registered on 1-12 and 17 August. On 6 August an ash plume extending ~ 10-73 km E and SE was depicted on satellite data. Volcanic plume information sometimes stems from the Airport Meteorological Center (AMC) in Yelizovo (a town 40 km NE of the S-coast town of Petropavlovsk-Kamchatsky; the latter is the Peninsula's capital, largest city, and features both a major airport and a marine port). The AMC reported that on 16 August, pilots saw a Karymsky ash plume at ~6.5 km altitude that extended NE.
During September 2006, local shallow earthquakes occurred ~ 30-250 times per day. A satellite image for 12 September showed an ash plume extending ~140 km SE. On 10 September volcanologists observed from visual data an ash explosion of [~2.3 km] altitude. Other possible ash explosions were thought to occur toward the end of September 2006, reaching heights of ~2.5-4.5 km altitude.
Local seismicity peaked the last week of October with a maximum of 550 weak shallow earthquakes per day, but levels declined through November 2006. Possible ash explosions rising ~2.5-5.0 km altitude prevailed the month of October and during 10-11 and 18-19 November. On 25 October staff of the Institute of Volcanology and Seismology (IVS) observed a series of ash bursts up to ~2.0 km above the summit with ash plumes that extended ~100 km E. On days of sufficient visibility during October and November 2006, ash plumes often extended ~29-200 km NE, ~20-220 km SE, and ~ 55-137 km E (figure 13). On 28 October observers noted an ash cloud extending to 70 km NE of Karymsky.
There were no seismic data the last week of November to the third week December 2006, but satellite data enabled surveillance. Figure 14 shows a 19 December image from the Advanced Spaceborne Thermal Emission and Reflection Radiometer (ASTER) instrument on the Terra satellite.
During the week of 29 December and the first week in January 2007 there were multiple weak local shallow earthquakes. They occurred at a rate of 100-130 per day during the week of 29 December. On 29 December and 1-3 January tremor was also registered.
According to visual information from pilots of international air flights (reported by AMC, Yelizovo), on 2 December an ash plume rose up ~ 6.9 km altitude and extended E. At 0200 on 22 December an ash plume rose up to ~ 7.0 km altitude and extended E. A number of ash plumes extending 9 to 240 km E were observed during December. At the end of December 2006 and into early January 2007, a possible lava flow was observed on a flank of the volcano.
Geologic Background. Karymsky, the most active volcano of Kamchatka's eastern volcanic zone, is a symmetrical stratovolcano constructed within a 5-km-wide caldera that formed during the early Holocene. The caldera cuts the south side of the Pleistocene Dvor volcano and is located outside the north margin of the large mid-Pleistocene Polovinka caldera, which contains the smaller Akademia Nauk and Odnoboky calderas. Most seismicity preceding Karymsky eruptions originated beneath Akademia Nauk caldera, located immediately south. The caldera enclosing Karymsky formed about 7600-7700 radiocarbon years ago; construction of the stratovolcano began about 2000 years later. The latest eruptive period began about 500 years ago, following a 2300-year quiescence. Much of the cone is mantled by lava flows less than 200 years old. Historical eruptions have been vulcanian or vulcanian-strombolian with moderate explosive activity and occasional lava flows from the summit crater.
Information Contacts: Olga A. Girina, Kamchatka Volcanic Eruptions Response Team (KVERT), a cooperative program of the Institute of Volcanic Geology and Geochemistry, Far East Division, Russian Academy of Sciences, Piip Ave. 9, Petropavlovsk-Kamchatsky, 683006, Russia, GS RAS (Russia), and the Alaska Volcano Observatory (AVO), a cooperative program of the U.S. Geological Survey, 4200 University Drive, Anchorage, AK 99508-4667, USA (URL: http://www.avo.alaska.edu/), the Geophysical Institute, University of Alaska, PO Box 757320, Fairbanks, AK 99775-7320, USA, and the Alaska Division of Geological and Geophysical Surveys, 794 University Ave., Suite 200, Fairbanks, AK 99709, USA; Jesse Allen, National Aeronautics and Space Administration Earth Observatory (URL: http://earthobservatory.nasa.gov/NaturalHazards).
Lascar
Chile
23.37°S, 67.73°W; summit elev. 5592 m
All times are local (unless otherwise noted)
Crater changes after May; minor explosions during September and October 2006
This report covers the time interval September-October 2006 and was contributed by scientists from the Universidad Católica del Norte (Chile), University of Florence (Italy), Universidad Nacional de Salta (Argentina), and Universidad Nacional Autónoma de México (México). Changes seen in Láscar's central active crater after the May 2005 and April 2006 eruptions and after the gas fumaroles investigation carried out during September 2006. Our previous report covered activity into early May 2006 (BGVN 31:04).
Eruptive activity. Substantial ash emissions were noted on 18-21 and 28 April 2006. Several small phreatic explosions occurred starting 18April, continuing through May, July, and August 2006; the last in that time frame occurring on 14 August. After that, three minor explosions occurred between September and October 2006.
An explosion occurred at 0812 on 21 September. The eruptive plume reached 800 m above summit crater. A dark gray-colored plume, with moderate ash content dispersed NNE. The event failed to produce detectable ashfall, seismic activity, or eruption noises.
A minor explosion at 0830 on 20 October 2006 sent an eruptive plume up to 200 m above the summit crater. A dark gray-colored plume with moderate ash content dispersed E. At 1900 a larger eruption lasted 25 minutes. A dark gray-colored plume with moderate ash content reached 800 m above the summit crater and dispersed E. The October events also did not produce detected ashfall, seismic activity, or eruption noises.
Morphological changes in central active crater. Significant morphological changes, principally to the crater floor, occurred after the May 2005 Vulcanian eruption (Aguilera and others, 2006a; BGVN 30:04 and 30:05). Field and aerial observations between October 2002 and March 2005 showed a typical funnel shaped crater, with a depth of 450 m (Aguilera and others, 2003). This phenomena has been recognized as always occurring during the collapse-period of the lava dome growth-collapse cycle described by Matthews and others (1997). The observations during October 2002 and March 2005 show that the crater floor can be recognized from the S border of the central active crater (figure 37). However, observations during December 2005 (after the May 2005 Vulcanian eruption) and September 2006 (after the April 2006 eruptive cycle) show that the crater floor cannot be recognized from S border of central active crater (figure 38), probably indicating subsidence of the crater floor (Aguilera and others, 2006b; BGVN 31:04; and Clavero and others, 2006). Observations made in the central active crater indicate subsidence of crater floor.
The photograph from October 2002 (figure 39) shows the position of the crater floor inferred just before the May 2005 eruption, while the photograph from September 2006 (figure 40) shows the crater floor after the May 2005 and April 2006 eruptions. The position of the crater floor before the May 2005 eruption corresponded to a level associated with talus deposits, and the latest crater floor lay at the bottom of a new circular crater. A notable change in the morphology of the internal walls of the central active crater between the March and December 2005 photographs was the absence of a part of the crater wall (probably corresponding to parts of ancient lava domes, ballistic and ashfall deposits), exposing a new N wall of the crater.
Gas fumarole investigations. During 9-15 September 2006, gas sampling from fumaroles inside the central active crater was carried out by personnel of Universidad Católica del Norte (Chile). They noted a lowering of the temperature of fumaroles from 385°C to 250°C in October 2002 (Tassi and others, 2004). Scientists from Università degli studi di Firenze (Italy) and Universidad Católica del Norte (Chile) are conducting a systematic and permanent gas sampling campaign at Láscar and other active volcanoes of the Central Volcanic Zone (e.g. Putana, Lastarria, Isluga and others). Scientists from the Universidad Católica del Norte, the Universidad Nacional de Salta and SEGEMAR (Argentina) are processing data from Landsat TM and ETM+ and from ASTER images, with the objective of understanding the behavior of Lascar volcano during the 1998-2004 period.
References. Aguilera, F., Viramonte, J., Medina, E., Guzmán, K., Becchio, R., Delgado, H., and Arnosio, M., 2006a, Eruptive activity from Lascar volcano (2003-2005): XI Congreso Geológico Chileno, Antofagasta, 2006, p. 397-400.
Aguilera, F., Viramonte, J., Medina, E., Guzmán, K., Becchio, R., Delgado, H., and Arnosio, M., 2006b, Recent eruptive activity from Lascar volcano (2006): XI Congreso Geológico Chileno, Antofagasta, 2006, p. 393-396.
Clavero, J., Naranjo, J., and Cayupi, J., 2006, El ciclo eruptivo del 18 al 25 de Abril de 2006 del Volcán Lascar, Andes Centrales: XI Congreso Geológico Chileno, Antofagasta, 2006, p. 435-438.
Giggenbach, W., 1975, A simple method for the collection and analysis of volcanic gas samples: Bulletin of Volcanology, v. 39, p. 132-145.
Giggenbach, W., and Goguel, R., 1989, Collection and analysis of geothermal and volcanic water and gas discharges: DSIR Chemistry, Rept. No. 2401.
Matthews, S., Gardeweg, M., and Sparks, R., 1997, The 1984 to 1996 cyclic activity of Lascar volcano, northern Chile: cycles of dome growth, dome subsidence, degassing and explosive eruptions: Bulletin of Volcanology, v. 59, p. 72 - 82
Tassi, F., Viramonte, J., Vaselli, O., Poodts, M., Aguilera, F., Martínez, C., Rodríguez, L., and Watson, I., 2004, First geochemical data from fumarolic gases at Lascar volcano, Chile: 32nd International Geological Congress, Florence, August 20-28, 2004.
Viramonte, J., Aguilera, F., Delgado, H., Rodríguez, L., Guzman, K., Jiménez, J., and Becchio, R., 2006, A new eruptive cycle of Lascar volcano (Chile). The risk for the aeronavigation in northern Argentina: Garavolcan 2006, Tenerife, Spain.
Geologic Background. Láscar is the most active volcano of the northern Chilean Andes. The andesitic-to-dacitic stratovolcano contains six overlapping summit craters. Prominent lava flows descend its NW flanks. An older, higher stratovolcano 5 km E, Volcán Aguas Calientes, displays a well-developed summit crater and a probable Holocene lava flow near its summit (de Silva and Francis, 1991). Láscar consists of two major edifices; activity began at the eastern volcano and then shifted to the western cone. The largest eruption took place about 26,500 years ago, and following the eruption of the Tumbres scoria flow about 9000 years ago, activity shifted back to the eastern edifice, where three overlapping craters were formed. Frequent small-to-moderate explosive eruptions have been recorded since the mid-19th century, along with periodic larger eruptions that produced ashfall hundreds of kilometers away. The largest historical eruption took place in 1993, producing pyroclastic flows to 8.5 km NW of the summit and ashfall in Buenos Aires.
Information Contacts: Felipe Aguilera, Eduardo Medina, Karen Guzmán, and Valeria Ortega, Programa de Doctorado en Ciencias mención Geología and Depto de Ciencias Geológicas, Univ Católica del Norte, Avenida Angamos 0610, Antofagasta, Chile; Franco Tassi and Orlando Vaselli, Dept of Earth Science, Univ of Florence, Via La Pira 4, 50110, Florence, Italy (URL: http://www.geo.unifi.it/); José G. Viramonte, Instituto GEONORTE and CONICET, Univ Nacional de Salta, Buenos Aires 177, Salta 4400, Argentina (URL: http://www.unsa.edu.ar/); Hugo Delgado G., Instituto de Geofísica, Univ Nacional Autónoma de México, Ciudad Universitaria, Del Coyoacán, México D.F., C.P. 04510, México (URL: http://www.igeofcu.unam.mx/).
Montagu Island (United Kingdom) — November 2006 Cite this Report
Montagu Island
United Kingdom
58.445°S, 26.374°W; summit elev. 1370 m
All times are local (unless otherwise noted)
Explosive and possible effusive activity continues in December 2006
Matt Patrick provided three new ASTER images showing Montagu on 28 October 2006. The ASTER VNIR image (Bands 3-2-1, RGB) (figure 17) depicts Montagu in a state similar to that observed in other ASTER images of the eruption. The persistent ash plume has covered the NE quadrant of the island in dark tephra, while the lava field extending from the summit vent to the coast is clearly visible. The lava delta, extending to a distance of ~ 3.5 km from the vent, first formed during the September-October 2005 eruptive phase and remains intact (BGVN 30:11). It is unclear if any new lava flows erupted since that time have extended as far.
ASTER (Advanced Spaceborne Thermal Emission and Reflection Radiometer) is an imaging radiometer that consists of three distinct telescope subsystems: near infrared (VNIR), shortwave infrared (SWIR), and thermal infrared (TIR). These have the following spectral ranges, number of bands, and spatial resolutions: VNIR (spectral range, 0.5-0.9 ?m in three bands; spatial resolution, 15 m); SWIR (spectral range 1.6-2.5 ?m in six bands, spatial resolution 30 m); TIR (8-12 ?m in five bands; spatial resolution, 90 m).
Patrick noted that the ASTER TIR (Band 14; thermal infrared wavelength 10.95-11.65 ?m) and SWIR (Band 9; short-wave infrared wavelength 2.360-2.430 ?m) images (figure 18) may show a new lava flow reaching ~ 1.5 km NE from the summit. An elongated section of warm pixels in the TIR corresponds to a feature which appears to have a faint outline of anomalous pixels in the SWIR, possibly reflecting a new flow.
Geologic Background. The largest of the South Sandwich Islands, Montagu consists of a massive shield volcano cut by a 6-km-wide ice-filled summit caldera. The summit of the 11 x 15 km island rises about 3,000 m from the sea floor between Bristol and Saunders Islands. Around 90% of the island is ice-covered; glaciers extending to the sea typically form vertical ice cliffs. The name Mount Belinda has been applied both to the high point at the southern end of the summit caldera and to the young central cone. Mount Oceanite, an isolated peak at the SE tip of the island, was the source of lava flows exposed at Mathias Point and Allen Point. There was no record of Holocene activity until MODIS satellite data, beginning in late 2001, revealed thermal anomalies consistent with lava lake activity. Apparent plumes and single anomalous pixels were observed intermittently on AVHRR images from March 1995 to February 1998, possibly indicating earlier volcanic activity.
Information Contacts: Matthew Patrick, Dept. of Geological and Mining Engineering and Sciences, Michigan Technological University, 1400 Townsend Drive, Houghton, MI 49931, USA; Hawai'i Institute of Geophysics and Planetology (HIGP) Thermal Alerts Team, School of Ocean and Earth Science and Technology (SOEST), Univ. of Hawai'i, 2525 Correa Road, Honolulu, HI 96822, USA (URL: http://modis.higp.hawaii.edu/).
Northern EPR at 9.8°N (Undersea Features) — November 2006 Cite this Report
Northern EPR at 9.8°N
Undersea Features
9.83°N, 104.3°W; summit elev. -2500 m
All times are local (unless otherwise noted)
Lava erupted along at least 18 km of ridge axis
According to the RIDGE 2000 Program website, a new eruption on the East Pacific rise (EPR) was first suspected during a visit to the site by the research vessel RV Knorr in April 2006. Since October 2003 an array of up to 12 ocean-bottom seismometers (OBSs) had been deployed in an area ~ 4 x 4 km located between 9°49' N and 9°51' N (the EPR Integrated Study Site, ISS) as part of a continuing microseismicity monitoring project being led by Maya Tolstoy and Felix Waldhauser.
Investigators attempted to recover 12 OBSs on 25 April 2006, but only four were recovered. Tolstoy and others (2006), Chadwick (2006), and the Ridge 2000 Program (2006) reported that eight OBS were stuck in the new lava on the sea floor (see figure 5) from an eruption that had occurred since the last OBS servicing in May 2005. Water column measurements were also made by the RV Knorr, yielding light-scattering measurements indicative of extensive particulates in the water column, and corroborating the evidence for a recent eruption (BGVN 31:06).
The TowCam images suggested that the new lavas erupted from fissures within the axial summit trough (AST), which reestablished quickly after the event by drain-back and collapse. Comparison of TowCam bathymetry with pre-eruption Alvin mapping suggested that after the eruption the axial summit trough became 10-15 m narrower and a few meters shallower at 9°50.4' N. Lava flow morphologies indicate that the highest effusion rates were near 9°50' N.
Radiometric dating of 10 rocks collected from the young terrain is under way, using 210Po. Preliminary 210Po results in Tolstoy and others (2006) indicate that nine of the rocks were erupted within a year before their collection, with dates ranging from late summer 2005 to January 2006.
According to Tolstoy and others (2006), based on the sea-floor images, the extent of water column anomalies, the preliminary lava ages, and the distribution of OBSs that failed to return, they estimated that the flow extended intermittently for at least 18 km along the ridge axis. This zone extends from 9°46' N to 9°55.7' N, with off-axis extent ranging from 0 to 1 km. The eruption occurred on the same segment (segment B) as the 1991-1992 eruption, with a similar length scale.
The loss of some seismometers did not preclude the capture of important data associated with the eruption, including precursory activity. Tolstoy and others (2006) found a gradual ramp-up in seismicity since monitoring began at this site in October 2003. The pattern of seismicity culminated in an intense but brief (6-hour) inferred diking event on 22 January 2006, followed by rapid tapering to markedly decreased levels of seismicity.
Two follow-up cruises proceeded to the eruption site, the RV New Horizon in April-May 2006, and the RV Atlantis in June 2006. They assessed the extent of the new eruption and its effect on the biological communities, ecosystems, and chemistry at the EPR ISS. More work on the event was recently reported at the Fall 2006 meeting of the American Geophysical Union (Eg., session V13 C).
Background. The East Pacific Rise (EPR) near 9°50' N spreads at a full rate of ~ 110 mm per year and is one of the better-studied mid-ocean ridge (MOR) segments in the world. Ever since an eruption was documented in 1991, scientists have regularly returned to document ecosystem progression, to study changes in vent-fluid chemistry and temperature, and to conduct detailed geological mapping. Anomalies in water-column measurements of temperature and light scattering indicated vigorous discharge of high-temperature hydrothermal fluids. Radiometric dating of rocks collected from the young terrain, using 210Po, indicated that many of the rocks were erupted within a year before their collection. Sea-floor images give further evidence of the recency of surface lava flows.
References. Tolstoy, M., Cowen, J.P., Baker, E.T., Fornari, D.J., Rubin, K.H., Shank, T.M., Waldhauser, F., Bohnenstiehl, D.R., Forsyth, D.W., Holmes, R.C., Love, B., Perfit, M.R., Weekly, R.T., Soule, S.A., and Glazer, B., 2006, A sea-floor spreading event captured by seismometers, Science, v. 314, no. 5807, p. 1920-1922.
Hinds, J.S., Perfit, M.R., Soule, S.A., Fornari, D.J., and Ridley, W.I., 2005, Discriminating lava flows from the EPR ISS (9°25'-9°55' N) using lava morphology, petrography, and geochemistry: American Geophysical Union, Fall Meeting 2005, abstract ##T31A-0496 (2005AGUFM.T31A0496H).
Chadwick, W.W., Jr., 2006, A submarine volcano is caught in the act: Science, v. 314, no. 5807, p. 1887-1888.
Ridge 2000 Program, 2006, News: Ridge 2000 research discover/document seafloor eruption: Ridge 2000 Program web site, URL: http://www.ridge2000.org/science/tcs/epr_2006_science_supp_material.php.
Geologic Background. A series of dives with the submersible Alvin in 1991 on the East Pacific Rise at about 9°50'N detected evidence for a very recent, possibly ongoing, eruption. Hot-vent animal communities documented during November-December 1989 had been buried by fresh basaltic lava flows, and the scorched soft tissues of partially buried biota had not yet attracted bottom scavengers. Fresh black smoker chimneys and new lava flows were present. This site is south of the Clipperton Fracture Zone at a depth of about 2,500 m, and about 1,000 km SW of Acapulco, México; the south end of the Lamont Seamount chain is about 10 km NW. This is also the location where lava flows previously estimated as being less than roughly 50 years old had been found. Later dating using very short half-life radionuclides from dredged samples confirmed the young age of the eruption and indicated that another eruptive event had taken place in late 1991 and early 1992. An eruption in 2005-2006 produced lava flows that entrapped previously emplaced seismometers.
Information Contacts: Ridge 2000 Program, Ridge 2000 Program Office, Institute of Geophysics and Planetology (IGPP), University of California San Diego, Scripps Institution of Oceanography, La Jolla, CA 92093-0225, USA (URL: http://www.ridge2000.org/).
Sheveluch (Russia) — November 2006 Cite this Report
Sheveluch
Russia
56.653°N, 161.36°E; summit elev. 3283 m
All times are local (unless otherwise noted)
Ash plumes rising to ~ 10 km in December
In December 2006 Shiveluch underwent heightened seismic and volcanic activity of an intensity not seen since 22 September 2005. During the latter episode, plumes reached ~ 7.5 km altitude (BGVN 30:08). This report covers from September 2005 to December 2006.
Activity during 2005. Seismic levels declined in the weeks subsequent to the previously described 22 September eruption. The Kamchatka Volcanic Eruptions Response Team (KVERT) had raised the Concern Color Code level to orange due to the 22 September 2005 eruption and then lowered it to yellow at the start of November. During October, KVERT noted that weak shallow earthquakes, hot avalanches, and small fumarolic activity persisted. Incandescence at the dome was reported on 13, 15, 17, 22, and 29 October, and thermal anomalies over the lava dome were frequently registered.
On 22 October a weak ash-gas plume extended to the E. Seismic activity decreased further and did not exceed background levels in October and November, and remained at low levels in December. Weak avalanches were reported at the start of November. Weak seismicity and fumarolic activity was registered in December. Numerous thermal anomalies over the lava dome and incandescence at the dome were widely reported (specifically, on 1, 7, 8-11, 15, 17-18, 25, and 27-29 December).
Activity during 2006. The lava dome continued to grow in 2006; overall volcanism and seismicity remained low during January to May 2006. Visual and satellite observations of weak fumarolic activity and thermal anomalies were noted during periods of visibility early in 2006 (13-14, 16-17, 22, and 30-31 January and 1 February). One shallow earthquake was registered on 30 January. On 23 May a thermal anomaly was reported, and on 21, and 27-31 May moderate gas-and-steam plumes were observed.
Three deep earthquakes were recorded, one each day, on 1-2 and 5 June, and a shallow earthquakes was recorded on both 2 and 4 June. On 5 and 8 June gas-and-steam plumes rose over the volcano. A thermal anomaly from the volcanic crater was noted on 2-5 and 7-8 June. Fumarolic activity of the lava dome was observed on 23 and 29-30 June. On 16 and 19 June, gas-and-steam plumes rose to ~ 3-3.5 km altitude from the lava dome summit. A steam plume extending 9.5 km NE from the volcano was observed on a 24 July satellite image. Observers noted frequent fumarolic emissions from the dome (on 1-2, 8, 10, 17-20, 22, and 24-26 July). Frequent thermal anomalies over the dome also were noted (on 4, 7-8, 17-18, and 23-26 July).
In August and September, activity remained the same with periods of fumarolic activity and reports of thermal anomalies. Seismicity remained low except for five earthquakes in the middle of August. Several weak earthquakes were registered throughout October and November, as well as fumarolic activity of the lava dome in periods of good visibility. Sporadic thermal anomalies were recorded (on 6, 8, 14-15, 22, and 27-31 October and 1-2, 6-7, 13-15, and 19-22 November). According to visual and video data, gas-and-steam plumes rose to ~ 3.5 km altitude and extended NW on 23 October. A weak continuous spasmodic volcanic tremor was registered on 29-30 October and 2 November.
Heightened volcanic activity during December began with a strong seismic event on 4 December from 1906-1940. According to satellite data, an ash plume raising up ~ 6 km altitude and extending NW was observed at 2100, and during 2130-2400 gas-and-steam plumes containing ash extended NW at ~ 3.0 km altitude. On 4 December ashfall extended ~ 150 km. Several tens of shallow earthquakes were registered in the following days. On 5 December the level of Concern Color Code was raised from yellow to orange. On 8 December another eruption occurred with ash plumes to ~ 4 km altitude that extended NW.
On 12 December, ash explosions to a height ~ 4 km produced a plume that extended E-SE from 25-460 km, according to satellite data from various sources. According to visual and video data, two separate ash plumes rose to ~ 10 km altitude and extended NW on 16, 17, and 20 December. On subsequent days, satellite data showed ash clouds extended primarily ~ 570 km to the E, as well as to the NE.
On 26 December 2006 the Concern Color Code level was raised to red. At 2130 on 27 December, video data recorded a gas-and-steam plume rising to ~ 3.5 km altitude. An ash plume rose to ~ 10 km altitude and extended E on 25-27 December (figure 9) and N on the 28th. The Concern Color Code level lowered to orange on 28 December 2006, where it remained in early January 2007.
Geologic Background. The high, isolated massif of Sheveluch volcano (also spelled Shiveluch) rises above the lowlands NNE of the Kliuchevskaya volcano group. The 1,300 km3 andesitic volcano is one of Kamchatka's largest and most active volcanic structures, with at least 60 large eruptions during the Holocene. The summit of roughly 65,000-year-old Stary Shiveluch is truncated by a broad 9-km-wide late-Pleistocene caldera breached to the south. Many lava domes occur on its outer flanks. The Molodoy Shiveluch lava dome complex was constructed during the Holocene within the large open caldera; Holocene lava dome extrusion also took place on the flanks of Stary Shiveluch. Widespread tephra layers from these eruptions have provided valuable time markers for dating volcanic events in Kamchatka. Frequent collapses of dome complexes, most recently in 1964, have produced debris avalanches whose deposits cover much of the floor of the breached caldera.
Information Contacts: Olga A. Girina, Kamchatka Volcanic Eruptions Response Team (KVERT), a cooperative program of the Institute of Volcanic Geology and Geochemistry, Far East Division, Russian Academy of Sciences, Piip Ave. 9, Petropavlovsk-Kamchatsky, 683006, Russia, GS RAS (Russia), and the Alaska Volcano Observatory (AVO), a cooperative program of the U.S. Geological Survey, 4200 University Drive, Anchorage, AK 99508-4667, USA (URL: http://www.avo.alaska.edu/), the Geophysical Institute, University of Alaska, PO Box 757320, Fairbanks, AK 99775-7320, USA, and the Alaska Division of Geological and Geophysical Surveys, 794 University Ave., Suite 200, Fairbanks, AK 99709, USA; Jeff Schmaltz, MODIS Land Rapid Response Team, NASA Goddard Space Flight Center (URL: http://modis.gsfc.nasa.gov/gallery/); National Aeronautics and Space Administration Earth Observatory (URL: http://earthobservatory.nasa.gov/NaturalHazards).