Recently Published Bulletin Reports
Erebus (Antarctica) Lava lake remains active; most thermal alerts recorded since 2019
Rincon de la Vieja (Costa Rica) Frequent phreatic explosions during July-December 2023
Bezymianny (Russia) Explosion on 18 October 2023 sends ash plume 8 km high; lava flows and incandescent avalanches
Kilauea (United States) Low-level lava effusions in the lava lake at Halema’uma’u during July-December 2022
Nyamulagira (DR Congo) Lava flows and thermal activity during May-October 2023
Bagana (Papua New Guinea) Explosions, ash plumes, ashfall, and lava flows during April-September 2023
Mayon (Philippines) Lava flows, pyroclastic flows, ash emissions, and seismicity during April-September 2023
Nishinoshima (Japan) Eruption plumes and gas-and-steam plumes during May-August 2023
Krakatau (Indonesia) White gas-and-steam plumes and occasional ash plumes during May-August 2023
Villarrica (Chile) Strombolian activity, gas-and-ash emissions, and crater incandescence during April-September 2023
Merapi (Indonesia) Frequent incandescent avalanches during April-September 2023
Ebeko (Russia) Moderate explosive activity with ash plumes continued during June-November 2023
Erebus (Antarctica) — January 2024  Cite this Report
Erebus
Antarctica
77.53°S, 167.17°E; summit elev. 3794 m
All times are local (unless otherwise noted)
Lava lake remains active; most thermal alerts recorded since 2019
The lava lake in the summit crater of Erebus has been active since at least 1972. Located in Antarctica overlooking the McMurdo Station on Ross Island, it is the southernmost active volcano on the planet. Because of the remote location, activity is primarily monitored by satellites. This report covers activity during 2023.
The number of thermal alerts recorded by the Hawai'i Institute of Geophysics and Planetology’s MODVOLC Thermal Alerts System increased considerably in 2023 compared to the years 2020-2022 (table 9). In contrast to previous years, the MODIS instruments aboard the Aqua and Terra satellites captured data from Erebus every month during 2023. Consistent with previous years, the lowest number of anomalous pixels were recorded in January, November, and December.
Table 9. Number of monthly MODIS-MODVOLC thermal alert pixels recorded at Erebus during 2017-2023. See BGVN 42:06 for data from 2000 through 2016. The table was compiled using data provided by the HIGP – MODVOLC Thermal Alerts System.
| Year |
Jan |
Feb |
Mar |
Apr |
May |
Jun |
Jul |
Aug |
Sep |
Oct |
Nov |
Dec |
SUM |
| 2017 |
0 |
21 |
9 |
0 |
0 |
1 |
11 |
61 |
76 |
52 |
0 |
3 |
234 |
| 2018 |
0 |
21 |
58 |
182 |
55 |
17 |
137 |
172 |
103 |
29 |
0 |
0 |
774 |
| 2019 |
2 |
21 |
162 |
151 |
55 |
56 |
75 |
53 |
29 |
19 |
1 |
0 |
624 |
| 2020 |
0 |
2 |
16 |
18 |
4 |
4 |
1 |
3 |
18 |
3 |
1 |
6 |
76 |
| 2021 |
0 |
9 |
1 |
0 |
2 |
56 |
46 |
47 |
35 |
52 |
5 |
3 |
256 |
| 2022 |
1 |
13 |
55 |
22 |
15 |
32 |
39 |
19 |
31 |
11 |
0 |
0 |
238 |
| 2023 |
2 |
33 |
49 |
82 |
41 |
32 |
70 |
64 |
42 |
17 |
5 |
11 |
448 |
Sentinel-2 infrared images showed one or two prominent heat sources within the summit crater, accompanied by adjacent smaller sources, similar to recent years (see BGVN 46:01, 47:02, and 48:01). A unique image was obtained on 25 November 2023 by the OLI-2 (Operational Land Imager-2) on Landsat 9, showing the upper part of the volcano surrounded by clouds (figure 32).
Geologic Background. Mount Erebus, the world's southernmost historically active volcano, overlooks the McMurdo research station on Ross Island. It is the largest of three major volcanoes forming the crudely triangular Ross Island. The summit of the dominantly phonolitic volcano has been modified by one or two generations of caldera formation. A summit plateau at about 3,200 m elevation marks the rim of the youngest caldera, which formed during the late-Pleistocene and within which the modern cone was constructed. An elliptical 500 x 600 m wide, 110-m-deep crater truncates the summit and contains an active lava lake within a 250-m-wide, 100-m-deep inner crater; other lava lakes are sometimes present. The glacier-covered volcano was erupting when first sighted by Captain James Ross in 1841. Continuous lava-lake activity with minor explosions, punctuated by occasional larger Strombolian explosions that eject bombs onto the crater rim, has been documented since 1972, but has probably been occurring for much of the volcano's recent history.
Information Contacts: Hawai'i Institute of Geophysics and Planetology (HIGP) - MODVOLC Thermal Alerts System, School of Ocean and Earth Science and Technology (SOEST), Univ. of Hawai'i, 2525 Correa Road, Honolulu, HI 96822, USA (URL: http://modis.higp.hawaii.edu/); Copernicus Browser, Copernicus Data Space Ecosystem, European Space Agency (URL: https://dataspace.copernicus.eu/browser/); NASA Earth Observatory, EOS Project Science Office, NASA Goddard Space Flight Center, Goddard, Maryland, USA (URL: https://earthobservatory.nasa.gov/images/152134/erebus-breaks-through).
Rincon de la Vieja (Costa Rica) — January 2024 Cite this Report
Rincon de la Vieja
Costa Rica
10.83°N, 85.324°W; summit elev. 1916 m
All times are local (unless otherwise noted)
Frequent phreatic explosions during July-December 2023
Rincón de la Vieja is a volcanic complex in Costa Rica with a hot convecting acid lake that exhibits frequent weak phreatic explosions, gas-and-steam emissions, and occasional elevated sulfur dioxide levels (BGVN 45:10, 46:03, 46:11). The current eruption period began June 2021. This report covers activity during July-December 2023 and is based on weekly bulletins and occasional daily reports from the Observatorio Vulcanologico Sismologica de Costa Rica-Universidad Nacional (OVSICORI-UNA).
Numerous weak phreatic explosions continued during July-December 2023, along with gas-and-steam emissions and plumes that rose as high as 3 km above the crater rim. Many weekly OVSICORI-UNA bulletins included the previous week's number of explosions and emissions (table 9). For many explosions, the time of explosion was given (table 10). Frequent seismic activity (long-period earthquakes, volcano-tectonic earthquakes, and tremor) accompanied the phreatic activity.
Table 9. Number of reported weekly phreatic explosions and gas-and-steam emissions at Rincón de la Vieja, July-December 2023. Counts are reported for the week before the Weekly Bulletin date; not all reports included these data. Courtesy of OVSICORI-UNA.
| OVSICORI Weekly Bulletin |
Number of explosions |
Number of emissions |
| 28 Jul 2023 |
6 |
14 |
| 4 Aug 2023 |
10 |
12 |
| 1 Sep 2023 |
13 |
11 |
| 22 Sep 2023 |
12 |
13 |
| 29 Sep 2023 |
6 |
11 |
| 6 Oct 2023 |
12 |
5 |
| 13 Oct 2023 |
7 |
9 |
| 20 Oct 2023 |
1 |
15 |
| 27 Oct 2023 |
3 |
23 |
| 3 Nov 2023 |
3 |
10 |
| 17 Nov 2023 |
0 |
Some |
| 24 Nov 2023 |
0 |
14 |
| 8 Dec 2023 |
4 |
16 |
| 22 Dec 2023 |
8 |
18 |
Table 10. Summary of activity at Rincón de la Vieja during July-December 2023. Weak phreatic explosions and gas emissions are noted where the time of explosion was indicated in the weekly or daily bulletins. Height of plumes or emissions are distance above the crater rim. Courtesy of OVSICORI-UNA.
| Date |
Time |
Description of Activity |
| 1 Jul 2023 |
0156 |
Explosion. |
| 2 Jul 2023 |
0305 |
Explosion. |
| 4 Jul 2023 |
0229, 0635 |
Event at 0635 produced a gas-and-steam plume that rose 700 m and drifted W; seen by residents in Liberia (21 km SW). |
| 9 Jul 2023 |
1843 |
Explosion. |
| 21 Jul 2023 |
0705 |
Explosion. |
| 26 Jul 2023 |
1807 |
Explosion. |
| 28 Jul 2023 |
0802 |
Explosion generated a gas-and-steam plume that rose 500 m. |
| 30 Jul 2023 |
1250 |
Explosion. |
| 31 Jul 2023 |
2136 |
Explosion. |
| 11 Aug 2023 |
0828 |
Explosion. |
| 18 Aug 2023 |
1304 |
Explosion. |
| 21 Aug 2023 |
1224 |
Explosion generated gas-and-steam plumes rose 500-600 m. |
| 22 Aug 2023 |
0749 |
Explosion generated gas-and-steam plumes rose 500-600 m. |
| 24 Aug 2023 |
1900 |
Explosion. |
| 25 Aug 2023 |
0828 |
Event produced a steam-and-gas plume that rose 3 km and drifted NW. |
| 27-28 Aug 2023 |
0813 |
Four small events; the event at 0813 on 28 August lasted two minutes and generated a steam-and-gas plume that rose 2.5 km. |
| 1 Sep 2023 |
1526 |
Explosion generated plume that rose 2 km and ejected material onto the flanks. |
| 2-3 Sep 2023 |
- |
Small explosions detected in infrasound data. |
| 4 Sep 2023 |
1251 |
Gas-and-steam plume rose 1 km and drifted W. |
| 7 Nov 2023 |
1113 |
Explosion. |
| 8 Nov 2023 |
0722 |
Explosion. |
| 12 Nov 2023 |
0136 |
Small gas emissions. |
| 14 Nov 2023 |
0415 |
Small gas emissions. |
According to OVSICORI-UNA, during July-October the average weekly sulfur dioxide (SO2) flux ranged from 68 to 240 tonnes/day. However, in mid-November the flux increased to as high as 334 tonnes/day, the highest value measured in recent years. The high SO2 flux in mid-November was also detected by the TROPOMI instrument on the Sentinel-5P satellite (figure 43).
Geologic Background. Rincón de la Vieja, the largest volcano in NW Costa Rica, is a remote volcanic complex in the Guanacaste Range. The volcano consists of an elongated, arcuate NW-SE-trending ridge constructed within the 15-km-wide early Pleistocene Guachipelín caldera, whose rim is exposed on the south side. Sometimes known as the "Colossus of Guanacaste," it has an estimated volume of 130 km3 and contains at least nine major eruptive centers. Activity has migrated to the SE, where the youngest-looking craters are located. The twin cone of Santa María volcano, the highest peak of the complex, is located at the eastern end of a smaller, 5-km-wide caldera and has a 500-m-wide crater. A Plinian eruption producing the 0.25 km3 Río Blanca tephra about 3,500 years ago was the last major magmatic eruption. All subsequent eruptions, including numerous historical eruptions possibly dating back to the 16th century, have been from the prominent active crater containing a 500-m-wide acid lake located ENE of Von Seebach crater.
Information Contacts: Observatorio Vulcanológico Sismológica de Costa Rica-Universidad Nacional (OVSICORI-UNA), Apartado 86-3000, Heredia, Costa Rica (URL: http://www.ovsicori.una.ac.cr/); NASA Global Sulfur Dioxide Monitoring Page, Atmospheric Chemistry and Dynamics Laboratory, NASA Goddard Space Flight Center (NASA/GSFC), 8800 Greenbelt Road, Goddard MD 20771, USA (URL: https://so2.gsfc.nasa.gov/).
Bezymianny (Russia) — November 2023 Cite this Report
Bezymianny
Russia
55.972°N, 160.595°E; summit elev. 2882 m
All times are local (unless otherwise noted)
Explosion on 18 October 2023 sends ash plume 8 km high; lava flows and incandescent avalanches
Bezymianny, located on Russia’s Kamchatka Peninsula, has had eruptions since 1955 characterized by dome growth, explosions, pyroclastic flows, ash plumes, and ashfall. Activity during November 2022-April 2023 included gas-and-steam emissions, lava dome collapses generating avalanches, and persistent thermal activity. Similar eruptive activity continued from May through October 2023, described here based on information from weekly and daily reports of the Kamchatka Volcano Eruptions Response Team (KVERT), notices from Tokyo VAAC (Volcanic Ash Advisory Center), and from satellite data.
Overall activity decreased after the strong period of activity in late March through April 2023, which included ash explosions during 29 March and 7-8 April 2023 that sent plumes as high as 10-12 km altitude, along with dome growth and lava flows (BGVN 48:05). This reduced activity can be seen in the MIROVA thermal detection system graph (figure 56), which was consistent with data from the MODVOLC thermal detection system and with Sentinel-2 satellite images that showed persistent hotspots in the summit crater when conditions allowed observations. A renewed period of strong activity began in mid-October 2023.
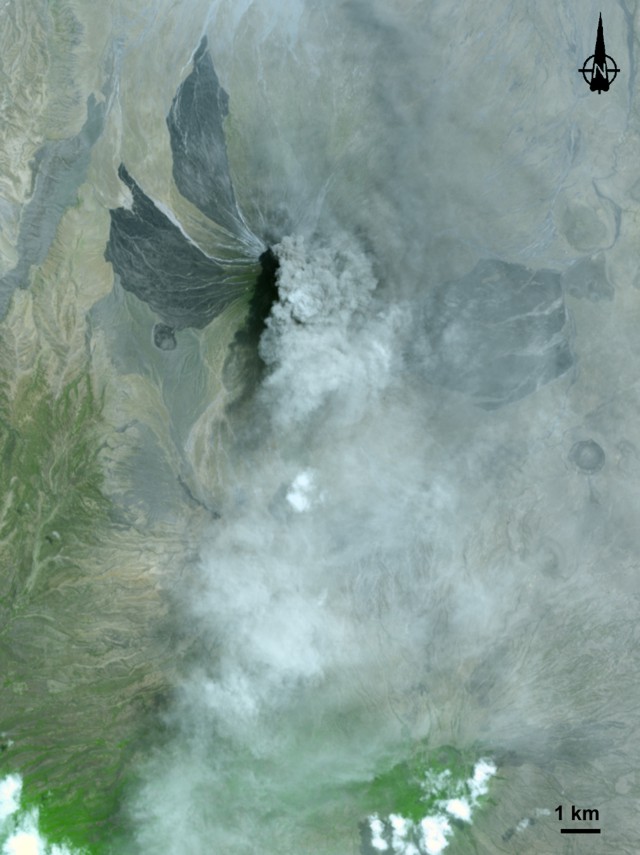
Activity increased significantly on 17 October 2023 when large collapses began during 0700-0830 on the E flanks of the lava dome and continued to after 0930 the next day (figure 57). Ash plumes rose to an altitude of 4.5-5 km, extending 220 km NNE by 18 October. A large explosion at 1630 on 18 October produced an ash plume that rose to an altitude of 11 km (8 km above the summit) and drifted NNE and then NW, extending 900 km NW within two days at an altitude of 8 km. Minor ashfall was noted in Kozyrevsk (45 km WNW). At 0820 on 20 October an ash plume was identified in satellite images drifting 100 km ENE at altitudes of 4-4.5 km.
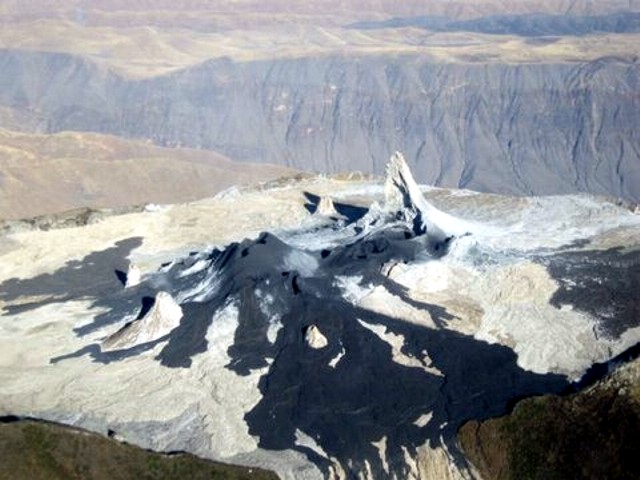
Lava flows and hot avalanches from the dome down the SE flank continued over the next few days, including 23 October when clear conditions allowed good observations (figures 58 and 59). A large thermal anomaly was observed over the volcano through 24 October, and in the summit crater on 30 October (figure 60). Strong fumarolic activity continued, with numerous avalanches and occasional incandescence. By the last week of October, volcanic activity had decreased to a level consistent with that earlier in the reporting period.
Aviation warnings were frequently updated during 17-20 October. KVERT issued a Volcano Observatory Notice for Aviation (VONA) on 17 October at 1419 and 1727 (0219 and 0527 UTC) raising the Aviation Color Code (ACC) from Yellow to Orange (second highest level). The next day, KVERT issued a VONA at 1705 (0505 UTC) raising the ACC to Red (highest level) but lowered it back to Orange at 2117 (0917 UTC). After another decrease to Yellow and back to Orange, the ACC was reduced to Yellow on 20 October at 1204 (0004 UTC). In addition, the Tokyo VAAC issued a series of Volcanic Ash Advisories beginning on 16 October and continuing through 30 October.
Geologic Background. The modern Bezymianny, much smaller than its massive neighbors Kamen and Kliuchevskoi on the Kamchatka Peninsula, was formed about 4,700 years ago over a late-Pleistocene lava-dome complex and an edifice built about 11,000-7,000 years ago. Three periods of intensified activity have occurred during the past 3,000 years. The latest period, which was preceded by a 1,000-year quiescence, began with the dramatic 1955-56 eruption. This eruption, similar to that of St. Helens in 1980, produced a large open crater that was formed by collapse of the summit and an associated lateral blast. Subsequent episodic but ongoing lava-dome growth, accompanied by intermittent explosive activity and pyroclastic flows, has largely filled the 1956 crater.
Information Contacts: Kamchatka Volcanic Eruptions Response Team (KVERT), Far Eastern Branch, Russian Academy of Sciences, 9 Piip Blvd., Petropavlovsk-Kamchatsky, 683006, Russia (URL: http://www.kscnet.ru/ivs/kvert/); Kamchatka Volcanological Station, Kamchatka Branch of Geophysical Survey, (KB GS RAS), Klyuchi, Kamchatka Krai, Russia (URL: http://volkstat.ru/); Tokyo Volcanic Ash Advisory Center (VAAC), 1-3-4 Otemachi, Chiyoda-ku, Tokyo 100-8122, Japan (URL: http://ds.data.jma.go.jp/svd/vaac/data/); Hawai'i Institute of Geophysics and Planetology (HIGP) - MODVOLC Thermal Alerts System, School of Ocean and Earth Science and Technology (SOEST), Univ. of Hawai'i, 2525 Correa Road, Honolulu, HI 96822, USA (URL: http://modis.higp.hawaii.edu/); MIROVA (Middle InfraRed Observation of Volcanic Activity), a collaborative project between the Universities of Turin and Florence (Italy) supported by the Centre for Volcanic Risk of the Italian Civil Protection Department (URL: http://www.mirovaweb.it/); Copernicus Browser, Copernicus Data Space Ecosystem, European Space Agency (URL: https://dataspace.copernicus.eu/browser/).chr
Kilauea (United States) — January 2023 Cite this Report
Kilauea
United States
19.421°N, 155.287°W; summit elev. 1222 m
All times are local (unless otherwise noted)
Low-level lava effusions in the lava lake at Halema’uma’u during July-December 2022
Kīlauea is the southeastern-most volcano in Hawaii and overlaps the E flank of the Mauna Loa volcano. Its East Rift Zone (ERZ) has been intermittently active for at least 2,000 years. An extended eruption period began in January 1983 and was characterized by open lava lakes and lava flows from the summit caldera and the East Rift Zone. During May 2018 magma migrated into the Lower East Rift Zone (LERZ) and opened 24 fissures along a 6-km-long NE-trending fracture zone that produced lava flows traveling in multiple directions. As lava emerged from the fissures, the lava lake at Halema'uma'u drained and explosions sent ash plumes to several kilometers altitude (BGVN 43:10).
The current eruption period started during September 2021 and has recently been characterized by lava effusions, spatter, and sulfur dioxide emissions in the active Halema’uma’u lava lake (BGVN 47:08). Lava effusions, some spatter, and sulfur dioxide emissions have continued during this reporting period of July through December 2022 using daily reports, volcanic activity notices, and abundant photo, map, and video data from the US Geological Survey's (USGS) Hawaiian Volcano Observatory (HVO).
Summary of activity during July-December 2022. Low-level effusions have continued at the western vent of the Halema’uma’u crater during July through early December 2022. Occasional weak ooze-outs (also called lava break outs) would occur along the margins of the crater floor. The overall level of the active lava lake throughout the reporting period gradually increased due to infilling, however it stagnated in mid-September (table 13). During September through November, activity began to decline, though lava effusions persisted at the western vent. By 9 December, the active part of the lava lake had completely crusted over, and incandescence was no longer visible.
Table 13. Summary of measurements taken during overflights at Kīlauea that show a gradual increase in the active lava lake level and the volume of lava effused since 29 September 2021. Lower activity was reported during September-October. Data collected during July-December 2022. Courtesy of HVO.
| Date: |
Level of the active lava lake (m): |
Cumulative volume of lava effused (million cubic meters): |
| 7 Jul 2022 |
130 |
95 |
| 19 Jul 2022 |
133 |
98 |
| 4 Aug 2022 |
136 |
102 |
| 16 Aug 2022 |
137 |
104 |
| 12 Sep 2022 |
143 |
111 |
| 5 Oct 2022 |
143 |
111 |
| 28 Oct 2022 |
143 |
111 |
Activity during July 2022. Lava effusions were reported from the western vent in the Halema’uma’u crater, along with occasional weak ooze-outs along the margins of the crater floor. The height of the lava lake was variable due to deflation-inflation tilt events; for example, the lake level dropped approximately 3-4 m during a summit deflation-inflation event reported on 1 July. Webcam images taken during the night of 6-12 July showed intermittent low-level spattering at the western vent that rose less than 10 m above the vent (figure 519). Measurements made during an overflight on 7 July indicated that the crater floor was infilled about 130 m and that 95 million cubic meters of lava had been effused since 29 September 2021. A single, relatively small lava ooze-out was active to the S of the lava lake. Around midnight on 8 July there were two brief periods of lava overflow onto the lake margins. On 9 July lava ooze-outs were reported near the SE and NE edges of the crater floor and during 10-11 July they occurred near the E, NE, and NW edges. On 16 July crater incandescence was reported, though the ooze-outs and spattering were not visible. On 18 July overnight webcam images showed incandescence in the western vent complex and two ooze-outs were reported around 0000 and 0200 on 19 July. By 0900 there were active ooze-outs along the SW edge of the crater floor. Measurements made from an overflight on 19 July indicated that the crater floor was infilled about 133 m and 98 million cubic meters of lava had erupted since 29 September 2021 (figure 520). On 20 July around 1600 active ooze-outs were visible along the N edge of the crater, which continued through the next day. Extensive ooze-outs occurred along the W margin during 24 July until 1900; on 26 July minor ooze-outs were noted along the N margin. Minor spattering was visible on 29 July along the E margin of the lake. The sulfur dioxide emission rates ranged 650-2,800 tons per day (t/d), the higher of which was measured on 8 July (figure 519).
Activity during August 2022. The eruption continued in the Halema’uma’u crater at the western vent. According to HVO the lava in the active lake remained at the level of the bounding levees. Occasional minor ooze-outs were observed along the margins of the crater floor. Strong nighttime crater incandescence was visible after midnight on 6 August over the western vent cone. During 6-7 August scattered small lava lobes were active along the crater floor and incandescence persisted above the western vent through 9 August. During 7-9 August HVO reported a single lava effusion source was active along the NW margin of the crater floor. Measurements from an overflight on 4 August indicated that the crater floor was infilled about 136 m total and that 102 million cubic meters of lava had been erupted since the start of the eruption. Lava breakouts were reported along the N, NE, E, S, and W margins of the crater during 10-16 August. Another overflight survey conducted on 16 August indicated that the crater floor infilled about 137 m and 104 million cubic meters of lava had been erupted since September 2021. Measured sulfur dioxide emissions rates ranged 1,150-2,450 t/d, the higher of which occurred on 8 August.
Activity during September 2022. During September, lava effusion continued from the western vent into the active lava lake and onto the crater floor. Intermittent minor ooze-outs were reported through the month. A small ooze-out was visible on the W crater floor margin at 0220 on 2 September, which showed decreasing surface activity throughout the day, but remained active through 3 September. On 3 September around 1900 a lava outbreak occurred along the NW margin of the crater floor but had stopped by the evening of 4 September. Field crews monitoring the summit lava lake on 9 September observed spattering on the NE margin of the lake that rose no higher than 10 m, before falling back onto the lava lake crust (figure 521). Overflight measurements on 12 September indicated that the crater floor was infilled a total of 143 m and 111 million cubic meters of lava had been erupted since September 2021. Extensive breakouts in the W and N part of the crater floor were reported at 1600 on 20 September and continued into 26 September. The active part of the lava lake dropped by 10 m while other parts of the crater floor dropped by several meters. Summit tiltmeters recorded a summit seismic swarm of more than 80 earthquakes during 1500-1800 on 21 September, which occurred about 1.5 km below Halema’uma’u; a majority of these were less than Mw 2. By 22 September the active part of the lava lake was infilled about 2 m. On 23 September the western vent areas exhibited several small spatter cones with incandescent openings, along with weak, sporadic spattering (figure 522). The sulfur dioxide emission rate ranged from 930 t/d to 2,000 t/d, the higher of which was measured on 6 September.
Activity during October 2022. Activity during October declined slightly compared to previous months, though lava effusions persisted from the western vent into the active lava lake and onto the crater floor during October (figure 523). Slight variations in the lava lake were noted throughout the month. HVO reported that around 0600 on 3 October the level of the lava lake has lowered slightly. Overflight measurements taken on 5 October indicated that the crater floor was infilled a total of about 143 m and that 111 million cubic meters of lava had been effused since September 2021. During 6-7 October the lake gradually rose 0.5 m. Sulfur dioxide measurements made on 22 October had an emission rate of 700 t/d. Another overflight taken on 28 October showed that there was little to no change in the elevation of the crater floor: the crater floor was infilled a total of 143 m and 111 million cubic meters of lava had erupted since the start of the eruption.
Activity during November 2022. Activity remained low during November, though HVO reported that lava from the western vent continued to effuse into the active lava lake and onto the crater floor throughout the month. The rate of sulfur dioxide emissions during November ranged from 300-600 t/d, the higher amount of which occurred on 9 November.
Activity during December 2022. Similar low activity was reported during December, with lava effusing from the western vent into the active lava lake and onto the crater floor. During 4-5 December the active part of the lava lake was slightly variable in elevation and fluctuated within 1 m. On 9 December HVO reported that lava was no longer erupting from the western vent in the Halema’uma’u crater and that sulfur dioxide emissions had returned to near pre-eruption background levels; during 10-11 December, the lava lake had completely crusted over, and no incandescence was visible (figure 524). Time lapse camera images covering the 4-10 December showed that the crater floor showed weak deflation and no inflation. Some passive events of crustal overturning were reported during 14-15 December, which brought fresh incandescent lava to the lake surface. The sulfur dioxide emission rate was approximately 200 t/d on 14 December. A smaller overturn event on 17 December and another that occurred around 0000 and into the morning of 20 December were also detected. A small seismic swarm was later detected on 30 December.
Geologic Background. Kilauea overlaps the E flank of the massive Mauna Loa shield volcano in the island of Hawaii. Eruptions are prominent in Polynesian legends; written documentation since 1820 records frequent summit and flank lava flow eruptions interspersed with periods of long-term lava lake activity at Halemaumau crater in the summit caldera until 1924. The 3 x 5 km caldera was formed in several stages about 1,500 years ago and during the 18th century; eruptions have also originated from the lengthy East and Southwest rift zones, which extend to the ocean in both directions. About 90% of the surface of the basaltic shield volcano is formed of lava flows less than about 1,100 years old; 70% of the surface is younger than 600 years. The long-term eruption from the East rift zone between 1983 and 2018 produced lava flows covering more than 100 km2, destroyed hundreds of houses, and added new coastline.
Information Contacts: Hawaiian Volcano Observatory (HVO), U.S. Geological Survey, PO Box 51, Hawai'i National Park, HI 96718, USA (URL: http://hvo.wr.usgs.gov/).
Nyamulagira (DR Congo) — November 2023 Cite this Report
Nyamulagira
DR Congo
1.408°S, 29.2°E; summit elev. 3058 m
All times are local (unless otherwise noted)
Lava flows and thermal activity during May-October 2023
Nyamulagira (also known as Nyamuragira) is a shield volcano in the Democratic Republic of Congo with the summit truncated by a small 2 x 2.3 km caldera with walls up to about 100 m high. Documented eruptions have occurred within the summit caldera, as well as from numerous flank fissures and cinder cones. The current eruption period began in April 2018 and has more recently been characterized by summit crater lava flows and thermal activity (BGVN 48:05). This report describes lava flows and variable thermal activity during May through October 2023, based on information from the Observatoire Volcanologique de Goma (OVG) and various satellite data.
Lava lake activity continued during May. The MIROVA (Middle InfraRed Observation of Volcanic Activity) system recorded moderate-to-strong thermal activity throughout the reporting period; activity was more intense during May and October and relatively weaker from June through September (figure 95). The MODVOLC thermal algorithm, detected a total of 209 thermal alerts. There were 143 hotspots detected during May, eight during June, nine during September, and 49 during October. This activity was also reflected in infrared satellite images, where a lava flow was visible in the NW part of the crater on 7 May and strong activity was seen in the center of the crater on 4 October (figure 96). Another infrared satellite image taken on 12 May showed still active lava flows along the NW margin of the crater. According to OVG lava effusions were active during 7-29 May and moved to the N and NW parts of the crater beginning on 9 May. Strong summit crater incandescence was visible from Goma (27 km S) during the nights of 17, 19, and 20 May (figure 97). On 17 May there was an increase in eruptive activity, which peaked at 0100 on 20 May. Notable sulfur dioxide plumes drifted NW and W during 19-20 May (figure 98). Drone footage acquired in partnership with the USGS (United States Geological Survey) on 20 May captured images of narrow lava flows that traveled about 100 m down the W flank (figure 99). Data from the Rumangabo seismic station indicated a decreasing trend in activity during 17-21 May. Although weather clouds prevented clear views of the summit, a strong thermal signature on the NW flank was visible in an infrared satellite image on 22 May, based on an infrared satellite image. On 28 May the lava flows on the upper W flank began to cool and solidify. By 29 May seismicity returned to levels similar to those recorded before the 17 May increase. Lava effusion continued but was confined to the summit crater; periodic crater incandescence was observed.
Low-level activity was noted during June through October. On 1 June OVG reported that seismicity remained at lower levels and that crater incandescence had been absent for three days, though infrared satellite imagery showed continued lava effusion in the summit crater. The lava flows on the flanks covered an estimated 0.6 km2. Satellite imagery continued to show thermal activity confined to the lava lake through October (figure 96), although no lava flows or significant sulfur dioxide emissions were reported.
Geologic Background. Africa's most active volcano, Nyamulagira (also known as Nyamuragira), is a massive high-potassium basaltic shield about 25 km N of Lake Kivu and 13 km NNW of the steep-sided Nyiragongo volcano. The summit is truncated by a small 2 x 2.3 km caldera that has walls up to about 100 m high. Documented eruptions have occurred within the summit caldera, as well as from the numerous flank fissures and cinder cones. A lava lake in the summit crater, active since at least 1921, drained in 1938, at the time of a major flank eruption. Recent lava flows extend down the flanks more than 30 km from the summit as far as Lake Kivu; extensive lava flows from this volcano have covered 1,500 km2 of the western branch of the East African Rift.
Information Contacts: Observatoire Volcanologique de Goma (OVG), Departement de Geophysique, Centre de Recherche en Sciences Naturelles, Lwiro, D.S. Bukavu, DR Congo; Hawai'i Institute of Geophysics and Planetology (HIGP) - MODVOLC Thermal Alerts System, School of Ocean and Earth Science and Technology (SOEST), Univ. of Hawai'i, 2525 Correa Road, Honolulu, HI 96822, USA (URL: http://modis.higp.hawaii.edu/); MIROVA (Middle InfraRed Observation of Volcanic Activity), a collaborative project between the Universities of Turin and Florence (Italy) supported by the Centre for Volcanic Risk of the Italian Civil Protection Department (URL: http://www.mirovaweb.it/); NASA Global Sulfur Dioxide Monitoring Page, Atmospheric Chemistry and Dynamics Laboratory, NASA Goddard Space Flight Center (NASA/GSFC), 8800 Greenbelt Road, Goddard, Maryland, USA (URL: https://so2.gsfc.nasa.gov/); Copernicus Browser, Copernicus Data Space Ecosystem, European Space Agency (URL: https://dataspace.copernicus.eu/browser/); Charles Balagizi, Goma Volcano Observatory, Departement de Geophysique, Centre de Recherche en Sciences Naturelles, Lwiro, D.S. Bukavu, DR Congo.
Bagana (Papua New Guinea) — October 2023 Cite this Report
Bagana
Papua New Guinea
6.137°S, 155.196°E; summit elev. 1855 m
All times are local (unless otherwise noted)
Explosions, ash plumes, ashfall, and lava flows during April-September 2023
The remote volcano of Bagana is located in central Bougainville Island, Papua New Guinea. Recorded eruptions date back to 1842 and activity has consisted of effusive activity that has built a small lava dome in the summit crater and occasional explosions that produced pyroclastic flows. The most recent eruption has been ongoing since February 2000 and has produced occasional explosions, ash plumes, and lava flows. More recently, activity has been characterized by ongoing effusive activity and ash emissions (BGVN 48:04). This report updates activity from April through September 2023 that has consisted of explosions, ash plumes, ashfall, and lava flows, using information from the Darwin Volcanic Ash Advisory Center (VAAC) and satellite data.
An explosive eruption was reported on 7 July that generated a large gas-and-ash plume to high altitudes and caused significant ashfall in local communities; the eruption plume had reached upper tropospheric (16-18 km altitude) altitudes by 2200, according to satellite images. Sulfur dioxide plumes were detected in satellite images on 8 July and indicated that the plume was likely a mixture of gas, ice, and ash. A report issued by the Autonomous Bougainville Government (ABG) (Torokina District, Education Section) on 10 July noted that significant ash began falling during 2000-2100 on 7 July and covered most areas in the Vuakovi, Gotana (9 km SW), Koromaketo, Laruma (25 km W) and Atsilima (27 km NW) villages. Pyroclastic flows also occurred, according to ground-based reports; small deposits confined to one drainage were inspected by RVO during an overflight on 17 July and were confirmed to be from the 7 July event. Ashfall continued until 10 July and covered vegetation, which destroyed bushes and gardens and contaminated rivers and streams.
RVO reported another eruption on 14 July. The Darwin VAAC stated that an explosive event started around 0830 on 15 July and produced an ash plume that rose to 16.5 km altitude by 1000 and drifted N, according to satellite images. The plume continued to drift N and remained visible through 1900, and by 2150 it had dissipated.
Ashfall likely from both the 7 and 15 July events impacted about 8,111 people in Torokina (20 km SW), including Tsito/Vuakovi, Gotana, Koromaketo, Kenaia, Longkogari, Kenbaki, Piva (13 km SW), and Atsinima, and in the Tsitovi district, according to ABG. Significant ashfall was also reported in Ruruvu (22 km N) in the Wakunai District of Central Bougainville, though the thickness of these deposits could not be confirmed. An evacuation was called for the villages in Wakunai, where heavy ashfall had contaminated water sources; the communities of Ruruvu, Togarau, Kakarapaia, Karauturi, Atao, and Kuritaturi were asked to evacuate to a disaster center at the Wakunai District Station, and communities in Torokina were asked to evacuate to the Piva District station. According to a news article, more than 7,000 people needed temporary accommodations, with about 1,000 people in evacuation shelters. Ashfall had deposited over a broad area, contaminating water supplies, affecting crops, and collapsing some roofs and houses in rural areas. Schools were temporarily shut down. Intermittent ash emissions continued through the end of July and drifted NNW, NW, and SW. Fine ashfall was reported on the coast of Torokina, and ash plumes also drifted toward Laruma and Atsilima.
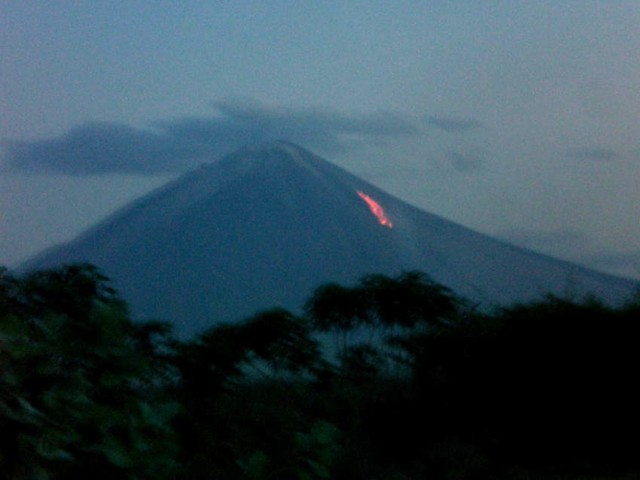
A small explosive eruption occurred at 2130 on 28 July that ejected material from the crater vents, according to reports from Torokina, in addition to a lava flow that contained two lobes. A second explosion was detected at 2157. Incandescence from the lava flow was visible from Piva as it descended the W flank around 2000 on 29 July (figure 47). The Darwin VAAC reported that a strong thermal anomaly was visible in satellite images during 30-31 July and that ash emissions rose to 2.4 km altitude and drifted WSW on 30 July. A ground report from RVO described localized emissions at 0900 on 31 July.
The Darwin VAAC reported that ash plumes were identified in satellite imagery at 0800 and 1220 on 12 August and rose to 2.1 km and 3 km altitude and drifted NW and W, respectively. A news report stated that aid was sent to more than 6,300 people that were adversely affected by the eruption. Photos taken during 17-19 August showed ash emissions rising no higher than 1 km above the summit and drifting SE. A small explosion generated an ash plume during the morning of 19 August. Deposits from small pyroclastic flows were also captured in the photos. Satellite images captured lava flows and pyroclastic flow deposits. Two temporary seismic stations were installed near Bagana on 17 August at distances of 7 km WSW (Vakovi station) and 11 km SW (Kepox station). The Kepox station immediately started to record continuous, low-frequency background seismicity.
Satellite data. Little to no thermal activity was detected during April through mid-July 2023; only one anomaly was recorded during early April and one during early June, according to MIROVA (Middle InfraRed Observation of Volcanic Activity) data (figure 48). Thermal activity increased in both power and frequency during mid-July through September, although there were still some short gaps in detected activity. MODVOLC also detected increased thermal activity during August; thermal hotspots were detected a total of five times on 19, 20, and 27 August. Weak thermal anomalies were also captured in infrared satellite images on clear weather days throughout the reporting period on 7, 12, and 17 April, 27 May, 1, 6, 16, and 31 July, and 19 September (figure 48); a strong thermal anomaly was visible on 31 July. Distinct sulfur dioxide plumes that drifted generally NW were intermittently captured by the TROPOMI instrument on the Sentinel-5P satellite and sometimes exceeded two Dobson Units (DUs) (figure 49).
Geologic Background. Bagana volcano, in a remote portion of central Bougainville Island, is frequently active. This massive symmetrical cone was largely constructed by an accumulation of viscous andesitic lava flows. The entire edifice could have been constructed in about 300 years at its present rate of lava production. Eruptive activity is characterized by non-explosive effusion of viscous lava that maintains a small lava dome in the summit crater, although occasional explosive activity produces pyroclastic flows. Lava flows with tongue-shaped lobes up to 50 m thick and prominent levees descend the flanks on all sides.
Information Contacts: Rabaul Volcano Observatory (RVO), Geohazards Management Division, Department of Mineral Policy and Geohazards Management (DMPGM), PO Box 3386, Kokopo, East New Britain Province, Papua New Guinea; Darwin Volcanic Ash Advisory Centre (VAAC), Bureau of Meteorology, Northern Territory Regional Office, PO Box 40050, Casuarina, NT 0811, Australia (URL: http://www.bom.gov.au/info/vaac/); MIROVA (Middle InfraRed Observation of Volcanic Activity), a collaborative project between the Universities of Turin and Florence (Italy) supported by the Centre for Volcanic Risk of the Italian Civil Protection Department (URL: http://www.mirovaweb.it/); Hawai'i Institute of Geophysics and Planetology (HIGP) - MODVOLC Thermal Alerts System, School of Ocean and Earth Science and Technology (SOEST), Univ. of Hawai'i, 2525 Correa Road, Honolulu, HI 96822, USA (URL: http://modis.higp.hawaii.edu/); NASA Global Sulfur Dioxide Monitoring Page, Atmospheric Chemistry and Dynamics Laboratory, NASA Goddard Space Flight Center (NASA/GSFC), 8800 Greenbelt Road, Goddard, Maryland, USA (URL: https://so2.gsfc.nasa.gov/); Copernicus Browser, Copernicus Data Space Ecosystem, European Space Agency (URL: https://dataspace.copernicus.eu/browser/); Autonomous Bougainville Government, P.O Box 322, Buka, AROB, PNG (URL: https://abg.gov.pg/); Andrew Tupper (Twitter: @andrewcraigtupp); Simon Carn, Geological and Mining Engineering and Sciences, Michigan Technological University, 1400 Townsend Drive, Houghton, MI 49931, USA (URL: http://www.volcarno.com/, Twitter: @simoncarn); Radio NZ (URL: https://www.rnz.co.nz/news/pacific/494464/more-than-7-000-people-in-bougainville-need-temporary-accommodation-after-eruption); USAID, 1300 Pennsylvania Ave, NW, Washington DC 20004, USA (URL: https://www.usaid.gov/pacific-islands/press-releases/aug-08-2023-united-states-provides-immediate-emergency-assistance-support-communities-affected-mount-bagana-volcanic-eruptions).
Mayon (Philippines) — October 2023 Cite this Report
Mayon
Philippines
13.257°N, 123.685°E; summit elev. 2462 m
All times are local (unless otherwise noted)
Lava flows, pyroclastic flows, ash emissions, and seismicity during April-September 2023
Mayon is located in the Philippines and has steep upper slopes capped by a small summit crater. Historical eruptions date back to 1616 CE that have been characterized by Strombolian eruptions, lava flows, pyroclastic flows, and mudflows. Eruptions mostly originated from a central conduit. Pyroclastic flows and mudflows have commonly descended many of the approximately 40 drainages that surround the volcano. The most recent eruption occurred during June through October 2022 and consisted of lava dome growth and gas-and-steam emissions (BGVN 47:12). A new eruption was reported during late April 2023 and has included lava flows, pyroclastic density currents, ash emissions, and seismicity. This report covers activity during April through September 2023 based on daily bulletins from the Philippine Institute of Volcanology and Seismology (PHIVOLCS).
During April through September 2023, PHIVOLCS reported near-daily rockfall events, frequent volcanic earthquakes, and sulfur dioxide measurements. Gas-and-steam emissions rose 100-900 m above the crater and drifted in different directions. Nighttime crater incandescence was often visible during clear weather and was accompanied by incandescent avalanches of material. Activity notably increased during June when lava flows were reported on the S, SE, and E flanks (figure 52). The MIROVA graph (Middle InfraRed Observation of Volcanic Activity) showed strong thermal activity coincident with these lava flows, which remained active through September (figure 53). According to the MODVOLC thermal algorithm, a total of 110 thermal alerts were detected during the reporting period: 17 during June, 40 during July, 27 during August, and 26 during September. During early June, pyroclastic density currents (PDCs) started to occur more frequently.
Low activity was reported during much of April and May; gas-and-steam emissions rose 100-900 m above the crater and generally drifted in different directions. A total of 52 rockfall events and 18 volcanic earthquakes were detected during April and 147 rockfall events and 13 volcanic events during May. Sulfur dioxide flux measurements ranged between 400-576 tons per day (t/d) during April, the latter of which was measured on 29 April and between 162-343 t/d during May, the latter of which was measured on 13 May.
Activity during June increased, characterized by lava flows, pyroclastic density currents (PDCs), crater incandescence and incandescent rockfall events, gas-and-steam emissions, and continued seismicity. Weather clouds often prevented clear views of the summit, but during clear days, moderate gas-and-steam emissions rose 100-2,500 m above the crater and drifted in multiple directions. A total of 6,237 rockfall events and 288 volcanic earthquakes were detected. The rockfall events often deposited material on the S and SE flanks within 700-1,500 m of the summit crater and ash from the events drifted SW, S, SE, NE, and E. Sulfur dioxide emissions ranged between 149-1,205 t/d, the latter of which was measured on 10 June. Short-term observations from EDM and electronic tiltmeter monitoring indicated that the upper slopes were inflating since February 2023. Longer-term ground deformation parameters based on EDM, precise leveling, continuous GPS, and electronic tilt monitoring indicated that the volcano remained inflated, especially on the NW and SE flanks. At 1000 on 5 June the Volcano Alert Level (VAL) was raised to 2 (on a 0-5 scale). PHIVOLCS noted that although low-level volcanic earthquakes, ground deformation, and volcanic gas emissions indicated unrest, the steep increase in rockfall frequency may indicate increased dome activity.
A total of 151 dome-collapse PDCs occurred during 8-9 and 11-30 June, traveled 500-2,000 m, and deposited material on the S flank within 2 km of the summit crater. During 8-9 June the VAL was raised to 3. At approximately 1947 on 11 June lava flow activity was reported; two lobes traveled within 500 m from the crater and deposited material on the S (Mi-isi), SE (Bonga), and E (Basud) flanks. Weak seismicity accompanied the lava flow and slight inflation on the upper flanks. This lava flow remained active through 30 June, moving down the S and SE flank as far as 2.5 km and 1.8 km, respectively and depositing material up to 3.3 km from the crater. During 15-16 June traces of ashfall from the PDCs were reported in Sitio Buga, Nabonton, City of Ligao and Purok, and San Francisco, Municipality of Guinobatan. During 28-29 June there were two PDCs generated by the collapse of the lava flow front, which generated a light-brown ash plume 1 km high. Satellite monitors detected significant concentrations of sulfur dioxide beginning on 29 June. On 30 June PDCs primarily affected the Basud Gully on the E flank, the largest of which occurred at 1301 and lasted eight minutes, based on the seismic record. Four PDCs generated between 1800 and 2000 that lasted approximately four minutes each traveled 3-4 km on the E flank and generated an ash plume that rose 1 km above the crater and drifted N and NW. Ashfall was recorded in Tabaco City.
Similar strong activity continued during July; slow lava effusion remained active on the S and SE flanks and traveled as far as 2.8 km and 2.8 km, respectively and material was deposited as far as 4 km from the crater. There was a total of 6,983 rockfall events and 189 PDCs that affected the S, SE, and E flanks. The volcano network detected a total of 2,124 volcanic earthquakes. Continuous gas-and-steam emissions rose 200-2,000 m above the crater and drifted in multiple directions. Sulfur dioxide emissions averaged 792-4,113 t/d, the latter of which was measured on 28 July. During 2-4 July three PDCs were generated from the collapse of the lava flow and resulting light brown plumes rose 200-300 m above the crater. Continuous tremor pulses were reported beginning at 1547 on 3 July through 7 July at 1200, at 2300 on 8 July and going through 0300 on 10 July, and at 2300 on 16 July, as recorded by the seismic network. During 6-9 July there were 10 lava flow-collapse-related PDCs that generated light brown plumes 300-500 m above the crater. During 10-11 July light ashfall was reported in some areas of Mabinit, Legazpi City, Budiao and Salvacion, Daraga, and Camalig, Albay. By 18 July the lava flow advanced 600 m on the E flank as well.
During 1733 on 18 July and 0434 on 19 July PHIVOLCS reported 30 “ashing” events, which are degassing events accompanied by audible thunder-like sounds and entrained ash at the crater, which produced short, dark plumes that drifted SW. These events each lasted 20-40 seconds, and plume heights ranged from 150-300 m above the crater, as recorded by seismic, infrasound, visual, and thermal monitors. Three more ashing events occurred during 19-20 July. Short-term observations from electronic tilt and GPS monitoring indicate deflation on the E lower flanks in early July and inflation on the NW middle flanks during the third week of July. Longer-term ground deformation parameters from EDM, precise leveling, continuous GPS, and electronic tilt monitoring indicated that the volcano was still generally inflated relative to baseline levels. A short-lived lava pulse lasted 28 seconds at 1956 on 21 July, which was accompanied by seismic and infrasound signals. By 22 July, the only lava flow that remained active was on the SE flank, and continued to extend 3.4 km, while those on the S and E flanks weakened markedly. One ashing event was detected during 30-31 July, whereas there were 57 detected during 31 July-1 August; according to PHIVOLCS beginning at approximately 1800 on 31 July eruptive activity was dominated by phases of intermittent ashing, as well as increased in the apparent rates of lava effusion from the summit crater. The ashing phases consisted of discrete events recorded as low-frequency volcanic earthquakes (LFVQ) typically 30 seconds in duration, based on seismic and infrasound signals. Gray ash plume rose 100 m above the crater and generally drifted NE. Shortly after these ashing events began, new lava began to effuse rapidly from the crater, feeding the established flowed on the SE, E, and E flanks and generating frequent rockfall events.
Intensified unrest persisted during August. There was a total of 4,141 rockfall events, 2,881 volcanic earthquakes, which included volcanic tremor events, 32 ashing events, and 101 PDCs detected throughout the month. On clear weather days, gas-and-steam emissions rose 300-1,500 m above the crater and drifted in different directions (figure 54). Sulfur dioxide emissions averaged 735-4,756 t/d, the higher value of which was measured on 16 August. During 1-2 August the rate of lava effusion decreased, but continued to feed the flows on the SE, S, and E flanks, maintaining their advances to 3.4 km, 2.8 km, and 1.1 km from the crater, respectively (figure 55). Rockfall and PDCs generated by collapses at the lava flow margins and from the summit dome deposited material within 4 km of the crater. During 3-4 August there were 10 tremor events detected that lasted 1-4 minutes. Short-lived lava pulse lasted 35 seconds and was accompanied by seismic and infrasound signals at 0442 on 6 August. Seven collapses were recorded at the front of the lava flow during 12-14 August.
During September, similar activity of slow lava effusion, PDCs, gas-and-steam emissions, and seismicity continued. There was a total of 4,452 rockfall events, 329 volcanic earthquakes, which included volcanic tremor events, two ashing events, and 85 PDCs recorded throughout the month. On clear weather days, gas-and-steam emissions rose 100-1,500 m above the crater and drifted in multiple directions. Sulfur dioxide emissions averaged 609-2,252 t/d, the higher average of which was measured on 6 September. Slow lava effusion continued advancing on the SE, S, and E flanks, maintaining lengths of 3.4 km, 2.8 km, and 1.1 km, respectively. Rockfall and PDC events generated by collapses along the lava flow margins and at the summit dome deposited material within 4 km of the crater.
Geologic Background. Symmetrical Mayon, which rises above the Albay Gulf NW of Legazpi City, is the most active volcano of the Philippines. The steep upper slopes are capped by a small summit crater. Recorded eruptions since 1616 CE range from Strombolian to basaltic Plinian, with cyclical activity beginning with basaltic eruptions, followed by longer periods of andesitic lava flows. Eruptions occur predominately from the central conduit and have also produced lava flows that travel far down the flanks. Pyroclastic density currents and mudflows have commonly swept down many of the approximately 40 ravines that radiate from the summit and have often damaged populated lowland areas. A violent eruption in 1814 killed more than 1,200 people and devastated several towns.
Information Contacts: Philippine Institute of Volcanology and Seismology (PHIVOLCS), Department of Science and Technology, University of the Philippines Campus, Diliman, Quezon City, Philippines (URL: http://www.phivolcs.dost.gov.ph/); MIROVA (Middle InfraRed Observation of Volcanic Activity), a collaborative project between the Universities of Turin and Florence (Italy) supported by the Centre for Volcanic Risk of the Italian Civil Protection Department (URL: http://www.mirovaweb.it/); Hawai'i Institute of Geophysics and Planetology (HIGP) - MODVOLC Thermal Alerts System, School of Ocean and Earth Science and Technology (SOEST), Univ. of Hawai'i, 2525 Correa Road, Honolulu, HI 96822, USA (URL: http://modis.higp.hawaii.edu/); Copernicus Browser, Copernicus Data Space Ecosystem, European Space Agency (URL: https://dataspace.copernicus.eu/browser/); William Rogers, Legazpi City, Albay Province, Philippines.
Nishinoshima (Japan) — October 2023 Cite this Report
Nishinoshima
Japan
27.247°N, 140.874°E; summit elev. 100 m
All times are local (unless otherwise noted)
Eruption plumes and gas-and-steam plumes during May-August 2023
Nishinoshima, located about 1,000 km S of Tokyo, is a small island in the Ogasawara Arc in Japan. The island is the summit of a massive submarine volcano that has prominent submarine peaks to the S, W, and NE. Eruptions date back to 1973 and the current eruption period began in October 2022. Recent activity has consisted of small ash plumes and fumarolic activity (BGVN 48:07). This report covers activity during May through August 2023, using information from monthly reports of the Japan Meteorological Agency (JMA) monthly reports and satellite data.
Activity during May through June was relatively low. The Japan Coast Guard (JCG) did overflights on 14 and 22 June and reported white gas-and-steam emissions rising 600 m and 1,200 m from the central crater of the pyroclastic cone, respectively (figure 125). In addition, multiple white gas-and-steam emissions rose from the inner rim of the W side of the crater and from the SE flank of the pyroclastic cone. Discolored brown-to-green water was observed around almost the entire perimeter of the island; on 22 June light green discolored water was observed off the S coast of the island.
Observations from the Himawari meteorological satellite confirmed an eruption on 9 and 10 July. An eruption plume rose 1.6 km above the crater and drifted N around 1300 on 9 July. Satellite images acquired at 1420 and 2020 on 9 July and at 0220 on 10 July showed continuing emissions that rose 1.3-1.6 km above the crater and drifted NE and N. The Tokyo VAAC reported that an ash plume seen by a pilot and identified in a satellite image at 0630 on 21 July rose to 3 km altitude and drifted S.
Aerial observations conducted by JCG on 8 August showed a white-and-gray plume rising from the central crater of the pyroclastic cone, and multiple white gas-and-steam emissions were rising from the inner edge of the western crater and along the NW-SE flanks of the island (figure 126). Brown-to-green discolored water was also noted around the perimeter of the island.
Intermittent low-to-moderate power thermal anomalies were recorded in the MIROVA graph (Middle InfraRed Observation of Volcanic Activity), showing an increase in both frequency and power beginning in July (figure 127). This increase in activity coincides with eruptive activity on 9 and 10 July, characterized by eruption plumes. According to the MODVOLC thermal alert algorithm, one thermal hotspot was recorded on 20 July. Weak thermal anomalies were also detected in infrared satellite imagery, accompanied by strong gas-and-steam plumes (figure 128).
Geologic Background. The small island of Nishinoshima was enlarged when several new islands coalesced during an eruption in 1973-74. Multiple eruptions that began in 2013 completely covered the previous exposed surface and continued to enlarge the island. The island is the summit of a massive submarine volcano that has prominent peaks to the S, W, and NE. The summit of the southern cone rises to within 214 m of the ocean surface 9 km SSE.
Information Contacts: Japan Meteorological Agency (JMA), 1-3-4 Otemachi, Chiyoda-ku, Tokyo 100-8122, Japan (URL: http://www.jma.go.jp/jma/indexe.html); Tokyo Volcanic Ash Advisory Center (VAAC), 1-3-4 Otemachi, Chiyoda-ku, Tokyo 100-8122, Japan (URL: http://ds.data.jma.go.jp/svd/vaac/data/); MIROVA (Middle InfraRed Observation of Volcanic Activity), a collaborative project between the Universities of Turin and Florence (Italy) supported by the Centre for Volcanic Risk of the Italian Civil Protection Department (URL: http://www.mirovaweb.it/); Copernicus Browser, Copernicus Data Space Ecosystem, European Space Agency (URL: https://dataspace.copernicus.eu/browser/).
Krakatau (Indonesia) — October 2023 Cite this Report
Krakatau
Indonesia
6.1009°S, 105.4233°E; summit elev. 285 m
All times are local (unless otherwise noted)
White gas-and-steam plumes and occasional ash plumes during May-August 2023
Krakatau is located in the Sunda Strait between Java and Sumatra, Indonesia. Caldera collapse during the catastrophic 1883 eruption destroyed Danan and Perbuwatan cones and left only a remnant of Rakata. The post-collapse cone of Anak Krakatau (Child of Krakatau) was constructed within the 1883 caldera at a point between the former Danan and Perbuwatan cones; it has been the site of frequent eruptions since 1927. The current eruption period began in May 2021 and has recently consisted of Strombolian eruptions and ash plumes (BGVN 48:07). This report describes lower levels of activity consisting of ash and white gas-and-steam plumes during May through August 2023, based on information provided by the Indonesian Center for Volcanology and Geological Hazard Mitigation, referred to as Pusat Vulkanologi dan Mitigasi Bencana Geologi (PVMBG), MAGMA Indonesia, and satellite data.
Activity was relatively low during May and June. Daily white gas-and-steam emissions rose 25-200 m above the crater and drifted in different directions. Five ash plumes were detected at 0519 on 10 May, 1241 on 11 May, 0920 on 12 May, 2320 on 12 May, and at 0710 on 13 May, and rose 1-2.5 km above the crater and drifted SW. A webcam image taken on 12 May showed ejection of incandescent material above the vent. A total of nine ash plumes were detected during 6-11 June: at 1434 and 00220 on 6 and 7 June the ash plumes rose 500 m above the crater and drifted NW, at 1537 on 8 June the ash plume rose 1 km above the crater and drifted SW, at 0746 and at 0846 on 9 June the ash plumes rose 800 m and 3 km above the crater and drifted SW, respectively, at 0423, 1431, and 1750 on 10 June the ash plumes rose 2 km, 1.5 km, and 3.5 km above the crater and drifted NW, respectively, and at 0030 on 11 June an ash plume rose 2 km above the crater and drifted NW. Webcam images taken on 10 and 11 June at 0455 and 0102, respectively, showed incandescent material ejected above the vent. On 19 June an ash plume at 0822 rose 1.5 km above the crater and drifted SE.
Similar low activity of white gas-and-steam emissions and few ash plumes were reported during July and August. Daily white gas-and-steam emissions rose 25-300 m above the crater and drifted in multiple directions. Three ash plumes were reported at 0843, 0851, and 0852 on 20 July that rose 500-2,000 m above the crater and drifted NW.
The MIROVA (Middle InfraRed Observation of Volcanic Activity) graph of MODIS thermal anomaly data showed intermittent low-to-moderate power thermal anomalies during May through August 2023 (figure 140). Although activity was often obscured by weather clouds, a thermal anomaly was visible in an infrared satellite image of the crater on 12 May, accompanied by an eruption plume that drifted SW (figure 141).
Geologic Background. The renowned Krakatau (frequently mis-named as Krakatoa) volcano lies in the Sunda Strait between Java and Sumatra. Collapse of an older edifice, perhaps in 416 or 535 CE, formed a 7-km-wide caldera. Remnants of that volcano are preserved in Verlaten and Lang Islands; subsequently the Rakata, Danan, and Perbuwatan cones were formed, coalescing to create the pre-1883 Krakatau Island. Caldera collapse during the catastrophic 1883 eruption destroyed Danan and Perbuwatan, and left only a remnant of Rakata. This eruption caused more than 36,000 fatalities, most as a result of tsunamis that swept the adjacent coastlines of Sumatra and Java. Pyroclastic surges traveled 40 km across the Sunda Strait and reached the Sumatra coast. After a quiescence of less than a half century, the post-collapse cone of Anak Krakatau (Child of Krakatau) was constructed within the 1883 caldera at a point between the former Danan and Perbuwatan cones. Anak Krakatau has been the site of frequent eruptions since 1927.
Information Contacts: Pusat Vulkanologi dan Mitigasi Bencana Geologi (PVMBG, also known as Indonesian Center for Volcanology and Geological Hazard Mitigation, CVGHM), Jalan Diponegoro 57, Bandung 40122, Indonesia (URL: http://www.vsi.esdm.go.id/); MAGMA Indonesia, Kementerian Energi dan Sumber Daya Mineral (URL: https://magma.esdm.go.id/v1); MIROVA (Middle InfraRed Observation of Volcanic Activity), a collaborative project between the Universities of Turin and Florence (Italy) supported by the Centre for Volcanic Risk of the Italian Civil Protection Department (URL: http://www.mirovaweb.it/); Copernicus Browser, Copernicus Data Space Ecosystem, European Space Agency (URL: https://dataspace.copernicus.eu/browser/).
Villarrica (Chile) — October 2023 Cite this Report
Villarrica
Chile
39.42°S, 71.93°W; summit elev. 2847 m
All times are local (unless otherwise noted)
Strombolian activity, gas-and-ash emissions, and crater incandescence during April-September 2023
Villarrica, in central Chile, consists of a 2-km-wide caldera that formed about 3,500 years ago and is located at the base of the presently active cone at the NW margin of a 6-km-wide caldera. Historical eruptions eruptions date back to 1558 and have been characterized by mild-to-moderate explosive activity with occasional lava effusions. The current eruption period began in December 2014 and has recently consisted of nighttime crater incandescence, ash emissions, and seismicity (BGVN 48:04). This report covers activity during April through September 2023 and describes occasional Strombolian activity, gas-and-ash emissions, and nighttime crater incandescence. Information for this report primarily comes from the Southern Andes Volcano Observatory (Observatorio Volcanológico de Los Andes del Sur, OVDAS), part of Chile's National Service of Geology and Mining (Servicio Nacional de Geología y Minería, SERNAGEOMIN) and satellite data.
Seismicity during April consisted of long period (LP) events and tremor (TRE); a total of 9,413 LP-type events and 759 TR-type events were detected throughout the month. Nighttime crater incandescence persisted and was visible in the degassing column. Sulfur dioxide data was obtained using Differential Absorption Optical Spectroscopy Equipment (DOAS) that showed an average value of 1,450 ± 198 tons per day (t/d) during 1-15 April and 1,129 ± 201 t/d during 16-30 April, with a maximum daily value of 2,784 t/d on 9 April. Gas-and-steam emissions of variable intensities rose above the active crater as high as 1.3 km above the crater on 13 April. Strombolian explosions were not observed and there was a slight decrease in the lava lake level.
There were 14,123 LP-type events and 727 TR-type events detected during May. According to sulfur dioxide measurements taken with DOAS equipment, the active crater emitted an average value of 1,826 ± 482 t/d during 1-15 May and 912 ± 41 t/d during 16-30 May, with a daily maximum value of 5,155 t/d on 13 May. Surveillance cameras showed continuous white gas-and-steam emissions that rose as high as 430 m above the crater on 27 May. Nighttime incandescence illuminated the gas column less than 300 m above the crater rim was and no pyroclastic emissions were reported. A landslide was identified on 13 May on the E flank of the volcano 50 m from the crater rim and extending 300 m away; SERNAGEOMIN noted that this event may have occurred on 12 May. During the morning of 27 and 28 May minor Strombolian explosions characterized by incandescent ejecta were recorded at the crater rim; the last reported Strombolian explosions had occurred at the end of March.
Seismic activity during June consisted of five volcano-tectonic (VT)-type events, 21,606 LP-type events, and 2,085 TR-type events. The average value of sulfur dioxide flux obtained by DOAS equipment was 1,420 ± 217 t/d during 1-15 June and 2,562 ± 804 t/d, with a maximum daily value of 4,810 t/d on 17 June. White gas-and-steam emissions rose less than 480 m above the crater; frequent nighttime crater incandescence was reflected in the degassing plume. On 12 June an emission rose 100 m above the crater and drifted NNW. On 15 June one or several emissions resulted in ashfall to the NE as far as 5.5 km from the crater, based on a Skysat satellite image. Several Strombolian explosions occurred within the crater; activity on 15 June was higher energy and ejected blocks 200-300 m on the NE slope. Surveillance cameras showed white gas-and-steam emissions rising 480 m above the crater on 16 June. On 19 and 24 June low-intensity Strombolian activity was observed, ejecting material as far as 200 m from the center of the crater to the E.
During July, seismicity included 29,319 LP-type events, 3,736 TR-type events, and two VT-type events. DOAS equipment recorded two days of sulfur dioxide emissions of 4,220 t/d and 1,009 t/d on 1 and 13 July, respectively. Constant nighttime incandescence was also recorded and was particularly noticeable when accompanied by eruptive columns on 12 and 16 July. Minor explosive events were detected in the crater. According to Skysat satellite images taken on 12, 13, and 16 July, ashfall deposits were identified 155 m S of the crater. According to POVI, incandescence was visible from two vents on the crater floor around 0336 on 12 July. Gas-and-ash emissions rose as high as 1.2 km above the crater on 13 July and drifted E and NW. A series of gas-and-steam pulses containing some ash deposited material on the upper E flank around 1551 on 13 July. During 16-31 July, average sulfur dioxide emissions of 1,679 ± 406 t/d were recorded, with a maximum daily value of 2,343 t/d on 28 July. Fine ash emissions were also reported on 16, 17, and 23 July.
Seismicity persisted during August, characterized by 27,011 LP-type events, 3,323 TR-type events, and three VT-type events. The average value of sulfur dioxide measurements taken during 1-15 August was 1,642 ± 270 t/d and 2,207 ± 4,549 t/d during 16-31 August, with a maximum daily value of 3,294 t/d on 27 August. Nighttime crater incandescence remained visible in degassing columns. White gas-and-steam emissions rose 480 m above the crater on 6 August. According to a Skysat satellite image from 6 August, ash accumulation was observed proximal to the crater and was mainly distributed toward the E slope. White gas-and-steam emissions rose 320 m above the crater on 26 August. Nighttime incandescence and Strombolian activity that generated ash emissions were reported on 27 August.
Seismicity during September was characterized by five VT-type events, 12,057 LP-type events, and 2,058 TR-type events. Nighttime incandescence persisted. On 2 September an ash emission rose 180 m above the crater and drifted SE at 1643 (figure 125) and a white gas-and-steam plume rose 320 m above the crater. According to the Buenos Aires VAAC, periods of continuous gas-and-ash emissions were visible in webcam images from 1830 on 2 September to 0110 on 3 September. Strombolian activity was observed on 2 September and during the early morning of 3 September, the latter event of which generated an ash emission that rose 60 m above the crater and drifted 100 m from the center of the crater to the NE and SW. Ashfall was reported to the SE and S as far as 750 m from the crater. The lava lake was active during 3-4 September and lava fountaining was visible for the first time since 26 March 2023, according to POVI. Fountains captured in webcam images at 2133 on 3 September and at 0054 on 4 September rose as high as 60 m above the crater rim and ejected material onto the upper W flank. Sulfur dioxide flux of 1,730 t/d and 1,281 t/d was measured on 3 and 4 September, respectively, according to data obtained by DOAS equipment.
Strong Strombolian activity and larger gas-and-ash plumes were reported during 18-20 September. On 18 September activity was also associated with energetic LP-type events and notable sulfur dioxide fluxes (as high as 4,277 t/d). On 19 September Strombolian activity and incandescence were observed. On 20 September at 0914 ash emissions rose 50 m above the crater and drifted SSE, accompanied by Strombolian activity that ejected material less than 100 m SSE, causing fall deposits on that respective flank. SERNAGEOMIN reported that a Planet Scope satellite image taken on 20 September showed the lava lake in the crater, measuring 32 m x 35 m and an area of 0.001 km2. Several ash emissions were recorded at 0841, 0910, 1251, 1306, 1312, 1315, and 1324 on 23 September and rose less than 150 m above the crater. The sulfur dioxide flux value was 698 t/d on 23 September and 1,097 t/d on 24 September. On 24 September the Volcanic Alert Level (VAL) was raised to Orange (the third level on a four-color scale). SENAPRED maintained the Alert Level at Yellow (the middle level on a three-color scale) for the communities of Villarrica, Pucón (16 km N), Curarrehue, and Panguipulli.
During 24-25 September there was an increase in seismic energy (observed at TR-events) and acoustic signals, characterized by 1 VT-type event, 213 LP-type events, and 124 TR-type events. Mainly white gas-and-steam emissions, in addition to occasional fine ash emissions were recorded. During the early morning of 25 September Strombolian explosions were reported and ejected material 250 m in all directions, though dominantly toward the NW. On 25 September the average value of sulfur dioxide flux was 760 t/d. Seismicity during 25-30 September consisted of five VT-type events, 1,937 LP-type events, and 456 TR-type events.
During 25-29 September moderate Strombolian activity was observed and ejected material as far as the crater rim. In addition, ash pulses lasting roughly 50 minutes were observed around 0700 and dispersed ENE. During 26-27 September a TR episode lasted 6.5 hours and was accompanied by discrete acoustic signals. Satellite images from 26 September showed a spatter cone on the crater floor with one vent that measured 10 x 14 m and a smaller vent about 35 m NE of the cone. SERNAGEOMIN reported an abundant number of bomb-sized blocks up to 150 m from the crater, as well as impact marks on the snow, which indicated explosive activity. A low-altitude ash emission was observed drifting NW around 1140 on 28 September, based on webcam images. Between 0620 and 0850 on 29 September an ash emission rose 60 m above the crater and drifted NW. During an overflight taken around 1000 on 29 September scientists observed molten material in the vent, a large accumulation of pyroclasts inside the crater, and energetic degassing, some of which contained a small amount of ash. Block-sized pyroclasts were deposited on the internal walls and near the crater, and a distal ash deposit was also visible. The average sulfur dioxide flux measured on 28 September was 344 t/d. Satellite images taken on 29 September ashfall was deposited roughly 3 km WNW from the crater and nighttime crater incandescence remained visible. The average sulfur dioxide flux value from 29 September was 199 t/d. On 30 September at 0740 a pulsating ash emission rose 1.1 km above the crater and drifted NNW (figure 126). Deposits on the S flank extended as far as 4.5 km from the crater rim, based on satellite images from 30 September.
Infrared MODIS satellite data processed by MIROVA (Middle InfraRed Observation of Volcanic Activity) showed intermittent thermal activity during April through September, with slightly stronger activity detected during late September (figure 127). Small clusters of thermal activity were detected during mid-June, early July, early August, and late September. According to the MODVOLC thermal alert system, a total of four thermal hotspots were detected on 7 July and 3 and 23 September. This activity was also intermittently captured in infrared satellite imagery on clear weather days (figure 128).
Geologic Background. The glacier-covered Villarrica stratovolcano, in the northern Lakes District of central Chile, is ~15 km south of the city of Pucon. A 2-km-wide caldera that formed about 3,500 years ago is located at the base of the presently active, dominantly basaltic to basaltic andesite cone at the NW margin of a 6-km-wide Pleistocene caldera. More than 30 scoria cones and fissure vents are present on the flanks. Plinian eruptions and pyroclastic flows that have extended up to 20 km from the volcano were produced during the Holocene. Lava flows up to 18 km long have issued from summit and flank vents. Eruptions documented since 1558 CE have consisted largely of mild-to-moderate explosive activity with occasional lava effusion. Glaciers cover 40 km2 of the volcano, and lahars have damaged towns on its flanks.
Information Contacts: Servicio Nacional de Geología y Minería (SERNAGEOMIN), Observatorio Volcanológico de Los Andes del Sur (OVDAS), Avda Sta María No. 0104, Santiago, Chile (URL: http://www.sernageomin.cl/); Proyecto Observación Villarrica Internet (POVI) (URL: http://www.povi.cl/); Sistema y Servicio Nacional de Prevención y Repuesta Ante Desastres (SENAPRED), Av. Beauchef 1671, Santiago, Chile (URL: https://web.senapred.cl/); Buenos Aires Volcanic Ash Advisory Center (VAAC), Servicio Meteorológico Nacional-Fuerza Aérea Argentina, 25 de mayo 658, Buenos Aires, Argentina (URL: http://www.smn.gov.ar/vaac/buenosaires/inicio.php); MIROVA (Middle InfraRed Observation of Volcanic Activity), a collaborative project between the Universities of Turin and Florence (Italy) supported by the Centre for Volcanic Risk of the Italian Civil Protection Department (URL: http://www.mirovaweb.it/); Hawai'i Institute of Geophysics and Planetology (HIGP) - MODVOLC Thermal Alerts System, School of Ocean and Earth Science and Technology (SOEST), Univ. of Hawai'i, 2525 Correa Road, Honolulu, HI 96822, USA (URL: http://modis.higp.hawaii.edu/); Copernicus Browser, Copernicus Data Space Ecosystem, European Space Agency (URL: https://dataspace.copernicus.eu/browser/).
Merapi (Indonesia) — October 2023 Cite this Report
Merapi
Indonesia
7.54°S, 110.446°E; summit elev. 2910 m
All times are local (unless otherwise noted)
Frequent incandescent avalanches during April-September 2023
Merapi, located just north of the major city of Yogyakarta in central Java, Indonesia, has had activity within the last 20 years characterized by pyroclastic flows and lahars accompanying growth and collapse of the steep-sided active summit lava dome. The current eruption period began in late December 2020 and has more recently consisted of ash plumes, intermittent incandescent avalanches of material, and pyroclastic flows (BGVN 48:04). This report covers activity during April through September 2023, based on information from Balai Penyelidikan dan Pengembangan Teknologi Kebencanaan Geologi (BPPTKG), the Center for Research and Development of Geological Disaster Technology, a branch of PVMBG which specifically monitors Merapi. Additional information comes from the Pusat Vulkanologi dan Mitigasi Bencana Geologi (PVMBG, also known as Indonesian Center for Volcanology and Geological Hazard Mitigation, CVGHM), MAGMA Indonesia, the Darwin Volcanic Ash Advisory Centre (VAAC), and various satellite data.
Activity during April through September 2023 primarily consisted of incandescent avalanches of material that mainly affected the SW and W flanks and traveled as far as 2.3 km from the summit (table 25) and white gas-and-steam emissions that rose 10-1,000 m above the crater.
Table 25. Monthly summary of avalanches and avalanche distances recorded at Merapi during April through September 2023. The number of reported avalanches does not include instances where possible avalanches were heard but could not be visually confirmed as a result of inclement weather. Data courtesy of BPPTKG (April-September 2023 daily reports).
| Month |
Average number of avalanches per day |
Distance avalanches traveled (m) |
| Apr 2023 |
19 |
1,200-2,000 |
| May 2023 |
22 |
500-2,000 |
| Jun 2023 |
18 |
1,200-2,000 |
| Jul 2023 |
30 |
300-2,000 |
| Aug 2023 |
25 |
400-2,300 |
| Sep 2023 |
23 |
600-2,000 |
BPPTKG reported that during April and May white gas-and-steam emissions rose 10-750 m above the crater, incandescent avalanches descended 500-2,000 m on the SW and W flanks (figure 135). Cloudy weather often prevented clear views of the summit, and sometimes avalanches could not be confirmed. According to a webcam image, a pyroclastic flow was visible on 17 April at 0531. During the week of 28 April and 4 May a pyroclastic flow was reported on the SW flank, traveling up to 2.5 km. According to a drone overflight taken on 17 May the SW lava dome volume was an estimated 2,372,800 cubic meters and the dome in the main crater was an estimated 2,337,300 cubic meters.
During June and July similar activity persisted with white gas-and-steam emissions rising 10-350 m above the crater and frequent incandescent avalanches that traveled 300-2,000 m down the SW, W, and S flanks (figure 136). Based on an analysis of aerial photos taken on 24 June the volume of the SW lava dome was approximately 2.5 million cubic meters. A pyroclastic flow was observed on 5 July that traveled 2.7 km on the SW flank. According to the Darwin VAAC multiple minor ash plumes were identified in satellite images on 19 July that rose to 3.7 km altitude and drifted S and SW. During 22, 25, and 26 July a total of 17 avalanches descended as far as 1.8 km on the S flank.
Frequent white gas-and-steam emissions continued during August and September, rising 10-450 m above the crater. Incandescent avalanches mainly affected the SW and W flanks and traveled 400-2,300 m from the vent (figure 137). An aerial survey conducted on 10 August was analyzed and reported that estimates of the SW dome volume was 2,764,300 cubic meters and the dome in the main crater was 2,369,800 cubic meters.
Frequent and moderate-power thermal activity continued throughout the reporting period, according to a MIROVA (Middle InfraRed Observation of Volcanic Activity) analysis of MODIS satellite data (figure 138). There was an increase in the number of detected anomalies during mid-May. The MODVOLC thermal algorithm recorded a total of 47 thermal hotspots: six during April, nine during May, eight during June, 15 during July, four during August, and five during September. Some of this activity was captured in infrared satellite imagery on clear weather days, sometimes accompanied by incandescent material on the SW flank (figure 139).
Geologic Background. Merapi, one of Indonesia's most active volcanoes, lies in one of the world's most densely populated areas and dominates the landscape immediately north of the major city of Yogyakarta. It is the youngest and southernmost of a volcanic chain extending NNW to Ungaran volcano. Growth of Old Merapi during the Pleistocene ended with major edifice collapse perhaps about 2,000 years ago, leaving a large arcuate scarp cutting the eroded older Batulawang volcano. Subsequent growth of the steep-sided Young Merapi edifice, its upper part unvegetated due to frequent activity, began SW of the earlier collapse scarp. Pyroclastic flows and lahars accompanying growth and collapse of the steep-sided active summit lava dome have devastated cultivated lands on the western-to-southern flanks and caused many fatalities.
Information Contacts: Balai Penyelidikan dan Pengembangan Teknologi Kebencanaan Geologi (BPPTKG), Center for Research and Development of Geological Disaster Technology (URL: http://merapi.bgl.esdm.go.id/, Twitter: @BPPTKG); MAGMA Indonesia, Kementerian Energi dan Sumber Daya Mineral (URL: https://magma.esdm.go.id/v1); Pusat Vulkanologi dan Mitigasi Bencana Geologi (PVMBG, also known as Indonesian Center for Volcanology and Geological Hazard Mitigation, CVGHM), Jalan Diponegoro 57, Bandung 40122, Indonesia (URL: http://www.vsi.esdm.go.id/); Darwin Volcanic Ash Advisory Centre (VAAC), Bureau of Meteorology, Northern Territory Regional Office, PO Box 40050, Casuarina, NT 0811, Australia (URL: http://www.bom.gov.au/info/vaac/); MIROVA (Middle InfraRed Observation of Volcanic Activity), a collaborative project between the Universities of Turin and Florence (Italy) supported by the Centre for Volcanic Risk of the Italian Civil Protection Department (URL: http://www.mirovaweb.it/); Hawai'i Institute of Geophysics and Planetology (HIGP) - MODVOLC Thermal Alerts System, School of Ocean and Earth Science and Technology (SOEST), Univ. of Hawai'i, 2525 Correa Road, Honolulu, HI 96822, USA (URL: http://modis.higp.hawaii.edu/); Copernicus Browser, Copernicus Data Space Ecosystem, European Space Agency (URL: https://dataspace.copernicus.eu/browser/); Øystein Lund Andersen (URL: https://www.oysteinlundandersen.com/, https://twitter.com/oysteinvolcano).
Ebeko
Russia
50.686°N, 156.014°E; summit elev. 1103 m
All times are local (unless otherwise noted)
Moderate explosive activity with ash plumes continued during June-November 2023
Ebeko, located on the N end of Paramushir Island in Russia’s Kuril Islands just S of the Kamchatka Peninsula, consists of three summit craters along a SSW-NNE line at the northern end of a complex of five volcanic cones. Observed eruptions date back to the late 18th century and have been characterized as small-to-moderate explosions from the summit crater, accompanied by intense fumarolic activity. The current eruptive period began in June 2022, consisting of frequent explosions, ash plumes, and thermal activity (BGVN 47:10, 48:06). This report covers similar activity during June-November 2023, based on information from the Kamchatka Volcanic Eruptions Response Team (KVERT) and satellite data.
Moderate explosive activity continued during June-November 2023 (figures 50 and 51). According to visual data from Severo-Kurilsk, explosions sent ash 2-3.5 km above the summit (3-4.5 km altitude) during most days during June through mid-September. Activity after mid-September was slightly weaker, with ash usually reaching less than 2 km above the summit. According to KVERT the volcano in October and November was, with a few exceptions, either quiet or obscured by clouds that prevented satellite observations. KVERT issued Volcano Observatory Notices for Aviation (VONA) on 8 and 12 June, 13 and 22 July, 3 and 21 August, and 31 October warning of potential aviation hazards from ash plumes drifting 3-15 km from the volcano. Based on satellite data, KVERT reported a persistent thermal anomaly whenever weather clouds permitted viewing.
Geologic Background. The flat-topped summit of the central cone of Ebeko volcano, one of the most active in the Kuril Islands, occupies the northern end of Paramushir Island. Three summit craters located along a SSW-NNE line form Ebeko volcano proper, at the northern end of a complex of five volcanic cones. Blocky lava flows extend west from Ebeko and SE from the neighboring Nezametnyi cone. The eastern part of the southern crater contains strong solfataras and a large boiling spring. The central crater is filled by a lake about 20 m deep whose shores are lined with steaming solfataras; the northern crater lies across a narrow, low barrier from the central crater and contains a small, cold crescentic lake. Historical activity, recorded since the late-18th century, has been restricted to small-to-moderate explosive eruptions from the summit craters. Intense fumarolic activity occurs in the summit craters, on the outer flanks of the cone, and in lateral explosion craters.
Information Contacts: Kamchatka Volcanic Eruptions Response Team (KVERT), Far Eastern Branch, Russian Academy of Sciences, 9 Piip Blvd., Petropavlovsk-Kamchatsky, 683006, Russia (URL: http://www.kscnet.ru/ivs/kvert/).
Search Bulletin Archive by Publication Date
Select a month and year from the drop-downs and click "Show Issue" to have that issue displayed in this tab.
The default month and year is the latest issue available.
Bulletin of the Global Volcanism Network - Volume 32, Number 11 (November 2007)
Managing Editor: Richard Wunderman
Bezymianny (Russia)
Continued activity May-December 2007 with ash plumes and lava emission
Fuego (Guatemala)
Variable explosive activity continues sporadically, July 2005-December 2006
Irazu (Costa Rica)
Seismicity and degassing remain low, January 2004-September 2007
Lengai, Ol Doinyo (Tanzania)
New lava linked to Plinian eruptions of August-September 2007
Ruapehu (New Zealand)
Additional data on hydrothermal eruption's distribution and damage
Soputan (Indonesia)
Ash plumes and seismic activity continue through November 2007
Suwanosejima (Japan)
Eruptions of July 2005-December 2007 send plumes to varying heights
Bezymianny (Russia) — November 2007 Cite this Report
Bezymianny
Russia
55.972°N, 160.595°E; summit elev. 2882 m
All times are local (unless otherwise noted)
Continued activity May-December 2007 with ash plumes and lava emission
As reported in BGVN 31:11, after a period of moderate volcanic activity following the extensive eruption of 9 May 2006, heightened activity occurred at Bezymianny during December 2006 before returning to moderate activity through early 2007. This report covers the period from May through December 2007. It was drawn mainly from reports of the Kamchatkan Volcanic Eruption Response Team (KVERT).
Based on satellite data from 10 May 2007, KVERT reported that a large thermal anomaly with a temperature of ~ 51°C appeared over Bezymianny's summit lava dome.
At about 0330-0400 on 12 May, an explosive eruption may have occurred, according to seismic data from Kozyrevsk. Ash plumes rose to an altitude of 4 km and were visible on satellite imagery drifting in multiple directions. Ashfall was reported in the town of Klyuchi, a spot ~ 47 km NE of the volcano. On 13 May, an elongated thermal anomaly was seen on satellite imagery to the SE of the dome, which decreased in size through 17 May. That day, hunters saw a large (200 m wide) mudflow along the Sukhaya Khapitsa river.
KVERT reported that Bezymianny seismicity was at background during May-September 2007, but increased in early October. Satellite imagery observations showed a thermal anomaly in the crater on 4, 6, 8, and 11 October; fumarolic activity was observed during 6-7 and 10-11 October. Based on seismic interpretation, a hot avalanche probably occurred on 10 October and small eruptions also occurred on 14 October.
The Tokyo Volcanic Ash Advisory Center (VAAC) reported ash plumes to altitudes of ~ 10 km on 14 October. Those of 15 October reached 7.3-9.1 km altitude and drifted E and SE. A strong thermal anomaly was present in the crater around this time. Slightly elevated seismicity occurred during 16-19 October before returning to background during19-20 October. Based on observations of NOAA satellite images by the Tokyo VAAC, a stripe of ash deposits appeared on the ESE flank by 18 October.
Based on seismicity, KVERT interpreted that a series of explosions or collapses from lava flow fronts occurred on 5 November 2007. Two avalanches and an ash plume were also detected. Satellite imagery revealed a thermal anomaly over the lava dome. According to Aleksei Ozerov, the 5 November activity was caused by dome collapse. This demolished a significant section of the SE dome, involving a total volume of almost 200,000 m3. The collapse produced a debris avalanche that traveled almost 3 km downslope.
According to a TERRA MODIS image on 9 November, a very bright (probably high temperature) gas-steam plume rose to about 35 km altitude. [This unusually tall plume height has not been confirmed.] On 10 November, KVERT reported continued growth of a viscous lava flow from the summit dome.
During an overflight around this time observers saw a 4-km-long deposit on the SE flank laid down by pyroclastic flows on 5 November. Lava flow-front collapses from older lava flows on the SE flank were also evident. Visual observations and video footage analysis indicated that gas-and-steam plumes drifted NE on 9 November and S on 13 November. Based on observations of satellite imagery, the Washington VAAC reported that an ash plume at an altitude of ~6.4 km drifted E on 15 November. Visual observations and video footage showed gas-and-steam plumes on 17 and 18 November.
Seismicity was above background during 19-20 November. A thermal anomaly occurred at the crater during 16-17 and 21 November. An ash plume reached 4.3 km altitude on 2 December. Seismicity was at background through the rest of December, except during 21-25 December, when it again rose. Ash plumes up to 4.5 km altitude and avalanches were registered on 23 December.
A paroxysmal explosive eruption occurred between 0917 and 1020 UTC on 24 December 2007 and a large column rose to ~ 13.0 km altitude. According to satellite data, ash clouds extended from the volcano over 850 km to the NE on 24-25 December. According to KVERT volcanologists, who circled the volcano by helicopter with cameras, this eruption destroyed a part of lava dome.
Geologic Background. The modern Bezymianny, much smaller than its massive neighbors Kamen and Kliuchevskoi on the Kamchatka Peninsula, was formed about 4,700 years ago over a late-Pleistocene lava-dome complex and an edifice built about 11,000-7,000 years ago. Three periods of intensified activity have occurred during the past 3,000 years. The latest period, which was preceded by a 1,000-year quiescence, began with the dramatic 1955-56 eruption. This eruption, similar to that of St. Helens in 1980, produced a large open crater that was formed by collapse of the summit and an associated lateral blast. Subsequent episodic but ongoing lava-dome growth, accompanied by intermittent explosive activity and pyroclastic flows, has largely filled the 1956 crater.
Information Contacts: Olga Girina, Kamchatka Volcanic Eruptions Response Team (KVERT), a cooperative program of the Institute of Volcanic Geology and Geochemistry, Far East Division, Russian Academy of Sciences, Piip Ave. 9, Petropavlovsk-Kamchatsky, 683006, Russia (URL: http://www.kscnet.ru/ivs/eng/), the Kamchatka Experimental and Methodical Seismological Department (KEMSD), GS RAS (Russia), and the Alaska Volcano Observatory (USA); Alaska Volcano Observatory (AVO), cooperative program of the U.S. Geological Survey, 4200 University Drive, Anchorage, AK 99508-4667, USA (URL: http://www.avo.alaska.edu/), the Geophysical Institute, University of Alaska, PO Box 757320, Fairbanks, AK 99775-7320, USA, and the Alaska Division of Geological and Geophysical Surveys, 794 University Ave., Suite 200, Fairbanks, AK 99709, USA; Washington Volcanic Ash Advisory Center (VAAC), Satellite Analysis Branch (SAB), NOAA/NESDIS E/SP23, NOAA Science Center Room 401, 5200 Auth Rd, Camp Springs, MD 20746, USA (URL: http://www.ospo.noaa.gov/Products/atmosphere/vaac/); Hawai'i Institute of Geophysics and Planetology (HIGP) Hot Spots System, University of Hawai'i, 2525 Correa Road, Honolulu, HI 96822, USA (URL: http://modis.higp.hawaii.edu/); Vladivostok Times (URL: http://www.vladivostoktimes.ru/).
Fuego (Guatemala) — November 2007 Cite this Report
Fuego
Guatemala
14.4748°N, 90.8806°W; summit elev. 3799 m
All times are local (unless otherwise noted)
Variable explosive activity continues sporadically, July 2005-December 2006
Fuego was previously discussed in BGVN 30:08. This report discusses ongoing developments at Fuego since July 2005 and through December 2006. In general, the volcano erupts vesicular, olivine-bearing basaltic lava flows. They traveled from the central crater hundreds of meters down the S, SW and W flanks, and the lava flow fronts released occasional blocky avalanches of incandescent material. The latter process is generally omitted from the rest of this report unless the avalanche(s) were particularly noteworthy, as in cases where pyroclastic flows were also noted.
On 17 July 2005, an ash plume ~ 3.5-4 km high accompanied small pyroclastic flows down Santa Teresa and Taniluyá ravines. This activity continued sporadically through October 2005.
From 2-7 November 2005, weak explosions and low ash plumes occurred along with lava flows that traveled down the volcano's S and SW flanks, extending 600 m towards the Taniluyá ravine, and 300 m towards the Cenizas ravine. On 14 November, two lava flows traveled from the S edge of the central crater 150 m toward the Cenizas ravine, and 400 m toward the Taniluyá ravine. A third lava flow traveled 600 m W towards the Santa Teresa ravine. Between 17 and 21 November, lava flows traveled S towards the Cenizas and Taniluyá ravines and W towards Santa Teresa ravine.
On 13 December 2005, two lava flows from Fuego extended 200-300 m W and SW of the central crater. On 27 December 2005 an ash plume rising ~ 7.6 km altitude extended SSW and SSE of the volcano; lava flows traveled ~ 2 km S down Taniluyá ravine, and W down Seca ravine, initially extending ~ 800 m and 1,200 m, respectively.
At 0602 on 27 December, a pyroclastic flow descended S. Ash fell S of the volcano in the port of San Jose. Later that day, lava flows extended 1.2 and 1.3 km, and pyroclastic flows descended 1.8 and 2 km down the Taniluyá and Seca ravines, respectively. Lava flows also traveled W toward Santa Teresa ravine, and SE towards the Jute and Lajas ravines. An ash plume rose ~ 7.6 km, and a small amount of ash fell W and SW of the volcano in the villages of Morelia, Santa Sofía, Los Tarros, and Panimaché (~ 7 km SSW). This activity continued through 29 December with more lava flows and bombs. The emissions hurled incandescent lava clots ~ 75 m high, spawned lava flows, and generated a dark plume rising to ~ 1 km above the crater rim.
January 2006 activity was essentially a continuation of December's with moderate-to-strong explosions and incandescent lava ejecta hurled ~ 40 m high. Explosions could be heard 25-30 km away. The explosions were accompanied by rumbling sounds and acoustic waves that shook windows and doors in villages near the volcano. Ash plumes rose ~ 1 km to ~ 1.5 km. On 22-23 January, there were Strombolian lava ejections rising ~ 100 m above the crater rim accompanied by block avalanches down the SW flank.
During February and March 2006, explosions moderated but activity continued. Weak-to-moderate explosions occurred; shock waves were sometimes felt in villages near the volcano. On 6-7 March, ash emissions up to ~ 4.6 km altitude were visible on satellite imagery.
From 22 through 28 March, Fuego ejected incandescent material up to ~ 50-75 m and gas plumes to ~ 300 m above the crater rim. Short pyroclastic flows from avalanches occurred on the upper flanks. On 28 March, pyroclastic flows traveled ~ 450 m S, and avalanches occurred from the lava-flow fronts.
On 17 April 2006, explosive ejections threw lava ~ 50-75 m above crater rim, and gas plumes rose to ~ 150-200 m. Lava flowed ~ 400 m S towards Taniluyá ravine.
During 17-18 May 2006 lava flows reached ~ 100 m SW towards the Taniluyá river and ~ 500 m SW towards the Cenizas river. Fumarolic gases rose to ~ 600 m above the crater rim and drifted E and W.
On 29 June 2006 fumarolic gases rose to ~ 125 m , spatter to tens of meters, and ash plumes ~ 2.2 km respectively above the crater rim. Lava flows extended ~ 400 m SW toward the Cenizas river. Pyroclastic flows traveled mainly SW along the Cenizas river, with a lesser number moving SW along the Taniluyá river.
On 3 July 2006, explosions discharged incandescent material hundreds of meters above the central crater and avalanches traveled ~ 300-500 m SW along the Cenizas river.
The only activity reported in August occurred on the 16-17th, when ash explosions reached 300-800 m above the crater rim, and explosions of incandescent material produced avalanches that descended 300-500 m SW towards the Cenizas, Taniluyá, and Santa Teresa river valleys.
The latter half of September 2006 continued the characteristic previous activity with explosions that sent incandescent lava 75-100 m above the crater rim and that generated hot avalanches SW towards the Taniluyá River.
On 15 November, lava flows traveled about 150 m SW, and avalanches occurred from the lava-flow fronts. On 17 November, three out of seven explosions propelled incandescent material 100 m above the central crater rim. Relative quiescence followed through December 2006.
Geologic Background. Volcán Fuego, one of Central America's most active volcanoes, is also one of three large stratovolcanoes overlooking Guatemala's former capital, Antigua. The scarp of an older edifice, Meseta, lies between Fuego and Acatenango to the north. Construction of Meseta dates back to about 230,000 years and continued until the late Pleistocene or early Holocene. Collapse of Meseta may have produced the massive Escuintla debris-avalanche deposit, which extends about 50 km onto the Pacific coastal plain. Growth of the modern Fuego volcano followed, continuing the southward migration of volcanism that began at the mostly andesitic Acatenango. Eruptions at Fuego have become more mafic with time, and most historical activity has produced basaltic rocks. Frequent vigorous eruptions have been recorded since the onset of the Spanish era in 1524, and have produced major ashfalls, along with occasional pyroclastic flows and lava flows.
Information Contacts: Instituto Nacional de Sismologia, Vulcanología, Meteorología e Hidrologia (INSIVUMEH), Ministero de Communicaciones, Transporto, Obras Públicas y Vivienda, 7a. Av. 14-57, zona 13, Guatemala City 01013, Guatemala (URL: http://www.insivumeh.gob.gt/); Coordinadora Nacional para la Reducción de Desastres (CONRED), Av. Hincapié 21-72, Zona 13, Guatemala City, Guatemala; Washington Volcanic Ash Advisory Center (VAAC), Satellite Analysis Branch (SAB), NOAA/NESDIS E/SP23, NOAA Science Center Room 401, 5200 Auth Rd, Camp Springs, MD 20746, USA (URL: http://www.ospo.noaa.gov/Products/atmosphere/vaac/).
Irazu (Costa Rica) — November 2007 Cite this Report
Irazu
Costa Rica
9.979°N, 83.852°W; summit elev. 3436 m
All times are local (unless otherwise noted)
Seismicity and degassing remain low, January 2004-September 2007
The Observatorio Vulcanológico y Sismológico de Costa Rica (OVSICORI-UNA) reported small-magnitude seismicity and stable fumarolic and crater lake conditions at Irazú over the period September 2001 to December 2003 (BGVN 28:12). This report summarizes monthly contributions from OVSICORI-UNA from January 2004 through September 2007.
Activity during January-December 2004. The lake level at Irazú remained high through 2004 with a green color from January to September and a light green and greenish yellow color in October and November. Convection cells occurred in the NW, SW, SE, NE, N edges of the lake throughout the year. Small areas of minor mass wasting occurred in the NE and SW walls, and fumarolic activity on the NW side remained constant with a low level of gas emission. A seismograph located 5 km SW of the active crater registered mild tectonic and low-frequency earthquakes throughout 2004. Peak activity occurred on 19 July 2004, with nine earthquakes occurring over four hours and an intensity of M 1.2-1.8 at focal depths of 5-15 km.
Activity during January-November 2005. The lake level remained high through 2005 with a greenish yellow color through April and darker green from May through November. A ring of lighter yellow color indicating iron-oxide deposits was visible from March through November 2005. Convection cells occurred in similar manner to the 2004 interval, and toward the lake's center of the lake. Small areas of minor mass wasting occurred in the NE and SW walls and fumarolic activity on the NW side remained constantly low. From January through March and again in October 2005, earthquakes (M 1-2) 3-16 km deep occurred from the active crater to a distance of 20 km NW and 15 km SE .
Activity during March-December 2006. During March through December 2006, the lake level at Irazú was high with a yellowish green color. The SW crater wall showed areas of minor mass wasting moving toward the lake. Similar to January-November 2005, convection cells were observed in various areas. In August, the gas emission temperature of the NW-flank fumarole was measured at 86°C (N-flank fumarole temperatures over 80°C have been reported for almost 40 years). In November 2006, the lake level, convection cells, and fumarolic activity remained constant but the lake color changed to light green. A seismograph located 5 km SW of the active crater registered continuing low level tectonic and low-frequency earthquakes. In mid-December, earthquake activity was reported by local residents, but no other changes were recorded.
Activity during 2007. In February 2007, the lake level receded, and the color changed to yellowish green. In March, measurements of the lake level indicated a descent of 4.48 m, with regard to September of the 2005 and lake color remained a greenish yellow with a temperature of 15 °C. Temperature at a convection cell at the NE edge was 34 °C. During the period March-September, the lake level continued to descend and fell an additional 3.87 m. The lake retained a light green color, with convection calls in the NE, at the N edge, and toward the center. Small areas of minor mass wasting continued in the SW crater wall, and fumaroles on the NW side continued minor degassing.
Geologic Background. The massive Irazú volcano in Costa Rica, immediately E of the capital city of San José, covers an area of 500 km2 and is vegetated to within a few hundred meters of its broad summit crater complex. At least 10 satellitic cones are located on its S flank. No lava effusion is known since the eruption of the Cervantes lava flows from S-flank vents about 14,000 years ago, and all known Holocene eruptions have been explosive. The focus of eruptions at the summit crater complex has migrated to the W towards the main crater, which contains a small lake. The first well-documented eruption occurred in 1723, and frequent explosive eruptions have occurred since. Ashfall from the last major eruption during 1963-65 caused significant disruption to San José and surrounding areas. Phreatic activity reported in 1994 may have been a landslide event from the fumarolic area on the NW summit (Fallas et al., 2018).
Information Contacts: E. Fernández, E. Duarte, R. Van der Laat, W. Sáenz, M. Martínez, V. Barboza, E. Malavassi, R. Sáenz, and J. Brenes, Observatorio Vulcanologico Sismologica de Costa Rica-Universidad Nacional (OVSICORI-UNA), Apartado 86-3000, Heredia, Costa Rica (URL: http://www.ovsicori.una.ac.cr/).
Ol Doinyo Lengai (Tanzania) — November 2007 Cite this Report
Ol Doinyo Lengai
Tanzania
2.764°S, 35.914°E; summit elev. 2962 m
All times are local (unless otherwise noted)
New lava linked to Plinian eruptions of August-September 2007
Following explosive eruptions beginning on 1 January 1983, Ol Doinyo Lengai (hereafter called 'Lengai') entered a stage consisting chiefly of the effusion of numerous small fluid, carbonatitic lava flows in its active N summit crater. During March 1983 to early 2007, reports focused almost exclusively on the summit crater, the scene of numerous, often-changing hornitos (or spatter cones) and carbonatitic lava flows that slowly filled the crater. Lava began overflowing the crater, first to the W around 14 June 1993 (BGVN 18:07), then onto the NW flank (beginning in late October 1998, BGVN 24:02), E flank (beginning in early November 1998, BGVN 24:02), W flank (beginning in February 2002, BGVN 27:10), and N flank (beginning in January 2005, BGVN 30:04), making it important to chronicle changes on the flanks. Observations of activity throughout 2007 are summarized in table 14.
Table 14. Summary of visitors to Ol Doinyo Lengai and their brief observations (from a climb, aerial overflight, flank, or satellite) during 2007. Observations for 2006 were reported in BGVN 32:02. Much of this list is courtesy of Frederick Belton; see Belton's website for most of the contributor's contact information.
| Date |
Observer |
Observation Location |
Brief Observations |
| 31 Jan-02 Feb 2007 |
Tom Pfeiffer |
Climb |
See BGVN 32:02. |
| 03 Mar 2007 |
Annette Loettrup |
Climb |
No activity; no significant changes to crater. |
| 04 Mar 2007 |
Janet Davis |
Aerial |
No activity; no significant changes to crater. |
| 24 Mar 2007 |
Unnamed |
Climb |
No activity; no significant changes to crater. |
| 17 Jun-20 Jun 2007 |
Rohit Nandedkar, Hannes Mattsson, Barbara Tripoli |
Climb |
High but variable activity of the inner crater (see text). |
| 22-23 Jul 2007 |
Lindsay McHenry |
Climb |
Activity in inner crater (see text). |
| 03 Aug-05 Aug 2007 |
Julie Machault and the group "Aventure et Volcans" |
Climb, Aerial |
Small lava flows and an open vent cradling lava (see text). |
| 15 Aug-16 Aug 2007 |
Gaston Gonnet |
Climb |
Mild strombolian activity from 3 cones. |
| 23 Aug 2007 |
Gwynne Morson |
Aerial |
| 21, 23 Aug 2007 |
Christoph Weber |
Climb |
Active eruption with lava flows (see text). |
| 01 Sep-02 Sep 2007 |
Chiara Montaldo |
Climb |
Eruption (see text). |
| 03 Sep 2007 |
Gwynne Morson |
Aerial |
Newly formed and erupting cinder cone (see text). |
| 04 Sep 2007 |
Sian Brown (pilot) |
Aerial |
Large ash plume above Lengai. |
| 04 Sep 2007 |
NASA satellite |
Satellite |
ASTER image on NASA's Terra Satellite (see text). |
| 06 Sep 2007 |
Gwynne Morson |
Aerial |
-- |
| 10 Sep 2007 |
Jens Fissenebert, Sandra Kliegalhoefer |
Flank |
High ash plume photographed from Lake Natron Camp. |
| 11 Sep-13 Sep 2007 |
Leander Ward |
Flank |
Eruption (see text). |
| 13 Sep 2007 |
Gwynne Morson |
Aerial |
Heavy ash plumes. |
| 19 Sep-21 Sep 2007 |
Jelle Schouten, Stan Brouwer |
Aerial |
Plumes flowing from Lengai. |
| 22-23 Sep 2007 |
Roger Mitchell, Barry Dawson |
Aerial |
Continuous activity (see text). |
| 24 Sep 2007 |
Jen Schoemburg |
Flank |
Continuous activity (see text). |
| 23 Sep-30 Sep 2007 |
Roger Mitchell, Barry Dawson |
Flank |
Continuous activity (see text). |
| 27 Sep 2007 |
Jen Schoemburg |
Aerial |
Continuous activity (see text). |
| 1st week Oct 2007 |
Unnamed pilot |
Aerial |
Ash plumes rising to 3 km above summit. |
| 05 Oct 2007 |
Message forwarded from Louise Leakey |
Flank |
Ash plume to 3 km. |
| 12 Oct 2007 |
Colin Church |
Flank |
Ash falls on W side of Lengai. |
| mid-Oct 2007 |
L. Dudley |
Aerial |
Heavy ash plume blowing to NW. |
| 09 Oct-16 Oct 2007 |
Graham Wickenden |
Flank |
Ash plumes viewed from Lake Natron Camp. |
| 16 Oct 2007 |
Leander Ward |
Flank camp N of Lengai on lower slopes of Gelai |
Lightning in ash clouds. |
| 16 Oct 2007 |
Unnamed |
Aerial |
Ash cone now dominates entire active crater. |
| 19 Oct 2007 |
Kathy Moore (pilot) |
Aerial |
Eruption at 0830, plumes of smoke and ash to altitude above 7.6 km. |
| 21 Oct 2007 |
Leander Ward |
Flank |
Dark and light ash clouds being erupted from the ash cone. |
| 23 Oct 2007 |
Gwynne Morson |
Aerial |
Dark ash clouds; cone (possibly T49B) still exists. |
| 25 Oct 2007 |
Benoit Wilhelmi |
Aerial |
"extremely aggressive" activity. |
| 29 Oct 2007 |
Gwynne Morson |
Aerial |
Pause in eruption. |
| 31 Oct 2007 |
Gwynne Morson |
Aerial |
Dark ash clouds. |
| 04 Nov 2007 |
Tim Leach |
Flank Lake Natron Camp |
Daily ash eruptions, some lava eruptions at night. |
| 07 Nov 2007 |
Toulouse VAAC |
Satellite |
Lengai remained active, but ash not identified on satellite imagery. |
| 10 Nov 2007 |
Michael Dalton-Smith |
Flank |
Activity continues, constant 'smoke' rising 300-600 m above summit, drifting WSW toward Gol Mountains. |
| 11 Nov 2007 |
Tim Leach |
Flank Lake Natron Camp |
Activity seems to have decreased. |
| 21 Nov 2007 |
Toulouse VAAC |
Satellite |
Lengai remained active, but ash not identified on satellite imagery. |
| 27 Nov 2007 |
Tim Leach |
Flank Lake Natron Camp |
Activity "off and on"; heard report of large "lava eruption" about a week ago. |
As this report goes to press, contradictory reports exist concerning impacts of eruptions on the volcano's flanks, with the key question concerning the amount of impact on those flanks by fires, lava flows, ashfall, or conceivably, volcanic bombs large enough to start fires on impact with the ground surface-or perhaps some combination of these and other processes.
Observations during 17-20 June 2007. A report posted on Frederick Belton's Ol Doinyo Lengai website described a visit by Rohit Nandedkar, Hannes B. Mattsson, and Barbara Tripoli during 17-20 June. They observed generally high, but variable, activity of the inner crater. A lot of sulfuric gasses escaped, mainly at fractures in the outer crater, but also from the big hornito on the SW side. Three spatter cones situated on the S and W side of the inner crater discharged spatter that splashed up to 15-20 m high at intervals of 20 minutes, with 30 minute breaks. All three cones were never active at the same time. The group saw three active interconnected lava ponds (mainly on the E side of the inner crater). The molten material was eroding the E side and destabilizing the adjacent cliff. The ponds were always active, but more vigorous activity lasted for intervals of several hours. On 19 June the crust of the inner crater burst near a big, half-collapsed hornito, sending a lava flow E.
Activity on 19 July 2007. On 20 July 2007 the Associated Press (AP) reported that "Lengai was believed to be the source of a series of shallow earthquakes experienced in the region over the past week" according to Alfred Mutua, the Kenyan government spokesman. On 19 July BBC News reported that hundreds of villagers fled their homes on the slopes in response to the above-mentioned seismic swarm, fearing an imminent eruption. A BBC correspondent reported that lava flowing down a flank was causing panic among villagers. The East African Standard indicated that products of the 19 July eruption had entered inhabited areas, stating that " . . . . more than 1,500 people, most of them Maasai families, vacated their homes in Ngaresero, Orbalal and Nayobi villages following the tremors that triggered the volcanic eruption . . . . Villagers are reported to have heard roaring . . . . before the volcano started discharging ash and lava." There were also reports of a damaged school and two injuries, but no deaths. Subsequent inquiries about the incident have cast doubt on these earlier claims.
Volcanologist Gerald Ernst contacted aviators, guides, scientists, and local inhabitants in the region; they had seen no dramatic eruptive events at the mountain during late July 2007. Overall, the compiled comments indicated that the summit crater was intact and eruptions were confined to the summit area. Keith Roberts was reported to have observed that a landslide kicked up a lot of dust, which could have been confused from a distance with ash from a large flank eruption.
Greg Vaughan of the Jet Propulsion Labs subsequently took a preliminary look at some ASTER satellite imagery and concluded that in mid-June through late July the summit crater was likely to have continued to emit lava. The 20 July thermal emissions supported summit lava eruptions but failed to document any lava that had spilled over the crater rim. In addition, no thermal anomalies were measured by MODIS instruments as reported by the Hawai'i Institute of Geophysics and Planetology (HIGP) Thermal Alerts System from 7 July through 22 August (UTC).
Belton's website contained a report by Lindsay McHenry, who had climbed Lengai on 22-23 July 2007. She reported: "There were frequent minor earthquakes in the days preceding the climb. There were two active spatter cones, one on the far eastern side of the crater and a small one just to the east of the central spire. Both were throwing small blocks ? locally, and occasionally raining ash over the entire crater. Our guides directed us to an aa flow on the northern side of the crater that they claimed was only 4 days old. The interior was still warm and showed no signs of alteration. The flow was confined to the crater."
MODIS (MODVOLC) measurements. Data from MODIS satellites and analyzed with the MODVOLC algorithm revealed no thermal anomalies for the period 7 July-22 August 2007. Instead, multiple thermal anomalies were measured at and around the crater particularly during 23 August-3 September and 10-20 September 2007 (table 15). It is plausible that a brief ash-bearing eruption like the alleged 19 July event could have been missed by the MODIS satellites or not detected by the MODVOLC algorithm.
Table 15. MODIS/MODVOLC thermal anomalies measured at Ol Doinyo Lengai during 2007. No anomalies were detected during 1 January-1 June, 7 July-22 August, 21 September-16 October, 18-30 October, and 1 November-29 December 2007. Anomalies measured by MODIS during 2006 were reported in BGVN 32:02. Courtesy of the Hawai'i Institute of Geophysics and Planetology (HIGP) Thermal Alerts System.
| Date |
Time (UTC) |
Number of pixels |
Satellite |
| 02 Jun 2007 |
0745 |
1 |
Terra |
| 23 Jun 2007 |
2025 |
3 |
Terra |
| 23 Jun 2007 |
2320 |
1 |
Aqua |
| 25 Jun 2007 |
2015 |
1 |
Terra |
| 29 Jun 2007 |
1950 |
1 |
Terra |
| 29 Jun 2007 |
2245 |
1 |
Aqua |
| 30 Jun 2007 |
2030 |
1 |
Terra |
| 30 Jun 2007 |
2330 |
1 |
Aqua |
| 02 Jul 2007 |
2315 |
1 |
Aqua |
| 06 Jul 2007 |
1955 |
1 |
Terra |
| 06 Jul 2007 |
2250 |
1 |
Aqua |
| 23 Aug 2007 |
1955 |
1 |
Terra |
| 23 Aug 2007 |
2250 |
1 |
Aqua |
| 25 Aug 2007 |
1940 |
2 |
Terra |
| 26 Aug 2007 |
2320 |
1 |
Aqua |
| 28 Aug 2007 |
2310 |
1 |
Aqua |
| 30 Aug 2007 |
2000 |
2 |
Terra |
| 30 Aug 2007 |
2300 |
1 |
Aqua |
| 31 Aug 2007 |
0825 |
2 |
Terra |
| 31 Aug 2007 |
1120 |
2 |
Aqua |
| 31 Aug 2007 |
2045 |
2 |
Terra |
| 31 Aug 2007 |
2340 |
2 |
Aqua |
| 01 Sep 2007 |
1950 |
10 |
Terra |
| 01 Sep 2007 |
2245 |
2 |
Aqua |
| 02 Sep 2007 |
0810 |
2 |
Terra |
| 02 Sep 2007 |
1105 |
2 |
Aqua |
| 03 Sep 2007 |
1935 |
2 |
Terra |
| 10 Sep 2007 |
1940 |
1 |
Terra |
| 10 Sep 2007 |
2240 |
2 |
Aqua |
| 19 Sep 2007 |
2235 |
1 |
Aqua |
| 20 Sep 2007 |
0800 |
4 |
Terra |
| 17 Oct 2007 |
2000 |
2 |
Terra |
| 31 Oct 2007 |
2310 |
1 |
Aqua |
| 30 Dec 2007 |
0815 |
1 |
Terra |
Observations during early August 2007. The European Association of Volcanologists (LAVE), a group that visits many volcanoes and publishes an informative and colorful newsletter, ascended and camped in the active crater on 3-5 August 2007 (Machault, 2008). Machault (2008) discussed a crater still strewn with multiple hornitos. Many of their observations concerned the emissions at these hornitos and abundant still fresh lava flows of small volume seen spreading over the crater floor. They departed the crater at 0700 on 5 August at which point they saw no activity.
In more detail, one vent at a hornito was particularly active on 3-4 August. The active vent was open and cradling molten lava. It was located well up on the cone of a hornito to the near E of T49B. This vent emitted lapilli on 4 August and the next day it emitted lava. On 4 August the same vent E of T49B discharged a lava flow on the crater floor, 100 m long with several arms. The afternoon of 4 August the same vent issued black "smoke" and clouds. A 'black geyser' rose above the hornitos in the center of the crater but the exact source vent was uncertain.
Eruptions of late August and September 2007. Matthieu Kervyn analyzed MODIS data with the MODLEN algorithm (tailored to the lower temperature lavas at Lengai) and recorded multiple and repeated thermal anomalies at and around the crater after 21 August 2007. This indicated a new eruptive event during 21-23 August, with a peak on 23 August (MODVOLC data in table 15 show anomalies starting 23 August). Anomalies at that time seemed to be restricted to the crater, but moved out to the flanks on 31 August and 1 September. On 23 August, pilot Gwynne Morson photographed the recent lava flows (figure 95), which, when freshly cooled are black in color (later altering to white due to weathering).
Ashley Davies reported that thermal emissions were detected on 27 August 2007 from the NASA Earth Observing-1 (EO-1) spacecraft, which combined both the Hyperion hyperspectral imager and the ALI multispectral imager, yielding coverage of both visible and short-wavelength infrared (SWIR). Hyperion data (30 m/pixel resolution) showed two very bright sources in the summit crater with spectra consistent with erupting lava. There was also an indication of a short lava flow to the NW. Based on a preliminary analysis of the Hyperion data, effusion rate was estimated at ~ 0.5 m3/s. [Note: As part of the JPL Volcano Sensor Web, the EO-1 observation was triggered autonomously by an alert from the MODVOLC system. This in turn triggered a series of data transmissions and rapid processing at JPL. Notification was received at JPL within 2 hours of data acquisition. JPL processed the Hyperion data within 36 hours of acquisition.]
Chiara Montaldo and her husband climbed Lengai on the night of 1-2 September. Lava started to come out of the crater on the afternoon of 1 September and flowed down the flank all night (figure 96). At 0500 on 2 September, the crater was erupting; the noise and smell was very strong. From time to time there was an explosion sound (like fireworks) and a column of ash and lapilli could be seen. The column was not continuous, and it was incandescent with black smoke and ash. They felt very strong earthquakes on the top. A few hours after they climbed down on 2 September, the column and the noise were higher and the wind changed direction, blowing the ash toward them. On the following night (2-3 September) another group tried to climb the volcano, but retreated about halfway up because the eruption was getting more intense.
According to Burra Gadiye, a mountain guide, an ash eruption began during the night of 3-4 September 2007. On 3 September pilot Gywnne Morson observed a new erupting cone in the central to E side of the crater. Thomas Holden relayed a pilot's account of a large ash plume on 4 September. The ash plume and strong thermal activity in the crater and probably lava flows to the W and NW may have spawned fires that burned large areas of the W and NW flank, as can be seen in a 4 September 2007 ASTER image (figure 97). Kervyn observed that the volcano erupted on 4 September, first at midnight and then at 0500, causing significant ash clouds. Ash fallout was observed at Engare Sero village, 18 km N of the summit. Ashfall lasted for over 12 hours. The ash cloud was imaged by ASTER on the morning of 4 September drifting SSW. Roger Mitchell attributed the large burned areas on figure 97 as due to fires ignited after the ash eruption of 3-4 September.
Chris Weber reported that during the night of 3-4 September, lapilli- and ash-bearing eruptions rose about 3 km above the vent. Pictures taken from a plane on 5 September indicated that the hornitos and other crater morphology remained without dramatic change. Satellite images around this time showed vast areas of burned vegetation on the S, W, and NW slopes. The charred area at the S was caused by a bush fire that started before 20 August (observed by Weber), while he attributed such areas to the W and NW as caused by lava flows. A sketch of the inner crater was drawn on 23 August by Weber (figure 98).
At about 1100 on 24 September, Jen Schoemburg reported seeing ash rising to an altitude of ~ 4 km, drifting NW. A local safari vehicle driver said that there had often been a 'mirage' visible above the volcano (from gases), but that for the previous two weeks or so the volcano had been emitting ash. He also said that people in surrounding villages had reported skin rashes on themselves and their animals. Additionally, 2-3 weeks prior, there had been earthquakes felt in the region. Near noon on 27 September, Schoemburg flew over going N, with the volcano passing on the W side of the plane (figure 99). The pilot said that in recent weeks ash rose to 6 km altitude; during the fly-over, it was rising to about 4.6 km, still drifting NW.
Observations during late September and ash petrology. Barry Dawson and Roger Mitchell reported on activity during 22-30 September 2007 and their petrologic investigations. During an overflight on 22 September, Dawson observed that there had been a complete collapse of the area around former T49 hornito/ash cone area, with the formation of an ash pit surrounded by new black ejecta. A large hornito (T40) between the pit and the N wall of the crater was still in existence. Small emissions of ash, probably less than 100 m high, were drifting N. There was much new whitened ash around the whole summit area, but with most to the S where the S crater and the higher parts of the S slopes were most thickly blanketed, possibly from the plume recorded on the ASTER image (figure 97) of 4 September 2007.
As observed from the foot of the volcano on 23 September and on the early morning of 24 September, there were small, intermittent ash eruptions. At about 0900 on 24 September a strong eruption started, giving rise to a black eruption column that quickly built up to a height estimated to be ~ 6 km (figure 100), where it spread out into a typical Plinian-type cloud. From the lower W slopes, explosions were distinctly heard. This strong eruptive phase lasted till around 1300 with the ash cloud drifting NW and lapilli falling on the NW slopes; lapilli were gathered for a comparative study with lapilli from the 1966 eruption (Dawson and others, 1992). Smaller, intermittent lapilli-bearing eruptions continued until nightfall (around 1830).
On 25 September there was minor activity until about 1300, when new eruptions ejected white material. A lapilli cone could be seen from the lower S slopes, and subsequently fountaining took place from two distinct centers within the crater. Activity continued for about four hours. On 26 September there was only minor activity with fine ash drifting to the NW, but in the late afternoon an ash column with a whitened head rose ~ 3 km. In the evening, the atmospheric dust resulted in the sun having a halo, being red in color. The moon that night also had a halo.
On 27 September, the volcano was quiet, but at 0900 on 28 September it erupted again, though no plume developed. There was fountaining from three centers over the next hour, with regular migration of the fountains from N to S; black lapilli was ejected to ~ 200 m above the vent. Activity recommenced at 1330 and lasted all afternoon, with an eruption column up to 2 km high. After this event, the prominent hornito near the N rim of the crater that was previously visible from the lower slopes was no longer visible.
There was no sign of activity on 29 September until 1200, when large eruptions sent material up to 3 km above the volcano. Initially black, the billowing top of the eruption column became white at and above the level of the surrounding atmospheric clouds. This could be interpreted as due to either (1) a higher albedo of finer material at the top of the eruption column, (2) dust forming nucleation sites for condensing atmospheric water, or (3) a combination of the two. In the late afternoon and early evening, dark material from the eruption plume, now much reduced in height, continued to spill down the NW slopes rather like a density flow. On 30 September, when last observed by Dawson, there were only minor ash eruptions that drifted NW.
Dawson noted that up to 30 September, the volume of material erupted and the height of the eruption column appeared smaller than the last major phase of ash eruptions in 1966-67, when plume heights of ~ 10,000 m were estimated, and ash distribution was as far as Seronera (130 km to the W) and Loliondo (72 km to the NW) (Dawson and others, 1968). For comparison, on 27 September 2007 when Dawson visited Sale (a Wasonjo settlement 45 km NW of Lengai), there were no signs of ashfall; during the July 1967 eruption, there was ashfall at Arusha (110 km SE) and at Wilson airfield, Nairobi (190 km NE) (Dawson and others, 1995). Natrocarbonatite lava in the gully immediately S of the climbing track (the overflow from the crater extruded roughly 25 March-5 April 2006, BGVN 32:02) was of two types; (a) a pahoehoe flow containing entrained blocks of wollastonite nephelinite, that was overlain and mainly buried beneath (b) a later aa flow that extended 3 km from the crater. On the upper SE slopes, ~ 200-300 m below the rim of the S crater, there had been extrusion of a short, thin, then-whitened natrocarbonatite flow; flank eruptions are unusual at Lengai.
Mitchell and Dawson collected ash samples on 24 September and subsequently described them as follows. "The lapilli contain nuclei of nepheline, clinopyroxene, Ti-melanite and wollastonite, collectively wollastonite ijolite, probably xenocrystic. Wollastonite and clinopyroxene are replaced by combeite. However the mantling ash consists of nepheline, melilite, combeite (Na2Ca2Si3O9), a Na-Ca carbonate-phosphate, Mn magnetite, and a K-Fe sulphide in a volumetrically-insignificant (less than 5%) sodium carbonate matrix. In lacking clinopyroxene the mantling ash is not nephelinite or melilitite, and is unlike any other magma type previously recorded from the volcano. The mantling ash is interpreted as a hybrid magma formed when nephelinite interacted with natrocarbonatite magma, forming combeite and melilite at the expense of clinopyroxene. The resulting decarbonation reaction released the CO2 that drove the eruption." Mitchell added that the ash seemed to be an extreme variant of the 1996 ash.
Activity during October-November 2007. On his website, Belton reported that Leander Ward saw lightning in some of the ash clouds in the early morning of 16 October 2007. Ward observed that the ash cone then dominated the entire active crater and appeared to have grown significantly in diameter; no other cones were visible. Charter pilot Kathy Moore reported an eruption on 19 October around 0830, sending plumes of smoke and ash into the atmosphere to an altitude of ~ 7.6 km. The plume was visible for ~ 160 km, but the eruption (one large blast followed by a smaller one) lasted only for a few minutes. Within half an hour the large cloud of ash had dispersed and only smaller clouds remained close to the mountain.
Tim Leach, owner of Lake Natron Camp on the S shore of Lake Natron, reported on 4 November that the ash eruption continued on a daily basis. His crew had occasionally seen night-time "lava eruptions." Leach advised against climbing the active crater and stated that they were working on developing safer routes terminating in the inactive S Crater. One difficult route that has been climbed twice from the Kerimasi side was vegetated in September, but by the end of October it was ash covered.
Michael Dalton-Smith reported that as of 10 November activity continued. From a distance he saw constant "smoke" rising 300-600 m above the summit. At one point it appeared that a light colored but strong ash cloud formed a column, but it was difficult to tell for sure due to clouds. Jean-Claude Tanguy sent an aerial photograph (figure 101) taken by Maxime Le Goff on 23 November 2007 that showed pronounced changes in the active crater. A large crater had clearly developed in the center of the N crater and the complex array of hornitos nearly all buried in ash were not in evidence.
References. Dawson, J. B., Bowden, P., and Clark, G. C., 1968, Activity of the carbonatite volcano Oldoinyo Lengai, 1966, International Journal of Earth Sciences (Geologische Rundshau), v. 57, no. 3, p. 865-879.
Dawson, J. B., Smith, J. V., and Steele, I. M., 1992, 1966 ash eruption of t he carbonatite volcano Oldoinyo Lengai: mineralogy of lapilli and mixing of silicate and carbonate magmas, Mineralogical Magazine, v. 56, p. 1-16.
Dawson, J. B., Keller, J., and Nyamweru, C., 1995, Historic and recent eruptive activity of Oldoinyo Lengai, p. 4-22 in Bell, K., and Keller, J. (eds), Carbonatite Volcanism, Oldoinyo Lengai and the Petrogenesis of Natrocarbonatites, Springer-Verlag, Berlin, p. 4-22.
Machault, J., 2007, Lengai du 3 au 5 ao?t 2007, LAVE, Revue de L'Association Volcanologique Européene, no. 129, p. 29-32, November 2007, 7 rue de la Guadeloupe, 75018 Paris, France (http://www.lave-volcans.com) ISSN 0982-9601.
Geologic Background. The symmetrical Ol Doinyo Lengai is the only volcano known to have erupted carbonatite tephras and lavas in historical time. The prominent stratovolcano, known to the Maasai as "The Mountain of God," rises abruptly above the broad plain south of Lake Natron in the Gregory Rift Valley. The cone-building stage ended about 15,000 years ago and was followed by periodic ejection of natrocarbonatitic and nephelinite tephra during the Holocene. Historical eruptions have consisted of smaller tephra ejections and emission of numerous natrocarbonatitic lava flows on the floor of the summit crater and occasionally down the upper flanks. The depth and morphology of the northern crater have changed dramatically during the course of historical eruptions, ranging from steep crater walls about 200 m deep in the mid-20th century to shallow platforms mostly filling the crater. Long-term lava effusion in the summit crater beginning in 1983 had by the turn of the century mostly filled the northern crater; by late 1998 lava had begun overflowing the crater rim.
Information Contacts: Gerald Ernst, Centre for Environmental & Geophysical Flows, Department of Earth Sciences, University of Bristol, Wills Memorial Building, Queens Road, Bristol BS8 1RJ, United Kingdom; Greg Vaughan, Jet Propulsion Laboratory, Mail Stop 183-501, 4800 Oak. Grove Dr., Pasadena, CA 91109, USA; Frederick Belton, Developmental Studies Department, PO Box 16, Middle Tennessee State University, Murfreesboro, TN 37132, USA (URL: http://oldoinyolengai.pbworks.com/); Hawai'i Institute of Geophysics and Planetology (HIGP) Thermal Alerts System, School of Ocean and Earth Science and Technology (SOEST), Univ. of Hawai'i, 2525 Correa Road, Honolulu, HI 96822, USA (URL: http://modis.higp.hawaii.edu/); Matthieu Kervyn, University of Ghent, Geology Department, Ghent, Belgium (URL: http://homepages.vub.ac.be/~makervyn/); Ashley Davies, NMP-ST6 Autonomous Sciencecraft Experiment Asteroids, Comets and Satellites Group (3224), ms 183-501, Jet Propulsion Laboratory, 4800 Oak Grove Dr., Pasadena, CA 91109-8099, USA; Christoph Weber, Volcano Expeditions International, Muehlweg 11, 74199 Untergruppenbach, Germany (URL: http://www.v-e-i.de/); J. Barry Dawson, Grant Institute of Earth Science, University of Edinburgh, King's Building, Edinburgh EH9 3JW, United Kingdom; Roger Mitchell, Lakehead University, 955 Oliver Road, Thunder Bay, ON P7B 5EI, Canada; Jennifer Fela Schoemburg, Cologne, Germany; Lake Natron Camp, Tim Leach (URL: http://www.ngare-sero-lodge.com/Natron_camp.htm); Kathy Moore; Celia Nyamweru, Department of Anthropology, St. Lawrence University, Canton, NY 13617, USA (URL: http://blogs.stlawu.edu/lengai/); Michael Dalton-Smith (URL: http://digitalcrossing.ca/); Jean-Claude Tanguy, Centre National de la Recherche Scientifique-Institut de Physique du Globe (CNRS-IPGP), Observatoire de Saint-Maur, 4, avenue de Neptune, 94107 Saint-Maur des Fossés Cedex, France; Julie Machault, LAVE "Aventure et Volcans" (sponsored by L'Association Volcanologique Européene, 7 rue de la Guadeloupe, 75018 Paris, France (URL: http://www.lave-volcans.com); USGS National Earthquake Information Center (URL: http://earthquakes.usgs.gov/).
Ruapehu (New Zealand) — November 2007 Cite this Report
Ruapehu
New Zealand
39.28°S, 175.57°E; summit elev. 2797 m
All times are local (unless otherwise noted)
Additional data on hydrothermal eruption's distribution and damage
A hydrothermal explosion at Ruapehu on 25 September 2007 was previously described (BGVN 32:10), with a plume and lahars discharged from Crater Lake. Since publication, new photos and additional information was provided by Brad Scott of New Zealand's Institute of Geological & Nuclear Sciences. In addition, an article came out on the tephra dam failure and subsequent lahar (Manville and Cronin, 2007). The tephra dam broke in March 2007 (BGVN 32:10) sending a big lahar down the Whangaehu Gorge and River (figure 36).
Photos of hydrothermal and lahar deposits on snow and alpine glacial ice were taken within days of the hydrothermal explosion. By 4 October, the mountain was blanketed in fresh snow, completely masking the recent deposits. Photos such as those included in this report (fresh deposits laid down on ice and snow from erupting high-altitude crater lakes) are comparatively rare.
Dome Shelter, located just N of Crater Lake, was directly in the path of the explosion. It was extensively buried by debris from the explosion and one person inside was badly injured.
Instruments recorded seismic and air-pressure signals associated with the hydrothermal explosion (figure 37). The seismic plot shows a strong wave initially arriving at 2026 NZ local time. The velocity of sound in air is several-fold slower that the velocity of vibrations through rock (seismic waves). In addition, the sound waves were recorded at a station ~ 6 km farther away from the signal source. Consequently the sound signal's first arrival was later.
Work is still in progress to understand the complicated lahar dynamics of this event. Three main lahars descended the mountain on 25 September. Two headed roughly E (one via the outlet and associated Whangaehu Gorge, the other, larger, out over the crater walls and down a glacier). Another lahar went N (over the crater walls).
The photo of Ruapehu's summit taken from a plane, shown in figure 35 in BGVN 32:10, was a view from the NE illustrating the scene shortly after the eruption. A similar photo appears here as figure 38, although this photo was taken from the E. In both these photos, the largest (most conspicuous) lahar follows a straight path from the summit area adjacent Crater Lake. It traveled over the Whangaehu glacier.
Ejecta apparently accumulated in the N Crater basin (figure 39) before some of it flowed down the Whangaehu glacier. The latter lahar was complex, owing to eruption-blasted water followed by runoff and other possible complexities still under study. The third lahar was small and came down the Ruapehu's N side. It passed near a ski slope (figures 40 and 41).
A view of Crater Lake looking S into the crater from the Dome Shelter (figure 42) shows the strong directionality of the blast to the N (towards Dome Shelter). Numerous small blocks and bombs are visible in the foreground. Near the lake appear some lighter textured deposits on the snow (figure 42). These are rather thin (less than 0.5-1 m thick) and cross some of the darker deposits. Initial field interpretations were that these lighter deposits formed in two ways. One is the deposits mark the absorption of ejected Crater Lake water into the snow pack. The second is that they preserve the aerosol developed on the fringes of a directed blast of steam and water discharged from the Lake. Figure 43 is similar to the previous one, only viewed standing on debris farther to the E, an area where significant runoff formed a long narrow channel, which in the foreground traveled downslope towards the viewer.
Dome Shelter and news-reported injury. Dome Shelter was partly buried by typical snow accumulation, over which came the deposits from the hydrothermal eruption, some of which invaded the structure (figure 44). To summarize news stories in the New Zealand Herald and The Sydney Morning Herald, four mountaineers were camped in the Shelter during the explosion. William Pike's left leg was injured and his right leg below the knee was crushed and pinned by deposits. He was rescued and ultimately flown out by helicopter but had suffered severe hypothermia. Doctors said at one point he was very near death, with body temperature in the 25-26°C range. They managed to save him after amputating the lower portion of his right leg. The news also reported that the Shelter was designated for emergency use only (not as a camping shelter).
GNS noted that the Shelter also houses monitoring instruments, equipment less damaged than initially thought. Data from one of the two seismic systems continued to flow, although the data were rather noisy. Accordingly, GNS began relying on nearby monitoring stations.
Reference. Manville, V., and Cronin, S.J., 2007, Breakout lahar from New Zealand's Crater Lake, Earth Observing Satellite, Transactions, American Geophysical Union, v. 88, no. 43, p. 441-442.
Geologic Background. Ruapehu, one of New Zealand's most active volcanoes, is a complex stratovolcano constructed during at least four cone-building episodes dating back to about 200,000 years ago. The dominantly andesitic 110 km3 volcanic massif is elongated in a NNE-SSW direction and surrounded by another 100 km3 ring plain of volcaniclastic debris, including the NW-flank Murimoto debris-avalanche deposit. A series of subplinian eruptions took place between about 22,600 and 10,000 years ago, but pyroclastic flows have been infrequent. The broad summait area and flank contain at least six vents active during the Holocene. Frequent mild-to-moderate explosive eruptions have been recorded from the Te Wai a-Moe (Crater Lake) vent, and tephra characteristics suggest that the crater lake may have formed as recently as 3,000 years ago. Lahars resulting from phreatic eruptions at the summit crater lake are a hazard to a ski area on the upper flanks and lower river valleys.
Information Contacts: Brad Scott, Institute of Geological & Nuclear Sciences (IGNS), Private Bag 2000, Wairakei, New Zealand (URL: http://www.gns.cri.nz/); New Zealand GeoNet Project (URL: http://www.geonet.org.nz/); New Zealand Herald (URL: http://www.nzherald.co.nz/); Sydney Morning Herald (URL: http://www.smh.com.au/).
Soputan (Indonesia) — November 2007 Cite this Report
Soputan
Indonesia
1.112°N, 124.737°E; summit elev. 1785 m
All times are local (unless otherwise noted)
Ash plumes and seismic activity continue through November 2007
Our last report on Soputan (BGVN 32:01) indicated that Soputan's lava dome was still emitting gas and generating rockfalls and ash plumes to 12 km in altitude through December 2006. This report, which includes a map (figure 3), discusses activity through November 2007.
According to the Center of Volcanology and Geological Hazard Mitigation (CVGHM), diffuse ash plumes rose from Soputan to an altitude of 1.8 km during 20-25 June 2007. The Alert Level remained at 3 (on a scale of 1-4), where it had been since 15 December 2006. Between 11 June and 1 July 2007 the only seismicity recorded was caused by rockfalls, with 107 events during 11-17 June, 124 events during 18-24 June, and 78 events during 25 June-1 July.
News accounts reported that Soputan erupted on 14 August, producing ash plumes that, according to the Darwin Volcanic Ash Advisory Centre (VAAC), rose to 4.6 km altitude and drifted W. Lava and rock avalanches were also observed. According to Yahoo! Canada News, volcanologist Sandy Manengke indicated that no injuries or damage were reported, but that villages along Soputan's base were covered in volcanic dust, and many residents were wearing face masks. According to Reuters, Saut Simatupang, head of Indonesia's Volcanology Survey, told the news agency that no evacuation was ordered and the Alert Level was not raised to 4 (maximum) because Soputan was unlikely to erupt in a way that would threaten the nearest village, 11 km from its crater. On 15 August seismicity decreased.
Based on observations of satellite imagery and information from CVGHM, the Darwin VAAC reported that an ash plume rose to an altitude of 4.6 km and drifted W during 14-15 August. Visual observations were made on 24-25 October and 30-31 October 2007 of white and gray plumes that rose to altitudes of 1.8-3.3 km and drifted W. In addition, based upon pilot reports and satellite imagery, the Darwin VAAC reported that on 25-26 October, ash plumes rose to 13.7 km altitude and drifted WSW. On 25 October, lava flowed 500-600 m down the W flank and flowed again on 30 October. Villagers and tourists were warned not to travel within a 6 km radius of the summit.
MODVOLC data (which is MODIS satellite thermal infrared data processed to indicate possible volcanism) is sometimes helpful in assessing lava and dome emissions at volcanoes. Alerts for 2007 appeared in August (7 alerts), October (23 alerts), and November (2 alerts). During 2006, alerts took place in December (11 alerts) and October (5).
According to CVGHM, the Alert Status was lowered from 3 to 2 on 23 November, based on a decrease in the number of earthquakes and seismic intensity, deformation measurements, and visual observations.
Geologic Background. The Soputan stratovolcano on the southern rim of the Quaternary Tondano caldera on the northern arm of Sulawesi Island is one of Sulawesi's most active volcanoes. The youthful, largely unvegetated volcano is the only active cone in the Sempu-Soputan volcanic complex, which includes the Soputan caldera, Rindengan, and Manimporok (3.5 km ESE). Kawah Masem maar was formed in the W part of the caldera and contains a crater lake; sulfur has been extracted from fumarolic areas in the maar since 1938. Recent eruptions have originated at both the summit crater and Aeseput, a prominent NE-flank vent that formed in 1906 and was the source of intermittent major lava flows until 1924.
Information Contacts: Center of Volcanology and Geological Hazard Mitigation (CVGHM), Diponegoro 57, Bandung, Jawa Barat 40122, Indonesia (URL: http://vsi.esdm.go.id/); Jenny Farlow, Darwin Volcanic Ash Advisory Centre, Bureau of Meteorology, Australia (URL: http://www.bom.gov.au/info/vaac/); Hawai'i Institute of Geophysics and Planetology (HIGP) Hot Spots System, University of Hawai'i, 2525 Correa Road, Honolulu, HI 96822, USA (URL: http://modis.higp.hawaii.edu/); Reuters (URL: http://www.reuters.com/); Yahoo! Canada News (URL: http://ca.news.yahoo.com/).
Suwanosejima (Japan) — November 2007 Cite this Report
Suwanosejima
Japan
29.638°N, 129.714°E; summit elev. 796 m
All times are local (unless otherwise noted)
Eruptions of July 2005-December 2007 send plumes to varying heights
Suwanose-jima, in the East China sea, is one of Japan's most active volcanoes. Our last report on Suwanose-jima (BGVN 30:07) tabulated the seismicity and the numerous ash plumes seen between April 2004 and July 2005. The current report continues the tabulation from August 2005 to December 2007 (table 4).
Table 4. Summary of activity reported at Suwanose-jima from August 2005 to December 2007, based on information from the Tokyo VAAC. "--" indicates that data were not reported.
| Date |
Activity |
Plume Altitude (km) |
Drift Direction |
| 11 Aug-12 Aug 2005 |
Small eruptions |
~ 3.4 |
-- |
| 22 Sep 2005 |
Plume |
~ 1.8 |
W |
| 07 Oct-09 Oct 2005 |
Eruptions |
max. 1.8 |
SW, E, SE |
| 01 Jan 2006 |
Explosions |
-- |
-- |
| 10 Jan 2006 |
Explosions |
~ 1.8 |
E |
| 24 Jan 2006 |
Plume |
1.5 |
E |
| 28 Jan 2006 |
Plume |
max. 1.8 |
W |
| 29 Jan 2006 |
Explosion |
-- |
-- |
| 31 Jan 2006 |
Plume |
1.5 |
W |
| 01 Feb 2006 |
Explosions |
-- |
-- |
| 06 Feb-07 Feb 2006 |
Explosions |
1.2 |
NW |
| 08 Feb-10 Feb 2006 |
Plumes |
max. 1.5 |
E and SE |
| 15 Feb-18 Feb 2006 |
Plumes |
max. 1.5 |
E and S |
| 22 Feb-24 Feb 2006 |
Eruptions |
max. ~ 3 |
S, E, NE |
| 02 Mar-08 Mar 2006 |
Explosions |
max. ~ 1.8 |
E, SE, S, NW |
| 16 Apr 2006 |
Ash plume |
~ 1.5 |
-- |
| 07 Jun 2006 |
Ash plume |
2.4 |
-- |
| 30 Jun 2006 |
Plume |
1.2 |
NE |
| 16 Jul 2006 |
Ash plume |
1.8 |
N |
| 26 Jul-30 Jul 2006 |
Explosions |
max. ~ 1.8 |
N, straight up |
| 11 Aug-14 Aug 2006 |
Explosions |
max. ~ 1.8 |
N and W |
| 26 Aug 2006 |
Plumes |
1.8 |
Straight up |
| 28 Aug 2006 |
Plumes |
1.5 |
E |
| 19 Sep 2006 |
Ash plumes |
3.4 |
E |
| 20 Sep 2006 |
Ash and steam |
2.1 |
N |
| 06 Oct 2006 |
Explosion |
-- |
-- |
| 14, 16-17 Oct 2006 |
Ash plumes |
3 |
-- |
| 18 Oct 2006 |
Explosion |
-- |
-- |
| 27 Oct-28 Oct 2006 |
Ash plumes |
1.8 |
E |
| 04 Nov-06 Nov 2006 |
Plumes |
1.2 |
E and SW |
| 09 Nov 2006 |
Plume |
1.5 |
W |
| 17 Nov 2006 |
Plume |
2.1 |
Straight up |
| 19 Dec 2006 |
Eruption |
-- |
-- |
| 09 Jan 2007 |
Plume |
-- |
-- |
| 28 Jan 2007 |
Plume |
-- |
-- |
| 05 Feb-07 Feb 2007 |
Plume |
-- |
-- |
| 19 Feb-20 Feb 2007 |
Plumes |
-- |
-- |
| 02 Mar 2007 |
Plume |
1.2 |
W |
| 17 Mar 2007 |
Explosion |
-- |
-- |
| 30 Mar 2007 |
Explosion |
-- |
-- |
| 02 Apr 2007 |
Explosion |
-- |
-- |
| 08 May 2007 |
Explosions |
-- |
-- |
| 26 Jul 2007 |
Ash plume |
1.5 |
SW |
| 17 Sep 2007 |
Explosions |
-- |
-- |
| 16 Oct 2007 |
Plume |
1.5 |
E |
| 22 Oct 2007 |
Plume |
1.5 |
W |
| 26 Oct-28 Oct 2007 |
Plumes |
1.5 |
E and W |
| 29 Nov-02 Dec 2007 |
Plumes |
1.2-1.8 |
E |
| 10 Dec 2007 |
Plumes |
1.5-1.8 |
W |
| 14 Dec-17 Dec 2007 |
Plumes |
1.5-1.8 |
E |
During the reporting interval, the Tokyo Volcanic Ash Advisory Center reported small explosions or eruptions, usually accompanied by ash plumes, every month during this period, except for November and December 2005, May 2006, and June 2007. Ash was seldom identified on satellite imagery. On 20 September 2006, the Moderate Resolution Imaging Spectroradiometer (MODIS) on NASA's Terra satellite detected ash-and-steam emissions (figure 11).
Geologic Background. The 8-km-long island of Suwanosejima in the northern Ryukyu Islands consists of an andesitic stratovolcano with two active summit craters. The summit is truncated by a large breached crater extending to the sea on the E flank that was formed by edifice collapse. One of Japan's most frequently active volcanoes, it was in a state of intermittent Strombolian activity from Otake, the NE summit crater, between 1949 and 1996, after which periods of inactivity lengthened. The largest recorded eruption took place in 1813-14, when thick scoria deposits covered residential areas, and the SW crater produced two lava flows that reached the western coast. At the end of the eruption the summit of Otake collapsed, forming a large debris avalanche and creating an open collapse scarp extending to the eastern coast. The island remained uninhabited for about 70 years after the 1813-1814 eruption. Lava flows reached the eastern coast of the island in 1884. Only about 50 people live on the island.
Information Contacts: Tokyo Volcanic Ash Advisory Center (Tokyo VAAC), Japan Meteorological Agency (JMA), 1-3-4 Ote-machi, Chiyoda-ku, Tokyo 100, Japan (URL: https://ds.data.jma.go.jp/svd/vaac/data/); NASA Moderate Resolution Imaging Spectroradiometer (MODIS) program (URL: http://modis.gsfc.nasa.gov/).