Recently Published Bulletin Reports
Erebus (Antarctica) Lava lake remains active; most thermal alerts recorded since 2019
Rincon de la Vieja (Costa Rica) Frequent phreatic explosions during July-December 2023
Bezymianny (Russia) Explosion on 18 October 2023 sends ash plume 8 km high; lava flows and incandescent avalanches
Kilauea (United States) Low-level lava effusions in the lava lake at Halema’uma’u during July-December 2022
Nyamulagira (DR Congo) Lava flows and thermal activity during May-October 2023
Bagana (Papua New Guinea) Explosions, ash plumes, ashfall, and lava flows during April-September 2023
Mayon (Philippines) Lava flows, pyroclastic flows, ash emissions, and seismicity during April-September 2023
Nishinoshima (Japan) Eruption plumes and gas-and-steam plumes during May-August 2023
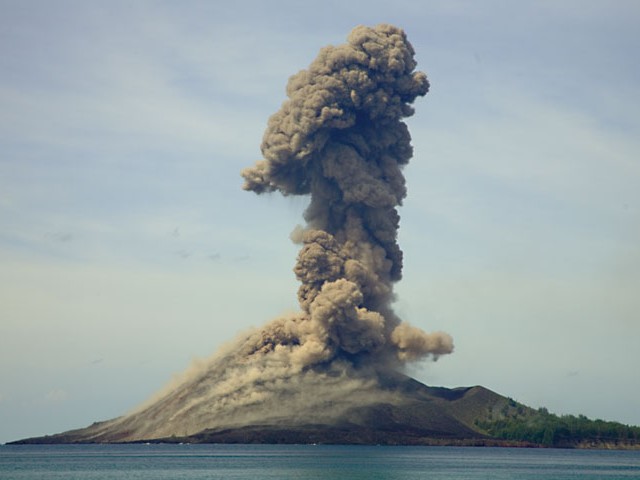
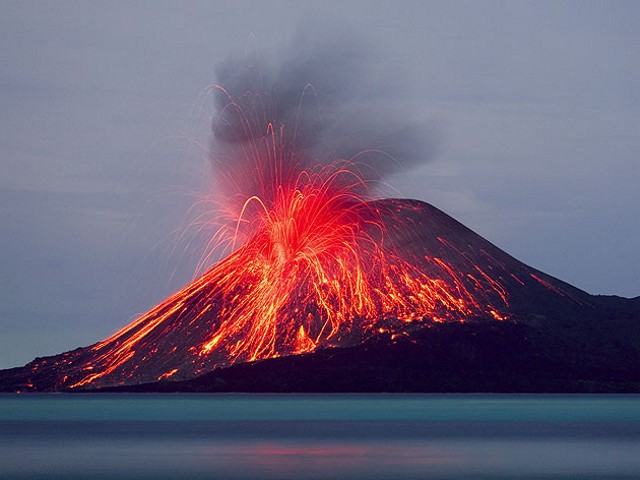
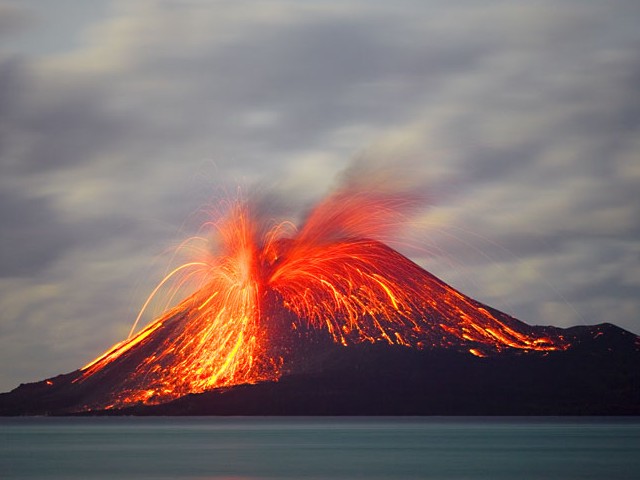
Krakatau (Indonesia) White gas-and-steam plumes and occasional ash plumes during May-August 2023
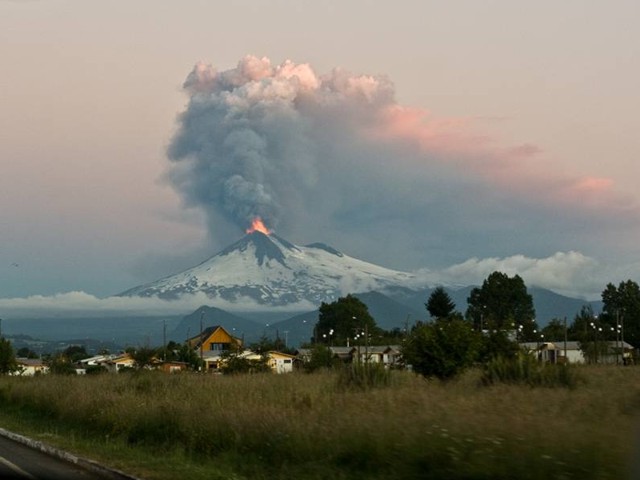
Villarrica (Chile) Strombolian activity, gas-and-ash emissions, and crater incandescence during April-September 2023
Merapi (Indonesia) Frequent incandescent avalanches during April-September 2023
Ebeko (Russia) Moderate explosive activity with ash plumes continued during June-November 2023
Erebus (Antarctica) — January 2024  Cite this Report
Erebus
Antarctica
77.53°S, 167.17°E; summit elev. 3794 m
All times are local (unless otherwise noted)
Lava lake remains active; most thermal alerts recorded since 2019
The lava lake in the summit crater of Erebus has been active since at least 1972. Located in Antarctica overlooking the McMurdo Station on Ross Island, it is the southernmost active volcano on the planet. Because of the remote location, activity is primarily monitored by satellites. This report covers activity during 2023.
The number of thermal alerts recorded by the Hawai'i Institute of Geophysics and Planetology’s MODVOLC Thermal Alerts System increased considerably in 2023 compared to the years 2020-2022 (table 9). In contrast to previous years, the MODIS instruments aboard the Aqua and Terra satellites captured data from Erebus every month during 2023. Consistent with previous years, the lowest number of anomalous pixels were recorded in January, November, and December.
Table 9. Number of monthly MODIS-MODVOLC thermal alert pixels recorded at Erebus during 2017-2023. See BGVN 42:06 for data from 2000 through 2016. The table was compiled using data provided by the HIGP – MODVOLC Thermal Alerts System.
| Year |
Jan |
Feb |
Mar |
Apr |
May |
Jun |
Jul |
Aug |
Sep |
Oct |
Nov |
Dec |
SUM |
| 2017 |
0 |
21 |
9 |
0 |
0 |
1 |
11 |
61 |
76 |
52 |
0 |
3 |
234 |
| 2018 |
0 |
21 |
58 |
182 |
55 |
17 |
137 |
172 |
103 |
29 |
0 |
0 |
774 |
| 2019 |
2 |
21 |
162 |
151 |
55 |
56 |
75 |
53 |
29 |
19 |
1 |
0 |
624 |
| 2020 |
0 |
2 |
16 |
18 |
4 |
4 |
1 |
3 |
18 |
3 |
1 |
6 |
76 |
| 2021 |
0 |
9 |
1 |
0 |
2 |
56 |
46 |
47 |
35 |
52 |
5 |
3 |
256 |
| 2022 |
1 |
13 |
55 |
22 |
15 |
32 |
39 |
19 |
31 |
11 |
0 |
0 |
238 |
| 2023 |
2 |
33 |
49 |
82 |
41 |
32 |
70 |
64 |
42 |
17 |
5 |
11 |
448 |
Sentinel-2 infrared images showed one or two prominent heat sources within the summit crater, accompanied by adjacent smaller sources, similar to recent years (see BGVN 46:01, 47:02, and 48:01). A unique image was obtained on 25 November 2023 by the OLI-2 (Operational Land Imager-2) on Landsat 9, showing the upper part of the volcano surrounded by clouds (figure 32).
Geologic Background. Mount Erebus, the world's southernmost historically active volcano, overlooks the McMurdo research station on Ross Island. It is the largest of three major volcanoes forming the crudely triangular Ross Island. The summit of the dominantly phonolitic volcano has been modified by one or two generations of caldera formation. A summit plateau at about 3,200 m elevation marks the rim of the youngest caldera, which formed during the late-Pleistocene and within which the modern cone was constructed. An elliptical 500 x 600 m wide, 110-m-deep crater truncates the summit and contains an active lava lake within a 250-m-wide, 100-m-deep inner crater; other lava lakes are sometimes present. The glacier-covered volcano was erupting when first sighted by Captain James Ross in 1841. Continuous lava-lake activity with minor explosions, punctuated by occasional larger Strombolian explosions that eject bombs onto the crater rim, has been documented since 1972, but has probably been occurring for much of the volcano's recent history.
Information Contacts: Hawai'i Institute of Geophysics and Planetology (HIGP) - MODVOLC Thermal Alerts System, School of Ocean and Earth Science and Technology (SOEST), Univ. of Hawai'i, 2525 Correa Road, Honolulu, HI 96822, USA (URL: http://modis.higp.hawaii.edu/); Copernicus Browser, Copernicus Data Space Ecosystem, European Space Agency (URL: https://dataspace.copernicus.eu/browser/); NASA Earth Observatory, EOS Project Science Office, NASA Goddard Space Flight Center, Goddard, Maryland, USA (URL: https://earthobservatory.nasa.gov/images/152134/erebus-breaks-through).
Rincon de la Vieja (Costa Rica) — January 2024 Cite this Report
Rincon de la Vieja
Costa Rica
10.83°N, 85.324°W; summit elev. 1916 m
All times are local (unless otherwise noted)
Frequent phreatic explosions during July-December 2023
Rincón de la Vieja is a volcanic complex in Costa Rica with a hot convecting acid lake that exhibits frequent weak phreatic explosions, gas-and-steam emissions, and occasional elevated sulfur dioxide levels (BGVN 45:10, 46:03, 46:11). The current eruption period began June 2021. This report covers activity during July-December 2023 and is based on weekly bulletins and occasional daily reports from the Observatorio Vulcanologico Sismologica de Costa Rica-Universidad Nacional (OVSICORI-UNA).
Numerous weak phreatic explosions continued during July-December 2023, along with gas-and-steam emissions and plumes that rose as high as 3 km above the crater rim. Many weekly OVSICORI-UNA bulletins included the previous week's number of explosions and emissions (table 9). For many explosions, the time of explosion was given (table 10). Frequent seismic activity (long-period earthquakes, volcano-tectonic earthquakes, and tremor) accompanied the phreatic activity.
Table 9. Number of reported weekly phreatic explosions and gas-and-steam emissions at Rincón de la Vieja, July-December 2023. Counts are reported for the week before the Weekly Bulletin date; not all reports included these data. Courtesy of OVSICORI-UNA.
| OVSICORI Weekly Bulletin |
Number of explosions |
Number of emissions |
| 28 Jul 2023 |
6 |
14 |
| 4 Aug 2023 |
10 |
12 |
| 1 Sep 2023 |
13 |
11 |
| 22 Sep 2023 |
12 |
13 |
| 29 Sep 2023 |
6 |
11 |
| 6 Oct 2023 |
12 |
5 |
| 13 Oct 2023 |
7 |
9 |
| 20 Oct 2023 |
1 |
15 |
| 27 Oct 2023 |
3 |
23 |
| 3 Nov 2023 |
3 |
10 |
| 17 Nov 2023 |
0 |
Some |
| 24 Nov 2023 |
0 |
14 |
| 8 Dec 2023 |
4 |
16 |
| 22 Dec 2023 |
8 |
18 |
Table 10. Summary of activity at Rincón de la Vieja during July-December 2023. Weak phreatic explosions and gas emissions are noted where the time of explosion was indicated in the weekly or daily bulletins. Height of plumes or emissions are distance above the crater rim. Courtesy of OVSICORI-UNA.
| Date |
Time |
Description of Activity |
| 1 Jul 2023 |
0156 |
Explosion. |
| 2 Jul 2023 |
0305 |
Explosion. |
| 4 Jul 2023 |
0229, 0635 |
Event at 0635 produced a gas-and-steam plume that rose 700 m and drifted W; seen by residents in Liberia (21 km SW). |
| 9 Jul 2023 |
1843 |
Explosion. |
| 21 Jul 2023 |
0705 |
Explosion. |
| 26 Jul 2023 |
1807 |
Explosion. |
| 28 Jul 2023 |
0802 |
Explosion generated a gas-and-steam plume that rose 500 m. |
| 30 Jul 2023 |
1250 |
Explosion. |
| 31 Jul 2023 |
2136 |
Explosion. |
| 11 Aug 2023 |
0828 |
Explosion. |
| 18 Aug 2023 |
1304 |
Explosion. |
| 21 Aug 2023 |
1224 |
Explosion generated gas-and-steam plumes rose 500-600 m. |
| 22 Aug 2023 |
0749 |
Explosion generated gas-and-steam plumes rose 500-600 m. |
| 24 Aug 2023 |
1900 |
Explosion. |
| 25 Aug 2023 |
0828 |
Event produced a steam-and-gas plume that rose 3 km and drifted NW. |
| 27-28 Aug 2023 |
0813 |
Four small events; the event at 0813 on 28 August lasted two minutes and generated a steam-and-gas plume that rose 2.5 km. |
| 1 Sep 2023 |
1526 |
Explosion generated plume that rose 2 km and ejected material onto the flanks. |
| 2-3 Sep 2023 |
- |
Small explosions detected in infrasound data. |
| 4 Sep 2023 |
1251 |
Gas-and-steam plume rose 1 km and drifted W. |
| 7 Nov 2023 |
1113 |
Explosion. |
| 8 Nov 2023 |
0722 |
Explosion. |
| 12 Nov 2023 |
0136 |
Small gas emissions. |
| 14 Nov 2023 |
0415 |
Small gas emissions. |
According to OVSICORI-UNA, during July-October the average weekly sulfur dioxide (SO2) flux ranged from 68 to 240 tonnes/day. However, in mid-November the flux increased to as high as 334 tonnes/day, the highest value measured in recent years. The high SO2 flux in mid-November was also detected by the TROPOMI instrument on the Sentinel-5P satellite (figure 43).
Geologic Background. Rincón de la Vieja, the largest volcano in NW Costa Rica, is a remote volcanic complex in the Guanacaste Range. The volcano consists of an elongated, arcuate NW-SE-trending ridge constructed within the 15-km-wide early Pleistocene Guachipelín caldera, whose rim is exposed on the south side. Sometimes known as the "Colossus of Guanacaste," it has an estimated volume of 130 km3 and contains at least nine major eruptive centers. Activity has migrated to the SE, where the youngest-looking craters are located. The twin cone of Santa María volcano, the highest peak of the complex, is located at the eastern end of a smaller, 5-km-wide caldera and has a 500-m-wide crater. A Plinian eruption producing the 0.25 km3 Río Blanca tephra about 3,500 years ago was the last major magmatic eruption. All subsequent eruptions, including numerous historical eruptions possibly dating back to the 16th century, have been from the prominent active crater containing a 500-m-wide acid lake located ENE of Von Seebach crater.
Information Contacts: Observatorio Vulcanológico Sismológica de Costa Rica-Universidad Nacional (OVSICORI-UNA), Apartado 86-3000, Heredia, Costa Rica (URL: http://www.ovsicori.una.ac.cr/); NASA Global Sulfur Dioxide Monitoring Page, Atmospheric Chemistry and Dynamics Laboratory, NASA Goddard Space Flight Center (NASA/GSFC), 8800 Greenbelt Road, Goddard MD 20771, USA (URL: https://so2.gsfc.nasa.gov/).
Bezymianny (Russia) — November 2023 Cite this Report
Bezymianny
Russia
55.972°N, 160.595°E; summit elev. 2882 m
All times are local (unless otherwise noted)
Explosion on 18 October 2023 sends ash plume 8 km high; lava flows and incandescent avalanches
Bezymianny, located on Russia’s Kamchatka Peninsula, has had eruptions since 1955 characterized by dome growth, explosions, pyroclastic flows, ash plumes, and ashfall. Activity during November 2022-April 2023 included gas-and-steam emissions, lava dome collapses generating avalanches, and persistent thermal activity. Similar eruptive activity continued from May through October 2023, described here based on information from weekly and daily reports of the Kamchatka Volcano Eruptions Response Team (KVERT), notices from Tokyo VAAC (Volcanic Ash Advisory Center), and from satellite data.
Overall activity decreased after the strong period of activity in late March through April 2023, which included ash explosions during 29 March and 7-8 April 2023 that sent plumes as high as 10-12 km altitude, along with dome growth and lava flows (BGVN 48:05). This reduced activity can be seen in the MIROVA thermal detection system graph (figure 56), which was consistent with data from the MODVOLC thermal detection system and with Sentinel-2 satellite images that showed persistent hotspots in the summit crater when conditions allowed observations. A renewed period of strong activity began in mid-October 2023.
Activity increased significantly on 17 October 2023 when large collapses began during 0700-0830 on the E flanks of the lava dome and continued to after 0930 the next day (figure 57). Ash plumes rose to an altitude of 4.5-5 km, extending 220 km NNE by 18 October. A large explosion at 1630 on 18 October produced an ash plume that rose to an altitude of 11 km (8 km above the summit) and drifted NNE and then NW, extending 900 km NW within two days at an altitude of 8 km. Minor ashfall was noted in Kozyrevsk (45 km WNW). At 0820 on 20 October an ash plume was identified in satellite images drifting 100 km ENE at altitudes of 4-4.5 km.
Lava flows and hot avalanches from the dome down the SE flank continued over the next few days, including 23 October when clear conditions allowed good observations (figures 58 and 59). A large thermal anomaly was observed over the volcano through 24 October, and in the summit crater on 30 October (figure 60). Strong fumarolic activity continued, with numerous avalanches and occasional incandescence. By the last week of October, volcanic activity had decreased to a level consistent with that earlier in the reporting period.
Aviation warnings were frequently updated during 17-20 October. KVERT issued a Volcano Observatory Notice for Aviation (VONA) on 17 October at 1419 and 1727 (0219 and 0527 UTC) raising the Aviation Color Code (ACC) from Yellow to Orange (second highest level). The next day, KVERT issued a VONA at 1705 (0505 UTC) raising the ACC to Red (highest level) but lowered it back to Orange at 2117 (0917 UTC). After another decrease to Yellow and back to Orange, the ACC was reduced to Yellow on 20 October at 1204 (0004 UTC). In addition, the Tokyo VAAC issued a series of Volcanic Ash Advisories beginning on 16 October and continuing through 30 October.
Geologic Background. The modern Bezymianny, much smaller than its massive neighbors Kamen and Kliuchevskoi on the Kamchatka Peninsula, was formed about 4,700 years ago over a late-Pleistocene lava-dome complex and an edifice built about 11,000-7,000 years ago. Three periods of intensified activity have occurred during the past 3,000 years. The latest period, which was preceded by a 1,000-year quiescence, began with the dramatic 1955-56 eruption. This eruption, similar to that of St. Helens in 1980, produced a large open crater that was formed by collapse of the summit and an associated lateral blast. Subsequent episodic but ongoing lava-dome growth, accompanied by intermittent explosive activity and pyroclastic flows, has largely filled the 1956 crater.
Information Contacts: Kamchatka Volcanic Eruptions Response Team (KVERT), Far Eastern Branch, Russian Academy of Sciences, 9 Piip Blvd., Petropavlovsk-Kamchatsky, 683006, Russia (URL: http://www.kscnet.ru/ivs/kvert/); Kamchatka Volcanological Station, Kamchatka Branch of Geophysical Survey, (KB GS RAS), Klyuchi, Kamchatka Krai, Russia (URL: http://volkstat.ru/); Tokyo Volcanic Ash Advisory Center (VAAC), 1-3-4 Otemachi, Chiyoda-ku, Tokyo 100-8122, Japan (URL: http://ds.data.jma.go.jp/svd/vaac/data/); Hawai'i Institute of Geophysics and Planetology (HIGP) - MODVOLC Thermal Alerts System, School of Ocean and Earth Science and Technology (SOEST), Univ. of Hawai'i, 2525 Correa Road, Honolulu, HI 96822, USA (URL: http://modis.higp.hawaii.edu/); MIROVA (Middle InfraRed Observation of Volcanic Activity), a collaborative project between the Universities of Turin and Florence (Italy) supported by the Centre for Volcanic Risk of the Italian Civil Protection Department (URL: http://www.mirovaweb.it/); Copernicus Browser, Copernicus Data Space Ecosystem, European Space Agency (URL: https://dataspace.copernicus.eu/browser/).chr
Kilauea (United States) — January 2023 Cite this Report
Kilauea
United States
19.421°N, 155.287°W; summit elev. 1222 m
All times are local (unless otherwise noted)
Low-level lava effusions in the lava lake at Halema’uma’u during July-December 2022
Kīlauea is the southeastern-most volcano in Hawaii and overlaps the E flank of the Mauna Loa volcano. Its East Rift Zone (ERZ) has been intermittently active for at least 2,000 years. An extended eruption period began in January 1983 and was characterized by open lava lakes and lava flows from the summit caldera and the East Rift Zone. During May 2018 magma migrated into the Lower East Rift Zone (LERZ) and opened 24 fissures along a 6-km-long NE-trending fracture zone that produced lava flows traveling in multiple directions. As lava emerged from the fissures, the lava lake at Halema'uma'u drained and explosions sent ash plumes to several kilometers altitude (BGVN 43:10).
The current eruption period started during September 2021 and has recently been characterized by lava effusions, spatter, and sulfur dioxide emissions in the active Halema’uma’u lava lake (BGVN 47:08). Lava effusions, some spatter, and sulfur dioxide emissions have continued during this reporting period of July through December 2022 using daily reports, volcanic activity notices, and abundant photo, map, and video data from the US Geological Survey's (USGS) Hawaiian Volcano Observatory (HVO).
Summary of activity during July-December 2022. Low-level effusions have continued at the western vent of the Halema’uma’u crater during July through early December 2022. Occasional weak ooze-outs (also called lava break outs) would occur along the margins of the crater floor. The overall level of the active lava lake throughout the reporting period gradually increased due to infilling, however it stagnated in mid-September (table 13). During September through November, activity began to decline, though lava effusions persisted at the western vent. By 9 December, the active part of the lava lake had completely crusted over, and incandescence was no longer visible.
Table 13. Summary of measurements taken during overflights at Kīlauea that show a gradual increase in the active lava lake level and the volume of lava effused since 29 September 2021. Lower activity was reported during September-October. Data collected during July-December 2022. Courtesy of HVO.
| Date: |
Level of the active lava lake (m): |
Cumulative volume of lava effused (million cubic meters): |
| 7 Jul 2022 |
130 |
95 |
| 19 Jul 2022 |
133 |
98 |
| 4 Aug 2022 |
136 |
102 |
| 16 Aug 2022 |
137 |
104 |
| 12 Sep 2022 |
143 |
111 |
| 5 Oct 2022 |
143 |
111 |
| 28 Oct 2022 |
143 |
111 |
Activity during July 2022. Lava effusions were reported from the western vent in the Halema’uma’u crater, along with occasional weak ooze-outs along the margins of the crater floor. The height of the lava lake was variable due to deflation-inflation tilt events; for example, the lake level dropped approximately 3-4 m during a summit deflation-inflation event reported on 1 July. Webcam images taken during the night of 6-12 July showed intermittent low-level spattering at the western vent that rose less than 10 m above the vent (figure 519). Measurements made during an overflight on 7 July indicated that the crater floor was infilled about 130 m and that 95 million cubic meters of lava had been effused since 29 September 2021. A single, relatively small lava ooze-out was active to the S of the lava lake. Around midnight on 8 July there were two brief periods of lava overflow onto the lake margins. On 9 July lava ooze-outs were reported near the SE and NE edges of the crater floor and during 10-11 July they occurred near the E, NE, and NW edges. On 16 July crater incandescence was reported, though the ooze-outs and spattering were not visible. On 18 July overnight webcam images showed incandescence in the western vent complex and two ooze-outs were reported around 0000 and 0200 on 19 July. By 0900 there were active ooze-outs along the SW edge of the crater floor. Measurements made from an overflight on 19 July indicated that the crater floor was infilled about 133 m and 98 million cubic meters of lava had erupted since 29 September 2021 (figure 520). On 20 July around 1600 active ooze-outs were visible along the N edge of the crater, which continued through the next day. Extensive ooze-outs occurred along the W margin during 24 July until 1900; on 26 July minor ooze-outs were noted along the N margin. Minor spattering was visible on 29 July along the E margin of the lake. The sulfur dioxide emission rates ranged 650-2,800 tons per day (t/d), the higher of which was measured on 8 July (figure 519).
Activity during August 2022. The eruption continued in the Halema’uma’u crater at the western vent. According to HVO the lava in the active lake remained at the level of the bounding levees. Occasional minor ooze-outs were observed along the margins of the crater floor. Strong nighttime crater incandescence was visible after midnight on 6 August over the western vent cone. During 6-7 August scattered small lava lobes were active along the crater floor and incandescence persisted above the western vent through 9 August. During 7-9 August HVO reported a single lava effusion source was active along the NW margin of the crater floor. Measurements from an overflight on 4 August indicated that the crater floor was infilled about 136 m total and that 102 million cubic meters of lava had been erupted since the start of the eruption. Lava breakouts were reported along the N, NE, E, S, and W margins of the crater during 10-16 August. Another overflight survey conducted on 16 August indicated that the crater floor infilled about 137 m and 104 million cubic meters of lava had been erupted since September 2021. Measured sulfur dioxide emissions rates ranged 1,150-2,450 t/d, the higher of which occurred on 8 August.
Activity during September 2022. During September, lava effusion continued from the western vent into the active lava lake and onto the crater floor. Intermittent minor ooze-outs were reported through the month. A small ooze-out was visible on the W crater floor margin at 0220 on 2 September, which showed decreasing surface activity throughout the day, but remained active through 3 September. On 3 September around 1900 a lava outbreak occurred along the NW margin of the crater floor but had stopped by the evening of 4 September. Field crews monitoring the summit lava lake on 9 September observed spattering on the NE margin of the lake that rose no higher than 10 m, before falling back onto the lava lake crust (figure 521). Overflight measurements on 12 September indicated that the crater floor was infilled a total of 143 m and 111 million cubic meters of lava had been erupted since September 2021. Extensive breakouts in the W and N part of the crater floor were reported at 1600 on 20 September and continued into 26 September. The active part of the lava lake dropped by 10 m while other parts of the crater floor dropped by several meters. Summit tiltmeters recorded a summit seismic swarm of more than 80 earthquakes during 1500-1800 on 21 September, which occurred about 1.5 km below Halema’uma’u; a majority of these were less than Mw 2. By 22 September the active part of the lava lake was infilled about 2 m. On 23 September the western vent areas exhibited several small spatter cones with incandescent openings, along with weak, sporadic spattering (figure 522). The sulfur dioxide emission rate ranged from 930 t/d to 2,000 t/d, the higher of which was measured on 6 September.
Activity during October 2022. Activity during October declined slightly compared to previous months, though lava effusions persisted from the western vent into the active lava lake and onto the crater floor during October (figure 523). Slight variations in the lava lake were noted throughout the month. HVO reported that around 0600 on 3 October the level of the lava lake has lowered slightly. Overflight measurements taken on 5 October indicated that the crater floor was infilled a total of about 143 m and that 111 million cubic meters of lava had been effused since September 2021. During 6-7 October the lake gradually rose 0.5 m. Sulfur dioxide measurements made on 22 October had an emission rate of 700 t/d. Another overflight taken on 28 October showed that there was little to no change in the elevation of the crater floor: the crater floor was infilled a total of 143 m and 111 million cubic meters of lava had erupted since the start of the eruption.
Activity during November 2022. Activity remained low during November, though HVO reported that lava from the western vent continued to effuse into the active lava lake and onto the crater floor throughout the month. The rate of sulfur dioxide emissions during November ranged from 300-600 t/d, the higher amount of which occurred on 9 November.
Activity during December 2022. Similar low activity was reported during December, with lava effusing from the western vent into the active lava lake and onto the crater floor. During 4-5 December the active part of the lava lake was slightly variable in elevation and fluctuated within 1 m. On 9 December HVO reported that lava was no longer erupting from the western vent in the Halema’uma’u crater and that sulfur dioxide emissions had returned to near pre-eruption background levels; during 10-11 December, the lava lake had completely crusted over, and no incandescence was visible (figure 524). Time lapse camera images covering the 4-10 December showed that the crater floor showed weak deflation and no inflation. Some passive events of crustal overturning were reported during 14-15 December, which brought fresh incandescent lava to the lake surface. The sulfur dioxide emission rate was approximately 200 t/d on 14 December. A smaller overturn event on 17 December and another that occurred around 0000 and into the morning of 20 December were also detected. A small seismic swarm was later detected on 30 December.
Geologic Background. Kilauea overlaps the E flank of the massive Mauna Loa shield volcano in the island of Hawaii. Eruptions are prominent in Polynesian legends; written documentation since 1820 records frequent summit and flank lava flow eruptions interspersed with periods of long-term lava lake activity at Halemaumau crater in the summit caldera until 1924. The 3 x 5 km caldera was formed in several stages about 1,500 years ago and during the 18th century; eruptions have also originated from the lengthy East and Southwest rift zones, which extend to the ocean in both directions. About 90% of the surface of the basaltic shield volcano is formed of lava flows less than about 1,100 years old; 70% of the surface is younger than 600 years. The long-term eruption from the East rift zone between 1983 and 2018 produced lava flows covering more than 100 km2, destroyed hundreds of houses, and added new coastline.
Information Contacts: Hawaiian Volcano Observatory (HVO), U.S. Geological Survey, PO Box 51, Hawai'i National Park, HI 96718, USA (URL: http://hvo.wr.usgs.gov/).
Nyamulagira (DR Congo) — November 2023 Cite this Report
Nyamulagira
DR Congo
1.408°S, 29.2°E; summit elev. 3058 m
All times are local (unless otherwise noted)
Lava flows and thermal activity during May-October 2023
Nyamulagira (also known as Nyamuragira) is a shield volcano in the Democratic Republic of Congo with the summit truncated by a small 2 x 2.3 km caldera with walls up to about 100 m high. Documented eruptions have occurred within the summit caldera, as well as from numerous flank fissures and cinder cones. The current eruption period began in April 2018 and has more recently been characterized by summit crater lava flows and thermal activity (BGVN 48:05). This report describes lava flows and variable thermal activity during May through October 2023, based on information from the Observatoire Volcanologique de Goma (OVG) and various satellite data.
Lava lake activity continued during May. The MIROVA (Middle InfraRed Observation of Volcanic Activity) system recorded moderate-to-strong thermal activity throughout the reporting period; activity was more intense during May and October and relatively weaker from June through September (figure 95). The MODVOLC thermal algorithm, detected a total of 209 thermal alerts. There were 143 hotspots detected during May, eight during June, nine during September, and 49 during October. This activity was also reflected in infrared satellite images, where a lava flow was visible in the NW part of the crater on 7 May and strong activity was seen in the center of the crater on 4 October (figure 96). Another infrared satellite image taken on 12 May showed still active lava flows along the NW margin of the crater. According to OVG lava effusions were active during 7-29 May and moved to the N and NW parts of the crater beginning on 9 May. Strong summit crater incandescence was visible from Goma (27 km S) during the nights of 17, 19, and 20 May (figure 97). On 17 May there was an increase in eruptive activity, which peaked at 0100 on 20 May. Notable sulfur dioxide plumes drifted NW and W during 19-20 May (figure 98). Drone footage acquired in partnership with the USGS (United States Geological Survey) on 20 May captured images of narrow lava flows that traveled about 100 m down the W flank (figure 99). Data from the Rumangabo seismic station indicated a decreasing trend in activity during 17-21 May. Although weather clouds prevented clear views of the summit, a strong thermal signature on the NW flank was visible in an infrared satellite image on 22 May, based on an infrared satellite image. On 28 May the lava flows on the upper W flank began to cool and solidify. By 29 May seismicity returned to levels similar to those recorded before the 17 May increase. Lava effusion continued but was confined to the summit crater; periodic crater incandescence was observed.
Low-level activity was noted during June through October. On 1 June OVG reported that seismicity remained at lower levels and that crater incandescence had been absent for three days, though infrared satellite imagery showed continued lava effusion in the summit crater. The lava flows on the flanks covered an estimated 0.6 km2. Satellite imagery continued to show thermal activity confined to the lava lake through October (figure 96), although no lava flows or significant sulfur dioxide emissions were reported.
Geologic Background. Africa's most active volcano, Nyamulagira (also known as Nyamuragira), is a massive high-potassium basaltic shield about 25 km N of Lake Kivu and 13 km NNW of the steep-sided Nyiragongo volcano. The summit is truncated by a small 2 x 2.3 km caldera that has walls up to about 100 m high. Documented eruptions have occurred within the summit caldera, as well as from the numerous flank fissures and cinder cones. A lava lake in the summit crater, active since at least 1921, drained in 1938, at the time of a major flank eruption. Recent lava flows extend down the flanks more than 30 km from the summit as far as Lake Kivu; extensive lava flows from this volcano have covered 1,500 km2 of the western branch of the East African Rift.
Information Contacts: Observatoire Volcanologique de Goma (OVG), Departement de Geophysique, Centre de Recherche en Sciences Naturelles, Lwiro, D.S. Bukavu, DR Congo; Hawai'i Institute of Geophysics and Planetology (HIGP) - MODVOLC Thermal Alerts System, School of Ocean and Earth Science and Technology (SOEST), Univ. of Hawai'i, 2525 Correa Road, Honolulu, HI 96822, USA (URL: http://modis.higp.hawaii.edu/); MIROVA (Middle InfraRed Observation of Volcanic Activity), a collaborative project between the Universities of Turin and Florence (Italy) supported by the Centre for Volcanic Risk of the Italian Civil Protection Department (URL: http://www.mirovaweb.it/); NASA Global Sulfur Dioxide Monitoring Page, Atmospheric Chemistry and Dynamics Laboratory, NASA Goddard Space Flight Center (NASA/GSFC), 8800 Greenbelt Road, Goddard, Maryland, USA (URL: https://so2.gsfc.nasa.gov/); Copernicus Browser, Copernicus Data Space Ecosystem, European Space Agency (URL: https://dataspace.copernicus.eu/browser/); Charles Balagizi, Goma Volcano Observatory, Departement de Geophysique, Centre de Recherche en Sciences Naturelles, Lwiro, D.S. Bukavu, DR Congo.
Bagana (Papua New Guinea) — October 2023 Cite this Report
Bagana
Papua New Guinea
6.137°S, 155.196°E; summit elev. 1855 m
All times are local (unless otherwise noted)
Explosions, ash plumes, ashfall, and lava flows during April-September 2023
The remote volcano of Bagana is located in central Bougainville Island, Papua New Guinea. Recorded eruptions date back to 1842 and activity has consisted of effusive activity that has built a small lava dome in the summit crater and occasional explosions that produced pyroclastic flows. The most recent eruption has been ongoing since February 2000 and has produced occasional explosions, ash plumes, and lava flows. More recently, activity has been characterized by ongoing effusive activity and ash emissions (BGVN 48:04). This report updates activity from April through September 2023 that has consisted of explosions, ash plumes, ashfall, and lava flows, using information from the Darwin Volcanic Ash Advisory Center (VAAC) and satellite data.
An explosive eruption was reported on 7 July that generated a large gas-and-ash plume to high altitudes and caused significant ashfall in local communities; the eruption plume had reached upper tropospheric (16-18 km altitude) altitudes by 2200, according to satellite images. Sulfur dioxide plumes were detected in satellite images on 8 July and indicated that the plume was likely a mixture of gas, ice, and ash. A report issued by the Autonomous Bougainville Government (ABG) (Torokina District, Education Section) on 10 July noted that significant ash began falling during 2000-2100 on 7 July and covered most areas in the Vuakovi, Gotana (9 km SW), Koromaketo, Laruma (25 km W) and Atsilima (27 km NW) villages. Pyroclastic flows also occurred, according to ground-based reports; small deposits confined to one drainage were inspected by RVO during an overflight on 17 July and were confirmed to be from the 7 July event. Ashfall continued until 10 July and covered vegetation, which destroyed bushes and gardens and contaminated rivers and streams.
RVO reported another eruption on 14 July. The Darwin VAAC stated that an explosive event started around 0830 on 15 July and produced an ash plume that rose to 16.5 km altitude by 1000 and drifted N, according to satellite images. The plume continued to drift N and remained visible through 1900, and by 2150 it had dissipated.
Ashfall likely from both the 7 and 15 July events impacted about 8,111 people in Torokina (20 km SW), including Tsito/Vuakovi, Gotana, Koromaketo, Kenaia, Longkogari, Kenbaki, Piva (13 km SW), and Atsinima, and in the Tsitovi district, according to ABG. Significant ashfall was also reported in Ruruvu (22 km N) in the Wakunai District of Central Bougainville, though the thickness of these deposits could not be confirmed. An evacuation was called for the villages in Wakunai, where heavy ashfall had contaminated water sources; the communities of Ruruvu, Togarau, Kakarapaia, Karauturi, Atao, and Kuritaturi were asked to evacuate to a disaster center at the Wakunai District Station, and communities in Torokina were asked to evacuate to the Piva District station. According to a news article, more than 7,000 people needed temporary accommodations, with about 1,000 people in evacuation shelters. Ashfall had deposited over a broad area, contaminating water supplies, affecting crops, and collapsing some roofs and houses in rural areas. Schools were temporarily shut down. Intermittent ash emissions continued through the end of July and drifted NNW, NW, and SW. Fine ashfall was reported on the coast of Torokina, and ash plumes also drifted toward Laruma and Atsilima.
A small explosive eruption occurred at 2130 on 28 July that ejected material from the crater vents, according to reports from Torokina, in addition to a lava flow that contained two lobes. A second explosion was detected at 2157. Incandescence from the lava flow was visible from Piva as it descended the W flank around 2000 on 29 July (figure 47). The Darwin VAAC reported that a strong thermal anomaly was visible in satellite images during 30-31 July and that ash emissions rose to 2.4 km altitude and drifted WSW on 30 July. A ground report from RVO described localized emissions at 0900 on 31 July.
The Darwin VAAC reported that ash plumes were identified in satellite imagery at 0800 and 1220 on 12 August and rose to 2.1 km and 3 km altitude and drifted NW and W, respectively. A news report stated that aid was sent to more than 6,300 people that were adversely affected by the eruption. Photos taken during 17-19 August showed ash emissions rising no higher than 1 km above the summit and drifting SE. A small explosion generated an ash plume during the morning of 19 August. Deposits from small pyroclastic flows were also captured in the photos. Satellite images captured lava flows and pyroclastic flow deposits. Two temporary seismic stations were installed near Bagana on 17 August at distances of 7 km WSW (Vakovi station) and 11 km SW (Kepox station). The Kepox station immediately started to record continuous, low-frequency background seismicity.
Satellite data. Little to no thermal activity was detected during April through mid-July 2023; only one anomaly was recorded during early April and one during early June, according to MIROVA (Middle InfraRed Observation of Volcanic Activity) data (figure 48). Thermal activity increased in both power and frequency during mid-July through September, although there were still some short gaps in detected activity. MODVOLC also detected increased thermal activity during August; thermal hotspots were detected a total of five times on 19, 20, and 27 August. Weak thermal anomalies were also captured in infrared satellite images on clear weather days throughout the reporting period on 7, 12, and 17 April, 27 May, 1, 6, 16, and 31 July, and 19 September (figure 48); a strong thermal anomaly was visible on 31 July. Distinct sulfur dioxide plumes that drifted generally NW were intermittently captured by the TROPOMI instrument on the Sentinel-5P satellite and sometimes exceeded two Dobson Units (DUs) (figure 49).
Geologic Background. Bagana volcano, in a remote portion of central Bougainville Island, is frequently active. This massive symmetrical cone was largely constructed by an accumulation of viscous andesitic lava flows. The entire edifice could have been constructed in about 300 years at its present rate of lava production. Eruptive activity is characterized by non-explosive effusion of viscous lava that maintains a small lava dome in the summit crater, although occasional explosive activity produces pyroclastic flows. Lava flows with tongue-shaped lobes up to 50 m thick and prominent levees descend the flanks on all sides.
Information Contacts: Rabaul Volcano Observatory (RVO), Geohazards Management Division, Department of Mineral Policy and Geohazards Management (DMPGM), PO Box 3386, Kokopo, East New Britain Province, Papua New Guinea; Darwin Volcanic Ash Advisory Centre (VAAC), Bureau of Meteorology, Northern Territory Regional Office, PO Box 40050, Casuarina, NT 0811, Australia (URL: http://www.bom.gov.au/info/vaac/); MIROVA (Middle InfraRed Observation of Volcanic Activity), a collaborative project between the Universities of Turin and Florence (Italy) supported by the Centre for Volcanic Risk of the Italian Civil Protection Department (URL: http://www.mirovaweb.it/); Hawai'i Institute of Geophysics and Planetology (HIGP) - MODVOLC Thermal Alerts System, School of Ocean and Earth Science and Technology (SOEST), Univ. of Hawai'i, 2525 Correa Road, Honolulu, HI 96822, USA (URL: http://modis.higp.hawaii.edu/); NASA Global Sulfur Dioxide Monitoring Page, Atmospheric Chemistry and Dynamics Laboratory, NASA Goddard Space Flight Center (NASA/GSFC), 8800 Greenbelt Road, Goddard, Maryland, USA (URL: https://so2.gsfc.nasa.gov/); Copernicus Browser, Copernicus Data Space Ecosystem, European Space Agency (URL: https://dataspace.copernicus.eu/browser/); Autonomous Bougainville Government, P.O Box 322, Buka, AROB, PNG (URL: https://abg.gov.pg/); Andrew Tupper (Twitter: @andrewcraigtupp); Simon Carn, Geological and Mining Engineering and Sciences, Michigan Technological University, 1400 Townsend Drive, Houghton, MI 49931, USA (URL: http://www.volcarno.com/, Twitter: @simoncarn); Radio NZ (URL: https://www.rnz.co.nz/news/pacific/494464/more-than-7-000-people-in-bougainville-need-temporary-accommodation-after-eruption); USAID, 1300 Pennsylvania Ave, NW, Washington DC 20004, USA (URL: https://www.usaid.gov/pacific-islands/press-releases/aug-08-2023-united-states-provides-immediate-emergency-assistance-support-communities-affected-mount-bagana-volcanic-eruptions).
Mayon (Philippines) — October 2023 Cite this Report
Mayon
Philippines
13.257°N, 123.685°E; summit elev. 2462 m
All times are local (unless otherwise noted)
Lava flows, pyroclastic flows, ash emissions, and seismicity during April-September 2023
Mayon is located in the Philippines and has steep upper slopes capped by a small summit crater. Historical eruptions date back to 1616 CE that have been characterized by Strombolian eruptions, lava flows, pyroclastic flows, and mudflows. Eruptions mostly originated from a central conduit. Pyroclastic flows and mudflows have commonly descended many of the approximately 40 drainages that surround the volcano. The most recent eruption occurred during June through October 2022 and consisted of lava dome growth and gas-and-steam emissions (BGVN 47:12). A new eruption was reported during late April 2023 and has included lava flows, pyroclastic density currents, ash emissions, and seismicity. This report covers activity during April through September 2023 based on daily bulletins from the Philippine Institute of Volcanology and Seismology (PHIVOLCS).
During April through September 2023, PHIVOLCS reported near-daily rockfall events, frequent volcanic earthquakes, and sulfur dioxide measurements. Gas-and-steam emissions rose 100-900 m above the crater and drifted in different directions. Nighttime crater incandescence was often visible during clear weather and was accompanied by incandescent avalanches of material. Activity notably increased during June when lava flows were reported on the S, SE, and E flanks (figure 52). The MIROVA graph (Middle InfraRed Observation of Volcanic Activity) showed strong thermal activity coincident with these lava flows, which remained active through September (figure 53). According to the MODVOLC thermal algorithm, a total of 110 thermal alerts were detected during the reporting period: 17 during June, 40 during July, 27 during August, and 26 during September. During early June, pyroclastic density currents (PDCs) started to occur more frequently.
Low activity was reported during much of April and May; gas-and-steam emissions rose 100-900 m above the crater and generally drifted in different directions. A total of 52 rockfall events and 18 volcanic earthquakes were detected during April and 147 rockfall events and 13 volcanic events during May. Sulfur dioxide flux measurements ranged between 400-576 tons per day (t/d) during April, the latter of which was measured on 29 April and between 162-343 t/d during May, the latter of which was measured on 13 May.
Activity during June increased, characterized by lava flows, pyroclastic density currents (PDCs), crater incandescence and incandescent rockfall events, gas-and-steam emissions, and continued seismicity. Weather clouds often prevented clear views of the summit, but during clear days, moderate gas-and-steam emissions rose 100-2,500 m above the crater and drifted in multiple directions. A total of 6,237 rockfall events and 288 volcanic earthquakes were detected. The rockfall events often deposited material on the S and SE flanks within 700-1,500 m of the summit crater and ash from the events drifted SW, S, SE, NE, and E. Sulfur dioxide emissions ranged between 149-1,205 t/d, the latter of which was measured on 10 June. Short-term observations from EDM and electronic tiltmeter monitoring indicated that the upper slopes were inflating since February 2023. Longer-term ground deformation parameters based on EDM, precise leveling, continuous GPS, and electronic tilt monitoring indicated that the volcano remained inflated, especially on the NW and SE flanks. At 1000 on 5 June the Volcano Alert Level (VAL) was raised to 2 (on a 0-5 scale). PHIVOLCS noted that although low-level volcanic earthquakes, ground deformation, and volcanic gas emissions indicated unrest, the steep increase in rockfall frequency may indicate increased dome activity.
A total of 151 dome-collapse PDCs occurred during 8-9 and 11-30 June, traveled 500-2,000 m, and deposited material on the S flank within 2 km of the summit crater. During 8-9 June the VAL was raised to 3. At approximately 1947 on 11 June lava flow activity was reported; two lobes traveled within 500 m from the crater and deposited material on the S (Mi-isi), SE (Bonga), and E (Basud) flanks. Weak seismicity accompanied the lava flow and slight inflation on the upper flanks. This lava flow remained active through 30 June, moving down the S and SE flank as far as 2.5 km and 1.8 km, respectively and depositing material up to 3.3 km from the crater. During 15-16 June traces of ashfall from the PDCs were reported in Sitio Buga, Nabonton, City of Ligao and Purok, and San Francisco, Municipality of Guinobatan. During 28-29 June there were two PDCs generated by the collapse of the lava flow front, which generated a light-brown ash plume 1 km high. Satellite monitors detected significant concentrations of sulfur dioxide beginning on 29 June. On 30 June PDCs primarily affected the Basud Gully on the E flank, the largest of which occurred at 1301 and lasted eight minutes, based on the seismic record. Four PDCs generated between 1800 and 2000 that lasted approximately four minutes each traveled 3-4 km on the E flank and generated an ash plume that rose 1 km above the crater and drifted N and NW. Ashfall was recorded in Tabaco City.
Similar strong activity continued during July; slow lava effusion remained active on the S and SE flanks and traveled as far as 2.8 km and 2.8 km, respectively and material was deposited as far as 4 km from the crater. There was a total of 6,983 rockfall events and 189 PDCs that affected the S, SE, and E flanks. The volcano network detected a total of 2,124 volcanic earthquakes. Continuous gas-and-steam emissions rose 200-2,000 m above the crater and drifted in multiple directions. Sulfur dioxide emissions averaged 792-4,113 t/d, the latter of which was measured on 28 July. During 2-4 July three PDCs were generated from the collapse of the lava flow and resulting light brown plumes rose 200-300 m above the crater. Continuous tremor pulses were reported beginning at 1547 on 3 July through 7 July at 1200, at 2300 on 8 July and going through 0300 on 10 July, and at 2300 on 16 July, as recorded by the seismic network. During 6-9 July there were 10 lava flow-collapse-related PDCs that generated light brown plumes 300-500 m above the crater. During 10-11 July light ashfall was reported in some areas of Mabinit, Legazpi City, Budiao and Salvacion, Daraga, and Camalig, Albay. By 18 July the lava flow advanced 600 m on the E flank as well.
During 1733 on 18 July and 0434 on 19 July PHIVOLCS reported 30 “ashing” events, which are degassing events accompanied by audible thunder-like sounds and entrained ash at the crater, which produced short, dark plumes that drifted SW. These events each lasted 20-40 seconds, and plume heights ranged from 150-300 m above the crater, as recorded by seismic, infrasound, visual, and thermal monitors. Three more ashing events occurred during 19-20 July. Short-term observations from electronic tilt and GPS monitoring indicate deflation on the E lower flanks in early July and inflation on the NW middle flanks during the third week of July. Longer-term ground deformation parameters from EDM, precise leveling, continuous GPS, and electronic tilt monitoring indicated that the volcano was still generally inflated relative to baseline levels. A short-lived lava pulse lasted 28 seconds at 1956 on 21 July, which was accompanied by seismic and infrasound signals. By 22 July, the only lava flow that remained active was on the SE flank, and continued to extend 3.4 km, while those on the S and E flanks weakened markedly. One ashing event was detected during 30-31 July, whereas there were 57 detected during 31 July-1 August; according to PHIVOLCS beginning at approximately 1800 on 31 July eruptive activity was dominated by phases of intermittent ashing, as well as increased in the apparent rates of lava effusion from the summit crater. The ashing phases consisted of discrete events recorded as low-frequency volcanic earthquakes (LFVQ) typically 30 seconds in duration, based on seismic and infrasound signals. Gray ash plume rose 100 m above the crater and generally drifted NE. Shortly after these ashing events began, new lava began to effuse rapidly from the crater, feeding the established flowed on the SE, E, and E flanks and generating frequent rockfall events.
Intensified unrest persisted during August. There was a total of 4,141 rockfall events, 2,881 volcanic earthquakes, which included volcanic tremor events, 32 ashing events, and 101 PDCs detected throughout the month. On clear weather days, gas-and-steam emissions rose 300-1,500 m above the crater and drifted in different directions (figure 54). Sulfur dioxide emissions averaged 735-4,756 t/d, the higher value of which was measured on 16 August. During 1-2 August the rate of lava effusion decreased, but continued to feed the flows on the SE, S, and E flanks, maintaining their advances to 3.4 km, 2.8 km, and 1.1 km from the crater, respectively (figure 55). Rockfall and PDCs generated by collapses at the lava flow margins and from the summit dome deposited material within 4 km of the crater. During 3-4 August there were 10 tremor events detected that lasted 1-4 minutes. Short-lived lava pulse lasted 35 seconds and was accompanied by seismic and infrasound signals at 0442 on 6 August. Seven collapses were recorded at the front of the lava flow during 12-14 August.
During September, similar activity of slow lava effusion, PDCs, gas-and-steam emissions, and seismicity continued. There was a total of 4,452 rockfall events, 329 volcanic earthquakes, which included volcanic tremor events, two ashing events, and 85 PDCs recorded throughout the month. On clear weather days, gas-and-steam emissions rose 100-1,500 m above the crater and drifted in multiple directions. Sulfur dioxide emissions averaged 609-2,252 t/d, the higher average of which was measured on 6 September. Slow lava effusion continued advancing on the SE, S, and E flanks, maintaining lengths of 3.4 km, 2.8 km, and 1.1 km, respectively. Rockfall and PDC events generated by collapses along the lava flow margins and at the summit dome deposited material within 4 km of the crater.
Geologic Background. Symmetrical Mayon, which rises above the Albay Gulf NW of Legazpi City, is the most active volcano of the Philippines. The steep upper slopes are capped by a small summit crater. Recorded eruptions since 1616 CE range from Strombolian to basaltic Plinian, with cyclical activity beginning with basaltic eruptions, followed by longer periods of andesitic lava flows. Eruptions occur predominately from the central conduit and have also produced lava flows that travel far down the flanks. Pyroclastic density currents and mudflows have commonly swept down many of the approximately 40 ravines that radiate from the summit and have often damaged populated lowland areas. A violent eruption in 1814 killed more than 1,200 people and devastated several towns.
Information Contacts: Philippine Institute of Volcanology and Seismology (PHIVOLCS), Department of Science and Technology, University of the Philippines Campus, Diliman, Quezon City, Philippines (URL: http://www.phivolcs.dost.gov.ph/); MIROVA (Middle InfraRed Observation of Volcanic Activity), a collaborative project between the Universities of Turin and Florence (Italy) supported by the Centre for Volcanic Risk of the Italian Civil Protection Department (URL: http://www.mirovaweb.it/); Hawai'i Institute of Geophysics and Planetology (HIGP) - MODVOLC Thermal Alerts System, School of Ocean and Earth Science and Technology (SOEST), Univ. of Hawai'i, 2525 Correa Road, Honolulu, HI 96822, USA (URL: http://modis.higp.hawaii.edu/); Copernicus Browser, Copernicus Data Space Ecosystem, European Space Agency (URL: https://dataspace.copernicus.eu/browser/); William Rogers, Legazpi City, Albay Province, Philippines.
Nishinoshima (Japan) — October 2023 Cite this Report
Nishinoshima
Japan
27.247°N, 140.874°E; summit elev. 100 m
All times are local (unless otherwise noted)
Eruption plumes and gas-and-steam plumes during May-August 2023
Nishinoshima, located about 1,000 km S of Tokyo, is a small island in the Ogasawara Arc in Japan. The island is the summit of a massive submarine volcano that has prominent submarine peaks to the S, W, and NE. Eruptions date back to 1973 and the current eruption period began in October 2022. Recent activity has consisted of small ash plumes and fumarolic activity (BGVN 48:07). This report covers activity during May through August 2023, using information from monthly reports of the Japan Meteorological Agency (JMA) monthly reports and satellite data.
Activity during May through June was relatively low. The Japan Coast Guard (JCG) did overflights on 14 and 22 June and reported white gas-and-steam emissions rising 600 m and 1,200 m from the central crater of the pyroclastic cone, respectively (figure 125). In addition, multiple white gas-and-steam emissions rose from the inner rim of the W side of the crater and from the SE flank of the pyroclastic cone. Discolored brown-to-green water was observed around almost the entire perimeter of the island; on 22 June light green discolored water was observed off the S coast of the island.
Observations from the Himawari meteorological satellite confirmed an eruption on 9 and 10 July. An eruption plume rose 1.6 km above the crater and drifted N around 1300 on 9 July. Satellite images acquired at 1420 and 2020 on 9 July and at 0220 on 10 July showed continuing emissions that rose 1.3-1.6 km above the crater and drifted NE and N. The Tokyo VAAC reported that an ash plume seen by a pilot and identified in a satellite image at 0630 on 21 July rose to 3 km altitude and drifted S.
Aerial observations conducted by JCG on 8 August showed a white-and-gray plume rising from the central crater of the pyroclastic cone, and multiple white gas-and-steam emissions were rising from the inner edge of the western crater and along the NW-SE flanks of the island (figure 126). Brown-to-green discolored water was also noted around the perimeter of the island.
Intermittent low-to-moderate power thermal anomalies were recorded in the MIROVA graph (Middle InfraRed Observation of Volcanic Activity), showing an increase in both frequency and power beginning in July (figure 127). This increase in activity coincides with eruptive activity on 9 and 10 July, characterized by eruption plumes. According to the MODVOLC thermal alert algorithm, one thermal hotspot was recorded on 20 July. Weak thermal anomalies were also detected in infrared satellite imagery, accompanied by strong gas-and-steam plumes (figure 128).
Geologic Background. The small island of Nishinoshima was enlarged when several new islands coalesced during an eruption in 1973-74. Multiple eruptions that began in 2013 completely covered the previous exposed surface and continued to enlarge the island. The island is the summit of a massive submarine volcano that has prominent peaks to the S, W, and NE. The summit of the southern cone rises to within 214 m of the ocean surface 9 km SSE.
Information Contacts: Japan Meteorological Agency (JMA), 1-3-4 Otemachi, Chiyoda-ku, Tokyo 100-8122, Japan (URL: http://www.jma.go.jp/jma/indexe.html); Tokyo Volcanic Ash Advisory Center (VAAC), 1-3-4 Otemachi, Chiyoda-ku, Tokyo 100-8122, Japan (URL: http://ds.data.jma.go.jp/svd/vaac/data/); MIROVA (Middle InfraRed Observation of Volcanic Activity), a collaborative project between the Universities of Turin and Florence (Italy) supported by the Centre for Volcanic Risk of the Italian Civil Protection Department (URL: http://www.mirovaweb.it/); Copernicus Browser, Copernicus Data Space Ecosystem, European Space Agency (URL: https://dataspace.copernicus.eu/browser/).
Krakatau (Indonesia) — October 2023 Cite this Report
Krakatau
Indonesia
6.1009°S, 105.4233°E; summit elev. 285 m
All times are local (unless otherwise noted)
White gas-and-steam plumes and occasional ash plumes during May-August 2023
Krakatau is located in the Sunda Strait between Java and Sumatra, Indonesia. Caldera collapse during the catastrophic 1883 eruption destroyed Danan and Perbuwatan cones and left only a remnant of Rakata. The post-collapse cone of Anak Krakatau (Child of Krakatau) was constructed within the 1883 caldera at a point between the former Danan and Perbuwatan cones; it has been the site of frequent eruptions since 1927. The current eruption period began in May 2021 and has recently consisted of Strombolian eruptions and ash plumes (BGVN 48:07). This report describes lower levels of activity consisting of ash and white gas-and-steam plumes during May through August 2023, based on information provided by the Indonesian Center for Volcanology and Geological Hazard Mitigation, referred to as Pusat Vulkanologi dan Mitigasi Bencana Geologi (PVMBG), MAGMA Indonesia, and satellite data.
Activity was relatively low during May and June. Daily white gas-and-steam emissions rose 25-200 m above the crater and drifted in different directions. Five ash plumes were detected at 0519 on 10 May, 1241 on 11 May, 0920 on 12 May, 2320 on 12 May, and at 0710 on 13 May, and rose 1-2.5 km above the crater and drifted SW. A webcam image taken on 12 May showed ejection of incandescent material above the vent. A total of nine ash plumes were detected during 6-11 June: at 1434 and 00220 on 6 and 7 June the ash plumes rose 500 m above the crater and drifted NW, at 1537 on 8 June the ash plume rose 1 km above the crater and drifted SW, at 0746 and at 0846 on 9 June the ash plumes rose 800 m and 3 km above the crater and drifted SW, respectively, at 0423, 1431, and 1750 on 10 June the ash plumes rose 2 km, 1.5 km, and 3.5 km above the crater and drifted NW, respectively, and at 0030 on 11 June an ash plume rose 2 km above the crater and drifted NW. Webcam images taken on 10 and 11 June at 0455 and 0102, respectively, showed incandescent material ejected above the vent. On 19 June an ash plume at 0822 rose 1.5 km above the crater and drifted SE.
Similar low activity of white gas-and-steam emissions and few ash plumes were reported during July and August. Daily white gas-and-steam emissions rose 25-300 m above the crater and drifted in multiple directions. Three ash plumes were reported at 0843, 0851, and 0852 on 20 July that rose 500-2,000 m above the crater and drifted NW.
The MIROVA (Middle InfraRed Observation of Volcanic Activity) graph of MODIS thermal anomaly data showed intermittent low-to-moderate power thermal anomalies during May through August 2023 (figure 140). Although activity was often obscured by weather clouds, a thermal anomaly was visible in an infrared satellite image of the crater on 12 May, accompanied by an eruption plume that drifted SW (figure 141).
Geologic Background. The renowned Krakatau (frequently mis-named as Krakatoa) volcano lies in the Sunda Strait between Java and Sumatra. Collapse of an older edifice, perhaps in 416 or 535 CE, formed a 7-km-wide caldera. Remnants of that volcano are preserved in Verlaten and Lang Islands; subsequently the Rakata, Danan, and Perbuwatan cones were formed, coalescing to create the pre-1883 Krakatau Island. Caldera collapse during the catastrophic 1883 eruption destroyed Danan and Perbuwatan, and left only a remnant of Rakata. This eruption caused more than 36,000 fatalities, most as a result of tsunamis that swept the adjacent coastlines of Sumatra and Java. Pyroclastic surges traveled 40 km across the Sunda Strait and reached the Sumatra coast. After a quiescence of less than a half century, the post-collapse cone of Anak Krakatau (Child of Krakatau) was constructed within the 1883 caldera at a point between the former Danan and Perbuwatan cones. Anak Krakatau has been the site of frequent eruptions since 1927.
Information Contacts: Pusat Vulkanologi dan Mitigasi Bencana Geologi (PVMBG, also known as Indonesian Center for Volcanology and Geological Hazard Mitigation, CVGHM), Jalan Diponegoro 57, Bandung 40122, Indonesia (URL: http://www.vsi.esdm.go.id/); MAGMA Indonesia, Kementerian Energi dan Sumber Daya Mineral (URL: https://magma.esdm.go.id/v1); MIROVA (Middle InfraRed Observation of Volcanic Activity), a collaborative project between the Universities of Turin and Florence (Italy) supported by the Centre for Volcanic Risk of the Italian Civil Protection Department (URL: http://www.mirovaweb.it/); Copernicus Browser, Copernicus Data Space Ecosystem, European Space Agency (URL: https://dataspace.copernicus.eu/browser/).
Villarrica (Chile) — October 2023 Cite this Report
Villarrica
Chile
39.42°S, 71.93°W; summit elev. 2847 m
All times are local (unless otherwise noted)
Strombolian activity, gas-and-ash emissions, and crater incandescence during April-September 2023
Villarrica, in central Chile, consists of a 2-km-wide caldera that formed about 3,500 years ago and is located at the base of the presently active cone at the NW margin of a 6-km-wide caldera. Historical eruptions eruptions date back to 1558 and have been characterized by mild-to-moderate explosive activity with occasional lava effusions. The current eruption period began in December 2014 and has recently consisted of nighttime crater incandescence, ash emissions, and seismicity (BGVN 48:04). This report covers activity during April through September 2023 and describes occasional Strombolian activity, gas-and-ash emissions, and nighttime crater incandescence. Information for this report primarily comes from the Southern Andes Volcano Observatory (Observatorio Volcanológico de Los Andes del Sur, OVDAS), part of Chile's National Service of Geology and Mining (Servicio Nacional de Geología y Minería, SERNAGEOMIN) and satellite data.
Seismicity during April consisted of long period (LP) events and tremor (TRE); a total of 9,413 LP-type events and 759 TR-type events were detected throughout the month. Nighttime crater incandescence persisted and was visible in the degassing column. Sulfur dioxide data was obtained using Differential Absorption Optical Spectroscopy Equipment (DOAS) that showed an average value of 1,450 ± 198 tons per day (t/d) during 1-15 April and 1,129 ± 201 t/d during 16-30 April, with a maximum daily value of 2,784 t/d on 9 April. Gas-and-steam emissions of variable intensities rose above the active crater as high as 1.3 km above the crater on 13 April. Strombolian explosions were not observed and there was a slight decrease in the lava lake level.
There were 14,123 LP-type events and 727 TR-type events detected during May. According to sulfur dioxide measurements taken with DOAS equipment, the active crater emitted an average value of 1,826 ± 482 t/d during 1-15 May and 912 ± 41 t/d during 16-30 May, with a daily maximum value of 5,155 t/d on 13 May. Surveillance cameras showed continuous white gas-and-steam emissions that rose as high as 430 m above the crater on 27 May. Nighttime incandescence illuminated the gas column less than 300 m above the crater rim was and no pyroclastic emissions were reported. A landslide was identified on 13 May on the E flank of the volcano 50 m from the crater rim and extending 300 m away; SERNAGEOMIN noted that this event may have occurred on 12 May. During the morning of 27 and 28 May minor Strombolian explosions characterized by incandescent ejecta were recorded at the crater rim; the last reported Strombolian explosions had occurred at the end of March.
Seismic activity during June consisted of five volcano-tectonic (VT)-type events, 21,606 LP-type events, and 2,085 TR-type events. The average value of sulfur dioxide flux obtained by DOAS equipment was 1,420 ± 217 t/d during 1-15 June and 2,562 ± 804 t/d, with a maximum daily value of 4,810 t/d on 17 June. White gas-and-steam emissions rose less than 480 m above the crater; frequent nighttime crater incandescence was reflected in the degassing plume. On 12 June an emission rose 100 m above the crater and drifted NNW. On 15 June one or several emissions resulted in ashfall to the NE as far as 5.5 km from the crater, based on a Skysat satellite image. Several Strombolian explosions occurred within the crater; activity on 15 June was higher energy and ejected blocks 200-300 m on the NE slope. Surveillance cameras showed white gas-and-steam emissions rising 480 m above the crater on 16 June. On 19 and 24 June low-intensity Strombolian activity was observed, ejecting material as far as 200 m from the center of the crater to the E.
During July, seismicity included 29,319 LP-type events, 3,736 TR-type events, and two VT-type events. DOAS equipment recorded two days of sulfur dioxide emissions of 4,220 t/d and 1,009 t/d on 1 and 13 July, respectively. Constant nighttime incandescence was also recorded and was particularly noticeable when accompanied by eruptive columns on 12 and 16 July. Minor explosive events were detected in the crater. According to Skysat satellite images taken on 12, 13, and 16 July, ashfall deposits were identified 155 m S of the crater. According to POVI, incandescence was visible from two vents on the crater floor around 0336 on 12 July. Gas-and-ash emissions rose as high as 1.2 km above the crater on 13 July and drifted E and NW. A series of gas-and-steam pulses containing some ash deposited material on the upper E flank around 1551 on 13 July. During 16-31 July, average sulfur dioxide emissions of 1,679 ± 406 t/d were recorded, with a maximum daily value of 2,343 t/d on 28 July. Fine ash emissions were also reported on 16, 17, and 23 July.
Seismicity persisted during August, characterized by 27,011 LP-type events, 3,323 TR-type events, and three VT-type events. The average value of sulfur dioxide measurements taken during 1-15 August was 1,642 ± 270 t/d and 2,207 ± 4,549 t/d during 16-31 August, with a maximum daily value of 3,294 t/d on 27 August. Nighttime crater incandescence remained visible in degassing columns. White gas-and-steam emissions rose 480 m above the crater on 6 August. According to a Skysat satellite image from 6 August, ash accumulation was observed proximal to the crater and was mainly distributed toward the E slope. White gas-and-steam emissions rose 320 m above the crater on 26 August. Nighttime incandescence and Strombolian activity that generated ash emissions were reported on 27 August.
Seismicity during September was characterized by five VT-type events, 12,057 LP-type events, and 2,058 TR-type events. Nighttime incandescence persisted. On 2 September an ash emission rose 180 m above the crater and drifted SE at 1643 (figure 125) and a white gas-and-steam plume rose 320 m above the crater. According to the Buenos Aires VAAC, periods of continuous gas-and-ash emissions were visible in webcam images from 1830 on 2 September to 0110 on 3 September. Strombolian activity was observed on 2 September and during the early morning of 3 September, the latter event of which generated an ash emission that rose 60 m above the crater and drifted 100 m from the center of the crater to the NE and SW. Ashfall was reported to the SE and S as far as 750 m from the crater. The lava lake was active during 3-4 September and lava fountaining was visible for the first time since 26 March 2023, according to POVI. Fountains captured in webcam images at 2133 on 3 September and at 0054 on 4 September rose as high as 60 m above the crater rim and ejected material onto the upper W flank. Sulfur dioxide flux of 1,730 t/d and 1,281 t/d was measured on 3 and 4 September, respectively, according to data obtained by DOAS equipment.
Strong Strombolian activity and larger gas-and-ash plumes were reported during 18-20 September. On 18 September activity was also associated with energetic LP-type events and notable sulfur dioxide fluxes (as high as 4,277 t/d). On 19 September Strombolian activity and incandescence were observed. On 20 September at 0914 ash emissions rose 50 m above the crater and drifted SSE, accompanied by Strombolian activity that ejected material less than 100 m SSE, causing fall deposits on that respective flank. SERNAGEOMIN reported that a Planet Scope satellite image taken on 20 September showed the lava lake in the crater, measuring 32 m x 35 m and an area of 0.001 km2. Several ash emissions were recorded at 0841, 0910, 1251, 1306, 1312, 1315, and 1324 on 23 September and rose less than 150 m above the crater. The sulfur dioxide flux value was 698 t/d on 23 September and 1,097 t/d on 24 September. On 24 September the Volcanic Alert Level (VAL) was raised to Orange (the third level on a four-color scale). SENAPRED maintained the Alert Level at Yellow (the middle level on a three-color scale) for the communities of Villarrica, Pucón (16 km N), Curarrehue, and Panguipulli.
During 24-25 September there was an increase in seismic energy (observed at TR-events) and acoustic signals, characterized by 1 VT-type event, 213 LP-type events, and 124 TR-type events. Mainly white gas-and-steam emissions, in addition to occasional fine ash emissions were recorded. During the early morning of 25 September Strombolian explosions were reported and ejected material 250 m in all directions, though dominantly toward the NW. On 25 September the average value of sulfur dioxide flux was 760 t/d. Seismicity during 25-30 September consisted of five VT-type events, 1,937 LP-type events, and 456 TR-type events.
During 25-29 September moderate Strombolian activity was observed and ejected material as far as the crater rim. In addition, ash pulses lasting roughly 50 minutes were observed around 0700 and dispersed ENE. During 26-27 September a TR episode lasted 6.5 hours and was accompanied by discrete acoustic signals. Satellite images from 26 September showed a spatter cone on the crater floor with one vent that measured 10 x 14 m and a smaller vent about 35 m NE of the cone. SERNAGEOMIN reported an abundant number of bomb-sized blocks up to 150 m from the crater, as well as impact marks on the snow, which indicated explosive activity. A low-altitude ash emission was observed drifting NW around 1140 on 28 September, based on webcam images. Between 0620 and 0850 on 29 September an ash emission rose 60 m above the crater and drifted NW. During an overflight taken around 1000 on 29 September scientists observed molten material in the vent, a large accumulation of pyroclasts inside the crater, and energetic degassing, some of which contained a small amount of ash. Block-sized pyroclasts were deposited on the internal walls and near the crater, and a distal ash deposit was also visible. The average sulfur dioxide flux measured on 28 September was 344 t/d. Satellite images taken on 29 September ashfall was deposited roughly 3 km WNW from the crater and nighttime crater incandescence remained visible. The average sulfur dioxide flux value from 29 September was 199 t/d. On 30 September at 0740 a pulsating ash emission rose 1.1 km above the crater and drifted NNW (figure 126). Deposits on the S flank extended as far as 4.5 km from the crater rim, based on satellite images from 30 September.
Infrared MODIS satellite data processed by MIROVA (Middle InfraRed Observation of Volcanic Activity) showed intermittent thermal activity during April through September, with slightly stronger activity detected during late September (figure 127). Small clusters of thermal activity were detected during mid-June, early July, early August, and late September. According to the MODVOLC thermal alert system, a total of four thermal hotspots were detected on 7 July and 3 and 23 September. This activity was also intermittently captured in infrared satellite imagery on clear weather days (figure 128).
Geologic Background. The glacier-covered Villarrica stratovolcano, in the northern Lakes District of central Chile, is ~15 km south of the city of Pucon. A 2-km-wide caldera that formed about 3,500 years ago is located at the base of the presently active, dominantly basaltic to basaltic andesite cone at the NW margin of a 6-km-wide Pleistocene caldera. More than 30 scoria cones and fissure vents are present on the flanks. Plinian eruptions and pyroclastic flows that have extended up to 20 km from the volcano were produced during the Holocene. Lava flows up to 18 km long have issued from summit and flank vents. Eruptions documented since 1558 CE have consisted largely of mild-to-moderate explosive activity with occasional lava effusion. Glaciers cover 40 km2 of the volcano, and lahars have damaged towns on its flanks.
Information Contacts: Servicio Nacional de Geología y Minería (SERNAGEOMIN), Observatorio Volcanológico de Los Andes del Sur (OVDAS), Avda Sta María No. 0104, Santiago, Chile (URL: http://www.sernageomin.cl/); Proyecto Observación Villarrica Internet (POVI) (URL: http://www.povi.cl/); Sistema y Servicio Nacional de Prevención y Repuesta Ante Desastres (SENAPRED), Av. Beauchef 1671, Santiago, Chile (URL: https://web.senapred.cl/); Buenos Aires Volcanic Ash Advisory Center (VAAC), Servicio Meteorológico Nacional-Fuerza Aérea Argentina, 25 de mayo 658, Buenos Aires, Argentina (URL: http://www.smn.gov.ar/vaac/buenosaires/inicio.php); MIROVA (Middle InfraRed Observation of Volcanic Activity), a collaborative project between the Universities of Turin and Florence (Italy) supported by the Centre for Volcanic Risk of the Italian Civil Protection Department (URL: http://www.mirovaweb.it/); Hawai'i Institute of Geophysics and Planetology (HIGP) - MODVOLC Thermal Alerts System, School of Ocean and Earth Science and Technology (SOEST), Univ. of Hawai'i, 2525 Correa Road, Honolulu, HI 96822, USA (URL: http://modis.higp.hawaii.edu/); Copernicus Browser, Copernicus Data Space Ecosystem, European Space Agency (URL: https://dataspace.copernicus.eu/browser/).
Merapi (Indonesia) — October 2023 Cite this Report
Merapi
Indonesia
7.54°S, 110.446°E; summit elev. 2910 m
All times are local (unless otherwise noted)
Frequent incandescent avalanches during April-September 2023
Merapi, located just north of the major city of Yogyakarta in central Java, Indonesia, has had activity within the last 20 years characterized by pyroclastic flows and lahars accompanying growth and collapse of the steep-sided active summit lava dome. The current eruption period began in late December 2020 and has more recently consisted of ash plumes, intermittent incandescent avalanches of material, and pyroclastic flows (BGVN 48:04). This report covers activity during April through September 2023, based on information from Balai Penyelidikan dan Pengembangan Teknologi Kebencanaan Geologi (BPPTKG), the Center for Research and Development of Geological Disaster Technology, a branch of PVMBG which specifically monitors Merapi. Additional information comes from the Pusat Vulkanologi dan Mitigasi Bencana Geologi (PVMBG, also known as Indonesian Center for Volcanology and Geological Hazard Mitigation, CVGHM), MAGMA Indonesia, the Darwin Volcanic Ash Advisory Centre (VAAC), and various satellite data.
Activity during April through September 2023 primarily consisted of incandescent avalanches of material that mainly affected the SW and W flanks and traveled as far as 2.3 km from the summit (table 25) and white gas-and-steam emissions that rose 10-1,000 m above the crater.
Table 25. Monthly summary of avalanches and avalanche distances recorded at Merapi during April through September 2023. The number of reported avalanches does not include instances where possible avalanches were heard but could not be visually confirmed as a result of inclement weather. Data courtesy of BPPTKG (April-September 2023 daily reports).
| Month |
Average number of avalanches per day |
Distance avalanches traveled (m) |
| Apr 2023 |
19 |
1,200-2,000 |
| May 2023 |
22 |
500-2,000 |
| Jun 2023 |
18 |
1,200-2,000 |
| Jul 2023 |
30 |
300-2,000 |
| Aug 2023 |
25 |
400-2,300 |
| Sep 2023 |
23 |
600-2,000 |
BPPTKG reported that during April and May white gas-and-steam emissions rose 10-750 m above the crater, incandescent avalanches descended 500-2,000 m on the SW and W flanks (figure 135). Cloudy weather often prevented clear views of the summit, and sometimes avalanches could not be confirmed. According to a webcam image, a pyroclastic flow was visible on 17 April at 0531. During the week of 28 April and 4 May a pyroclastic flow was reported on the SW flank, traveling up to 2.5 km. According to a drone overflight taken on 17 May the SW lava dome volume was an estimated 2,372,800 cubic meters and the dome in the main crater was an estimated 2,337,300 cubic meters.
During June and July similar activity persisted with white gas-and-steam emissions rising 10-350 m above the crater and frequent incandescent avalanches that traveled 300-2,000 m down the SW, W, and S flanks (figure 136). Based on an analysis of aerial photos taken on 24 June the volume of the SW lava dome was approximately 2.5 million cubic meters. A pyroclastic flow was observed on 5 July that traveled 2.7 km on the SW flank. According to the Darwin VAAC multiple minor ash plumes were identified in satellite images on 19 July that rose to 3.7 km altitude and drifted S and SW. During 22, 25, and 26 July a total of 17 avalanches descended as far as 1.8 km on the S flank.
Frequent white gas-and-steam emissions continued during August and September, rising 10-450 m above the crater. Incandescent avalanches mainly affected the SW and W flanks and traveled 400-2,300 m from the vent (figure 137). An aerial survey conducted on 10 August was analyzed and reported that estimates of the SW dome volume was 2,764,300 cubic meters and the dome in the main crater was 2,369,800 cubic meters.
Frequent and moderate-power thermal activity continued throughout the reporting period, according to a MIROVA (Middle InfraRed Observation of Volcanic Activity) analysis of MODIS satellite data (figure 138). There was an increase in the number of detected anomalies during mid-May. The MODVOLC thermal algorithm recorded a total of 47 thermal hotspots: six during April, nine during May, eight during June, 15 during July, four during August, and five during September. Some of this activity was captured in infrared satellite imagery on clear weather days, sometimes accompanied by incandescent material on the SW flank (figure 139).
Geologic Background. Merapi, one of Indonesia's most active volcanoes, lies in one of the world's most densely populated areas and dominates the landscape immediately north of the major city of Yogyakarta. It is the youngest and southernmost of a volcanic chain extending NNW to Ungaran volcano. Growth of Old Merapi during the Pleistocene ended with major edifice collapse perhaps about 2,000 years ago, leaving a large arcuate scarp cutting the eroded older Batulawang volcano. Subsequent growth of the steep-sided Young Merapi edifice, its upper part unvegetated due to frequent activity, began SW of the earlier collapse scarp. Pyroclastic flows and lahars accompanying growth and collapse of the steep-sided active summit lava dome have devastated cultivated lands on the western-to-southern flanks and caused many fatalities.
Information Contacts: Balai Penyelidikan dan Pengembangan Teknologi Kebencanaan Geologi (BPPTKG), Center for Research and Development of Geological Disaster Technology (URL: http://merapi.bgl.esdm.go.id/, Twitter: @BPPTKG); MAGMA Indonesia, Kementerian Energi dan Sumber Daya Mineral (URL: https://magma.esdm.go.id/v1); Pusat Vulkanologi dan Mitigasi Bencana Geologi (PVMBG, also known as Indonesian Center for Volcanology and Geological Hazard Mitigation, CVGHM), Jalan Diponegoro 57, Bandung 40122, Indonesia (URL: http://www.vsi.esdm.go.id/); Darwin Volcanic Ash Advisory Centre (VAAC), Bureau of Meteorology, Northern Territory Regional Office, PO Box 40050, Casuarina, NT 0811, Australia (URL: http://www.bom.gov.au/info/vaac/); MIROVA (Middle InfraRed Observation of Volcanic Activity), a collaborative project between the Universities of Turin and Florence (Italy) supported by the Centre for Volcanic Risk of the Italian Civil Protection Department (URL: http://www.mirovaweb.it/); Hawai'i Institute of Geophysics and Planetology (HIGP) - MODVOLC Thermal Alerts System, School of Ocean and Earth Science and Technology (SOEST), Univ. of Hawai'i, 2525 Correa Road, Honolulu, HI 96822, USA (URL: http://modis.higp.hawaii.edu/); Copernicus Browser, Copernicus Data Space Ecosystem, European Space Agency (URL: https://dataspace.copernicus.eu/browser/); Øystein Lund Andersen (URL: https://www.oysteinlundandersen.com/, https://twitter.com/oysteinvolcano).
Ebeko
Russia
50.686°N, 156.014°E; summit elev. 1103 m
All times are local (unless otherwise noted)
Moderate explosive activity with ash plumes continued during June-November 2023
Ebeko, located on the N end of Paramushir Island in Russia’s Kuril Islands just S of the Kamchatka Peninsula, consists of three summit craters along a SSW-NNE line at the northern end of a complex of five volcanic cones. Observed eruptions date back to the late 18th century and have been characterized as small-to-moderate explosions from the summit crater, accompanied by intense fumarolic activity. The current eruptive period began in June 2022, consisting of frequent explosions, ash plumes, and thermal activity (BGVN 47:10, 48:06). This report covers similar activity during June-November 2023, based on information from the Kamchatka Volcanic Eruptions Response Team (KVERT) and satellite data.
Moderate explosive activity continued during June-November 2023 (figures 50 and 51). According to visual data from Severo-Kurilsk, explosions sent ash 2-3.5 km above the summit (3-4.5 km altitude) during most days during June through mid-September. Activity after mid-September was slightly weaker, with ash usually reaching less than 2 km above the summit. According to KVERT the volcano in October and November was, with a few exceptions, either quiet or obscured by clouds that prevented satellite observations. KVERT issued Volcano Observatory Notices for Aviation (VONA) on 8 and 12 June, 13 and 22 July, 3 and 21 August, and 31 October warning of potential aviation hazards from ash plumes drifting 3-15 km from the volcano. Based on satellite data, KVERT reported a persistent thermal anomaly whenever weather clouds permitted viewing.
Geologic Background. The flat-topped summit of the central cone of Ebeko volcano, one of the most active in the Kuril Islands, occupies the northern end of Paramushir Island. Three summit craters located along a SSW-NNE line form Ebeko volcano proper, at the northern end of a complex of five volcanic cones. Blocky lava flows extend west from Ebeko and SE from the neighboring Nezametnyi cone. The eastern part of the southern crater contains strong solfataras and a large boiling spring. The central crater is filled by a lake about 20 m deep whose shores are lined with steaming solfataras; the northern crater lies across a narrow, low barrier from the central crater and contains a small, cold crescentic lake. Historical activity, recorded since the late-18th century, has been restricted to small-to-moderate explosive eruptions from the summit craters. Intense fumarolic activity occurs in the summit craters, on the outer flanks of the cone, and in lateral explosion craters.
Information Contacts: Kamchatka Volcanic Eruptions Response Team (KVERT), Far Eastern Branch, Russian Academy of Sciences, 9 Piip Blvd., Petropavlovsk-Kamchatsky, 683006, Russia (URL: http://www.kscnet.ru/ivs/kvert/).
Search Bulletin Archive by Publication Date
Select a month and year from the drop-downs and click "Show Issue" to have that issue displayed in this tab.
The default month and year is the latest issue available.
Bulletin of the Global Volcanism Network - Volume 33, Number 01 (January 2008)
Managing Editor: Richard Wunderman
Etna (Italy)
Tall sustained lava fountains, lava flows, and tephra blanket on 22-24 November 2007
Heard (Australia)
Rare thermal anomalies through March 2008 suggest eruptions
Huila, Nevado del (Colombia)
Eruptions in February, April, and May 2007; lahars take out bridges
Krakatau (Indonesia)
Repeated minor eruptions during October-November 2007
Llaima (Chile)
Ash plumes observed in May and August 2007; new eruption beginning 1 January 2008
Sheveluch (Russia)
Lava-dome growth and block-and-ash flows continue April-December 2007
Turrialba (Costa Rica)
Fumarolic increases during August 2007-January 2008
Ubinas (Peru)
Continuing ashfall during 2006-2007
Etna
Italy
37.748°N, 14.999°E; summit elev. 3357 m
All times are local (unless otherwise noted)
Tall sustained lava fountains, lava flows, and tephra blanket on 22-24 November 2007
After the 10-hour-long episode of sustained lava fountaining from the Southeast Crater (SEC) on 4-5 September 2007 (BGVN 32:09), Etna remained quiescent for about three weeks. Ash emissions then resumed from the vent on the eastern flank of the SEC cone, which had been the main focus of activity since mid-August 2007. During October, ash emissions occurred intermittently, at times with minor incandescent ejections. This activity persisted until mid-November, after which there was a week-long pause until the early morning of 22 November. That day around 0500, weak Strombolian activity and ash emission started from the vent on the E flank of the SEC and continued with increasing strength for the following 36 hours.
A series of explosions occurred at the Bocca Nuova between 1658 and 1705 on 23 November, ejecting dark gray ash plumes, and producing strong seismic signals on nearby stations. During the following hours, Strombolian explosions occurred from the SEC vent, ejecting incandescent bombs to several tens of meters high.
After 2020, the vigor increased, with bursts of bombs rising to 100 m high, accompanied by a sharp rise in tremor amplitude. By 2130, a broad, pulsating lava fountain rose from the vent. Then, 15 min later, observers saw sustained fountaining up to 600 m high. The fountains discharged from what appeared to be two closely spaced sources within the depression, often making a V-shape.
Lava spilled over the vent's rim in at least three locations (figure 129), feeding three narrow branches of lava that ran E and coalesced, before spreading down the steep W slope of the Valle del Bove. A fourth lava flow started from an area ~ 150 m NE of the active vent, where fountain-fed spatter rapidly accumulated and ultimately began to flow. This flow joined the main lava flow toward the Valle del Bove at about 2,500 m elevation.
The November lava flowed mostly on top of, or immediately adjacent to, the lava emitted during the eruption of early September 2007 (figure 129). At the base of the Valle del Bove slope, the November eruption's lava fanned out to form several minor lobes, the longest of which advanced to 1,670 m elevation, 4.2 km from the vent (figure 130; Burton and Neri, 2007).
The explosive activity fed a dense tephra plume. It blew NE and caused ash and lapilli falls as far as 80 km away in southern Calabria, (Andronico and Cristaldi, 2007). At Piano Provenzana (~ 6.5 km NNE of the summit), the deposit was about 3 cm thick. Coarse scoriae, up to 5 cm across, fell ~ 10 km NNE from the SEC (in Linguaglossa) during the first hour of the eruption. During the following hours, finer ash fell in areas adjacent Etna and to the W.
Shortly after 0300 on 24 November, the eruptive activity and volcanic tremor amplitude began to diminish gradually, and during the next 20 min the fountain height dropped from ~ 600 m to under 200 m. Subsequently, the fountaining gave way to a series of powerful explosions, which showered the entire SEC cone with meter-sized bombs. The last of these explosions occurred at 0338, and for another 45 min after this, only minor explosive ejections occurred from the vent.
During the following hours, material continued to crumble and collapse on the steep slopes around the vent, exposing incandescent rock in countless spots. By 0600, the tremor amplitude had dropped to background levels, and no further eruptive activity was noted at the vent.
For several days after the eruption, gravitational instability of the new pyroclastic deposit, which had accumulated to thicknesses of several tens of meters, especially on the N side of the vent, caused occasional slides of material, exposing the still-incandescent interior of the deposit. A particularly large collapse from the overhanging W rim of the vent at 1713 on 27 November may have been accompanied by minor explosive activity, with incandescent material rolling to the base of the SEC cone (Calvari, 2007).
Ash emissions from the same vent occurred on 10 January 2008 and again on 1-3 February (figure 131). In mid-February such emissions became more frequent; some produced plumes several hundreds of meters high.
References. Andronico, D. and Cristaldi, A., 2007, Il parossismo del 23-24 novembre 2007 al Cratere di SE: caratteristiche del deposito di caduta. Report published on-line at: http://www.ct.ingv.it/Report/RPTVETCEN20071123.pdf
Burton, M. and Neri, M., 2007, Stato attuale e osservazione dell'Etna 25 novembre 2007. Report published on-line at: http://www.ct.ingv.it/Report/WKRVGREP20071125.pdf
Calvari, S., 2007, Rapporto sull'attivit? dell'Etna del 27 novembre 2007. Report published on-line at: http://www.ct.ingv.it/Report/WKRVGREP20071127.pdf
Geologic Background. Mount Etna, towering above Catania on the island of Sicily, has one of the world's longest documented records of volcanism, dating back to 1500 BCE. Historical lava flows of basaltic composition cover much of the surface of this massive volcano, whose edifice is the highest and most voluminous in Italy. The Mongibello stratovolcano, truncated by several small calderas, was constructed during the late Pleistocene and Holocene over an older shield volcano. The most prominent morphological feature of Etna is the Valle del Bove, a 5 x 10 km caldera open to the east. Two styles of eruptive activity typically occur, sometimes simultaneously. Persistent explosive eruptions, sometimes with minor lava emissions, take place from one or more summit craters. Flank vents, typically with higher effusion rates, are less frequently active and originate from fissures that open progressively downward from near the summit (usually accompanied by Strombolian eruptions at the upper end). Cinder cones are commonly constructed over the vents of lower-flank lava flows. Lava flows extend to the foot of the volcano on all sides and have reached the sea over a broad area on the SE flank.
Information Contacts: Boris Behncke, Sonia Calvari, and Marco Neri, Istituto Nazionale di Geofisica e Vulcanologia (INGV), Sezione di Catania, Piazza Roma 2, 95123 Catania, Italy.
Heard (Australia) — January 2008 Cite this Report
Heard
Australia
53.106°S, 73.513°E; summit elev. 2745 m
All times are local (unless otherwise noted)
Rare thermal anomalies through March 2008 suggest eruptions
Due to its isolated location in the S Indian Ocean on the Kerguelen Plateau, Heard Island is rarely visited, and satellite imagery provides the only regular information on eruptive activity. The Hawai'i Institute of Geophysics and Planetology (HIGP) Thermal Alerts System MODVOLC provides an analysis of MODIS (Moderate Resolution Imaging Spectroradiometer) satellite thermal anomaly data, with 1-2 daily observations. That system remains the best source of evidence at isolated, glacier-covered volcanoes like Heard, though it is difficult to determine how often meteorological clouds may obscure thermal anomalies.
The last report summarized activity beginning in March 2000 (BGVN 32:06), describing three eruptive episodes (based on thermal anomalies). The last thermal anomaly mentioned was on 6 April 2007. As seen on table 5, the MODVOLC system recorded the next thermal anomaly on 24 July 2007. For the rest of 2007, there were anomalies recorded on two days in August and two days in November. During 2008 as late as 2 March, anomalies occurred in February and March.
Table 5. Thermal anomalies measured by MODIS/MODVOLC over Heard Island during 7 April 2007 through 2 March 2008. Courtesy of HIGP Thermal Anomalies Team.
| Date |
Time (UTC) |
Pixels |
Satellite |
| 24 Jul 2007 |
1750 |
1 |
Aqua |
| 12 Aug 2007 |
1820 |
1 |
Terra |
| 30 Aug 2007 |
1955 |
1 |
Aqua |
| 11 Nov 2007 |
1800 |
1 |
Terra |
| 11 Nov 2007 |
1945 |
2 |
Aqua |
| 22 Feb 2008 |
1955 |
3 |
Aqua |
| 02 Mar 2008 |
1950 |
1 |
Aqua |
Geologic Background. Heard Island on the Kerguelen Plateau in the southern Indian Ocean consists primarily of the emergent portion of two volcanic structures. The large glacier-covered composite basaltic-to-trachytic cone of Big Ben comprises most of the island, and the smaller Mt. Dixon lies at the NW tip of the island across a narrow isthmus. Little is known about the structure of Big Ben because of its extensive ice cover. The active Mawson Peak forms the island's high point and lies within a 5-6 km wide caldera breached to the SW side of Big Ben. Small satellitic scoria cones are mostly located on the northern coast. Several subglacial eruptions have been reported at this isolated volcano, but observations are infrequent and additional activity may have occurred.
Information Contacts: Hawai'i Institute of Geophysics and Planetology (HIGP) Thermal Alerts System, School of Ocean and Earth Science and Technology (SOEST), Univ. of Hawai'i, 2525 Correa Road, Honolulu, HI 96822, USA (URL: http://modis.higp.hawaii.edu/).
Nevado del Huila (Colombia) — January 2008 Cite this Report
Nevado del Huila
Colombia
2.93°N, 76.03°W; summit elev. 5364 m
All times are local (unless otherwise noted)
Eruptions in February, April, and May 2007; lahars take out bridges
Nevado del Huila was the scene of elevated seismicity during February and May 2000 (BGVN 25:05). In 1994, the M 6.4 Paéz earthquake triggered avalanches and lahars along the Paéz river, which took many lives (BGVN 19:05, 19:07). A more recent abstract summarized the losses from the Paéz earthquake as 271 reported deaths, 1,700 people missing, and more than 32,000 people evacuated during the crisis (Schuster, 1996). Correa and Pulgarín (2002a, b) wrote reviews of the volcano's geology, hazards, and related topics.
This report discusses the onset of eruptions during February 2007 and repeated eruptions during April and May 2007. During the most active intervals during February and April there were substantial ash plumes, lahars, earthquake swarms (and some individual earthquakes up to M ~ 3), and the growth of fissures, crevasses, and new fumaroles on the volcano's upper, glacier-covered slopes. During the April eruption thousands of residents evacuated. This report draws heavily on material issued by the Instituto Colombiano de Geología y Minería (INGEOMINAS), Observatory Vulcanológico and Sismológico de Popayán.
The andesitic-dacitic edifice (figure 6) is large and elongate (with a footprint of ~ 170 km2 ). Located in the Central Cordillera (figure 7), it forms Colombia's highest peak. This area only 3 degrees from the equator experiences periods of high precipitation. In 1995 its alpine glaciers covered ~ 13.4 km2 with an approximate volume of 800 x 106 m3 (Pulgarín and others, 2005).
The April 2007 activity impacted not only the immediate vicinity of the volcano, but also ten's of kilometers to the S, where rivers carried debris. In order to assess the impact of the lahars, INGEOMINAS compared calibrated Landsat images from before and after the 19 February eruption. They found clear visual evidence that the lahars had discolored the Betania Reservoir, ~ 150 km downstream.
The Símbola joins the Paéz river ~ 28 km (straight-line distance) S of Pico Central (figure 8). Adjacent that intersection sits the town of Belacázar (figure 9). Another ~ 15 km downstream, the Paéz merges into the Magdalena river, the 6th largest river the world in terms of sediment yield (~ 690 t / (km2 ? yr); Restrepo and others, 2005). A straight-line distance of ~ 50 km downslope from the intersection of the Paéz and Magdalena rivers, the Magdalena enters the Betania Reservoir.
Beyond the reservoir, the Magdalena flows NNE; it ultimately reaches the Carribean Sea at a large delta in N Colombia by the large city of Barranquilla (figure 7). According to Restrepo and Kjerfve (2000), "the Magdalena is the largest river discharging directly into the Caribbean sea [228 km3 water annually], and it has the highest sediment yield of any medium-sized or large river along the entire E coast of South America."
Unrest and 19 February eruption. Since 1994 the volcano has been monitored by multiple telemetered seismometers with data sent to the city of Popayán (~ 100 km SSW). Mumucué (2007) pointed out that people living around the volcano saw the appearance of fumaroles in October 2006.
From 22 November 2006, INGEOMINAS assigned an elevated hazard of Level II ('Eruption probable in the coming days or weeks'). Some fracture-related earthquakes took place at depths of 2 km below the summit. Some of these earthquakes reached MR 1.6-1.9.
A 13 February flight mainly found steam escaping both secondary craters and fumarole fields on the main crater's margin. The previous day, observers W of the volcano in Consacá saw steam emissions outside the crater.
A seismometer recorded an earthquake swarm during 1030-1259 on 18 February. The seismometer, located 2 km S of Pico Central (at station 'Cerro Negro') measured 108 earthquakes interpreted as rock fracture events in the upper part of the volcano. An M 3 earthquake followed, and at 0137 on 19 February a new swarm of 53 earthquakes occurred. In this swarm fracture earthquakes were accompanied by those of longer period; the amplitude and number of events increased into the next morning.
Seismic records also contained some long-period earthquakes called tornillos (events with long, gradually decreasing codas or tails, so that their seismic trace resembles the tapering profile of a wood screw; tornillo is Spanish for screw). During March 2006-February 2007, instruments had recorded 105 tornillos (an average of 9 per month). In contrast, during 1-19 February 2007, instruments recorded 20 tornillos, more than double the number usually seen during a full month.
INGEOMINAS reported two earthquakes on 19 February 2007, at 0830 and 0853, with probable explosive character. Aviation authorities reported ash-bearing columns over the edifice reaching ~ 0.6-0.7 km above the summit.
A later INGEOMINAS summary of events stated that the eruption began at 0856 on 19 February, manifested as a ~ 1.5 km tall eruption column blowing mainly W. Ashfall was noted by inhabitants of Toribio, Silvia, and Páez (in the Department of Cauca). Small mudflows came down the Bellavista and Azufrada rivers feeding into the Paéz river, but airborne observers found significant fresh deposits at higher elevations. Authorities advised inhabitants to move to higher ground. Inhabitants noticed the rise of the Paéz river at 1150 on 19 February.
A 20 February flight detected significant fresh ash, abundant crevasses in the ice, and a steaming fissure near the summit (figure 10). The fissure extended ~ 2 km between Pico Central and Pico la Cresta to the N. Observers noted that the fissure continually emitted gases along its entire length. The flight was a collaboration between INGEOMINAS and IGEFA (Inspección General de la Fuerza Aérea).
A VAAC report noted an eruption at about 1400 UTC on the 19th to approximately FL 200 (~ 6.1 km altitude) moving W and dissipating quickly. No ash was seen in satellite imagery the next day at either 0045 or 1100 UTC, however, around this latter time, a pilot observed an ash cloud. In addition, a local aircraft reported ash to ~ 6.1 km at 0500 UTC on the 21st.
During 30 March-16 April 2007 INGEOMINAS observers reported the initiation of noteworthy seismicity indicating rock fractures and movement of fluids. The fracture events were located at depths of 4-8 km E and SW from the central peak and at magnitudes of less than 1.0. Low gas columns were again seen on 11 April, moving W.
Seismicity further increased on 17 April, leading up to an eruption on the 18th. Early on 18 April, a cluster of 25 rock-fracture earthquakes occurred, M 0.5 to 1.5. These were located at a depth less than 2 km. Seismicity again increased later that morning.
April 2007 eruption. A brief summary of the 18 April eruption appeared on the website hosted by the International Charter "Space and Major Disasters" on 20 April). It stated, "The Nevado del Huila volcano erupted at 02:57 local time 18 April, causing avalanches and floods [lahars] which affected the villages of La Plata, Paicol, Tesalia, Natagá, [and] Belalcázar. About 5,000 people were evacuated." (That same website hosted more than 10 (Landsat, Radarsat, and Envisat) images shedding light on this remote volcano's behavior, hazards, and impacts).
According to an 18 April 2007 report from the Washington Volcanic Ash Advisory Center (VAAC), a pilot in Colombia saw an ash cloud. Two ash plumes were evident on GOES-10 (split window) satellite imagery for an eruption starting at 0815 UTC on 18 April. They rose to poorly constrained altitudes of ~ 9 and 11 km and drifted E at 9 km/hour. The lower ash cloud was ~ 37 km across and moved SW at 9-18 km/hour. The higher ash cloud was ~ 19 km across and moved E at 0-9 km/hour. These clouds had dissipated by 1034 UTC.
The 18 April eruption sent an a torrent of brown water and rocks down the volcano's sides and into the Paéz and Símbola rivers (figures 11 and 12), causing them to flood, destroying several kilometers of highway and endangering or sweeping away what some government reports stated were 15 bridges (although it is uncertain how many of those were footbridges, and new reports tended to indicate a slightly higher numbers). In an evaluation the lahars of 18 April, INGEOMINAS staff found them quite similar, though smaller, than those of the earthquake and disaster of 1994.
Videos. At least three videos taken chiefly from Colombian military or national guard helicopters were posted on the web during April-May 2007 (see Videos, under References). They featured either the volcano or the powerful lahars or both, as follows.
Video 1("Avalancha . . ."; posted 18 April 2007) contains lahar footage from a television newscast, much of it taken from a helicopter. The shots include several bridges destroyed or impacted by lahars and the dialog mentioned nineteen bridges affected. Segments also show closeups of sediments and considerable flooding. Few if any flooded or damaged buildings were shown. Footage shows segments of the river with various gradients; the dark water carrying considerable debris. In one scene of a threatened bridge taken from shore, the turbulent river races by and among the passing logs seemingly floats a large farm animal.
Video 2 ("Sobrevuelo . . ." [Overflight . . .]) was taken by INGEOMINAS on 3 March 2007. It shows the volcano in modest eruption. A dense, dark plume emerges from the complex ice-bound summit area. Somewhat surprisingly, the plume immediately descends one flank of the volcano.
Video 3 (Erupcion . . . 18 Abril) shows vigorous white plumes escaping from multiple vents and forming a dense white plume. The text says that the footage was taken hours after the eruption on 18 April 2007. The base of the volcano is shrouded in weather clouds. The footage credits "Ejercito Nacional-INGEOMINAS-FAC."
Further observations and assessments. Seismicity escalated during 19-20 April but decreased on the 21st. Two larger earthquakes soon took place, on the 22nd and 27th. Their respective seismic signals appeared to come from rock fracturing at shallow depths; they had epicenters at Pico Central, and they were M 3.0 and M 3.2. On 23 April instruments detected continuous low-frequency tremor, interpreted as continuing instability and possible eruptions.
On 22 April, the Colombian Air Force flew INGEOMINAS staff past the volcano. They observed the N-trending fissure seen in February and found it had extended to reach a length of 2.3 km and a width of ~ 200 m. It emitted a white, sulfurous smelling gas column to 5 km altitude. The 22 April observers also saw a second new fissure ~ 2 km long across the same region. Strong fumaroles also discharged. Some lahars remained active down both E and W flank drainages.
Associated with the eruptions and as recent as 28 April 2007, there had been a total of 5,708 seismic events. Of those, 2,861 had signals suggesting rock fracture and 2,847 had signals suggesting movement of fluids.
During late April and early May 2007 the seismicity generally decreased (except for a 6 May, M 3.2 earthquake). On 5 May, INGEOMINAS staff, using a land-based correlation spectrometer, measured an SO2 flux from the volcano at 3,000 tons per day.
Early on 14 May, INGEOMINAS recorded a cluster of 54 low magnitude earthquake events, possibly triggering or associated with an ash emission. Based on satellite imagery of 14 May, the Washington VAAC reported an ash plume 8 km wide in an area 45 km W; it drifted SW and dissipated.
Based on seismic interpretation, INGEOMINAS inferred ash emissions during 27 May. Aerial observations later that day confirmed the emissions. Tremor recorded on 28 May possibly indicated another pulse of ash emissions. The SO2 flux measured on 1 June continued at 3,000 metric tons per day and on 2 June increased to ~ 6,900 metric tons per day. Flights on 3, 6, and 10 June indicated no changes in the existing fissures nor changes in the fumarolic field. Seismicity was relatively quiet during June 2007.
Humanitarian concerns. Luz Amanda Pulido, director of the national disaster office said that there were no reports of deaths or injuries. According to a 22 May report of the UN Office for the Coordination of Human Affairs (OHCA), by 26 April authorities resolved to evacuate 2,307 families affected by the crisis.
A government document issued May 2007 discussed the displaced residents. According to that report (Mumucué, 2007) the number of indigenous inhabitants living around the volcano and affected by lahars or emissions or both totaled 26,949 people. The affected territory he discussed (the Municipio de Páez, which has Belacazar as the main urban center) had an area of ~ 161,000 hectares. The inhabitants losses included cultivated areas and farm animals, including horses and smaller livestock. Photos showed displaced families living in temporary camps with outdoor cooking facilities. Another photo showed workers installing a footbridge where a vehicle bridge was lost to the torrent. That photo, taken ~5 days after the 18 April lahars began showed that by this time the river had greatly receded. The report was also a plea for supplies, including children's clothing and two-way radios with solar panels. Total days of community work devoted to reconstruction after the disaster and as late as May 2007 amounted to 4,264 (Mumucué, 2007).
References. Correa, A.M., and Pulgarín, B.A, 2002a, Revisión histórica de los estudios geológicos y otros aspectos, sobre el volcán Nevado del Huila y su área de influenza, Instituto Colombiano de Geologia y Mineria, INGEOMINAS; Observatorio Vulcanológico y Sismológico, Popayán; Junio de 2002, 51 p.
Correa, A., and Pulgarín, B., 2002b, Morfología, estratigrafía y petrografía general del Complejo Volcánico Nevado del Huila (énfasis en el flanco occidental): INGEOMINAS, Centro Operativo, Popayán, Informe Interno, 104 p.
Mumucué, J.A., May 2007, Analisis de los diversos eventos de erupción volcánica en la región de Tierradentro Páez Cauca hasta el momento: Republica de Colombia, Departamento del Cauca - Region de Tierradentro, Asociación de Cabildos Nasa ?xh??xha.
Pulagarín, B.A., Jordan, E., and Linder, W., 2005, Aspectos geológicos y cambio glaciar del volcán Nevado del Huila entre 1961 y 1995: Proceedings I Conferencia Cambio Climático, Bogotá 2005, 17 p.
Restrepoa, J.D., Kjerfveb, B., Hermelina, M., and Restrepoa, J.C., 2005, Factors controlling sediment yield in a major South American drainage basin: the Magdalena River, Colombia: Journal of Hydrology, v. 316, nos. 1-4, 10 January 2006, p. 213-232.
Restrepoa, J.D., and Kjerfve, B., 2000, Magdalena river: interannual variability (1975-1995) and revised water discharge and sediment load estimates: Journal of Hydrology, v. 235, nos. 1-2, 22 August 2000, p. 137-149, Elsevier.
Schuster, R. L., 1996, Recent earthquake-induced catastrophic landslides in the Andes of Ecuador and Colombia; Abstract, Colorado Scientific Society (URL: http://www.coloscisoc.org/abstracts).
Video References. (1) "Avalancha del Volcan Nevado del Huila" [A newscast from a Colombian television station, www.youtube.com/watch?v=k6nW1DP5mqg
(2) INGEOMINAS, 3 March 2007, Sobrevuelo Ingeominas Nevado Huila pocos dias despues de la erupción" (posted 8 May 2007) [Overflight of summit area] http://www.youtube.com/watch?v=UPP0vzBzZ38 (00:39)
(3) INGEOMINAS, 2007, Erupcion Nevado del Huila Colombia 18 Abril; Video stamped with "Ejercito Nacional-INGEOMINAS-FAC"; http://www.youtube.com/watch?v=xUnYOALOCWg; (00:56) (Posted 8 May 2007)
Geologic Background. Nevado del Huila, the highest peak in the Colombian Andes, is an elongated N-S-trending volcanic chain mantled by a glacier icecap. The andesitic-dacitic volcano was constructed within a 10-km-wide caldera. Volcanism at Nevado del Huila has produced six volcanic cones whose ages in general migrated from south to north. The high point of the complex is Pico Central. Two glacier-free lava domes lie at the southern end of the volcanic complex. The first historical activity was an explosive eruption in the mid-16th century. Long-term, persistent steam columns had risen from Pico Central prior to the next eruption in 2007, when explosive activity was accompanied by damaging mudflows.
Information Contacts: Instituto Colombiano de Geología y Minería (INGEOMINAS), Observatorio Vulcanológico y Sismológico de Popayán, Popayán, Colombia; Washington Volcanic Ash Advisory Center (VAAC), Satellite Analysis Branch (SAB), NOAA/NESDIS E/SP23, NOAA Science Center Room 401, 5200 Auth road, Camp Springs, MD 20746, USA (URL: http://www.ospo.noaa.gov/Products/atmosphere/vaac/); Jorge Castilla Echenique, Salud para desplazados, Programa de Emergencias y Desastres OPS/OMS, PWR Colombia; Jorge E. Victoria R., Salud en Desastres y Emergencias Complejas, Organización Panamericana De La Salud, Oficina de Neiva, Carrera 10 No. 4-72, Huila, Colombia; International Charter-Space and Major Disasters (URL: http://www.disasterscharter.org/).
Krakatau (Indonesia) — January 2008 Cite this Report
Krakatau
Indonesia
6.1009°S, 105.4233°E; summit elev. 285 m
All times are local (unless otherwise noted)
Repeated minor eruptions during October-November 2007
During 23-26 October 2007, minor eruptions occurred at Anak Krakatau (BGVN 32:09), an island and active vent on the rim of the famous larger caldera whose name often is misspelled as "Krakatoa." This report continues coverage from late October through November 2007. The Center of Volcanology and Geological Hazard Mitigation (CVGHM) raised the Alert Level to 3 (on a scale of 1-4) for Krakatau on 26 October because of the presence of multiple gray plumes from the volcano and an increase in seismicity. Plumes rose to an altitude of ~ 1 km during 23-26 and 30 October. Villagers and tourists were advised not go within 3 km of the summit.
According to an Associated Press news article, "red-hot lava flares" from Anak Krakatau rose 500-700 m above the S crater on 6 November. Multiple ash clouds were also observed. On 9 November, CVGHM officials in Bandung, West Java, conducted seismic and visual monitoring. Officials said, that on that day there were 182 eruptions coupled with 11 volcanic earthquakes, 54 shallow volcanic shocks, eight deep volcanic tremors and 44 shallower tremors. The volcano spewed "smoke" 29 times. On 13-14 November, as reported by CVGHM, lava flows and incandescent rocks traveled 400 m down the flanks.
As reported by VolcanoDiscovery's Tom Pfeiffer, who visited there from 21-26 November, emissions were relatively constant. He noted that all activity occurred from the newly formed crater on the upper S flank just below the old summit crater (figure 18). On 21 November, the new crater had an oval shape, approximately 50 x 70 m. Dense, dark brown, billowing ash clouds escaped in pulses from the crater at near-constant intervals of about 2 minutes, rising typically 100-200 m above the crater and drifting E. A few blocks were ejected along with the ash clouds (figure 19).
Pfeiffer also reported that at more irregular intervals, about 10-30 min apart, more violent, small vulcanian explosions interrupted the weaker ash venting events. The more violent explosions consisted of a sudden spray of mostly solid rocks and few incandescent scoria, followed by more powerful and turbulent ash plumes that rose up to 1 km above the crater (figure 20). Generally, these vulcanian explosions occurred after a slightly longer quiet period and, in most cases, the length of the quiet period correlated with the force of the explosion.
Pfeiffer noted that several more powerful explosions occurred at intervals of approximately 16-24 hours. The strongest, on 21-22 November, showered the whole island with incandescent blocks, ignited bush fires, and produced a very loud cannon-shot noise that rattled windows on the W coast of Java, 40 km away (figure 21).
Other, unusually large blasts occurred at around 0200 on 21 November and at around 0900 and 1320 on 23 November (figure 22). Early on 23 November, activity became more ash-rich and the vigor of the individual events increased slightly over the next two days. The pace of single explosions stayed at near-constant intervals of about 2 minutes. During 24-25 November, ash plumes typically rose to over 1 km above the crater and were easily visible from the W coast of Java. Based on a pilot report, on 24 November, the Darwin Volcanic Ash Advisory Center noted that an ash plume rose to an altitude of 3 km and drifted NE.
Based on the University of Hawaii's Institute of Geophysics and Planetology (HIGP) Thermal Alerts System MODVOLC analysis of MODIS (Moderate Resolution Imaging Spectroradiometer) satellite thermal anomaly data, occasional hot spots were identified by Terra or Aqua satellites. The thermal alerts occurred on twelve occasions between 27 October and 9 December 2007. Seven of these took place between 16 and 26 November 2007.
Geologic Background. The renowned Krakatau (frequently mis-named as Krakatoa) volcano lies in the Sunda Strait between Java and Sumatra. Collapse of an older edifice, perhaps in 416 or 535 CE, formed a 7-km-wide caldera. Remnants of that volcano are preserved in Verlaten and Lang Islands; subsequently the Rakata, Danan, and Perbuwatan cones were formed, coalescing to create the pre-1883 Krakatau Island. Caldera collapse during the catastrophic 1883 eruption destroyed Danan and Perbuwatan, and left only a remnant of Rakata. This eruption caused more than 36,000 fatalities, most as a result of tsunamis that swept the adjacent coastlines of Sumatra and Java. Pyroclastic surges traveled 40 km across the Sunda Strait and reached the Sumatra coast. After a quiescence of less than a half century, the post-collapse cone of Anak Krakatau (Child of Krakatau) was constructed within the 1883 caldera at a point between the former Danan and Perbuwatan cones. Anak Krakatau has been the site of frequent eruptions since 1927.
Information Contacts: Center of Volcanology and Geological Hazard Mitigation (CVGHM), Saut Simatupang, 57, Bandung 40122, Indonesia (URL: http://vsi.esdm.go.id/); Darwin Volcanic Ash Advisory Center, Bureau of Meteorology, Australia (URL: http://www.bom.gov.au/info/vac); Tom Pfeiffer, Volcano Discovery (URL: http://www.decadevolcano.net/, http://www.volcanodiscovery.com/volcano-tours/krakatau/photos.html); Associated Press (URL: http://www.ap.org/).
Llaima
Chile
38.692°S, 71.729°W; summit elev. 3125 m
All times are local (unless otherwise noted)
Ash plumes observed in May and August 2007; new eruption beginning 1 January 2008
From January 2002 through April 2003 (BGVN 29:02) there were increases in seismicity and fumarolic activity, along with minor eruptions, pronounced glacial melting, and substantial ash and gas plumes. Renewed activity consisting of minor eruptions was reported in May and possibly August 2007, but a larger eruption began on 1 January 2008. The source for most of the following is the Observatorio Volcanológico de los Andes del Sur (OVDAS)-SERNAGEOMIN (Volcano Observatory of the Southern Andes-Chile National Service of Geology and Mining).
On 26 May 2007, the Buenos Aires Volcanic Ash Advisory Center (VAAC) reported that ash plumes from Llaima rose to altitudes of 3-4.3 km and were visible on satellite imagery drifting E. A pilot reported another ash plume on 28 May that rose to an altitude of 5.5-6.7 km and drifted E. On 29 May, an ash plume rose to an altitude of 3 km and drifted E. No further activity was reported until 8 August, when pilots observed a plume to an altitude of 5.2 km drifting E. Ash was not identified on satellite imagery for this date.
Eruption during January 2008. Based on pilot reports and observations of satellite imagery, the Buenos Aires VAAC reported that on 1 January 2008 an ash plume rose to an altitude of 12.5 km and drifted E and ESE. The eruption began at 1820 hours, according to the Chile National Emergency Office. Lava was reported to be visible on the E flank and fumaroles at the summit were noted. The strong explosive activity prompted authorities to raise the Alert level to Yellow. According to news media reports, around 700 people were evacuated from local communities following the initial eruption, including about 200 tourists and National Forest Service employees from the Conguillo National Park. Most of the residents returned the following day when activity declined.
SERNAGEOMIN reported that tremor coincided with the onset of the gas and pyroclastic emissions on 1 January. Lava and incandescent material initially emitted were confined to the crater, but within a few hours, a Strombolian phase began. Soon, brightly glowing material covered much of the previously ice-covered summit (figure 14). Around the time of the eruption, an increase in volume of the Captrén river on the N flank was observed; this was likely a response to the glacial melting.
On the following day, observers on an overflight saw small emissions of ash and gas (mainly steam) and three small lahars on the N and W flanks. Tremor decreased, though explosions continued. Based on pilot reports and satellite imagery, the Buenos Aires VAAC reported that an ash plume rose to an altitude of 12.5 km and drifted E (figure 15). A later overflight revealed that the explosion on 2 January occurred at an area high on the E flank, outside the summit crater. A lava flow on the E flank was also noted. On 3 January an ash plume was visible on satellite imagery at an altitude of 3.7 km drifting NE. Airborne observers noted small sporadic gas-and-ash emissions.
In addition to ash, Llaima's eruption released considerable sulfur dioxide (SO2), identified by satellite instruments in the days following the 1 January eruption (figure 16). The initially intense SO2 plume dispersed as it moved E. On 4 January, the plume passed over Tristan da Cunha, a remote archipelago in the South Atlantic Ocean (figure 16). According to Charles Holliday, Simon Carn, and Michon Scott, the SO2 dissipated after 6 January 2008.
Between 1835 and 1915 on 6 January 2008 a helicopter overflight was conducted, coordinated by Jaime Pinto, Director of the Araucania Region Emergency Office (OREMI). Observers noted that main crater vent was clogged with lava (figure 17), which, after the eruption, dropped a few dozen meters inside the crater. During the eruption, lava diverged into two areas in the main crater, draining flows to the W and NE and melting the ice. The melted ice produced three lahars toward the W flank, which merged into one that entered the Calbuco River. To the NE, the melted ice generated a single channel lahar that flowed into the Captrén River, cutting the road in several locations. A small lahar also traveled to the E. The dispersion of ash and gases was mainly to the E, although initially they went ESE. There were abundant cracks seen in the glaciers in the SW and SE of the main crater, particularly in the SE.
SERNAGEOMIN reported that during 10-14 January 2008 seismicity decreased in terms of energy, but increased in the number of events. Based on seismic interpretation, weak explosions produced plumes of gas and ash that drifted NE. On 11 January, the upper surface of lava flows on the W flank that were observed during an overflight were cooled and snow-covered near the crater, but snow-free, and therefore still hot, about 500 m farther downslope. Blocks of incandescent material rolled ~ 1.5 km downslope and caused steam emissions where they contacted the glacier. Abundant cracks in glaciers to the SW of the crater were noted. Based on observations of satellite imagery and pilot reports, the Buenos Aires VAAC reported that ash plumes rose to an altitude of 5.5-6.7 km and drifted NE on 11 January and SW on 13 January.
Eruptive activity continued during the second half of January from the main crater and from two craters and a fissure on the E flank. The main crater contained three active pyroclastic cones. On 16 January one of the craters, ~ 15 m in diameter, produced ash plumes that rose to an altitude of ~ 3.6 km. Glaciers on the NE slope and W flank were fractured and dislocated. Ash plumes rising from the E flank attained an altitude of 4.1 km. Ash emissions vented from a NE-trending fissure ~ 80 m long and ~ 10 m wide. On 16-17 January glowing rocks were emitted from the fissure's NE end; ash plumes caused by rolling rocks rose from multiple areas.
At 0732 on 18 January, an explosion from the E flank sent an ash plume to an altitude of 9.1 km that quickly dispersed NE. People later saw a small lateral explosion from the same area, ash-and-gas emissions from several points, and a new fissure.
On 19 January, an explosion produced an ash plume that rose to an altitude of 4.1 km. An overflight revealed Strombolian activity in the main crater from a new pyroclastic cone that was 120 m in diameter and 100 m high; the cone was absent during a 17 January overflight. A second crater to the SW emitted gas. Sporadic ash emissions were noted from the E sector and an explosion produced a pyroclastic flow and an ash plume that quickly dissipated. On 20 January, another explosion produced an ash plume that rose to an altitude of 4.1 km. Gas and ash emissions were again noted from multiple areas. On 21 January, cloud cover prevented visual observations, but one small ash emission was seen at the end of the day.
On 23 January, a brown ash plume rose to an altitude of 3.5 km and drifted W. Observers on an overflight later that day saw Strombolian eruptions from the pyroclastic cone in the main crater accompanied by emissions of brown ash. A small hornito emitting bluish gas and a lava field were noted between the pyroclastic cone and the inner margins of the crater. Explosions from the E flank were detected on 24 January, and on 26 January steam plumes were observed. Strombolian eruptions in the main crater accompanied by gas and ash emissions continued during through 27 January. Ash plumes rose to altitudes of 3.3-4.1 km and drifted NW, E, SE, and S.
MODVOLC Thermal Alerts. Numerous MODIS thermal anomalies were measured almost daily throughout the month of January 2008 (table 2). As shown by the number of pixels for various observing time, the anomalies covered a particularly large area on 2 January (24 pixels). In contrast, anomalies were absent during the previous intervals of 1 January 2002 through 26 April 2007, and 16 June 2007 through 1 January 2008.
Table 2. Thermal anomalies measured by MODIS/MODVOLC over Llaima from 27 April 2007 through 30 January 2008. No anomalies were detected from 2002 through 26 April 2007, or 16 June 2007 through 1 January 2008. Courtesy of HIGP Thermal Anomalies Team.
| Date |
Time (UTC) |
Pixels |
Satellite |
| 27 Apr 2007 |
1910 |
3 |
Aqua |
| 14 Jun 2007 |
1455 |
5 |
Terra |
| 15 Jun 2007 |
0515 |
1 |
Aqua |
| 02 Jan 2008 |
0250 |
2 |
Terra |
| 02 Jan 2008 |
0430 |
9 |
Terra |
| 02 Jan 2008 |
0605 |
24 |
Aqua |
| 02 Jan 2008 |
1355 |
2 |
Terra |
| 02 Jan 2008 |
1535 |
3 |
Terra |
| 02 Jan 2008 |
1810 |
2 |
Aqua |
| 03 Jan 2008 |
0335 |
4 |
Terra |
| 03 Jan 2008 |
0510 |
2 |
Aqua |
| 03 Jan 2008 |
1440 |
1 |
Terra |
| 03 Jan 2008 |
1850 |
1 |
Aqua |
| 04 Jan 2008 |
0555 |
3 |
Aqua |
| 05 Jan 2008 |
0320 |
1 |
Terra |
| 06 Jan 2008 |
0545 |
1 |
Aqua |
| 11 Jan 2008 |
0425 |
1 |
Terra |
| 11 Jan 2008 |
0600 |
2 |
Aqua |
| 12 Jan 2008 |
0330 |
1 |
Terra |
| 14 Jan 2008 |
0630 |
1 |
Aqua |
| 15 Jan 2008 |
0400 |
1 |
Terra |
| 15 Jan 2008 |
0535 |
1 |
Aqua |
| 16 Jan 2008 |
0620 |
2 |
Aqua |
| 17 Jan 2008 |
0345 |
1 |
Terra |
| 17 Jan 2008 |
0525 |
3 |
Aqua |
| 17 Jan 2008 |
1450 |
2 |
Terra |
| 18 Jan 2008 |
0605 |
1 |
Aqua |
| 20 Jan 2008 |
0555 |
1 |
Aqua |
| 22 Jan 2008 |
0405 |
1 |
Terra |
| 22 Jan 2008 |
0545 |
2 |
Aqua |
| 23 Jan 2008 |
0625 |
1 |
Aqua |
| 24 Jan 2008 |
0530 |
3 |
Aqua |
| 24 Jan 2008 |
1455 |
1 |
Terra |
| 25 Jan 2008 |
0255 |
3 |
Terra |
| 25 Jan 2008 |
0615 |
4 |
Aqua |
| 26 Jan 2008 |
0340 |
2 |
Terra |
| 26 Jan 2008 |
0520 |
2 |
Aqua |
| 26 Jan 2008 |
1445 |
1 |
Aqua |
| 27 Jan 2008 |
0425 |
2 |
Terra |
| 27 Jan 2008 |
0600 |
2 |
Aqua |
| 27 Jan 2008 |
1525 |
1 |
Terra |
| 28 Jan 2008 |
0330 |
4 |
Terra |
| 28 Jan 2008 |
0505 |
4 |
Aqua |
| 28 Jan 2008 |
1845 |
1 |
Aqua |
| 29 Jan 2008 |
0410 |
4 |
Terra |
| 29 Jan 2008 |
0550 |
2 |
Aqua |
| 30 Jan 2008 |
0315 |
2 |
Terra |
| 30 Jan 2008 |
0630 |
4 |
Aqua |
| 30 Jan 2008 |
1420 |
5 |
Terra |
| 31 Jan 2008 |
0400 |
6 |
Terra |
| 31 Jan 2008 |
0535 |
3 |
Aqua |
| 31 Jan 2008 |
1915 |
3 |
Aqua |
Geologic Background. Llaima, one of Chile's largest and most active volcanoes, contains two main historically active craters, one at the summit and the other, Pichillaima, to the SE. The massive, dominantly basaltic-to-andesitic, stratovolcano has a volume of 400 km3. A Holocene edifice built primarily of accumulated lava flows was constructed over an 8-km-wide caldera that formed about 13,200 years ago, following the eruption of the 24 km3 Curacautín Ignimbrite. More than 40 scoria cones dot the volcano's flanks. Following the end of an explosive stage about 7200 years ago, construction of the present edifice began, characterized by Strombolian, Hawaiian, and infrequent subplinian eruptions. Frequent moderate explosive eruptions with occasional lava flows have been recorded since the 17th century.
Information Contacts: Servico Nacional de Geologia y Mineria (SERNAGEOMIN), Avda Sta María N° 0104, Santiago, Chile (URL: http://www.sernageomin.cl/); Buenos Aires Volcanic Ash Advisory Center (VAAC), Servicio Meteorológico Nacional-Fuerza Aérea Argentina, 25 de mayo 658, Buenos Aires, Argentina (URL: http://www.smn.gov.ar/vaac/buenosaires/productos.php); Simon Carn, Joint Center for Earth Systems Technology (JCET), University of Maryland Baltimore County (UMBC); Charles Holliday, U.S. Air Force Weather Agency (AFWA)/XOGM, Offutt Air Force Base, NE 68113, USA; Hawai'i Institute of Geophysics and Planetology (HIGP) Thermal Alerts System, School of Ocean and Earth Science and Technology (SOEST), Univ. of Hawai'i, 2525 Correa Road, Honolulu, HI 96822, USA (URL: http://modis.higp.hawaii.edu/); Associated Press (URL: http://www.ap.org/); United Nations Office for the Coordination of Humanitarian Affairs (OCHA) (URL: https://reliefweb.int/); Antonio Vergara, Temuco, Chile (URL: http://www.flickr.com/people/odiofotolog/).
Sheveluch (Russia) — January 2008 Cite this Report
Sheveluch
Russia
56.653°N, 161.36°E; summit elev. 3283 m
All times are local (unless otherwise noted)
Lava-dome growth and block-and-ash flows continue April-December 2007
Shiveluch (also spelled Sheveluch), the scene of lava-dome growth, is one of the most active volcanoes on Kamchatka. It was last reported here discussing events through early April 2007 (BGVN 32:03). The following report covering the interval early April-December 2007 came from multiple sources.
Shiveluch's eruptions are of an explosive nature and the volcano has been in a state of heightened activity since 5 December 2006. Vigorous activity continued to the time of this report (March 2008). Small lava-dome collapse events produced ash plumes and short block-and-ash flows, which in turn generated mudflows when snow was present. This activity was recorded in shallow volcanic earthquakes and tremor and a large, ever-present thermal anomaly on satellite imagery.
The Level of Concern Color Code remained at Orange throughout this report period (early April through December 2007). The Kamchatka Branch of the Geophysical Service of the Russian Academy of Sciences (KB GS RAS) is monitoring the volcano and believes that it poses little danger for nearby populated localities.
During April 2007 growth of the lava dome continued, and hot lava extruded at the top of the dome. Hot avalanches from the top of the dome occurred daily. Ash and ash-and-steam plumes rose to altitudes of ~ 4.6-6.5 km. Some plumes were seen on satellite imagery drifting E, SE, and S. According to satellite data, ash plumes extended ~ 60 km on 28-29 April, mainly to the S and SW, and ~ 50 km to the E on 5 and 7 May. During 27-28 May, plumes were seen on satellite imagery drifting SW.
A large thermal anomaly was conspicious during the last week of April 2007, and hot avalanches originating from the dome were noted on 30 April, 4 May, and 6-7 May. Gas-steam emissions occurred repeatedly. On 7 May a mudflow traveled down Shiveluch's slope, reaching ~ 20 km beyond the lava dome and blocking ~ 30 m of a road, isolating the district center Ust-Kamchatsk on the E of the peninsula. There were no vehicles on this portion of the road when the mudflow descended, and no casualties occurred. Figure 12 contrasts the dome in 2006 and 2007.
During July, gas-steam plumes frequently reached 4.0-6.1 km altitude. Ash was not always identified on satellite imagery because clouds obscured visibility; however, on 16 July satellite imagery detected gas-steam and ash plumes that extended for about 7-40 km to the S and SW of the volcano. Seismic data suggested that gas-and-ash emissions were concurrent with hot avalanches (figure 13).
On 25 September 2007, video observations indicated ash plumes rising to 6 km altitude and drifting E. According to video for 27 September and 2 October 2007, gas-steam plumes rose up to 4.5 and 3.5 km altitude, respectively. Weak fumarolic activity was noted on both 1 and 8 October. KB GS RAS noted that there was no significant variation in the previous ongoing activity through December 2007 that might indicate any impending activity of greater significance. Frequent MODIS thermal alerts continued throughout 2007 into 2008.
Reference. Gorbach, N., 31 July 2007, Bulletin of activity at Sheveluch volcano, issued 31 July 2007 [title approximate (translated from Russian); available in Russian at URL: http://www.kscnet.ru/ivs/volcanoes/inform_messages/2007/Sheveluch_072007/Sheveluch_072007.html).
Geologic Background. The high, isolated massif of Sheveluch volcano (also spelled Shiveluch) rises above the lowlands NNE of the Kliuchevskaya volcano group. The 1,300 km3 andesitic volcano is one of Kamchatka's largest and most active volcanic structures, with at least 60 large eruptions during the Holocene. The summit of roughly 65,000-year-old Stary Shiveluch is truncated by a broad 9-km-wide late-Pleistocene caldera breached to the south. Many lava domes occur on its outer flanks. The Molodoy Shiveluch lava dome complex was constructed during the Holocene within the large open caldera; Holocene lava dome extrusion also took place on the flanks of Stary Shiveluch. Widespread tephra layers from these eruptions have provided valuable time markers for dating volcanic events in Kamchatka. Frequent collapses of dome complexes, most recently in 1964, have produced debris avalanches whose deposits cover much of the floor of the breached caldera.
Information Contacts: Yuri Demyanchuk, Natasha Gorbsch, and theKamchatka Volcanic Eruptions Response Team (KVERT), Institute of Volcanology and Seismology, Far East Division, Russian Academy of Sciences, Piip Ave. 9, Petropavlovsk-Kamchatsky, 683006, Russia (URL: http://www.kscnet.ru/ivs/); Kamchatka Branch of the Geophysical Service of the Russian Academy of Sciences (KB GS RAS), Russia (URL: http://www.emsd.ru/); Alaska Volcano Observatory (AVO), a cooperative program of the U.S. Geological Survey, 4200 University Drive, Anchorage, AK 99508-4667, USA (URL: http://www.avo.alaska.edu/), Geophysical Institute, University of Alaska, PO Box 757320, Fairbanks, AK 99775-7320, USA, and the Alaska Division of Geological and Geophysical Surveys, 794 University Ave., Suite 200, Fairbanks, AK 99709, USA.
Turrialba (Costa Rica) — January 2008 Cite this Report
Turrialba
Costa Rica
10.025°N, 83.767°W; summit elev. 3340 m
All times are local (unless otherwise noted)
Fumarolic increases during August 2007-January 2008
Enhanced fumarolic activity accompanied by new fractures at the summit was noted during June-September 2007 (BGVN 32:08). The earlier report noted that the fumaroles had spread over a larger area and contained molten sulfur, a condensate previously not seen here in more than 25 years of continuous monitoring by the Observatorio Vulcanológico y Sismológico de Costa Rica-Universidad Nacional (OVSICORI-UNA). By mid-August 2007, acute chemical burning of important patches of natural forest had occurred. This report covers the period from October 2007 through January 2008.
During October, new sites of gas discharge, small landslides, and accelerated vegetation die-off were noted from various locations within and around the crater. Fumaroles were active and widespread across the central crater. Many exhibited sulfur deposits and those in the S, SE, and SW reached a temperature of 91°C.
Areas burned by acute acidification extended during November. Fieldwork conducted by OVSICORI-UNA confirmed an unusual output of gas from several fumaroles along the S outer wall of the volcano. Pastures turned yellowish near the upper areas, and native and exotic tree species were impacted as well as birch tree patches along most drainage basins.
During December, within the W crater, fumarole temperatures reached 280°C and significant sulfur deposits were noted. Local residents confirmed an unusual output of gas from several fumaroles along the S outer wall of the volcano. Areas burned by acute acidification extended during the month. On 5 December, members of the media and local communities observed a gas-and-steam plume from Turrialba that rose to an altitude greater than 5.3 km (figure 12).
On a team visit between 30 and 31 January 2008, OVSICORI staff documented the progression of fumarolic activity in the W crater, the external W crater walls, and distant areas towards the W, NW, and SW. Some of the fumaroles correspond with two fractures. One to the SW of the W crater, trending SW, was 100 m in length and 2 to 3 cm wide, and deposited sulfur. The second crack to the NW of the W crater, also trending SW , had temperatures of 72°C and discharged steam and gas affecting the adjacent vegetation. To the NW of the W crater, the team studied an area of about 20 x 50 m with constant gas emission and a temperature of 88°C.
Geologic Background. Turrialba, the easternmost of Costa Rica's Holocene volcanoes, is a large vegetated basaltic-to-dacitic stratovolcano located across a broad saddle NE of Irazú volcano overlooking the city of Cartago. The massive edifice covers an area of 500 km2. Three well-defined craters occur at the upper SW end of a broad 800 x 2200 m summit depression that is breached to the NE. Most activity originated from the summit vent complex, but two pyroclastic cones are located on the SW flank. Five major explosive eruptions have occurred during the past 3500 years. A series of explosive eruptions during the 19th century were sometimes accompanied by pyroclastic flows. Fumarolic activity continues at the central and SW summit craters.
Information Contacts: Eliécer Duarte, Erick Fernández, and Vilma Barboza, Observatorio Vulcanológico y Sismológico de Costa Rica, Universidad Nacional (OVSICORI-UNA), Apdo. 2346-3000, Heredia, Costa Rica (URL: http://www.ovsicori.una.ac.cr/); Tellez and Francois Robichaud, Université de Sherbrooke, 2500 boul. de l'Université, Sherbrooke, Québec J1K 2R1, Canada.
Ubinas
Peru
16.345°S, 70.8972°W; summit elev. 5608 m
All times are local (unless otherwise noted)
Continuing ashfall during 2006-2007
Ubinas began erupting ash on 25 March 2006 (BGVN 31:03 and 31:05). As reported in BGVN 31:10, ash eruptions and steam emissions continued through 31 October 2006. This report discusses ongoing eruptions through December 2007 as drawn from Buenos Aires Volcanic Ash Advisory Center (VAAC) reports and the Instituto Geológical Minero y Metalúrgico (INGEMMET).
From November 2006 through December 2007, emissions of volcanic ash, rocks, and gases with water and steam were essentially continuous. INGEMMET authorities indicated that during March 2007 the volcano generated increased ashfall behavior that significantly affected people and the environment. At the beginning of the month, small explosions occurred every 6-8 days but the rate of activity increased toward the end. On 30 March 2007, nearby residents felt a strong explosion. A large ash plume vented from the volcano's summit and local communities were blanketed beneath falling ash. According to INGEMMET authorities, most of Querapi, a town ~ 4.5 km SE of the crater's active vent, was covered in volcanic ash, and the town of Anascapa, 6 km E, also experienced ashfall.
Volcanic ash clouds blown into the atmosphere also presented a hazard to aviation. As summarized in table 3, ash clouds were nearly continuously reported by the Buenos Aires VAAC and the INGEMMET. Plume heights reached as high as 9.1 km in May and again in November 2007. The aviation warning color code was generally Red through the period. The reports were based on satellite imagery and pilot reports. No thermal alerts were noted from the University of Hawaii's Institute of Geophysics and Planetology (HIGP) MODIS satellite-based thermal alert system during 2006 or 2007.
Table 3. Compilation of Volcanic Ash Advisories for aviation from Ubinas during November 2006 through December 2007. Courtesy of the Buenos Aires Volcanic Ash Advisory Center (VAAC) and the Instituto Geológical Minero y Metalúrgico (INGEMMET).
| Date |
Altitude of Plume (km) |
Flight Level (thousands of feet) |
Direction of Plume |
| 3-16 Nov 2006 |
5.5-7.3 |
190-260 |
SW, S, SW |
| 25 Nov 2006 |
5.5 |
180 |
NE |
| 2 Dec 2006 |
5.5 |
180 |
N |
| 27-30 Dec 2006 |
4.9-8.5 |
160-280 |
E |
| 28 Jan 2007 |
5.5-6.9 |
180-220 |
SE |
| 2-5 Feb 2007 |
5.5 |
180 |
S, SW |
| 18-21 Feb 2007 |
5.5-7.0 |
180-230 |
E, SW |
| 11, 14 Mar 2007 |
5.5-6.4 |
180-210 |
N, SW |
| 30 Mar 2007 |
5.5 |
180 |
E |
| 5, 7-9, 10-11 Apr 2007 |
5.5-7.8 |
180-270 |
E, SE, S, SW, W |
| 17-18, 22, 24 Apr 2007 |
5.5-7.2 |
180-280 |
NW, SW, SE |
| 2-5 May 2007 |
5.5-9.1 |
180/300 |
N, S, SE, SW |
| 12, 15-16 May 2007 |
5.5-8.2 |
180-270 |
SE, N, SW |
| 17, 19-22 May 2007 |
5.5-9.1 |
180-300 |
E, SE |
| 22-28 May 2007 |
5.5-7.3 |
180-240 |
NE, SE |
| 30 May-6 Jun 2007 |
3.7-7.6 |
120-250 |
NE, SE |
| 12-17 Jun 2007 |
5.5-6.7 |
180-230 |
NE, E, SW, W |
| 27-28 Jun 2007 |
5.5-6.7 |
180-230 |
SW, NW, E |
| 4 Jul 2007 |
5.5-6.1 |
180-200 |
S |
| 23-25 Jul 2007 |
5.9-6.1 |
190-200 |
SE, S |
| 9 Aug 2007 |
6.1 |
200 |
SE |
| 11-14 Sep 2007 |
5.5-7.6 |
180-250 |
E, SE |
| 20 Sep 2007 |
5.5-6.4 |
180-210 |
E |
| 5-7 Oct 2007 |
5.5-6.4 |
180-210 |
N, S |
| 11-13, 15 Oct 2007 |
5.5-7.6 |
180-250 |
N, SE |
| 19-27 Oct 2007 |
5.5-8.5 |
180-280 |
NW, NE |
| 1, 3-6 Nov 2007 |
5.5-7.6 |
180-250 |
NE, SE |
| 11-12 Nov 2007 |
5.5-6.7 |
180-220 |
NE |
| 16, 18, 20 Nov 2007 |
5.5-7.9 |
180-260 |
NE |
| 24-27 Nov 2007 |
6.1-9.1 |
200-300 |
SE, E, SW |
| 28-29 Nov 2007 |
6.7-7.6 |
220-250 |
SW, NE |
| 4-7, 10 Dec 2007 |
5.5-8.5 |
180-280 |
NE |
| 17 Dec 2007 |
5.5-6.7 |
180-220 |
N |
Geologic Background. The truncated appearance of Ubinas, Perú's most active volcano, is a result of a 1.4-km-wide crater at the summit. It is the northernmost of three young volcanoes located along a regional structural lineament about 50 km behind the main volcanic front. The growth and destruction of Ubinas I was followed by construction of Ubinas II beginning in the mid-Pleistocene. The upper slopes of the andesitic-to-rhyolitic Ubinas II stratovolcano are composed primarily of andesitic and trachyandesitic lava flows and steepen to nearly 45°. The steep-walled, 150-m-deep summit crater contains an ash cone with a 500-m-wide funnel-shaped vent that is 200 m deep. Debris-avalanche deposits from the collapse of the SE flank about 3,700 years ago extend 10 km from the volcano. Widespread Plinian pumice-fall deposits include one from about 1,000 years ago. Holocene lava flows are visible on the flanks, but activity documented since the 16th century has consisted of intermittent minor-to-moderate explosive eruptions.
Information Contacts: Instituto Geológical Minero y Metalúrgico (INGEMMET), Av. Canadá 1470, San Borja, Lima 41, Perú (URL: http://www.ingemmet.gob.pe/); Buenos Aires Volcanic Ash Advisory Center (VAAC), Argentina (URL: http://www.smn.gov.ar/vaac/buenosaires/productos.php).