Recently Published Bulletin Reports
Erebus (Antarctica) Lava lake remains active; most thermal alerts recorded since 2019
Rincon de la Vieja (Costa Rica) Frequent phreatic explosions during July-December 2023
Bezymianny (Russia) Explosion on 18 October 2023 sends ash plume 8 km high; lava flows and incandescent avalanches
Kilauea (United States) Low-level lava effusions in the lava lake at Halema’uma’u during July-December 2022
Nyamulagira (DR Congo) Lava flows and thermal activity during May-October 2023
Bagana (Papua New Guinea) Explosions, ash plumes, ashfall, and lava flows during April-September 2023
Mayon (Philippines) Lava flows, pyroclastic flows, ash emissions, and seismicity during April-September 2023
Nishinoshima (Japan) Eruption plumes and gas-and-steam plumes during May-August 2023
Krakatau (Indonesia) White gas-and-steam plumes and occasional ash plumes during May-August 2023
Villarrica (Chile) Strombolian activity, gas-and-ash emissions, and crater incandescence during April-September 2023
Merapi (Indonesia) Frequent incandescent avalanches during April-September 2023
Ebeko (Russia) Moderate explosive activity with ash plumes continued during June-November 2023
Erebus (Antarctica) — January 2024  Cite this Report
Erebus
Antarctica
77.53°S, 167.17°E; summit elev. 3794 m
All times are local (unless otherwise noted)
Lava lake remains active; most thermal alerts recorded since 2019
The lava lake in the summit crater of Erebus has been active since at least 1972. Located in Antarctica overlooking the McMurdo Station on Ross Island, it is the southernmost active volcano on the planet. Because of the remote location, activity is primarily monitored by satellites. This report covers activity during 2023.
The number of thermal alerts recorded by the Hawai'i Institute of Geophysics and Planetology’s MODVOLC Thermal Alerts System increased considerably in 2023 compared to the years 2020-2022 (table 9). In contrast to previous years, the MODIS instruments aboard the Aqua and Terra satellites captured data from Erebus every month during 2023. Consistent with previous years, the lowest number of anomalous pixels were recorded in January, November, and December.
Table 9. Number of monthly MODIS-MODVOLC thermal alert pixels recorded at Erebus during 2017-2023. See BGVN 42:06 for data from 2000 through 2016. The table was compiled using data provided by the HIGP – MODVOLC Thermal Alerts System.
| Year |
Jan |
Feb |
Mar |
Apr |
May |
Jun |
Jul |
Aug |
Sep |
Oct |
Nov |
Dec |
SUM |
| 2017 |
0 |
21 |
9 |
0 |
0 |
1 |
11 |
61 |
76 |
52 |
0 |
3 |
234 |
| 2018 |
0 |
21 |
58 |
182 |
55 |
17 |
137 |
172 |
103 |
29 |
0 |
0 |
774 |
| 2019 |
2 |
21 |
162 |
151 |
55 |
56 |
75 |
53 |
29 |
19 |
1 |
0 |
624 |
| 2020 |
0 |
2 |
16 |
18 |
4 |
4 |
1 |
3 |
18 |
3 |
1 |
6 |
76 |
| 2021 |
0 |
9 |
1 |
0 |
2 |
56 |
46 |
47 |
35 |
52 |
5 |
3 |
256 |
| 2022 |
1 |
13 |
55 |
22 |
15 |
32 |
39 |
19 |
31 |
11 |
0 |
0 |
238 |
| 2023 |
2 |
33 |
49 |
82 |
41 |
32 |
70 |
64 |
42 |
17 |
5 |
11 |
448 |
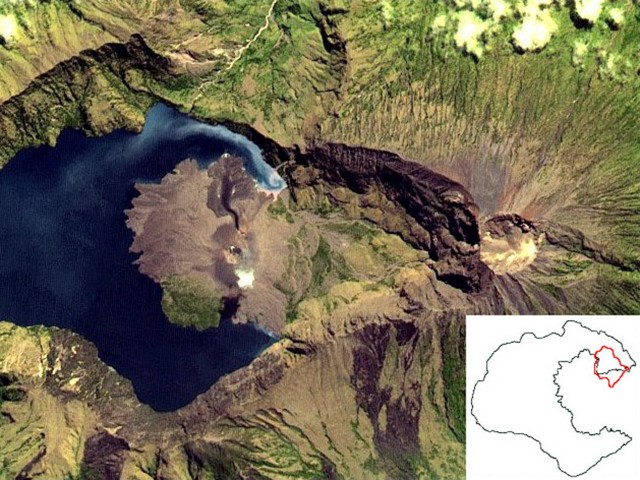
Sentinel-2 infrared images showed one or two prominent heat sources within the summit crater, accompanied by adjacent smaller sources, similar to recent years (see BGVN 46:01, 47:02, and 48:01). A unique image was obtained on 25 November 2023 by the OLI-2 (Operational Land Imager-2) on Landsat 9, showing the upper part of the volcano surrounded by clouds (figure 32).
Geologic Background. Mount Erebus, the world's southernmost historically active volcano, overlooks the McMurdo research station on Ross Island. It is the largest of three major volcanoes forming the crudely triangular Ross Island. The summit of the dominantly phonolitic volcano has been modified by one or two generations of caldera formation. A summit plateau at about 3,200 m elevation marks the rim of the youngest caldera, which formed during the late-Pleistocene and within which the modern cone was constructed. An elliptical 500 x 600 m wide, 110-m-deep crater truncates the summit and contains an active lava lake within a 250-m-wide, 100-m-deep inner crater; other lava lakes are sometimes present. The glacier-covered volcano was erupting when first sighted by Captain James Ross in 1841. Continuous lava-lake activity with minor explosions, punctuated by occasional larger Strombolian explosions that eject bombs onto the crater rim, has been documented since 1972, but has probably been occurring for much of the volcano's recent history.
Information Contacts: Hawai'i Institute of Geophysics and Planetology (HIGP) - MODVOLC Thermal Alerts System, School of Ocean and Earth Science and Technology (SOEST), Univ. of Hawai'i, 2525 Correa Road, Honolulu, HI 96822, USA (URL: http://modis.higp.hawaii.edu/); Copernicus Browser, Copernicus Data Space Ecosystem, European Space Agency (URL: https://dataspace.copernicus.eu/browser/); NASA Earth Observatory, EOS Project Science Office, NASA Goddard Space Flight Center, Goddard, Maryland, USA (URL: https://earthobservatory.nasa.gov/images/152134/erebus-breaks-through).
Rincon de la Vieja (Costa Rica) — January 2024 Cite this Report
Rincon de la Vieja
Costa Rica
10.83°N, 85.324°W; summit elev. 1916 m
All times are local (unless otherwise noted)
Frequent phreatic explosions during July-December 2023
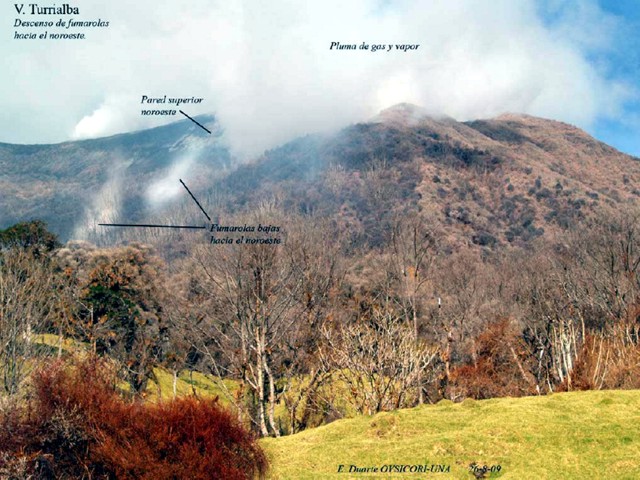
Rincón de la Vieja is a volcanic complex in Costa Rica with a hot convecting acid lake that exhibits frequent weak phreatic explosions, gas-and-steam emissions, and occasional elevated sulfur dioxide levels (BGVN 45:10, 46:03, 46:11). The current eruption period began June 2021. This report covers activity during July-December 2023 and is based on weekly bulletins and occasional daily reports from the Observatorio Vulcanologico Sismologica de Costa Rica-Universidad Nacional (OVSICORI-UNA).
Numerous weak phreatic explosions continued during July-December 2023, along with gas-and-steam emissions and plumes that rose as high as 3 km above the crater rim. Many weekly OVSICORI-UNA bulletins included the previous week's number of explosions and emissions (table 9). For many explosions, the time of explosion was given (table 10). Frequent seismic activity (long-period earthquakes, volcano-tectonic earthquakes, and tremor) accompanied the phreatic activity.
Table 9. Number of reported weekly phreatic explosions and gas-and-steam emissions at Rincón de la Vieja, July-December 2023. Counts are reported for the week before the Weekly Bulletin date; not all reports included these data. Courtesy of OVSICORI-UNA.
| OVSICORI Weekly Bulletin |
Number of explosions |
Number of emissions |
| 28 Jul 2023 |
6 |
14 |
| 4 Aug 2023 |
10 |
12 |
| 1 Sep 2023 |
13 |
11 |
| 22 Sep 2023 |
12 |
13 |
| 29 Sep 2023 |
6 |
11 |
| 6 Oct 2023 |
12 |
5 |
| 13 Oct 2023 |
7 |
9 |
| 20 Oct 2023 |
1 |
15 |
| 27 Oct 2023 |
3 |
23 |
| 3 Nov 2023 |
3 |
10 |
| 17 Nov 2023 |
0 |
Some |
| 24 Nov 2023 |
0 |
14 |
| 8 Dec 2023 |
4 |
16 |
| 22 Dec 2023 |
8 |
18 |
Table 10. Summary of activity at Rincón de la Vieja during July-December 2023. Weak phreatic explosions and gas emissions are noted where the time of explosion was indicated in the weekly or daily bulletins. Height of plumes or emissions are distance above the crater rim. Courtesy of OVSICORI-UNA.
| Date |
Time |
Description of Activity |
| 1 Jul 2023 |
0156 |
Explosion. |
| 2 Jul 2023 |
0305 |
Explosion. |
| 4 Jul 2023 |
0229, 0635 |
Event at 0635 produced a gas-and-steam plume that rose 700 m and drifted W; seen by residents in Liberia (21 km SW). |
| 9 Jul 2023 |
1843 |
Explosion. |
| 21 Jul 2023 |
0705 |
Explosion. |
| 26 Jul 2023 |
1807 |
Explosion. |
| 28 Jul 2023 |
0802 |
Explosion generated a gas-and-steam plume that rose 500 m. |
| 30 Jul 2023 |
1250 |
Explosion. |
| 31 Jul 2023 |
2136 |
Explosion. |
| 11 Aug 2023 |
0828 |
Explosion. |
| 18 Aug 2023 |
1304 |
Explosion. |
| 21 Aug 2023 |
1224 |
Explosion generated gas-and-steam plumes rose 500-600 m. |
| 22 Aug 2023 |
0749 |
Explosion generated gas-and-steam plumes rose 500-600 m. |
| 24 Aug 2023 |
1900 |
Explosion. |
| 25 Aug 2023 |
0828 |
Event produced a steam-and-gas plume that rose 3 km and drifted NW. |
| 27-28 Aug 2023 |
0813 |
Four small events; the event at 0813 on 28 August lasted two minutes and generated a steam-and-gas plume that rose 2.5 km. |
| 1 Sep 2023 |
1526 |
Explosion generated plume that rose 2 km and ejected material onto the flanks. |
| 2-3 Sep 2023 |
- |
Small explosions detected in infrasound data. |
| 4 Sep 2023 |
1251 |
Gas-and-steam plume rose 1 km and drifted W. |
| 7 Nov 2023 |
1113 |
Explosion. |
| 8 Nov 2023 |
0722 |
Explosion. |
| 12 Nov 2023 |
0136 |
Small gas emissions. |
| 14 Nov 2023 |
0415 |
Small gas emissions. |
According to OVSICORI-UNA, during July-October the average weekly sulfur dioxide (SO2) flux ranged from 68 to 240 tonnes/day. However, in mid-November the flux increased to as high as 334 tonnes/day, the highest value measured in recent years. The high SO2 flux in mid-November was also detected by the TROPOMI instrument on the Sentinel-5P satellite (figure 43).
Geologic Background. Rincón de la Vieja, the largest volcano in NW Costa Rica, is a remote volcanic complex in the Guanacaste Range. The volcano consists of an elongated, arcuate NW-SE-trending ridge constructed within the 15-km-wide early Pleistocene Guachipelín caldera, whose rim is exposed on the south side. Sometimes known as the "Colossus of Guanacaste," it has an estimated volume of 130 km3 and contains at least nine major eruptive centers. Activity has migrated to the SE, where the youngest-looking craters are located. The twin cone of Santa María volcano, the highest peak of the complex, is located at the eastern end of a smaller, 5-km-wide caldera and has a 500-m-wide crater. A Plinian eruption producing the 0.25 km3 Río Blanca tephra about 3,500 years ago was the last major magmatic eruption. All subsequent eruptions, including numerous historical eruptions possibly dating back to the 16th century, have been from the prominent active crater containing a 500-m-wide acid lake located ENE of Von Seebach crater.
Information Contacts: Observatorio Vulcanológico Sismológica de Costa Rica-Universidad Nacional (OVSICORI-UNA), Apartado 86-3000, Heredia, Costa Rica (URL: http://www.ovsicori.una.ac.cr/); NASA Global Sulfur Dioxide Monitoring Page, Atmospheric Chemistry and Dynamics Laboratory, NASA Goddard Space Flight Center (NASA/GSFC), 8800 Greenbelt Road, Goddard MD 20771, USA (URL: https://so2.gsfc.nasa.gov/).
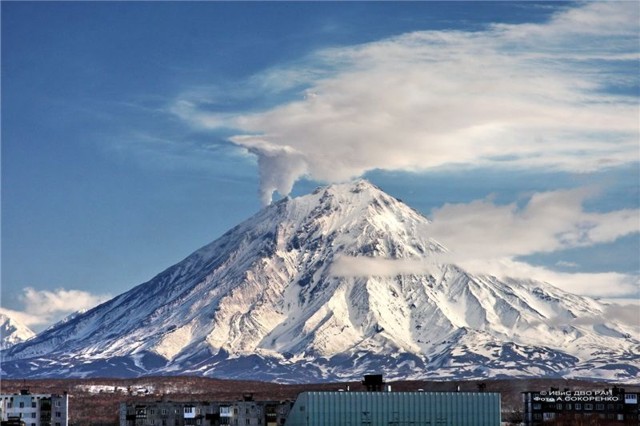
Bezymianny (Russia) — November 2023 Cite this Report
Bezymianny
Russia
55.972°N, 160.595°E; summit elev. 2882 m
All times are local (unless otherwise noted)
Explosion on 18 October 2023 sends ash plume 8 km high; lava flows and incandescent avalanches
Bezymianny, located on Russia’s Kamchatka Peninsula, has had eruptions since 1955 characterized by dome growth, explosions, pyroclastic flows, ash plumes, and ashfall. Activity during November 2022-April 2023 included gas-and-steam emissions, lava dome collapses generating avalanches, and persistent thermal activity. Similar eruptive activity continued from May through October 2023, described here based on information from weekly and daily reports of the Kamchatka Volcano Eruptions Response Team (KVERT), notices from Tokyo VAAC (Volcanic Ash Advisory Center), and from satellite data.
Overall activity decreased after the strong period of activity in late March through April 2023, which included ash explosions during 29 March and 7-8 April 2023 that sent plumes as high as 10-12 km altitude, along with dome growth and lava flows (BGVN 48:05). This reduced activity can be seen in the MIROVA thermal detection system graph (figure 56), which was consistent with data from the MODVOLC thermal detection system and with Sentinel-2 satellite images that showed persistent hotspots in the summit crater when conditions allowed observations. A renewed period of strong activity began in mid-October 2023.
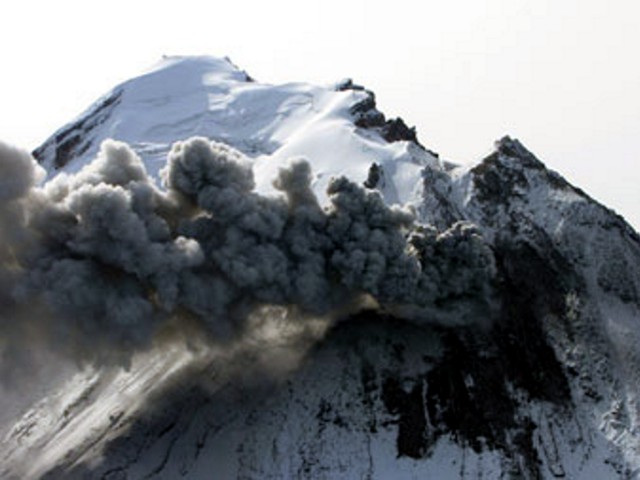
Activity increased significantly on 17 October 2023 when large collapses began during 0700-0830 on the E flanks of the lava dome and continued to after 0930 the next day (figure 57). Ash plumes rose to an altitude of 4.5-5 km, extending 220 km NNE by 18 October. A large explosion at 1630 on 18 October produced an ash plume that rose to an altitude of 11 km (8 km above the summit) and drifted NNE and then NW, extending 900 km NW within two days at an altitude of 8 km. Minor ashfall was noted in Kozyrevsk (45 km WNW). At 0820 on 20 October an ash plume was identified in satellite images drifting 100 km ENE at altitudes of 4-4.5 km.
Lava flows and hot avalanches from the dome down the SE flank continued over the next few days, including 23 October when clear conditions allowed good observations (figures 58 and 59). A large thermal anomaly was observed over the volcano through 24 October, and in the summit crater on 30 October (figure 60). Strong fumarolic activity continued, with numerous avalanches and occasional incandescence. By the last week of October, volcanic activity had decreased to a level consistent with that earlier in the reporting period.
Aviation warnings were frequently updated during 17-20 October. KVERT issued a Volcano Observatory Notice for Aviation (VONA) on 17 October at 1419 and 1727 (0219 and 0527 UTC) raising the Aviation Color Code (ACC) from Yellow to Orange (second highest level). The next day, KVERT issued a VONA at 1705 (0505 UTC) raising the ACC to Red (highest level) but lowered it back to Orange at 2117 (0917 UTC). After another decrease to Yellow and back to Orange, the ACC was reduced to Yellow on 20 October at 1204 (0004 UTC). In addition, the Tokyo VAAC issued a series of Volcanic Ash Advisories beginning on 16 October and continuing through 30 October.
Geologic Background. The modern Bezymianny, much smaller than its massive neighbors Kamen and Kliuchevskoi on the Kamchatka Peninsula, was formed about 4,700 years ago over a late-Pleistocene lava-dome complex and an edifice built about 11,000-7,000 years ago. Three periods of intensified activity have occurred during the past 3,000 years. The latest period, which was preceded by a 1,000-year quiescence, began with the dramatic 1955-56 eruption. This eruption, similar to that of St. Helens in 1980, produced a large open crater that was formed by collapse of the summit and an associated lateral blast. Subsequent episodic but ongoing lava-dome growth, accompanied by intermittent explosive activity and pyroclastic flows, has largely filled the 1956 crater.
Information Contacts: Kamchatka Volcanic Eruptions Response Team (KVERT), Far Eastern Branch, Russian Academy of Sciences, 9 Piip Blvd., Petropavlovsk-Kamchatsky, 683006, Russia (URL: http://www.kscnet.ru/ivs/kvert/); Kamchatka Volcanological Station, Kamchatka Branch of Geophysical Survey, (KB GS RAS), Klyuchi, Kamchatka Krai, Russia (URL: http://volkstat.ru/); Tokyo Volcanic Ash Advisory Center (VAAC), 1-3-4 Otemachi, Chiyoda-ku, Tokyo 100-8122, Japan (URL: http://ds.data.jma.go.jp/svd/vaac/data/); Hawai'i Institute of Geophysics and Planetology (HIGP) - MODVOLC Thermal Alerts System, School of Ocean and Earth Science and Technology (SOEST), Univ. of Hawai'i, 2525 Correa Road, Honolulu, HI 96822, USA (URL: http://modis.higp.hawaii.edu/); MIROVA (Middle InfraRed Observation of Volcanic Activity), a collaborative project between the Universities of Turin and Florence (Italy) supported by the Centre for Volcanic Risk of the Italian Civil Protection Department (URL: http://www.mirovaweb.it/); Copernicus Browser, Copernicus Data Space Ecosystem, European Space Agency (URL: https://dataspace.copernicus.eu/browser/).chr
Kilauea (United States) — January 2023 Cite this Report
Kilauea
United States
19.421°N, 155.287°W; summit elev. 1222 m
All times are local (unless otherwise noted)
Low-level lava effusions in the lava lake at Halema’uma’u during July-December 2022
Kīlauea is the southeastern-most volcano in Hawaii and overlaps the E flank of the Mauna Loa volcano. Its East Rift Zone (ERZ) has been intermittently active for at least 2,000 years. An extended eruption period began in January 1983 and was characterized by open lava lakes and lava flows from the summit caldera and the East Rift Zone. During May 2018 magma migrated into the Lower East Rift Zone (LERZ) and opened 24 fissures along a 6-km-long NE-trending fracture zone that produced lava flows traveling in multiple directions. As lava emerged from the fissures, the lava lake at Halema'uma'u drained and explosions sent ash plumes to several kilometers altitude (BGVN 43:10).
The current eruption period started during September 2021 and has recently been characterized by lava effusions, spatter, and sulfur dioxide emissions in the active Halema’uma’u lava lake (BGVN 47:08). Lava effusions, some spatter, and sulfur dioxide emissions have continued during this reporting period of July through December 2022 using daily reports, volcanic activity notices, and abundant photo, map, and video data from the US Geological Survey's (USGS) Hawaiian Volcano Observatory (HVO).
Summary of activity during July-December 2022. Low-level effusions have continued at the western vent of the Halema’uma’u crater during July through early December 2022. Occasional weak ooze-outs (also called lava break outs) would occur along the margins of the crater floor. The overall level of the active lava lake throughout the reporting period gradually increased due to infilling, however it stagnated in mid-September (table 13). During September through November, activity began to decline, though lava effusions persisted at the western vent. By 9 December, the active part of the lava lake had completely crusted over, and incandescence was no longer visible.
Table 13. Summary of measurements taken during overflights at Kīlauea that show a gradual increase in the active lava lake level and the volume of lava effused since 29 September 2021. Lower activity was reported during September-October. Data collected during July-December 2022. Courtesy of HVO.
| Date: |
Level of the active lava lake (m): |
Cumulative volume of lava effused (million cubic meters): |
| 7 Jul 2022 |
130 |
95 |
| 19 Jul 2022 |
133 |
98 |
| 4 Aug 2022 |
136 |
102 |
| 16 Aug 2022 |
137 |
104 |
| 12 Sep 2022 |
143 |
111 |
| 5 Oct 2022 |
143 |
111 |
| 28 Oct 2022 |
143 |
111 |
Activity during July 2022. Lava effusions were reported from the western vent in the Halema’uma’u crater, along with occasional weak ooze-outs along the margins of the crater floor. The height of the lava lake was variable due to deflation-inflation tilt events; for example, the lake level dropped approximately 3-4 m during a summit deflation-inflation event reported on 1 July. Webcam images taken during the night of 6-12 July showed intermittent low-level spattering at the western vent that rose less than 10 m above the vent (figure 519). Measurements made during an overflight on 7 July indicated that the crater floor was infilled about 130 m and that 95 million cubic meters of lava had been effused since 29 September 2021. A single, relatively small lava ooze-out was active to the S of the lava lake. Around midnight on 8 July there were two brief periods of lava overflow onto the lake margins. On 9 July lava ooze-outs were reported near the SE and NE edges of the crater floor and during 10-11 July they occurred near the E, NE, and NW edges. On 16 July crater incandescence was reported, though the ooze-outs and spattering were not visible. On 18 July overnight webcam images showed incandescence in the western vent complex and two ooze-outs were reported around 0000 and 0200 on 19 July. By 0900 there were active ooze-outs along the SW edge of the crater floor. Measurements made from an overflight on 19 July indicated that the crater floor was infilled about 133 m and 98 million cubic meters of lava had erupted since 29 September 2021 (figure 520). On 20 July around 1600 active ooze-outs were visible along the N edge of the crater, which continued through the next day. Extensive ooze-outs occurred along the W margin during 24 July until 1900; on 26 July minor ooze-outs were noted along the N margin. Minor spattering was visible on 29 July along the E margin of the lake. The sulfur dioxide emission rates ranged 650-2,800 tons per day (t/d), the higher of which was measured on 8 July (figure 519).
Activity during August 2022. The eruption continued in the Halema’uma’u crater at the western vent. According to HVO the lava in the active lake remained at the level of the bounding levees. Occasional minor ooze-outs were observed along the margins of the crater floor. Strong nighttime crater incandescence was visible after midnight on 6 August over the western vent cone. During 6-7 August scattered small lava lobes were active along the crater floor and incandescence persisted above the western vent through 9 August. During 7-9 August HVO reported a single lava effusion source was active along the NW margin of the crater floor. Measurements from an overflight on 4 August indicated that the crater floor was infilled about 136 m total and that 102 million cubic meters of lava had been erupted since the start of the eruption. Lava breakouts were reported along the N, NE, E, S, and W margins of the crater during 10-16 August. Another overflight survey conducted on 16 August indicated that the crater floor infilled about 137 m and 104 million cubic meters of lava had been erupted since September 2021. Measured sulfur dioxide emissions rates ranged 1,150-2,450 t/d, the higher of which occurred on 8 August.
Activity during September 2022. During September, lava effusion continued from the western vent into the active lava lake and onto the crater floor. Intermittent minor ooze-outs were reported through the month. A small ooze-out was visible on the W crater floor margin at 0220 on 2 September, which showed decreasing surface activity throughout the day, but remained active through 3 September. On 3 September around 1900 a lava outbreak occurred along the NW margin of the crater floor but had stopped by the evening of 4 September. Field crews monitoring the summit lava lake on 9 September observed spattering on the NE margin of the lake that rose no higher than 10 m, before falling back onto the lava lake crust (figure 521). Overflight measurements on 12 September indicated that the crater floor was infilled a total of 143 m and 111 million cubic meters of lava had been erupted since September 2021. Extensive breakouts in the W and N part of the crater floor were reported at 1600 on 20 September and continued into 26 September. The active part of the lava lake dropped by 10 m while other parts of the crater floor dropped by several meters. Summit tiltmeters recorded a summit seismic swarm of more than 80 earthquakes during 1500-1800 on 21 September, which occurred about 1.5 km below Halema’uma’u; a majority of these were less than Mw 2. By 22 September the active part of the lava lake was infilled about 2 m. On 23 September the western vent areas exhibited several small spatter cones with incandescent openings, along with weak, sporadic spattering (figure 522). The sulfur dioxide emission rate ranged from 930 t/d to 2,000 t/d, the higher of which was measured on 6 September.
Activity during October 2022. Activity during October declined slightly compared to previous months, though lava effusions persisted from the western vent into the active lava lake and onto the crater floor during October (figure 523). Slight variations in the lava lake were noted throughout the month. HVO reported that around 0600 on 3 October the level of the lava lake has lowered slightly. Overflight measurements taken on 5 October indicated that the crater floor was infilled a total of about 143 m and that 111 million cubic meters of lava had been effused since September 2021. During 6-7 October the lake gradually rose 0.5 m. Sulfur dioxide measurements made on 22 October had an emission rate of 700 t/d. Another overflight taken on 28 October showed that there was little to no change in the elevation of the crater floor: the crater floor was infilled a total of 143 m and 111 million cubic meters of lava had erupted since the start of the eruption.
Activity during November 2022. Activity remained low during November, though HVO reported that lava from the western vent continued to effuse into the active lava lake and onto the crater floor throughout the month. The rate of sulfur dioxide emissions during November ranged from 300-600 t/d, the higher amount of which occurred on 9 November.
Activity during December 2022. Similar low activity was reported during December, with lava effusing from the western vent into the active lava lake and onto the crater floor. During 4-5 December the active part of the lava lake was slightly variable in elevation and fluctuated within 1 m. On 9 December HVO reported that lava was no longer erupting from the western vent in the Halema’uma’u crater and that sulfur dioxide emissions had returned to near pre-eruption background levels; during 10-11 December, the lava lake had completely crusted over, and no incandescence was visible (figure 524). Time lapse camera images covering the 4-10 December showed that the crater floor showed weak deflation and no inflation. Some passive events of crustal overturning were reported during 14-15 December, which brought fresh incandescent lava to the lake surface. The sulfur dioxide emission rate was approximately 200 t/d on 14 December. A smaller overturn event on 17 December and another that occurred around 0000 and into the morning of 20 December were also detected. A small seismic swarm was later detected on 30 December.
Geologic Background. Kilauea overlaps the E flank of the massive Mauna Loa shield volcano in the island of Hawaii. Eruptions are prominent in Polynesian legends; written documentation since 1820 records frequent summit and flank lava flow eruptions interspersed with periods of long-term lava lake activity at Halemaumau crater in the summit caldera until 1924. The 3 x 5 km caldera was formed in several stages about 1,500 years ago and during the 18th century; eruptions have also originated from the lengthy East and Southwest rift zones, which extend to the ocean in both directions. About 90% of the surface of the basaltic shield volcano is formed of lava flows less than about 1,100 years old; 70% of the surface is younger than 600 years. The long-term eruption from the East rift zone between 1983 and 2018 produced lava flows covering more than 100 km2, destroyed hundreds of houses, and added new coastline.
Information Contacts: Hawaiian Volcano Observatory (HVO), U.S. Geological Survey, PO Box 51, Hawai'i National Park, HI 96718, USA (URL: http://hvo.wr.usgs.gov/).
Nyamulagira (DR Congo) — November 2023 Cite this Report
Nyamulagira
DR Congo
1.408°S, 29.2°E; summit elev. 3058 m
All times are local (unless otherwise noted)
Lava flows and thermal activity during May-October 2023
Nyamulagira (also known as Nyamuragira) is a shield volcano in the Democratic Republic of Congo with the summit truncated by a small 2 x 2.3 km caldera with walls up to about 100 m high. Documented eruptions have occurred within the summit caldera, as well as from numerous flank fissures and cinder cones. The current eruption period began in April 2018 and has more recently been characterized by summit crater lava flows and thermal activity (BGVN 48:05). This report describes lava flows and variable thermal activity during May through October 2023, based on information from the Observatoire Volcanologique de Goma (OVG) and various satellite data.
Lava lake activity continued during May. The MIROVA (Middle InfraRed Observation of Volcanic Activity) system recorded moderate-to-strong thermal activity throughout the reporting period; activity was more intense during May and October and relatively weaker from June through September (figure 95). The MODVOLC thermal algorithm, detected a total of 209 thermal alerts. There were 143 hotspots detected during May, eight during June, nine during September, and 49 during October. This activity was also reflected in infrared satellite images, where a lava flow was visible in the NW part of the crater on 7 May and strong activity was seen in the center of the crater on 4 October (figure 96). Another infrared satellite image taken on 12 May showed still active lava flows along the NW margin of the crater. According to OVG lava effusions were active during 7-29 May and moved to the N and NW parts of the crater beginning on 9 May. Strong summit crater incandescence was visible from Goma (27 km S) during the nights of 17, 19, and 20 May (figure 97). On 17 May there was an increase in eruptive activity, which peaked at 0100 on 20 May. Notable sulfur dioxide plumes drifted NW and W during 19-20 May (figure 98). Drone footage acquired in partnership with the USGS (United States Geological Survey) on 20 May captured images of narrow lava flows that traveled about 100 m down the W flank (figure 99). Data from the Rumangabo seismic station indicated a decreasing trend in activity during 17-21 May. Although weather clouds prevented clear views of the summit, a strong thermal signature on the NW flank was visible in an infrared satellite image on 22 May, based on an infrared satellite image. On 28 May the lava flows on the upper W flank began to cool and solidify. By 29 May seismicity returned to levels similar to those recorded before the 17 May increase. Lava effusion continued but was confined to the summit crater; periodic crater incandescence was observed.
Low-level activity was noted during June through October. On 1 June OVG reported that seismicity remained at lower levels and that crater incandescence had been absent for three days, though infrared satellite imagery showed continued lava effusion in the summit crater. The lava flows on the flanks covered an estimated 0.6 km2. Satellite imagery continued to show thermal activity confined to the lava lake through October (figure 96), although no lava flows or significant sulfur dioxide emissions were reported.
Geologic Background. Africa's most active volcano, Nyamulagira (also known as Nyamuragira), is a massive high-potassium basaltic shield about 25 km N of Lake Kivu and 13 km NNW of the steep-sided Nyiragongo volcano. The summit is truncated by a small 2 x 2.3 km caldera that has walls up to about 100 m high. Documented eruptions have occurred within the summit caldera, as well as from the numerous flank fissures and cinder cones. A lava lake in the summit crater, active since at least 1921, drained in 1938, at the time of a major flank eruption. Recent lava flows extend down the flanks more than 30 km from the summit as far as Lake Kivu; extensive lava flows from this volcano have covered 1,500 km2 of the western branch of the East African Rift.
Information Contacts: Observatoire Volcanologique de Goma (OVG), Departement de Geophysique, Centre de Recherche en Sciences Naturelles, Lwiro, D.S. Bukavu, DR Congo; Hawai'i Institute of Geophysics and Planetology (HIGP) - MODVOLC Thermal Alerts System, School of Ocean and Earth Science and Technology (SOEST), Univ. of Hawai'i, 2525 Correa Road, Honolulu, HI 96822, USA (URL: http://modis.higp.hawaii.edu/); MIROVA (Middle InfraRed Observation of Volcanic Activity), a collaborative project between the Universities of Turin and Florence (Italy) supported by the Centre for Volcanic Risk of the Italian Civil Protection Department (URL: http://www.mirovaweb.it/); NASA Global Sulfur Dioxide Monitoring Page, Atmospheric Chemistry and Dynamics Laboratory, NASA Goddard Space Flight Center (NASA/GSFC), 8800 Greenbelt Road, Goddard, Maryland, USA (URL: https://so2.gsfc.nasa.gov/); Copernicus Browser, Copernicus Data Space Ecosystem, European Space Agency (URL: https://dataspace.copernicus.eu/browser/); Charles Balagizi, Goma Volcano Observatory, Departement de Geophysique, Centre de Recherche en Sciences Naturelles, Lwiro, D.S. Bukavu, DR Congo.
Bagana (Papua New Guinea) — October 2023 Cite this Report
Bagana
Papua New Guinea
6.137°S, 155.196°E; summit elev. 1855 m
All times are local (unless otherwise noted)
Explosions, ash plumes, ashfall, and lava flows during April-September 2023
The remote volcano of Bagana is located in central Bougainville Island, Papua New Guinea. Recorded eruptions date back to 1842 and activity has consisted of effusive activity that has built a small lava dome in the summit crater and occasional explosions that produced pyroclastic flows. The most recent eruption has been ongoing since February 2000 and has produced occasional explosions, ash plumes, and lava flows. More recently, activity has been characterized by ongoing effusive activity and ash emissions (BGVN 48:04). This report updates activity from April through September 2023 that has consisted of explosions, ash plumes, ashfall, and lava flows, using information from the Darwin Volcanic Ash Advisory Center (VAAC) and satellite data.
An explosive eruption was reported on 7 July that generated a large gas-and-ash plume to high altitudes and caused significant ashfall in local communities; the eruption plume had reached upper tropospheric (16-18 km altitude) altitudes by 2200, according to satellite images. Sulfur dioxide plumes were detected in satellite images on 8 July and indicated that the plume was likely a mixture of gas, ice, and ash. A report issued by the Autonomous Bougainville Government (ABG) (Torokina District, Education Section) on 10 July noted that significant ash began falling during 2000-2100 on 7 July and covered most areas in the Vuakovi, Gotana (9 km SW), Koromaketo, Laruma (25 km W) and Atsilima (27 km NW) villages. Pyroclastic flows also occurred, according to ground-based reports; small deposits confined to one drainage were inspected by RVO during an overflight on 17 July and were confirmed to be from the 7 July event. Ashfall continued until 10 July and covered vegetation, which destroyed bushes and gardens and contaminated rivers and streams.
RVO reported another eruption on 14 July. The Darwin VAAC stated that an explosive event started around 0830 on 15 July and produced an ash plume that rose to 16.5 km altitude by 1000 and drifted N, according to satellite images. The plume continued to drift N and remained visible through 1900, and by 2150 it had dissipated.
Ashfall likely from both the 7 and 15 July events impacted about 8,111 people in Torokina (20 km SW), including Tsito/Vuakovi, Gotana, Koromaketo, Kenaia, Longkogari, Kenbaki, Piva (13 km SW), and Atsinima, and in the Tsitovi district, according to ABG. Significant ashfall was also reported in Ruruvu (22 km N) in the Wakunai District of Central Bougainville, though the thickness of these deposits could not be confirmed. An evacuation was called for the villages in Wakunai, where heavy ashfall had contaminated water sources; the communities of Ruruvu, Togarau, Kakarapaia, Karauturi, Atao, and Kuritaturi were asked to evacuate to a disaster center at the Wakunai District Station, and communities in Torokina were asked to evacuate to the Piva District station. According to a news article, more than 7,000 people needed temporary accommodations, with about 1,000 people in evacuation shelters. Ashfall had deposited over a broad area, contaminating water supplies, affecting crops, and collapsing some roofs and houses in rural areas. Schools were temporarily shut down. Intermittent ash emissions continued through the end of July and drifted NNW, NW, and SW. Fine ashfall was reported on the coast of Torokina, and ash plumes also drifted toward Laruma and Atsilima.
A small explosive eruption occurred at 2130 on 28 July that ejected material from the crater vents, according to reports from Torokina, in addition to a lava flow that contained two lobes. A second explosion was detected at 2157. Incandescence from the lava flow was visible from Piva as it descended the W flank around 2000 on 29 July (figure 47). The Darwin VAAC reported that a strong thermal anomaly was visible in satellite images during 30-31 July and that ash emissions rose to 2.4 km altitude and drifted WSW on 30 July. A ground report from RVO described localized emissions at 0900 on 31 July.
The Darwin VAAC reported that ash plumes were identified in satellite imagery at 0800 and 1220 on 12 August and rose to 2.1 km and 3 km altitude and drifted NW and W, respectively. A news report stated that aid was sent to more than 6,300 people that were adversely affected by the eruption. Photos taken during 17-19 August showed ash emissions rising no higher than 1 km above the summit and drifting SE. A small explosion generated an ash plume during the morning of 19 August. Deposits from small pyroclastic flows were also captured in the photos. Satellite images captured lava flows and pyroclastic flow deposits. Two temporary seismic stations were installed near Bagana on 17 August at distances of 7 km WSW (Vakovi station) and 11 km SW (Kepox station). The Kepox station immediately started to record continuous, low-frequency background seismicity.
Satellite data. Little to no thermal activity was detected during April through mid-July 2023; only one anomaly was recorded during early April and one during early June, according to MIROVA (Middle InfraRed Observation of Volcanic Activity) data (figure 48). Thermal activity increased in both power and frequency during mid-July through September, although there were still some short gaps in detected activity. MODVOLC also detected increased thermal activity during August; thermal hotspots were detected a total of five times on 19, 20, and 27 August. Weak thermal anomalies were also captured in infrared satellite images on clear weather days throughout the reporting period on 7, 12, and 17 April, 27 May, 1, 6, 16, and 31 July, and 19 September (figure 48); a strong thermal anomaly was visible on 31 July. Distinct sulfur dioxide plumes that drifted generally NW were intermittently captured by the TROPOMI instrument on the Sentinel-5P satellite and sometimes exceeded two Dobson Units (DUs) (figure 49).
Geologic Background. Bagana volcano, in a remote portion of central Bougainville Island, is frequently active. This massive symmetrical cone was largely constructed by an accumulation of viscous andesitic lava flows. The entire edifice could have been constructed in about 300 years at its present rate of lava production. Eruptive activity is characterized by non-explosive effusion of viscous lava that maintains a small lava dome in the summit crater, although occasional explosive activity produces pyroclastic flows. Lava flows with tongue-shaped lobes up to 50 m thick and prominent levees descend the flanks on all sides.
Information Contacts: Rabaul Volcano Observatory (RVO), Geohazards Management Division, Department of Mineral Policy and Geohazards Management (DMPGM), PO Box 3386, Kokopo, East New Britain Province, Papua New Guinea; Darwin Volcanic Ash Advisory Centre (VAAC), Bureau of Meteorology, Northern Territory Regional Office, PO Box 40050, Casuarina, NT 0811, Australia (URL: http://www.bom.gov.au/info/vaac/); MIROVA (Middle InfraRed Observation of Volcanic Activity), a collaborative project between the Universities of Turin and Florence (Italy) supported by the Centre for Volcanic Risk of the Italian Civil Protection Department (URL: http://www.mirovaweb.it/); Hawai'i Institute of Geophysics and Planetology (HIGP) - MODVOLC Thermal Alerts System, School of Ocean and Earth Science and Technology (SOEST), Univ. of Hawai'i, 2525 Correa Road, Honolulu, HI 96822, USA (URL: http://modis.higp.hawaii.edu/); NASA Global Sulfur Dioxide Monitoring Page, Atmospheric Chemistry and Dynamics Laboratory, NASA Goddard Space Flight Center (NASA/GSFC), 8800 Greenbelt Road, Goddard, Maryland, USA (URL: https://so2.gsfc.nasa.gov/); Copernicus Browser, Copernicus Data Space Ecosystem, European Space Agency (URL: https://dataspace.copernicus.eu/browser/); Autonomous Bougainville Government, P.O Box 322, Buka, AROB, PNG (URL: https://abg.gov.pg/); Andrew Tupper (Twitter: @andrewcraigtupp); Simon Carn, Geological and Mining Engineering and Sciences, Michigan Technological University, 1400 Townsend Drive, Houghton, MI 49931, USA (URL: http://www.volcarno.com/, Twitter: @simoncarn); Radio NZ (URL: https://www.rnz.co.nz/news/pacific/494464/more-than-7-000-people-in-bougainville-need-temporary-accommodation-after-eruption); USAID, 1300 Pennsylvania Ave, NW, Washington DC 20004, USA (URL: https://www.usaid.gov/pacific-islands/press-releases/aug-08-2023-united-states-provides-immediate-emergency-assistance-support-communities-affected-mount-bagana-volcanic-eruptions).
Mayon (Philippines) — October 2023 Cite this Report
Mayon
Philippines
13.257°N, 123.685°E; summit elev. 2462 m
All times are local (unless otherwise noted)
Lava flows, pyroclastic flows, ash emissions, and seismicity during April-September 2023
Mayon is located in the Philippines and has steep upper slopes capped by a small summit crater. Historical eruptions date back to 1616 CE that have been characterized by Strombolian eruptions, lava flows, pyroclastic flows, and mudflows. Eruptions mostly originated from a central conduit. Pyroclastic flows and mudflows have commonly descended many of the approximately 40 drainages that surround the volcano. The most recent eruption occurred during June through October 2022 and consisted of lava dome growth and gas-and-steam emissions (BGVN 47:12). A new eruption was reported during late April 2023 and has included lava flows, pyroclastic density currents, ash emissions, and seismicity. This report covers activity during April through September 2023 based on daily bulletins from the Philippine Institute of Volcanology and Seismology (PHIVOLCS).
During April through September 2023, PHIVOLCS reported near-daily rockfall events, frequent volcanic earthquakes, and sulfur dioxide measurements. Gas-and-steam emissions rose 100-900 m above the crater and drifted in different directions. Nighttime crater incandescence was often visible during clear weather and was accompanied by incandescent avalanches of material. Activity notably increased during June when lava flows were reported on the S, SE, and E flanks (figure 52). The MIROVA graph (Middle InfraRed Observation of Volcanic Activity) showed strong thermal activity coincident with these lava flows, which remained active through September (figure 53). According to the MODVOLC thermal algorithm, a total of 110 thermal alerts were detected during the reporting period: 17 during June, 40 during July, 27 during August, and 26 during September. During early June, pyroclastic density currents (PDCs) started to occur more frequently.
Low activity was reported during much of April and May; gas-and-steam emissions rose 100-900 m above the crater and generally drifted in different directions. A total of 52 rockfall events and 18 volcanic earthquakes were detected during April and 147 rockfall events and 13 volcanic events during May. Sulfur dioxide flux measurements ranged between 400-576 tons per day (t/d) during April, the latter of which was measured on 29 April and between 162-343 t/d during May, the latter of which was measured on 13 May.
Activity during June increased, characterized by lava flows, pyroclastic density currents (PDCs), crater incandescence and incandescent rockfall events, gas-and-steam emissions, and continued seismicity. Weather clouds often prevented clear views of the summit, but during clear days, moderate gas-and-steam emissions rose 100-2,500 m above the crater and drifted in multiple directions. A total of 6,237 rockfall events and 288 volcanic earthquakes were detected. The rockfall events often deposited material on the S and SE flanks within 700-1,500 m of the summit crater and ash from the events drifted SW, S, SE, NE, and E. Sulfur dioxide emissions ranged between 149-1,205 t/d, the latter of which was measured on 10 June. Short-term observations from EDM and electronic tiltmeter monitoring indicated that the upper slopes were inflating since February 2023. Longer-term ground deformation parameters based on EDM, precise leveling, continuous GPS, and electronic tilt monitoring indicated that the volcano remained inflated, especially on the NW and SE flanks. At 1000 on 5 June the Volcano Alert Level (VAL) was raised to 2 (on a 0-5 scale). PHIVOLCS noted that although low-level volcanic earthquakes, ground deformation, and volcanic gas emissions indicated unrest, the steep increase in rockfall frequency may indicate increased dome activity.
A total of 151 dome-collapse PDCs occurred during 8-9 and 11-30 June, traveled 500-2,000 m, and deposited material on the S flank within 2 km of the summit crater. During 8-9 June the VAL was raised to 3. At approximately 1947 on 11 June lava flow activity was reported; two lobes traveled within 500 m from the crater and deposited material on the S (Mi-isi), SE (Bonga), and E (Basud) flanks. Weak seismicity accompanied the lava flow and slight inflation on the upper flanks. This lava flow remained active through 30 June, moving down the S and SE flank as far as 2.5 km and 1.8 km, respectively and depositing material up to 3.3 km from the crater. During 15-16 June traces of ashfall from the PDCs were reported in Sitio Buga, Nabonton, City of Ligao and Purok, and San Francisco, Municipality of Guinobatan. During 28-29 June there were two PDCs generated by the collapse of the lava flow front, which generated a light-brown ash plume 1 km high. Satellite monitors detected significant concentrations of sulfur dioxide beginning on 29 June. On 30 June PDCs primarily affected the Basud Gully on the E flank, the largest of which occurred at 1301 and lasted eight minutes, based on the seismic record. Four PDCs generated between 1800 and 2000 that lasted approximately four minutes each traveled 3-4 km on the E flank and generated an ash plume that rose 1 km above the crater and drifted N and NW. Ashfall was recorded in Tabaco City.
Similar strong activity continued during July; slow lava effusion remained active on the S and SE flanks and traveled as far as 2.8 km and 2.8 km, respectively and material was deposited as far as 4 km from the crater. There was a total of 6,983 rockfall events and 189 PDCs that affected the S, SE, and E flanks. The volcano network detected a total of 2,124 volcanic earthquakes. Continuous gas-and-steam emissions rose 200-2,000 m above the crater and drifted in multiple directions. Sulfur dioxide emissions averaged 792-4,113 t/d, the latter of which was measured on 28 July. During 2-4 July three PDCs were generated from the collapse of the lava flow and resulting light brown plumes rose 200-300 m above the crater. Continuous tremor pulses were reported beginning at 1547 on 3 July through 7 July at 1200, at 2300 on 8 July and going through 0300 on 10 July, and at 2300 on 16 July, as recorded by the seismic network. During 6-9 July there were 10 lava flow-collapse-related PDCs that generated light brown plumes 300-500 m above the crater. During 10-11 July light ashfall was reported in some areas of Mabinit, Legazpi City, Budiao and Salvacion, Daraga, and Camalig, Albay. By 18 July the lava flow advanced 600 m on the E flank as well.
During 1733 on 18 July and 0434 on 19 July PHIVOLCS reported 30 “ashing” events, which are degassing events accompanied by audible thunder-like sounds and entrained ash at the crater, which produced short, dark plumes that drifted SW. These events each lasted 20-40 seconds, and plume heights ranged from 150-300 m above the crater, as recorded by seismic, infrasound, visual, and thermal monitors. Three more ashing events occurred during 19-20 July. Short-term observations from electronic tilt and GPS monitoring indicate deflation on the E lower flanks in early July and inflation on the NW middle flanks during the third week of July. Longer-term ground deformation parameters from EDM, precise leveling, continuous GPS, and electronic tilt monitoring indicated that the volcano was still generally inflated relative to baseline levels. A short-lived lava pulse lasted 28 seconds at 1956 on 21 July, which was accompanied by seismic and infrasound signals. By 22 July, the only lava flow that remained active was on the SE flank, and continued to extend 3.4 km, while those on the S and E flanks weakened markedly. One ashing event was detected during 30-31 July, whereas there were 57 detected during 31 July-1 August; according to PHIVOLCS beginning at approximately 1800 on 31 July eruptive activity was dominated by phases of intermittent ashing, as well as increased in the apparent rates of lava effusion from the summit crater. The ashing phases consisted of discrete events recorded as low-frequency volcanic earthquakes (LFVQ) typically 30 seconds in duration, based on seismic and infrasound signals. Gray ash plume rose 100 m above the crater and generally drifted NE. Shortly after these ashing events began, new lava began to effuse rapidly from the crater, feeding the established flowed on the SE, E, and E flanks and generating frequent rockfall events.
Intensified unrest persisted during August. There was a total of 4,141 rockfall events, 2,881 volcanic earthquakes, which included volcanic tremor events, 32 ashing events, and 101 PDCs detected throughout the month. On clear weather days, gas-and-steam emissions rose 300-1,500 m above the crater and drifted in different directions (figure 54). Sulfur dioxide emissions averaged 735-4,756 t/d, the higher value of which was measured on 16 August. During 1-2 August the rate of lava effusion decreased, but continued to feed the flows on the SE, S, and E flanks, maintaining their advances to 3.4 km, 2.8 km, and 1.1 km from the crater, respectively (figure 55). Rockfall and PDCs generated by collapses at the lava flow margins and from the summit dome deposited material within 4 km of the crater. During 3-4 August there were 10 tremor events detected that lasted 1-4 minutes. Short-lived lava pulse lasted 35 seconds and was accompanied by seismic and infrasound signals at 0442 on 6 August. Seven collapses were recorded at the front of the lava flow during 12-14 August.
During September, similar activity of slow lava effusion, PDCs, gas-and-steam emissions, and seismicity continued. There was a total of 4,452 rockfall events, 329 volcanic earthquakes, which included volcanic tremor events, two ashing events, and 85 PDCs recorded throughout the month. On clear weather days, gas-and-steam emissions rose 100-1,500 m above the crater and drifted in multiple directions. Sulfur dioxide emissions averaged 609-2,252 t/d, the higher average of which was measured on 6 September. Slow lava effusion continued advancing on the SE, S, and E flanks, maintaining lengths of 3.4 km, 2.8 km, and 1.1 km, respectively. Rockfall and PDC events generated by collapses along the lava flow margins and at the summit dome deposited material within 4 km of the crater.
Geologic Background. Symmetrical Mayon, which rises above the Albay Gulf NW of Legazpi City, is the most active volcano of the Philippines. The steep upper slopes are capped by a small summit crater. Recorded eruptions since 1616 CE range from Strombolian to basaltic Plinian, with cyclical activity beginning with basaltic eruptions, followed by longer periods of andesitic lava flows. Eruptions occur predominately from the central conduit and have also produced lava flows that travel far down the flanks. Pyroclastic density currents and mudflows have commonly swept down many of the approximately 40 ravines that radiate from the summit and have often damaged populated lowland areas. A violent eruption in 1814 killed more than 1,200 people and devastated several towns.
Information Contacts: Philippine Institute of Volcanology and Seismology (PHIVOLCS), Department of Science and Technology, University of the Philippines Campus, Diliman, Quezon City, Philippines (URL: http://www.phivolcs.dost.gov.ph/); MIROVA (Middle InfraRed Observation of Volcanic Activity), a collaborative project between the Universities of Turin and Florence (Italy) supported by the Centre for Volcanic Risk of the Italian Civil Protection Department (URL: http://www.mirovaweb.it/); Hawai'i Institute of Geophysics and Planetology (HIGP) - MODVOLC Thermal Alerts System, School of Ocean and Earth Science and Technology (SOEST), Univ. of Hawai'i, 2525 Correa Road, Honolulu, HI 96822, USA (URL: http://modis.higp.hawaii.edu/); Copernicus Browser, Copernicus Data Space Ecosystem, European Space Agency (URL: https://dataspace.copernicus.eu/browser/); William Rogers, Legazpi City, Albay Province, Philippines.
Nishinoshima (Japan) — October 2023 Cite this Report
Nishinoshima
Japan
27.247°N, 140.874°E; summit elev. 100 m
All times are local (unless otherwise noted)
Eruption plumes and gas-and-steam plumes during May-August 2023
Nishinoshima, located about 1,000 km S of Tokyo, is a small island in the Ogasawara Arc in Japan. The island is the summit of a massive submarine volcano that has prominent submarine peaks to the S, W, and NE. Eruptions date back to 1973 and the current eruption period began in October 2022. Recent activity has consisted of small ash plumes and fumarolic activity (BGVN 48:07). This report covers activity during May through August 2023, using information from monthly reports of the Japan Meteorological Agency (JMA) monthly reports and satellite data.
Activity during May through June was relatively low. The Japan Coast Guard (JCG) did overflights on 14 and 22 June and reported white gas-and-steam emissions rising 600 m and 1,200 m from the central crater of the pyroclastic cone, respectively (figure 125). In addition, multiple white gas-and-steam emissions rose from the inner rim of the W side of the crater and from the SE flank of the pyroclastic cone. Discolored brown-to-green water was observed around almost the entire perimeter of the island; on 22 June light green discolored water was observed off the S coast of the island.
Observations from the Himawari meteorological satellite confirmed an eruption on 9 and 10 July. An eruption plume rose 1.6 km above the crater and drifted N around 1300 on 9 July. Satellite images acquired at 1420 and 2020 on 9 July and at 0220 on 10 July showed continuing emissions that rose 1.3-1.6 km above the crater and drifted NE and N. The Tokyo VAAC reported that an ash plume seen by a pilot and identified in a satellite image at 0630 on 21 July rose to 3 km altitude and drifted S.
Aerial observations conducted by JCG on 8 August showed a white-and-gray plume rising from the central crater of the pyroclastic cone, and multiple white gas-and-steam emissions were rising from the inner edge of the western crater and along the NW-SE flanks of the island (figure 126). Brown-to-green discolored water was also noted around the perimeter of the island.
Intermittent low-to-moderate power thermal anomalies were recorded in the MIROVA graph (Middle InfraRed Observation of Volcanic Activity), showing an increase in both frequency and power beginning in July (figure 127). This increase in activity coincides with eruptive activity on 9 and 10 July, characterized by eruption plumes. According to the MODVOLC thermal alert algorithm, one thermal hotspot was recorded on 20 July. Weak thermal anomalies were also detected in infrared satellite imagery, accompanied by strong gas-and-steam plumes (figure 128).
Geologic Background. The small island of Nishinoshima was enlarged when several new islands coalesced during an eruption in 1973-74. Multiple eruptions that began in 2013 completely covered the previous exposed surface and continued to enlarge the island. The island is the summit of a massive submarine volcano that has prominent peaks to the S, W, and NE. The summit of the southern cone rises to within 214 m of the ocean surface 9 km SSE.
Information Contacts: Japan Meteorological Agency (JMA), 1-3-4 Otemachi, Chiyoda-ku, Tokyo 100-8122, Japan (URL: http://www.jma.go.jp/jma/indexe.html); Tokyo Volcanic Ash Advisory Center (VAAC), 1-3-4 Otemachi, Chiyoda-ku, Tokyo 100-8122, Japan (URL: http://ds.data.jma.go.jp/svd/vaac/data/); MIROVA (Middle InfraRed Observation of Volcanic Activity), a collaborative project between the Universities of Turin and Florence (Italy) supported by the Centre for Volcanic Risk of the Italian Civil Protection Department (URL: http://www.mirovaweb.it/); Copernicus Browser, Copernicus Data Space Ecosystem, European Space Agency (URL: https://dataspace.copernicus.eu/browser/).
Krakatau (Indonesia) — October 2023 Cite this Report
Krakatau
Indonesia
6.1009°S, 105.4233°E; summit elev. 285 m
All times are local (unless otherwise noted)
White gas-and-steam plumes and occasional ash plumes during May-August 2023
Krakatau is located in the Sunda Strait between Java and Sumatra, Indonesia. Caldera collapse during the catastrophic 1883 eruption destroyed Danan and Perbuwatan cones and left only a remnant of Rakata. The post-collapse cone of Anak Krakatau (Child of Krakatau) was constructed within the 1883 caldera at a point between the former Danan and Perbuwatan cones; it has been the site of frequent eruptions since 1927. The current eruption period began in May 2021 and has recently consisted of Strombolian eruptions and ash plumes (BGVN 48:07). This report describes lower levels of activity consisting of ash and white gas-and-steam plumes during May through August 2023, based on information provided by the Indonesian Center for Volcanology and Geological Hazard Mitigation, referred to as Pusat Vulkanologi dan Mitigasi Bencana Geologi (PVMBG), MAGMA Indonesia, and satellite data.
Activity was relatively low during May and June. Daily white gas-and-steam emissions rose 25-200 m above the crater and drifted in different directions. Five ash plumes were detected at 0519 on 10 May, 1241 on 11 May, 0920 on 12 May, 2320 on 12 May, and at 0710 on 13 May, and rose 1-2.5 km above the crater and drifted SW. A webcam image taken on 12 May showed ejection of incandescent material above the vent. A total of nine ash plumes were detected during 6-11 June: at 1434 and 00220 on 6 and 7 June the ash plumes rose 500 m above the crater and drifted NW, at 1537 on 8 June the ash plume rose 1 km above the crater and drifted SW, at 0746 and at 0846 on 9 June the ash plumes rose 800 m and 3 km above the crater and drifted SW, respectively, at 0423, 1431, and 1750 on 10 June the ash plumes rose 2 km, 1.5 km, and 3.5 km above the crater and drifted NW, respectively, and at 0030 on 11 June an ash plume rose 2 km above the crater and drifted NW. Webcam images taken on 10 and 11 June at 0455 and 0102, respectively, showed incandescent material ejected above the vent. On 19 June an ash plume at 0822 rose 1.5 km above the crater and drifted SE.
Similar low activity of white gas-and-steam emissions and few ash plumes were reported during July and August. Daily white gas-and-steam emissions rose 25-300 m above the crater and drifted in multiple directions. Three ash plumes were reported at 0843, 0851, and 0852 on 20 July that rose 500-2,000 m above the crater and drifted NW.
The MIROVA (Middle InfraRed Observation of Volcanic Activity) graph of MODIS thermal anomaly data showed intermittent low-to-moderate power thermal anomalies during May through August 2023 (figure 140). Although activity was often obscured by weather clouds, a thermal anomaly was visible in an infrared satellite image of the crater on 12 May, accompanied by an eruption plume that drifted SW (figure 141).
Geologic Background. The renowned Krakatau (frequently mis-named as Krakatoa) volcano lies in the Sunda Strait between Java and Sumatra. Collapse of an older edifice, perhaps in 416 or 535 CE, formed a 7-km-wide caldera. Remnants of that volcano are preserved in Verlaten and Lang Islands; subsequently the Rakata, Danan, and Perbuwatan cones were formed, coalescing to create the pre-1883 Krakatau Island. Caldera collapse during the catastrophic 1883 eruption destroyed Danan and Perbuwatan, and left only a remnant of Rakata. This eruption caused more than 36,000 fatalities, most as a result of tsunamis that swept the adjacent coastlines of Sumatra and Java. Pyroclastic surges traveled 40 km across the Sunda Strait and reached the Sumatra coast. After a quiescence of less than a half century, the post-collapse cone of Anak Krakatau (Child of Krakatau) was constructed within the 1883 caldera at a point between the former Danan and Perbuwatan cones. Anak Krakatau has been the site of frequent eruptions since 1927.
Information Contacts: Pusat Vulkanologi dan Mitigasi Bencana Geologi (PVMBG, also known as Indonesian Center for Volcanology and Geological Hazard Mitigation, CVGHM), Jalan Diponegoro 57, Bandung 40122, Indonesia (URL: http://www.vsi.esdm.go.id/); MAGMA Indonesia, Kementerian Energi dan Sumber Daya Mineral (URL: https://magma.esdm.go.id/v1); MIROVA (Middle InfraRed Observation of Volcanic Activity), a collaborative project between the Universities of Turin and Florence (Italy) supported by the Centre for Volcanic Risk of the Italian Civil Protection Department (URL: http://www.mirovaweb.it/); Copernicus Browser, Copernicus Data Space Ecosystem, European Space Agency (URL: https://dataspace.copernicus.eu/browser/).
Villarrica (Chile) — October 2023 Cite this Report
Villarrica
Chile
39.42°S, 71.93°W; summit elev. 2847 m
All times are local (unless otherwise noted)
Strombolian activity, gas-and-ash emissions, and crater incandescence during April-September 2023
Villarrica, in central Chile, consists of a 2-km-wide caldera that formed about 3,500 years ago and is located at the base of the presently active cone at the NW margin of a 6-km-wide caldera. Historical eruptions eruptions date back to 1558 and have been characterized by mild-to-moderate explosive activity with occasional lava effusions. The current eruption period began in December 2014 and has recently consisted of nighttime crater incandescence, ash emissions, and seismicity (BGVN 48:04). This report covers activity during April through September 2023 and describes occasional Strombolian activity, gas-and-ash emissions, and nighttime crater incandescence. Information for this report primarily comes from the Southern Andes Volcano Observatory (Observatorio Volcanológico de Los Andes del Sur, OVDAS), part of Chile's National Service of Geology and Mining (Servicio Nacional de Geología y Minería, SERNAGEOMIN) and satellite data.
Seismicity during April consisted of long period (LP) events and tremor (TRE); a total of 9,413 LP-type events and 759 TR-type events were detected throughout the month. Nighttime crater incandescence persisted and was visible in the degassing column. Sulfur dioxide data was obtained using Differential Absorption Optical Spectroscopy Equipment (DOAS) that showed an average value of 1,450 ± 198 tons per day (t/d) during 1-15 April and 1,129 ± 201 t/d during 16-30 April, with a maximum daily value of 2,784 t/d on 9 April. Gas-and-steam emissions of variable intensities rose above the active crater as high as 1.3 km above the crater on 13 April. Strombolian explosions were not observed and there was a slight decrease in the lava lake level.
There were 14,123 LP-type events and 727 TR-type events detected during May. According to sulfur dioxide measurements taken with DOAS equipment, the active crater emitted an average value of 1,826 ± 482 t/d during 1-15 May and 912 ± 41 t/d during 16-30 May, with a daily maximum value of 5,155 t/d on 13 May. Surveillance cameras showed continuous white gas-and-steam emissions that rose as high as 430 m above the crater on 27 May. Nighttime incandescence illuminated the gas column less than 300 m above the crater rim was and no pyroclastic emissions were reported. A landslide was identified on 13 May on the E flank of the volcano 50 m from the crater rim and extending 300 m away; SERNAGEOMIN noted that this event may have occurred on 12 May. During the morning of 27 and 28 May minor Strombolian explosions characterized by incandescent ejecta were recorded at the crater rim; the last reported Strombolian explosions had occurred at the end of March.
Seismic activity during June consisted of five volcano-tectonic (VT)-type events, 21,606 LP-type events, and 2,085 TR-type events. The average value of sulfur dioxide flux obtained by DOAS equipment was 1,420 ± 217 t/d during 1-15 June and 2,562 ± 804 t/d, with a maximum daily value of 4,810 t/d on 17 June. White gas-and-steam emissions rose less than 480 m above the crater; frequent nighttime crater incandescence was reflected in the degassing plume. On 12 June an emission rose 100 m above the crater and drifted NNW. On 15 June one or several emissions resulted in ashfall to the NE as far as 5.5 km from the crater, based on a Skysat satellite image. Several Strombolian explosions occurred within the crater; activity on 15 June was higher energy and ejected blocks 200-300 m on the NE slope. Surveillance cameras showed white gas-and-steam emissions rising 480 m above the crater on 16 June. On 19 and 24 June low-intensity Strombolian activity was observed, ejecting material as far as 200 m from the center of the crater to the E.
During July, seismicity included 29,319 LP-type events, 3,736 TR-type events, and two VT-type events. DOAS equipment recorded two days of sulfur dioxide emissions of 4,220 t/d and 1,009 t/d on 1 and 13 July, respectively. Constant nighttime incandescence was also recorded and was particularly noticeable when accompanied by eruptive columns on 12 and 16 July. Minor explosive events were detected in the crater. According to Skysat satellite images taken on 12, 13, and 16 July, ashfall deposits were identified 155 m S of the crater. According to POVI, incandescence was visible from two vents on the crater floor around 0336 on 12 July. Gas-and-ash emissions rose as high as 1.2 km above the crater on 13 July and drifted E and NW. A series of gas-and-steam pulses containing some ash deposited material on the upper E flank around 1551 on 13 July. During 16-31 July, average sulfur dioxide emissions of 1,679 ± 406 t/d were recorded, with a maximum daily value of 2,343 t/d on 28 July. Fine ash emissions were also reported on 16, 17, and 23 July.
Seismicity persisted during August, characterized by 27,011 LP-type events, 3,323 TR-type events, and three VT-type events. The average value of sulfur dioxide measurements taken during 1-15 August was 1,642 ± 270 t/d and 2,207 ± 4,549 t/d during 16-31 August, with a maximum daily value of 3,294 t/d on 27 August. Nighttime crater incandescence remained visible in degassing columns. White gas-and-steam emissions rose 480 m above the crater on 6 August. According to a Skysat satellite image from 6 August, ash accumulation was observed proximal to the crater and was mainly distributed toward the E slope. White gas-and-steam emissions rose 320 m above the crater on 26 August. Nighttime incandescence and Strombolian activity that generated ash emissions were reported on 27 August.
Seismicity during September was characterized by five VT-type events, 12,057 LP-type events, and 2,058 TR-type events. Nighttime incandescence persisted. On 2 September an ash emission rose 180 m above the crater and drifted SE at 1643 (figure 125) and a white gas-and-steam plume rose 320 m above the crater. According to the Buenos Aires VAAC, periods of continuous gas-and-ash emissions were visible in webcam images from 1830 on 2 September to 0110 on 3 September. Strombolian activity was observed on 2 September and during the early morning of 3 September, the latter event of which generated an ash emission that rose 60 m above the crater and drifted 100 m from the center of the crater to the NE and SW. Ashfall was reported to the SE and S as far as 750 m from the crater. The lava lake was active during 3-4 September and lava fountaining was visible for the first time since 26 March 2023, according to POVI. Fountains captured in webcam images at 2133 on 3 September and at 0054 on 4 September rose as high as 60 m above the crater rim and ejected material onto the upper W flank. Sulfur dioxide flux of 1,730 t/d and 1,281 t/d was measured on 3 and 4 September, respectively, according to data obtained by DOAS equipment.
Strong Strombolian activity and larger gas-and-ash plumes were reported during 18-20 September. On 18 September activity was also associated with energetic LP-type events and notable sulfur dioxide fluxes (as high as 4,277 t/d). On 19 September Strombolian activity and incandescence were observed. On 20 September at 0914 ash emissions rose 50 m above the crater and drifted SSE, accompanied by Strombolian activity that ejected material less than 100 m SSE, causing fall deposits on that respective flank. SERNAGEOMIN reported that a Planet Scope satellite image taken on 20 September showed the lava lake in the crater, measuring 32 m x 35 m and an area of 0.001 km2. Several ash emissions were recorded at 0841, 0910, 1251, 1306, 1312, 1315, and 1324 on 23 September and rose less than 150 m above the crater. The sulfur dioxide flux value was 698 t/d on 23 September and 1,097 t/d on 24 September. On 24 September the Volcanic Alert Level (VAL) was raised to Orange (the third level on a four-color scale). SENAPRED maintained the Alert Level at Yellow (the middle level on a three-color scale) for the communities of Villarrica, Pucón (16 km N), Curarrehue, and Panguipulli.
During 24-25 September there was an increase in seismic energy (observed at TR-events) and acoustic signals, characterized by 1 VT-type event, 213 LP-type events, and 124 TR-type events. Mainly white gas-and-steam emissions, in addition to occasional fine ash emissions were recorded. During the early morning of 25 September Strombolian explosions were reported and ejected material 250 m in all directions, though dominantly toward the NW. On 25 September the average value of sulfur dioxide flux was 760 t/d. Seismicity during 25-30 September consisted of five VT-type events, 1,937 LP-type events, and 456 TR-type events.
During 25-29 September moderate Strombolian activity was observed and ejected material as far as the crater rim. In addition, ash pulses lasting roughly 50 minutes were observed around 0700 and dispersed ENE. During 26-27 September a TR episode lasted 6.5 hours and was accompanied by discrete acoustic signals. Satellite images from 26 September showed a spatter cone on the crater floor with one vent that measured 10 x 14 m and a smaller vent about 35 m NE of the cone. SERNAGEOMIN reported an abundant number of bomb-sized blocks up to 150 m from the crater, as well as impact marks on the snow, which indicated explosive activity. A low-altitude ash emission was observed drifting NW around 1140 on 28 September, based on webcam images. Between 0620 and 0850 on 29 September an ash emission rose 60 m above the crater and drifted NW. During an overflight taken around 1000 on 29 September scientists observed molten material in the vent, a large accumulation of pyroclasts inside the crater, and energetic degassing, some of which contained a small amount of ash. Block-sized pyroclasts were deposited on the internal walls and near the crater, and a distal ash deposit was also visible. The average sulfur dioxide flux measured on 28 September was 344 t/d. Satellite images taken on 29 September ashfall was deposited roughly 3 km WNW from the crater and nighttime crater incandescence remained visible. The average sulfur dioxide flux value from 29 September was 199 t/d. On 30 September at 0740 a pulsating ash emission rose 1.1 km above the crater and drifted NNW (figure 126). Deposits on the S flank extended as far as 4.5 km from the crater rim, based on satellite images from 30 September.
Infrared MODIS satellite data processed by MIROVA (Middle InfraRed Observation of Volcanic Activity) showed intermittent thermal activity during April through September, with slightly stronger activity detected during late September (figure 127). Small clusters of thermal activity were detected during mid-June, early July, early August, and late September. According to the MODVOLC thermal alert system, a total of four thermal hotspots were detected on 7 July and 3 and 23 September. This activity was also intermittently captured in infrared satellite imagery on clear weather days (figure 128).
Geologic Background. The glacier-covered Villarrica stratovolcano, in the northern Lakes District of central Chile, is ~15 km south of the city of Pucon. A 2-km-wide caldera that formed about 3,500 years ago is located at the base of the presently active, dominantly basaltic to basaltic andesite cone at the NW margin of a 6-km-wide Pleistocene caldera. More than 30 scoria cones and fissure vents are present on the flanks. Plinian eruptions and pyroclastic flows that have extended up to 20 km from the volcano were produced during the Holocene. Lava flows up to 18 km long have issued from summit and flank vents. Eruptions documented since 1558 CE have consisted largely of mild-to-moderate explosive activity with occasional lava effusion. Glaciers cover 40 km2 of the volcano, and lahars have damaged towns on its flanks.
Information Contacts: Servicio Nacional de Geología y Minería (SERNAGEOMIN), Observatorio Volcanológico de Los Andes del Sur (OVDAS), Avda Sta María No. 0104, Santiago, Chile (URL: http://www.sernageomin.cl/); Proyecto Observación Villarrica Internet (POVI) (URL: http://www.povi.cl/); Sistema y Servicio Nacional de Prevención y Repuesta Ante Desastres (SENAPRED), Av. Beauchef 1671, Santiago, Chile (URL: https://web.senapred.cl/); Buenos Aires Volcanic Ash Advisory Center (VAAC), Servicio Meteorológico Nacional-Fuerza Aérea Argentina, 25 de mayo 658, Buenos Aires, Argentina (URL: http://www.smn.gov.ar/vaac/buenosaires/inicio.php); MIROVA (Middle InfraRed Observation of Volcanic Activity), a collaborative project between the Universities of Turin and Florence (Italy) supported by the Centre for Volcanic Risk of the Italian Civil Protection Department (URL: http://www.mirovaweb.it/); Hawai'i Institute of Geophysics and Planetology (HIGP) - MODVOLC Thermal Alerts System, School of Ocean and Earth Science and Technology (SOEST), Univ. of Hawai'i, 2525 Correa Road, Honolulu, HI 96822, USA (URL: http://modis.higp.hawaii.edu/); Copernicus Browser, Copernicus Data Space Ecosystem, European Space Agency (URL: https://dataspace.copernicus.eu/browser/).
Merapi (Indonesia) — October 2023 Cite this Report
Merapi
Indonesia
7.54°S, 110.446°E; summit elev. 2910 m
All times are local (unless otherwise noted)
Frequent incandescent avalanches during April-September 2023
Merapi, located just north of the major city of Yogyakarta in central Java, Indonesia, has had activity within the last 20 years characterized by pyroclastic flows and lahars accompanying growth and collapse of the steep-sided active summit lava dome. The current eruption period began in late December 2020 and has more recently consisted of ash plumes, intermittent incandescent avalanches of material, and pyroclastic flows (BGVN 48:04). This report covers activity during April through September 2023, based on information from Balai Penyelidikan dan Pengembangan Teknologi Kebencanaan Geologi (BPPTKG), the Center for Research and Development of Geological Disaster Technology, a branch of PVMBG which specifically monitors Merapi. Additional information comes from the Pusat Vulkanologi dan Mitigasi Bencana Geologi (PVMBG, also known as Indonesian Center for Volcanology and Geological Hazard Mitigation, CVGHM), MAGMA Indonesia, the Darwin Volcanic Ash Advisory Centre (VAAC), and various satellite data.
Activity during April through September 2023 primarily consisted of incandescent avalanches of material that mainly affected the SW and W flanks and traveled as far as 2.3 km from the summit (table 25) and white gas-and-steam emissions that rose 10-1,000 m above the crater.
Table 25. Monthly summary of avalanches and avalanche distances recorded at Merapi during April through September 2023. The number of reported avalanches does not include instances where possible avalanches were heard but could not be visually confirmed as a result of inclement weather. Data courtesy of BPPTKG (April-September 2023 daily reports).
| Month |
Average number of avalanches per day |
Distance avalanches traveled (m) |
| Apr 2023 |
19 |
1,200-2,000 |
| May 2023 |
22 |
500-2,000 |
| Jun 2023 |
18 |
1,200-2,000 |
| Jul 2023 |
30 |
300-2,000 |
| Aug 2023 |
25 |
400-2,300 |
| Sep 2023 |
23 |
600-2,000 |
BPPTKG reported that during April and May white gas-and-steam emissions rose 10-750 m above the crater, incandescent avalanches descended 500-2,000 m on the SW and W flanks (figure 135). Cloudy weather often prevented clear views of the summit, and sometimes avalanches could not be confirmed. According to a webcam image, a pyroclastic flow was visible on 17 April at 0531. During the week of 28 April and 4 May a pyroclastic flow was reported on the SW flank, traveling up to 2.5 km. According to a drone overflight taken on 17 May the SW lava dome volume was an estimated 2,372,800 cubic meters and the dome in the main crater was an estimated 2,337,300 cubic meters.
During June and July similar activity persisted with white gas-and-steam emissions rising 10-350 m above the crater and frequent incandescent avalanches that traveled 300-2,000 m down the SW, W, and S flanks (figure 136). Based on an analysis of aerial photos taken on 24 June the volume of the SW lava dome was approximately 2.5 million cubic meters. A pyroclastic flow was observed on 5 July that traveled 2.7 km on the SW flank. According to the Darwin VAAC multiple minor ash plumes were identified in satellite images on 19 July that rose to 3.7 km altitude and drifted S and SW. During 22, 25, and 26 July a total of 17 avalanches descended as far as 1.8 km on the S flank.
Frequent white gas-and-steam emissions continued during August and September, rising 10-450 m above the crater. Incandescent avalanches mainly affected the SW and W flanks and traveled 400-2,300 m from the vent (figure 137). An aerial survey conducted on 10 August was analyzed and reported that estimates of the SW dome volume was 2,764,300 cubic meters and the dome in the main crater was 2,369,800 cubic meters.
Frequent and moderate-power thermal activity continued throughout the reporting period, according to a MIROVA (Middle InfraRed Observation of Volcanic Activity) analysis of MODIS satellite data (figure 138). There was an increase in the number of detected anomalies during mid-May. The MODVOLC thermal algorithm recorded a total of 47 thermal hotspots: six during April, nine during May, eight during June, 15 during July, four during August, and five during September. Some of this activity was captured in infrared satellite imagery on clear weather days, sometimes accompanied by incandescent material on the SW flank (figure 139).
Geologic Background. Merapi, one of Indonesia's most active volcanoes, lies in one of the world's most densely populated areas and dominates the landscape immediately north of the major city of Yogyakarta. It is the youngest and southernmost of a volcanic chain extending NNW to Ungaran volcano. Growth of Old Merapi during the Pleistocene ended with major edifice collapse perhaps about 2,000 years ago, leaving a large arcuate scarp cutting the eroded older Batulawang volcano. Subsequent growth of the steep-sided Young Merapi edifice, its upper part unvegetated due to frequent activity, began SW of the earlier collapse scarp. Pyroclastic flows and lahars accompanying growth and collapse of the steep-sided active summit lava dome have devastated cultivated lands on the western-to-southern flanks and caused many fatalities.
Information Contacts: Balai Penyelidikan dan Pengembangan Teknologi Kebencanaan Geologi (BPPTKG), Center for Research and Development of Geological Disaster Technology (URL: http://merapi.bgl.esdm.go.id/, Twitter: @BPPTKG); MAGMA Indonesia, Kementerian Energi dan Sumber Daya Mineral (URL: https://magma.esdm.go.id/v1); Pusat Vulkanologi dan Mitigasi Bencana Geologi (PVMBG, also known as Indonesian Center for Volcanology and Geological Hazard Mitigation, CVGHM), Jalan Diponegoro 57, Bandung 40122, Indonesia (URL: http://www.vsi.esdm.go.id/); Darwin Volcanic Ash Advisory Centre (VAAC), Bureau of Meteorology, Northern Territory Regional Office, PO Box 40050, Casuarina, NT 0811, Australia (URL: http://www.bom.gov.au/info/vaac/); MIROVA (Middle InfraRed Observation of Volcanic Activity), a collaborative project between the Universities of Turin and Florence (Italy) supported by the Centre for Volcanic Risk of the Italian Civil Protection Department (URL: http://www.mirovaweb.it/); Hawai'i Institute of Geophysics and Planetology (HIGP) - MODVOLC Thermal Alerts System, School of Ocean and Earth Science and Technology (SOEST), Univ. of Hawai'i, 2525 Correa Road, Honolulu, HI 96822, USA (URL: http://modis.higp.hawaii.edu/); Copernicus Browser, Copernicus Data Space Ecosystem, European Space Agency (URL: https://dataspace.copernicus.eu/browser/); Øystein Lund Andersen (URL: https://www.oysteinlundandersen.com/, https://twitter.com/oysteinvolcano).
Ebeko
Russia
50.686°N, 156.014°E; summit elev. 1103 m
All times are local (unless otherwise noted)
Moderate explosive activity with ash plumes continued during June-November 2023
Ebeko, located on the N end of Paramushir Island in Russia’s Kuril Islands just S of the Kamchatka Peninsula, consists of three summit craters along a SSW-NNE line at the northern end of a complex of five volcanic cones. Observed eruptions date back to the late 18th century and have been characterized as small-to-moderate explosions from the summit crater, accompanied by intense fumarolic activity. The current eruptive period began in June 2022, consisting of frequent explosions, ash plumes, and thermal activity (BGVN 47:10, 48:06). This report covers similar activity during June-November 2023, based on information from the Kamchatka Volcanic Eruptions Response Team (KVERT) and satellite data.
Moderate explosive activity continued during June-November 2023 (figures 50 and 51). According to visual data from Severo-Kurilsk, explosions sent ash 2-3.5 km above the summit (3-4.5 km altitude) during most days during June through mid-September. Activity after mid-September was slightly weaker, with ash usually reaching less than 2 km above the summit. According to KVERT the volcano in October and November was, with a few exceptions, either quiet or obscured by clouds that prevented satellite observations. KVERT issued Volcano Observatory Notices for Aviation (VONA) on 8 and 12 June, 13 and 22 July, 3 and 21 August, and 31 October warning of potential aviation hazards from ash plumes drifting 3-15 km from the volcano. Based on satellite data, KVERT reported a persistent thermal anomaly whenever weather clouds permitted viewing.
Geologic Background. The flat-topped summit of the central cone of Ebeko volcano, one of the most active in the Kuril Islands, occupies the northern end of Paramushir Island. Three summit craters located along a SSW-NNE line form Ebeko volcano proper, at the northern end of a complex of five volcanic cones. Blocky lava flows extend west from Ebeko and SE from the neighboring Nezametnyi cone. The eastern part of the southern crater contains strong solfataras and a large boiling spring. The central crater is filled by a lake about 20 m deep whose shores are lined with steaming solfataras; the northern crater lies across a narrow, low barrier from the central crater and contains a small, cold crescentic lake. Historical activity, recorded since the late-18th century, has been restricted to small-to-moderate explosive eruptions from the summit craters. Intense fumarolic activity occurs in the summit craters, on the outer flanks of the cone, and in lateral explosion craters.
Information Contacts: Kamchatka Volcanic Eruptions Response Team (KVERT), Far Eastern Branch, Russian Academy of Sciences, 9 Piip Blvd., Petropavlovsk-Kamchatsky, 683006, Russia (URL: http://www.kscnet.ru/ivs/kvert/).
Search Bulletin Archive by Publication Date
Select a month and year from the drop-downs and click "Show Issue" to have that issue displayed in this tab.
The default month and year is the latest issue available.
Bulletin of the Global Volcanism Network - Volume 34, Number 09 (September 2009)
Managing Editor: Richard Wunderman
Anatahan (United States)
Quiet except for brief tremor in February 2009 and plume in June 2009
Kaba (Indonesia)
Increased seismicity and whitish vapor emissions
Koryaksky (Russia)
Continued ash emissions during May-September 2009
Pagan (United States)
Emission of a small plume in mid-April 2009
Reventador (Ecuador)
Lava flows seen and SO2 fluxes recorded during 16-17 September 2009
Rinjani (Indonesia)
More data relevant to eruptions during 2 May through at least 31 August 2009
St. Helens (United States)
Eruption ceased in late January 2008; quiet continues in late 2009
Turrialba (Costa Rica)
Non-eruptive in August 2009, but degassing and with widening cracks
Anatahan (United States) — September 2009 Cite this Report
Anatahan
United States
16.35°N, 145.67°E; summit elev. 790 m
All times are local (unless otherwise noted)
Quiet except for brief tremor in February 2009 and plume in June 2009
Our most recent report on Anatahan (BGVN 33:12) discussed sulfur dioxide emissions and steam plumes during 2008. This report covers activity between January and October 2009.
A team of research scientists from the University of Tokyo and Kyushu University visited the volcano during the week of 19 January. They worked with the Emergency Management Office of the Commonwealth of the Northern Mariana Islands (CNMI) to perform seismic station maintenance. The team observed no unusual volcanic phenomena. Seismic levels remained low, and no anomalies were observed in satellite imagery.
The U.S. Geological Survey (USGS) reported that seismic activity at Anatahan during the first half of 2009 was generally at background levels. On 11 February a brief episode of tremor occurred. A low level plume was observed in satellite images on 13 June, but there was no evidence that it contained ash. Nothing unusual was observed in satellite images throughout the rest of the week. According to the USGS, Anatahan was quiet as of 6 November.
Geologic Background. The elongate, 9-km-long island of Anatahan in the central Mariana Islands consists of a large stratovolcano with a 2.3 x 5 km compound summit caldera. The larger western portion of the caldera is 2.3 x 3 km wide, and its western rim forms the island's high point. Ponded lava flows overlain by pyroclastic deposits fill the floor of the western caldera, whose SW side is cut by a fresh-looking smaller crater. The 2-km-wide eastern portion of the caldera contained a steep-walled inner crater whose floor prior to the 2003 eruption was only 68 m above sea level. A submarine cone, named NE Anatahan, rises to within 460 m of the sea surface on the NE flank, and numerous other submarine vents are found on the NE-to-SE flanks. Sparseness of vegetation on the most recent lava flows had indicated that they were of Holocene age, but the first historical eruption did not occur until May 2003, when a large explosive eruption took place forming a new crater inside the eastern caldera.
Information Contacts: Dina Venezky, Volcano Hazards Program, U.S. Geological Survey, 345 Middlefield Road, MS 910, Menlo Park, CA 94025, USA (URL: http://volcanoes.usgs.gov/); Emergency Management Office, Commonwealth of the Northern Mariana Islands, PO Box 100007, Saipan, MP 96950, USA (URL: http://www.cnmihsem.gov.mp/).
Kaba (Indonesia) — September 2009 Cite this Report
Kaba
Indonesia
3.522°S, 102.615°E; summit elev. 1940 m
All times are local (unless otherwise noted)
Increased seismicity and whitish vapor emissions
Deep volcanic earthquakes, seismic tremor, and five small explosions with corresponding ash emission were reported from Kaba in August 2000 (BGVN 25:11). Since then, Kaba has been quiet, but even in its normal state it almost always emits whitish plumes 25-100 m high.
On 20 October 2009, the Center of Volcanology and Geological Hazard Mitigation (CVGHM) reported that seismic activity from Kaba increased in August and remained elevated into September and October. Inflation was also detected. When weather permitted, diffuse white plumes were seen rising ~ 25-50 m above the summit crater complex and drifting E. Based on the deformation and increased seismicity, CVGHM raised the Alert Level to 2 (on a scale of 1-4).
From January through August 2009, the frequency of deep volcanic earthquakes averaged 85 events per month, but in August the number of events rose to 257 per month. During August-September, whitish plumes remained similar to September-October. In September seismicity fluctuated but tended to increase. Earthquakes and total tremors recorded at Kaba's monitoring post are shown in table 2.
Table 2. Summary of Kaba seismic data recorded during 12 September-20 October 2009. Courtesy of CVGHM.
| Dates (2009) |
Deep volcanic earthquakes (Count, Characteristics) |
Shallow volcanic earthquakes (Count, Characteristics) |
Notes |
| Beginning on 12 September |
343 |
55 |
-- |
| 1-17 October |
253. Max. amplitudes of 1-18 mm; S-wave minus P-wave arrival times ("S-P") of 0.2-3.5 s with signals lasting 4-35 s. |
271. Max. amplitudes 0.5-15 mm, durations of 2.5-11 s. |
-- |
| 18 October |
68. Max. amplitude of 1-19 mm; S-P times of 0.2-3 s, and a duration of 3.5-47 s. |
67. Max. amplitudes 0.8-16 mm, durations of 2.5-13 s. |
-- |
| 19 October |
50. Max. amplitudes of 0.5-18 mm; S-P 0.5-2 s, and a duration of 2-15 s. |
127. Max. amplitudes 0.5-15 mm, durations of 2.5-10 s. |
Volcanic tremor registered during 0640-0900 local time; max. amplitudes 0.5-2 mm. |
| 20 October |
29. Max. amplitudes of 0.5-18 mm; S-P 0.5-2 seconds and a duration of 2-15 s. |
21. Max. amplitudes 0.5-15 mm, durations of 2.5-10 s. |
Continuous tremor with amplitudes of 1-7 mm; the most prevalent amplitudes 1-3 mm. During clear weather, whitish plumes rose ~ 25 m. |
Deformation measurements taken using an EDM (electronic distance measurement) method were as follows: Biring station, shorter by 10 cm; Voelsang station, longer by 0.4 cm; and Kaba station, shorter by 2 cm.
Measurements of the crater water temperature on 15 October showed a reading of 72°C, with a pH of 3.24. The sulfurous and associated solfatara areas recorded a temperature of around 106-107°C. There was no other activity in the area of the crater.
Geologic Background. Kaba, a twin volcano with Mount Hitam, has an elongated summit crater complex dominated by three large historically active craters trending ENE from the summit to the upper NE flank. The SW-most crater of Gunung Kaba, named Hidup (or Lama), is the largest. Most historical eruptions have affected only the summit area. They mostly originated from the central summit craters, although the upper-NE flank crater Kawah Vogelsang also produced explosions during the 19th and 20th centuries.
Information Contacts: Center of Volcanology and Geological Hazard Mitigation (CVGHM), Jalan Diponegoro 57, Bandung 40122, Indonesia (URL: http://vsi.esdm.go.id/).
Koryaksky (Russia) — September 2009 Cite this Report
Koryaksky
Russia
53.321°N, 158.712°E; summit elev. 3430 m
All times are local (unless otherwise noted)
Continued ash emissions during May-September 2009
During March-18 April 2009 (BGVN 34:03) seismicity and volcanism continued at Karymsky, and ash plumes were detected for hundreds of kilometers. This report discusses the interval May-October 2009, with some discussion of earlier seismicity. The key conclusion for this new interval is that seismicity has not stopped and occasional, though smaller ash plumes continued.
In the mid-May 2009 volcanic and seismic activity decreased considerably. The active fumarole on the NW slope produced gas-steam plumes, but no longer contained appreciable ash (figure 8).
On 2-3 June 2009, observers again saw small areas of snow that were dark gray, indicating some increased ash content. On 15-16 August 2009 instruments began to register a spasmodic volcanic tremor; seismicity increased, and on 17 August ash fell to the SW, forming a deposit 1 mm thick (figure 9).
Seismic analysis. Seliverstov (2009) analyzed seismicity for May 2008 to 10 June 2009, looking at events larger than Ks 4 (Class 4 earthquakes, roughly those larger than M ~ 1.2) and found a spatial and temporal pattern to this stronger seismicity. During March 2008 a prominent swarm of earthquakes was often centered at about 5-10 km depth. Smaller earthquakes were also seen around that time, several at ~ 12 km depth, and some at 15 km depth. This stronger seismicity then waned for several months until late June. During August 2008 to 10 June 2009, earthquakes were numerous, often centered near 5 km depth.
Figure 10 shows a representative set of hypocenters during 3 January 2009-6 November 2009. The pattern shown was similar to that seen during various months during 2008 through mid-2009. Other patterns during 2008 to mid-2009 included intervals where epicenters dipped, as noted in the analysis presented by Seliverstov (2009). Despite decreased volcanic activity, the elevated seismicity remained until at least 10 June 2009.
The number of earthquakes recorded within 10-15 km of the summit during January through October 2009 by the KB GS RAS peaked in April with 422 events, and again in August with 245 events. Otherwise, the interval commonly had monthly totals of 100-200 with the lowest during January (59 events) and October (37 events).
References. Seliverstov, N., 2009, The activity Koryaksky volcano, Kamchatka, Vestnik KRAUNC, Earth Science Series; Petropavlovsk-Kamchatsky, 2009, v. 13, p.7-9 [ISSN 1816-5524]. In Russian.
Geologic Background. The large symmetrical Koryaksky stratovolcano is the most prominent landmark of the NW-trending Avachinskaya volcano group, which towers above Kamchatka's largest city, Petropavlovsk. Erosion has produced a ribbed surface on the eastern flanks of the 3430-m-high volcano; the youngest lava flows are found on the upper W flank and below SE-flank cinder cones. Extensive Holocene lava fields on the western flank were primarily fed by summit vents; those on the SW flank originated from flank vents. Lahars associated with a period of lava effusion from south- and SW-flank fissure vents about 3900-3500 years ago reached Avacha Bay. Only a few moderate explosive eruptions have occurred during historical time, but no strong explosive eruptions have been documented during the Holocene. Koryaksky's first historical eruption, in 1895, also produced a lava flow.
Information Contacts: Kamchatka Volcanic Eruptions Response Team (KVERT), Far East Division, Russian Academy of Sciences, 9 Piip Blvd., Petropavlovsk-Kamchatsky, 683006, Russia (URL: http://www.kscnet.ru/ivs/); Kamchatka Branch of the Geophysical Service of the Russian Academy of Sciences (KB GS RAS), Sergey Senukov, Russia (URL: http://www.emsd.ru/); Alexander Socorenko and Sergei Chirkov, IV&S FED RAS; Tokyo Volcanic Ash Advisory Center (VAAC), Tokyo, Japan (URL: http://ds.data.jma.go.jp/svd/vaac/data/).
Pagan (United States) — September 2009 Cite this Report
Pagan
United States
18.13°N, 145.8°E; summit elev. 570 m
All times are local (unless otherwise noted)
Emission of a small plume in mid-April 2009
Our most recent report on Pagan (BGVN 32:01) covered light ashfall and a small gas plume probably containing some ash during the first week of December 2006. We received no additional information regarding activity at Pagan until April 2009. The U.S. Geological Survey (USGS) does not currently have monitoring instruments on Pagan. Monitoring is by satellite and ground observers.
According to the Washington Volcanic Ash Advisory Center (VAAC), a plume from Pagan on 15 April consisting of intermittent puffs of steam rose to an altitude of 1.8 km and drifted about 37 km W. This observation was confirmed by a ship crew that noted a white plume "with some black" that same day.
On 16 April, the Washington VAAC reported that a narrow plume of unknown composition extended 85 km W from the volcano. According to the CNMI Emergency Management Office, fishermen reported that the plume was "thicker" on 15 April than on 16 April. Weather clouds obscured satellite views. The next day fishermen again reported a plume.
By 17 April, steaming had diminished. A passing pilot reported seeing no activity; however, the Washington VAAC noted a very faint plume extending 85 km NNW in satellite imagery.
Crew on a U.S. National Oceanic and Atmospheric Administration (NOAA) ship observed continuous emissions from the N crater during 21-22 April. Satellite imagery analyzed by the Washington VAAC showed a diffuse plume drifting 15 km W on 23 April. On 28 April, steam emissions had decreased.
Based on analyses of satellite imagery, the Washington VAAC reported that on 14 August a 2-hour-long thermal anomaly detected over Pagan was followed by a small emission. The emission, hotter than its surroundings, drifted NW and quickly dissipated.
No thermal hotspots on Pagan have been detected by MODIS during the last five years.
Geologic Background. Pagan Island, the largest and one of the most active of the Mariana Islands volcanoes, consists of two stratovolcanoes connected by a narrow isthmus. Both North and South Pagan stratovolcanoes were constructed within calderas, 7 and 4 km in diameter, respectively. North Pagan at the NE end of the island rises above the flat floor of the northern caldera, which may have formed less than 1,000 years ago. South Pagan is a stratovolcano with an elongated summit containing four distinct craters. Almost all of the recorded eruptions, which date back to the 17th century, have originated from North Pagan. The largest eruption during historical time took place in 1981 and prompted the evacuation of the sparsely populated island.
Information Contacts: Dina Venezky, Volcano Hazards Program, U.S. Geological Survey, 345 Middlefield Road, MS 910, Menlo Park, CA 94025, USA (URL: http://volcanoes.usgs.gov/); Emergency Management Office, Commonwealth of the Northern Mariana Islands, PO Box 100007, Saipan, MP 96950, USA (URL: http://www.cnmihsem.gov.mp/); Washington Volcanic Ash Advisory Center, Satellite Analysis Branch (SAB), NOAA/NESDIS E/SP23, NOAA Science Center Room 401, 5200 Auth Rd, Camp Springs, MD 20746, USA (URL: http://www.ospo.noaa.gov/Products/atmosphere/vaac/); Hawai'i Institute of Geophysics and Planetology (HIGP) Thermal Alerts System, School of Ocean and Earth Science and Technology (SOEST), University of Hawai'i, 2525 Correa Road, Honolulu, HI 96822, USA (URL: http://modis.higp.hawaii.edu/).
Reventador (Ecuador) — September 2009 Cite this Report
Reventador
Ecuador
0.077°S, 77.656°W; summit elev. 3562 m
All times are local (unless otherwise noted)
Lava flows seen and SO2 fluxes recorded during 16-17 September 2009
Activity at Reventador between August 2008 and late April 2009 was a period of generally low seismicity (BGVN 34:03). During early November 2008 repeated small eruptions occurred with steam-and-ash plumes, Strombolian eruptions, and lava flows. This report continues coverage through October 2009, an interval that included new lava flows advancing ~ 500 m by mid-September 2009.
Based on analysis of satellite imagery, the Washington Volcanic Ash Advisory Center (VAAC) reported that on 1 May a thermal anomaly over Reventador occurred along with a possible low plume drifting W. The Instituto Geofísico-Escuela Politécnica Nacional (IG) reported to the VAAC the presence of lava and gas emissions and possible smoke from burning vegetation, but little to no ash.
On 15 May, the IG observed an ash emission, although neither an ash signature nor a thermal anomaly was detected in satellite imagery. On 26 May, a diffuse ash plume rose to an altitude of 6.4 km and drifted SW. Thermal anomalies were intermittently seen on satellite imagery.
On 21 July-3 August, tremor was sporadic. On 4 August, seismicity increased and periods of tremor frequently saturated the seismic stations. Thermal anomalies, detected in satellite imagery on 1 and 2 August, became more intense on 4, 5, and 10 August. On 6 August, a steam plume rose 1.2 km above the crater and drifted W. Incandescent blocks were ejected from the crater and fell onto the flanks. Thermal images taken from a location 7 km E of Reventador revealed a linear area of higher temperatures, confirming the presence of a new lava flow on the S flank. Incandescence in the crater was seen on 9 August. According to the Washington VAAC, based on information from the IG, an ash plume on 15 August rose to an altitude of 3.6 km and drifted NW.
Field observations on 16-17 September 2009. IG scientists visited Reventador during 16-17 September 2009; among their objectives was to map, sample, and collect thermal images of the new lava flows and to measure the sulfur dioxide (SO2) concentrations with a mobile DOAS.
The team noted that recent lava flows had descended the flanks in a SE to E direction, continuing the same pattern that had begun with the 2005 eruption (figure 31). A dome within the crater showed constant growth (figure 32). Gas was emitted to a height of less than 200 m and drifted mainly W. A small lava flow originating in the dome area had descended ~ 500 m from the cone's S flank.
Thermal images and SO2 measurements were collected near the caldera, and lavas were sampled. SO2 flux measurements (table 4) were collected both by helicopter and by car (figure 33). A telescope for the SO2 measurements sat below the helicopter blades and those spinning blades may have interfered with the measurements. The values presented may thus underestimate the SO2 fluxes.
Table 4. Reventador SO2 data collected from helicopter on 16 and 17 September 2009. The transects in the first column are indicated on figure 33. Transect 34 measurements clearly indicated that the SO2 gas plume had divided (bifurcated) and the two plumes appear as 34a and 34b. For this transect, the SO2 fluxes were calculated separately for each lava plume segment, than added to get the total emission. Land-based measurements, transects 43 and 46, were collected S and W of the vent. Courtesy of IG.
| Transect/Route |
Wind speed (m/s) |
Wind direction |
Data number |
Offset |
SO2 flux (t/d) |
Plume Width |
Traverse Length |
Intensity Limit |
| 31 |
5 |
281 |
191 |
-28 |
811 |
1.9 km |
52.2 km |
7 |
| 34a |
5 |
270 |
95 |
-1 |
1,425 |
3.6 km |
22.2 km |
7 |
| 34b |
5 |
326 |
124 |
-8 |
795 |
2.5 km |
49.2 km |
7 |
| 34 Total |
-- |
-- |
215 |
-- |
2,220 |
-- |
-- |
-- |
| 35 |
5 |
337 |
84 |
-28 |
616 |
1.6 km |
22.8 km |
5 |
| 36 |
5 |
349 |
147 |
-16 |
557 |
2.1 km |
30.2 km |
8 |
| 43 |
5 |
202 |
471 |
-14 |
283 |
5.2 km |
42.8 km |
5 |
| 46 |
5 |
236 |
1222 |
-14 |
1,264 |
16 km |
116 km |
5 |
Based on a pilot observation, the Washington VAAC reported that on 21 September a plume rose to an altitude of 7.6 km. An ash plume on 4 October drifted W. In both cases, ash was not seen in satellite imagery, although meteorological clouds were present. In the latter case, an occasional thermal anomaly was observed.
Thermal anomalies over the crater area were detected in MODIS satellite imagery on 6, 11, and 13 October. On 13 October, the OMI satellite sensor indicated that the SO2 concentration in the atmosphere near the volcano had increased. On 14 October, seismicity increased and harmonic tremor was detected. A seismic station located at ~ 2,600 m elevation on the NE flank of the cone detected rockfalls. Several people living in the area reported roaring noises and had observed slight incandescence from the crater during the previous few nights.
During an overflight on 16 October, scientists saw the lava dome and a lava flow on the NE flank (figure 34). Bluish gases were being emitted. According to a thermal camera, the incandescent parts in the crater were about 300°C. Other observers heard roaring noises and sounds resembling "cannon shots." Incandescent blocks were ejected from the crater, and steam and gas rose 100 m and drifted SW. Incandescent material was seen on the S flank.
On 17 October, long period (LP) earthquakes and volcanic explosions lasting up to 10 hours were registered, incandescence on the S flank was noted, and noises similar to the previous day were again heard. A small gray plume was seen the next day. On 19 October, thermal anomalies were again detected on satellite imagery. During an overflight, blue gas plumes containing SO2 were seen (figure 35). The lava flow on the S flank occupied a large area and was divided into two branches.
According to the IG, on 21 October, steam-and-gas plumes with little to no ash rose 2-4 km above the crater and drifted in various directions. An explosion that day ejected incandescent material from the crater and blocks rolled down the flanks. On 22 October, a few explosions generated ash-and-steam plumes that rose 4 km. Observations during an overflight revealed a small lava flow on the N flank and a larger flow with four branches on the S flank (figure 36). Part of the lava dome base had disappeared and small spines were present, especially on the S side of the dome. Thermal images revealed that material in the crater was 400°C and the lava-flow fronts were 250°C. Cloudy weather prevented visual observations during 23-26 October. Roaring noises were heard on 25 October.
Geologic Background. Volcán El Reventador is the most frequently active of a chain of Ecuadorian volcanoes in the Cordillera Real, well east of the principal volcanic axis. The forested, dominantly andesitic stratovolcano has 4-km-wide avalanche scarp open to the E formed by edifice collapse. A young, unvegetated, cone rises from the amphitheater floor to a height comparable to the rim. It has been the source of numerous lava flows as well as explosive eruptions visible from Quito, about 90 km ESE. Frequent lahars in this region of heavy rainfall have left extensive deposits on the scarp slope. The largest recorded eruption took place in 2002, producing a 17-km-high eruption column, pyroclastic flows that traveled up to 8 km, and lava flows from summit and flank vents.
Information Contacts: Geophysical Institute (IG), Escuela Politécnica Nacional, Apartado 17-01-2759, Quito, Ecuador (URL: http://www.igepn.edu.ec/); Washington Volcanic Ash Advisory Center, Satellite Analysis Branch (SAB), NOAA/NESDIS E/SP23, NOAA Science Center Room 401, 5200 Auth Rd, Camp Springs, MD 20746, USA (URL: http://www.ospo.noaa.gov/Products/atmosphere/vaac/); Hawai'i Institute of Geophysics and Planetology (HIGP) Thermal Alerts System, School of Ocean and Earth Science and Technology (SOEST), University of Hawai'i, 2525 Correa Road, Honolulu, HI 96822, USA (URL: http://modis.higp.hawaii.edu/).
Rinjani (Indonesia) — September 2009 Cite this Report
Rinjani
Indonesia
8.42°S, 116.47°E; summit elev. 3726 m
All times are local (unless otherwise noted)
More data relevant to eruptions during 2 May through at least 31 August 2009
A series of eruptions at Rinjani began on 2 May 2009 (BGVN 34:06). The current report, provided by Alain Bernard, presents additional data regarding these eruptions, which continued through 31 August 2009.
Studies of Rinjani volcanic lake are part of a cooperative agreement between Indonesia and Belgium, a collaboration funded by the Commission Universitaire pour le Développement (CUD, the main Belgian development cooperation agency for universities). Geochemical and physical studies of the Segara Anak lake started in the framework of this collaborative effort during the summer of 2006. During the summer of 2008, investigators installed a monitoring station for continuous measurements of the lake's level and temperature, and for meteorological parameters.
The scientific teams involved in this study were (Indonesia) Akhmad Solikhin, Devy Syabahna and Syegi Kunrat of the Center of Volcanology and Geological Hazards Mitigation (CVGHM); (Belgium) Alain Bernard, Benjamin Barbier, Robin Campion, and Corentin Caudron of the Université Libre de Bruxelles (ULB), and Vincent Hallet and David Lemadec of the Facultés Universitaires Notre Dame de la Paix (FUNDP).
Segara Anak lake. The majestic Segara Anak lake filling the caldera of Rinjani covers an area of 11 km2. Prior to the 2009 eruption, the lake's volume was 1.02 km3. The lake-surface elevation is ~ 2 km (figures 11 and 12).
The lake is neutral (pH: 7-8) and its chemistry dominated by chlorides and sulfates with a relatively high concentration of total-dissolved solids (TDS: 2,640 mg/L). This unusually high TDS value and lake surface temperatures (20-22°C), well above ambient temperatures (14-15°C) for this altitude, reflects a strong input of hydrothermal fluids. Numerous hot springs are located along the shore at the foot of the Barujari cone. Bathymetric profiles showed several areas with columns of gas bubbles escaping from the lake's floor.
Precursory signals of the May 2009 eruption. Changes in Segara Anak lake and the hot springs before the first 2 May 2009 eruption included significant anomalies in the temperature and chemistry of the hot springs.
During field work 10-14 April 2009, the researchers noted an increase in temperature and acidity of hot springs 53 and 54 (figures 13-14) compared to July. This increasing acidity was confirmed in the lab as the consequence of an increase in sulfate levels not observed during studies since 2004.
The Fe-ion concentrations in spring 54, usually below detection limits, peaked at 120 mg/L. This change in chemistry produced a yellowish-brown coloration of the lake waters because of the precipitation of ferric hydroxide, Fe(OH)3 (figures 15-16). An ASTER image from 21 August 2009, processed to enhance the Fe(OH)3 precipitates, revealed a chemical plume close to where hot springs 53 and 54 injected water into the lake.
A chemical plume of low pH and dissolved oxygen was observed at the lake surface extending up to several hundred meters away from hot spring 54. pH profiles as a function of depth recorded at several locations showed a clear acidification of Segara Anak lake especially at shallow depths (15-20 m) (figure 17). Rainfall in April 2009 caused a shallow zone of higher pH.
A slight lake surface temperature increase from 20°C in July 2008 to 22°C in early April 2009 was mostly attributed to meteorological effects. Large increases seen in lake level in January and February 2009 were the consequence of heavy rainfalls. Heating of the lake between August 2008 and April 2009 occurred mainly during periods with reduced heat loss to the atmosphere due to less wind.
A report of these field observations was made on 17 April to CVGHM, which prompted them to send another team to the volcano. The new team arrived at the summit of the volcano on 2 May 2009, the day the eruptions started.
Eruptive activity May-August 2009. The 2009 eruptions originated from the same vent of the October 2004 activity (figure 18), and was characterized by mild eruptions that produced a small lava flow and low altitude, ash-poor gas plumes (figure 19). Contrary to that reported in some newspapers, the 2009 eruption did not open a new vent.
Alain Bernard sent a report by Robin Campion (ULB) who was on site June 2009. According to Campion, mild activity was observed from the SE rim during 9-11 June. Pressurized incandescent gas was released at a 1-2 second intervals from a vent located in the 2004 crater, on the S flank of Barujari. At variable intervals (10 seconds to 10 minutes), stronger gas jets ejected lava fragments to heights up to 100 m. Occasional ash ejections occurred from a second vent in the same crater. A third lower vent emitted a viscous lava flow that reached Segara Anak Lake. Contact between the lake and the lava delta resulted in a warm surface current (figure 20).
Figure 21 shows an ASTER satellite image of Rinjani lake-surface temperatures. Increased discharge of the hot springs on the S flank of Barujari produced a distinct plume with an orange-red color. Weak winds carried the steam-and-gas plume (with low ash content) N and W at an altitude of 3-4 km. Activity did not vary during the 3-day observation period.
As of 31 August 2009, the eruption was still underway. At that point, the new lava flow covered an area of 0.65 km2 (figure 22). The shoreline had been significantly modified by the entry of lava into Segara Anak lake, and the lake surface area had been reduced by 0.46 km2 (figures 22 and 23).
According to Alain Bernard, updates on Rinjani's activity will be posted on the website of the Commission of Volcanic Lakes (CVL, see information contacts). Bernard sent additional figures describing Rinjani behavior as late as 27 September 2009.
Geologic Background. Rinjani volcano on the island of Lombok rises to 3726 m, second in height among Indonesian volcanoes only to Sumatra's Kerinci volcano. Rinjani has a steep-sided conical profile when viewed from the east, but the west side of the compound volcano is truncated by the 6 x 8.5 km, oval-shaped Segara Anak (Samalas) caldera. The caldera formed during one of the largest Holocene eruptions globally in 1257 CE, which truncated Samalas stratovolcano. The western half of the caldera contains a 230-m-deep lake whose crescentic form results from growth of the post-caldera cone Barujari at the east end of the caldera. Historical eruptions dating back to 1847 have been restricted to Barujari cone and consist of moderate explosive activity and occasional lava flows that have entered Segara Anak lake.
Information Contacts: Alain Bernard, Benjamin Barbier, Robin Campion, and Corentin Caudron, Université Libre de Bruxelles (ULB), Belgium (Commission of Volcanic lakes, URL: http://www.ulb.ac.be/sciences/cvl/rinjani/rinjani.html); Akhmad Solikhin, Devy Syabahna, and Syegi Kunrat, Center of Volcanology and Geological Hazards Mitigation (CVGHM), Jalan Diponegoro 57, Bandung 40122, Indonesia (URL: http://vsi.esdm.go.id/); Vincent Hallet and David Lemadec, Facultés Universitaires Notre Dame de la Paix (FUNDP, URL: http://www.fundp.ac.be/); Bakosurtanal, Badan Koordinasi Survei dan Pemetaan Nasional (URL: http://www.bakosurtanal.go.id/); Jim Chow (URL: http://www.flickr.com/photos/11668976@N06/3486237730); Arjo Vanderjagt, Oude Boteringestraat 52, 9712 GL Groningen, The Netherlands (URL: http://www.flickr.com/photos/87453322@N00/3794836615).
St. Helens (United States) — September 2009 Cite this Report
St. Helens
United States
46.2°N, 122.18°W; summit elev. 2549 m
All times are local (unless otherwise noted)
Eruption ceased in late January 2008; quiet continues in late 2009
The eruptive episode that began with the volcano reawakening in October 2004 (BGVN 29:09) ended in late January or early February 2008. The activity included explosions containing ash that rose up to ~ 3 km above the crater and lava dome growth. Sherrod and others (2008) provide a comprehensive discussion of the 2004-2006 portion of the eruption. This report spans 28 November 2007 through October 2009.
A GPS receiver on the W part of the active spine recorded continued SW advance at a rate of 3-4 mm per day during September through November 2007. During 28 November-4 December 2007, small inflation-deflation events occurred, which the USGS Cascades Volcano Observatory (CVO) interpreted as dome-growth pulses. On 31 December 2007 aerial observers saw a new small, snow-free spine on top of the active lobe.
On 25 January 2008, a steam plume rose from the dome slightly above the crater rim. Though seismicity had persisted at low levels through mid-February 2008, very few earthquakes were recorded after late January. Locatable earthquakes were fewer than one per day, all under M 2.0. Ground tilt measurements showed an overall subsidence in the area of the new dome. A GPS receiver on the previously active spine settled about 2 cm per day on a southward path. During February, the daily ground-tilt events stopped and gas emissions were barely detectable.
Comparison of photographs taken by remote cameras during late January to mid-February 2008 showed no evidence of extrusion. Cynthia Gardner (CVO), in a personal communication, noted that dome growth stopped in late January or early February (January 27 ± 10 days).
During March 2008, the most significant developments were a small, M 2.0 earthquake on 4 March and a very small earthquake swarm on 6 March. The latter started with a roughly M 1.2 event, followed by several smaller tremors over a seven-minute period. No tilt changes were associated with the swarm. On 14 March, the Pacific Northwest Seismic Network recorded four very small earthquakes located near the volcano. There were no tilt changes associated with this activity.
Radar imagery analyzed by Jet Propulsion Laboratory staff during late March 2008 showed that the E and W arms of Crater Glacier were touching, or close to touching, just N of the 1980s lava dome. From 30 May 2008 (figure 71) to 8 July 2008, the W arm of the glacier advanced ~ 20 m. By 8 July, the old and new lava domes in the crater were encircled by ice (figure 72). Further down slope glacier ice descended into the gullies that had been carved by erosion into the Pumice Plain. On 10 July, after nearly 5 months without signs of renewed activity, CVO lowered the Alert Level to Normal and the Aviation Color Code to Green.
As of October 2009, earthquakes, volcanic gas emissions, and ground deformation had all fallen to levels observed prior to the onset of the eruption.
References. Lahusen, R.G., 2005, Acoustic flow monitor system?user manual: U.S. Geological Survey Open-File Report 02-429, 22 p.
Sherrod, D.R., Scott, W.E., and Stauffer, P.H., eds., 2008, A volcano rekindled: the renewed eruption of Mount St. Helens, 2004-2006: U.S. Geological Survey, Professional Paper 1750, 856 p.
Geologic Background. Prior to 1980, Mount St. Helens was a conical volcano sometimes known as the Fujisan of America. During the 1980 eruption the upper 400 m of the summit was removed by slope failure, leaving a 2 x 3.5 km breached crater now partially filled by a lava dome. There have been nine major eruptive periods beginning about 40-50,000 years ago, and it has been the most active volcano in the Cascade Range during the Holocene. Prior to 2,200 years ago, tephra, lava domes, and pyroclastic flows were erupted, forming the older edifice, but few lava flows extended beyond the base of the volcano. The modern edifice consists of basaltic as well as andesitic and dacitic products from summit and flank vents. Eruptions in the 19th century originated from the Goat Rocks area on the N flank, and were witnessed by early settlers.
Information Contacts: Cascades Volcano Observatory (CVO), U.S. Geological Survey, 1300 SE Cardinal Court, Building 10, Suite 100, Vancouver, WA 98683-9589, USA (URL: https://volcanoes.usgs.gov/observatories/cvo/); Pacific Northwest Seismic Network, University of Washington, Dept. of Earth and Space Sciences, Box 351310, Seattle, WA 98195-1310, USA (URL: http://www.pnsn.org/); Hawai'i Institute of Geophysics and Planetology (HIGP) Thermal Alerts System, School of Ocean and Earth Science and Technology (SOEST), Univ. of Hawai'i, 2525 Correa Road, Honolulu, HI 96822, USA (URL: http://modis.higp.hawaii.edu/).
Turrialba (Costa Rica) — September 2009 Cite this Report
Turrialba
Costa Rica
10.025°N, 83.767°W; summit elev. 3340 m
All times are local (unless otherwise noted)
Non-eruptive in August 2009, but degassing and with widening cracks
The Observatorio Vulcanológico y Sismológico de Costa Rica, Universidad Nacional (OVSICORI-UNA) continued monitoring the Turrialba non-eruptive interval of February 2008 through August 2009. As during the previous four months (BGVN 33:01), Turrialba continued to emit sulfurous gas from its central and W craters, and elsewhere, including some new cracks.
Activity during February-December 2008. During February 2008, the area around Turrialba affected by acid rain increased due to degassing. The degassing vents on the N, NW, W, and SW walls were rich in sublimated native sulfur. Gas-emission temperatures ranged from 72 to 132°C. Owing to prevailing winds, the vegetation most affected was on the N, NW, and SW flanks. The effects ranged from discoloration to death of various plant species. Residents in the area reported occasional nausea and irritation of the skin and eyes. On 22 February, local observers reported a gas plume up to ~ 2 km in height.
On the SE and SW walls of the central crater two cracks 2-3 cm wide and 100 m long continued to emit gases at ~ 90°C and produced sulfur deposits (figure 13). In stable atmospheric conditions gas columns often rose ~ 500 m above the crater. Rockslides sometimes covered emitting fumaroles, and new sulfur deposits tended to develop in these areas.
During 7-8 March 2008, gas sampling at the summit fumaroles determined the maximum temperature at the largest W wall vent was 278°C. Degassing vents were also noted at spots in the middle of the forest. In some cases emissions had killed all local vegetation.
On 7-8 March 2008, Erick Fernandez and Eliécer Duarte of OVSICORI, and the National University (UNA) took gas samples. The analysis, done by Jorge Andrés Diaz and Sergio Achí of the University of Costa Rica, revealed the presence of He at 80,000 ppm (parts per million), whereas the typical He concentration in the neighborhood of a volcano is 25 ppm.
OVSICORI-UNA reported continued degassing during August and September 2008. Multiple fumaroles and areas of sulfur deposition were noted in both the central and W craters. Fumarolic emissions on the S and SE flanks of the W crater continued to damage vegetation in that area.
On 23 September 2008, OVSICORI fieldwork confirmed a severe impact of acid-rain on areas that had been only mildly affected during the preceding 3 years of degassing. At least three sectors showed new impacts on vegetation and infrastructure, from the summit downhill ~ 3 km along the S and SE flanks. The upper sector, which includes the entire caldera and lower sectors to the E, S, and SE near the summit, had been severely burned during August and September. This area goes from the summit down to an elevation of ~ 2,900 m. By 23 September, weeds, dwarf vegetation, and trees had been completely burned; however in these areas some resistant species maintained some green and appeared seemingly viable. Along the external walls to the S of the W crater, plants had been burned down to the soil. Due to the removal of that natural coverage, erosion had cut extended radial gullies.
Between the elevations of 2,900 and 2,600 m, significant forest patches have been partially seared by extreme acidification, particularly the dense birch forests. Below 2,600 m elevation mild burns to the tree canopy and pasture areas were evident. The evidence of chemical burns due to the heavy gases are amplified along canyons and depressions. These conditions caused residents to voluntarily leave their farms in 2007.
Monitored SO2 emissions during the early part of 2008 had been ~ 750 metric tons per day (t/d). At the end of April 2008, an increase to ~ 1,000 t/d was noted, which then increased to ~ 2,000 t/d well into July. During the end of July the emissions declined to ~ 1,100 t/d. The increase in SO2 flux corresponded to increases in vegetation damage.
Activity during January-June 2009. In May 2009 OVSICORI reported ongoing fumarolic degassing during the preceding months from the central crater, from the N, NW, W, SW and S walls, from new vents on the S and SW walls, and other locations. Some locations continued to form sublimated sulfur deposits. The two cracks in the SE and SW walls had temperatures of ~ 87°C. The emissions in the W wall registered ~ 91°C and displayed sulfur deposits. In meteorologically quiet conditions, gas plumes were noted up to 500-600 m above the crater floor. All of these areas had experienced small landslides that occasionally covered some vents.
SO2 flux was variable during early 2009 (figure 14). The flux data were collected with a roughly consistent sun angle, between 0900 and 1100 in the morning on the SW flank. In the graph the SO2 flux varies between ~ 0 and ~ 2,000 t/d, the maximum flux occurred on 23 April.
On 14 June 2009, OVSICORI-UNA reported that fumarolic activity from Turrialba had been observed all around the upper flanks of the active W crater. During the previous two months, the fumarolic activity was also accompanied by widening radial cracks (1.5 cm on average), 1-2 km tall gas-and-vapor plumes, and one sustained seismic swarm. Temperatures of fumarolic vents in the lower parts of the crater were between 120 and 160°C. The temperature of summit cracks was 94°C. By mid-June, dairy pastures and forests had been chemically burned as far away as 3.5 km NW and W. During the last week of August 2009, the W and NW lower flanks, sectors previously reported with moderate effects, showed acute burns, and yellow pastures within 3 to 4 km radius (figures 15, 16, and 17).
Near the Toro Amarillo river (4 km E of the crater) chemical burning surrounds stands of trees. Such whitening effect had been previously reported at the end of 2007 for areas closer to the active crater, 1.5 km W (figure 18).
Several elongated cracks were mapped just south of the W crater as well as 1 km downslope NW. One main crack, noticed during mid-2009 due to sulfur depositions on the surface, was opened by August in places as much as 12 cm. In late August 2009 it emitted gasses at 90°C. The crack trends E-W, in places intersecting a trail used to reach the summit's SW and W sides.
The last two years have caused residents to leave owing to the burned and dead pastures. Some commented on their apprehension related to the emergence of the lower fumaroles. Along the S side of the Irazú summit located 10 km SW of Turrialba's summit, mild burns have been observed on patches of birch, eucalyptus and pine. Lesser impact was reported last year in that same area.
False eruption report. The Washington VAAC received surface observations from an airport near the volcano erroneously indicating an eruption on the morning of 23 September 2009.
The VAAC decided to initially describe the activity as an eruption because it was the first time the airport had reported emissions, the volcano was known to have been degassing for some time, and early morning satellite imagery showed cloud cover, preventing good analysis. In addition, attempts to reach local volcanologists by telephone using contact numbers from the ICAO [International Civil Aviation Organization] handbook and the OVSICORI webpage were not successful. OVSICORI-UNA personnel reported a few hours later that the volcano had not erupted. As a result of the incident, the VAAC has obtained current contact numbers, including personal cell phones, for future use.
Geologic Background. Turrialba, the easternmost of Costa Rica's Holocene volcanoes, is a large vegetated basaltic-to-dacitic stratovolcano located across a broad saddle NE of Irazú volcano overlooking the city of Cartago. The massive edifice covers an area of 500 km2. Three well-defined craters occur at the upper SW end of a broad 800 x 2200 m summit depression that is breached to the NE. Most activity originated from the summit vent complex, but two pyroclastic cones are located on the SW flank. Five major explosive eruptions have occurred during the past 3500 years. A series of explosive eruptions during the 19th century were sometimes accompanied by pyroclastic flows. Fumarolic activity continues at the central and SW summit craters.
Information Contacts: Eliécer Duarte, Erick Fernández, Vilma Barboza, S. Miranda, L. Ortiz, G. Chavez, Jorge Brenes, Thomás Marino, Javier Pacheco, Juan Segura, and Rodolfo van der Laat, Observatorio Vulcanológico y Sismológico de Costa Rica, Universidad Nacional (OVSICORI-UNA), Apdo. 2346-3000, Heredia, Costa Rica (URL: http://www.ovsicori.una.ac.cr/); Francois Robichaud, Université de Sherbrooke, 2500 boul. de l'Université, Sherbrooke, Québec J1K 2R1, Canada; Washington Volcanic Ash Advisory Center, Satellite Analysis Branch (SAB), NOAA/NESDIS E/SP23, NOAA Science Center Room 401, 5200 Auth Rd, Camp Springs, MD 20746, USA (URL: http://www.ospo.noaa.gov/Products/atmosphere/vaac/).