Recently Published Bulletin Reports
Erebus (Antarctica) Lava lake remains active; most thermal alerts recorded since 2019
Rincon de la Vieja (Costa Rica) Frequent phreatic explosions during July-December 2023
Bezymianny (Russia) Explosion on 18 October 2023 sends ash plume 8 km high; lava flows and incandescent avalanches
Kilauea (United States) Low-level lava effusions in the lava lake at Halema’uma’u during July-December 2022
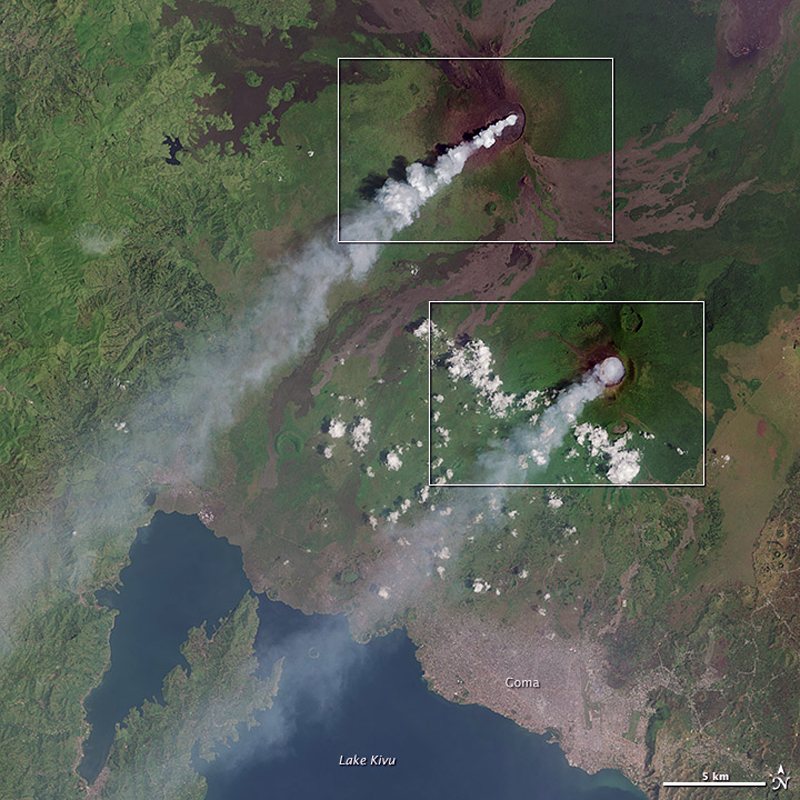
Nyamulagira (DR Congo) Lava flows and thermal activity during May-October 2023
Bagana (Papua New Guinea) Explosions, ash plumes, ashfall, and lava flows during April-September 2023
Mayon (Philippines) Lava flows, pyroclastic flows, ash emissions, and seismicity during April-September 2023
Nishinoshima (Japan) Eruption plumes and gas-and-steam plumes during May-August 2023
Krakatau (Indonesia) White gas-and-steam plumes and occasional ash plumes during May-August 2023
Villarrica (Chile) Strombolian activity, gas-and-ash emissions, and crater incandescence during April-September 2023
Merapi (Indonesia) Frequent incandescent avalanches during April-September 2023
Ebeko (Russia) Moderate explosive activity with ash plumes continued during June-November 2023
Erebus (Antarctica) — January 2024  Cite this Report
Erebus
Antarctica
77.53°S, 167.17°E; summit elev. 3794 m
All times are local (unless otherwise noted)
Lava lake remains active; most thermal alerts recorded since 2019
The lava lake in the summit crater of Erebus has been active since at least 1972. Located in Antarctica overlooking the McMurdo Station on Ross Island, it is the southernmost active volcano on the planet. Because of the remote location, activity is primarily monitored by satellites. This report covers activity during 2023.
The number of thermal alerts recorded by the Hawai'i Institute of Geophysics and Planetology’s MODVOLC Thermal Alerts System increased considerably in 2023 compared to the years 2020-2022 (table 9). In contrast to previous years, the MODIS instruments aboard the Aqua and Terra satellites captured data from Erebus every month during 2023. Consistent with previous years, the lowest number of anomalous pixels were recorded in January, November, and December.
Table 9. Number of monthly MODIS-MODVOLC thermal alert pixels recorded at Erebus during 2017-2023. See BGVN 42:06 for data from 2000 through 2016. The table was compiled using data provided by the HIGP – MODVOLC Thermal Alerts System.
| Year |
Jan |
Feb |
Mar |
Apr |
May |
Jun |
Jul |
Aug |
Sep |
Oct |
Nov |
Dec |
SUM |
| 2017 |
0 |
21 |
9 |
0 |
0 |
1 |
11 |
61 |
76 |
52 |
0 |
3 |
234 |
| 2018 |
0 |
21 |
58 |
182 |
55 |
17 |
137 |
172 |
103 |
29 |
0 |
0 |
774 |
| 2019 |
2 |
21 |
162 |
151 |
55 |
56 |
75 |
53 |
29 |
19 |
1 |
0 |
624 |
| 2020 |
0 |
2 |
16 |
18 |
4 |
4 |
1 |
3 |
18 |
3 |
1 |
6 |
76 |
| 2021 |
0 |
9 |
1 |
0 |
2 |
56 |
46 |
47 |
35 |
52 |
5 |
3 |
256 |
| 2022 |
1 |
13 |
55 |
22 |
15 |
32 |
39 |
19 |
31 |
11 |
0 |
0 |
238 |
| 2023 |
2 |
33 |
49 |
82 |
41 |
32 |
70 |
64 |
42 |
17 |
5 |
11 |
448 |
Sentinel-2 infrared images showed one or two prominent heat sources within the summit crater, accompanied by adjacent smaller sources, similar to recent years (see BGVN 46:01, 47:02, and 48:01). A unique image was obtained on 25 November 2023 by the OLI-2 (Operational Land Imager-2) on Landsat 9, showing the upper part of the volcano surrounded by clouds (figure 32).
Geologic Background. Mount Erebus, the world's southernmost historically active volcano, overlooks the McMurdo research station on Ross Island. It is the largest of three major volcanoes forming the crudely triangular Ross Island. The summit of the dominantly phonolitic volcano has been modified by one or two generations of caldera formation. A summit plateau at about 3,200 m elevation marks the rim of the youngest caldera, which formed during the late-Pleistocene and within which the modern cone was constructed. An elliptical 500 x 600 m wide, 110-m-deep crater truncates the summit and contains an active lava lake within a 250-m-wide, 100-m-deep inner crater; other lava lakes are sometimes present. The glacier-covered volcano was erupting when first sighted by Captain James Ross in 1841. Continuous lava-lake activity with minor explosions, punctuated by occasional larger Strombolian explosions that eject bombs onto the crater rim, has been documented since 1972, but has probably been occurring for much of the volcano's recent history.
Information Contacts: Hawai'i Institute of Geophysics and Planetology (HIGP) - MODVOLC Thermal Alerts System, School of Ocean and Earth Science and Technology (SOEST), Univ. of Hawai'i, 2525 Correa Road, Honolulu, HI 96822, USA (URL: http://modis.higp.hawaii.edu/); Copernicus Browser, Copernicus Data Space Ecosystem, European Space Agency (URL: https://dataspace.copernicus.eu/browser/); NASA Earth Observatory, EOS Project Science Office, NASA Goddard Space Flight Center, Goddard, Maryland, USA (URL: https://earthobservatory.nasa.gov/images/152134/erebus-breaks-through).
Rincon de la Vieja (Costa Rica) — January 2024 Cite this Report
Rincon de la Vieja
Costa Rica
10.83°N, 85.324°W; summit elev. 1916 m
All times are local (unless otherwise noted)
Frequent phreatic explosions during July-December 2023
Rincón de la Vieja is a volcanic complex in Costa Rica with a hot convecting acid lake that exhibits frequent weak phreatic explosions, gas-and-steam emissions, and occasional elevated sulfur dioxide levels (BGVN 45:10, 46:03, 46:11). The current eruption period began June 2021. This report covers activity during July-December 2023 and is based on weekly bulletins and occasional daily reports from the Observatorio Vulcanologico Sismologica de Costa Rica-Universidad Nacional (OVSICORI-UNA).
Numerous weak phreatic explosions continued during July-December 2023, along with gas-and-steam emissions and plumes that rose as high as 3 km above the crater rim. Many weekly OVSICORI-UNA bulletins included the previous week's number of explosions and emissions (table 9). For many explosions, the time of explosion was given (table 10). Frequent seismic activity (long-period earthquakes, volcano-tectonic earthquakes, and tremor) accompanied the phreatic activity.
Table 9. Number of reported weekly phreatic explosions and gas-and-steam emissions at Rincón de la Vieja, July-December 2023. Counts are reported for the week before the Weekly Bulletin date; not all reports included these data. Courtesy of OVSICORI-UNA.
| OVSICORI Weekly Bulletin |
Number of explosions |
Number of emissions |
| 28 Jul 2023 |
6 |
14 |
| 4 Aug 2023 |
10 |
12 |
| 1 Sep 2023 |
13 |
11 |
| 22 Sep 2023 |
12 |
13 |
| 29 Sep 2023 |
6 |
11 |
| 6 Oct 2023 |
12 |
5 |
| 13 Oct 2023 |
7 |
9 |
| 20 Oct 2023 |
1 |
15 |
| 27 Oct 2023 |
3 |
23 |
| 3 Nov 2023 |
3 |
10 |
| 17 Nov 2023 |
0 |
Some |
| 24 Nov 2023 |
0 |
14 |
| 8 Dec 2023 |
4 |
16 |
| 22 Dec 2023 |
8 |
18 |
Table 10. Summary of activity at Rincón de la Vieja during July-December 2023. Weak phreatic explosions and gas emissions are noted where the time of explosion was indicated in the weekly or daily bulletins. Height of plumes or emissions are distance above the crater rim. Courtesy of OVSICORI-UNA.
| Date |
Time |
Description of Activity |
| 1 Jul 2023 |
0156 |
Explosion. |
| 2 Jul 2023 |
0305 |
Explosion. |
| 4 Jul 2023 |
0229, 0635 |
Event at 0635 produced a gas-and-steam plume that rose 700 m and drifted W; seen by residents in Liberia (21 km SW). |
| 9 Jul 2023 |
1843 |
Explosion. |
| 21 Jul 2023 |
0705 |
Explosion. |
| 26 Jul 2023 |
1807 |
Explosion. |
| 28 Jul 2023 |
0802 |
Explosion generated a gas-and-steam plume that rose 500 m. |
| 30 Jul 2023 |
1250 |
Explosion. |
| 31 Jul 2023 |
2136 |
Explosion. |
| 11 Aug 2023 |
0828 |
Explosion. |
| 18 Aug 2023 |
1304 |
Explosion. |
| 21 Aug 2023 |
1224 |
Explosion generated gas-and-steam plumes rose 500-600 m. |
| 22 Aug 2023 |
0749 |
Explosion generated gas-and-steam plumes rose 500-600 m. |
| 24 Aug 2023 |
1900 |
Explosion. |
| 25 Aug 2023 |
0828 |
Event produced a steam-and-gas plume that rose 3 km and drifted NW. |
| 27-28 Aug 2023 |
0813 |
Four small events; the event at 0813 on 28 August lasted two minutes and generated a steam-and-gas plume that rose 2.5 km. |
| 1 Sep 2023 |
1526 |
Explosion generated plume that rose 2 km and ejected material onto the flanks. |
| 2-3 Sep 2023 |
- |
Small explosions detected in infrasound data. |
| 4 Sep 2023 |
1251 |
Gas-and-steam plume rose 1 km and drifted W. |
| 7 Nov 2023 |
1113 |
Explosion. |
| 8 Nov 2023 |
0722 |
Explosion. |
| 12 Nov 2023 |
0136 |
Small gas emissions. |
| 14 Nov 2023 |
0415 |
Small gas emissions. |
According to OVSICORI-UNA, during July-October the average weekly sulfur dioxide (SO2) flux ranged from 68 to 240 tonnes/day. However, in mid-November the flux increased to as high as 334 tonnes/day, the highest value measured in recent years. The high SO2 flux in mid-November was also detected by the TROPOMI instrument on the Sentinel-5P satellite (figure 43).
Geologic Background. Rincón de la Vieja, the largest volcano in NW Costa Rica, is a remote volcanic complex in the Guanacaste Range. The volcano consists of an elongated, arcuate NW-SE-trending ridge constructed within the 15-km-wide early Pleistocene Guachipelín caldera, whose rim is exposed on the south side. Sometimes known as the "Colossus of Guanacaste," it has an estimated volume of 130 km3 and contains at least nine major eruptive centers. Activity has migrated to the SE, where the youngest-looking craters are located. The twin cone of Santa María volcano, the highest peak of the complex, is located at the eastern end of a smaller, 5-km-wide caldera and has a 500-m-wide crater. A Plinian eruption producing the 0.25 km3 Río Blanca tephra about 3,500 years ago was the last major magmatic eruption. All subsequent eruptions, including numerous historical eruptions possibly dating back to the 16th century, have been from the prominent active crater containing a 500-m-wide acid lake located ENE of Von Seebach crater.
Information Contacts: Observatorio Vulcanológico Sismológica de Costa Rica-Universidad Nacional (OVSICORI-UNA), Apartado 86-3000, Heredia, Costa Rica (URL: http://www.ovsicori.una.ac.cr/); NASA Global Sulfur Dioxide Monitoring Page, Atmospheric Chemistry and Dynamics Laboratory, NASA Goddard Space Flight Center (NASA/GSFC), 8800 Greenbelt Road, Goddard MD 20771, USA (URL: https://so2.gsfc.nasa.gov/).
Bezymianny (Russia) — November 2023 Cite this Report
Bezymianny
Russia
55.972°N, 160.595°E; summit elev. 2882 m
All times are local (unless otherwise noted)
Explosion on 18 October 2023 sends ash plume 8 km high; lava flows and incandescent avalanches
Bezymianny, located on Russia’s Kamchatka Peninsula, has had eruptions since 1955 characterized by dome growth, explosions, pyroclastic flows, ash plumes, and ashfall. Activity during November 2022-April 2023 included gas-and-steam emissions, lava dome collapses generating avalanches, and persistent thermal activity. Similar eruptive activity continued from May through October 2023, described here based on information from weekly and daily reports of the Kamchatka Volcano Eruptions Response Team (KVERT), notices from Tokyo VAAC (Volcanic Ash Advisory Center), and from satellite data.
Overall activity decreased after the strong period of activity in late March through April 2023, which included ash explosions during 29 March and 7-8 April 2023 that sent plumes as high as 10-12 km altitude, along with dome growth and lava flows (BGVN 48:05). This reduced activity can be seen in the MIROVA thermal detection system graph (figure 56), which was consistent with data from the MODVOLC thermal detection system and with Sentinel-2 satellite images that showed persistent hotspots in the summit crater when conditions allowed observations. A renewed period of strong activity began in mid-October 2023.
Activity increased significantly on 17 October 2023 when large collapses began during 0700-0830 on the E flanks of the lava dome and continued to after 0930 the next day (figure 57). Ash plumes rose to an altitude of 4.5-5 km, extending 220 km NNE by 18 October. A large explosion at 1630 on 18 October produced an ash plume that rose to an altitude of 11 km (8 km above the summit) and drifted NNE and then NW, extending 900 km NW within two days at an altitude of 8 km. Minor ashfall was noted in Kozyrevsk (45 km WNW). At 0820 on 20 October an ash plume was identified in satellite images drifting 100 km ENE at altitudes of 4-4.5 km.
Lava flows and hot avalanches from the dome down the SE flank continued over the next few days, including 23 October when clear conditions allowed good observations (figures 58 and 59). A large thermal anomaly was observed over the volcano through 24 October, and in the summit crater on 30 October (figure 60). Strong fumarolic activity continued, with numerous avalanches and occasional incandescence. By the last week of October, volcanic activity had decreased to a level consistent with that earlier in the reporting period.
Aviation warnings were frequently updated during 17-20 October. KVERT issued a Volcano Observatory Notice for Aviation (VONA) on 17 October at 1419 and 1727 (0219 and 0527 UTC) raising the Aviation Color Code (ACC) from Yellow to Orange (second highest level). The next day, KVERT issued a VONA at 1705 (0505 UTC) raising the ACC to Red (highest level) but lowered it back to Orange at 2117 (0917 UTC). After another decrease to Yellow and back to Orange, the ACC was reduced to Yellow on 20 October at 1204 (0004 UTC). In addition, the Tokyo VAAC issued a series of Volcanic Ash Advisories beginning on 16 October and continuing through 30 October.
Geologic Background. The modern Bezymianny, much smaller than its massive neighbors Kamen and Kliuchevskoi on the Kamchatka Peninsula, was formed about 4,700 years ago over a late-Pleistocene lava-dome complex and an edifice built about 11,000-7,000 years ago. Three periods of intensified activity have occurred during the past 3,000 years. The latest period, which was preceded by a 1,000-year quiescence, began with the dramatic 1955-56 eruption. This eruption, similar to that of St. Helens in 1980, produced a large open crater that was formed by collapse of the summit and an associated lateral blast. Subsequent episodic but ongoing lava-dome growth, accompanied by intermittent explosive activity and pyroclastic flows, has largely filled the 1956 crater.
Information Contacts: Kamchatka Volcanic Eruptions Response Team (KVERT), Far Eastern Branch, Russian Academy of Sciences, 9 Piip Blvd., Petropavlovsk-Kamchatsky, 683006, Russia (URL: http://www.kscnet.ru/ivs/kvert/); Kamchatka Volcanological Station, Kamchatka Branch of Geophysical Survey, (KB GS RAS), Klyuchi, Kamchatka Krai, Russia (URL: http://volkstat.ru/); Tokyo Volcanic Ash Advisory Center (VAAC), 1-3-4 Otemachi, Chiyoda-ku, Tokyo 100-8122, Japan (URL: http://ds.data.jma.go.jp/svd/vaac/data/); Hawai'i Institute of Geophysics and Planetology (HIGP) - MODVOLC Thermal Alerts System, School of Ocean and Earth Science and Technology (SOEST), Univ. of Hawai'i, 2525 Correa Road, Honolulu, HI 96822, USA (URL: http://modis.higp.hawaii.edu/); MIROVA (Middle InfraRed Observation of Volcanic Activity), a collaborative project between the Universities of Turin and Florence (Italy) supported by the Centre for Volcanic Risk of the Italian Civil Protection Department (URL: http://www.mirovaweb.it/); Copernicus Browser, Copernicus Data Space Ecosystem, European Space Agency (URL: https://dataspace.copernicus.eu/browser/).chr
Kilauea (United States) — January 2023 Cite this Report
Kilauea
United States
19.421°N, 155.287°W; summit elev. 1222 m
All times are local (unless otherwise noted)
Low-level lava effusions in the lava lake at Halema’uma’u during July-December 2022
Kīlauea is the southeastern-most volcano in Hawaii and overlaps the E flank of the Mauna Loa volcano. Its East Rift Zone (ERZ) has been intermittently active for at least 2,000 years. An extended eruption period began in January 1983 and was characterized by open lava lakes and lava flows from the summit caldera and the East Rift Zone. During May 2018 magma migrated into the Lower East Rift Zone (LERZ) and opened 24 fissures along a 6-km-long NE-trending fracture zone that produced lava flows traveling in multiple directions. As lava emerged from the fissures, the lava lake at Halema'uma'u drained and explosions sent ash plumes to several kilometers altitude (BGVN 43:10).
The current eruption period started during September 2021 and has recently been characterized by lava effusions, spatter, and sulfur dioxide emissions in the active Halema’uma’u lava lake (BGVN 47:08). Lava effusions, some spatter, and sulfur dioxide emissions have continued during this reporting period of July through December 2022 using daily reports, volcanic activity notices, and abundant photo, map, and video data from the US Geological Survey's (USGS) Hawaiian Volcano Observatory (HVO).
Summary of activity during July-December 2022. Low-level effusions have continued at the western vent of the Halema’uma’u crater during July through early December 2022. Occasional weak ooze-outs (also called lava break outs) would occur along the margins of the crater floor. The overall level of the active lava lake throughout the reporting period gradually increased due to infilling, however it stagnated in mid-September (table 13). During September through November, activity began to decline, though lava effusions persisted at the western vent. By 9 December, the active part of the lava lake had completely crusted over, and incandescence was no longer visible.
Table 13. Summary of measurements taken during overflights at Kīlauea that show a gradual increase in the active lava lake level and the volume of lava effused since 29 September 2021. Lower activity was reported during September-October. Data collected during July-December 2022. Courtesy of HVO.
| Date: |
Level of the active lava lake (m): |
Cumulative volume of lava effused (million cubic meters): |
| 7 Jul 2022 |
130 |
95 |
| 19 Jul 2022 |
133 |
98 |
| 4 Aug 2022 |
136 |
102 |
| 16 Aug 2022 |
137 |
104 |
| 12 Sep 2022 |
143 |
111 |
| 5 Oct 2022 |
143 |
111 |
| 28 Oct 2022 |
143 |
111 |
Activity during July 2022. Lava effusions were reported from the western vent in the Halema’uma’u crater, along with occasional weak ooze-outs along the margins of the crater floor. The height of the lava lake was variable due to deflation-inflation tilt events; for example, the lake level dropped approximately 3-4 m during a summit deflation-inflation event reported on 1 July. Webcam images taken during the night of 6-12 July showed intermittent low-level spattering at the western vent that rose less than 10 m above the vent (figure 519). Measurements made during an overflight on 7 July indicated that the crater floor was infilled about 130 m and that 95 million cubic meters of lava had been effused since 29 September 2021. A single, relatively small lava ooze-out was active to the S of the lava lake. Around midnight on 8 July there were two brief periods of lava overflow onto the lake margins. On 9 July lava ooze-outs were reported near the SE and NE edges of the crater floor and during 10-11 July they occurred near the E, NE, and NW edges. On 16 July crater incandescence was reported, though the ooze-outs and spattering were not visible. On 18 July overnight webcam images showed incandescence in the western vent complex and two ooze-outs were reported around 0000 and 0200 on 19 July. By 0900 there were active ooze-outs along the SW edge of the crater floor. Measurements made from an overflight on 19 July indicated that the crater floor was infilled about 133 m and 98 million cubic meters of lava had erupted since 29 September 2021 (figure 520). On 20 July around 1600 active ooze-outs were visible along the N edge of the crater, which continued through the next day. Extensive ooze-outs occurred along the W margin during 24 July until 1900; on 26 July minor ooze-outs were noted along the N margin. Minor spattering was visible on 29 July along the E margin of the lake. The sulfur dioxide emission rates ranged 650-2,800 tons per day (t/d), the higher of which was measured on 8 July (figure 519).
Activity during August 2022. The eruption continued in the Halema’uma’u crater at the western vent. According to HVO the lava in the active lake remained at the level of the bounding levees. Occasional minor ooze-outs were observed along the margins of the crater floor. Strong nighttime crater incandescence was visible after midnight on 6 August over the western vent cone. During 6-7 August scattered small lava lobes were active along the crater floor and incandescence persisted above the western vent through 9 August. During 7-9 August HVO reported a single lava effusion source was active along the NW margin of the crater floor. Measurements from an overflight on 4 August indicated that the crater floor was infilled about 136 m total and that 102 million cubic meters of lava had been erupted since the start of the eruption. Lava breakouts were reported along the N, NE, E, S, and W margins of the crater during 10-16 August. Another overflight survey conducted on 16 August indicated that the crater floor infilled about 137 m and 104 million cubic meters of lava had been erupted since September 2021. Measured sulfur dioxide emissions rates ranged 1,150-2,450 t/d, the higher of which occurred on 8 August.
Activity during September 2022. During September, lava effusion continued from the western vent into the active lava lake and onto the crater floor. Intermittent minor ooze-outs were reported through the month. A small ooze-out was visible on the W crater floor margin at 0220 on 2 September, which showed decreasing surface activity throughout the day, but remained active through 3 September. On 3 September around 1900 a lava outbreak occurred along the NW margin of the crater floor but had stopped by the evening of 4 September. Field crews monitoring the summit lava lake on 9 September observed spattering on the NE margin of the lake that rose no higher than 10 m, before falling back onto the lava lake crust (figure 521). Overflight measurements on 12 September indicated that the crater floor was infilled a total of 143 m and 111 million cubic meters of lava had been erupted since September 2021. Extensive breakouts in the W and N part of the crater floor were reported at 1600 on 20 September and continued into 26 September. The active part of the lava lake dropped by 10 m while other parts of the crater floor dropped by several meters. Summit tiltmeters recorded a summit seismic swarm of more than 80 earthquakes during 1500-1800 on 21 September, which occurred about 1.5 km below Halema’uma’u; a majority of these were less than Mw 2. By 22 September the active part of the lava lake was infilled about 2 m. On 23 September the western vent areas exhibited several small spatter cones with incandescent openings, along with weak, sporadic spattering (figure 522). The sulfur dioxide emission rate ranged from 930 t/d to 2,000 t/d, the higher of which was measured on 6 September.
Activity during October 2022. Activity during October declined slightly compared to previous months, though lava effusions persisted from the western vent into the active lava lake and onto the crater floor during October (figure 523). Slight variations in the lava lake were noted throughout the month. HVO reported that around 0600 on 3 October the level of the lava lake has lowered slightly. Overflight measurements taken on 5 October indicated that the crater floor was infilled a total of about 143 m and that 111 million cubic meters of lava had been effused since September 2021. During 6-7 October the lake gradually rose 0.5 m. Sulfur dioxide measurements made on 22 October had an emission rate of 700 t/d. Another overflight taken on 28 October showed that there was little to no change in the elevation of the crater floor: the crater floor was infilled a total of 143 m and 111 million cubic meters of lava had erupted since the start of the eruption.
Activity during November 2022. Activity remained low during November, though HVO reported that lava from the western vent continued to effuse into the active lava lake and onto the crater floor throughout the month. The rate of sulfur dioxide emissions during November ranged from 300-600 t/d, the higher amount of which occurred on 9 November.
Activity during December 2022. Similar low activity was reported during December, with lava effusing from the western vent into the active lava lake and onto the crater floor. During 4-5 December the active part of the lava lake was slightly variable in elevation and fluctuated within 1 m. On 9 December HVO reported that lava was no longer erupting from the western vent in the Halema’uma’u crater and that sulfur dioxide emissions had returned to near pre-eruption background levels; during 10-11 December, the lava lake had completely crusted over, and no incandescence was visible (figure 524). Time lapse camera images covering the 4-10 December showed that the crater floor showed weak deflation and no inflation. Some passive events of crustal overturning were reported during 14-15 December, which brought fresh incandescent lava to the lake surface. The sulfur dioxide emission rate was approximately 200 t/d on 14 December. A smaller overturn event on 17 December and another that occurred around 0000 and into the morning of 20 December were also detected. A small seismic swarm was later detected on 30 December.
Geologic Background. Kilauea overlaps the E flank of the massive Mauna Loa shield volcano in the island of Hawaii. Eruptions are prominent in Polynesian legends; written documentation since 1820 records frequent summit and flank lava flow eruptions interspersed with periods of long-term lava lake activity at Halemaumau crater in the summit caldera until 1924. The 3 x 5 km caldera was formed in several stages about 1,500 years ago and during the 18th century; eruptions have also originated from the lengthy East and Southwest rift zones, which extend to the ocean in both directions. About 90% of the surface of the basaltic shield volcano is formed of lava flows less than about 1,100 years old; 70% of the surface is younger than 600 years. The long-term eruption from the East rift zone between 1983 and 2018 produced lava flows covering more than 100 km2, destroyed hundreds of houses, and added new coastline.
Information Contacts: Hawaiian Volcano Observatory (HVO), U.S. Geological Survey, PO Box 51, Hawai'i National Park, HI 96718, USA (URL: http://hvo.wr.usgs.gov/).
Nyamulagira (DR Congo) — November 2023 Cite this Report
Nyamulagira
DR Congo
1.408°S, 29.2°E; summit elev. 3058 m
All times are local (unless otherwise noted)
Lava flows and thermal activity during May-October 2023
Nyamulagira (also known as Nyamuragira) is a shield volcano in the Democratic Republic of Congo with the summit truncated by a small 2 x 2.3 km caldera with walls up to about 100 m high. Documented eruptions have occurred within the summit caldera, as well as from numerous flank fissures and cinder cones. The current eruption period began in April 2018 and has more recently been characterized by summit crater lava flows and thermal activity (BGVN 48:05). This report describes lava flows and variable thermal activity during May through October 2023, based on information from the Observatoire Volcanologique de Goma (OVG) and various satellite data.
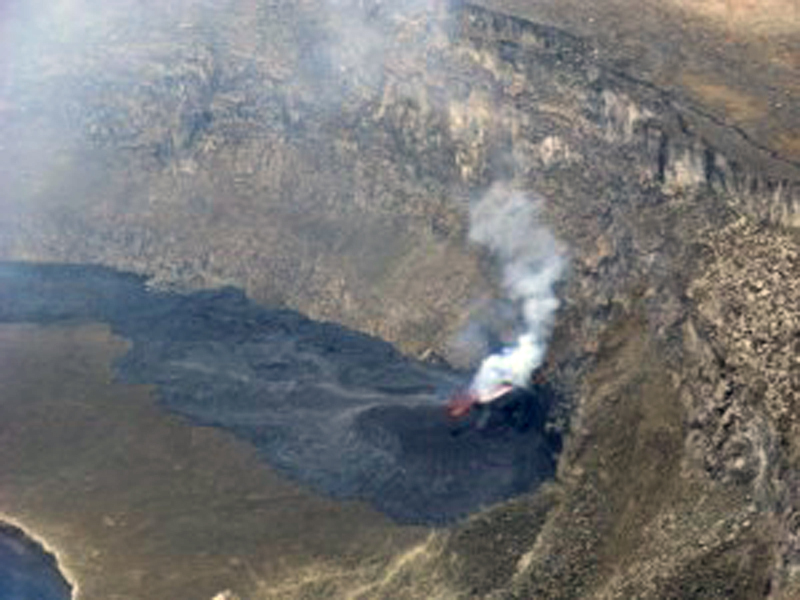
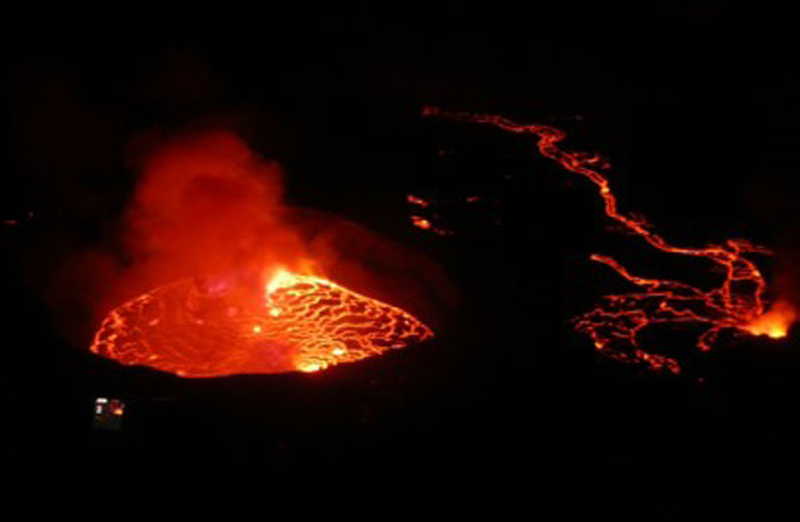
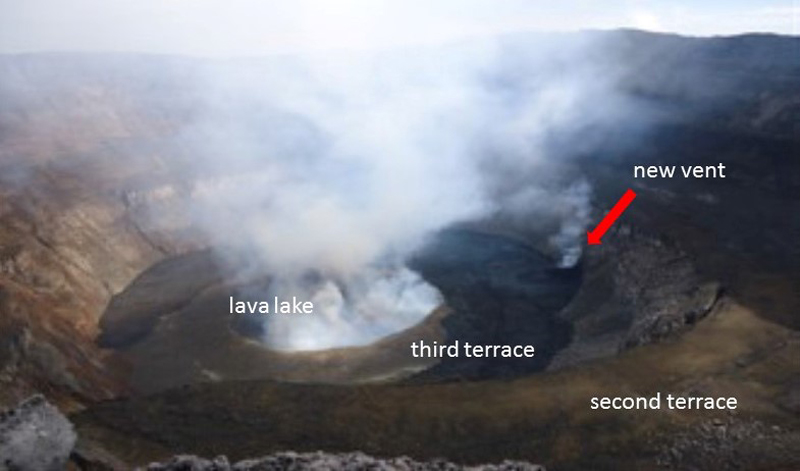
Lava lake activity continued during May. The MIROVA (Middle InfraRed Observation of Volcanic Activity) system recorded moderate-to-strong thermal activity throughout the reporting period; activity was more intense during May and October and relatively weaker from June through September (figure 95). The MODVOLC thermal algorithm, detected a total of 209 thermal alerts. There were 143 hotspots detected during May, eight during June, nine during September, and 49 during October. This activity was also reflected in infrared satellite images, where a lava flow was visible in the NW part of the crater on 7 May and strong activity was seen in the center of the crater on 4 October (figure 96). Another infrared satellite image taken on 12 May showed still active lava flows along the NW margin of the crater. According to OVG lava effusions were active during 7-29 May and moved to the N and NW parts of the crater beginning on 9 May. Strong summit crater incandescence was visible from Goma (27 km S) during the nights of 17, 19, and 20 May (figure 97). On 17 May there was an increase in eruptive activity, which peaked at 0100 on 20 May. Notable sulfur dioxide plumes drifted NW and W during 19-20 May (figure 98). Drone footage acquired in partnership with the USGS (United States Geological Survey) on 20 May captured images of narrow lava flows that traveled about 100 m down the W flank (figure 99). Data from the Rumangabo seismic station indicated a decreasing trend in activity during 17-21 May. Although weather clouds prevented clear views of the summit, a strong thermal signature on the NW flank was visible in an infrared satellite image on 22 May, based on an infrared satellite image. On 28 May the lava flows on the upper W flank began to cool and solidify. By 29 May seismicity returned to levels similar to those recorded before the 17 May increase. Lava effusion continued but was confined to the summit crater; periodic crater incandescence was observed.
Low-level activity was noted during June through October. On 1 June OVG reported that seismicity remained at lower levels and that crater incandescence had been absent for three days, though infrared satellite imagery showed continued lava effusion in the summit crater. The lava flows on the flanks covered an estimated 0.6 km2. Satellite imagery continued to show thermal activity confined to the lava lake through October (figure 96), although no lava flows or significant sulfur dioxide emissions were reported.
Geologic Background. Africa's most active volcano, Nyamulagira (also known as Nyamuragira), is a massive high-potassium basaltic shield about 25 km N of Lake Kivu and 13 km NNW of the steep-sided Nyiragongo volcano. The summit is truncated by a small 2 x 2.3 km caldera that has walls up to about 100 m high. Documented eruptions have occurred within the summit caldera, as well as from the numerous flank fissures and cinder cones. A lava lake in the summit crater, active since at least 1921, drained in 1938, at the time of a major flank eruption. Recent lava flows extend down the flanks more than 30 km from the summit as far as Lake Kivu; extensive lava flows from this volcano have covered 1,500 km2 of the western branch of the East African Rift.
Information Contacts: Observatoire Volcanologique de Goma (OVG), Departement de Geophysique, Centre de Recherche en Sciences Naturelles, Lwiro, D.S. Bukavu, DR Congo; Hawai'i Institute of Geophysics and Planetology (HIGP) - MODVOLC Thermal Alerts System, School of Ocean and Earth Science and Technology (SOEST), Univ. of Hawai'i, 2525 Correa Road, Honolulu, HI 96822, USA (URL: http://modis.higp.hawaii.edu/); MIROVA (Middle InfraRed Observation of Volcanic Activity), a collaborative project between the Universities of Turin and Florence (Italy) supported by the Centre for Volcanic Risk of the Italian Civil Protection Department (URL: http://www.mirovaweb.it/); NASA Global Sulfur Dioxide Monitoring Page, Atmospheric Chemistry and Dynamics Laboratory, NASA Goddard Space Flight Center (NASA/GSFC), 8800 Greenbelt Road, Goddard, Maryland, USA (URL: https://so2.gsfc.nasa.gov/); Copernicus Browser, Copernicus Data Space Ecosystem, European Space Agency (URL: https://dataspace.copernicus.eu/browser/); Charles Balagizi, Goma Volcano Observatory, Departement de Geophysique, Centre de Recherche en Sciences Naturelles, Lwiro, D.S. Bukavu, DR Congo.
Bagana (Papua New Guinea) — October 2023 Cite this Report
Bagana
Papua New Guinea
6.137°S, 155.196°E; summit elev. 1855 m
All times are local (unless otherwise noted)
Explosions, ash plumes, ashfall, and lava flows during April-September 2023
The remote volcano of Bagana is located in central Bougainville Island, Papua New Guinea. Recorded eruptions date back to 1842 and activity has consisted of effusive activity that has built a small lava dome in the summit crater and occasional explosions that produced pyroclastic flows. The most recent eruption has been ongoing since February 2000 and has produced occasional explosions, ash plumes, and lava flows. More recently, activity has been characterized by ongoing effusive activity and ash emissions (BGVN 48:04). This report updates activity from April through September 2023 that has consisted of explosions, ash plumes, ashfall, and lava flows, using information from the Darwin Volcanic Ash Advisory Center (VAAC) and satellite data.
An explosive eruption was reported on 7 July that generated a large gas-and-ash plume to high altitudes and caused significant ashfall in local communities; the eruption plume had reached upper tropospheric (16-18 km altitude) altitudes by 2200, according to satellite images. Sulfur dioxide plumes were detected in satellite images on 8 July and indicated that the plume was likely a mixture of gas, ice, and ash. A report issued by the Autonomous Bougainville Government (ABG) (Torokina District, Education Section) on 10 July noted that significant ash began falling during 2000-2100 on 7 July and covered most areas in the Vuakovi, Gotana (9 km SW), Koromaketo, Laruma (25 km W) and Atsilima (27 km NW) villages. Pyroclastic flows also occurred, according to ground-based reports; small deposits confined to one drainage were inspected by RVO during an overflight on 17 July and were confirmed to be from the 7 July event. Ashfall continued until 10 July and covered vegetation, which destroyed bushes and gardens and contaminated rivers and streams.
RVO reported another eruption on 14 July. The Darwin VAAC stated that an explosive event started around 0830 on 15 July and produced an ash plume that rose to 16.5 km altitude by 1000 and drifted N, according to satellite images. The plume continued to drift N and remained visible through 1900, and by 2150 it had dissipated.
Ashfall likely from both the 7 and 15 July events impacted about 8,111 people in Torokina (20 km SW), including Tsito/Vuakovi, Gotana, Koromaketo, Kenaia, Longkogari, Kenbaki, Piva (13 km SW), and Atsinima, and in the Tsitovi district, according to ABG. Significant ashfall was also reported in Ruruvu (22 km N) in the Wakunai District of Central Bougainville, though the thickness of these deposits could not be confirmed. An evacuation was called for the villages in Wakunai, where heavy ashfall had contaminated water sources; the communities of Ruruvu, Togarau, Kakarapaia, Karauturi, Atao, and Kuritaturi were asked to evacuate to a disaster center at the Wakunai District Station, and communities in Torokina were asked to evacuate to the Piva District station. According to a news article, more than 7,000 people needed temporary accommodations, with about 1,000 people in evacuation shelters. Ashfall had deposited over a broad area, contaminating water supplies, affecting crops, and collapsing some roofs and houses in rural areas. Schools were temporarily shut down. Intermittent ash emissions continued through the end of July and drifted NNW, NW, and SW. Fine ashfall was reported on the coast of Torokina, and ash plumes also drifted toward Laruma and Atsilima.
A small explosive eruption occurred at 2130 on 28 July that ejected material from the crater vents, according to reports from Torokina, in addition to a lava flow that contained two lobes. A second explosion was detected at 2157. Incandescence from the lava flow was visible from Piva as it descended the W flank around 2000 on 29 July (figure 47). The Darwin VAAC reported that a strong thermal anomaly was visible in satellite images during 30-31 July and that ash emissions rose to 2.4 km altitude and drifted WSW on 30 July. A ground report from RVO described localized emissions at 0900 on 31 July.
The Darwin VAAC reported that ash plumes were identified in satellite imagery at 0800 and 1220 on 12 August and rose to 2.1 km and 3 km altitude and drifted NW and W, respectively. A news report stated that aid was sent to more than 6,300 people that were adversely affected by the eruption. Photos taken during 17-19 August showed ash emissions rising no higher than 1 km above the summit and drifting SE. A small explosion generated an ash plume during the morning of 19 August. Deposits from small pyroclastic flows were also captured in the photos. Satellite images captured lava flows and pyroclastic flow deposits. Two temporary seismic stations were installed near Bagana on 17 August at distances of 7 km WSW (Vakovi station) and 11 km SW (Kepox station). The Kepox station immediately started to record continuous, low-frequency background seismicity.
Satellite data. Little to no thermal activity was detected during April through mid-July 2023; only one anomaly was recorded during early April and one during early June, according to MIROVA (Middle InfraRed Observation of Volcanic Activity) data (figure 48). Thermal activity increased in both power and frequency during mid-July through September, although there were still some short gaps in detected activity. MODVOLC also detected increased thermal activity during August; thermal hotspots were detected a total of five times on 19, 20, and 27 August. Weak thermal anomalies were also captured in infrared satellite images on clear weather days throughout the reporting period on 7, 12, and 17 April, 27 May, 1, 6, 16, and 31 July, and 19 September (figure 48); a strong thermal anomaly was visible on 31 July. Distinct sulfur dioxide plumes that drifted generally NW were intermittently captured by the TROPOMI instrument on the Sentinel-5P satellite and sometimes exceeded two Dobson Units (DUs) (figure 49).
Geologic Background. Bagana volcano, in a remote portion of central Bougainville Island, is frequently active. This massive symmetrical cone was largely constructed by an accumulation of viscous andesitic lava flows. The entire edifice could have been constructed in about 300 years at its present rate of lava production. Eruptive activity is characterized by non-explosive effusion of viscous lava that maintains a small lava dome in the summit crater, although occasional explosive activity produces pyroclastic flows. Lava flows with tongue-shaped lobes up to 50 m thick and prominent levees descend the flanks on all sides.
Information Contacts: Rabaul Volcano Observatory (RVO), Geohazards Management Division, Department of Mineral Policy and Geohazards Management (DMPGM), PO Box 3386, Kokopo, East New Britain Province, Papua New Guinea; Darwin Volcanic Ash Advisory Centre (VAAC), Bureau of Meteorology, Northern Territory Regional Office, PO Box 40050, Casuarina, NT 0811, Australia (URL: http://www.bom.gov.au/info/vaac/); MIROVA (Middle InfraRed Observation of Volcanic Activity), a collaborative project between the Universities of Turin and Florence (Italy) supported by the Centre for Volcanic Risk of the Italian Civil Protection Department (URL: http://www.mirovaweb.it/); Hawai'i Institute of Geophysics and Planetology (HIGP) - MODVOLC Thermal Alerts System, School of Ocean and Earth Science and Technology (SOEST), Univ. of Hawai'i, 2525 Correa Road, Honolulu, HI 96822, USA (URL: http://modis.higp.hawaii.edu/); NASA Global Sulfur Dioxide Monitoring Page, Atmospheric Chemistry and Dynamics Laboratory, NASA Goddard Space Flight Center (NASA/GSFC), 8800 Greenbelt Road, Goddard, Maryland, USA (URL: https://so2.gsfc.nasa.gov/); Copernicus Browser, Copernicus Data Space Ecosystem, European Space Agency (URL: https://dataspace.copernicus.eu/browser/); Autonomous Bougainville Government, P.O Box 322, Buka, AROB, PNG (URL: https://abg.gov.pg/); Andrew Tupper (Twitter: @andrewcraigtupp); Simon Carn, Geological and Mining Engineering and Sciences, Michigan Technological University, 1400 Townsend Drive, Houghton, MI 49931, USA (URL: http://www.volcarno.com/, Twitter: @simoncarn); Radio NZ (URL: https://www.rnz.co.nz/news/pacific/494464/more-than-7-000-people-in-bougainville-need-temporary-accommodation-after-eruption); USAID, 1300 Pennsylvania Ave, NW, Washington DC 20004, USA (URL: https://www.usaid.gov/pacific-islands/press-releases/aug-08-2023-united-states-provides-immediate-emergency-assistance-support-communities-affected-mount-bagana-volcanic-eruptions).
Mayon (Philippines) — October 2023 Cite this Report
Mayon
Philippines
13.257°N, 123.685°E; summit elev. 2462 m
All times are local (unless otherwise noted)
Lava flows, pyroclastic flows, ash emissions, and seismicity during April-September 2023
Mayon is located in the Philippines and has steep upper slopes capped by a small summit crater. Historical eruptions date back to 1616 CE that have been characterized by Strombolian eruptions, lava flows, pyroclastic flows, and mudflows. Eruptions mostly originated from a central conduit. Pyroclastic flows and mudflows have commonly descended many of the approximately 40 drainages that surround the volcano. The most recent eruption occurred during June through October 2022 and consisted of lava dome growth and gas-and-steam emissions (BGVN 47:12). A new eruption was reported during late April 2023 and has included lava flows, pyroclastic density currents, ash emissions, and seismicity. This report covers activity during April through September 2023 based on daily bulletins from the Philippine Institute of Volcanology and Seismology (PHIVOLCS).
During April through September 2023, PHIVOLCS reported near-daily rockfall events, frequent volcanic earthquakes, and sulfur dioxide measurements. Gas-and-steam emissions rose 100-900 m above the crater and drifted in different directions. Nighttime crater incandescence was often visible during clear weather and was accompanied by incandescent avalanches of material. Activity notably increased during June when lava flows were reported on the S, SE, and E flanks (figure 52). The MIROVA graph (Middle InfraRed Observation of Volcanic Activity) showed strong thermal activity coincident with these lava flows, which remained active through September (figure 53). According to the MODVOLC thermal algorithm, a total of 110 thermal alerts were detected during the reporting period: 17 during June, 40 during July, 27 during August, and 26 during September. During early June, pyroclastic density currents (PDCs) started to occur more frequently.
Low activity was reported during much of April and May; gas-and-steam emissions rose 100-900 m above the crater and generally drifted in different directions. A total of 52 rockfall events and 18 volcanic earthquakes were detected during April and 147 rockfall events and 13 volcanic events during May. Sulfur dioxide flux measurements ranged between 400-576 tons per day (t/d) during April, the latter of which was measured on 29 April and between 162-343 t/d during May, the latter of which was measured on 13 May.
Activity during June increased, characterized by lava flows, pyroclastic density currents (PDCs), crater incandescence and incandescent rockfall events, gas-and-steam emissions, and continued seismicity. Weather clouds often prevented clear views of the summit, but during clear days, moderate gas-and-steam emissions rose 100-2,500 m above the crater and drifted in multiple directions. A total of 6,237 rockfall events and 288 volcanic earthquakes were detected. The rockfall events often deposited material on the S and SE flanks within 700-1,500 m of the summit crater and ash from the events drifted SW, S, SE, NE, and E. Sulfur dioxide emissions ranged between 149-1,205 t/d, the latter of which was measured on 10 June. Short-term observations from EDM and electronic tiltmeter monitoring indicated that the upper slopes were inflating since February 2023. Longer-term ground deformation parameters based on EDM, precise leveling, continuous GPS, and electronic tilt monitoring indicated that the volcano remained inflated, especially on the NW and SE flanks. At 1000 on 5 June the Volcano Alert Level (VAL) was raised to 2 (on a 0-5 scale). PHIVOLCS noted that although low-level volcanic earthquakes, ground deformation, and volcanic gas emissions indicated unrest, the steep increase in rockfall frequency may indicate increased dome activity.
A total of 151 dome-collapse PDCs occurred during 8-9 and 11-30 June, traveled 500-2,000 m, and deposited material on the S flank within 2 km of the summit crater. During 8-9 June the VAL was raised to 3. At approximately 1947 on 11 June lava flow activity was reported; two lobes traveled within 500 m from the crater and deposited material on the S (Mi-isi), SE (Bonga), and E (Basud) flanks. Weak seismicity accompanied the lava flow and slight inflation on the upper flanks. This lava flow remained active through 30 June, moving down the S and SE flank as far as 2.5 km and 1.8 km, respectively and depositing material up to 3.3 km from the crater. During 15-16 June traces of ashfall from the PDCs were reported in Sitio Buga, Nabonton, City of Ligao and Purok, and San Francisco, Municipality of Guinobatan. During 28-29 June there were two PDCs generated by the collapse of the lava flow front, which generated a light-brown ash plume 1 km high. Satellite monitors detected significant concentrations of sulfur dioxide beginning on 29 June. On 30 June PDCs primarily affected the Basud Gully on the E flank, the largest of which occurred at 1301 and lasted eight minutes, based on the seismic record. Four PDCs generated between 1800 and 2000 that lasted approximately four minutes each traveled 3-4 km on the E flank and generated an ash plume that rose 1 km above the crater and drifted N and NW. Ashfall was recorded in Tabaco City.
Similar strong activity continued during July; slow lava effusion remained active on the S and SE flanks and traveled as far as 2.8 km and 2.8 km, respectively and material was deposited as far as 4 km from the crater. There was a total of 6,983 rockfall events and 189 PDCs that affected the S, SE, and E flanks. The volcano network detected a total of 2,124 volcanic earthquakes. Continuous gas-and-steam emissions rose 200-2,000 m above the crater and drifted in multiple directions. Sulfur dioxide emissions averaged 792-4,113 t/d, the latter of which was measured on 28 July. During 2-4 July three PDCs were generated from the collapse of the lava flow and resulting light brown plumes rose 200-300 m above the crater. Continuous tremor pulses were reported beginning at 1547 on 3 July through 7 July at 1200, at 2300 on 8 July and going through 0300 on 10 July, and at 2300 on 16 July, as recorded by the seismic network. During 6-9 July there were 10 lava flow-collapse-related PDCs that generated light brown plumes 300-500 m above the crater. During 10-11 July light ashfall was reported in some areas of Mabinit, Legazpi City, Budiao and Salvacion, Daraga, and Camalig, Albay. By 18 July the lava flow advanced 600 m on the E flank as well.
During 1733 on 18 July and 0434 on 19 July PHIVOLCS reported 30 “ashing” events, which are degassing events accompanied by audible thunder-like sounds and entrained ash at the crater, which produced short, dark plumes that drifted SW. These events each lasted 20-40 seconds, and plume heights ranged from 150-300 m above the crater, as recorded by seismic, infrasound, visual, and thermal monitors. Three more ashing events occurred during 19-20 July. Short-term observations from electronic tilt and GPS monitoring indicate deflation on the E lower flanks in early July and inflation on the NW middle flanks during the third week of July. Longer-term ground deformation parameters from EDM, precise leveling, continuous GPS, and electronic tilt monitoring indicated that the volcano was still generally inflated relative to baseline levels. A short-lived lava pulse lasted 28 seconds at 1956 on 21 July, which was accompanied by seismic and infrasound signals. By 22 July, the only lava flow that remained active was on the SE flank, and continued to extend 3.4 km, while those on the S and E flanks weakened markedly. One ashing event was detected during 30-31 July, whereas there were 57 detected during 31 July-1 August; according to PHIVOLCS beginning at approximately 1800 on 31 July eruptive activity was dominated by phases of intermittent ashing, as well as increased in the apparent rates of lava effusion from the summit crater. The ashing phases consisted of discrete events recorded as low-frequency volcanic earthquakes (LFVQ) typically 30 seconds in duration, based on seismic and infrasound signals. Gray ash plume rose 100 m above the crater and generally drifted NE. Shortly after these ashing events began, new lava began to effuse rapidly from the crater, feeding the established flowed on the SE, E, and E flanks and generating frequent rockfall events.
Intensified unrest persisted during August. There was a total of 4,141 rockfall events, 2,881 volcanic earthquakes, which included volcanic tremor events, 32 ashing events, and 101 PDCs detected throughout the month. On clear weather days, gas-and-steam emissions rose 300-1,500 m above the crater and drifted in different directions (figure 54). Sulfur dioxide emissions averaged 735-4,756 t/d, the higher value of which was measured on 16 August. During 1-2 August the rate of lava effusion decreased, but continued to feed the flows on the SE, S, and E flanks, maintaining their advances to 3.4 km, 2.8 km, and 1.1 km from the crater, respectively (figure 55). Rockfall and PDCs generated by collapses at the lava flow margins and from the summit dome deposited material within 4 km of the crater. During 3-4 August there were 10 tremor events detected that lasted 1-4 minutes. Short-lived lava pulse lasted 35 seconds and was accompanied by seismic and infrasound signals at 0442 on 6 August. Seven collapses were recorded at the front of the lava flow during 12-14 August.
During September, similar activity of slow lava effusion, PDCs, gas-and-steam emissions, and seismicity continued. There was a total of 4,452 rockfall events, 329 volcanic earthquakes, which included volcanic tremor events, two ashing events, and 85 PDCs recorded throughout the month. On clear weather days, gas-and-steam emissions rose 100-1,500 m above the crater and drifted in multiple directions. Sulfur dioxide emissions averaged 609-2,252 t/d, the higher average of which was measured on 6 September. Slow lava effusion continued advancing on the SE, S, and E flanks, maintaining lengths of 3.4 km, 2.8 km, and 1.1 km, respectively. Rockfall and PDC events generated by collapses along the lava flow margins and at the summit dome deposited material within 4 km of the crater.
Geologic Background. Symmetrical Mayon, which rises above the Albay Gulf NW of Legazpi City, is the most active volcano of the Philippines. The steep upper slopes are capped by a small summit crater. Recorded eruptions since 1616 CE range from Strombolian to basaltic Plinian, with cyclical activity beginning with basaltic eruptions, followed by longer periods of andesitic lava flows. Eruptions occur predominately from the central conduit and have also produced lava flows that travel far down the flanks. Pyroclastic density currents and mudflows have commonly swept down many of the approximately 40 ravines that radiate from the summit and have often damaged populated lowland areas. A violent eruption in 1814 killed more than 1,200 people and devastated several towns.
Information Contacts: Philippine Institute of Volcanology and Seismology (PHIVOLCS), Department of Science and Technology, University of the Philippines Campus, Diliman, Quezon City, Philippines (URL: http://www.phivolcs.dost.gov.ph/); MIROVA (Middle InfraRed Observation of Volcanic Activity), a collaborative project between the Universities of Turin and Florence (Italy) supported by the Centre for Volcanic Risk of the Italian Civil Protection Department (URL: http://www.mirovaweb.it/); Hawai'i Institute of Geophysics and Planetology (HIGP) - MODVOLC Thermal Alerts System, School of Ocean and Earth Science and Technology (SOEST), Univ. of Hawai'i, 2525 Correa Road, Honolulu, HI 96822, USA (URL: http://modis.higp.hawaii.edu/); Copernicus Browser, Copernicus Data Space Ecosystem, European Space Agency (URL: https://dataspace.copernicus.eu/browser/); William Rogers, Legazpi City, Albay Province, Philippines.
Nishinoshima (Japan) — October 2023 Cite this Report
Nishinoshima
Japan
27.247°N, 140.874°E; summit elev. 100 m
All times are local (unless otherwise noted)
Eruption plumes and gas-and-steam plumes during May-August 2023
Nishinoshima, located about 1,000 km S of Tokyo, is a small island in the Ogasawara Arc in Japan. The island is the summit of a massive submarine volcano that has prominent submarine peaks to the S, W, and NE. Eruptions date back to 1973 and the current eruption period began in October 2022. Recent activity has consisted of small ash plumes and fumarolic activity (BGVN 48:07). This report covers activity during May through August 2023, using information from monthly reports of the Japan Meteorological Agency (JMA) monthly reports and satellite data.
Activity during May through June was relatively low. The Japan Coast Guard (JCG) did overflights on 14 and 22 June and reported white gas-and-steam emissions rising 600 m and 1,200 m from the central crater of the pyroclastic cone, respectively (figure 125). In addition, multiple white gas-and-steam emissions rose from the inner rim of the W side of the crater and from the SE flank of the pyroclastic cone. Discolored brown-to-green water was observed around almost the entire perimeter of the island; on 22 June light green discolored water was observed off the S coast of the island.
Observations from the Himawari meteorological satellite confirmed an eruption on 9 and 10 July. An eruption plume rose 1.6 km above the crater and drifted N around 1300 on 9 July. Satellite images acquired at 1420 and 2020 on 9 July and at 0220 on 10 July showed continuing emissions that rose 1.3-1.6 km above the crater and drifted NE and N. The Tokyo VAAC reported that an ash plume seen by a pilot and identified in a satellite image at 0630 on 21 July rose to 3 km altitude and drifted S.
Aerial observations conducted by JCG on 8 August showed a white-and-gray plume rising from the central crater of the pyroclastic cone, and multiple white gas-and-steam emissions were rising from the inner edge of the western crater and along the NW-SE flanks of the island (figure 126). Brown-to-green discolored water was also noted around the perimeter of the island.
Intermittent low-to-moderate power thermal anomalies were recorded in the MIROVA graph (Middle InfraRed Observation of Volcanic Activity), showing an increase in both frequency and power beginning in July (figure 127). This increase in activity coincides with eruptive activity on 9 and 10 July, characterized by eruption plumes. According to the MODVOLC thermal alert algorithm, one thermal hotspot was recorded on 20 July. Weak thermal anomalies were also detected in infrared satellite imagery, accompanied by strong gas-and-steam plumes (figure 128).
Geologic Background. The small island of Nishinoshima was enlarged when several new islands coalesced during an eruption in 1973-74. Multiple eruptions that began in 2013 completely covered the previous exposed surface and continued to enlarge the island. The island is the summit of a massive submarine volcano that has prominent peaks to the S, W, and NE. The summit of the southern cone rises to within 214 m of the ocean surface 9 km SSE.
Information Contacts: Japan Meteorological Agency (JMA), 1-3-4 Otemachi, Chiyoda-ku, Tokyo 100-8122, Japan (URL: http://www.jma.go.jp/jma/indexe.html); Tokyo Volcanic Ash Advisory Center (VAAC), 1-3-4 Otemachi, Chiyoda-ku, Tokyo 100-8122, Japan (URL: http://ds.data.jma.go.jp/svd/vaac/data/); MIROVA (Middle InfraRed Observation of Volcanic Activity), a collaborative project between the Universities of Turin and Florence (Italy) supported by the Centre for Volcanic Risk of the Italian Civil Protection Department (URL: http://www.mirovaweb.it/); Copernicus Browser, Copernicus Data Space Ecosystem, European Space Agency (URL: https://dataspace.copernicus.eu/browser/).
Krakatau (Indonesia) — October 2023 Cite this Report
Krakatau
Indonesia
6.1009°S, 105.4233°E; summit elev. 285 m
All times are local (unless otherwise noted)
White gas-and-steam plumes and occasional ash plumes during May-August 2023
Krakatau is located in the Sunda Strait between Java and Sumatra, Indonesia. Caldera collapse during the catastrophic 1883 eruption destroyed Danan and Perbuwatan cones and left only a remnant of Rakata. The post-collapse cone of Anak Krakatau (Child of Krakatau) was constructed within the 1883 caldera at a point between the former Danan and Perbuwatan cones; it has been the site of frequent eruptions since 1927. The current eruption period began in May 2021 and has recently consisted of Strombolian eruptions and ash plumes (BGVN 48:07). This report describes lower levels of activity consisting of ash and white gas-and-steam plumes during May through August 2023, based on information provided by the Indonesian Center for Volcanology and Geological Hazard Mitigation, referred to as Pusat Vulkanologi dan Mitigasi Bencana Geologi (PVMBG), MAGMA Indonesia, and satellite data.
Activity was relatively low during May and June. Daily white gas-and-steam emissions rose 25-200 m above the crater and drifted in different directions. Five ash plumes were detected at 0519 on 10 May, 1241 on 11 May, 0920 on 12 May, 2320 on 12 May, and at 0710 on 13 May, and rose 1-2.5 km above the crater and drifted SW. A webcam image taken on 12 May showed ejection of incandescent material above the vent. A total of nine ash plumes were detected during 6-11 June: at 1434 and 00220 on 6 and 7 June the ash plumes rose 500 m above the crater and drifted NW, at 1537 on 8 June the ash plume rose 1 km above the crater and drifted SW, at 0746 and at 0846 on 9 June the ash plumes rose 800 m and 3 km above the crater and drifted SW, respectively, at 0423, 1431, and 1750 on 10 June the ash plumes rose 2 km, 1.5 km, and 3.5 km above the crater and drifted NW, respectively, and at 0030 on 11 June an ash plume rose 2 km above the crater and drifted NW. Webcam images taken on 10 and 11 June at 0455 and 0102, respectively, showed incandescent material ejected above the vent. On 19 June an ash plume at 0822 rose 1.5 km above the crater and drifted SE.
Similar low activity of white gas-and-steam emissions and few ash plumes were reported during July and August. Daily white gas-and-steam emissions rose 25-300 m above the crater and drifted in multiple directions. Three ash plumes were reported at 0843, 0851, and 0852 on 20 July that rose 500-2,000 m above the crater and drifted NW.
The MIROVA (Middle InfraRed Observation of Volcanic Activity) graph of MODIS thermal anomaly data showed intermittent low-to-moderate power thermal anomalies during May through August 2023 (figure 140). Although activity was often obscured by weather clouds, a thermal anomaly was visible in an infrared satellite image of the crater on 12 May, accompanied by an eruption plume that drifted SW (figure 141).
Geologic Background. The renowned Krakatau (frequently mis-named as Krakatoa) volcano lies in the Sunda Strait between Java and Sumatra. Collapse of an older edifice, perhaps in 416 or 535 CE, formed a 7-km-wide caldera. Remnants of that volcano are preserved in Verlaten and Lang Islands; subsequently the Rakata, Danan, and Perbuwatan cones were formed, coalescing to create the pre-1883 Krakatau Island. Caldera collapse during the catastrophic 1883 eruption destroyed Danan and Perbuwatan, and left only a remnant of Rakata. This eruption caused more than 36,000 fatalities, most as a result of tsunamis that swept the adjacent coastlines of Sumatra and Java. Pyroclastic surges traveled 40 km across the Sunda Strait and reached the Sumatra coast. After a quiescence of less than a half century, the post-collapse cone of Anak Krakatau (Child of Krakatau) was constructed within the 1883 caldera at a point between the former Danan and Perbuwatan cones. Anak Krakatau has been the site of frequent eruptions since 1927.
Information Contacts: Pusat Vulkanologi dan Mitigasi Bencana Geologi (PVMBG, also known as Indonesian Center for Volcanology and Geological Hazard Mitigation, CVGHM), Jalan Diponegoro 57, Bandung 40122, Indonesia (URL: http://www.vsi.esdm.go.id/); MAGMA Indonesia, Kementerian Energi dan Sumber Daya Mineral (URL: https://magma.esdm.go.id/v1); MIROVA (Middle InfraRed Observation of Volcanic Activity), a collaborative project between the Universities of Turin and Florence (Italy) supported by the Centre for Volcanic Risk of the Italian Civil Protection Department (URL: http://www.mirovaweb.it/); Copernicus Browser, Copernicus Data Space Ecosystem, European Space Agency (URL: https://dataspace.copernicus.eu/browser/).
Villarrica (Chile) — October 2023 Cite this Report
Villarrica
Chile
39.42°S, 71.93°W; summit elev. 2847 m
All times are local (unless otherwise noted)
Strombolian activity, gas-and-ash emissions, and crater incandescence during April-September 2023
Villarrica, in central Chile, consists of a 2-km-wide caldera that formed about 3,500 years ago and is located at the base of the presently active cone at the NW margin of a 6-km-wide caldera. Historical eruptions eruptions date back to 1558 and have been characterized by mild-to-moderate explosive activity with occasional lava effusions. The current eruption period began in December 2014 and has recently consisted of nighttime crater incandescence, ash emissions, and seismicity (BGVN 48:04). This report covers activity during April through September 2023 and describes occasional Strombolian activity, gas-and-ash emissions, and nighttime crater incandescence. Information for this report primarily comes from the Southern Andes Volcano Observatory (Observatorio Volcanológico de Los Andes del Sur, OVDAS), part of Chile's National Service of Geology and Mining (Servicio Nacional de Geología y Minería, SERNAGEOMIN) and satellite data.
Seismicity during April consisted of long period (LP) events and tremor (TRE); a total of 9,413 LP-type events and 759 TR-type events were detected throughout the month. Nighttime crater incandescence persisted and was visible in the degassing column. Sulfur dioxide data was obtained using Differential Absorption Optical Spectroscopy Equipment (DOAS) that showed an average value of 1,450 ± 198 tons per day (t/d) during 1-15 April and 1,129 ± 201 t/d during 16-30 April, with a maximum daily value of 2,784 t/d on 9 April. Gas-and-steam emissions of variable intensities rose above the active crater as high as 1.3 km above the crater on 13 April. Strombolian explosions were not observed and there was a slight decrease in the lava lake level.
There were 14,123 LP-type events and 727 TR-type events detected during May. According to sulfur dioxide measurements taken with DOAS equipment, the active crater emitted an average value of 1,826 ± 482 t/d during 1-15 May and 912 ± 41 t/d during 16-30 May, with a daily maximum value of 5,155 t/d on 13 May. Surveillance cameras showed continuous white gas-and-steam emissions that rose as high as 430 m above the crater on 27 May. Nighttime incandescence illuminated the gas column less than 300 m above the crater rim was and no pyroclastic emissions were reported. A landslide was identified on 13 May on the E flank of the volcano 50 m from the crater rim and extending 300 m away; SERNAGEOMIN noted that this event may have occurred on 12 May. During the morning of 27 and 28 May minor Strombolian explosions characterized by incandescent ejecta were recorded at the crater rim; the last reported Strombolian explosions had occurred at the end of March.
Seismic activity during June consisted of five volcano-tectonic (VT)-type events, 21,606 LP-type events, and 2,085 TR-type events. The average value of sulfur dioxide flux obtained by DOAS equipment was 1,420 ± 217 t/d during 1-15 June and 2,562 ± 804 t/d, with a maximum daily value of 4,810 t/d on 17 June. White gas-and-steam emissions rose less than 480 m above the crater; frequent nighttime crater incandescence was reflected in the degassing plume. On 12 June an emission rose 100 m above the crater and drifted NNW. On 15 June one or several emissions resulted in ashfall to the NE as far as 5.5 km from the crater, based on a Skysat satellite image. Several Strombolian explosions occurred within the crater; activity on 15 June was higher energy and ejected blocks 200-300 m on the NE slope. Surveillance cameras showed white gas-and-steam emissions rising 480 m above the crater on 16 June. On 19 and 24 June low-intensity Strombolian activity was observed, ejecting material as far as 200 m from the center of the crater to the E.
During July, seismicity included 29,319 LP-type events, 3,736 TR-type events, and two VT-type events. DOAS equipment recorded two days of sulfur dioxide emissions of 4,220 t/d and 1,009 t/d on 1 and 13 July, respectively. Constant nighttime incandescence was also recorded and was particularly noticeable when accompanied by eruptive columns on 12 and 16 July. Minor explosive events were detected in the crater. According to Skysat satellite images taken on 12, 13, and 16 July, ashfall deposits were identified 155 m S of the crater. According to POVI, incandescence was visible from two vents on the crater floor around 0336 on 12 July. Gas-and-ash emissions rose as high as 1.2 km above the crater on 13 July and drifted E and NW. A series of gas-and-steam pulses containing some ash deposited material on the upper E flank around 1551 on 13 July. During 16-31 July, average sulfur dioxide emissions of 1,679 ± 406 t/d were recorded, with a maximum daily value of 2,343 t/d on 28 July. Fine ash emissions were also reported on 16, 17, and 23 July.
Seismicity persisted during August, characterized by 27,011 LP-type events, 3,323 TR-type events, and three VT-type events. The average value of sulfur dioxide measurements taken during 1-15 August was 1,642 ± 270 t/d and 2,207 ± 4,549 t/d during 16-31 August, with a maximum daily value of 3,294 t/d on 27 August. Nighttime crater incandescence remained visible in degassing columns. White gas-and-steam emissions rose 480 m above the crater on 6 August. According to a Skysat satellite image from 6 August, ash accumulation was observed proximal to the crater and was mainly distributed toward the E slope. White gas-and-steam emissions rose 320 m above the crater on 26 August. Nighttime incandescence and Strombolian activity that generated ash emissions were reported on 27 August.
Seismicity during September was characterized by five VT-type events, 12,057 LP-type events, and 2,058 TR-type events. Nighttime incandescence persisted. On 2 September an ash emission rose 180 m above the crater and drifted SE at 1643 (figure 125) and a white gas-and-steam plume rose 320 m above the crater. According to the Buenos Aires VAAC, periods of continuous gas-and-ash emissions were visible in webcam images from 1830 on 2 September to 0110 on 3 September. Strombolian activity was observed on 2 September and during the early morning of 3 September, the latter event of which generated an ash emission that rose 60 m above the crater and drifted 100 m from the center of the crater to the NE and SW. Ashfall was reported to the SE and S as far as 750 m from the crater. The lava lake was active during 3-4 September and lava fountaining was visible for the first time since 26 March 2023, according to POVI. Fountains captured in webcam images at 2133 on 3 September and at 0054 on 4 September rose as high as 60 m above the crater rim and ejected material onto the upper W flank. Sulfur dioxide flux of 1,730 t/d and 1,281 t/d was measured on 3 and 4 September, respectively, according to data obtained by DOAS equipment.
Strong Strombolian activity and larger gas-and-ash plumes were reported during 18-20 September. On 18 September activity was also associated with energetic LP-type events and notable sulfur dioxide fluxes (as high as 4,277 t/d). On 19 September Strombolian activity and incandescence were observed. On 20 September at 0914 ash emissions rose 50 m above the crater and drifted SSE, accompanied by Strombolian activity that ejected material less than 100 m SSE, causing fall deposits on that respective flank. SERNAGEOMIN reported that a Planet Scope satellite image taken on 20 September showed the lava lake in the crater, measuring 32 m x 35 m and an area of 0.001 km2. Several ash emissions were recorded at 0841, 0910, 1251, 1306, 1312, 1315, and 1324 on 23 September and rose less than 150 m above the crater. The sulfur dioxide flux value was 698 t/d on 23 September and 1,097 t/d on 24 September. On 24 September the Volcanic Alert Level (VAL) was raised to Orange (the third level on a four-color scale). SENAPRED maintained the Alert Level at Yellow (the middle level on a three-color scale) for the communities of Villarrica, Pucón (16 km N), Curarrehue, and Panguipulli.
During 24-25 September there was an increase in seismic energy (observed at TR-events) and acoustic signals, characterized by 1 VT-type event, 213 LP-type events, and 124 TR-type events. Mainly white gas-and-steam emissions, in addition to occasional fine ash emissions were recorded. During the early morning of 25 September Strombolian explosions were reported and ejected material 250 m in all directions, though dominantly toward the NW. On 25 September the average value of sulfur dioxide flux was 760 t/d. Seismicity during 25-30 September consisted of five VT-type events, 1,937 LP-type events, and 456 TR-type events.
During 25-29 September moderate Strombolian activity was observed and ejected material as far as the crater rim. In addition, ash pulses lasting roughly 50 minutes were observed around 0700 and dispersed ENE. During 26-27 September a TR episode lasted 6.5 hours and was accompanied by discrete acoustic signals. Satellite images from 26 September showed a spatter cone on the crater floor with one vent that measured 10 x 14 m and a smaller vent about 35 m NE of the cone. SERNAGEOMIN reported an abundant number of bomb-sized blocks up to 150 m from the crater, as well as impact marks on the snow, which indicated explosive activity. A low-altitude ash emission was observed drifting NW around 1140 on 28 September, based on webcam images. Between 0620 and 0850 on 29 September an ash emission rose 60 m above the crater and drifted NW. During an overflight taken around 1000 on 29 September scientists observed molten material in the vent, a large accumulation of pyroclasts inside the crater, and energetic degassing, some of which contained a small amount of ash. Block-sized pyroclasts were deposited on the internal walls and near the crater, and a distal ash deposit was also visible. The average sulfur dioxide flux measured on 28 September was 344 t/d. Satellite images taken on 29 September ashfall was deposited roughly 3 km WNW from the crater and nighttime crater incandescence remained visible. The average sulfur dioxide flux value from 29 September was 199 t/d. On 30 September at 0740 a pulsating ash emission rose 1.1 km above the crater and drifted NNW (figure 126). Deposits on the S flank extended as far as 4.5 km from the crater rim, based on satellite images from 30 September.
Infrared MODIS satellite data processed by MIROVA (Middle InfraRed Observation of Volcanic Activity) showed intermittent thermal activity during April through September, with slightly stronger activity detected during late September (figure 127). Small clusters of thermal activity were detected during mid-June, early July, early August, and late September. According to the MODVOLC thermal alert system, a total of four thermal hotspots were detected on 7 July and 3 and 23 September. This activity was also intermittently captured in infrared satellite imagery on clear weather days (figure 128).
Geologic Background. The glacier-covered Villarrica stratovolcano, in the northern Lakes District of central Chile, is ~15 km south of the city of Pucon. A 2-km-wide caldera that formed about 3,500 years ago is located at the base of the presently active, dominantly basaltic to basaltic andesite cone at the NW margin of a 6-km-wide Pleistocene caldera. More than 30 scoria cones and fissure vents are present on the flanks. Plinian eruptions and pyroclastic flows that have extended up to 20 km from the volcano were produced during the Holocene. Lava flows up to 18 km long have issued from summit and flank vents. Eruptions documented since 1558 CE have consisted largely of mild-to-moderate explosive activity with occasional lava effusion. Glaciers cover 40 km2 of the volcano, and lahars have damaged towns on its flanks.
Information Contacts: Servicio Nacional de Geología y Minería (SERNAGEOMIN), Observatorio Volcanológico de Los Andes del Sur (OVDAS), Avda Sta María No. 0104, Santiago, Chile (URL: http://www.sernageomin.cl/); Proyecto Observación Villarrica Internet (POVI) (URL: http://www.povi.cl/); Sistema y Servicio Nacional de Prevención y Repuesta Ante Desastres (SENAPRED), Av. Beauchef 1671, Santiago, Chile (URL: https://web.senapred.cl/); Buenos Aires Volcanic Ash Advisory Center (VAAC), Servicio Meteorológico Nacional-Fuerza Aérea Argentina, 25 de mayo 658, Buenos Aires, Argentina (URL: http://www.smn.gov.ar/vaac/buenosaires/inicio.php); MIROVA (Middle InfraRed Observation of Volcanic Activity), a collaborative project between the Universities of Turin and Florence (Italy) supported by the Centre for Volcanic Risk of the Italian Civil Protection Department (URL: http://www.mirovaweb.it/); Hawai'i Institute of Geophysics and Planetology (HIGP) - MODVOLC Thermal Alerts System, School of Ocean and Earth Science and Technology (SOEST), Univ. of Hawai'i, 2525 Correa Road, Honolulu, HI 96822, USA (URL: http://modis.higp.hawaii.edu/); Copernicus Browser, Copernicus Data Space Ecosystem, European Space Agency (URL: https://dataspace.copernicus.eu/browser/).
Merapi (Indonesia) — October 2023 Cite this Report
Merapi
Indonesia
7.54°S, 110.446°E; summit elev. 2910 m
All times are local (unless otherwise noted)
Frequent incandescent avalanches during April-September 2023
Merapi, located just north of the major city of Yogyakarta in central Java, Indonesia, has had activity within the last 20 years characterized by pyroclastic flows and lahars accompanying growth and collapse of the steep-sided active summit lava dome. The current eruption period began in late December 2020 and has more recently consisted of ash plumes, intermittent incandescent avalanches of material, and pyroclastic flows (BGVN 48:04). This report covers activity during April through September 2023, based on information from Balai Penyelidikan dan Pengembangan Teknologi Kebencanaan Geologi (BPPTKG), the Center for Research and Development of Geological Disaster Technology, a branch of PVMBG which specifically monitors Merapi. Additional information comes from the Pusat Vulkanologi dan Mitigasi Bencana Geologi (PVMBG, also known as Indonesian Center for Volcanology and Geological Hazard Mitigation, CVGHM), MAGMA Indonesia, the Darwin Volcanic Ash Advisory Centre (VAAC), and various satellite data.
Activity during April through September 2023 primarily consisted of incandescent avalanches of material that mainly affected the SW and W flanks and traveled as far as 2.3 km from the summit (table 25) and white gas-and-steam emissions that rose 10-1,000 m above the crater.
Table 25. Monthly summary of avalanches and avalanche distances recorded at Merapi during April through September 2023. The number of reported avalanches does not include instances where possible avalanches were heard but could not be visually confirmed as a result of inclement weather. Data courtesy of BPPTKG (April-September 2023 daily reports).
| Month |
Average number of avalanches per day |
Distance avalanches traveled (m) |
| Apr 2023 |
19 |
1,200-2,000 |
| May 2023 |
22 |
500-2,000 |
| Jun 2023 |
18 |
1,200-2,000 |
| Jul 2023 |
30 |
300-2,000 |
| Aug 2023 |
25 |
400-2,300 |
| Sep 2023 |
23 |
600-2,000 |
BPPTKG reported that during April and May white gas-and-steam emissions rose 10-750 m above the crater, incandescent avalanches descended 500-2,000 m on the SW and W flanks (figure 135). Cloudy weather often prevented clear views of the summit, and sometimes avalanches could not be confirmed. According to a webcam image, a pyroclastic flow was visible on 17 April at 0531. During the week of 28 April and 4 May a pyroclastic flow was reported on the SW flank, traveling up to 2.5 km. According to a drone overflight taken on 17 May the SW lava dome volume was an estimated 2,372,800 cubic meters and the dome in the main crater was an estimated 2,337,300 cubic meters.
During June and July similar activity persisted with white gas-and-steam emissions rising 10-350 m above the crater and frequent incandescent avalanches that traveled 300-2,000 m down the SW, W, and S flanks (figure 136). Based on an analysis of aerial photos taken on 24 June the volume of the SW lava dome was approximately 2.5 million cubic meters. A pyroclastic flow was observed on 5 July that traveled 2.7 km on the SW flank. According to the Darwin VAAC multiple minor ash plumes were identified in satellite images on 19 July that rose to 3.7 km altitude and drifted S and SW. During 22, 25, and 26 July a total of 17 avalanches descended as far as 1.8 km on the S flank.
Frequent white gas-and-steam emissions continued during August and September, rising 10-450 m above the crater. Incandescent avalanches mainly affected the SW and W flanks and traveled 400-2,300 m from the vent (figure 137). An aerial survey conducted on 10 August was analyzed and reported that estimates of the SW dome volume was 2,764,300 cubic meters and the dome in the main crater was 2,369,800 cubic meters.
Frequent and moderate-power thermal activity continued throughout the reporting period, according to a MIROVA (Middle InfraRed Observation of Volcanic Activity) analysis of MODIS satellite data (figure 138). There was an increase in the number of detected anomalies during mid-May. The MODVOLC thermal algorithm recorded a total of 47 thermal hotspots: six during April, nine during May, eight during June, 15 during July, four during August, and five during September. Some of this activity was captured in infrared satellite imagery on clear weather days, sometimes accompanied by incandescent material on the SW flank (figure 139).
Geologic Background. Merapi, one of Indonesia's most active volcanoes, lies in one of the world's most densely populated areas and dominates the landscape immediately north of the major city of Yogyakarta. It is the youngest and southernmost of a volcanic chain extending NNW to Ungaran volcano. Growth of Old Merapi during the Pleistocene ended with major edifice collapse perhaps about 2,000 years ago, leaving a large arcuate scarp cutting the eroded older Batulawang volcano. Subsequent growth of the steep-sided Young Merapi edifice, its upper part unvegetated due to frequent activity, began SW of the earlier collapse scarp. Pyroclastic flows and lahars accompanying growth and collapse of the steep-sided active summit lava dome have devastated cultivated lands on the western-to-southern flanks and caused many fatalities.
Information Contacts: Balai Penyelidikan dan Pengembangan Teknologi Kebencanaan Geologi (BPPTKG), Center for Research and Development of Geological Disaster Technology (URL: http://merapi.bgl.esdm.go.id/, Twitter: @BPPTKG); MAGMA Indonesia, Kementerian Energi dan Sumber Daya Mineral (URL: https://magma.esdm.go.id/v1); Pusat Vulkanologi dan Mitigasi Bencana Geologi (PVMBG, also known as Indonesian Center for Volcanology and Geological Hazard Mitigation, CVGHM), Jalan Diponegoro 57, Bandung 40122, Indonesia (URL: http://www.vsi.esdm.go.id/); Darwin Volcanic Ash Advisory Centre (VAAC), Bureau of Meteorology, Northern Territory Regional Office, PO Box 40050, Casuarina, NT 0811, Australia (URL: http://www.bom.gov.au/info/vaac/); MIROVA (Middle InfraRed Observation of Volcanic Activity), a collaborative project between the Universities of Turin and Florence (Italy) supported by the Centre for Volcanic Risk of the Italian Civil Protection Department (URL: http://www.mirovaweb.it/); Hawai'i Institute of Geophysics and Planetology (HIGP) - MODVOLC Thermal Alerts System, School of Ocean and Earth Science and Technology (SOEST), Univ. of Hawai'i, 2525 Correa Road, Honolulu, HI 96822, USA (URL: http://modis.higp.hawaii.edu/); Copernicus Browser, Copernicus Data Space Ecosystem, European Space Agency (URL: https://dataspace.copernicus.eu/browser/); Øystein Lund Andersen (URL: https://www.oysteinlundandersen.com/, https://twitter.com/oysteinvolcano).
Ebeko
Russia
50.686°N, 156.014°E; summit elev. 1103 m
All times are local (unless otherwise noted)
Moderate explosive activity with ash plumes continued during June-November 2023
Ebeko, located on the N end of Paramushir Island in Russia’s Kuril Islands just S of the Kamchatka Peninsula, consists of three summit craters along a SSW-NNE line at the northern end of a complex of five volcanic cones. Observed eruptions date back to the late 18th century and have been characterized as small-to-moderate explosions from the summit crater, accompanied by intense fumarolic activity. The current eruptive period began in June 2022, consisting of frequent explosions, ash plumes, and thermal activity (BGVN 47:10, 48:06). This report covers similar activity during June-November 2023, based on information from the Kamchatka Volcanic Eruptions Response Team (KVERT) and satellite data.
Moderate explosive activity continued during June-November 2023 (figures 50 and 51). According to visual data from Severo-Kurilsk, explosions sent ash 2-3.5 km above the summit (3-4.5 km altitude) during most days during June through mid-September. Activity after mid-September was slightly weaker, with ash usually reaching less than 2 km above the summit. According to KVERT the volcano in October and November was, with a few exceptions, either quiet or obscured by clouds that prevented satellite observations. KVERT issued Volcano Observatory Notices for Aviation (VONA) on 8 and 12 June, 13 and 22 July, 3 and 21 August, and 31 October warning of potential aviation hazards from ash plumes drifting 3-15 km from the volcano. Based on satellite data, KVERT reported a persistent thermal anomaly whenever weather clouds permitted viewing.
Geologic Background. The flat-topped summit of the central cone of Ebeko volcano, one of the most active in the Kuril Islands, occupies the northern end of Paramushir Island. Three summit craters located along a SSW-NNE line form Ebeko volcano proper, at the northern end of a complex of five volcanic cones. Blocky lava flows extend west from Ebeko and SE from the neighboring Nezametnyi cone. The eastern part of the southern crater contains strong solfataras and a large boiling spring. The central crater is filled by a lake about 20 m deep whose shores are lined with steaming solfataras; the northern crater lies across a narrow, low barrier from the central crater and contains a small, cold crescentic lake. Historical activity, recorded since the late-18th century, has been restricted to small-to-moderate explosive eruptions from the summit craters. Intense fumarolic activity occurs in the summit craters, on the outer flanks of the cone, and in lateral explosion craters.
Information Contacts: Kamchatka Volcanic Eruptions Response Team (KVERT), Far Eastern Branch, Russian Academy of Sciences, 9 Piip Blvd., Petropavlovsk-Kamchatsky, 683006, Russia (URL: http://www.kscnet.ru/ivs/kvert/).
Search Bulletin Archive by Publication Date
Select a month and year from the drop-downs and click "Show Issue" to have that issue displayed in this tab.
The default month and year is the latest issue available.
Bulletin of the Global Volcanism Network - Volume 42, Number 01 (January 2017)
Managing Editor: Edward Venzke
Chirpoi (Russia)
Chirpoi's Snow cone erupts 11 November 2012; continued activity through October 2016
Kanlaon (Philippines)
Three ash explosions on 18 June 2016; steam plumes through July
Langila (Papua New Guinea)
Weak ash plumes during April-May and November-December 2016
Momotombo (Nicaragua)
Numerous explosions with ash plumes and lava flow, December 2015-April 2016
Nyiragongo (DR Congo)
New vent in the summit crater during February-April 2016; lava lake active throughout 2011-2016
Rinjani (Indonesia)
Ash eruptions on 1 August to 10 km altitude; explosions on 27 September 2016
Sheveluch (Russia)
Ongoing strong explosions and ash plumes during September 2014-February 2015
Stromboli (Italy)
Ongoing explosive activity during 2014, followed by large lava flows into the sea in August
Suwanosejima (Japan)
Occasional ash plumes during January-September 2015
Telica (Nicaragua)
Multiple explosive ash-and-gas episodes; May 2015, and September 2015 through May 2016
Chirpoi
Russia
46.532°N, 150.871°E; summit elev. 742 m
All times are local (unless otherwise noted)
Chirpoi's Snow cone erupts 11 November 2012; continued activity through October 2016
The first recorded eruption in 30 years at Russia's Chirpoi volcano was initially detected on 11 November 2012 by MODIS infrared satellite data and captured by the MODVOLC thermal alert system. The Sakhalin Volcanic Eruption Response Team (SVERT) reported satellite images that detected thermal anomalies over Snow, a volcanic crater on the S end of Chirpoi Island, beginning on 20 November 2012 (BGVN 38:12), which they interpreted as a possible lava flow on the SE flank. Sparse satellite observations by SVERT, MIROVA and MODVOLC thermal anomaly information, a single report from the Tokyo Volcanic Ash Advisory Center (VAAC), and a site visit to this remote location in the Kuril Islands in the western Pacific Ocean together suggest nearly continuous activity at Snow through mid-October 2016.
Activity during November 2012-April 2013. Continuous reports of activity between November 2012 and April 2013 began with strong MODVOLC thermal anomalies from MODIS satellite data first recorded on 11 November local time, followed by a report of thermal anomalies detected from SVERT on 20 November. Strong thermal anomalies were reported by MODVOLC for 12 days during November and nine days during December 2012, after which they did not appear again until July 2013. However, SVERT reported thermal anomalies in satellite data almost weekly through 26 April 2013. They also observed steam-and-gas emissions in satellite data a number of times between 15 December 2012 and 5 March 2013.
Activity during July 2013-June 2014. After about a 10 week break between thermal anomaly observations, the MODVOLC pixels reappeared on 8 July 2013, and SVERT reported a thermal anomaly on 14 July 2013 suggesting a new period of lava effusion. The MODVOLC anomalies were intermittent with only three in July, one each in August and September, and two in October 2013; they then disappeared until March 2014. A single MODVOLC thermal anomaly was recorded on 10 March 2014, one appeared on 2 June and two appeared on 25 June 2014.
SVERT reported anomalies twice in July 2013, three times in August and once on 1 September before picking up again in November. SVERT reported thermal anomalies every week in November 2013, and most weeks through the first week in May 2014. After weak anomalies during 2-4 June 2014, SVERT inferred cooling lava flows and lowered the Alert Level from Yellow to Green.
Steam-and-gas emissions were reported by SVERT only between 23 July and 12 August 2013, and not again until late October. Gas-and-steam emissions were common between 22 October and 25 November 2013 when a plume was observed in satellite imagery drifting 90 km SE, after which plumes were not observed until 15 March 2014. Twice in late March (20 and 27) steam-and-gas plumes were detected drifting SE (150 and 50 km). After 13 April 2014, plumes were not detected again until September.
Activity during August 2014-October 2016. Although SVERT kept the Alert Level at Green until 4 September 2014 when they raised it back to Yellow, MODVOLC thermal alert pixels in late June (two on the 25th) and on 10 August, suggest possible continued activity during the summer. When skies were clear, SVERT again detected thermal anomalies in satellite data beginning on 1 September 2014 and continuing most weeks until 8 June 2015. MODVOLC recorded thermal anomalies on 2 and 22 September, and 22 October 2014, but then was quiet until a strong signal reappeared in April 2015 with six days of multiple anomalies recorded during the month, and five days with anomalies in May. During this interval from September 2014 to June 2015, steam-and-gas plumes were reported twice each in September 2014, February, March, and April 2015, and on 25 May 2015.
While no data is available from SVERT between 9 June and 11 November 2015, the Aviation Color Code remained at Yellow, and single MODVOLC thermal alert pixels were recorded on 28 June, 19 and 30 July, two on 7 September, and one each on 5 October, 3 November, and 19 November 2015, suggesting some type of continued heat source such as a lava flow. In addition, MIROVA records for 2015 provide the strongest evidence for ongoing low-to-moderate volcanic activity throughout 2015 (figure 2).
Visual confirmation of an effusive eruption at Chirpoi was made in October 2015. The website Volcano Discovery reported that "Passengers on board a Russian cruise ship (Ponant) documented the recent … eruption of Snow volcano. When passing the island in October 2015, lava flows were actively reaching the sea, creating spectacular littoral explosions." (figure 3). A video of the event from the cruise ship is also posted on the website.
SVERT reports were available again beginning in November 2015 and they reported that satellite images revealed thermal anomalies almost weekly from 11 November through 10 August 2016. They lowered the Alert Level to Green on 29 August 2016. MODVOLC thermal anomaly data was sparse in 2016 with only three reports of single anomalies on 5 February, 20 May, and 12 June 2016. Reports of steam-and-gas plumes observed in satellite imagery from SVERT were made on 12 and 14 November 2015, 24 March, and 20 and 23 April 2016. A plume that may have contained minor ash was observed by SVERT in satellite data drifting SW on 16 July, and one drifting 90 km N was noted during 22-24 July.
The Tokyo VAAC reported a possible eruption observed on satellite imagery at 1300 UTM on 6 March 2016 with a plume rising to 6.1 km altitude and drifting E. MIROVA data for 2016 again seems to confirm ongoing low to moderate thermally anomalous activity at Chirpoi until the middle of October when Radiative Power levels drop below 0.5 Watts VRP (figure 2).
Geologic Background. Chirpoi, a small island lying between the larger islands of Simushir and Urup, contains a half dozen volcanic edifices constructed within an 8-9 km wide, partially submerged caldera. The southern rim of the caldera is exposed on nearby Brat Chirpoev Island. The symmetrical Cherny volcano, which forms the central cone of the island, erupted twice during the 18th and 19th centuries. The youngest volcano, Snow, originated between 1770 and 1810. It is composed almost entirely of lava flows, many of which have reached the sea on the southern coast. No recorded eruptions are known from Brat Chirpoev, but its youthful morphology suggests recent Strombolian activity.
Information Contacts: Sakhalin Volcanic Eruption Response Team (SVERT), Institute of Marine Geology and Geophysics, Far Eastern Branch, Russian Academy of Science, Nauki st., 1B, Yuzhno-Sakhalinsk, Russia, 693022 (URL: http://www.imgg.ru/en/, http://www.imgg.ru/ru/svert/reports/); Hawai'i Institute of Geophysics and Planetology (HIGP), MODVOLC Thermal Alerts System, School of Ocean and Earth Science and Technology (SOEST), Univ. of Hawai'i, 2525 Correa Road, Honolulu, HI 96822, USA (URL: http://modis.higp.hawaii.edu/, http://modis.higp.hawaii.edu/cgi-bin/modisnew.cgi); MIROVA (Middle InfraRed Observation of Volcanic Activity), a collaborative project between the Universities of Turin and Florence (Italy) supported by the Centre for Volcanic Risk of the Italian Civil Protection Department (URL: http://www.mirovaweb.it/); Volcano Discovery (URL: http://www.volcanodiscovery.com/chirpoi/news/55254/Chirpoi-volcano-Kurile-Islands-Russia-video-of-lava-entering-the-sea.html); Tokyo Volcanic Ash Advisory Center (VAAC), Tokyo, Japan (URL: http://ds.data.jma.go.jp/svd/vaac/data/).
Kanlaon (Philippines) — January 2017 Cite this Report
Kanlaon
Philippines
10.4096°N, 123.13°E; summit elev. 2422 m
All times are local (unless otherwise noted)
Three ash explosions on 18 June 2016; steam plumes through July
An ash explosion from Kanlaon on 24 November 2015 was the start of activity that included intermittent ash emissions through December and during 29-31 March 2016 (BGVN: 4014). That activity was followed by decreasing tremor and steam plumes rising to as high as 800 during the first days of April 2016. A short series of explosions on 18 June 2016 were the last ash emissions through 2016, based on Philippine Institute of Volcanology and Seismology (PHIVOLCS) reports. The Alert Level remained at 1 (on a scale of 0-5) throughout the reporting period, indicating low level of volcanic unrest.
PHIVOLCS reported that ground deformation measurements from continuous GPS data as of 2 June 2016 indicated slight inflation of the edifice since December 2015. Weak to moderate emission of white steam plumes that rose 540 m during 15-17 June and drifted SW and NW.
A series of three eruptive events occurred on 18 June, beginning at 0919 and lasting 27 minutes. These events were recorded by the seismic monitoring network as consecutive explosion-type earthquakes that lasted 30, 42, and 29 seconds, respectively. The first event, a steam-and-gas explosion, generated a light gray-to-white ash plume that initially rose 1.5 km above the crater and then later to 3 km (figure 3). The second event, an ash eruption immediately following the first event, produced a dense black ash plume that rose 500 m. Lastly, a grayish ash plume rose 500 m. Minor ashfall was reported to the W in the barangays of Ara-al, San Miguel, and Yubo in La Carlota City (14 km W), Sag-ang in La Castellana (16 km SW), and Ilijan in Bago City (30 km NW). A diffuse sulfur odor was detected in Ara-al.
PHIVOLCS reported that during 20, 22-23, and 25-26 June white steam plumes rose as high as 800 m and drifted WNW, NW and SW; wispy steam plumes were observed on 27 June. Starting at 1640 on 23 June the seismic network recorded a 4-minute-long, explosion-type signal; weather clouds prevented visual observations of the summit area.
White plumes were again seen during 20-25 July. On 20 July plumes were a dirty-white color; on 21-22 they were of white steam; and on 25 July they rose 200 m and drifted NW and SW. Sulfur dioxide (SO2) emitted at the active vent averaged 234 tonnes/day on 21 July.
Ground deformation data from continuous GPS measurements as of 3 September 2016 indicated no significant change of the edifice since August 2016.
Geologic Background. Kanlaon volcano (also spelled Canlaon) forms the highest point on the Philippine island of Negros. The massive andesitic stratovolcano is covered with fissure-controlled pyroclastic cones and craters, many of which are filled by lakes. The largest debris avalanche known in the Philippines traveled 33 km SW from Kanlaon. The summit contains a 2-km-wide, elongated northern caldera with a crater lake and a smaller but higher active vent, Lugud crater, to the south. Eruptions recorded since 1866 have typically consisted of phreatic explosions of small-to-moderate size that produce minor local ashfall.
Information Contacts: Philippine Institute of Volcanology and Seismology (PHIVOLCS), Department of Science and Technology, PHIVOLCS Building, C.P. Garcia Avenue, Univ. of the Philippines Campus, Diliman, Quezon City, Philippines (URL: http://www.phivolcs.dost.gov.ph/).
Langila (Papua New Guinea) — January 2017 Cite this Report
Langila
Papua New Guinea
5.525°S, 148.42°E; summit elev. 1330 m
All times are local (unless otherwise noted)
Weak ash plumes during April-May and November-December 2016
After two explosions at Langila produced ash plumes that rose to 1.5 and 2.1 km in early December 2012 (BGVN 41.01), no further information about the volcano's activity was available from the Rabaul Volcano Observatory or the Darwin VAAC until April 2016. This report discusses two new eruptions in 2016, one during 2 April-13 May and the other during 3 November-24 December. Observations of ash plumes continued into mid-January 2017.
Thermal anomalies, based on MODIS satellite instruments analyzed using the MODVOLC algorithm, were occasionally detected after 2012. During 2013, seven anomalies were reported during 23 October-1 December (4 pixels on 25 October); during 2014-2015, a possible anomaly was identified on 23 August 2014 NE of the crater and thus probably not associated with volcanic activity.
During 2016, the Darwin VAAC reported the ejection of several ash plumes during 2 April-13 May and 3 November-24 December (table 3). Most plumes rose between 2-3.3 km in altitude. MODVOLC thermal alerts were also seen during those two periods, with six anomalies during April and May, and one reported in November During 20-27 December 2016, five thermal anomalies were reported (most with more than one pixel). Two alert pixels in August were weak and somewhat E of the volcano, and probably not associated with activity.
Table 3. Ash plumes from Langila reported during April-May and November-December 2016. Observations are based on analyses of satellite imagery, ground observations by the Rabaul Volcano Observatory, and wind data; dates are based on local time. Courtesy of the Darwin VAAC.
| Date |
Max. Plume Altitude (km) |
Drift |
| 02-03 Apr 2016 |
2.1 |
35-65 km N, NE, E |
| 06-07 Apr 2016 |
3 |
55 km NE, E |
| 21-22 Apr 2016 |
2.1 |
75-110 km N |
| 09-10 May 2016 |
2.1-3 |
75 km N, NW, W |
| 11-13 May 2016 |
2.1 |
25-85 km NNW, NW, W |
| 03 Nov 2016 |
3.3 |
55 km W |
| 04 Nov 2016 |
3.3 |
NW |
| 13 Nov 2016 |
2.1 |
55 km N |
| 16 Nov 2016 |
4.3 |
30 km SE |
| 01-06 Dec 2016 |
2.1-3 |
NE, NW, W (40 km on 3 Dec) |
| 08-09, 11, 13 Dec 2016 |
1.8-2.4 |
110 km W, WNW, N |
| 21-24 Dec 2016 |
2.4 |
N, NW, S, SE |
The Mirova (Middle InfraRed Observation of Volcanic Activity) volcano hotspot detection system, also based on analysis of MODIS data, also detected occasional hotspots during 2016 (figure 5). Most occurred during April-May and November-December, but a few intermittent anomalies were noted every month during June-October as well. The heat radiated by the volcanic activity (or Volcanic Radiative Power, as measured in watts) was mostly less than 0.5 W.
Geologic Background. Langila, one of the most active volcanoes of New Britain, consists of a group of four small overlapping composite basaltic-andesitic cones on the lower E flank of the extinct Talawe volcano in the Cape Gloucester area of NW New Britain. A rectangular, 2.5-km-long crater is breached widely to the SE; Langila was constructed NE of the breached crater of Talawe. An extensive lava field reaches the coast on the N and NE sides of Langila. Frequent mild-to-moderate explosive eruptions, sometimes accompanied by lava flows, have been recorded since the 19th century from three active craters at the summit. The youngest and smallest crater (no. 3 crater) was formed in 1960 and has a diameter of 150 m.
Information Contacts: Darwin Volcanic Ash Advisory Centre (VAAC), Bureau of Meteorology, Northern Territory Regional Office, PO Box 40050, Casuarina, NT 0811, Australia (URL: http://www.bom.gov.au/info/vaac/); Rabaul Volcano Observatory (RVO), PO Box 386, Rabaul, Papua New Guinea; Hawai'i Institute of Geophysics and Planetology (HIGP), MODVOLC Thermal Alerts System, School of Ocean and Earth Science and Technology (SOEST), Univ. of Hawai'i, 2525 Correa Road, Honolulu, HI 96822, USA (URL: http://modis.higp.hawaii.edu/, http://modis.higp.hawaii.edu/); MIROVA (Middle InfraRed Observation of Volcanic Activity), a collaborative project between the Universities of Turin and Florence (Italy) supported by the Centre for Volcanic Risk of the Italian Civil Protection Department (URL: http://www.mirovaweb.it/).
Momotombo (Nicaragua) — January 2017 Cite this Report
Momotombo
Nicaragua
12.423°N, 86.539°W; summit elev. 1270 m
All times are local (unless otherwise noted)
Numerous explosions with ash plumes and lava flow, December 2015-April 2016
Between 1996 and 2011 there were about 14 seismic swarms at Momotombo, along with fumarolic activity, and an explosion in 2006 (BGVN 37:02). According to the Instituto Nicaragüense de Estudios Territoriales (INETER), explosive activity that generated ash plumes resumed on 1 December 2015 and ended on 8 April 2016. The number of daily explosions increased beginning on 12 February 2016, with very high counts in the first half of March (figure 15).
Activity during December 2015-January 2016. According to the Instituto Nicaragüense de Estudios Territoriales (INETER), an explosion at 0749 on 1 December 2015 generated a gas-and-ash plume that rose 1 km above the crater and drifted SW. Additional explosions at 0817, 0842, and 0855 generated ash plumes that rose 300 m. Gas emissions were visible the rest of the day. The Sistema Nacional para la Prevención, Mitigación y Atención de Desastres (SINAPRED) reported that during 1-2 December, explosions ejected incandescent tephra, and a slow-moving lava flow on the N flank was observed. According to a news report (La Prensa) that interviewed INETER officials, ashfall was reported in nearby communities to the W and SW, including La Concha (40 km SSE), Los Arcos, Flor de la Piedra, La Paz Centro, and Leóin. Some families in La Paz Centro (17 km SW) self-evacuated.
Based on satellite and webcam observations, and seismic data, the Washington Volcanic Ash Advisory Center (VAAC) reported that during 2-3 December 2015, ash plumes rose to an altitude of 2.4 km and drifted 90-225 km NW and WNW.
According to INETER and SINAPRED reports, activity continued through 10 December 2015. Fieldwork revealed a small, incandescent, circular crater halfway up the E flank that was fuming during the morning of 6 December. An explosion on 7 December destroyed part of the crater. On 10 December, SINAPRED reported that material had been accumulating in the crater since the beginning of the eruption on 1 December. Seismicity during 9-14 December was low and stable.
INETER reported that during 29-30 December 2015, no explosions were detected, though Real-time Seismic-Amplitude Measurements (RSAM) continued at moderate-to-high levels.
Three gas-and-ash explosions on 2 January 2016 (at 1333, 1426, and 1434) were noted in INETER and SINAPRED reports which excavated the remaining parts of the lava dome that had been emplaced about a month earlier. An ash plume rose 500 m above the crater, drifted S and SW, and caused ashfall in Puerto Momotombo (9 km WSW). Possible ash plumes from an explosion at 2129 were hidden by darkness. At 0420 on 3 January, an explosion ejected lava bombs 2 km away and caused ashfall in La Paz Centro. Lava flows had advanced as far as 2 km down the NE flank.
INETER reported that at 1209 on 12 January 2016, a large explosion ejected incandescent material onto the flanks and generated an ash plume that rose 4 km above the crater. Tephra was deposited on the E, NE, N, and NW flanks. Ash plumes drifted downwind and caused ashfall in the communities of Flor de Piedra, Amatistán, Guacucal (40 km N), La Palma, Puerto Momotombo (10 km WSW), La Sabaneta, Mira Lago, Asentamiento Miramar, Pancasán, René Linarte, Raúl Cabezas, and Betania. At around 0500 on 15 January, strong volcanic tremor was accompanied by small explosions in the crater; ejected ash and incandescent tephra were deposited on the W flank. Seismicity decreased during 16-17 January.
According to INETER, during 20-21 January both RSAM values and emissions were low. Volcanic tremor increased at 0900 on 22 January, causing RSAM values to rise to high levels. There were no emission changes. INETER recommended that the public stay at least 6 km away from the volcano.
INETER reported that during 26-29 January, RSAM values were at low to moderate levels, and gas emissions were at moderate levels. Crater incandescence from high-temperature gas emissions was observed at night during 26-27 January. A Strombolian explosion at 0344 on 30 January ejected tephra onto the E, NE, N, and NW flanks, and produced gas emissions. At 0529 on 31 January, another explosion also ejected gas, ash, and incandescent material. Ashfall was reported in the nearby communities of Boqueron, Puerto Momotombo, and La Sabaneta. Moderate levels of gas emissions drifted SW towards Puerto Momotombo.
Activity during February-April 2016. During 4-5 and 7-8 February, both RSAM values were low to moderate and emissions were at moderate levels. INETER reported moderate levels of gas emissions on 10 February; volcanic tremor and gas emissions increased to moderate-to-high levels the next day. An explosion on 12 February produced small ash emissions and ejected incandescent material onto the N and SE flanks. An explosion at 1305 on 15 February generated an ash plume that rose 2 km above the crater and ejected incandescent tephra onto the N and NE flanks.
INETER reported that during 16-17 February, two explosions accompanied by tremor produced ash emissions and ejected incandescent material onto the flanks. The first and largest explosion (at 0344) ejected incandescent tephra 800 m above the crater. RSAM values were at low-to-moderate levels. Based on webcam views and satellite images, the Washington VAAC reported that on 19 February, ash emissions rose to an altitude of 3.6 km and drifted SW and WSW. The next day, ash emissions drifted SW. On 21 February ash plumes drifted about 80 km W and 25 km E.
During 19 February-1 March, explosions were detected daily. Explosions produced ash plumes and ejected incandescent material onto the N, NE, E, and SE flanks. Ash plumes rose 1.7-2.3 km above the crater and drifted SW during 21-22 February; gas-and-ash plumes rose 1.8 km on 24 February; an ash plume rose 1 km on 25 February and a small gas-and-ash plume rose 300 m on 26 February. A pyroclastic flow traveled 3.5 km down the N and NW flanks during 23-24 February. Explosions on 27 February ejected tephra 300 m above the crater.
At 0646 on 1 March, explosions ejected gas and incandescent tephra, and an ash plume that rose 1.2 km lasted 16 minutes, causing the plume to widen and darken the sky. According to INETER, 53 small explosions during 2-3 March generated weak gas plumes that rose 300 m above the crater. On 3 March, some explosions produced ash plumes that drifted W and SW. RSAM values were at low to moderate levels. SINAPRED reported that during 5-6 March, there were 78 explosions for a total of 279 explosions detected since 1 December 2015. One of the most significant explosions occurred on 6 March. The next day gas-and-ash plumes rose as high as 1 km above the crater.
On 28 March, SINAPRED reported that 38 explosions, detected over a period of 24 hours, ejected gas-and-ash plumes and incandescent tephra. The strongest event occurred at 1140 on 27 March and generated a plume that rose 1 km.
SINAPRED reported that on 2 April, explosions produced gas-and-ash plumes and ejected incandescent tephra. According to INETER, three explosions during 5-6 April ejected incandescent material onto the flanks and produced gas-and-ash plumes that rose 500 m above the crater. During 6-7 April there were 27 small explosions. The explosions ejected some incandescent material and generated ash plumes that rose 200 m and drifted SW. RSAM values were low during 5-12 April.
Monthly INETER reports did not indicate any explosive activity after 8 April 2016. The August 2016 report indicated that seismicity was low, with only five volcano-tectonic earthquakes. The RSAM in August was a low 30 units.
Thermal anomalies during the 2015-16 eruption. Many thermal anomalies, based on MODIS satellite instruments analyzed using the MODVOLC algorithm, were observed between 2-6 December 2015, primarily on the ENE flank. Subsequently, one anomaly was observed on 1 February, 2 February, and 15 February 2016. A weak possible hotspot on the E flank was also observed on 19 February, but it was slightly S of the previous hotspots.
The Mirova (Middle InfraRed Observation of Volcanic Activity) system, also based on analysis of MODIS data, detected several anomalies within 5 km of the crater during March 2016, but none thereafter through 2016. The heat radiated by the volcanic activity (or Volcanic Radiative Power, as measured in watts) was mostly less than 0.5 watts.
Before this latest activity, a weak hotspot was also detected by MODVOLC on 7 March 2012 near the N rim of the crater, and on 19 June 2014, somewhat further down the E flank than most of the other events; neither event may have been associated with volcanism; no volcanic activity was reported on those days.
Geologic Background. Momotombo is a young stratovolcano that rises prominently above the NW shore of Lake Managua, forming one of Nicaragua's most familiar landmarks. Momotombo began growing about 4500 years ago at the SE end of the Marrabios Range and consists of a somma from an older edifice that is surmounted by a symmetrical younger cone with a 150 x 250 m wide summit crater. Young lava flows extend down the NW flank into the 4-km-wide Monte Galán caldera. The youthful cone of Momotombito forms an island offshore in Lake Managua. Momotombo has a long record of Strombolian eruptions, punctuated by occasional stronger explosive activity. The latest eruption, in 1905, produced a lava flow that traveled from the summit to the lower NE base. A small black plume was seen above the crater after a 10 April 1996 earthquake, but later observations noted no significant changes in the crater. A major geothermal field is located on the south flank.
Information Contacts: Instituto Nicaragüense de Estudios Territoriales (INETER), Apartado Postal 2110, Managua, Nicaragua (URL: http://webserver2.ineter.gob.ni/vol/dep-vol.html); Sistema Nacional para la Prevención, Mitigación y Atención de Desastres (SINAPRED), Edificio SINAPRED, Rotonda Comandante Hugo Chávez 50 metros al Norte, frente a la Avenida Bolívar, Managua, Nicaragua (URL: http://www.sinapred.gob.ni/); Washington Volcanic Ash Advisory Center (VAAC), Satellite Analysis Branch (SAB), NOAA/NESDIS OSPO, NOAA Science Center Room 401, 5200 Auth Rd, Camp Springs, MD 20746, USA (URL: http://www.ospo.noaa.gov/Products/atmosphere/vaac/, archive at: http://www.ssd.noaa.gov/VAAC/archive.html); Hawai'i Institute of Geophysics and Planetology (HIGP), MODVOLC Thermal Alerts System, School of Ocean and Earth Science and Technology (SOEST), Univ. of Hawai'i, 2525 Correa Road, Honolulu, HI 96822, USA (URL: http://modis.higp.hawaii.edu/); MIROVA (Middle InfraRed Observation of Volcanic Activity), a collaborative project between the Universities of Turin and Florence (Italy) supported by the Centre for Volcanic Risk of the Italian Civil Protection Department (URL: http://www.mirovaweb.it/); La Prensa (Nicaragua) (URL: http://www.laprensa.com.ni/).
Nyiragongo (DR Congo) — January 2017 Cite this Report
Nyiragongo
DR Congo
1.52°S, 29.25°E; summit elev. 3470 m
All times are local (unless otherwise noted)
New vent in the summit crater during February-April 2016; lava lake active throughout 2011-2016
Nyiragongo holds one of the world's largest lava lakes, having been observed since at least 1971 (CSLP 21-71). Lava flows in 1977 and 2002 had deadly consequences for the city of Goma, which lies about 15 km S of the summit. The last Bulletin (BGVN 39:04) summarized observations made by a team of scientists that visited the volcano during 30 May-9 June 2011, and Toulouse Volcanic Ash Advisory Center (VAAC) notices posted in July 2012. This report covers activity from November 2011 through December 2016. Ground reports of activity are infrequent, though there are intermittent tourist expeditions, and a visit by scientists in March 2016 provided visual observations detailing changes in the crater and vent morphology.
Excellent pictures of the lava lake within the crater were taken in June 2010 by photographer Olivier Grunewald, while on an expedition to the volcano with observatory scientists doing fieldwork. These images, 28 total, were provided by Nelson (2011) for a news article; three are shown below (figures 54-56).
Emissions and thermal anomalies. A nearly daily record of thermal alerts identified from the MODIS Agua and Terra satellite sensors has been generated by MODVOLC since 2002; the MODVOLC and MIROVA systems recorded nearly daily thermal anomalies during 2015 and at least through December 2016.
According to NASA's Earth Observatory, a satellite image acquired on 15 November 2011 showed heat coming from the active lava lake. The Toulouse VAAC reported that, according to a Volcano Observatory Notices for Aviation (VONA) issued by OVG (Observatoire Volcanologique de Goma), a gas plume composed mostly of sulfur dioxide rose from the crater on 1 November 2012. Another satellite image, acquired on 29 July 2013 and analyzed by NASA's Earth Observatory, again showed incandescence coming from the active lava lake in the summit crater; a diffuse blue plume drifted N.
A satellite image from 29 January 2014 showed a gas-and-steam plume rising from Nyiragongo. On 9 February 2015, clear skies permitted a view from space of plumes venting from Nyamuragira (figure 57, top) and Nyiragongo (figure 57, bottom) volcanoes.
New vent in crater, February 2016. Activity intensified on 28 February 2016, prompting OVG to dispatch a team of scientists to the crater. Starting at 0400 on 29 February, local residents began to hear frequent rumblings coming from the volcano almost every minute. These were likely caused by the opening of a new vent (observed the next day) and associated rockfalls inside the crater. During a 1-2 March field expedition, the scientists observed the new eruptive vent (figure 58), located at the NE end of the lowest crater terrace, outside the active lava lake (which had been in place since 2002) and just at the base of the near-vertical crater walls. The vent sits on the E-trending fracture zone that connects the summit vent with the prominent flank cone Baruta to the NE of the main edifice, near the village of Kibumba. Photos in the report suggest that the new vent sits atop a small spatter cone. Fresh lava flows had pooled onto the crater floor around the cone.
Observers during a 10-11 March field expedition noted that activity in the new vent consisted in pulsating lava fountains and Strombolian bursts which ejected material of a few tens of meters high. Lava flows from the new vent extended around the central pit on 11 March (figure 59). Activity in the lava lake was intense; lava fountains were active in the N and E parts of the lake. Both the lava lake and crater vent were producing gas emissions (figure 60).
On 26 March and 8 April 2016, the mainly effusive activity from the new vent continued with little change. Lava flows had surrounded the central pit (containing the main lava lake), covered most of the third terrace, and cascaded into the central vent at multiple locations.
A report from OVG on 12 April 2016 noted that activity had declined since 6 April 2016, and that the level of the lava lake had dropped. A report dated 17 April stated that some volcanic earthquakes had been located within 5 km E and 10-15 km N of the crater; continuous volcanic tremor was recorded during 0200-0400 on 17 April. In a photo dated 19 April the incandescent vent atop a spatter cone was visible. According to Volcano Discovery, local mountain guides reported that as of 30 May, no more lava flows were being produced from the vent, although bubbling lava was visible.
Ongoing activity through December 2016. Social media accounts and photos from a few tourist expeditions showed that the lava lake within the summit crater remained active during August-November 2016. Infrared data from MODIS instruments confirmed this persistent activity, with almost daily anomalies, through the end of December 2016.
Information from a weekly bulletin produced by the Goma Volcano Observatory, not available online, was reported by Radio Kivu. That report, for 27 December-2 January 2017, noted there was incandescence visible during 30-31 December, and that lava flows had overflowed the lake into the rest of the crater, accompanied by explosions and fountaining. A persistent gas plume can be seen during the day, which typically blows to the west.
Research on January 2002 eruption. In a recent article by Wauthier and others (2012), and summarized by Morton (2016), researchers reported finding evidence for linkage between the deadly January 2002 eruption (BGVN 26:12 and later) and a magnitude-6.2 earthquake eight months afterwards, centered 20 km S in the Lake Kivu region, partially destroying the town of Kalehe. Using satellite radar data (InSAR – Interferometric Synthetic Aperature Radar) to analyze ground deformation between the volcano and the lake before and after both the eruption and the earthquake, they inferred the formation of 20-km-long dike intrusion (figure 61, along the pink line between Nyiragongo and Lake Kivu).
References: Morton, M. C., 2016 (May/June), Double trouble: Volcanic eruption leads to strong earthquake eight months later, Earth, American Geosciences Institute, v.61, no. 5&6, p. 33 (www.earthmagazine.org).
Nelson, P., 2011 (28 February), Nyiragongo Crater: Journey to the Center of the World, boston.Com (URL: http://archive.boston.com/bigpicture/2011/02/nyiragongo_crater_journey_to_t.html). Photos by Olivier Grunewald.
Wauthier, C., Cayol, V., Kervyn, F., and d'Oreye, N., 2012 (May), Magma sources involved in the 2002 Nyiragongo eruption, as inferred from an InSAR analysis, Journal of Geophysical Research, Solid Earth, Geodesy and Gravity/Tectonophysics, v. 117, issue B5, 36 p.
Geologic Background. The Nyiragongo stratovolcano contained a lava lake in its deep summit crater that was active for half a century before draining catastrophically through its outer flanks in 1977. The steep slopes contrast to the low profile of its neighboring shield volcano, Nyamuragira. Benches in the steep-walled, 1.2-km-wide summit crater mark levels of former lava lakes, which have been observed since the late-19th century. Two older stratovolcanoes, Baruta and Shaheru, are partially overlapped by Nyiragongo on the north and south. About 100 cones are located primarily along radial fissures south of Shaheru, east of the summit, and along a NE-SW zone extending as far as Lake Kivu. Many cones are buried by voluminous lava flows that extend long distances down the flanks, which is characterized by the eruption of foiditic rocks. The extremely fluid 1977 lava flows caused many fatalities, as did lava flows that inundated portions of the major city of Goma in January 2002.
Information Contacts: Observatoire Volcanologique de Goma (Goma Volcano Observatory), Goma, North Kivu, DR Congo; Hawai'i Institute of Geophysics and Planetology (HIGP), MODVOLC Thermal Alerts System, School of Ocean and Earth Science and Technology (SOEST), Univ. of Hawai'i, 2525 Correa Road, Honolulu, HI 96822, USA (URL: http://modis.higp.hawaii.edu/); MIROVA - Middle InfraRed Observation of Volcanic Activity, A near real time volcanic hot-spot detection system based on the analysis of MODIS ( Moderate Resolution Imaging Spectroradiometer) data, a collaborative project between the Universities of Turin and Florence (Italy) (URL: http://www.mirovaweb.it/); Tom Pfeiffer, Volcano Discovery (URL: https://www.volcanodiscovery.com/nyiragongo/news); NASA Earth Observatory, EOS Project Science Office, NASA Goddard Space Flight Center, Goddard, Maryland, USA (URL: http://earthobservatory.nasa.gov/); Radio Kivu, Goma, North Kivu, DR Congo (URL: http://www.radiokivu1.org/page/article.php?action=articleread&tokena=1432).
Rinjani (Indonesia) — January 2017 Cite this Report
Rinjani
Indonesia
8.42°S, 116.47°E; summit elev. 3726 m
All times are local (unless otherwise noted)
Ash eruptions on 1 August to 10 km altitude; explosions on 27 September 2016
An eruption at Rinjani that lasted two months, between 25 October and 24 December 2015 (BVGN 41:08) included ash plumes rising to 6 km altitude and lava flows from the Barujari cone that reached the Segara Anak lake within the caldera. A new eruption that began on 1 August 2016 generated ash plumes to about 10 km altitude. After another period of quiet, small-scale explosive activity on 27 September stranded a number of trekkers on the slopes and caused the Alert level to be raised to 2. No further activity was reported in 2016.
Based on satellite and pilot observations, the Darwin VAAC reported that an eruption on 1 August 2016 generated an ash plume that rose to an altitude of 9.8 km altitude and drifted S. The ash plumes were first visible in satellite images at 1150, and according to the Pusat Vulkanologi dan Mitigasi Bencana Geologi (PVMBG, also known as the Centre for Volcanology and Geological Hazard Mitigation), passengers aboard a passing aircraft saw ash plumes rising 2 km above the crater (figure 27). The National Agency for Disaster Management (BNPB) noted that the Lombok International Airport closed at 1655 and was scheduled to reopen at 1000 the next day. Later on 1 August ash plumes rose to altitudes of 4.3-6.1 km altitude and drifted S, SW, and W. No plumes were visible at 1730; conditions had returned to normal levels, although BNPB warned that the public should stay at least 1.5 km away from the volcano.
PVMBG reported that at 1445 on 27 September a small explosive eruption at Barujari Crater produced an ash plume rose that rose 2 km above the crater and drifted WSW. The eruption was preceded by an increase in seismicity, but the number and amplitude of the events were insignificant. The Alert Level was raised to 2, and the public was warned not to approach the crater within a 3-km radius.
Based on data from the Mount Rinjani National Park, BNPB reported that as many as 1,023 tourists were on Rinjani when it erupted on 27 September; officially only 464 people were registered to make the 3-day trek to the volcano and back. Officials began the evacuation of tourists that day.
The Jakarta Post reported on 1 October that the West Nusa Tenggara Disaster Mitigation Agency (BPBD NTB) had called on representatives of foreign countries to file a report if they had citizens still missing in the climbing area. The agency made the request following reports that 44 tourists had not yet returned from climbing the mountain. BPBD NTB head Muhammad Rum said it was possible that the climbers had returned, but had not yet been recorded, or had not passed through either of the two official entrances. The Jakarta Post reported on 5 December 2016 that hiking routes were once again open.
Geologic Background. Rinjani volcano on the island of Lombok rises to 3726 m, second in height among Indonesian volcanoes only to Sumatra's Kerinci volcano. Rinjani has a steep-sided conical profile when viewed from the east, but the west side of the compound volcano is truncated by the 6 x 8.5 km, oval-shaped Segara Anak (Samalas) caldera. The caldera formed during one of the largest Holocene eruptions globally in 1257 CE, which truncated Samalas stratovolcano. The western half of the caldera contains a 230-m-deep lake whose crescentic form results from growth of the post-caldera cone Barujari at the east end of the caldera. Historical eruptions dating back to 1847 have been restricted to Barujari cone and consist of moderate explosive activity and occasional lava flows that have entered Segara Anak lake.
Information Contacts: Pusat Vulkanologi dan Mitigasi Bencana Geologi (PVMBG, also known as Indonesian Centre for Volcanology and Geological Hazard Mitigation, CVGHM), Jalan Diponegoro 57, Bandung 40122, Indonesia (URL: http://www.vsi.esdm.go.id/); Darwin Volcanic Ash Advisory Centre (VAAC), Bureau of Meteorology, Northern Territory Regional Office, PO Box 40050, Casuarina, NT 0811, Australia (URL: http://www.bom.gov.au/info/vaac/); Badan Nasional Penanggulangan Bencana (BNPB), National Disaster Management Agency, Graha BNPB - Jl. Scout Kav.38, East Jakarta 13120, Indonesia (URL: http://www.bnpb.go.id/); Jakarta Post (URL: http://www.thejakartapost.com/).
Sheveluch (Russia) — January 2017 Cite this Report
Sheveluch
Russia
56.653°N, 161.36°E; summit elev. 3283 m
All times are local (unless otherwise noted)
Ongoing strong explosions and ash plumes during September 2014-February 2015
An eruption at Sheveluch has been ongoing since 1999, and the activity there was previously described through August 2014 (BGVN 39:08). During 1 September 2014-28 February 2015 the same type of activity prevailed, with periods of strong explosions producing ash plumes as high as 11 km altitude. Most of the following data comes from Kamchatka Volcanic Eruption Response Team (KVERT) reports. Views of the volcano are often obscured by clouds.
KVERT reported that the explosive and effusive eruption continued into September 2014 through at least the end of February 2015. Activity was dominated by lava dome growth on the SE flank (N flank after mid-September), moderate ash explosions, fumarolic activity, and hot avalanches. According to KVERT, satellite data showed a thermal anomaly over the dome most days, when weather permitted observation. However, few MODVOLC alerts about MODIS thermal anomalies were recorded during the reporting period: two in September 2014, one in November, one in December, three in January 2015, and two in February.
Occasional strong explosions were reported by KVERT that produced ash plumes that rose as high as 11.5 km and drifted mostly in a northerly and easterly direction (NW to E). Strong explosions were recorded 2-3 times per month during September-November 2014, and about seven times per month during December 2014-February 2015. The Alert Level remained Orange (second highest) throughout the reporting period, except on 24 September, when it was briefly raised to Red due to strong explosions at 1238 that generated a large ash plume (207 x 250 km) that rose 11-11.5 km (figure 38); the Alert Level was lowered back to Orange that same day as the explosive activity subsided.
In addition to the above activity, KVERT recorded a small pyroclastic flow on 7 January 2015 that descended the SE flank of the dome. Ashfall was reported in Klyuchi Village (50 km SW) on 12 January and in in Ust-Kamchatsk (85 km SE) on 4 March.
According to a news article (CNN), strong explosions on 28 February 2015 blew ash plumes across the Bering Sea into western Alaska and caused Alaska Airlines to cancel several flights. The article also indicated that an airlines spokesman mentioned that a similar cancellation had occurred in January.
Geologic Background. The high, isolated massif of Sheveluch volcano (also spelled Shiveluch) rises above the lowlands NNE of the Kliuchevskaya volcano group. The 1,300 km3 andesitic volcano is one of Kamchatka's largest and most active volcanic structures, with at least 60 large eruptions during the Holocene. The summit of roughly 65,000-year-old Stary Shiveluch is truncated by a broad 9-km-wide late-Pleistocene caldera breached to the south. Many lava domes occur on its outer flanks. The Molodoy Shiveluch lava dome complex was constructed during the Holocene within the large open caldera; Holocene lava dome extrusion also took place on the flanks of Stary Shiveluch. Widespread tephra layers from these eruptions have provided valuable time markers for dating volcanic events in Kamchatka. Frequent collapses of dome complexes, most recently in 1964, have produced debris avalanches whose deposits cover much of the floor of the breached caldera.
Information Contacts: Kamchatka Volcanic Eruptions Response Team (KVERT), Far East Division, Russian Academy of Sciences, 9 Piip Blvd., Petropavlovsk-Kamchatsky, 683006, Russia (URL: http://www.kscnet.ru/ivs/kvert/); Institute of Volcanology and Seismology, Far Eastern Branch, Russian Academy of Sciences, (IVS FEB RAS), 9 Piip Blvd., Petropavlovsk-Kamchatsky 683006, Russia (URL: http://www.kscnet.ru/ivs/eng/); Hawai'i Institute of Geophysics and Planetology (HIGP), MODVOLC Thermal Alerts System, School of Ocean and Earth Science and Technology (SOEST), Univ. of Hawai'i, 2525 Correa Road, Honolulu, HI 96822, USA (URL: http://modis.higp.hawaii.edu/); Cable News Network (CNN), Turner Broadcasting System, Inc. (URL: http://www.cnn.com/).
Stromboli (Italy) — January 2017 Cite this Report
Stromboli
Italy
38.789°N, 15.213°E; summit elev. 924 m
All times are local (unless otherwise noted)
Ongoing explosive activity during 2014, followed by large lava flows into the sea in August
Italy's Stromboli volcano, best known for lava fountain eruptions, has been essentially continuously active for at least the last 400 years. Confirmed historical observations of its eruptions go back 2,000 years. Frequent, mild explosive activity in 2013 was accompanied by lava flows and ash plumes (BGVN 40:11). Activity increased significantly during 2014 as reported by the Instituto Nazionale de Geofisica e Vulcanologia (INGV), Sezione de Catania, who monitors the gas geochemistry, deformation, and seismology, as well as the surficial activity. The Toulouse Volcanic Ash Advisory Center (VAAC) reports on ash plumes potentially affecting air travel. The activity at the summit consistently occurs from vents within two well defined north and south crater areas (figure 88) at the head of the Sciara del Fuoco, a large scarp that runs from the summit down the NW side of the island (see BGVN 36:09 for geologic map).
A gradual increase of Strombolian activity from January through May 2014 was followed by small lava flows in June onto the Sciara del Fuoco. Several more lava flows in early July contributed to landslides that sent debris down the scarp into the ocean. In mid-July, four additional flows emerged and traveled down the scarp, with the flow on 19 July reaching the coastline. A strong surge in explosion frequency and intensity in early August caused 300-m-high fountains, followed by lava flows into the ocean for several days between 6 and 13 August. Minor ash emissions in early October sent plumes as high as 3 km altitude. Lava flows continued intermittently into October, but they no longer made it to the coast. Activity diminished significantly at the end of October 2014.
Activity during January-March 2014. After an explosive sequence on 25 December 2013 sent lapilli, bombs, and an ash plume above the summit craters, activity was quieter for several months. INGV reported that a medium-intensity explosive sequence of four events occurred from the S crater area on 4 January 2014. Lava fountaining with lapilli and bombs landing on the S part of the crater terrace and the S and E edges of the Sciara del Fuoco were reported, along with a minor landslide along the scarp. For the remainder of January, fountain explosion heights ranged from low (less than 80 m) to medium (less than 120 m) from the North (N) Area vents. Explosions of lapilli and bombs mixed with ash averaged 2-3 per hour. The South (S) Area vents sometimes exhibited medium-high-intensity (over 150 m) activity with discontinuous spattering, averaging 3-7 explosions per hour.
Only vent N1 in the North Area was active in February 2014. It was characterized by low- to medium-intensity explosive activity, emitting lapilli and bombs mixed with ash at a rate of 2-3 explosions per hour. In the South Area, vents S1, S3, and S4 were active at weak levels with emissions of fine ash mixed with some coarse material, at a rate averaging less than 6 explosions per hour.
Typical Strombolian activity during March included low- to medium-intensity explosive activity from both vent areas. A sequence of three explosions on 7 March from the South Vents led to the fallout of bombs on the upper side of the Sciara del Fuoco. At vent S1 vigorous activity on 14 March produced the rapid accumulation of lava fragments around the vent that flowed downward inside the terrace crater before subsiding. On 17 March small explosions at vent S3 briefly formed a new nearby vent with a persistent thermal anomaly. An increase in SO2 flux was observed in mid-March by INGV. The average frequency of explosions increased in the last week of March to 10-13 per hour, and the seismic amplitudes were also slightly higher in the second half of the month.
Activity during April-June 2014. Lapilli and bombs mixed with fine ash were typical from all vents during April 2014. The South Area had greater activity, with 3 or 4 vents active during the month, although the activity level was generally low- to medium-intensity in both areas. Frequency of events was generally average, ranging from 9 to 15 per hour. Activity in May 2014 was much the same as April in the N Area until the very end of the month when vent N2 began low-intensity explosive activity. All four vents in the S Area were active throughout May. Two intervals of high intensity spattering were reported on 13 and 19 May from the S Area vents. Explosion rates increased slightly during the month to averages of 11 to 18 per hour.
Activity continued to increase in both vent areas during June 2014. Explosions increased to a rate of more than 20 per hour several times during the month, accompanied by longer periods of spattering. Seismic tremor amplitudes also increased beginning at the end of May. Two periods of vigorous spattering led to lava flows. On 17 June, 70 minutes of vigorous spattering from vent S1 fed a lava overflow within the crater that flowed NE for a few tens of meters before cooling. On the morning of 22 June, vent N2 showed a marked increase in both frequency and intensity of activity. It was characterized by vigorous spattering and discrete bursts of high-intensity (over 200 m high) lava jets. The lava flowed from a crack at the edge of the vent and spread to the upper part of the Sciara del Fuoco. It flowed down the scarp for a few hundred meters before stopping early on 23 June. The South Area vents also had explosions over 200 m high beginning on 23 June. A lava flow emerged from vent S1 on 27 June; on 29 June, vent N2 produced two lava flows, the first remained within the crater, and the second, starting in the afternoon, continued flowing into 30 June, reaching the upper Sciara del Fuoco before stopping.
The first anomalies from the MODVOLC thermal alert system using MODIS satellite thermal data in 2014 appeared in early June and increased during the lava flow emissions that occurred at the end of the month.
Activity during July-October 2014. Three lava flows emerged from Vent N2 on 1, 4, and 7 July 2014. The first flowed E for two hours over the 29 June flow within the crater, and was followed later in the day by a second flow that moved towards the Sciara del Fuoco as did the flows on 4 and 7 July. Modest slumping of material around the western portion of the small pyroclastic cone that formed around Vent N2 led to a collapse and landslide that spread rapidly down the Sciara del Fuoco on 7 July. This led to a lava overflow on the upper part of the scarp for several hours during 7 July. Additional lava flows from Vent N2 occurred on 9 and 10 July as large blocks rolling down the scarp coalesced into a lava flow that continued until the evening of 10 July. Small landslides were triggered on the steep flanks of the scarp, and fine debris was carried downslope, almost to the coastline (figure 89).
Four lava flows emerged from vent N2 on 15, 16, 17, and 19 July, while activity at vent N1 continued as low- to high-intensity (up to 200 m high) explosions with lapilli and bomb ejections. The new flows were emplaced just north of the earlier flows. The flow on 19 July made it to the shoreline. Meanwhile, constant spattering and low-intensity explosions continued in the South area at all four vents. The locus of activity shifted during 21 and 22 July from the North Area to the South Area.
During 3 and 4 August, there was a strong surge in explosion frequency to averages of over 30 per hour with peaks of around 100 per hour. This resulted in high-intensity explosions (to over 300 m in height above the vents) from both the North and South Areas. A new lava overflow from the crater terrace began in the early afternoon of 6 August, following the same path down the center of the Sciara del Fuoco as other recent flows. Landslides of hot material quickly reached the coastline, raising large plumes of steam. Pulsating flows of lava later reached the coast and continued flowing into the early hours of 7 August. A new lava overflow from the N Area vents in the early morning of 7 August quickly formed a broad lava field at 600 m elevation and flowed onto the Sciara del Fuoco. Several arms of the lava flowed toward the coast and entered the sea (figure 90).
Lava emissions continued from the N Area vents, reaching the coastline intermittently for several days, fanning out and covering large areas of the scarp, and generating steam jets and explosions with blocks of lava sent tens of meters high as the lava entered the ocean (figure 91). During this time, explosive activity decreased noticeably at the vents, while strong degassing continued. The lava continued to flow along the eastern edge of the Sciara del Fuoco with new flows covering earlier cooling flows as they traveled down the scarp to the coastline until 13 August. Lava effusion continued until mid-October but flows gradually retreated up the scarp, no longer reaching the sea.
Sporadic ash emissions in early October 2014 led to several reports from the Toulouse VAAC. Ash was reported in the vicinity of Stromboli at a low levels on 30 September, but it was not identifiable on satellite data. It was reported below 1.8 km altitude on 8 October, below 2.4 km on 9 October and below 3 km on 11 October.
A few intermittent MODVOLC thermal anomalies were recorded in July and then substantial anomalies appeared in August, with multiple-per-day continuously during 7-29 August. Almost daily multi-pixel anomalies continued in September and October, but ended abruptly on 28 October. Only one more anomaly was recorded on 8 November 2014. No additional reports on Stromboli were issued by INGV after the 16 October 2014 update.
Geologic Background. Spectacular incandescent nighttime explosions at Stromboli have long attracted visitors to the "Lighthouse of the Mediterranean" in the NE Aeolian Islands. This volcano has lent its name to the frequent mild explosive activity that has characterized its eruptions throughout much of historical time. The small island is the emergent summit of a volcano that grew in two main eruptive cycles, the last of which formed the western portion of the island. The Neostromboli eruptive period took place between about 13,000 and 5,000 years ago. The active summit vents are located at the head of the Sciara del Fuoco, a prominent scarp that formed about 5,000 years ago due to a series of slope failures which extends to below sea level. The modern volcano has been constructed within this scarp, which funnels pyroclastic ejecta and lava flows to the NW. Essentially continuous mild Strombolian explosions, sometimes accompanied by lava flows, have been recorded for more than a millennium.
Information Contacts: Istituto Nazionale di Geofisica e Vulcanologia (INGV), Sezione di Catania, Piazza Roma 2, 95123 Catania, Italy (URL: http://www.ct.ingv.it/en/); Toulouse Volcanic Ash Advisory Center (VAAC), Météo-France, 42 Avenue Gaspard Coriolis, F-31057 Toulouse cedex, France (URL: http://www.meteo.fr/vaac/); Hawai'i Institute of Geophysics and Planetology (HIGP), MODVOLC Thermal Alerts System, School of Ocean and Earth Science and Technology (SOEST), Univ. of Hawai'i, 2525 Correa Road, Honolulu, HI 96822, USA (URL: http://modis.higp.hawaii.edu/).
Suwanosejima (Japan) — January 2017 Cite this Report
Suwanosejima
Japan
29.638°N, 129.714°E; summit elev. 796 m
All times are local (unless otherwise noted)
Occasional ash plumes during January-September 2015
Continuous tremor, intervals with several explosions per day, and plumes rising to 5.5 km altitude were observed at Suwanosejima between 1 April 2013 and 14 December 2014 (BGVN 39:11). The data for this report, covering 5 January-11 September 2015, was gathered primarily from two key sources: the Tokyo Volcanic Ash Advisory Center (VAAC) and the Japan Meteorological Agency (JMA). Throughout the entire reporting period, no MODVOLC thermal anomalies were recorded, although the hazard status remained at Alert Level 2 (Do not approach the crater), on an increasing scale of 1-5. The Otake (also O-take) crater (figure 1) was the site of much of the activity during 2015.
In its Monthly Volcanic Activity Report for January 2015, JMA noted four explosive eruptions at the Otake crater, in addition to other occasional non-explosive eruptions. Grayish plumes accompanying the eruption rose as high as 1 km above the crater rim. On 25 January a field survey revealed a pit in the southeastern portion of the Otake crater which had formed since the previous survey on 8 November 2012.
Plumes in 2015 were reported by the VAAC in the months of January, February, April, July, August, and September. JMA served as the primary source for all of these VAAC notices; any additional sources are noted. The Tokyo VAAC reported that on 5 January ash plumes rose to altitudes of 1.5-1.8 km and drifted NE and SE, and were also observed by pilots. The VAAC also reported an explosion on 25 January, the same day as the field survey.
The Tokyo VAAC reported that during 11-12 and 14-15 February ash plumes rose to altitudes of 1.8-2.1 km and drifted E. JMA's monthly report for February 2015 indicated that twelve explosions occurred at Otake crater, in addition to occasional, non-explosive events. Grayish plumes accompanying the explosions rose as high as 1,500 m above the crater rim. According to the Suwanosejima branch of the Toshima Village administration, ash fall was observed at Kiriishi port (located ~3.5 km S. of Otake) on 26 February.
A very small eruption at the Otake crater on 5 March 2015 was noted by JMA. An event on 13 April reported by the Tokyo VAAC generated a plume that rose to an altitude of 2.1 km and drifted N. Explosions during 24-25 April generated plumes that rose to altitudes of 1.8-2.1 km and drifted N and SE.
JMA reported a continued high activity level at the Otake crater with very small eruptions recorded on 5 and 17 May 2015. No explosions were observed at the Otake crater in June. The Tokyo VAAC reported that ash plumes from small eruptions at Otake on 30-31 July rose to altitudes of 2.1-3 km and drifted E, SW, and W, as reported by pilots and seen in satellite data. Grayish plumes accompanying the eruption rose as high as 1,300 m above the crater rim. According to the Suwanosejima branch of the Toshima Village administration, ashfall was observed in a village ~4 km SSW of Otake on 31 July.
JMA's August 2015 report described small, occasional, non-explosive events at the Otake crater, with accompanying grayish plumes rising as high as 1.2 km above the crater rim. Volcanic "glow" was observed at the Otake crater occasionally at night with a high-sensitivity camera. According to the Toshima Village administration, ashfall 4 km SSW of Otake was again present on 1, 2, and 9 August. The Tokyo VAAC reported that ash plumes identified in satellite images rose to an altitude of 4 km on 2 August, and to 1.8 km on 21 August that drifted SE.
In the September 2015 report, JMA noted that volcanic activity had remained at high levels, with 89 explosions recorded at the Otake crater; 69 of those were on 24 September, the first time more than 50 explosions a day had been observed since 30 December 2013. Plumes accompanying the events rose as high as 1,500 m above the crater rim. Crater incandescence was observed at night with a thermal camera. According to the Toshima Village administration, ashfall was once again observed in a village 4 km SSW on 7 September. The Tokyo VAAC reported that on 13 September ash plumes rose to an altitude of 1.8 km and drifted SE. JMA noted that parts of local structures shook in association with explosions that occurred on 24 September. Explosions and rumbling were heard on the island.
Geologic Background. The 8-km-long island of Suwanosejima in the northern Ryukyu Islands consists of an andesitic stratovolcano with two active summit craters. The summit is truncated by a large breached crater extending to the sea on the E flank that was formed by edifice collapse. One of Japan's most frequently active volcanoes, it was in a state of intermittent Strombolian activity from Otake, the NE summit crater, between 1949 and 1996, after which periods of inactivity lengthened. The largest recorded eruption took place in 1813-14, when thick scoria deposits covered residential areas, and the SW crater produced two lava flows that reached the western coast. At the end of the eruption the summit of Otake collapsed, forming a large debris avalanche and creating an open collapse scarp extending to the eastern coast. The island remained uninhabited for about 70 years after the 1813-1814 eruption. Lava flows reached the eastern coast of the island in 1884. Only about 50 people live on the island.
Information Contacts: Japan Meteorological Agency (JMA), Otemachi, 1-3-4, Chiyoda-ku Tokyo 100-8122, Japan (URL: http://www.jma.go.jp/); Tokyo Volcanic Ash Advisory Center (VAAC), Tokyo, Japan (URL: http://ds.data.jma.go.jp/svd/vaac/data/).
Telica (Nicaragua) — January 2017 Cite this Report
Telica
Nicaragua
12.606°N, 86.84°W; summit elev. 1036 m
All times are local (unless otherwise noted)
Multiple explosive ash-and-gas episodes; May 2015, and September 2015 through May 2016
Small explosions have been recorded at Nicaragua's Telica volcano regularly since early in the 20th century. The last major eruptive episode began with a series of small explosions in March 2011 and culminated in greatly increased seismicity and several larger explosions during May that deposited ashfall in communities within 8 km of the volcano, and caused a small number of evacuations. Ash-bearing explosive activity died down by mid-June 2011, although steady degassing with gas-and-steam plumes continued. A small ash-and-gas explosion was reported on 25 September 2013.
On 7 May 2015 a new series of larger ash-and-gas explosions began. Nicaragua's Instituto Nicaragüense de Estudios Territoriales (INETER) provides monthly reports on seismic activity and monitoring of thermal and geochemical data as well as daily informational bulletins of volcanic activity; aviation advisories are also provided by the Washington Volcanic Ash Advisory Center (VAAC). Activity from June 2014 through August of 2016 is covered in this report.
A decrease in seismicity and increase in temperature within the summit crater at Telica in April 2015 preceded an ash-and-gas explosion on 7 May 2015 after several years of relative quiet. This was followed by a series of over 100 ash-bearing explosions in the following three weeks, the last on 28 May. Degassing from fumaroles continued without ash during June and the crater had cooled significantly by August. A new series of ash-and-gas explosion between 23 and 26 September 2015 sent ashfall to nearby communities and a few large volcanic bombs several hundred meters from the crater. The next series of explosions between 22 and 29 November sent ashfall to over 70 communities within 20 km of Telica. Incandescence was observed in a crack in the floor of the summit crater in December, but lava wasn't observed in the vent until 25 February 2016 after a sequence of gas explosions that lasted until 1 March. The lava and incandescence were observed until early May when explosions on 7-8 May 2016 were observed from a new vent in the N part of the crater. No further ash emissions were observed, and seismicity dropped significantly and remained quiet through August 2016.
Activity between June 2014 and May 2015. Remote temperature measurements of the summit crater floor at Telica showed a steady decline between May and July 2014 from an average of 417°C to 350°C, continuing a decline from values measured in 2013 that had been as much as 100°C hotter. During this time, few noises were heard and little incandescence from the crater was observed. There were no further reports until February 2015 when fresh landslides along the SE inner wall were observed blocking the vent; on a 25 February summit crater visit there was no noise, and few emissions from fumaroles were observed. Temperatures at the fumaroles on the SE, S and SW walls of the crater were around 150°C, and the floor of the crater was measured at 123°C with the Testo IR 820 thermometer. Gas emissions were more variable in March 2015, but again there was no noise or incandescence observed. The numbers of daily seismic events in March 2015, 3982, were generally within normal levels, ranging from a few to a few hundred per day, depending on type of seismicity.
The temperature at the floor of the crater in April 2015 had risen significantly to 412°C. The seismicity was also changed, with fewer total events (1,973). There was a noticeable drop in the number of events in the second half of April. As reported by INETER seismologist Virginia Tenorio, this decrease in number of events, accompanied by a narrowing of the frequency range to between 3 and 11 Hz, from a normally larger range of 3 to 30 Hz, also occurred prior to the last significant eruption in 2011.
Activity during May-August 2015. On 7 May 2015 at 1609 and 1615, INETER reported that Telica broke its "relative calm" since 26 September 2013 with two gas and ash explosions which rose about 200 m above the rim of the crater. This was the beginning of an eruptive period that included 902 seismically-detected explosions between 7 and 28 May, of which 104 were accompanied by volcanic ash (figure 35). Some also involved ejection of large incandescent lava blocks. Towns within 40 km in a generally W direction were affected by ashfall from these explosions.
An explosion on 12 May ejected rocks 400 m high to the W. Minor ashfall was reported during May in El Realejo (35 km WSW), Corinto (40 km WSW), Posoltega (16 km SW), Guanacastal (20 km WSW), Quezalguaque (12 km SW), Chinandega (30 km W), El Viejo (35 km WNW), and Chichigalpa (20 km WSW). On 20 and 21 May, a series of explosions ejected one-m-diameter blocks up to 500 m from the crater. Many ash plumes were photographed by the INETER web camera located at the TELN seismic station on the E flank; others by INETER scientists at the volcano (figures 36-40).
On only two dates during May did these explosions initiate reports from the Washington VAAC; they reported ash emissions on 11 May rising to 1.8 km and drifting W, and twice on 26 May. The first plume on 26 May extended 75 km W below 3 km altitude, and a second drifted 117 km WNW of the summit at 4.3 km before dissipating.
Visits to the crater on 8 and 14 May revealed a new vent at the base of the S wall of the crater that formed during the 7 May explosion (figure 41). There was a substantial increase in temperature inside the crater from 150°C to 377°C between these dates. The first explosion with incandescent material was observed on 10 May. SO2 measurements of 1,000-1,500 tons per day (t/d) were taken during an explosion on 26 May (figure 42), and values were significantly higher than previous levels of around 300 t/d.
Seismicity in May was high, with 18,858 recorded events. The high number of volcano-tectonic events (VT) during the month (605) was associated with the ruptures that triggered explosions; they have a characteristic frequency of 4.5 to 10.0 Hz. Most of the VT events were located between 6 and 10 km below the surface. The majority of the total seismic events in May were related to degassing and gas explosions (18,087). Screw-type "tornillo" earthquakes are usually rare at Telica, but about 46 of them were observed in May.
The volcano remained relatively calm during June, with the number of daily seismic events typically at 10 or lower, far fewer than May. Even fewer seismic events (71) were recorded in July along with gas emissions that were variable but generally light. The most degassing came from fumaroles located on the inner walls of the crater where the temperature was measured at 298°C. On a 25 August visit to the crater, INETER technicians noted that the points where incandescence had been observed prior to May had disappeared, and temperatures at the fumaroles on the SW and NE walls ranged from 50°C to 160°C.
Activity during September 2015-August 2016. A new gas-and-ash explosion at 0800 on 23 September 2015 sent ash to the NW, W, and SW. The plume rose to 400 m above the crater. Other smaller explosions with small quantities of ash continued that day and the next. Ashfall was reported in the community of Guanacastal (20 km WSW). Additional medium-intensity explosions on 26 September ejected gas, ash, and rock fragments up to 500 m from the crater. Ash plumes reached 1,000 m above the crater and drifted W and NW. The Washington VAAC reported these emissions at 4.3 km altitude, drifting N and W about 45 km (figure 43). This second series of explosions opened a new vent on the N side of the crater floor, and gas emissions continued from both vents. Seismic events in September numbered 775.
During October, no ash explosions were recorded, although 2,921 total seismic events were reported. On 22 November 2015 a new series of explosions began, lasting for eight days. That day, the Washington VAAC reported an ash plume to 2.4 km that drifted about 185 km W. According to a news article published by el19, two explosions, at 0847 and 0848, generated ash plumes that rose 2 km and ejected tephra at least 900 m away (figure 44). Residents in Agua Fría (900 m away) noted it was the first time lapilli and blocks had reached their community. La Prensa reported that ash fell in at least 70 communities in the municipalities of Quezalguaque (13 km SW), Posoltega (16 km WSW), Chichigalpa (20 km WSW), and Chinandega (30 km W).
INETER reported that during 25-27 November numerous small explosions were recorded, most of which generated volcanic ash, with the highest plume reaching 800 m above the crater. Satellite imagery reported from the Washington VAAC showed a faint plume extending about 16 km WSW at 1.2 km altitude on 26 November. Occasional emissions continued until 29 November with several VAAC reports indicating plumes at 1.5 km altitude visible in satellite imagery drifting up to 45 km W and SW.
While no explosions were reported during December 2015, the INETER volcano observer (René Dávila) noted that incandescence was observed in a N-S trending fracture on the crater floor during a visit to the summit. Seismicity was low in December, with a total of 1,342 events recorded, although there was an increase in micro-seismicity during the second half of the month. Even fewer seismic events were reported in January 2016 (171 events), along with few gas emissions that seldom rose above the crater rim.
On 13 February 2016 emissions were observed in visible satellite imagery by the Washington VAAC moving WSW from the summit that likely contained ash. This was preceded by a burst of seismic activity reported by INETER. They noted intermittent high micro-seismicity between 16 February and 1 March. Incandescence from the vent on the crater floor increased during February; lava on the crater floor was first observed by INETER on 25 February. Small gas explosions were observed inside the crater during 24- 26 February followed by five gas-and-ash explosions recorded during 29 February-1 March which generated plumes that rose 300 m above the crater and drifted W and SW. Gas-and-ash emissions lasted for 14 minutes during the strongest of these events.
A visit to the crater on 15 March 2016 by INETER scientists provided additional evidence of incandescence within the crater and a temperature reading of 485° C (figure 45).
From late March through early May, INETER reported incandescence and lava inside a vent on the crater floor, and micro-seismicity remained high even though gas emissions and RSAM values were low. The last report of incandescence from the vent on the crater floor was during the second week of May. RSAM values had dropped to 80 units by 14 May.
Based on information from INETER, SINAPRED reported that 30 explosions occurred during 7-8 May 2016, producing gas-and-ash plumes that rose 600 m and drifted S and SW. The explosions originated from a new vent in the N part of the crater. Seismic RSAM amplitudes spiked to several hundred units between 8 and 12 June, but there were no reports of ash emissions after 8 May from either the Washington VAAC or INETER.
In late July 2016 scientists visited the Las Quemadas, Aguas Frías, (Hot Spring) located 1.7 km north-east of Telica to study temperature and chemistry of the geothermal waters. Seismicity and RSAM values remained low through August 2016 with no further reports of ash emissions or lava in the crater.
Geologic Background. Telica, one of Nicaragua's most active volcanoes, has erupted frequently since the beginning of the Spanish era. This volcano group consists of several interlocking cones and vents with a general NW alignment. Sixteenth-century eruptions were reported at symmetrical Santa Clara volcano at the SW end of the group. However, its eroded and breached crater has been covered by forests throughout historical time, and these eruptions may have originated from Telica, whose upper slopes in contrast are unvegetated. The steep-sided cone of Telica is truncated by a 700-m-wide double crater; the southern crater, the source of recent eruptions, is 120 m deep. El Liston, immediately E, has several nested craters. The fumaroles and boiling mudpots of Hervideros de San Jacinto, SE of Telica, form a prominent geothermal area frequented by tourists, and geothermal exploration has occurred nearby.
Information Contacts: Instituto Nicaragüense de Estudios Territoriales (INETER), Apartado Postal 2110, Managua, Nicaragua (URL: http://webserver2.ineter.gob.ni/vol/dep-vol.html); Washington Volcanic Ash Advisory Center (VAAC), Satellite Analysis Branch (SAB), NOAA/NESDIS OSPO, NOAA Science Center Room 401, 5200 Auth Rd, Camp Springs, MD 20746, USA (URL: http://www.ospo.noaa.gov/Products/atmosphere/vaac/ , archive at: http://www.ssd.noaa.gov/VAAC/archive.html); Sistema Nacional para la Prevencion, Mitigacion y Atencion de Desastres, (SINAPRED), Edificio SINAPRED, Rotonda Comandante Hugo Chávez 50 metros al Norte, frente a la Avenida Bolívar, Managua, Nicaragua (URL: http://www.sinapred.gob.ni/); El19digital, https://www.el19digital.com/articulos/ver/titulo:35988-volcan-telica-registra-fuerte-explosion; La Prensa, http://www.laprensa.com.ni/2015/11/22/departamentales/1940877-volcan-telica-lanza-piedras-cenizas-dos-mil-metros-altura .