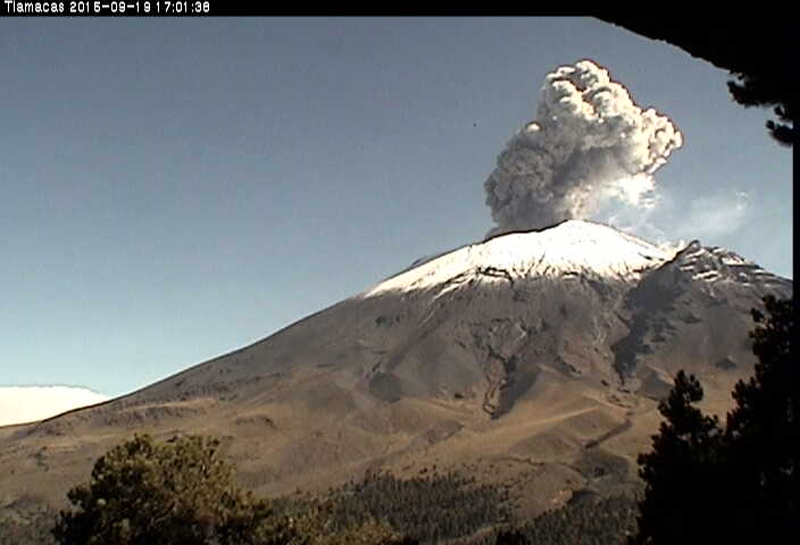
Recently Published Bulletin Reports
Erebus (Antarctica) Lava lake remains active; most thermal alerts recorded since 2019
Rincon de la Vieja (Costa Rica) Frequent phreatic explosions during July-December 2023
Bezymianny (Russia) Explosion on 18 October 2023 sends ash plume 8 km high; lava flows and incandescent avalanches
Kilauea (United States) Low-level lava effusions in the lava lake at Halema’uma’u during July-December 2022
Nyamulagira (DR Congo) Lava flows and thermal activity during May-October 2023
Bagana (Papua New Guinea) Explosions, ash plumes, ashfall, and lava flows during April-September 2023
Mayon (Philippines) Lava flows, pyroclastic flows, ash emissions, and seismicity during April-September 2023
Nishinoshima (Japan) Eruption plumes and gas-and-steam plumes during May-August 2023
Krakatau (Indonesia) White gas-and-steam plumes and occasional ash plumes during May-August 2023
Villarrica (Chile) Strombolian activity, gas-and-ash emissions, and crater incandescence during April-September 2023
Merapi (Indonesia) Frequent incandescent avalanches during April-September 2023
Ebeko (Russia) Moderate explosive activity with ash plumes continued during June-November 2023
Erebus (Antarctica) — January 2024  Cite this Report
Erebus
Antarctica
77.53°S, 167.17°E; summit elev. 3794 m
All times are local (unless otherwise noted)
Lava lake remains active; most thermal alerts recorded since 2019
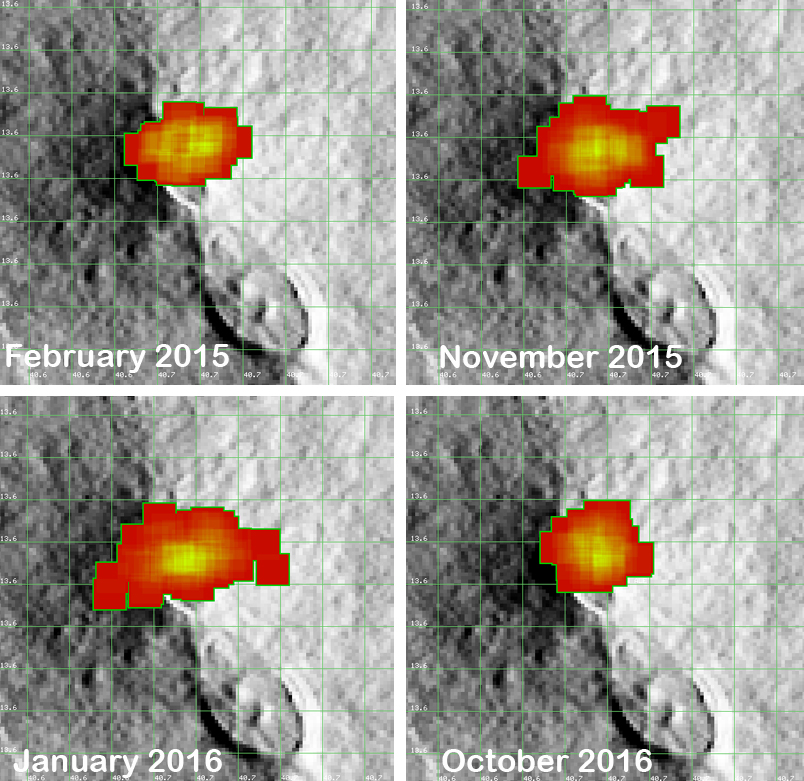
The lava lake in the summit crater of Erebus has been active since at least 1972. Located in Antarctica overlooking the McMurdo Station on Ross Island, it is the southernmost active volcano on the planet. Because of the remote location, activity is primarily monitored by satellites. This report covers activity during 2023.
The number of thermal alerts recorded by the Hawai'i Institute of Geophysics and Planetology’s MODVOLC Thermal Alerts System increased considerably in 2023 compared to the years 2020-2022 (table 9). In contrast to previous years, the MODIS instruments aboard the Aqua and Terra satellites captured data from Erebus every month during 2023. Consistent with previous years, the lowest number of anomalous pixels were recorded in January, November, and December.
Table 9. Number of monthly MODIS-MODVOLC thermal alert pixels recorded at Erebus during 2017-2023. See BGVN 42:06 for data from 2000 through 2016. The table was compiled using data provided by the HIGP – MODVOLC Thermal Alerts System.
| Year |
Jan |
Feb |
Mar |
Apr |
May |
Jun |
Jul |
Aug |
Sep |
Oct |
Nov |
Dec |
SUM |
| 2017 |
0 |
21 |
9 |
0 |
0 |
1 |
11 |
61 |
76 |
52 |
0 |
3 |
234 |
| 2018 |
0 |
21 |
58 |
182 |
55 |
17 |
137 |
172 |
103 |
29 |
0 |
0 |
774 |
| 2019 |
2 |
21 |
162 |
151 |
55 |
56 |
75 |
53 |
29 |
19 |
1 |
0 |
624 |
| 2020 |
0 |
2 |
16 |
18 |
4 |
4 |
1 |
3 |
18 |
3 |
1 |
6 |
76 |
| 2021 |
0 |
9 |
1 |
0 |
2 |
56 |
46 |
47 |
35 |
52 |
5 |
3 |
256 |
| 2022 |
1 |
13 |
55 |
22 |
15 |
32 |
39 |
19 |
31 |
11 |
0 |
0 |
238 |
| 2023 |
2 |
33 |
49 |
82 |
41 |
32 |
70 |
64 |
42 |
17 |
5 |
11 |
448 |
Sentinel-2 infrared images showed one or two prominent heat sources within the summit crater, accompanied by adjacent smaller sources, similar to recent years (see BGVN 46:01, 47:02, and 48:01). A unique image was obtained on 25 November 2023 by the OLI-2 (Operational Land Imager-2) on Landsat 9, showing the upper part of the volcano surrounded by clouds (figure 32).
Geologic Background. Mount Erebus, the world's southernmost historically active volcano, overlooks the McMurdo research station on Ross Island. It is the largest of three major volcanoes forming the crudely triangular Ross Island. The summit of the dominantly phonolitic volcano has been modified by one or two generations of caldera formation. A summit plateau at about 3,200 m elevation marks the rim of the youngest caldera, which formed during the late-Pleistocene and within which the modern cone was constructed. An elliptical 500 x 600 m wide, 110-m-deep crater truncates the summit and contains an active lava lake within a 250-m-wide, 100-m-deep inner crater; other lava lakes are sometimes present. The glacier-covered volcano was erupting when first sighted by Captain James Ross in 1841. Continuous lava-lake activity with minor explosions, punctuated by occasional larger Strombolian explosions that eject bombs onto the crater rim, has been documented since 1972, but has probably been occurring for much of the volcano's recent history.
Information Contacts: Hawai'i Institute of Geophysics and Planetology (HIGP) - MODVOLC Thermal Alerts System, School of Ocean and Earth Science and Technology (SOEST), Univ. of Hawai'i, 2525 Correa Road, Honolulu, HI 96822, USA (URL: http://modis.higp.hawaii.edu/); Copernicus Browser, Copernicus Data Space Ecosystem, European Space Agency (URL: https://dataspace.copernicus.eu/browser/); NASA Earth Observatory, EOS Project Science Office, NASA Goddard Space Flight Center, Goddard, Maryland, USA (URL: https://earthobservatory.nasa.gov/images/152134/erebus-breaks-through).
Rincon de la Vieja (Costa Rica) — January 2024 Cite this Report
Rincon de la Vieja
Costa Rica
10.83°N, 85.324°W; summit elev. 1916 m
All times are local (unless otherwise noted)
Frequent phreatic explosions during July-December 2023
Rincón de la Vieja is a volcanic complex in Costa Rica with a hot convecting acid lake that exhibits frequent weak phreatic explosions, gas-and-steam emissions, and occasional elevated sulfur dioxide levels (BGVN 45:10, 46:03, 46:11). The current eruption period began June 2021. This report covers activity during July-December 2023 and is based on weekly bulletins and occasional daily reports from the Observatorio Vulcanologico Sismologica de Costa Rica-Universidad Nacional (OVSICORI-UNA).
Numerous weak phreatic explosions continued during July-December 2023, along with gas-and-steam emissions and plumes that rose as high as 3 km above the crater rim. Many weekly OVSICORI-UNA bulletins included the previous week's number of explosions and emissions (table 9). For many explosions, the time of explosion was given (table 10). Frequent seismic activity (long-period earthquakes, volcano-tectonic earthquakes, and tremor) accompanied the phreatic activity.
Table 9. Number of reported weekly phreatic explosions and gas-and-steam emissions at Rincón de la Vieja, July-December 2023. Counts are reported for the week before the Weekly Bulletin date; not all reports included these data. Courtesy of OVSICORI-UNA.
| OVSICORI Weekly Bulletin |
Number of explosions |
Number of emissions |
| 28 Jul 2023 |
6 |
14 |
| 4 Aug 2023 |
10 |
12 |
| 1 Sep 2023 |
13 |
11 |
| 22 Sep 2023 |
12 |
13 |
| 29 Sep 2023 |
6 |
11 |
| 6 Oct 2023 |
12 |
5 |
| 13 Oct 2023 |
7 |
9 |
| 20 Oct 2023 |
1 |
15 |
| 27 Oct 2023 |
3 |
23 |
| 3 Nov 2023 |
3 |
10 |
| 17 Nov 2023 |
0 |
Some |
| 24 Nov 2023 |
0 |
14 |
| 8 Dec 2023 |
4 |
16 |
| 22 Dec 2023 |
8 |
18 |
Table 10. Summary of activity at Rincón de la Vieja during July-December 2023. Weak phreatic explosions and gas emissions are noted where the time of explosion was indicated in the weekly or daily bulletins. Height of plumes or emissions are distance above the crater rim. Courtesy of OVSICORI-UNA.
| Date |
Time |
Description of Activity |
| 1 Jul 2023 |
0156 |
Explosion. |
| 2 Jul 2023 |
0305 |
Explosion. |
| 4 Jul 2023 |
0229, 0635 |
Event at 0635 produced a gas-and-steam plume that rose 700 m and drifted W; seen by residents in Liberia (21 km SW). |
| 9 Jul 2023 |
1843 |
Explosion. |
| 21 Jul 2023 |
0705 |
Explosion. |
| 26 Jul 2023 |
1807 |
Explosion. |
| 28 Jul 2023 |
0802 |
Explosion generated a gas-and-steam plume that rose 500 m. |
| 30 Jul 2023 |
1250 |
Explosion. |
| 31 Jul 2023 |
2136 |
Explosion. |
| 11 Aug 2023 |
0828 |
Explosion. |
| 18 Aug 2023 |
1304 |
Explosion. |
| 21 Aug 2023 |
1224 |
Explosion generated gas-and-steam plumes rose 500-600 m. |
| 22 Aug 2023 |
0749 |
Explosion generated gas-and-steam plumes rose 500-600 m. |
| 24 Aug 2023 |
1900 |
Explosion. |
| 25 Aug 2023 |
0828 |
Event produced a steam-and-gas plume that rose 3 km and drifted NW. |
| 27-28 Aug 2023 |
0813 |
Four small events; the event at 0813 on 28 August lasted two minutes and generated a steam-and-gas plume that rose 2.5 km. |
| 1 Sep 2023 |
1526 |
Explosion generated plume that rose 2 km and ejected material onto the flanks. |
| 2-3 Sep 2023 |
- |
Small explosions detected in infrasound data. |
| 4 Sep 2023 |
1251 |
Gas-and-steam plume rose 1 km and drifted W. |
| 7 Nov 2023 |
1113 |
Explosion. |
| 8 Nov 2023 |
0722 |
Explosion. |
| 12 Nov 2023 |
0136 |
Small gas emissions. |
| 14 Nov 2023 |
0415 |
Small gas emissions. |
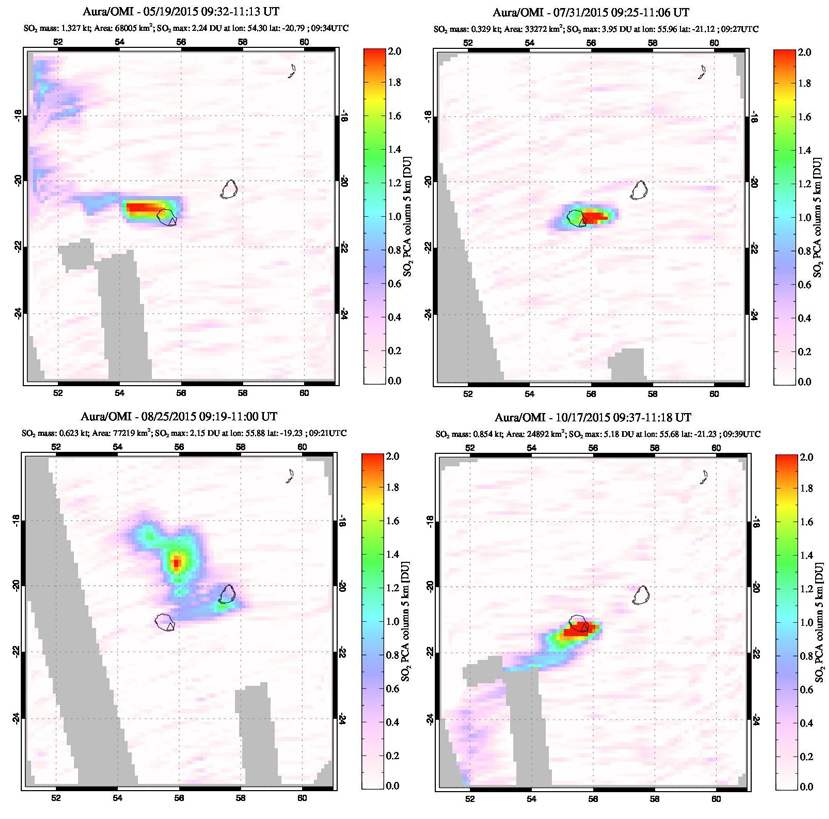
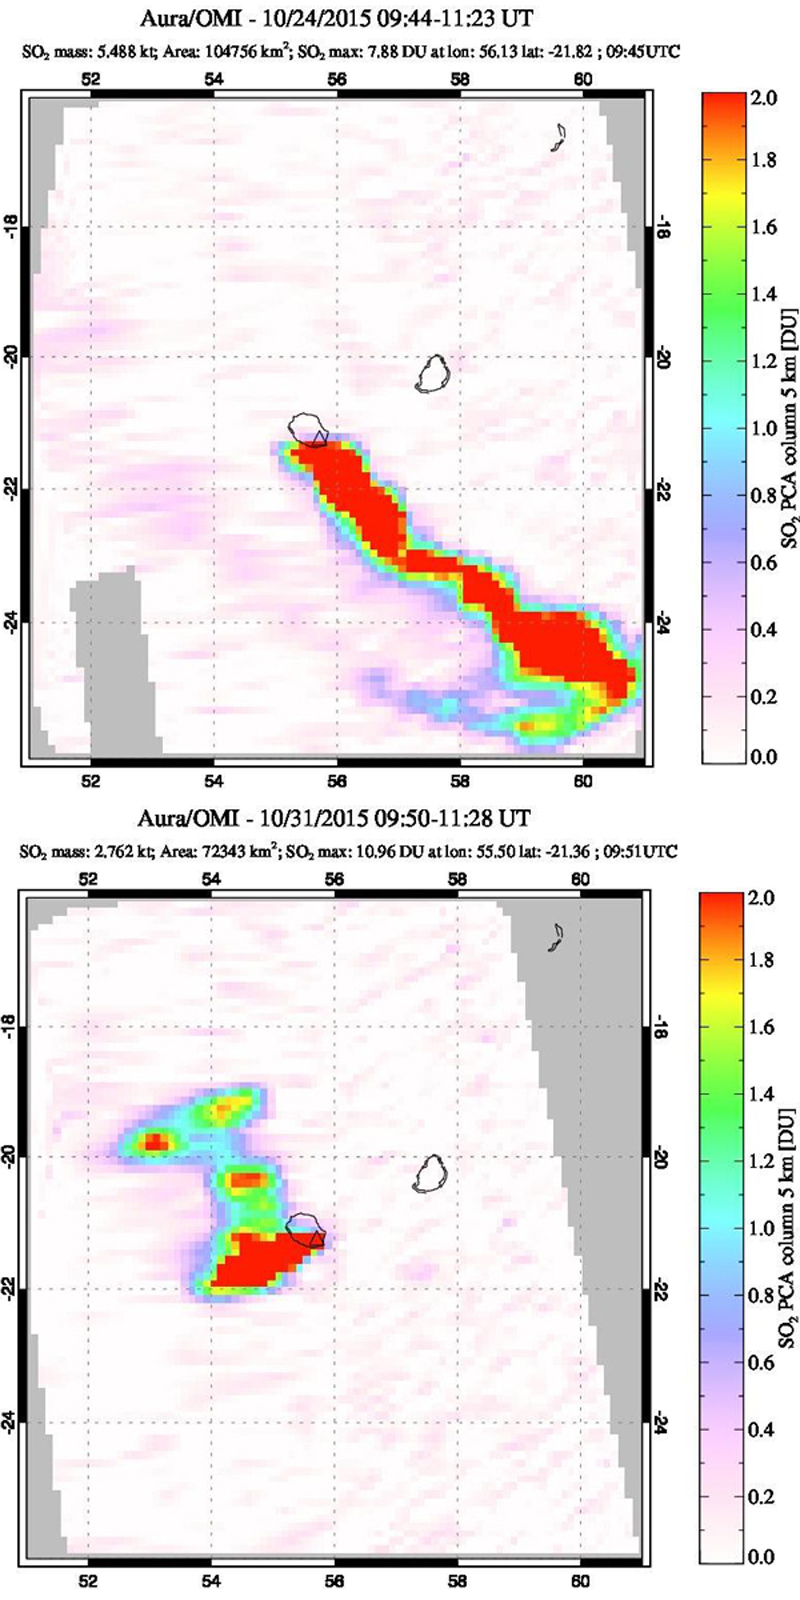
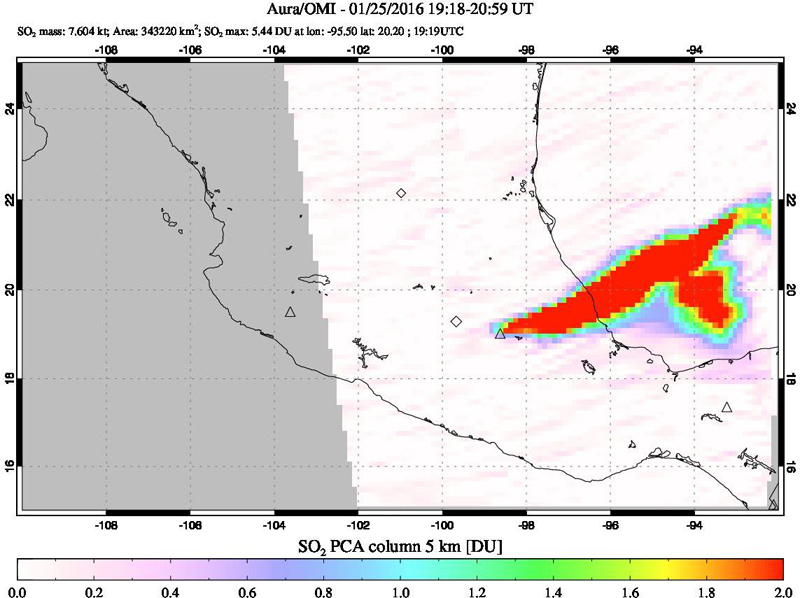
According to OVSICORI-UNA, during July-October the average weekly sulfur dioxide (SO2) flux ranged from 68 to 240 tonnes/day. However, in mid-November the flux increased to as high as 334 tonnes/day, the highest value measured in recent years. The high SO2 flux in mid-November was also detected by the TROPOMI instrument on the Sentinel-5P satellite (figure 43).
Geologic Background. Rincón de la Vieja, the largest volcano in NW Costa Rica, is a remote volcanic complex in the Guanacaste Range. The volcano consists of an elongated, arcuate NW-SE-trending ridge constructed within the 15-km-wide early Pleistocene Guachipelín caldera, whose rim is exposed on the south side. Sometimes known as the "Colossus of Guanacaste," it has an estimated volume of 130 km3 and contains at least nine major eruptive centers. Activity has migrated to the SE, where the youngest-looking craters are located. The twin cone of Santa María volcano, the highest peak of the complex, is located at the eastern end of a smaller, 5-km-wide caldera and has a 500-m-wide crater. A Plinian eruption producing the 0.25 km3 Río Blanca tephra about 3,500 years ago was the last major magmatic eruption. All subsequent eruptions, including numerous historical eruptions possibly dating back to the 16th century, have been from the prominent active crater containing a 500-m-wide acid lake located ENE of Von Seebach crater.
Information Contacts: Observatorio Vulcanológico Sismológica de Costa Rica-Universidad Nacional (OVSICORI-UNA), Apartado 86-3000, Heredia, Costa Rica (URL: http://www.ovsicori.una.ac.cr/); NASA Global Sulfur Dioxide Monitoring Page, Atmospheric Chemistry and Dynamics Laboratory, NASA Goddard Space Flight Center (NASA/GSFC), 8800 Greenbelt Road, Goddard MD 20771, USA (URL: https://so2.gsfc.nasa.gov/).
Bezymianny (Russia) — November 2023 Cite this Report
Bezymianny
Russia
55.972°N, 160.595°E; summit elev. 2882 m
All times are local (unless otherwise noted)
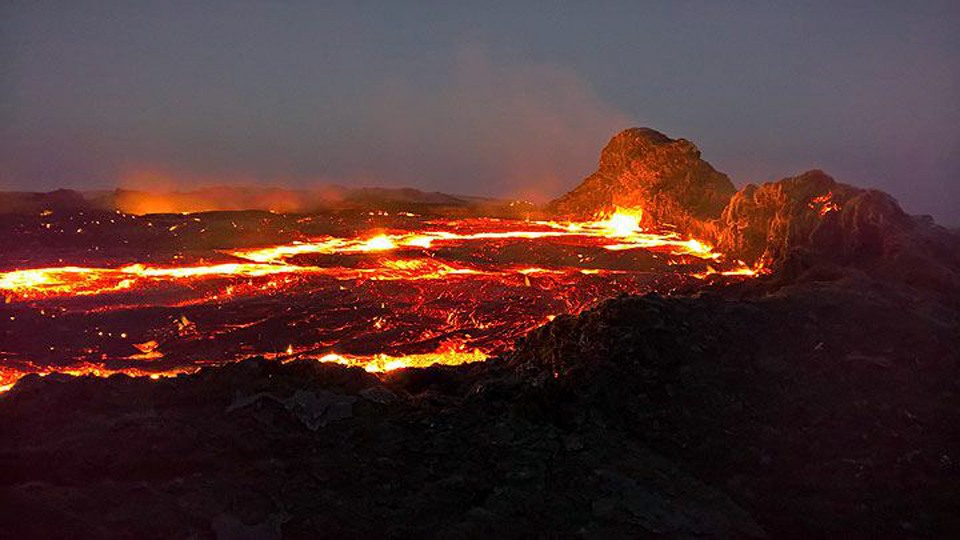
Explosion on 18 October 2023 sends ash plume 8 km high; lava flows and incandescent avalanches
Bezymianny, located on Russia’s Kamchatka Peninsula, has had eruptions since 1955 characterized by dome growth, explosions, pyroclastic flows, ash plumes, and ashfall. Activity during November 2022-April 2023 included gas-and-steam emissions, lava dome collapses generating avalanches, and persistent thermal activity. Similar eruptive activity continued from May through October 2023, described here based on information from weekly and daily reports of the Kamchatka Volcano Eruptions Response Team (KVERT), notices from Tokyo VAAC (Volcanic Ash Advisory Center), and from satellite data.
Overall activity decreased after the strong period of activity in late March through April 2023, which included ash explosions during 29 March and 7-8 April 2023 that sent plumes as high as 10-12 km altitude, along with dome growth and lava flows (BGVN 48:05). This reduced activity can be seen in the MIROVA thermal detection system graph (figure 56), which was consistent with data from the MODVOLC thermal detection system and with Sentinel-2 satellite images that showed persistent hotspots in the summit crater when conditions allowed observations. A renewed period of strong activity began in mid-October 2023.
Activity increased significantly on 17 October 2023 when large collapses began during 0700-0830 on the E flanks of the lava dome and continued to after 0930 the next day (figure 57). Ash plumes rose to an altitude of 4.5-5 km, extending 220 km NNE by 18 October. A large explosion at 1630 on 18 October produced an ash plume that rose to an altitude of 11 km (8 km above the summit) and drifted NNE and then NW, extending 900 km NW within two days at an altitude of 8 km. Minor ashfall was noted in Kozyrevsk (45 km WNW). At 0820 on 20 October an ash plume was identified in satellite images drifting 100 km ENE at altitudes of 4-4.5 km.
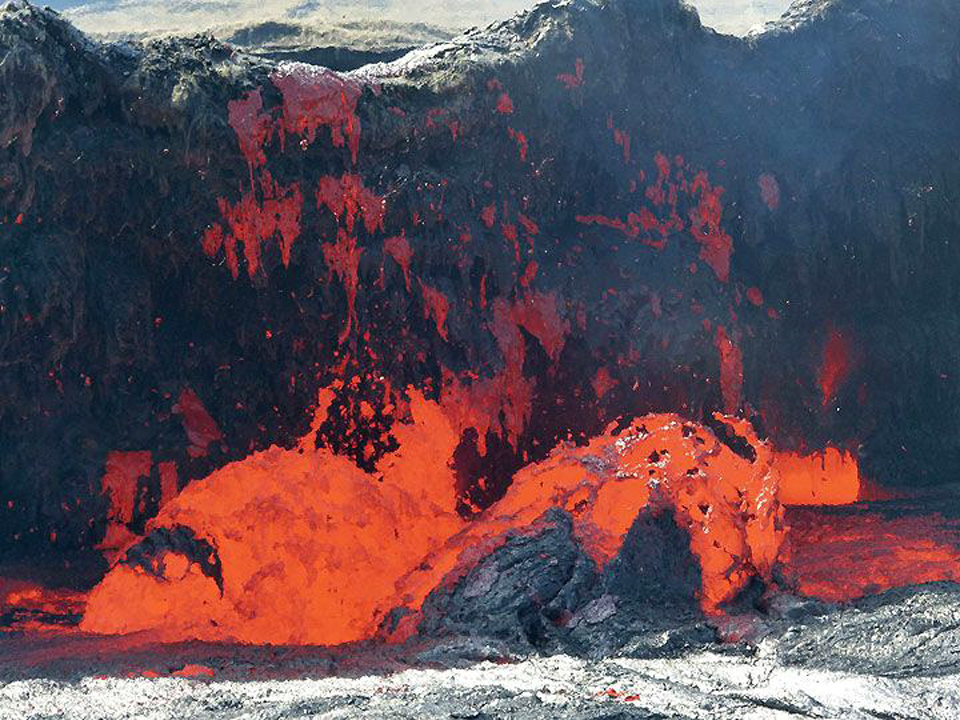
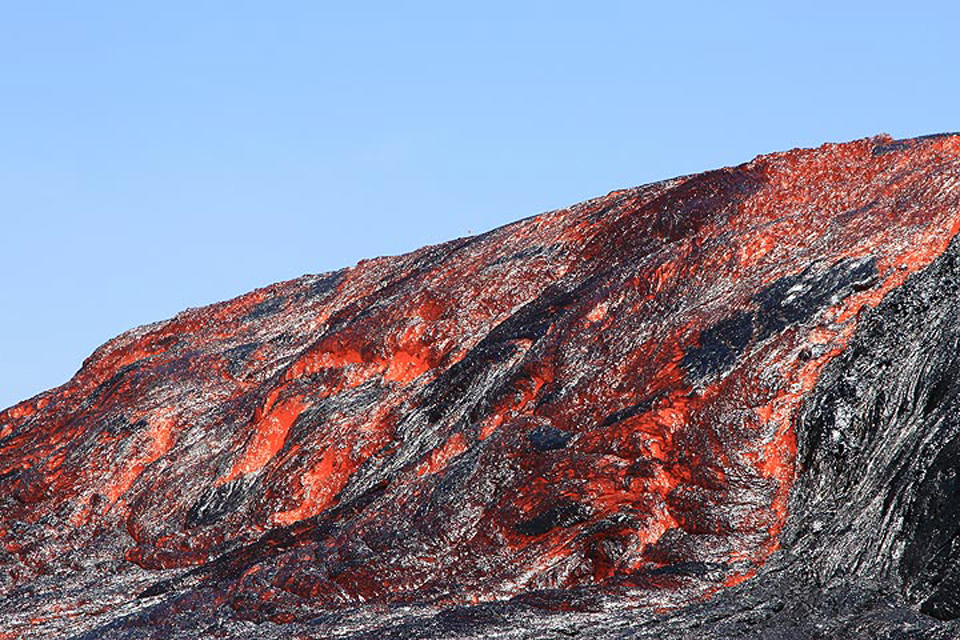
Lava flows and hot avalanches from the dome down the SE flank continued over the next few days, including 23 October when clear conditions allowed good observations (figures 58 and 59). A large thermal anomaly was observed over the volcano through 24 October, and in the summit crater on 30 October (figure 60). Strong fumarolic activity continued, with numerous avalanches and occasional incandescence. By the last week of October, volcanic activity had decreased to a level consistent with that earlier in the reporting period.
Aviation warnings were frequently updated during 17-20 October. KVERT issued a Volcano Observatory Notice for Aviation (VONA) on 17 October at 1419 and 1727 (0219 and 0527 UTC) raising the Aviation Color Code (ACC) from Yellow to Orange (second highest level). The next day, KVERT issued a VONA at 1705 (0505 UTC) raising the ACC to Red (highest level) but lowered it back to Orange at 2117 (0917 UTC). After another decrease to Yellow and back to Orange, the ACC was reduced to Yellow on 20 October at 1204 (0004 UTC). In addition, the Tokyo VAAC issued a series of Volcanic Ash Advisories beginning on 16 October and continuing through 30 October.
Geologic Background. The modern Bezymianny, much smaller than its massive neighbors Kamen and Kliuchevskoi on the Kamchatka Peninsula, was formed about 4,700 years ago over a late-Pleistocene lava-dome complex and an edifice built about 11,000-7,000 years ago. Three periods of intensified activity have occurred during the past 3,000 years. The latest period, which was preceded by a 1,000-year quiescence, began with the dramatic 1955-56 eruption. This eruption, similar to that of St. Helens in 1980, produced a large open crater that was formed by collapse of the summit and an associated lateral blast. Subsequent episodic but ongoing lava-dome growth, accompanied by intermittent explosive activity and pyroclastic flows, has largely filled the 1956 crater.
Information Contacts: Kamchatka Volcanic Eruptions Response Team (KVERT), Far Eastern Branch, Russian Academy of Sciences, 9 Piip Blvd., Petropavlovsk-Kamchatsky, 683006, Russia (URL: http://www.kscnet.ru/ivs/kvert/); Kamchatka Volcanological Station, Kamchatka Branch of Geophysical Survey, (KB GS RAS), Klyuchi, Kamchatka Krai, Russia (URL: http://volkstat.ru/); Tokyo Volcanic Ash Advisory Center (VAAC), 1-3-4 Otemachi, Chiyoda-ku, Tokyo 100-8122, Japan (URL: http://ds.data.jma.go.jp/svd/vaac/data/); Hawai'i Institute of Geophysics and Planetology (HIGP) - MODVOLC Thermal Alerts System, School of Ocean and Earth Science and Technology (SOEST), Univ. of Hawai'i, 2525 Correa Road, Honolulu, HI 96822, USA (URL: http://modis.higp.hawaii.edu/); MIROVA (Middle InfraRed Observation of Volcanic Activity), a collaborative project between the Universities of Turin and Florence (Italy) supported by the Centre for Volcanic Risk of the Italian Civil Protection Department (URL: http://www.mirovaweb.it/); Copernicus Browser, Copernicus Data Space Ecosystem, European Space Agency (URL: https://dataspace.copernicus.eu/browser/).chr
Kilauea (United States) — January 2023 Cite this Report
Kilauea
United States
19.421°N, 155.287°W; summit elev. 1222 m
All times are local (unless otherwise noted)
Low-level lava effusions in the lava lake at Halema’uma’u during July-December 2022
Kīlauea is the southeastern-most volcano in Hawaii and overlaps the E flank of the Mauna Loa volcano. Its East Rift Zone (ERZ) has been intermittently active for at least 2,000 years. An extended eruption period began in January 1983 and was characterized by open lava lakes and lava flows from the summit caldera and the East Rift Zone. During May 2018 magma migrated into the Lower East Rift Zone (LERZ) and opened 24 fissures along a 6-km-long NE-trending fracture zone that produced lava flows traveling in multiple directions. As lava emerged from the fissures, the lava lake at Halema'uma'u drained and explosions sent ash plumes to several kilometers altitude (BGVN 43:10).
The current eruption period started during September 2021 and has recently been characterized by lava effusions, spatter, and sulfur dioxide emissions in the active Halema’uma’u lava lake (BGVN 47:08). Lava effusions, some spatter, and sulfur dioxide emissions have continued during this reporting period of July through December 2022 using daily reports, volcanic activity notices, and abundant photo, map, and video data from the US Geological Survey's (USGS) Hawaiian Volcano Observatory (HVO).
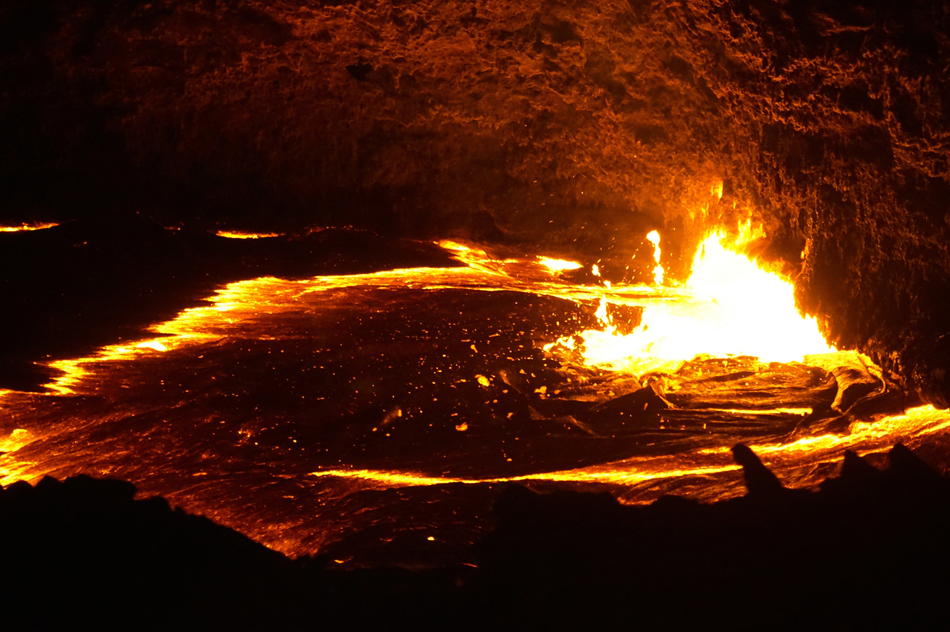
Summary of activity during July-December 2022. Low-level effusions have continued at the western vent of the Halema’uma’u crater during July through early December 2022. Occasional weak ooze-outs (also called lava break outs) would occur along the margins of the crater floor. The overall level of the active lava lake throughout the reporting period gradually increased due to infilling, however it stagnated in mid-September (table 13). During September through November, activity began to decline, though lava effusions persisted at the western vent. By 9 December, the active part of the lava lake had completely crusted over, and incandescence was no longer visible.
Table 13. Summary of measurements taken during overflights at Kīlauea that show a gradual increase in the active lava lake level and the volume of lava effused since 29 September 2021. Lower activity was reported during September-October. Data collected during July-December 2022. Courtesy of HVO.
| Date: |
Level of the active lava lake (m): |
Cumulative volume of lava effused (million cubic meters): |
| 7 Jul 2022 |
130 |
95 |
| 19 Jul 2022 |
133 |
98 |
| 4 Aug 2022 |
136 |
102 |
| 16 Aug 2022 |
137 |
104 |
| 12 Sep 2022 |
143 |
111 |
| 5 Oct 2022 |
143 |
111 |
| 28 Oct 2022 |
143 |
111 |
Activity during July 2022. Lava effusions were reported from the western vent in the Halema’uma’u crater, along with occasional weak ooze-outs along the margins of the crater floor. The height of the lava lake was variable due to deflation-inflation tilt events; for example, the lake level dropped approximately 3-4 m during a summit deflation-inflation event reported on 1 July. Webcam images taken during the night of 6-12 July showed intermittent low-level spattering at the western vent that rose less than 10 m above the vent (figure 519). Measurements made during an overflight on 7 July indicated that the crater floor was infilled about 130 m and that 95 million cubic meters of lava had been effused since 29 September 2021. A single, relatively small lava ooze-out was active to the S of the lava lake. Around midnight on 8 July there were two brief periods of lava overflow onto the lake margins. On 9 July lava ooze-outs were reported near the SE and NE edges of the crater floor and during 10-11 July they occurred near the E, NE, and NW edges. On 16 July crater incandescence was reported, though the ooze-outs and spattering were not visible. On 18 July overnight webcam images showed incandescence in the western vent complex and two ooze-outs were reported around 0000 and 0200 on 19 July. By 0900 there were active ooze-outs along the SW edge of the crater floor. Measurements made from an overflight on 19 July indicated that the crater floor was infilled about 133 m and 98 million cubic meters of lava had erupted since 29 September 2021 (figure 520). On 20 July around 1600 active ooze-outs were visible along the N edge of the crater, which continued through the next day. Extensive ooze-outs occurred along the W margin during 24 July until 1900; on 26 July minor ooze-outs were noted along the N margin. Minor spattering was visible on 29 July along the E margin of the lake. The sulfur dioxide emission rates ranged 650-2,800 tons per day (t/d), the higher of which was measured on 8 July (figure 519).
Activity during August 2022. The eruption continued in the Halema’uma’u crater at the western vent. According to HVO the lava in the active lake remained at the level of the bounding levees. Occasional minor ooze-outs were observed along the margins of the crater floor. Strong nighttime crater incandescence was visible after midnight on 6 August over the western vent cone. During 6-7 August scattered small lava lobes were active along the crater floor and incandescence persisted above the western vent through 9 August. During 7-9 August HVO reported a single lava effusion source was active along the NW margin of the crater floor. Measurements from an overflight on 4 August indicated that the crater floor was infilled about 136 m total and that 102 million cubic meters of lava had been erupted since the start of the eruption. Lava breakouts were reported along the N, NE, E, S, and W margins of the crater during 10-16 August. Another overflight survey conducted on 16 August indicated that the crater floor infilled about 137 m and 104 million cubic meters of lava had been erupted since September 2021. Measured sulfur dioxide emissions rates ranged 1,150-2,450 t/d, the higher of which occurred on 8 August.
Activity during September 2022. During September, lava effusion continued from the western vent into the active lava lake and onto the crater floor. Intermittent minor ooze-outs were reported through the month. A small ooze-out was visible on the W crater floor margin at 0220 on 2 September, which showed decreasing surface activity throughout the day, but remained active through 3 September. On 3 September around 1900 a lava outbreak occurred along the NW margin of the crater floor but had stopped by the evening of 4 September. Field crews monitoring the summit lava lake on 9 September observed spattering on the NE margin of the lake that rose no higher than 10 m, before falling back onto the lava lake crust (figure 521). Overflight measurements on 12 September indicated that the crater floor was infilled a total of 143 m and 111 million cubic meters of lava had been erupted since September 2021. Extensive breakouts in the W and N part of the crater floor were reported at 1600 on 20 September and continued into 26 September. The active part of the lava lake dropped by 10 m while other parts of the crater floor dropped by several meters. Summit tiltmeters recorded a summit seismic swarm of more than 80 earthquakes during 1500-1800 on 21 September, which occurred about 1.5 km below Halema’uma’u; a majority of these were less than Mw 2. By 22 September the active part of the lava lake was infilled about 2 m. On 23 September the western vent areas exhibited several small spatter cones with incandescent openings, along with weak, sporadic spattering (figure 522). The sulfur dioxide emission rate ranged from 930 t/d to 2,000 t/d, the higher of which was measured on 6 September.
Activity during October 2022. Activity during October declined slightly compared to previous months, though lava effusions persisted from the western vent into the active lava lake and onto the crater floor during October (figure 523). Slight variations in the lava lake were noted throughout the month. HVO reported that around 0600 on 3 October the level of the lava lake has lowered slightly. Overflight measurements taken on 5 October indicated that the crater floor was infilled a total of about 143 m and that 111 million cubic meters of lava had been effused since September 2021. During 6-7 October the lake gradually rose 0.5 m. Sulfur dioxide measurements made on 22 October had an emission rate of 700 t/d. Another overflight taken on 28 October showed that there was little to no change in the elevation of the crater floor: the crater floor was infilled a total of 143 m and 111 million cubic meters of lava had erupted since the start of the eruption.
Activity during November 2022. Activity remained low during November, though HVO reported that lava from the western vent continued to effuse into the active lava lake and onto the crater floor throughout the month. The rate of sulfur dioxide emissions during November ranged from 300-600 t/d, the higher amount of which occurred on 9 November.
Activity during December 2022. Similar low activity was reported during December, with lava effusing from the western vent into the active lava lake and onto the crater floor. During 4-5 December the active part of the lava lake was slightly variable in elevation and fluctuated within 1 m. On 9 December HVO reported that lava was no longer erupting from the western vent in the Halema’uma’u crater and that sulfur dioxide emissions had returned to near pre-eruption background levels; during 10-11 December, the lava lake had completely crusted over, and no incandescence was visible (figure 524). Time lapse camera images covering the 4-10 December showed that the crater floor showed weak deflation and no inflation. Some passive events of crustal overturning were reported during 14-15 December, which brought fresh incandescent lava to the lake surface. The sulfur dioxide emission rate was approximately 200 t/d on 14 December. A smaller overturn event on 17 December and another that occurred around 0000 and into the morning of 20 December were also detected. A small seismic swarm was later detected on 30 December.
Geologic Background. Kilauea overlaps the E flank of the massive Mauna Loa shield volcano in the island of Hawaii. Eruptions are prominent in Polynesian legends; written documentation since 1820 records frequent summit and flank lava flow eruptions interspersed with periods of long-term lava lake activity at Halemaumau crater in the summit caldera until 1924. The 3 x 5 km caldera was formed in several stages about 1,500 years ago and during the 18th century; eruptions have also originated from the lengthy East and Southwest rift zones, which extend to the ocean in both directions. About 90% of the surface of the basaltic shield volcano is formed of lava flows less than about 1,100 years old; 70% of the surface is younger than 600 years. The long-term eruption from the East rift zone between 1983 and 2018 produced lava flows covering more than 100 km2, destroyed hundreds of houses, and added new coastline.
Information Contacts: Hawaiian Volcano Observatory (HVO), U.S. Geological Survey, PO Box 51, Hawai'i National Park, HI 96718, USA (URL: http://hvo.wr.usgs.gov/).
Nyamulagira (DR Congo) — November 2023 Cite this Report
Nyamulagira
DR Congo
1.408°S, 29.2°E; summit elev. 3058 m
All times are local (unless otherwise noted)
Lava flows and thermal activity during May-October 2023
Nyamulagira (also known as Nyamuragira) is a shield volcano in the Democratic Republic of Congo with the summit truncated by a small 2 x 2.3 km caldera with walls up to about 100 m high. Documented eruptions have occurred within the summit caldera, as well as from numerous flank fissures and cinder cones. The current eruption period began in April 2018 and has more recently been characterized by summit crater lava flows and thermal activity (BGVN 48:05). This report describes lava flows and variable thermal activity during May through October 2023, based on information from the Observatoire Volcanologique de Goma (OVG) and various satellite data.
Lava lake activity continued during May. The MIROVA (Middle InfraRed Observation of Volcanic Activity) system recorded moderate-to-strong thermal activity throughout the reporting period; activity was more intense during May and October and relatively weaker from June through September (figure 95). The MODVOLC thermal algorithm, detected a total of 209 thermal alerts. There were 143 hotspots detected during May, eight during June, nine during September, and 49 during October. This activity was also reflected in infrared satellite images, where a lava flow was visible in the NW part of the crater on 7 May and strong activity was seen in the center of the crater on 4 October (figure 96). Another infrared satellite image taken on 12 May showed still active lava flows along the NW margin of the crater. According to OVG lava effusions were active during 7-29 May and moved to the N and NW parts of the crater beginning on 9 May. Strong summit crater incandescence was visible from Goma (27 km S) during the nights of 17, 19, and 20 May (figure 97). On 17 May there was an increase in eruptive activity, which peaked at 0100 on 20 May. Notable sulfur dioxide plumes drifted NW and W during 19-20 May (figure 98). Drone footage acquired in partnership with the USGS (United States Geological Survey) on 20 May captured images of narrow lava flows that traveled about 100 m down the W flank (figure 99). Data from the Rumangabo seismic station indicated a decreasing trend in activity during 17-21 May. Although weather clouds prevented clear views of the summit, a strong thermal signature on the NW flank was visible in an infrared satellite image on 22 May, based on an infrared satellite image. On 28 May the lava flows on the upper W flank began to cool and solidify. By 29 May seismicity returned to levels similar to those recorded before the 17 May increase. Lava effusion continued but was confined to the summit crater; periodic crater incandescence was observed.
Low-level activity was noted during June through October. On 1 June OVG reported that seismicity remained at lower levels and that crater incandescence had been absent for three days, though infrared satellite imagery showed continued lava effusion in the summit crater. The lava flows on the flanks covered an estimated 0.6 km2. Satellite imagery continued to show thermal activity confined to the lava lake through October (figure 96), although no lava flows or significant sulfur dioxide emissions were reported.
Geologic Background. Africa's most active volcano, Nyamulagira (also known as Nyamuragira), is a massive high-potassium basaltic shield about 25 km N of Lake Kivu and 13 km NNW of the steep-sided Nyiragongo volcano. The summit is truncated by a small 2 x 2.3 km caldera that has walls up to about 100 m high. Documented eruptions have occurred within the summit caldera, as well as from the numerous flank fissures and cinder cones. A lava lake in the summit crater, active since at least 1921, drained in 1938, at the time of a major flank eruption. Recent lava flows extend down the flanks more than 30 km from the summit as far as Lake Kivu; extensive lava flows from this volcano have covered 1,500 km2 of the western branch of the East African Rift.
Information Contacts: Observatoire Volcanologique de Goma (OVG), Departement de Geophysique, Centre de Recherche en Sciences Naturelles, Lwiro, D.S. Bukavu, DR Congo; Hawai'i Institute of Geophysics and Planetology (HIGP) - MODVOLC Thermal Alerts System, School of Ocean and Earth Science and Technology (SOEST), Univ. of Hawai'i, 2525 Correa Road, Honolulu, HI 96822, USA (URL: http://modis.higp.hawaii.edu/); MIROVA (Middle InfraRed Observation of Volcanic Activity), a collaborative project between the Universities of Turin and Florence (Italy) supported by the Centre for Volcanic Risk of the Italian Civil Protection Department (URL: http://www.mirovaweb.it/); NASA Global Sulfur Dioxide Monitoring Page, Atmospheric Chemistry and Dynamics Laboratory, NASA Goddard Space Flight Center (NASA/GSFC), 8800 Greenbelt Road, Goddard, Maryland, USA (URL: https://so2.gsfc.nasa.gov/); Copernicus Browser, Copernicus Data Space Ecosystem, European Space Agency (URL: https://dataspace.copernicus.eu/browser/); Charles Balagizi, Goma Volcano Observatory, Departement de Geophysique, Centre de Recherche en Sciences Naturelles, Lwiro, D.S. Bukavu, DR Congo.
Bagana (Papua New Guinea) — October 2023 Cite this Report
Bagana
Papua New Guinea
6.137°S, 155.196°E; summit elev. 1855 m
All times are local (unless otherwise noted)
Explosions, ash plumes, ashfall, and lava flows during April-September 2023
The remote volcano of Bagana is located in central Bougainville Island, Papua New Guinea. Recorded eruptions date back to 1842 and activity has consisted of effusive activity that has built a small lava dome in the summit crater and occasional explosions that produced pyroclastic flows. The most recent eruption has been ongoing since February 2000 and has produced occasional explosions, ash plumes, and lava flows. More recently, activity has been characterized by ongoing effusive activity and ash emissions (BGVN 48:04). This report updates activity from April through September 2023 that has consisted of explosions, ash plumes, ashfall, and lava flows, using information from the Darwin Volcanic Ash Advisory Center (VAAC) and satellite data.
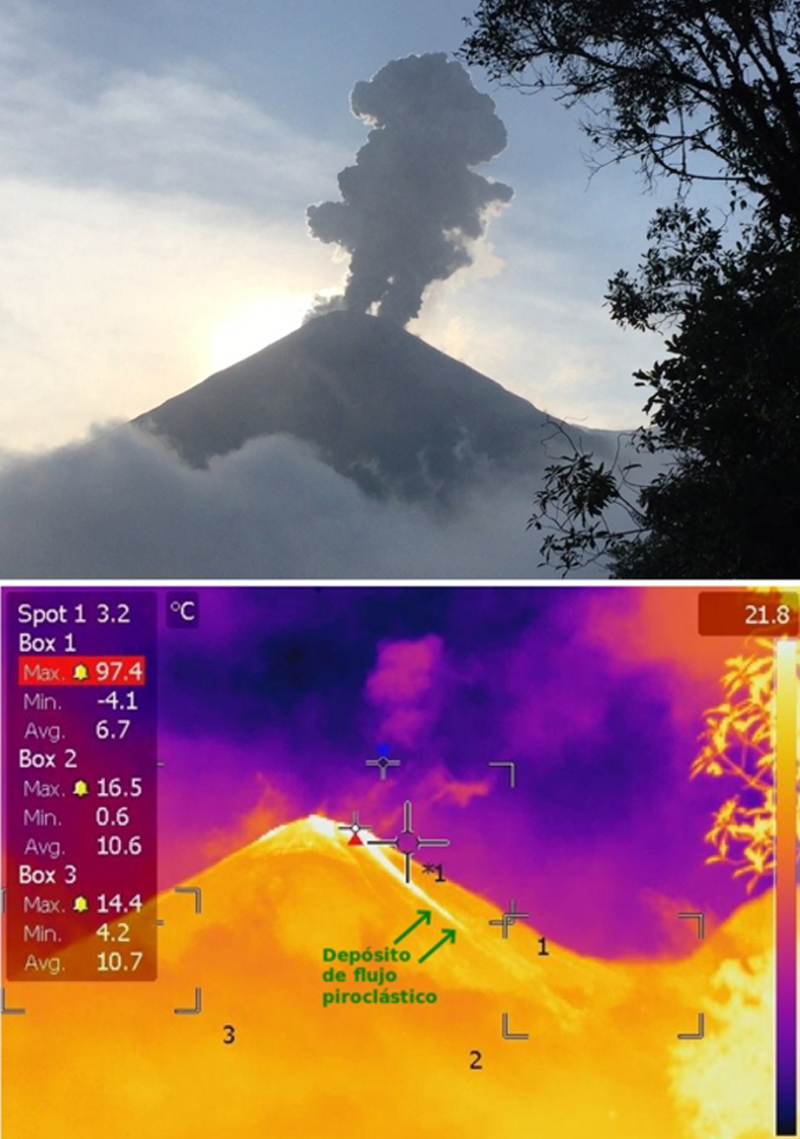
An explosive eruption was reported on 7 July that generated a large gas-and-ash plume to high altitudes and caused significant ashfall in local communities; the eruption plume had reached upper tropospheric (16-18 km altitude) altitudes by 2200, according to satellite images. Sulfur dioxide plumes were detected in satellite images on 8 July and indicated that the plume was likely a mixture of gas, ice, and ash. A report issued by the Autonomous Bougainville Government (ABG) (Torokina District, Education Section) on 10 July noted that significant ash began falling during 2000-2100 on 7 July and covered most areas in the Vuakovi, Gotana (9 km SW), Koromaketo, Laruma (25 km W) and Atsilima (27 km NW) villages. Pyroclastic flows also occurred, according to ground-based reports; small deposits confined to one drainage were inspected by RVO during an overflight on 17 July and were confirmed to be from the 7 July event. Ashfall continued until 10 July and covered vegetation, which destroyed bushes and gardens and contaminated rivers and streams.
RVO reported another eruption on 14 July. The Darwin VAAC stated that an explosive event started around 0830 on 15 July and produced an ash plume that rose to 16.5 km altitude by 1000 and drifted N, according to satellite images. The plume continued to drift N and remained visible through 1900, and by 2150 it had dissipated.
Ashfall likely from both the 7 and 15 July events impacted about 8,111 people in Torokina (20 km SW), including Tsito/Vuakovi, Gotana, Koromaketo, Kenaia, Longkogari, Kenbaki, Piva (13 km SW), and Atsinima, and in the Tsitovi district, according to ABG. Significant ashfall was also reported in Ruruvu (22 km N) in the Wakunai District of Central Bougainville, though the thickness of these deposits could not be confirmed. An evacuation was called for the villages in Wakunai, where heavy ashfall had contaminated water sources; the communities of Ruruvu, Togarau, Kakarapaia, Karauturi, Atao, and Kuritaturi were asked to evacuate to a disaster center at the Wakunai District Station, and communities in Torokina were asked to evacuate to the Piva District station. According to a news article, more than 7,000 people needed temporary accommodations, with about 1,000 people in evacuation shelters. Ashfall had deposited over a broad area, contaminating water supplies, affecting crops, and collapsing some roofs and houses in rural areas. Schools were temporarily shut down. Intermittent ash emissions continued through the end of July and drifted NNW, NW, and SW. Fine ashfall was reported on the coast of Torokina, and ash plumes also drifted toward Laruma and Atsilima.
A small explosive eruption occurred at 2130 on 28 July that ejected material from the crater vents, according to reports from Torokina, in addition to a lava flow that contained two lobes. A second explosion was detected at 2157. Incandescence from the lava flow was visible from Piva as it descended the W flank around 2000 on 29 July (figure 47). The Darwin VAAC reported that a strong thermal anomaly was visible in satellite images during 30-31 July and that ash emissions rose to 2.4 km altitude and drifted WSW on 30 July. A ground report from RVO described localized emissions at 0900 on 31 July.
The Darwin VAAC reported that ash plumes were identified in satellite imagery at 0800 and 1220 on 12 August and rose to 2.1 km and 3 km altitude and drifted NW and W, respectively. A news report stated that aid was sent to more than 6,300 people that were adversely affected by the eruption. Photos taken during 17-19 August showed ash emissions rising no higher than 1 km above the summit and drifting SE. A small explosion generated an ash plume during the morning of 19 August. Deposits from small pyroclastic flows were also captured in the photos. Satellite images captured lava flows and pyroclastic flow deposits. Two temporary seismic stations were installed near Bagana on 17 August at distances of 7 km WSW (Vakovi station) and 11 km SW (Kepox station). The Kepox station immediately started to record continuous, low-frequency background seismicity.
Satellite data. Little to no thermal activity was detected during April through mid-July 2023; only one anomaly was recorded during early April and one during early June, according to MIROVA (Middle InfraRed Observation of Volcanic Activity) data (figure 48). Thermal activity increased in both power and frequency during mid-July through September, although there were still some short gaps in detected activity. MODVOLC also detected increased thermal activity during August; thermal hotspots were detected a total of five times on 19, 20, and 27 August. Weak thermal anomalies were also captured in infrared satellite images on clear weather days throughout the reporting period on 7, 12, and 17 April, 27 May, 1, 6, 16, and 31 July, and 19 September (figure 48); a strong thermal anomaly was visible on 31 July. Distinct sulfur dioxide plumes that drifted generally NW were intermittently captured by the TROPOMI instrument on the Sentinel-5P satellite and sometimes exceeded two Dobson Units (DUs) (figure 49).
Geologic Background. Bagana volcano, in a remote portion of central Bougainville Island, is frequently active. This massive symmetrical cone was largely constructed by an accumulation of viscous andesitic lava flows. The entire edifice could have been constructed in about 300 years at its present rate of lava production. Eruptive activity is characterized by non-explosive effusion of viscous lava that maintains a small lava dome in the summit crater, although occasional explosive activity produces pyroclastic flows. Lava flows with tongue-shaped lobes up to 50 m thick and prominent levees descend the flanks on all sides.
Information Contacts: Rabaul Volcano Observatory (RVO), Geohazards Management Division, Department of Mineral Policy and Geohazards Management (DMPGM), PO Box 3386, Kokopo, East New Britain Province, Papua New Guinea; Darwin Volcanic Ash Advisory Centre (VAAC), Bureau of Meteorology, Northern Territory Regional Office, PO Box 40050, Casuarina, NT 0811, Australia (URL: http://www.bom.gov.au/info/vaac/); MIROVA (Middle InfraRed Observation of Volcanic Activity), a collaborative project between the Universities of Turin and Florence (Italy) supported by the Centre for Volcanic Risk of the Italian Civil Protection Department (URL: http://www.mirovaweb.it/); Hawai'i Institute of Geophysics and Planetology (HIGP) - MODVOLC Thermal Alerts System, School of Ocean and Earth Science and Technology (SOEST), Univ. of Hawai'i, 2525 Correa Road, Honolulu, HI 96822, USA (URL: http://modis.higp.hawaii.edu/); NASA Global Sulfur Dioxide Monitoring Page, Atmospheric Chemistry and Dynamics Laboratory, NASA Goddard Space Flight Center (NASA/GSFC), 8800 Greenbelt Road, Goddard, Maryland, USA (URL: https://so2.gsfc.nasa.gov/); Copernicus Browser, Copernicus Data Space Ecosystem, European Space Agency (URL: https://dataspace.copernicus.eu/browser/); Autonomous Bougainville Government, P.O Box 322, Buka, AROB, PNG (URL: https://abg.gov.pg/); Andrew Tupper (Twitter: @andrewcraigtupp); Simon Carn, Geological and Mining Engineering and Sciences, Michigan Technological University, 1400 Townsend Drive, Houghton, MI 49931, USA (URL: http://www.volcarno.com/, Twitter: @simoncarn); Radio NZ (URL: https://www.rnz.co.nz/news/pacific/494464/more-than-7-000-people-in-bougainville-need-temporary-accommodation-after-eruption); USAID, 1300 Pennsylvania Ave, NW, Washington DC 20004, USA (URL: https://www.usaid.gov/pacific-islands/press-releases/aug-08-2023-united-states-provides-immediate-emergency-assistance-support-communities-affected-mount-bagana-volcanic-eruptions).
Mayon (Philippines) — October 2023 Cite this Report
Mayon
Philippines
13.257°N, 123.685°E; summit elev. 2462 m
All times are local (unless otherwise noted)
Lava flows, pyroclastic flows, ash emissions, and seismicity during April-September 2023
Mayon is located in the Philippines and has steep upper slopes capped by a small summit crater. Historical eruptions date back to 1616 CE that have been characterized by Strombolian eruptions, lava flows, pyroclastic flows, and mudflows. Eruptions mostly originated from a central conduit. Pyroclastic flows and mudflows have commonly descended many of the approximately 40 drainages that surround the volcano. The most recent eruption occurred during June through October 2022 and consisted of lava dome growth and gas-and-steam emissions (BGVN 47:12). A new eruption was reported during late April 2023 and has included lava flows, pyroclastic density currents, ash emissions, and seismicity. This report covers activity during April through September 2023 based on daily bulletins from the Philippine Institute of Volcanology and Seismology (PHIVOLCS).
During April through September 2023, PHIVOLCS reported near-daily rockfall events, frequent volcanic earthquakes, and sulfur dioxide measurements. Gas-and-steam emissions rose 100-900 m above the crater and drifted in different directions. Nighttime crater incandescence was often visible during clear weather and was accompanied by incandescent avalanches of material. Activity notably increased during June when lava flows were reported on the S, SE, and E flanks (figure 52). The MIROVA graph (Middle InfraRed Observation of Volcanic Activity) showed strong thermal activity coincident with these lava flows, which remained active through September (figure 53). According to the MODVOLC thermal algorithm, a total of 110 thermal alerts were detected during the reporting period: 17 during June, 40 during July, 27 during August, and 26 during September. During early June, pyroclastic density currents (PDCs) started to occur more frequently.
Low activity was reported during much of April and May; gas-and-steam emissions rose 100-900 m above the crater and generally drifted in different directions. A total of 52 rockfall events and 18 volcanic earthquakes were detected during April and 147 rockfall events and 13 volcanic events during May. Sulfur dioxide flux measurements ranged between 400-576 tons per day (t/d) during April, the latter of which was measured on 29 April and between 162-343 t/d during May, the latter of which was measured on 13 May.
Activity during June increased, characterized by lava flows, pyroclastic density currents (PDCs), crater incandescence and incandescent rockfall events, gas-and-steam emissions, and continued seismicity. Weather clouds often prevented clear views of the summit, but during clear days, moderate gas-and-steam emissions rose 100-2,500 m above the crater and drifted in multiple directions. A total of 6,237 rockfall events and 288 volcanic earthquakes were detected. The rockfall events often deposited material on the S and SE flanks within 700-1,500 m of the summit crater and ash from the events drifted SW, S, SE, NE, and E. Sulfur dioxide emissions ranged between 149-1,205 t/d, the latter of which was measured on 10 June. Short-term observations from EDM and electronic tiltmeter monitoring indicated that the upper slopes were inflating since February 2023. Longer-term ground deformation parameters based on EDM, precise leveling, continuous GPS, and electronic tilt monitoring indicated that the volcano remained inflated, especially on the NW and SE flanks. At 1000 on 5 June the Volcano Alert Level (VAL) was raised to 2 (on a 0-5 scale). PHIVOLCS noted that although low-level volcanic earthquakes, ground deformation, and volcanic gas emissions indicated unrest, the steep increase in rockfall frequency may indicate increased dome activity.
A total of 151 dome-collapse PDCs occurred during 8-9 and 11-30 June, traveled 500-2,000 m, and deposited material on the S flank within 2 km of the summit crater. During 8-9 June the VAL was raised to 3. At approximately 1947 on 11 June lava flow activity was reported; two lobes traveled within 500 m from the crater and deposited material on the S (Mi-isi), SE (Bonga), and E (Basud) flanks. Weak seismicity accompanied the lava flow and slight inflation on the upper flanks. This lava flow remained active through 30 June, moving down the S and SE flank as far as 2.5 km and 1.8 km, respectively and depositing material up to 3.3 km from the crater. During 15-16 June traces of ashfall from the PDCs were reported in Sitio Buga, Nabonton, City of Ligao and Purok, and San Francisco, Municipality of Guinobatan. During 28-29 June there were two PDCs generated by the collapse of the lava flow front, which generated a light-brown ash plume 1 km high. Satellite monitors detected significant concentrations of sulfur dioxide beginning on 29 June. On 30 June PDCs primarily affected the Basud Gully on the E flank, the largest of which occurred at 1301 and lasted eight minutes, based on the seismic record. Four PDCs generated between 1800 and 2000 that lasted approximately four minutes each traveled 3-4 km on the E flank and generated an ash plume that rose 1 km above the crater and drifted N and NW. Ashfall was recorded in Tabaco City.
Similar strong activity continued during July; slow lava effusion remained active on the S and SE flanks and traveled as far as 2.8 km and 2.8 km, respectively and material was deposited as far as 4 km from the crater. There was a total of 6,983 rockfall events and 189 PDCs that affected the S, SE, and E flanks. The volcano network detected a total of 2,124 volcanic earthquakes. Continuous gas-and-steam emissions rose 200-2,000 m above the crater and drifted in multiple directions. Sulfur dioxide emissions averaged 792-4,113 t/d, the latter of which was measured on 28 July. During 2-4 July three PDCs were generated from the collapse of the lava flow and resulting light brown plumes rose 200-300 m above the crater. Continuous tremor pulses were reported beginning at 1547 on 3 July through 7 July at 1200, at 2300 on 8 July and going through 0300 on 10 July, and at 2300 on 16 July, as recorded by the seismic network. During 6-9 July there were 10 lava flow-collapse-related PDCs that generated light brown plumes 300-500 m above the crater. During 10-11 July light ashfall was reported in some areas of Mabinit, Legazpi City, Budiao and Salvacion, Daraga, and Camalig, Albay. By 18 July the lava flow advanced 600 m on the E flank as well.
During 1733 on 18 July and 0434 on 19 July PHIVOLCS reported 30 “ashing” events, which are degassing events accompanied by audible thunder-like sounds and entrained ash at the crater, which produced short, dark plumes that drifted SW. These events each lasted 20-40 seconds, and plume heights ranged from 150-300 m above the crater, as recorded by seismic, infrasound, visual, and thermal monitors. Three more ashing events occurred during 19-20 July. Short-term observations from electronic tilt and GPS monitoring indicate deflation on the E lower flanks in early July and inflation on the NW middle flanks during the third week of July. Longer-term ground deformation parameters from EDM, precise leveling, continuous GPS, and electronic tilt monitoring indicated that the volcano was still generally inflated relative to baseline levels. A short-lived lava pulse lasted 28 seconds at 1956 on 21 July, which was accompanied by seismic and infrasound signals. By 22 July, the only lava flow that remained active was on the SE flank, and continued to extend 3.4 km, while those on the S and E flanks weakened markedly. One ashing event was detected during 30-31 July, whereas there were 57 detected during 31 July-1 August; according to PHIVOLCS beginning at approximately 1800 on 31 July eruptive activity was dominated by phases of intermittent ashing, as well as increased in the apparent rates of lava effusion from the summit crater. The ashing phases consisted of discrete events recorded as low-frequency volcanic earthquakes (LFVQ) typically 30 seconds in duration, based on seismic and infrasound signals. Gray ash plume rose 100 m above the crater and generally drifted NE. Shortly after these ashing events began, new lava began to effuse rapidly from the crater, feeding the established flowed on the SE, E, and E flanks and generating frequent rockfall events.
Intensified unrest persisted during August. There was a total of 4,141 rockfall events, 2,881 volcanic earthquakes, which included volcanic tremor events, 32 ashing events, and 101 PDCs detected throughout the month. On clear weather days, gas-and-steam emissions rose 300-1,500 m above the crater and drifted in different directions (figure 54). Sulfur dioxide emissions averaged 735-4,756 t/d, the higher value of which was measured on 16 August. During 1-2 August the rate of lava effusion decreased, but continued to feed the flows on the SE, S, and E flanks, maintaining their advances to 3.4 km, 2.8 km, and 1.1 km from the crater, respectively (figure 55). Rockfall and PDCs generated by collapses at the lava flow margins and from the summit dome deposited material within 4 km of the crater. During 3-4 August there were 10 tremor events detected that lasted 1-4 minutes. Short-lived lava pulse lasted 35 seconds and was accompanied by seismic and infrasound signals at 0442 on 6 August. Seven collapses were recorded at the front of the lava flow during 12-14 August.
During September, similar activity of slow lava effusion, PDCs, gas-and-steam emissions, and seismicity continued. There was a total of 4,452 rockfall events, 329 volcanic earthquakes, which included volcanic tremor events, two ashing events, and 85 PDCs recorded throughout the month. On clear weather days, gas-and-steam emissions rose 100-1,500 m above the crater and drifted in multiple directions. Sulfur dioxide emissions averaged 609-2,252 t/d, the higher average of which was measured on 6 September. Slow lava effusion continued advancing on the SE, S, and E flanks, maintaining lengths of 3.4 km, 2.8 km, and 1.1 km, respectively. Rockfall and PDC events generated by collapses along the lava flow margins and at the summit dome deposited material within 4 km of the crater.
Geologic Background. Symmetrical Mayon, which rises above the Albay Gulf NW of Legazpi City, is the most active volcano of the Philippines. The steep upper slopes are capped by a small summit crater. Recorded eruptions since 1616 CE range from Strombolian to basaltic Plinian, with cyclical activity beginning with basaltic eruptions, followed by longer periods of andesitic lava flows. Eruptions occur predominately from the central conduit and have also produced lava flows that travel far down the flanks. Pyroclastic density currents and mudflows have commonly swept down many of the approximately 40 ravines that radiate from the summit and have often damaged populated lowland areas. A violent eruption in 1814 killed more than 1,200 people and devastated several towns.
Information Contacts: Philippine Institute of Volcanology and Seismology (PHIVOLCS), Department of Science and Technology, University of the Philippines Campus, Diliman, Quezon City, Philippines (URL: http://www.phivolcs.dost.gov.ph/); MIROVA (Middle InfraRed Observation of Volcanic Activity), a collaborative project between the Universities of Turin and Florence (Italy) supported by the Centre for Volcanic Risk of the Italian Civil Protection Department (URL: http://www.mirovaweb.it/); Hawai'i Institute of Geophysics and Planetology (HIGP) - MODVOLC Thermal Alerts System, School of Ocean and Earth Science and Technology (SOEST), Univ. of Hawai'i, 2525 Correa Road, Honolulu, HI 96822, USA (URL: http://modis.higp.hawaii.edu/); Copernicus Browser, Copernicus Data Space Ecosystem, European Space Agency (URL: https://dataspace.copernicus.eu/browser/); William Rogers, Legazpi City, Albay Province, Philippines.
Nishinoshima (Japan) — October 2023 Cite this Report
Nishinoshima
Japan
27.247°N, 140.874°E; summit elev. 100 m
All times are local (unless otherwise noted)
Eruption plumes and gas-and-steam plumes during May-August 2023
Nishinoshima, located about 1,000 km S of Tokyo, is a small island in the Ogasawara Arc in Japan. The island is the summit of a massive submarine volcano that has prominent submarine peaks to the S, W, and NE. Eruptions date back to 1973 and the current eruption period began in October 2022. Recent activity has consisted of small ash plumes and fumarolic activity (BGVN 48:07). This report covers activity during May through August 2023, using information from monthly reports of the Japan Meteorological Agency (JMA) monthly reports and satellite data.
Activity during May through June was relatively low. The Japan Coast Guard (JCG) did overflights on 14 and 22 June and reported white gas-and-steam emissions rising 600 m and 1,200 m from the central crater of the pyroclastic cone, respectively (figure 125). In addition, multiple white gas-and-steam emissions rose from the inner rim of the W side of the crater and from the SE flank of the pyroclastic cone. Discolored brown-to-green water was observed around almost the entire perimeter of the island; on 22 June light green discolored water was observed off the S coast of the island.
Observations from the Himawari meteorological satellite confirmed an eruption on 9 and 10 July. An eruption plume rose 1.6 km above the crater and drifted N around 1300 on 9 July. Satellite images acquired at 1420 and 2020 on 9 July and at 0220 on 10 July showed continuing emissions that rose 1.3-1.6 km above the crater and drifted NE and N. The Tokyo VAAC reported that an ash plume seen by a pilot and identified in a satellite image at 0630 on 21 July rose to 3 km altitude and drifted S.
Aerial observations conducted by JCG on 8 August showed a white-and-gray plume rising from the central crater of the pyroclastic cone, and multiple white gas-and-steam emissions were rising from the inner edge of the western crater and along the NW-SE flanks of the island (figure 126). Brown-to-green discolored water was also noted around the perimeter of the island.
Intermittent low-to-moderate power thermal anomalies were recorded in the MIROVA graph (Middle InfraRed Observation of Volcanic Activity), showing an increase in both frequency and power beginning in July (figure 127). This increase in activity coincides with eruptive activity on 9 and 10 July, characterized by eruption plumes. According to the MODVOLC thermal alert algorithm, one thermal hotspot was recorded on 20 July. Weak thermal anomalies were also detected in infrared satellite imagery, accompanied by strong gas-and-steam plumes (figure 128).
Geologic Background. The small island of Nishinoshima was enlarged when several new islands coalesced during an eruption in 1973-74. Multiple eruptions that began in 2013 completely covered the previous exposed surface and continued to enlarge the island. The island is the summit of a massive submarine volcano that has prominent peaks to the S, W, and NE. The summit of the southern cone rises to within 214 m of the ocean surface 9 km SSE.
Information Contacts: Japan Meteorological Agency (JMA), 1-3-4 Otemachi, Chiyoda-ku, Tokyo 100-8122, Japan (URL: http://www.jma.go.jp/jma/indexe.html); Tokyo Volcanic Ash Advisory Center (VAAC), 1-3-4 Otemachi, Chiyoda-ku, Tokyo 100-8122, Japan (URL: http://ds.data.jma.go.jp/svd/vaac/data/); MIROVA (Middle InfraRed Observation of Volcanic Activity), a collaborative project between the Universities of Turin and Florence (Italy) supported by the Centre for Volcanic Risk of the Italian Civil Protection Department (URL: http://www.mirovaweb.it/); Copernicus Browser, Copernicus Data Space Ecosystem, European Space Agency (URL: https://dataspace.copernicus.eu/browser/).
Krakatau (Indonesia) — October 2023 Cite this Report
Krakatau
Indonesia
6.1009°S, 105.4233°E; summit elev. 285 m
All times are local (unless otherwise noted)
White gas-and-steam plumes and occasional ash plumes during May-August 2023
Krakatau is located in the Sunda Strait between Java and Sumatra, Indonesia. Caldera collapse during the catastrophic 1883 eruption destroyed Danan and Perbuwatan cones and left only a remnant of Rakata. The post-collapse cone of Anak Krakatau (Child of Krakatau) was constructed within the 1883 caldera at a point between the former Danan and Perbuwatan cones; it has been the site of frequent eruptions since 1927. The current eruption period began in May 2021 and has recently consisted of Strombolian eruptions and ash plumes (BGVN 48:07). This report describes lower levels of activity consisting of ash and white gas-and-steam plumes during May through August 2023, based on information provided by the Indonesian Center for Volcanology and Geological Hazard Mitigation, referred to as Pusat Vulkanologi dan Mitigasi Bencana Geologi (PVMBG), MAGMA Indonesia, and satellite data.
Activity was relatively low during May and June. Daily white gas-and-steam emissions rose 25-200 m above the crater and drifted in different directions. Five ash plumes were detected at 0519 on 10 May, 1241 on 11 May, 0920 on 12 May, 2320 on 12 May, and at 0710 on 13 May, and rose 1-2.5 km above the crater and drifted SW. A webcam image taken on 12 May showed ejection of incandescent material above the vent. A total of nine ash plumes were detected during 6-11 June: at 1434 and 00220 on 6 and 7 June the ash plumes rose 500 m above the crater and drifted NW, at 1537 on 8 June the ash plume rose 1 km above the crater and drifted SW, at 0746 and at 0846 on 9 June the ash plumes rose 800 m and 3 km above the crater and drifted SW, respectively, at 0423, 1431, and 1750 on 10 June the ash plumes rose 2 km, 1.5 km, and 3.5 km above the crater and drifted NW, respectively, and at 0030 on 11 June an ash plume rose 2 km above the crater and drifted NW. Webcam images taken on 10 and 11 June at 0455 and 0102, respectively, showed incandescent material ejected above the vent. On 19 June an ash plume at 0822 rose 1.5 km above the crater and drifted SE.
Similar low activity of white gas-and-steam emissions and few ash plumes were reported during July and August. Daily white gas-and-steam emissions rose 25-300 m above the crater and drifted in multiple directions. Three ash plumes were reported at 0843, 0851, and 0852 on 20 July that rose 500-2,000 m above the crater and drifted NW.
The MIROVA (Middle InfraRed Observation of Volcanic Activity) graph of MODIS thermal anomaly data showed intermittent low-to-moderate power thermal anomalies during May through August 2023 (figure 140). Although activity was often obscured by weather clouds, a thermal anomaly was visible in an infrared satellite image of the crater on 12 May, accompanied by an eruption plume that drifted SW (figure 141).
Geologic Background. The renowned Krakatau (frequently mis-named as Krakatoa) volcano lies in the Sunda Strait between Java and Sumatra. Collapse of an older edifice, perhaps in 416 or 535 CE, formed a 7-km-wide caldera. Remnants of that volcano are preserved in Verlaten and Lang Islands; subsequently the Rakata, Danan, and Perbuwatan cones were formed, coalescing to create the pre-1883 Krakatau Island. Caldera collapse during the catastrophic 1883 eruption destroyed Danan and Perbuwatan, and left only a remnant of Rakata. This eruption caused more than 36,000 fatalities, most as a result of tsunamis that swept the adjacent coastlines of Sumatra and Java. Pyroclastic surges traveled 40 km across the Sunda Strait and reached the Sumatra coast. After a quiescence of less than a half century, the post-collapse cone of Anak Krakatau (Child of Krakatau) was constructed within the 1883 caldera at a point between the former Danan and Perbuwatan cones. Anak Krakatau has been the site of frequent eruptions since 1927.
Information Contacts: Pusat Vulkanologi dan Mitigasi Bencana Geologi (PVMBG, also known as Indonesian Center for Volcanology and Geological Hazard Mitigation, CVGHM), Jalan Diponegoro 57, Bandung 40122, Indonesia (URL: http://www.vsi.esdm.go.id/); MAGMA Indonesia, Kementerian Energi dan Sumber Daya Mineral (URL: https://magma.esdm.go.id/v1); MIROVA (Middle InfraRed Observation of Volcanic Activity), a collaborative project between the Universities of Turin and Florence (Italy) supported by the Centre for Volcanic Risk of the Italian Civil Protection Department (URL: http://www.mirovaweb.it/); Copernicus Browser, Copernicus Data Space Ecosystem, European Space Agency (URL: https://dataspace.copernicus.eu/browser/).
Villarrica (Chile) — October 2023 Cite this Report
Villarrica
Chile
39.42°S, 71.93°W; summit elev. 2847 m
All times are local (unless otherwise noted)
Strombolian activity, gas-and-ash emissions, and crater incandescence during April-September 2023
Villarrica, in central Chile, consists of a 2-km-wide caldera that formed about 3,500 years ago and is located at the base of the presently active cone at the NW margin of a 6-km-wide caldera. Historical eruptions eruptions date back to 1558 and have been characterized by mild-to-moderate explosive activity with occasional lava effusions. The current eruption period began in December 2014 and has recently consisted of nighttime crater incandescence, ash emissions, and seismicity (BGVN 48:04). This report covers activity during April through September 2023 and describes occasional Strombolian activity, gas-and-ash emissions, and nighttime crater incandescence. Information for this report primarily comes from the Southern Andes Volcano Observatory (Observatorio Volcanológico de Los Andes del Sur, OVDAS), part of Chile's National Service of Geology and Mining (Servicio Nacional de Geología y Minería, SERNAGEOMIN) and satellite data.
Seismicity during April consisted of long period (LP) events and tremor (TRE); a total of 9,413 LP-type events and 759 TR-type events were detected throughout the month. Nighttime crater incandescence persisted and was visible in the degassing column. Sulfur dioxide data was obtained using Differential Absorption Optical Spectroscopy Equipment (DOAS) that showed an average value of 1,450 ± 198 tons per day (t/d) during 1-15 April and 1,129 ± 201 t/d during 16-30 April, with a maximum daily value of 2,784 t/d on 9 April. Gas-and-steam emissions of variable intensities rose above the active crater as high as 1.3 km above the crater on 13 April. Strombolian explosions were not observed and there was a slight decrease in the lava lake level.
There were 14,123 LP-type events and 727 TR-type events detected during May. According to sulfur dioxide measurements taken with DOAS equipment, the active crater emitted an average value of 1,826 ± 482 t/d during 1-15 May and 912 ± 41 t/d during 16-30 May, with a daily maximum value of 5,155 t/d on 13 May. Surveillance cameras showed continuous white gas-and-steam emissions that rose as high as 430 m above the crater on 27 May. Nighttime incandescence illuminated the gas column less than 300 m above the crater rim was and no pyroclastic emissions were reported. A landslide was identified on 13 May on the E flank of the volcano 50 m from the crater rim and extending 300 m away; SERNAGEOMIN noted that this event may have occurred on 12 May. During the morning of 27 and 28 May minor Strombolian explosions characterized by incandescent ejecta were recorded at the crater rim; the last reported Strombolian explosions had occurred at the end of March.
Seismic activity during June consisted of five volcano-tectonic (VT)-type events, 21,606 LP-type events, and 2,085 TR-type events. The average value of sulfur dioxide flux obtained by DOAS equipment was 1,420 ± 217 t/d during 1-15 June and 2,562 ± 804 t/d, with a maximum daily value of 4,810 t/d on 17 June. White gas-and-steam emissions rose less than 480 m above the crater; frequent nighttime crater incandescence was reflected in the degassing plume. On 12 June an emission rose 100 m above the crater and drifted NNW. On 15 June one or several emissions resulted in ashfall to the NE as far as 5.5 km from the crater, based on a Skysat satellite image. Several Strombolian explosions occurred within the crater; activity on 15 June was higher energy and ejected blocks 200-300 m on the NE slope. Surveillance cameras showed white gas-and-steam emissions rising 480 m above the crater on 16 June. On 19 and 24 June low-intensity Strombolian activity was observed, ejecting material as far as 200 m from the center of the crater to the E.
During July, seismicity included 29,319 LP-type events, 3,736 TR-type events, and two VT-type events. DOAS equipment recorded two days of sulfur dioxide emissions of 4,220 t/d and 1,009 t/d on 1 and 13 July, respectively. Constant nighttime incandescence was also recorded and was particularly noticeable when accompanied by eruptive columns on 12 and 16 July. Minor explosive events were detected in the crater. According to Skysat satellite images taken on 12, 13, and 16 July, ashfall deposits were identified 155 m S of the crater. According to POVI, incandescence was visible from two vents on the crater floor around 0336 on 12 July. Gas-and-ash emissions rose as high as 1.2 km above the crater on 13 July and drifted E and NW. A series of gas-and-steam pulses containing some ash deposited material on the upper E flank around 1551 on 13 July. During 16-31 July, average sulfur dioxide emissions of 1,679 ± 406 t/d were recorded, with a maximum daily value of 2,343 t/d on 28 July. Fine ash emissions were also reported on 16, 17, and 23 July.
Seismicity persisted during August, characterized by 27,011 LP-type events, 3,323 TR-type events, and three VT-type events. The average value of sulfur dioxide measurements taken during 1-15 August was 1,642 ± 270 t/d and 2,207 ± 4,549 t/d during 16-31 August, with a maximum daily value of 3,294 t/d on 27 August. Nighttime crater incandescence remained visible in degassing columns. White gas-and-steam emissions rose 480 m above the crater on 6 August. According to a Skysat satellite image from 6 August, ash accumulation was observed proximal to the crater and was mainly distributed toward the E slope. White gas-and-steam emissions rose 320 m above the crater on 26 August. Nighttime incandescence and Strombolian activity that generated ash emissions were reported on 27 August.
Seismicity during September was characterized by five VT-type events, 12,057 LP-type events, and 2,058 TR-type events. Nighttime incandescence persisted. On 2 September an ash emission rose 180 m above the crater and drifted SE at 1643 (figure 125) and a white gas-and-steam plume rose 320 m above the crater. According to the Buenos Aires VAAC, periods of continuous gas-and-ash emissions were visible in webcam images from 1830 on 2 September to 0110 on 3 September. Strombolian activity was observed on 2 September and during the early morning of 3 September, the latter event of which generated an ash emission that rose 60 m above the crater and drifted 100 m from the center of the crater to the NE and SW. Ashfall was reported to the SE and S as far as 750 m from the crater. The lava lake was active during 3-4 September and lava fountaining was visible for the first time since 26 March 2023, according to POVI. Fountains captured in webcam images at 2133 on 3 September and at 0054 on 4 September rose as high as 60 m above the crater rim and ejected material onto the upper W flank. Sulfur dioxide flux of 1,730 t/d and 1,281 t/d was measured on 3 and 4 September, respectively, according to data obtained by DOAS equipment.
Strong Strombolian activity and larger gas-and-ash plumes were reported during 18-20 September. On 18 September activity was also associated with energetic LP-type events and notable sulfur dioxide fluxes (as high as 4,277 t/d). On 19 September Strombolian activity and incandescence were observed. On 20 September at 0914 ash emissions rose 50 m above the crater and drifted SSE, accompanied by Strombolian activity that ejected material less than 100 m SSE, causing fall deposits on that respective flank. SERNAGEOMIN reported that a Planet Scope satellite image taken on 20 September showed the lava lake in the crater, measuring 32 m x 35 m and an area of 0.001 km2. Several ash emissions were recorded at 0841, 0910, 1251, 1306, 1312, 1315, and 1324 on 23 September and rose less than 150 m above the crater. The sulfur dioxide flux value was 698 t/d on 23 September and 1,097 t/d on 24 September. On 24 September the Volcanic Alert Level (VAL) was raised to Orange (the third level on a four-color scale). SENAPRED maintained the Alert Level at Yellow (the middle level on a three-color scale) for the communities of Villarrica, Pucón (16 km N), Curarrehue, and Panguipulli.
During 24-25 September there was an increase in seismic energy (observed at TR-events) and acoustic signals, characterized by 1 VT-type event, 213 LP-type events, and 124 TR-type events. Mainly white gas-and-steam emissions, in addition to occasional fine ash emissions were recorded. During the early morning of 25 September Strombolian explosions were reported and ejected material 250 m in all directions, though dominantly toward the NW. On 25 September the average value of sulfur dioxide flux was 760 t/d. Seismicity during 25-30 September consisted of five VT-type events, 1,937 LP-type events, and 456 TR-type events.
During 25-29 September moderate Strombolian activity was observed and ejected material as far as the crater rim. In addition, ash pulses lasting roughly 50 minutes were observed around 0700 and dispersed ENE. During 26-27 September a TR episode lasted 6.5 hours and was accompanied by discrete acoustic signals. Satellite images from 26 September showed a spatter cone on the crater floor with one vent that measured 10 x 14 m and a smaller vent about 35 m NE of the cone. SERNAGEOMIN reported an abundant number of bomb-sized blocks up to 150 m from the crater, as well as impact marks on the snow, which indicated explosive activity. A low-altitude ash emission was observed drifting NW around 1140 on 28 September, based on webcam images. Between 0620 and 0850 on 29 September an ash emission rose 60 m above the crater and drifted NW. During an overflight taken around 1000 on 29 September scientists observed molten material in the vent, a large accumulation of pyroclasts inside the crater, and energetic degassing, some of which contained a small amount of ash. Block-sized pyroclasts were deposited on the internal walls and near the crater, and a distal ash deposit was also visible. The average sulfur dioxide flux measured on 28 September was 344 t/d. Satellite images taken on 29 September ashfall was deposited roughly 3 km WNW from the crater and nighttime crater incandescence remained visible. The average sulfur dioxide flux value from 29 September was 199 t/d. On 30 September at 0740 a pulsating ash emission rose 1.1 km above the crater and drifted NNW (figure 126). Deposits on the S flank extended as far as 4.5 km from the crater rim, based on satellite images from 30 September.
Infrared MODIS satellite data processed by MIROVA (Middle InfraRed Observation of Volcanic Activity) showed intermittent thermal activity during April through September, with slightly stronger activity detected during late September (figure 127). Small clusters of thermal activity were detected during mid-June, early July, early August, and late September. According to the MODVOLC thermal alert system, a total of four thermal hotspots were detected on 7 July and 3 and 23 September. This activity was also intermittently captured in infrared satellite imagery on clear weather days (figure 128).
Geologic Background. The glacier-covered Villarrica stratovolcano, in the northern Lakes District of central Chile, is ~15 km south of the city of Pucon. A 2-km-wide caldera that formed about 3,500 years ago is located at the base of the presently active, dominantly basaltic to basaltic andesite cone at the NW margin of a 6-km-wide Pleistocene caldera. More than 30 scoria cones and fissure vents are present on the flanks. Plinian eruptions and pyroclastic flows that have extended up to 20 km from the volcano were produced during the Holocene. Lava flows up to 18 km long have issued from summit and flank vents. Eruptions documented since 1558 CE have consisted largely of mild-to-moderate explosive activity with occasional lava effusion. Glaciers cover 40 km2 of the volcano, and lahars have damaged towns on its flanks.
Information Contacts: Servicio Nacional de Geología y Minería (SERNAGEOMIN), Observatorio Volcanológico de Los Andes del Sur (OVDAS), Avda Sta María No. 0104, Santiago, Chile (URL: http://www.sernageomin.cl/); Proyecto Observación Villarrica Internet (POVI) (URL: http://www.povi.cl/); Sistema y Servicio Nacional de Prevención y Repuesta Ante Desastres (SENAPRED), Av. Beauchef 1671, Santiago, Chile (URL: https://web.senapred.cl/); Buenos Aires Volcanic Ash Advisory Center (VAAC), Servicio Meteorológico Nacional-Fuerza Aérea Argentina, 25 de mayo 658, Buenos Aires, Argentina (URL: http://www.smn.gov.ar/vaac/buenosaires/inicio.php); MIROVA (Middle InfraRed Observation of Volcanic Activity), a collaborative project between the Universities of Turin and Florence (Italy) supported by the Centre for Volcanic Risk of the Italian Civil Protection Department (URL: http://www.mirovaweb.it/); Hawai'i Institute of Geophysics and Planetology (HIGP) - MODVOLC Thermal Alerts System, School of Ocean and Earth Science and Technology (SOEST), Univ. of Hawai'i, 2525 Correa Road, Honolulu, HI 96822, USA (URL: http://modis.higp.hawaii.edu/); Copernicus Browser, Copernicus Data Space Ecosystem, European Space Agency (URL: https://dataspace.copernicus.eu/browser/).
Merapi (Indonesia) — October 2023 Cite this Report
Merapi
Indonesia
7.54°S, 110.446°E; summit elev. 2910 m
All times are local (unless otherwise noted)
Frequent incandescent avalanches during April-September 2023
Merapi, located just north of the major city of Yogyakarta in central Java, Indonesia, has had activity within the last 20 years characterized by pyroclastic flows and lahars accompanying growth and collapse of the steep-sided active summit lava dome. The current eruption period began in late December 2020 and has more recently consisted of ash plumes, intermittent incandescent avalanches of material, and pyroclastic flows (BGVN 48:04). This report covers activity during April through September 2023, based on information from Balai Penyelidikan dan Pengembangan Teknologi Kebencanaan Geologi (BPPTKG), the Center for Research and Development of Geological Disaster Technology, a branch of PVMBG which specifically monitors Merapi. Additional information comes from the Pusat Vulkanologi dan Mitigasi Bencana Geologi (PVMBG, also known as Indonesian Center for Volcanology and Geological Hazard Mitigation, CVGHM), MAGMA Indonesia, the Darwin Volcanic Ash Advisory Centre (VAAC), and various satellite data.
Activity during April through September 2023 primarily consisted of incandescent avalanches of material that mainly affected the SW and W flanks and traveled as far as 2.3 km from the summit (table 25) and white gas-and-steam emissions that rose 10-1,000 m above the crater.
Table 25. Monthly summary of avalanches and avalanche distances recorded at Merapi during April through September 2023. The number of reported avalanches does not include instances where possible avalanches were heard but could not be visually confirmed as a result of inclement weather. Data courtesy of BPPTKG (April-September 2023 daily reports).
| Month |
Average number of avalanches per day |
Distance avalanches traveled (m) |
| Apr 2023 |
19 |
1,200-2,000 |
| May 2023 |
22 |
500-2,000 |
| Jun 2023 |
18 |
1,200-2,000 |
| Jul 2023 |
30 |
300-2,000 |
| Aug 2023 |
25 |
400-2,300 |
| Sep 2023 |
23 |
600-2,000 |
BPPTKG reported that during April and May white gas-and-steam emissions rose 10-750 m above the crater, incandescent avalanches descended 500-2,000 m on the SW and W flanks (figure 135). Cloudy weather often prevented clear views of the summit, and sometimes avalanches could not be confirmed. According to a webcam image, a pyroclastic flow was visible on 17 April at 0531. During the week of 28 April and 4 May a pyroclastic flow was reported on the SW flank, traveling up to 2.5 km. According to a drone overflight taken on 17 May the SW lava dome volume was an estimated 2,372,800 cubic meters and the dome in the main crater was an estimated 2,337,300 cubic meters.
During June and July similar activity persisted with white gas-and-steam emissions rising 10-350 m above the crater and frequent incandescent avalanches that traveled 300-2,000 m down the SW, W, and S flanks (figure 136). Based on an analysis of aerial photos taken on 24 June the volume of the SW lava dome was approximately 2.5 million cubic meters. A pyroclastic flow was observed on 5 July that traveled 2.7 km on the SW flank. According to the Darwin VAAC multiple minor ash plumes were identified in satellite images on 19 July that rose to 3.7 km altitude and drifted S and SW. During 22, 25, and 26 July a total of 17 avalanches descended as far as 1.8 km on the S flank.
Frequent white gas-and-steam emissions continued during August and September, rising 10-450 m above the crater. Incandescent avalanches mainly affected the SW and W flanks and traveled 400-2,300 m from the vent (figure 137). An aerial survey conducted on 10 August was analyzed and reported that estimates of the SW dome volume was 2,764,300 cubic meters and the dome in the main crater was 2,369,800 cubic meters.
Frequent and moderate-power thermal activity continued throughout the reporting period, according to a MIROVA (Middle InfraRed Observation of Volcanic Activity) analysis of MODIS satellite data (figure 138). There was an increase in the number of detected anomalies during mid-May. The MODVOLC thermal algorithm recorded a total of 47 thermal hotspots: six during April, nine during May, eight during June, 15 during July, four during August, and five during September. Some of this activity was captured in infrared satellite imagery on clear weather days, sometimes accompanied by incandescent material on the SW flank (figure 139).
Geologic Background. Merapi, one of Indonesia's most active volcanoes, lies in one of the world's most densely populated areas and dominates the landscape immediately north of the major city of Yogyakarta. It is the youngest and southernmost of a volcanic chain extending NNW to Ungaran volcano. Growth of Old Merapi during the Pleistocene ended with major edifice collapse perhaps about 2,000 years ago, leaving a large arcuate scarp cutting the eroded older Batulawang volcano. Subsequent growth of the steep-sided Young Merapi edifice, its upper part unvegetated due to frequent activity, began SW of the earlier collapse scarp. Pyroclastic flows and lahars accompanying growth and collapse of the steep-sided active summit lava dome have devastated cultivated lands on the western-to-southern flanks and caused many fatalities.
Information Contacts: Balai Penyelidikan dan Pengembangan Teknologi Kebencanaan Geologi (BPPTKG), Center for Research and Development of Geological Disaster Technology (URL: http://merapi.bgl.esdm.go.id/, Twitter: @BPPTKG); MAGMA Indonesia, Kementerian Energi dan Sumber Daya Mineral (URL: https://magma.esdm.go.id/v1); Pusat Vulkanologi dan Mitigasi Bencana Geologi (PVMBG, also known as Indonesian Center for Volcanology and Geological Hazard Mitigation, CVGHM), Jalan Diponegoro 57, Bandung 40122, Indonesia (URL: http://www.vsi.esdm.go.id/); Darwin Volcanic Ash Advisory Centre (VAAC), Bureau of Meteorology, Northern Territory Regional Office, PO Box 40050, Casuarina, NT 0811, Australia (URL: http://www.bom.gov.au/info/vaac/); MIROVA (Middle InfraRed Observation of Volcanic Activity), a collaborative project between the Universities of Turin and Florence (Italy) supported by the Centre for Volcanic Risk of the Italian Civil Protection Department (URL: http://www.mirovaweb.it/); Hawai'i Institute of Geophysics and Planetology (HIGP) - MODVOLC Thermal Alerts System, School of Ocean and Earth Science and Technology (SOEST), Univ. of Hawai'i, 2525 Correa Road, Honolulu, HI 96822, USA (URL: http://modis.higp.hawaii.edu/); Copernicus Browser, Copernicus Data Space Ecosystem, European Space Agency (URL: https://dataspace.copernicus.eu/browser/); Øystein Lund Andersen (URL: https://www.oysteinlundandersen.com/, https://twitter.com/oysteinvolcano).
Ebeko
Russia
50.686°N, 156.014°E; summit elev. 1103 m
All times are local (unless otherwise noted)
Moderate explosive activity with ash plumes continued during June-November 2023
Ebeko, located on the N end of Paramushir Island in Russia’s Kuril Islands just S of the Kamchatka Peninsula, consists of three summit craters along a SSW-NNE line at the northern end of a complex of five volcanic cones. Observed eruptions date back to the late 18th century and have been characterized as small-to-moderate explosions from the summit crater, accompanied by intense fumarolic activity. The current eruptive period began in June 2022, consisting of frequent explosions, ash plumes, and thermal activity (BGVN 47:10, 48:06). This report covers similar activity during June-November 2023, based on information from the Kamchatka Volcanic Eruptions Response Team (KVERT) and satellite data.
Moderate explosive activity continued during June-November 2023 (figures 50 and 51). According to visual data from Severo-Kurilsk, explosions sent ash 2-3.5 km above the summit (3-4.5 km altitude) during most days during June through mid-September. Activity after mid-September was slightly weaker, with ash usually reaching less than 2 km above the summit. According to KVERT the volcano in October and November was, with a few exceptions, either quiet or obscured by clouds that prevented satellite observations. KVERT issued Volcano Observatory Notices for Aviation (VONA) on 8 and 12 June, 13 and 22 July, 3 and 21 August, and 31 October warning of potential aviation hazards from ash plumes drifting 3-15 km from the volcano. Based on satellite data, KVERT reported a persistent thermal anomaly whenever weather clouds permitted viewing.
Geologic Background. The flat-topped summit of the central cone of Ebeko volcano, one of the most active in the Kuril Islands, occupies the northern end of Paramushir Island. Three summit craters located along a SSW-NNE line form Ebeko volcano proper, at the northern end of a complex of five volcanic cones. Blocky lava flows extend west from Ebeko and SE from the neighboring Nezametnyi cone. The eastern part of the southern crater contains strong solfataras and a large boiling spring. The central crater is filled by a lake about 20 m deep whose shores are lined with steaming solfataras; the northern crater lies across a narrow, low barrier from the central crater and contains a small, cold crescentic lake. Historical activity, recorded since the late-18th century, has been restricted to small-to-moderate explosive eruptions from the summit craters. Intense fumarolic activity occurs in the summit craters, on the outer flanks of the cone, and in lateral explosion craters.
Information Contacts: Kamchatka Volcanic Eruptions Response Team (KVERT), Far Eastern Branch, Russian Academy of Sciences, 9 Piip Blvd., Petropavlovsk-Kamchatsky, 683006, Russia (URL: http://www.kscnet.ru/ivs/kvert/).
Search Bulletin Archive by Publication Date
Select a month and year from the drop-downs and click "Show Issue" to have that issue displayed in this tab.
The default month and year is the latest issue available.
Bulletin of the Global Volcanism Network - Volume 42, Number 07 (July 2017)
Managing Editor: Edward Venzke
Erta Ale (Ethiopia)
Persistent lava lake; crater rim overflows; new fissure eruption begins in January 2017
Fournaise, Piton de la (France)
Intermittent effusive episodes during February-October 2015; May and September 2016; and February 2017
Kambalny (Russia)
First major eruption in over 600 years consists of large ash explosions during March-April 2017
Lascar (Chile)
Thermal anomaly persists until April 2017
Popocatepetl (Mexico)
Ash plumes several times weekly, multiple episodes of dome growth and destruction, and high SO2 flux during January 2015-June 2016.
Reventador (Ecuador)
Lava flow emerges from summit cone, January 2016; continued explosions, pyroclastic flows, and ash emissions
San Miguel (El Salvador)
Six small ash emission events during January 2015-June 2017
Santa Maria (Guatemala)
Continuous ash emissions, pyroclastic flows and lahars; new lava dome visible at Caliente dome, October 2016
Stromboli (Italy)
Persistent low- and moderate-level explosive activity during 2015 and 2016
Yasur (Vanuatu)
Strong explosions reported through mid-June 2017, with ongoing thermal anomalies
Erta Ale
Ethiopia
13.601°N, 40.666°E; summit elev. 585 m
All times are local (unless otherwise noted)
Persistent lava lake; crater rim overflows; new fissure eruption begins in January 2017
Ethiopia's Erta Ale basaltic shield volcano has had an active lava lake since the mid 1960s, and possibly much earlier. The first confirmed historical observations were in 1906. Two active craters (Northern and Southern) within a larger oval-shaped caldera exhibit periodic fountaining of lava causing lava lake overflows; this creates spectacular incandescence as the pahoehoe lava flows into the larger caldera around the craters and occasionally beyond. Lava flows in the South Pit crater overflowed its rim in November 2010 (BGVN 36:06). This report discusses activity from 2011 through June 2017, including the South Pit crater overflows in January and November 2016, and a new fissure eruption on the SE flank that began in January 2017 and was continuing in June 2017. Information comes from satellite thermal and visual data (NASA Earth Observatory, MODIS), and photographs from expeditions (primarily from Volcano Discovery) that regularly visit this remote site.
The lava lake at the South Pit crater in the summit caldera remained active, with the lake level falling and rising to within a few meters of the rim, during 2011-2015. Intermittent lava flows were reported from the North Pit Crater as well during this time. Activity increased late in 2015, and the first overflows of the South Pit crater rim since late 2010 occurred in mid-January 2016. It overflowed again in November 2016, and covered a significant area of the surrounding caldera floor with pahoehoe. By late December, effusive activity was reported from both craters. Flow intensity and volume increased dramatically for several days beginning on 17 January 2017, followed by ash emissions and crater collapses on 20-21 January. A new fissure eruption on the SE flank about 4 km from the caldera appeared on 21 January 2017, and sent lava flows several kilometers to the NE and the SW. Activity at the fissure vent increased during subsequent months, and by June 2017 a substantial new lava field that contained at least one new lava lake and flows more than 1,500 m long covered the area. Effusive activity had also resumed at both craters in the summit caldera.
Activity during November 2011-December 2016. Visitors in November 2011 confirmed the continued presence of the lava lake (figure 32) at the South Pit crater in the summit caldera. On 16 January 2012, an attack by Eritrean rebels on tourists camping at the S crater rim left at least five European tourists dead and seven others wounded; four Europeans and their Ethiopian guides were also abducted, according to Volcano Discovery reports. News reported through Volcano Discovery suggested that the abducted tourists were released in March 2012.
Visitors in January 2013 reported that the lava lake in the North Pit crater was active and about 10 m below the rim. Intermittent lava flows were observed from a hornito in the South Pit crater and were continuing to fill the crater floor. Members of an expedition in December 2013 observed that the active lava lake at the South Pit crater had risen considerably during previous months (figure 33). An expedition in February 2015 also documented continued lava fountaining (figure 34) at the South Pit crater.
During 19-21 November 2015, visitors on an expedition to Erta Ale observed significant changes in the lava lake level at the South Pit crater. On the morning of 19 November (figure 35) the lake surface was 2-3 m below the rim. A local guide reported that the lake had been very active during the previous weeks, rising to levels near overflowing similar to the event in late 2010. A second terrace of freshly cooled pahoehoe was visible less than 1 m below the rim, indicating the most recent maximum height of the lake. On 19 November, the lake rose to within 30 cm of the terrace rim, with occasional lava fountains splashing onto the terrace (figure 36), and Pele's hair forming continuously. The level had dropped several meters by the next morning. During 20 and 21 November, the activity was characterized by large, periodic "exploding bubbles" from the center of the lake creating waves across the surface; minor Strombolian activity and fountaining occurred around the edges. The lake level generally fluctuated between 0.5 and 1 m below the second terrace. On the evening of 21 November, the level rose rapidly from five to three meters below the second terrace; lava rapidly seeped out of the cracks in the cooling surface, overflowing onto the thin crust.
Volcano Discovery reported that the lava overflowed the rim of the South Pit crater during the night of 15-16 January 2016, and covered the rim with a fresh crust of pahoehoe. An expedition leader reported that during 12-15 February 2016, the lake level had dropped 5-7 m. A visitor to the crater in April 2016 photographed the lake level several meters below the rim with active fountaining lava (figure 37).
The southern pit crater began overflowing again at the beginning of November 2016, and covered significant parts of the surrounding caldera floor (figures 38 and 39). The overflow was observed at mid-day on 14 November by visitors from the Societe de Volcanologie Geneve (SVG).
By late December 2016, effusive activity was reported from both the North and South Pit craters, including activity at the South Pit crater overflowing beyond the surrounding summit caldera. An expedition during 29 December 2016-1 January 2017 observed changing activity from both craters inside the summit caldera (figure 40). During 29-31 December, the lake level at the South Pit crater fluctuated between 0.5 and 1 m below the rim. During this time lava fountains 2-3 m high were frequent along the South Pit crater rim, but it did not overflow. The caldera floor around the crater was covered with 2-3 m of fresh pahoehoe, over an area about 150 m in diameter. Activity at the North Pit crater had formed three hornitos, one of which was emitting lava.
Activity during January-June 2017. Observations on 16 January 2017 at the North Pit crater showed remnants of two large hornitos surrounded by fresh lava flows (figure 41). During 16-20 January 2017, the lava lake at the South Pit crater underwent rapid and large variations, producing massive overflows and intense spattering. During the morning of 16 January the lake overflowed the W rim of the crater (figure 42); in the afternoon two lava rivers, reaching 500 m in length, appeared on the SW flank.
On 17 January around 1300, two overflows began on the South Pit crater rim. Two hours later, overflows appeared on the NE and N flank; lava was flowing over about 70% of the rim according to visitors (figure 43). They reported the speed of the lava flowing on the flank at 50-70 km per hour, covering about 1 km2 within the larger caldera. In the morning of 18 January, fresh, glowing lava covered the area around the South Pit crater 500-700 m in all directions (figure 44). Sporadic overflows occurred with lake levels fluctuating by 10-15 m for several days. During lower levels, Strombolian fountains reached 50-60 m above the lake.
On the evening of 20 January, explosions of very large gas bubbles were observed by Oliver Grunewald and reported by Culture Volcan, causing lava to spatter up to 30 m high. Parts of both of the craters in the Summit caldera began to collapse. At the North Pit crater, a new 20 m deep oval-shaped pit crater 150 x 30 m formed during the next 24 hours. A collapse at the South Pit crater doubled its size. This activity was accompanied by ash emissions that reached 700-800 m above the crater.
Volcano Discovery reported news from eyewitness reports of a fissure eruption beginning on 21 January 2017. Two fissure eruptions were visible on the SE flank, 3 and 4 km SE of the South Pit crater lava lake, in satellite imagery taken on 26 January 2017 (figure 45). The higher vent was located at about 650 m elevation, and the lower one around 400 m. The fissures created three distinct lava fields, one to the NE reaching about 3 km length, a smaller one to the W (about 1 km), and one to the SSE about 2 km long. The surface area covered by the first two (on either side on the northernmost fissures) was estimated to be about 1.5 km² (1,500,000 m²), while the southern flow covered about 0.35 km² (350,000 m²). As a result of the sudden draining of the magma into the new fissure zone, the lava lake in the South Pit crater was reported to have dropped by 80-100 m. Additional satellite imagery taken before and after the fissure eruptions began reveal the locations of the new flows on 23 and 27 January 2017 (figure 46).
After dropping about 100 m after the flank eruption began, the South Pit crater lake level rose again by mid-February to 40-50 m below its rim. By April 2017, activity still remained high; a new lava lake about 80 x 175 m in size had formed at the flank eruption site, and a growing lava field, about 1,500 m wide had reached 3.5 km NE of the original site. Geologists from Addis Abeba University who visited the site during 11-15 April 2017 noted two coalesced hornitos in the NE part of the South Pit crater, estimated to be 7 m high. The old lava lake was covered with cooled lava in a 200-m-diameter near-circular shape. Frequent surface collapse and lake-level changes occurred every 30 minutes, and lava fountains rose 25 m above the surface. The fresh lava surface around the crater rim had cooled enough to walk on it. The North Pit crater was still degassing, with several small hornitos growing in the center. The lake level at the new fissure (the SE Rift Zone) had dropped by about 10 m.
By early May 2017, the first lava lake at the SE Rift Zone had crusted over and a new lake was forming about 350 m E. A new breakout also started in early May, and was feeding a new flow field overlapping the previous one to the NE, more than 1,500 m long and over 500 m wide.
Satellite data. In addition to field observations of Erta Ale, valuable information is available from continuous satellite data. Thermal data from MODIS is processed by both the MIROVA and MODVOLC systems. The MIROVA thermal anomaly system recorded the high levels of heat flow and changes in location of the heat flow sources from late September 2015 through June 2017 (figure 47). The change in location and intensity of the heat flow in late January 2017 corresponds with the opening of the SE-flank fissure.
The MODVOLC thermal alert system managed by the University of Hawaii has captured persistent thermal alerts from Erta Ale for at least 10 years. When activity is moderate to high at the lava lakes in the pit craters, the signal is concentrated in those areas (figure 48). The reports of lava overflowing the south crater rim in January 2016 correspond to increased heat flow visible in the MODVOLC data. The dramatic changes in heat flow with the new fissure flows from the SE rift zone and subsequent new lava lake formation are apparent in MODVOLC images from January-May 2017 (figure 49).
Geologic Background. The Erta Ale basaltic shield volcano in Ethiopia has a 50-km-wide edifice that rises more than 600 m from below sea level in the Danakil depression. The volcano includes a 0.7 x 1.6 km summit crater hosting steep-sided pit craters. Another larger 1.8 x 3.1 km wide depression elongated parallel to the trend of the Erta Ale range is located SE of the summit and is bounded by curvilinear fault scarps on the SE side. Basaltic lava flows from these fissures have poured into the caldera and locally overflowed its rim. The summit caldera usually also holds at least one long-term lava lake that has been active since at least 1967, and possibly since 1906. Recent fissure eruptions have occurred on the N flank.
Information Contacts: NASA Earth Observatory, EOS Project Science Office, NASA Goddard Space Flight Center, Goddard, Maryland, USA (URL: http://earthobservatory.nasa.gov/); Tom Pfeiffer, Volcano Discovery (URL: http://www.volcanodiscovery.com/); Robert Simon, Sr. Data Visualization Engineer, Planet Labs Inc. (URL: http://www.planet.com/); MIROVA (Middle InfraRed Observation of Volcanic Activity), a collaborative project between the Universities of Turin and Florence (Italy) supported by the Centre for Volcanic Risk of the Italian Civil Protection Department (URL: http://www.mirovaweb.it/); Hawai'i Institute of Geophysics and Planetology (HIGP), MODVOLC Thermal Alerts System, School of Ocean and Earth Science and Technology (SOEST), Univ. of Hawai'i, 2525 Correa Road, Honolulu, HI 96822, USA (URL: http://modis.higp.hawaii.edu/); Societe de Volcanologie Geneve (SVG), Bulletin 161, January 2017.
Piton de la Fournaise (France) — July 2017 Cite this Report
Piton de la Fournaise
France
21.244°S, 55.708°E; summit elev. 2632 m
All times are local (unless otherwise noted)
Intermittent effusive episodes during February-October 2015; May and September 2016; and February 2017
Short pulses of intermittent eruptive activity have characterized Piton de la Fournaise, the large basaltic shield volcano on Reunion Island in the western Indian Ocean, for several thousand years. Recent eruptive episodes on 21 June 2014 and activity that started on 4 February 2015 have already been reported (BGVN 40:02). This report covers the remainder of the 2015 eruptive episode, and additional activity through May 2017. Information about Piton de la Fournaise is provided by the Observatoire Volcanologique du Piton de la Fournaise (OVPF) and satellite instruments.
A one-day fissure eruption on the ESE side of the central cone of the summit caldera on 21 June 2014 created a 1.5-km-long flow. This was followed by seven months of quiet. There were four effusive eruption events during 2015. The 4-15 February event occurred on the W side of the Dolomieu summit cone and the lava flow traveled about 2.5 km S. Effusion during 17-30 May started outside and SE of the Dolomieu Crater and traveled 4 km before it ceased. The brief 30 July-2 August event erupted from a 1-km-long fissure in the NE part of the l'Enclos Fouqué caldera and produced dozens of lava fountains. During 24 August-31 October a more sustained eruption from a fissure on the S flank of Dolomieu Crater sent lava flows at least 3.5 km down the flank to the S. Piton de la Fournaise experienced two effusive episodes in 2016. The 26-27 May event caused lava fountains on the SE flank of Dolomieu Crater. During 11-18 September, several fissures opened in the N part of the l'Enclos Fouqué caldera and produced numerous lava fountains and a lava flow. An effusive event on the SE flank of the summit crater during 31 January-27 February 2017 sent lava through tubes and flowed several kilometers to the SE before subsiding.
Activity during June 2014 and February 2015. The one-day eruption on 21 June 2014 consisted of a fissure eruption that was entirely contained within the Enclos Fouqué (the summit caldera) on the ESE side of the central (Dolomieu) cone. A lava fountain at the fissure created a spatter rampart and two lava flows that traveled about 1.5 km to the SE (BGVN 40:02).
The next eruption began abruptly on 4 February 2015 at a fissure on the W side of the summit cone adjacent to Bory crater (see figure 87), and lava flowed generally S, reaching about 2.5 km in length by 8 February (figure 88). The MODVOLC thermal alert signal for this event was detected over 4-14 February, and indications of continuing activity ceased by 15 February. OVPF partially reopened access to the volcano on 21 February.
Activity during May 2015. A brief increase in seismic activity, continued deformation, and increased magmatic gas emissions occurred on 29 April, but no effusive activity took place. A 90-minute seismic swarm of 200 volcano-tectonic (VT) events followed by significant deformation at the summit crater preceded a new effusive eruption at 1345 on 17 May. The eruption started outside and SE of Dolomieu crater in the Castle crater area. Volcanologists noted lava fountains from three fissures, and two lava flows. A very large gas plume emitted during the first few hours of the eruption rose 3.6-4 km above the summit and drifted NW. The fissure furthest W stopped issuing lava fountains before midnight.
On 18 May only one fissure was active and the SSW-drifting gas plume was much smaller. Hydrogen sulfide emissions continued to be high, and carbon dioxide emissions increased. Lava fountains from a single vent along the second fissure, further E, rose 40-50 m. The lava flow had traveled 4 km, reaching an elevation of 1.1 km. On 19 May, scientists observed lava fountains 20-30 m high, and noted the lava flow which had traveled 750 m in the previous day, reaching 1 km elevation. Lava-flow rates estimated by satellite data fluctuated but showed an overall decrease from 24.2 m2/s on 17 May to 2.5 m2/s on 21 May. During 21-22 May observers reported large variations in activity, including increasing heights of the lava fountain (over 50 m high), collapsing parts of the newly formed cinder cone, and a new very fluid lava flow adjacent to the main flow.
During an overflight on 23 May scientists observed a large blue sulfur dioxide plume above the vent, lower lava fountains, a smaller vent in the cone, and the presence of a lava tube about 200 m downstream of the vent. During 24-25 May activity remained unchanged; low lava fountains and low-level lava flows persisted (figure 89). OVPF reported that the eruption continued through 30 May 2015 after which tremor was no longer detected. The MODVOLC thermal alerts for this event agreed well with the observations of the volcanologists. Strong multi-pixel alerts were issued daily from 17-30 May.
Activity during 30 July-2 August 2015. A brief spike in seismicity on 6 July was the only notable activity after 30 May prior to a new eruptive episode that began on 30 July with a sharp increase in seismicity, increased gas emissions, and deformation near the summit. A fissure eruption began the next day at 0920, preceded by 90 minutes of high seismicity and 80 minutes of major deformation; it was confirmed by a hiker and then by observation of a gas plume. The 1-km-long fissure opened in the NE part of the l'Enclos Fouqué caldera and produced dozens of lava fountains (figure 90). Based on satellite images and gas data, the flow rate was estimated to be 28 m2/s initially and then 11 m2/s later that day. A gas plume rose to altitudes of 3.2-3.5 km. By the evening there were only five fountains, and a lava flow had traveled as far E as Plaine des Osmondes (NE part of the caldera). According to an AP news article, lava fountains were 40 m high, forming 20-m-high cones on 31 July. At 1115 on 2 August tremor stopped after several hours of fluctuating intensity, indicating the end of effusive activity.
Activity during 24 August-November 2015. The government reopened access to the caldera on 20 August; this was very short-lived, however, as a new eruption began on 24 August that continued through November 2015. Sulfur dioxide gas emissions increased at 1600, and the seismic and deformation network indicated a magmatic intrusion beginning at 1711 (figure 91). Lava fountains were visible at 1850 from a fissure on the S flank of Dolomieu Crater, at about 2,000 m elevation, near Rivals Crater. The fissure propagated towards the top of Rivals, and at around 2115 a fissure opened to the NW, below Bory Crater. The lava-flow rate was 30-60 m2/s . By the next morning fountains at higher elevations ceased, and were only active from a 100-m-long section near Rivals crater. The lava flow rate had significantly decreased to 10 m2/s . Near the top of the active fissure, a small cone had formed 140 m E of the sign to Rivals crater.
OVPF reported that the eruption fluctuated during the rest of August, causing variations in the height of the lava fountains and emissions. One vent remained active, and lava flows from it traveled at least as far as 3.5 km during 27-28 August. During an overflight the next day, scientists observed two growing cinder cones with lava lakes and lava fountains. An 'a'a lava flow was active, and a large gas plume rose 3 km.
Scientists conducting fieldwork during 31 August-1 September observed an active cone (20 m high) filled with a lava lake. Fluctuating lava fountains rose 15-20 m above the surface and gas bubbles exploded. Lava traveled through a 50-m-long lava tube and extended a distance of 1 km. During 1-2 September, seismicity increased and the lava flow grew to 2 km long (figure 92). Lava was observed in two separate side-by-side vents on 4 September (figure 93), and lava fountains were lower compared to recent days. Five small lava flows were visible near the foot of the cone; four were 30 m long and the fifth was 1 km long.
The side-by-side vents remained active through 17 September, after which only one was active. Lava flows emerged from and were active beyond a 50-100 m lava tube; the largest lava flows were up to 1.5 km in length. During 22-23 September a new lava tube formed to the W of the lava field. By 24 September the active cone was 30 m high; lava fountains were lower and less frequently observed but lava flows continued to be active, traveling as far as 3 km S and E (figure 94). OVPF reported that seismicity at Piton de la Fournaise slowly increased during the last week of September, and deformation data showed a trend of deflation during the last few days of the month. During fieldwork on 27 September volcanologists noted continuous lava fountains. Small lava flows were active, though the fronts of the two larger ones were no longer advancing.
During the first two weeks of October, the lava lake remained active; bursting gas bubbles ejected lava onto the edges of the 30-35-m-high cone. Pahoehoe lava flows issued from ephemeral vents on lava tubes, and in many instances hornitos were built at these vents. Lava was active as far as 2.5 km from the base of the cone and burned vegetation near the base of Piton de Bert. The lava-flow rate peaked at 11 m2/s during 1-4 October then returned to the previous rate of 5-10 m2/s. On 7 October lava flowed out of a breach in the cone. The evolution of the morphology of the eruptive vent changed from a fissure to a single cone between late August and early October (figure 95).
On 12 October there was a strong increase in tremor intensity, with values reaching or exceeding those detected during the first few hours of the eruption (24 August). Strain measurements showed continued deflation. A hornito SW of the cone ejected spatter during 13-14 October. Activity continued to increase on 16 and 17 October (figure 96). The cone continued to grow; the base was 100 m in diameter and it was about 40 m high. Parts of the cone rim continued to collapse, and a notch in the rim allowed for periodic lava-lake overflows. Increased SO2 flux created bubbles in the lava that caused ejection and spattering of large amounts of lava around the vent rim.
Tremor ceased abruptly on 19 October. Observers reported that a small explosion in the vent ejected spatter on 22 October, but lava flows were not observed. Lava fountains were visible from the main 24 August vent on 30 October for the last time (figure 97).
OVPF reported that based on the change in seismic and lava flow activity, the effusive phase of the eruption beginning on 24 August had ended by 31 October 2015. They noted that during a few days before 11 November, the networks had recorded geophysical and geochemical signs of pressurization within the volcano. They also observed during aerial reconnaissance on 11 November persistent white fumarolic activity reflecting the high temperature of the lava field. Indications of inflation ceased at the end of November. MODVOLC thermal alerts became sporadic during November and ceased altogether on 2 December 2015 for more than five months.
MODVOLC thermal alerts for 2015. The MODVOLC thermal alerts captured for Piton de la Fournaise during 2015 show the differing locations of the four effusive eruptions (figure 98). The 4-14 February episode was located on the W side of the summit cone adjacent to Bory crater, in the W side of the Enclos Fouqué summit caldera. The 17-30 May episode extended farther E than that of the February event. A 1-km-long fissure opened in the NE part of the l'Enclos Fouqué caldera for the brief 31 July-1 August episode. Activity was concentrated on the S flank of the Dolomieu Crater during the lengthier 24 August-31 October effusive episode.
Sulfur Dioxide flux during 2015. Images captured by the OMI (Ozone Monitoring Instrument) on the Aura satellite showed significant SO2 plumes during three of the 2015 eruptive episodes, especially at the onset of the activity (figure 99). Dobson Unit (DU) values greater than 2 are shown as red pixels in the images. The largest plumes of SO2 captured during 2015 were after the effusive episodes had ended on 24 and 31 October 2015 (figure 100).
Activity during 2016. Piton de la Fournaise experienced two effusive episodes in 2016, one occurred during 26-27 May, and the other during 11-18 September. The GPS networks detected evidence of inflation on 24 January 2016. This lasted until the second week of February when weak deflation was recorded. OVPF reported that CO2 gas emission, deformation, and seismicity began to slowly increase on 16 May, and then seismicity significantly increased at 1140 on 25 May. Tremor began at 0805 on 26 May, characteristic of an ongoing eruption, likely from a new fissure near Château Fort crater. Bad weather prevented visual observations of the area at first, though at 0900 ground observers confirmed a new eruption. Later that day scientists and reporters saw about six lava fountains (some were 40-50 m high) during brief aerial surveys and a cinder cone being built on a flat area at 1850 m elevation about 1-1.5 km SE of Castle Crater. On 27 May, tremor levels significantly dropped at 0845 and then ceased at 1100. Signals indicative of degassing continued. The lava fountains on 26 May were located on the SE flank of the main Dolomieu Crater south of the locations of both the May and August 2015 episodes (figure 101).
Significant inflation continued after the 26-27 May eruption until mid-June (more than two centimeters between 27 May and 8 June) when it levelled off, and then began again in mid-July along with increased seismicity beginning on 13 July that lasted through the remainder of the month. OVPF reported that seismicity remained low during August. Gas emissions were also low and dominated by water vapor; CO2 emissions had been elevated during 21-27 July. Inflation had stopped in early August and slight deflation was detected through 2 September.
Seismicity increased on 10 September, and elevated levels of SO2 were detected at fumaroles. A seismic swarm occurred at 0735 on 11 September, characterized by several earthquakes per minute. Deformation suggested magma migrating to the surface. Volcanic tremor began at 0841, indicating the beginning of the eruption. Several fissures opened in the N part of the l'Enclos Fouqué caldera, between Puy Mi-côte and the July 2015 eruption site, and produced a dozen 15-30-m-high lava fountains distributed over several hundred meters. The eruption continued on the next day.
OVPF reported that volcanic tremor stabilized during 14-17 September. Field observations on 15 September revealed that the two volcanic cones that had formed on the lower part of the fissures had begun to coalesce (figure 102). Lava from the northernmost cone flowed N and NE, and by 0900 was active midway between Piton Partage and Nez Coupé de Sainte Rose. The height of the lava fountains grew in the afternoon, rising as high as 60 m, likely from activity ceasing at the southernmost cone and focusing at one main cone. On 16 September the main cone continued to build around a 50-m-high lava fountain; lava flows from this vent traveled NE. Tremor rose during the night on 17 September, and then fell sharply at 0418 on 18 September, indicating the end of surface activity. During 11-18 September, the erupted volume was an estimated 7 million cubic meters. By 26 September, earthquake frequency had decreased to less than five per day.
Following the slight deflation observed during the eruption (11-18 September), inflation began again on 18 September, slowed significantly by 1 October and ceased by 6 October. Inflation resumed at the summit on 12 December, and increased summit seismicity was reported by OVPF on 22 December 2016.
Activity during January-May 2017. A return to background levels of seismicity (0-1 events per day) and a slowdown in inflation were reported on 9 January 2017. Inflation resumed on 22 January. This was interpreted by OVPF to represent the deep-seated magma supplies beginning to feed the surface reservoir about 1.5-2 km under the summit craters once again. Following a seismic swarm beginning at 1522 on 31 January, seismic tremor indicated that a new effusive eruption began at 1940 on 31 January.
Visual observations on 1 February confirmed that the active vent was located about 1 km SE of Château Fort and about 2.5 km ENE of Piton de Bert (figure 103). Lava fountains rose 20-50 m above the 10-m-high vent, and 'a'a lava flows branched and traveled 750 m (figure 104). Two other cracks had opened at the beginning of the eruption, but were no longer active. Tremor levels decreased in the early hours of the eruption; lava-fountain heights were variable (between 20-50 m).
On 2 February, two lava fountains at the vent were visible, and lava flows had traveled an additional 500 m E (figure 105). The vent was 128 m long and about 35 m high at the highest part. On 4 February OVPF noted that significant fluctuations of volcanic tremor were detected for more than 24 hours, with intensity levels reaching those observed at the onset of the eruption. Higher levels of seismicity continued through 7 February.
OVPF reported that during 8-14 February volcanic tremor was high, with levels reaching those observed at the onset of the eruption on 31 January. The eruptive vent was perched on top of a cone that was 30-35 m high and 190 m wide at the base (figure 106). The lava level inside of the cone was low, or about half of cone's height, and incandescent material was ejected from the vent. Inflation stopped on 11 February. The lava flow reached its farthest extent on 10 February, almost 3 km SE of the vent (figures 107 and 108).
Volcanic tremor fluctuated during 14-21 February. Observations made on the ground on 16 February by the observatory teams indicated that activity continued mainly in lava tubes. Only a few flows were visible a hundred meters downstream of the eruptive cone. A resumption of inflation was confirmed on 20 February.
During 25-26 February OVPF observers noted ejections of material from the active vent. A few skylights in the lava tubes were spotted. Late at night on 26 February tremor began to decline, and ceased at 1010 the next morning. Mid-day on 27 February observers confirmed that no material was being ejected from the vent, and that only white plumes were rising; gas emissions ceased at 1930. OVPF reported that the 28-day eruption at Piton de la Fournaise, beginning on 31 January and ending on 27 February, was estimated to have produced between 8 and 10 million cubic meters of lava. Although the eruption had ended on 27 February, inflation at the summit continued until about 7 March. It resumed at a low rate in mid-April, along with minor seismicity.
A new seismic swarm began at 1340 on 17 May and was accompanied by rapid deformation that suggested rising magma; volcanic tremor was recorded at 2010. The seismic and deformation activity was located in the NE part of l'Enclos Fouqué caldera. During an overflight at 1100 on 18 May scientists observed no surface activity at the base of the Nez Coupé de Sainte Rose rampart (on the N side of the volcano) nor outside of l'Enclos Fouqué caldera, and suggested that fractures opened but did not emit lava.
Seismicity increased again at 0400 on 18 May. The number of shallow (2 km depth) volcano-tectonic earthquakes progressively decreased over the next three days. During a field visit on 22 May scientists mapped the deformation associated with the 17 May event and measured displacements which did not exceed 35 cm. The 17-18 May activity resulted in two new zones of fumaroles that followed the trends seen in seismic and deformation data. Inflation stopped around mid-June, and seismicity was minimal for the remainder of the month.
MIROVA thermal data for 2016 and January-May 2017. Plots of thermal anomaly data by the MIROVA system correlated with the eruptive activity of 26-27 May 2016, 11-18 September 2016, and 31 January-27 February 2017 (figure 109). The thermal signatures of the September 2016 and February 2017 episodes show continued cooling of the new lava flows for several weeks after the effusive activity ceased.
Geologic Background. Piton de la Fournaise is a massive basaltic shield volcano on the French island of Réunion in the western Indian Ocean. Much of its more than 530,000-year history overlapped with eruptions of the deeply dissected Piton des Neiges shield volcano to the NW. Three scarps formed at about 250,000, 65,000, and less than 5,000 years ago by progressive eastward slumping, leaving caldera-sized embayments open to the E and SE. Numerous pyroclastic cones are present on the floor of the scarps and their outer flanks. Most recorded eruptions have originated from the summit and flanks of Dolomieu, a 400-m-high lava shield that has grown within the youngest scarp, which is about 9 km wide and about 13 km from the western wall to the ocean on the E side. More than 150 eruptions, most of which have produced fluid basaltic lava flows, have occurred since the 17th century. Only six eruptions, in 1708, 1774, 1776, 1800, 1977, and 1986, have originated from fissures outside the scarps.
Information Contacts: Observatoire Volcanologique du Piton de la Fournaise, Institut de Physique du Globe de Paris, 14 route nationale 3, 27 ème km, 97418 La Plaine des Cafres, La Réunion, France (URL: http://www.ipgp.fr/); Hawai'i Institute of Geophysics and Planetology (HIGP), MODVOLC Thermal Alerts System, School of Ocean and Earth Science and Technology (SOEST), Univ. of Hawai'i, 2525 Correa Road, Honolulu, HI 96822, USA (URL: http://modis.higp.hawaii.edu/); MIROVA (Middle InfraRed Observation of Volcanic Activity), a collaborative project between the Universities of Turin and Florence (Italy) supported by the Centre for Volcanic Risk of the Italian Civil Protection Department (URL: http://www.mirovaweb.it/); NASA Goddard Space Flight Center (NASA/GSFC), Global Sulfur Dioxide Monitoring Page, Atmospheric Chemistry and Dynamics Laboratory, 8800 Greenbelt Road, Goddard, Maryland, USA (URL: https://so2.gsfc.nasa.gov/); Associated Press (URL: http://www.ap.org/); U.S. News (URL: https://www.usnews.com/news/world/articles/2015/08/01/highly-active-volcano-erupts-on-reunion-amid-media-frenzy).
Kambalny
Russia
51.306°N, 156.875°E; summit elev. 2116 m
All times are local (unless otherwise noted)
First major eruption in over 600 years consists of large ash explosions during March-April 2017
The last major eruption at Kambalny volcano was around 1350, although younger undated tephra layers have been found; there are also five Holocene cinder cones on the W and SE flanks. According to the Kamchatkan Volcanic Eruption Response Team (KVERT), a new eruption began began at about 2120 UTC on 24 March 2017. Satellite data showed an initial ash plume at about 5-6 km altitude drifting about 35 km SW from the volcano.
Explosive activity was strong during 24-27 March, generating ash plumes up to 7 km high that drifted downwind as far as 2,000 km (table 1). Activity then decreased, with only minor ash emissions through 6 April, followed by ash plumes that drifted 50 and 170 km on 9 and 10 April, respectively. Only gas-and-steam plumes were reported after that time.
Table 1. Chronological details of the March-April 2017 eruption of Kambalny. Data from KVERT reports.
| Date |
Time (UTC) |
Plume height (km) |
Drift (km) |
Other observations |
| 24 Mar 2017 |
2250 |
5-6 |
35 SW |
Aviation Color Code Orange |
| 25 Mar 2017 |
0053 |
5-6 |
100 SSW |
-- |
| 25 Mar 2017 |
0240 |
5-6 |
163 SSW |
-- |
| 25 Mar 2017 |
0409 |
5-7 |
255 SW |
-- |
| 25 Mar 2017 |
1250 |
5 |
550 SSW |
-- |
| 25 Mar 2017 |
1807 |
6 |
870 SSW |
-- |
| 25 Mar 2017 |
2250 |
5.5 |
930 S |
-- |
| 26 Mar 2017 |
0530 |
5 |
1,350 SSE |
-- |
| 26 Mar 2017 |
2131 |
3.5-4 |
670 SE |
-- |
| 27 Mar 2017 |
0041 |
5 |
830 SE |
-- |
| 27 Mar 2017 |
0347 |
4-4.5 |
425 SE |
-- |
| 27 Mar 2017 |
2119 |
4-5 |
51 W |
-- |
| 27-31 Mar 2017 |
-- |
5-6 |
2,000 W to SE |
-- |
| 01 Apr 2017 |
-- |
-- |
200 E, SE |
Quiet. |
| 02-04 Apr 2017 |
-- |
7 |
-- |
Minor ash emissions thru 6 Apr; satellite thermal anomaly 3-4 Apr. |
| 09 Apr 2017 |
-- |
7 |
50 NE |
-- |
| 10 Apr 2017 |
-- |
-- |
170 SE |
-- |
| 12 Apr 2017 |
-- |
-- |
-- |
Gas-and-steam activity. |
| 21-28 Apr 2017 |
-- |
-- |
-- |
Moderate activity. |
| 05 May 2017 |
-- |
-- |
-- |
Aviation Color Code Yellow. Moderate gas-steam activity. |
| 19 May 2017 |
-- |
-- |
-- |
Aviation Color Code Yellow Green. Only gas-steam activity during last month; explosive phase began 24 Mar, ended 10 Apr 2017. |
On 25 March satellite imagery showed an ash plume stretching about 100 km SW of the Kamchatka Peninsula (figure 1). A dark stain is visible to the W of the plume, where ash has covered the snow. By 26 March ashfall had covered the ground on both sides of the volcano. The eruption was also observed on the ground by staff at the South Kamchatka Federal Wildlife Sanctuary (figure 2). The Ozone Monitoring Instrument on the Aura satellite observed an airborne plume of sulfur dioxide (SO2) trailing S of Kamchatka on 26 March 2017 (figure 3).
On 28 March 2017, the Operational Land Imager (OLI) on the Landsat 8 satellite acquired a natural-color image of an ash plume from Kambalny (figure 4), including a large area of ash-covered snow. When photographed by scientists on 12 April (figure 5), the entire edifice was covered by ash and there was a gas-and-steam plume rising from a crater fumarole.
Geologic Background. The southernmost major stratovolcano on the Kamchatka peninsula, Kambalny has a summit crater that is breached to the SE. Five Holocene cinder cones on the W and SE flanks have produced fresh-looking lava flows. Beginning about 6,300 radiocarbon years ago, a series of major collapses of the edifice produced at least three debris-avalanche deposits. The last major eruption took place about 600 years ago, although younger tephra layers have been found, and an eruption was reported in 1767. Active fumarolic areas are found on the flanks of the volcano, which is located south of the massive Pauzhetka volcano-tectonic depression.
Information Contacts: Kamchatka Volcanic Eruptions Response Team (KVERT), Far Eastern Branch, Russian Academy of Sciences, 9 Piip Blvd., Petropavlovsk-Kamchatsky, 683006, Russia (URL: http://www.kscnet.ru/ivs/kvert/); Institute of Volcanology and Seismology, Far Eastern Branch, Russian Academy of Sciences, (IVS FEB RAS), 9 Piip Blvd., Petropavlovsk-Kamchatsky 683006, Russia (URL: http://www.kscnet.ru/ivs/eng/); South Kamchatka Federal Wildlife Sanctuary, Ministry of Natural Resources and Ecology of the Russian Federation, Kamchatka Territory 684000, Russia (URL: http://www.kronoki.ru/); NASA Earth Observatory, EOS Project Science Office, NASA Goddard Space Flight Center, Goddard, Maryland, USA (URL: http://earthobservatory.nasa.gov/); NASA Goddard Space Flight Center (NASA/GSFC), Global Sulfur Dioxide Monitoring Page, Atmospheric Chemistry and Dynamics Laboratory, 8800 Greenbelt Road, Goddard, Maryland, USA (URL: https://so2.gsfc.nasa.gov/).
Lascar
Chile
23.37°S, 67.73°W; summit elev. 5592 m
All times are local (unless otherwise noted)
Thermal anomaly persists until April 2017
The six overlapping summit craters of northern Chile's Lascar volcano have produced numerous lava flows down the NW flanks. Frequent small-to-moderate explosive eruptions since the mid-19th century, and infrequent larger eruptions, have produced ashfall hundreds of kilometers away. The largest historical eruption took place in 1993, producing pyroclastic flows to 8.5 km NW of the summit and ashfall in Buenos Aires. An explosion on 30 October 2015 produced an ash plume that rose 2.5 km above the 5.6 km high summit and drifted NE; this event also initiated a distinct thermal anomaly signal recorded by MIROVA that continued through June 2016 (BGVN 41:07). Continuous incandescence from the crater was seen for the next two months. The thermal anomaly did not begin to diminish until February 2017; details of activity through June 2017 are reported here with information primarily from Chile's Servicio Nacional de Geología y Minería, (SERNAGEOMIN), and the Italian MIROVA project.
After the 30 October 2015 explosion, a persistent thermal anomaly appeared in the MIROVA data that maintained a near-constant level of activity through June 2016 (figure 49, BGVN 41:07). The MIROVA VRP (Volcanic Radiative Power) values remained steady with multiple weekly anomalies through January 2017 when they began to taper off in both frequency and intensity (figure 46). They were intermittent during February, persistent but at a lower level during March and into the first few days of April. A few anomalies appeared later in April, and one during mid-May 2017; there is no evidence to determine exactly when eruptive activity ended or the cause of the anomalies.
Throughout July 2016-June 2017, the local webcam showed persistent degassing of mostly steam plumes from the main crater, with plume heights ranging from 500-1,500 m above the summit (table 6). Although there were three pilot reports of ash emissions from Lascar on 22 and 25 September and 29 December 2016, in each case the Buenos Aires VAAC noted that there was no indication of volcanic ash in satellite images under clear skies; the webcam did show continuous emissions of steam and gas dissipating rapidly near the summit. Seismicity during this period varied from a low of three events during October 2016 to a high of 122 events during June 2017. Although there was an increase in the number of seismic events during April 2017, the total energy released remained low. Continuous incandescence at the crater was observed during October-December 2016.
Table 6. Seismic events, degassing information, and incandescence observed at Lascar from July 2016-June 2017. Information provided by SERNAGEOMIN monthly reports. Maximum height is meters above the 5,592 m elevation summit.
| Month |
No of Seismic Events |
Degassing |
Maximum Height (m) |
Date of Maximum Height |
Incandescence Observed |
| Jul 2016 |
11 |
Steam |
700 |
4 Jul |
-- |
| Aug 2016 |
12 |
Steam |
850 |
25 Aug |
-- |
| Sep 2016 |
24 |
Steam |
1,100 |
21 Sep |
-- |
| Oct 2016 |
3 |
Steam |
1,000 |
28 Oct |
Continuous |
| Nov 2016 |
7 |
Steam |
1,500 |
4 Nov |
Continuous |
| Dec 2016 |
6 |
Steam |
1,400 |
20 Dec |
Continuous |
| Jan 2017 |
13 |
Constant |
800 |
6 Jan |
-- |
| Feb 2017 |
36 |
Constant |
650 |
19 Feb |
-- |
| Mar 2017 |
19 |
Constant |
600 |
5 Mar |
-- |
| Apr 2017 |
112 |
Constant |
600 |
29 Apr |
-- |
| May 2017 |
97 |
Constant |
560 |
8 May |
-- |
| Jun 2017 |
122 |
Constant |
500 |
1 Jun |
-- |
Geologic Background. Láscar is the most active volcano of the northern Chilean Andes. The andesitic-to-dacitic stratovolcano contains six overlapping summit craters. Prominent lava flows descend its NW flanks. An older, higher stratovolcano 5 km E, Volcán Aguas Calientes, displays a well-developed summit crater and a probable Holocene lava flow near its summit (de Silva and Francis, 1991). Láscar consists of two major edifices; activity began at the eastern volcano and then shifted to the western cone. The largest eruption took place about 26,500 years ago, and following the eruption of the Tumbres scoria flow about 9000 years ago, activity shifted back to the eastern edifice, where three overlapping craters were formed. Frequent small-to-moderate explosive eruptions have been recorded since the mid-19th century, along with periodic larger eruptions that produced ashfall hundreds of kilometers away. The largest historical eruption took place in 1993, producing pyroclastic flows to 8.5 km NW of the summit and ashfall in Buenos Aires.
Information Contacts: Servicio Nacional de Geología y Minería, (SERNAGEOMIN), Observatorio Volcanológico de Los Andes del Sur (OVDAS), Avda Sta María No. 0104, Santiago, Chile ( URL: http://www.sernageomin.cl/); MIROVA (Middle InfraRed Observation of Volcanic Activity), a collaborative project between the Universities of Turin and Florence (Italy) supported by the Centre for Volcanic Risk of the Italian Civil Protection Department (URL: http://www.mirovaweb.it/); Buenos Aires Volcanic Ash Advisory Center (VAAC), Servicio Meteorológico Nacional-Fuerza Aérea Argentina, 25 de mayo 658, Buenos Aires, Argentina (URL: http://www.smn.gov.ar/vaac/buenosaires/inicio.php?lang=es).
Popocatepetl (Mexico) — July 2017 Cite this Report
Popocatepetl
Mexico
19.023°N, 98.622°W; summit elev. 5393 m
All times are local (unless otherwise noted)
Ash plumes several times weekly, multiple episodes of dome growth and destruction, and high SO2 flux during January 2015-June 2016.
Frequent historical eruptions, first recorded in Aztec codices, have occurred since pre-Columbian time at México's Popocatépetl, the second highest volcano in North America. More recently, activity picked up in the mid-1990s after about 50 years of quiescence. The current eruption, which has been ongoing since January 2005, has included frequent ash plumes rising generally 1-4 km above the 5.4-km-elevation summit, and numerous episodes of lava-dome growth and destruction within the 500-m-wide summit caldera. Multiple ash emissions generally occur daily, with larger, more explosive events that generate ashfall in neighboring communities occurring several times each month. Information about Popocatépetl comes primarily from daily reports provided by México's Centro Nacional de Prevención de Desastres (CENAPRED). Many ash emissions are also reported by the Washington Volcanic Ash Advisory Center (VAAC). Satellite visible and thermal imagery and SO2 data also provide important information about the character of the eruptive activity. Our last report covered activity through December 2014 (BGVN 40:02); this report covers 2015 and the first six months of 2016.
CENAPRED reported near-constant emissions of water vapor, gas, and minor ash during 2015 and January-June 2016. Ash plumes from larger explosions regularly occurred several times per day during the more active months, and a few times a week during the quieter months. Ashfall is sometimes reported within 40 km of the summit. The plumes generally rose to altitudes of 6.1-7.9 km, and occasionally higher. The prevailing winds most often sent the ash NE or E, but multi-direction plumes at different altitudes were also common. Incandescent tephra was ejected onto the flank within 1 km of the summit every month, and was reported 3.5 km from the summit after stronger activity on 3 April 2016. Sulfur dioxide emissions are persistent, with plumes drifting a hundred or more kilometers from the volcano observed regularly in satellite data. Two episodes of dome growth were reported in February and April 2015, and dome destruction was inferred during January 2016.
Activity during January-June 2015. During January 2015 CENAPRED reported at least 13 explosions with ash-bearing plumes, as well as near-constant emissions of water vapor and gas that sometimes contained ash. The ash plumes generally rose to 600-1,500 m above the summit crater (up to 6.9 km altitude) and drifted either E or NE. Incandescence from the crater was visible on most clear nights. The Washington VAAC issued two series of reports; ash emissions on 4 January were not observed in satellite imagery due to weather clouds, but the 17 January emission was observed via webcam and satellite images at 5.8 km altitude drifting E. There were 58 MODVOLC thermal alerts issued in January, all from the immediate vicinity of the summit crater; most days had multiple-pixel alerts. NASA's Global Sulfur Dioxide monitoring system captured nine days of SO2 emissions with values greater than two Dobson Units (DU), a measure of the molecular density of SO2 in the atmosphere. Values greater than 2 show as red pixels on the imagery created from the OMI on the Aura satellite (figure 69).
The volcano was very active during February 2015. CENAPRED reported that their seismic network recorded several hundred low-intensity events that were accompanied by steam-and-gas-emissions and usually contained ash. Numerous explosions were attributed to lava-dome growth. Ash plumes rose 1-2 km above the crater, generally drifting NE. Ashfall was reported a number of times in communities up to 50 km away, and incandescence at the summit was observed on many nights.
On 11 February, ashfall was reported in the city of Puebla (~50 km to the E) and in the municipalities of Juan C. Bonilla (30 km ENE), Domingo Arenas (22 km NE), Huejotzingo (27 km NE), and at the airport to the E. On 15 February, explosions generated ashfall in Huejotzingo, Domingo Arenas, Salvador el Verde (30 km NNE), San Felipe Teotlalcingo (26 km NNE), and Puebla. Five explosions generated ash plumes on 18 February (figure 70). On 21 February, there were 22 small explosions, some of which ejected tephra 200 m onto the NE flank. A series of explosions on 24 February ejected incandescent material as far as 700 m onto the NE and SE flanks.
Additional explosions (19) detected on 25 February resulted in ashfall 20-37 km to the NE in San Martín Texmelucan (35 km NE), San Matías Tlalancaleca (35 km NE), San Salvador el Verde (29 km NE), Santa Rita Tlahuapan (34 km NNE), Tlaltenango, Huejotzingo, San Miguel Xoxtla (37 km NE), Domingo Arenas, Santa María Atexcac (20 km NE), and the Puebla airport (30 km NE). Explosions on 26 February ejected incandescent tephra 700 m onto the N and NE flanks; ashfall was again noted in Domingo Arenas, San Martín Texmelucan, and Huejotzingo in the state of Puebla. The international airport in Huejotzingo suspended operations to clean up the ash. On 27 February explosions generated ash emissions and again ejected incandescent tephra 300 m onto the flanks. Ashfall was reported in Huejotzingo, Domingo Arenas, Tlaltenango, San Andrés Cholula (33 km E), and Puebla. Two separate series of explosions were detected on 28 February, and more incandescent tephra was ejected 300 m onto the flanks.
During an overflight on 17 February, volcanologists observed a dome at the bottom of the inner crater, which formed in July 2013 and extends 100 m below the floor of the main crater. They identified this as dome number 55; it was 150 in diameter. On a second overflight on 27 February, volcanologists observed that the dome had grown and was filling the bottom of the inner crater (figure 71). The dome was 250 m in diameter and at least 40 m high, putting the top about 60 m above the bottom of the main crater floor. The volume was an estimated 1.96 million cubic meters. They also witnessed a small ash explosion from the inner crater (figure 71).
The Washington VAAC issued reports of ash emissions on 3 February, and during 11-16 and 24-28 February. Ash plumes identified in satellite imagery rose to altitudes of 6.1-6.7 km during 11-13 February and drifted as far as 5 km NE. On 24 February, a plume was seen extending about 15 km ENE from the summit at 6.7 km altitude. The next day an ash plume was observed in satellite imagery at 9.1 km altitude extending NE about 12 km from the summit. Later that day (25 February) it extended 300 km NE at 6.7 km altitude, out over the Gulf of México, before it dissipated. Additional emissions on 25 February occurred about every 60-90 minutes and drifted 130 km ENE at 8.2 km altitude. These bursts of ash continued moving ENE and finally dissipated about 170 km from the volcano. Plumes observed on 27 and 28 February in multispectral satellite images rose to 7-7.9 km altitude. A small area of faint ash from the 27 February emission was visible in images in the Gulf of México about 390 ENE of the summit late on 28 February, while a new emission was visible extending NE about 25 km. Twenty-five MODVOLC thermal alerts were issued most days during February (except 12-17). The OMI instrument on the AURA satellite captured 14 days of SO2 emissions with DU>2.
Activity continued at a high rate during March 2015, again with hundreds of emission events with gas, steam, and small quantities of ash (figure 72). Larger quantities of ash from multiple-per-week explosions rose 1-3 km above the summit and drifted N or NE. Incandescent tephra was ejected 100-800 m onto the N, NE, and SE flanks at least four times. A series of explosions on 7 March led to ashfall reported in Ecatzingo (15 km SW). On 9 March ashfall was reported in Amecameca (20 km NW), Ecatzingo (15 km SW), and Tepextlipa from explosions the previous day. A four-hour series of explosions on 24 March produced steam, gas, and ash emissions that rose 3 km.
The Washington VAAC reported ash emissions every day during 1-5, 7-10, 19-21, and 24-26 March. During the first week, the plumes rose 6.1-7.6 km altitude, drifted NE, N, and NW, and were usually visible for about 100 km from the summit before dissipating. On 8 March, two plumes drifted in opposite directions: one went 15 km ENE at 7 km altitude and one drifted 45 km W at 5.6 km altitude. During the second half of March, the plumes drifted generally NE, at altitudes of 6.1-7.3 km, tens of kilometers before dissipating. Only 11 MODVOLC thermal alerts were issued in March; SO2 data showed four days with DU>2, although SO2 plumes were visible in satellite data almost every day.
Hundreds of daily ash emissions were noted by CENAPRED during April 2015. Ash plumes generally drifted N or NE at 1-3 km above the summit crater, but occasionally they drifted W or SW. Incandescence was often noted at night. Incandescent tephra was ejected several hundred meters onto the flanks during 4-6 April, and again on 18 and 20 April. The only ashfall reported during the month was in Tetela and Ocuituco (both about 22 km SW) after ash-bearing explosions during 3-4 April.
During an overflight on 10 April (figure 73), scientists confirmed that a lava dome had been emplaced in the bottom of the crater between 24 March and 4 April. The lava dome was at least 250 m in diameter and 30 m high. The surface of the dome had concentric fractures and the central part was collapsed from deflation.
The Washington VAAC issued aviation alerts during 1, 3-8, 13, and 18-21 April. On 3 April volcanic ash was observed moving SE from the summit at 8.2 km altitude. The plume extended over 150 km before dissipating later in the day. Another plume the same day rose to 9.1 km altitude and drifted 55 km NE. During 4 and 5 April, ongoing emissions at various altitudes from 6.1 to 9.1 km drifted in multiple directions for tens of kilometers before dissipating. Most of the alerts were for brief, intermittent emissions that dissipated within 20 km of the summit after a few hours. On 7 April one ash cloud drifted 45 km SSE and another drifted 100 km SE, both at 7.6 km altitude. An ash emission on 13 April traveled around 260 km E at 7.3 km altitude before dissipating. The plumes observed during 18-21 April ranged from 6.7 to 9.7 km in altitude, and mostly drifted NE or E. There were 20 MODVOLC thermal alerts issued during April, scattered throughout the month. Most days during April had SO2 plumes with values >2 DU in the satellite data.
Ashfall was reported in San Pedro Benito Juárez (10-12 km SE), in the municipality of Atlixco Puebla on 2 May 2015, and in Ocuituco (24 km SW) on 22 May. On 26 May ashfall was reported in Tetela del Volcán (20 km SW) and slight ashfall was recorded in Amozoc, Puebla (60 km E) on 31 May. The ongoing explosions generated ash emissions that generally rose 0.5-2.5 km above the crater rim and sent plumes to the SW, SE, and E (figure 74). Nighttime crater incandescence was observed on most clear nights.
Although aviation alerts from the Washington VAAC were issued during 9 days of May (2, 10, 20-21, 25-26, 28, and 30-31), plumes were only visible in satellite images a few times. The highest plume was on 20 May, at 8.2 km altitude drifting SSW. The plume on 26 May was observed drifting NW at 6.1 km, extending 150 km from the summit. Only four MODVOLC thermal alerts were issued during 10, 19, 21 and 30 May, but strong SO2 plumes (>2 DU values) were recorded 12 times, with just as many days showing smaller-magnitude plumes.
Activity was much quieter at Popocatépetl during June 2015. Only six VAAC reports were issued (during 7-8, 12, and 21-22), and only two were identified in satellite images. The plume on 7 June rose to 8.2 km altitude and drifted SW. The larger plume on 12 June came from multiple small emissions; it rose to 6.1 km altitude and was last seen at 55 km SW of the summit before dissipating. There were seven MODVOLC thermal alerts on seven different days during June, and 17 different days with SO2 plumes with recorded values >2 Dobson Units.
Activity during July-December 2015. Multiple daily emissions, nighttime incandescence, and intermittent explosions continued during July 2015 (figure 75). Nine MODVOLC thermal alerts were issued, but they were concentrated during 6-8 and 26-31 July. The Washington VAAC issued alerts on 8, 10, and 11 July, and then during a second period from 24 to 28 July. The report on 8 July noted an ash emission at 7.6 km altitude extending 15 km SW from the summit. The report on 10 July noted that ashfall had been reported about 10 km NW of the summit, but cloudy skies prevented satellite observations. Reports issued during 24-28 July included satellite observations of emissions at 6.1 to 7.6 km altitude extending 25-45 km NE or W from the summit before dissipating. The SO2 emissions during July were visible nearly every day in the satellite data, with 16 days having values >2 DU.
Sulfur dioxide emissions during August 2015 were also visible in satellite imagery nearly every day. Six days had values >2 DU. There were no Washington VAAC reports during August, but there were ten MODVOLC thermal alerts issued throughout the month.
The number of daily emissions during September 2015 were far fewer than during January-July 2015, although crater incandescence was still observed. The Washington VAAC only issued three reports, all during 19-20 September. They observed an ash emission on 19 September at 6.7 km altitude that extended 45 km WNW from the summit for a few hours before dissipating (figure 76). Ten MODVOLC thermal alerts were issued in September, and SO2 plumes were visible daily with values >2 DU on half the days of the month.
Ash emissions increased again during October 2015. Ash-bearing plumes rose as high as 2 km above the crater. The Washington VAAC issued reports of ash plumes on 12 different days. An ash plume observed on 2 October at 7.6 km altitude extended 185 km SW before dissipating; another plume on 20 October was identified in satellite images at 8.5 km altitude drifting NW, and was visible from México City. Eighteen MODVOLC thermal alerts were issued throughout the month, and strong SO2 plumes were detected nearly every day in OMI satellite data.
Activity during November 2015 was similar to that during October. CENAPRED recorded tens of daily emissions of water vapor, gas, and minor amounts of ash. Explosions at regular intervals sent ash plumes 1-3 km above the summit, and incandescent material was deposited on the flanks within 1 km of the crater a number of times (figure 77). The Washington VAAC issued aviation alerts almost daily during 1-17 November, but none after that for the rest of the year. Most of the ash plumes reached 6.1-7.3 km altitude and drifted N, NE, SW, W, and S for a few tens of kilometers before dissipating. The plume on 7 November rose to 9.1 km and was visible as a dark feature above the weather clouds before it dissipated.
While ash plume observations decreased during the second half of November and during December, MODVOLC thermal alerts increased in number. Thirty-three appeared during November, and 35 during December. Plumes of SO2 were persistently visible in Aura/OMI satellite data both months.
Activity during January-June 2016. A series of explosive events during 2-8 January 2016 resulted in 13 aviation alerts from the Washington VAAC. An ash plume first reported in satellite data early on 6 January was drifting E at 6.4 km altitude. By late the next day, VAAC reports indicated that the plume was still visible over 1,000 km E before it finally dissipated. A new series of explosive events began on 20 January (figure 78) and lasted through 26 January.
CENAPRED reported that on 23 January 2016 an increase in activity was characterized by continuous gas-and-ash emissions, likely related to the destruction of a recently-formed lava dome. Later that night cameras recorded incandescent fragments ejected during periods of emissions. The constant steam-and-ash emissions drifted E and ENE for more than 48 hours at altitudes from 6.1 to 8.2 km. By 25 January, an ash plume was still visible over 900 km E. NASA Earth Observatory posted a satellite image of the plume around 1930 UTC (1330 local time) (figure 79). NASA's Goddard Space Flight Center also captured an image of a strong SO2 plume drifting NE from Popocatépetl at the same time (figure 80). Twenty-six MODVOLC thermal alerts were issued on 15 days of January. Especially strong SO2 plumes were visible on 6, 7, 23, and 25 January.
Tens of daily emissions of water vapor, gas, and ash were reported during February 2016, along with multiple daily explosions generating ash plumes and occasionally sending tephra onto the flank. The Washington VAAC issued aviation alerts on twelve days during the month. They were discrete events that sent ash plumes generally E or SE at altitudes between 6 and 7 km, and generally dissipated within 6 hours, tens of kilometers from the summit. An ash plume reported on 15 February was still visible 500 km E of the summit before it dissipated. MODVOLC thermal alerts were reported on 10 days during the month, SO2 plumes were more intermittent and only exceeded 2 DU on four days.
The largest ash explosion events during March 2016 took place at the end of the month. On 27 March, an ash plume was spotted by the Washington VAAC extending about 100 km NE at 6.4 km altitude. Explosions on 29 March created an ash plume at 9.1 km altitude moving rapidly ESE (figure 81). Ashfall from the plume caused Puebla's airport to close from 2000 on 29 March to 0600 on 30 March. The plume fanned out and extended tens of kilometers to both the S and SE before dissipating. On 31 March an explosion produced an ash plume that rose 1.8 km and drifted ENE; incandescent fragments fell 1 km away on the ESE flank. Thermal alerts were issued by MODVOLC on 13 days of March, and SO2 plumes were visible about the same number of days, but values did not exceed 2 DU.
On 2 April 2016 CENAPRED scientists conducted an overflight of the crater and observed the inner crater which was 325 m in diameter and 50 m deep (figure 82). The crater had previously been filled with a lava dome, destroyed in January, which had grown to an estimated volume of 2,000,000 cubic meters. Small landslides had occurred on the E wall of the inner crater. During 3 April, incandescent fragments were ejected as far as 3.5 km onto the E and SE flanks, generating fires in that part of the forest; authorities noted that the event was the largest explosion in three years. Ash fell in the towns of Juan C. Bonilla (32 km ENE) and Coronango (35 km ENE), both in the state of Puebla. The Washington VAAC reported numerous ash plumes during 1-9 April. The highest, on 1 April, was observed in satellite data at 9.7 km altitude, extending over 300 km NE over the Gulf of México. The other plumes were mostly observed between 6.4 and 8.5 km altitude, drifting E or NE.
Strombolian activity on 18 April ejected incandescent fragments 1.6 km onto the NE flank, and ash plumes rose 3 km above the crater and drifted ENE. Ashfall was reported in San Pedro Benito Juárez (12 km SE), San Nicolás de los Ranchos (15 km ENE), Tianguismanalco (17 km E), San Martín Texmelucan (35 km NNE), and Huejotzingo (27 km NE). According to a news article, the airport in Puebla closed again due to the ash plumes. Thermal alerts from MODVOLC were recorded on 13 days during the month, and SO2 plumes were visible in the Aura/OMI data almost every day.
Activity continued at slightly lower levels during May 2016 with VAAC reports issued on nine days. The ash plumes reported all dissipated quickly within a few tens of kilometers of the summit after drifting E at altitudes generally around 6.4 to 6.7 km. Single MODVOLC alerts were reported on only six days during the month, and except for a large SO2 plume on 3 May, small plumes were visible about 8 days of the month.
An increase in the number of daily explosions with ash emissions was reported by CENAPRED during June 2016. As many as six a day were reported during the second week of the month. An explosion on 12 June produced an ash plume that rose 2.5 km and drifted W (figure 83). Minor amounts of ash fell in Ozumba (18 km W). Aviation alerts were issued by the Washington VAAC on 13 days. Most of the ash plumes dissipated within six hours a few tens of kilometers from the summit due to high winds. The plumes rose to altitudes between 6.1 and 7.9 km, and drifted NE, W and SW. The ash plume reported on 23 June extended NE 16 km at 7.3 km altitude, and 26 km SW at 5.8 km altitude simultaneously. Thermal alerts from the MODVOLC system were reported on 1, 8, and 25 June. SO2 satellite data was only available for the second half of the month, and showed two days with significant SO2 plumes.
Geologic Background. Volcán Popocatépetl, whose name is the Aztec word for smoking mountain, rises 70 km SE of Mexico City to form North America's 2nd-highest volcano. The glacier-clad stratovolcano contains a steep-walled, 400 x 600 m wide crater. The generally symmetrical volcano is modified by the sharp-peaked Ventorrillo on the NW, a remnant of an earlier volcano. At least three previous major cones were destroyed by gravitational failure during the Pleistocene, producing massive debris-avalanche deposits covering broad areas to the south. The modern volcano was constructed south of the late-Pleistocene to Holocene El Fraile cone. Three major Plinian eruptions, the most recent of which took place about 800 CE, have occurred since the mid-Holocene, accompanied by pyroclastic flows and voluminous lahars that swept basins below the volcano. Frequent historical eruptions, first recorded in Aztec codices, have occurred since Pre-Columbian time.
Information Contacts: Centro Nacional de Prevención de Desastres (CENAPRED), Av. Delfín Madrigal No.665. Coyoacan, México D.F. 04360, México (URL: https://www.gob.mx/cenapred/); Washington Volcanic Ash Advisory Center (VAAC), Satellite Analysis Branch (SAB), NOAA/NESDIS OSPO, NOAA Science Center Room 401, 5200 Auth Rd, Camp Springs, MD 20746, USA (URL: http://www.ospo.noaa.gov/Products/atmosphere/vaac/, archive at: http://www.ssd.noaa.gov/VAAC/archive.html); Hawai'i Institute of Geophysics and Planetology (HIGP), MODVOLC Thermal Alerts System, School of Ocean and Earth Science and Technology (SOEST), Univ. of Hawai'i, 2525 Correa Road, Honolulu, HI 96822, USA (URL: http://modis.higp.hawaii.edu/); NASA Earth Observatory, EOS Project Science Office, NASA Goddard Space Flight Center, Goddard, Maryland, USA (URL: http://earthobservatory.nasa.gov/); NASA Goddard Space Flight Center (NASA/GSFC), Global Sulfur Dioxide Monitoring Page, Atmospheric Chemistry and Dynamics Laboratory, 8800 Greenbelt Road, Goddard, Maryland, USA (URL: https://so2.gsfc.nasa.gov/).
Reventador (Ecuador) — July 2017 Cite this Report
Reventador
Ecuador
0.077°S, 77.656°W; summit elev. 3562 m
All times are local (unless otherwise noted)
Lava flow emerges from summit cone, January 2016; continued explosions, pyroclastic flows, and ash emissions
The andesitic Volcán El Reventador lies well east of the main volcanic axis of the Cordillera Real in Ecuador and has historical observations of eruptions with numerous lava flows and explosive events going back to the 16th century. The largest historical eruption took place in November 2002 and generated a 17-km-high eruption cloud, pyroclastic flows that traveled 8 km, and several lava flows. From June 2014-December 2015, monthly eruptive activity included ash plumes, lava flows, pyroclastic flows, and ejected incandescent blocks (BGVN 42:06). Similar activity during January-April 2016 is described below with information provided by the Instituto Geofisico-Escuela Politecnicia Nacional (IG) of Ecuador, and the Washington Volcanic Ash Advisory Center (VAAC).
Almost daily eruptive activity continued during January-April 2016. Steam and gas emissions, usually containing minor amounts of ash, were visible at the summit crater on most clear days rising 500-1,000 m above the 3.6-km-high summit. Explosions sent incandescent blocks 500-1,500 m down all flanks several times each month. Pyroclastic flows also traveled similar distances down the flanks a few times each month. A lava flow was observed descending the N flank of the summit cone on 28 January 2016.
Steam and gas emissions, usually with minor amounts of ash, rose daily from the summit crater during January 2016. Plumes generally rose 500-1,000 m and drifted NW or W. A pyroclastic flow descended 1,000 m down the NE flank on 5 January. Loud explosions were heard in the community of El Reventador (15 km E) on 6 and 7 January, and plumes were observed 1.5 km above the crater. The Washington VAAC reported an ash emission moving SW on 9 January at 4.6 km altitude; it extended 65 km SW before dissipating. The Guayaquil Meteorological Weather Office (MWO) reported an ash emission on 12 January at 6.7 km altitude, but extensive cloud cover prevented satellite observation.
The Washington VAAC observed emissions in satellite imagery moving 25 km NW on 15 and 16 January at about 4.9 km altitude. Technical crews performing maintenance on 15 January observed and documented several explosions with ash plumes that reached 2 km above the summit (about 5.5 km altitude) and observed a pyroclastic flow that moved 500 m down the N flank (figure 53). They also noted pyroclastic deposits that had been emplaced during recent weeks along the N flank. Small pyroclastic flows during the night of 18 January descended the flanks of the cone for 1,000 m. Additional explosions the next day sent blocks down the SW flank. On 21 January, incandescent blocks traveled 1,200 m down the W flank; on 27 January, they were observed 500 m below the summit crater. The Washington VAAC observed a hotpot in infrared imagery on 24 January.
On 28 January 2016, IG conducted an overflight and observed pulsing fumarolic activity producing plumes with low to moderate ash emissions drifting W. They noted pyroclastic flow deposits on all the flanks that did not go beyond the foot of the active cone. They also witnessed an active lava flow descending the N flank, emerging from a vent on the N side of the summit of the cone (figure 54). Thermal measurements were taken at the N vent (501°C ), the central vent (372.8°C), and the base of the flow (324.6°C) (figure 55). MODVOLC thermal alerts were reported on eight days during January (6, 9 (4), 14, 16 (3), 18 (3), 25 (2), 27 (3), 29, 31).
Reventador was quieter during February 2016 than in January. Steam and gas emissions with minor ash were observed often, with emissions generally below 500 m above the crater. Incandescent blocks observed on 4 February were 1,000 m below the summit crater. The Washington VAAC reported ash emissions visible in satellite imagery on 5 February moving SSW, extending about 25 km at 4.3 km altitude (about 700 m above the summit crater); they also observed incandescence at the crater. Incandescence was again observed on 6 and 7 February; blocks traveled 700 m down the SW flank on 13 February. A diffuse, narrow plume of ash was drifting NW from the summit on 14 February at 4.6 km altitude. The Guayaquil MWO reported an ash plume at 6.1 km altitude moving W on 23 February, but weather clouds obscured views in satellite imagery. Although it was cloudy on 27 February, loud explosions were heard during the night. MODVOLC thermal alerts were reported on seven days of the month; 1 (3), 3 (5), 5 (4), 6, 14 (3), 19, and 26 (3).
Tourists visiting the Hostería el Reventador observed steam, gas, and ash emissions on 2 March 2016. On many clear days during March, emissions of steam with minor ash were observed rising 1 km above the summit crater, drifting NW, W or SW. Incandescence and pyroclastic flows were seen much more frequently than during February. A pyroclastic flow traveled down the SE flank on 5 March. Explosions that afternoon sent incandescent blocks 1,200 m down the E and SE flanks. This activity continued through 9 March with blocks traveling daily 500-1,000 m down the flanks. On 9 March, ash emissions rose to 1 km above the crater and drifted NW; morning explosions sent blocks 1,200 m down the flanks and a small pyroclastic flow was observed that night. Explosions with steam and ash rising 1 km above the summit were observed on 10 March. Incandescence at the summit, and blocks rolling up to 1,500 m down the flanks were observed on most clear nights during the second half of March. A pyroclastic flow on 20 March descended 2 km down the SW flank. Steam and ash were reported drifting W 1 km above the crater on 21 March.
The Guayaquil MWO reported ash emissions on 7 March to 4.9 km, but weather clouds prevented observations by the Washington VAAC. On 10 March, ash emissions were confirmed in satellite imagery at 6.1 km altitude drifting W. The MWO reported ash emissions at 6.4 km altitude on 15 March, but weather clouds again prevented satellite observation. Webcam images showed ash emissions on 18 March at 4.3 km altitude drifting NW. The next day, the Washington VAAC was able to observe emissions in both satellite imagery and the webcam drifting W at 5.5 km altitude. Possible emissions on 31 March were also obscured by weather clouds. MODVOLC thermal alerts were reported on 7 days during March; 6, 15 (2), 16 (2), 22 (4), 26 (4), 29, 31.
Explosions that sent incandescent blocks down the flanks were observed nine times during April 2016, on days 3, 4, 7, 9, 12, 19, 23, 25, and 26. They generally travelled 1,000 m or more down various flanks. They were observed 2,000 m down the SW flank after a large explosion on 23 April. Pyroclastic flows were observed three times. On 6 April they traveled 1,500 m down the NW flank; on 13 and 21 April they traveled 1,000 m down the E flank. Steam and gas emissions were observed on most clear days, and generally contained minor amounts of ash. The plumes usually rose 300 to 800 m above the summit and drifted W, but on 13 and 18 April they rose 2 km above the summit, according to INSIVUMEH.
The Washington VAAC reported a possible ash emission on 4 April drifting NW at 4.3 km altitude based on a brief emission witnessed from the webcam. Weather clouds prevented satellite imagery views. There were also reports of volcanic ash at 6.7 km altitude drifting SE on 12 April, but both the webcam and satellite imagery were obscured by clouds. Observers reported an ash plume moving NE at 5.5 km altitude the next day. Ash emissions were reported moving NW at 5.8 km altitude on 29 April, but weather clouds again obscured satellite imagery. MODVOLC thermal alerts were reported on 8 days of April: 3, 11 (2), 14 (2), 19 (2), 20, 25 (4), 26 (3), 30.
Geologic Background. Volcán El Reventador is the most frequently active of a chain of Ecuadorian volcanoes in the Cordillera Real, well east of the principal volcanic axis. The forested, dominantly andesitic stratovolcano has 4-km-wide avalanche scarp open to the E formed by edifice collapse. A young, unvegetated, cone rises from the amphitheater floor to a height comparable to the rim. It has been the source of numerous lava flows as well as explosive eruptions visible from Quito, about 90 km ESE. Frequent lahars in this region of heavy rainfall have left extensive deposits on the scarp slope. The largest recorded eruption took place in 2002, producing a 17-km-high eruption column, pyroclastic flows that traveled up to 8 km, and lava flows from summit and flank vents.
Information Contacts: Instituto Geofísico (IG), Escuela Politécnica Nacional, Casilla 17-01-2759, Quito, Ecuador (URL: http://www.igepn.edu.ec/); Washington Volcanic Ash Advisory Center (VAAC), Satellite Analysis Branch (SAB), NOAA/NESDIS OSPO, NOAA Science Center Room 401, 5200 Auth Rd, Camp Springs, MD 20746, USA (URL: http://www.ospo.noaa.gov/Products/atmosphere/vaac/, archive at: http://www.ssd.noaa.gov/VAAC/archive.html); Hawai'i Institute of Geophysics and Planetology (HIGP) - MODVOLC Thermal Alerts System, School of Ocean and Earth Science and Technology (SOEST), Univ. of Hawai'i, 2525 Correa Road, Honolulu, HI 96822, USA (URL: http://modis.higp.hawaii.edu/).
San Miguel (El Salvador) — July 2017 Cite this Report
San Miguel
El Salvador
13.434°N, 88.269°W; summit elev. 2130 m
All times are local (unless otherwise noted)
Six small ash emission events during January 2015-June 2017
Volcán de San Miguel (Chaparrastique), in southern El Salvador, was active with several flank lava flows during the 17th-19th centuries, but recent activity has consisted of occasional ash eruptions from the summit crater. The beginning of the most recent eruption on 29 December 2013 resulted in a large ash plume that rose to 9.7 km altitude, and dispersed ash to many communities within 30 km of the volcano (BGVN 40:08). Intermittent ash plumes lasted through 28 July 2014. This report covers activity from January 2015 through June 2017, and describes six small ash emission events during this time. Information about San Miguel comes from the the Ministero de Medio Ambiente y Recursos Naturales (MARN) of El Salvador, and the Washington Volcanic Ash Advisory Center (VAAC).
Six ash-bearing explosions occurred at San Miguel between January 2015 and June 2017. Otherwise, minor seismicity and pulses of gas-and-steam emissions were the primary type of activity. The explosion on 26 January 2015 sent a plume 300 m above the crater, drifting SW. An explosion on 11 April 2015 resulted in an ash plume rising about 800 m above the crater that also drifted SW. Trace amounts of ash were emitted on 13 August 2015. The largest explosion of the period took place on 12 January 2016, when an ash plume drifting W caused ashfall as far as 25 km away, and the plume was ultimately visible as far as 300 km from the volcano. Incandescence was observed at the base of the 900-m-high eruptive column that appeared on 18 June 2016. Minor ash emissions were reported on 7 January 2017 drifting 130 km SW from San Miguel. Minor seismic swarms and steam-and-gas plumes were reported during February-June 2017.
Activity during 2015. After very little activity other than slightly elevated RSAM values since July 2014, a small ash-bearing explosion occurred on 26 January 2015 (figure 18). The ash plume rose about 300 m above the crater and drifted SW, dissipating quickly. Trace amounts of ash fell in the Piedra Azul area about 6 km SW of the crater.
Another emission lasting for 20 minutes on 22 February 2015 sent a column of gas 300 m above the crater that dispersed to the SSW; no ash was observed. Occasional pulses of gas were reported during March rising 200 m above the summit crater. An explosion on 11 April 2015 resulted in an ash plume rising about 800 m above the crater and drifting SW. Local observers reported a millimeter of ashfall in the areas of La Piedra, Morita, and San Jorge, less than 10 km to the SW.
Occasional small pulses of gas that rose to about 200 m above the crater were typical behavior during May-July (figure 19). On 13 August 2015, the webcam captured a gas plume emission that contained minor amounts of ash and rose 200-300 m above the crater. A millimeter of ashfall was reported in San Jorge, and near the communities of Moritas and Piedrita to the SW. No emissions were reported during September, and the small pulses of gas observed during October did not exceed 200 m above the summit crater. No anomalous activity was reported during November, and small discrete pulses of gas were the only activity reported for December 2015.
Activity during 2016. San Miguel began the year with what MARN described as a VEI 1 eruption of ash and gas on 12 January 2016 (figure 20). Periodic pulses of ash and gas lasting 3-5 minutes rose to less than 1,000 m above the crater and drifted WSW. Ashfall was reported from La Piedra, Moritas, La Placita, San Jorge, (all less than 10 km SW), San Rafael Oriente (10 km SW), Alegría (25 km NW) and Berlin in Usulután (21 km SW).
NASA Earth Observatory captured images of two pulses of ash from the 12 January eruption that show the changing direction of the plume (figure 21). The first image, taken at 1635 (UTC) shows the ash plume headed directly W. The second image, taken three hours later at 1935 shows the active plume drifting SW, with the earlier plume segment farther to the W over the Pacific Ocean. The Washington VAAC reported the ash emission at 2.4 km altitude (300 m above the summit crater) drifting WSW at 1745 (UTC). At that time, the denser part of the plume extended 45 km from the volcano and the diffuse, wispy plume extended 130 km WSW. By midday on 13 January, the Washington VAAC reported ongoing emissions and that the plume extended 300 km SW. The plume was no longer visible in satellite images by the end of the day.
Seismicity declined during 12-14 January 2016. On 15 January, local observers reported a millimeter of ash deposited in Las Cruces on the N flank. Gas emissions during 17-18 January were weak, only rising 150 m. At 0900 on 18 January, the emission plume became dark and drifted SW. By the next crater inspection on 19 February, MARN scientists noted only minor degassing from the summit crater.
Although a period of volcanic tremor occurred on 8 March 2016, only short pulses of gas were observed that did not rise more than 150 m above the crater. Another spike in seismicity occurred on 3 April, but no gas or ash emissions were observed. Otherwise, only minor pulses of gas issued from the crater during February through May. A seismic swarm indicating rock fracturing at depth on 31 May could have resulted in trace amounts of ash deposited within the crater, but cloudy weather prevented observations. A few pulses of gas were observed from the webcam other times during May.
Seismic activity increased significantly during the second week in June. An explosion in the early morning of 18 June 2016 lasted about 60 seconds, and sent an ash emission to about 900 m above the crater (figure 22). Incandescence was observed within the eruptive column, and the debris fell about 100 m down the N flank. Ashfall of less than half a millimeter was reported in the El Volcan area about 7 km NE of the crater. The volcanologist who examined the ash determined that it was juvenile material from a magmatic explosion. A continuous column of steam-and-gas issued from the crater until 29 June (figure 23). During this time, local observers and officials from the Civil Protection of San Jorge reported sulfur odors and slight acid rain damage to the vegetation in the La Morita, La Piedrita, La Ceiba, and LACAYO farms, located about 4 km W of the crater.
Seismic activity was slightly elevated during the first half of July 2016, but otherwise only small pulses of gas were observed from the crater. Low-level activity continued from the summit crater during August. On 29 August, however, a seismic signal indicative of a lahar was noted near the VSM (Santa Isabel) seismic station, but no damage was reported. Periodic pulses of gases were noted during September 2016. A 20-minute-long seismic signal on 5 September indicated another lahar passing near seismic station VSM, but no damage was reported. GPS measurements during September indicated deformation of a few millimeters on the N flank. No explosions were reported during October-December 2016, only small plumes of steam and gas were observed (figure 24).
Activity during January-June 2017. On 7 January 2017, the Washington VAAC reported minor volcanic ash emissions from San Miguel at 2.6 km altitude extending SW about 130 km from the summit. Mild degassing continued during February and March. A brief seismic swarm occurred on 17 April 2017, but no explosions of gas or ash were observed in the webcam. A strong gas plume rose 1.2 km above the crater rim on 27 April. Seismicity decreased during May. Other than small gas plumes, the only activity reported during June 2017 was a slight increase in seismicity beginning on 12 June and lasting to the end of the month.
Geologic Background. The symmetrical cone of San Miguel, one of the most active volcanoes in El Salvador, rises from near sea level to form one of the country's most prominent landmarks. A broad, deep, crater complex that has been frequently modified by eruptions recorded since the early 16th century caps the truncated unvegetated summit, also known locally as Chaparrastique. Flanks eruptions of the basaltic-andesitic volcano have produced many lava flows, including several during the 17th-19th centuries that extended to the N, NE, and SE. The SE-flank flows are the largest and form broad, sparsely vegetated lava fields crossed by highways and a railroad skirting the base of the volcano. Flank vent locations have migrated higher on the edifice during historical time, and the most recent activity has consisted of minor ash eruptions from the summit crater.
Information Contacts: Ministero de Medio Ambiente y Recursos Naturales (MARN), Km. 5½ Carretera a Nueva San Salvador, Avenida las Mercedes, San Salvador, El Salvador (URL: http://www.snet.gob.sv/ver/vulcanologia); Washington Volcanic Ash Advisory Center (VAAC), Satellite Analysis Branch (SAB), NOAA/NESDIS OSPO, NOAA Science Center Room 401, 5200 Auth Rd, Camp Springs, MD 20746, USA (URL: http://www.ospo.noaa.gov/Products/atmosphere/vaac/, archive at: http://www.ssd.noaa.gov/VAAC/archive.html).
Santa Maria (Guatemala) — July 2017 Cite this Report
Santa Maria
Guatemala
14.757°N, 91.552°W; summit elev. 3745 m
All times are local (unless otherwise noted)
Continuous ash emissions, pyroclastic flows and lahars; new lava dome visible at Caliente dome, October 2016
The dacitic Santiaguito lava-dome complex on the W flank of Guatemala's Santa María volcano has been growing since 1922. The youngest of the four vents in the complex, Caliente, has been actively erupting with ash explosions, pyroclastic flows, and lava flows for more than 40 years. Constant steam and magmatic gases during January-June 2016 were accompanied by some of the largest explosive events of the last few years in April and May. Ash plumes rose to over 5 km altitude and spread ash regularly over communities within 30 km (BGVN 41:09). Guatemala's INSIVUMEH (Instituto Nacional de Sismologia, Vulcanologia, Meterologia e Hidrologia) and the Washington VAAC (Volcanic Ash Advisory Center) provided regular updates on the continuing activity during the second half of 2016, and are the primary sources of information for this report.
Constant emission of both steam and magmatic gas were observed from the summit of Caliente dome throughout July-December 2016. Overall, eruptive activity decreased during this period compared with the previous six months. During July-September, INSIVUMEH reported 3-5 daily weak or moderate explosions with ash plumes that rose to 3.3-3.5 km altitude and dispersed ash over communities generally to the SW within 30 km. Stronger explosions took place 5-10 times each month from July-September. The ash plumes from these larger explosions usually rose to 5-5.5 km altitude. The highest plume was reported by the Washington VAAC at 6.1 km altitude during August. Ash plumes drifted more than 100 km from the volcano on several occasions, and ashfall was reported more than 50 km away more than once. These larger explosions also produced numerous pyroclastic flows that descended into the drainages on the SE, S, and SW flanks of Caliente dome. Heavy rains resulted in substantial lahars generated from the ash and debris several times each month.
INSIVUMEH observed the growth of a new lava dome inside the summit crater of Caliente beginning in October. By the end of the year, it had filled more than half of the summit crater with new material. During October, November, and the first part of December, the number of smaller explosions to around 3.5 km altitude increased to 25-35 daily events.
Activity during July-August 2016. Eruptive activity at the Santiaguito dome complex decreased from previous months during July 2016. Constant degassing from the Caliente dome, weak and moderate daily explosions, and ashfall in nearby (5-20 km) communities to the W and SW were typical. Steam and magmatic gases generally rose 300-400 m above the summit crater. Three or four weak to moderate explosions per day generally created diffuse ash plumes that rose to altitudes of 3.3-3.5 km. Ashfall from the smaller explosions generally affected the villages of San Marcos Palajunoj, Loma Linda, Monte Bello, and a few others located 10-20 km SW. Four stronger explosions on 1 (2), 3, and 10 July sent ash plumes to altitudes of 5-5.5 km (figure 48) and generated pyroclastic flows that descended the SW, S, and SE flanks (figure 49).
Ash from the larger explosions was reported at least once in Columba, about 20 km SW (figure 50), Malacatán (about 55 km NW), and also from the Chiapas regions of Mexico, 70 km W. The Washington VAAC reported a plume on 1 July at 5.2 km altitude with ash extending about 35 km WNW. On 10 July, they observed an ash plume in multispectral imagery moving NW about 45 km from the summit. They also observed a bright hotspot at the summit. On 11 July, they reported an ash plume at 6.4 km altitude extending over 80 km NW. Dissipating ash was visible in imagery about 275 km NW later in the day.
A lahar descended the Cabello de Ángel river drainage on 3 July 2016 after a large explosion (figure 51). It was up to 30 m wide in places, and 1.5 m deep with blocks up to 1.5 m in diameter. The Cabello de Ángel flows into the Nimá I and Samala River drainages.
Constant degassing of steam and bluish magmatic gases continued during August 2016, rising 100-400 m above the summit of Caliente dome. Three to five weak or moderate explosions occurred daily, sending ash plumes to altitudes of 3.3-3.5 km (800-1,000 m above the dome). The STG3 seismic station recorded nine larger explosions in August (4, 14, 16, 18, 20, 21, 23, 28) that sent ash emissions to 4-5.5 km altitude, and generated pyroclastic flows that descended up to 2.5 km down the flanks (figure 52). The incandescent rock and ash descended the Nimá I, Nimá II, and San Isidro drainages on the SW, S, and SE flanks.
Communities and fincas (farms) affected by ashfall from these explosions included San Marcos Palajunoj, Loma Linda, Monte Bello, San Felipe (15 km SSW), Mazatenango (25 km SSE), Retalhuleu (27 km SW), El Faro, La Florida (5 km S), Patzulin (SW flank), and El Patrocinio. Tephra particles as large as 8 mm were collected in Loma Linda (figure 53). A few of the explosions resulted in ashfall more than 50 km from the volcano, including into Mexico. The Washington VAAC reported ash plumes rising to 5.8 km on 1 August; they were later visible 175 km W of the Mexico coast, W of Tapachula, Mexico. Two emissions on 12 August were seen at 5.2 km altitude drifting W. Ongoing emissions were reported at 6.1 km altitude on 16 August moving WNW and extending about 80 km. The plume observed on 19 August was 65 km NW at 5.5 km altitude. A plume observed in multispectral imagery on 25 August was moving NW at 6.1 km altitude over 185 km from the summit.
Increased precipitation during August 2016 led to lahars on 8, 13, and 29 August 2016 that descended the Cabello de Ángel , Nimá I, and Samalá drainages. They ranged from 18 to 25 m wide and were 1.5 m deep containing blocks up to 1.5 m in diameter. Flooding was reported downstream near the Castillo Armas bridge on the Samalá River.
Activity during September 2016. Most of the steam and magmatic gases emitting daily from Caliente during September 2016 rose 100-400 m above the dome and generally drifted SW or W (figure 54). Small to moderate ash-bearing explosions occurred 3-5 times daily; ash plumes generally rose to 3.3-3.5 km altitude during these events. Several stronger explosions during September (1, 4, 11, 17, 19, 24, 25, 30) generated ash plumes that rose to 4.5 or 5 km altitude and drifted W, SW, S, SE and E. The Washington VAAC also reported an ash plume observed in multispectral imagery on 20 September at 5.2 km altitude drifting 45 km W. A few hours later, they reported two plumes, one at 4.6 km drifting 75 mi W, and a second at 5.2 km altitude moving WSW over 80 km from the summit.
Near-daily ashfall was reported from many of the communities 10-20 km SW including San Marcos Palajunoj, Loma Linda, Monte Bello, Santa María de Jesús, El Nuevo Palmar, and Las Marías (figure 55) during September 2016. Lapilli as large as 15 mm diameter was collected in the neighborhoods of San Marcos Palajunoj (figure 56).
The larger explosions also resulted in pyroclastic flows that travelled 2.0-2.5 km down the SW, S, and SE flanks in the Nimá I, Nimá II, and San Isidro drainages. Areas of vegetation burned from the heat of the pyroclastic flows (figure 57).
Lahars or heavy mudflows were recorded on ten days during September, primarily in the Cabello de Ángel and Nimá I drainages (figure 58). Channels of debris worked their way over the 2015 lava flows in the Nimá I drainage and continued downstream. The lahars were 13-20 m wide and 1.5 m high and carried clay, volcanic ash, and blocks up to 1.5 m in diameter.
The constant explosive activity at Caliente dome during 2016 enlarged the summit crater significantly between January and the end of September 2016. In January 2016, it was about 260 m wide and 20 m deep; by 21 September, it was 340 m wide and 175 m deep according to INSIVUMEH (figure 59).
Activity during October-December 2016. INSIVUMEH reported that a new lava dome began growing inside the summit crater of Caliente on 1 October 2016. The number of weak to moderate ash-bearing explosions increased during October, but the overall amount of energy from the explosions decreased. The STG3 seismic station recorded 25-35 weak to moderate explosions per day and the ash plumes they created generally rose to 3.3-3.5 km altitude (figure 60). There were no strong explosions reported by INSIVUMEH. The Washington VAAC reported larger ash plumes at 5.5 km altitude on 3 and 4 October that drifted a few tens of kilometers SSW from the summit before dissipating. Ashfall from these plumes was reported in the villages of San Marcos Palajunoj, Loma Linda, Monte Bello, El Faro, Patzulin and others to the S and SW. Lahars up to 20 m wide descended the Cabello de Ángel drainage on 4, 27, and 28 October.
The same eruptive pattern as October continued during November 2016 with 25-35 daily weak to moderate explosions that were responsible for ashfall in the villages to the SW, including Monte Claro, San José, and La Quinta and others. Steam and magmatic gasses continued to rise 100-500 m above the Caliente dome. A 15-m-wide lahar descended the Cabello de Ángel drainage on 9 November that was one meter deep, and carried material several kilometers down the Nimá and Samala drainages. The Washington VAAC reported some of the ash plumes visible up to 50 km from the dome. On 14 November, they noted two ash emissions at 4.6 km altitude. One was dissipating about 40 km SW while the second was within 15 km headed in the same direction. They also noted a small ash emission at 4.6 km altitude on 25 November drifting 20 km W.
Eruptive activity continued at a similar level during the first half of December 2016 with many weak and a few moderate explosions. During the second half of the month, the number of moderate explosions increased, but the overall number of explosions decreased. Twenty-five to thirty weak to moderate explosions per day were responsible for ash plumes rising to 3.0-3.5 km altitude. The Washington VAAC reported plumes on 24 and 30 December visible in satellite imagery at 4.6 km altitude drifting W. INSIVUMEH reported that the explosion on 30 December generated a pyroclastic flow that traveled for 2 km.
The growth of the new lava dome within the summit crater of Caliente first observed in October continued during November and December. By 18 December 2016 the new, growing dome had filled about two-thirds of the summit crater (figure 61). Heat flow at Caliente steadily declined during the second half of 2016, especially as compared with values during the first half of the year (see figure 47, BGVN (41:09). Only two MODVOLC thermal alerts were recorded after June 2016, on 29 July and 1 August. The MIROVA signal also showed a steady decrease in heat flow during this period (figure 62).
Geologic Background. Symmetrical, forest-covered Santa María volcano is part of a chain of large stratovolcanoes that rise above the Pacific coastal plain of Guatemala. The sharp-topped, conical profile is cut on the SW flank by a 1.5-km-wide crater. The oval-shaped crater extends from just below the summit to the lower flank, and was formed during a catastrophic eruption in 1902. The renowned Plinian eruption of 1902 that devastated much of SW Guatemala followed a long repose period after construction of the large basaltic andesite stratovolcano. The massive dacitic Santiaguito lava-dome complex has been growing at the base of the 1902 crater since 1922. Compound dome growth at Santiaguito has occurred episodically from four vents, with activity progressing E towards the most recent, Caliente. Dome growth has been accompanied by almost continuous minor explosions, with periodic lava extrusion, larger explosions, pyroclastic flows, and lahars.
Information Contacts: Instituto Nacional de Sismologia, Vulcanologia, Meteorologia e Hydrologia (INSIVUMEH), Unit of Volcanology, Geologic Department of Investigation and Services, 7a Av. 14-57, Zona 13, Guatemala City, Guatemala (URL: http://www.insivumeh.gob.gt/); Washington Volcanic Ash Advisory Center (VAAC), Satellite Analysis Branch (SAB), NOAA/NESDIS OSPO, NOAA Science Center Room 401, 5200 Auth Rd, Camp Springs, MD 20746, USA (URL: http://www.ospo.noaa.gov/Products/atmosphere/vaac/, archive at: http://www.ssd.noaa.gov/VAAC/archive.html); Hawai'i Institute of Geophysics and Planetology (HIGP) - MODVOLC Thermal Alerts System, School of Ocean and Earth Science and Technology (SOEST), Univ. of Hawai'i, 2525 Correa Road, Honolulu, HI 96822, USA (URL: http://modis.higp.hawaii.edu/); MIROVA (Middle InfraRed Observation of Volcanic Activity), a collaborative project between the Universities of Turin and Florence (Italy) supported by the Centre for Volcanic Risk of the Italian Civil Protection Department (URL: http://www.mirovaweb.it/).
Stromboli
Italy
38.789°N, 15.213°E; summit elev. 924 m
All times are local (unless otherwise noted)
Persistent low- and moderate-level explosive activity during 2015 and 2016
Confirmed historical eruptions at Italy's Stromboli volcano go back 2,000 years as this island volcano in the Tyrrhenian Sea has been a natural beacon for eons with its near-constant fountains of lava. Explosive activity during 2014 generated numerous lava flows that traveled down the flanks, including several that reached the ocean during August (BGVN 42:01). The volcano was quieter during 2015 and 2016 as reported by the Instituto Nazionale de Geofisica e Vulcanologia (INGV), Sezione de Catania, who monitors the gas geochemistry, deformation, and seismology, as well as the surficial activity at Stromboli. Their weekly reports are summarized briefly below. Eruptive activity at the summit consistently occurs from multiple vents at both a north crater area (N Area) and a southern crater group (S Area) on the Terrazza Craterica at the head of the Sciara del Fuoco, a large scarp that runs from the summit down the NW side of the island. Thermal and visual cameras placed on the nearby Pizzo Sopra La Fossa monitor activity at the Terrazza Craterica.
No reports were issued by INGV after a report of 16 October 2014. The last activity at Stromboli in 2014 captured remotely was a MODVOLC thermal alert on 8 November 2014. Low- to medium-intensity explosions from the active vent areas at the summit characterized activity throughout 2015 and 2016. Occasional bursts of higher-intensity activity sent ash, lapilli, and bombs across the Terrazza Craterica and onto the head of the Sciara del Fuoco.
Activity during 2015. While no thermal anomalies were identified in MODIS data during 2015 or 2016, the eruptive activity continued at low-to-moderate levels. Strombolian explosions were frequent from both crater areas during January 2015. Six explosions accompanied by abundant ash emissions erupted from the N Area on 12 and 13 January. In the S Area, vents also produced tephra containing lapilli and small bombs. A high-intensity burst from the S Area on 23 January contained ash and a few lapilli and bombs.
Intermittent explosive activity continued at both crater areas during February 2015. Medium-to-low intensity explosive activity during the first week characterized the N Area, with the ejection of bombs mixed with ash. Strombolian activity increased on 7 February. In the S Area, explosions were characterized by the ejection of fine ash with lesser coarse material (lapilli and bombs). An energetic explosive event took place at the S Area on 15 February (figure 92). It was the strongest event since the activity of August 2014, and was followed by several explosions over the following 12 hours that contained abundant tephra.
Low-intensity explosions characterized both the N and S Areas during March and early April 2015. Beginning on the afternoon of 15 April, the intensity and number of explosions increased significantly in the N Area for about 48 hours. Low- to medium-intensity explosions continued at both crater areas during May. On the evening of 11 May, and again during 13-15 May, a continuous glow was observed from the S Area caused by significant spattering activity. Strombolian activity was also noted from both crater areas on 20 and 21 May, and was more frequently observed during June 2015 (figure 93).
Members of an expedition to the summit on 1 July 2015 observed explosive activity from the S Area vents (figure 94). Activity continued at low-to-moderate levels during July. On 16 July, a strongly intense explosive sequence occurred at both crater areas (figure 95). The first explosion occurred in the S Area at 0103. A larger explosion a few seconds later produced a jet of bombs and lapilli that lasted for about 15 seconds and rose about 300 m into the air, depositing material across the Terrazza Craterica area and the upper part of the Sciara del Fuoco. A third explosion, this time from the N Area, occurred about one minute later, ejecting bombs and lapilli 200 m into the air. Intense spattering continued from both crater areas for the next hour, after which activity resumed at lower levels.
Low-intensity explosions accompanied by weak and discontinuous spattering with ash, lapilli, and bombs characterized activity from both areas for most of August except for a short-lived (2-hour) vigorous explosive event at the S Area beginning around 2300 on 8 August 2015. Activity was more vigorous at the N Area from 23 August through the end of the month. Low- and medium-low intensity explosions were typical during September with only a few days of medium- to medium-high intensity explosive events. Activity during October was difficult for INGV to monitor due to difficulty with their equipment, but it appeared to continue at low-to-moderate levels.
A series of medium- and medium-high intensity events occurred during 7-9 November 2015 from the N Area and were captured by the thermal camera on the Pizzo Sopra La Fossa (figure 96). Two vents in the N Area produced strong explosions at the same time generating plumes with fine ash and lapilli that likely reached over 200 m above the Terrazza Craterica. Another strong explosion from the N Area occurred on 19 November, sending coarse ejecta onto the top of the Sciara del Fuoco.
Explosions during 12 and 14 December ejected bombs and lapilli onto the Sciara del Fuoco. During an overflight on 16 December thermal imagery showed hot explosive material from the N Area deposited on the Sciara del Fuoco, and freshly erupted material surrounding the S Area as well.
Activity during 2016. During January 2016 windy and cloudy weather conditions and technical equipment problems made observations difficult for INGV, but activity was generally low to moderate at both crater areas. A strong Strombolian explosion from the N Area on 14 January was one of the larger events of the month, sending lapilli and bombs to the top of the Sciara del Fuoco. Numerous explosions from the N Area of medium-to-medium-high intensity were typical during February. Explosions at the S Area were generally low intensity. Clear weather on 15 February provided an excellent view of the two crater areas on the Terrazza Craterica (figure 97). A brief event on 21 February at the S Area caused weak spattering around the vent.
During March 2016, two vents were active in the S Area, and one in the N Area until 16 March, when a second vent began activity (figure 98). The typical frequency of events during low-level activity is 0-1 explosions per hour. Rarely, higher energy events will deposit material on the Sciara del Fuoco. After a month of low-intensity activity at both crater areas, there was a rapid intensification of explosive activity at the S Area at around 2130 on 28 April, which continued through 1 May (figure 99).
Generally low-level activity during most of May was interrupted during 6-11 May with persistent incandescence and pulsating spattering at the S Area vents. Occasional medium-to-high-intensity explosions from the S Area produced significant ash emissions during the second half of May, and often sent lapilli and bombs on to the Terrazza Craterica, and occasionally onto the Sciara del Fuoco.
Events with medium-to-high intensity levels continued at the S Area during June 2016, which resulted in ash emissions covering much of the Terrazza Craterica. Intensity increased in the N area by the third week of June. Two site inspections on 6 and 7 July by INGV provided details of the ongoing changes in morphology at the Terrazza Craterica (figure 100). At the N Area, they noted two distinct vents, while in the S area they observed a large crater depression with subvertical walls that had many deep vents on the S side. Episodic explosive activity from the N Area was accompanied by small ash plumes. In the S Area, landslides occurred along the southernmost wall, lasting for tens of seconds and producing small ash clouds.
During late July, persistent incandescence was visible at night from the Pizzo Sopra La Fossa coming from the northernmost vent of the S Area, which continued until 19 August. Activity diminished from this vent and appeared at the southernmost vent of the S Area on 20 August. Explosions of incandescent lava were observed about ten meters above the crater rim. Occasional high-intensity explosions from the N Area resulted in coarse ash emissions during August, especially during 27 and 28 August when two vents were active at the N area, sending bombs, lapilli, and ash onto the Sciara del Fuoco.
By the end of August activity was concentrated mostly in the N Area where two active vents ejected lapilli, bombs, and abundant ash in explosions that occurred at a rate of 2-3 per hour. On 29 September, a nighttime pulsating glow was observed from the Pizzo Sopra La Fossa visible camera emanating from the southernmost vent of the S area. Observations of the glow persisted until 6 October. INVG inferred the glow was related to deep explosive activity. Typical low-to-moderate activity during October included Strombolian activity several tens of meters above the crater rim and frequent ash emissions, primarily from the S Area.
During November and December 2016, low- and moderate-level activity continued, with persistent incandescence observed at northern vent of the S Area for most of December, and rare low-and-medium-intensity explosions observed at the N Area (figure 101).
Geologic Background. Spectacular incandescent nighttime explosions at Stromboli have long attracted visitors to the "Lighthouse of the Mediterranean" in the NE Aeolian Islands. This volcano has lent its name to the frequent mild explosive activity that has characterized its eruptions throughout much of historical time. The small island is the emergent summit of a volcano that grew in two main eruptive cycles, the last of which formed the western portion of the island. The Neostromboli eruptive period took place between about 13,000 and 5,000 years ago. The active summit vents are located at the head of the Sciara del Fuoco, a prominent scarp that formed about 5,000 years ago due to a series of slope failures which extends to below sea level. The modern volcano has been constructed within this scarp, which funnels pyroclastic ejecta and lava flows to the NW. Essentially continuous mild Strombolian explosions, sometimes accompanied by lava flows, have been recorded for more than a millennium.
Information Contacts: Istituto Nazionale di Geofisica e Vulcanologia (INGV), Sezione di Catania, Piazza Roma 2, 95123 Catania, Italy (URL: http://www.ct.ingv.it/en/).
Yasur
Vanuatu
19.532°S, 169.447°E; summit elev. 361 m
All times are local (unless otherwise noted)
Strong explosions reported through mid-June 2017, with ongoing thermal anomalies
The almost continuous eruption at Yasur, possibly over the previous 800 years, remained active through October 2016 (BGVN 41:12). The Vanuatu Geohazards Observatory (VGO) has maintained the hazards status at Volcano Alert Level 2 (major unrest - danger around the crater rim and specific area, notable/large unrest, considerable possibility of eruption and also chance of flank eruption) through mid-June 2017.
Volcano Alert Bulletins posted by the VGO on 19 April, 22 May, and 22 June 2017 indicated ongoing strong explosive activity. Satellite-detected MODIS thermal anomalies identified by MODVOLC were numerous during the reporting period, with at least one every month except during November 2016. The MIROVA system also detected nearly continuous thermal anomalies during the year ending on 12 June 2017 (figure 46), though activity decreased in the last few months of 2016 and was somewhat more intermittent in the first half of 2017 compared to July-September 2016.
Geologic Background. Yasur has exhibited essentially continuous Strombolian and Vulcanian activity at least since Captain Cook observed ash eruptions in 1774. This style of activity may have continued for the past 800 years. Located at the SE tip of Tanna Island in Vanuatu, this pyroclastic cone has a nearly circular, 400-m-wide summit crater. The active cone is largely contained within the small Yenkahe caldera, and is the youngest of a group of Holocene volcanic centers constructed over the down-dropped NE flank of the Pleistocene Tukosmeru volcano. The Yenkahe horst is located within the Siwi ring fracture, a 4-km-wide open feature associated with eruption of the andesitic Siwi pyroclastic sequence. Active tectonism along the Yenkahe horst accompanying eruptions has raised Port Resolution harbor more than 20 m during the past century.
Information Contacts: Vanuatu Geohazards Observatory, Department of Geology, Mines and Water Resources of Vanuatu (URL: http://www.vmgd.gov.vu/vmgd/, http://www.vmgd.gov.vu/vmgd/index.php/geohazards/volcano); Hawai'i Institute of Geophysics and Planetology (HIGP) - MODVOLC Thermal Alerts System, School of Ocean and Earth Science and Technology (SOEST), Univ. of Hawai'i, 2525 Correa Road, Honolulu, HI 96822, USA (URL: http://modis.higp.hawaii.edu/); MIROVA (Middle InfraRed Observation of Volcanic Activity), a collaborative project between the Universities of Turin and Florence (Italy) supported by the Centre for Volcanic Risk of the Italian Civil Protection Department (URL: http://www.mirovaweb.it/).