Recently Published Bulletin Reports
Erebus (Antarctica) Lava lake remains active; most thermal alerts recorded since 2019
Rincon de la Vieja (Costa Rica) Frequent phreatic explosions during July-December 2023
Bezymianny (Russia) Explosion on 18 October 2023 sends ash plume 8 km high; lava flows and incandescent avalanches
Kilauea (United States) Low-level lava effusions in the lava lake at Halema’uma’u during July-December 2022
Nyamulagira (DR Congo) Lava flows and thermal activity during May-October 2023
Bagana (Papua New Guinea) Explosions, ash plumes, ashfall, and lava flows during April-September 2023
Mayon (Philippines) Lava flows, pyroclastic flows, ash emissions, and seismicity during April-September 2023
Nishinoshima (Japan) Eruption plumes and gas-and-steam plumes during May-August 2023
Krakatau (Indonesia) White gas-and-steam plumes and occasional ash plumes during May-August 2023
Villarrica (Chile) Strombolian activity, gas-and-ash emissions, and crater incandescence during April-September 2023
Merapi (Indonesia) Frequent incandescent avalanches during April-September 2023
Ebeko (Russia) Moderate explosive activity with ash plumes continued during June-November 2023
Erebus (Antarctica) — January 2024  Cite this Report
Erebus
Antarctica
77.53°S, 167.17°E; summit elev. 3794 m
All times are local (unless otherwise noted)
Lava lake remains active; most thermal alerts recorded since 2019
The lava lake in the summit crater of Erebus has been active since at least 1972. Located in Antarctica overlooking the McMurdo Station on Ross Island, it is the southernmost active volcano on the planet. Because of the remote location, activity is primarily monitored by satellites. This report covers activity during 2023.
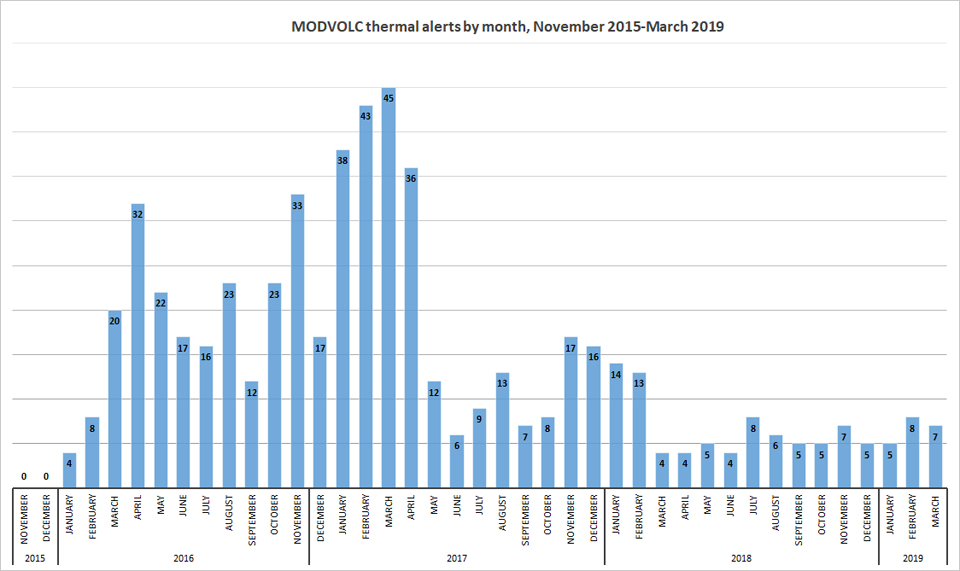
The number of thermal alerts recorded by the Hawai'i Institute of Geophysics and Planetology’s MODVOLC Thermal Alerts System increased considerably in 2023 compared to the years 2020-2022 (table 9). In contrast to previous years, the MODIS instruments aboard the Aqua and Terra satellites captured data from Erebus every month during 2023. Consistent with previous years, the lowest number of anomalous pixels were recorded in January, November, and December.
Table 9. Number of monthly MODIS-MODVOLC thermal alert pixels recorded at Erebus during 2017-2023. See BGVN 42:06 for data from 2000 through 2016. The table was compiled using data provided by the HIGP – MODVOLC Thermal Alerts System.
| Year |
Jan |
Feb |
Mar |
Apr |
May |
Jun |
Jul |
Aug |
Sep |
Oct |
Nov |
Dec |
SUM |
| 2017 |
0 |
21 |
9 |
0 |
0 |
1 |
11 |
61 |
76 |
52 |
0 |
3 |
234 |
| 2018 |
0 |
21 |
58 |
182 |
55 |
17 |
137 |
172 |
103 |
29 |
0 |
0 |
774 |
| 2019 |
2 |
21 |
162 |
151 |
55 |
56 |
75 |
53 |
29 |
19 |
1 |
0 |
624 |
| 2020 |
0 |
2 |
16 |
18 |
4 |
4 |
1 |
3 |
18 |
3 |
1 |
6 |
76 |
| 2021 |
0 |
9 |
1 |
0 |
2 |
56 |
46 |
47 |
35 |
52 |
5 |
3 |
256 |
| 2022 |
1 |
13 |
55 |
22 |
15 |
32 |
39 |
19 |
31 |
11 |
0 |
0 |
238 |
| 2023 |
2 |
33 |
49 |
82 |
41 |
32 |
70 |
64 |
42 |
17 |
5 |
11 |
448 |
Sentinel-2 infrared images showed one or two prominent heat sources within the summit crater, accompanied by adjacent smaller sources, similar to recent years (see BGVN 46:01, 47:02, and 48:01). A unique image was obtained on 25 November 2023 by the OLI-2 (Operational Land Imager-2) on Landsat 9, showing the upper part of the volcano surrounded by clouds (figure 32).
Geologic Background. Mount Erebus, the world's southernmost historically active volcano, overlooks the McMurdo research station on Ross Island. It is the largest of three major volcanoes forming the crudely triangular Ross Island. The summit of the dominantly phonolitic volcano has been modified by one or two generations of caldera formation. A summit plateau at about 3,200 m elevation marks the rim of the youngest caldera, which formed during the late-Pleistocene and within which the modern cone was constructed. An elliptical 500 x 600 m wide, 110-m-deep crater truncates the summit and contains an active lava lake within a 250-m-wide, 100-m-deep inner crater; other lava lakes are sometimes present. The glacier-covered volcano was erupting when first sighted by Captain James Ross in 1841. Continuous lava-lake activity with minor explosions, punctuated by occasional larger Strombolian explosions that eject bombs onto the crater rim, has been documented since 1972, but has probably been occurring for much of the volcano's recent history.
Information Contacts: Hawai'i Institute of Geophysics and Planetology (HIGP) - MODVOLC Thermal Alerts System, School of Ocean and Earth Science and Technology (SOEST), Univ. of Hawai'i, 2525 Correa Road, Honolulu, HI 96822, USA (URL: http://modis.higp.hawaii.edu/); Copernicus Browser, Copernicus Data Space Ecosystem, European Space Agency (URL: https://dataspace.copernicus.eu/browser/); NASA Earth Observatory, EOS Project Science Office, NASA Goddard Space Flight Center, Goddard, Maryland, USA (URL: https://earthobservatory.nasa.gov/images/152134/erebus-breaks-through).
Rincon de la Vieja (Costa Rica) — January 2024 Cite this Report
Rincon de la Vieja
Costa Rica
10.83°N, 85.324°W; summit elev. 1916 m
All times are local (unless otherwise noted)
Frequent phreatic explosions during July-December 2023
Rincón de la Vieja is a volcanic complex in Costa Rica with a hot convecting acid lake that exhibits frequent weak phreatic explosions, gas-and-steam emissions, and occasional elevated sulfur dioxide levels (BGVN 45:10, 46:03, 46:11). The current eruption period began June 2021. This report covers activity during July-December 2023 and is based on weekly bulletins and occasional daily reports from the Observatorio Vulcanologico Sismologica de Costa Rica-Universidad Nacional (OVSICORI-UNA).
Numerous weak phreatic explosions continued during July-December 2023, along with gas-and-steam emissions and plumes that rose as high as 3 km above the crater rim. Many weekly OVSICORI-UNA bulletins included the previous week's number of explosions and emissions (table 9). For many explosions, the time of explosion was given (table 10). Frequent seismic activity (long-period earthquakes, volcano-tectonic earthquakes, and tremor) accompanied the phreatic activity.
Table 9. Number of reported weekly phreatic explosions and gas-and-steam emissions at Rincón de la Vieja, July-December 2023. Counts are reported for the week before the Weekly Bulletin date; not all reports included these data. Courtesy of OVSICORI-UNA.
| OVSICORI Weekly Bulletin |
Number of explosions |
Number of emissions |
| 28 Jul 2023 |
6 |
14 |
| 4 Aug 2023 |
10 |
12 |
| 1 Sep 2023 |
13 |
11 |
| 22 Sep 2023 |
12 |
13 |
| 29 Sep 2023 |
6 |
11 |
| 6 Oct 2023 |
12 |
5 |
| 13 Oct 2023 |
7 |
9 |
| 20 Oct 2023 |
1 |
15 |
| 27 Oct 2023 |
3 |
23 |
| 3 Nov 2023 |
3 |
10 |
| 17 Nov 2023 |
0 |
Some |
| 24 Nov 2023 |
0 |
14 |
| 8 Dec 2023 |
4 |
16 |
| 22 Dec 2023 |
8 |
18 |
Table 10. Summary of activity at Rincón de la Vieja during July-December 2023. Weak phreatic explosions and gas emissions are noted where the time of explosion was indicated in the weekly or daily bulletins. Height of plumes or emissions are distance above the crater rim. Courtesy of OVSICORI-UNA.
| Date |
Time |
Description of Activity |
| 1 Jul 2023 |
0156 |
Explosion. |
| 2 Jul 2023 |
0305 |
Explosion. |
| 4 Jul 2023 |
0229, 0635 |
Event at 0635 produced a gas-and-steam plume that rose 700 m and drifted W; seen by residents in Liberia (21 km SW). |
| 9 Jul 2023 |
1843 |
Explosion. |
| 21 Jul 2023 |
0705 |
Explosion. |
| 26 Jul 2023 |
1807 |
Explosion. |
| 28 Jul 2023 |
0802 |
Explosion generated a gas-and-steam plume that rose 500 m. |
| 30 Jul 2023 |
1250 |
Explosion. |
| 31 Jul 2023 |
2136 |
Explosion. |
| 11 Aug 2023 |
0828 |
Explosion. |
| 18 Aug 2023 |
1304 |
Explosion. |
| 21 Aug 2023 |
1224 |
Explosion generated gas-and-steam plumes rose 500-600 m. |
| 22 Aug 2023 |
0749 |
Explosion generated gas-and-steam plumes rose 500-600 m. |
| 24 Aug 2023 |
1900 |
Explosion. |
| 25 Aug 2023 |
0828 |
Event produced a steam-and-gas plume that rose 3 km and drifted NW. |
| 27-28 Aug 2023 |
0813 |
Four small events; the event at 0813 on 28 August lasted two minutes and generated a steam-and-gas plume that rose 2.5 km. |
| 1 Sep 2023 |
1526 |
Explosion generated plume that rose 2 km and ejected material onto the flanks. |
| 2-3 Sep 2023 |
- |
Small explosions detected in infrasound data. |
| 4 Sep 2023 |
1251 |
Gas-and-steam plume rose 1 km and drifted W. |
| 7 Nov 2023 |
1113 |
Explosion. |
| 8 Nov 2023 |
0722 |
Explosion. |
| 12 Nov 2023 |
0136 |
Small gas emissions. |
| 14 Nov 2023 |
0415 |
Small gas emissions. |
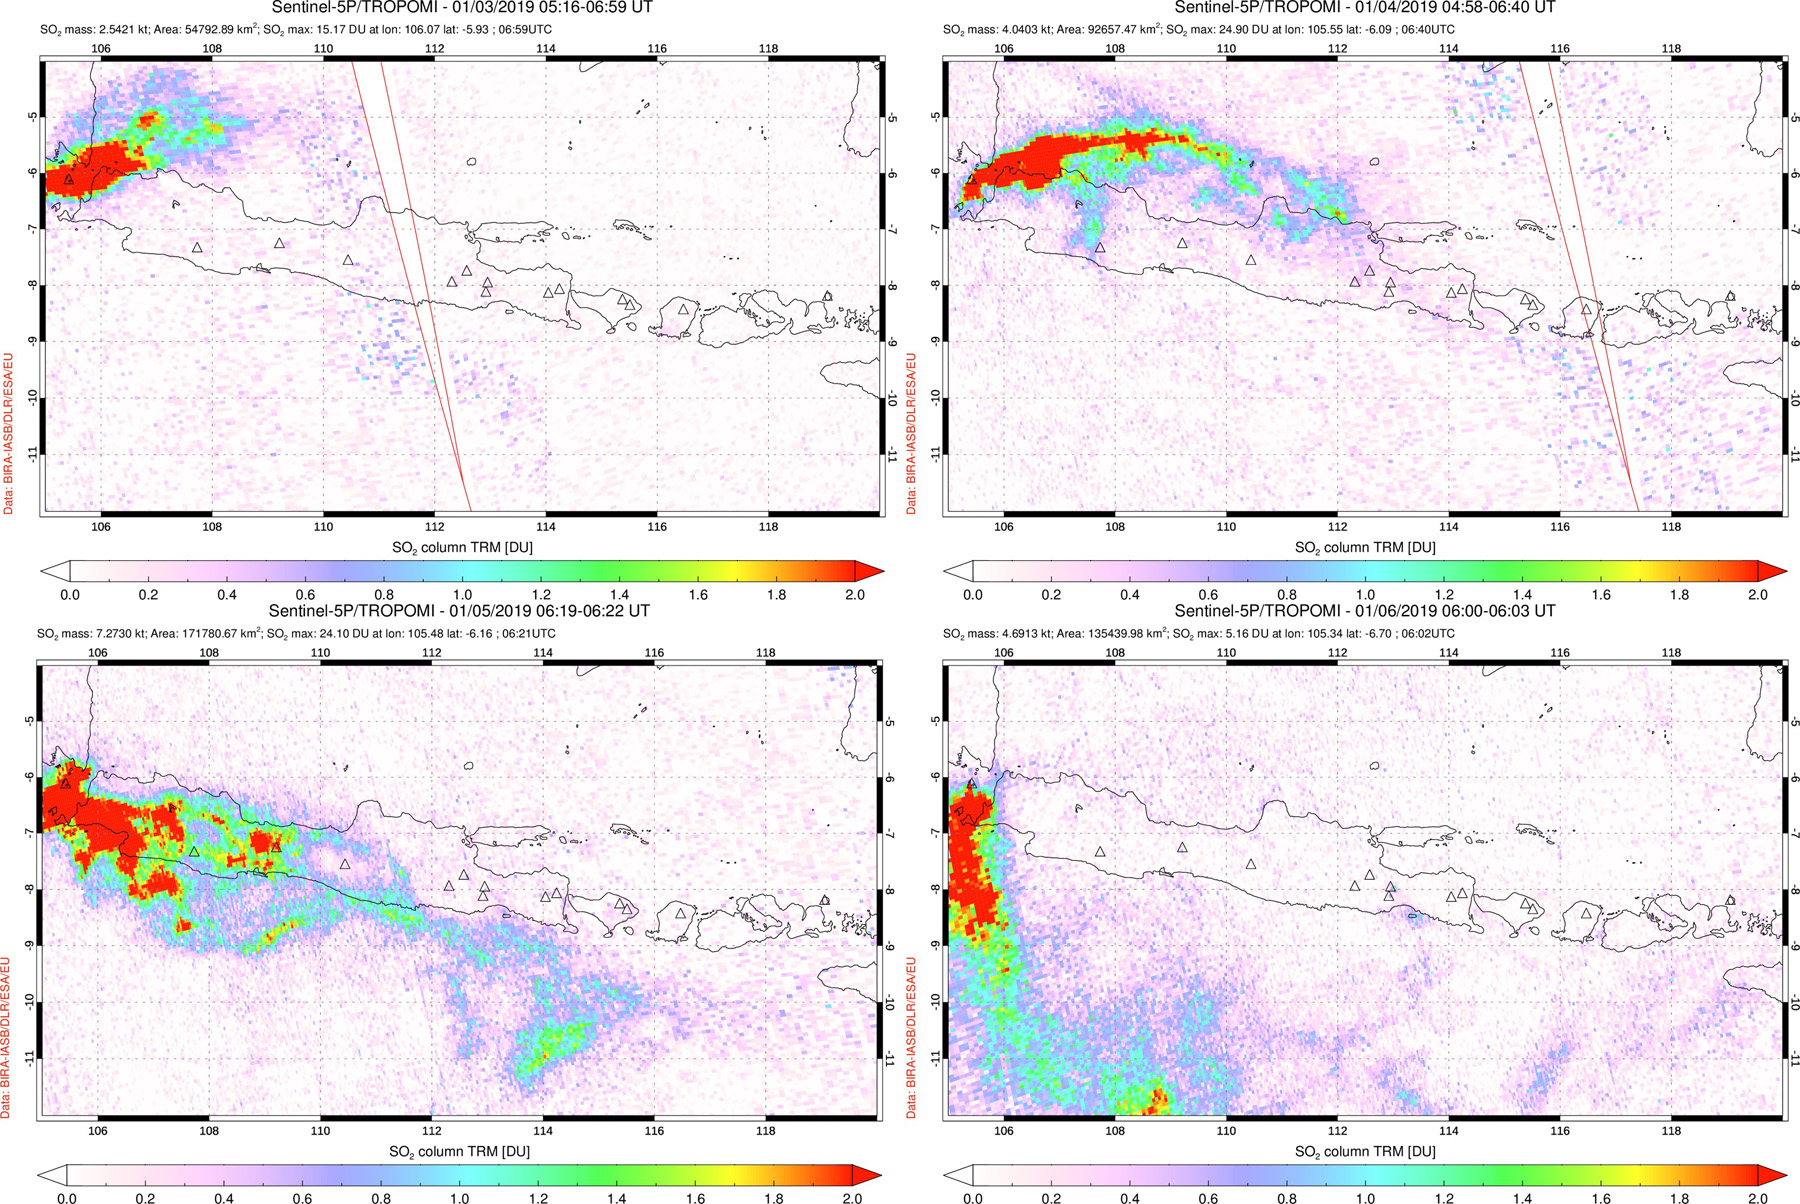
According to OVSICORI-UNA, during July-October the average weekly sulfur dioxide (SO2) flux ranged from 68 to 240 tonnes/day. However, in mid-November the flux increased to as high as 334 tonnes/day, the highest value measured in recent years. The high SO2 flux in mid-November was also detected by the TROPOMI instrument on the Sentinel-5P satellite (figure 43).
Geologic Background. Rincón de la Vieja, the largest volcano in NW Costa Rica, is a remote volcanic complex in the Guanacaste Range. The volcano consists of an elongated, arcuate NW-SE-trending ridge constructed within the 15-km-wide early Pleistocene Guachipelín caldera, whose rim is exposed on the south side. Sometimes known as the "Colossus of Guanacaste," it has an estimated volume of 130 km3 and contains at least nine major eruptive centers. Activity has migrated to the SE, where the youngest-looking craters are located. The twin cone of Santa María volcano, the highest peak of the complex, is located at the eastern end of a smaller, 5-km-wide caldera and has a 500-m-wide crater. A Plinian eruption producing the 0.25 km3 Río Blanca tephra about 3,500 years ago was the last major magmatic eruption. All subsequent eruptions, including numerous historical eruptions possibly dating back to the 16th century, have been from the prominent active crater containing a 500-m-wide acid lake located ENE of Von Seebach crater.
Information Contacts: Observatorio Vulcanológico Sismológica de Costa Rica-Universidad Nacional (OVSICORI-UNA), Apartado 86-3000, Heredia, Costa Rica (URL: http://www.ovsicori.una.ac.cr/); NASA Global Sulfur Dioxide Monitoring Page, Atmospheric Chemistry and Dynamics Laboratory, NASA Goddard Space Flight Center (NASA/GSFC), 8800 Greenbelt Road, Goddard MD 20771, USA (URL: https://so2.gsfc.nasa.gov/).
Bezymianny (Russia) — November 2023 Cite this Report
Bezymianny
Russia
55.972°N, 160.595°E; summit elev. 2882 m
All times are local (unless otherwise noted)
Explosion on 18 October 2023 sends ash plume 8 km high; lava flows and incandescent avalanches
Bezymianny, located on Russia’s Kamchatka Peninsula, has had eruptions since 1955 characterized by dome growth, explosions, pyroclastic flows, ash plumes, and ashfall. Activity during November 2022-April 2023 included gas-and-steam emissions, lava dome collapses generating avalanches, and persistent thermal activity. Similar eruptive activity continued from May through October 2023, described here based on information from weekly and daily reports of the Kamchatka Volcano Eruptions Response Team (KVERT), notices from Tokyo VAAC (Volcanic Ash Advisory Center), and from satellite data.
Overall activity decreased after the strong period of activity in late March through April 2023, which included ash explosions during 29 March and 7-8 April 2023 that sent plumes as high as 10-12 km altitude, along with dome growth and lava flows (BGVN 48:05). This reduced activity can be seen in the MIROVA thermal detection system graph (figure 56), which was consistent with data from the MODVOLC thermal detection system and with Sentinel-2 satellite images that showed persistent hotspots in the summit crater when conditions allowed observations. A renewed period of strong activity began in mid-October 2023.
Activity increased significantly on 17 October 2023 when large collapses began during 0700-0830 on the E flanks of the lava dome and continued to after 0930 the next day (figure 57). Ash plumes rose to an altitude of 4.5-5 km, extending 220 km NNE by 18 October. A large explosion at 1630 on 18 October produced an ash plume that rose to an altitude of 11 km (8 km above the summit) and drifted NNE and then NW, extending 900 km NW within two days at an altitude of 8 km. Minor ashfall was noted in Kozyrevsk (45 km WNW). At 0820 on 20 October an ash plume was identified in satellite images drifting 100 km ENE at altitudes of 4-4.5 km.
Lava flows and hot avalanches from the dome down the SE flank continued over the next few days, including 23 October when clear conditions allowed good observations (figures 58 and 59). A large thermal anomaly was observed over the volcano through 24 October, and in the summit crater on 30 October (figure 60). Strong fumarolic activity continued, with numerous avalanches and occasional incandescence. By the last week of October, volcanic activity had decreased to a level consistent with that earlier in the reporting period.
Aviation warnings were frequently updated during 17-20 October. KVERT issued a Volcano Observatory Notice for Aviation (VONA) on 17 October at 1419 and 1727 (0219 and 0527 UTC) raising the Aviation Color Code (ACC) from Yellow to Orange (second highest level). The next day, KVERT issued a VONA at 1705 (0505 UTC) raising the ACC to Red (highest level) but lowered it back to Orange at 2117 (0917 UTC). After another decrease to Yellow and back to Orange, the ACC was reduced to Yellow on 20 October at 1204 (0004 UTC). In addition, the Tokyo VAAC issued a series of Volcanic Ash Advisories beginning on 16 October and continuing through 30 October.
Geologic Background. The modern Bezymianny, much smaller than its massive neighbors Kamen and Kliuchevskoi on the Kamchatka Peninsula, was formed about 4,700 years ago over a late-Pleistocene lava-dome complex and an edifice built about 11,000-7,000 years ago. Three periods of intensified activity have occurred during the past 3,000 years. The latest period, which was preceded by a 1,000-year quiescence, began with the dramatic 1955-56 eruption. This eruption, similar to that of St. Helens in 1980, produced a large open crater that was formed by collapse of the summit and an associated lateral blast. Subsequent episodic but ongoing lava-dome growth, accompanied by intermittent explosive activity and pyroclastic flows, has largely filled the 1956 crater.
Information Contacts: Kamchatka Volcanic Eruptions Response Team (KVERT), Far Eastern Branch, Russian Academy of Sciences, 9 Piip Blvd., Petropavlovsk-Kamchatsky, 683006, Russia (URL: http://www.kscnet.ru/ivs/kvert/); Kamchatka Volcanological Station, Kamchatka Branch of Geophysical Survey, (KB GS RAS), Klyuchi, Kamchatka Krai, Russia (URL: http://volkstat.ru/); Tokyo Volcanic Ash Advisory Center (VAAC), 1-3-4 Otemachi, Chiyoda-ku, Tokyo 100-8122, Japan (URL: http://ds.data.jma.go.jp/svd/vaac/data/); Hawai'i Institute of Geophysics and Planetology (HIGP) - MODVOLC Thermal Alerts System, School of Ocean and Earth Science and Technology (SOEST), Univ. of Hawai'i, 2525 Correa Road, Honolulu, HI 96822, USA (URL: http://modis.higp.hawaii.edu/); MIROVA (Middle InfraRed Observation of Volcanic Activity), a collaborative project between the Universities of Turin and Florence (Italy) supported by the Centre for Volcanic Risk of the Italian Civil Protection Department (URL: http://www.mirovaweb.it/); Copernicus Browser, Copernicus Data Space Ecosystem, European Space Agency (URL: https://dataspace.copernicus.eu/browser/).chr
Kilauea (United States) — January 2023 Cite this Report
Kilauea
United States
19.421°N, 155.287°W; summit elev. 1222 m
All times are local (unless otherwise noted)
Low-level lava effusions in the lava lake at Halema’uma’u during July-December 2022
Kīlauea is the southeastern-most volcano in Hawaii and overlaps the E flank of the Mauna Loa volcano. Its East Rift Zone (ERZ) has been intermittently active for at least 2,000 years. An extended eruption period began in January 1983 and was characterized by open lava lakes and lava flows from the summit caldera and the East Rift Zone. During May 2018 magma migrated into the Lower East Rift Zone (LERZ) and opened 24 fissures along a 6-km-long NE-trending fracture zone that produced lava flows traveling in multiple directions. As lava emerged from the fissures, the lava lake at Halema'uma'u drained and explosions sent ash plumes to several kilometers altitude (BGVN 43:10).
The current eruption period started during September 2021 and has recently been characterized by lava effusions, spatter, and sulfur dioxide emissions in the active Halema’uma’u lava lake (BGVN 47:08). Lava effusions, some spatter, and sulfur dioxide emissions have continued during this reporting period of July through December 2022 using daily reports, volcanic activity notices, and abundant photo, map, and video data from the US Geological Survey's (USGS) Hawaiian Volcano Observatory (HVO).
Summary of activity during July-December 2022. Low-level effusions have continued at the western vent of the Halema’uma’u crater during July through early December 2022. Occasional weak ooze-outs (also called lava break outs) would occur along the margins of the crater floor. The overall level of the active lava lake throughout the reporting period gradually increased due to infilling, however it stagnated in mid-September (table 13). During September through November, activity began to decline, though lava effusions persisted at the western vent. By 9 December, the active part of the lava lake had completely crusted over, and incandescence was no longer visible.
Table 13. Summary of measurements taken during overflights at Kīlauea that show a gradual increase in the active lava lake level and the volume of lava effused since 29 September 2021. Lower activity was reported during September-October. Data collected during July-December 2022. Courtesy of HVO.
| Date: |
Level of the active lava lake (m): |
Cumulative volume of lava effused (million cubic meters): |
| 7 Jul 2022 |
130 |
95 |
| 19 Jul 2022 |
133 |
98 |
| 4 Aug 2022 |
136 |
102 |
| 16 Aug 2022 |
137 |
104 |
| 12 Sep 2022 |
143 |
111 |
| 5 Oct 2022 |
143 |
111 |
| 28 Oct 2022 |
143 |
111 |
Activity during July 2022. Lava effusions were reported from the western vent in the Halema’uma’u crater, along with occasional weak ooze-outs along the margins of the crater floor. The height of the lava lake was variable due to deflation-inflation tilt events; for example, the lake level dropped approximately 3-4 m during a summit deflation-inflation event reported on 1 July. Webcam images taken during the night of 6-12 July showed intermittent low-level spattering at the western vent that rose less than 10 m above the vent (figure 519). Measurements made during an overflight on 7 July indicated that the crater floor was infilled about 130 m and that 95 million cubic meters of lava had been effused since 29 September 2021. A single, relatively small lava ooze-out was active to the S of the lava lake. Around midnight on 8 July there were two brief periods of lava overflow onto the lake margins. On 9 July lava ooze-outs were reported near the SE and NE edges of the crater floor and during 10-11 July they occurred near the E, NE, and NW edges. On 16 July crater incandescence was reported, though the ooze-outs and spattering were not visible. On 18 July overnight webcam images showed incandescence in the western vent complex and two ooze-outs were reported around 0000 and 0200 on 19 July. By 0900 there were active ooze-outs along the SW edge of the crater floor. Measurements made from an overflight on 19 July indicated that the crater floor was infilled about 133 m and 98 million cubic meters of lava had erupted since 29 September 2021 (figure 520). On 20 July around 1600 active ooze-outs were visible along the N edge of the crater, which continued through the next day. Extensive ooze-outs occurred along the W margin during 24 July until 1900; on 26 July minor ooze-outs were noted along the N margin. Minor spattering was visible on 29 July along the E margin of the lake. The sulfur dioxide emission rates ranged 650-2,800 tons per day (t/d), the higher of which was measured on 8 July (figure 519).
Activity during August 2022. The eruption continued in the Halema’uma’u crater at the western vent. According to HVO the lava in the active lake remained at the level of the bounding levees. Occasional minor ooze-outs were observed along the margins of the crater floor. Strong nighttime crater incandescence was visible after midnight on 6 August over the western vent cone. During 6-7 August scattered small lava lobes were active along the crater floor and incandescence persisted above the western vent through 9 August. During 7-9 August HVO reported a single lava effusion source was active along the NW margin of the crater floor. Measurements from an overflight on 4 August indicated that the crater floor was infilled about 136 m total and that 102 million cubic meters of lava had been erupted since the start of the eruption. Lava breakouts were reported along the N, NE, E, S, and W margins of the crater during 10-16 August. Another overflight survey conducted on 16 August indicated that the crater floor infilled about 137 m and 104 million cubic meters of lava had been erupted since September 2021. Measured sulfur dioxide emissions rates ranged 1,150-2,450 t/d, the higher of which occurred on 8 August.
Activity during September 2022. During September, lava effusion continued from the western vent into the active lava lake and onto the crater floor. Intermittent minor ooze-outs were reported through the month. A small ooze-out was visible on the W crater floor margin at 0220 on 2 September, which showed decreasing surface activity throughout the day, but remained active through 3 September. On 3 September around 1900 a lava outbreak occurred along the NW margin of the crater floor but had stopped by the evening of 4 September. Field crews monitoring the summit lava lake on 9 September observed spattering on the NE margin of the lake that rose no higher than 10 m, before falling back onto the lava lake crust (figure 521). Overflight measurements on 12 September indicated that the crater floor was infilled a total of 143 m and 111 million cubic meters of lava had been erupted since September 2021. Extensive breakouts in the W and N part of the crater floor were reported at 1600 on 20 September and continued into 26 September. The active part of the lava lake dropped by 10 m while other parts of the crater floor dropped by several meters. Summit tiltmeters recorded a summit seismic swarm of more than 80 earthquakes during 1500-1800 on 21 September, which occurred about 1.5 km below Halema’uma’u; a majority of these were less than Mw 2. By 22 September the active part of the lava lake was infilled about 2 m. On 23 September the western vent areas exhibited several small spatter cones with incandescent openings, along with weak, sporadic spattering (figure 522). The sulfur dioxide emission rate ranged from 930 t/d to 2,000 t/d, the higher of which was measured on 6 September.
Activity during October 2022. Activity during October declined slightly compared to previous months, though lava effusions persisted from the western vent into the active lava lake and onto the crater floor during October (figure 523). Slight variations in the lava lake were noted throughout the month. HVO reported that around 0600 on 3 October the level of the lava lake has lowered slightly. Overflight measurements taken on 5 October indicated that the crater floor was infilled a total of about 143 m and that 111 million cubic meters of lava had been effused since September 2021. During 6-7 October the lake gradually rose 0.5 m. Sulfur dioxide measurements made on 22 October had an emission rate of 700 t/d. Another overflight taken on 28 October showed that there was little to no change in the elevation of the crater floor: the crater floor was infilled a total of 143 m and 111 million cubic meters of lava had erupted since the start of the eruption.
Activity during November 2022. Activity remained low during November, though HVO reported that lava from the western vent continued to effuse into the active lava lake and onto the crater floor throughout the month. The rate of sulfur dioxide emissions during November ranged from 300-600 t/d, the higher amount of which occurred on 9 November.
Activity during December 2022. Similar low activity was reported during December, with lava effusing from the western vent into the active lava lake and onto the crater floor. During 4-5 December the active part of the lava lake was slightly variable in elevation and fluctuated within 1 m. On 9 December HVO reported that lava was no longer erupting from the western vent in the Halema’uma’u crater and that sulfur dioxide emissions had returned to near pre-eruption background levels; during 10-11 December, the lava lake had completely crusted over, and no incandescence was visible (figure 524). Time lapse camera images covering the 4-10 December showed that the crater floor showed weak deflation and no inflation. Some passive events of crustal overturning were reported during 14-15 December, which brought fresh incandescent lava to the lake surface. The sulfur dioxide emission rate was approximately 200 t/d on 14 December. A smaller overturn event on 17 December and another that occurred around 0000 and into the morning of 20 December were also detected. A small seismic swarm was later detected on 30 December.
Geologic Background. Kilauea overlaps the E flank of the massive Mauna Loa shield volcano in the island of Hawaii. Eruptions are prominent in Polynesian legends; written documentation since 1820 records frequent summit and flank lava flow eruptions interspersed with periods of long-term lava lake activity at Halemaumau crater in the summit caldera until 1924. The 3 x 5 km caldera was formed in several stages about 1,500 years ago and during the 18th century; eruptions have also originated from the lengthy East and Southwest rift zones, which extend to the ocean in both directions. About 90% of the surface of the basaltic shield volcano is formed of lava flows less than about 1,100 years old; 70% of the surface is younger than 600 years. The long-term eruption from the East rift zone between 1983 and 2018 produced lava flows covering more than 100 km2, destroyed hundreds of houses, and added new coastline.
Information Contacts: Hawaiian Volcano Observatory (HVO), U.S. Geological Survey, PO Box 51, Hawai'i National Park, HI 96718, USA (URL: http://hvo.wr.usgs.gov/).
Nyamulagira (DR Congo) — November 2023 Cite this Report
Nyamulagira
DR Congo
1.408°S, 29.2°E; summit elev. 3058 m
All times are local (unless otherwise noted)
Lava flows and thermal activity during May-October 2023
Nyamulagira (also known as Nyamuragira) is a shield volcano in the Democratic Republic of Congo with the summit truncated by a small 2 x 2.3 km caldera with walls up to about 100 m high. Documented eruptions have occurred within the summit caldera, as well as from numerous flank fissures and cinder cones. The current eruption period began in April 2018 and has more recently been characterized by summit crater lava flows and thermal activity (BGVN 48:05). This report describes lava flows and variable thermal activity during May through October 2023, based on information from the Observatoire Volcanologique de Goma (OVG) and various satellite data.
Lava lake activity continued during May. The MIROVA (Middle InfraRed Observation of Volcanic Activity) system recorded moderate-to-strong thermal activity throughout the reporting period; activity was more intense during May and October and relatively weaker from June through September (figure 95). The MODVOLC thermal algorithm, detected a total of 209 thermal alerts. There were 143 hotspots detected during May, eight during June, nine during September, and 49 during October. This activity was also reflected in infrared satellite images, where a lava flow was visible in the NW part of the crater on 7 May and strong activity was seen in the center of the crater on 4 October (figure 96). Another infrared satellite image taken on 12 May showed still active lava flows along the NW margin of the crater. According to OVG lava effusions were active during 7-29 May and moved to the N and NW parts of the crater beginning on 9 May. Strong summit crater incandescence was visible from Goma (27 km S) during the nights of 17, 19, and 20 May (figure 97). On 17 May there was an increase in eruptive activity, which peaked at 0100 on 20 May. Notable sulfur dioxide plumes drifted NW and W during 19-20 May (figure 98). Drone footage acquired in partnership with the USGS (United States Geological Survey) on 20 May captured images of narrow lava flows that traveled about 100 m down the W flank (figure 99). Data from the Rumangabo seismic station indicated a decreasing trend in activity during 17-21 May. Although weather clouds prevented clear views of the summit, a strong thermal signature on the NW flank was visible in an infrared satellite image on 22 May, based on an infrared satellite image. On 28 May the lava flows on the upper W flank began to cool and solidify. By 29 May seismicity returned to levels similar to those recorded before the 17 May increase. Lava effusion continued but was confined to the summit crater; periodic crater incandescence was observed.
Low-level activity was noted during June through October. On 1 June OVG reported that seismicity remained at lower levels and that crater incandescence had been absent for three days, though infrared satellite imagery showed continued lava effusion in the summit crater. The lava flows on the flanks covered an estimated 0.6 km2. Satellite imagery continued to show thermal activity confined to the lava lake through October (figure 96), although no lava flows or significant sulfur dioxide emissions were reported.
Geologic Background. Africa's most active volcano, Nyamulagira (also known as Nyamuragira), is a massive high-potassium basaltic shield about 25 km N of Lake Kivu and 13 km NNW of the steep-sided Nyiragongo volcano. The summit is truncated by a small 2 x 2.3 km caldera that has walls up to about 100 m high. Documented eruptions have occurred within the summit caldera, as well as from the numerous flank fissures and cinder cones. A lava lake in the summit crater, active since at least 1921, drained in 1938, at the time of a major flank eruption. Recent lava flows extend down the flanks more than 30 km from the summit as far as Lake Kivu; extensive lava flows from this volcano have covered 1,500 km2 of the western branch of the East African Rift.
Information Contacts: Observatoire Volcanologique de Goma (OVG), Departement de Geophysique, Centre de Recherche en Sciences Naturelles, Lwiro, D.S. Bukavu, DR Congo; Hawai'i Institute of Geophysics and Planetology (HIGP) - MODVOLC Thermal Alerts System, School of Ocean and Earth Science and Technology (SOEST), Univ. of Hawai'i, 2525 Correa Road, Honolulu, HI 96822, USA (URL: http://modis.higp.hawaii.edu/); MIROVA (Middle InfraRed Observation of Volcanic Activity), a collaborative project between the Universities of Turin and Florence (Italy) supported by the Centre for Volcanic Risk of the Italian Civil Protection Department (URL: http://www.mirovaweb.it/); NASA Global Sulfur Dioxide Monitoring Page, Atmospheric Chemistry and Dynamics Laboratory, NASA Goddard Space Flight Center (NASA/GSFC), 8800 Greenbelt Road, Goddard, Maryland, USA (URL: https://so2.gsfc.nasa.gov/); Copernicus Browser, Copernicus Data Space Ecosystem, European Space Agency (URL: https://dataspace.copernicus.eu/browser/); Charles Balagizi, Goma Volcano Observatory, Departement de Geophysique, Centre de Recherche en Sciences Naturelles, Lwiro, D.S. Bukavu, DR Congo.
Bagana (Papua New Guinea) — October 2023 Cite this Report
Bagana
Papua New Guinea
6.137°S, 155.196°E; summit elev. 1855 m
All times are local (unless otherwise noted)
Explosions, ash plumes, ashfall, and lava flows during April-September 2023
The remote volcano of Bagana is located in central Bougainville Island, Papua New Guinea. Recorded eruptions date back to 1842 and activity has consisted of effusive activity that has built a small lava dome in the summit crater and occasional explosions that produced pyroclastic flows. The most recent eruption has been ongoing since February 2000 and has produced occasional explosions, ash plumes, and lava flows. More recently, activity has been characterized by ongoing effusive activity and ash emissions (BGVN 48:04). This report updates activity from April through September 2023 that has consisted of explosions, ash plumes, ashfall, and lava flows, using information from the Darwin Volcanic Ash Advisory Center (VAAC) and satellite data.
An explosive eruption was reported on 7 July that generated a large gas-and-ash plume to high altitudes and caused significant ashfall in local communities; the eruption plume had reached upper tropospheric (16-18 km altitude) altitudes by 2200, according to satellite images. Sulfur dioxide plumes were detected in satellite images on 8 July and indicated that the plume was likely a mixture of gas, ice, and ash. A report issued by the Autonomous Bougainville Government (ABG) (Torokina District, Education Section) on 10 July noted that significant ash began falling during 2000-2100 on 7 July and covered most areas in the Vuakovi, Gotana (9 km SW), Koromaketo, Laruma (25 km W) and Atsilima (27 km NW) villages. Pyroclastic flows also occurred, according to ground-based reports; small deposits confined to one drainage were inspected by RVO during an overflight on 17 July and were confirmed to be from the 7 July event. Ashfall continued until 10 July and covered vegetation, which destroyed bushes and gardens and contaminated rivers and streams.
RVO reported another eruption on 14 July. The Darwin VAAC stated that an explosive event started around 0830 on 15 July and produced an ash plume that rose to 16.5 km altitude by 1000 and drifted N, according to satellite images. The plume continued to drift N and remained visible through 1900, and by 2150 it had dissipated.
Ashfall likely from both the 7 and 15 July events impacted about 8,111 people in Torokina (20 km SW), including Tsito/Vuakovi, Gotana, Koromaketo, Kenaia, Longkogari, Kenbaki, Piva (13 km SW), and Atsinima, and in the Tsitovi district, according to ABG. Significant ashfall was also reported in Ruruvu (22 km N) in the Wakunai District of Central Bougainville, though the thickness of these deposits could not be confirmed. An evacuation was called for the villages in Wakunai, where heavy ashfall had contaminated water sources; the communities of Ruruvu, Togarau, Kakarapaia, Karauturi, Atao, and Kuritaturi were asked to evacuate to a disaster center at the Wakunai District Station, and communities in Torokina were asked to evacuate to the Piva District station. According to a news article, more than 7,000 people needed temporary accommodations, with about 1,000 people in evacuation shelters. Ashfall had deposited over a broad area, contaminating water supplies, affecting crops, and collapsing some roofs and houses in rural areas. Schools were temporarily shut down. Intermittent ash emissions continued through the end of July and drifted NNW, NW, and SW. Fine ashfall was reported on the coast of Torokina, and ash plumes also drifted toward Laruma and Atsilima.
A small explosive eruption occurred at 2130 on 28 July that ejected material from the crater vents, according to reports from Torokina, in addition to a lava flow that contained two lobes. A second explosion was detected at 2157. Incandescence from the lava flow was visible from Piva as it descended the W flank around 2000 on 29 July (figure 47). The Darwin VAAC reported that a strong thermal anomaly was visible in satellite images during 30-31 July and that ash emissions rose to 2.4 km altitude and drifted WSW on 30 July. A ground report from RVO described localized emissions at 0900 on 31 July.
The Darwin VAAC reported that ash plumes were identified in satellite imagery at 0800 and 1220 on 12 August and rose to 2.1 km and 3 km altitude and drifted NW and W, respectively. A news report stated that aid was sent to more than 6,300 people that were adversely affected by the eruption. Photos taken during 17-19 August showed ash emissions rising no higher than 1 km above the summit and drifting SE. A small explosion generated an ash plume during the morning of 19 August. Deposits from small pyroclastic flows were also captured in the photos. Satellite images captured lava flows and pyroclastic flow deposits. Two temporary seismic stations were installed near Bagana on 17 August at distances of 7 km WSW (Vakovi station) and 11 km SW (Kepox station). The Kepox station immediately started to record continuous, low-frequency background seismicity.
Satellite data. Little to no thermal activity was detected during April through mid-July 2023; only one anomaly was recorded during early April and one during early June, according to MIROVA (Middle InfraRed Observation of Volcanic Activity) data (figure 48). Thermal activity increased in both power and frequency during mid-July through September, although there were still some short gaps in detected activity. MODVOLC also detected increased thermal activity during August; thermal hotspots were detected a total of five times on 19, 20, and 27 August. Weak thermal anomalies were also captured in infrared satellite images on clear weather days throughout the reporting period on 7, 12, and 17 April, 27 May, 1, 6, 16, and 31 July, and 19 September (figure 48); a strong thermal anomaly was visible on 31 July. Distinct sulfur dioxide plumes that drifted generally NW were intermittently captured by the TROPOMI instrument on the Sentinel-5P satellite and sometimes exceeded two Dobson Units (DUs) (figure 49).
Geologic Background. Bagana volcano, in a remote portion of central Bougainville Island, is frequently active. This massive symmetrical cone was largely constructed by an accumulation of viscous andesitic lava flows. The entire edifice could have been constructed in about 300 years at its present rate of lava production. Eruptive activity is characterized by non-explosive effusion of viscous lava that maintains a small lava dome in the summit crater, although occasional explosive activity produces pyroclastic flows. Lava flows with tongue-shaped lobes up to 50 m thick and prominent levees descend the flanks on all sides.
Information Contacts: Rabaul Volcano Observatory (RVO), Geohazards Management Division, Department of Mineral Policy and Geohazards Management (DMPGM), PO Box 3386, Kokopo, East New Britain Province, Papua New Guinea; Darwin Volcanic Ash Advisory Centre (VAAC), Bureau of Meteorology, Northern Territory Regional Office, PO Box 40050, Casuarina, NT 0811, Australia (URL: http://www.bom.gov.au/info/vaac/); MIROVA (Middle InfraRed Observation of Volcanic Activity), a collaborative project between the Universities of Turin and Florence (Italy) supported by the Centre for Volcanic Risk of the Italian Civil Protection Department (URL: http://www.mirovaweb.it/); Hawai'i Institute of Geophysics and Planetology (HIGP) - MODVOLC Thermal Alerts System, School of Ocean and Earth Science and Technology (SOEST), Univ. of Hawai'i, 2525 Correa Road, Honolulu, HI 96822, USA (URL: http://modis.higp.hawaii.edu/); NASA Global Sulfur Dioxide Monitoring Page, Atmospheric Chemistry and Dynamics Laboratory, NASA Goddard Space Flight Center (NASA/GSFC), 8800 Greenbelt Road, Goddard, Maryland, USA (URL: https://so2.gsfc.nasa.gov/); Copernicus Browser, Copernicus Data Space Ecosystem, European Space Agency (URL: https://dataspace.copernicus.eu/browser/); Autonomous Bougainville Government, P.O Box 322, Buka, AROB, PNG (URL: https://abg.gov.pg/); Andrew Tupper (Twitter: @andrewcraigtupp); Simon Carn, Geological and Mining Engineering and Sciences, Michigan Technological University, 1400 Townsend Drive, Houghton, MI 49931, USA (URL: http://www.volcarno.com/, Twitter: @simoncarn); Radio NZ (URL: https://www.rnz.co.nz/news/pacific/494464/more-than-7-000-people-in-bougainville-need-temporary-accommodation-after-eruption); USAID, 1300 Pennsylvania Ave, NW, Washington DC 20004, USA (URL: https://www.usaid.gov/pacific-islands/press-releases/aug-08-2023-united-states-provides-immediate-emergency-assistance-support-communities-affected-mount-bagana-volcanic-eruptions).
Mayon (Philippines) — October 2023 Cite this Report
Mayon
Philippines
13.257°N, 123.685°E; summit elev. 2462 m
All times are local (unless otherwise noted)
Lava flows, pyroclastic flows, ash emissions, and seismicity during April-September 2023
Mayon is located in the Philippines and has steep upper slopes capped by a small summit crater. Historical eruptions date back to 1616 CE that have been characterized by Strombolian eruptions, lava flows, pyroclastic flows, and mudflows. Eruptions mostly originated from a central conduit. Pyroclastic flows and mudflows have commonly descended many of the approximately 40 drainages that surround the volcano. The most recent eruption occurred during June through October 2022 and consisted of lava dome growth and gas-and-steam emissions (BGVN 47:12). A new eruption was reported during late April 2023 and has included lava flows, pyroclastic density currents, ash emissions, and seismicity. This report covers activity during April through September 2023 based on daily bulletins from the Philippine Institute of Volcanology and Seismology (PHIVOLCS).
During April through September 2023, PHIVOLCS reported near-daily rockfall events, frequent volcanic earthquakes, and sulfur dioxide measurements. Gas-and-steam emissions rose 100-900 m above the crater and drifted in different directions. Nighttime crater incandescence was often visible during clear weather and was accompanied by incandescent avalanches of material. Activity notably increased during June when lava flows were reported on the S, SE, and E flanks (figure 52). The MIROVA graph (Middle InfraRed Observation of Volcanic Activity) showed strong thermal activity coincident with these lava flows, which remained active through September (figure 53). According to the MODVOLC thermal algorithm, a total of 110 thermal alerts were detected during the reporting period: 17 during June, 40 during July, 27 during August, and 26 during September. During early June, pyroclastic density currents (PDCs) started to occur more frequently.
Low activity was reported during much of April and May; gas-and-steam emissions rose 100-900 m above the crater and generally drifted in different directions. A total of 52 rockfall events and 18 volcanic earthquakes were detected during April and 147 rockfall events and 13 volcanic events during May. Sulfur dioxide flux measurements ranged between 400-576 tons per day (t/d) during April, the latter of which was measured on 29 April and between 162-343 t/d during May, the latter of which was measured on 13 May.
Activity during June increased, characterized by lava flows, pyroclastic density currents (PDCs), crater incandescence and incandescent rockfall events, gas-and-steam emissions, and continued seismicity. Weather clouds often prevented clear views of the summit, but during clear days, moderate gas-and-steam emissions rose 100-2,500 m above the crater and drifted in multiple directions. A total of 6,237 rockfall events and 288 volcanic earthquakes were detected. The rockfall events often deposited material on the S and SE flanks within 700-1,500 m of the summit crater and ash from the events drifted SW, S, SE, NE, and E. Sulfur dioxide emissions ranged between 149-1,205 t/d, the latter of which was measured on 10 June. Short-term observations from EDM and electronic tiltmeter monitoring indicated that the upper slopes were inflating since February 2023. Longer-term ground deformation parameters based on EDM, precise leveling, continuous GPS, and electronic tilt monitoring indicated that the volcano remained inflated, especially on the NW and SE flanks. At 1000 on 5 June the Volcano Alert Level (VAL) was raised to 2 (on a 0-5 scale). PHIVOLCS noted that although low-level volcanic earthquakes, ground deformation, and volcanic gas emissions indicated unrest, the steep increase in rockfall frequency may indicate increased dome activity.
A total of 151 dome-collapse PDCs occurred during 8-9 and 11-30 June, traveled 500-2,000 m, and deposited material on the S flank within 2 km of the summit crater. During 8-9 June the VAL was raised to 3. At approximately 1947 on 11 June lava flow activity was reported; two lobes traveled within 500 m from the crater and deposited material on the S (Mi-isi), SE (Bonga), and E (Basud) flanks. Weak seismicity accompanied the lava flow and slight inflation on the upper flanks. This lava flow remained active through 30 June, moving down the S and SE flank as far as 2.5 km and 1.8 km, respectively and depositing material up to 3.3 km from the crater. During 15-16 June traces of ashfall from the PDCs were reported in Sitio Buga, Nabonton, City of Ligao and Purok, and San Francisco, Municipality of Guinobatan. During 28-29 June there were two PDCs generated by the collapse of the lava flow front, which generated a light-brown ash plume 1 km high. Satellite monitors detected significant concentrations of sulfur dioxide beginning on 29 June. On 30 June PDCs primarily affected the Basud Gully on the E flank, the largest of which occurred at 1301 and lasted eight minutes, based on the seismic record. Four PDCs generated between 1800 and 2000 that lasted approximately four minutes each traveled 3-4 km on the E flank and generated an ash plume that rose 1 km above the crater and drifted N and NW. Ashfall was recorded in Tabaco City.
Similar strong activity continued during July; slow lava effusion remained active on the S and SE flanks and traveled as far as 2.8 km and 2.8 km, respectively and material was deposited as far as 4 km from the crater. There was a total of 6,983 rockfall events and 189 PDCs that affected the S, SE, and E flanks. The volcano network detected a total of 2,124 volcanic earthquakes. Continuous gas-and-steam emissions rose 200-2,000 m above the crater and drifted in multiple directions. Sulfur dioxide emissions averaged 792-4,113 t/d, the latter of which was measured on 28 July. During 2-4 July three PDCs were generated from the collapse of the lava flow and resulting light brown plumes rose 200-300 m above the crater. Continuous tremor pulses were reported beginning at 1547 on 3 July through 7 July at 1200, at 2300 on 8 July and going through 0300 on 10 July, and at 2300 on 16 July, as recorded by the seismic network. During 6-9 July there were 10 lava flow-collapse-related PDCs that generated light brown plumes 300-500 m above the crater. During 10-11 July light ashfall was reported in some areas of Mabinit, Legazpi City, Budiao and Salvacion, Daraga, and Camalig, Albay. By 18 July the lava flow advanced 600 m on the E flank as well.
During 1733 on 18 July and 0434 on 19 July PHIVOLCS reported 30 “ashing” events, which are degassing events accompanied by audible thunder-like sounds and entrained ash at the crater, which produced short, dark plumes that drifted SW. These events each lasted 20-40 seconds, and plume heights ranged from 150-300 m above the crater, as recorded by seismic, infrasound, visual, and thermal monitors. Three more ashing events occurred during 19-20 July. Short-term observations from electronic tilt and GPS monitoring indicate deflation on the E lower flanks in early July and inflation on the NW middle flanks during the third week of July. Longer-term ground deformation parameters from EDM, precise leveling, continuous GPS, and electronic tilt monitoring indicated that the volcano was still generally inflated relative to baseline levels. A short-lived lava pulse lasted 28 seconds at 1956 on 21 July, which was accompanied by seismic and infrasound signals. By 22 July, the only lava flow that remained active was on the SE flank, and continued to extend 3.4 km, while those on the S and E flanks weakened markedly. One ashing event was detected during 30-31 July, whereas there were 57 detected during 31 July-1 August; according to PHIVOLCS beginning at approximately 1800 on 31 July eruptive activity was dominated by phases of intermittent ashing, as well as increased in the apparent rates of lava effusion from the summit crater. The ashing phases consisted of discrete events recorded as low-frequency volcanic earthquakes (LFVQ) typically 30 seconds in duration, based on seismic and infrasound signals. Gray ash plume rose 100 m above the crater and generally drifted NE. Shortly after these ashing events began, new lava began to effuse rapidly from the crater, feeding the established flowed on the SE, E, and E flanks and generating frequent rockfall events.
Intensified unrest persisted during August. There was a total of 4,141 rockfall events, 2,881 volcanic earthquakes, which included volcanic tremor events, 32 ashing events, and 101 PDCs detected throughout the month. On clear weather days, gas-and-steam emissions rose 300-1,500 m above the crater and drifted in different directions (figure 54). Sulfur dioxide emissions averaged 735-4,756 t/d, the higher value of which was measured on 16 August. During 1-2 August the rate of lava effusion decreased, but continued to feed the flows on the SE, S, and E flanks, maintaining their advances to 3.4 km, 2.8 km, and 1.1 km from the crater, respectively (figure 55). Rockfall and PDCs generated by collapses at the lava flow margins and from the summit dome deposited material within 4 km of the crater. During 3-4 August there were 10 tremor events detected that lasted 1-4 minutes. Short-lived lava pulse lasted 35 seconds and was accompanied by seismic and infrasound signals at 0442 on 6 August. Seven collapses were recorded at the front of the lava flow during 12-14 August.
During September, similar activity of slow lava effusion, PDCs, gas-and-steam emissions, and seismicity continued. There was a total of 4,452 rockfall events, 329 volcanic earthquakes, which included volcanic tremor events, two ashing events, and 85 PDCs recorded throughout the month. On clear weather days, gas-and-steam emissions rose 100-1,500 m above the crater and drifted in multiple directions. Sulfur dioxide emissions averaged 609-2,252 t/d, the higher average of which was measured on 6 September. Slow lava effusion continued advancing on the SE, S, and E flanks, maintaining lengths of 3.4 km, 2.8 km, and 1.1 km, respectively. Rockfall and PDC events generated by collapses along the lava flow margins and at the summit dome deposited material within 4 km of the crater.
Geologic Background. Symmetrical Mayon, which rises above the Albay Gulf NW of Legazpi City, is the most active volcano of the Philippines. The steep upper slopes are capped by a small summit crater. Recorded eruptions since 1616 CE range from Strombolian to basaltic Plinian, with cyclical activity beginning with basaltic eruptions, followed by longer periods of andesitic lava flows. Eruptions occur predominately from the central conduit and have also produced lava flows that travel far down the flanks. Pyroclastic density currents and mudflows have commonly swept down many of the approximately 40 ravines that radiate from the summit and have often damaged populated lowland areas. A violent eruption in 1814 killed more than 1,200 people and devastated several towns.
Information Contacts: Philippine Institute of Volcanology and Seismology (PHIVOLCS), Department of Science and Technology, University of the Philippines Campus, Diliman, Quezon City, Philippines (URL: http://www.phivolcs.dost.gov.ph/); MIROVA (Middle InfraRed Observation of Volcanic Activity), a collaborative project between the Universities of Turin and Florence (Italy) supported by the Centre for Volcanic Risk of the Italian Civil Protection Department (URL: http://www.mirovaweb.it/); Hawai'i Institute of Geophysics and Planetology (HIGP) - MODVOLC Thermal Alerts System, School of Ocean and Earth Science and Technology (SOEST), Univ. of Hawai'i, 2525 Correa Road, Honolulu, HI 96822, USA (URL: http://modis.higp.hawaii.edu/); Copernicus Browser, Copernicus Data Space Ecosystem, European Space Agency (URL: https://dataspace.copernicus.eu/browser/); William Rogers, Legazpi City, Albay Province, Philippines.
Nishinoshima (Japan) — October 2023 Cite this Report
Nishinoshima
Japan
27.247°N, 140.874°E; summit elev. 100 m
All times are local (unless otherwise noted)
Eruption plumes and gas-and-steam plumes during May-August 2023
Nishinoshima, located about 1,000 km S of Tokyo, is a small island in the Ogasawara Arc in Japan. The island is the summit of a massive submarine volcano that has prominent submarine peaks to the S, W, and NE. Eruptions date back to 1973 and the current eruption period began in October 2022. Recent activity has consisted of small ash plumes and fumarolic activity (BGVN 48:07). This report covers activity during May through August 2023, using information from monthly reports of the Japan Meteorological Agency (JMA) monthly reports and satellite data.
Activity during May through June was relatively low. The Japan Coast Guard (JCG) did overflights on 14 and 22 June and reported white gas-and-steam emissions rising 600 m and 1,200 m from the central crater of the pyroclastic cone, respectively (figure 125). In addition, multiple white gas-and-steam emissions rose from the inner rim of the W side of the crater and from the SE flank of the pyroclastic cone. Discolored brown-to-green water was observed around almost the entire perimeter of the island; on 22 June light green discolored water was observed off the S coast of the island.
Observations from the Himawari meteorological satellite confirmed an eruption on 9 and 10 July. An eruption plume rose 1.6 km above the crater and drifted N around 1300 on 9 July. Satellite images acquired at 1420 and 2020 on 9 July and at 0220 on 10 July showed continuing emissions that rose 1.3-1.6 km above the crater and drifted NE and N. The Tokyo VAAC reported that an ash plume seen by a pilot and identified in a satellite image at 0630 on 21 July rose to 3 km altitude and drifted S.
Aerial observations conducted by JCG on 8 August showed a white-and-gray plume rising from the central crater of the pyroclastic cone, and multiple white gas-and-steam emissions were rising from the inner edge of the western crater and along the NW-SE flanks of the island (figure 126). Brown-to-green discolored water was also noted around the perimeter of the island.
Intermittent low-to-moderate power thermal anomalies were recorded in the MIROVA graph (Middle InfraRed Observation of Volcanic Activity), showing an increase in both frequency and power beginning in July (figure 127). This increase in activity coincides with eruptive activity on 9 and 10 July, characterized by eruption plumes. According to the MODVOLC thermal alert algorithm, one thermal hotspot was recorded on 20 July. Weak thermal anomalies were also detected in infrared satellite imagery, accompanied by strong gas-and-steam plumes (figure 128).
Geologic Background. The small island of Nishinoshima was enlarged when several new islands coalesced during an eruption in 1973-74. Multiple eruptions that began in 2013 completely covered the previous exposed surface and continued to enlarge the island. The island is the summit of a massive submarine volcano that has prominent peaks to the S, W, and NE. The summit of the southern cone rises to within 214 m of the ocean surface 9 km SSE.
Information Contacts: Japan Meteorological Agency (JMA), 1-3-4 Otemachi, Chiyoda-ku, Tokyo 100-8122, Japan (URL: http://www.jma.go.jp/jma/indexe.html); Tokyo Volcanic Ash Advisory Center (VAAC), 1-3-4 Otemachi, Chiyoda-ku, Tokyo 100-8122, Japan (URL: http://ds.data.jma.go.jp/svd/vaac/data/); MIROVA (Middle InfraRed Observation of Volcanic Activity), a collaborative project between the Universities of Turin and Florence (Italy) supported by the Centre for Volcanic Risk of the Italian Civil Protection Department (URL: http://www.mirovaweb.it/); Copernicus Browser, Copernicus Data Space Ecosystem, European Space Agency (URL: https://dataspace.copernicus.eu/browser/).
Krakatau (Indonesia) — October 2023 Cite this Report
Krakatau
Indonesia
6.1009°S, 105.4233°E; summit elev. 285 m
All times are local (unless otherwise noted)
White gas-and-steam plumes and occasional ash plumes during May-August 2023
Krakatau is located in the Sunda Strait between Java and Sumatra, Indonesia. Caldera collapse during the catastrophic 1883 eruption destroyed Danan and Perbuwatan cones and left only a remnant of Rakata. The post-collapse cone of Anak Krakatau (Child of Krakatau) was constructed within the 1883 caldera at a point between the former Danan and Perbuwatan cones; it has been the site of frequent eruptions since 1927. The current eruption period began in May 2021 and has recently consisted of Strombolian eruptions and ash plumes (BGVN 48:07). This report describes lower levels of activity consisting of ash and white gas-and-steam plumes during May through August 2023, based on information provided by the Indonesian Center for Volcanology and Geological Hazard Mitigation, referred to as Pusat Vulkanologi dan Mitigasi Bencana Geologi (PVMBG), MAGMA Indonesia, and satellite data.
Activity was relatively low during May and June. Daily white gas-and-steam emissions rose 25-200 m above the crater and drifted in different directions. Five ash plumes were detected at 0519 on 10 May, 1241 on 11 May, 0920 on 12 May, 2320 on 12 May, and at 0710 on 13 May, and rose 1-2.5 km above the crater and drifted SW. A webcam image taken on 12 May showed ejection of incandescent material above the vent. A total of nine ash plumes were detected during 6-11 June: at 1434 and 00220 on 6 and 7 June the ash plumes rose 500 m above the crater and drifted NW, at 1537 on 8 June the ash plume rose 1 km above the crater and drifted SW, at 0746 and at 0846 on 9 June the ash plumes rose 800 m and 3 km above the crater and drifted SW, respectively, at 0423, 1431, and 1750 on 10 June the ash plumes rose 2 km, 1.5 km, and 3.5 km above the crater and drifted NW, respectively, and at 0030 on 11 June an ash plume rose 2 km above the crater and drifted NW. Webcam images taken on 10 and 11 June at 0455 and 0102, respectively, showed incandescent material ejected above the vent. On 19 June an ash plume at 0822 rose 1.5 km above the crater and drifted SE.
Similar low activity of white gas-and-steam emissions and few ash plumes were reported during July and August. Daily white gas-and-steam emissions rose 25-300 m above the crater and drifted in multiple directions. Three ash plumes were reported at 0843, 0851, and 0852 on 20 July that rose 500-2,000 m above the crater and drifted NW.
The MIROVA (Middle InfraRed Observation of Volcanic Activity) graph of MODIS thermal anomaly data showed intermittent low-to-moderate power thermal anomalies during May through August 2023 (figure 140). Although activity was often obscured by weather clouds, a thermal anomaly was visible in an infrared satellite image of the crater on 12 May, accompanied by an eruption plume that drifted SW (figure 141).
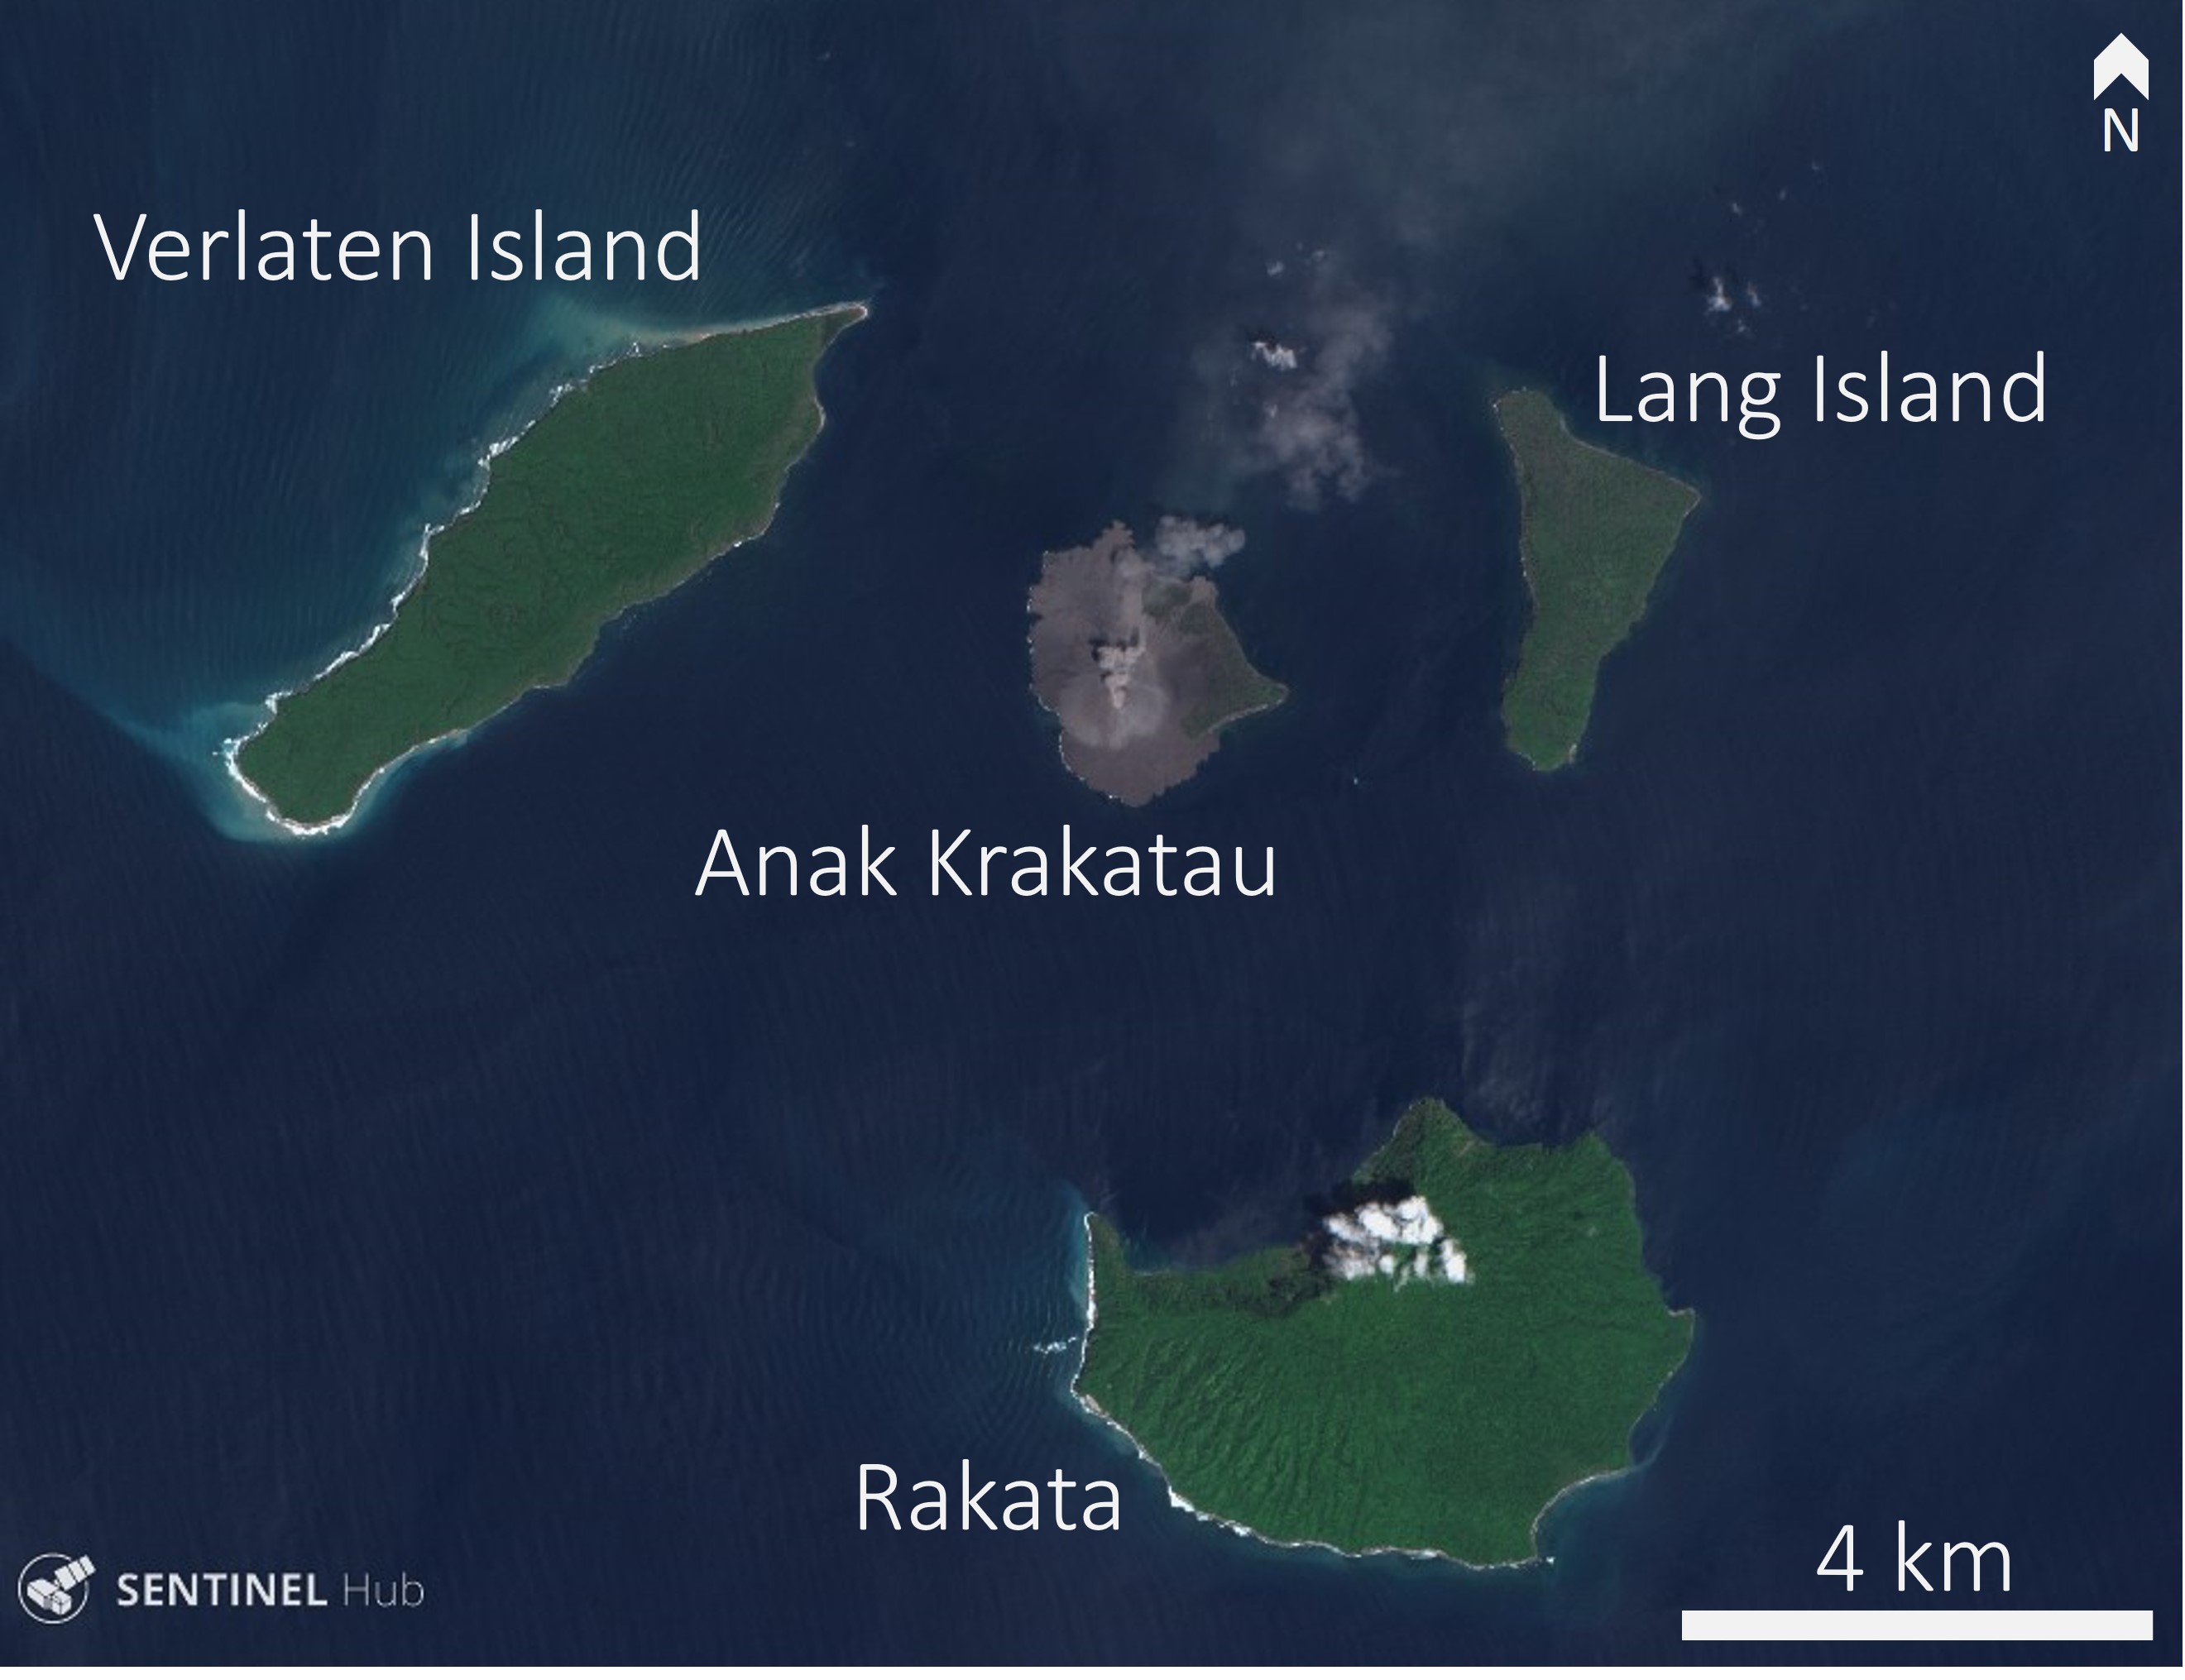
Geologic Background. The renowned Krakatau (frequently mis-named as Krakatoa) volcano lies in the Sunda Strait between Java and Sumatra. Collapse of an older edifice, perhaps in 416 or 535 CE, formed a 7-km-wide caldera. Remnants of that volcano are preserved in Verlaten and Lang Islands; subsequently the Rakata, Danan, and Perbuwatan cones were formed, coalescing to create the pre-1883 Krakatau Island. Caldera collapse during the catastrophic 1883 eruption destroyed Danan and Perbuwatan, and left only a remnant of Rakata. This eruption caused more than 36,000 fatalities, most as a result of tsunamis that swept the adjacent coastlines of Sumatra and Java. Pyroclastic surges traveled 40 km across the Sunda Strait and reached the Sumatra coast. After a quiescence of less than a half century, the post-collapse cone of Anak Krakatau (Child of Krakatau) was constructed within the 1883 caldera at a point between the former Danan and Perbuwatan cones. Anak Krakatau has been the site of frequent eruptions since 1927.
Information Contacts: Pusat Vulkanologi dan Mitigasi Bencana Geologi (PVMBG, also known as Indonesian Center for Volcanology and Geological Hazard Mitigation, CVGHM), Jalan Diponegoro 57, Bandung 40122, Indonesia (URL: http://www.vsi.esdm.go.id/); MAGMA Indonesia, Kementerian Energi dan Sumber Daya Mineral (URL: https://magma.esdm.go.id/v1); MIROVA (Middle InfraRed Observation of Volcanic Activity), a collaborative project between the Universities of Turin and Florence (Italy) supported by the Centre for Volcanic Risk of the Italian Civil Protection Department (URL: http://www.mirovaweb.it/); Copernicus Browser, Copernicus Data Space Ecosystem, European Space Agency (URL: https://dataspace.copernicus.eu/browser/).
Villarrica (Chile) — October 2023 Cite this Report
Villarrica
Chile
39.42°S, 71.93°W; summit elev. 2847 m
All times are local (unless otherwise noted)
Strombolian activity, gas-and-ash emissions, and crater incandescence during April-September 2023
Villarrica, in central Chile, consists of a 2-km-wide caldera that formed about 3,500 years ago and is located at the base of the presently active cone at the NW margin of a 6-km-wide caldera. Historical eruptions eruptions date back to 1558 and have been characterized by mild-to-moderate explosive activity with occasional lava effusions. The current eruption period began in December 2014 and has recently consisted of nighttime crater incandescence, ash emissions, and seismicity (BGVN 48:04). This report covers activity during April through September 2023 and describes occasional Strombolian activity, gas-and-ash emissions, and nighttime crater incandescence. Information for this report primarily comes from the Southern Andes Volcano Observatory (Observatorio Volcanológico de Los Andes del Sur, OVDAS), part of Chile's National Service of Geology and Mining (Servicio Nacional de Geología y Minería, SERNAGEOMIN) and satellite data.
Seismicity during April consisted of long period (LP) events and tremor (TRE); a total of 9,413 LP-type events and 759 TR-type events were detected throughout the month. Nighttime crater incandescence persisted and was visible in the degassing column. Sulfur dioxide data was obtained using Differential Absorption Optical Spectroscopy Equipment (DOAS) that showed an average value of 1,450 ± 198 tons per day (t/d) during 1-15 April and 1,129 ± 201 t/d during 16-30 April, with a maximum daily value of 2,784 t/d on 9 April. Gas-and-steam emissions of variable intensities rose above the active crater as high as 1.3 km above the crater on 13 April. Strombolian explosions were not observed and there was a slight decrease in the lava lake level.
There were 14,123 LP-type events and 727 TR-type events detected during May. According to sulfur dioxide measurements taken with DOAS equipment, the active crater emitted an average value of 1,826 ± 482 t/d during 1-15 May and 912 ± 41 t/d during 16-30 May, with a daily maximum value of 5,155 t/d on 13 May. Surveillance cameras showed continuous white gas-and-steam emissions that rose as high as 430 m above the crater on 27 May. Nighttime incandescence illuminated the gas column less than 300 m above the crater rim was and no pyroclastic emissions were reported. A landslide was identified on 13 May on the E flank of the volcano 50 m from the crater rim and extending 300 m away; SERNAGEOMIN noted that this event may have occurred on 12 May. During the morning of 27 and 28 May minor Strombolian explosions characterized by incandescent ejecta were recorded at the crater rim; the last reported Strombolian explosions had occurred at the end of March.
Seismic activity during June consisted of five volcano-tectonic (VT)-type events, 21,606 LP-type events, and 2,085 TR-type events. The average value of sulfur dioxide flux obtained by DOAS equipment was 1,420 ± 217 t/d during 1-15 June and 2,562 ± 804 t/d, with a maximum daily value of 4,810 t/d on 17 June. White gas-and-steam emissions rose less than 480 m above the crater; frequent nighttime crater incandescence was reflected in the degassing plume. On 12 June an emission rose 100 m above the crater and drifted NNW. On 15 June one or several emissions resulted in ashfall to the NE as far as 5.5 km from the crater, based on a Skysat satellite image. Several Strombolian explosions occurred within the crater; activity on 15 June was higher energy and ejected blocks 200-300 m on the NE slope. Surveillance cameras showed white gas-and-steam emissions rising 480 m above the crater on 16 June. On 19 and 24 June low-intensity Strombolian activity was observed, ejecting material as far as 200 m from the center of the crater to the E.
During July, seismicity included 29,319 LP-type events, 3,736 TR-type events, and two VT-type events. DOAS equipment recorded two days of sulfur dioxide emissions of 4,220 t/d and 1,009 t/d on 1 and 13 July, respectively. Constant nighttime incandescence was also recorded and was particularly noticeable when accompanied by eruptive columns on 12 and 16 July. Minor explosive events were detected in the crater. According to Skysat satellite images taken on 12, 13, and 16 July, ashfall deposits were identified 155 m S of the crater. According to POVI, incandescence was visible from two vents on the crater floor around 0336 on 12 July. Gas-and-ash emissions rose as high as 1.2 km above the crater on 13 July and drifted E and NW. A series of gas-and-steam pulses containing some ash deposited material on the upper E flank around 1551 on 13 July. During 16-31 July, average sulfur dioxide emissions of 1,679 ± 406 t/d were recorded, with a maximum daily value of 2,343 t/d on 28 July. Fine ash emissions were also reported on 16, 17, and 23 July.
Seismicity persisted during August, characterized by 27,011 LP-type events, 3,323 TR-type events, and three VT-type events. The average value of sulfur dioxide measurements taken during 1-15 August was 1,642 ± 270 t/d and 2,207 ± 4,549 t/d during 16-31 August, with a maximum daily value of 3,294 t/d on 27 August. Nighttime crater incandescence remained visible in degassing columns. White gas-and-steam emissions rose 480 m above the crater on 6 August. According to a Skysat satellite image from 6 August, ash accumulation was observed proximal to the crater and was mainly distributed toward the E slope. White gas-and-steam emissions rose 320 m above the crater on 26 August. Nighttime incandescence and Strombolian activity that generated ash emissions were reported on 27 August.
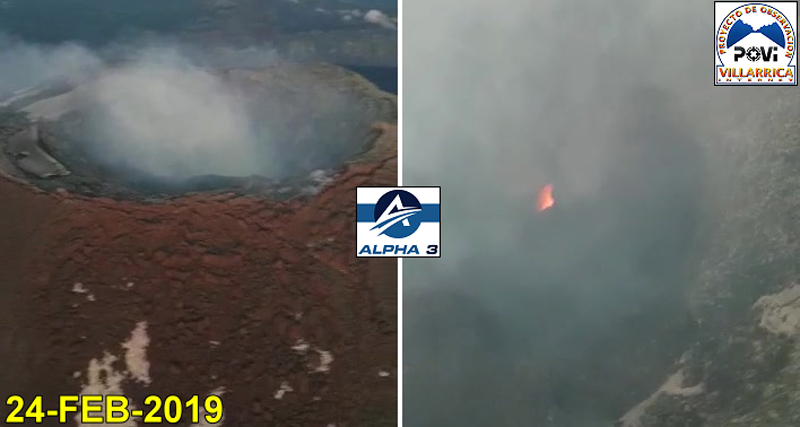
Seismicity during September was characterized by five VT-type events, 12,057 LP-type events, and 2,058 TR-type events. Nighttime incandescence persisted. On 2 September an ash emission rose 180 m above the crater and drifted SE at 1643 (figure 125) and a white gas-and-steam plume rose 320 m above the crater. According to the Buenos Aires VAAC, periods of continuous gas-and-ash emissions were visible in webcam images from 1830 on 2 September to 0110 on 3 September. Strombolian activity was observed on 2 September and during the early morning of 3 September, the latter event of which generated an ash emission that rose 60 m above the crater and drifted 100 m from the center of the crater to the NE and SW. Ashfall was reported to the SE and S as far as 750 m from the crater. The lava lake was active during 3-4 September and lava fountaining was visible for the first time since 26 March 2023, according to POVI. Fountains captured in webcam images at 2133 on 3 September and at 0054 on 4 September rose as high as 60 m above the crater rim and ejected material onto the upper W flank. Sulfur dioxide flux of 1,730 t/d and 1,281 t/d was measured on 3 and 4 September, respectively, according to data obtained by DOAS equipment.
Strong Strombolian activity and larger gas-and-ash plumes were reported during 18-20 September. On 18 September activity was also associated with energetic LP-type events and notable sulfur dioxide fluxes (as high as 4,277 t/d). On 19 September Strombolian activity and incandescence were observed. On 20 September at 0914 ash emissions rose 50 m above the crater and drifted SSE, accompanied by Strombolian activity that ejected material less than 100 m SSE, causing fall deposits on that respective flank. SERNAGEOMIN reported that a Planet Scope satellite image taken on 20 September showed the lava lake in the crater, measuring 32 m x 35 m and an area of 0.001 km2. Several ash emissions were recorded at 0841, 0910, 1251, 1306, 1312, 1315, and 1324 on 23 September and rose less than 150 m above the crater. The sulfur dioxide flux value was 698 t/d on 23 September and 1,097 t/d on 24 September. On 24 September the Volcanic Alert Level (VAL) was raised to Orange (the third level on a four-color scale). SENAPRED maintained the Alert Level at Yellow (the middle level on a three-color scale) for the communities of Villarrica, Pucón (16 km N), Curarrehue, and Panguipulli.
During 24-25 September there was an increase in seismic energy (observed at TR-events) and acoustic signals, characterized by 1 VT-type event, 213 LP-type events, and 124 TR-type events. Mainly white gas-and-steam emissions, in addition to occasional fine ash emissions were recorded. During the early morning of 25 September Strombolian explosions were reported and ejected material 250 m in all directions, though dominantly toward the NW. On 25 September the average value of sulfur dioxide flux was 760 t/d. Seismicity during 25-30 September consisted of five VT-type events, 1,937 LP-type events, and 456 TR-type events.
During 25-29 September moderate Strombolian activity was observed and ejected material as far as the crater rim. In addition, ash pulses lasting roughly 50 minutes were observed around 0700 and dispersed ENE. During 26-27 September a TR episode lasted 6.5 hours and was accompanied by discrete acoustic signals. Satellite images from 26 September showed a spatter cone on the crater floor with one vent that measured 10 x 14 m and a smaller vent about 35 m NE of the cone. SERNAGEOMIN reported an abundant number of bomb-sized blocks up to 150 m from the crater, as well as impact marks on the snow, which indicated explosive activity. A low-altitude ash emission was observed drifting NW around 1140 on 28 September, based on webcam images. Between 0620 and 0850 on 29 September an ash emission rose 60 m above the crater and drifted NW. During an overflight taken around 1000 on 29 September scientists observed molten material in the vent, a large accumulation of pyroclasts inside the crater, and energetic degassing, some of which contained a small amount of ash. Block-sized pyroclasts were deposited on the internal walls and near the crater, and a distal ash deposit was also visible. The average sulfur dioxide flux measured on 28 September was 344 t/d. Satellite images taken on 29 September ashfall was deposited roughly 3 km WNW from the crater and nighttime crater incandescence remained visible. The average sulfur dioxide flux value from 29 September was 199 t/d. On 30 September at 0740 a pulsating ash emission rose 1.1 km above the crater and drifted NNW (figure 126). Deposits on the S flank extended as far as 4.5 km from the crater rim, based on satellite images from 30 September.
Infrared MODIS satellite data processed by MIROVA (Middle InfraRed Observation of Volcanic Activity) showed intermittent thermal activity during April through September, with slightly stronger activity detected during late September (figure 127). Small clusters of thermal activity were detected during mid-June, early July, early August, and late September. According to the MODVOLC thermal alert system, a total of four thermal hotspots were detected on 7 July and 3 and 23 September. This activity was also intermittently captured in infrared satellite imagery on clear weather days (figure 128).
Geologic Background. The glacier-covered Villarrica stratovolcano, in the northern Lakes District of central Chile, is ~15 km south of the city of Pucon. A 2-km-wide caldera that formed about 3,500 years ago is located at the base of the presently active, dominantly basaltic to basaltic andesite cone at the NW margin of a 6-km-wide Pleistocene caldera. More than 30 scoria cones and fissure vents are present on the flanks. Plinian eruptions and pyroclastic flows that have extended up to 20 km from the volcano were produced during the Holocene. Lava flows up to 18 km long have issued from summit and flank vents. Eruptions documented since 1558 CE have consisted largely of mild-to-moderate explosive activity with occasional lava effusion. Glaciers cover 40 km2 of the volcano, and lahars have damaged towns on its flanks.
Information Contacts: Servicio Nacional de Geología y Minería (SERNAGEOMIN), Observatorio Volcanológico de Los Andes del Sur (OVDAS), Avda Sta María No. 0104, Santiago, Chile (URL: http://www.sernageomin.cl/); Proyecto Observación Villarrica Internet (POVI) (URL: http://www.povi.cl/); Sistema y Servicio Nacional de Prevención y Repuesta Ante Desastres (SENAPRED), Av. Beauchef 1671, Santiago, Chile (URL: https://web.senapred.cl/); Buenos Aires Volcanic Ash Advisory Center (VAAC), Servicio Meteorológico Nacional-Fuerza Aérea Argentina, 25 de mayo 658, Buenos Aires, Argentina (URL: http://www.smn.gov.ar/vaac/buenosaires/inicio.php); MIROVA (Middle InfraRed Observation of Volcanic Activity), a collaborative project between the Universities of Turin and Florence (Italy) supported by the Centre for Volcanic Risk of the Italian Civil Protection Department (URL: http://www.mirovaweb.it/); Hawai'i Institute of Geophysics and Planetology (HIGP) - MODVOLC Thermal Alerts System, School of Ocean and Earth Science and Technology (SOEST), Univ. of Hawai'i, 2525 Correa Road, Honolulu, HI 96822, USA (URL: http://modis.higp.hawaii.edu/); Copernicus Browser, Copernicus Data Space Ecosystem, European Space Agency (URL: https://dataspace.copernicus.eu/browser/).
Merapi (Indonesia) — October 2023 Cite this Report
Merapi
Indonesia
7.54°S, 110.446°E; summit elev. 2910 m
All times are local (unless otherwise noted)
Frequent incandescent avalanches during April-September 2023
Merapi, located just north of the major city of Yogyakarta in central Java, Indonesia, has had activity within the last 20 years characterized by pyroclastic flows and lahars accompanying growth and collapse of the steep-sided active summit lava dome. The current eruption period began in late December 2020 and has more recently consisted of ash plumes, intermittent incandescent avalanches of material, and pyroclastic flows (BGVN 48:04). This report covers activity during April through September 2023, based on information from Balai Penyelidikan dan Pengembangan Teknologi Kebencanaan Geologi (BPPTKG), the Center for Research and Development of Geological Disaster Technology, a branch of PVMBG which specifically monitors Merapi. Additional information comes from the Pusat Vulkanologi dan Mitigasi Bencana Geologi (PVMBG, also known as Indonesian Center for Volcanology and Geological Hazard Mitigation, CVGHM), MAGMA Indonesia, the Darwin Volcanic Ash Advisory Centre (VAAC), and various satellite data.
Activity during April through September 2023 primarily consisted of incandescent avalanches of material that mainly affected the SW and W flanks and traveled as far as 2.3 km from the summit (table 25) and white gas-and-steam emissions that rose 10-1,000 m above the crater.
Table 25. Monthly summary of avalanches and avalanche distances recorded at Merapi during April through September 2023. The number of reported avalanches does not include instances where possible avalanches were heard but could not be visually confirmed as a result of inclement weather. Data courtesy of BPPTKG (April-September 2023 daily reports).
| Month |
Average number of avalanches per day |
Distance avalanches traveled (m) |
| Apr 2023 |
19 |
1,200-2,000 |
| May 2023 |
22 |
500-2,000 |
| Jun 2023 |
18 |
1,200-2,000 |
| Jul 2023 |
30 |
300-2,000 |
| Aug 2023 |
25 |
400-2,300 |
| Sep 2023 |
23 |
600-2,000 |
BPPTKG reported that during April and May white gas-and-steam emissions rose 10-750 m above the crater, incandescent avalanches descended 500-2,000 m on the SW and W flanks (figure 135). Cloudy weather often prevented clear views of the summit, and sometimes avalanches could not be confirmed. According to a webcam image, a pyroclastic flow was visible on 17 April at 0531. During the week of 28 April and 4 May a pyroclastic flow was reported on the SW flank, traveling up to 2.5 km. According to a drone overflight taken on 17 May the SW lava dome volume was an estimated 2,372,800 cubic meters and the dome in the main crater was an estimated 2,337,300 cubic meters.
During June and July similar activity persisted with white gas-and-steam emissions rising 10-350 m above the crater and frequent incandescent avalanches that traveled 300-2,000 m down the SW, W, and S flanks (figure 136). Based on an analysis of aerial photos taken on 24 June the volume of the SW lava dome was approximately 2.5 million cubic meters. A pyroclastic flow was observed on 5 July that traveled 2.7 km on the SW flank. According to the Darwin VAAC multiple minor ash plumes were identified in satellite images on 19 July that rose to 3.7 km altitude and drifted S and SW. During 22, 25, and 26 July a total of 17 avalanches descended as far as 1.8 km on the S flank.
Frequent white gas-and-steam emissions continued during August and September, rising 10-450 m above the crater. Incandescent avalanches mainly affected the SW and W flanks and traveled 400-2,300 m from the vent (figure 137). An aerial survey conducted on 10 August was analyzed and reported that estimates of the SW dome volume was 2,764,300 cubic meters and the dome in the main crater was 2,369,800 cubic meters.
Frequent and moderate-power thermal activity continued throughout the reporting period, according to a MIROVA (Middle InfraRed Observation of Volcanic Activity) analysis of MODIS satellite data (figure 138). There was an increase in the number of detected anomalies during mid-May. The MODVOLC thermal algorithm recorded a total of 47 thermal hotspots: six during April, nine during May, eight during June, 15 during July, four during August, and five during September. Some of this activity was captured in infrared satellite imagery on clear weather days, sometimes accompanied by incandescent material on the SW flank (figure 139).
Geologic Background. Merapi, one of Indonesia's most active volcanoes, lies in one of the world's most densely populated areas and dominates the landscape immediately north of the major city of Yogyakarta. It is the youngest and southernmost of a volcanic chain extending NNW to Ungaran volcano. Growth of Old Merapi during the Pleistocene ended with major edifice collapse perhaps about 2,000 years ago, leaving a large arcuate scarp cutting the eroded older Batulawang volcano. Subsequent growth of the steep-sided Young Merapi edifice, its upper part unvegetated due to frequent activity, began SW of the earlier collapse scarp. Pyroclastic flows and lahars accompanying growth and collapse of the steep-sided active summit lava dome have devastated cultivated lands on the western-to-southern flanks and caused many fatalities.
Information Contacts: Balai Penyelidikan dan Pengembangan Teknologi Kebencanaan Geologi (BPPTKG), Center for Research and Development of Geological Disaster Technology (URL: http://merapi.bgl.esdm.go.id/, Twitter: @BPPTKG); MAGMA Indonesia, Kementerian Energi dan Sumber Daya Mineral (URL: https://magma.esdm.go.id/v1); Pusat Vulkanologi dan Mitigasi Bencana Geologi (PVMBG, also known as Indonesian Center for Volcanology and Geological Hazard Mitigation, CVGHM), Jalan Diponegoro 57, Bandung 40122, Indonesia (URL: http://www.vsi.esdm.go.id/); Darwin Volcanic Ash Advisory Centre (VAAC), Bureau of Meteorology, Northern Territory Regional Office, PO Box 40050, Casuarina, NT 0811, Australia (URL: http://www.bom.gov.au/info/vaac/); MIROVA (Middle InfraRed Observation of Volcanic Activity), a collaborative project between the Universities of Turin and Florence (Italy) supported by the Centre for Volcanic Risk of the Italian Civil Protection Department (URL: http://www.mirovaweb.it/); Hawai'i Institute of Geophysics and Planetology (HIGP) - MODVOLC Thermal Alerts System, School of Ocean and Earth Science and Technology (SOEST), Univ. of Hawai'i, 2525 Correa Road, Honolulu, HI 96822, USA (URL: http://modis.higp.hawaii.edu/); Copernicus Browser, Copernicus Data Space Ecosystem, European Space Agency (URL: https://dataspace.copernicus.eu/browser/); Øystein Lund Andersen (URL: https://www.oysteinlundandersen.com/, https://twitter.com/oysteinvolcano).
Ebeko
Russia
50.686°N, 156.014°E; summit elev. 1103 m
All times are local (unless otherwise noted)
Moderate explosive activity with ash plumes continued during June-November 2023
Ebeko, located on the N end of Paramushir Island in Russia’s Kuril Islands just S of the Kamchatka Peninsula, consists of three summit craters along a SSW-NNE line at the northern end of a complex of five volcanic cones. Observed eruptions date back to the late 18th century and have been characterized as small-to-moderate explosions from the summit crater, accompanied by intense fumarolic activity. The current eruptive period began in June 2022, consisting of frequent explosions, ash plumes, and thermal activity (BGVN 47:10, 48:06). This report covers similar activity during June-November 2023, based on information from the Kamchatka Volcanic Eruptions Response Team (KVERT) and satellite data.
Moderate explosive activity continued during June-November 2023 (figures 50 and 51). According to visual data from Severo-Kurilsk, explosions sent ash 2-3.5 km above the summit (3-4.5 km altitude) during most days during June through mid-September. Activity after mid-September was slightly weaker, with ash usually reaching less than 2 km above the summit. According to KVERT the volcano in October and November was, with a few exceptions, either quiet or obscured by clouds that prevented satellite observations. KVERT issued Volcano Observatory Notices for Aviation (VONA) on 8 and 12 June, 13 and 22 July, 3 and 21 August, and 31 October warning of potential aviation hazards from ash plumes drifting 3-15 km from the volcano. Based on satellite data, KVERT reported a persistent thermal anomaly whenever weather clouds permitted viewing.
Geologic Background. The flat-topped summit of the central cone of Ebeko volcano, one of the most active in the Kuril Islands, occupies the northern end of Paramushir Island. Three summit craters located along a SSW-NNE line form Ebeko volcano proper, at the northern end of a complex of five volcanic cones. Blocky lava flows extend west from Ebeko and SE from the neighboring Nezametnyi cone. The eastern part of the southern crater contains strong solfataras and a large boiling spring. The central crater is filled by a lake about 20 m deep whose shores are lined with steaming solfataras; the northern crater lies across a narrow, low barrier from the central crater and contains a small, cold crescentic lake. Historical activity, recorded since the late-18th century, has been restricted to small-to-moderate explosive eruptions from the summit craters. Intense fumarolic activity occurs in the summit craters, on the outer flanks of the cone, and in lateral explosion craters.
Information Contacts: Kamchatka Volcanic Eruptions Response Team (KVERT), Far Eastern Branch, Russian Academy of Sciences, 9 Piip Blvd., Petropavlovsk-Kamchatsky, 683006, Russia (URL: http://www.kscnet.ru/ivs/kvert/).
Search Bulletin Archive by Publication Date
Select a month and year from the drop-downs and click "Show Issue" to have that issue displayed in this tab.
The default month and year is the latest issue available.
Bulletin of the Global Volcanism Network - Volume 44, Number 03 (March 2019)
Managing Editor: Edward Venzke
Krakatau (Indonesia)
Ash plumes, ballistic ejecta, and lava extrusion during October-December; partial collapse and tsunami in late December; Surtseyan activity in December-January 2019
Kuchinoerabujima (Japan)
Weak explosions and ash plumes beginning 21 October 2018
Masaya (Nicaragua)
Lava lake persists with decreased thermal output, November 2018-February 2019
Pacaya (Guatemala)
Continuous activity from the cone in Mackenney crater; daily lava flows on the NW flank during October 2018-January 2019
Planchon-Peteroa (Chile)
New eruption begins in September 2018; continuous ash emissions and intermittent explosions December 2018-February 2019
Popocatepetl (Mexico)
Explosions with ash plumes and incandescent ejecta continue during September 2018-February 2019
Reventador (Ecuador)
Multiple daily explosions with ash plumes and incandescent blocks rolling down the flanks, October 2018-January 2019
Santa Maria (Guatemala)
Daily explosions cause steam-and-ash plumes and block avalanches, November 2018-February 2019
Stromboli (Italy)
Constant explosions from both crater areas during November 2018-February 2019
Villarrica (Chile)
Intermittent Strombolian activity ejects incandescent bombs around crater rim, September 2018-February 2019
Krakatau (Indonesia) — March 2019 Cite this Report
Krakatau
Indonesia
6.1009°S, 105.4233°E; summit elev. 285 m
All times are local (unless otherwise noted)
Ash plumes, ballistic ejecta, and lava extrusion during October-December; partial collapse and tsunami in late December; Surtseyan activity in December-January 2019
Krakatau volcano, between Java in Sumatra in the Sunda Straight of Indonesia, is known for its catastrophic collapse in 1883 that produced far-reaching pyroclastic flows, ashfall, and tsunami. The pre-1883 edifice had grown within an even older collapse caldera that formed around 535 CE, resulting in a 7-km-wide caldera and the three surrounding islands of Verlaten, Lang, and Rakata (figure 55). Eruptions that began in late December 1927 (figures 56 and 57) built the Anak Krakatau cone above sea level (Sudradjat, 1982; Simkin and Fiske, 1983). Frequent smaller eruptions since that time, over 40 short episodes consisting of ash plumes, incandescent blocks and bombs, and lava flows, constructed an island reaching 338 m elevation.
Historically there has been a lot of confusion about the name and preferred spelling of this volcano. Some have incorrectly made a distinction between the pre-1883 edifice being called "Krakatoa" and then using "Krakatau" for the current volcano. Anak Krakatau is the name of the active cone, but the overall volcano name is simply Krakatau. Simkin and Fiske (1983) explained as follows: "Krakatau was the accepted spelling for the volcano in 1883 and remains the accepted spelling in modern Indonesia. In the original manuscript copy submitted to the printers of the 1888 Royal Society Report, now in the archives of the Royal Society, this spelling has been systematically changed by a neat red line through the final 'au' and the replacement 'oa' entered above; a late policy change that, from some of the archived correspondence, saddened several contributors to the volume."
After 15 months of quiescence Krakatau began a new eruption phase on 21 June 2018, characterized by ash plumes, ballistic ejecta, Strombolian activity, and lava flows. Ash plumes reached 4.9 km and a lava flow traveled down the SE flank and entered the ocean. This report summarizes the activity from October 2018 to January 2019 based on reports by Pusat Vulkanologi dan Mitigasi Bencana Geologi (PVMBG), also known as the Indonesian Center for Volcanology and Geological Hazard Mitigation (CVGHM), MAGMA Indonesia, the National Board for Disaster Management - Badan Nasional Penanggulangan Bencana (BNPB), the Darwin Volcanic Ash Advisory Center (VAAC), satellite data, and eye witness accounts.
Activity during October-21 December 2018. The eruption continued to eject incandescent ballistic ejecta, ash plumes, and lava flows in October through December 2018. On 22 December a partial collapse of Anak Krakatau began, dramatically changing the morphology of the island and triggering a deadly tsunami that impacted coastlines around the Sunda Straight. Following the collapse the vent was located below sea level and Surtseyan activity produced steam plumes, ash plumes, and volcanic lightning.
Sentinel-2 satellite images acquired through October show incandescence in the crater, lava flows on the SW flank, and incandescent material to the S to SE of the crater (figure 58). This correlates with eyewitness accounts of explosions ejecting incandescent ballistic ejecta, and Volcano Observatory Notice for Aviation (VONA) ash plume reports. The Darwin VAAC reported ash plumes to 1.5-2.4 km altitude that drifted in multiple directions during 17-19 October, but throughout most of October visual observations were limited due to fog. A video shared by Sutopo on 24 October shows ash emission and lava fountaining producing a lava flow that entered the ocean, resulting in a white plume. Video by Richard Roscoe of Photovolcanica shows explosions ejecting incandescent blocks onto the flanks and ash plumes accompanied by volcanic lightning on 25 October.
Throughout November frequent ash plumes rose to 0.3-1.3 km altitude, with explosion durations spanning 29-212 seconds (figure 59). Observations by Øystein Lund Andersen describe explosions ejecting incandescent material with ash plumes and some associated lightning on 17 November (figure 60).
During 1-21 December intermittent explosions lasting 46-776 seconds produced ash plumes that rose up to 1 km altitude. Thermal signatures were sporadically detected by various satellite thermal infrared sensors during this time. On 22 December ash plumes reached 0.3-1.5 km through the day and continuous tremor was recorded.
Activity and events during 22-28 December 2018. The following events during the evening of the 22nd were recorded by Øystein Lund Andersen, who was photographing the eruption from the Anyer-Carita area in Java, approximately 47 km from Anak Krakatau. Starting at 1429 local time, incandescence and ash plumes were observed and the eruption could be heard as intermittent 'cannon-fire' sounds, sometimes shaking walls and windows. An increase in intensity was noted at around 1700, when the ash column increased in height and was accompanied by volcanic lightning, and eruption sounds became more frequent (figure 61). A white steam plume began to rise from the shore of the southern flank. After sunset incandescent ballistic blocks were observed impacting the flanks, with activity intensity peaking around 1830 with louder eruption sounds and a higher steam plume from the ocean (figure 62).
PVMBG recorded an eruption at 2103. When viewed at 2105 by Øystein Lund Andersen, a dark plume across the area blocked observations of Anak Krakatau and any incandescence (figure 63). At 2127-2128 the first tsunami wave hit the shore and traveled approximately 15 m inland (matching the BNPB determined time of 2127). At approximately 2131 the sound of the ocean ceased and was soon replaced by a rumbling sound and the second, larger tsunami wave impacted the area and traveled further inland, where it reached significant depths and caused extensive damage (figures 64 and 65). After the tsunami, eruption activity remained high and the eruption was heard again during intervals from 0300 through to early afternoon.
Observations on 23 December reveal steam-rich ash plumes and base surge traveling along the water, indicative of the shallow-water Surtseyan eruption (figure 66). Ashfall was reported on the 26th in several regions including Cilegon, Anyer, and Serang. The first radar observations of Krakatau were on 24 December and showed a significant removal of material from the island (figure 67). At 0600 on the 27th the volcanic alert level was increased from II to III (on a scale of I-IV) and a VONA with Aviation Color Code Red reported an ash plume to approximately 7 km altitude that dispersed to the NE. When Anak Krakatau was visible, Surtseyan activity and plumes were observed through the end of December. On 28 December, plumes reached 200-3000 m. At 0418 the eruption paused and the first observation of the post-collapse edifice was made. The estimated removed volume (above sea level) was 150-180 million m3, leaving a remaining volume of 40-70 million m3. The summit of the pre-collapse cone was 338 m, while the highest point post-collapse was reduced to 110 m. Hundreds of thousands of lightning strokes were detected during 22-28 December with varying intensity (figure 68).
Damage resulting from the 22 December tsunami. On the 29 December the damage reported by BNPB was 1,527 heavily damaged housing units, 70 with moderate damage, 181 with light damage, 78 damaged lodging and warung units, 434 damaged boats and ships and some damage to public facilities. Damage was recorded in the five regencies of Pandenglang, Serang, South Lampung, Pesawaran and Tanggamus. A BNPB report on 14 January gave the following figures: 437 fatalities, 10 people missing, 31,943 people injured, and 16,198 people evacuated (figure 69). The eruption and tsunami resulted in damage to the surrounding islands, with scouring on the Anak-Krakatau-facing slope of Rakata and damage to vegetation on Kecil island (figure 70 and 71).
Activity during January 2019. Surtseyan activity continued into January 2019. Øystein Lund Andersen observed the eruption on 4-5 January. Activity on 4 January was near-continuous. The photographs show black cock's-tail jets that rose a few hundred meters before collapsing (figure 72), accompanied by white lateral base surge that spread from the vent across the ocean (figure 73), and white steam plumes that were visible from Anyer-Carita, West Java. In the evening the ash-and-steam plume was much higher (figure 74). It was also noted that older pumice had washed ashore at this location and a coating of sulfur was present along the beach and some of the water surface. Activity decreased again on the 5th (figure 75) with a VONA reporting an ash plume to 1.5 km towards the WSW. SO2 plumes were dispersed to the NE, E, and S during this time (figure 76).
During 5-9 January intermittent explosions lasting 20 seconds to 13 minutes produced ash plumes rising up to 1.2 km and dispersing E. From 11 to 19 January white plumes were observed up to 500 m. Observations were prevented due to fog during 20-31 January. MIROVA thermal data show elevated thermal anomalies from July through January, with a decrease in energy in November through January (figure 77). The radiative power detected in December-January was the lowest since June 2018.
Morphological changes to Anak Krakatau. Images taken before and after the collapse event show changes in the shoreline, destruction of vegetation, and removal of the cone (figure 78). A TerraSAR-X image acquired on 29 January shows that in the location where the cone and active vent was, a bay had formed, opening to the W (figure 79). These changes are also visible in Sentinel-2 satellite images, with the open bay visible through light cloud cover on 29 December (figure 80).
By 9 January a rim had formed, closing off the bay to the ocean and forming a circular crater lake. Photos by James Reynolds on 11 January show a new crater rim to the W of the vent, which was filled with water (figure 81). Steam and/or gas emissions were emanating from the surface in that area. The southern lava delta surface was covered with tephra, and part of the lava delta had been removed, leaving a smooth coastline. By the time these images were taken there was already extensive erosion of the fresh deposits around the island. Fresh material extended the coast in places and filled in bays to produce a more even shoreline.
References. Simkin, T., and Fiske, R.S., 1983, Krakatau 1883: the volcanic eruption and its effects: Smithsonian Institution Press, Washington DC, 464 p. ISBN 0-87474-841-0.
Sudradjat (Sumartadipura), A., 1982. The morphological development of Anak Krakatau Volcano, Sunda Straight. Geologi Indonesia, 9(1):1-11.
Geologic Background. The renowned Krakatau (frequently mis-named as Krakatoa) volcano lies in the Sunda Strait between Java and Sumatra. Collapse of an older edifice, perhaps in 416 or 535 CE, formed a 7-km-wide caldera. Remnants of that volcano are preserved in Verlaten and Lang Islands; subsequently the Rakata, Danan, and Perbuwatan cones were formed, coalescing to create the pre-1883 Krakatau Island. Caldera collapse during the catastrophic 1883 eruption destroyed Danan and Perbuwatan, and left only a remnant of Rakata. This eruption caused more than 36,000 fatalities, most as a result of tsunamis that swept the adjacent coastlines of Sumatra and Java. Pyroclastic surges traveled 40 km across the Sunda Strait and reached the Sumatra coast. After a quiescence of less than a half century, the post-collapse cone of Anak Krakatau (Child of Krakatau) was constructed within the 1883 caldera at a point between the former Danan and Perbuwatan cones. Anak Krakatau has been the site of frequent eruptions since 1927.
Information Contacts: Badan Nasional Penanggulangan Bencana (BNPB), National Disaster Management Agency, Graha BNPB - Jl. Scout Kav.38, East Jakarta 13120, Indonesia (URL: http://www.bnpb.go.id/); Sutopo Purwo Nugroho, BNPB (Twitter: @Sutopo_PN, URL: https://twitter.com/Sutopo_PN ); Geospatial Information Authority of Japan (GSI), 1 Kitasato, Tsukuba, Ibaraki 305-0811, Japan (URL: http://www.gsi.go.jp/ENGLISH/index.html); Badan Informasi Geospasial (BIG), Jl. Raya Jakarta - Bogor KM. 46 Cibinong 16911, Indonesia (URL: http://www.big.go.id/atlas-administrasi/); NASA Goddard Space Flight Center (NASA/GSFC), Global Sulfur Dioxide Monitoring Page, Atmospheric Chemistry and Dynamics Laboratory, 8800 Greenbelt Road, Goddard, Maryland, USA (URL: https://so2.gsfc.nasa.gov/); JAXA | Japan Aerospace Exploration Agency, 7-44-1 Jindaiji Higashi-machi, Chofu-shi, Tokyo 182-8522, Japan (URL: https://global.jaxa.jp/); MIROVA (Middle InfraRed Observation of Volcanic Activity), a collaborative project between the Universities of Turin and Florence (Italy) supported by the Centre for Volcanic Risk of the Italian Civil Protection Department (URL: http://www.mirovaweb.it/); Sentinel Hub Playground (URL: https://www.sentinel-hub.com/explore/sentinel-playground); Øystein Lund Andersen (Twitter: @OysteinLAnderse, https://twitter.com/OysteinLAnderse, URL: https://www.oysteinlundandersen.com/krakatau-volcano-witnessing-the-eruption-tsunami-22december2018/); James Reynolds, Earth Uncut TV (Twitter: @EarthUncutTV, URL: https://www.earthuncut.tv/, YouTube: https://www.youtube.com/channel/UCLKYsEXfI0PGXeKYL1KV7qA); Chris Vagasky, Vaisala Inc., Louisville, Colorado, USA (URL: https://www.vaisala.com/en?type=1, Twitter: @COweatherman, URL: https://twitter.com/COweatherman).
Kuchinoerabujima (Japan) — March 2019 Cite this Report
Kuchinoerabujima
Japan
30.443°N, 130.217°E; summit elev. 657 m
All times are local (unless otherwise noted)
Weak explosions and ash plumes beginning 21 October 2018
Activity at Kuchinoerabujima is exemplified by interim explosions and periods of high seismicity. A weak explosion occurred on 3 August 2014, the first since 1980, and was followed by several others during 29 May-19 June 2015 (BGVN 42:03). This report describes events through February 2019. Information is based on monthly and annual reports from the Japan Meteorological Agency (JMA) and advisories from the Tokyo Volcanic Ash Advisory Center (VAAC). Activity has been limited to Kuchinoerabujima's Shindake Crater.
Activity during 2016-2018. According to JMA, between July 2016 and August 2018, the volcano was relatively quiet. Deflation had occurred since January 2016. On 18 April 2018 the Alert Level was lowered from 3 to 2 (on a scale of 1-5). A low-temperature thermal anomaly persisted near the W fracture in Shindake crater. During January-March 2018, both the number of volcanic earthquakes (generally numerous and typically shallow) and sulfur dioxide flux remained slightly above baselines levels in August 2014 (60-500 tons/day compared tp generally less than 100 tons/day in August 2014).
JMA reported that on 15 August 2018 a swarm of deep volcanic earthquakes was recorded, prompting an increase in the Alert Level to 4. The earthquake hypocenters were about 5 km deep, below the SW flanks of Shindake, and the maximum magnitude was 1.9. They occurred at about the same place as the swarm that occurred just before the May 2015 eruption. Sulfur dioxide emissions had increased since the beginning of August; they were 1,600, 1,000, and 1,200 tons/day on 11, 13, and 17 August, respectively. No surficial changes in gas emissions or thermal areas were observed during 16-20 August. On 29 August, JMA downgraded the Alert Level to 3, after no further SO2 flux increase had occurred in recent days and GNSS measurements had not changed.
A very weak explosion was recorded at 1831 on 21 October, with additional activity between 2110 on 21 October and 1350 on 22 October; plumes rose 200 m above the crater rim. During an overflight on 22 October, observers noted ash in the emissions, though no morphological changes to the crater nor ash deposits were seen. Based on satellite images and information from JMA, the Tokyo VAAC reported that during 24-28 October ash plumes rose to altitudes of 0.9-1.5 km and drifted in multiple directions. During a field observation on 28 October, JMA scientists did not observe any changes in the thermal anomalies at the crater.
JMA reported that during 31 October-5 November 2018, very small events released plumes that rose 500-1,200 m above the crater rim. On 6 November, crater incandescence began to be periodically visible. During 12-19 November, ash plumes rose as high as 1.2 km above the crater rim and, according to the Tokyo VAAC, drifted in multiple directions. Observers doing fieldwork on 14 and 15 November noted that thermal measurements in the crater had not changed. Intermittent explosions during 22-26 November generated plumes that rose as high as 2.1 km above the crater rim. During 28 November-3 December the plumes rose as high as 1.5 km above the rim.
JMA reported that at 1637 on 18 December an explosion produced an ash plume that rose 2 km and then disappeared into a weather cloud. The event ejected material that fell in the crater area, and generated a pyroclastic flow that traveled 1 km W and 500 m E of the crater. Another weak explosion occurred on 28 December, scattering large cinders up to 500 m from the crater.
The Tokyo VAAC did not issue any ash advisories for aviation until 21 October 2018, when it issued at least one report every day through 13 December. It also issued advisories on 18-20 and 28 December.
Activity during January-early February 2019. JMA reported that at 0919 local time on 17 January 2019 an explosion generated a pyroclastic flow that reached about 1.9 km NW and 1 km E of the crater. It was the strongest explosion since October 2018. In addition, "large cinders" fell about 1-1.8 km from the crater.
Tokyo VAAC ash advisories were issued on 1, 17, 20, and 29 January 2018. An explosion at 1713-1915 on 29 January produced an ash plume that rose 4 km above the crater rim and drifted E, along with a pyroclastic flow. Ash fell in parts of Yakushima. During 30 January-1 February and 3-5 February, white plumes rose as high as 600 m. On 2 February, an explosion at 1141-1300 generated a plume that rose 600 m. No additional activity during February was reported by JMA. The Alert Level remained at 3.
Geologic Background. A group of young stratovolcanoes forms the eastern end of the irregularly shaped island of Kuchinoerabujima in the northern Ryukyu Islands, 15 km W of Yakushima. The Furudake, Shindake, and Noikeyama cones were erupted from south to north, respectively, forming a composite cone with multiple craters. All historical eruptions have occurred from Shindake, although a lava flow from the S flank of Furudake that reached the coast has a very fresh morphology. Frequent explosive eruptions have taken place from Shindake since 1840; the largest of these was in December 1933. Several villages on the 4 x 12 km island are located within a few kilometers of the active crater and have suffered damage from eruptions.
Information Contacts: Japan Meteorological Agency (JMA), Otemachi, 1-3-4, Chiyoda-ku Tokyo 100-8122, Japan (URL: http://www.jma.go.jp/); Tokyo Volcanic Ash Advisory Center (VAAC), 1-3-4 Otemachi, Chiyoda-ku, Tokyo, Japan (URL: http://ds.data.jma.go.jp/svd/vaac/data/).
Masaya
Nicaragua
11.9844°N, 86.1688°W; summit elev. 594 m
All times are local (unless otherwise noted)
Lava lake persists with decreased thermal output, November 2018-February 2019
Nicaragua's Volcan Masaya has an intermittent lava lake that has attracted visitors since the time of the Spanish Conquistadores; tephrochronology has dated eruptions back several thousand years. The unusual basaltic caldera has had historical explosive eruptions in addition to lava flows and an actively circulating lava lake. An explosion in 2012 ejected ash to several hundred meters above the volcano, bombs as large as 60 cm fell around the crater, and ash fell to a thickness of 2 mm in some areas of the park. The reemergence of the lava lake inside Santiago crater was reported in December 2015. By late March 2016 the lava lake had grown and intensified enough to generate a significant thermal anomaly signature which has varied in strength but continued at a moderate level into early 2019. Information for this report, which covers the period from November 2018 through February 2019, is provided by the Instituto Nicareguense de Estudios Territoriales (INETER) and satellite -based imagery and thermal data.
The lava lake in Santiago Crater remained visible and active throughout November 2018 to February 2019 with little change from the previous few months (figure 70). Seismic amplitude RSAM values remained steady, oscillating between 10 and 40 RSAM units during the period.
Every few months INETER carries out SO2 measurements by making a transect using a mobile DOAS spectrometer that samples for gases downwind of the volcano. Transects were done on 9-10 October 2018, 21-24 January 2019, and 18-21 February 2019 (figure 71). Average values during the October transect were 1,454 tons per day, in January they were 1,007 tons per day, and in February they averaged 1,318 tons per day, all within a typical range of values for the last several months.
During a visit by INETER technicians in early November 2018, the lens of the Mirador 1 webcam, that had water inside it and had been damaged by gases, was cleaned and repaired. During 21-24 January 2019 INETER made a site visit with scientists from the University of Johannes Gutenberg in Mainz, Germany, to measure halogen species in gas plumes, and to test different sampling techniques for volcanic gases, including through spectroscopic observations with DOAS equipment, in-situ gas sampling (MultiGAS, denuders, alkaline traps), and using a Quadcopter UAV (drone) sampling system.
Periodic measurements of CO2 from the El Comalito crater have been taken by INETER for many years. The most recent observations on 19 February 2019 indicated an emission rate of 46 ± 3 tons per day of CO2, only slightly higher than the average value over 16 measurements between 2008 and 2019 (figure 72).
Satellite imagery (figure 73) and in-situ thermal measurements during November 2018-February 2019 indicated constant activity at the lava lake and no significant changes during the period. On 14 January 2019 temperatures were measured with the FLIR SC620 thermal camera, along with visual observations of the crater; abundant gas was noted, and no explosions from the lake were heard. The temperature at the lava lake was measured at 107°C, much cooler than the 340°C measured in September 2018 (figure 74).
Thermal anomaly data from satellite instruments also confirmed moderate levels of ongoing thermal activity. The MIROVA project plot indicated activity throughout the period (figure 75), and a plot of the number of MODVOLC thermal alerts by month since the lava lake first appeared in December 2015 suggests constant activity at a reduced thermal output level from the higher values in early 2017 (figure 76).
Geologic Background. Masaya volcano in Nicaragua has erupted frequently since the time of the Spanish Conquistadors, when an active lava lake prompted attempts to extract the volcano's molten "gold" until it was found to be basalt rock upon cooling. It lies within the massive Pleistocene Las Sierras caldera and is itself a broad, 6 x 11 km basaltic caldera with steep-sided walls up to 300 m high. The caldera is filled on its NW end by more than a dozen vents that erupted along a circular, 4-km-diameter fracture system. The Nindirí and Masaya cones, the source of observed eruptions, were constructed at the southern end of the fracture system and contain multiple summit craters, including the currently active Santiago crater. A major basaltic Plinian tephra erupted from Masaya about 6,500 years ago. Recent lava flows cover much of the caldera floor and there is a lake at the far eastern end. A lava flow from the 1670 eruption overtopped the north caldera rim. Periods of long-term vigorous gas emission at roughly quarter-century intervals have caused health hazards and crop damage.
Information Contacts: Instituto Nicaragüense de Estudios Territoriales (INETER), Apartado Postal 2110, Managua, Nicaragua (URL: http://www.ineter.gob.ni/); MIROVA (Middle InfraRed Observation of Volcanic Activity), a collaborative project between the Universities of Turin and Florence (Italy) supported by the Centre for Volcanic Risk of the Italian Civil Protection Department (URL: http://www.mirovaweb.it/); Hawai'i Institute of Geophysics and Planetology (HIGP) - MODVOLC Thermal Alerts System, School of Ocean and Earth Science and Technology (SOEST), Univ. of Hawai'i, 2525 Correa Road, Honolulu, HI 96822, USA (URL: http://modis.higp.hawaii.edu/); Sentinel Hub Playground (URL: https://www.sentinel-hub.com/explore/sentinel-playground); Alun Ebenezer (Twitter: @AlunEbenezer, URL: https://twitter.com/AlunEbenezer).
Pacaya
Guatemala
14.382°N, 90.601°W; summit elev. 2569 m
All times are local (unless otherwise noted)
Continuous activity from the cone in Mackenney crater; daily lava flows on the NW flank during October 2018-January 2019
Extensive lava flows, bomb-laden Strombolian explosions, and ash plumes emerging from MacKenney crater have characterized the persistent activity at Pacaya since 1961. The latest eruptive episode began with intermittent ash plumes and incandescence in June 2015; the growth of a new pyroclastic cone inside the summit crater was confirmed in mid-December 2015. The pyroclastic cone has continued to grow, rising above the crater rim in late 2017 and sending numerous flows down the flanks of the crater throughout 2018 (BGVN 43:11). Similar activity continued during October 2018-January 2019, covered in this report, with information provided primarily by Guatemala's Instituto Nacional de Sismologia, Vulcanologia, Meteorologia e Hydrologia (INSIVUMEH).
There were few variations in the eruptive activity at Pacaya during October 2018-January 2019. Virtually constant Strombolian activity from the summit of the pyroclastic cone within Mackenney crater produced ejecta that rose 5-30 m daily. Periods of increased activity occasionally increased the height of the ejecta to 50 m. Lava flows descended the NW flank of Mackenney cone towards Cerro Chino crater, usually one or two a day, sometimes three or four. They travelled 50-300 m down the flank; the longest reached 600 m in mid-October and 500 m at the end of January. Steam and gas plumes persisted from the summit; a single VAAC report mentioned dilute ash in mid-October. Plumes generally rose a few hundred meters above the summit, occasionally reaching 700-800 m. Incandescent avalanche blocks at the heads of the flows were sometimes as large as a meter in diameter and traveled far down the flanks.
Constant Strombolian activity during October 2018 from the pyroclastic cone within Mackenney crater was ejected up to 30 m above the summit of the cone throughout the month, with occasional more intense episodes rising 50 m. Lava flows were reported daily by INSIVUMEH on the NW flank from 50 to 300 m long. White and blue gas-and-steam emissions generally rose a few hundred meters from the summit of the pyroclastic cone and usually drifted S or N. The highest rose 800 m on 26 and 27 October. In a special report issued late on 12 October INSIVUMEH noted that seismicity had increased during the day; Strombolian explosions also increased and ejected material 25-50 m above the summit, producing block avalanches in the vicinity of the flows (figure 103). The cone within Mackenney crater continued to grow, reaching 75 m above the rim and nearly filling the crater at its base. According to the Washington VAAC, on 14 October a pilot reported minor ash emissions moving W at an estimated 650 m above the summit. Multi-spectral imagery showed a faint ash plume moving W at 3.4 km altitude, and a well-defined hotspot was seen in short-wave infrared imagery.
Similar activity persisted throughout November 2018 (figures 104 and 105). The Strombolian activity usually rose 5-30 m high; on 24 November INSIVUMEH reported ejecta 75 m high and the presence of four lava flows on the NW flank that traveled distances ranging from 50 to 200 m. Steam-and-gas emissions rose no more than 500 m above the summit. On 24 and 28 November incandescent avalanche blocks were observed at the fronts of the lava flows.
During December 2018, continuous Strombolian activity was observed 25 m high. Incandescent avalanche blocks were noted at the fronts of the lava flows more frequently than in previous months. One to three lava flows extending 50-300 m down the NW flank towards Cerro Chino were reported every day that the flanks were visible (figure 106). Late on 13 December INSIVUMEH released a special bulletin noting that explosions were heard as far as 8 km from Mackenney crater, and Strombolian activity rose 25-50 m. Constant tremor activity had been produced from the ongoing lava flows descending the flank; the incandescent avalanche blocks up to 1 m in diameter were falling from the front of the flows. By the end of December, the growing pyroclastic cone had filled the inside of Mackenney crater, reaching 75-100 m above the crater rim. In a special information report on 28 December, INSIVUMEH noted that changes in the eruptive patterns included an increase in seismic tremor along with more persistent and higher energy Strombolian activity from the active cone, which frequently sent material outside of the crater onto the flanks.
There were no significant changes in activity during January 2019. Constant Strombolian activity rose 5-30 m above the summit; INSIVUMEH reported the height at 50 m on 7 January. Large incandescent avalanche blocks were noted at the front of the lava flows several times; one or two flows daily reached lengths of 100-300 m. The flow reported on 29 January reached 500 m, traveling down the NW flank towards Cerro Chino. Steam plumes, sometimes with bluish gas, rose generally to around 100 m above the summit, occasionally higher. Growth and destruction of the pyroclastic cone inside Mackenney crater continued as it had for the previous several months. The persistent Strombolian and lava flow activity was responsible for a strong thermal signature recorded in satellite data and plotted by the MIROVA project during the period (figure 107).
Geologic Background. Eruptions from Pacaya are frequently visible from Guatemala City, the nation's capital. This complex basaltic volcano was constructed just outside the southern topographic rim of the 14 x 16 km Pleistocene Amatitlán caldera. A cluster of dacitic lava domes occupies the southern caldera floor. The post-caldera Pacaya massif includes the older Pacaya Viejo and Cerro Grande stratovolcanoes and the currently active Mackenney stratovolcano. Collapse of Pacaya Viejo between 600 and 1,500 years ago produced a debris-avalanche deposit that extends 25 km onto the Pacific coastal plain and left an arcuate scarp inside which the modern Pacaya volcano (Mackenney cone) grew. The NW-flank Cerro Chino crater was last active in the 19th century. During the past several decades, activity has consisted of frequent Strombolian eruptions with intermittent lava flow extrusion that has partially filled in the caldera moat and covered the flanks of Mackenney cone, punctuated by occasional larger explosive eruptions that partially destroy the summit.
Information Contacts: Instituto Nacional de Sismologia, Vulcanologia, Meteorologia e Hydrologia (INSIVUMEH), Unit of Volcanology, Geologic Department of Investigation and Services, 7a Av. 14-57, Zona 13, Guatemala City, Guatemala (URL: http://www.insivumeh.gob.gt/); Coordinadora Nacional para la Reducción de Desastres (CONRED), Av. Hincapié 21-72, Zona 13, Guatemala City, Guatemala (URL: http://conred.gob.gt/www/index.php); MIROVA (Middle InfraRed Observation of Volcanic Activity), a collaborative project between the Universities of Turin and Florence (Italy) supported by the Centre for Volcanic Risk of the Italian Civil Protection Department (URL: http://www.mirovaweb.it/); Carlos Barrios (Twitter: @shekano, URL: https://twitter.com/shekano).
Planchon-Peteroa (Chile) — March 2019 Cite this Report
Planchon-Peteroa
Chile
35.223°S, 70.568°W; summit elev. 3977 m
All times are local (unless otherwise noted)
New eruption begins in September 2018; continuous ash emissions and intermittent explosions December 2018-February 2019
Planchón-Peteroa, a large basaltic to dacitic volcanic complex, lies on the remote Chile-Argentina border roughly 200 km S of Santiago, Chile. Its intermittent eruptive history has been characterized by short-lived explosive events with gas and ash plumes from active craters around the Volcán Peteroa area (figure 10). The most recent eruption, from February-June 2011, was a series of sporadic ash and gas plumes which rose as high as 5.5 km altitude and produced ashfall as far as 70 km away (BGVN 38:11). After seven years of little surface activity, a new series of ash emissions and explosive activity began in September 2018; a major seismic swarm in 2016 did not result in surface activity. Information for this report, covering through February 2019, was provided primarily by Servicio Nacional de Geología y Minería (SERNAGEOMIN), Observatorio Volcanológico de Los Andes del Sur (OVDAS) and the Buenos Aires Volcanic Ash Advisory Center (VAAC).
Planchón-Peteroa remained quiet during 2014 and 2015. A significant seismic swarm during 2016 led SERNAGEOMIN to raise the alert level for nearly the entire year, although no surface eruptive activity took place. A smaller seismic event in 2017 also did not include surface activity. Increased emissions that included particulate material were first reported in September 2018; the first explosions with ash took place in early November 2018. Persistent emissions with dense plumes of ash began in mid-December and continued through February 2019; intermittent pulses and explosions during that time coincided with increased seismic and thermal activity.
Activity during 2014-2015. Background levels of volcano-tectonic (VT) and long-period (LP) earthquakes were reported by SERNAGEOMIN throughout 2014 and 2015. A single seismic event greater than M 3.0 was reported on 11 May 2014, located within 1 km of the crater. Inclinometer, SO2, and thermal data all indicated no significant changes during the period. During March-July 2015 sporadic fumaroles were observed rising less than 200 m from the active crater.
Activity during 2016. An increase in LP seismic events from a few to several hundred per month was noted by SERNAGEOMIN beginning in January 2016. As a result, they increased the Alert Level of the volcano from Green to Yellow on 22 January. The webcam revealed degassing of mainly water vapor reaching close to 200 m above the active crater. During the first two weeks of February 2016 the number of LP events increased ten-fold from 328 in January to 3,634; all the events were smaller than M 1.1. The rate of LP seismicity increased further during the last two weeks of February to 7,301 events, and the steam plumes reached 400 m above the crater. LP seismicity remained high during March with 9,627 measured events; similar numbers of events were sustained through May 2016 (figure 11).
LP seismicity decreased substantially to only 470 events during the first two weeks of June 2016, leading SERNAGEOMIN to reduce the Alert Level to Green. However, during the second half of June a spike in the VT events from 8 during the first half of the month to 944 caused authorities to raise the Alert Level back to Yellow. This increase in VT seismic events was also accompanied by an increase in the number and spectral frequency of the LP events. They changed from having dominant frequencies between 1.9 and 2 Hz to 4-5 Hz, with a location that moved closer to the crater zone than before, and occurred at depths of around 1.5 km. On 28 June a M 3.4 VT event occurred 4.3 km NNE of the crater at a depth of 4.8 km. LP events numbered between 2,100 and 4,100 events monthly during June-September.
VT seismic events increased to their highest levels of 2016 during July (4,609 events) before beginning a gradual decline through the end of the year, ending with about 700 events in December (figure 11). A strong steam plume rose 550 m above the crater on 4 July 2016 and was accompanied by 400 VT events. The number of LP events increased significantly for the second time during the year beginning in October and remained over 14,000 events through January 2017. Three seismic events with local magnitude (ML) greater than M 3.0 were recorded on 7, 12, and 16 October; the locations of the events were approximately 3 km NNW at an average depth of 5 km. A M 3.4 event was recorded on 19 November. Low-level steam plumes did not rise more than 200 m above the crater for the remainder of the year. SERNAGEOMIN installed two new seismic stations, on 29 November and 15 December 2016.
Activity during 2017. Levels of both VT and LP seismic events declined during January-May 2017. A M 3.5 VT earthquake on 19 February was located 3.7 km NNW of the crater and 4.5 km deep. On 28 March, a M 3.6 event occurred in a similar location. Steam plumes occasionally rose as high as 200 m during the period. SERNAGEOMIN lowered the Alert Level to Green on 17 May 2017 based on the gradual decrease in seismicity to baseline levels accompanied by little to no surface activity.
A seismic swarm of 39 events on 15 June was located 14 km SE and 8-10 km deep. VT seismic events during the first half of July 2017 were located 4-7 km deep under the summit craters and included a M 4.0 event on 8 July. An increase in both VT and LP seismicity in early July led SERNAGEOMIN to raise the Alert Level to Yellow on 10 July (figure 11). The monthly number of VT events dropped below 100 in August and remained low for the rest of the year. A M 3.5 VT event was reported on 5 November, located 6.5 km E and 6 km deep. On 14 November seismometers recorded a 30-minute tremor event. A brief increase in degassing began on 23 November; steam plumes reached 600 m the next day but returned to less than 150 m by the end of the month. SERNAGEOMIN lowered the Alert Level to Green in mid-December 2017 as a result of decreased surface and seismic activity.
Activity during 2018. Low levels of surface and seismic activity persisted into early June 2018. Steam plumes rose no more than 500 m above the crater, numbers of VT events remained low, and the numbers of LP events decreased steadily. In mid-May the amplitude of continuous tremor events began to increase. The frequency of the tremor events had been around 1-2 Hz earlier in the year, but beginning on 21 June they increased to around 5 Hz; this was accompanied by an oscillating amplitude seismic signal referred to as "banded tremor." SERNAGEOMIN interpreted the increase in amplitude and the banded tremor as an indication of increased heat in the system, and as a result raised the Alert Level to Yellow on 6 July 2018. The number of LP seismic events increased steadily beginning in June, along with the amplitude of the seismic events, although there were no apparent changes in surface activity (figure 12). Weak thermal anomalies were first detected in satellite data in mid-August. SERNAGEOMIN noted that the locations of the seismic events were migrating closer to the crater, and the depths were shallowing from June to August 2018.
SERNAGEOMIN first reported the presence of particulate material in the persistent degassing from the active crater on 21 September 2018, noting that the degassing steam turned "slightly gray" but plumes did not rise more than 600 m above the crater. Mostly-white emissions continued during October, although they specifically mentioned emissions of low-intensity particulate material observed during 13-15 October, rising 600 m above the crater. Three MIROVA thermal alerts appeared on 14 October, the first over 1 MW to be recorded (figure 13). During the second half of October, SERNAGEOMIN noted persistent mostly-white degassing in the webcam that rose up to 700 m above the crater. They also reported webcam images in the second half of October that showed ash emissions rising a short distance above the crater, generally drifting SE, although they did not specify certain dates
SERNAGEOMIN reported an explosion with an ash emission visible in the webcam on 7 November 2018; they reported the plume height at about 1,000 m above the crater (figure 14). The Buenos Aires VAAC reported the ash plume drifting SE visible in satellite imagery at 4.3 km altitude. Low-altitude ash emissions were observed in the webcam multiple additional times during November. In a special report issued on 7 December, SERNAGEOMIN reported a 1,300-m-high ash emission that dispersed ESE. The Buenos Aires VAAC reported continuous ash emissions beginning on 14 December that lasted through the rest of the month (figure 15).
Plumes generally drifted SE at 4.6-4.9 km altitude during December, with occasional stronger puffs that were reported as high as 5.8 km altitude (figure 16). On 16 December the webcam recorded high-intensity pulsating ash emissions that drifted 20 km SE. Incandescence was visible around the crater that night. Webcam images showed dark gray plumes during the second half of December, suggesting a high concentration of ash; the pulsating nature of the emissions was observed in the webcam again during 24-27 December, reaching 1,600 m above the crater. Multiple thermal alerts were reported during the second half of the month.
Activity during January-February 2019. Dense ash plumes were reported daily during January and February 2019 by both SERNAGEOMIN and the Buenos Aires VAAC; plumes heights were generally between 400 m and 1 km above the active crater (figure 17). Higher plumes that reached 2 km above the crater and drifted E were reported on 1 and 3 February (figure 18). SERNAGEOMIN noted that the first of these events was accompanied by an increase in very low frequency seismic activity (VLP).
Satellite-based SO2 instruments also detected a significant gas plume on 3 February (figure 19). SERNAGEOMIN reported a tremor signal on 14 February 2019 associated with a dense ash plume that rose to 2 km above the summit and drifted NE. Webcam images during the second half of February showed constant degassing; gray plumes drifted mostly SE about 2 km above the summit (figure 20).
Geologic Background. Planchón-Peteroa is an elongated complex volcano along the Chile-Argentina border with several overlapping calderas. Activity began in the Pleistocene with construction of the basaltic andesite to dacitic Volcán Azufre, followed by formation of the basaltic and basaltic andesite Volcán Planchón, 6 km N. About 11,500 years ago much of Azufre and part of Planchón collapsed, forming the massive Río Teno debris avalanche, which traveled 95 km to reach Chile's Central Valley. Subsequently, Volcán Planchón II was formed. The youngest volcano, andesitic and basaltic andesite Volcán Peteroa, consists of scattered vents between Azufre and Planchón, and and contains a small steaming crater lake. Reported eruptions from the complex have been dominantly explosive, although lava flows were emplaced in 1837 and 1937.
Information Contacts: Servicio Nacional de Geología y Minería (SERNAGEOMIN), Observatorio Volcanológico de Los Andes del Sur (OVDAS), Avda Sta María No. 0104, Santiago, Chile (URL: http://www.sernageomin.cl/); Buenos Aires Volcanic Ash Advisory Center (VAAC), Servicio Meteorológico Nacional-Fuerza Aérea Argentina, 25 de mayo 658, Buenos Aires, Argentina (URL: http://www.smn.gov.ar/vaac/buenosaires/inicio.php); MIROVA (Middle InfraRed Observation of Volcanic Activity), a collaborative project between the Universities of Turin and Florence (Italy) supported by the Centre for Volcanic Risk of the Italian Civil Protection Department (URL: http://www.mirovaweb.it/); NASA Goddard Space Flight Center (NASA/GSFC), Global Sulfur Dioxide Monitoring Page, Atmospheric Chemistry and Dynamics Laboratory, 8800 Greenbelt Road, Goddard, Maryland, USA (URL: https://so2.gsfc.nasa.gov/); Servicio Geológico Minero Argentino (SEGEMAR), Av. General Paz 5445 (colectora), Parque Tecnológico Miguelete, Edificio 14 y Edificio 25, San Martín (B1650 WAB) (URL: http://www.segemar.gov.ar/); Sentinel Hub Playground (URL: https://www.sentinel-hub.com/explore/sentinel-playground); Cumbres y Montañas de O'Higgins (URL: https://www.facebook.com/cymohiggins/); Volcanes de Chile (URL: https://www.volcanesdechile.net/, Twitter: @volcanesdechile); Felipe Aguilera Volcanes (Twitter: @FelipeVolcanes, URL: https://twitter.com/FelipeVolcanes).
Popocatepetl (Mexico) — March 2019 Cite this Report
Popocatepetl
Mexico
19.023°N, 98.622°W; summit elev. 5393 m
All times are local (unless otherwise noted)
Explosions with ash plumes and incandescent ejecta continue during September 2018-February 2019
Frequent historical eruptions have been reported from Mexico's Popocatépetl going back to the 14th century. Activity increased in the mid-1990s after about 50 years of quiescence, and the current eruption, ongoing since January 2005, has included numerous episodes of lava-dome growth and destruction within the 500-m-wide summit caldera. Multiple emissions of steam and gas occur daily, rising generally 1-3 km above the 5.4-km-elevation summit; many contain small amounts of ash. Larger, more explosive events with ash plumes and incandescent ejecta landing on the flanks usually occur several times every week.
Activity through August 2018 was typical of the ongoing eruption with near-constant emissions of water vapor, gas, and minor ash, as well as multiple explosions every week with ash-plumes and incandescent blocks scattered on the flanks (BGVN 43:11). This report covers similar activity from September 2018 through February 2019. Information about Popocatépetl comes from daily reports provided by México's Centro Nacional de Prevención de Desastres (CENAPRED); ash emissions are also reported by the Washington Volcanic Ash Advisory Center (VAAC). Satellite visible and thermal imagery and SO2 data also provide helpful observations of activity.
Near-constant emissions of steam and gas, often with minor ash content, were typical activity throughout September 2018-February 2019. Intermittent larger explosions with plumes of moderate ash content that generated ashfall in nearby communities were reported each month except November. Periods with increased explosive activity that consisted of multiple daily explosions included all of September into early October, early December 2018, and the second half of February 2019 (figure 116). Increased observations of incandescence at the summit generally coincided with increases in explosive activity. Increases in thermal anomalies measured by the MIROVA project during this time also correlated with times of increased explosive activity as reported by CENAPRED (figure 117).
Activity during September 2018. Multiple explosions with ash plumes were reported nearly every day in September (figure 118). The Washington VAAC reported an ash plume visible in satellite imagery 15 km NW of the summit at 7.6 km altitude on 4 September. Most plumes reported by the VAAC during the month rose to 6.1-7.6 km and drifted up to 40 km in multiple directions. Two small episodes of ash emissions with tremor on 16 September were followed the next day by a series of emissions, explosions, and tremor that lasted for over six hours; incandescent blocks were visible on the flanks in the early morning. An increase in activity late on 18 September produced Strombolian eruptions that lasted for nearly eight hours along with ash emissions and incandescent blocks on the flanks. A plume on 19 September still had detectable ash 150 km NE of the summit; a smaller plume drifting E was responsible for ashfall reported in Tlaxcala.
Discrete puffs of ash were observed by the Washington VAAC on 20 September moving WSW extending around 200 km from the summit. Three explosions on 21 September ejected incandescent blocks onto the NE flank. During an overflight on 21 September, CENAPRED observed dome number 80, partly destroyed by the recent explosions (figure 119). The Washington VAAC reported an ash plume at 8.8 km altitude on 21 September 30 km WSW from the summit. Ashfall was reported by CENACOM (Mexican National Communications Center) on 29 September in Atlautla, Tehuixtitlan, and Cuecuecuautitla in the State of Mexico, and in the Tláhuac Delegation, Iztapalapa, and Xochimilco in Mexico City.
Activity during October and November 2018. The Washington VAAC reported an ash plume at 7 km altitude on 2 October, 35 km W of the summit. Numerous smaller plumes were reported by the VAAC during both months at about 6 km altitude drifting in multiple directions. Two larger explosions on 8 October produced ash plumes that rose to 3.5 and 2.4 km, respectively, above the summit, and drifted NE (figure 120). As a result, ashfall was reported at the Puebla airport. On 10 and 12 October, extended periods of LP tremor were accompanied by gas emissions, but otherwise lower levels of activity were noted for much of the month. An ash plume extended over 80 km NE at 7.6 km altitude on 10 November. An explosion on 13 November produced incandescent fragments on the flanks. During 19-21 November episodes of LP seismicity and tremors produced gas and ash emissions; some of the episodes lasted for as long as 13 hours; incandescent fragments were observed on the upper slopes during the more intense periods. On 22 November scientists on an overflight by CENAPRED observed dome 81 with a diameter of 175 m and an estimated depth of 30 m (figure 121).
Activity during December 2018. Increased ash emissions were reported in early December 2018, producing ash plumes that rose at least 1 km above the crater and drifted mostly E; incandescent blocks ejected on 5 December fell mostly back into the crater. Multiple explosions on 6 and 7 December produced ash plumes that rose as high as 2.5 km above the crater and resulted in ashfall in Amecameca and Tlalmanalco; they also produced incandescent blocks that traveled as far at 2.5 km from the crater, according to CENAPRED. An explosion on 9 December produced a 2-km-high ash plume that drifted NE (figure 122). Satellite images captured during clear skies on 18 December showed incandescence at the dome inside the summit crater, and dark ash and ejecta covering much of the upper flanks (figure 123). An ash plume was centered about 100 km NE of the summit on 24 December at 7.6 km altitude, and dissipating rapidly, according to the Washington VAAC. Incandescent blocks were ejected onto the flanks on 26 December during an evening explosion.
Activity during January 2019. An explosion in the early morning of 16 January 2019 produced incandescent blocks that traveled 1.5 km down the slopes. It also produced an ash emission that lasted for 25 minutes; the seismic signal associated with the event was a mixture of harmonic tremor and high-frequency low-amplitude earthquakes. In the first minutes the height of the column reached 1,000 m above the crater, later it decreased to 500 m; ash was dispersed ENE. Late on 22 January a large explosion produced an ash plume that rose 3.5 km above the crater and numerous incandescent blocks that were observed as far as 2 km from the summit (figure 124); ashfall was reported in Santa Isabel Cholula, Santa Ana Xalmimilulco, Domingo Arenas, San Martin Texmelucan, Tlalancaleca, San Salvador el Verde, San Andres Calpan, San Nicolás de los Ranchos, and Huejotzingo, all in the state of Puebla. A large discrete ash plume was observed in satellite imagery by the Washington VAAC on 24 January at 6.7 km altitude moving NE to about 35 km distance before dissipating. In an overflight on 27 January CENAPRED noted that the internal crater remained about 300 m wide and 150 m deep, and no dome was visible (figure 125).
Activity during February 2019. Several days of increased activity of harmonic tremor and explosions were reported during 14-19 February 2019 (figure 126). Incandescent blocks from Strombolian activity appeared on the flanks late on 14 February traveling as far as 1.5 km, along with a continuous stream of ash and gas that drifted SW for seven hours. The initial ash plume rose 800 m, but by early the next day had risen to 2 km. Ashfall was reported in the communities of Hueyapan, Tetela del Volcán, Zacualpan, Temoac, Jantetelco, Cuautla, Ocuituco, and Yecapixtla, in the state of Morelos, and in Tochimilco, Puebla, on 15 February.
A new episode of Strombolian activity early on 16 February lasted for six hours and produced 2-km-high ash plumes that drifted SE. Later that afternoon, a new harmonic tremor episode, again lasting about six hours, was accompanied by water vapor and gas emissions that drifted NE and incandescent blocks ejected 400 m down the flanks. A Sentinel-2 satellite image that day recorded a significant thermal signature from the summit dome (figure 127).
Satellite instruments recorded a strong SO2 signature from the volcano during 15-18 February (figure 128). Multi-hour periods of harmonic tremor were recorded during 17-19 February, accompanied by gas-and-ash emissions. Ash plume heights were between 1 and 2 km above the crater, and minor ashfall was reported in Tlaxco and Xalostoc in Nativitas, and Hueyotlipan, Amaxac de Guerrero, Tepetitla de Lardizábal, and Texoloc in Tlaxcala, on 18 February. Two overflights on 18 and 19 February confirmed the formation of dome 82 inside the summit crater, estimated to be 200 m in diameter (figure 129).
Geologic Background. Volcán Popocatépetl, whose name is the Aztec word for smoking mountain, rises 70 km SE of Mexico City to form North America's 2nd-highest volcano. The glacier-clad stratovolcano contains a steep-walled, 400 x 600 m wide crater. The generally symmetrical volcano is modified by the sharp-peaked Ventorrillo on the NW, a remnant of an earlier volcano. At least three previous major cones were destroyed by gravitational failure during the Pleistocene, producing massive debris-avalanche deposits covering broad areas to the south. The modern volcano was constructed south of the late-Pleistocene to Holocene El Fraile cone. Three major Plinian eruptions, the most recent of which took place about 800 CE, have occurred since the mid-Holocene, accompanied by pyroclastic flows and voluminous lahars that swept basins below the volcano. Frequent historical eruptions, first recorded in Aztec codices, have occurred since Pre-Columbian time.
Information Contacts: Centro Nacional de Prevención de Desastres (CENAPRED), Av. Delfín Madrigal No.665. Coyoacan, México D.F. 04360, México (URL: http://www.cenapred.unam.mx/); Washington Volcanic Ash Advisory Center (VAAC), Satellite Analysis Branch (SAB), NOAA/NESDIS OSPO, NOAA Science Center Room 401, 5200 Auth Rd, Camp Springs, MD 20746, USA (URL: www.ospo.noaa.gov/Products/atmosphere/vaac, archive at: http://www.ssd.noaa.gov/VAAC/archive.html); MIROVA (Middle InfraRed Observation of Volcanic Activity), a collaborative project between the Universities of Turin and Florence (Italy) supported by the Centre for Volcanic Risk of the Italian Civil Protection Department (URL: http://www.mirovaweb.it/); Sentinel Hub Playground (URL: https://www.sentinel-hub.com/explore/sentinel-playground); Global Sulfur Dioxide Monitoring Page, Atmospheric Chemistry and Dynamics Laboratory, NASA Goddard Space Flight Center (NASA/GSFC), 8800 Greenbelt Road, Goddard, Maryland, USA (URL: https://so2.gsfc.nasa.gov/).
Reventador (Ecuador) — March 2019 Cite this Report
Reventador
Ecuador
0.077°S, 77.656°W; summit elev. 3562 m
All times are local (unless otherwise noted)
Multiple daily explosions with ash plumes and incandescent blocks rolling down the flanks, October 2018-January 2019
The andesitic Volcán El Reventador lies well east of the main volcanic axis of the Cordillera Real in Ecuador and has historical eruptions with numerous lava flows and explosive events going back to the 16th century. The eruption in November 2002 generated a 17-km-high eruption cloud, pyroclastic flows that traveled 8 km, and several lava flows. Eruptive activity has been continuous since 2008. Daily explosions with ash emissions and ejecta of incandescent blocks rolling hundreds of meters down the flanks have been typical for many years. Activity continued during October 2018-January 2019, the period covered in this report, with information provided by Ecuador's Instituto Geofisico (IG-EPN), the Washington Volcano Ash Advisory Center (VAAC), and infrared satellite data.
Multiple daily reports were issued from the Washington VAAC throughout the entire October 2018-January 2019 period. Plumes of ash and gas usually rose to altitudes of 4.3-6.1 km and drifted about 20 km in prevailing wind directions before either dissipating or being obscured by meteoric clouds. The average number of daily explosions reported by IG-EPN for the second half of 2018 was more than 20 per day (figure 104). The many explosions during the period originated from multiple vents within a large scarp that formed on the W flank in mid-April (BGVN 43:11, figure 95) (figure 105). Incandescent blocks were observed often in the IG webcams; they traveled 400-1,000 m down the flanks.
Activity during October 2018-January 2019. During most days of October 2018 plumes of gas, steam, and ash rose over 1,000 m above the summit of Reventador, and most commonly drifted W or NW. Incandescence was observed on all nights that were not cloudy; incandescent blocks rolled 400-800 m down the flanks during half of the nights. During episodes of increased activity, ash plumes rose over 1,200 m (8, 10-11, 18-19 October) and incandescent blocks rolled down multiple flanks (figure 106).
Similar activity continued during November. IG reported 17 days of the month with steam, gas, and ash emissions rising more than 1,000 m above the summit. The other days were either cloudy or had emissions rising between 500 and 1,000 m. Incandescent blocks were usually observed on the S or SE flanks, generally travelling 400-600 m down the flanks. The Washington VAAC reported a discrete ash plume at 6.1 km altitude drifting WNW about 35 km from the summit on 15 November. The next day, intermittent puffs were noted moving W, and a bright hotspot at the summit was visible in satellite imagery. During the most intense activity of the month, incandescent blocks traveled 800 m down all the flanks (17-19 November) and ash plumes rose over 1,200 m (23 November) (figure 107).
Steam, gas, and ash plumes rose over 1,200 m above the summit on 1 December. The next day, there were reports of ashfall in San Rafael and Hosteria El Hotelito, where they reported an ash layer about 1 mm thick was deposited on vehicles during the night. Ash emissions exceeded 1,200 m above the summit on 5 and 6 December as well. Incandescent blocks traveled 800 m down all the flanks on 11, 22, 24, and 26 December, and reached 900 m on 21 December. Ash emissions rising 500 to over 1,000 m above the summit were a daily occurrence, and incandescent blocks descended 500 m or more down the flanks most days during the second half of the month (figure 108).
During the first few days of January 2019 the ash and steam plumes did not rise over 800 m, and incandescent blocks were noted 300-500 m down the S flank. An increase in activity on 6 January sent ash-and-gas plumes over 1,000 m, drifting W, and incandescent blocks 1,000 m down many flanks. For multiple days in the middle of the month the volcano was completely obscured by clouds; only occasional observations of plumes of ash and steam were made, incandescence seen at night through the clouds confirmed ongoing activity. The Washington VAAC reported continuous ash emissions moving SE extending more than 100 km on 12 January. A significant explosion late on 20 January sent incandescent blocks 800 m down the S flank; although it was mostly cloudy for much of the second half of January, brief glimpses of ash plumes rising over 1,000 m and incandescent blocks traveling up to 800 m down numerous flanks were made almost daily (figure 109).
Visual evidence from the webcams supports significant thermal activity at Reventador. Atmospheric conditions are often cloudy and thus the thermal signature recorded by satellite instruments is frequently diminished. In spite of this, the MODVOLC thermal alert system recorded seven thermal alerts on three days in October, four alerts on two days in November, six alerts on two days in December and three alerts on three days in January 2019. In addition, the MIROVA system measured moderate levels of radiative power intermittently throughout the period; the most intense anomalies of 2018 were recorded on 15 October and 6 December (figure 110).
Geologic Background. Volcán El Reventador is the most frequently active of a chain of Ecuadorian volcanoes in the Cordillera Real, well east of the principal volcanic axis. The forested, dominantly andesitic stratovolcano has 4-km-wide avalanche scarp open to the E formed by edifice collapse. A young, unvegetated, cone rises from the amphitheater floor to a height comparable to the rim. It has been the source of numerous lava flows as well as explosive eruptions visible from Quito, about 90 km ESE. Frequent lahars in this region of heavy rainfall have left extensive deposits on the scarp slope. The largest recorded eruption took place in 2002, producing a 17-km-high eruption column, pyroclastic flows that traveled up to 8 km, and lava flows from summit and flank vents.
Information Contacts: Instituto Geofísico (IG-EPN), Escuela Politécnica Nacional, Casilla 17-01-2759, Quito, Ecuador (URL: http://www.igepn.edu.ec); Washington Volcanic Ash Advisory Center (VAAC), Satellite Analysis Branch (SAB), NOAA/NESDIS OSPO, NOAA Science Center Room 401, 5200 Auth Rd, Camp Springs, MD 20746, USA (URL: www.ospo.noaa.gov/Products/atmosphere/vaac, archive at: http://www.ssd.noaa.gov/VAAC/archive.html); MIROVA (Middle InfraRed Observation of Volcanic Activity), a collaborative project between the Universities of Turin and Florence (Italy) supported by the Centre for Volcanic Risk of the Italian Civil Protection Department (URL: http://www.mirovaweb.it/); Hawai'i Institute of Geophysics and Planetology (HIGP) - MODVOLC Thermal Alerts System, School of Ocean and Earth Science and Technology (SOEST), Univ. of Hawai'i, 2525 Correa Road, Honolulu, HI 96822, USA (URL: http://modis.higp.hawaii.edu/).
Santa Maria (Guatemala) — March 2019 Cite this Report
Santa Maria
Guatemala
14.757°N, 91.552°W; summit elev. 3745 m
All times are local (unless otherwise noted)
Daily explosions cause steam-and-ash plumes and block avalanches, November 2018-February 2019
The dacitic Santiaguito lava-dome complex on the W flank of Guatemala's Santa María volcano has been growing and actively erupting since 1922. The youngest of the four vents in the complex, Caliente, has been erupting with ash explosions, pyroclastic, and lava flows for more than 40 years. A lava dome that appeared within the summit crater of Caliente in October 2016 has continued to grow, producing frequent block avalanches down the flanks. Daily explosions of steam and ash also continued during November 2018-February 2019, the period covered in this report, with information primarily from Guatemala's INSIVUMEH (Instituto Nacional de Sismologia, Vulcanologia, Meterologia e Hidrologia) and the Washington VAAC (Volcanic Ash Advisory Center).
Activity at Santa Maria continued with little variation from previous months during November 2018-February 2019. Plumes of steam with minor magmatic gases rose continuously from the Caliente crater 100-500 m above the summit, generally drifting SW or SE before dissipating. In addition, daily explosions with varying amounts of ash rose to altitudes of around 2.8-3.5 km and usually extended 20-30 km before dissipating. Most of the plumes drifted SW or SE; minor ashfall occurred in the adjacent hills almost daily and was reported at the fincas located within 15 km in those directions several times each month. Continued growth of the Caliente lava dome resulted in daily block avalanches descending its flanks. The MIROVA plot of thermal energy during this time shows a consistent level of heat flow with minor variations throughout the period (figure 89).
During November 2018 steam plumes rose to altitudes of 2.8-3.2 km from Caliente summit, usually drifting SW, sometimes SE. Several ash-bearing explosions were reported daily, rising to 3-3.2 km altitude and also drifting SW or SE. The highest plume reported by INSIVUMEH rose to 3.4 km on 25 November and drifted SW. The Washington VAAC reported an ash emission on 9 November that rose to 4.3 km altitude and drifted W; it dissipated within a few hours about 35 km from the summit. On 11 November another plume rose to 4.9 km altitude and drifted NW. INSIVUMEH issued a special report on 2 November noting an increase in block avalanches on the S and SE flanks, many of which traveled from the crater dome to the base of the volcano. Nearly constant avalanche blocks descended the SE flank of the dome and occasionally traveled down the other flanks as well throughout the month. They reached the bottom of the cone again on 29 November. Ashfall was reported around the flanks more than once every week and at Finca Florida on 12 November. Finca San Jose reported ashfall on 11, 13, and 23 November, and Parcelamiento Monte Claro reported ashfall on 15, 24, 25, and 27 November.
Constant degassing from the Caliente dome during December 2018 formed white plumes of mostly steam that rose to 2.6-3.0 km altitude during the month. Weak explosions averaging 9-13 per day produced gray ash plumes that rose to 2.8-3.4 km altitude. The Washington VAAC reported an ash emission on 4 December that extended 25 km SW of the summit at 3.0 km altitude and dissipated quickly. Small ash plumes were visible in satellite imagery a few kilometers WNW on 8, 12, 30, and 31 December at 4.3 km altitude; they each dissipated within a few hours. Ashfall was reported in Finca Monte Claro on 1 and 4 December, and in San Marcos Palajunoj on 26 and 30 December along with Loma Linda. On 28 December ashfall on the E flank affected the communities of Las Marías, Calahuache, and El Nuevo Palmar. Block avalanches occurred daily, sending large blocks to the base of the volcano that often stirred up small plumes of ash in the vicinity (figure 90).
Multiple explosions daily during January 2019 produced steam-and-ash plumes (figure 91). Constant degassing rising 10-500 m emerged from the SSE part of the Caliente dome, and ashfall, mainly on the W and SW rim of the cone, was a daily feature. Seismic station STG-3 detected 10-18 explosions per day that produced ash plumes, which rose to between 2.7 and 3.5 km altitude. The Washington VAAC noted a faint ash emission in satellite imagery on 1 January that was about 25 km W of the summit at 4.3 km altitude. A new emission appeared at the same altitude on 4 January about 15 km NW of the summit. A low-density emission around midday on 5 January produced an ash plume that drifted NNE at 4.6 km altitude. Ash plumes drifted W at 4.3 km altitude on 11 and 14 January for short periods of time before dissipating.
Ash drifted mainly towards the W, SW, and S, causing ashfall in the villages of San Marcos Palajunoj, Loma Linda, Monte Bello, El Patrocinio, La Florida, El Faro, Patzulín and a few others several times during the month. The main places where daily ashfall was reported were near the complex, in the hilly crop areas of the El Faro and San José Patzulín farms (figure 92). Blocks up to 3 m in diameter reached the base of the complex, stirring up ash plumes that settled on the immediate flanks. Juvenile material continued to appear at the summit of the dome during January; the dome had risen above the edge of the crater created by the explosions of 2016. Changes in the size and shape of the dome between 23 November 2018 and 13 January 2019 showed the addition of material on the E and SE side of the dome, as well as a new effusive flow that travelled 200-300 m down the E flank (figure 93).
Persistent steam rising 50-150 m above the crater was typical during February 2019 and accompanied weak and moderate explosions that averaged 12 per day throughout the month. White and gray ash plumes from the explosions rose to 2.8-3.3 km altitude; daily block avalanches usually reached the base of the dome (figure 94). Ashfall occurred around the complex, mainly on the W, SW, and NE flanks on a daily basis, but communities farther away were affected as well. The Washington VAAC reported an ash plume on 7 February in visible satellite imagery moving SW from the summit at 4.9 km altitude. The next day a new ash plume was located about 20 km W of the summit, dissipating rapidly, at 4.3 km altitude. Ashfall drifting SW affected Palajuno Monte Claro on 5, 9, 15, and 16 February. Ash drifting E and SE affected Calaguache, Las Marías and surrounding farms on 14 and 17 February, and fine-grained ash drifting SE was reported at finca San José on 21 February.
Geologic Background. Symmetrical, forest-covered Santa María volcano is part of a chain of large stratovolcanoes that rise above the Pacific coastal plain of Guatemala. The sharp-topped, conical profile is cut on the SW flank by a 1.5-km-wide crater. The oval-shaped crater extends from just below the summit to the lower flank, and was formed during a catastrophic eruption in 1902. The renowned Plinian eruption of 1902 that devastated much of SW Guatemala followed a long repose period after construction of the large basaltic andesite stratovolcano. The massive dacitic Santiaguito lava-dome complex has been growing at the base of the 1902 crater since 1922. Compound dome growth at Santiaguito has occurred episodically from four vents, with activity progressing E towards the most recent, Caliente. Dome growth has been accompanied by almost continuous minor explosions, with periodic lava extrusion, larger explosions, pyroclastic flows, and lahars.
Information Contacts: Instituto Nacional de Sismologia, Vulcanologia, Meteorologia e Hydrologia (INSIVUMEH), Unit of Volcanology, Geologic Department of Investigation and Services, 7a Av. 14-57, Zona 13, Guatemala City, Guatemala (URL: http://www.insivumeh.gob.gt/); Washington Volcanic Ash Advisory Center (VAAC), Satellite Analysis Branch (SAB), NOAA/NESDIS OSPO, NOAA Science Center Room 401, 5200 Auth Rd, Camp Springs, MD 20746, USA (URL: www.ospo.noaa.gov/Products/atmosphere/vaac, archive at: http://www.ssd.noaa.gov/VAAC/archive.html); MIROVA (Middle InfraRed Observation of Volcanic Activity), a collaborative project between the Universities of Turin and Florence (Italy) supported by the Centre for Volcanic Risk of the Italian Civil Protection Department (URL: http://www.mirovaweb.it/).
Stromboli
Italy
38.789°N, 15.213°E; summit elev. 924 m
All times are local (unless otherwise noted)
Constant explosions from both crater areas during November 2018-February 2019
Nearly constant fountains of lava at Stromboli have served as a natural beacon in the Tyrrhenian Sea for at least 2,000 years. Eruptive activity at the summit consistently occurs from multiple vents at both a north crater area (N Area) and a southern crater group (CS Area) on the Terrazza Craterica at the head of the Sciara del Fuoco, a large scarp that runs from the summit down the NW side of the island. Thermal and visual cameras that monitor activity at the vents are located on the nearby Pizzo Sopra La Fossa, above the Terrazza Craterica, and at a location closer to the summit craters.
Eruptive activity from November 2018 to February 2019 was consistent in terms of explosion intensities and rates from both crater areas at the summit, and similar to activity of the past few years (table 5). In the North Crater area, both vents N1 and N2 emitted a mixture of coarse (lapilli and bombs) and fine (ash) ejecta; most explosions rose less than 80 m above the vents, some reached 150 m. Average explosion rates ranged from 4 to 21 per hour. In the CS crater area continuous degassing and occasional intense spattering were typical at vent C, vent S1 was a low-intensity incandescent jet throughout the period. Explosions from vent S2 produced 80-150 m high ejecta of ash, lapilli and bombs at average rates of 3-16 per hour. Thermal activity at Stromboli was actually higher during November 2018-February 2019 than it had been in previous months as recorded in the MIROVA Log Radiative Power data from MODIS infrared satellite information (figure 139).
Table 5. Summary of activity levels at Stromboli, November 2018-February 2019. Low intensity activity indicates ejecta rising less than 80 m and medium intensity is ejecta rising less than 150 m. Data courtesy of INGV.
| Month |
N Area Activity |
CS Area Activity |
| Nov 2018 |
Low- to medium-intensity explosions at both N1 and N2, lapilli and bombs mixed with ash, explosion rates of 6-16 per hour. |
Continuous degassing at C; intense spattering on 26 Nov. Low- to medium-intensity incandescent jetting at S1. Low- to medium-intensity explosions at S2 with a mix of coarse and fine ejecta and explosion rates of 3-18 per hour. |
| Dec 2018 |
Low- to medium-intensity explosions at both N1 and N2, coarse and fine ejecta, explosion rates of 4-21 per hour. Three days of intense spattering at N2. |
Continuous degassing at C; intense spattering 1-2 Dec. Low- to medium-intensity incandescent jets at S1, low and medium-intensity explosions of coarse and fine material at S2. Average explosion raters were 10-18 per hour at the beginning of the month, 3-4 per hour during last week. |
| Jan 2019 |
Low- to medium-intensity explosions at N1, coarse ejecta. Low- to medium-intensity and spattering at N2, coarse and fine ejecta. Explosion rates of 9-16 per hour. |
Continuous degassing and low-intensity explosions of coarse ejecta at C. Low-intensity incandescent jets at S1. Low- and medium-intensity explosions of coarse and fine ejecta at S2. |
| Feb 2019 |
Medium-intensity explosions with coarse ejecta at N1. Low-intensity explosions with fine ash at N2. Explosion rates of 4-11 per hour. |
Continuous degassing and low-intensity explosions with coarse and fine ejecta at C and S2. Low intensity incandescent jets at S1. Explosion rates of 2-13 per hour. |
Activity at the N area was very consistent during November 2018 (figure 140). Explosions of low-intensity (less than 80 m high) to medium-intensity (less than 150 m high) occurred at both the N1 and N2 vents and produced coarse material (lapilli and bombs) mixed with ash, at rates averaging 6-16 explosions per hour. In the SC area continuous degassing was reported from vent C with a brief period of intense spattering on 26 November. At vent S1 low- to medium-intensity incandescent jetting was reported. At vent S2, low- and medium-intensity explosive activity produced a mixture of coarse and fine (ash) material at a frequency of 3-18 events per hour.
Similar activity continued during December at both crater areas, although there were brief periods of more intense activity. Low- to medium-intensity explosions at both N area vents produced a mixture of coarse and fine-grained material at rates averaging 4-21 per hour. During 6-7 December ejecta from the N vents fell onto the upper part of the Sciara del Fuoco and rolled down the gullies to the coast, producing tongues of debris (figure 141). An explosion at N1 on 12 December produced a change in the structure of the crater area. During 10-16 December the ejecta from the N area landed outside the crater on the Sciara del Fuoco. Intense spattering was observed from N2 on 18, 22, and 31 December. In the CS area, continuous degassing took place at vent C, along with a brief period of intense spattering on 1-2 December. Low to medium intensity incandescent jets persisted at S1 along with low-and medium-intensity explosions of coarse and fine-grained material at vent S2. Rates of explosion at the CS area were higher at the beginning of December (10-18 per hour) and lower during the last week of the month (3-4 per hour).
Explosive intensity was low (ejecta less than 80 m high) at vent N1 at the beginning of January 2019 and increased to medium (ejecta less than 150 m high) during the second half of the month, producing coarse ejecta of lapilli and bombs. Intensity at vent N2 was low to medium throughout the month with both coarse- and fine-grained material ejected. Explosions from N2 sent large blocks onto the Sciara del Fuoco several times throughout the month and usually was accompanied by intense spattering. Explosion rates varied, with averages of 9 to 16 per hour, throughout the month in the N area. In the CS area continuous degassing occurred at vent C, and low-intensity explosions of coarse-grained material were reported during the second half of the month. Low-intensity incandescent jets at S1 along with low- and medium-intensity explosions of coarse and fine-grained material at S2 persisted throughout the month.
A helicopter overflight of Stromboli on 8 January 2019 allowed for detailed visual and thermal observations of activity and of the morphology of the vents at the summit (figure 142). Vent C had two small hornitos, and a small scoria cone was present in vent S1, while a larger crater was apparent at S2. In the N crater area vent N2 had a large scoria cone that faced the Sciara del Fuoco to the north; three narrow gullies were visible at the base of the cone (figure 143). Vent S1 was a large crater containing three small vents aligned in a NW-SE trend; INGV scientists concluded the vents formed as a result of the 12 December 2018 explosion. Thermal images showed relatively low temperatures at all fumaroles compared with earlier visits.
Activity during February 2019 declined slightly from the previous few months. Explosions at vent N1 were of medium-intensity and produced coarse material (lapilli and bombs). At N2, low-intensity explosions produced fine ash. Average explosion rates in the N area ranged from 4-11 per hour. At the CS area, continuous degassing and low-intensity explosions produced coarse and fine-grained material from vents C and S2 while low-intensity incandescent jets were active at S1. The explosion rates at the CS area averaged 2-13 per hour.
Geologic Background. Spectacular incandescent nighttime explosions at Stromboli have long attracted visitors to the "Lighthouse of the Mediterranean" in the NE Aeolian Islands. This volcano has lent its name to the frequent mild explosive activity that has characterized its eruptions throughout much of historical time. The small island is the emergent summit of a volcano that grew in two main eruptive cycles, the last of which formed the western portion of the island. The Neostromboli eruptive period took place between about 13,000 and 5,000 years ago. The active summit vents are located at the head of the Sciara del Fuoco, a prominent scarp that formed about 5,000 years ago due to a series of slope failures which extends to below sea level. The modern volcano has been constructed within this scarp, which funnels pyroclastic ejecta and lava flows to the NW. Essentially continuous mild Strombolian explosions, sometimes accompanied by lava flows, have been recorded for more than a millennium.
Information Contacts: Istituto Nazionale di Geofisica e Vulcanologia (INGV), Sezione di Catania, Piazza Roma 2, 95123 Catania, Italy, (URL: http://www.ct.ingv.it/en/); MIROVA (Middle InfraRed Observation of Volcanic Activity), a collaborative project between the Universities of Turin and Florence (Italy) supported by the Centre for Volcanic Risk of the Italian Civil Protection Department (URL: http://www.mirovaweb.it/).
Villarrica
Chile
39.42°S, 71.93°W; summit elev. 2847 m
All times are local (unless otherwise noted)
Intermittent Strombolian activity ejects incandescent bombs around crater rim, September 2018-February 2019
Historical eruptions at Chile's Villarrica, documented since 1558, have consisted largely of mild-to-moderate explosive activity with occasional lava effusion. An intermittently active lava lake at the summit has been the source of explosive activity, incandescence, and thermal anomalies for several decades. Sporadic Strombolian activity at the lava lake and small ash emissions have continued since the last large explosion on 3 March 2015. Similar continuing activity during September 2018-February 2019 is covered in this report, with information provided primarily by the Southern Andes Volcano Observatory (Observatorio Volcanológico de Los Andes del Sur, OVDAS), part of Chile's National Service of Geology and Mining (Servicio Nacional de Geología y Minería, SERNAGEOMIN), and Projecto Observación Villarrica Internet (POVI), part of the Fundacion Volcanes de Chile, a research group that studies volcanoes across Chile.
After ash emissions during July 2018 and an increase in of thermal activity from late July through early September 2018 (BGVN 43:10), Villarrica was much quieter through February 2019. Steam plumes rose no more than a few hundred meters above the summit and the number of thermal alerts decreased steadily. Intermittent Strombolian activity sent ejecta a few tens of meters above the summit crater, with larger bombs landing outside the crater rim. A small pyroclastic cone appeared at the surface of the lava lake, about 70 m below the rim, in November. The largest lava fountain rose 35 m above the crater rim in late January 2019.
Steam plumes rose no more than 300 m above the crater during September 2018 and were less than 150 m high in October; incandescence at the summit was visible during clear nights, although a gradual decrease in activity suggested a lowering of the lake level to SERNAGEOMIN. SERNAGEOMIN attributed an increase in LP seismic events from 1,503 in September to 5,279 in October to dynamics of the lava lake inside the summit crater; counts decreased gradually in the following months.
POVI reported webcam evidence of Strombolian activity with ejecta around the crater several times during November 2018. On 5 November the webcam captured an image of an incandescent bomb, more than a meter in diameter, that landed on the NW flank. The next day, explosions sent ejecta 50 m above the edge of the crater, and pyroclastic debris landed around the perimeter. Significant Strombolian explosions on 16 November sent incandescent bombs toward the W rim of the crater (figure 70). The POVI webcam in Pucón captured incandescent ejecta landing on the crater rim on 23 November. POVI scientists observed a small pyroclastic cone, about 10-12 m in diameter, at the bottom of the summit crater on 19 November (figure 71); it was still visible on 25 November.
During December 2018 webcam images showed steam plumes rising less than 350 m above the crater. Infrasound instruments identified two small explosions related to lava lake surface activity. SERNAGEOMIN noted a minor variation in the baseline of the inclinometers; continued monitoring indicated the variation was seasonal. A compilation by POVI of images of the summit crater during 2018 showed the evolution of the lava lake level during the year. It had dropped out of sight early in the year, rose to its highest level in July, and then lowered slightly, remaining stable for the last several months of the year (figure 72).
Between 25 December 2018 and 15 January 2019, financed with funds contributed by the Fundación Volcanes de Chile, POVI was able to install new HD webcams with continuous daily image recording, greatly improving the level of detail data available of the activity at the summit. POVI reported that after a five-week break, Strombolian explosions resumed on 3 January 2019; the lava fountains rose 20 m above the crater rim, and pyroclastic ejecta fell to the E. On 24 January the Strombolian explosions ejected ash, lapilli, and bombs up to 15 cm in diameter; the lava fountain was about 35 m high.
An explosion on 7 February reached about 29 m above the crater's edge; on 9 February a lava fountain three meters in diameter rose 17 m above the crater rim. Sporadic explosions were imaged on 12 February as well (figure 73). During a reconnaissance overflight on 24 February 2019, POVI scientists observed part of the lava pit at the bottom of the crater (figure 74). As of 28 February they noted a slight but sustained increase in the energy of the explosions. SERNAGEOMIN noted that steam plumes rose 400 m in January and 150 m during February, and incandescence was visible on clear nights during both months.
Geologic Background. The glacier-covered Villarrica stratovolcano, in the northern Lakes District of central Chile, is ~15 km south of the city of Pucon. A 2-km-wide caldera that formed about 3,500 years ago is located at the base of the presently active, dominantly basaltic to basaltic andesite cone at the NW margin of a 6-km-wide Pleistocene caldera. More than 30 scoria cones and fissure vents are present on the flanks. Plinian eruptions and pyroclastic flows that have extended up to 20 km from the volcano were produced during the Holocene. Lava flows up to 18 km long have issued from summit and flank vents. Eruptions documented since 1558 CE have consisted largely of mild-to-moderate explosive activity with occasional lava effusion. Glaciers cover 40 km2 of the volcano, and lahars have damaged towns on its flanks.
Information Contacts: Servicio Nacional de Geología y Minería (SERNAGEOMIN), Observatorio Volcanológico de Los Andes del Sur (OVDAS), Avda Sta María No. 0104, Santiago, Chile (URL: http://www.sernageomin.cl/); Proyecto Observación Villarrica Internet (POVI) (URL: http://www.povi.cl/).