Recently Published Bulletin Reports
Erebus (Antarctica) Lava lake remains active; most thermal alerts recorded since 2019
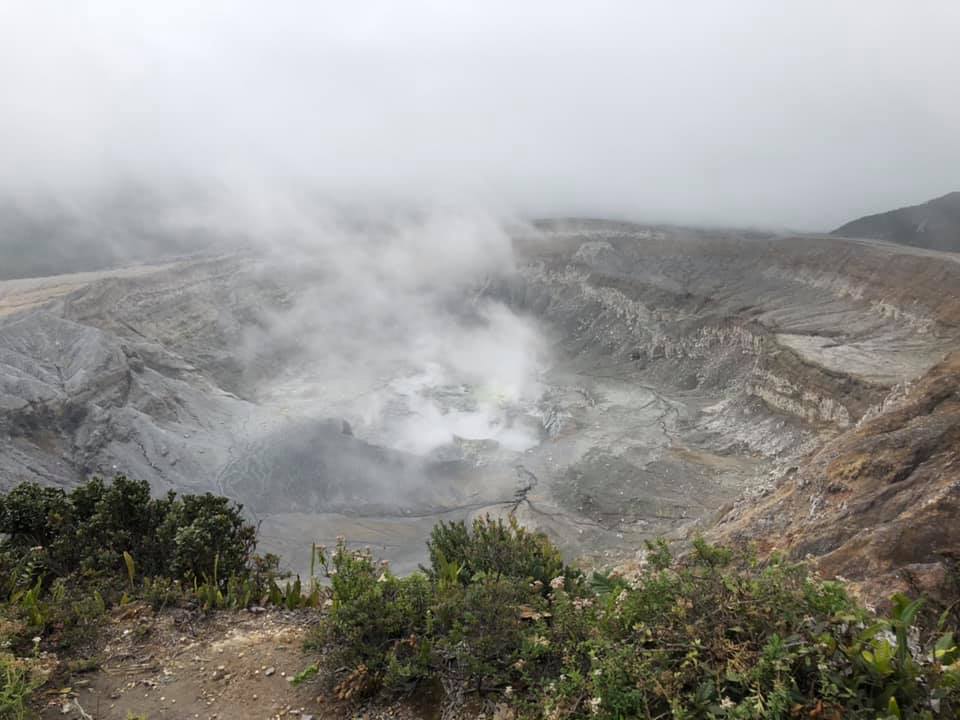
Rincon de la Vieja (Costa Rica) Frequent phreatic explosions during July-December 2023
Bezymianny (Russia) Explosion on 18 October 2023 sends ash plume 8 km high; lava flows and incandescent avalanches
Kilauea (United States) Low-level lava effusions in the lava lake at Halema’uma’u during July-December 2022
Nyamulagira (DR Congo) Lava flows and thermal activity during May-October 2023
Bagana (Papua New Guinea) Explosions, ash plumes, ashfall, and lava flows during April-September 2023
Mayon (Philippines) Lava flows, pyroclastic flows, ash emissions, and seismicity during April-September 2023
Nishinoshima (Japan) Eruption plumes and gas-and-steam plumes during May-August 2023
Krakatau (Indonesia) White gas-and-steam plumes and occasional ash plumes during May-August 2023
Villarrica (Chile) Strombolian activity, gas-and-ash emissions, and crater incandescence during April-September 2023
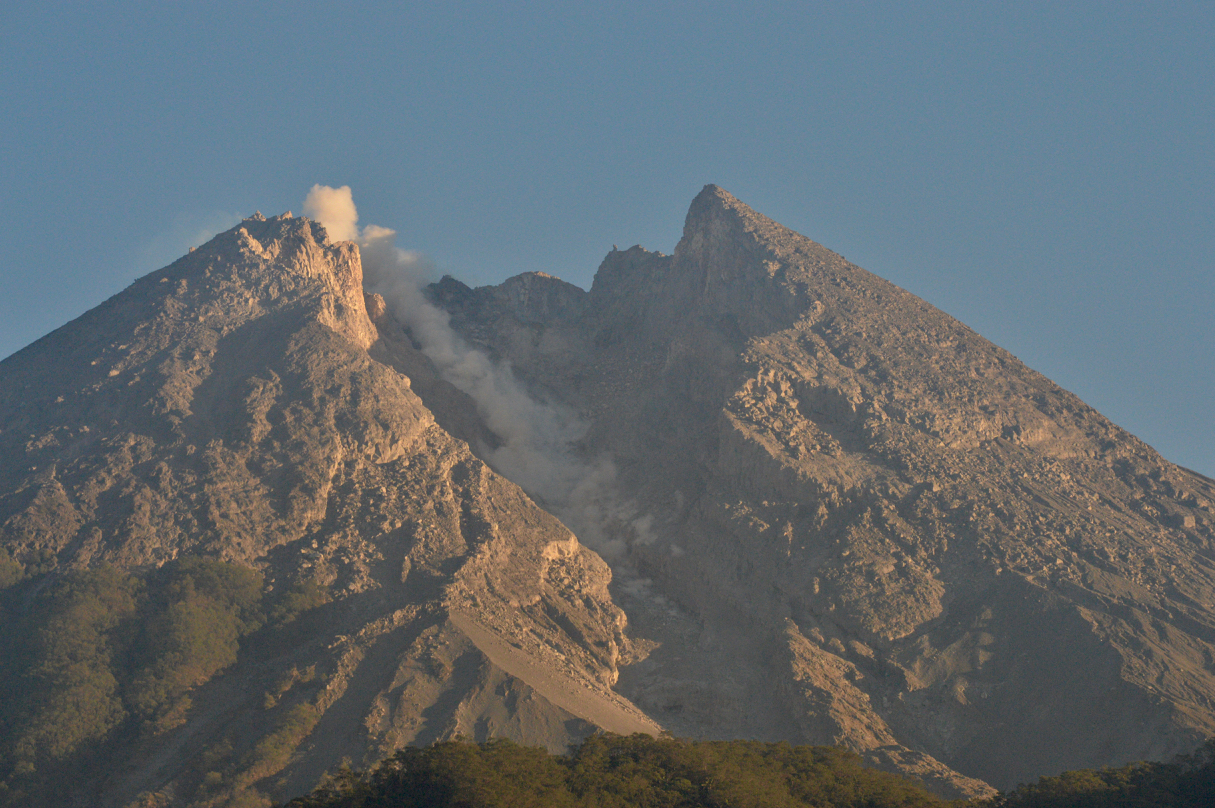
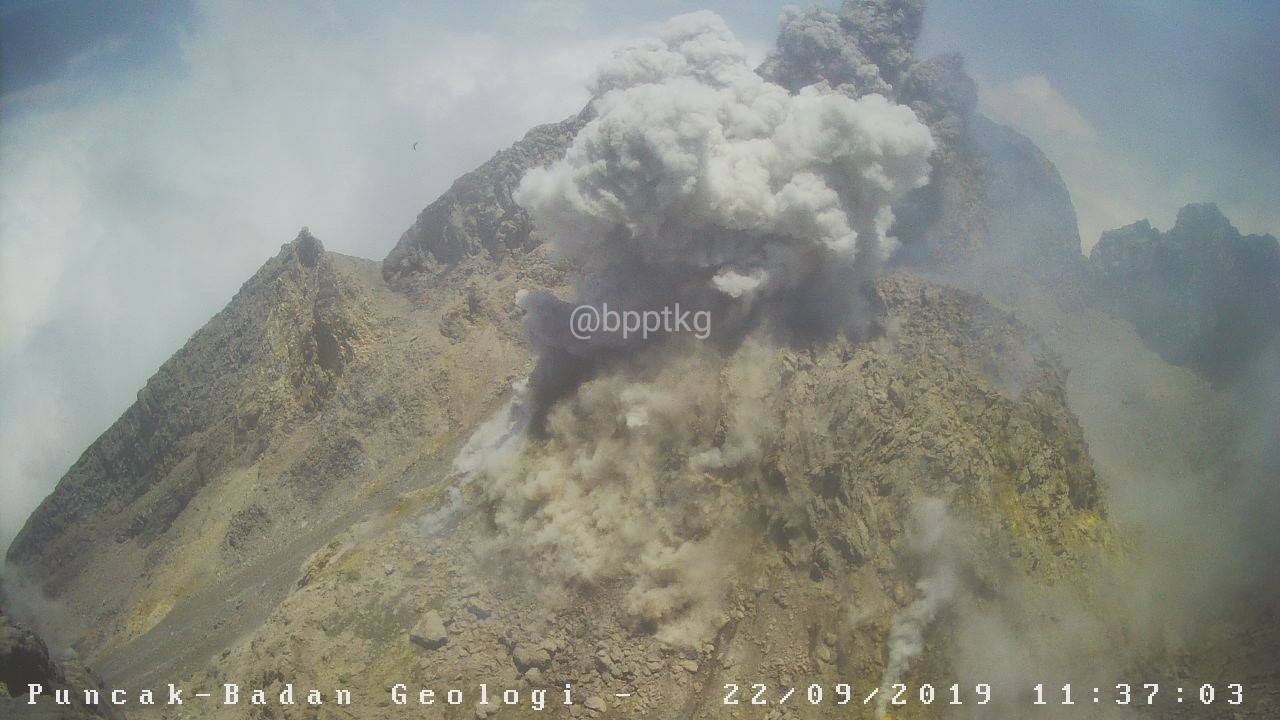
Merapi (Indonesia) Frequent incandescent avalanches during April-September 2023
Ebeko (Russia) Moderate explosive activity with ash plumes continued during June-November 2023
Erebus (Antarctica) — January 2024  Cite this Report
Erebus
Antarctica
77.53°S, 167.17°E; summit elev. 3794 m
All times are local (unless otherwise noted)
Lava lake remains active; most thermal alerts recorded since 2019
The lava lake in the summit crater of Erebus has been active since at least 1972. Located in Antarctica overlooking the McMurdo Station on Ross Island, it is the southernmost active volcano on the planet. Because of the remote location, activity is primarily monitored by satellites. This report covers activity during 2023.
The number of thermal alerts recorded by the Hawai'i Institute of Geophysics and Planetology’s MODVOLC Thermal Alerts System increased considerably in 2023 compared to the years 2020-2022 (table 9). In contrast to previous years, the MODIS instruments aboard the Aqua and Terra satellites captured data from Erebus every month during 2023. Consistent with previous years, the lowest number of anomalous pixels were recorded in January, November, and December.
Table 9. Number of monthly MODIS-MODVOLC thermal alert pixels recorded at Erebus during 2017-2023. See BGVN 42:06 for data from 2000 through 2016. The table was compiled using data provided by the HIGP – MODVOLC Thermal Alerts System.
| Year |
Jan |
Feb |
Mar |
Apr |
May |
Jun |
Jul |
Aug |
Sep |
Oct |
Nov |
Dec |
SUM |
| 2017 |
0 |
21 |
9 |
0 |
0 |
1 |
11 |
61 |
76 |
52 |
0 |
3 |
234 |
| 2018 |
0 |
21 |
58 |
182 |
55 |
17 |
137 |
172 |
103 |
29 |
0 |
0 |
774 |
| 2019 |
2 |
21 |
162 |
151 |
55 |
56 |
75 |
53 |
29 |
19 |
1 |
0 |
624 |
| 2020 |
0 |
2 |
16 |
18 |
4 |
4 |
1 |
3 |
18 |
3 |
1 |
6 |
76 |
| 2021 |
0 |
9 |
1 |
0 |
2 |
56 |
46 |
47 |
35 |
52 |
5 |
3 |
256 |
| 2022 |
1 |
13 |
55 |
22 |
15 |
32 |
39 |
19 |
31 |
11 |
0 |
0 |
238 |
| 2023 |
2 |
33 |
49 |
82 |
41 |
32 |
70 |
64 |
42 |
17 |
5 |
11 |
448 |
Sentinel-2 infrared images showed one or two prominent heat sources within the summit crater, accompanied by adjacent smaller sources, similar to recent years (see BGVN 46:01, 47:02, and 48:01). A unique image was obtained on 25 November 2023 by the OLI-2 (Operational Land Imager-2) on Landsat 9, showing the upper part of the volcano surrounded by clouds (figure 32).
Geologic Background. Mount Erebus, the world's southernmost historically active volcano, overlooks the McMurdo research station on Ross Island. It is the largest of three major volcanoes forming the crudely triangular Ross Island. The summit of the dominantly phonolitic volcano has been modified by one or two generations of caldera formation. A summit plateau at about 3,200 m elevation marks the rim of the youngest caldera, which formed during the late-Pleistocene and within which the modern cone was constructed. An elliptical 500 x 600 m wide, 110-m-deep crater truncates the summit and contains an active lava lake within a 250-m-wide, 100-m-deep inner crater; other lava lakes are sometimes present. The glacier-covered volcano was erupting when first sighted by Captain James Ross in 1841. Continuous lava-lake activity with minor explosions, punctuated by occasional larger Strombolian explosions that eject bombs onto the crater rim, has been documented since 1972, but has probably been occurring for much of the volcano's recent history.
Information Contacts: Hawai'i Institute of Geophysics and Planetology (HIGP) - MODVOLC Thermal Alerts System, School of Ocean and Earth Science and Technology (SOEST), Univ. of Hawai'i, 2525 Correa Road, Honolulu, HI 96822, USA (URL: http://modis.higp.hawaii.edu/); Copernicus Browser, Copernicus Data Space Ecosystem, European Space Agency (URL: https://dataspace.copernicus.eu/browser/); NASA Earth Observatory, EOS Project Science Office, NASA Goddard Space Flight Center, Goddard, Maryland, USA (URL: https://earthobservatory.nasa.gov/images/152134/erebus-breaks-through).
Rincon de la Vieja (Costa Rica) — January 2024 Cite this Report
Rincon de la Vieja
Costa Rica
10.83°N, 85.324°W; summit elev. 1916 m
All times are local (unless otherwise noted)
Frequent phreatic explosions during July-December 2023
Rincón de la Vieja is a volcanic complex in Costa Rica with a hot convecting acid lake that exhibits frequent weak phreatic explosions, gas-and-steam emissions, and occasional elevated sulfur dioxide levels (BGVN 45:10, 46:03, 46:11). The current eruption period began June 2021. This report covers activity during July-December 2023 and is based on weekly bulletins and occasional daily reports from the Observatorio Vulcanologico Sismologica de Costa Rica-Universidad Nacional (OVSICORI-UNA).
Numerous weak phreatic explosions continued during July-December 2023, along with gas-and-steam emissions and plumes that rose as high as 3 km above the crater rim. Many weekly OVSICORI-UNA bulletins included the previous week's number of explosions and emissions (table 9). For many explosions, the time of explosion was given (table 10). Frequent seismic activity (long-period earthquakes, volcano-tectonic earthquakes, and tremor) accompanied the phreatic activity.
Table 9. Number of reported weekly phreatic explosions and gas-and-steam emissions at Rincón de la Vieja, July-December 2023. Counts are reported for the week before the Weekly Bulletin date; not all reports included these data. Courtesy of OVSICORI-UNA.
| OVSICORI Weekly Bulletin |
Number of explosions |
Number of emissions |
| 28 Jul 2023 |
6 |
14 |
| 4 Aug 2023 |
10 |
12 |
| 1 Sep 2023 |
13 |
11 |
| 22 Sep 2023 |
12 |
13 |
| 29 Sep 2023 |
6 |
11 |
| 6 Oct 2023 |
12 |
5 |
| 13 Oct 2023 |
7 |
9 |
| 20 Oct 2023 |
1 |
15 |
| 27 Oct 2023 |
3 |
23 |
| 3 Nov 2023 |
3 |
10 |
| 17 Nov 2023 |
0 |
Some |
| 24 Nov 2023 |
0 |
14 |
| 8 Dec 2023 |
4 |
16 |
| 22 Dec 2023 |
8 |
18 |
Table 10. Summary of activity at Rincón de la Vieja during July-December 2023. Weak phreatic explosions and gas emissions are noted where the time of explosion was indicated in the weekly or daily bulletins. Height of plumes or emissions are distance above the crater rim. Courtesy of OVSICORI-UNA.
| Date |
Time |
Description of Activity |
| 1 Jul 2023 |
0156 |
Explosion. |
| 2 Jul 2023 |
0305 |
Explosion. |
| 4 Jul 2023 |
0229, 0635 |
Event at 0635 produced a gas-and-steam plume that rose 700 m and drifted W; seen by residents in Liberia (21 km SW). |
| 9 Jul 2023 |
1843 |
Explosion. |
| 21 Jul 2023 |
0705 |
Explosion. |
| 26 Jul 2023 |
1807 |
Explosion. |
| 28 Jul 2023 |
0802 |
Explosion generated a gas-and-steam plume that rose 500 m. |
| 30 Jul 2023 |
1250 |
Explosion. |
| 31 Jul 2023 |
2136 |
Explosion. |
| 11 Aug 2023 |
0828 |
Explosion. |
| 18 Aug 2023 |
1304 |
Explosion. |
| 21 Aug 2023 |
1224 |
Explosion generated gas-and-steam plumes rose 500-600 m. |
| 22 Aug 2023 |
0749 |
Explosion generated gas-and-steam plumes rose 500-600 m. |
| 24 Aug 2023 |
1900 |
Explosion. |
| 25 Aug 2023 |
0828 |
Event produced a steam-and-gas plume that rose 3 km and drifted NW. |
| 27-28 Aug 2023 |
0813 |
Four small events; the event at 0813 on 28 August lasted two minutes and generated a steam-and-gas plume that rose 2.5 km. |
| 1 Sep 2023 |
1526 |
Explosion generated plume that rose 2 km and ejected material onto the flanks. |
| 2-3 Sep 2023 |
- |
Small explosions detected in infrasound data. |
| 4 Sep 2023 |
1251 |
Gas-and-steam plume rose 1 km and drifted W. |
| 7 Nov 2023 |
1113 |
Explosion. |
| 8 Nov 2023 |
0722 |
Explosion. |
| 12 Nov 2023 |
0136 |
Small gas emissions. |
| 14 Nov 2023 |
0415 |
Small gas emissions. |
According to OVSICORI-UNA, during July-October the average weekly sulfur dioxide (SO2) flux ranged from 68 to 240 tonnes/day. However, in mid-November the flux increased to as high as 334 tonnes/day, the highest value measured in recent years. The high SO2 flux in mid-November was also detected by the TROPOMI instrument on the Sentinel-5P satellite (figure 43).
Geologic Background. Rincón de la Vieja, the largest volcano in NW Costa Rica, is a remote volcanic complex in the Guanacaste Range. The volcano consists of an elongated, arcuate NW-SE-trending ridge constructed within the 15-km-wide early Pleistocene Guachipelín caldera, whose rim is exposed on the south side. Sometimes known as the "Colossus of Guanacaste," it has an estimated volume of 130 km3 and contains at least nine major eruptive centers. Activity has migrated to the SE, where the youngest-looking craters are located. The twin cone of Santa María volcano, the highest peak of the complex, is located at the eastern end of a smaller, 5-km-wide caldera and has a 500-m-wide crater. A Plinian eruption producing the 0.25 km3 Río Blanca tephra about 3,500 years ago was the last major magmatic eruption. All subsequent eruptions, including numerous historical eruptions possibly dating back to the 16th century, have been from the prominent active crater containing a 500-m-wide acid lake located ENE of Von Seebach crater.
Information Contacts: Observatorio Vulcanológico Sismológica de Costa Rica-Universidad Nacional (OVSICORI-UNA), Apartado 86-3000, Heredia, Costa Rica (URL: http://www.ovsicori.una.ac.cr/); NASA Global Sulfur Dioxide Monitoring Page, Atmospheric Chemistry and Dynamics Laboratory, NASA Goddard Space Flight Center (NASA/GSFC), 8800 Greenbelt Road, Goddard MD 20771, USA (URL: https://so2.gsfc.nasa.gov/).
Bezymianny (Russia) — November 2023 Cite this Report
Bezymianny
Russia
55.972°N, 160.595°E; summit elev. 2882 m
All times are local (unless otherwise noted)
Explosion on 18 October 2023 sends ash plume 8 km high; lava flows and incandescent avalanches
Bezymianny, located on Russia’s Kamchatka Peninsula, has had eruptions since 1955 characterized by dome growth, explosions, pyroclastic flows, ash plumes, and ashfall. Activity during November 2022-April 2023 included gas-and-steam emissions, lava dome collapses generating avalanches, and persistent thermal activity. Similar eruptive activity continued from May through October 2023, described here based on information from weekly and daily reports of the Kamchatka Volcano Eruptions Response Team (KVERT), notices from Tokyo VAAC (Volcanic Ash Advisory Center), and from satellite data.
Overall activity decreased after the strong period of activity in late March through April 2023, which included ash explosions during 29 March and 7-8 April 2023 that sent plumes as high as 10-12 km altitude, along with dome growth and lava flows (BGVN 48:05). This reduced activity can be seen in the MIROVA thermal detection system graph (figure 56), which was consistent with data from the MODVOLC thermal detection system and with Sentinel-2 satellite images that showed persistent hotspots in the summit crater when conditions allowed observations. A renewed period of strong activity began in mid-October 2023.
Activity increased significantly on 17 October 2023 when large collapses began during 0700-0830 on the E flanks of the lava dome and continued to after 0930 the next day (figure 57). Ash plumes rose to an altitude of 4.5-5 km, extending 220 km NNE by 18 October. A large explosion at 1630 on 18 October produced an ash plume that rose to an altitude of 11 km (8 km above the summit) and drifted NNE and then NW, extending 900 km NW within two days at an altitude of 8 km. Minor ashfall was noted in Kozyrevsk (45 km WNW). At 0820 on 20 October an ash plume was identified in satellite images drifting 100 km ENE at altitudes of 4-4.5 km.
Lava flows and hot avalanches from the dome down the SE flank continued over the next few days, including 23 October when clear conditions allowed good observations (figures 58 and 59). A large thermal anomaly was observed over the volcano through 24 October, and in the summit crater on 30 October (figure 60). Strong fumarolic activity continued, with numerous avalanches and occasional incandescence. By the last week of October, volcanic activity had decreased to a level consistent with that earlier in the reporting period.
Aviation warnings were frequently updated during 17-20 October. KVERT issued a Volcano Observatory Notice for Aviation (VONA) on 17 October at 1419 and 1727 (0219 and 0527 UTC) raising the Aviation Color Code (ACC) from Yellow to Orange (second highest level). The next day, KVERT issued a VONA at 1705 (0505 UTC) raising the ACC to Red (highest level) but lowered it back to Orange at 2117 (0917 UTC). After another decrease to Yellow and back to Orange, the ACC was reduced to Yellow on 20 October at 1204 (0004 UTC). In addition, the Tokyo VAAC issued a series of Volcanic Ash Advisories beginning on 16 October and continuing through 30 October.
Geologic Background. The modern Bezymianny, much smaller than its massive neighbors Kamen and Kliuchevskoi on the Kamchatka Peninsula, was formed about 4,700 years ago over a late-Pleistocene lava-dome complex and an edifice built about 11,000-7,000 years ago. Three periods of intensified activity have occurred during the past 3,000 years. The latest period, which was preceded by a 1,000-year quiescence, began with the dramatic 1955-56 eruption. This eruption, similar to that of St. Helens in 1980, produced a large open crater that was formed by collapse of the summit and an associated lateral blast. Subsequent episodic but ongoing lava-dome growth, accompanied by intermittent explosive activity and pyroclastic flows, has largely filled the 1956 crater.
Information Contacts: Kamchatka Volcanic Eruptions Response Team (KVERT), Far Eastern Branch, Russian Academy of Sciences, 9 Piip Blvd., Petropavlovsk-Kamchatsky, 683006, Russia (URL: http://www.kscnet.ru/ivs/kvert/); Kamchatka Volcanological Station, Kamchatka Branch of Geophysical Survey, (KB GS RAS), Klyuchi, Kamchatka Krai, Russia (URL: http://volkstat.ru/); Tokyo Volcanic Ash Advisory Center (VAAC), 1-3-4 Otemachi, Chiyoda-ku, Tokyo 100-8122, Japan (URL: http://ds.data.jma.go.jp/svd/vaac/data/); Hawai'i Institute of Geophysics and Planetology (HIGP) - MODVOLC Thermal Alerts System, School of Ocean and Earth Science and Technology (SOEST), Univ. of Hawai'i, 2525 Correa Road, Honolulu, HI 96822, USA (URL: http://modis.higp.hawaii.edu/); MIROVA (Middle InfraRed Observation of Volcanic Activity), a collaborative project between the Universities of Turin and Florence (Italy) supported by the Centre for Volcanic Risk of the Italian Civil Protection Department (URL: http://www.mirovaweb.it/); Copernicus Browser, Copernicus Data Space Ecosystem, European Space Agency (URL: https://dataspace.copernicus.eu/browser/).chr
Kilauea (United States) — January 2023 Cite this Report
Kilauea
United States
19.421°N, 155.287°W; summit elev. 1222 m
All times are local (unless otherwise noted)
Low-level lava effusions in the lava lake at Halema’uma’u during July-December 2022
Kīlauea is the southeastern-most volcano in Hawaii and overlaps the E flank of the Mauna Loa volcano. Its East Rift Zone (ERZ) has been intermittently active for at least 2,000 years. An extended eruption period began in January 1983 and was characterized by open lava lakes and lava flows from the summit caldera and the East Rift Zone. During May 2018 magma migrated into the Lower East Rift Zone (LERZ) and opened 24 fissures along a 6-km-long NE-trending fracture zone that produced lava flows traveling in multiple directions. As lava emerged from the fissures, the lava lake at Halema'uma'u drained and explosions sent ash plumes to several kilometers altitude (BGVN 43:10).
The current eruption period started during September 2021 and has recently been characterized by lava effusions, spatter, and sulfur dioxide emissions in the active Halema’uma’u lava lake (BGVN 47:08). Lava effusions, some spatter, and sulfur dioxide emissions have continued during this reporting period of July through December 2022 using daily reports, volcanic activity notices, and abundant photo, map, and video data from the US Geological Survey's (USGS) Hawaiian Volcano Observatory (HVO).
Summary of activity during July-December 2022. Low-level effusions have continued at the western vent of the Halema’uma’u crater during July through early December 2022. Occasional weak ooze-outs (also called lava break outs) would occur along the margins of the crater floor. The overall level of the active lava lake throughout the reporting period gradually increased due to infilling, however it stagnated in mid-September (table 13). During September through November, activity began to decline, though lava effusions persisted at the western vent. By 9 December, the active part of the lava lake had completely crusted over, and incandescence was no longer visible.
Table 13. Summary of measurements taken during overflights at Kīlauea that show a gradual increase in the active lava lake level and the volume of lava effused since 29 September 2021. Lower activity was reported during September-October. Data collected during July-December 2022. Courtesy of HVO.
| Date: |
Level of the active lava lake (m): |
Cumulative volume of lava effused (million cubic meters): |
| 7 Jul 2022 |
130 |
95 |
| 19 Jul 2022 |
133 |
98 |
| 4 Aug 2022 |
136 |
102 |
| 16 Aug 2022 |
137 |
104 |
| 12 Sep 2022 |
143 |
111 |
| 5 Oct 2022 |
143 |
111 |
| 28 Oct 2022 |
143 |
111 |
Activity during July 2022. Lava effusions were reported from the western vent in the Halema’uma’u crater, along with occasional weak ooze-outs along the margins of the crater floor. The height of the lava lake was variable due to deflation-inflation tilt events; for example, the lake level dropped approximately 3-4 m during a summit deflation-inflation event reported on 1 July. Webcam images taken during the night of 6-12 July showed intermittent low-level spattering at the western vent that rose less than 10 m above the vent (figure 519). Measurements made during an overflight on 7 July indicated that the crater floor was infilled about 130 m and that 95 million cubic meters of lava had been effused since 29 September 2021. A single, relatively small lava ooze-out was active to the S of the lava lake. Around midnight on 8 July there were two brief periods of lava overflow onto the lake margins. On 9 July lava ooze-outs were reported near the SE and NE edges of the crater floor and during 10-11 July they occurred near the E, NE, and NW edges. On 16 July crater incandescence was reported, though the ooze-outs and spattering were not visible. On 18 July overnight webcam images showed incandescence in the western vent complex and two ooze-outs were reported around 0000 and 0200 on 19 July. By 0900 there were active ooze-outs along the SW edge of the crater floor. Measurements made from an overflight on 19 July indicated that the crater floor was infilled about 133 m and 98 million cubic meters of lava had erupted since 29 September 2021 (figure 520). On 20 July around 1600 active ooze-outs were visible along the N edge of the crater, which continued through the next day. Extensive ooze-outs occurred along the W margin during 24 July until 1900; on 26 July minor ooze-outs were noted along the N margin. Minor spattering was visible on 29 July along the E margin of the lake. The sulfur dioxide emission rates ranged 650-2,800 tons per day (t/d), the higher of which was measured on 8 July (figure 519).
Activity during August 2022. The eruption continued in the Halema’uma’u crater at the western vent. According to HVO the lava in the active lake remained at the level of the bounding levees. Occasional minor ooze-outs were observed along the margins of the crater floor. Strong nighttime crater incandescence was visible after midnight on 6 August over the western vent cone. During 6-7 August scattered small lava lobes were active along the crater floor and incandescence persisted above the western vent through 9 August. During 7-9 August HVO reported a single lava effusion source was active along the NW margin of the crater floor. Measurements from an overflight on 4 August indicated that the crater floor was infilled about 136 m total and that 102 million cubic meters of lava had been erupted since the start of the eruption. Lava breakouts were reported along the N, NE, E, S, and W margins of the crater during 10-16 August. Another overflight survey conducted on 16 August indicated that the crater floor infilled about 137 m and 104 million cubic meters of lava had been erupted since September 2021. Measured sulfur dioxide emissions rates ranged 1,150-2,450 t/d, the higher of which occurred on 8 August.
Activity during September 2022. During September, lava effusion continued from the western vent into the active lava lake and onto the crater floor. Intermittent minor ooze-outs were reported through the month. A small ooze-out was visible on the W crater floor margin at 0220 on 2 September, which showed decreasing surface activity throughout the day, but remained active through 3 September. On 3 September around 1900 a lava outbreak occurred along the NW margin of the crater floor but had stopped by the evening of 4 September. Field crews monitoring the summit lava lake on 9 September observed spattering on the NE margin of the lake that rose no higher than 10 m, before falling back onto the lava lake crust (figure 521). Overflight measurements on 12 September indicated that the crater floor was infilled a total of 143 m and 111 million cubic meters of lava had been erupted since September 2021. Extensive breakouts in the W and N part of the crater floor were reported at 1600 on 20 September and continued into 26 September. The active part of the lava lake dropped by 10 m while other parts of the crater floor dropped by several meters. Summit tiltmeters recorded a summit seismic swarm of more than 80 earthquakes during 1500-1800 on 21 September, which occurred about 1.5 km below Halema’uma’u; a majority of these were less than Mw 2. By 22 September the active part of the lava lake was infilled about 2 m. On 23 September the western vent areas exhibited several small spatter cones with incandescent openings, along with weak, sporadic spattering (figure 522). The sulfur dioxide emission rate ranged from 930 t/d to 2,000 t/d, the higher of which was measured on 6 September.
Activity during October 2022. Activity during October declined slightly compared to previous months, though lava effusions persisted from the western vent into the active lava lake and onto the crater floor during October (figure 523). Slight variations in the lava lake were noted throughout the month. HVO reported that around 0600 on 3 October the level of the lava lake has lowered slightly. Overflight measurements taken on 5 October indicated that the crater floor was infilled a total of about 143 m and that 111 million cubic meters of lava had been effused since September 2021. During 6-7 October the lake gradually rose 0.5 m. Sulfur dioxide measurements made on 22 October had an emission rate of 700 t/d. Another overflight taken on 28 October showed that there was little to no change in the elevation of the crater floor: the crater floor was infilled a total of 143 m and 111 million cubic meters of lava had erupted since the start of the eruption.
Activity during November 2022. Activity remained low during November, though HVO reported that lava from the western vent continued to effuse into the active lava lake and onto the crater floor throughout the month. The rate of sulfur dioxide emissions during November ranged from 300-600 t/d, the higher amount of which occurred on 9 November.
Activity during December 2022. Similar low activity was reported during December, with lava effusing from the western vent into the active lava lake and onto the crater floor. During 4-5 December the active part of the lava lake was slightly variable in elevation and fluctuated within 1 m. On 9 December HVO reported that lava was no longer erupting from the western vent in the Halema’uma’u crater and that sulfur dioxide emissions had returned to near pre-eruption background levels; during 10-11 December, the lava lake had completely crusted over, and no incandescence was visible (figure 524). Time lapse camera images covering the 4-10 December showed that the crater floor showed weak deflation and no inflation. Some passive events of crustal overturning were reported during 14-15 December, which brought fresh incandescent lava to the lake surface. The sulfur dioxide emission rate was approximately 200 t/d on 14 December. A smaller overturn event on 17 December and another that occurred around 0000 and into the morning of 20 December were also detected. A small seismic swarm was later detected on 30 December.
Geologic Background. Kilauea overlaps the E flank of the massive Mauna Loa shield volcano in the island of Hawaii. Eruptions are prominent in Polynesian legends; written documentation since 1820 records frequent summit and flank lava flow eruptions interspersed with periods of long-term lava lake activity at Halemaumau crater in the summit caldera until 1924. The 3 x 5 km caldera was formed in several stages about 1,500 years ago and during the 18th century; eruptions have also originated from the lengthy East and Southwest rift zones, which extend to the ocean in both directions. About 90% of the surface of the basaltic shield volcano is formed of lava flows less than about 1,100 years old; 70% of the surface is younger than 600 years. The long-term eruption from the East rift zone between 1983 and 2018 produced lava flows covering more than 100 km2, destroyed hundreds of houses, and added new coastline.
Information Contacts: Hawaiian Volcano Observatory (HVO), U.S. Geological Survey, PO Box 51, Hawai'i National Park, HI 96718, USA (URL: http://hvo.wr.usgs.gov/).
Nyamulagira (DR Congo) — November 2023 Cite this Report
Nyamulagira
DR Congo
1.408°S, 29.2°E; summit elev. 3058 m
All times are local (unless otherwise noted)
Lava flows and thermal activity during May-October 2023
Nyamulagira (also known as Nyamuragira) is a shield volcano in the Democratic Republic of Congo with the summit truncated by a small 2 x 2.3 km caldera with walls up to about 100 m high. Documented eruptions have occurred within the summit caldera, as well as from numerous flank fissures and cinder cones. The current eruption period began in April 2018 and has more recently been characterized by summit crater lava flows and thermal activity (BGVN 48:05). This report describes lava flows and variable thermal activity during May through October 2023, based on information from the Observatoire Volcanologique de Goma (OVG) and various satellite data.
Lava lake activity continued during May. The MIROVA (Middle InfraRed Observation of Volcanic Activity) system recorded moderate-to-strong thermal activity throughout the reporting period; activity was more intense during May and October and relatively weaker from June through September (figure 95). The MODVOLC thermal algorithm, detected a total of 209 thermal alerts. There were 143 hotspots detected during May, eight during June, nine during September, and 49 during October. This activity was also reflected in infrared satellite images, where a lava flow was visible in the NW part of the crater on 7 May and strong activity was seen in the center of the crater on 4 October (figure 96). Another infrared satellite image taken on 12 May showed still active lava flows along the NW margin of the crater. According to OVG lava effusions were active during 7-29 May and moved to the N and NW parts of the crater beginning on 9 May. Strong summit crater incandescence was visible from Goma (27 km S) during the nights of 17, 19, and 20 May (figure 97). On 17 May there was an increase in eruptive activity, which peaked at 0100 on 20 May. Notable sulfur dioxide plumes drifted NW and W during 19-20 May (figure 98). Drone footage acquired in partnership with the USGS (United States Geological Survey) on 20 May captured images of narrow lava flows that traveled about 100 m down the W flank (figure 99). Data from the Rumangabo seismic station indicated a decreasing trend in activity during 17-21 May. Although weather clouds prevented clear views of the summit, a strong thermal signature on the NW flank was visible in an infrared satellite image on 22 May, based on an infrared satellite image. On 28 May the lava flows on the upper W flank began to cool and solidify. By 29 May seismicity returned to levels similar to those recorded before the 17 May increase. Lava effusion continued but was confined to the summit crater; periodic crater incandescence was observed.
Low-level activity was noted during June through October. On 1 June OVG reported that seismicity remained at lower levels and that crater incandescence had been absent for three days, though infrared satellite imagery showed continued lava effusion in the summit crater. The lava flows on the flanks covered an estimated 0.6 km2. Satellite imagery continued to show thermal activity confined to the lava lake through October (figure 96), although no lava flows or significant sulfur dioxide emissions were reported.
Geologic Background. Africa's most active volcano, Nyamulagira (also known as Nyamuragira), is a massive high-potassium basaltic shield about 25 km N of Lake Kivu and 13 km NNW of the steep-sided Nyiragongo volcano. The summit is truncated by a small 2 x 2.3 km caldera that has walls up to about 100 m high. Documented eruptions have occurred within the summit caldera, as well as from the numerous flank fissures and cinder cones. A lava lake in the summit crater, active since at least 1921, drained in 1938, at the time of a major flank eruption. Recent lava flows extend down the flanks more than 30 km from the summit as far as Lake Kivu; extensive lava flows from this volcano have covered 1,500 km2 of the western branch of the East African Rift.
Information Contacts: Observatoire Volcanologique de Goma (OVG), Departement de Geophysique, Centre de Recherche en Sciences Naturelles, Lwiro, D.S. Bukavu, DR Congo; Hawai'i Institute of Geophysics and Planetology (HIGP) - MODVOLC Thermal Alerts System, School of Ocean and Earth Science and Technology (SOEST), Univ. of Hawai'i, 2525 Correa Road, Honolulu, HI 96822, USA (URL: http://modis.higp.hawaii.edu/); MIROVA (Middle InfraRed Observation of Volcanic Activity), a collaborative project between the Universities of Turin and Florence (Italy) supported by the Centre for Volcanic Risk of the Italian Civil Protection Department (URL: http://www.mirovaweb.it/); NASA Global Sulfur Dioxide Monitoring Page, Atmospheric Chemistry and Dynamics Laboratory, NASA Goddard Space Flight Center (NASA/GSFC), 8800 Greenbelt Road, Goddard, Maryland, USA (URL: https://so2.gsfc.nasa.gov/); Copernicus Browser, Copernicus Data Space Ecosystem, European Space Agency (URL: https://dataspace.copernicus.eu/browser/); Charles Balagizi, Goma Volcano Observatory, Departement de Geophysique, Centre de Recherche en Sciences Naturelles, Lwiro, D.S. Bukavu, DR Congo.
Bagana (Papua New Guinea) — October 2023 Cite this Report
Bagana
Papua New Guinea
6.137°S, 155.196°E; summit elev. 1855 m
All times are local (unless otherwise noted)
Explosions, ash plumes, ashfall, and lava flows during April-September 2023
The remote volcano of Bagana is located in central Bougainville Island, Papua New Guinea. Recorded eruptions date back to 1842 and activity has consisted of effusive activity that has built a small lava dome in the summit crater and occasional explosions that produced pyroclastic flows. The most recent eruption has been ongoing since February 2000 and has produced occasional explosions, ash plumes, and lava flows. More recently, activity has been characterized by ongoing effusive activity and ash emissions (BGVN 48:04). This report updates activity from April through September 2023 that has consisted of explosions, ash plumes, ashfall, and lava flows, using information from the Darwin Volcanic Ash Advisory Center (VAAC) and satellite data.
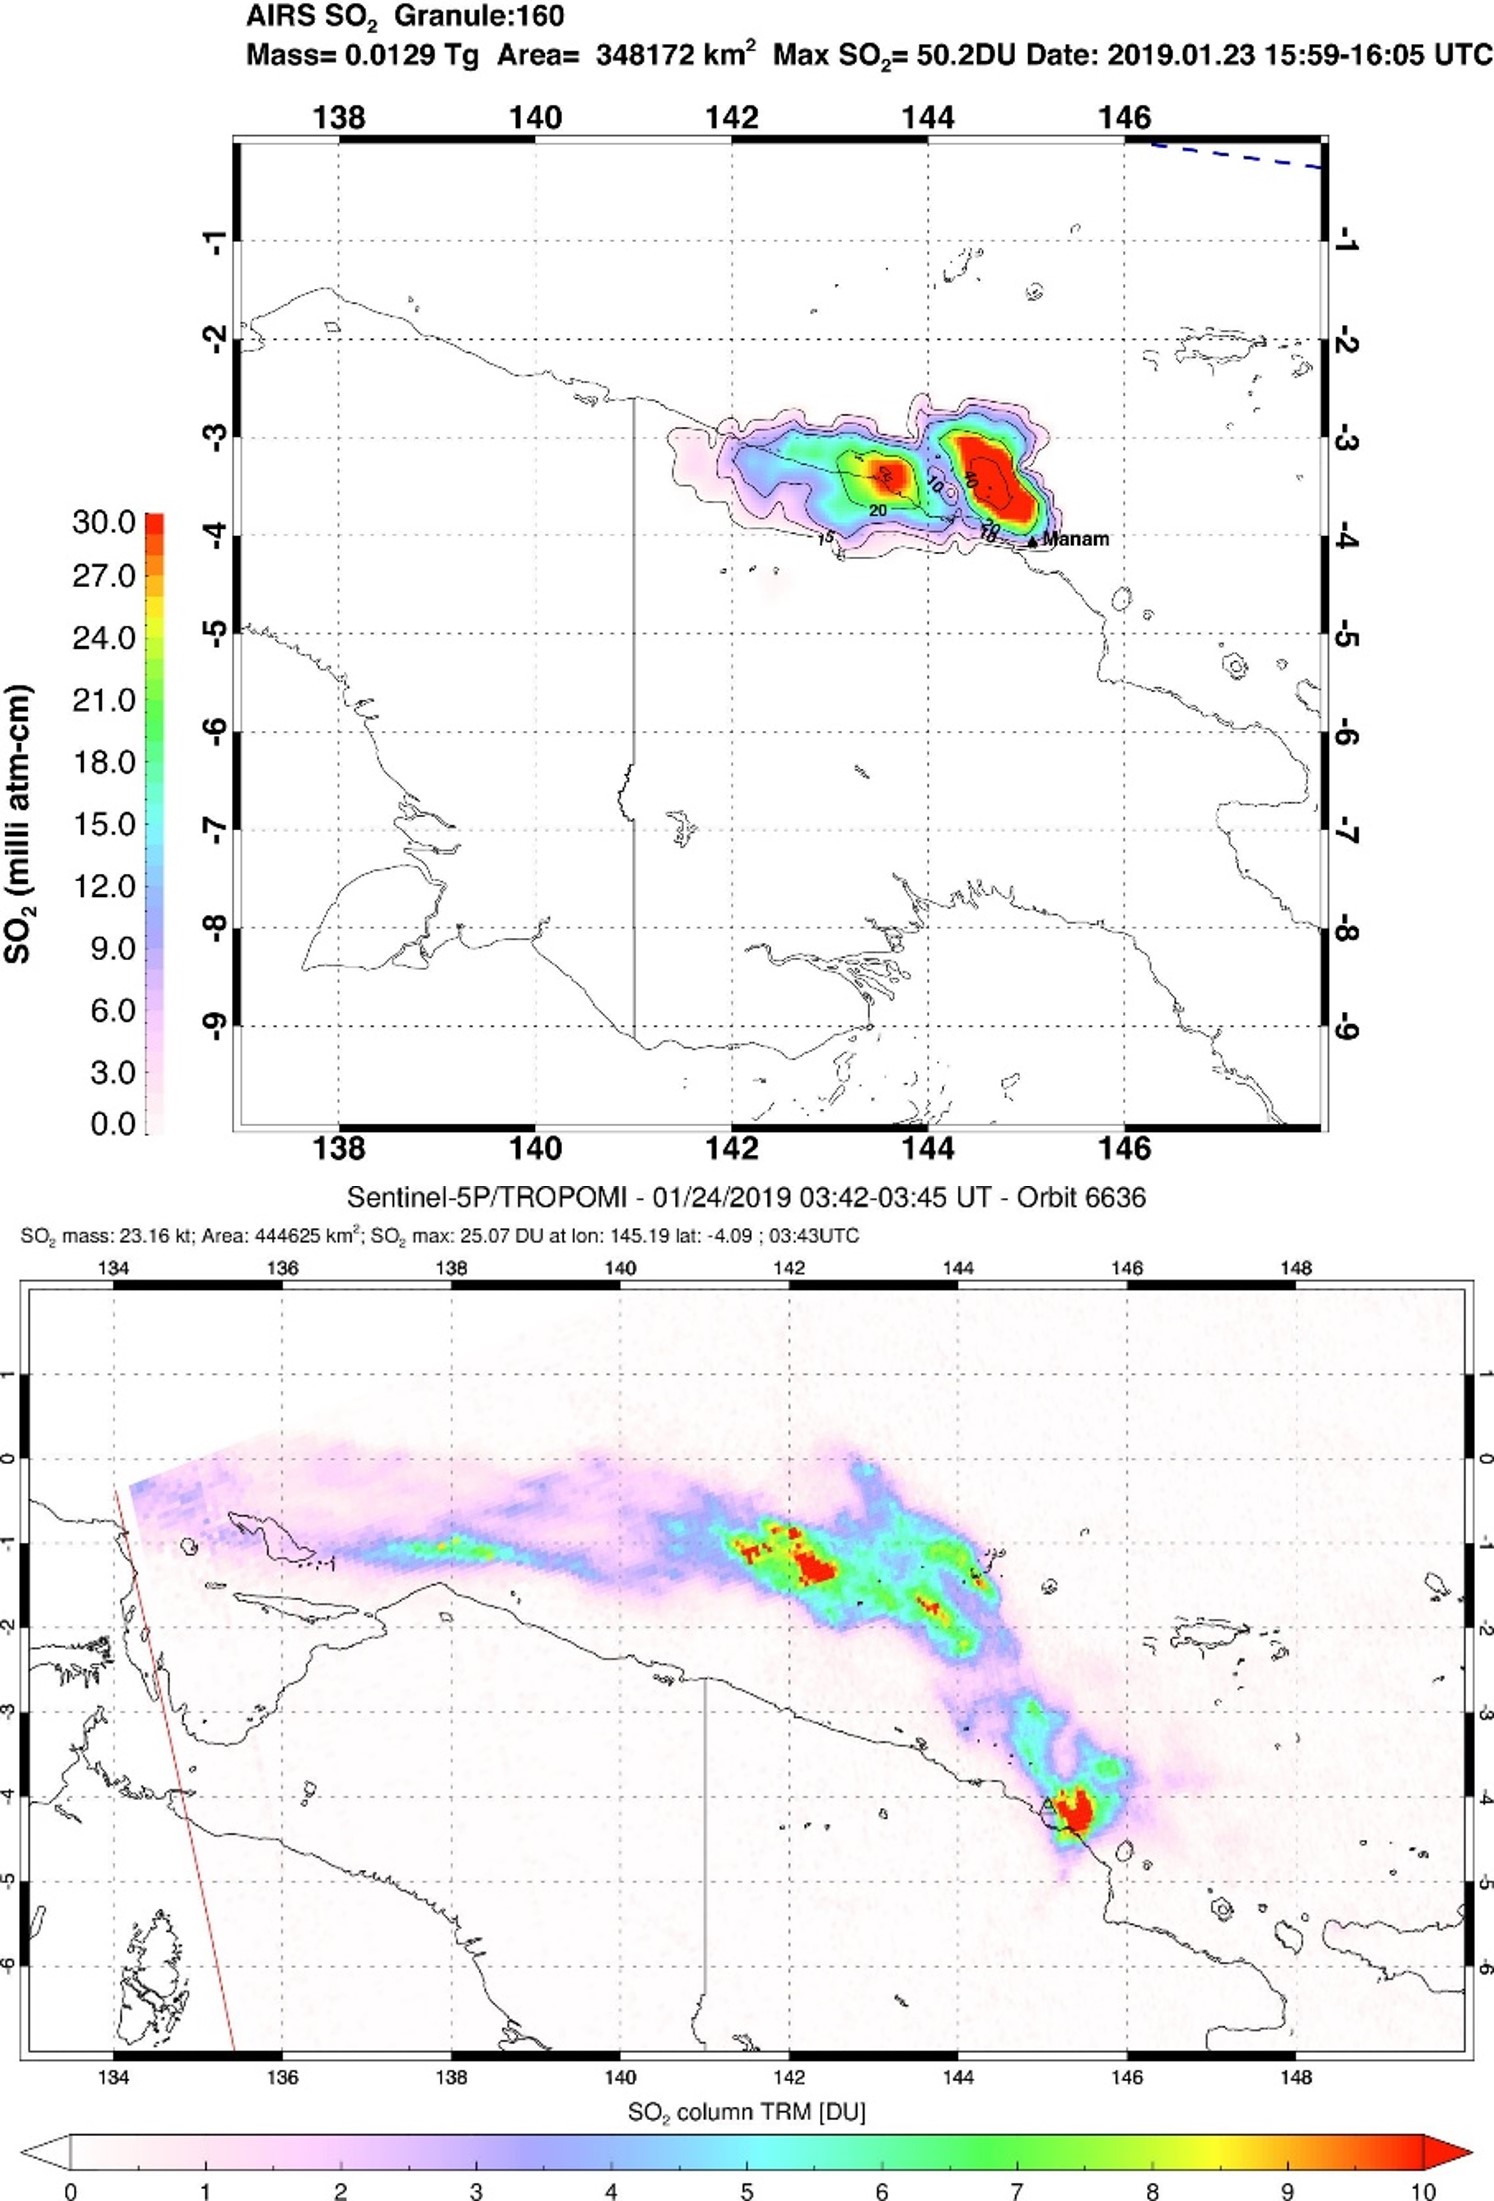
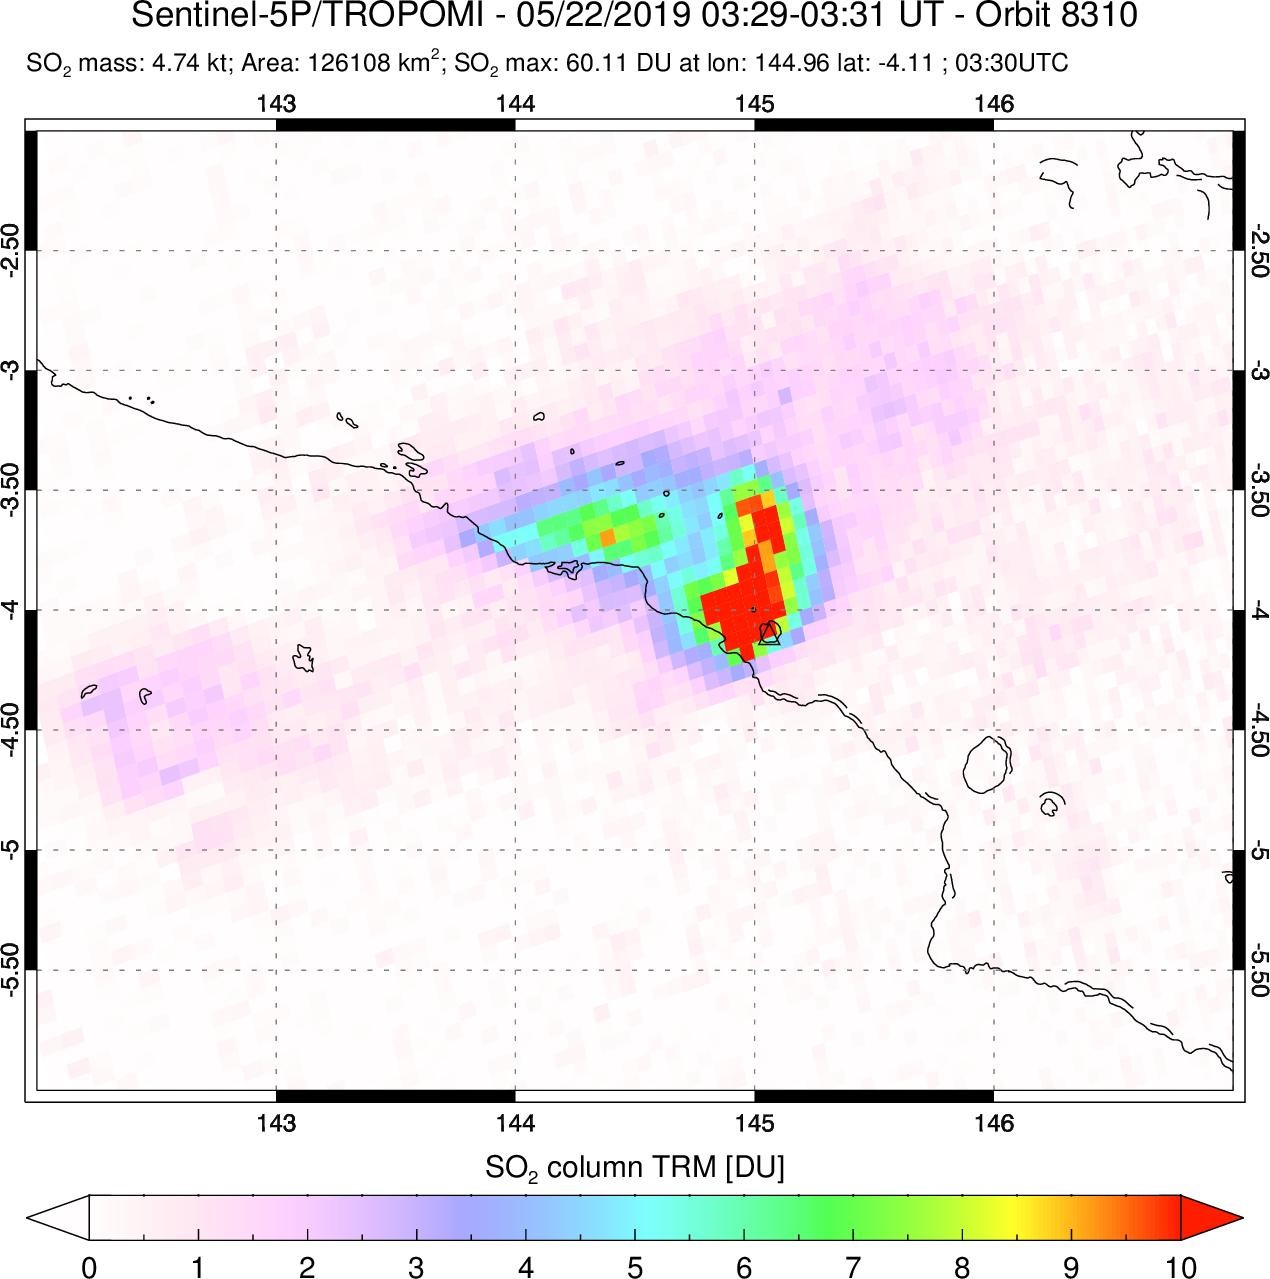
An explosive eruption was reported on 7 July that generated a large gas-and-ash plume to high altitudes and caused significant ashfall in local communities; the eruption plume had reached upper tropospheric (16-18 km altitude) altitudes by 2200, according to satellite images. Sulfur dioxide plumes were detected in satellite images on 8 July and indicated that the plume was likely a mixture of gas, ice, and ash. A report issued by the Autonomous Bougainville Government (ABG) (Torokina District, Education Section) on 10 July noted that significant ash began falling during 2000-2100 on 7 July and covered most areas in the Vuakovi, Gotana (9 km SW), Koromaketo, Laruma (25 km W) and Atsilima (27 km NW) villages. Pyroclastic flows also occurred, according to ground-based reports; small deposits confined to one drainage were inspected by RVO during an overflight on 17 July and were confirmed to be from the 7 July event. Ashfall continued until 10 July and covered vegetation, which destroyed bushes and gardens and contaminated rivers and streams.
RVO reported another eruption on 14 July. The Darwin VAAC stated that an explosive event started around 0830 on 15 July and produced an ash plume that rose to 16.5 km altitude by 1000 and drifted N, according to satellite images. The plume continued to drift N and remained visible through 1900, and by 2150 it had dissipated.
Ashfall likely from both the 7 and 15 July events impacted about 8,111 people in Torokina (20 km SW), including Tsito/Vuakovi, Gotana, Koromaketo, Kenaia, Longkogari, Kenbaki, Piva (13 km SW), and Atsinima, and in the Tsitovi district, according to ABG. Significant ashfall was also reported in Ruruvu (22 km N) in the Wakunai District of Central Bougainville, though the thickness of these deposits could not be confirmed. An evacuation was called for the villages in Wakunai, where heavy ashfall had contaminated water sources; the communities of Ruruvu, Togarau, Kakarapaia, Karauturi, Atao, and Kuritaturi were asked to evacuate to a disaster center at the Wakunai District Station, and communities in Torokina were asked to evacuate to the Piva District station. According to a news article, more than 7,000 people needed temporary accommodations, with about 1,000 people in evacuation shelters. Ashfall had deposited over a broad area, contaminating water supplies, affecting crops, and collapsing some roofs and houses in rural areas. Schools were temporarily shut down. Intermittent ash emissions continued through the end of July and drifted NNW, NW, and SW. Fine ashfall was reported on the coast of Torokina, and ash plumes also drifted toward Laruma and Atsilima.
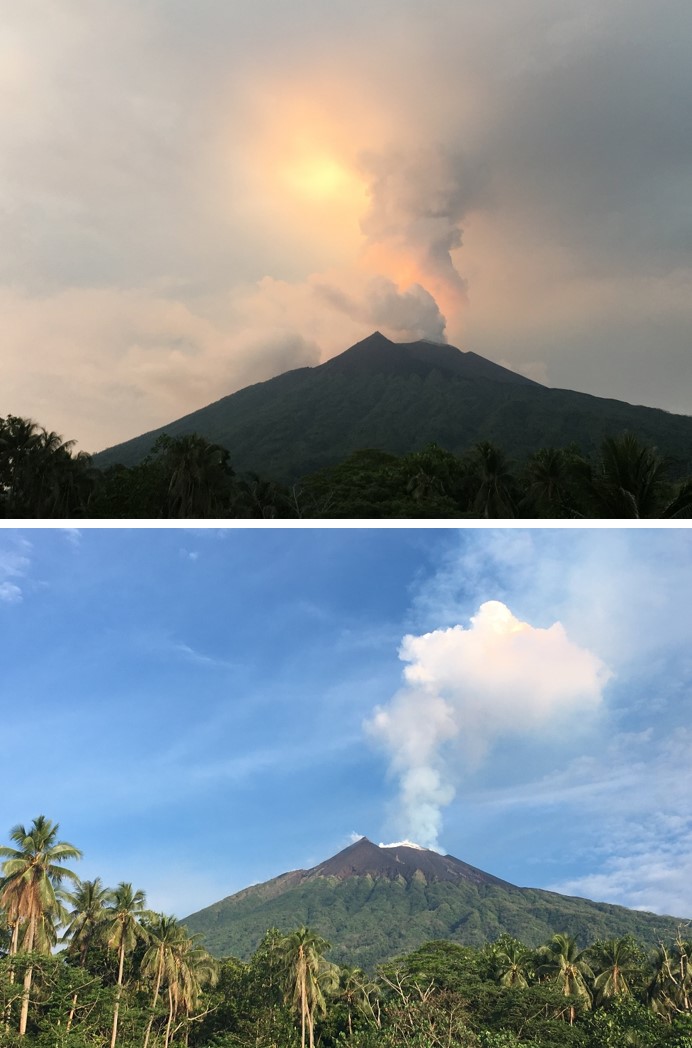
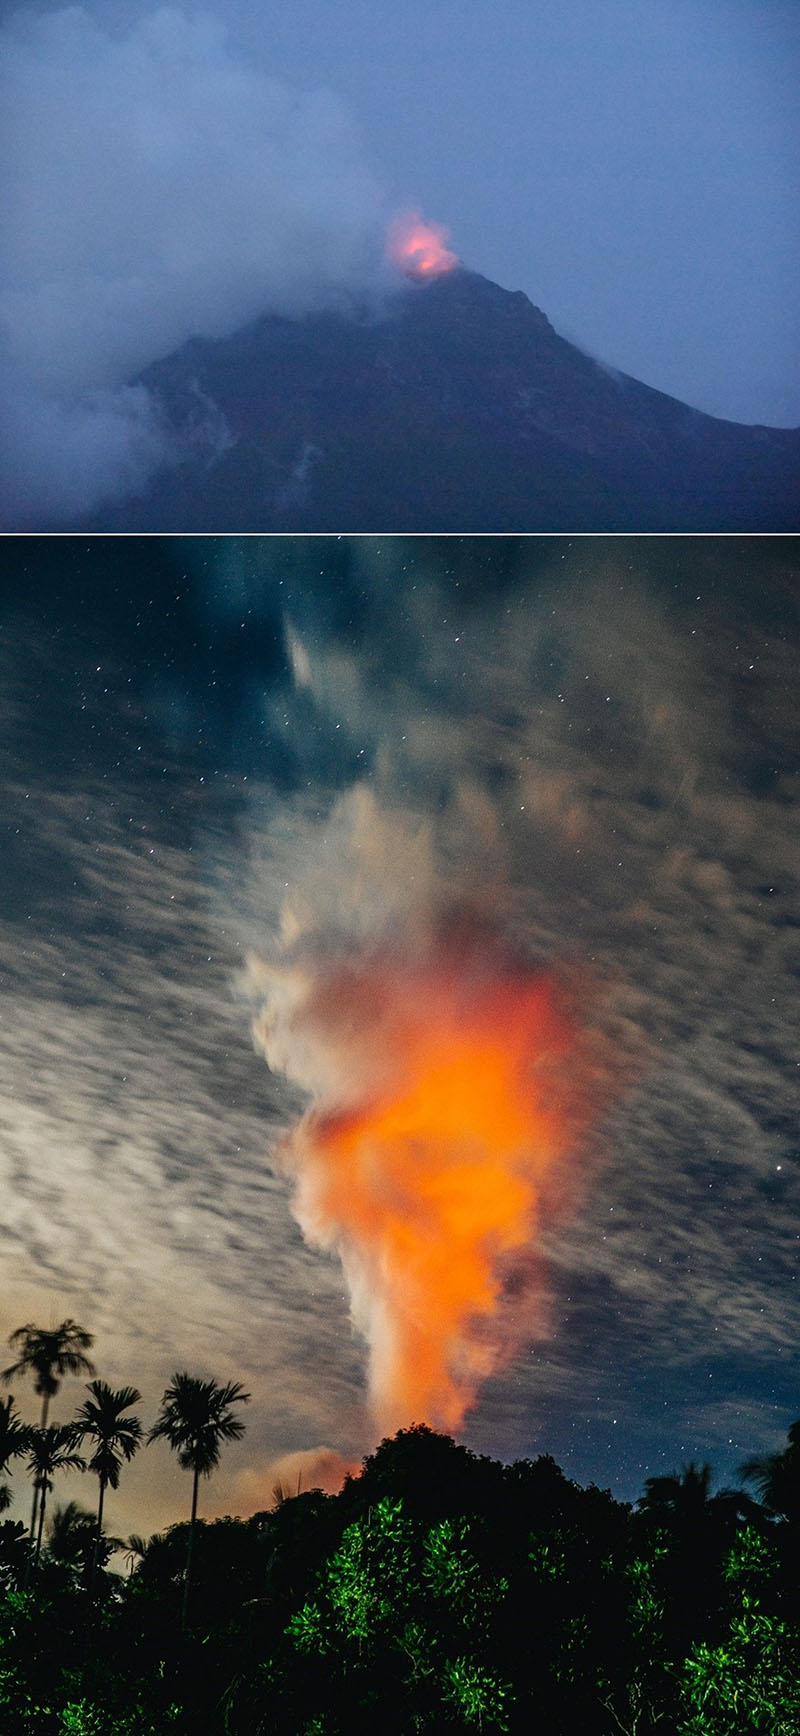
A small explosive eruption occurred at 2130 on 28 July that ejected material from the crater vents, according to reports from Torokina, in addition to a lava flow that contained two lobes. A second explosion was detected at 2157. Incandescence from the lava flow was visible from Piva as it descended the W flank around 2000 on 29 July (figure 47). The Darwin VAAC reported that a strong thermal anomaly was visible in satellite images during 30-31 July and that ash emissions rose to 2.4 km altitude and drifted WSW on 30 July. A ground report from RVO described localized emissions at 0900 on 31 July.
The Darwin VAAC reported that ash plumes were identified in satellite imagery at 0800 and 1220 on 12 August and rose to 2.1 km and 3 km altitude and drifted NW and W, respectively. A news report stated that aid was sent to more than 6,300 people that were adversely affected by the eruption. Photos taken during 17-19 August showed ash emissions rising no higher than 1 km above the summit and drifting SE. A small explosion generated an ash plume during the morning of 19 August. Deposits from small pyroclastic flows were also captured in the photos. Satellite images captured lava flows and pyroclastic flow deposits. Two temporary seismic stations were installed near Bagana on 17 August at distances of 7 km WSW (Vakovi station) and 11 km SW (Kepox station). The Kepox station immediately started to record continuous, low-frequency background seismicity.
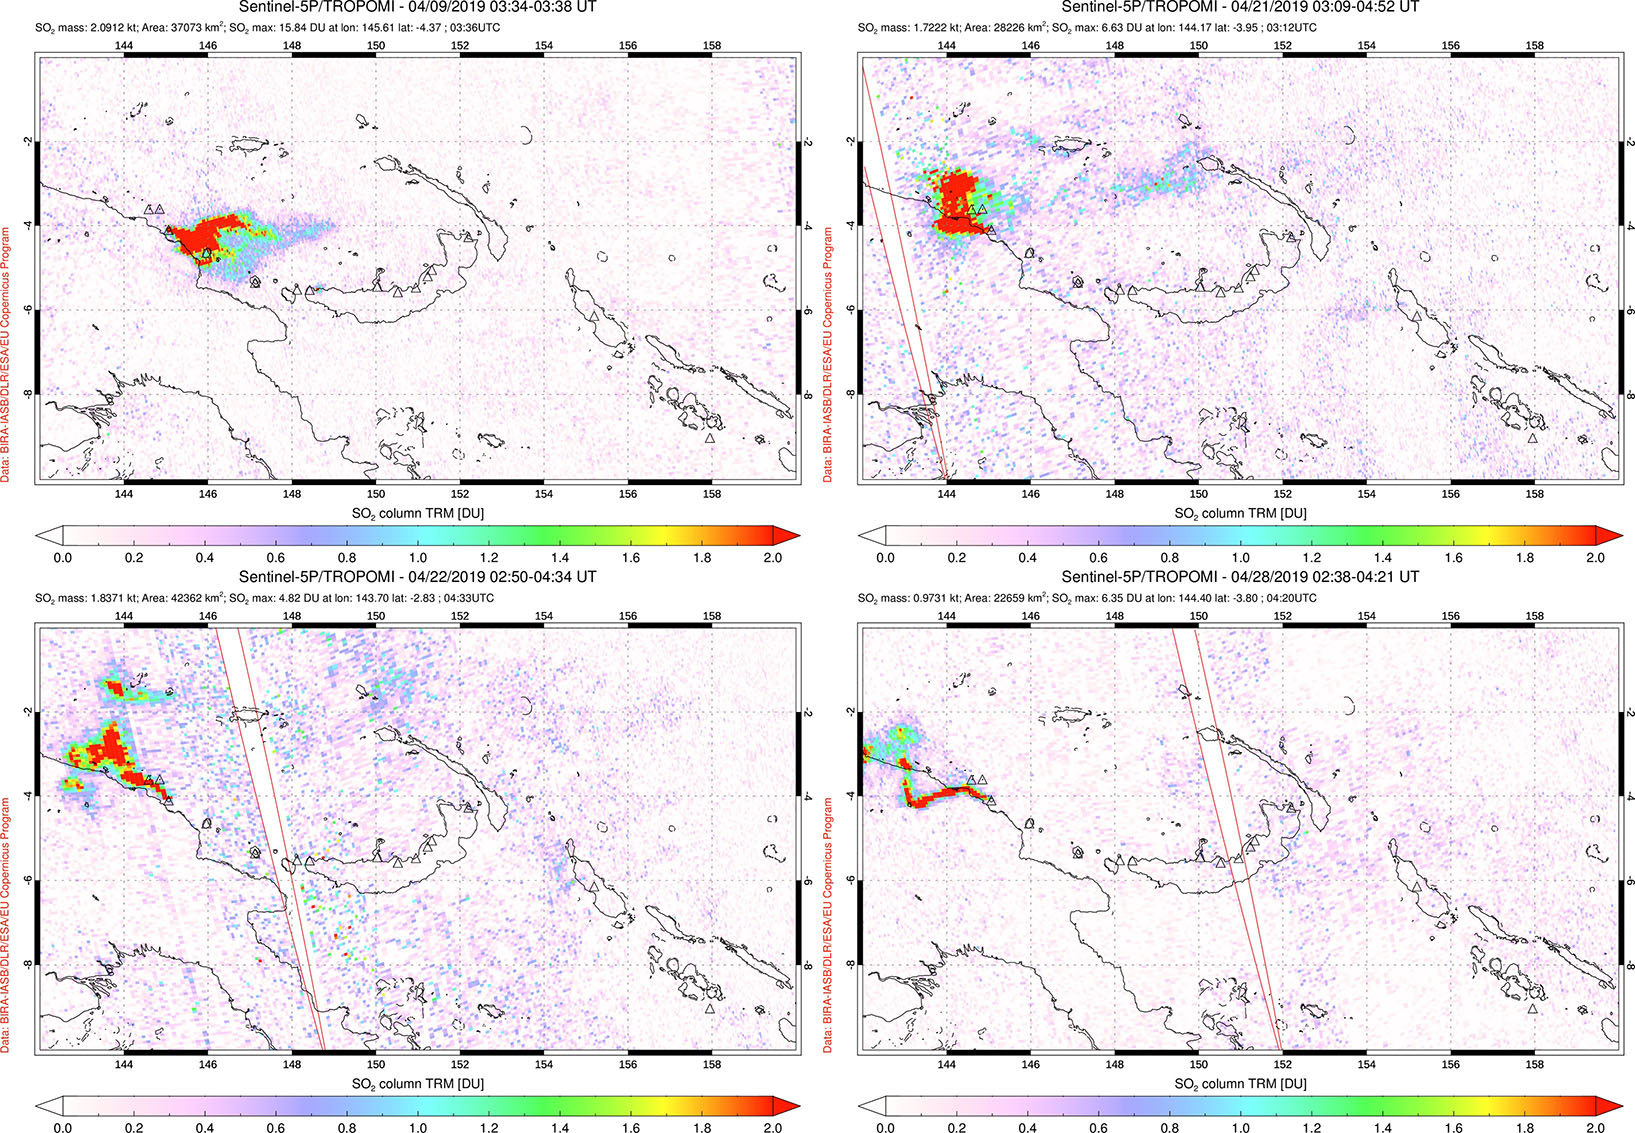
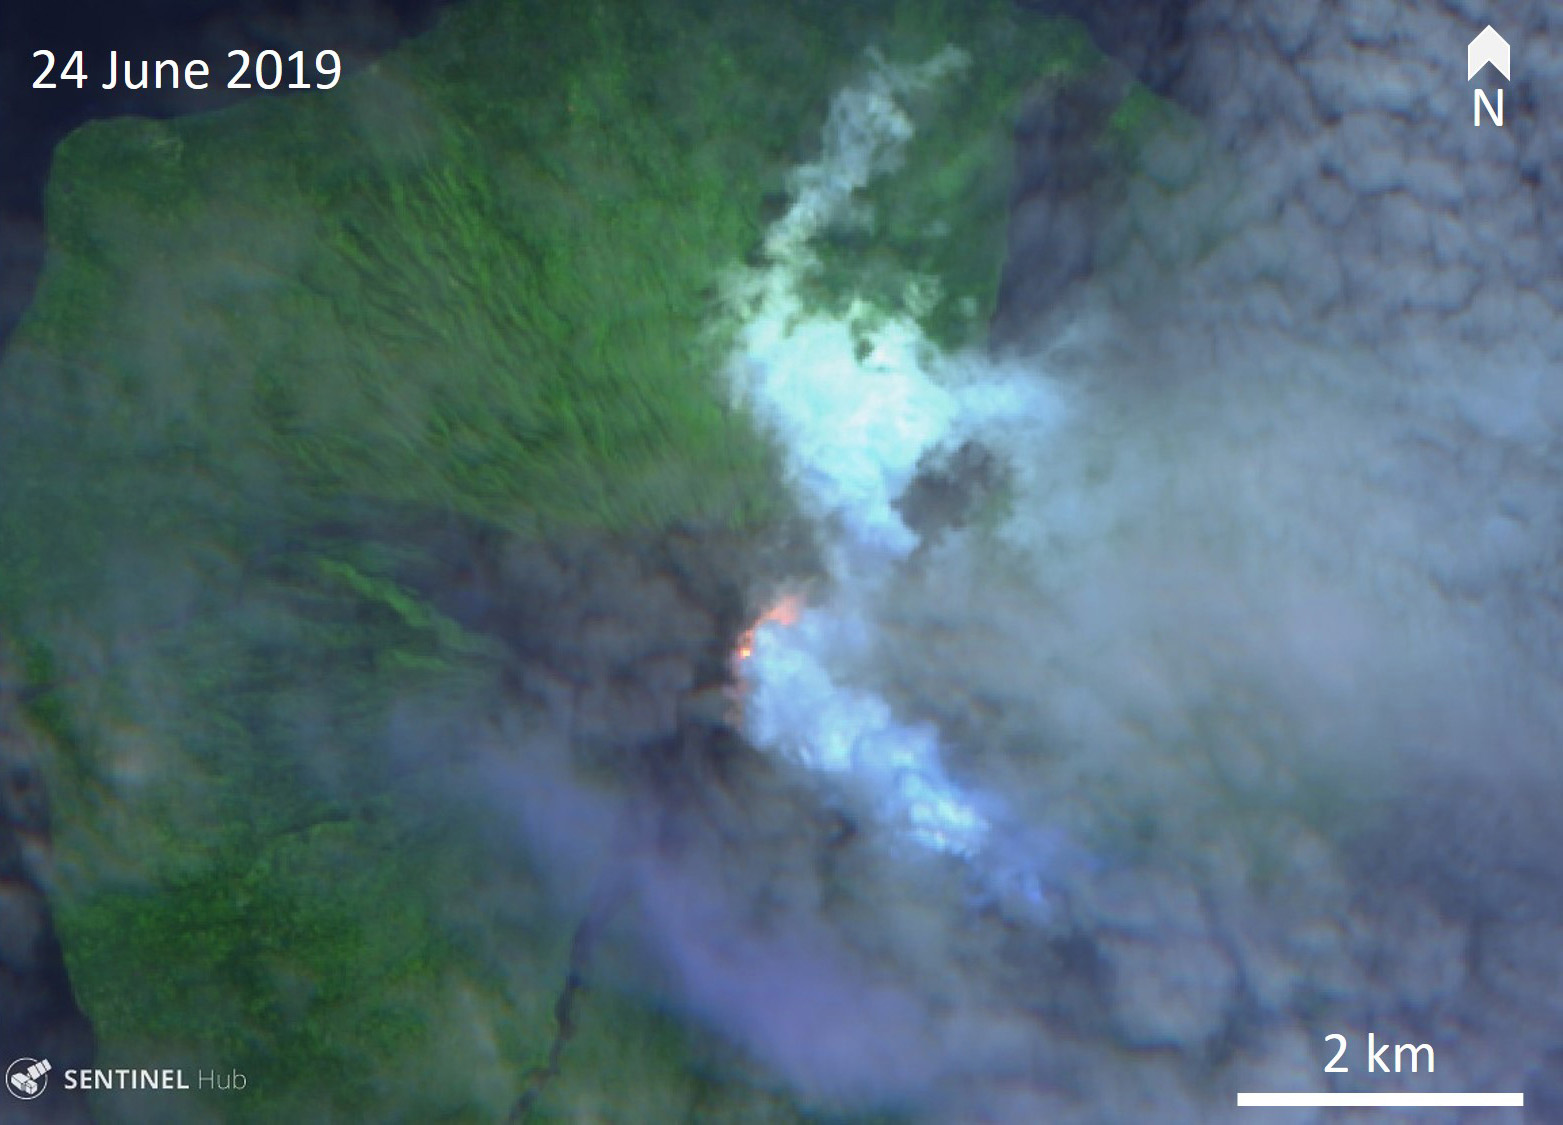
Satellite data. Little to no thermal activity was detected during April through mid-July 2023; only one anomaly was recorded during early April and one during early June, according to MIROVA (Middle InfraRed Observation of Volcanic Activity) data (figure 48). Thermal activity increased in both power and frequency during mid-July through September, although there were still some short gaps in detected activity. MODVOLC also detected increased thermal activity during August; thermal hotspots were detected a total of five times on 19, 20, and 27 August. Weak thermal anomalies were also captured in infrared satellite images on clear weather days throughout the reporting period on 7, 12, and 17 April, 27 May, 1, 6, 16, and 31 July, and 19 September (figure 48); a strong thermal anomaly was visible on 31 July. Distinct sulfur dioxide plumes that drifted generally NW were intermittently captured by the TROPOMI instrument on the Sentinel-5P satellite and sometimes exceeded two Dobson Units (DUs) (figure 49).
Geologic Background. Bagana volcano, in a remote portion of central Bougainville Island, is frequently active. This massive symmetrical cone was largely constructed by an accumulation of viscous andesitic lava flows. The entire edifice could have been constructed in about 300 years at its present rate of lava production. Eruptive activity is characterized by non-explosive effusion of viscous lava that maintains a small lava dome in the summit crater, although occasional explosive activity produces pyroclastic flows. Lava flows with tongue-shaped lobes up to 50 m thick and prominent levees descend the flanks on all sides.
Information Contacts: Rabaul Volcano Observatory (RVO), Geohazards Management Division, Department of Mineral Policy and Geohazards Management (DMPGM), PO Box 3386, Kokopo, East New Britain Province, Papua New Guinea; Darwin Volcanic Ash Advisory Centre (VAAC), Bureau of Meteorology, Northern Territory Regional Office, PO Box 40050, Casuarina, NT 0811, Australia (URL: http://www.bom.gov.au/info/vaac/); MIROVA (Middle InfraRed Observation of Volcanic Activity), a collaborative project between the Universities of Turin and Florence (Italy) supported by the Centre for Volcanic Risk of the Italian Civil Protection Department (URL: http://www.mirovaweb.it/); Hawai'i Institute of Geophysics and Planetology (HIGP) - MODVOLC Thermal Alerts System, School of Ocean and Earth Science and Technology (SOEST), Univ. of Hawai'i, 2525 Correa Road, Honolulu, HI 96822, USA (URL: http://modis.higp.hawaii.edu/); NASA Global Sulfur Dioxide Monitoring Page, Atmospheric Chemistry and Dynamics Laboratory, NASA Goddard Space Flight Center (NASA/GSFC), 8800 Greenbelt Road, Goddard, Maryland, USA (URL: https://so2.gsfc.nasa.gov/); Copernicus Browser, Copernicus Data Space Ecosystem, European Space Agency (URL: https://dataspace.copernicus.eu/browser/); Autonomous Bougainville Government, P.O Box 322, Buka, AROB, PNG (URL: https://abg.gov.pg/); Andrew Tupper (Twitter: @andrewcraigtupp); Simon Carn, Geological and Mining Engineering and Sciences, Michigan Technological University, 1400 Townsend Drive, Houghton, MI 49931, USA (URL: http://www.volcarno.com/, Twitter: @simoncarn); Radio NZ (URL: https://www.rnz.co.nz/news/pacific/494464/more-than-7-000-people-in-bougainville-need-temporary-accommodation-after-eruption); USAID, 1300 Pennsylvania Ave, NW, Washington DC 20004, USA (URL: https://www.usaid.gov/pacific-islands/press-releases/aug-08-2023-united-states-provides-immediate-emergency-assistance-support-communities-affected-mount-bagana-volcanic-eruptions).
Mayon (Philippines) — October 2023 Cite this Report
Mayon
Philippines
13.257°N, 123.685°E; summit elev. 2462 m
All times are local (unless otherwise noted)
Lava flows, pyroclastic flows, ash emissions, and seismicity during April-September 2023
Mayon is located in the Philippines and has steep upper slopes capped by a small summit crater. Historical eruptions date back to 1616 CE that have been characterized by Strombolian eruptions, lava flows, pyroclastic flows, and mudflows. Eruptions mostly originated from a central conduit. Pyroclastic flows and mudflows have commonly descended many of the approximately 40 drainages that surround the volcano. The most recent eruption occurred during June through October 2022 and consisted of lava dome growth and gas-and-steam emissions (BGVN 47:12). A new eruption was reported during late April 2023 and has included lava flows, pyroclastic density currents, ash emissions, and seismicity. This report covers activity during April through September 2023 based on daily bulletins from the Philippine Institute of Volcanology and Seismology (PHIVOLCS).
During April through September 2023, PHIVOLCS reported near-daily rockfall events, frequent volcanic earthquakes, and sulfur dioxide measurements. Gas-and-steam emissions rose 100-900 m above the crater and drifted in different directions. Nighttime crater incandescence was often visible during clear weather and was accompanied by incandescent avalanches of material. Activity notably increased during June when lava flows were reported on the S, SE, and E flanks (figure 52). The MIROVA graph (Middle InfraRed Observation of Volcanic Activity) showed strong thermal activity coincident with these lava flows, which remained active through September (figure 53). According to the MODVOLC thermal algorithm, a total of 110 thermal alerts were detected during the reporting period: 17 during June, 40 during July, 27 during August, and 26 during September. During early June, pyroclastic density currents (PDCs) started to occur more frequently.
Low activity was reported during much of April and May; gas-and-steam emissions rose 100-900 m above the crater and generally drifted in different directions. A total of 52 rockfall events and 18 volcanic earthquakes were detected during April and 147 rockfall events and 13 volcanic events during May. Sulfur dioxide flux measurements ranged between 400-576 tons per day (t/d) during April, the latter of which was measured on 29 April and between 162-343 t/d during May, the latter of which was measured on 13 May.
Activity during June increased, characterized by lava flows, pyroclastic density currents (PDCs), crater incandescence and incandescent rockfall events, gas-and-steam emissions, and continued seismicity. Weather clouds often prevented clear views of the summit, but during clear days, moderate gas-and-steam emissions rose 100-2,500 m above the crater and drifted in multiple directions. A total of 6,237 rockfall events and 288 volcanic earthquakes were detected. The rockfall events often deposited material on the S and SE flanks within 700-1,500 m of the summit crater and ash from the events drifted SW, S, SE, NE, and E. Sulfur dioxide emissions ranged between 149-1,205 t/d, the latter of which was measured on 10 June. Short-term observations from EDM and electronic tiltmeter monitoring indicated that the upper slopes were inflating since February 2023. Longer-term ground deformation parameters based on EDM, precise leveling, continuous GPS, and electronic tilt monitoring indicated that the volcano remained inflated, especially on the NW and SE flanks. At 1000 on 5 June the Volcano Alert Level (VAL) was raised to 2 (on a 0-5 scale). PHIVOLCS noted that although low-level volcanic earthquakes, ground deformation, and volcanic gas emissions indicated unrest, the steep increase in rockfall frequency may indicate increased dome activity.
A total of 151 dome-collapse PDCs occurred during 8-9 and 11-30 June, traveled 500-2,000 m, and deposited material on the S flank within 2 km of the summit crater. During 8-9 June the VAL was raised to 3. At approximately 1947 on 11 June lava flow activity was reported; two lobes traveled within 500 m from the crater and deposited material on the S (Mi-isi), SE (Bonga), and E (Basud) flanks. Weak seismicity accompanied the lava flow and slight inflation on the upper flanks. This lava flow remained active through 30 June, moving down the S and SE flank as far as 2.5 km and 1.8 km, respectively and depositing material up to 3.3 km from the crater. During 15-16 June traces of ashfall from the PDCs were reported in Sitio Buga, Nabonton, City of Ligao and Purok, and San Francisco, Municipality of Guinobatan. During 28-29 June there were two PDCs generated by the collapse of the lava flow front, which generated a light-brown ash plume 1 km high. Satellite monitors detected significant concentrations of sulfur dioxide beginning on 29 June. On 30 June PDCs primarily affected the Basud Gully on the E flank, the largest of which occurred at 1301 and lasted eight minutes, based on the seismic record. Four PDCs generated between 1800 and 2000 that lasted approximately four minutes each traveled 3-4 km on the E flank and generated an ash plume that rose 1 km above the crater and drifted N and NW. Ashfall was recorded in Tabaco City.
Similar strong activity continued during July; slow lava effusion remained active on the S and SE flanks and traveled as far as 2.8 km and 2.8 km, respectively and material was deposited as far as 4 km from the crater. There was a total of 6,983 rockfall events and 189 PDCs that affected the S, SE, and E flanks. The volcano network detected a total of 2,124 volcanic earthquakes. Continuous gas-and-steam emissions rose 200-2,000 m above the crater and drifted in multiple directions. Sulfur dioxide emissions averaged 792-4,113 t/d, the latter of which was measured on 28 July. During 2-4 July three PDCs were generated from the collapse of the lava flow and resulting light brown plumes rose 200-300 m above the crater. Continuous tremor pulses were reported beginning at 1547 on 3 July through 7 July at 1200, at 2300 on 8 July and going through 0300 on 10 July, and at 2300 on 16 July, as recorded by the seismic network. During 6-9 July there were 10 lava flow-collapse-related PDCs that generated light brown plumes 300-500 m above the crater. During 10-11 July light ashfall was reported in some areas of Mabinit, Legazpi City, Budiao and Salvacion, Daraga, and Camalig, Albay. By 18 July the lava flow advanced 600 m on the E flank as well.
During 1733 on 18 July and 0434 on 19 July PHIVOLCS reported 30 “ashing” events, which are degassing events accompanied by audible thunder-like sounds and entrained ash at the crater, which produced short, dark plumes that drifted SW. These events each lasted 20-40 seconds, and plume heights ranged from 150-300 m above the crater, as recorded by seismic, infrasound, visual, and thermal monitors. Three more ashing events occurred during 19-20 July. Short-term observations from electronic tilt and GPS monitoring indicate deflation on the E lower flanks in early July and inflation on the NW middle flanks during the third week of July. Longer-term ground deformation parameters from EDM, precise leveling, continuous GPS, and electronic tilt monitoring indicated that the volcano was still generally inflated relative to baseline levels. A short-lived lava pulse lasted 28 seconds at 1956 on 21 July, which was accompanied by seismic and infrasound signals. By 22 July, the only lava flow that remained active was on the SE flank, and continued to extend 3.4 km, while those on the S and E flanks weakened markedly. One ashing event was detected during 30-31 July, whereas there were 57 detected during 31 July-1 August; according to PHIVOLCS beginning at approximately 1800 on 31 July eruptive activity was dominated by phases of intermittent ashing, as well as increased in the apparent rates of lava effusion from the summit crater. The ashing phases consisted of discrete events recorded as low-frequency volcanic earthquakes (LFVQ) typically 30 seconds in duration, based on seismic and infrasound signals. Gray ash plume rose 100 m above the crater and generally drifted NE. Shortly after these ashing events began, new lava began to effuse rapidly from the crater, feeding the established flowed on the SE, E, and E flanks and generating frequent rockfall events.
Intensified unrest persisted during August. There was a total of 4,141 rockfall events, 2,881 volcanic earthquakes, which included volcanic tremor events, 32 ashing events, and 101 PDCs detected throughout the month. On clear weather days, gas-and-steam emissions rose 300-1,500 m above the crater and drifted in different directions (figure 54). Sulfur dioxide emissions averaged 735-4,756 t/d, the higher value of which was measured on 16 August. During 1-2 August the rate of lava effusion decreased, but continued to feed the flows on the SE, S, and E flanks, maintaining their advances to 3.4 km, 2.8 km, and 1.1 km from the crater, respectively (figure 55). Rockfall and PDCs generated by collapses at the lava flow margins and from the summit dome deposited material within 4 km of the crater. During 3-4 August there were 10 tremor events detected that lasted 1-4 minutes. Short-lived lava pulse lasted 35 seconds and was accompanied by seismic and infrasound signals at 0442 on 6 August. Seven collapses were recorded at the front of the lava flow during 12-14 August.
During September, similar activity of slow lava effusion, PDCs, gas-and-steam emissions, and seismicity continued. There was a total of 4,452 rockfall events, 329 volcanic earthquakes, which included volcanic tremor events, two ashing events, and 85 PDCs recorded throughout the month. On clear weather days, gas-and-steam emissions rose 100-1,500 m above the crater and drifted in multiple directions. Sulfur dioxide emissions averaged 609-2,252 t/d, the higher average of which was measured on 6 September. Slow lava effusion continued advancing on the SE, S, and E flanks, maintaining lengths of 3.4 km, 2.8 km, and 1.1 km, respectively. Rockfall and PDC events generated by collapses along the lava flow margins and at the summit dome deposited material within 4 km of the crater.
Geologic Background. Symmetrical Mayon, which rises above the Albay Gulf NW of Legazpi City, is the most active volcano of the Philippines. The steep upper slopes are capped by a small summit crater. Recorded eruptions since 1616 CE range from Strombolian to basaltic Plinian, with cyclical activity beginning with basaltic eruptions, followed by longer periods of andesitic lava flows. Eruptions occur predominately from the central conduit and have also produced lava flows that travel far down the flanks. Pyroclastic density currents and mudflows have commonly swept down many of the approximately 40 ravines that radiate from the summit and have often damaged populated lowland areas. A violent eruption in 1814 killed more than 1,200 people and devastated several towns.
Information Contacts: Philippine Institute of Volcanology and Seismology (PHIVOLCS), Department of Science and Technology, University of the Philippines Campus, Diliman, Quezon City, Philippines (URL: http://www.phivolcs.dost.gov.ph/); MIROVA (Middle InfraRed Observation of Volcanic Activity), a collaborative project between the Universities of Turin and Florence (Italy) supported by the Centre for Volcanic Risk of the Italian Civil Protection Department (URL: http://www.mirovaweb.it/); Hawai'i Institute of Geophysics and Planetology (HIGP) - MODVOLC Thermal Alerts System, School of Ocean and Earth Science and Technology (SOEST), Univ. of Hawai'i, 2525 Correa Road, Honolulu, HI 96822, USA (URL: http://modis.higp.hawaii.edu/); Copernicus Browser, Copernicus Data Space Ecosystem, European Space Agency (URL: https://dataspace.copernicus.eu/browser/); William Rogers, Legazpi City, Albay Province, Philippines.
Nishinoshima (Japan) — October 2023 Cite this Report
Nishinoshima
Japan
27.247°N, 140.874°E; summit elev. 100 m
All times are local (unless otherwise noted)
Eruption plumes and gas-and-steam plumes during May-August 2023
Nishinoshima, located about 1,000 km S of Tokyo, is a small island in the Ogasawara Arc in Japan. The island is the summit of a massive submarine volcano that has prominent submarine peaks to the S, W, and NE. Eruptions date back to 1973 and the current eruption period began in October 2022. Recent activity has consisted of small ash plumes and fumarolic activity (BGVN 48:07). This report covers activity during May through August 2023, using information from monthly reports of the Japan Meteorological Agency (JMA) monthly reports and satellite data.
Activity during May through June was relatively low. The Japan Coast Guard (JCG) did overflights on 14 and 22 June and reported white gas-and-steam emissions rising 600 m and 1,200 m from the central crater of the pyroclastic cone, respectively (figure 125). In addition, multiple white gas-and-steam emissions rose from the inner rim of the W side of the crater and from the SE flank of the pyroclastic cone. Discolored brown-to-green water was observed around almost the entire perimeter of the island; on 22 June light green discolored water was observed off the S coast of the island.
Observations from the Himawari meteorological satellite confirmed an eruption on 9 and 10 July. An eruption plume rose 1.6 km above the crater and drifted N around 1300 on 9 July. Satellite images acquired at 1420 and 2020 on 9 July and at 0220 on 10 July showed continuing emissions that rose 1.3-1.6 km above the crater and drifted NE and N. The Tokyo VAAC reported that an ash plume seen by a pilot and identified in a satellite image at 0630 on 21 July rose to 3 km altitude and drifted S.
Aerial observations conducted by JCG on 8 August showed a white-and-gray plume rising from the central crater of the pyroclastic cone, and multiple white gas-and-steam emissions were rising from the inner edge of the western crater and along the NW-SE flanks of the island (figure 126). Brown-to-green discolored water was also noted around the perimeter of the island.
Intermittent low-to-moderate power thermal anomalies were recorded in the MIROVA graph (Middle InfraRed Observation of Volcanic Activity), showing an increase in both frequency and power beginning in July (figure 127). This increase in activity coincides with eruptive activity on 9 and 10 July, characterized by eruption plumes. According to the MODVOLC thermal alert algorithm, one thermal hotspot was recorded on 20 July. Weak thermal anomalies were also detected in infrared satellite imagery, accompanied by strong gas-and-steam plumes (figure 128).
Geologic Background. The small island of Nishinoshima was enlarged when several new islands coalesced during an eruption in 1973-74. Multiple eruptions that began in 2013 completely covered the previous exposed surface and continued to enlarge the island. The island is the summit of a massive submarine volcano that has prominent peaks to the S, W, and NE. The summit of the southern cone rises to within 214 m of the ocean surface 9 km SSE.
Information Contacts: Japan Meteorological Agency (JMA), 1-3-4 Otemachi, Chiyoda-ku, Tokyo 100-8122, Japan (URL: http://www.jma.go.jp/jma/indexe.html); Tokyo Volcanic Ash Advisory Center (VAAC), 1-3-4 Otemachi, Chiyoda-ku, Tokyo 100-8122, Japan (URL: http://ds.data.jma.go.jp/svd/vaac/data/); MIROVA (Middle InfraRed Observation of Volcanic Activity), a collaborative project between the Universities of Turin and Florence (Italy) supported by the Centre for Volcanic Risk of the Italian Civil Protection Department (URL: http://www.mirovaweb.it/); Copernicus Browser, Copernicus Data Space Ecosystem, European Space Agency (URL: https://dataspace.copernicus.eu/browser/).
Krakatau (Indonesia) — October 2023 Cite this Report
Krakatau
Indonesia
6.1009°S, 105.4233°E; summit elev. 285 m
All times are local (unless otherwise noted)
White gas-and-steam plumes and occasional ash plumes during May-August 2023
Krakatau is located in the Sunda Strait between Java and Sumatra, Indonesia. Caldera collapse during the catastrophic 1883 eruption destroyed Danan and Perbuwatan cones and left only a remnant of Rakata. The post-collapse cone of Anak Krakatau (Child of Krakatau) was constructed within the 1883 caldera at a point between the former Danan and Perbuwatan cones; it has been the site of frequent eruptions since 1927. The current eruption period began in May 2021 and has recently consisted of Strombolian eruptions and ash plumes (BGVN 48:07). This report describes lower levels of activity consisting of ash and white gas-and-steam plumes during May through August 2023, based on information provided by the Indonesian Center for Volcanology and Geological Hazard Mitigation, referred to as Pusat Vulkanologi dan Mitigasi Bencana Geologi (PVMBG), MAGMA Indonesia, and satellite data.
Activity was relatively low during May and June. Daily white gas-and-steam emissions rose 25-200 m above the crater and drifted in different directions. Five ash plumes were detected at 0519 on 10 May, 1241 on 11 May, 0920 on 12 May, 2320 on 12 May, and at 0710 on 13 May, and rose 1-2.5 km above the crater and drifted SW. A webcam image taken on 12 May showed ejection of incandescent material above the vent. A total of nine ash plumes were detected during 6-11 June: at 1434 and 00220 on 6 and 7 June the ash plumes rose 500 m above the crater and drifted NW, at 1537 on 8 June the ash plume rose 1 km above the crater and drifted SW, at 0746 and at 0846 on 9 June the ash plumes rose 800 m and 3 km above the crater and drifted SW, respectively, at 0423, 1431, and 1750 on 10 June the ash plumes rose 2 km, 1.5 km, and 3.5 km above the crater and drifted NW, respectively, and at 0030 on 11 June an ash plume rose 2 km above the crater and drifted NW. Webcam images taken on 10 and 11 June at 0455 and 0102, respectively, showed incandescent material ejected above the vent. On 19 June an ash plume at 0822 rose 1.5 km above the crater and drifted SE.
Similar low activity of white gas-and-steam emissions and few ash plumes were reported during July and August. Daily white gas-and-steam emissions rose 25-300 m above the crater and drifted in multiple directions. Three ash plumes were reported at 0843, 0851, and 0852 on 20 July that rose 500-2,000 m above the crater and drifted NW.
The MIROVA (Middle InfraRed Observation of Volcanic Activity) graph of MODIS thermal anomaly data showed intermittent low-to-moderate power thermal anomalies during May through August 2023 (figure 140). Although activity was often obscured by weather clouds, a thermal anomaly was visible in an infrared satellite image of the crater on 12 May, accompanied by an eruption plume that drifted SW (figure 141).
Geologic Background. The renowned Krakatau (frequently mis-named as Krakatoa) volcano lies in the Sunda Strait between Java and Sumatra. Collapse of an older edifice, perhaps in 416 or 535 CE, formed a 7-km-wide caldera. Remnants of that volcano are preserved in Verlaten and Lang Islands; subsequently the Rakata, Danan, and Perbuwatan cones were formed, coalescing to create the pre-1883 Krakatau Island. Caldera collapse during the catastrophic 1883 eruption destroyed Danan and Perbuwatan, and left only a remnant of Rakata. This eruption caused more than 36,000 fatalities, most as a result of tsunamis that swept the adjacent coastlines of Sumatra and Java. Pyroclastic surges traveled 40 km across the Sunda Strait and reached the Sumatra coast. After a quiescence of less than a half century, the post-collapse cone of Anak Krakatau (Child of Krakatau) was constructed within the 1883 caldera at a point between the former Danan and Perbuwatan cones. Anak Krakatau has been the site of frequent eruptions since 1927.
Information Contacts: Pusat Vulkanologi dan Mitigasi Bencana Geologi (PVMBG, also known as Indonesian Center for Volcanology and Geological Hazard Mitigation, CVGHM), Jalan Diponegoro 57, Bandung 40122, Indonesia (URL: http://www.vsi.esdm.go.id/); MAGMA Indonesia, Kementerian Energi dan Sumber Daya Mineral (URL: https://magma.esdm.go.id/v1); MIROVA (Middle InfraRed Observation of Volcanic Activity), a collaborative project between the Universities of Turin and Florence (Italy) supported by the Centre for Volcanic Risk of the Italian Civil Protection Department (URL: http://www.mirovaweb.it/); Copernicus Browser, Copernicus Data Space Ecosystem, European Space Agency (URL: https://dataspace.copernicus.eu/browser/).
Villarrica (Chile) — October 2023 Cite this Report
Villarrica
Chile
39.42°S, 71.93°W; summit elev. 2847 m
All times are local (unless otherwise noted)
Strombolian activity, gas-and-ash emissions, and crater incandescence during April-September 2023
Villarrica, in central Chile, consists of a 2-km-wide caldera that formed about 3,500 years ago and is located at the base of the presently active cone at the NW margin of a 6-km-wide caldera. Historical eruptions eruptions date back to 1558 and have been characterized by mild-to-moderate explosive activity with occasional lava effusions. The current eruption period began in December 2014 and has recently consisted of nighttime crater incandescence, ash emissions, and seismicity (BGVN 48:04). This report covers activity during April through September 2023 and describes occasional Strombolian activity, gas-and-ash emissions, and nighttime crater incandescence. Information for this report primarily comes from the Southern Andes Volcano Observatory (Observatorio Volcanológico de Los Andes del Sur, OVDAS), part of Chile's National Service of Geology and Mining (Servicio Nacional de Geología y Minería, SERNAGEOMIN) and satellite data.
Seismicity during April consisted of long period (LP) events and tremor (TRE); a total of 9,413 LP-type events and 759 TR-type events were detected throughout the month. Nighttime crater incandescence persisted and was visible in the degassing column. Sulfur dioxide data was obtained using Differential Absorption Optical Spectroscopy Equipment (DOAS) that showed an average value of 1,450 ± 198 tons per day (t/d) during 1-15 April and 1,129 ± 201 t/d during 16-30 April, with a maximum daily value of 2,784 t/d on 9 April. Gas-and-steam emissions of variable intensities rose above the active crater as high as 1.3 km above the crater on 13 April. Strombolian explosions were not observed and there was a slight decrease in the lava lake level.
There were 14,123 LP-type events and 727 TR-type events detected during May. According to sulfur dioxide measurements taken with DOAS equipment, the active crater emitted an average value of 1,826 ± 482 t/d during 1-15 May and 912 ± 41 t/d during 16-30 May, with a daily maximum value of 5,155 t/d on 13 May. Surveillance cameras showed continuous white gas-and-steam emissions that rose as high as 430 m above the crater on 27 May. Nighttime incandescence illuminated the gas column less than 300 m above the crater rim was and no pyroclastic emissions were reported. A landslide was identified on 13 May on the E flank of the volcano 50 m from the crater rim and extending 300 m away; SERNAGEOMIN noted that this event may have occurred on 12 May. During the morning of 27 and 28 May minor Strombolian explosions characterized by incandescent ejecta were recorded at the crater rim; the last reported Strombolian explosions had occurred at the end of March.
Seismic activity during June consisted of five volcano-tectonic (VT)-type events, 21,606 LP-type events, and 2,085 TR-type events. The average value of sulfur dioxide flux obtained by DOAS equipment was 1,420 ± 217 t/d during 1-15 June and 2,562 ± 804 t/d, with a maximum daily value of 4,810 t/d on 17 June. White gas-and-steam emissions rose less than 480 m above the crater; frequent nighttime crater incandescence was reflected in the degassing plume. On 12 June an emission rose 100 m above the crater and drifted NNW. On 15 June one or several emissions resulted in ashfall to the NE as far as 5.5 km from the crater, based on a Skysat satellite image. Several Strombolian explosions occurred within the crater; activity on 15 June was higher energy and ejected blocks 200-300 m on the NE slope. Surveillance cameras showed white gas-and-steam emissions rising 480 m above the crater on 16 June. On 19 and 24 June low-intensity Strombolian activity was observed, ejecting material as far as 200 m from the center of the crater to the E.
During July, seismicity included 29,319 LP-type events, 3,736 TR-type events, and two VT-type events. DOAS equipment recorded two days of sulfur dioxide emissions of 4,220 t/d and 1,009 t/d on 1 and 13 July, respectively. Constant nighttime incandescence was also recorded and was particularly noticeable when accompanied by eruptive columns on 12 and 16 July. Minor explosive events were detected in the crater. According to Skysat satellite images taken on 12, 13, and 16 July, ashfall deposits were identified 155 m S of the crater. According to POVI, incandescence was visible from two vents on the crater floor around 0336 on 12 July. Gas-and-ash emissions rose as high as 1.2 km above the crater on 13 July and drifted E and NW. A series of gas-and-steam pulses containing some ash deposited material on the upper E flank around 1551 on 13 July. During 16-31 July, average sulfur dioxide emissions of 1,679 ± 406 t/d were recorded, with a maximum daily value of 2,343 t/d on 28 July. Fine ash emissions were also reported on 16, 17, and 23 July.
Seismicity persisted during August, characterized by 27,011 LP-type events, 3,323 TR-type events, and three VT-type events. The average value of sulfur dioxide measurements taken during 1-15 August was 1,642 ± 270 t/d and 2,207 ± 4,549 t/d during 16-31 August, with a maximum daily value of 3,294 t/d on 27 August. Nighttime crater incandescence remained visible in degassing columns. White gas-and-steam emissions rose 480 m above the crater on 6 August. According to a Skysat satellite image from 6 August, ash accumulation was observed proximal to the crater and was mainly distributed toward the E slope. White gas-and-steam emissions rose 320 m above the crater on 26 August. Nighttime incandescence and Strombolian activity that generated ash emissions were reported on 27 August.
Seismicity during September was characterized by five VT-type events, 12,057 LP-type events, and 2,058 TR-type events. Nighttime incandescence persisted. On 2 September an ash emission rose 180 m above the crater and drifted SE at 1643 (figure 125) and a white gas-and-steam plume rose 320 m above the crater. According to the Buenos Aires VAAC, periods of continuous gas-and-ash emissions were visible in webcam images from 1830 on 2 September to 0110 on 3 September. Strombolian activity was observed on 2 September and during the early morning of 3 September, the latter event of which generated an ash emission that rose 60 m above the crater and drifted 100 m from the center of the crater to the NE and SW. Ashfall was reported to the SE and S as far as 750 m from the crater. The lava lake was active during 3-4 September and lava fountaining was visible for the first time since 26 March 2023, according to POVI. Fountains captured in webcam images at 2133 on 3 September and at 0054 on 4 September rose as high as 60 m above the crater rim and ejected material onto the upper W flank. Sulfur dioxide flux of 1,730 t/d and 1,281 t/d was measured on 3 and 4 September, respectively, according to data obtained by DOAS equipment.
Strong Strombolian activity and larger gas-and-ash plumes were reported during 18-20 September. On 18 September activity was also associated with energetic LP-type events and notable sulfur dioxide fluxes (as high as 4,277 t/d). On 19 September Strombolian activity and incandescence were observed. On 20 September at 0914 ash emissions rose 50 m above the crater and drifted SSE, accompanied by Strombolian activity that ejected material less than 100 m SSE, causing fall deposits on that respective flank. SERNAGEOMIN reported that a Planet Scope satellite image taken on 20 September showed the lava lake in the crater, measuring 32 m x 35 m and an area of 0.001 km2. Several ash emissions were recorded at 0841, 0910, 1251, 1306, 1312, 1315, and 1324 on 23 September and rose less than 150 m above the crater. The sulfur dioxide flux value was 698 t/d on 23 September and 1,097 t/d on 24 September. On 24 September the Volcanic Alert Level (VAL) was raised to Orange (the third level on a four-color scale). SENAPRED maintained the Alert Level at Yellow (the middle level on a three-color scale) for the communities of Villarrica, Pucón (16 km N), Curarrehue, and Panguipulli.
During 24-25 September there was an increase in seismic energy (observed at TR-events) and acoustic signals, characterized by 1 VT-type event, 213 LP-type events, and 124 TR-type events. Mainly white gas-and-steam emissions, in addition to occasional fine ash emissions were recorded. During the early morning of 25 September Strombolian explosions were reported and ejected material 250 m in all directions, though dominantly toward the NW. On 25 September the average value of sulfur dioxide flux was 760 t/d. Seismicity during 25-30 September consisted of five VT-type events, 1,937 LP-type events, and 456 TR-type events.
During 25-29 September moderate Strombolian activity was observed and ejected material as far as the crater rim. In addition, ash pulses lasting roughly 50 minutes were observed around 0700 and dispersed ENE. During 26-27 September a TR episode lasted 6.5 hours and was accompanied by discrete acoustic signals. Satellite images from 26 September showed a spatter cone on the crater floor with one vent that measured 10 x 14 m and a smaller vent about 35 m NE of the cone. SERNAGEOMIN reported an abundant number of bomb-sized blocks up to 150 m from the crater, as well as impact marks on the snow, which indicated explosive activity. A low-altitude ash emission was observed drifting NW around 1140 on 28 September, based on webcam images. Between 0620 and 0850 on 29 September an ash emission rose 60 m above the crater and drifted NW. During an overflight taken around 1000 on 29 September scientists observed molten material in the vent, a large accumulation of pyroclasts inside the crater, and energetic degassing, some of which contained a small amount of ash. Block-sized pyroclasts were deposited on the internal walls and near the crater, and a distal ash deposit was also visible. The average sulfur dioxide flux measured on 28 September was 344 t/d. Satellite images taken on 29 September ashfall was deposited roughly 3 km WNW from the crater and nighttime crater incandescence remained visible. The average sulfur dioxide flux value from 29 September was 199 t/d. On 30 September at 0740 a pulsating ash emission rose 1.1 km above the crater and drifted NNW (figure 126). Deposits on the S flank extended as far as 4.5 km from the crater rim, based on satellite images from 30 September.
Infrared MODIS satellite data processed by MIROVA (Middle InfraRed Observation of Volcanic Activity) showed intermittent thermal activity during April through September, with slightly stronger activity detected during late September (figure 127). Small clusters of thermal activity were detected during mid-June, early July, early August, and late September. According to the MODVOLC thermal alert system, a total of four thermal hotspots were detected on 7 July and 3 and 23 September. This activity was also intermittently captured in infrared satellite imagery on clear weather days (figure 128).
Geologic Background. The glacier-covered Villarrica stratovolcano, in the northern Lakes District of central Chile, is ~15 km south of the city of Pucon. A 2-km-wide caldera that formed about 3,500 years ago is located at the base of the presently active, dominantly basaltic to basaltic andesite cone at the NW margin of a 6-km-wide Pleistocene caldera. More than 30 scoria cones and fissure vents are present on the flanks. Plinian eruptions and pyroclastic flows that have extended up to 20 km from the volcano were produced during the Holocene. Lava flows up to 18 km long have issued from summit and flank vents. Eruptions documented since 1558 CE have consisted largely of mild-to-moderate explosive activity with occasional lava effusion. Glaciers cover 40 km2 of the volcano, and lahars have damaged towns on its flanks.
Information Contacts: Servicio Nacional de Geología y Minería (SERNAGEOMIN), Observatorio Volcanológico de Los Andes del Sur (OVDAS), Avda Sta María No. 0104, Santiago, Chile (URL: http://www.sernageomin.cl/); Proyecto Observación Villarrica Internet (POVI) (URL: http://www.povi.cl/); Sistema y Servicio Nacional de Prevención y Repuesta Ante Desastres (SENAPRED), Av. Beauchef 1671, Santiago, Chile (URL: https://web.senapred.cl/); Buenos Aires Volcanic Ash Advisory Center (VAAC), Servicio Meteorológico Nacional-Fuerza Aérea Argentina, 25 de mayo 658, Buenos Aires, Argentina (URL: http://www.smn.gov.ar/vaac/buenosaires/inicio.php); MIROVA (Middle InfraRed Observation of Volcanic Activity), a collaborative project between the Universities of Turin and Florence (Italy) supported by the Centre for Volcanic Risk of the Italian Civil Protection Department (URL: http://www.mirovaweb.it/); Hawai'i Institute of Geophysics and Planetology (HIGP) - MODVOLC Thermal Alerts System, School of Ocean and Earth Science and Technology (SOEST), Univ. of Hawai'i, 2525 Correa Road, Honolulu, HI 96822, USA (URL: http://modis.higp.hawaii.edu/); Copernicus Browser, Copernicus Data Space Ecosystem, European Space Agency (URL: https://dataspace.copernicus.eu/browser/).
Merapi (Indonesia) — October 2023 Cite this Report
Merapi
Indonesia
7.54°S, 110.446°E; summit elev. 2910 m
All times are local (unless otherwise noted)
Frequent incandescent avalanches during April-September 2023
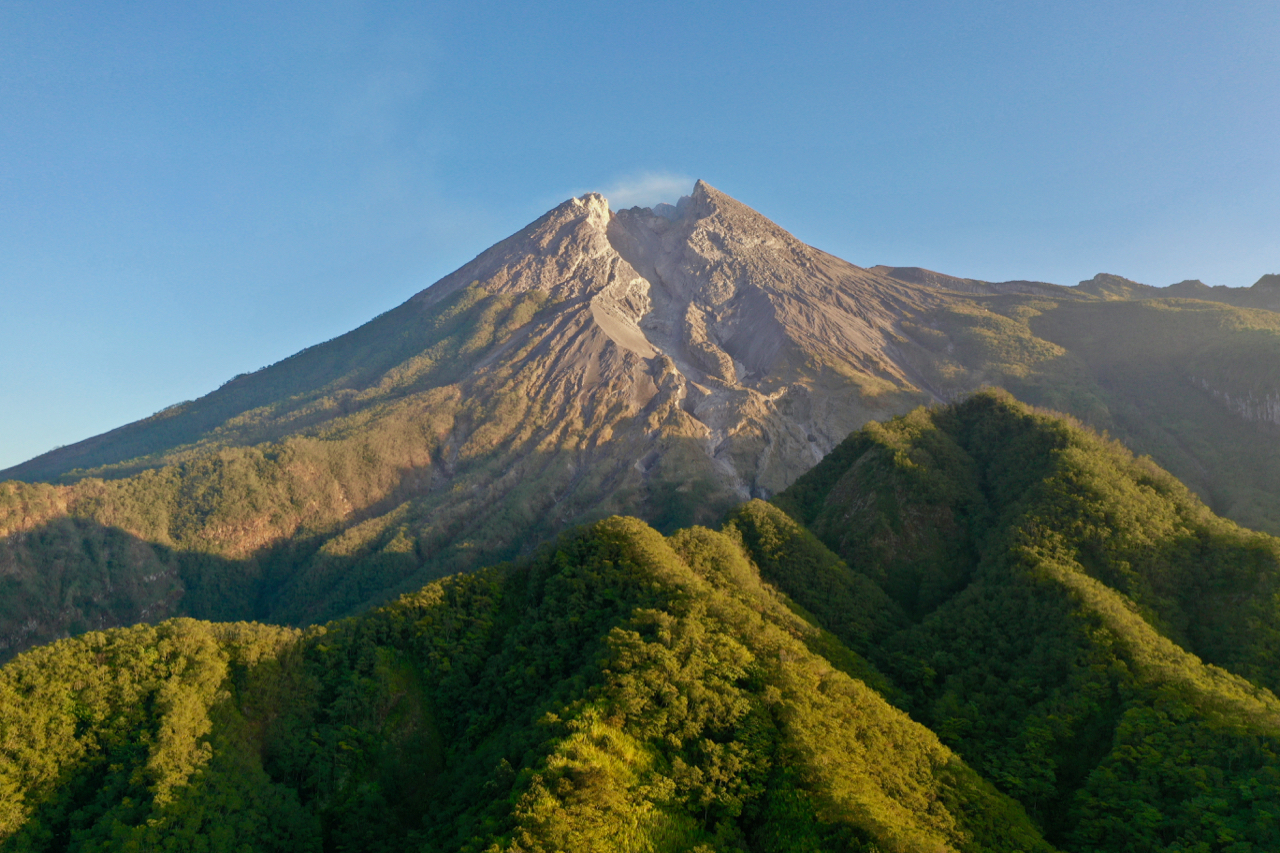
Merapi, located just north of the major city of Yogyakarta in central Java, Indonesia, has had activity within the last 20 years characterized by pyroclastic flows and lahars accompanying growth and collapse of the steep-sided active summit lava dome. The current eruption period began in late December 2020 and has more recently consisted of ash plumes, intermittent incandescent avalanches of material, and pyroclastic flows (BGVN 48:04). This report covers activity during April through September 2023, based on information from Balai Penyelidikan dan Pengembangan Teknologi Kebencanaan Geologi (BPPTKG), the Center for Research and Development of Geological Disaster Technology, a branch of PVMBG which specifically monitors Merapi. Additional information comes from the Pusat Vulkanologi dan Mitigasi Bencana Geologi (PVMBG, also known as Indonesian Center for Volcanology and Geological Hazard Mitigation, CVGHM), MAGMA Indonesia, the Darwin Volcanic Ash Advisory Centre (VAAC), and various satellite data.
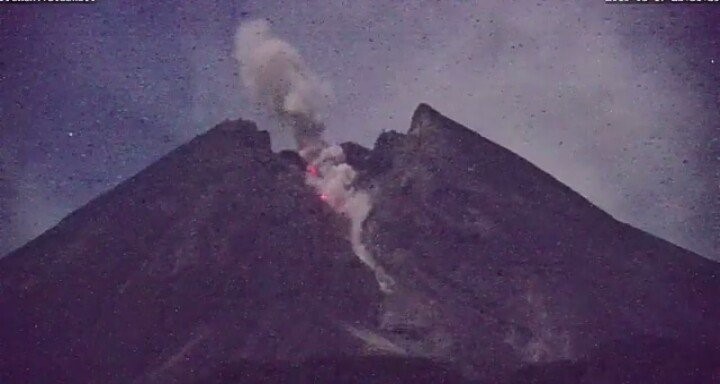
Activity during April through September 2023 primarily consisted of incandescent avalanches of material that mainly affected the SW and W flanks and traveled as far as 2.3 km from the summit (table 25) and white gas-and-steam emissions that rose 10-1,000 m above the crater.
Table 25. Monthly summary of avalanches and avalanche distances recorded at Merapi during April through September 2023. The number of reported avalanches does not include instances where possible avalanches were heard but could not be visually confirmed as a result of inclement weather. Data courtesy of BPPTKG (April-September 2023 daily reports).
| Month |
Average number of avalanches per day |
Distance avalanches traveled (m) |
| Apr 2023 |
19 |
1,200-2,000 |
| May 2023 |
22 |
500-2,000 |
| Jun 2023 |
18 |
1,200-2,000 |
| Jul 2023 |
30 |
300-2,000 |
| Aug 2023 |
25 |
400-2,300 |
| Sep 2023 |
23 |
600-2,000 |
BPPTKG reported that during April and May white gas-and-steam emissions rose 10-750 m above the crater, incandescent avalanches descended 500-2,000 m on the SW and W flanks (figure 135). Cloudy weather often prevented clear views of the summit, and sometimes avalanches could not be confirmed. According to a webcam image, a pyroclastic flow was visible on 17 April at 0531. During the week of 28 April and 4 May a pyroclastic flow was reported on the SW flank, traveling up to 2.5 km. According to a drone overflight taken on 17 May the SW lava dome volume was an estimated 2,372,800 cubic meters and the dome in the main crater was an estimated 2,337,300 cubic meters.
During June and July similar activity persisted with white gas-and-steam emissions rising 10-350 m above the crater and frequent incandescent avalanches that traveled 300-2,000 m down the SW, W, and S flanks (figure 136). Based on an analysis of aerial photos taken on 24 June the volume of the SW lava dome was approximately 2.5 million cubic meters. A pyroclastic flow was observed on 5 July that traveled 2.7 km on the SW flank. According to the Darwin VAAC multiple minor ash plumes were identified in satellite images on 19 July that rose to 3.7 km altitude and drifted S and SW. During 22, 25, and 26 July a total of 17 avalanches descended as far as 1.8 km on the S flank.
Frequent white gas-and-steam emissions continued during August and September, rising 10-450 m above the crater. Incandescent avalanches mainly affected the SW and W flanks and traveled 400-2,300 m from the vent (figure 137). An aerial survey conducted on 10 August was analyzed and reported that estimates of the SW dome volume was 2,764,300 cubic meters and the dome in the main crater was 2,369,800 cubic meters.
Frequent and moderate-power thermal activity continued throughout the reporting period, according to a MIROVA (Middle InfraRed Observation of Volcanic Activity) analysis of MODIS satellite data (figure 138). There was an increase in the number of detected anomalies during mid-May. The MODVOLC thermal algorithm recorded a total of 47 thermal hotspots: six during April, nine during May, eight during June, 15 during July, four during August, and five during September. Some of this activity was captured in infrared satellite imagery on clear weather days, sometimes accompanied by incandescent material on the SW flank (figure 139).
Geologic Background. Merapi, one of Indonesia's most active volcanoes, lies in one of the world's most densely populated areas and dominates the landscape immediately north of the major city of Yogyakarta. It is the youngest and southernmost of a volcanic chain extending NNW to Ungaran volcano. Growth of Old Merapi during the Pleistocene ended with major edifice collapse perhaps about 2,000 years ago, leaving a large arcuate scarp cutting the eroded older Batulawang volcano. Subsequent growth of the steep-sided Young Merapi edifice, its upper part unvegetated due to frequent activity, began SW of the earlier collapse scarp. Pyroclastic flows and lahars accompanying growth and collapse of the steep-sided active summit lava dome have devastated cultivated lands on the western-to-southern flanks and caused many fatalities.
Information Contacts: Balai Penyelidikan dan Pengembangan Teknologi Kebencanaan Geologi (BPPTKG), Center for Research and Development of Geological Disaster Technology (URL: http://merapi.bgl.esdm.go.id/, Twitter: @BPPTKG); MAGMA Indonesia, Kementerian Energi dan Sumber Daya Mineral (URL: https://magma.esdm.go.id/v1); Pusat Vulkanologi dan Mitigasi Bencana Geologi (PVMBG, also known as Indonesian Center for Volcanology and Geological Hazard Mitigation, CVGHM), Jalan Diponegoro 57, Bandung 40122, Indonesia (URL: http://www.vsi.esdm.go.id/); Darwin Volcanic Ash Advisory Centre (VAAC), Bureau of Meteorology, Northern Territory Regional Office, PO Box 40050, Casuarina, NT 0811, Australia (URL: http://www.bom.gov.au/info/vaac/); MIROVA (Middle InfraRed Observation of Volcanic Activity), a collaborative project between the Universities of Turin and Florence (Italy) supported by the Centre for Volcanic Risk of the Italian Civil Protection Department (URL: http://www.mirovaweb.it/); Hawai'i Institute of Geophysics and Planetology (HIGP) - MODVOLC Thermal Alerts System, School of Ocean and Earth Science and Technology (SOEST), Univ. of Hawai'i, 2525 Correa Road, Honolulu, HI 96822, USA (URL: http://modis.higp.hawaii.edu/); Copernicus Browser, Copernicus Data Space Ecosystem, European Space Agency (URL: https://dataspace.copernicus.eu/browser/); Øystein Lund Andersen (URL: https://www.oysteinlundandersen.com/, https://twitter.com/oysteinvolcano).
Ebeko
Russia
50.686°N, 156.014°E; summit elev. 1103 m
All times are local (unless otherwise noted)
Moderate explosive activity with ash plumes continued during June-November 2023
Ebeko, located on the N end of Paramushir Island in Russia’s Kuril Islands just S of the Kamchatka Peninsula, consists of three summit craters along a SSW-NNE line at the northern end of a complex of five volcanic cones. Observed eruptions date back to the late 18th century and have been characterized as small-to-moderate explosions from the summit crater, accompanied by intense fumarolic activity. The current eruptive period began in June 2022, consisting of frequent explosions, ash plumes, and thermal activity (BGVN 47:10, 48:06). This report covers similar activity during June-November 2023, based on information from the Kamchatka Volcanic Eruptions Response Team (KVERT) and satellite data.
Moderate explosive activity continued during June-November 2023 (figures 50 and 51). According to visual data from Severo-Kurilsk, explosions sent ash 2-3.5 km above the summit (3-4.5 km altitude) during most days during June through mid-September. Activity after mid-September was slightly weaker, with ash usually reaching less than 2 km above the summit. According to KVERT the volcano in October and November was, with a few exceptions, either quiet or obscured by clouds that prevented satellite observations. KVERT issued Volcano Observatory Notices for Aviation (VONA) on 8 and 12 June, 13 and 22 July, 3 and 21 August, and 31 October warning of potential aviation hazards from ash plumes drifting 3-15 km from the volcano. Based on satellite data, KVERT reported a persistent thermal anomaly whenever weather clouds permitted viewing.
Geologic Background. The flat-topped summit of the central cone of Ebeko volcano, one of the most active in the Kuril Islands, occupies the northern end of Paramushir Island. Three summit craters located along a SSW-NNE line form Ebeko volcano proper, at the northern end of a complex of five volcanic cones. Blocky lava flows extend west from Ebeko and SE from the neighboring Nezametnyi cone. The eastern part of the southern crater contains strong solfataras and a large boiling spring. The central crater is filled by a lake about 20 m deep whose shores are lined with steaming solfataras; the northern crater lies across a narrow, low barrier from the central crater and contains a small, cold crescentic lake. Historical activity, recorded since the late-18th century, has been restricted to small-to-moderate explosive eruptions from the summit craters. Intense fumarolic activity occurs in the summit craters, on the outer flanks of the cone, and in lateral explosion craters.
Information Contacts: Kamchatka Volcanic Eruptions Response Team (KVERT), Far Eastern Branch, Russian Academy of Sciences, 9 Piip Blvd., Petropavlovsk-Kamchatsky, 683006, Russia (URL: http://www.kscnet.ru/ivs/kvert/).
Search Bulletin Archive by Publication Date
Select a month and year from the drop-downs and click "Show Issue" to have that issue displayed in this tab.
The default month and year is the latest issue available.
Bulletin of the Global Volcanism Network - Volume 44, Number 10 (October 2019)
Managing Editor: Edward Venzke
Dukono (Indonesia)
Eruption with frequent ash plumes continues through September 2019
Etna (Italy)
Five lava flows and numerous ash plumes and Strombolian explosions, April-September 2019
Fuego (Guatemala)
Ongoing ash plume explosions and block avalanches, April-September 2019
Heard (Australia)
Ongoing thermal anomalies at the summit crater during April-September 2019
Klyuchevskoy (Russia)
Ongoing weak thermal anomalies during July-September 2019, but no ash plumes after 1 August
Manam (Papua New Guinea)
Significant eruption on 28 June produced an ash plume up to 15.2 km and pyroclastic flows
Merapi (Indonesia)
Low-volume dome growth continues during April-September 2019 with rockfalls and small block-and-ash flows
Poas (Costa Rica)
Occasional phreatic explosions continue through September 2019
Shishaldin (United States)
Active lava lake and spattering on 23 July 2019; minor explosions and lava fountaining on 17 August
Tangkuban Parahu (Indonesia)
Phreatic eruption on 27 July followed by intermittent explosions through to 17 September 2019
Dukono (Indonesia) — October 2019 Cite this Report
Dukono
Indonesia
1.6992°N, 127.8783°E; summit elev. 1273 m
All times are local (unless otherwise noted)
Eruption with frequent ash plumes continues through September 2019
The eruption at Dukono, ongoing since 1933, is typified by frequent ash explosions and ash plumes (BGVN 43:04). This activity continued through at least September 2019. The data below were primarily provided by the Pusat Vulkanologi dan Mitigasi Bencana Geologi (PVMBG), also known as the Center for Volcanology and Geological Hazard Mitigation (CVGHM), and the Darwin Volcanic Ash Advisory Centre (VAAC).
According to PVMBG, during April-September 2019 the volcano continued to generate ash plumes almost every day that rose to altitudes of 1.5-3 km (table 20, figure 12). Ashfall was reported on 8 August at the Galela Airport, Maluku Utara, 17 km NW. The Alert Level remained at 2 (on a scale of 1-4), and the 2-km exclusion zone remained in effect.
Table 20. Monthly summary of reported ash plumes from Dukono for April-September 2019. The direction of drift for the ash plume through each month was highly variable, but did not extend for any notable distances during this reporting period. Data courtesy of the Darwin VAAC and PVMBG.
| Month |
Plume Altitude (km) |
Notable Plume Drift |
| Apr 2019 |
1.5-2.4 |
-- |
| May 2019 |
1.5-3 |
-- |
| Jun 2019 |
1.8-2.4 |
-- |
| Jul 2019 |
1.5-2.1 |
-- |
| Aug 2019 |
1.8-2.1 |
-- |
| Sep 2019 |
1.5-2.1 |
-- |
Instruments aboard NASA satellites detected high levels of sulfur dioxide near or directly above the volcano on 11, 20-22 April; 17, 22, and 27 May; 15-18 August; and 23-24 and 29 September. However, the cause of the high levels may, at least in part, have been due to other active volcanoes in the area.
Geologic Background. The Dukono complex in northern Halmahera is on an edifice with a broad, low profile containing multiple peaks and overlapping craters. Almost continuous explosive eruptions, sometimes accompanied by lava flows, have occurred since 1933. During a major eruption in 1550 CE, a lava flow filled in the strait between Halmahera and the Gunung Mamuya cone, 10 km NE. Malupang Wariang, 1 km SW of the summit crater complex, contains a 700 x 570 m crater that has also had reported eruptions.
Information Contacts: Pusat Vulkanologi dan Mitigasi Bencana Geologi (PVMBG, also known as Indonesian Center for Volcanology and Geological Hazard Mitigation, CVGHM), Jalan Diponegoro 57, Bandung 40122, Indonesia (URL: http://www.vsi.esdm.go.id/); Darwin Volcanic Ash Advisory Centre (VAAC), Bureau of Meteorology, Northern Territory Regional Office, PO Box 40050, Casuarina, NT 0811, Australia (URL: http://www.bom.gov.au/info/vaac/); Global Sulfur Dioxide Monitoring Page, Atmospheric Chemistry and Dynamics Laboratory, NASA Goddard Space Flight Center (NASA/GSFC), 8800 Greenbelt Road, Goddard, Maryland, USA (URL: https://so2.gsfc.nasa.gov/); Sentinel Hub Playground (URL: https://www.sentinel-hub.com/explore/sentinel-playground).
Etna
Italy
37.748°N, 14.999°E; summit elev. 3357 m
All times are local (unless otherwise noted)
Five lava flows and numerous ash plumes and Strombolian explosions, April-September 2019
Italy's Mount Etna on the island of Sicily has had historically recorded eruptions for the past 3,500 years and has been erupting continuously since September 2013 through at least September 2019. Lava flows, explosive eruptions with ash plumes, and Strombolian lava fountains commonly occur from its summit areas that include the Northeast Crater (NEC), the Voragine-Bocca Nuova (or Central) complex (VOR-BN), the Southeast Crater (SEC, formed in 1978), and the New Southeast Crater (NSEC, formed in 2011). The newest crater, referred to as the "cono della sella" (saddle cone), emerged during early 2017 in the area between SEC and NSEC. Varying activity that included several lava flows, Strombolian activity, and numerous ash plumes from most of the active summit vents and several flank fissures occurred during April-September 2019, the period covered in this report, with information provided primarily by the Osservatorio Etneo (OE), part of the Catania Branch of Italy's Istituo Nazionale di Geofisica e Vulcanologica (INGV).
Degassing of variable intensity was typical activity from all the vents at Etna during much of April 2019. Intermittent ash emission and Strombolian activity occurred at Bocca Nuova, especially during the last week. Minor ash emissions were reported from NEC and NSEC the last week as well. Most of the activity at the summit during May 2019 was focused around the New South East Crater (NSEC); repeated Strombolian activity was witnessed from the E vent near the summit throughout the month. Beginning on 30 May, two fissures opened on the N and SE flanks of NSEC and produced lava flows that traveled E and SE across the W wall of the Valle del Bove. The flows ceased during the first week of June; activity for the rest of that month consisted of intermittent explosions with small ash plumes from Voragine and Bocca Nuova. Discontinuous Strombolian explosions and isolated ash emissions from NEC, NSEC, and Bocca Nuova characterized activity during the first half of July 2019; the explosions intensified at NSEC later in the month. A lava flow emerged from the lower NE flank of NSEC on 18 July that lasted for several days. Explosions produced substantial ash plumes from the NSEC summit crater, causing ashfall nearby, and a new flow emerged from a fissure on the S flank of NSEC on 27 July.
Explosions with intermittent ash emissions during August 2019 were focused primarily on the North East Crater (NEC), with occasional ash emissions from Bocca Nuova. These continued into early September. Activity increased to include Strombolian explosions with the ash emissions at NEC, Bocca Nuova, and Voragine where a scoria cone formed deep within the crater from continued Strombolian activity. A lava flow emerged from the base of the scoria cone on 18 September and was active for about four days, sending branches of lava into multiple areas of the adjacent Bocca Nuova crater. Ash emissions at NEC continued during the end of the month. The multiple episodes of varying activity during the period were reflected in the MIROVA thermal energy data; spikes of thermal activity that corresponded to periods of lava effusion were apparent late May-early June, multiple times in July, and during the second half of September (figure 260).
Activity during April-May 2019. During a site visit to the summit on 1 April scientists from INGV noted weak degassing from both pit craters, BN-1 and BN-2, within Bocca Nuova (BN); the Voragine (VOR) and North East Crater (NEC) were emitting abundant steam and gas emissions. The New Southeast Crater (NSEC) also had significant fumarolic activity concentrated primarily on the crater rim along with gas plumes visible from both the E vent and the 24 December 2018 flank fissure (figure 261). A brief episode of ash emission was observed from BN on the morning of 8 April. Persistent pulsating flashes of incandescence were noted at the E vent of NSEC during the second week. A new vent was observed in the inner wall of the Voragine crater during an inspection on 19 April, located immediately below the vent which formed on 12 January 2019 (figure 262). During the last week of April there were ten episodes of ash emission from BN, two from NEC, and one produced by the E vent at NSEC. Strombolian activity was observed on the morning of 28 April at BN-1, and persistent incandescence was visible from the E vent of NSEC. Early on 30 April both BN-1 and BN-2 were producing explosions every few seconds. Coarse ejecta (lapilli and bombs) rose higher than the crater rim; most fell back within the crater, but some material was observed on the rim the following day.
Activity at the summit during May 2019 was focused around the New South East Crater (NSEC). Discontinuous Strombolian activity was observed at the E vent of NSEC early on 2 May accompanied by ash emissions from the summit vent that rose about 1,000 m (figure 263). Explosion frequency increased beginning on 5 May with weak and discontinuous ash emissions reported from the NSEC summit for the next several days; ash emissions were also observed from the Saddle vent and the NSEC E vent during 6-8 May. In addition to ash emissions and Strombolian activity continuing from both the summit and E vents at NSEC during the third and fourth weeks, overnight on 17-18 May several larger Strombolian explosions sent pyroclastic ejecta tens of meters above the crater rim (figure 264). The explosion intervals ranged from a few minutes to a few hours. The new vent that had formed at Voragine in mid-April coalesced with the 12 January vent during the second week of May; dilute ash was observed from the BN-1 vent on 23 May.
A fissure opened at the base of the N flank of NSEC shortly after midnight on 30 May 2019 at an elevation of about 3,150 m (figure 265). It produced mild explosive activity and a lava flow that spread towards the W wall of the Valle del Bove. By 0800 UTC the flow had reached an elevation of 2,050 m. A second fissure opened at 0335 the same morning at the base of the SE flank of NSEC at an elevation of 3,050 m. The lava flowed along the W wall of the Valle del Bove towards Serra Giannicola Grande and had reached an elevation of 2,260 m by 0815. Strong winds dispersed ash emissions from the fissures to the NE for much of the day; ashfall occurred in Linguaglossa (figure 266). The Toulouse VAAC reported an ash plume drifting ENE at 3.9 km altitude on 30 May. Samples of the ash that were collected and analyzed were shown to be about 70% lithic clasts, 25% crystals, and about 5% juvenile material. It became clear the next day that two vents along the SE-flank fissure initially produced separate flows that coalesced into a single flow which expanded along the W wall of Valle del Bove. By 0830 on 31 May that flow had reached an elevation of 1,700 m at the base of Serra Giannicola Grande. The fissure at the base of the N flank continued to propagate along the W wall of Valle del Bove also, and had reached an elevation of 2,050 near Monte Simone by 1030 on 31 May (figure 267). When the new eruptive activity began on 29 May, inclinometers measured slight but prolonged deflation of the volcano.
Activity during June-July 2019. The flow from the N flank of NSEC ceased advancing on 1 June 2019, but the active spattering continued from the fissure on the SE flank for a few more days. The SE-flank flow had reached 1,700 m elevation in the Valle del Bove by the afternoon of 2 June (figure 268). The intensity and frequency of the explosions decreased over the next few days, with the active flow front receding back towards the vent until it stopped moving on 6 June. The NE rim of the summit cone at NSEC appeared lowered by several meters after the eruption ceased. The lava flows and explosions of 30 May-2 June produced persistent SO2 emissions that drifted E and N for over 800 km (figure 269).
Activity for the rest of June 2019 moved to the other craters, mainly Voragine, after the flows ceased at NSEC. On the morning of 6 June there were sporadic ash emissions from NEC that quickly dissipated. A small ash plume appeared from Bocca Nuova (BN) on 11 June. An explosive sequence that began on 13 June from the crater floor of Voragine continued intermittently through the third week of the month (figure 270) and produced several small ash plumes. A new vent opened on the crater floor and produced a small ash plume; ejecta also landed on the crater rim several times. On 22 June small, discontinuous ash emissions were produced from BN-1; they dispersed rapidly, but intermittent explosions continued during the following week. By the end of the month, only BN was exhibiting activity other than degassing; incandescence from the crater was seen during the night of 24 June and three isolated ash emissions were seen in the webcams on 26 June.
Discontinuous Strombolian explosions and isolated ash emissions characterized activity during the first half of July 2019. Pulsating degassing from NEC produced ash emissions on 2 and 3 July (figure 271), and incandescence on 4 and 5 July. Intense degassing was observed at NSEC during 1-5 July, this turned into isolated ash emissions and Strombolian activity on 5 and 6 July from the E vent with explosions occurring every 1-5 minutes; the ejecta landed on the upper E flank. Dilute ash emissions were observed from Bocca Nuova on 6 July. NEC produced two major ash emissions on the evening of 8 July and the late morning of 13 July. The ash plumes quickly dispersed in the summit area. Strombolian activity at the E vent of NSEC was witnessed on 14 July. Explosive activity at Bocca Nuova remained deep within the crater during mid-July. Steam produced by the 13 June 2019 vent on the floor of Voragine occasionally contained dilute ash. During 15-17 July sporadic explosions were observed at NSEC accompanied by small puffs of ash that rapidly dispersed.
Beginning early on 18 July, Strombolian activity increased at NSEC from an explosion every 1-2 minutes to multiple explosions per minute in the following hours. Continuous activity during the evening decreased sharply around 2200. About an hour later visual and thermal surveillance cameras on Monte Cagliato recorded the opening of a vent on the lower NE flank of NSEC; lava slowly advanced from the vent towards Valle del Leone (figures 272 and 273). Explosive activity resumed at the NSEC summit a few hours later, accompanied by occasional ash emissions from NEC and Bocca Nuova. Explosions tapered off briefly by noon on 19 July, but a sudden increase in explosive activity during the afternoon of 19 July produced Strombolian activity and sporadic ash emissions from three vents inside the NSEC crater. Ashfall was reported that evening in communities on the S flank of Etna. The Toulouse VAAC reported significant ash above the summit at 3.7 km altitude. Activity declined again later that evening at NSEC, but abundant ash emission began at NEC that lasted until the morning of 20 July. A new phase of explosive activity began at NSEC around 0700 on 20 July with an ash plume and an increase in lava emission from the vent on the NE flank (figure 274). By the evening of 20 July only a small amount of material was feeding the lava flow; the farthest advanced fronts were at an elevation around 2,150 m, above Monte Simone. A few small ash emissions were observed at Bocca Nuova on 21 July.
Visible and thermal images taken on 24 July 2019 indicated only degassing at BN-1 and BN-2, and limited degassing from low-temperature fumaroles from the multiple vents at VOR (figure 275). After a few days of quiet, NSEC resumed discontinuous ash emissions on 25 July. A sudden increase in the amplitude of volcanic tremor was noted early on 27 July, which was followed a few hours later by the opening of a new eruptive fissure on the S flank of NSEC (figure 276). Explosive activity intensified and produced a dense ash-rich plume that dispersed to the E at an estimated altitude of 4.5-5 km. A thin layer of ash was reported in Giarre, Riposto, and Torre Archirafi. A lava flow emerged from the S portion of the fissure and expanded SW and S. By 1135 the most advanced front had reached and passed the N side of the base of the Barbagallo Mountians at an elevation of about 2,850 m. It continued to spread down into the area between Monte Frumento Supino and the pyroclastic cones of 2002-2003 (figure 277). A series of particularly strong explosions occurred from NSEC around midday, producing an ash plume that rose to 7.5 km altitude. By this time the most advanced lava fronts were located at an elevation of about 2,600 m, but they were rapidly advancing SSW towards Monte Nero, surrounding Monte Frumento Supino from the W. Explosive activity decreased significantly early in the morning on 28 July; flow activity also slowed around the same time. Occasional puffs of reddish-brown ash were noted from NEC during the morning as well. The explosions and the lava effusion ceased on the evening of 28 July. An isolated ash emission from Bocca Nuova in the early hours of 31 July was the last activity reported in July. A substantial SO2 plume (6.59 DU) from the explosions on 27 July had drifted to the E coast of the Adriatic Sea by midday on 28 July and was detected in satellite instruments.
Activity during August-September 2019. Activity during August 2019 was focused primarily on the North East Crater (NEC), with occasional ash emissions from Bocca Nuova. The plumes were occasionally dense and dark brown from NEC. Weak emissions of dilute ash from NEC quickly dispersed on the morning of 4 August, followed by more intermittent ash emissions during 6-10 August; a few had significant concentrations of ash that drifted SE. Part of the N rim of NEC collapsed during the explosions of early August (figure 278). During a site inspection to the summit by INGV personnel on 16 August, continuous degassing at Bocca Nuova was interrupted every 10-15 minutes by explosions, but no ejecta was noted. Discontinuous emissions from NEC formed small ash plumes that rose a few hundred meters and remained in the summit area (figure 279). Thermal surveys that day indicated high temperatures of about 800°C along a 10-m-fracture zone on the northern rim of VOR. Ash emissions from NEC were persistent through 20 August when they decreased significantly; a few explosions had dilute ash emissions from Bocca Nuova that day and the next (figure 280). Sulfur dioxide emissions were notable during 19-22 August, drifting S and W hundreds of kilometers before dissipating. Isolated and dilute ash from NEC early on 28 August was interpreted by INGV as resulting from collapses along the inner crater walls. During site inspections on 27, 28, and 30 August, deep explosions from Bocca Nuova were heard, and degassing was observed at all of the summit vents.
Activity during September 2019 began with discontinuous and dilute ash emissions from NEC and Bocca Nuova, as well as episodes of Strombolian activity at both vents. This was followed by increased Strombolian activity, ash emissions, and a lava flow at Voragine. Isolated ash emissions occurred at NEC and VOR on 4 and 5 September. Sporadic deep explosions were heard from BN-1 during a site inspection on 7 September. Overnight during 7-8 September the visual webcams recorded incandescence at NEC and pyroclastic ejecta observed outside the crater rim that coincided with increased tremor activity. A more intense episode of Strombolian activity began the following evening at NEC. Activity was continuous from 1800 on 9 September to 0500 on 10 September, and produced dilute ash emissions that quickly dispersed (figure 281). Slight ashfall was reported in Piedimonte Etneo, Giarre-Riposto, and Rifugio Citelli. Continuous puffs of dilute ash were observed beginning at dawn on 11 September with sporadic ejecta again landing outside the crater rim. Significant SO2 plumes were measured by satellite instruments on 10 and 11 September (figure 282).
In addition to the Strombolian activity at NEC on 12 September, ash emissions began that morning at VOR. They increased in frequency and then transitioned to near-continuous Strombolian activity that produced ejecta which landed in the base of the adjacent Bocca Nuova crater. The explosions from the Strombolian activity were felt in Zafferana Etnea, Aci S. Antonio, Pedara, and neighboring areas. On 13 September the webcams observed multiple periods of continuous ash emissions from NEC and short, intense pulses of ash from VOR that accompanied Strombolian activity; coarse ejecta rose 20 m above and landed outside of the crater rim, producing impact craters on the W side of the summit between VOR and BN. The vent that sourced the Strombolian activity was located in the deepest part of the Voragine crater. By 15 September, continued ejecta had formed a scoria cone around the vent inside VOR (figure 283).
Explosive activity inside VOR increased on the afternoon of 18 September 2019. Pyroclastic ejecta and ash erupted from several vents and reached heights of several tens of meters. A lava flow emerged from the W base of the scoria cone and headed S, advancing several hundred meters (figure 284). It then flowed over the saddle that divides VOR and BN, split into two branches, and entered Bocca Nuova. One stream poured into BN-1, and another stopped near the edge of the BN-2 pit crater. By 22 September the flow was cooling, but strong Strombolian activity continued inside Voragine. NEC was characterized by large-scale ash emissions during the end of September, including one in the morning of 27 September that sent a plume over the S flank of Etna before dissipating (figure 285). Strombolian activity continued within Bocca Nuova during the last week of the month.
Geologic Background. Mount Etna, towering above Catania on the island of Sicily, has one of the world's longest documented records of volcanism, dating back to 1500 BCE. Historical lava flows of basaltic composition cover much of the surface of this massive volcano, whose edifice is the highest and most voluminous in Italy. The Mongibello stratovolcano, truncated by several small calderas, was constructed during the late Pleistocene and Holocene over an older shield volcano. The most prominent morphological feature of Etna is the Valle del Bove, a 5 x 10 km caldera open to the east. Two styles of eruptive activity typically occur, sometimes simultaneously. Persistent explosive eruptions, sometimes with minor lava emissions, take place from one or more summit craters. Flank vents, typically with higher effusion rates, are less frequently active and originate from fissures that open progressively downward from near the summit (usually accompanied by Strombolian eruptions at the upper end). Cinder cones are commonly constructed over the vents of lower-flank lava flows. Lava flows extend to the foot of the volcano on all sides and have reached the sea over a broad area on the SE flank.
Information Contacts: Sezione di Catania - Osservatorio Etneo, Istituto Nazionale di Geofisica e Vulcanologia (INGV), Sezione di Catania, Piazza Roma 2, 95123 Catania, Italy (URL: http://www.ct.ingv.it/it/ ); MIROVA (Middle InfraRed Observation of Volcanic Activity), a collaborative project between the Universities of Turin and Florence (Italy) supported by the Centre for Volcanic Risk of the Italian Civil Protection Department (URL: http://www.mirovaweb.it/); Global Sulfur Dioxide Monitoring Page, Atmospheric Chemistry and Dynamics Laboratory, NASA Goddard Space Flight Center (NASA/GSFC), 8800 Greenbelt Road, Goddard, Maryland, USA (URL: https://so2.gsfc.nasa.gov/); Toulouse Volcanic Ash Advisory Center (VAAC), Météo-France, 42 Avenue Gaspard Coriolis, F-31057 Toulouse cedex, France (URL: http://www.meteo.fr/aeroweb/info/vaac/).
Fuego (Guatemala) — October 2019 Cite this Report
Fuego
Guatemala
14.4748°N, 90.8806°W; summit elev. 3799 m
All times are local (unless otherwise noted)
Ongoing ash plume explosions and block avalanches, April-September 2019
Guatemala's Volcán de Fuego was continuously active through September 2019; it has been erupting vigorously since 2002 with historical observations of eruptions dating back to 1531. These eruptions have resulted in major ashfalls, pyroclastic flows, lava flows, and damaging lahars. Large explosions with hundreds of fatalities occurred during 3-5 June 2018; after a brief pause, significant activity resumed and continued during April-September 2019, the period covered in this report. Reports are provided by the Instituto Nacional de Sismologia, Vulcanología, Meteorología e Hidrologia (INSIVUMEH) and the National Office of Disaster Management (CONRED); aviation alerts of ash plumes are issued by the Washington Volcanic Ash Advisory Center (VAAC). Satellite data from NASA and other sources provide valuable information about heat flow and gas emissions.
Daily activity continued at a high level throughout April-September 2019 (table 19) with multiple ash explosions every hour, incandescent ejecta reaching hundreds of meters above the summit sending block avalanches down multiple ravines, and ash falling on communities on the SW flank and beyond. During April and part of May a lava flow was also active in the Seca ravine. Although explosive activity remained at a high level throughout the period, thermal activity began a decline in May that continued through September, noticeable in both the MIROVA radiative power data (figure 117), and monthly images of MODVOLC thermal alerts (figure 118).
Table 19. Activity summary by month for Fuego with information compiled from INSIVUMEH daily reports.
| Month |
Fumarole Color, Height (m), Direction |
Ash Explosions per hour |
Ash Plume Heights (km) |
Ash Plume Distance (km) and Direction |
Incandescent Ejecta Height (m) |
Ravines affected by avalanche blocks |
Sounds and Vibrations |
Villages Reporting ashfall |
Lava Flow activity |
| Apr 2019 |
Gray and White, 4,100-4,500, W-SW |
10-25 |
4.3-5.0 |
10-25, W-SW-E-N |
100-450 |
Seca, Taniluyá, Ceniza, Trinidad, Las Lajas and Honda |
Weak to moderate rumbles, shock waves rattled roofs, train engine noises every 5-20 minutes |
Panimaché I and II, Morelia, Santa Sofía, El Porvenir, Los Yucales, Finca Palo Verde, Sangre de Cristo, San Pedro Yepocapa, La Rochela, Ceilán, El Rodeo, Alotenango, Ciudad Vieja, Osuna |
Active flow in Seca ravine, 200-800 m long |
| May 2019 |
Gray and White, 4,200-4,500, W-SW-S |
12-26 |
4.5-4.9 |
10-30, W-SW-S-SE |
200-450 |
Seca, Taniluyá, Ceniza, Trinidad, El Jute, Las Lajas and Honda |
Weak to moderate rumbles, shock waves rattled roofs, train engine noises at regular intervals |
Panimaché I and II, Morelia, Santa Sofía, El Porvenir, Los Yucales, Finca Palo Verde, Sangre de Cristo, San Pedro Yepocapa, Ceilán, La Rochela |
Active flow in Seca ravine, 300-1,000 m |
| Jun 2019 |
White, 4,100-4,500, E-SE-N-W-SW |
10-24 |
4.4-4.8 |
10-30, W-SW-NW-N-E-SE |
200-450 |
Seca, Taniluyá, Ceniza, Trinidad, El Jute, Las Lajas and Honda |
Weak to moderate rumbles, shock waves rattled roofs, train engine noises every 5-10 minutes |
Sangre de Cristo, Yepocapa, Morelia, Santa Sofía, Panimache I and II, El Porvenir, Finca Palo Verde, La Rochela, Ceilán, Alotenango, San Miguel Dueñas |
-- |
| Jul 2019 |
White, 4,100-4,500, W-SW |
8-25 |
4.3-4.8 |
10-25, W-SW |
150-450 |
Seca, Taniluyá, Ceniza, Trinidad, El Jute, Las Lajas and Honda |
Weak to moderate rumbles, shock waves rattled roofs, train engine noises every 5-15 minutes |
Morelia, Santa Sofía, El Porvenir, Finca Palo Verde, San Pedro Yepocapa, Panimaché I y II, Sangre de Cristo, La Rochela, Ceilán |
-- |
| Aug 2019 |
White, 4,100-4,500, W-SW |
10-23 |
4.4-4.8 |
10-25 W-SW |
200-400 |
Seca, Taniluyá, Ceniza, Trinidad, El Jute, Las Lajas y Honda |
Weak to moderate rumbles, shock waves rattle windows; train engine noises every 3-13 minutes |
Morelia, Santa Sofía, El Porvenir, Finca Palo Verde, San Pedro Yepocapa, Panimaché I y II, Sangre de Cristo, and others |
Flow in Seca ravine, 13 Aug 75-100 m |
| Sep 2019 |
White, 4,100-4,400, W-SW |
5-22 |
4.4-4.8 |
10-20 W-SW |
200-400 |
Seca, Taniluyá, Ceniza, Trinidad, El Jute, Las Lajas and Honda |
Weak to moderate rumbles, shock waves rattled roofs, train engine noises every 3-10 minutes |
Panimaché I, Panimache II villages,Morelia, Santa Sofía, Palo Verde estate, San Pedro Yepocapa, Sangre de Cristo, El Porvenir, La Rochela villages and Ceylon |
-- |
Activity increased at the very end of March 2019. The rate of explosions increased to 14-32 events per hour by 31 March; ash plumes rose to 5 km altitude and resulted in ashfall in numerous nearby communities. An early morning lava flow that day reached 800 m down the Seca ravine. Continuous white and gray fumarolic plumes reached 4.1 to 4.4 km altitude during April 2019 and drifted generally W and SW. There were about 15-20 ash-bearing explosions per hour; the highest rate of 25 per hour occurred on 10 April. Plume altitudes were below 4.8 km for most of the month; on 28 and 29 April they rose to 5.0 and 4.9 km. For most of the month they drifted W and SW; the wind direction changed to the E during 10-16 April. Most days of the month ashfall was reported in the communities of Panimaché I y II, Morelia, Santa Sofía, Finca Palo Verde, San Pedro Yepocapa, Sangre de Cristo and El Porvenir on the W and SW flank. During 10-13 April when the wind direction changed to easterly, communities to the NE, E and SE of Alotenango, Ciudad Vieja, La Reunión, La Rochela, El Rodeo, Osuna, Ceilán and others on the N and E flanks were affected by ashfall. The Washington VAAC issued multiple daily advisories on 18 days in April, identifying short-lived ash plumes drifting with the prevailing winds.
Incandescent ejecta rose 200-300 m above the summit on most days (figure 119). During 23-25 April, ejecta rose 300-450 m above the summit. Six ravines were affected by the incandescent avalanche blocks nearly every day: the Seca, Taniluyá, Ceniza, Trinidad, Las Lajas, and Honda. The explosions caused rumbles, shock waves that rattled roofs, and sounds similar to a train locomotive at intervals of 5-20 minutes in nearby communities throughout the month. A lava flow was present in the Seca (Santa Teresa) ravine for most of the month; its length varied from 200 to 800 m. Special reports of lahars were issued seven times during April. On 4 April a moderate lahar descended the Seca ravine carrying centimeter- to meter-sized blocks, tree trunks and branches. During 9-11 April nine lahars were recorded in the Las Lajas, El Jute, Seca, Rio Mineral, Taniluya, and Ceniza ravines. The largest flows were 20 m wide and 3 m deep carrying blocks and debris up to 3 m in diameter; they were warm and thick with a strong sulfurous odor. Two more lahars were reported on 18 April in the Taniluya and Ceniza ravines carrying 1-2 m sized blocks in a warm, sulfurous flow.
During May 2019, primarily white fumaroles rose to 4.2-4.5 km altitude and drifted W, SW, and S; gray fumaroles were reported only during the first few days of the month. Generally, 15-20 ash explosions per hour occurred; the maximum was 26 on 17 May. Ash plume heights ranged from 4.5-4.8 km altitude nearly every day, drifting 10-25 km primarily W, SW, and S throughout the month, except for 6-8 May when plumes drifted NW and 18-19 May when wind directions changed and sent ash S and SE. Plumes drifted 25-30 km SE, S, and SW on 19 May. Ashfall was reported daily from communities on the W flank including Panimaché I and II, Morelia, Santa Sofía, El Porvenir, Los Yucales, Finca Palo Verde, Sangre de Cristo, and San Pedro Yepocapa, among others, and also from the E side including Ceilán and La Rochela when the wind direction changed. The Washington VAAC issued multiple daily ash advisories on 19 days during May.
Incandescent Strombolian activity continued sending ejecta 200-300 m above the summit during the first half of the month and 300-450 m high during the latter half (figure 120). Seven major ravines, the Seca, Taniluyá, Ceniza, Trinidad, El Jute, Las Lajas, and Honda were affected by block avalanches throughout the month. Intermittent explosions caused rumbles, shock waves that rattled roofs, and sounds similar to a train locomotive at frequent intervals on most days. The lava flow in the Seca ravine advanced from 300 m length on 2 May to 1,000 m long on 9 May. It was reported as being 500 m long on 18 May but was not active after that date. Numerous lahars descended multiple ravines in May. INSIVUMEH issued nine special reports of lahar activity on 3, 14, 16, 20, 23, and 27-29 May. They affected the Las Lajas, Ceniza, El Jute, El Mineral, and Seca ravines. The thick, pasty flows contained blocks of various sizes up to 3 m in diameter along with tree trunks and branches. Several were warm with a sulfurous smell (figure 121). SO2 emissions remained low throughout April-September with only minor emissions recorded in satellite data on 1 April and 9 May 2019 (figure 122).
The fumarolic plumes were only white during June 2019, rising to 4.1-4.5 km altitude daily, drifting W or SW except during the first days of the month when variable winds sent the steam N, E, and SE. Explosions with ash took place 15-20 times per hour on most days with plumes rising to 4.5-4.8 km altitude and drifting primarily W or SW except for the first days of the month (figure 123). On most days, ash plumes drifted 15-20 km W and SW, except during 2-7 June when winds sent ash E, SE, N, and NW. Ashfall was reported virtually every day in Sangre de Cristo, Yepocapa, Morelia, Santa Sofía, and Panimache I and II. In addition, the communities of El Porvenir, Los Yucales, and Finca Palo Verde reported ashfall several days each week. During 2, 4, and 7 June, the N and SE winds caused ash to fall in Alotenango and San Miguel Dueñas. The Washington VAAC issued ash advisories on 15 days during June.
The height of the Strombolian ejecta varied from 200-300 m above the summit on many days in June , but also was sometimes stronger, rising 300-450 m. While block avalanches were reported in all seven barrancas (ravines) more than once (Seca, Taniluyá, Ceniza, Trinidad, El Jute, Las Lajas and Honda), on all days they were reported in the Seca, Taniluya, Ceniza, and Trinidad. Weak to moderate rumbles and shock waves rattled roofs every day, and train engine noises were heard every 5-10 minutes. Seven special reports of lahars were issued on days 2, 11, 21-23, and 30. They affected the Las Lajas, El Jute, Seca, El Mineral, and Ceniza ravines with thick, pasty flows containing blocks 1-3 m in size, shaking the ground as they flowed downstream.
During July 2019, white steam plumes rose daily from the summit of Fuego to an altitude of 4.1-4.3 km and drifted W and SW; higher plumes on 30 and 31 July rose to 4.5 km altitude. Fifteen to twenty ash explosions per hour were typical throughout the month and produced ash plumes that rose to 4.3-4.8 km altitude and drifted SW and W for 10-25 km before dissipating (figure 124). Near-daily ashfall was reported in Morelia, Santa Sofía, El Porvenir, Finca Palo Verde, San Pedro Yepocapa, Panimaché I y II, and Sangre de Cristo; La Rochela and Ceilán also reported ash on 4 and 6 July. Incandescent ejecta height varied from 150-450 m above the summit from day to day, sending block avalanches down all seven ravines on many days. Weak to moderate rumbles and shock waves rattled roofs every day, and train engine noises were heard every 5-15 minutes. On 19 July noises and vibrations were heard and felt 25 km away. Only one lahar was reported on 12 July in the Las Lajas ravine. It was warm, with a sulfurous odor, and carried volcanic ash, sand, and blocks 1-3 m in diameter that shook the ground as they flowed downstream. The Washington VAAC issued ash advisories on 13 days during July.
White steam plumes continued during August 2019, rising to an altitude of 4.1-4.5 km and drifting W and SW daily. Ash-bearing explosions continued also at a rate of about 15-20 per hour throughout the month, rising most days to between 4.5 and 4.7 km altitude. They drifted 15-20 km W or SW nearly every day before dissipating. Every day during the month, ashfall was reported in Morelia, Santa Sofía, El Porvenir, Finca Palo Verde, San Pedro Yepocapa, Panimaché I y II, Sangre de Cristo, and other communities on the SW flank. The Washington VAAC reported ash plumes at Fuego on 15 days during August (figure 125).
Incandescent ejecta also rose every day during August 2019 to 200-300 m above the summit, a few days were reported to 350-400 m. Every day, block avalanches descended the Seca, Taniluyá, Ceniza, and Trinidad ravines; most days blocks also traveled down the Las Lajas and Honda ravines, and many days they were also reported in the El Jute ravine (figure 126). Every 5-10 minutes, every day, weak and moderate rumbles sounding like a train engine shook buildings and rattled roofs in the nearby villages. On 13 August a small lava flow, 75-100 m long, was reported in the Seca ravine. Six lahars were reported on 3 August. They occurred in the Santa Teresa, Mineral, Ceniza, El Jute, and Las Lajas ravines. The thick pasty flows carried blocks 1-2 m in diameter, tree trunks and branches, and disrupted the roads between Siquinala and San Andres Osuna and El rodeo and El Zapote. The next day two more occurred in the Seca and Mineral drainages. From 17-20 August, six more lahars occurred, most in the Las Lajas drainage, but also in the Seca, Mineral and Ceniza ravines.
There were no changes in the steam fumaroles during September 2019; plumes seldom rose over 4.3 km altitude and continued drifting W and SW. The ash explosion rate decreased somewhat and rates of 5-10 per hour were typical on many days. Ash plume heights remained constant around 4.5-4.7 km altitude most days, also drifting W and SW 15-20 km before dissipating (figure 127). While ashfall was reported daily in Panimaché I, Morelia, Santa Sofía, Porvenir, Palo Verde, Yepocapa and other communities on the SW flank for the first half of the month, it grew more intermittent during the second half of September. South-directed winds deposited ash on La Rochela villages and Ceylon on 25 September. The Washington VAAC issued aviation ash advisories on 11 days during the month. Strombolian ejecta mostly rose 200-300 m above the summit; occasionally it reached 300-400 m. On most days, block avalanches descended the Seca, Taniluyá, Ceniza, Trinidad, and Las Lajas ravines; occasionally they were reported in the El Jute and Honda ravines as well. Every day, rumbles and shock waves shook roofs in nearby villages every 5-10 minutes. Lahars were reported twice, on 2 ad 9 September, in the Seca and Rio Mineral drainages both days, dragging branches, tree trunks and blocks up to 2 m in diameter.
Geologic Background. Volcán Fuego, one of Central America's most active volcanoes, is also one of three large stratovolcanoes overlooking Guatemala's former capital, Antigua. The scarp of an older edifice, Meseta, lies between Fuego and Acatenango to the north. Construction of Meseta dates back to about 230,000 years and continued until the late Pleistocene or early Holocene. Collapse of Meseta may have produced the massive Escuintla debris-avalanche deposit, which extends about 50 km onto the Pacific coastal plain. Growth of the modern Fuego volcano followed, continuing the southward migration of volcanism that began at the mostly andesitic Acatenango. Eruptions at Fuego have become more mafic with time, and most historical activity has produced basaltic rocks. Frequent vigorous eruptions have been recorded since the onset of the Spanish era in 1524, and have produced major ashfalls, along with occasional pyroclastic flows and lava flows.
Information Contacts: Instituto Nacional de Sismologia, Vulcanologia, Meteorologia e Hydrologia (INSIVUMEH), Unit of Volcanology, Geologic Department of Investigation and Services, 7a Av. 14-57, Zona 13, Guatemala City, Guatemala (URL: http://www.insivumeh.gob.gt/ ); MIROVA (Middle InfraRed Observation of Volcanic Activity), a collaborative project between the Universities of Turin and Florence (Italy) supported by the Centre for Volcanic Risk of the Italian Civil Protection Department (URL: http://www.mirovaweb.it/); Hawai'i Institute of Geophysics and Planetology (HIGP) - MODVOLC Thermal Alerts System, School of Ocean and Earth Science and Technology (SOEST), Univ. of Hawai'i, 2525 Correa Road, Honolulu, HI 96822, USA (URL: http://modis.higp.hawaii.edu/); Coordinadora Nacional para la Reducción de Desastres (CONRED), Av. Hincapié 21-72, Zona 13, Guatemala City, Guatemala (URL: http://conred.gob.gt/www/index.php); NASA Astronomy Picture of the day (URL: https://apod.nasa.gov/apod/ap190527.html); Global Sulfur Dioxide Monitoring Page, Atmospheric Chemistry and Dynamics Laboratory, NASA Goddard Space Flight Center (NASA/GSFC), 8800 Greenbelt Road, Goddard, Maryland, USA (URL: https://so2.gsfc.nasa.gov/); Paul A. Wallace, Lecturer in Geology, University of Liverpool, Liverpool England (URL: https://www.liverpool.ac.uk/environmental-sciences/staff/paul-wallace/, Twitter: @Paul_A_Wallace, URL: https://twitter.com/Paul_A_Wallace/status/1138527752963993600); Alex Cruz, Photojournalist, Guatemala (Twitter: @ACruz_elP, URL: https://twitter.com/ACruz_elP/status/1149690904023691264/photo/1); William Chigna, Guatemala (Twitter: @William_Chigna, URL: https://twitter.com/William_Chigna/status/1164575009966370816); Publinews Guatemala, (Twitter: @PublinewsGT, URL: https://twitter.com/PublinewsGT/status/1157288917365903360).
Heard (Australia) — October 2019 Cite this Report
Heard
Australia
53.106°S, 73.513°E; summit elev. 2745 m
All times are local (unless otherwise noted)
Ongoing thermal anomalies at the summit crater during April-September 2019
Heard Island, in the Southern Indian Ocean, is about 4,000 km from its closest point to Australia and about 1,500 km from the closest point in Antarctica. Because of the island's remoteness, monitoring is primarily accomplished by satellites. The Big Ben volcano has been active intermittently since 1910, if not before (BGVN 42:10), and thermal anomalies have been observed every month since June 2018 (BGVN 43:10, 44:04). The current reporting period is from April to September 2019.
During April-September 2019, only one thermal anomaly was detected with the MODIS satellite instruments analyzed using the MODVOLC algorithm, and that was on 10 June (2 pixels). The MIROVA (Middle InfraRed Observation of Volcanic Activity) volcano hotspot detection system, also based on analysis of MODIS data, detected a few scattered thermal alerts in late May-early June and three in September; most were between 1-2 km of the summit and of low to moderate power.
The island is usually covered by heavy clouds, obscuring satellite views. However, Sentinel-2 satellite imagery detected cloud-obscured thermal anomalies during the reporting period, most likely due to a persistent lava lake and possibly lava flows (BGVN 41:08).
Geologic Background. Heard Island on the Kerguelen Plateau in the southern Indian Ocean consists primarily of the emergent portion of two volcanic structures. The large glacier-covered composite basaltic-to-trachytic cone of Big Ben comprises most of the island, and the smaller Mt. Dixon lies at the NW tip of the island across a narrow isthmus. Little is known about the structure of Big Ben because of its extensive ice cover. The active Mawson Peak forms the island's high point and lies within a 5-6 km wide caldera breached to the SW side of Big Ben. Small satellitic scoria cones are mostly located on the northern coast. Several subglacial eruptions have been reported at this isolated volcano, but observations are infrequent and additional activity may have occurred.
Information Contacts: Sentinel Hub Playground (URL: https://www.sentinel-hub.com/explore/sentinel-playground); Hawai'i Institute of Geophysics and Planetology (HIGP) - MODVOLC Thermal Alerts System, School of Ocean and Earth Science and Technology (SOEST), Univ. of Hawai'i, 2525 Correa Road, Honolulu, HI 96822, USA (URL: http://modis.higp.hawaii.edu/); MIROVA (Middle InfraRed Observation of Volcanic Activity), a collaborative project between the Universities of Turin and Florence (Italy) supported by the Centre for Volcanic Risk of the Italian Civil Protection Department (URL: http://www.mirovaweb.it/).
Klyuchevskoy (Russia) — October 2019 Cite this Report
Klyuchevskoy
Russia
56.056°N, 160.642°E; summit elev. 4754 m
All times are local (unless otherwise noted)
Ongoing weak thermal anomalies during July-September 2019, but no ash plumes after 1 August
During September 2018 through June 2019, activity at Klyuchevskoy was characterized by weak thermal anomalies and moderate Strombolian-type explosions. Ash emissions were only reported on 1-2 July and 1 August during the period of July-September 2019. The volcano is monitored by the Kamchatkan Volcanic Eruption Response Team (KVERT) and is the primary source of information.
According to KVERT, moderate activity continued from July through at least the middle of September, with gas-and-steam emissions. At the beginning of July, KVERT reported incandescence in the crater. During 1-2 July, ash plumes drifted as far as 85 km E and SE. Ash plumes were visible blowing E in Sentinel-2 images on 17 and 19 July (figure 32); steam plumes were evident on some other days. KVERT reported that an ash emission was seen in webcam images on 1 August.
No thermal anomalies were detected with the MODIS satellite instruments analyzed using the MODVOLC algorithm. The MIROVA (Middle InfraRed Observation of Volcanic Activity) volcano hotspot detection system, also based on analysis of MODIS data, detected no thermal anomalies in June, four scattered ones in July, and only one in August, all low power. According to KVERT, a weak thermal anomaly was detected throughout the reporting period, at least through mid-September, except for the numerous days when the volcano was obscured by clouds; the temperature of the anomalies had steadily decreased with time.
Instruments aboard NASA satellites detected high levels of sulfur dioxide near or directly above the volcano every day during the first week of July and on 12 July, but not on other days during the reporting period. However, the origin for the high levels may, at least in part, have been due to other active volcanoes in the area.
At the beginning of July, the Aviation Color Code (ACC) remained at Orange (the second highest level on a four-color scale). Because of decreased activity, KVERT lowered the ACC to Yellow on 30 August and to Green (the lowest on the scale) on 24 September.
Geologic Background. Klyuchevskoy is the highest and most active volcano on the Kamchatka Peninsula. Since its origin about 6,000 years ago, this symmetrical, basaltic stratovolcano has produced frequent moderate-volume explosive and effusive eruptions without major periods of inactivity. It rises above a saddle NE of Kamen volcano and lies SE of the broad Ushkovsky massif. More than 100 flank eruptions have occurred during approximately the past 3,000 years, with most lateral craters and cones occurring along radial fissures between the unconfined NE-to-SE flanks of the conical volcano between 500 and 3,600 m elevation. Eruptions recorded since the late 17th century have resulted in frequent changes to the morphology of the 700-m-wide summit crater. These eruptions over the past 400 years have originated primarily from the summit crater, but have also included numerous major explosive and effusive eruptions from flank craters.
Information Contacts: Kamchatka Volcanic Eruptions Response Team (KVERT), Far Eastern Branch, Russian Academy of Sciences, 9 Piip Blvd., Petropavlovsk-Kamchatsky, 683006, Russia (URL: http://www.kscnet.ru/ivs/kvert/); Sentinel Hub Playground (URL: https://www.sentinel-hub.com/explore/sentinel-playground); MIROVA (Middle InfraRed Observation of Volcanic Activity), a collaborative project between the Universities of Turin and Florence (Italy) supported by the Centre for Volcanic Risk of the Italian Civil Protection Department (URL: http://www.mirovaweb.it/); Hawai'i Institute of Geophysics and Planetology (HIGP) - MODVOLC Thermal Alerts System, School of Ocean and Earth Science and Technology (SOEST), Univ. of Hawai'i, 2525 Correa Road, Honolulu, HI 96822, USA (URL: http://modis.higp.hawaii.edu/); Global Sulfur Dioxide Monitoring Page, Atmospheric Chemistry and Dynamics Laboratory, NASA Goddard Space Flight Center (NASA/GSFC), 8800 Greenbelt Road, Goddard, Maryland, USA (URL: https://so2.gsfc.nasa.gov/).
Manam (Papua New Guinea) — October 2019 Cite this Report
Manam
Papua New Guinea
4.08°S, 145.037°E; summit elev. 1807 m
All times are local (unless otherwise noted)
Significant eruption on 28 June produced an ash plume up to 15.2 km and pyroclastic flows
Manam is a frequently active volcano forming an island approximately 10 km wide, located 13 km north of the main island of Papua New Guinea. At the summit are the Main Crater and South Crater, with four valleys down the NE, SE, SW, and NW flanks (figure 57). Recent activity has occurred at both summit craters and has included gas and ash plumes, lava flows, and pyroclastic flows. Activity in December 2018 prompted the evacuation of nearby villages and the last reported activity for 2018 was ashfall on 8 December. Activity from January through September 2019 summarized below is based on information from the Rabaul Volcano Observatory (RVO), the Darwin Volcanic Ash Advisory Center (VAAC), the University of Hawai'i's MODVOLC thermal alert system, Sentinel-5P/TROPOMI and NASA Aqua/AIRS SO2 data, MIROVA thermal data, Sentinel-2 satellite images, and observations by visiting scientists. A significant eruption in June resulted in evacuations, airport closure, and damage to local crops and infrastructure.
Activity during January-May 2019. Several explosive eruptions occurred during January 2019 according to Darwin VAAC reports, including an ash plume that rose to around 15 km and dispersed to the W on the 7th. RVO reported that an increase in seismic activity triggered the warning system shortly before the eruption commenced (figure 58). Small explosions were observed through to the next day with ongoing activity from the Main Crater and a lava flow in the NE valley observed from around 0400. Intermittent explosions ejected scoria after 0600, depositing ejecta up to 2 cm in diameter in two villages on the SE side of the island. Incandescence at both summit craters and hot deposits at the terminus of the NE valley are visible in Sentinel-2 TIR data acquired on the 10th (figure 59).
Another explosion generated an ash plume to around 15 km on the 11th that dispersed to the SW. An explosive eruption occurred around 4 pm on the 23rd with the Darwin VAAC reporting an ash plume to around 16.5 km altitude, dispersing to the E. Activity continued into the following day, with satellites detecting SO2 plumes on both 23 and 24 January (figure 60). Activity declined by February with one ash plume reported up to 4.9 km altitude on 15 February.
Ash plumes rose up to 3 km between 1 and 5 March, and dispersed to the SE, ESE, and E. During 5-6 March the plumes moved E, and the events were accompanied by elevated seismicity and significant thermal anomalies detected in satellite data. During 19-22 March explosions produced ash plumes up to 4.6 km altitude, which dispersed to the E and SE. Simon Carn of the Michigan Technological University noted a plume in Aqua/AIRS data at around 15 km altitude at 0400 UTC on 23 January with approximately 13 kt measured, similar to other recent eruptions. Additional ash plumes were detected on 29 March, reaching 2.4-3 km and drifting to the E, NE, and N. Multiple SO2 plumes were detected throughout April (figure 61).
During 19-28 May the Deep Carbon Observatory ABOVE (Aerial-based Observations of Volcanic Emissions) scientific team observed activity at Manam and collected gas data using drone technology. They recorded degassing from the South Crater and Main Crater (figure 63 and 64), which was also detected in Sentinel-5P/TROPOMI data (figure 65). Later in the day the plumes rose vertically up to 3-4 km above sea level and appeared stronger due to condensation. Incandescence was observed each night at the South Crater (figure 66). The Darwin VAAC reported an ash plume on 10 May, reaching 5.5 km altitude and drifting to the NE. Smaller plumes up to 2.4 km were noted on the 11th.
Activity during June 2019. Ash plumes rose to 4.3 km and drifted SW on 7-8 June, and up to 3-3.7 km and towards the E and NE on 18 June. Sentinel-2 thermal satellite data show hot material around the Main Crater on 24 June (figure 66). On 27 June RVO reported that RSAM (Real-time Seismic Amplitude Measurement, a measure of seismic activity through time) increased from 540 to over 1,400 in 30 minutes. "Thundering noise" was noted by locals at around 0100 on the 28th. An ash plume drifting SW was visible in satellite images acquired after 0620, coinciding with reported sightings by nearby residents (figure 67). The Darwin VAAC noted that by 0910 the ash plume had reached 15.2 km altitude and was drifting SW. When seen in satellite imagery at 1700 that day the large ash plume had detached and remained visible extending SW. There were 267 lightning strokes detected within 75 km during the event (figure 68) and pyroclastic flows were generated down the NE and W flanks. At 0745 on 29 June an ash plume reached up to 4.8 km.
Villages including Dugulava, Yassa, Budua, Madauri, Waia, Dangale, and Bokure were impacted by ashfall and approximately 3,775 people had evacuated to care centers. Homes and crops were reportedly damaged due to falling ash and scoria. Flights through Madang airport were also disrupted due to the ash until they resumed on the 30th. The Office of the Resident Coordinator in Papua New Guinea reported that as many as 455 homes and gardens were destroyed. Humanitarian resources were strained due to another significant eruption at nearby Ulawun that began on 26 June.
Activity during July-September 2019. Activity was reduced through July and September. The Darwin VAAC reported an ash plume to approximately 6 km altitude on 6 July that drifted W and NW, another plume that day to 3.7 km that drifted N, and a plume on the 21st that rose to 4.3 km and drifted SW and W. Diffuse plumes rose to 2.4-2.7 km and drifted towards the W on 29 September. Thermal anomalies in the South Crater persisted through September.
Fresh deposits from recent events are visible in satellite deposits, notably in the NE after the January activity (figure 69). Satellite TIR data reflected elevated activity with increased energy detected in March and June-July in MODVOLC and MIROVA data (figure 70).
Geologic Background. The 10-km-wide island of Manam, lying 13 km off the northern coast of mainland Papua New Guinea, is one of the country's most active volcanoes. Four large radial valleys extend from the unvegetated summit of the conical basaltic-andesitic stratovolcano to its lower flanks. These valleys channel lava flows and pyroclastic avalanches that have sometimes reached the coast. Five small satellitic centers are located near the island's shoreline on the northern, southern, and western sides. Two summit craters are present; both are active, although most observed eruptions have originated from the southern crater, concentrating eruptive products during much of the past century into the SE valley. Frequent eruptions, typically of mild-to-moderate scale, have been recorded since 1616. Occasional larger eruptions have produced pyroclastic flows and lava flows that reached flat-lying coastal areas and entered the sea, sometimes impacting populated areas.
Information Contacts: Rabaul Volcano Observatory (RVO), Geohazards Management Division, Department of Mineral Policy and Geohazards Management (DMPGM), PO Box 3386, Kokopo, East New Britain Province, Papua New Guinea; Global Sulfur Dioxide Monitoring Page, Atmospheric Chemistry and Dynamics Laboratory, NASA Goddard Space Flight Center (NASA/GSFC), 8800 Greenbelt Road, Goddard, Maryland, USA (URL: https://SO2.gsfc.nasa.gov/); Sentinel Hub Playground (URL: https://www.sentinel-hub.com/explore/sentinel-playground); MIROVA (Middle InfraRed Observation of Volcanic Activity), a collaborative project between the Universities of Turin and Florence (Italy) supported by the Centre for Volcanic Risk of the Italian Civil Protection Department (URL: http://www.mirovaweb.it/); Hawai'i Institute of Geophysics and Planetology (HIGP) - MODVOLC Thermal Alerts System, School of Ocean and Earth Science and Technology (SOEST), Univ. of Hawai'i, 2525 Correa Road, Honolulu, HI 96822, USA (URL: http://modis.higp.hawaii.edu/); Office of the Resident Coordinator, United Nations, Port Moresby, National Capital District, Papua New Guinea (URL: https://papuanewguinea.un.org/en/about/about-the-resident-coordinator-office, https://reliefweb.int/report/papua-new-guinea/papua-new-guinea-volcanic-activity-office-resident-coordinator-flash-2); Himawari-8 Real-time Web, developed by the NICT Science Cloud project in NICT (National Institute of Information and Communications Technology), Japan, in collaboration with JMA (Japan Meteorological Agency) and CEReS (Center of Environmental Remote Sensing, Chiba University) (URL: https://himawari8.nict.go.jp/); Simon Carn, Geological and Mining Engineering and Sciences, Michigan Technological University, 1400 Townsend Drive, Houghton, MI 49931, USA (URL: http://www.volcarno.com/, Twitter: @simoncarn); Chris Vagasky, Vaisala Inc., Louisville, Colorado, USA (URL: https://www.vaisala.com/en?type=1, Twitter: @COweatherman, URL: https://twitter.com/COweatherman); Emma Liu, University College London Earth Sciences, London WC1E 6BS (URL: https://www.ucl.ac.uk/earth-sciences/people/academic/dr-emma-liu); Matthew Wordell, Boise, ID, USA (URL: https://www.matthhew.com/biocontact); Julian Rüdiger, Johannes Gutenberg University Mainz, Saarstr. 21, 55122 Mainz, Germany (URL: https://www.uni-mainz.de/); Planet Labs, Inc. (URL: https://www.planet.com/);.
Merapi (Indonesia) — October 2019 Cite this Report
Merapi
Indonesia
7.54°S, 110.446°E; summit elev. 2910 m
All times are local (unless otherwise noted)
Low-volume dome growth continues during April-September 2019 with rockfalls and small block-and-ash flows
Merapi is an active volcano north of the city of Yogyakarta (figure 79) that has a recent history of dome growth and collapse, resulting in block-and-ash flows that killed over 400 in 2010, while an estimated 10,000-20,000 lives were saved by evacuations. The edifice contains an active dome at the summit, above the Gendol drainage down the SE flank (figure 80). The current eruption episode began in May 2018 and dome growth was observed from 11 August 2018-onwards. This Bulletin summarizes activity during April through September 2019 and is based on information from Balai Penyelidikan dan Pengembangan Teknologi Kebencanaan Geologi (BPPTKG, the Center for Research and Development of Geological Disaster Technology, a branch of PVMBG), Sutopo of Badan Nasional Penanggulangan Bencana (BNPB), MAGMA Indonesia, along with observations by Øystein Lund Andersen and Brett Carr of the Lamont-Doherty Earth Observatory.
At the beginning of April the rate of dome growth was relatively low, with little morphological change since January, but the overall activity of Merapi was considered high. Magma extrusion above the upper Gendol drainage resulted in rockfalls and block-and-ash flows out to 1.5 km from the dome, which were incandescent and visible at night. Five block-and-ash flows were recorded on 24 April, reaching as far as 1.2 km down the Gendol drainage. The volume of the dome was calculated to be 466,000 m3 on 9 April, a slight decrease from the previous week. Weak gas plumes reached a maximum of 500 m above the dome throughout April.
Six block-and-ash flows were generated on 5 May, lasting up to 77 seconds. Throughout May there were no significant changes to the dome morphology but the volume had decreased to 458,000 by 4 May according to drome imagery analysis. Lava extrusion continued above the Gendol drainage, producing rockfalls and small block-and-ash flows out to 1.2 km (figure 81). Gas plumes were observed to reach 400 m above the top of the crater.
There were a total of 72 avalanches and block-and-ash flows from 29 January to 1 June, with an average distance of 1 km and a maximum of 2 km down the Gendol drainage. Photographs taken by Øystein Lund Andersen show the morphological change to the lava dome due to the collapse of rock and extruding lava down the Gendol drainage (figures 82 and 83). Block-and-ash flows were recorded on 17 and 20 June to a distance of 1.2 km, and a webcam image showed an incandescent flow on 26 June (figure 84). Throughout June gas plumes reached a maximum of 250 m above the top of the crater
Analysis of drone images taken on 4 July gave an updated dome volume of 475,000 m3, a slight increase but with little change in the morphology (figure 85). Block-and-ash flows traveled 1.1 km down the Gendol drainage on 1 July, 1 km on the 13th, and 1.1 km on the 14th, some of which were seen at night as incandescent blocks fell from the dome (figure 86). During the week of 19-25 July there were four recorded block-and-ash flows reaching 1.1 km, and flows traveled out to around 1 km on the 24th, 27th, and 31st. The morphology of the dome continued to be relatively stable due to the extruding lava falling into the Gendol drainage. Gas plumes reached 300 m above the top of the crater during July.
During the week of 5-11 August the dome volume was calculated to be 461,000 m3, a slight decrease from the week before with little morphological changes due to the continued lava extrusion collapsing into the Gendol drainage. There were five block-and-ash flows reaching a maximum of 1.2 km during 2-8 August. Two flows were observed on the 13th and 14th reaching 950 m, out to 1.9 km on the 20th and 22nd, and to 550 m on the 24th. There were 16 observed flows that reached 500-1,000 m on 25-27 August, with an additional flow out to 2 km at 1807 on the 27th (figure 87). Gas plumes reached a maximum of 350 m through the month.
Brett Carr was conducting field work at Merapi during 12-26 September. During this time the lava extrusion was low (below 1 m3 per second). He observed small rockfalls with blocks a couple of meters in size, traveling about 50-200 m down the drainage every hour or so, producing small plumes as they descended and resulting in incandescence on the dome at night. Small dome collapse events produced block-and-ash flows down the drainage once or twice per day (figure 88) and slightly larger flows just over 1 km long a couple of times per week.
The dome volume was 468,000 m3 by 19 September, a slight increase from the previous calculation but again with little morphological change. Two block-and-ash flows were observed out to 600 m on 9 September and seven occurred on the 9th out to 500-1,100 m. Two occurred on the 14th down to 750-900 m, three occurred on 17, 20, and 21 September to a maximum distance of 1.2 km, and three more out to 1.5 km through the 26th. A VONA (Volcano Observatory Notice for Aviation) was issued on the 22nd due to a small explosion producing an ash plume up to approximately 3.8 km altitude (about 800 m above the summit) and minor ashfall to 15 km SW. This was followed by a block-and-ash flow reaching as far as 1.2 km and lasting for 125 seconds (figure 89). Preceding the explosion there was an increase in temperature at several locations on the dome. Weak gas plumes were observed up to 100 m above the crater throughout the month.
Geologic Background. Merapi, one of Indonesia's most active volcanoes, lies in one of the world's most densely populated areas and dominates the landscape immediately north of the major city of Yogyakarta. It is the youngest and southernmost of a volcanic chain extending NNW to Ungaran volcano. Growth of Old Merapi during the Pleistocene ended with major edifice collapse perhaps about 2,000 years ago, leaving a large arcuate scarp cutting the eroded older Batulawang volcano. Subsequent growth of the steep-sided Young Merapi edifice, its upper part unvegetated due to frequent activity, began SW of the earlier collapse scarp. Pyroclastic flows and lahars accompanying growth and collapse of the steep-sided active summit lava dome have devastated cultivated lands on the western-to-southern flanks and caused many fatalities.
Information Contacts: Balai Penyelidikan dan Pengembangan Teknologi Kebencanaan Geologi (BPPTKG), Center for Research and Development of Geological Disaster Technology (URL: http://merapi.bgl.esdm.go.id/, Twitter: @BPPTKG); Pusat Vulkanologi dan Mitigasi Bencana Geologi (PVMBG, also known as Indonesian Center for Volcanology and Geological Hazard Mitigation, CVGHM), Jalan Diponegoro 57, Bandung 40122, Indonesia (URL: http://www.vsi.esdm.go.id/); MAGMA Indonesia, Kementerian Energi dan Sumber Daya Mineral (URL: https://magma.vsi.esdm.go.id/); Badan Nasional Penanggulangan Bencana (BNPB), National Disaster Management Agency, Graha BNPB - Jl. Scout Kav.38, East Jakarta 13120, Indonesia (URL: http://www.bnpb.go.id/, Twitter: https://twitter.com/BNPB_Indonesia); Øystein Lund Andersen (Twitter: @OysteinLAnderse, URL: http://www.oysteinlundandersen.com); Sutopo Purwo Nugroho, BNPB (Twitter: @Sutopo_PN, URL: https://twitter.com/Sutopo_PN); Brett Carr, Lamont-Doherty Earth Observatory, Columbia University, 61 Route 9W, Palisades, NY, USA (URL: https://www.ldeo.columbia.edu/user/bcarr).
Poas (Costa Rica) — October 2019 Cite this Report
Poas
Costa Rica
10.2°N, 84.233°W; summit elev. 2697 m
All times are local (unless otherwise noted)
Occasional phreatic explosions continue through September 2019
Activity at Poás is characterized by weak phreatic explosions and gas-and-ash-emissions, with a hot acid lake that occasionally disappears (BGVN 44:05). During the current reporting period of May-September 2019, this weak activity continued. The volcano is monitored by the Observatorio Vulcanologico Sismologica de Costa Rica-Universidad Nacional (OVSICORI-UNA), and most of the material below comes from their weekly bulletins (Boletin Semanal Vulcanologia).
According to OVSICORI-UNA, a period of continuous emissions occurred during 30 April-1 May with plumes rising 300 m above the crater rim and drifting SW. Ash emissions were visible for a few hours on 30 April, and incandescence was visible at night. OVSICORI-UNA did not report any additional phreatic explosions in May until daily phreatic, geyser-type explosions were observed between 29 May and 1 June, which reached approximately 100 m above the vent. A phreatic explosion on 10 June reached approximately 20-30 m in height, and frequent small phreatic explosions (heights below 20 m) were reported through 16 June.
OVSICORI-UNA reported that on 12 June small geyser-like explosions ejected material less than 50 m high at a rate of about once per hour. At 0604 on 18 June an explosion that lasted about six minutes produced a plume of unknown height. Residents reportedly heard several loud noises during 0610-0615 and observed a plume rising from the crater. Ash fell in Cajón (12 km SW), San Luis de Grecia (11 km SW), Los Ángeles, San Miguel de Grecia (11 km SW), San Isidro (28 km SE), and San Roque (23 km SSE). Whitish ash deposits surrounding the crater, especially on the W and S sectors, were visible in webcam images. On 21 June frequent small phreatic explosions from vent A (Boca Roja) were visible during good viewing conditions ejecting material less than 10 m high.
No additional phreatic activity was reported by OVSICORI-UNA during rest of June or July. The small crater lake was still present on 5 July when visible in satellite imagery and as seen by visitors (figure 130), During the first part of August geyser-like explosions occurred on several days, and reached a maximum height of 50 m. This activity culminated on 17 August with about 30 explosions/day from the vent (Boca Roja). At least one event at 0650 on that day generated a 1-km-high plume of steam, gas, and fine particles. By 26 August, the geyser-type activity had ceased. Geyser-type phreatic explosions resumed on 12 September, reaching a maximum height of 30 m. The number of explosions increased up to 10-15 events/hour and then became continuous for a short time. A phreatic explosion occurred on 22 September at 2059 that generated a plume that rose 3 km above the crater rim and drifted NE. During 22-23 September explosions generated plumes that rose 1 km.
According to OVSICORI-UNA, during 16-26 September sulfur dioxide emissions drifted W and NE, causing a sulfur odor in Alajuela, Heredia, San José, and Cartago. Acidic rain was recorded at an official's house in the Poás Volcano National Park (PNVP) on 23 September and at the Universidad Nacional Costa Rica (UNA) in Heredia (23 km SE) on 26 September. On 30 September, at 0540, a 5-minute long phreatic explosion ejected sediment, and produced a plume that rose 2 km above the crater rim and drifted SW. Ashfall and a sulfur odor was reported in Trojas de Sarchi (10 km SW) and Grecia (16 km SSW). Officials closed the PNVP because of the eruption and ongoing elevated seismicity; the park remained closed the next day.
During the first week of August, strong evaporation had reduced the intracrater lake significantly, and by mid-September, the lake had disappeared. At the end of September, however, some water had begun to accumulate again.
General monitoring data. During April and May, OVSICORI-UNA took few gas measurements due to an unfavorable wind direction. An SO2 measurement during the first part of June was between 100 and 200 t/d. Flux remained low through July, with low SO2/CO2 ratios, and high H2S/SO2 ratios, which OVSICORI-UNA stated were consistent with water infiltration. At the end of July, SO2 concentrations significantly increased to 300-800 t/d, with H2S disappearing and the CO2/SO2 ratio declining, with some fluctuations. Levels remained high through most of August, but had decreased to about 300 t/d by the end of the month. They rose again in September, with fluctuations, and on 29 September were measured at about 1,000 t/d before falling to between 300-400 t/d.
According to OVSICORI-UNA weekly reports, seismicity was relatively low during the reporting period, with a few VTs and LPs and normal background tremor. No significant deformation occurred, except for some deflation in June and July.
Geologic Background. The broad vegetated edifice of Poás, one of the most active volcanoes of Costa Rica, contains three craters along a N-S line. The frequently visited multi-hued summit crater lakes of the basaltic-to-dacitic volcano are easily accessible by vehicle from the nearby capital city of San José. A N-S-trending fissure cutting the complex stratovolcano extends to the lower N flank, where it has produced the Congo stratovolcano and several lake-filled maars. The southernmost of the two summit crater lakes, Botos, last erupted about 7,500 years ago. The more prominent geothermally heated northern lake, Laguna Caliente, is one of the world's most acidic natural lakes, with a pH of near zero. It has been the site of frequent phreatic and phreatomagmatic eruptions since an eruption was reported in 1828. Eruptions often include geyser-like ejections of crater-lake water.
Information Contacts: Observatorio Vulcanologico Sismologica de Costa Rica-Universidad Nacional (OVSICORI-UNA), Apartado 86-3000, Heredia, Costa Rica (URL: http://www.ovsicori.una.ac.cr/); Sentinel Hub Playground (URL: https://www.sentinel-hub.com/explore/sentinel-playground); Sheila DeForest (URL: https://www.facebook.com/sheila.deforest).
Shishaldin (United States) — October 2019 Cite this Report
Shishaldin
United States
54.756°N, 163.97°W; summit elev. 2857 m
All times are local (unless otherwise noted)
Active lava lake and spattering on 23 July 2019; minor explosions and lava fountaining on 17 August
Recent activity at Shishaldin, located on Unimak Island within the Aleutian Islands, has included a lava eruption in the summit crater, thermal anomalies, elevated seismicity, and gas-and-steam and ash plumes (BGVN 41:11). This report describes minor gas-and-steam emissions, increased seismicity, thermal anomalies, lava fountaining accompanied by minor explosive activity, and a spatter cone. The primary source of information is the Alaska Volcano Observatory (AVO). This report updates activity through September 2019.
Volcanism was relatively low between March 2016 and early July 2019; increased seismicity and steam emissions were detected in December 2017, but the activity declined in February 2018. Elevated seismicity and some thermal anomalies accompanied by incandescence observed in satellite imagery (when not obscured by clouds) returned in mid-July 2019 (figure 12).
Elevated surface temperatures and low-level seismic tremors remained elevated through September 2019 (figure 13). Field crews reported an active lava lake and minor spattering within the summit crater on 23 July 2019 (figures 14 and 15). Satellite imagery showed the presence of a small spatter cone and some lava flows within the summit crater on 28 July. A small steam plume was observed in satellite imagery and webcam images on 29 July, 20 August, and 30 September.
On 17 August 2019, a video taken by NOAA during an overflight showed repetitive minor explosive activity and low-level lava fountaining within the summit crater. This activity may have continued through 24 September, according to AVO. The spatter cone grew slightly in August and September, partially filling the summit crater. Accompanying lava flows also grew slightly during this time.
Satellite data from 3 September showed SO2 emissions and elevated surface temperatures. Satellite imagery and tiltmeter data recorded a collapse and slumping of the summit crater floor, which may have occurred on 19 September. In the last few weeks of September, seismicity and surface temperatures decreased to slightly above background levels.
According to MIROVA (Middle InfraRed Observation of Volcanic Activity) data from MODIS satellite instruments, more frequent thermal anomalies were detected in mid-July 2019 and remained elevated through early September (figure 16).
Geologic Background. The symmetrical glacier-covered Shishaldin in the Aleutian Islands is the westernmost of three large stratovolcanoes in the eastern half of Unimak Island. The Aleuts named the volcano Sisquk, meaning "mountain which points the way when I am lost." Constructed atop an older glacially dissected edifice, it is largely basaltic in composition. Remnants of an older edifice are exposed on the W and NE sides at 1,500-1,800 m elevation. There are over two dozen pyroclastic cones on its NW flank, which is covered by massive aa lava flows. Frequent explosive activity, primarily consisting of Strombolian ash eruptions from the small summit crater, but sometimes producing lava flows, has been recorded since the 18th century. A steam plume often rises from the summit crater.
Information Contacts: Alaska Volcano Observatory (AVO), a cooperative program of a) U.S. Geological Survey, 4200 University Drive, Anchorage, AK 99508-4667 USA (URL: https://avo.alaska.edu/), b) Geophysical Institute, University of Alaska, PO Box 757320, Fairbanks, AK 99775-7320, USA, and c) Alaska Division of Geological & Geophysical Surveys, 794 University Ave., Suite 200, Fairbanks, AK 99709, USA (URL: http://dggs.alaska.gov/); MIROVA (Middle InfraRed Observation of Volcanic Activity), a collaborative project between the Universities of Turin and Florence (Italy) supported by the Centre for Volcanic Risk of the Italian Civil Protection Department (URL: http://www.mirovaweb.it/); Hawai'i Institute of Geophysics and Planetology (HIGP) - MODVOLC Thermal Alerts System, School of Ocean and Earth Science and Technology (SOEST), Univ. of Hawai'i, 2525 Correa Road, Honolulu, HI 96822, USA (URL: http://modis.higp.hawaii.edu/); Sentinel Hub Playground (URL: https://www.sentinel-hub.com/explore/sentinel-playground).
Tangkuban Parahu (Indonesia) — October 2019 Cite this Report
Tangkuban Parahu
Indonesia
6.77°S, 107.6°E; summit elev. 2084 m
All times are local (unless otherwise noted)
Phreatic eruption on 27 July followed by intermittent explosions through to 17 September 2019
Tangkuban is located in the West Bandung and Subang Regencies in the West Java Province and has two main summit craters, Ratu and Upas (figure 3). Recent activity has largely consisted of phreatic explosions and gas-and-steam plumes at the Ratu crater. Prior to July 2019, the most recent activity occurred in 2012-2013, ending with a phreatic eruption on 5 October 2013 (BGVN 40:04). Background activity includes geothermal activity in the Ratu crater consisting of gas and steam emission (figure 4). This area is a tourist destination with infrastructure, and often people, overlooking the active crater. This report summarizes activity during 2014 through September 2019 and is based on official agency reports. Monitoring is the responsibility of Pusat Vulkanologi dan Mitigasi Bencana Geologi (PVMBG, also known as Indonesian Center for Volcanology and Geological Hazard Mitigation, CVGHM).
The first reported activity in 2014 consisted of gas-and-steam plumes during October-December, prompting PVMBG to increase the alert level from I to II on 31 December 2014. These white plumes reached a maximum of 50 m above the Ratu crater (figure 5) and were accompanied by elevated seismicity and deformation. This prompted the implementation of an exclusion zone with a radius of 1.5 km around the crater. The activity decreased and the alert level was lowered back to I on 8 January 2015. There was no further reported activity from January 2015 through mid-2019.
From 27 June 2019 an increase in activity was recorded in seismicity, deformation, gas chemistry, and visual observations. By 24 July the responsible government agencies had communicated that the volcano could erupt at any time. At 1548 on 26 July a phreatic (steam-driven) explosion ejected an ash plume that reached 200 m; a steam-rich plume rose to 600 m above the Ratu crater (figures 6, and 7). People were on the crater rim at the time and videos show a white plume rising from the crater followed by rapid jets of ash and sediment erupting through the first plume. Deposition of eruption material was 5-7 cm thick and concentrated within a 500 m radius from the point between the Rata and Upas craters, and wider deposition occurred within 2 km of the crater (figures 8 and 9). According to seismic data, the eruption lasted around 5 minutes and 30 seconds (figure 10). Videos show several pulses of ash that fell back into the crater, followed by an ash plume moving laterally towards the viewers.
On 27 July, the day after the eruption, Øystein Lund Andersen observed the volcano using a drone camera, operated from outside the restricted zone. Over a period of two hours the crater produced a small steam plume; ashfall and small blocks from the initial eruption are visible in and around the crater (figure 11). The ashfall is also visible in satellite imagery, which shows that deposition was restricted to the immediate vicinity to the SW of the crater (figure 12).
Another eruption occurred at 2046 on 1 August 2019 and lasted around 11 minutes, producing a plume up to 180 m above the vent. Additional explosions occurred at 0043 on 2 August, lasting around 3 minutes according to seismic data, but were not observed. Explosions continued to be recorded at 0145, 0357, and 0406 at the time of the PVMBG report when the last explosion was ongoing, and a photo shows an explosion at 0608 (figure 13). The explosions produced plumes that reached between 20 and 200 m above the vent. Due to elevated activity the Alert Level was increased to II on 2 August. Ash emission continued through the 4th. During 5-11 August events ejecting ash continued to produce plumes up to 80 m, and gas-and-steam plumes up to 200 m above the vent. Ashfall was localized around Ratu crater. The following week, 12-18 August, activity continued with ash and gas-and-steam plumes reaching 100-200 m above the vent. During 19-25 August, similar activity sent ash to 50-180 m, and gas-and-steam plumes to 200 m. A larger phreatic explosion occurred at 0930 on 31 August with an ash plume reaching 300 m, and a gas-and-steam plume reaching 600 m above the vent, depositing ash and sediment around the crater.
In early September activity consisted of gas-and-steam plumes up to 100-180 m above the vent with some ash plumes observed (figure 14). Two larger explosions occurred at 1657 and 1709 on 7 September with ash reaching 180 m, and gas-and-steam up to 200 m above the vent. Ash and sediment deposited around the crater. Due to strong winds to the SSW, the smell of sulfur was reported around Cimahi City in West Bandung, although there was no detected increase in sulfur emissions. A phreatic explosion on 17 September produced an ash plume to 40 m and a steam plume to 200 m above the crater. Weak gas-and-steam emissions reaching 200 m above the vent continued through to the end of September.
Geologic Background. Gunung Tangkuban Parahu is a broad stratovolcano overlooking Indonesia's former capital city of Bandung. The volcano was constructed within the 6 x 8 km Pleistocene Sunda caldera, which formed about 190,000 years ago. The volcano's low profile is the subject of legends referring to the mountain of the "upturned boat." The Sunda caldera rim forms a prominent ridge on the western side; elsewhere the rim is largely buried by deposits of the current volcano. The dominantly small phreatic eruptions recorded since the 19th century have originated from several nested craters within an elliptical 1 x 1.5 km summit depression.
Information Contacts: Pusat Vulkanologi dan Mitigasi Bencana Geologi (PVMBG, also known as Indonesian Center for Volcanology and Geological Hazard Mitigation, CVGHM), Jalan Diponegoro 57, Bandung 40122, Indonesia (URL: http://www.vsi.esdm.go.id/); Badan Nasional Penanggulangan Bencana (BNPB), National Disaster Management Agency, Graha BNPB - Jl. Scout Kav.38, East Jakarta 13120, Indonesia (URL: http://www.bnpb.go.id/); Øystein Lund Andersen (Twitter: @OysteinLAnderse, https://twitter.com/OysteinLAnderse, URL: https://www.oysteinlundandersen.com/tangkuban-prahu/tangkuban-prahu-volcano-west-java-one-day-after-the-26th-july-phreatic-eruption/); Reuters (URL: https://www.reuters.com/news/picture/editors-choice-pictures-idUSRTX71F3E); Planet Labs, Inc. (URL: https://www.planet.com/); .