Due to the US Government shutdown, the Smithsonian is temporarily closed. The Global Volcanism Program website will remain available but will not be monitored or updated. Status updates will be available on the Smithsonian homepage.


Quiet prevails despite the Tohoku megathrust of March 2011
Our previous report on Izu-Tobu (BGVN 23:04) summarized the elevated seismicity that began on 20 April 1998 in the eastern Izu Peninsula and started declining around 10 May. The activity included crustal deformation, indicating inflation likely linked to shallow magmatic activity. Izu-Tobu is located 100 km SW of Tokyo and just inland from the coast on the Izu peninsula.
Recent reports from the Japan Meteorological Agency (JMA) noted the Tohoku megathrust of March 2011, centered 400 km to the NE of Izu-Tobu, and that Izu-Tobu lacked any signs of correlated behavior as a result of that M 9.0 earthquake event and the numerous aftershocks.
Izu-Tobu had been quiet since March 2011 until 17 July when seismicity increased and small earthquakes with epicenters around Ito city (8.5 km N) were detected. Earthquakes on 18 July were M 2.5 and M 2.8 (interim values). A maximum seismic intensity of 1 on the JMA scale was observed in Ito-city and Higashi-Izu town (15 km SSW). Seismicity declined to the usual background level the following day. Ground deformation was observed around seismically active areas.
Seismicity along an area from Arai (8 km N) through offshore Shiofuki-zaki (2 km E of Ito-city), increased during 18-23 August 2011, then declined after 24 August. No earthquakes were observed until 22 September when the number of earthquakes temporarily increased at a shallower area around Usami; this activity was interpreted as not being directly related to magma intrusion.
Prior to the 22 September 2011 seismic activity, the volumetric strainmeter at Higashi-Izu town (15 km SSW) showed continuous contraction; the tiltmeter at Ito-city showed an apparent change on 18 September. The trend slowed as seismicity decreased; no change was observed after 23 September. GPS measurements did not exhibit remarkable changes and low-frequency earthquakes and tremor were not observed. The Alert Level at Izu-Tobu remained at 1.
Information Contacts: Japan Meteorological Agency (JMA), Otemachi, 1-3-4, Chiyoda-ku Tokyo 100-8122, Japan (URL: http://www.jma.go.jp/).
The Global Volcanism Program has no Weekly Reports available for Izu-Tobu.
Reports are organized chronologically and indexed below by Month/Year (Publication Volume:Number), and include a one-line summary. Click on the index link or scroll down to read the reports.
Brief eruption follows two-week seismic swarm
After a 2-week earthquake swarm, a brief submarine eruption built a small cone on the sea bottom a few kilometers off the coast of the Izu Peninsula. [See 14:7 for a more detailed report from JMA.]
Earthquakes began 30 June, and by 9 July, more than 19,000 had been recorded. Many were at depths of 4-5 km in a zone roughly 3-7 km NE of Ito, a city of 72,000 about 100 km SW of Tokyo and 40 km NW of Oshima volcano. The swarm included a pair of strong events that occurred within a minute of each other on 9 July at 1109; the first was of M 5.5, the second slightly weaker. At least 18 people were injured by these shocks, and landslides were reported at 16 sites. A year earlier, more than 17,000 events centered farther from the coast were recorded during a month of seismicity that began in late July 1988. Previous swarms had occurred SE of the 1989 epicentral area in 1984 and 1985, and numerous other 1984-86 events occurred in a zone separating the 1984 and 1985 swarm epicenters.
The eruption began on 13 July. A JMA seismometer started to record microseismicity at 1829. The captain of the RV Takuyo (Hydrographic Dept, JMSA), carrying out a bathymetric survey in the area, reported hearing an explosion sound from the sea bottom and a 30-second vibration at 1833. One minute later, the JMA seismometer was saturated by seismic events and remained saturated for the next 10 minutes or more. At 1840, the crew of the RV Takuyo saw the sea surface dome upward about 500 m from the vessel, then a gray-black plume rose from the same area. Five more plumes, ~30 m high and 100 m across, were observed in the next 5 minutes. The ejection of each plume was accompanied by violent shaking and vibration of the ship. No more eruptive activity was reported. Seismographs were again saturated at 1902, and another seismic sequence, of different frequency, was recorded at 1907. Another 15 minutes of volcanic microseismicity began at 2130. No detailed reports were available for the next few days, but strong seismicity stopped after 16 July.
After the eruption, a bathymetric survey using an unmanned vessel detected a new cone in about 100 m of water at the eruption site. The cone was about 450 m wide, with a summit crater 200 m in diameter, but rose only ~10 m above the sea bottom. The eruption occurred in a region of Recent monogenetic volcanism that has built numerous subaerial and submarine cones (figure 1). One nearby pyroclastic flow (Kawagodiara) on the Izu Peninsula has been dated at about 3,250 BP. No ages are available for the submarine edifices, although very fresh pillow lavas were found downslope during work in a submersible.
Reference. Ishii, T., Watanabe, M., Ishizuka, T., Ohta, S., Sakai, H., Haramura, H., Shikazono, N., Togashi, K., Minai, Y., Tominaga, T., Chinzei, K., Horikoshi, M., and Matsumoto, E., 1988, Geological Study with the "Shinkai 2000" in the West Sagami Bay including Calyptogena Colonies; Technical Reports of the Japan Marine Science and Technology Center, 1988, p. 189-218.
Information Contacts: T. Ishii, SI; S. Aramaki, Earthquake Research Institute, Univ of Tokyo; JMA; Hydrographic Dept, JMSA; Asahi Shinbun News, Tokyo.
Submarine cone growth documented; seismicity declines
The following supplements preliminary information in 14:6. An earthquake swarm began on 30 June beneath the sea floor E of the Izu Peninsula, an area where swarms have occurred roughly once or twice a year since 1976 (figure 2). The shocks were centered on the NE side of the post-1976 epicentral zone and were shallower than those of previous swarms (figure 3). Seismicity increased sharply on 4 July (figure 4). The strongest event, M 5.5 on 9 July at 1109, reached intensity 5 (JMA scale) in the Ito area and 4 near Ajiro, and had a right-lateral focal mechanism. The number of earthquakes began to decline the next day. However, strong ground tremor, initially with continuous wave trains of varying amplitude, then almost completely saturating instruments, was recorded 11 July between 2038 and 2148 (figure 5). Strong rumbling sounds accompanied the 11 July tremor but no eruption was evident on the sea surface. Another episode of vigorous ground tremor, with sporadic amplitude increases, began about midnight 12/13 July. The explosions observed from the JMSA's RV Takuyo between 1840 and 1845 (14:06) began with updoming of the sea surface, followed by cockscomb ejections. Frequent, audible shock waves jolted the vessel, 0.5 km from the eruption site. Strong, continuous tremor between 1833 and 1917 nearly saturated local seismometers (figure 6). Small tremor episodes continued until 20 July, with the longest total tremor duration on the 14th. Although bubbling was seen at the the eruption site and other locations nearby, no further eruptions were detected at the surface.
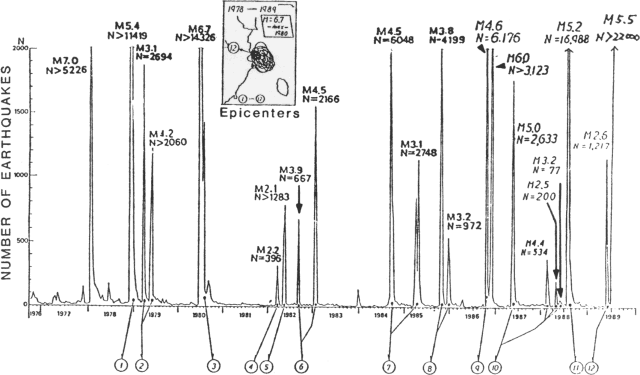 |
Figure 2. Seismic activity NE of the Izu Peninsula, 1976-89. Inset box shows superimposed epicentral zones of each of the 12 swarms, with the July 1989 swarm (no. 12) highlighted. Courtesy of JMA. |
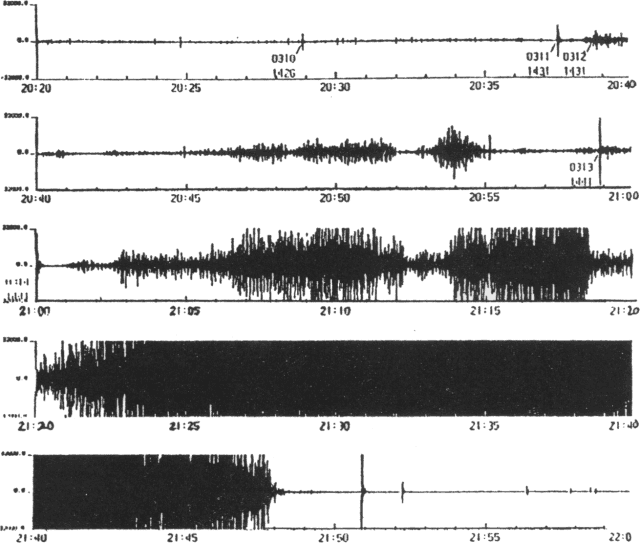 |
Figure 5. Seismograph record, 11 July between 2020 and 2200, showing tremor onset about 2038 and eventual saturation of instruments before tremor ended about 2148. Courtesy of JMA. |
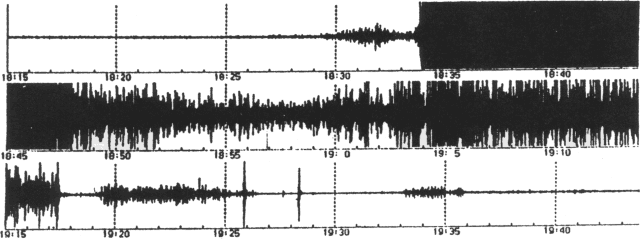 |
Figure 6. Seismograph record, 13 July between 1815 and 1945, including the period of eruptions visible at the sea surface. Courtesy of JMA. |
JMSA bathymetric surveys of the eventual eruption site recorded a flat sea floor before 9 July, but by 13 July, just before the witnessed explosions, the same area had developed a feature ~20 m high and 250 m across at its base. Most volcanologists believed that this feature had grown from submarine eruptions that were not witnessed but probably accompanied the strong tremor of 11 and/or 12 July. A 15 July resurvey revealed an edifice only 10 m high but 450 m in basal diameter, with a crater 200 m across breached on its south side (figure 7). Bubbles rose ~90 m from the crater to the sea surface.
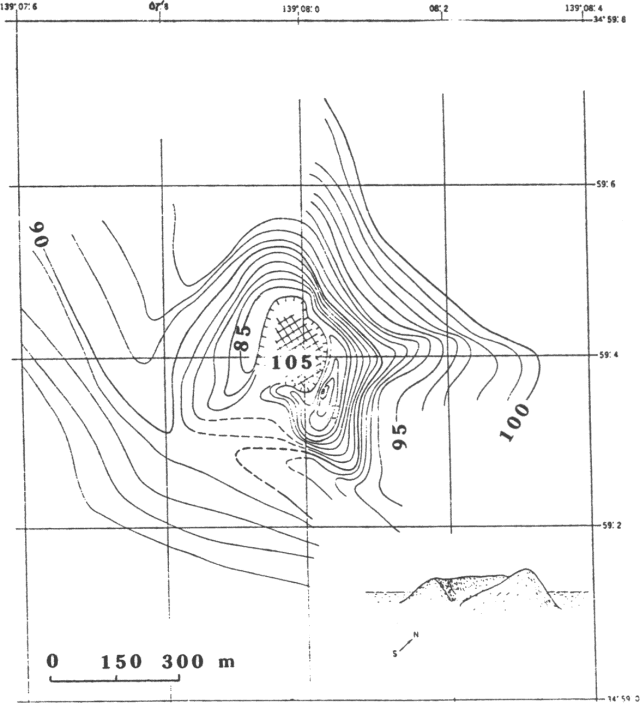 |
Figure 7. Bathymetry of Teishi-Kaikyu measured by an unmanned JMSA survey vessel, 15 July. Contour interval is 1 m. A sketch of the cone is inset at lower right. Courtesy of JMSA. |
Analysis by the National Research Center for Disaster Prevention revealed that the eruption was preceded by large, apparently precursory, ground tilting ~2.5 km to the SSE. Uplift centered in the Ito area was detected by Geographical Survey Institute levelling surveys, but was generally considered to be a possible precursor to stronger tectonic seismicity. The eruption site lies almost directly between Ito City and Hatsushima Island (roughly 10 km apart), and EDM data from the Earthquake Research Institute, Univ of Tokyo, show a clear increase in the distance between them. However, geologists suspect that the distance change may have been caused by faulting associated with the M 5.5 earthquake on 9 July rather than intrusion of magma.
Further References. Okada, Y., and Yamamoto, E., 1991, Dyke intrusion model for the 1989 seismo-volcanic activity off Ito, central Japan: JGR.
Shimada, S., Fujinawa, Y., Sekiguchi, S., Ohmi, S., Eguchi, T., and Okada, Y., 1990, Detection of a volcanic fracture opening in Japan using global positioning system measurements: Nature, v. 343, p. 631-633.
Information Contacts: JMA.
Earthquake swarm
A seismic swarm, centered ~5 km E of the Izu Peninsula coast at 10-15 km depth, began on 25 December at about 1900 and continued until the 27th (figures 8 and 9). A seismometer (in Izo City) 10 km from the epicentral area recorded about 300 shocks, the largest, M 2.9, on 26 December at 0238 and 0417. Three were felt (at Ajiro Weather Station) 15 km NW of the epicentral area, in the early morning of 26 December. No surface changes were observed.
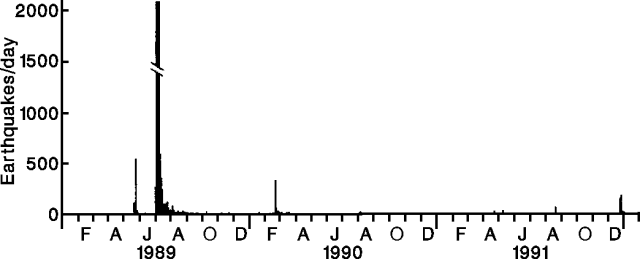 |
Figure 8. Daily number of recorded earthquakes in the vicinity of the [Izu-Tobu] volcano group, 1989-91. Seismicity associated with the July 1989 eruption saturated instruments. Courtesy of JMA. |
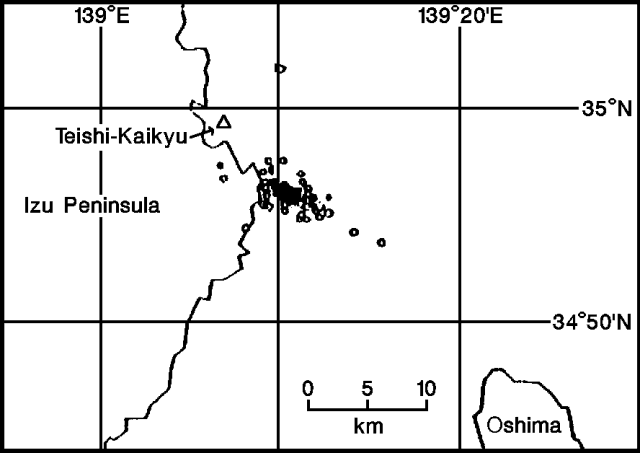 |
Figure 9. Epicenters of earthquakes recorded in the vicinity of the [Izu-Tobu] volcano group, 25-27 December 1991. Courtesy of JMA. |
The December swarm was the first in the area since 20-23 August, when a similar hypocenter distribution was observed. Earthquake swarms have been frequent in the area since 1978, but seismicity has been relatively low since the July 1989 submarine eruption of nearby Teishi Kaikyu.
Information Contacts: JMA.
Strong submarine seismic swarm
A seismic swarm, centered in the sea a few kilometers E of the Izu Peninsula coast at 4-12 km depth, began on 10 January at about 0200 and continued until the 17th. Seismicity declined on 15 January after about ten bursts, each lasting for a few hours, between 10 and 14 January (figures 10 and 11). Hypocenters were located from the coast (at Kawanazaki, Ito city) to 5 km E of the coast (figure 12). The past two swarms, in August and December 1991, had occurred in the same source area (figure 12) (16:8 and 12). A seismometer 10 km from the epicentral area recorded 2,000 shocks, the largest, M 3.8, on 10 December at 1751. Thirty-five were felt (at Ajiro Weather Station) 15 km NW of the epicentral area between 10 and 14 January. No surface changes were observed and no damage was reported.
Information Contacts: JMA.
Strongest earthquake swarm since 1989 submarine eruption
The strongest earthquake swarm since the 1989 submarine eruption at Teishi Knoll occurred between 28 May and 8 June, with no accompanying volcanic activity. Sources were located around Shiofuki-zaki cape, Ito City, on the E coast of the Izu Peninsula (figure 13). The source area, centered 2 km S of Teishi Knoll, roughly covers the S margin of the 1989 area. Focal depths were at 5-8 km, deeper than the 1-5 km depths in 1989. The seismicity consisted of short-period tectonic-type activity and low-frequency events. Volcanic tremor was not recorded.
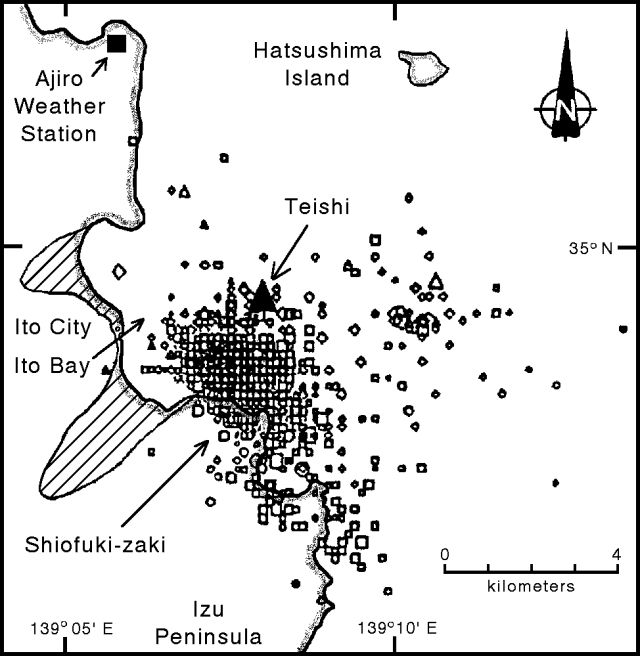 |
Figure 13. Epicenters of earthquakes in the Izu-Tobu area, 26 May-7 June 1993. Hatched area shows most densely inhabited area in Ito City. Courtesy of JMA. |
A total of 9,500 shocks was recorded in Ito City at a seismic station 5 km SW of the source; 25,000 events were recorded in 1989. Personnel at Ajiro Weather Station, 9 km NNW of the source, felt 175 shocks, the strongest of which reached intensity IV on the JMA scale. The largest shock was M 4.3 at 1512 on 31 May, compared to M 5.5 in 1989. No direct damage was caused by the seismicity, but hotels in Ito, a popular spa resort area, lost a reported 1.2 billion yen (> $11 million U.S.) after 60,000 tourists canceled their stay.
Frequent EDM and GPS measurements showed rapid expansion of up to 4 cm over Ito Bay from 27 May to 3 June when seismicity was high. Two tiltmeters near the coast of Ito showed a rapid decline (down tilt to the E) and a borehole strainmeter 20 km S of the source recorded rapid contraction during the same period. Ground deformation was [20-50%] that recorded in 1989. The deformation data are interpreted by JMA as suggesting an opening underground beneath the bay at a few kilometers depth.
Information Contacts: JMA.
Earthquake swarm offshore SE of Ito City
An offshore micro-earthquake swarm began around 0700 on 11 September near Kawanazaki (figure 14). The number of events increased from 61 on 11 September to 125 the next day before decreasing to only 12 on 13 September. The largest event was M 2.6 at 1059 on the 12th. Volume strain meters detected contraction of 10-7. The last earthquake swarm was detected between 27 February and 9 March 1994; it consisted of 287 events, including a M 3.8 earthquake.
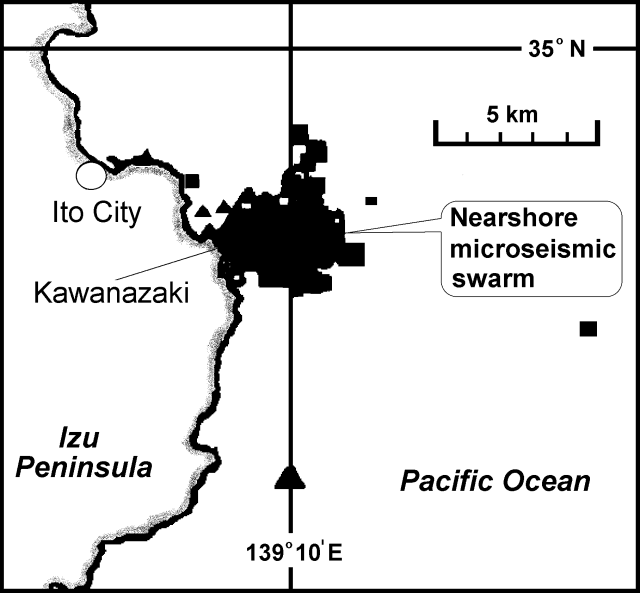 |
Figure 14. Epicenter map of events at Izu-Tobu during 11-13 September 1995. Different symbols indicate hypocenter depths: circles, 0-5 km; triangles, 5-10 km; squares, 10-15 km. Courtesy of JMA. |
Information Contacts: Volcanological Division, Seismological and Volcanological Department, Japan Meteorological Agency (JMA), 1-3-4 Ote-machi, Chiyoda-ku, Tokyo 100 Japan.
Migrating seismic swarms
On 11-12 and 18 September micro-earthquake swarms occurred offshore near Cape Kawana-zaki, in an area adjacent Ito City on the E coast of the Izu Peninsula (figure 15). After that, few micro-earthquakes took place until late September. An intense swarm began in late September; focal depths shallowed as the swarm shifted N and lay off Cape Shiofuki-zaki (figure 15). Personnel at Ajiro Weather Station, 9 km NNW of the source, felt 33 shocks. Kamata seismic station in Ito City, 5 km SW of the source, registered a total of 3,608 shocks. Two tiltmeters near the coast of Ito Peninsula showed rapid changes in tilt; volume strain meters around the volcano recorded compression.
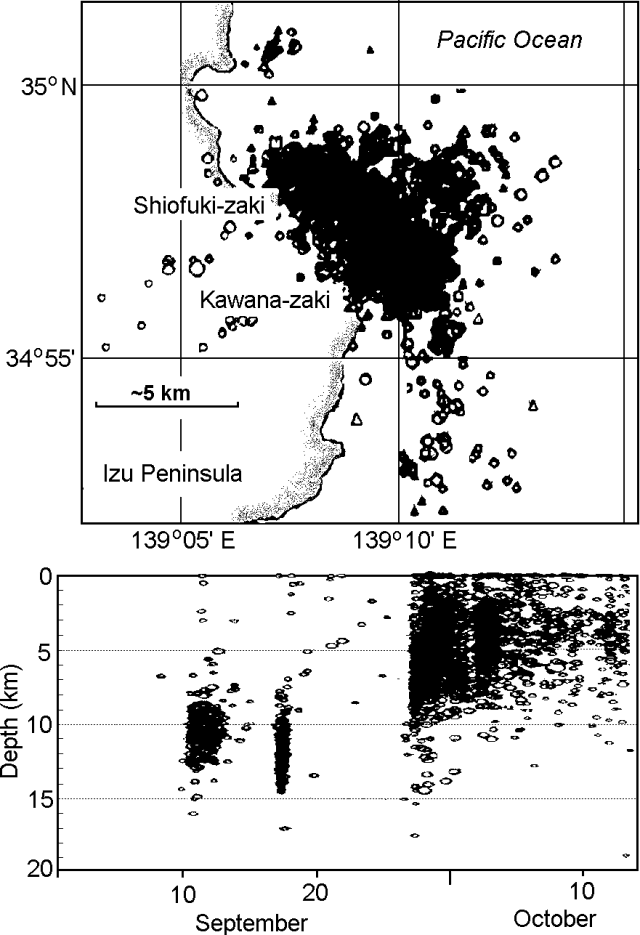 |
Figure 15. Izu-Tobu epicenter map (top) and plot of focal depths versus time for September through 16 October 1995 (bottom). Courtesy of JMA. |
Information Contacts: Volcanological Division, Seismological and Volcanological Department, Japan Meteorological Agency (JMA), 1-3-4 Ote-machi, Chiyoda-ku, Tokyo 100 Japan.
Tremor observed again
Mid- and late-September micro-earthquake swarms occurred offshore near Capes Kawana-zaki and Shiofuki-zaki (BGVN 20:09), an area adjacent Ito City on the E coast of the Izu Peninsula. In late September and early October pulses of seismicity continued off these Capes, trailing off toward mid-October (figure 16). Located ~5 km SW of the epicenters, Kamala Seismic Station recorded 5,881 October earthquakes. The largest earthquake struck at 1142 on 1 October with M 4.8; nearby Into City sustained a JMA-scale intensity of IV. Small-amplitude tremors occurred on both 4 October (four times), and 12 October (one time); low-frequency earthquakes took place on 4 October (four times) and 6 October (one time). Volumetric strain at Higashi-Izu and Ajiro acted in the sense of compression.
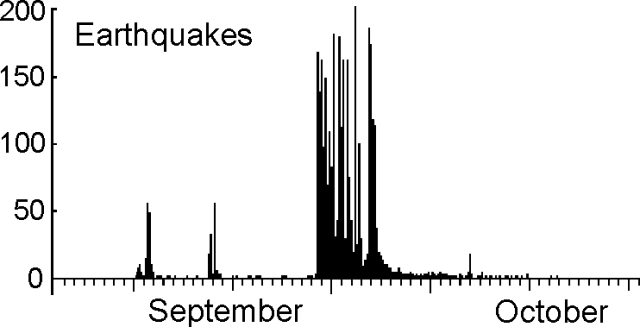 |
Figure 16. Hourly earthquakes at Izu-Tobu recorded ~5 km SW of the seismic sources, September-October 1995. Courtesy of JMA. |
Information Contacts: Volcanological Division, Seismological and Volcanological Department, Japan Meteorological Agency (JMA), 1-3-4 Ote-machi, Chiyoda-ku, Tokyo 100 Japan.
Seismic activity increases
Seismicity at the Izu-Tobu volcano group increased in July. There were 318 earthquakes recorded in July; and the largest one was M 2.4 detected on 12 July. The Kamata seismic station in Ito City recorded 61 events on 15 July, and 45 events on 20 July. Seismicity declined after 24 July.
Information Contacts: Volcanological Division, Japan Meteorological Agency, 1-3-4 Ote-machi, Chiyoda-ku, Tokyo 100, Japan
Seismic activity increases in October
Seismicity increased during the night of 15 October and the Kamata seismic station in Ito City recorded 2,172 events on 16 October; a gradual decline in seismic activity then followed. The largest earthquake had M 4.1. There were five low-frequency earthquakes recorded between 18 and 20 October. The total number of earthquakes registered at Kamata station during October was 5,876. There were 218 earthquakes in November, 61 of them on 3 November.
Information Contacts: Volcanological Division, Japan Meteorological Agency (JMA), 1-3-4 Ote-machi, Chiyoda-ku, Tokyo 100, Japan.
A large earthquake swarm starts on 3 March
About a month prior to a large seismic swarm, seismicity increased around the coastline N of Ito City; on 8 February JMA's Kamata seismic station recorded 20 events, the largest of which was M 3.5. The earthquake total for February was 59.
The large earthquake swarm started on 3 March adjacent to Ito City, a coastal town along the E side of the Izu Peninsula's neck. A migrating swarm had occurred in the same general region during 1995 (BGVN 20:09). The earthquake swarm that began on 3 March occurred in an EW-trending zone, 0-5 km offshore at depths of 2-10 km (figure 17). Small low-frequency earthquakes were reported during 4-6 March but none afterwards. Although the frequency of earthquakes declined after the morning of 5 March, they increased again in the afternoon of 6 March, creating a second seismic peak (figure 18).
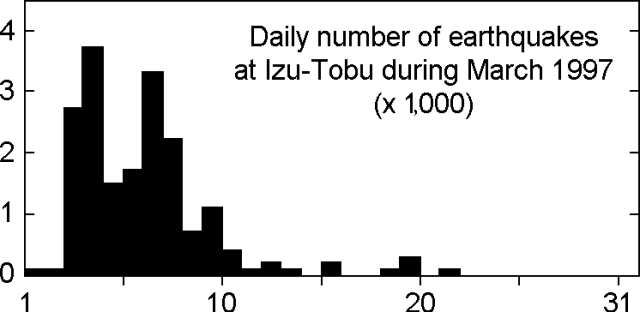 |
Figure 18. Daily number of earthquakes recorded at Kamata seismic station (1-31 March 1997). Courtesy of JMA. |
Aircraft surveys of the epicentral area were made on 7 and 9 March by the Hydrographic Department of the Maritime Safety Agency. The sea surface was not stained or discolored.
Seismic activity declined after 9 March, and ended on 12 March. The total number of earthquakes recorded at the Kamata Station (10 km SW of the first swarm) was 9,080, including 441 felt events. During March four earthquakes had M >5.0; the strongest one, M 5.7, occurred on 4 March.
GPS data gathered by the Geographical Survey Institute in the E part of the peninsula showed a continuous steady swelling of the region around the main earthquake swarm during 3-8 March. The rate of ground deformation (determined with GPS, tiltmeter, and volumetric strain meter) slowed down after 9 March. The ~12-km-long line between Hatsushima and Komuroyama, crossing above the swarm location, extended by a total of 13 cm. The accumulated strain at the Higashi-Izu JMA Station (~20 km SSW of the swarm) was ~6 x 10⁷.
Information Contacts: Volcanological Division, Japan Meteorological Agency (JMA), 1-3-4 Ote-machi, Chiyoda-ku, Tokyo 100, Japan; Masato Koyama, Shizuoka University, Institute of Geosciences, Ohya 836, Shizuoka-shi 422, Japan (URL: http://www.ipcs.shizuoka.ac.jp/~edmkoya/Izu/HIMVFe.html); Setsuya Nakada, Volcano Research Institute (VRI), University of Tokyo,Yayoi 1-1-1, Bunkyo-ku, Tokyo 113 Japan (URL: http://hakone.eri.u- tokyo.ac.jp/vrc/erup/izutobu.html).
Offshore earthquake swarm in late April
A 13 May report stated that elevated seismicity began on 20 April in the eastern Izu Peninsula and started declining on about 10 May. The peak occurred during 21-22 April, when 1,000 earthquakes took place offshore E of Ito City at depths of 2-9 km (figure 19). The largest earthquake of this swarm, on 3 May, was M 5.7. In total, 10,800 earthquakes were detected during 20 April-12 May; of these, 207 were felt by nearby residents. The activity was located SE of an October 1996 swarm (BGVN 21:11) and S of a March 1997 swarm (BGVN 22:02). The earthquake mechanism was SE-NW compression, similar to the March 1997 events.
Strain meters and tiltmeters showed slow deformation about 15 hours before the earthquakes started, clear deformation during 21-22 April, and declining deformation thereafter. GPS surveys disclosed 8 cm of extension between Komuro and Hatsushima (12 km apart); by 9 May the line was no longer extending. During the early stages of the swarm and later on 3 May, a change in the water level of a well N of Omuro-yama was observed. Crustal deformation observations showed inflation in the area of seismicity similar to during previous events; scientists suggested that the deformation was linked to shallow magmatic activity.
Information Contacts: Headquarters for Earthquake Research Promotion, Science and Technology Agency, 2-2-1, Kasumigaseki Chiyoda-ku, Tokyo, Japan 100; Volcano Research Center, Earthquake Research Institute (ERI), University of Tokyo, Yayoi 1-1-1, Bunkyo-ku, Tokyo 113, Japan; Katsuyuki Abe, Earthquake Information Center, ERI.
Quiet prevails despite the Tohoku megathrust of March 2011
Our previous report on Izu-Tobu (BGVN 23:04) summarized the elevated seismicity that began on 20 April 1998 in the eastern Izu Peninsula and started declining around 10 May. The activity included crustal deformation, indicating inflation likely linked to shallow magmatic activity. Izu-Tobu is located 100 km SW of Tokyo and just inland from the coast on the Izu peninsula.
Recent reports from the Japan Meteorological Agency (JMA) noted the Tohoku megathrust of March 2011, centered 400 km to the NE of Izu-Tobu, and that Izu-Tobu lacked any signs of correlated behavior as a result of that M 9.0 earthquake event and the numerous aftershocks.
Izu-Tobu had been quiet since March 2011 until 17 July when seismicity increased and small earthquakes with epicenters around Ito city (8.5 km N) were detected. Earthquakes on 18 July were M 2.5 and M 2.8 (interim values). A maximum seismic intensity of 1 on the JMA scale was observed in Ito-city and Higashi-Izu town (15 km SSW). Seismicity declined to the usual background level the following day. Ground deformation was observed around seismically active areas.
Seismicity along an area from Arai (8 km N) through offshore Shiofuki-zaki (2 km E of Ito-city), increased during 18-23 August 2011, then declined after 24 August. No earthquakes were observed until 22 September when the number of earthquakes temporarily increased at a shallower area around Usami; this activity was interpreted as not being directly related to magma intrusion.
Prior to the 22 September 2011 seismic activity, the volumetric strainmeter at Higashi-Izu town (15 km SSW) showed continuous contraction; the tiltmeter at Ito-city showed an apparent change on 18 September. The trend slowed as seismicity decreased; no change was observed after 23 September. GPS measurements did not exhibit remarkable changes and low-frequency earthquakes and tremor were not observed. The Alert Level at Izu-Tobu remained at 1.
Information Contacts: Japan Meteorological Agency (JMA), Otemachi, 1-3-4, Chiyoda-ku Tokyo 100-8122, Japan (URL: http://www.jma.go.jp/).
|
|
||||||||||||||||||||||||||||
There is data available for 6 confirmed eruptive periods.
1989 Jul 13 - 1989 Jul 13 Confirmed Eruption (Explosive / Effusive) VEI: 1
| Episode 1 | Eruption (Explosive / Effusive) | Teishi-kaikyu (4 km NE of Ito City) | ||||||||||||||||||||||||||||||||||||||||||||||||
|---|---|---|---|---|---|---|---|---|---|---|---|---|---|---|---|---|---|---|---|---|---|---|---|---|---|---|---|---|---|---|---|---|---|---|---|---|---|---|---|---|---|---|---|---|---|---|---|---|---|
| 1989 Jul 13 - 1989 Jul 13 | Evidence from Observations: Reported | ||||||||||||||||||||||||||||||||||||||||||||||||
|
List of 8 Events for Episode 1 at Teishi-kaikyu (4 km NE of Ito City)
|
|||||||||||||||||||||||||||||||||||||||||||||||||
[ 1930 Mar 1 ± 30 days ] Uncertain Eruption
| Episode 1 | Eruption (Explosive / Effusive) | 3.6 km NE of Teishi-jima | |||||||||||||
|---|---|---|---|---|---|---|---|---|---|---|---|---|---|---|
| 1930 Mar 1 ± 30 days - Unknown | Evidence from Unknown | |||||||||||||
|
List of 1 Events for Episode 1 at 3.6 km NE of Teishi-jima
|
||||||||||||||
0750 BCE (?) Confirmed Eruption (Explosive / Effusive) VEI: 3
| Episode 1 | Eruption (Explosive / Effusive) | Iwano-yama, Iyuzan, and other vents | ||||||||||||||||||||||||||||||||||||||
|---|---|---|---|---|---|---|---|---|---|---|---|---|---|---|---|---|---|---|---|---|---|---|---|---|---|---|---|---|---|---|---|---|---|---|---|---|---|---|---|
| 0750 BCE (?) - Unknown | Evidence from Correlation: Tephrochronology | ||||||||||||||||||||||||||||||||||||||
|
List of 6 Events for Episode 1 at Iwano-yama, Iyuzan, and other vents
|
|||||||||||||||||||||||||||||||||||||||
1150 BCE ± 50 years Confirmed Eruption (Explosive / Effusive) VEI: 4
| Episode 1 | Eruption (Explosive / Effusive) | Kawagodaira | |||||||||||||||||||||||||||||||||||||||||||||||||||||
|---|---|---|---|---|---|---|---|---|---|---|---|---|---|---|---|---|---|---|---|---|---|---|---|---|---|---|---|---|---|---|---|---|---|---|---|---|---|---|---|---|---|---|---|---|---|---|---|---|---|---|---|---|---|---|
| 1150 BCE ± 50 years - Unknown | Evidence from Isotopic: 14C (calibrated) | |||||||||||||||||||||||||||||||||||||||||||||||||||||
|
List of 9 Events for Episode 1 at Kawagodaira
|
||||||||||||||||||||||||||||||||||||||||||||||||||||||
2050 BCE (?) Confirmed Eruption (Explosive / Effusive)
| Episode 1 | Eruption (Explosive / Effusive) | Yoichizaka | ||||||||||||||||||
|---|---|---|---|---|---|---|---|---|---|---|---|---|---|---|---|---|---|---|---|
| 2050 BCE (?) - Unknown | Evidence from Correlation: Tephrochronology | ||||||||||||||||||
|
List of 2 Events for Episode 1 at Yoichizaka
|
|||||||||||||||||||
2100 BCE ± 100 years Confirmed Eruption (Explosive / Effusive) VEI: 4
| Episode 1 | Eruption (Explosive / Effusive) | Omuro-yama | ||||||||||||||||||||||||||||||||||||||||||||||||
|---|---|---|---|---|---|---|---|---|---|---|---|---|---|---|---|---|---|---|---|---|---|---|---|---|---|---|---|---|---|---|---|---|---|---|---|---|---|---|---|---|---|---|---|---|---|---|---|---|---|
| 2100 BCE ± 100 years - Unknown | Evidence from Isotopic: 14C (calibrated) | ||||||||||||||||||||||||||||||||||||||||||||||||
|
List of 8 Events for Episode 1 at Omuro-yama
|
|||||||||||||||||||||||||||||||||||||||||||||||||
8050 BCE (?) Confirmed Eruption (Explosive / Effusive) VEI: 3
| Episode 1 | Eruption (Explosive / Effusive) | Akakubo | ||||||||||||||||||||||||||||
|---|---|---|---|---|---|---|---|---|---|---|---|---|---|---|---|---|---|---|---|---|---|---|---|---|---|---|---|---|---|
| 8050 BCE (?) - Unknown | Evidence from Correlation: Tephrochronology | ||||||||||||||||||||||||||||
|
List of 4 Events for Episode 1 at Akakubo
|
|||||||||||||||||||||||||||||
This compilation of synonyms and subsidiary features may not be comprehensive. Features are organized into four major categories: Cones, Craters, Domes, and Thermal Features. Synonyms of features appear indented below the primary name. In some cases additional feature type, elevation, or location details are provided.
Synonyms |
||||
| Higashi-Izu Volcano Group | Omuro-yama Volcano Group | Omuroyama-Amagi Group | Higashi-Izu-Oki Group | ||||
Cones |
||||
| Feature Name | Feature Type | Elevation | Latitude | Longitude |
| Akakubo | Cone | 420 m | 34° 53' 0.00" N | 139° 4' 0.00" E |
| Akasaka-Minami | Cone | 100 m | 34° 57' 0.00" N | 139° 6' 0.00" E |
| Akazawa-kaikyu | Submarine cone | |||
| Amagisan | Stratovolcano | 1406 m | 34° 51' 49.00" N | 138° 59' 59.00" E |
| Amgai Highlands-Higashi | Vent | 490 m | 34° 50' 0.00" N | 139° 1' 0.00" E |
| Ananokubo | Tuff ring | 575 m | 34° 54' 0.00" N | 139° 3' 0.00" E |
| Ara-yama | Cone | 260 m | 34° 55' 0.00" N | 139° 6' 0.00" E |
| Atagawa-kaikyu | Submarine cone | |||
| Chikubo | Cone | 225 m | 34° 55' 0.00" N | 139° 8' 0.00" E |
| Fujimikubo | Tuff ring | 550 m | 34° 54' 0.00" N | 139° 3' 0.00" E |
| Funabara | Pyroclastic cone | 300 m | 34° 55' 0.00" N | 138° 54' 0.00" E |
| Haccho-rindo | Vent | 950 m | 34° 50' 0.00" N | 138° 57' 0.00" E |
| Hachigakubo Group | Cone | 460 m | 34° 57' 0.00" N | 139° 4' 0.00" E |
| Hachikubo-yama | Cone | 680 m | 34° 52' 0.00" N | 138° 56' 0.00" E |
| Hachi-yama | Cone | 619 m | 34° 47' 0.00" N | 138° 58' 0.00" E |
| Hachiyama-Higashioku | Cone | 600 m | 34° 48' 0.00" N | 138° 59' 0.00" E |
| Harai | Pyroclastic cone | |||
| Harai | Vent | 200 m | 34° 54' 0.00" N | 139° 7' 0.00" E |
| Hontanigawa-Shiryu | Vent | 550 m | 34° 50' 0.00" N | 138° 55' 0.00" E |
| Ikeda-Higashi | Cone | 200 m | 34° 56' 0.00" N | 139° 6' 0.00" E |
| Iwanokubo | Cone | 550 m | 34° 54' 0.00" N | 139° 3' 0.00" E |
| Iwanokubo | Tuff ring | 550 m | 34° 54' 0.00" N | 139° 3' 0.00" E |
| Iyuzan
Io-yama |
Pyroclastic cone | |||
| Iyu-zan | Cone | 459 m | 34° 53' 0.00" N | 139° 5' 0.00" E |
| Jizodo Group | Vent | 620 m | 34° 54' 0.00" N | 139° 0' 0.00" E |
| Joboshi | Pyroclastic cone | 135 m | 34° 57' 0.00" N | 139° 7' 0.00" E |
| Kadono | Pyroclastic cone | 217 m | 34° 57' 0.00" N | 139° 6' 0.00" E |
| Kadowaki-kaikyu | Submarine cone | |||
| Kannonyama-Higashi | Cone | 500 m | 34° 49' 0.00" N | 138° 59' 0.00" E |
| Kawana-Minami | Cone | 110 m | 34° 56' 0.00" N | 139° 9' 0.00" E |
| Koike | Vent | 500 m | 34° 47' 0.00" N | 138° 59' 0.00" E |
| Komuro-yama | Cone | 321 m | 34° 56' 0.00" N | 139° 8' 0.00" E |
| Maruno-yama | Pyroclastic cone | 696 m | 34° 54' 0.00" N | 139° 2' 0.00" E |
| Maru-yama | Cone | 938 m | 34° 51' 0.00" N | 138° 56' 0.00" E |
| Nagano | Vent | 400 m | 34° 53' 0.00" N | 138° 58' 0.00" E |
| Nagano-Higashi | Vent | 530 m | 34° 54' 0.00" N | 138° 59' 0.00" E |
| Nishi-Chigasaki-kaikyu | Submarine cone | |||
| Noborio-Minami | Vent | 730 m | 34° 49' 0.00" N | 138° 57' 0.00" E |
| Numanotaira Group | Vent | 600 m | 34° 48' 0.00" N | 138° 54' 0.00" E |
| Odaira | Vent | 580 m | 34° 48' 0.00" N | 138° 58' 0.00" E |
| Ogi | Cone | 200 m | 34° 56' 0.00" N | 139° 6' 0.00" E |
| Oike | Vent | 420 m | 34° 47' 0.00" N | 139° 0' 0.00" E |
| Oike-Minami | Vent | 500 m | 34° 47' 0.00" N | 138° 59' 0.00" E |
| Omuro-yama | Pyroclastic cone | 580 m | 34° 54' 0.00" N | 139° 6' 0.00" E |
| Sannohara-Kita | Cone | 140 m | 34° 56' 0.00" N | 139° 9' 0.00" E |
| Segehiki | Vent | 830 m | 34° 53' 0.00" N | 139° 1' 0.00" E |
| Sekiguchigawa-Joryu | Vent | 872 m | 34° 49' 0.00" N | 138° 59' 0.00" E |
| Sukumo-yama | Cone | 525 m | 35° 0' 0.00" N | 139° 7' 0.00" E |
| Taga | Stratovolcano | |||
| Takamuro-yama | Cone | 310 m | 34° 55' 0.00" N | 139° 7' 0.00" E |
| Takatsuka-yama | Pyroclastic cone | 300 m | 35° 1' 0.00" N | 138° 59' 0.00" E |
| Tenshi | Stratovolcano | |||
| Togasa-yama | Pyroclastic cone | 1197 m | 34° 53' 0.00" N | 139° 2' 0.00" E |
| Uchino | Pyroclastic cone | 150 m | 34° 58' 0.00" N | 139° 7' 0.00" E |
| Usami | Stratovolcano | |||
| Yoichizaka | Vent | 700 m | 34° 53' 0.00" N | 138° 57' 0.00" E |
| Yugaoka | Vent | 34° 49' 0.00" N | 139° 4' 0.00" E | |
Craters |
||||
| Feature Name | Feature Type | Elevation | Latitude | Longitude |
| Higashi-oike | Maar | 190 m | 34° 56' 0.00" N | 139° 7' 0.00" E |
| Hokibara-Higashi | Maar | 600 m | 34° 53' 0.00" N | 138° 58' 0.00" E |
| Inatori Group | Crater | 260 m | 34° 47' 0.00" N | 139° 3' 0.00" E |
| Ippeki-ko | Maar | 190 m | 34° 56' 0.00" N | 139° 7' 0.00" E |
| Kawagodaira | Maar | 1197 m | 34° 52' 0.00" N | 138° 59' 0.00" E |
| Kitanohara-Higashi | Maar | 420 m | 34° 55' 0.00" N | 138° 57' 0.00" E |
| Ohatano | Maar | 410 m | 34° 55' 0.00" N | 139° 2' 0.00" E |
| Sekiguchi Group | Crater | 200 m | 34° 48' 0.00" N | 139° 2' 0.00" E |
| Shiranutanoike | Maar | 650 m | 34° 51' 0.00" N | 139° 1' 0.00" E |
| Teishi-Kaikyu
Teishi Knoll |
Submarine crater | 34° 59' 31.00" N | 139° 7' 55.00" E | |
Domes |
||||
| Feature Name | Feature Type | Elevation | Latitude | Longitude |
| Anano-yama | Dome | 660 m | 34° 54' 0.00" N | 139° 4' 0.00" E |
| Daino-yama | Dome | 360 m | 34° 54' 0.00" N | 139° 5' 0.00" E |
| Iwano-yama | Dome | 602 m | 34° 55' 0.00" N | 139° 3' 0.00" E |
| Yahazu-yama | Dome | 816 m | 34° 54' 0.00" N | 139° 4' 0.00" E |
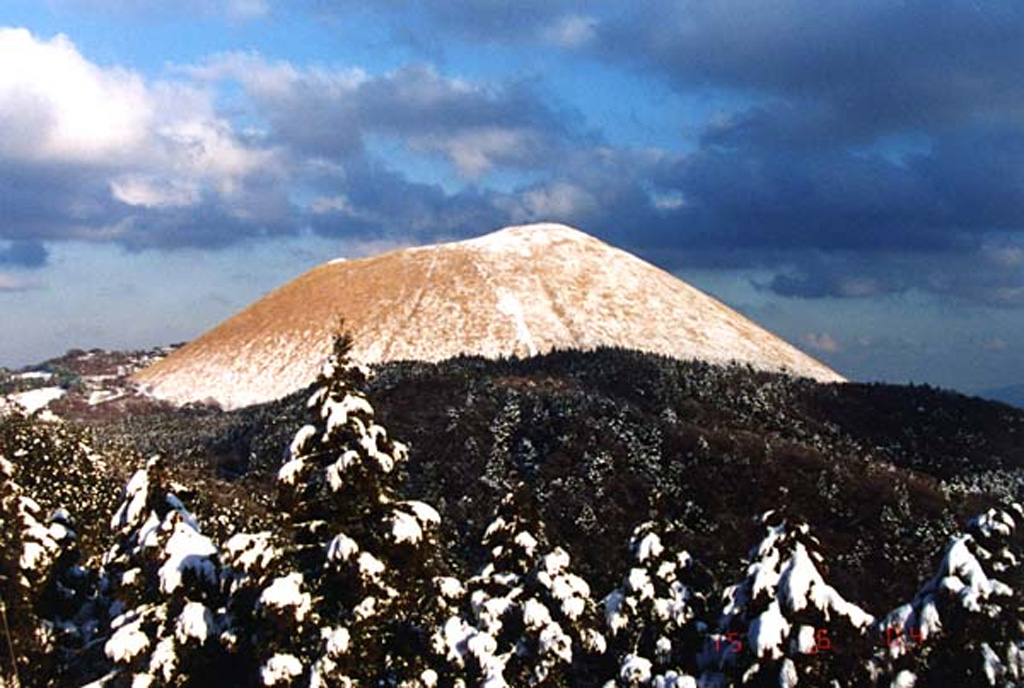
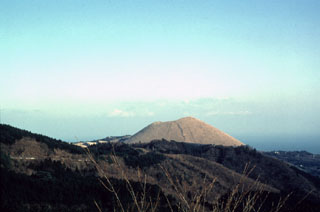 The Omuroyama scoria cone, one of about 70 subaerial volcanoes in the Izu-Tobu volcanic field, formed about 5,000 years ago in the SW part of the field. The cone rises 300 m above the flank in the foreground that was formed by lava flows originating from vents NE and S of the cone.
 Snow mantles the western flanks of Omurayama scoria cone in the Izu-Tobu volcano group. Omuroyama formed about 5,000 years ago. The volcanic field is located across a broad, plateau-like area of more than 400 km2 on the E side of the Izu Peninsula. About 70 monogenetic cones erupted during the last 140,000 years, and chemically similar submarine cones are located offshore.
The following 34 samples associated with this volcano can be found in the Smithsonian's NMNH Department of Mineral Sciences collections, and may be availble for research (contact the Rock and Ore Collections Manager). Catalog number links will open a window with more information.
| Catalog Number | Sample Description | Lava Source | Collection Date |
|---|---|---|---|
| NMNH 108941 | Olivine Andesite | -- | -- |
| NMNH 108947 | Olivine Basalt | ZYBOSI CRATER | -- |
| NMNH 108948 | Olivine Andesite | UMENOKI-DAIRA CRATER | -- |
| NMNH 108952 | Olivine Andesite | -- | -- |
| NMNH 112908 | Basalt | SUKUMO-YAMA CONE | -- |
| NMNH 112908 | Basalt | SUKUMO-YAMA CONE | -- |
| NMNH 112909 | Olivine Basalt | -- | -- |
| NMNH 112909 | Olivine Basalt | ZYOBOSI CRATER | -- |
| NMNH 112910 | Olivine Andesite | KOMURO-YAMA VOLLCANO | -- |
| NMNH 112910 | Olivine Andesite | KOMURO-YAMA VOLCANO | -- |
| NMNH 112911 | Olivine Andesite | -- | -- |
| NMNH 112911 | Olivine Andesite | -- | -- |
| NMNH 112912 | Augite Andesite | -- | -- |
| NMNH 112912 | Augite Andesite | UMENOKI-DAIRA CRATER | -- |
| NMNH 112913 | Augite Basalt | UMENOKI-DAIRA CRATER | -- |
| NMNH 112913 | Augite Basalt | UMENOKI-DAIRA CRATER | -- |
| NMNH 112914 | Olivine Andesite | -- | -- |
| NMNH 112914 | Olivine Andesite | -- | -- |
| NMNH 112915 | Augite Andesite | AMAGI, TOGASA-YAMA | -- |
| NMNH 112915 | Augite Andesite | AMAGI, TOGASA-YAMA | -- |
| NMNH 112916 | Augite Dacite | AMAGI | -- |
| NMNH 112916 | Augite Dacite | AMAGI | -- |
| NMNH 112917 | Hypersthene Dacite | AMAGI | -- |
| NMNH 112917 | Hypersthene Dacite | AMAGI | -- |
| NMNH 112941 | Trachybasalt | IWANO-YAMA | -- |
| NMNH 112941 | Trachybasalt | IWANO-YAMA | -- |
| NMNH 117451-3 | Obsidian | Kwago daira lava; Amagi | -- |
| NMNH 117801-13 | Olivine Basalt | Sukumo-yama | -- |
| NMNH 117801-15 | Olivine Andesite | Daino-yama | -- |
| NMNH 117801-16 | Olivine-Augite-Hypersthene Andesite | Taga | -- |
| NMNH 117801-23 | Olivine Andesite | Omuro-yama | -- |
| NMNH 117801-3 | Augite-Hypersthene Andesite | Taga | -- |
| NMNH 117801-7 | Basalt | Taga | -- |
| NMNH 117801-8 | Augite-Hypersthene Andesite | Taga | -- |
| Copernicus Browser | The Copernicus Browser replaced the Sentinel Hub Playground browser in 2023, to provide access to Earth observation archives from the Copernicus Data Space Ecosystem, the main distribution platform for data from the EU Copernicus missions. |
| MIROVA | Middle InfraRed Observation of Volcanic Activity (MIROVA) is a near real time volcanic hot-spot detection system based on the analysis of MODIS (Moderate Resolution Imaging Spectroradiometer) data. In particular, MIROVA uses the Middle InfraRed Radiation (MIR), measured over target volcanoes, in order to detect, locate and measure the heat radiation sourced from volcanic activity. |
| MODVOLC Thermal Alerts | Using infrared satellite Moderate Resolution Imaging Spectroradiometer (MODIS) data, scientists at the Hawai'i Institute of Geophysics and Planetology, University of Hawai'i, developed an automated system called MODVOLC to map thermal hot-spots in near real time. For each MODIS image, the algorithm automatically scans each 1 km pixel within it to check for high-temperature hot-spots. When one is found the date, time, location, and intensity are recorded. MODIS looks at every square km of the Earth every 48 hours, once during the day and once during the night, and the presence of two MODIS sensors in space allows at least four hot-spot observations every two days. Each day updated global maps are compiled to display the locations of all hot spots detected in the previous 24 hours. There is a drop-down list with volcano names which allow users to 'zoom-in' and examine the distribution of hot-spots at a variety of spatial scales. |
|
WOVOdat
Single Volcano View Temporal Evolution of Unrest Side by Side Volcanoes |
WOVOdat is a database of volcanic unrest; instrumentally and visually recorded changes in seismicity, ground deformation, gas emission, and other parameters from their normal baselines. It is sponsored by the World Organization of Volcano Observatories (WOVO) and presently hosted at the Earth Observatory of Singapore.
GVMID Data on Volcano Monitoring Infrastructure The Global Volcano Monitoring Infrastructure Database GVMID, is aimed at documenting and improving capabilities of volcano monitoring from the ground and space. GVMID should provide a snapshot and baseline view of the techniques and instrumentation that are in place at various volcanoes, which can be use by volcano observatories as reference to setup new monitoring system or improving networks at a specific volcano. These data will allow identification of what monitoring gaps exist, which can be then targeted by remote sensing infrastructure and future instrument deployments. |
| Volcanic Hazard Maps | The IAVCEI Commission on Volcanic Hazards and Risk has a Volcanic Hazard Maps database designed to serve as a resource for hazard mappers (or other interested parties) to explore how common issues in hazard map development have been addressed at different volcanoes, in different countries, for different hazards, and for different intended audiences. In addition to the comprehensive, searchable Volcanic Hazard Maps Database, this website contains information about diversity of volcanic hazard maps, illustrated using examples from the database. This site is for educational purposes related to volcanic hazard maps. Hazard maps found on this website should not be used for emergency purposes. For the most recent, official hazard map for a particular volcano, please seek out the proper institutional authorities on the matter. |
| IRIS seismic stations/networks | Incorporated Research Institutions for Seismology (IRIS) Data Services map showing the location of seismic stations from all available networks (permanent or temporary) within a radius of 0.18° (about 20 km at mid-latitudes) from the given location of Izu-Tobu. Users can customize a variety of filters and options in the left panel. Note that if there are no stations are known the map will default to show the entire world with a "No data matched request" error notice. |
| UNAVCO GPS/GNSS stations | Geodetic Data Services map from UNAVCO showing the location of GPS/GNSS stations from all available networks (permanent or temporary) within a radius of 20 km from the given location of Izu-Tobu. Users can customize the data search based on station or network names, location, and time window. Requires Adobe Flash Player. |
| DECADE Data | The DECADE portal, still in the developmental stage, serves as an example of the proposed interoperability between The Smithsonian Institution's Global Volcanism Program, the Mapping Gas Emissions (MaGa) Database, and the EarthChem Geochemical Portal. The Deep Earth Carbon Degassing (DECADE) initiative seeks to use new and established technologies to determine accurate global fluxes of volcanic CO2 to the atmosphere, but installing CO2 monitoring networks on 20 of the world's 150 most actively degassing volcanoes. The group uses related laboratory-based studies (direct gas sampling and analysis, melt inclusions) to provide new data for direct degassing of deep earth carbon to the atmosphere. |
| Large Eruptions of Izu-Tobu | Information about large Quaternary eruptions (VEI >= 4) is cataloged in the Large Magnitude Explosive Volcanic Eruptions (LaMEVE) database of the Volcano Global Risk Identification and Analysis Project (VOGRIPA). |
| EarthChem | EarthChem develops and maintains databases, software, and services that support the preservation, discovery, access and analysis of geochemical data, and facilitate their integration with the broad array of other available earth science parameters. EarthChem is operated by a joint team of disciplinary scientists, data scientists, data managers and information technology developers who are part of the NSF-funded data facility Integrated Earth Data Applications (IEDA). IEDA is a collaborative effort of EarthChem and the Marine Geoscience Data System (MGDS). |