
The Japan Meteorological Agency (JMA) reported that the number of small volcanic earthquakes beneath Miyakejima’s summit had increased on 17 June but afterwards declined to a rate of a few per day. No changes in tilt were detected after 18 June. In addition, webcam camera observations and a field survey on 8 July revealed no significant changes in the topography, fumaroles, or geothermal conditions within the summit crater. At 1100 on 18 July the Alert level was lowered to 1 (on a 5-level scale) and the public was warned to be cautious within 500 m of the main crater.
Source: Japan Meteorological Agency (JMA)
Minor plumes and low seismicity during April 2010-June 2012
During April 2010-June 2012 the Japan Meteorological Agency (JMA) maintained the hazard status for Miyake-jima at Alert Level 2, where it had stood since 31 March 2008. Our last report (BGVN 34:06) mentioned a minor eruption at Miyake-jima on 1 April 2009 which produced an ash plume that rose ~600 m above the crater. Since that time, activity was relatively low with up to four minor eruptions occurring during April-July 2010, as reported by the Tokyo Volcanic Ash Advisory Center (VAAC) based on information from JMA.
Eruptions occurred on 11 April, 4 July (two possible eruptions during the early morning), and 21 July 2010; the 21 July eruption was the only eruption for which the Tokyo VAAC issued an altitude and drift direction for the plume (~1.2 km altitude with E drift; table 5). The eruptions were characterized by gas and steam emissions lacking significant ash content (e.g. figure 23).
Table 5. Summary of detailed activity reports for Miyakejima during April 2010-June 2012; '--' indicates data not reported. Courtesy of JMA and Tokyo VAAC.
| Month | Gas-and-steam plume heights (m above crater rim) | SO2 flux (metric tons/day) | Remarks |
| Apr 2010 | -- | -- | 11 Apr: Based on information from JMA, Tokyo VAAC reported an eruption at 0840. |
| Jul 2010 | -- | -- | 4 Jul: Based on information from JMA, Tokyo VAAC reported possible eruptions at 1019 and 1434. |
| Jul 2010 | 400 | -- | 21 Jul: Based on information from JMA, Tokyo VAAC reported an eruption at 0928 that produced a plume which rose to an altitude of ~1.2 km (400 m above the crater) and drifted E. |
| Oct 2010 | 100-400 | 500-1,600 | -- |
| Nov 2010 | 100-400 | 500-1,600 | Short duration tremor on 11 and 25 November not accompanied by air-shocks or plume changes. |
| Dec 2010 | 100-400 | 500-900 | -- |
| Jan 2011 | 100-600 | 800-1,000 | -- |
| Feb 2011 | 100-400 | 1,000 | -- |
| Mar 2011 | 100-500 | 600-1,100 | GPS showed continuous deflation from a shallow source. |
| Apr 2011 | 100-500 | 700 | -- |
| May 2011 | 100-400 | 600-900 | -- |
| Jun 2011 | 100-300 | 600 | Low seismicity except for 6 June. Hypocenters located just beneath summit crater. No tremor observed. |
| Jul 2011 | 200-400 | 500 | Low seismicity centered just beneath summit crater. No tremor observed. |
| Aug 2011 | 200-500 | 800-1,000 | Low seismicity with small amplitude, short-duration tremor (~80-90 sec); two increases observed on 18 and 27 Aug. Hypocenters located just beneath summit crater. |
| Sep 2011 | 100-600 | 900 | Low seismicity centered just beneath summit crater. Banded tremor every 20 min. began 23 Sep and continued with smaller amplitudes into Oct. |
| Oct 2011 | 100-400 | 700-900 | Low seismicity centered just beneath summit crater. Continuing banded tremor from Sep ceased on 28 Oct. |
| Nov 2011 | 100-300 | 500-800 | Low seismicity centered just beneath summit crater. Volcanic tremor with small amplitude and short duration (~60 sec) occurred on 12 Nov at 0252; however, no infrasonic signal or ashfall was observed. |
| Dec 2011 | 100-300 | 1,100 | Low seismicity centered just beneath summit crater. No tremor was observed. |
| Jan 2012 | 100-400 | 900-1,200 | Low seismicity centered just beneath summit crater. Five episodes of volcanic tremor with small amplitude and short duration (~40-100 sec) occurred on 18, 22 and 30 Jan. |
| Feb 2012 | 100-400 | 900 | Low seismicity centered just beneath summit crater. |
| Mar 2012 | 100-300 | 600-900 | Aerial observations on 7 Mar revealed high temperature areas located on summit crater's S wall as previously seen in Jan 2010. Low seismicity centered just beneath summit crater; no tremor observed. |
| Apr 2012 | 100-300 | 500-700 | Low seismicity centered just beneath summit crater; no tremor observed. |
| May 2012 | 100-300 | 400 | Low seismicity centered just beneath summit crater; no tremor observed. |
| Jun 2012 | 100-200 | -- | A relatively large A-type earthquake with its hypocenter located around the crater occurred at 0940 on 28 Jun. A seismic intensity of 1 was detected at Miyakejima-Kamitsuki. No tremor observed. |
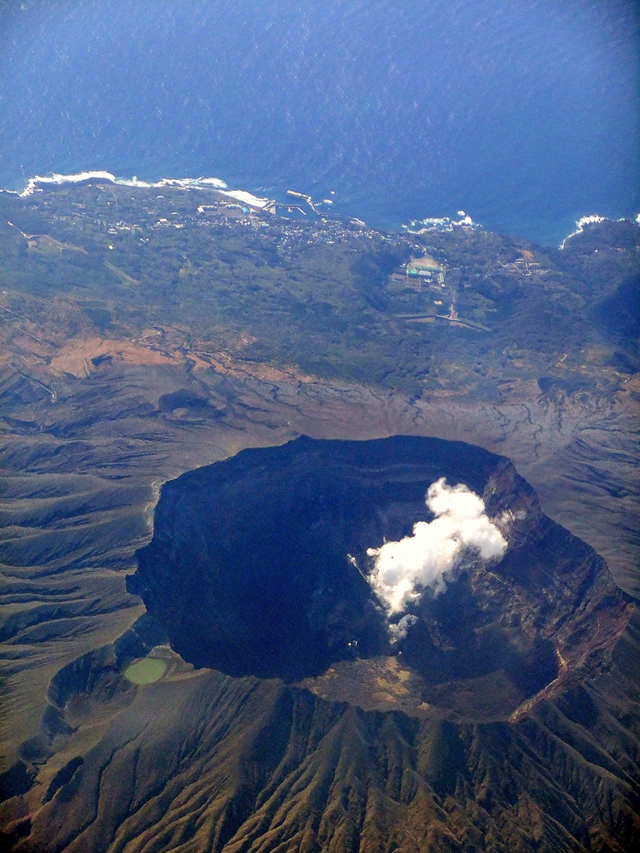 |
Figure 23. A S-looking photograph of Miyake-jima's crater taken from a flight on 17 March 2011 showing an apparent small gas-and-steam emission. Miyake Jima Airport is located along the coast, just out of view to the E. Courtesy of Flickr user R. Forrest. |
JMA reported low levels of seismicity centered just beneath the crater during the reporting interval. Occasional episodes of volcanic tremor occurred, but were not correlated with other data indicating emissions or eruptions (table 5). Sources in Miyakemura village reported that high SO2 concentrations were occasionally detected in some inhabited flank areas.
GPS data revealed contraction in some parts of the edifice, a process that, although diminishing, had continued since 2000. Over the same time period, long-term extension of the baseline along the N-S section of Miyake-jima had been observed since 2006, indicating inflation in deeper portions of the volcano.
Information Contacts: Japan Meteorological Agency (JMA), Otemachi, 1-3-4, Chiyoda-ku Tokyo 100-8122, Japan (URL: http://www.jma.go.jp/); Tokyo Volcanic Ash Advisory Center (VAAC), Tokyo, Japan (URL: http://ds.data.jma.go.jp/svd/vaac/data/).
2025: June
| July
2010: April
| June
| July
2009: April
2008: January
2006: February
| August
2004: January
| February
| December
2003: April
| August
2002: January
| March
| July
2001: February
| March
| May
The Japan Meteorological Agency (JMA) reported that the number of small volcanic earthquakes beneath Miyakejima’s summit had increased on 17 June but afterwards declined to a rate of a few per day. No changes in tilt were detected after 18 June. In addition, webcam camera observations and a field survey on 8 July revealed no significant changes in the topography, fumaroles, or geothermal conditions within the summit crater. At 1100 on 18 July the Alert level was lowered to 1 (on a 5-level scale) and the public was warned to be cautious within 500 m of the main crater.
Source: Japan Meteorological Agency (JMA)
The Japan Meteorological Agency (JMA) reported that the number of small volcanic earthquakes at Miyakejima decreased after a peak on 17 June that led to an Alert Level change. On 17 June the number of small volcanic earthquakes with epicenters directly below the summit crater totaled 59, and uplift near the summit was detected in tiltmeter data. During 18-23 June the number of daily earthquakes decreased to 0-4 earthquakes per day and no changes in tilt were detected after 18 June. The Alert Level remained at 2 (on a 5-level scale) and the public was warned to be cautious in areas inside the Oyama Ring Road.
Source: Japan Meteorological Agency (JMA)
The Japan Meteorological Agency (JMA) reported an increase in unrest at Miyakejima volcano on 17 June. An increase in small volcanic earthquakes was observed beneath the summit and tilt was measured in the direction of the summit crater starting at around 1000. However, there have been no visible changes in the summit crater. Volcanic gas emissions remain very low. The Alert Level was raised to level 2 (on a 5-level scale) at 1250 on 17 June, and the public was warned to be cautious within inside the Oyama Ring Road.
Source: Japan Meteorological Agency (JMA)
Based on information from JMA, the Tokyo VAAC reported that an eruption from Miyake-jima on 21 July produced a plume that rose to an altitude of 1.2 km (4,000 ft) a.s.l. and drifted E.
Source: Tokyo Volcanic Ash Advisory Center (VAAC)
Based on information from JMA, the Tokyo VAAC reported a possible eruption from Miyake-jima on 4 July. Details of possible resulting plumes were unreported.
Source: Tokyo Volcanic Ash Advisory Center (VAAC)
Based on information from JMA, the Tokyo VAAC reported an eruption from Miyake-jima on 11 April. Details of possible resulting plumes were unknown.
Source: Tokyo Volcanic Ash Advisory Center (VAAC)
JMA reported that on 1 April an eruption from Miyake-jima produced an ash plume that rose 600 m above the crater and drifted E. They also stated that the last eruption was on 8 May 2008.
Source: Japan Meteorological Agency (JMA)
Based on information from JMA, the Tokyo VAAC reported that an eruption plume from Miyake-jima rose to an altitude of 1.2 km (4,000 ft) a.s.l. and drifted SE on 7 January.
Source: Tokyo Volcanic Ash Advisory Center (VAAC)
The Tokyo VAAC reported that an eruption at Miyake-jima on 23 August generated plumes that reached altitudes of ~1.5 km (~5,000 ft) a.s.l. and drifted SE. Ash was not identified on satellite imagery.
Source: Tokyo Volcanic Ash Advisory Center (VAAC)
According to a news report, a minor eruption at Miyake-jima on 17 February consisted of small ash emissions. Residents of the island were warned that there could be gas emissions and mudslides. The Geological Survey of Japan, AIST website reported that the sulfur-dioxide flux at Miyake-jima averaged about 2,000-5,000 tons per day in January.
Sources: Associated Press; Geological Survey of Japan
According to the Geological Survey of Japan, volcanic activity at Miyake-jima that began during the summer of 2000 continued through early December. The sulfur-dioxide flux remained high through November 2004, with 3,000-10,000 tons emitted per day. The flux seemed to remain constant since October 2002. On 30 November a minor eruption occurred after a 2-year lull. Several minor eruptions followed, with the most recent eruption occurring on 9 December.
Source: Geological Survey of Japan
Relatively high amounts of gas discharge continued at Miyake-jima through 22 February. The sulfur-dioxide emission rate has been nearly constant (4,000-9,000 tons per day) since October 2002. Due to volcanic unrest, residents of the volcanic island have been evacuated since September 2000.
Source: Geological Survey of Japan
As of 8 January, gas emissions continued at Miyake-jima. The sulfur-dioxide flux was relatively high (about 4,000-9,000 tons per day) and had remained nearly constant since October 2002. Residents of Miyake-jima have been evacuated from the island since September 2000.
Source: Geological Survey of Japan
High amounts of volcanic-gas emissions continued at Miyake-jima through mid-August. The sulfur-dioxide flux has remained high and nearly constant since October 2002, with 4,000-9,000 tons emitted per day as of July 2003. The eruption began in summer 2002 and no explosive activity has been reported in 2003.
Source: Geological Survey of Japan
Miyake-jima has remained restless since its summer eruption in 2000, with robust degassing ongoing through the week of 16-22 April. The SO2 gas output (flux) remained high (about 5,000-10,000 tons/day) as of March 2003. All people who lived on Miyake-jima island have been evacuated since September 2000 and SO2 fluxes around that time had reached extremely high values, over 80,000 tons/day. Although high SO2 flux continues, thus far in 2003 there has been no eruption.
Source: Akihiko Tomiya, Senior Research Scientist, Geological Survey of Japan
The Air Force Weather Agency reported that a low-level steam-and-ash cloud from Miyake-jima was visible on satellite imagery on 26 July at 0713 and on 27 July at 0606. Around this time a continuous plume was visible at a height of 2.4-3 km a.s.l.
Source: US Air Force Weather Agency
According to a news report, a minor eruption occurred at Miyake-jima on 2 April shortly after 1000. While evacuated residents were visiting the island ash rose about 300 m above the volcano and fell around Miyake-jima.
Source: Dow Jones News
On 25 January at 1015 Air Force Weather Agency staff detected a faint E-drifting volcanic plume emanating from Miyake-jima on MODIS imagery.
Sources: NASA; US Air Force Weather Agency
Based on information from the JMA, VRC reported that no ash clouds had been observed at Miyake-jima since the 19 March eruption. They also reported that steam plumes with abundant SO2 were continuously emitted from the summit caldera to 0.5-2 km above the caldera rim. Continuous SO2 emission released as much as 33,000 to 46,000 tons of SO2 per day. Low-level seismic activity continued and a M 2.8 earthquake occurred on 7 May. Global positioning system (GPS) measurements showed steady, continuous deflation of the volcano though the rate was lower than before September 2000. During air inspections very small collapses of the caldera rims were occasionally seen.
Source: Volcano Research Center-Earthquake Research Institute (University of Tokyo)
Based on information from the Japan Meteorological Agency, the Kyodo news agency reported that on 16 March volcanic tremor was recorded at Miyake-jima. The tremor was the strongest to be recorded since 29 August 2000. On 19 March an eruption produced a black ash cloud that rose 800 m above the volcano. The island is currently uninhabited because the current volcanic activity that began on 26-27 June 2000 led officials to order an evacuation on 1 September 2000.
Source: Kyodo News
The National Coordination of Volcanic Eruption Prediction committee reported on the status of Miyake-jima on 5 February. They stated that eruptions had not occurred since October 2000. High SO2 emission rates, ranging from 20 to 50 kilotons per day, continued to be detected. Most of the SO2 is considered to be from degassing magma. The temperature of the active crater increased in December 2000 and returned to normal by late January. Very little ground deformation has been detected. Seismic activity had been low since September, until low-frequency earthquakes occurred in late-January. Due to the high SO2 emission rates and the threat of lahars, volcanologists continue to closely monitor the volcano.
Source: Volcano Research Center-Earthquake Research Institute (University of Tokyo)
Reports are organized chronologically and indexed below by Month/Year (Publication Volume:Number), and include a one-line summary. Click on the index link or scroll down to read the reports.
Tephra cloud to 10 km; lava flows from fissure vents destroy town; 2,000 evacuated
Miyake-jima erupted on 3 October after 21 years of quiescence. Two hours of increasing seismicity preceded the eruption onset. A column of tephra and vapor rose to 10 km, and lava flowed down the SW flank.
Small earthquakes began to be recorded at the JMA Miyake-jima Weather Station at [1359]. Weak shocks were felt at the same time in Ako, the largest village on the SW coast. Seismicity increased gradually, and from around 1430 to 1523 as many as 2-3 earthquakes per minute were recorded. The first felt shock (JMA intensity 1) at the weather station occurred at [1447], followed by others at 1500 (JMA 2), 1514 (JMA 1), and 2 at 1522 (both JMA 2). Many more shocks were felt in Ako. JMA personnel judged that the eruption began at 1523, when the amplitude of recorded continuous tremor began to increase. Tremor saturated the seismograph by [1529] and high amplitudes persisted for hours.
The eruption began [near Jinan-yama, 2 km SW of the summit, forming a 4-km-long fissure that extended to the SW coast]. Lava fountains rose to a few hundred meters from more than nine vents. Lava advanced [mainly] in [four] flows, 300-400 m wide, starting forest fires in many places. The largest flow reached Ako and a smaller one reached Usuki village about 1800; 90% of Ako was destroyed but there were no casualties. Lava reached the sea about 1900.
The pilot of a Japanese airliner reported that an eruption column had reached 10 km altitude around 1600. Tephra covered the entire 55-km2 island. Tephra was thickest on the E half of the island, where 20-30 cm of ash and lapilli accumulated; many car windshields were broken. In the SW sector, 7-8 cm were reported. The airport was closed by the clouds of tephra and about 7.5 cm of ash and fist-sized tephra on the runway. Rescue planes en route to the island had to return to Tokyo Airport.
Spectacular fountaining and frequent loud explosions continued until midnight. An underwater explosion at the SW end of the fissure was observed from a fishing boat about 2330. Activity subsided during the night and only voluminous white smoke was observed on 4 October. [Despite press reports of a new island off the S coast, no new island formed.]
Between the onset of the eruption and 0100 on 4 October, 59 earthquakes were felt. Earthquake activity, which had declined at the onset of the eruption, resumed at 1812 and increased gradually. At 2233 a magnitude 5.7 (Ms) [JMA magnitude 6.2] shock struck the island. Preliminary USGS data placed the event at 34.06°N, 139.45°E, at shallow depth. The shock caused landslides at about 10 places along island roads, and was felt weakly in Tokyo and throughout the Kanto district on Honshu, 180 km to the N. After this earthquake, seismic activity decreased through 4 October. Three felt earthquakes and a series of weak events of different character from those that preceded the eruption occurred between 1700 and 2100 on 5 October. About 3000 earthquakes, including 109 felt shocks, had been recorded on Miyake-jima [27 December 1982-18 January 1983].
When the eruption began, island residents fled to schools and other buildings designated as shelters, but [there was an unconfirmed report that] 30 were forced from the Tsubota town hall (3.5 km SE of the summit) when the roof began to collapse under the weight of tephra. About 2000 residents were moved from the endangered area near the eruption zone to the N coast. There were no casualties. Eleven government ships arrived to stand by in case the entire island population of 4400 needed evacuation. About 10% of the population left the island on 4 October.
Although heavy rain on 5 October cooled the lava, a stream that threatened the 60 remaining [wooden houses] in Ako continued to advance about 1/3 m/hour. On 6 October firemen tried to halt it by spraying water on its front.
Miyake-jima's most recent eruption was 24-27 August 1962, when explosions and lava flows originated from NE flank fissures. Of the 13 recorded eruptions since 1085, Ako was destroyed or badly damaged in 1643, 1712, 1763, and 1835.
Information Contacts: JMA, Tokyo; T. Tiba, National Science Museum, Tokyo; Japan Times, Tokyo; Kyodo News Service, Tokyo; AFP; DPA; AP; UPI.
Four lava flows, four explosion craters from 10-hour eruption
A SW-flank fissure eruption that began 3 October in mid-afternoon reached maximum intensity soon after it started and had subsided by the next morning. Frequent explosions and lava fountaining occurred from vents along a 4-km-long fissure extending SW from the island volcano's summit to the coast (figure 1), fountaining along the upper 2 km and phreatomagmatic explosions along the lower 2 km of the fissure. Lava buried 80% of the coast town of Ako, and heavy tephra falls occurred on the SE part of the island.
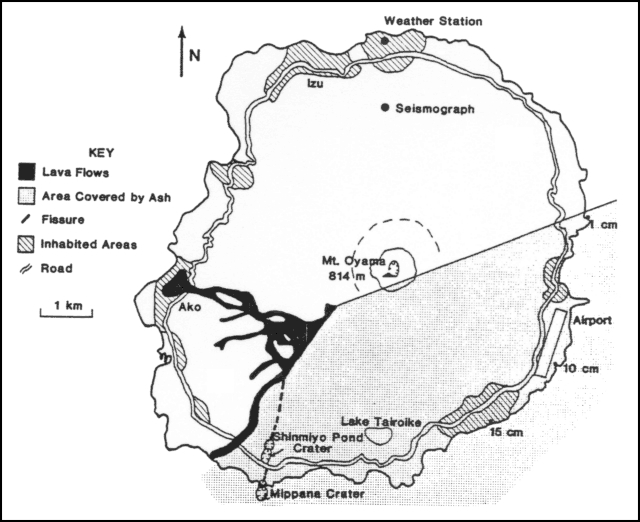 |
Figure 1. Sketch map of Miyake-jima after the eruption of 3-4 October 1983. Craters are indicated by hachured circles. Values in centimeters within the stippled area are thicknesses of new tephra at those locations. Mt. Oyama is the summit cone of Miyake-jima volcano. Courtesy of JMA. |
Pre-eruption studies. The JMA Mobile Observation Team had investigated Miyake-jima 20 August-8 September 1983 and found no unusual activity. During this investigation seismometers recorded a swarm of microearthquakes a few tens of kilometers S of the island, and another a similar distance N, but none with epicenters on the island. Temperatures, ground water chemistry and height of the steam column showed no anomalous values. From 27 December 1982 to 18 January 1983 many earthquakes, the largest of magnitude 6.1 (Ms) [JMA magnitude 6.4] at 1537 on 28 December, occurred 40 km S of the volcano, (figure 1), but no relation between them and the eruption is known.
Eruption chronology and products. JMA personnel judged that the eruption began at 1523, when the amplitude of recorded continuous tremor began to increase (figure 2). Tremor was saturating instruments by 1527. A dark eruption cloud that had reached 3 km altitude was observed from an [All Nippon Airways] airliner at 1529. People living at the foot of the volcano heard explosions at around 1530, and saw incandescent blocks and voluminous clouds of tephra ejected from points on the SW flank. Ash began to fall at the airport at 1540. The eruption column had reached an altitude of 10 km by around 1600. Lava flowing W was 0.5 km from Ako by 1630, and began surrounding and igniting houses around 1800. The southernmost lava flow entered the sea about 3.5 km SE of Ako at about 1900.
 |
Figure 2. Seismicity at Miyake-jima recorded at the JMA weather station on the N side of the island, 3-8 October 1983. Data shows the number of earthquakes felt per hour (top) and amplitude of continuous tremor (bottom). On the tremor graph, the broken line indicates approximately measured data and the heavy line above the graph diagramatically shows the period of eruptive activity. Courtesy of JMA. |
Phreatomagmatic explosions began at a newly formed explosion crater (named [Shinmyo] Pond Crater) near the S end of the fissure at around 1640. At 1722, a strong explosion near the seashore, perhaps at the same crater, produced an incandescent column. Lapilli started to fall in Tsubota (about 4 km E) at 1646. The lapilli fall was heavy enough to break car windshields at around 1700, but began to decline at 1834 and ceased at 1910 as wet muddy ashfall started. At 2140 a strong explosion occurred near the shore, and about an hour later many incandescent columns were observed there but this activity paused at about 2300. A submarine phreatomagmatic explosion at the SW end of the fissure was observed from a fishing boat at around 2310. At about 0145 occasional submarine explosions were seen . . . in the same area.
A member of the JMA Mobile Observation Team arrived at Miyake-jima on 4 October at 0500. Sea and air observations at that time revealed that the fountaining had ended, perhaps about an hour earlier, and observers in aircraft saw neither explosions nor lava extrusion. Four main lava flows had moved down the SW flank. Steam rose weakly from some places on the flows, and voluminously from the SW end of the fissure where phreatic activity had occurred. Small flames seen on flow surfaces were probably from burning trees [or houses]. Lava had virtually stopped flowing, although surveyors who landed at Ako by boat observed a flow front advancing slightly. A series of pits and cinder cones had formed along the fissure in [a slightly curved line] (figure 1). Along the lower 2 km of the fissure there were four explosion craters. The largest, 300 m in diameter, was the site of submarine explosions seen during the night. It had added new land at the shore and was given the name "Mippana Crater."
The largest of the lava flows had buried 80% of Ako. It was 50 m wide in valleys, 500 m wide in the town, and 5 m thick at its front. Several homes and two schools afire at the flow front were observed from the air at 0500 on 4 October. Part of the flow advanced a few meters 4-6 October; on the 6th sea water was sprayed at 40 places along the front to halt it. At 38 of these, the flow had stopped by the next day, but spraying continued until 8 October. The E half of the island was covered with dark tephra, 15 cm deep at Tsubota, 10 cm at the airport, and 1 cm on the NE coast. The coast road around the island was closed at many places by lava flows and tephra.
Volcanologists from the Universities of Tokyo, Tohoku, Chiba, and other institutions arrived on the island 4-5 October to study the eruption and its products. Shigeo Aramaki's preliminary estimate of the volume of material ejected was [4.7] x 106 m3 of lava and [7.4] x 106 m3 of tephra (table 1).
Table 1. Estimated ejecta volumes of eruptions at Miyake-jima during 1940, 1962, and 1983 (in millions of cubic meters).
| Year | Lava | Tephra |
| 1940 | 11 | greater than 1962 |
| 1962 | 9 | 0.3 |
| 1983 | 4.7 | 7.4 |
Seismicity. Five earthquakes were felt between 1448 and 1522 on 3 October , but with the steep increase in [continuous volcanic] tremor amplitude at the start of the eruption, felt shocks stopped (figure 2). Earthquake activity remained low from 1522-1800, the most vigorous phase of the fissure eruption, then increased gradually from 1812 until 2233 when a 5.7 (Ms) [JMA magnitude 6.2] event shook the island. The few shocks felt 5-6 October represent stronger than usual seismicity. The last felt event occurred 15 October and the total since the beginning of the activity was 101. Although landslides occurred at about 10 sites along roads, there were no casualties. The number of small earthquakes then gradually decreased, but remained above background level on 27 October. . . . The amplitude of recorded continuous tremor decreased rapidly late 3 October, reaching its usual low level on 5 October, but increased again briefly early 7 October without . . . eruptive activity.
Human effects. The JMA weather station issued an alert on 3 October at 1545. Evacuation of Ako's 1400 inhabitants by fishing boat, private car and bus began immediately, as the instruction to go to Izu, on the N shore, was repeated through loudspeakers. Eleven buses moved about 1,000 persons in two round trips before the road was cut by lava at around 1730. Fishing boats transported the remaining 70. Eleven ships (from JMSA and JSDF) arrived the evening of 3 October, in case the entire island population of 4,400 needed evacuation. Food, blankets, and tanks of water were shipped from Tokyo.
Electricity was restored to all areas except Tsubota within 24 hours. Water supply to half the island was cut off because of damage to a major conduit (from Tairo-ike Pond). Telephone service was interrupted on 4 October when a switching station in Ako failed, but emergency radio service was established the same day. Tephra deposits at the airport ware cleared after 4 days, allowing it to reopen. The Tokyo government planned to build temporary housing for evacuees.
Further References. Aramaki, S., Hayakawa, Y., Fujii, T., Nakamura, K., and Fukuoka, T., 1986, The October 1983 eruption of Miyake-jima volcano: JVGR, v. 29, p. 203-230.
Special Issue -- The 1983 eruption of Miyake-jima: Bulletin of the Volcanological Society of Japan, v. 29, December 1984, 349 pp. (32 papers).
Information Contacts: JMA, Tokyo.
Low-frequency earthquakes
Low-frequency earthquakes were recorded on 21 and 23 January.
Information Contacts: Volcanological Division, Seismological and Volcanological Department, Japan Meteorological Agency (JMA), 1-3-4 Ote-machi, Chiyoda-ku, Tokyo 100 Japan.
26-27 June earthquake swarm; seawater stain on SW flank
Press sources, including Reuters and the Associated Press, reported that on 26 June seismic activity began on the 55 km2 island of Miyake-jima. About 4,300 earthquakes were detected from late on 26 June through 27 June, although many were too small to be felt. On 27 June a M 4.5 earthquake, the largest registered, was centered in shallow water near the island's W coast. According to a 27 June article, Yoshiaki Ida, a seismologist with the Coordinating Committee for the Prediction of Volcanic Eruptions (CCPVE), said an eruption of steam may have begun undersea. The Defense Agency of Japan reported that an area of shallow water with a blue and yellow tinge near the island's W coast suggested that an eruption may have occurred underwater on the morning of 27 June (figure 3). In addition, a Defense Agency patrol boat reported feeling a strong jolt from below and shortly thereafter another patrol boat observed thick steam rising from the sea's surface in the same area.
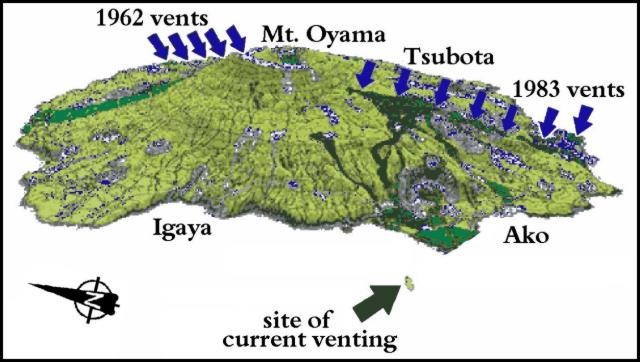 |
Figure 3. Shaded-relief schematic of the 8-km wide, circular island of Miyake-jima, as seen from the W. Sea surface discoloration on 27 June was located ~ 2.2 km off the coast of the port of Ako and was associated with an increase in seismic activity which appeared to be the result of a submarine eruption. Courtesy of the University of Tokyo. |
Authorities were concerned that the eruption could move closer to the shoreline; therefore, on the night of 26 June, 2,500 of the 4,000 Miyake-jima residents were evacuated from the SW and SE sections of the island and relocated to potentially safer areas of the island.
On 29 June, Japan Times reported that fears of a volcanic eruption on Miyake-jima had tapered off. They said that the Japan Meteorological Agency's CCPVE reported that seismic activity had moved off the W coast of the island (figure 4) and that magmatic activities were weakening. On Wednesday, 28 June, more than 400 earthquakes/hr were recorded between 1100 and 1600, but the number dropped to 289 between 1600 and 1700 hours. Some residents began to go home on Thursday as the danger subsided and the evacuation order was partially lifted.
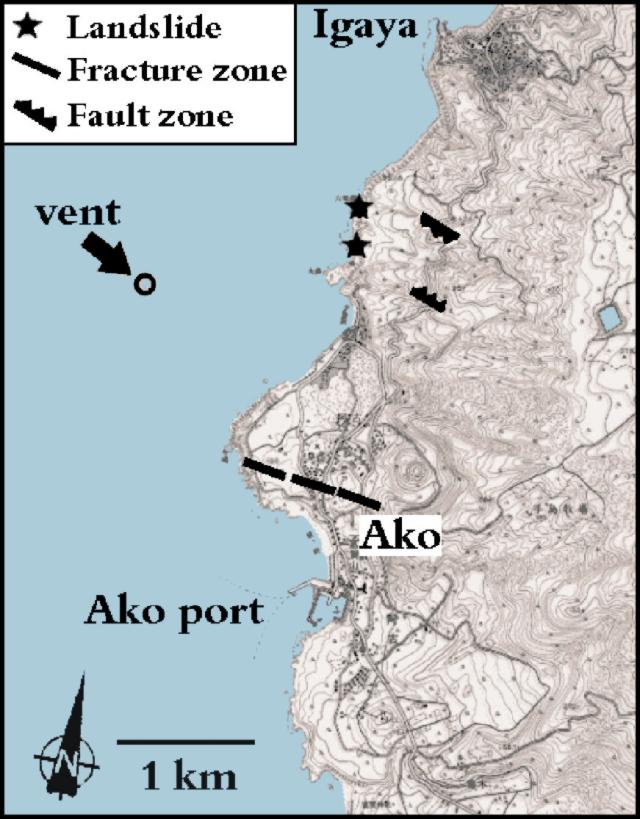 |
Figure 4. A close-up of the SW coast of the Miyake-jima. As of 29 June, seismic activity migrated to the W of the island causing landslides (stars) and eventually moved to the shallow waters to the W of the island where blue and yellow tinges in the water have been attributed to submarine venting. Fractures and faults are also shown. Courtesy of the University of Tokyo. |
Other events occurred in early July as this Bulletin went to press. A future issue will discuss side-scan sonar confirmation of a small submarine pit at the presumed vent site and a sudden caldera-style collapse that formed a substantial summit pit crater.
Information Contacts: Volcano Research Center - Earthquake Research Institute (VRC-ERI), University of Tokyo, Yayoi 1-1-1, Bunkyo-ku, Tokyo, 113-0032 Japan (URL: http://www.eri.u-tokyo.ac.jp/shimano/miyake2000/esurface.html); The Japan Times; Reuters; Associated Press.
Magma intrusion within W flank and explosive eruption on 7 July
The 27 June 2000 water discoloration ~1 km off the W shore of the island of Miyake-jima (BGVN 25:05) prompted considerable investigation. Remote Operation Vehicle (ROV) work and multi-beam side-scan sonar revealed fractures and what appeared to be three ocean-floor craters around the area of discoloration. Crustal deformation found in this region implies that cracks have opened under the W flank of the volcano. Magma intrusion was confirmed to have occurred in the W flank of the volcano around the time of the 27 June event. The absence of scoria or other eruptive products makes it likely that the event was thermal water released due to intrusion.
Magma intrusion is also thought to be the cause of a series of earthquakes that began on 26 June. Hypocenters migrated from a central position under the island in a curve to the W, NW, and N, reaching a position ~70 km NNW of the island by 21 July (figure 5).
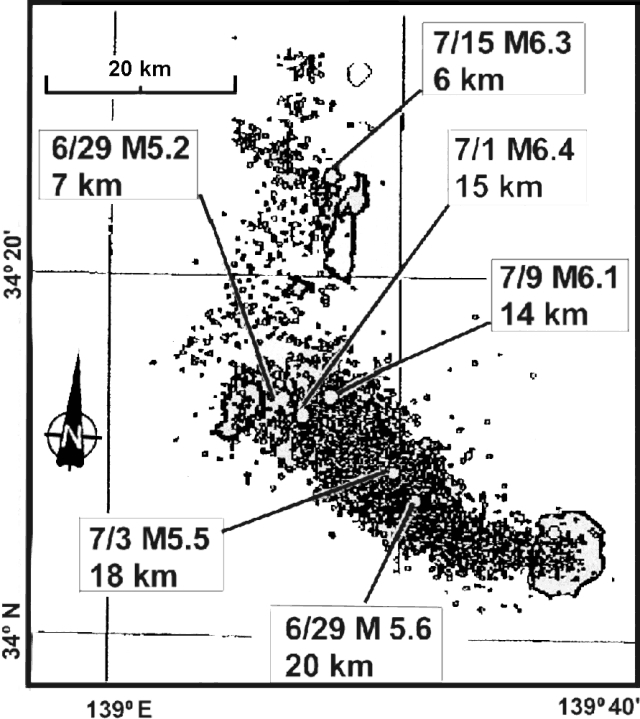 |
Figure 5. A map showing Miyake-jima (lower right-hand corner) and the NW migration of hypocenters, 26 June-21 July 2000. Hypocenters were centered under the summit when activity began and then migrated to a submarine location ~ 10 km NW. This movement was thought to be related to magma intruding to the W. Labels for the higher-magnitude events indicate the month/day, magnitude, and hypocenter depth. Courtesy of the Japan Meteorological Agency. |
Miyake-jima's mayor, Naoyuki Hirose, lifted the evacuation order for the SE district of Tsubota on 29 June, permitting hundreds of the almost 2,000 evacuees to return home. Approximately half of the island's population of 4,000 had been evacuated on 26 June.
At 0414 on 7 July, an eruption from the summit crater sent ash and rock into the sky; plumes dispersed ash over wide areas of the island. The eruption continued until 1110 and about 140 residents had to be evacuated from the N sector of the island to protect them from heavy ashfall. A second eruption at 1550 sent an ash column 1 km above the crater, ejected rocks, and produced loud booming noises. On 8 July there was a weak yellow-colored emission. Closer inspection of this last eruption revealed that very little material had been ejected, but a pit crater ~200 m in diameter and 100-200 m deep had formed. It is thought that the pit crater marked an empty cavity left when magma progressed from the summit area and intruded to the W.
The month-long crisis (figure 5) involved more than 17,500 earthquakes, including 5,480 strong enough to be felt by humans. The Miyake-jima earthquake swarm included a 7 July, M 5.2 event centered 25 km NW of Miyake-jima under the young volcanic islands of Nii-jima and Kozu-shima at 10 km depth, and a 1 July, M 6.4 event that killed one man on Kozu-shima by rockfall.
Information Contacts: Geological Survey of Japan, Higashi 1-1-3, Tsukuba, Ibaraki 305 Japan; Japan Meteorological Agency, Tokyo, Japan; Associated Press; Reuters.
Robust, multifaceted eruptions from new summit crater
This report covers the period 8 July-31 August 2000, an interval marked by strong outbursts, spectacular plumes, pyroclastic flows, ashfalls, and a remarkable series of concentric crater collapses that followed the initial crater collapse on 8 July 2000 (figures 6 and 7). Striking ash-column photos, some marked with azimuthal angles and calculated plume heights, appear on Japanese-language websites (see below).
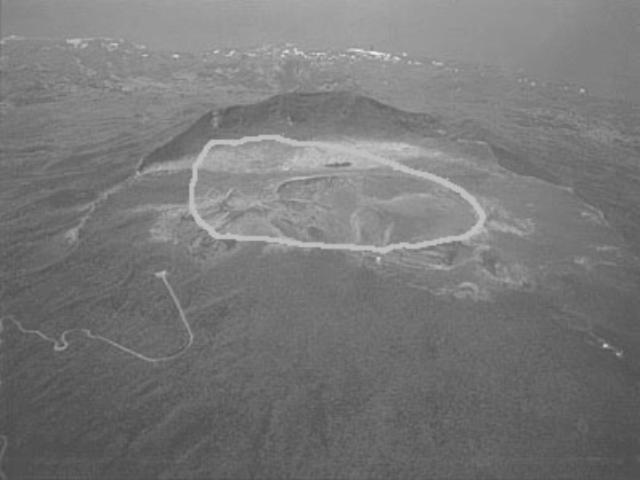 |
Figure 6. An oblique aerial view of Miyake-jima's pre-eruption summit; the sketched-in curve indicates the area of the collapse on 8 July 2000. That area is sub-circular in plan view (figure 7) and has a diameter of ~ 0.9 km. View is looking NNE. Courtesy of Tokyo Metropolitan Islands Promotion Corporation. |
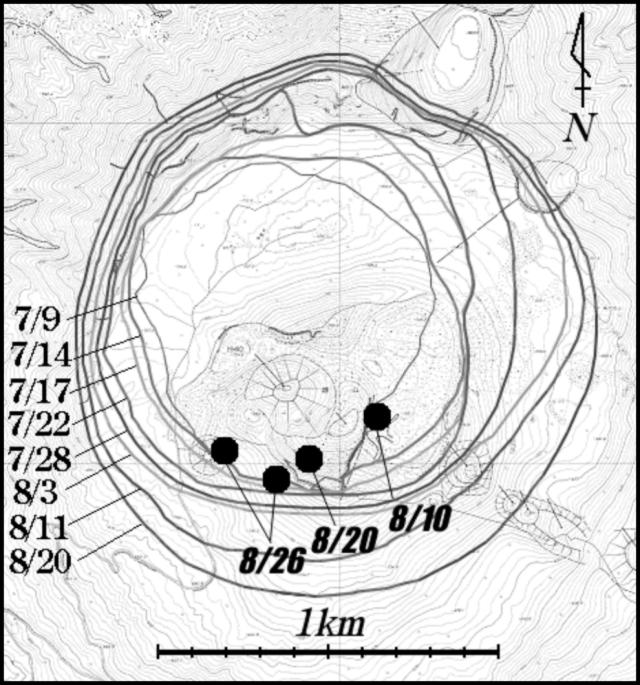 |
Figure 7. Map of Miyake-jima's active summit crater documenting the crater's expansion during July and August 2000. The margins were drawn from aerial photos taken on the specified dates. The progression was thought to be closely linked with summit deflation; this deflation had been detected since the end of June and accelerated on 8 July. Large dots indicate the locations of a series of small migrating vents seen in the crater during 10-26 August. From the website of K. F. Fujita. |
Continuous deflation at the summit had been recorded since the end of June. However, on 8 July the deflation accelerated. Following 4 days of earthquake swarms under the summit, at 1841 on 8 July, a small, phreatic explosion sent a cloud to 800 m above the summit (BGVN 25:07). This explosion lasted several minutes. At the same time, a large pit crater formed with a diameter of ~800-1,000 m and a depth of 100-200 m. A small amount of ash was ejected but was not comparable to the volume of the depression. Red ash and cinder deposits from this eruption were estimated to amount to less than 1 x 10⁶ m3. The volume of collapse was estimated at 50 x 106 m3. No scoriae or any other juvenile material was found. The rapid deflation is thought to have formed as the result of "drain-back" of magma that had intruded near the surface. This appears to have been the catalyst for the explosion.
After the 8 July explosion, tiltmeters recorded periods of sudden inflation. Inflations were preceded and accompanied by long-period earthquakes located less than 2 km below the surface. The intervals of inflation and earthquakes were followed by continued steady deflation. This cycle repeated itself approximately every 12 hours from the 8 July eruption to 23 July.
Following a series of foreshocks, at 1601 on 1 July a Mb 6.1 earthquake struck near Kozu-shima Island, NW of Miyake-jima. This was followed on 14 July by a M 5.3 earthquake off the coast of Miyake-jima. At about 0400, shortly after the earthquake, a phreatic eruption occurred. Thick layers of ash were deposited on the N and E parts of the islands. This eruption continued until about 1300 on 15 July. Photographs taken by Asahi News Network (ANN) on the afternoon of 14 July showed that the 8 July crater had expanded to a diameter of 1,000 m and a depth of 400 m. Observers looking at the bottom of the 8 July crater saw small phreatic explosions yielding plumes with convoluted and scrolled shapes (reminiscent of cock's tails); these originated from a new pit crater that was ~100 m in diameter. The volume of ash from this eruption was estimated to be less than 10 x 106 m3. The volume of collapse was estimated at 200 x 106 m3.
Measurements in early August showed that the collapsed crater had enlarged to a diameter of 1.4 km and a depth of 450 m. According to The Japan Times, an eruption on 10 August produced a plume that rose 3 km above the summit and deposited ash over the NE section of the island. Yukio Hayakawa reported that small pyroclastic flows accompanied this event. After 10 August, phreatic explosions occurred intermittently. Figure 7 shows the progressive expansion of the crater associated with the deflation. GPS measurements made at four stations around the summit indicated continued summit deflation, including during the explosion on 18 August.
At 1700 on 18 August, a large phreatic eruption occurred. This was the largest eruption since activity began on 26 June 2000. Yukio Hayakawa reported small pyroclastic flows. According to articles by the Associated Press and Reuters, white clouds rising to 8 km above the summit were encountered by a commercial airline pilot who was in route from Guam to Narita airport in Tokyo. The plane, which was flying over the island of Miyake shortly after the eruption, later landed safely at Narita. Aviation contacts later revealed that while in flight a commercial airliner encountered airborne ash and underwent a dual-engine flame-out, but managed to land safely. The airliner sustained ~$4 million (US dollars) in damage.
Ash fall was reported to be heaviest on the western part of the island, but ash in the NW sector accumulated up to 15 cm thick as far as 3 km from the crater (figure 8). Ballistics, which included basaltic bombs, were ejected at the end of the eruption and were deposited in a uniform, radial pattern around the crater (figure 9). On the W slope of the volcano, 2-m-diameter ballistics destroyed roofs of cowsheds and formed craters in the meadows. To the SE, there were reports of broken car windows and cinders 5 cm in diameter at the airport. It is uncertain whether these ballistics were juvenile material.
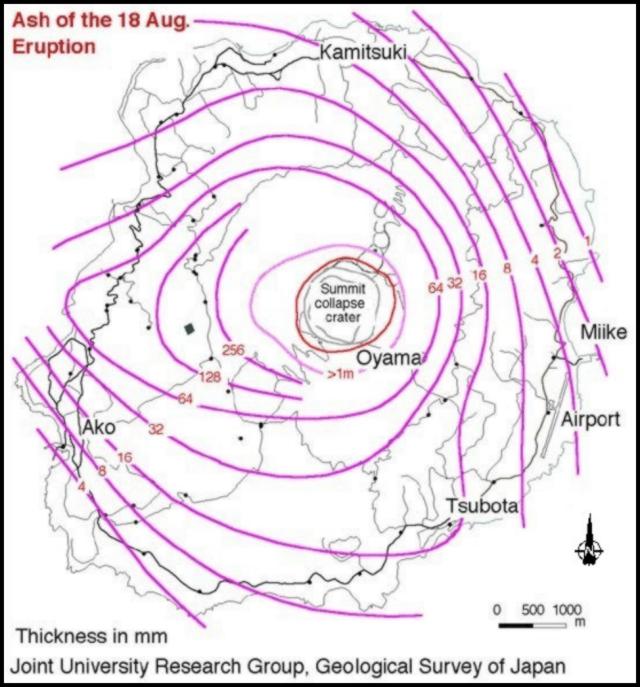 |
Figure 8. Isopach map of ash-fall deposits from Miyake-jima's eruption on 18 August 2000. Courtesy of Joint University Research Group, Geological Survey of Japan. |
 |
Figure 9. Isopleth map of ballistics from Miyake-jima's eruption on 18 August 2000. Courtesy of Joint University Research Group, Geological Survey of Japan. |
Although several lower plume-height observations and estimates were made, for example by aviators, one based on a photograph of the actively rising ash column indicated that the 18 August plume rose to at least 15 km. Laser radar (lidar) provided additional constraints on the height of airborne volcanic aerosols at distance from the volcano, detecting them on 23 August at 16 and 17.5 km altitude. More details follow.
For the 18 August eruption, lidar data collected by Takashi Shibata established these values at Nagoya, Japan (35°N, 137°E, on S Honshu Island, 290 km SE of the volcano) around 2100 on 23 August: backscatter ratio at 532 nm, 1.1; depolarization ratio at 532 nm, 5%; plume height, 16 km; and plume width, 100 km.
On 23 August the lidar instrument run by Motowo Fujiwara and Kouichi Shiraishi in Fukuoka (33.5°N, 130.4°E, on NW Kyushu Island, 850 km W of the volcano) detected a thin aerosol layer. Their measurement took place over an interval that began at 0013 and extended over the next hour and a half. They detected relatively strong scattering in the lower stratosphere and found these values: peak backscatter ratio at 532 nm, 1.20-1.25; depolarization ratio at 532 nm, 8-15%; layer height, 17.5 km; and layer width, 1 km. The cited height corresponds to the peak (strongest effect) of the layer; this altitude was ~1.7 km above the tropopause observed by Fukuoka Meteorological Observatory at 2100 on 22 August. Fujiwara and Shiraishi suggested aerosols might have come from Miyake-jima, specifically its eruption at 1702 on 18 August. The Meteorological Observatory reported that during the period from 18-21 August the wind direction around the layer height (17-18 km) changed from ENE to SSE (i.e., basically easterly) and its speed changed from 3 to 7 m/s. These easterly winds further suggested that the lidar-detected aerosol layer originated from a Miyake-jima eruption.
Observations made on 20 August by Osamu Oshima of the University of Tokyo revealed 3 small cones with open pits inside the summit crater, multiple mudflows from the crater pits onto the crater floor, and step faults that crossed new ash layers. He interpreted the step faults to indicate continued subsistence of the crater floor.
The Tokyo VAAC reported three small eruptions at Miyake-jima on 28 August. The eruption clouds reached respective heights of about 5.8, 3.8, and 5 km. On 29 August at 0430, Miyake-jima erupted vigorously again; according to the Eruption Committee this was the second-largest outburst of the recent eruptive episode (the most vigorous being the 18 August eruption). There were two pyroclastic flows, one to the NE that extended 5 km to the sea, and one to the SW that extended for 3 km. The pyroclastic flows contained large amounts of HCl, unlike those of 18 August. The eruption was theorized to be the result of either the collapse of an unstable hydrothermal system or contact between magma and meteoric water inside the volcano. Photos of the pyroclastic flows appeared on the internet (see references).
According to an article by the Associated Press and the Japanese news agency Asahi Shimbun, on 29 August all students, teachers, and school officials on Miyake-jima were evacuated to Tokyo, and all remaining residents of the island were ordered to evacuate. Residents who had not yet left the island as of 31 August were being housed in shelters due to the threat of mudslides produced by thick ash and rain.
Information Contacts: Miyake-jima Meterological Observatory and Volcanological Division; Japan Meteorological Agency (JMA), 1-3-4 Ote-machi, Chiyoda-ku, Tokyo 100, Japan (URL: http://www.jma.go.jp/); Akihiko Tomiya, Geological Survey of Japan, 1-1-3 Higashi, Ibaraki, Tsukuba 305, Japan (URL: https://www.gsj.jp/); Setsuya Nakada, Volcano Research Center, Earthquake Research Institute, University of Tokyo, Yayoi 1-1-1, Bunkyo-ku, Tokyo 113-0032, Japan (URL: http://www.eri.u-tokyo.ac.jp/VRC/index_E.html); Takashi Shibata, STEL, Nagoya University, Furo-cho, Chikusa-ku, Nagoya 464-8601, Japan; Yukio Hayakawa, Faculty of Education, Gunma University, Aramaki, Maebashi 371, Japan (URL: http://www.hayakawayukio.jp/); Motowo Fujiwara and Kouichi Shiraishi, Department of Earth System Science, Fukuoka University, 8-19-1 Nanakuma, Jonann-ku, Fukuoka 814-0180, Japan; U.S. Geological Survey, Reston, VA, USA (URL: http://www.usgs.gov); The Japan Times, 5-4, Shibaura 4-chome, Minato-ku, Tokyo 108-0023 (URL: http://www.japantimes.co.jp/); Asahi Shimbun (URL: http://www.asahi.com/english/english.html); Associated Press; Reuters.
Gravity and synthetic-aperature radar data; volcanism through October 2000
Volcanism at Miyake-jima began on 27 June 2000 with a series of underwater eruptions (BGVN 25:05-25:07). The continuing activity since then has given scientists the opportunity to conduct multi-faceted visual, geochemical, geodetic, and geophysical observations. This report covers June-October, and within this interval several stages of activity occurred including intrusive events, collapse of the summit crater, explosive phreatic events, and degassing (figure 10). During September to mid-October, SO2 emissions were high and low levels of ash were intermittently emitted.
 |
Figure 10. Time table summarizing the eruption at Miyake-jima during June-September 2000. Under the Phenomena column the abbreviation CTJ refers to an eruption with cock's tail jet. Under the Ejecta column the expression Cl/SO4 refers to the ratio of water soluble chloride to sulfur-dioxide ions attached on the surface of ash, a parameter whose increase is considered a good indicator of the hydrothermal water contribution. Courtesy of ERI, University of Tokyo. |
Gravity variation during June-August 2000. The ERI Gravity Group conducted a study on the spatio-temporal gravity variation during June-September 2000. They used a microgal gravimeter, which senses mass anomalies and movements beneath the Earth's surface. A change of 1.1 microgals ( µgal) is equal to about one part per billion of the gravitational acceleration at the Earth's surface. This is approximately the change in gravitational acceleration that would be expected from a 3 mm change in vertical position.
The group observed gravity changes among the five surveys around the volcano during June 1998 to August 2000 (figure 11). The geophysicists found that from the beginning of the activity to just before the crater collapse on 8 June 2000 gravity decreased ~140 microgals at the summit (figure 11a). This decrease could be explained by the creation of a cavity that was ~1.5 km deep and had a volume of 6 x 10⁸ m3. Gravity increased by 111 microgals in the SW part of the island due to the intrusion of a dyke that had a tensile opening of 1.7 m. The approximately 60 microgal increase along the coast resulted from subsidence of the entire island caused by deflation of the deep magma chamber.
 |
Figure 11. Differentials in gravity (µgal) shown for designated stations and shaded over larger areas resulting from five sequential surveys at Miyake-jima. The figures show differentials between: a) June 1998 to 6 July 2000 (dyke intrusion occurred on the W coast), b) 6 July-11 July 2000 (crater collapse began on 8 July), c) 14 July-31 July 2000 (crater collapse continued and summit explosions occurred on 14 and 15 July), and d) 31 July-12 August 2000 (crater collapse continued and a summit explosion occurred on 10 August). Courtesy of the ERI Gravity Group. |
From just before the 6 July crater collapse to just after the 11-14 July collapse the crater's cavity had a volume of 1.5 x 10⁸ m3 (figure 11b). During this time the gravity dramatically decreased by 1,135 microgals at the summit due to the mass deficiency associated with the crater collapse (dark band just outside the new crater). Gravity increased from ~50-130 microgals along the inner circular path. This increase was due to the loss of the upward-directed attraction associated with the pre-collapse summit morphology. The concentric gravity change suggested cylindrical conduits beneath the summit. If the collapse and drain-back/flow out of magma were to continue, the gravity at the center of the island (high elevations) would decrease and it would increase around the coast (low elevations).
Several events occurred during 11-31 July. The summit crater became deeper, reaching 450 m depth and larger with a crater cavity volume of 3 x 10⁸ m3. Steam explosions occurred on 14 and 15 July. The station SW of the summit (figure 11b) showed a gravity change of +129 microgals; by 31 July this station's differential decreased to -118 microgals. This decrease occurred because the center of gravity of the summit crater descended below the height of the seismic station due to the progressive collapse of the summit crater. Figure 11c portrays the gravity change spread in the form of concentric circles.
During 28 July to 12 August, the crater became even deeper reaching 500 m and larger with a crater cavity volume that was over 3.5 x 10⁸ m3 (figure 11d). Steam explosions occurred on 10, 14, and 15 August. Gravity decreased as much as 680 microgals around the summit because the expanding crater rim was approaching the stations. Gravity increased from 58 to 91 microgals in the E portion of the edifice, which indicated that the crater was extending to the E. As the center of collapse descended, the area of neutral change (white in figure 11d) also descended and approached the coastal area. Despite ongoing crater collapse, the center of mass of the crater remained above the height of the stations along the coast, so an increase in gravity was detected there.
Overall, during the course of the five gravity surveys, gravity steadily increased in the western section of the island. This increase suggested that magma was traveling through a channel from the volcano to the seismic swarm off the W coast of the island. There was also an unexplained gravity increase in the SSE part of the island. The gravity decrease in the island's center was mostly due to the collapse of the summit caldera. The gravity decrease appeared to be less dramatic after late-July because some observation points were destroyed. Gravity variation data for the period after the large phreatic eruption on 18 August were not available.
Measurement of the size of the summit crater using PI-SAR. The Environment Information Technology Section used an airborne high-resolution multiparameter synthetic aperture radar (PI-SAR) to capture images of the volcano and determine the change in the size of the summit crater during 6 July-30 August. The Pi-SAR was developed by the Communications Research Laboratory (CRL) of the Ministry of Posts and Telecommunications of Japan and the National Space Development Agency of Japan (NASDA). It is a dual-frequency radar operating at L-band and X-band frequencies with polarimetric functions. Although not discussed here, the X-band system also has an interferometric function by which topographic mapping of the ground surface is achieved.
The increase in size of the summit crater is evident by comparing three PI-SAR images of Miyake-jima (figure 12). Figure 12a was taken two days before the crater collapse on 8 July and the effects of the latter event appear on figure 12b. Figure 12c shows the effect on the size of the crater after a relatively small phreatic eruption on 10 August sent an ash cloud to an altitude of ~3 km and after a larger phreatic eruption occurred on 18 August sending an ash cloud to an altitude of ~15 km. Analysis of close-up views of the summit crater revealed that the eruptions caused the crater to grow from 1,380 x 1,370 m on 2 August, to 1,550 x 1,620 m on 30 August (figure 13).
 |
Figure 12. Images of Miyake-jima from the airborne high-resolution multiparameter synthetic aperture radar (PI-SAR) taken on (a) 6 July 2000, (b) 2 August 2000, and (c) 30 August 2000. The X band used: VV=Red, HV=Green, HH=Blue. The flight direction was from S to N, and illumination was from W to E. The images represent a 9 x 9.5 km area. Courtesy of the Environment Information Technology Section of CRL. |
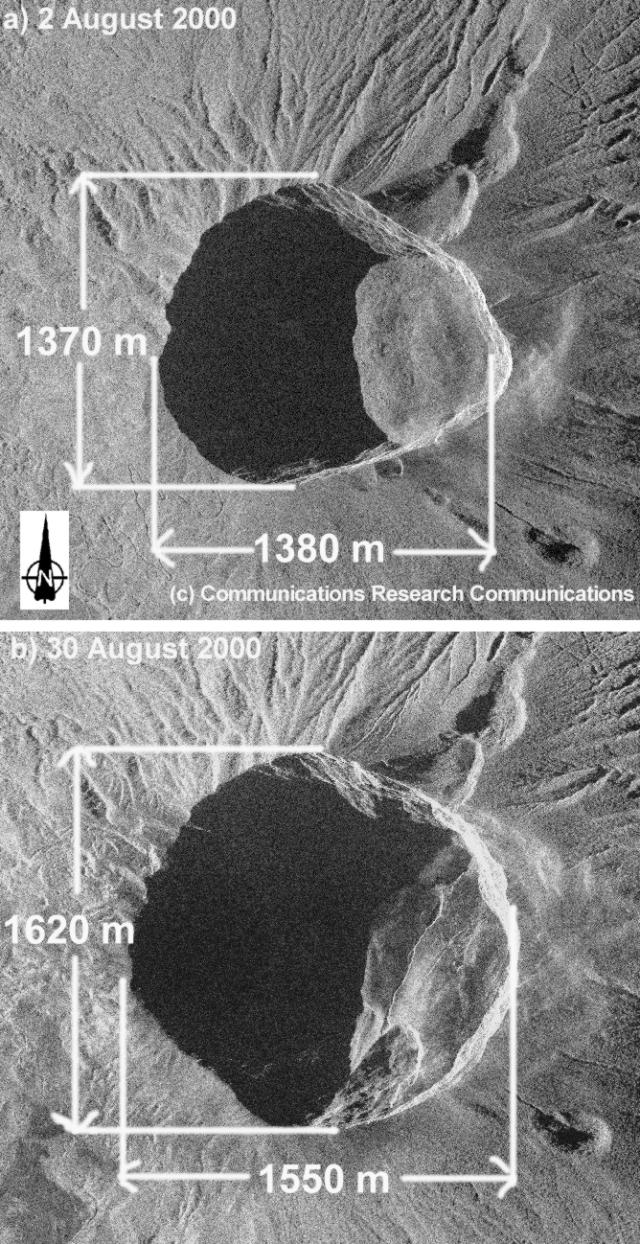 |
Figure 13. Enlarged images of Miyake-jima's summit crater made from airborne high-resolution multiparameter synthetic aperture radar (PI-SAR) taken on a) 2 August, and b) 30 August 2000 (close-up views of figure 12b and c). Courtesy of the Environment Information Technology Section of CRL. |
Activity during mid-August through mid-October 2000. According to the Volcano Research Center (VRC), subsidence of Miyake-jima's summit crater was not clearly observed after mid-August. Partial collapse of the northern cliff of the caldera was seen in late-September. Ash was emitted continuously in early September and intermittently in late September. A large pyroclastic cone with steaming craters was present on the southern cliff of the crater. On 16 October the crater floor was at an elevation of 230 m according to a laser distance-meter survey performed from a helicopter by Earthquake Research Institute (ERI).
The Japan Meteorological Agency, the Geological Survey of Japan, and the Tokyo Institute of Technology reported that in mid-October the SO2 flux from Miyake-jima's summit caldera was at a high level with 30,000-50,000 metric tons/day emitted. Since the SO2 flux was so high, officials decided that no one could stay on the island during the night. In early October public workers and researchers stayed on a ship near the harbor and landed on the island in the daytime. After a short period of time officials decided that it was too dangerous for people to live on the ship so they began to commute by small boats between Miyake-jima and the nearest island, Kozu-shima. Since power company workers were not on the island, electricity was cut, halting volcano data collection from electrically powered instruments on the transmission grid.
Information Contacts: ERI Gravity Group, Shuhei Okubo; Masato Furuya, Sun Wenke, Yoshiyuki Tanaka, Hidefumi Watanabe, Jun Oikawa, and Tokumitsu Maekawa (URL: http://www.eri.u-tokyo.ac.jp/); Environment Information Technology Section, Global Environment Division, Communications Research Laboratory (CRL), Japan (URL: https://www.nict.go.jp/en/); S. Nakada and Hedifumi Watanabe, Volcano Research Center, Earthquake Research Institute, University of Tokyo, Yayoi 1-1-1, Bunkyo-ku, Tokyo 113-0032, Japan (URL: http://www.eri.u-tokyo.ac.jp/VRC/index_E.html); Geological Survey of Japan, 1-1-3 Higashi, Ibaraki, Tsukuba 305, Japan (URL: https://www.gsj.jp/); Japan Meteorological Agency, Volcanological Division, 1-3-4 Ote-machi, Chiyoda-ku, Tokyo 100, Japan (URL: http://www.jma.go.jp/); Tokyo Institute of Technology, 2-12-1 Okayama, Meguro-ku, Tokyo, Japan (URL: http://www.titech.ac.jp/).
Continued high SO2 flux; volcanic tremor and eruption occur in mid-March
Activity since October 2000 (BGVN 25:09) through 12 February 2001 has been characterized by high volumes of volcanic gas emission. Minor ashfall was reported only near the summit crater. The active crater's temperature increased to 400°C during late December 2000; slight incandescence of the crater was observed at night, but disappeared by late January 2001. Ground deformation of Miyake-jima, which began in July 2000, declined, but still continued. Seismicity was low during September 2000-early February 2001, although shallow low-frequency earthquakes occurred in late January.
During October 2000-early February 2001 the plume that rose from Miyake-jima varied in height from several hundred meters to as much as two thousand meters. The SO2 flux maintained high values in the range of ~18,000-45,000 metric tons/day during the period. An abundance of the gas was often observed around the volcano's flanks depending on weather conditions. As of early February 2001, there was no indication of any decrease in the SO2 flux.
On 16 March 2001 the largest volcanic tremor episode since 29 August 2000 was recorded at Miyake-jima. Three days later, on 19 March, an eruption produced a black ash cloud that rose 800 m above the volcano. The island has remained uninhabited since 1 September 2000 when officials ordered an evacuation due to the persistent volcanic activity that began on 26-27 June 2000 (BGVN 25:05).
Information Contacts: Setsuya Nakada and Hidefumi Watanabe, Volcano Research Center, Earthquake Research Institute, University of Tokyo, Yayoi 1-1-1, Bunkyo-ku, Tokyo 113-0032, Japan (URL: http://www.eri.u-tokyo.ac.jp/VRC/index_E.html); Japan Meteorological Agency, Volcanological Division, 1-3-4 Ote-machi, Chiyoda-ku, Tokyo 100, Japan (URL: http://www.jma.go.jp/); Kyodo News Agency (URL: http://home.kyodo.co.jp/).
Eruptive activity decreases; high SO2 flux through April 2002
The following report covers activity at Miyake-jima after February 2001 and through April 2002, but a brief review of previous activity is included. Volcanism renewed at Miyake-jima on 27 June 2000 with a series of underwater eruptions (BGVN 25:05-25:07). Activity through October 2000 was characterized by intrusive events, collapse of the summit crater, explosive events, and degassing. SO2 emissions were high and low levels of ash were intermittently emitted (BGVN 25:09). During October 2000 through mid-February 2001 high volumes of volcanic gas emission continued (BGVN 26:02).
After a large eruption on 18 August 2000, large amounts of volcanic gas, especially SO2, started to discharge. SO2 flux monitoring by COSPEC V has been conducted since 26 August 2000. Monitoring is performed almost daily by the Japanese Meteorological Agency (JMA) and Geological Survey of Japan (GSJ). Figure 14 shows the daily average of SO2 flux during August 2000 through April 2002. The mean flux during September-December 2000 was ~40,000 metric tons per day (t/d). During 2000, the average SO2 flux was 40,000 t/d, and it decreased to 21,000 t/d during 2001. As of March 2002 the average SO2 flux was 10,000-20,000 t/d. During the 26 September 2001 explosion the amount of SO2 degassing was ~15,000 t/d.
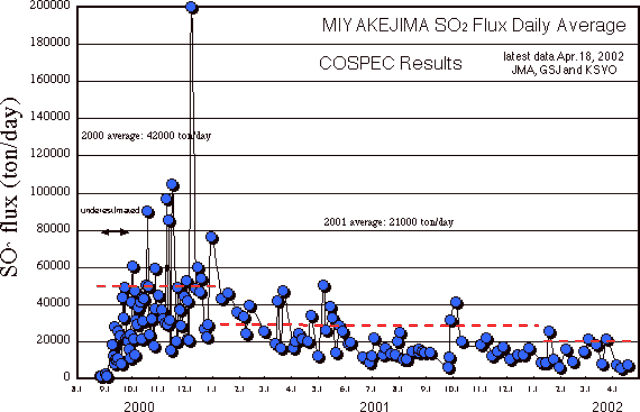 |
Figure 14. Daily averages of SO2 flux at Miyake-jima during August 2000 through April 2002. Courtesy JMA, GSJ, and KSVO. |
In November 2001 the GSJ reported that the strong eruptions of July-August 2000, initially thought to be solely phreatic, had been phreatomagmatic. For instance, tephra from the 18 August 2000 eruption was ~30-40% juvenile in nature. Following the 29 August 2000 eruption, activity was much weaker. A summit pit crater or caldera, formed as a result of "drain back" as magma was intruded elsewhere, stabilized in August 2000 with a diameter of 1.4 km.
On 16 March 2001 the JMA reported that the strongest tremor since 29 August 2000 had occurred. Three days later, on 19 March, an eruption produced a black ash cloud that rose 800 m above the volcano.
In mid-May 2001, based on information from the JMA, the Volcanic Research Center reported that no ash clouds had been observed since 19 March. They also reported that steam plumes with abundant SO2 were continuously emitted from the summit caldera to 0.5-2 km above the caldera rim. Continuous SO2 emission released as much as 33,000 to 46,000 metric tons of SO2 per day (figure 14). Low-level seismic activity continued; on 5 May 2001 a total of 446 small low-frequency earthquakes were registered, and on 7 May an M 2.8 earthquake occurred. Global positioning system (GPS) measurements showed steady, continuous deflation of the volcano, though the rate was lower than before September 2000. Very small collapses of the caldera rims were occasionally seen during air inspections.
About 20 small eruptions were recorded by the JMA during 2001 through the end of March 2002. Major eruptions were reported on 27 May, 26-27 September, and 16 October 2001. The eruptions produced ash plumes up to 1,500 m high.
On 25 January 2002 at 1015 Air Force Weather Agency staff detected a faint E-drifting volcanic plume emanating from Miyake-jima on MODIS imagery (figure 15).
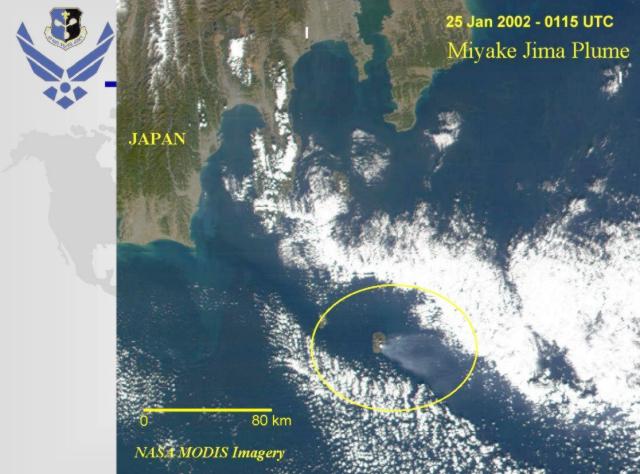 |
Figure 15. MODIS imagery on 25 January 2002 at 1015 shows a plume drifting E from Miyake-jima. Courtesy AFWA and NASA. |
The GSJ reported that as of 1 April 2002, eruptions were continuing and significant quantities of SO2 (10,000-20,000 t/d) discharged from the summit pit crater (figure 14). According to a news report, a minor eruption occurred at Miyake-jima on 2 April shortly after 1000. While evacuated residents were visiting the island, ash rose to ~300 m above the volcano and fell around Miyake-jima. The island is currently uninhabited because activity that began on 26-27 June 2000 prompted officials to order an evacuation on 1 September 2000.
Information Contacts: Japan Meteorological Agency (JMA), Volcanological Division, 1-3-4 Ote-machi, Chiyoda-ku, Tokyo 100, Japan (URL: http://www.jma.go.jp/); Setsuya Nakada and Hidefumi Watanabe, Volcano Research Center, Earthquake Research Institute, University of Tokyo, Yayoi 1-1-1, Bunkyo-ku, Tokyo 113-0032, Japan (URL: http://www.eri.u-tokyo.ac.jp/VRC/index_E.html); Akihiko Tomiya, Geological Survey of Japan (GSJ), National Institute of Advanced Industrial Science and Technology (AIST), Tsukuba Central 7, Tsukuba 305-8567, Japan (URL: http://staff.aist.go.jp/a.tomiya/miyakeE.html); Charles Holliday, Air Force Weather Agency (AFWA),106 Peacekeeper Dr., Ste 2NE; Offutt AFB, NE 68113-4039 USA; National Aeronautics and Space Administration (NASA), Washington, DC 20456-0001, USA (URL: https://www.nasa.gov/); Kusatsu-Shirane Volcano Observatory (KSVO), Tokyo Institute of Technology, Kusatsu, Agatsuma-gun, Gunma 377-17, Japan; Dow Jones News.
High SO2 fluxes, minor ash eruptions continue through November 2002
Volcanic activity that began at Miyake-jima during June and July 2000 was still ongoing as of November 2002. The current activity included a large amount of discharging volcanic gas. SO2 flux remained high (about 5,000-10,000 tons/day) as of October 2002. All residents of Miyake-jima island have been evacuated since September 2000.
During the 2000 activity, for several weeks the crater expanded in both depth and diameter (BGVN 25:09) and by September 2000 its diameter reached ~1.6 km. As of November 2002, the crater diameter remained at ~1.6 km. Several phreatomagmatic eruptions had occurred during July and August 2000 (e.g., July 14-15; August 10, 13, 18, and 29). The largest eruption occurred on 18 August 2000 (BGVN 25:09). It produced an eruption column to a height of ~15 km. Large amounts of ash and bombs ejected, the latter frequently rich in juvenile material and in a cauliflower shape (figure 16). About 30-40% of the ash consisted of juvenile fragments containing many micro-bubbles and microlites (figure 16).
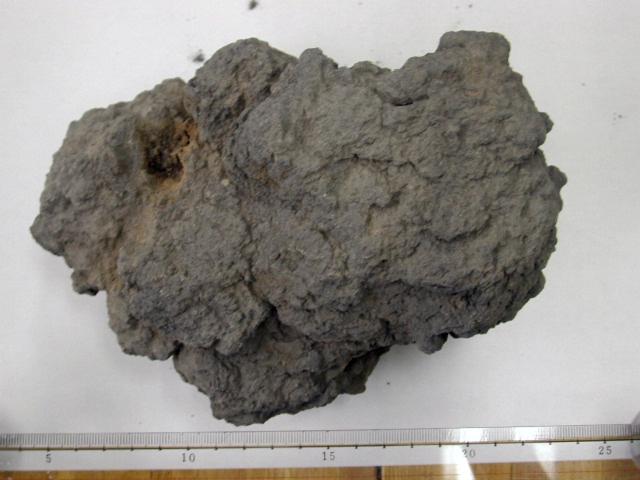 |
Figure 16. Cauliflower-shaped bomb from the 18 August 2000 eruption of Miyake-jima. Courtesy GSJ. |
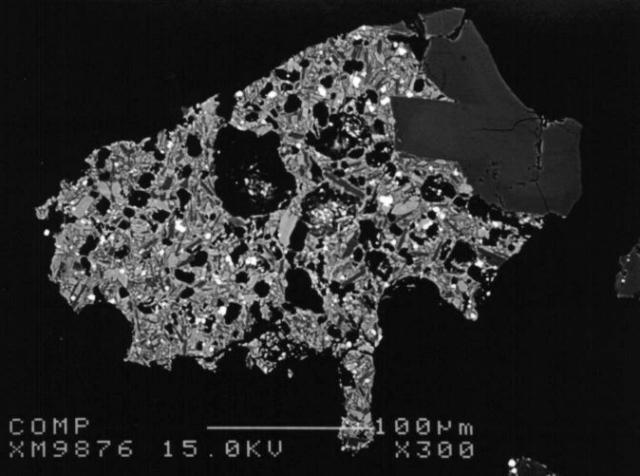 |
Figure 17. A polished section of 18 August 2000 ash showing a 100 µm scale bar. The specimen is riddled with microlites and sub-circular micro-bubbles. Courtesy GSJ. |
During the 29 August 2000 eruption (BGVN 25:07), a low-temperature pyroclastic flow occurred. The flow was weak, however, it reached the sea and sent an ash cloud to 8.0 km. Following the largest eruption on 18 August 2000, a large amount of volcanic gas, especially SO2, began to discharge. The mean flux during September-December 2000 was ~40,000 tons/day.
Table 2 compiles recent minor eruptions during 2001-2002. A major eruption had not occurred at Miyake-jima since 29 August 2000. However, small explosions with minor ash emission sometimes occurred. As of 15 November 2002, the last such explosion was on 8 October 2002.
Table 2. Occasional small, typically ash-bearing explosions took place at Miyake-jima during January 2001 through 15 November 2002. All of the eruptions since 2001 were small with minor ash emission; however, some plume observations following outbursts were thwarted by weather or other limitations (situations indicated by question marks). In several cases, the ash columns rose to heights of 1 to 1.5 km above the crater rim. Data from JMA and provided courtesy GSJ.
| Date | Time (approximate) | Plume height above rim |
| 11 Jan 2001 | 1040 | 800 m |
| 19 Mar 2001 | 0700-0740 | 800 m |
| 27 May 2001 | 0604 | 1,200 m |
| 03 Jun 2001 | 0634 | 700 m |
| 10 Jun 2001 | 1925 | 500 m |
| 10 Jun 2001 | 0638 and 0823 | 500 m |
| 18 Jul 2001 | 1742 | ?? |
| 26 Sep 2001 | 1132 | 1,000 m |
| 27 Sep 2001 | 2128 | 1,000 m |
| 27 Sep 2001 | 2304 | 800 m |
| 28 Sep 2001 | 0528 | 800 m |
| 11 Oct 2001 | 0445 and 0900 | ?? |
| 16 Oct 2001 | 0722 | 1,500 m |
| 01 Nov 2001 | 1232 | 800 m |
| 23 Jan 2002 | 1234 | 200 m |
| 21 Feb 2002 | 1737 | 300 m |
| 02 Mar 2002 | 0553 and 0612 | ?? |
| 31 Mar 2002 | 0604 | 200 m |
| 02 Apr 2002 | 1002 | 300 m |
| 16 Apr 2002 | 0600 | ?? |
| 15 Jun 2002 | 1619 | 500 m |
| 01 Aug 2002 | 1742 | ?? |
| 16 Sep 2002 | 0510 | ?? |
| 08 Oct 2002 | 1451 | 200 m |
Satellite imagery on 5-6 August showed a plume from Miyake-jima drifting ~185 km (100 nautical miles; figure 18). A wind profile taken at a nearby Hachijo-jima island was used to infer that the plume was below ~1,500 m.
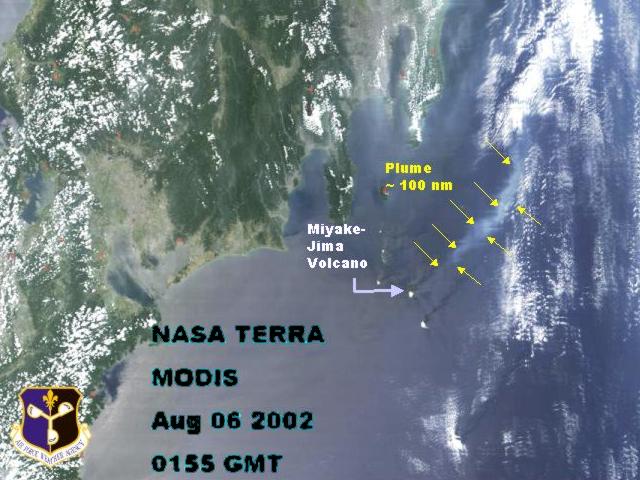 |
Figure 18. Satellite imagery on 6 August 2002 showed a plume drifting to the ENE from Miyake-jima. Courtesy Charles Holliday, U.S. AFWA. |
Information Contacts: Akihiko Tomiya, Geological Survey of Japan (GSJ), National Institute of Advanced Industrial Science and Technology (AIST), Tsukuba Central 7, Tsukuba 305-8567, Japan (URL: http://staff.aist.go.jp/a.tomiya/miyakeE.html); Japan Meteorological Agency (JMA), Volcanological Division, 1-3-4 Ote-machi, Chiyoda-ku, Tokyo 100, Japan (URL: http://www.jma.go.jp/); Charles Holliday, U.S. Air Force Weather Agency (AFWA),106 Peacekeeper Dr., Ste 2NE; Offutt AFB, NE 68113-4039 USA.
Small explosion in November 2002; continued high SO2 flux through April 2003
Miyake-jima has remained restless since the eruption that began in June 2000 (BGVN 25:05-25:07, 25:09, 26:02, 27:03, and 27:11). Small explosions with minor ash emission have been common (see BGVN 27:11). The most recent event reported by the Japan Meteorological Agency was at about 1320 on 24 November 2002, with the plume rising to an unknown height. The SO2 gas output remained high, ~4,000-9,000 tons/day, as of March 2003 (figure 19). Robust degassing was ongoing through the week of 16-22 April 2003. All residents on Miyake-jima island have been evacuated since September 2000, after which time SO2 fluxes reached extremely high values (over 80,000 tons/day in October 2000).
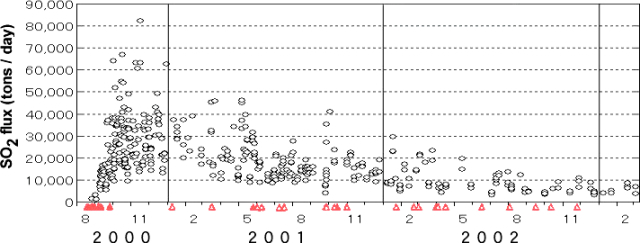 |
Figure 19. SO2 flux at Miyake-jima during August 2000-March 2003. Triangles along the timeline indicate explosions. Courtesy of the Geological Survey of Japan and the Japan Meteorological Agency. |
Information Contacts: Akihiko Tomiya, Geological Survey of Japan, AIST, 1-1 Higashi, 1-Chome Tsukuba, Ibaraki 305-8567, Japan (URL: http://staff.aist.go.jp/a.tomiya/tomiyae.html); Japan Meteorological Agency (JMA), Fukuoka, Japan (URL: http://www.jma.go.jp/).
Continued seismicity and regular gas-and-steam plumes
Volcanic activity at Miyake-jima since the eruption during the summer of 2000 (BGVN 25:07) has continued at lower levels through August 2003. The flux of SO2 gas remained high (~ 4, 000-9, 000 tons/day), and has been nearly constant since October 2002 (figure 20). A compilation of seismic data and plume observations through April 2003 (table 3) documents this continuing activity. Plume heights following the June-September 2000 activity have not been greater than 2.2 km above the summit (table 3), and their color has been described as white or grayish white.
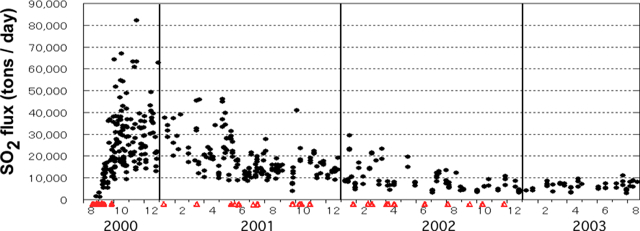 |
Figure 20. SO2 flux at Miyake-jima during August 2000-August 2003. Triangles along the timeline indicate explosions. Courtesy of the Geological Survey of Japan and the Japan Meteorological Agency. |
Table 3. Summary of seismicity and plume observations at Miyake-jima, January 2000-April 2003. All reported plumes originated from the summit crater, and were described as either white (W), light white (LW), grayish white (GW), or gray (G). No months during this time had more than six plumes observed on any single day. Data courtesy of JMA.
| Month | Volcanic earthquakes | Max. Plume Height (km) (date) | Plume Color (date) |
| Jan 2000 | 2 | -- | -- |
| Feb 2000 | 4 | -- | -- |
| Mar 2000 | 1 | -- | -- |
| Apr 2000 | No JMA report received this month | ||
| May 2000 | 3 | -- | -- |
| Jun 2000 | > 13,840 | -- | -- |
| Jul 2000 | > 24,494 | 1.5 (8, 14) | W (8) colored (14, 15) |
| Aug 2000 | > 10,175 | 14 (18) | Mix of white and colored almost daily all after 10th |
| Sep 2000 | 146 | 3.5 (26) frequently above 1 | W (almost daily), C (3, 24, 27) |
| Oct 2000 | 16 | 2.7 (10) | W |
| Nov 2000 | 5 | 2.5 (26) | W |
| Dec 2000 | 6 | 2.0 (22, 27) | W |
| Jan 2001 | 214 | 1.8 (22, 31) | W, GW (11) |
| Feb 2001 | 260 | 2.0 (17) | W |
| Mar 2001 | 299 | 2.0 (2, 16, 24) | W, GW (19) |
| Apr 2001 | 191 | 2.0 (4) | W |
| May 2001 | 707 | 2.2 (6) | W, G (27) |
| Jun 2001 | 192 | 2.2 (10) | W, G (3, 10) |
| Jul 2001 | 249 | 1.6 (16, 21) | W, G (10) |
| Aug 2001 | 306 | 2.0 (24, 25, 27, 28) | W |
| Sep 2001 | 234 | 3.0 (16) | W |
| Oct 2001 | 116 | 1.5 (16, 21, 22, 24, 29, 31) | W, GW |
| Nov 2001 | 124 | 2.0 (20) | W, GW (1) |
| Dec 2001 | 123 | 1.7 (29) | W |
| Jan 2002 | 41 | 2.0 (6) | W, GW |
| Feb 2002 | 88 | 1.7 (14) | W, GW |
| Mar 2002 | 71 | 1.2 (16, 28) | W, GW (31) |
| Apr 2002 | 104 | 1.0 (10) | W, GW (2, 3) |
| May 2002 | 265 | 1.5 (29) | W |
| Jun 2002 | 176 | 0.8 (9) | W, GW (15) |
| Jul 2002 | 78 | 0.8 (27) | W |
| Aug 2002 | 45 | 1.0 (3) | W |
| Sep 2002 | 57 | 1.5 (4) | W |
| Oct 2002 | 47 | 1.0 (6, 30) | W, GW (8) |
| Nov 2002 | 55 | 1.0 (6, 29) | W |
| Dec 2002 | 66 | 0.8 (28) | W |
| Jan 2003 | 202 | 1.0 (25) | W |
| Feb 2003 | 313 | 0.8 (13) | W |
| Mar 2003 | 212 | 1.2 (28) | W |
| Apr 2003 | 450 | 1.0 (28) | W |
The number of monthly earthquakes was very low (1-4/month) until late June through early September 2000. Except for 5 May 2001 when 447 volcanic earthquakes occurred, daily totals have been less than 50. Monthly earthquake totals since August 2000 have been less than 300, except for May 2001 (707) and April 2003 (450). Volcanic tremor also began in July 2000 and became continuous in September 2000. Tremor through April 2003 totaled less than 500 events per month, except for May 2001, when 1, 362 events were recorded (444 on the 22nd). The unusually high seismicity noted in May 2001 corresponded to a period of continuous steam plumes with abundant SO2 content (BGVN 27:03), after which SO2 flux declined (figure 2).
Seismicity at Miyake-jima is recorded by three seismographs maintained by the Japan Meterological Agency (JMA): station "A" is ~ 1.9 km NNE of the summit at 530 m elevation, station "AKOC" is ~ 4.6 km W at 42 m elevation, and station "RST" is ~ 1.9 km SSE at 463 m elevation.
Information Contacts: Japan Meteorological Agency (JMA), Volcanological Division, 1-3-4 Ote-machi, Chiyoda-ku, Tokyo 100, Japan (URL: http://www.jma.go.jp/); Akihiko Tomiya, Geological Survey of Japan, AIST, 1-1 Higashi, 1-Chome Tsukuba, Ibaraki 305-8567, Japan (URL: https://staff.aist.go.jp/a.tomiya/tomiyae.html).
SO2 flux continues gradual decline; minor eruptions in November-December 2004
Seismicity and regular gas-and-steam plumes related to the eruption during the summer of 2000 continued through August 2003 (BGVN 28:10). From August 2003 through August 2005 gas emissions continued; SO2 flux remained relatively high and nearly constant (4,000-9,000 tons per day) since October 2002 (figure 21). Eruptions were absent in 2003. Seismicity increased again in May 2003 to more than 700 events/month (table 4), compared to less than 450 the previous four months, a level higher than any recorded since August 2000 (BGVN 28:10).
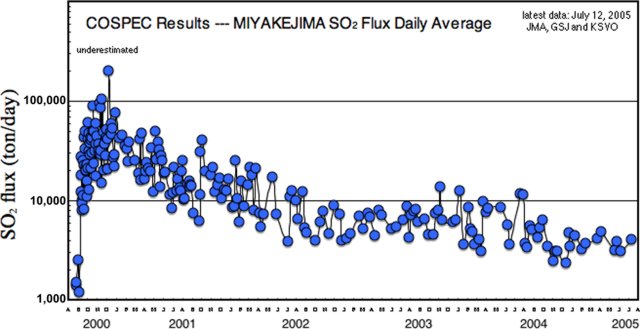 |
Figure 21. Daily average SO2 flux from Miyake-jima between August 2000 and July 2005. Courtesy of Kazahaya Kohei, Geological Survey of Japan. |
Table 4. Summary of seismicity and plume observations at Miyake-jima, May 2003-January 2005. All reported plumes originated from the summit crater, and were described as white (W) or gray (G). Data courtesy of JMA.
| Month | Volcanic earthquakes | Max. Plume Height (km) (date) | Plume Color (number of days, date) |
| May 2003 | 713 | 1.0 (3, 22) | W (22 days) |
| Jun 2003 | 811 | 0.9 (5) | W (17 days) |
| Jul 2003 | 762 | 0.8 (3) | W (13 days) |
| Aug 2003 | 562 | 1.0 (30) | W (7 days) |
| Sep 2003 | 551 | 0.9 (15) | W (17 days) |
| Oct 2003 | 649 | 1.0 (16, 27) | W (17 days) |
| Nov 2003 | 971 | 1.0 (14) | W (18 days) |
| Dec 2003 | 1,449 | 1.2 (4) | W (28 days) |
| Jan 2004 | 1,353 | 1.2 (28) | W (27 days) |
| Feb 2004 | 516 | 1.0 (16) | W (26 days) |
| Mar 2004 | 3,810 (590 on 7th) | 1.0 (3) | W (25 days) |
| Apr 2004 | 317 | 1.0 (16) | W (24 days) |
| May 2004 | 1,014 | 0.6 (21, 28) | W (13 days) |
| Jun 2004 | 1,134 (tremor amp. increased to 4 µm/s) | 0.8 (30) | W (13 days) |
| Jul 2004 | 1,025 | 1.0 (26) | W (16 days) |
| Aug 2004 | 643 | 1.2 (9) | W (11 days) |
| Sep 2004 | 468 | 1.0 (13) | W (14 days) |
| Oct 2004 | 776 | 1.0 (31) | W (21 days) |
| Nov 2004 | 1,015 | 1.0 (29) | W (25 days), G (1 day, 30th) |
| Dec 2004 | 1,634 | 1.5 (25) | W (28 days), G (1 day, 2nd) |
| Jan 2005 | 416 (tremor amp. drops below 1 µm/s) | 1.0 (14, 22) | W (28 days) |
The number of monthly events remained above 500 through February 2004, with counts of 1,449 in December 2003 and 1,353 in January 2004. Seismicity increased significantly during 5-15 March 2004, with more than 400 daily events recorded during 6-10 March (a high of 590 events on the 7th), before gradually declining, but resulting in a monthly total of 3,810. No unusual activity or eruptions accompanied the elevated seismicity. Although seismicity dropped in April 2004, more than 1,000 monthly seismic events were recorded during May-July 2004.
Seismicity was high again in November (1,015 events) and December (1,634 events) 2004, but the December seismicity was primarily due to over 700 events during 2-3 December. The amplitude of the continuous tremor also increased from below 1 ?m/s to around 4 ?m/s in June 2004. Amplitudes remained elevated, though variable, through December 2004.
On 30 November 2004 a minor ash eruption occurred after a 2-year lull. A minor eruption is defined as a small explosion with minor ash emission and plume height of less than 1 km. The Japanese Meteorological Agency (JMA) noted another gray plume on 2 December, and the Geological Survey of Japan (GSJ) listed minor eruptions on 2, 7-8, and 9 December 2004.
As of April 2005, the SO2 flux was about 2,000-5,000 tons/day. The danger of destructive eruptions was considered to be small, and some residents of the island (~ 3,800 people), who had been evacuated since September 2000 were returning home as of May 2005. However, the GSJ noted minor eruptions again on 12 April and 18 May 2005.
Information Contacts: Japan Meteorological Agency (JMA), Volcanological Division, 1-3-4 Ote-machi, Chiyoda-ku, Tokyo 100, Japan (URL: http://www.jma.go.jp/); A. Tomiya, Geological Survey of Japan (AIST), 1-1 Higashi, 1-Chome Tsukuba, Ibaraki 305-856, Japan (URL: https://staff.aist.go.jp/a.tomiya/miyakeE.html); Kazahaya Kohei, Geological Survey of Japan (URL: https://staff.aist.go.jp/kazahaya-k/miyakegas/COSPEC.html); Earthquake Research Institute (ERI), University of Tokyo,Yayoi 1-1-1, Bunkyo-ku, Tokyo, 113-0032, Japan.
Ash emissions in February 2006; declining SO2 flux
According to a news report, there was a minor eruption at Miyake-jima on 17 February 2006 that consisted of small ash emissions. Residents of the island were warned that there could be gas emissions and mudslides. The Geological Survey of Japan (AIST) website reported that the SO2 flux at Miyake-jima averaged about 2,000-5,000 tons per day in January 2006 (figure 22). The previous activity took place in November-December 2004, ending on 9 December 2004 when minor eruptions were reported after a two-year lull. As of mid-April 2006 no further activity had been reported.
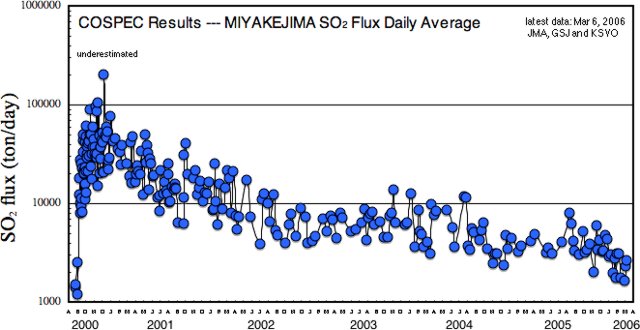 |
Figure 22. Sulfur dioxide (SO2) flux monitoring of Miyake-jima by COSPEC V was conducted from 26 August 2000, peaking in early 2000 at values well over 100,000 metric tons per day and dropping off slowly after that. Daily monitoring was performed by the Japanese Meteorological Agency and Geological Survey of Japan. |
Information Contacts: Japan Meteorological Agency (JMA), Volcanological Division, 1-3-4 Ote-machi, Chiyoda-ku, Tokyo 100, Japan (URL: http://www.jma.go.jp/); A. Tomiya, Geological Survey of Japan (AIST), 1-1 Higashi, 1-Chome Tsukuba, Ibaraki 305-856, Japan (URL: https://staff.aist.go.jp/a.tomiya/miyakeE.html); Kazahaya Kohei, Geological Survey of Japan (URL: https://staff.aist.go.jp/kazahaya-k/miyakegas/COSPEC.html); Earthquake Research Institute (ERI), University of Tokyo, Yayoi 1-1-1, Bunkyo-ku, Tokyo, 113-0032, Japan.
Four minor eruptions between August 2006 and April 2009
Miyake-jima has had a recent history of periodic minor eruptions and gas emissions containing relatively high concentrations of sulfur dioxide (SO2). SO2 emissions in January 2006 averaged about 2,000-5,000 tons per day, and there was a minor eruption on 17 February 2006 (BGVN 31:03).
The Tokyo Volcanic Ash Advisory Center (VAAC) described an eruption on 23 August 2006 that generated plumes which rose to an altitude of about 1.5 km and drifted SE. Ash was not identified on satellite imagery. No additional eruption reports were received until January 2008. Based on information from the Japan Meteorological Agency (JMA), the Tokyo VAAC reported that an eruption plume on 7 January rose to an altitude of 1.2 km and drifted SE. The JMA also reported an eruption on 8 May 2008. Another eruption reported by JMA produced an ash plume that rose 600 m above the crater and drifted E on 1 April 2009.
Information Contacts: Tokyo Volcanic Ash Advisory Center (VAAC), Tokyo, Japan (URL: http://ds.data.jma.go.jp/svd/vaac/data/); Japan Meteorological Agency (JMA), Otemachi, 1-3-4, Chiyoda-ku Tokyo 100-8122, Japan (URL: http://www.jma.go.jp/).
Minor plumes and low seismicity during April 2010-June 2012
During April 2010-June 2012 the Japan Meteorological Agency (JMA) maintained the hazard status for Miyake-jima at Alert Level 2, where it had stood since 31 March 2008. Our last report (BGVN 34:06) mentioned a minor eruption at Miyake-jima on 1 April 2009 which produced an ash plume that rose ~600 m above the crater. Since that time, activity was relatively low with up to four minor eruptions occurring during April-July 2010, as reported by the Tokyo Volcanic Ash Advisory Center (VAAC) based on information from JMA.
Eruptions occurred on 11 April, 4 July (two possible eruptions during the early morning), and 21 July 2010; the 21 July eruption was the only eruption for which the Tokyo VAAC issued an altitude and drift direction for the plume (~1.2 km altitude with E drift; table 5). The eruptions were characterized by gas and steam emissions lacking significant ash content (e.g. figure 23).
Table 5. Summary of detailed activity reports for Miyakejima during April 2010-June 2012; '--' indicates data not reported. Courtesy of JMA and Tokyo VAAC.
| Month | Gas-and-steam plume heights (m above crater rim) | SO2 flux (metric tons/day) | Remarks |
| Apr 2010 | -- | -- | 11 Apr: Based on information from JMA, Tokyo VAAC reported an eruption at 0840. |
| Jul 2010 | -- | -- | 4 Jul: Based on information from JMA, Tokyo VAAC reported possible eruptions at 1019 and 1434. |
| Jul 2010 | 400 | -- | 21 Jul: Based on information from JMA, Tokyo VAAC reported an eruption at 0928 that produced a plume which rose to an altitude of ~1.2 km (400 m above the crater) and drifted E. |
| Oct 2010 | 100-400 | 500-1,600 | -- |
| Nov 2010 | 100-400 | 500-1,600 | Short duration tremor on 11 and 25 November not accompanied by air-shocks or plume changes. |
| Dec 2010 | 100-400 | 500-900 | -- |
| Jan 2011 | 100-600 | 800-1,000 | -- |
| Feb 2011 | 100-400 | 1,000 | -- |
| Mar 2011 | 100-500 | 600-1,100 | GPS showed continuous deflation from a shallow source. |
| Apr 2011 | 100-500 | 700 | -- |
| May 2011 | 100-400 | 600-900 | -- |
| Jun 2011 | 100-300 | 600 | Low seismicity except for 6 June. Hypocenters located just beneath summit crater. No tremor observed. |
| Jul 2011 | 200-400 | 500 | Low seismicity centered just beneath summit crater. No tremor observed. |
| Aug 2011 | 200-500 | 800-1,000 | Low seismicity with small amplitude, short-duration tremor (~80-90 sec); two increases observed on 18 and 27 Aug. Hypocenters located just beneath summit crater. |
| Sep 2011 | 100-600 | 900 | Low seismicity centered just beneath summit crater. Banded tremor every 20 min. began 23 Sep and continued with smaller amplitudes into Oct. |
| Oct 2011 | 100-400 | 700-900 | Low seismicity centered just beneath summit crater. Continuing banded tremor from Sep ceased on 28 Oct. |
| Nov 2011 | 100-300 | 500-800 | Low seismicity centered just beneath summit crater. Volcanic tremor with small amplitude and short duration (~60 sec) occurred on 12 Nov at 0252; however, no infrasonic signal or ashfall was observed. |
| Dec 2011 | 100-300 | 1,100 | Low seismicity centered just beneath summit crater. No tremor was observed. |
| Jan 2012 | 100-400 | 900-1,200 | Low seismicity centered just beneath summit crater. Five episodes of volcanic tremor with small amplitude and short duration (~40-100 sec) occurred on 18, 22 and 30 Jan. |
| Feb 2012 | 100-400 | 900 | Low seismicity centered just beneath summit crater. |
| Mar 2012 | 100-300 | 600-900 | Aerial observations on 7 Mar revealed high temperature areas located on summit crater's S wall as previously seen in Jan 2010. Low seismicity centered just beneath summit crater; no tremor observed. |
| Apr 2012 | 100-300 | 500-700 | Low seismicity centered just beneath summit crater; no tremor observed. |
| May 2012 | 100-300 | 400 | Low seismicity centered just beneath summit crater; no tremor observed. |
| Jun 2012 | 100-200 | -- | A relatively large A-type earthquake with its hypocenter located around the crater occurred at 0940 on 28 Jun. A seismic intensity of 1 was detected at Miyakejima-Kamitsuki. No tremor observed. |
|
Figure 23. A S-looking photograph of Miyake-jima's crater taken from a flight on 17 March 2011 showing an apparent small gas-and-steam emission. Miyake Jima Airport is located along the coast, just out of view to the E. Courtesy of Flickr user R. Forrest. |
JMA reported low levels of seismicity centered just beneath the crater during the reporting interval. Occasional episodes of volcanic tremor occurred, but were not correlated with other data indicating emissions or eruptions (table 5). Sources in Miyakemura village reported that high SO2 concentrations were occasionally detected in some inhabited flank areas.
GPS data revealed contraction in some parts of the edifice, a process that, although diminishing, had continued since 2000. Over the same time period, long-term extension of the baseline along the N-S section of Miyake-jima had been observed since 2006, indicating inflation in deeper portions of the volcano.
Information Contacts: Japan Meteorological Agency (JMA), Otemachi, 1-3-4, Chiyoda-ku Tokyo 100-8122, Japan (URL: http://www.jma.go.jp/); Tokyo Volcanic Ash Advisory Center (VAAC), Tokyo, Japan (URL: http://ds.data.jma.go.jp/svd/vaac/data/).
|
|
||||||||||||||||||||||||||
There is data available for 39 confirmed eruptive periods.
2010 Apr 10 - 2010 Jul 21 Confirmed Eruption (Explosive / Effusive) VEI: 1
| Episode 1 | Eruption (Explosive / Effusive) | Summit crater | |||||||||||||||||||||||||||||||||||||||||||||||||||||||||||||||||||||||||||||||||||
|---|---|---|---|---|---|---|---|---|---|---|---|---|---|---|---|---|---|---|---|---|---|---|---|---|---|---|---|---|---|---|---|---|---|---|---|---|---|---|---|---|---|---|---|---|---|---|---|---|---|---|---|---|---|---|---|---|---|---|---|---|---|---|---|---|---|---|---|---|---|---|---|---|---|---|---|---|---|---|---|---|---|---|---|---|
| 2010 Apr 10 - 2010 Jul 21 | Evidence from Observations: Reported | |||||||||||||||||||||||||||||||||||||||||||||||||||||||||||||||||||||||||||||||||||
|
List of 15 Events for Episode 1 at Summit crater
|
||||||||||||||||||||||||||||||||||||||||||||||||||||||||||||||||||||||||||||||||||||
2009 Apr 1 - 2009 Apr 1 Confirmed Eruption (Explosive / Effusive) VEI: 1
| Episode 1 | Eruption (Explosive / Effusive) | ||||||||||||||||||||||||
|---|---|---|---|---|---|---|---|---|---|---|---|---|---|---|---|---|---|---|---|---|---|---|---|---|
| 2009 Apr 1 - 2009 Apr 1 | Evidence from Observations: Reported | |||||||||||||||||||||||
|
List of 3 Events for Episode 1
|
||||||||||||||||||||||||
2008 May 8 - 2008 May 8 Confirmed Eruption (Explosive / Effusive) VEI: 1
| Episode 1 | Eruption (Explosive / Effusive) | |||||||||||||||||||
|---|---|---|---|---|---|---|---|---|---|---|---|---|---|---|---|---|---|---|---|
| 2008 May 8 - 2008 May 8 | Evidence from Observations: Reported | ||||||||||||||||||
|
List of 2 Events for Episode 1
|
|||||||||||||||||||
2008 Jan 7 - 2008 Jan 7 Confirmed Eruption (Explosive / Effusive) VEI: 1
| Episode 1 | Eruption (Explosive / Effusive) | ||||||||||||||||||||||||
|---|---|---|---|---|---|---|---|---|---|---|---|---|---|---|---|---|---|---|---|---|---|---|---|---|
| 2008 Jan 7 - 2008 Jan 7 | Evidence from Observations: Reported | |||||||||||||||||||||||
|
List of 3 Events for Episode 1
|
||||||||||||||||||||||||
2006 Aug 23 - 2006 Aug 23 Confirmed Eruption (Explosive / Effusive) VEI: 1
| Episode 1 | Eruption (Explosive / Effusive) | ||||||||||||||||||||||||
|---|---|---|---|---|---|---|---|---|---|---|---|---|---|---|---|---|---|---|---|---|---|---|---|---|
| 2006 Aug 23 - 2006 Aug 23 | Evidence from Observations: Reported | |||||||||||||||||||||||
|
List of 3 Events for Episode 1
|
||||||||||||||||||||||||
2006 Feb 17 - 2006 Feb 17 Confirmed Eruption (Explosive / Effusive) VEI: 1
| Episode 1 | Eruption (Explosive / Effusive) | ||||||||||||||||||||||||
|---|---|---|---|---|---|---|---|---|---|---|---|---|---|---|---|---|---|---|---|---|---|---|---|---|
| 2006 Feb 17 - 2006 Feb 17 | Evidence from Observations: Reported | |||||||||||||||||||||||
|
List of 3 Events for Episode 1
|
||||||||||||||||||||||||
2005 Apr 12 - 2005 May 18 Confirmed Eruption (Explosive / Effusive) VEI: 1
| Episode 1 | Eruption (Explosive / Effusive) | ||||||||||||||||||||||||
|---|---|---|---|---|---|---|---|---|---|---|---|---|---|---|---|---|---|---|---|---|---|---|---|---|
| 2005 Apr 12 - 2005 May 18 | Evidence from Observations: Reported | |||||||||||||||||||||||
|
List of 3 Events for Episode 1
|
||||||||||||||||||||||||
2004 Nov 30 - 2004 Dec 9 Confirmed Eruption (Explosive / Effusive) VEI: 1
| Episode 1 | Eruption (Explosive / Effusive) | ||||||||||||||||||||||||
|---|---|---|---|---|---|---|---|---|---|---|---|---|---|---|---|---|---|---|---|---|---|---|---|---|
| 2004 Nov 30 - 2004 Dec 9 | Evidence from Observations: Reported | |||||||||||||||||||||||
|
List of 3 Events for Episode 1
|
||||||||||||||||||||||||
2001 Jan 11 - 2002 Nov 24 Confirmed Eruption (Explosive / Effusive) VEI: 2
| Episode 1 | Eruption (Explosive / Effusive) | |||||||||||||||||||||||||||||||||||||||
|---|---|---|---|---|---|---|---|---|---|---|---|---|---|---|---|---|---|---|---|---|---|---|---|---|---|---|---|---|---|---|---|---|---|---|---|---|---|---|---|
| 2001 Jan 11 - 2002 Nov 24 | Evidence from Observations: Reported | ||||||||||||||||||||||||||||||||||||||
|
List of 6 Events for Episode 1
|
|||||||||||||||||||||||||||||||||||||||
2000 Jun 27 - 2000 Sep 28 Confirmed Eruption (Explosive / Effusive) VEI: 3
| Episode 1 | Eruption (Explosive / Effusive) | Summit and submarine western flank | |||||||||||||||||||||||||||||||||||||||||||||||||||||||||||||||||||||||||||||||||||||||||||||||||||||||
|---|---|---|---|---|---|---|---|---|---|---|---|---|---|---|---|---|---|---|---|---|---|---|---|---|---|---|---|---|---|---|---|---|---|---|---|---|---|---|---|---|---|---|---|---|---|---|---|---|---|---|---|---|---|---|---|---|---|---|---|---|---|---|---|---|---|---|---|---|---|---|---|---|---|---|---|---|---|---|---|---|---|---|---|---|---|---|---|---|---|---|---|---|---|---|---|---|---|---|---|---|---|---|---|---|
| 2000 Jun 27 - 2000 Sep 28 | Evidence from Observations: Reported | |||||||||||||||||||||||||||||||||||||||||||||||||||||||||||||||||||||||||||||||||||||||||||||||||||||||
|
List of 19 Events for Episode 1 at Summit and submarine western flank
|
||||||||||||||||||||||||||||||||||||||||||||||||||||||||||||||||||||||||||||||||||||||||||||||||||||||||
1983 Oct 3 - 1983 Oct 4 Confirmed Eruption (Explosive / Effusive) VEI: 3
| Episode 1 | Eruption (Explosive / Effusive) | SW flank (4.5 km long NE-SW fissure) | |||||||||||||||||||||||||||||||||||||||||||||||||||||||||||||||||||||||||||||||||||||||||||||||||||||||
|---|---|---|---|---|---|---|---|---|---|---|---|---|---|---|---|---|---|---|---|---|---|---|---|---|---|---|---|---|---|---|---|---|---|---|---|---|---|---|---|---|---|---|---|---|---|---|---|---|---|---|---|---|---|---|---|---|---|---|---|---|---|---|---|---|---|---|---|---|---|---|---|---|---|---|---|---|---|---|---|---|---|---|---|---|---|---|---|---|---|---|---|---|---|---|---|---|---|---|---|---|---|---|---|---|
| 1983 Oct 3 - 1983 Oct 4 | Evidence from Observations: Reported | |||||||||||||||||||||||||||||||||||||||||||||||||||||||||||||||||||||||||||||||||||||||||||||||||||||||
|
List of 19 Events for Episode 1 at SW flank (4.5 km long NE-SW fissure)
|
||||||||||||||||||||||||||||||||||||||||||||||||||||||||||||||||||||||||||||||||||||||||||||||||||||||||
1962 Aug 24 - 1962 Aug 27 Confirmed Eruption (Explosive / Effusive) VEI: 2
| Episode 1 | Eruption (Explosive / Effusive) | NE flank | |||||||||||||||||||||||||||||||||||||||||||||||||||||||||||||||||||||||||
|---|---|---|---|---|---|---|---|---|---|---|---|---|---|---|---|---|---|---|---|---|---|---|---|---|---|---|---|---|---|---|---|---|---|---|---|---|---|---|---|---|---|---|---|---|---|---|---|---|---|---|---|---|---|---|---|---|---|---|---|---|---|---|---|---|---|---|---|---|---|---|---|---|---|---|
| 1962 Aug 24 - 1962 Aug 27 | Evidence from Observations: Reported | |||||||||||||||||||||||||||||||||||||||||||||||||||||||||||||||||||||||||
|
List of 13 Events for Episode 1 at NE flank
|
||||||||||||||||||||||||||||||||||||||||||||||||||||||||||||||||||||||||||
1940 Jul 12 - 1940 Aug 5 Confirmed Eruption (Explosive / Effusive) VEI: 3
| Episode 1 | Eruption (Explosive / Effusive) | Oyama, NE flank | |||||||||||||||||||||||||||||||||||||||||||||||||||||||||||||||||||||||||||||||||||
|---|---|---|---|---|---|---|---|---|---|---|---|---|---|---|---|---|---|---|---|---|---|---|---|---|---|---|---|---|---|---|---|---|---|---|---|---|---|---|---|---|---|---|---|---|---|---|---|---|---|---|---|---|---|---|---|---|---|---|---|---|---|---|---|---|---|---|---|---|---|---|---|---|---|---|---|---|---|---|---|---|---|---|---|---|
| 1940 Jul 12 - 1940 Aug 5 | Evidence from Observations: Reported | |||||||||||||||||||||||||||||||||||||||||||||||||||||||||||||||||||||||||||||||||||
|
List of 15 Events for Episode 1 at Oyama, NE flank
|
||||||||||||||||||||||||||||||||||||||||||||||||||||||||||||||||||||||||||||||||||||
1874 Jul 3 - 1874 Jul 17 (?) Confirmed Eruption (Explosive / Effusive) VEI: 3
| Episode 1 | Eruption (Explosive / Effusive) | NNE flank (560 m) | ||||||||||||||||||||||||||||||||||||||||||||||||||||||||||||||||||||||||||||||
|---|---|---|---|---|---|---|---|---|---|---|---|---|---|---|---|---|---|---|---|---|---|---|---|---|---|---|---|---|---|---|---|---|---|---|---|---|---|---|---|---|---|---|---|---|---|---|---|---|---|---|---|---|---|---|---|---|---|---|---|---|---|---|---|---|---|---|---|---|---|---|---|---|---|---|---|---|---|---|---|
| 1874 Jul 3 - 1874 Jul 17 (?) | Evidence from Observations: Reported | ||||||||||||||||||||||||||||||||||||||||||||||||||||||||||||||||||||||||||||||
|
List of 14 Events for Episode 1 at NNE flank (560 m)
|
|||||||||||||||||||||||||||||||||||||||||||||||||||||||||||||||||||||||||||||||
1835 Nov 11 (?) Confirmed Eruption (Explosive / Effusive) VEI: 2
| Episode 1 | Eruption (Explosive / Effusive) | West flank (east and SE of Ako) | ||||||||||||||||||||||||||||||||||||||||||||||||
|---|---|---|---|---|---|---|---|---|---|---|---|---|---|---|---|---|---|---|---|---|---|---|---|---|---|---|---|---|---|---|---|---|---|---|---|---|---|---|---|---|---|---|---|---|---|---|---|---|---|
| 1835 Nov 11 (?) - Unknown | Evidence from Observations: Reported | ||||||||||||||||||||||||||||||||||||||||||||||||
|
List of 8 Events for Episode 1 at West flank (east and SE of Ako)
|
|||||||||||||||||||||||||||||||||||||||||||||||||
1811 Jan 27 - 1811 Jan 28 Confirmed Eruption (Explosive / Effusive) VEI: 2
| Episode 1 | Eruption (Explosive / Effusive) | Summit and NE flank? | ||||||||||||||||||||||||||||||||||||||||||||||||
|---|---|---|---|---|---|---|---|---|---|---|---|---|---|---|---|---|---|---|---|---|---|---|---|---|---|---|---|---|---|---|---|---|---|---|---|---|---|---|---|---|---|---|---|---|---|---|---|---|---|
| 1811 Jan 27 - 1811 Jan 28 | Evidence from Observations: Reported | ||||||||||||||||||||||||||||||||||||||||||||||||
|
List of 8 Events for Episode 1 at Summit and NE flank?
|
|||||||||||||||||||||||||||||||||||||||||||||||||
1763 Aug 17 - 1769 Confirmed Eruption (Explosive / Effusive) VEI: 4
| Episode 1 | Eruption (Explosive / Effusive) | Oyama, SSW flank (Shinmio maar) | |||||||||||||||||||||||||||||||||||||||||||||||||||||
|---|---|---|---|---|---|---|---|---|---|---|---|---|---|---|---|---|---|---|---|---|---|---|---|---|---|---|---|---|---|---|---|---|---|---|---|---|---|---|---|---|---|---|---|---|---|---|---|---|---|---|---|---|---|---|
| 1763 Aug 17 - 1769 | Evidence from Observations: Reported | |||||||||||||||||||||||||||||||||||||||||||||||||||||
|
List of 9 Events for Episode 1 at Oyama, SSW flank (Shinmio maar)
|
||||||||||||||||||||||||||||||||||||||||||||||||||||||
1712 Feb 4 - 1714 Confirmed Eruption (Explosive / Effusive) VEI: 3 (?)
| Episode 1 | Eruption (Explosive / Effusive) | SW flank (Kuwanoki-daira) | ||||||||||||||||||||||||||||||||||||||||||||||||||||||||||
|---|---|---|---|---|---|---|---|---|---|---|---|---|---|---|---|---|---|---|---|---|---|---|---|---|---|---|---|---|---|---|---|---|---|---|---|---|---|---|---|---|---|---|---|---|---|---|---|---|---|---|---|---|---|---|---|---|---|---|---|
| 1712 Feb 4 - 1714 | Evidence from Observations: Reported | ||||||||||||||||||||||||||||||||||||||||||||||||||||||||||
|
List of 10 Events for Episode 1 at SW flank (Kuwanoki-daira)
|
|||||||||||||||||||||||||||||||||||||||||||||||||||||||||||
[ 1709 Apr 23 ] Uncertain Eruption
| Episode 1 | Eruption (Explosive / Effusive) | ||||
|---|---|---|---|---|
| 1709 Apr 23 - Unknown | Evidence from Unknown | |||
1643 Mar 31 - 1643 Apr Confirmed Eruption (Explosive / Effusive) VEI: 3
| Episode 1 | Eruption (Explosive / Effusive) | SW flank (SE of Ako, Kuwanoki-daira?) | |||||||||||||||||||||||||||||||||||||||||||
|---|---|---|---|---|---|---|---|---|---|---|---|---|---|---|---|---|---|---|---|---|---|---|---|---|---|---|---|---|---|---|---|---|---|---|---|---|---|---|---|---|---|---|---|---|
| 1643 Mar 31 - 1643 Apr | Evidence from Observations: Reported | |||||||||||||||||||||||||||||||||||||||||||
|
List of 7 Events for Episode 1 at SW flank (SE of Ako, Kuwanoki-daira?)
|
||||||||||||||||||||||||||||||||||||||||||||
1595 Nov 22 Confirmed Eruption (Explosive / Effusive) VEI: 2
| Episode 1 | Eruption (Explosive / Effusive) | SE flank | |||||||||||||||||||||||||||||||||
|---|---|---|---|---|---|---|---|---|---|---|---|---|---|---|---|---|---|---|---|---|---|---|---|---|---|---|---|---|---|---|---|---|---|---|
| 1595 Nov 22 - Unknown | Evidence from Observations: Reported | |||||||||||||||||||||||||||||||||
|
List of 5 Events for Episode 1 at SE flank
|
||||||||||||||||||||||||||||||||||
1535 Mar Confirmed Eruption (Explosive / Effusive) VEI: 2
| Episode 1 | Eruption (Explosive / Effusive) | SE flank | ||||||||||||||||||||||||||||
|---|---|---|---|---|---|---|---|---|---|---|---|---|---|---|---|---|---|---|---|---|---|---|---|---|---|---|---|---|---|
| 1535 Mar - Unknown | Evidence from Observations: Reported | ||||||||||||||||||||||||||||
|
List of 4 Events for Episode 1 at SE flank
|
|||||||||||||||||||||||||||||
1469 Dec 24 Confirmed Eruption (Explosive / Effusive) VEI: 3
| Episode 1 | Eruption (Explosive / Effusive) | Oyama | ||||||||||||||||||||||||||||
|---|---|---|---|---|---|---|---|---|---|---|---|---|---|---|---|---|---|---|---|---|---|---|---|---|---|---|---|---|---|
| 1469 Dec 24 - Unknown | Evidence from Observations: Reported | ||||||||||||||||||||||||||||
|
List of 4 Events for Episode 1 at Oyama
|
|||||||||||||||||||||||||||||
1154 Nov Confirmed Eruption (Explosive / Effusive) VEI: 3
| Episode 1 | Eruption (Explosive / Effusive) | NE flank?, SBS tephra | ||||||||||||||||||||||||||||
|---|---|---|---|---|---|---|---|---|---|---|---|---|---|---|---|---|---|---|---|---|---|---|---|---|---|---|---|---|---|
| 1154 Nov - Unknown | Evidence from Observations: Reported | ||||||||||||||||||||||||||||
|
List of 4 Events for Episode 1 at NE flank?, SBS tephra
|
|||||||||||||||||||||||||||||
1085 Confirmed Eruption (Explosive / Effusive) VEI: 2
| Episode 1 | Eruption (Explosive / Effusive) | ||||||||||||||||||||||||
|---|---|---|---|---|---|---|---|---|---|---|---|---|---|---|---|---|---|---|---|---|---|---|---|---|
| 1085 - Unknown | Evidence from Observations: Reported | |||||||||||||||||||||||
|
List of 3 Events for Episode 1
|
||||||||||||||||||||||||
0850 (?) Confirmed Eruption (Explosive / Effusive) VEI: 4
| Episode 1 | Eruption (Explosive / Effusive) | Oyama and East flank (Mi-ike maar) | |||||||||||||||||||||||||||||||||
|---|---|---|---|---|---|---|---|---|---|---|---|---|---|---|---|---|---|---|---|---|---|---|---|---|---|---|---|---|---|---|---|---|---|---|
| 0850 (?) - Unknown | Evidence from Observations: Reported | |||||||||||||||||||||||||||||||||
|
List of 5 Events for Episode 1 at Oyama and East flank (Mi-ike maar)
|
||||||||||||||||||||||||||||||||||
0832 Jun 23 Confirmed Eruption (Explosive / Effusive) VEI: 3
| Episode 1 | Eruption (Explosive / Effusive) | KHS tephra | |||||||||||||||||||||||
|---|---|---|---|---|---|---|---|---|---|---|---|---|---|---|---|---|---|---|---|---|---|---|---|---|
| 0832 Jun 23 - Unknown | Evidence from Observations: Reported | |||||||||||||||||||||||
|
List of 3 Events for Episode 1 at KHS tephra
|
||||||||||||||||||||||||
0750 ± 50 years Confirmed Eruption (Explosive / Effusive) VEI: 3
| Episode 1 | Eruption (Explosive / Effusive) | NE flank, MBS tephra | |||||||||||||||||||||||
|---|---|---|---|---|---|---|---|---|---|---|---|---|---|---|---|---|---|---|---|---|---|---|---|---|
| 0750 ± 50 years - Unknown | Evidence from Isotopic: 14C (calibrated) | |||||||||||||||||||||||
|
List of 3 Events for Episode 1 at NE flank, MBS tephra
|
||||||||||||||||||||||||
0500 ± 50 years Confirmed Eruption (Explosive / Effusive) VEI: 3
| Episode 1 | Eruption (Explosive / Effusive) | Daihannya-yama, DHS tephra | |||||||||||||||||||||||
|---|---|---|---|---|---|---|---|---|---|---|---|---|---|---|---|---|---|---|---|---|---|---|---|---|
| 0500 ± 50 years - Unknown | Evidence from Isotopic: 14C (calibrated) | |||||||||||||||||||||||
|
List of 3 Events for Episode 1 at Daihannya-yama, DHS tephra
|
||||||||||||||||||||||||
0320 ± 500 years Confirmed Eruption (Explosive / Effusive) VEI: 3 (?)
| Episode 1 | Eruption (Explosive / Effusive) | Sabigahama, SHB tephra | ||||||||||||||||||||||||||||||||||||||
|---|---|---|---|---|---|---|---|---|---|---|---|---|---|---|---|---|---|---|---|---|---|---|---|---|---|---|---|---|---|---|---|---|---|---|---|---|---|---|---|
| 0320 ± 500 years - Unknown | Evidence from Correlation: Tephrochronology | ||||||||||||||||||||||||||||||||||||||
|
List of 6 Events for Episode 1 at Sabigahama, SHB tephra
|
|||||||||||||||||||||||||||||||||||||||
0260 ± 500 years Confirmed Eruption (Explosive / Effusive) VEI: 4
| Episode 1 | Eruption (Explosive / Effusive) | TGS and TGA tephras | ||||||||||||||||||||||||||||
|---|---|---|---|---|---|---|---|---|---|---|---|---|---|---|---|---|---|---|---|---|---|---|---|---|---|---|---|---|---|
| 0260 ± 500 years - Unknown | Evidence from Correlation: Tephrochronology | ||||||||||||||||||||||||||||
|
List of 4 Events for Episode 1 at TGS and TGA tephras
|
|||||||||||||||||||||||||||||
0050 BCE ± 50 years Confirmed Eruption (Explosive / Effusive) VEI: 3
| Episode 1 | Eruption (Explosive / Effusive) | Taira-yama, TYS tephra | |||||||||||||||||||||||||||||||||
|---|---|---|---|---|---|---|---|---|---|---|---|---|---|---|---|---|---|---|---|---|---|---|---|---|---|---|---|---|---|---|---|---|---|---|
| 0050 BCE ± 50 years - Unknown | Evidence from Isotopic: 14C (calibrated) | |||||||||||||||||||||||||||||||||
|
List of 5 Events for Episode 1 at Taira-yama, TYS tephra
|
||||||||||||||||||||||||||||||||||
0600 BCE ± 500 years Confirmed Eruption (Explosive / Effusive) VEI: 3
| Episode 1 | Eruption (Explosive / Effusive) | IZS scoria | ||||||||||||||||||||||||||||
|---|---|---|---|---|---|---|---|---|---|---|---|---|---|---|---|---|---|---|---|---|---|---|---|---|---|---|---|---|---|
| 0600 BCE ± 500 years - Unknown | Evidence from Correlation: Tephrochronology | ||||||||||||||||||||||||||||
|
List of 4 Events for Episode 1 at IZS scoria
|
|||||||||||||||||||||||||||||
0950 BCE ± 200 years Confirmed Eruption (Explosive / Effusive) VEI: 4
| Episode 1 | Eruption (Explosive / Effusive) | Hatchodaira caldera, S flank (Furumio maar) | |||||||||||||||||||||||||||||||||||||||||||
|---|---|---|---|---|---|---|---|---|---|---|---|---|---|---|---|---|---|---|---|---|---|---|---|---|---|---|---|---|---|---|---|---|---|---|---|---|---|---|---|---|---|---|---|---|
| 0950 BCE ± 200 years - Unknown | Evidence from Correlation: Tephrochronology | |||||||||||||||||||||||||||||||||||||||||||
|
List of 7 Events for Episode 1 at Hatchodaira caldera, S flank (Furumio maar)
|
||||||||||||||||||||||||||||||||||||||||||||
1250 BCE (?) Confirmed Eruption (Explosive / Effusive) VEI: 3
| Episode 1 | Eruption (Explosive / Effusive) | TBS tephra | |||||||||||||||||||||||
|---|---|---|---|---|---|---|---|---|---|---|---|---|---|---|---|---|---|---|---|---|---|---|---|---|
| 1250 BCE (?) - Unknown | Evidence from Correlation: Tephrochronology | |||||||||||||||||||||||
|
List of 3 Events for Episode 1 at TBS tephra
|
||||||||||||||||||||||||
1450 BCE ± 500 years Confirmed Eruption (Explosive / Effusive)
| Episode 1 | Eruption (Explosive / Effusive) | NW flank (NGS scoria layer) | ||||||||||||||||||
|---|---|---|---|---|---|---|---|---|---|---|---|---|---|---|---|---|---|---|---|
| 1450 BCE ± 500 years - Unknown | Evidence from Correlation: Tephrochronology | ||||||||||||||||||
|
List of 2 Events for Episode 1 at NW flank (NGS scoria layer)
|
|||||||||||||||||||
1800 BCE ± 50 years Confirmed Eruption (Explosive / Effusive) VEI: 3
| Episode 1 | Eruption (Explosive / Effusive) | South flank (Mizutamari maar) | |||||||||||||||||||||||||||||||||
|---|---|---|---|---|---|---|---|---|---|---|---|---|---|---|---|---|---|---|---|---|---|---|---|---|---|---|---|---|---|---|---|---|---|---|
| 1800 BCE ± 50 years - Unknown | Evidence from Correlation: Tephrochronology | |||||||||||||||||||||||||||||||||
|
List of 5 Events for Episode 1 at South flank (Mizutamari maar)
|
||||||||||||||||||||||||||||||||||
2000 BCE ± 100 years Confirmed Eruption (Explosive / Effusive) VEI: 3
| Episode 1 | Eruption (Explosive / Effusive) | Igaya-Higashi tephra | |||||||||||||||||||||||
|---|---|---|---|---|---|---|---|---|---|---|---|---|---|---|---|---|---|---|---|---|---|---|---|---|
| 2000 BCE ± 100 years - Unknown | Evidence from Isotopic: 14C (calibrated) | |||||||||||||||||||||||
|
List of 3 Events for Episode 1 at Igaya-Higashi tephra
|
||||||||||||||||||||||||
2900 BCE ± 500 years Confirmed Eruption (Explosive / Effusive) VEI: 4
| Episode 1 | Eruption (Explosive / Effusive) | Igaya tephra layer | ||||||||||||||||||||||||||||||||||||||
|---|---|---|---|---|---|---|---|---|---|---|---|---|---|---|---|---|---|---|---|---|---|---|---|---|---|---|---|---|---|---|---|---|---|---|---|---|---|---|---|
| 2900 BCE ± 500 years - Unknown | Evidence from Correlation: Tephrochronology | ||||||||||||||||||||||||||||||||||||||
|
List of 6 Events for Episode 1 at Igaya tephra layer
|
|||||||||||||||||||||||||||||||||||||||
6450 BCE ± 500 years Confirmed Eruption (Explosive / Effusive) VEI: 4
| Episode 1 | Eruption (Explosive / Effusive) | NW flank, Ofunata; OFB tephra | ||||||||||||||||||||||||||||
|---|---|---|---|---|---|---|---|---|---|---|---|---|---|---|---|---|---|---|---|---|---|---|---|---|---|---|---|---|---|
| 6450 BCE ± 500 years - Unknown | Evidence from Correlation: Tephrochronology | ||||||||||||||||||||||||||||
|
List of 4 Events for Episode 1 at NW flank, Ofunata; OFB tephra
|
|||||||||||||||||||||||||||||
This compilation of synonyms and subsidiary features may not be comprehensive. Features are organized into four major categories: Cones, Craters, Domes, and Thermal Features. Synonyms of features appear indented below the primary name. In some cases additional feature type, elevation, or location details are provided.
Synonyms |
||||
| Miyake-jima | ||||
Cones |
||||
| Feature Name | Feature Type | Elevation | Latitude | Longitude |
| Hyotan-yama | Cone | |||
| Kuwanoki-daira | Cone | |||
Craters |
||||
| Feature Name | Feature Type | Elevation | Latitude | Longitude |
| Daihannya-yama | Fissure vent | |||
| Furumio
Tairoike |
Maar | |||
| Hatchodaira | Caldera | |||
| Hinoyama-toge | Fissure vent | |||
| Hirabe-yama | Crater | |||
| Igaya | Fissure vent | |||
| Izu | Crater | |||
| Kamane | Maar | |||
| Kanaso | Maar | |||
| Kazahaya | Fissure vent | |||
| Koshiki | Crater | |||
| Koshiki-ana | Crater | |||
| Kuwakidaira | Caldera | |||
| Miogataira | Crater | |||
| Mippana | Crater | |||
| Misodo-ana | Crater | |||
| Mitoribata | Fissure vent | |||
| Mizutamari
Yaema |
Maar | |||
| Nagane | Fissure vent | |||
| Oana | Crater | |||
| O-ana | Crater | |||
| Oyama | Caldera | |||
| Sanshichi-yama | Fissure vent | |||
| Shinmio
Sinmiyo |
Maar | |||
| Shinmiyo-ike | Crater | |||
| Suou-ana | Crater | |||
| Yamamio | Maar | |||
| Yoridai-zawa | Crater | |||
There are no samples for Miyakejima in the Smithsonian's NMNH Department of Mineral Sciences Rock and Ore collection.
| Copernicus Browser | The Copernicus Browser replaced the Sentinel Hub Playground browser in 2023, to provide access to Earth observation archives from the Copernicus Data Space Ecosystem, the main distribution platform for data from the EU Copernicus missions. |
| MIROVA | Middle InfraRed Observation of Volcanic Activity (MIROVA) is a near real time volcanic hot-spot detection system based on the analysis of MODIS (Moderate Resolution Imaging Spectroradiometer) data. In particular, MIROVA uses the Middle InfraRed Radiation (MIR), measured over target volcanoes, in order to detect, locate and measure the heat radiation sourced from volcanic activity. |
| MODVOLC Thermal Alerts | Using infrared satellite Moderate Resolution Imaging Spectroradiometer (MODIS) data, scientists at the Hawai'i Institute of Geophysics and Planetology, University of Hawai'i, developed an automated system called MODVOLC to map thermal hot-spots in near real time. For each MODIS image, the algorithm automatically scans each 1 km pixel within it to check for high-temperature hot-spots. When one is found the date, time, location, and intensity are recorded. MODIS looks at every square km of the Earth every 48 hours, once during the day and once during the night, and the presence of two MODIS sensors in space allows at least four hot-spot observations every two days. Each day updated global maps are compiled to display the locations of all hot spots detected in the previous 24 hours. There is a drop-down list with volcano names which allow users to 'zoom-in' and examine the distribution of hot-spots at a variety of spatial scales. |
|
WOVOdat
Single Volcano View Temporal Evolution of Unrest Side by Side Volcanoes |
WOVOdat is a database of volcanic unrest; instrumentally and visually recorded changes in seismicity, ground deformation, gas emission, and other parameters from their normal baselines. It is sponsored by the World Organization of Volcano Observatories (WOVO) and presently hosted at the Earth Observatory of Singapore.
GVMID Data on Volcano Monitoring Infrastructure The Global Volcano Monitoring Infrastructure Database GVMID, is aimed at documenting and improving capabilities of volcano monitoring from the ground and space. GVMID should provide a snapshot and baseline view of the techniques and instrumentation that are in place at various volcanoes, which can be use by volcano observatories as reference to setup new monitoring system or improving networks at a specific volcano. These data will allow identification of what monitoring gaps exist, which can be then targeted by remote sensing infrastructure and future instrument deployments. |
| Volcanic Hazard Maps | The IAVCEI Commission on Volcanic Hazards and Risk has a Volcanic Hazard Maps database designed to serve as a resource for hazard mappers (or other interested parties) to explore how common issues in hazard map development have been addressed at different volcanoes, in different countries, for different hazards, and for different intended audiences. In addition to the comprehensive, searchable Volcanic Hazard Maps Database, this website contains information about diversity of volcanic hazard maps, illustrated using examples from the database. This site is for educational purposes related to volcanic hazard maps. Hazard maps found on this website should not be used for emergency purposes. For the most recent, official hazard map for a particular volcano, please seek out the proper institutional authorities on the matter. |
| IRIS seismic stations/networks | Incorporated Research Institutions for Seismology (IRIS) Data Services map showing the location of seismic stations from all available networks (permanent or temporary) within a radius of 0.18° (about 20 km at mid-latitudes) from the given location of Miyakejima. Users can customize a variety of filters and options in the left panel. Note that if there are no stations are known the map will default to show the entire world with a "No data matched request" error notice. |
| UNAVCO GPS/GNSS stations | Geodetic Data Services map from UNAVCO showing the location of GPS/GNSS stations from all available networks (permanent or temporary) within a radius of 20 km from the given location of Miyakejima. Users can customize the data search based on station or network names, location, and time window. Requires Adobe Flash Player. |
| DECADE Data | The DECADE portal, still in the developmental stage, serves as an example of the proposed interoperability between The Smithsonian Institution's Global Volcanism Program, the Mapping Gas Emissions (MaGa) Database, and the EarthChem Geochemical Portal. The Deep Earth Carbon Degassing (DECADE) initiative seeks to use new and established technologies to determine accurate global fluxes of volcanic CO2 to the atmosphere, but installing CO2 monitoring networks on 20 of the world's 150 most actively degassing volcanoes. The group uses related laboratory-based studies (direct gas sampling and analysis, melt inclusions) to provide new data for direct degassing of deep earth carbon to the atmosphere. |
| Large Eruptions of Miyakejima | Information about large Quaternary eruptions (VEI >= 4) is cataloged in the Large Magnitude Explosive Volcanic Eruptions (LaMEVE) database of the Volcano Global Risk Identification and Analysis Project (VOGRIPA). |
| EarthChem | EarthChem develops and maintains databases, software, and services that support the preservation, discovery, access and analysis of geochemical data, and facilitate their integration with the broad array of other available earth science parameters. EarthChem is operated by a joint team of disciplinary scientists, data scientists, data managers and information technology developers who are part of the NSF-funded data facility Integrated Earth Data Applications (IEDA). IEDA is a collaborative effort of EarthChem and the Marine Geoscience Data System (MGDS). |


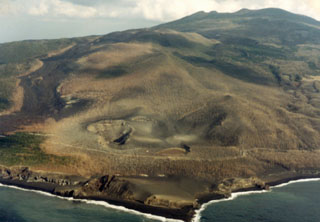 The craters in the foreground and the lava flow to the right erupted in 1983 from vents on the SW flank of Miyakejima. The 8-km-wide island rises about 1.1 km from the sea floor in the northern Izu Islands, about 200 km SSW of Tokyo. The summit cone of Oyama (upper right) lies within a caldera that formed about 3,000 years ago. Frequent eruptions have occurred since 1085 CE at vents ranging from the summit to below sea level.