Observatorio Volcanológico de los Andes del Sur (OVDAS)-SERNAGEOMIN and ONEMI reported an increase in ash emissions at Planchón-Peteroa beginning at 1700 on 1 February, with ash plumes rising as high as 2 km and drifting E. This activity was accompanied by the appearance of discrete, very-low-frequency seismic events which were only recorded that day. On 3 February webcams showed gas-and-ash plumes rising to heights less than 2 km. The Alert Level remained at Yellow (the middle level on a three-color scale) for the volcano, and ONEMI maintained Alert Level Yellow for the communities of Molina (66 WNW), Curicó (68 km NW), Romeral (75 km NW), and Teno (68 km NW).
Sources: Oficina Nacional de Emergencia-Ministerio del Interior (ONEMI), Servicio Nacional de Geología y Minería (SERNAGEOMIN)
Frequent ash plumes during March-April; last ash deposit seen in early May 2019
Planchón-Peteroa is located along the Chile-Argentina border and is the northernmost volcano of the Maule region. Eruptions have been intermittent in recent times and have consisted largely of gas-and-steam and ash plumes, with the most recent eruption phase beginning in November 2018. This report covers March through May 2019; the last evidence for ash emissions was during 6-8 May, after which the activity consisted of only gas-and-steam plumes. This report summarizes activity reports by Servicio Nacional de Geología y Minería (SERNAGEOMIN) and Oficina Nacional de Emergencia - Ministerio del Interior (ONEMI), and various satellite data.
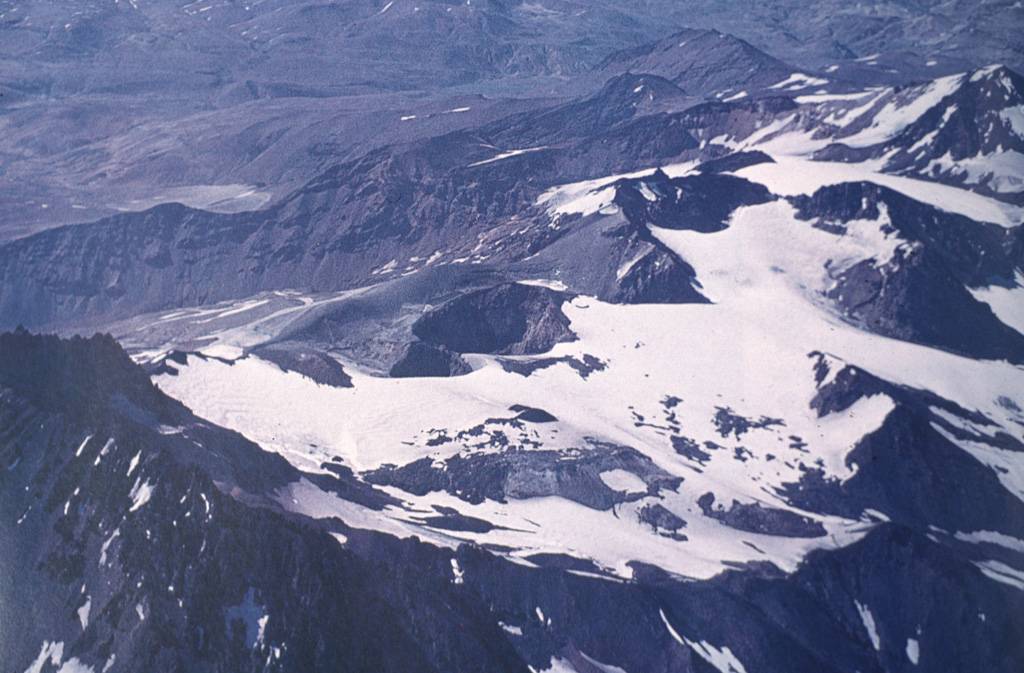
During 1-15 March ash plumes reached 2 km above the crater, with an increase in maximum plume heights after the 7th. Elevated sulfur dioxide (SO2) emissions were detected on 8 and 12 March. From 12 to 31 March ash plumes reached maximum heights of 1.6 km above the crater. An ash plume on 26 March reached 1.2 km (figure 21). Ash plumes were frequently imaged by the Sentinel-2 satellite, with the wind dispersing the ash plumes primarily to the SE (figure 22). Degassing was continuous throughout March, and SO2 emissions were detected by the TROPOspheric Monitoring Instrument (TROPOMI, figure 23). Sentinel-2 data showed one thermal anomaly for this period, on 12 March.
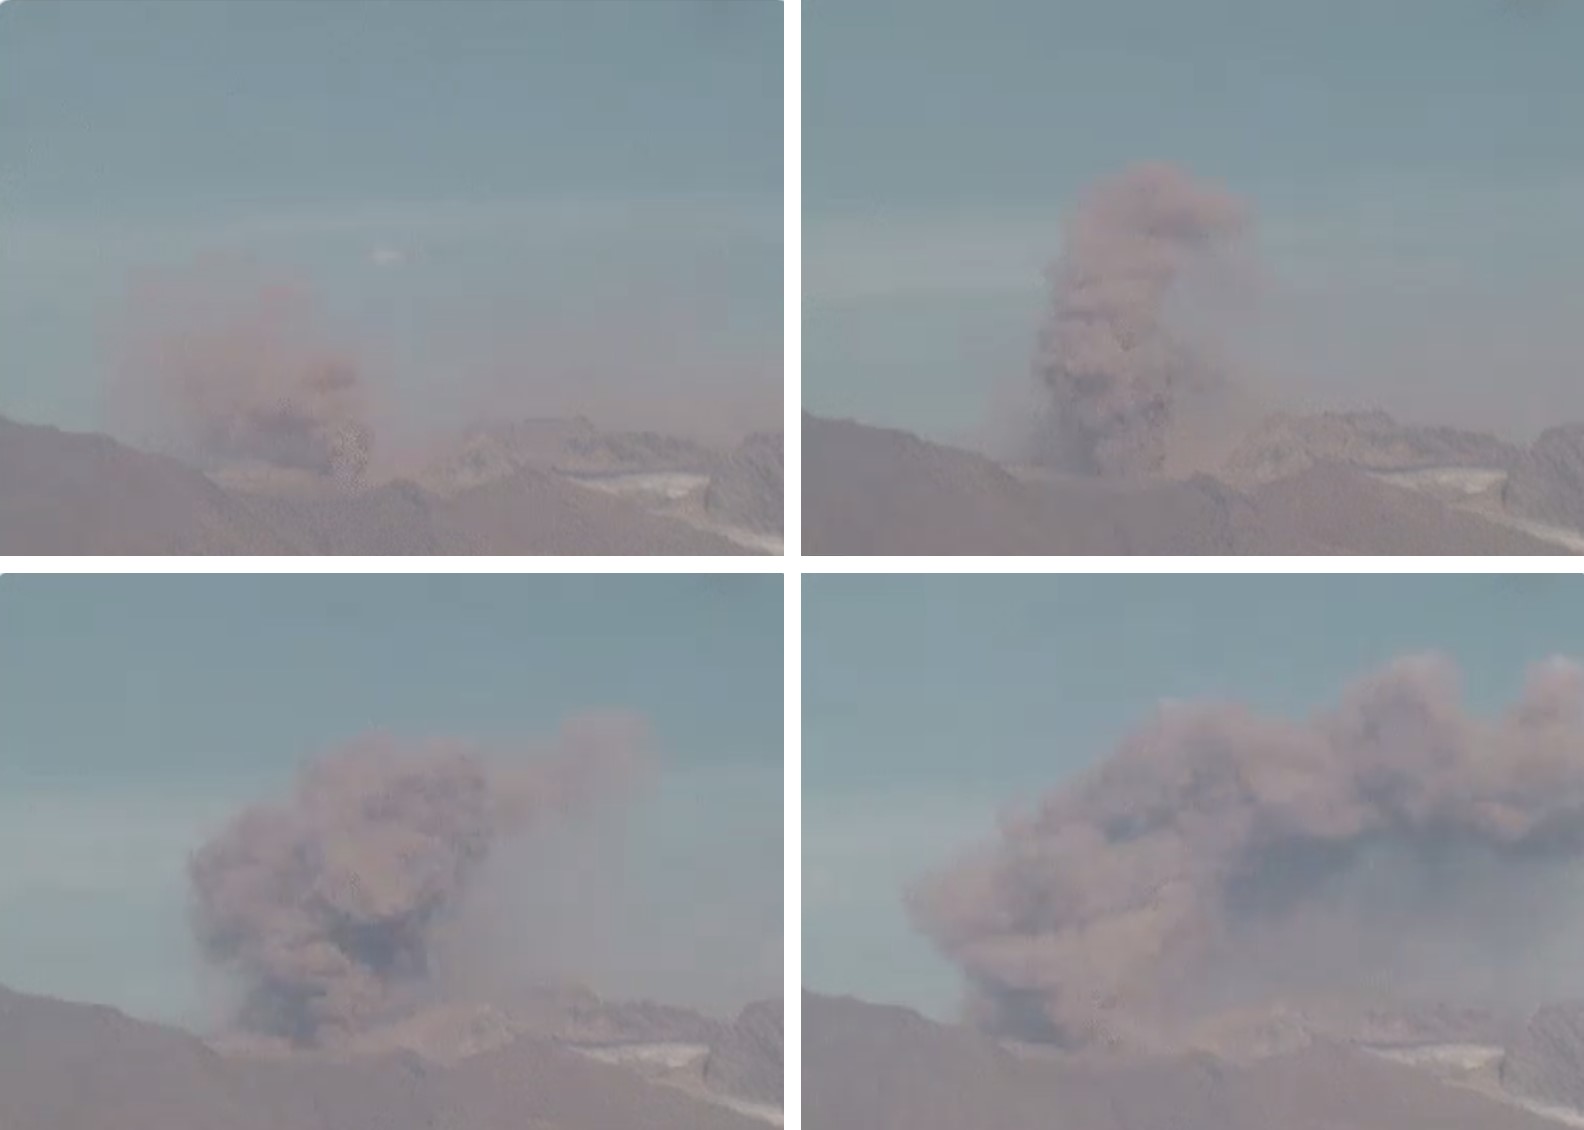 |
Figure 21. Screenshots of footage shared by SERNAGEOMIN showing an ash plume reaching 1.2 km above the crater at 1650 on 26 March 2019. Webcam images courtesy of SERNAGEOMIN. |
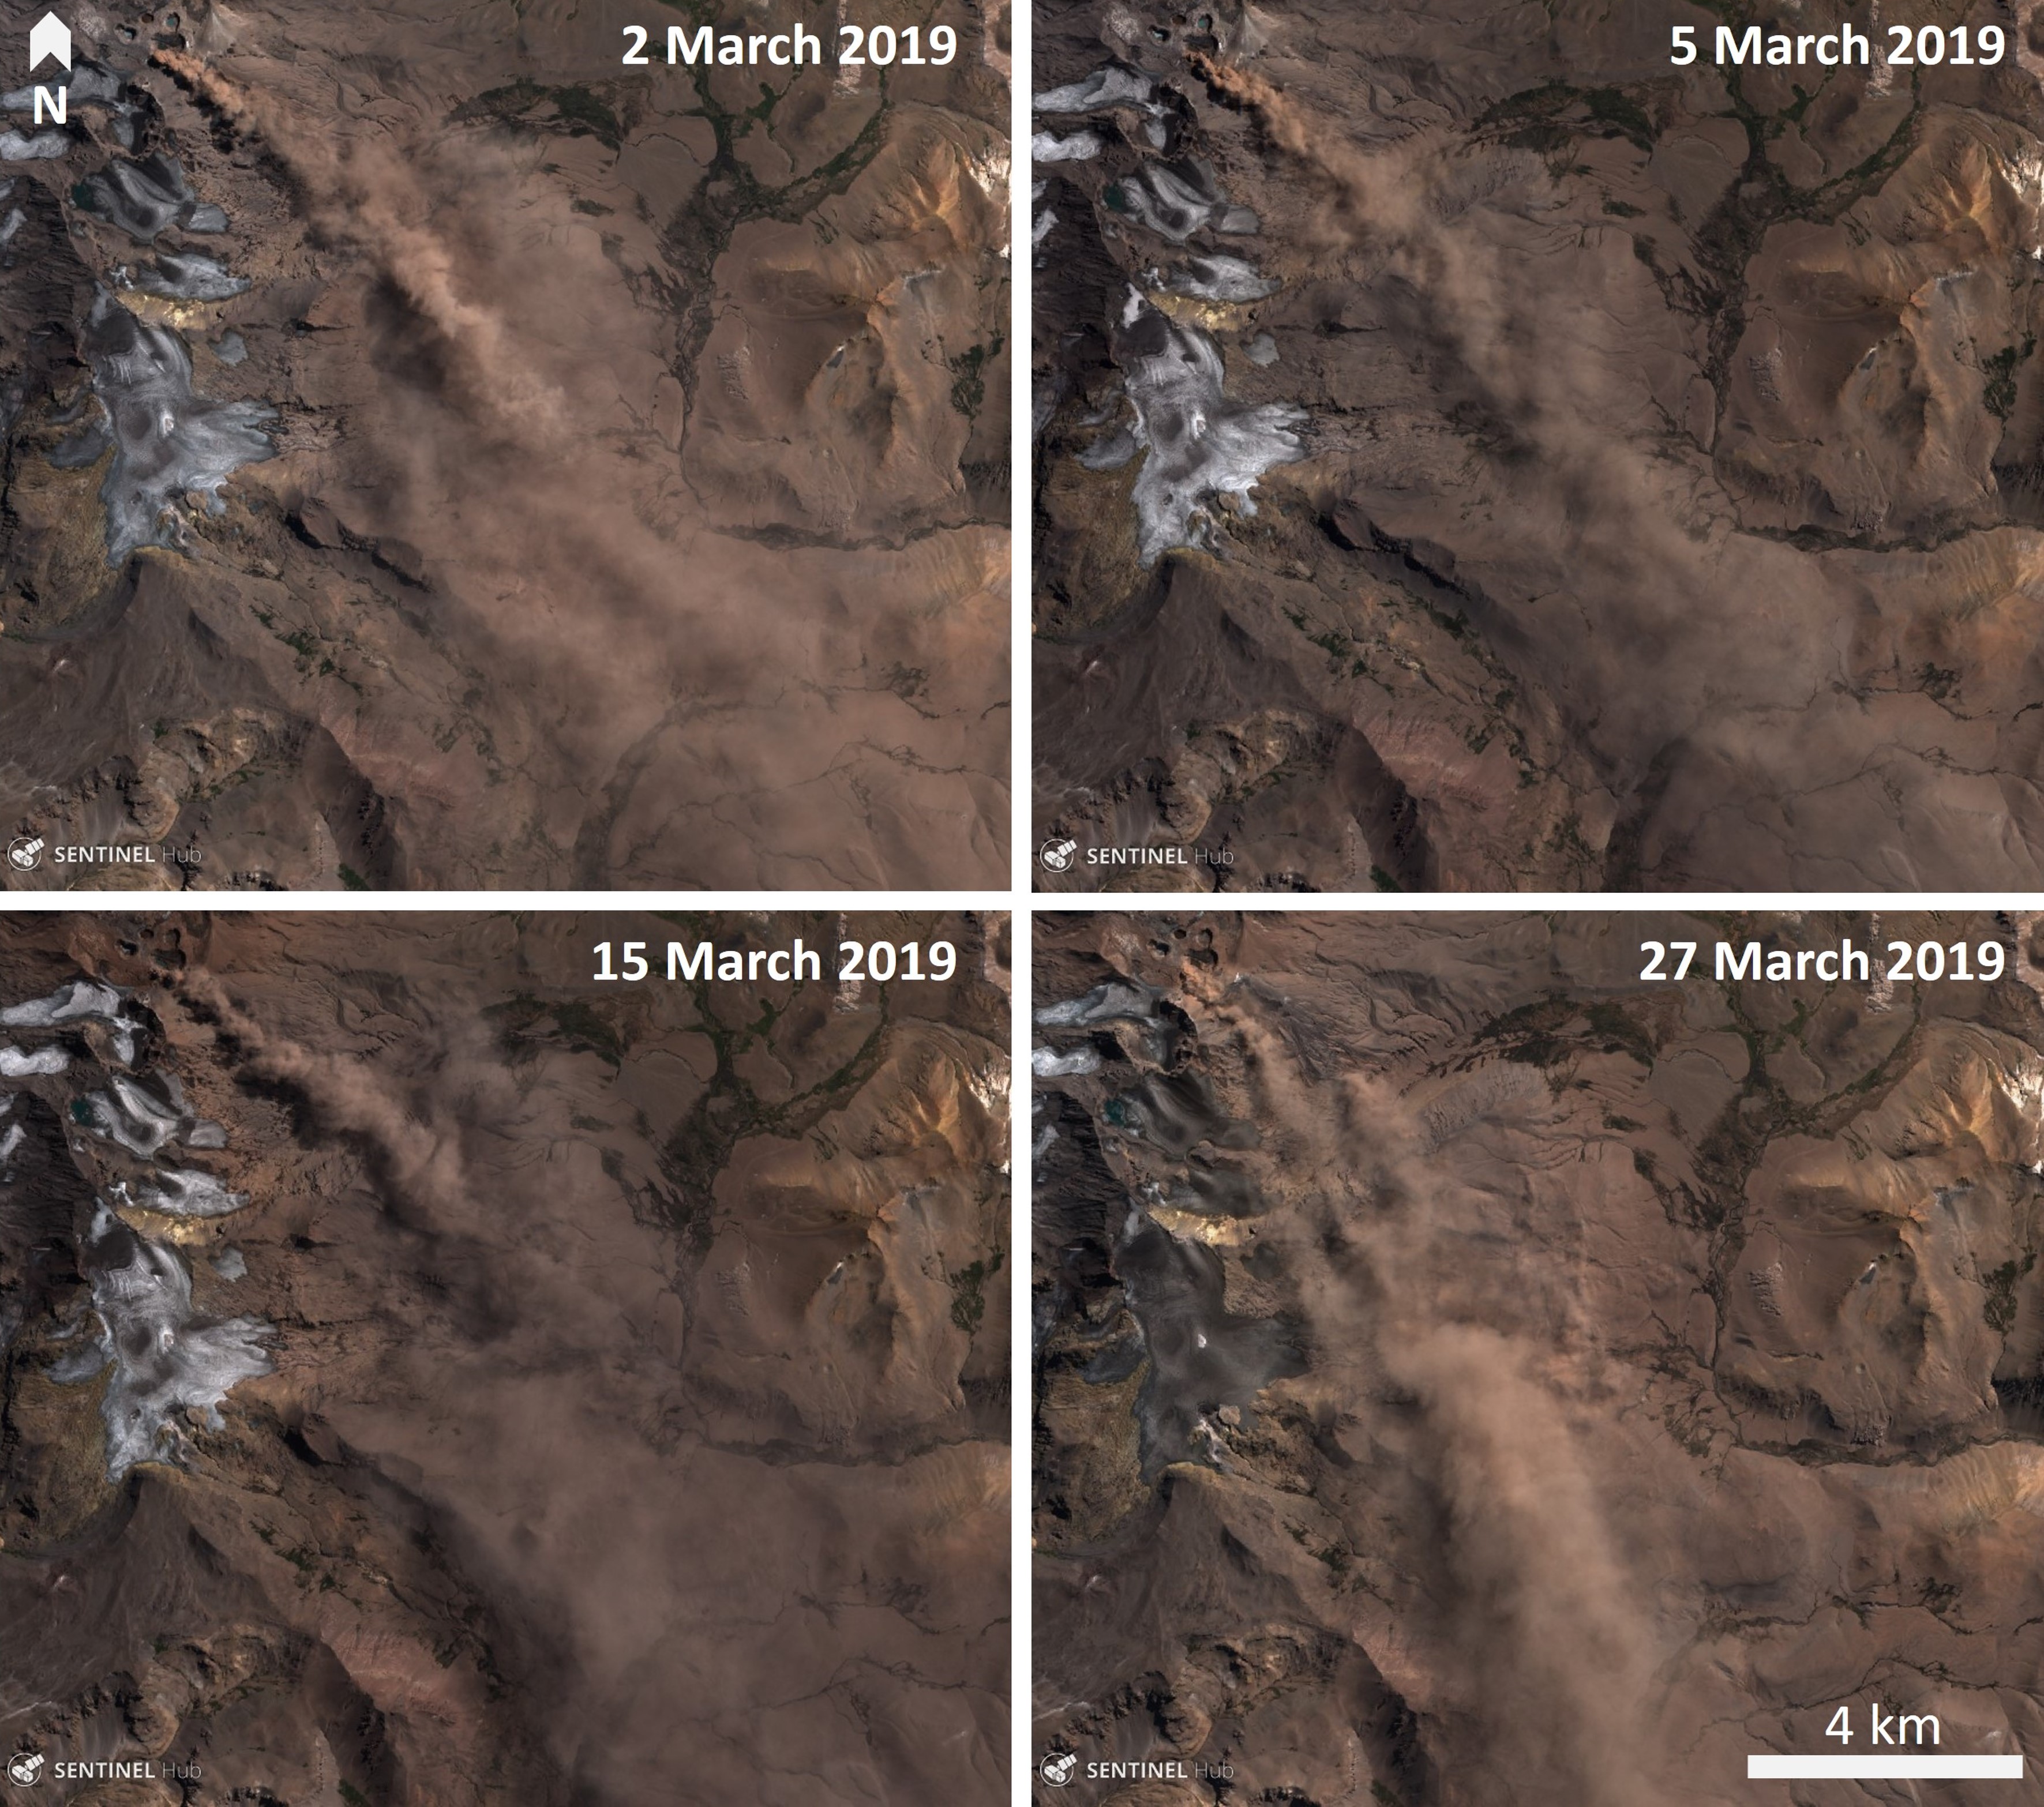 |
Figure 22. Examples of ash plumes from Planchón-Peteroa during March 2019. The brown plumes are all being blown to the SE. Sentinel-2 natural color (bands 4, 3, 2) satellite images courtesy of Sentinel Hub Playground. |
 |
Figure 23. Examples of SO2 emissions at Planchón-Peteroa during March 2019 as measured by Sentinel-5P/TROPOMI. The location of the volcano is indicated in the top-right image. Courtesy of NASA Goddard Space Flight Center. |
Ash plumes continued through April but were less frequently observed in Sentinel-2 satellite data. SERNAGEOMIN reported a reduction in plume height, with a maximum height of 1.5 km above the crater through to the 7th, and a maximum plume height of 400-600 m from the 8th through to the end of the month. Early in the month analysis of the ash showed around 5% juvenile material. SO2 emissions were measured on 3 and 5 April, with values of 320 ± 25 tons per day (t/d) and 634 ± 131 t/d, respectively. Degassing was continuous throughout April and May.
An ash plume was imaged on 1 May in Sentinel-2 imagery, but then cloud cover obscured satellite views through 4 May. A partially-obscured view in a 5 May Suomi NPP / VIIRS image (in NASA Worldview) showed what appeared to be an ash deposit on fresh snow to the SE of the crater. This ash deposit is visible through diffuse clouds in a Sentinel-2 image acquired on 6 May, and additional deposits are visible on 8 May (figure 24). During the rest of May the plumes were largely white with little to no volcanic ash content (figure 25).
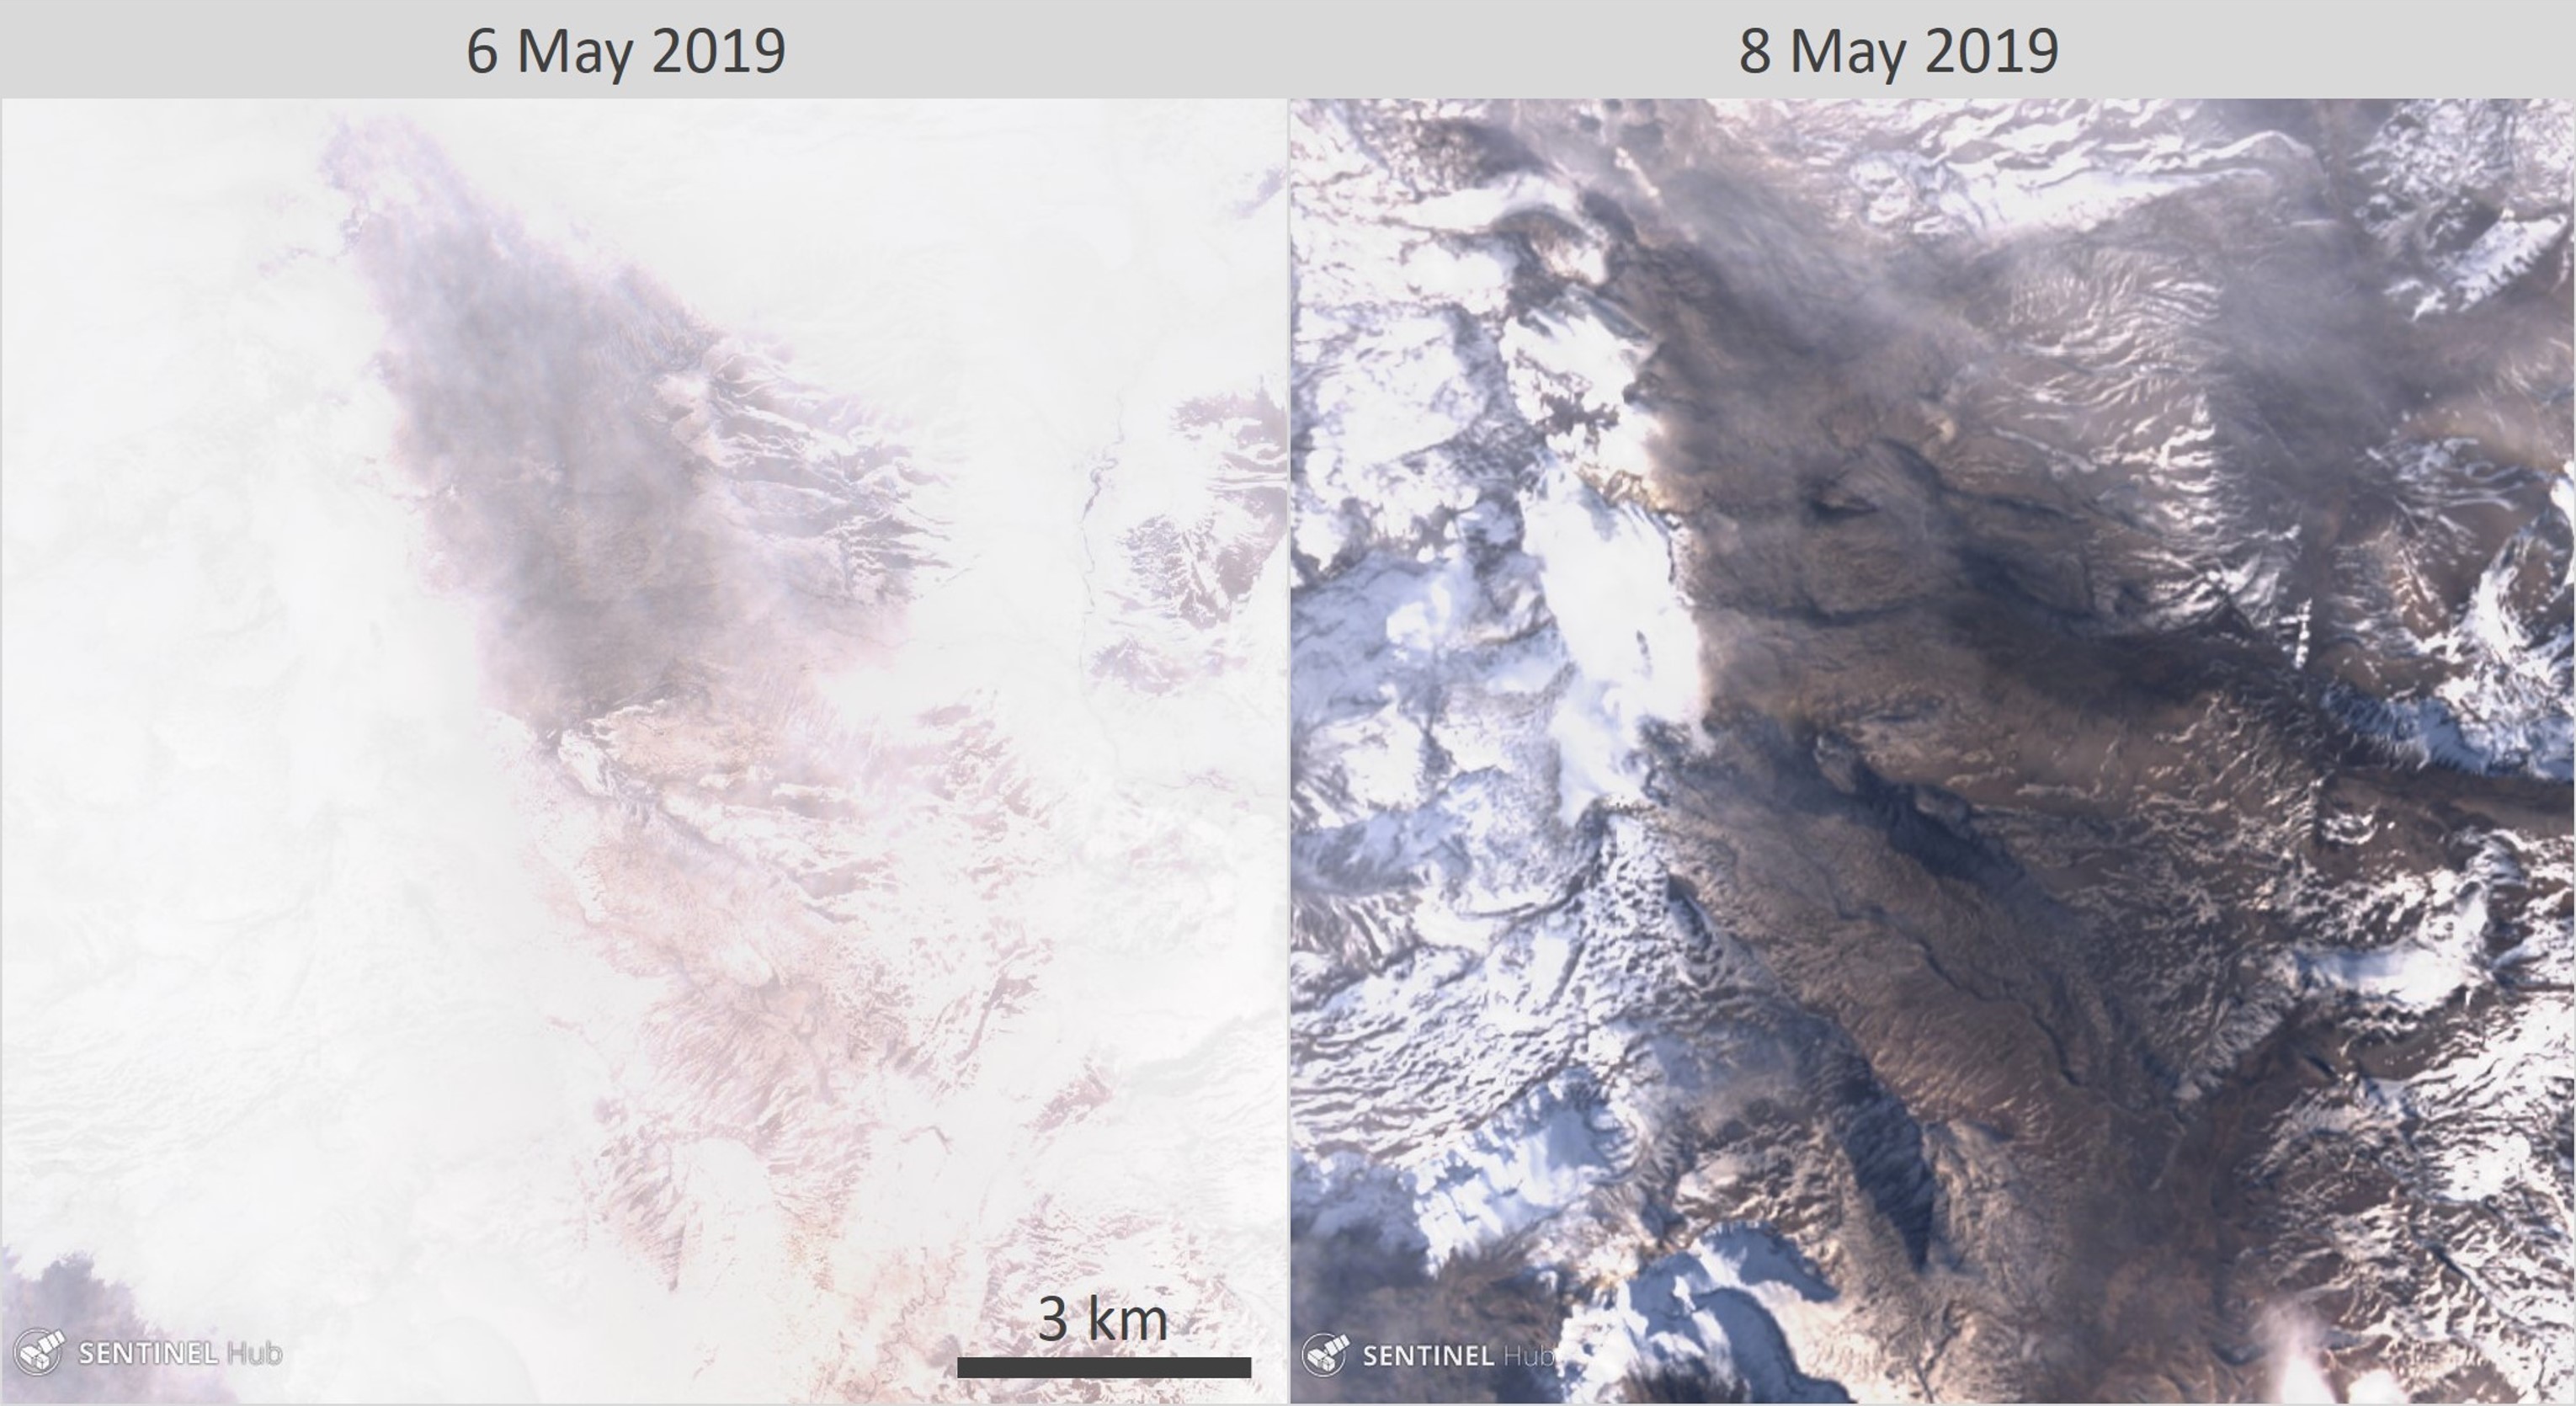 |
Figure 24. Ash deposited on snow to the SE of the active Planchón-Peteroa crater through light cloud cover, visible in a Sentinel-2 image (left) acquired on 6 May 2019, and a Landsat 8 image (right) acquired on 8 May. Sentinel-2 natural color (bands 4, 3, 2) and Landsat 8 true color (bands 4, 3, 2) satellite images courtesy of Sentinel Hub Playground. |
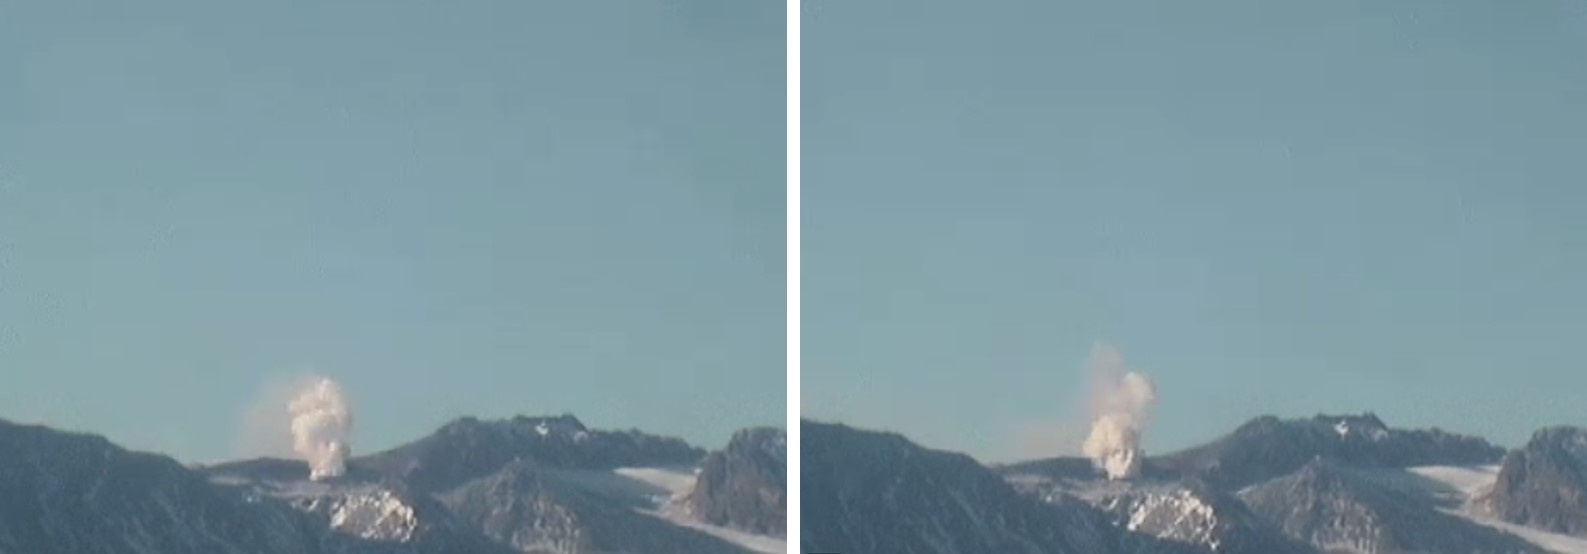 |
Figure 25. Continuous degassing at Planchón-Peteroa on 10 May producing a plume composed mainly of water vapor rises to 600 m above the crater. Webcam images courtesy of SERNAGEOMIN. |
Information Contacts: Servicio Nacional de Geología y Minería (SERNAGEOMIN), Observatorio Volcanológico de Los Andes del Sur (OVDAS), Avda Sta María No. 0104, Santiago, Chile (URL: http://www.sernageomin.cl/); Oficina Nacional de Emergencia - Ministerio del Interior (ONEMI), Beaucheff 1637/1671, Santiago, Chile (URL: http://www.onemi.cl/); Global Sulfur Dioxide Monitoring Page, Atmospheric Chemistry and Dynamics Laboratory, NASA Goddard Space Flight Center (NASA/GSFC), 8800 Greenbelt Road, Goddard, Maryland, USA (URL: https://so2.gsfc.nasa.gov/); Sentinel Hub Playground (URL: https://www.sentinel-hub.com/explore/sentinel-playground); NASA Worldview (URL: https://worldview.earthdata.nasa.gov/).
2019: January
2018: December
2017: May
| July
2016: January
| June
2011: February
| March
| April
| May
| June
2010: January
| July
| September
| October
| November
2008: May
2006: January
Observatorio Volcanológico de los Andes del Sur (OVDAS)-SERNAGEOMIN and ONEMI reported an increase in ash emissions at Planchón-Peteroa beginning at 1700 on 1 February, with ash plumes rising as high as 2 km and drifting E. This activity was accompanied by the appearance of discrete, very-low-frequency seismic events which were only recorded that day. On 3 February webcams showed gas-and-ash plumes rising to heights less than 2 km. The Alert Level remained at Yellow (the middle level on a three-color scale) for the volcano, and ONEMI maintained Alert Level Yellow for the communities of Molina (66 WNW), Curicó (68 km NW), Romeral (75 km NW), and Teno (68 km NW).
Sources: Oficina Nacional de Emergencia-Ministerio del Interior (ONEMI); Servicio Nacional de Geología y Minería (SERNAGEOMIN)
Observatorio Volcanológico de los Andes del Sur (OVDAS)-SERNAGEOMIN and ONEMI reported increased activity at Planchón-Peteroa beginning in the morning of 16 December. Low-intensity pulses of tremor were detected by the seismic network and associated with pulsating grayish gas emissions which rose no higher than 800 m above the vent rim. Webcams recorded crater incandescence during the night of 15-16 December. The Alert Level remained at Yellow (the middle level on a three-color scale) for the volcano, and ONEMI maintained Alert Level Yellow for the communities of Molina (66 WNW), Curicó (68 km NW), Romeral (75 km NW), and Teno (68 km NW).
Sources: Oficina Nacional de Emergencia-Ministerio del Interior (ONEMI); Servicio Nacional de Geología y Minería (SERNAGEOMIN)
Observatorio Volcanológico de los Andes del Sur (OVDAS) - SERNAGEOMIN reported that the Alert Level for Planchón-Peteroa was raised to Yellow (the middle level on a three-color scale) on 10 July, noting elevated seismicity (above baseline levels) on 8 July.
Source: Servicio Nacional de Geología y Minería (SERNAGEOMIN)
Based on Observatorio Volcanológico de los Andes del Sur (OVDAS) - SERNAGEOMIN observations, ONEMI reported on 17 May that the number and magnitude of earthqaukes at Planchón-Peteroa had gradually declined during the past months, reaching baseline levels. Minor to no surface activity was noted. OVDAS-SERNAGEOMIN lowered the Alert Level to Green (the lowest level on a three-color scale), and ONEMI canceled the Yellow Alert for the communities of Molina (66 WNW), Curicó (68 km NW), Romeral (75 km NW), and Teno (68 km NW) that had been in place since 1 July 2016.
Source: Oficina Nacional de Emergencia-Ministerio del Interior (ONEMI)
Based on Observatorio Volcanológico de los Andes del Sur (OVDAS) observations, on 1 July SERNAGEOMIN reported that seismicity at Planchón-Peteroa had begun increasing above baseline levels on 16 June; during 16-30 June the seismic network detected 944 volcano-tectonic events and 1,635 long-period events. The Alert Level was raised to Yellow.
Sources: Servicio Nacional de Geología y Minería (SERNAGEOMIN); Oficina Nacional de Emergencia-Ministerio del Interior (ONEMI)
Based on Observatorio Volcanológico de los Andes del Sur (OVDAS) observations, SERNAGEOMIN reported an increase in the number of long-period earthquakes at Planchón-Peteroa beginning on 15 January. On 22 January the Alert Level was raised to Yellow.
Source: Servicio Nacional de Geología y Minería (SERNAGEOMIN)
Based on SIGMET notices, the Buenos Aires VAAC reported that during 24-25 June ash plumes from Planchón-Peteroa rose to an altitude of 4.6 km (15,000 ft) a.s.l. and drifted W, NE, and E. On 27 June satellite imagery showed a gas-and-steam plume, possibly containing ash, drifting 110 km NW.
Source: Buenos Aires Volcanic Ash Advisory Center (VAAC)
SERNAGEOMIN reported that, based on video camera data, photographs, and observations during an overflight on 4 May, activity at Planchón-Peteroa was relatively stable during 30 April-8 May. Explosions lasting about 30 seconds produced ash plumes that rose at most 1 km above the crater and drifted tens of kilometers E, NE, NNE, NNW and NW. During 4-5 May material fell in Minera Río Teno (about 70 km NW) and Las Leñas, Argentina (45 km ENE). The Alert Level remained at Level 3, Yellow. Based on ODVAS web camera observations, the Buenos Aires VAAC reported that on 9 May gas-and-ash plumes rose to an altitude of 4.3 km (14,000 ft) a.s.l. and rapidly dissipated to the SE.
Sources: Buenos Aires Volcanic Ash Advisory Center (VAAC); Servicio Nacional de Geología y Minería (SERNAGEOMIN)
SERNAGEOMIN reported that during 1-15 April a camera installed in Romeral, approximately 61 km NW of Planchón-Peteroa, recorded predominantly white vapor plumes that rose at most 600 m. During 16-19, 21 and 25-29 April episodes of ash-plume production changed from discreet plumes to more continuous emissions. Ash plumes during 17-19 and 29 April rose 1.2 km and contained ash- to lapilli-sized particles. During overflights on 26, 27, and 29 April, a geologist noted that the crater geometry and fumarolic activity had changed very little during the previous few months and that ash emissions drifted mainly SW. SERNAGEOMIN stated that because ash-and-gas emissions were becoming almost continuous, the Alert Level was raised to Level 3, Yellow on 29 April. Based on analyses of satellite imagery, SIGMET notices, and ODVAS web camera observations, the Buenos Aires VAAC reported that during 2-3 May gas-and-ash plumes rose to altitudes of 4.6-5.5 km (15,000-18,000 ft) a.s.l. and drifted NE and E.
Sources: Buenos Aires Volcanic Ash Advisory Center (VAAC); Servicio Nacional de Geología y Minería (SERNAGEOMIN)
Based on a SIGMET notice, the Buenos Aires VAAC reported that on 26 April an ash plume from Planchón-Peteroa rose to an altitude of 5.8 km (19,000 ft) a.s.l. and drifted E.
Source: Buenos Aires Volcanic Ash Advisory Center (VAAC)
Based on a SIGMET notice, the Buenos Aires VAAC reported that on 17 April an ash plume from Planchón-Peteroa rose to an altitude of 4.6 km (15,000 ft) a.s.l. and drifted NE. Ash was not observed in satellite imagery.
Source: Buenos Aires Volcanic Ash Advisory Center (VAAC)
Based on a SIGMET notice, the Buenos Aires VAAC reported ash from an eruption of Planchón-Peteroa on 26 March. Ash was not observed in satellite imagery.
Source: Buenos Aires Volcanic Ash Advisory Center (VAAC)
Based on SIGMET notices, the Buenos Aires VAAC reported that during 17-18 March ash plumes from Planchón-Peteroa rose to altitudes of 3-4.3 km (10,000-14,000 ft) a.s.l. and drifted SE. On 18 March a diffuse steam-and-gas plume was visible in the ODVAS web camera.
Source: Buenos Aires Volcanic Ash Advisory Center (VAAC)
Based on SIGMET notices, the Buenos Aires VAAC reported that on 17 February an ash plume from Planchón-Peteroa rose to altitudes of 3-4.3 km (10,000-14,000 ft) a.s.l. and drifted SE.
Source: Buenos Aires Volcanic Ash Advisory Center (VAAC)
On 11 November, SERNAGEOMIN reported that seismicity from Planchón-Peteroa remained low. Observations from multiple sources, including a web camera and satellite images, showed that the height of the gas plume was lower than the previously reported height of 200 m, observed during 15-25 October. The Alert Level was lowered to 2, Green.
Source: Servicio Nacional de Geología y Minería (SERNAGEOMIN)
SERNAGEOMIN reported that during 15-25 October seismic activity from Planchón-Peteroa was low. Observations based on images from a camera installed in the town of Romeral (approximately 60 km NW) and photos sent by staff from a mining company (65 km WNW) showed that plume color changed from gray to white on 13 October. The plume was smaller, with heights of less than 200 m above the crater. Satellite imagery analyses corroborated the ground-based observations. On 27 October, the Alert Level was lowered to 3, Yellow.
Source: Servicio Nacional de Geología y Minería (SERNAGEOMIN)
Based on SIGMET notices, the Buenos Aires VAAC reported that on 12 October an ash plume from Planchón-Peteroa drifted E at an altitude of 4.6 km (15,000 ft) a.s.l.
Source: Buenos Aires Volcanic Ash Advisory Center (VAAC)
SERNAGEOMIN reported that during an overflight of Planchón-Peteroa on 30 September scientists observed an ash plume that rose 400 m and drifted E, diffusing over a wide area of Argentina. Parts of the ash plume drifted E and then NE, traveling tens of kilometers with an altitude as high as 6 km (19,700 ft) a.s.l. Also, a diffuse plume drifted S and SE at an altitude of 3 km (10,000 ft) a.s.l. On 1 October an ash plume drifted N and NW as far as Los Queñes, 30 km NW. A sulfur odor was also reported in Los Queñes. Based on analyses of satellite imagery, pilot observations, and SIGMET notices, the Buenos Aires VAAC reported that during 6-12 October ash plumes from Planchón-Peteroa rose to altitudes of 3-6.1 km (10,000-20,000 ft) a.s.l. and drifted in multiple directions. The Alert Level remained at 4, Yellow.
Sources: Buenos Aires Volcanic Ash Advisory Center (VAAC); Servicio Nacional de Geología y Minería (SERNAGEOMIN)
Based on analyses of satellite imagery, pilot observations, and SIGMET notices, the Buenos Aires VAAC reported that during 30 September-3 October ash plumes from Planchón-Peteroa rose to altitudes of 3-6.1 km (10,000-20,000 ft) a.s.l. and drifted NW, NNE, E, and SE.
Source: Buenos Aires Volcanic Ash Advisory Center (VAAC)
Based on analyses of satellite imagery, the Buenos Aires VAAC reported that on 26 September an ash plume from Planchón-Peteroa rose to an altitude of 4.3 km (14,000 ft) a.s.l. and drifted SSE.
Source: Buenos Aires Volcanic Ash Advisory Center (VAAC)
According to NASA's Earth Observatory, a satellite image of Planchón-Peteroa shows an ash plume drifting 22 km SE on 18 September and ashfall on the snow beneath the plume. The Buenos Aires VAAC reported that according to a SIGMET issued on 21 September an ash plume rose to an altitude of 6.1 km (20,000 ft) a.s.l and drifted SE. Ash was not identified in satellite imagery. The Alert Level remained at 4, Yellow.
Sources: Buenos Aires Volcanic Ash Advisory Center (VAAC); NASA Earth Observatory
SERNAGEOMIN reported that an overflight of Planchón-Peteroa on 7 September revealed that the explosions the day before were possibly phreato-magmatic in origin and similar to the explosions in 1991. Pulses of gas and ash had occurred every 40-60 seconds during the eruption. Plumes rose 200 m above the crater and ash mostly fell within 10 km to the E. During 10-13 September, plumes rising from the vent had progressively less ash and higher concentrations of water vapor. On 13 September, SERNAGEOMIN reported that petrographic and mineralogical studies of the ash indicated no juvenile components. The Alert Level remained at 4, Yellow.
Source: Servicio Nacional de Geología y Minería (SERNAGEOMIN)
SERNAGEOMIN reported that on 6 September an explosive eruption from Planchón-Peteroa produced an ash plume that rose 1.2 km above the complex and drifted mainly E to a distance of 30 km, with some parts of the plume going N and S. That same day SERNAGEOMIN received pictures from Romeral (approximately 61 km NW) that showed ash-and-gas plumes rising 200 m.
Source: Servicio Nacional de Geología y Minería (SERNAGEOMIN)
Based on a pilot observation, the Buenos Aires VAAC reported that on 28 July a gas plume from Planchón-Peteroa drifted E.
Source: Buenos Aires Volcanic Ash Advisory Center (VAAC)
Based on pilot reports and photographs SERNAGEOMIN reported on 13 January that fumarolic plumes from Planchón-Peteroa rose 250 m high on 4, 6, and 7 January. Increased fumarolic activity is common on the warmest days in the summer when snow melts in the crater and more steam is produced.
Source: Servicio Nacional de Geología y Minería (SERNAGEOMIN)
On 14 May, ONEMI reported that increased fumarolic activity at Planchón-Peteroa was normal and likely caused by atmospheric changes that made the plumes more visible from greater distances. Increased fumarolic activity is common when snow melts in the crater and more steam is produced.
Source: Oficina Nacional de Emergencia-Ministerio del Interior (ONEMI)
The Buenos Aires VAAC reported that based on SIGMETs, increased fumarolic activity occurred at Planchón-Peteroa and Cerro Azul beginning on 26 January. Servicio Nacional de Geología y Minería clarified that intense fumarolic activity only occurred at Planchón-Petero around 25 January. Increased fumarolic activity is normal during the summer when snow melts in the crater and more steam is produced.
Sources: Buenos Aires Volcanic Ash Advisory Center (VAAC); Servicio Nacional de Geología y Minería (SERNAGEOMIN)
Reports are organized chronologically and indexed below by Month/Year (Publication Volume:Number), and include a one-line summary. Click on the index link or scroll down to read the reports.
New fumarole field; plume emission
On 31 January from 0700 to 1000 a well-defined vertical fumarolic plume rising from the summit area was visible from a highway 70 km W (Route 5 south). The white plume was ~ 50 m wide and 300 m high. Humidity was high, air temperature was low and there was no wind. On 16 February geologist Don Tormey visited the summit and observed a new fumarole field of 40-50 vents that are ~20 cm in diameter, covering a 100 m2 area. New hydrothermal salt deposits covered the field and strongly acidic gases were emitted with water vapor. The site of the fumaroles was near the cone that extruded the 1937 lava flow.
Information Contacts: H. Moreno, Univ de Chile, Santiago, Chile; D. Tormey, Massachusetts Institute of Technology, USA.
Ash eruption to 1 km; drinking water contaminated; fish killed
At 0140 on 9 February, a tephra eruption began at Planchón-Peteroa, a large basaltic to dacitic volcanic complex on the Chile-Argentina border roughly 200 km S of Santiago (figure 1). The eruption was continuing at press time (15 February), with no notable changes in eruptive style. No lava emission has been observed; the most recent lava flow, a mafic andesite, was erupted in February 1937.
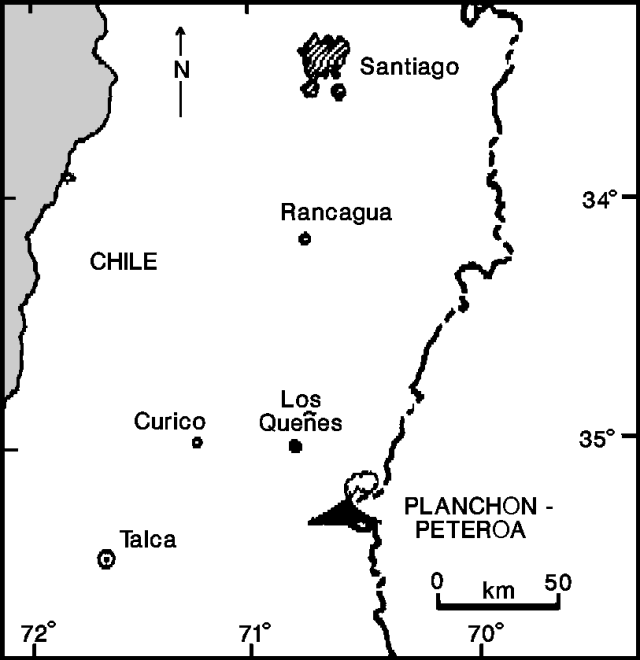 |
Figure 1. Map showing the location of Planchón-Peteroa. Courtesy of M. Gardeweg. |
Police in Carrizales (25 km NW) reported weak felt seismicity, followed by an explosion and the ejection of a brown column of gas and ash. No further seismicity was felt but there were no seismographs in the area. The eruption column averaged 400-700 m high and seldom exceeded 1,000 m. It was mainly formed by abundant pulses of vapor, with smaller, dense pulses of ash occurring every 10-15 minutes. The latter were audible 600-700 m from the crater. A weak sulfur odor was reported. Oscar González-Ferrán described the activity during his 11 February overflight as a low-level phreatomagmatic eruption.
The plume traveled ENE into Argentina, at an altitude of roughly 5,000-6,000 m. NOAA weather satellite images on 11 February showed the plume extending 80 km E and ~ 30 km N-S. A change in wind direction on 13 February caused ashfall as far as 70 km W of the crater, alarming area residents.
Large numbers of fish were killed in the Claro and Teno rivers, and the water supply for Los Queñes (population ~1,200), 35 km NW of the volcano, was contaminated. Contamination of the Río Claro may have occurred during the initial phase of the eruption, as water ejected from the crater lake, mixed with ice and tephra, entered the river (figure 2). Analyses of water taken from the Teno and Claro on 9 February showed notable increases in Fe and Mn contents, increases in turbidity, and a lowering of pH (table 1). Decreased contamination levels were noted 2 days after the start of the eruption. Potable water continued to be shipped to Los Queñes by special trucks. Ash now covers the small ice fields surrounding the active crater, and mixing of ash and melt from these fields may have caused additional contamination. Possible increases in eruptive activity and increased snowmelt caused by the ash cover present potential lahar hazards.
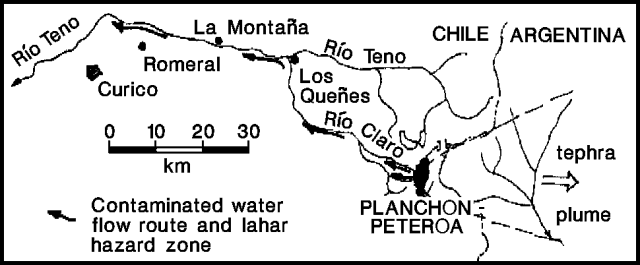 |
Figure 2. Sketch showing Planchón-Peteroa drainage, route of water contamination, and plume orientation, 11 February 1991. Courtesy of O. González-Ferrán. |
Table 1. Analyses of Los Queñes water from the Claro and Teno rivers by Empresa de Servicios Sanitarios del Maule S.A., NW slope of Planchón-Peteroa, February 1991. Standard column is the Chilean standard set by the Instituto Nacional de Normalizacion. Courtesy of M. Gardeweg.
| Date | Standard | Baseline | 09 Feb 1991 | 11 Feb 1991 | 11 Feb 1991 |
| River | -- | Teno | Claro | Claro | Teno |
| pH (30°C) | 5.9 | 7.7 | 3.7 | 5.6 | 6.95 |
| Fe (total mg/l) | 0.3 | 0.2 | 219.8 | 27.9 | 0.14 |
| Mn (mg/l) | 0.1 | less than 0.1 | 0.6 | 0.59 | 0.05 |
| Chlorides (mg/l) | 250 | 20.6 | 274.4 | 61.7 | 46.6 |
| CaCO3 (mg/l) | -- | 59.4 | 335 | -- | 109 |
| Conductivity | 395 | 14.2 | 1500 | 580 | 400 |
| Turbidity (NTU) | 5 | 1.7 | 3150 | 800 | 8.2 |
| Comments | -- | odorless | sulfur odor, ash | ash | odorless |
The eruption crater (200 m in diameter, within a 500-m-diameter crater), is in a depression between the cones of Planchón and Peteroa (figures 3 and 4). The larger crater has a rim elevation of 3,490 m and was the site of explosive activity during 1959, 1960, and 1967. On 25 March 1985, the inner crater was partially filled by a sulfurous lake (150 m in diameter), but no other activity was observed. A new fumarole field (100 m2 in area) was noted 16 February 1987 near the source of the 1937 lava (Moreno and Tormey, 1987, and 12:3). Lavas as old as 0.55 million years are found in the complex, which also includes products from Azufre volcano . . . to the SE (Tormey and others, 1989). The structure of the edifice is complicated by at least two syn-volcanic glaciations and a large debris avalanche (the "Teno Lahar") that removed a sector of Planchón.
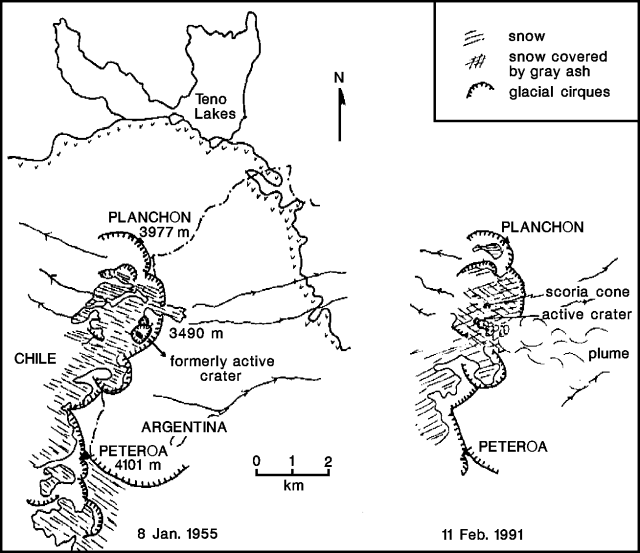 |
Figure 3. Sketch maps of the summit of Planchón-Peteroa based on 8 January 1955 (left) and 11 February 1991 (right) aerial photos. Courtesy of M. Gardeweg. |
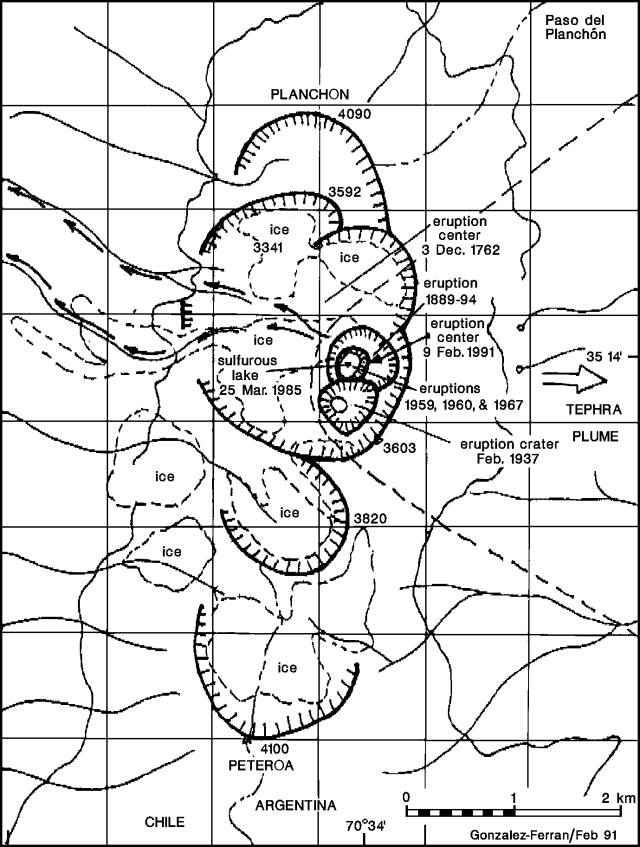 |
Figure 4. Sketch map showing the summit region and craters of Planchón-Peteroa, February 1991. Courtesy of O. González-Ferrán. |
References. Moreno R., H. and Tormey, D., 1987, New fumarolic activity at Peteroa volcano: EOS, v. 68, p. 500.
Tormey, D., Frey, F., and López-Escobar, L., 1989, Geologic history of the active Azufre - Planchón-Peteroa Volcanic Center (35°15'S, southern Andes) with implications for the development of compositional gaps: Asoc. Geol. Arg. Rev. XLIV (1-4), p. 420-430.
Information Contacts: Moyra Gardeweg, SERNAGEOMIN, Santiago; Oscar González-Ferrán, Univ de Chile; SAB.
Unrest including ashfall and SO2 emissions in November 1998
Information from the city of Romeral's Emergency Office indicated that Planchón-Peteroa emitted noteworthy amounts of SO2 in October 1998 and showed signs of unrest in November 1998. Apparently, small phreatic eruptions produced minor explosions. Ash fell on Carrizales, ~8 km NW of the volcano, on 18 and 21 November, and fumaroles were observed from Carrizales on 24 November along with an intense SO2 odor. A local herdsman observed fine ashfall and intense fumaroles on 18 November and reported that fumes continued up to 24 November when he came down from the volcano. No seismic activity was felt. On 30 November, observers at ~3,050 m elevation on the E flank saw no fresh ash.
The volcano last erupted in February 1991 producing a 500-1,000 m column of gas and dispersing fine ash as far as 30 km ESE of the volcano.
Information Contacts: José Antonio Naranjo, Programa Riesgo Volcánico Servicio Nacional de Geología y Minería, (SERNAGEOMIN), Av. Santa María 0104, Casilla 10465, Santiago, Chile.
Increased fumarolic activity during January-February 2001
Increased fumarolic activity was reported at Planchón-Peteroa (figure 5) during January and February 2001. There have been no reports of anomalous activity at the volcano since November 1998 when small phreatic eruptions produced explosions that deposited ash up to ~8 km NW of the volcano (BGVN 24:03).
 |
Figure 5. Map showing the location of Planchón-Peteroa (originally in BGVN 16:01). Courtesy of M. Gardeweg, SERNAGEOMIN. |
The first report of possible renewed volcanic activity was made on 12 December 2000 when observers on a commercial flight traveling S past Planchón-Peteroa saw steam rising from a fumarole to heights of 150-200 m and extending ~1 km SSE. The activity was considered normal for the time of year.
Patricia Sruoga of the Servico Geológico Argentino reported that during late January to early February the altitude of steam emitted from fumaroles on Planchón-Peteroa was higher than was observed in 1996 and during trips to the volcano on 3 February and 3 March 1999. She also reported that there was an increase in the frequency of steam emission. The observations were made from Gendarmerie, 6 km E of the volcano. On 6 February observations made from a commercial flight heading S of the volcano revealed that steam from a fumarole rose to a height of ~150 m and extended a little more than 0.5 km toward the E. On 12 February another sighting of steam was made from a commercial aircraft in the area of Curicó (figure 5). Based on the general location, the steam was determined to have originated from one of Planchón-Peteroa's fumaroles.
Information provided by José Piña from the Emergencia de la Municipalidad de Romeral confirmed that during the first couple of weeks of February there was indeed an increase in fumarolic activity. According to an observer in the area, since December 2000 there had been an increase in steam-and-gas emissions from the volcano along with a strong sulphur odor that was especially strong during the night. Piña visited the E flank of the zone of craters and discovered that there was a reddish material on the snow. He determined that the material was deposited through aeolian action, which is common due to strong winds in the area. He also noted that there was intense fumarolic activity at the NE crater, with fumarolic plumes rising up to 300 m above the volcano's W flank. In addition, steam rose up to 100 m high as it escaped from the 1991-92 crater on the E flank. Occasionally there was a strong odor of sulfur and underground noises. Piña also noticed fumaroles on the top of Morro Planchón, whose plumes rose ~3.9 km high. These types of fumaroles were thought to be fed by melted snow that drips through fractures. On 16 February observations from a commercial aircraft traveling towards the N revealed that 500-m-high white fumarolic emissions extended ~1 km towards the SE. GOES imagery of the area in January and February did not show thermal anomalies aside from the normal variations between day and night.
Based on the aforementioned information, the Departamento Geología Aplicada of the Servicio Nacional de Geología y Minería (SERNAGEOMIN) concluded that the increase in fumoralic activity during January and February in comparison to previous years at Planchón-Petero was due to phreatic water produced by the underground infiltration of melted snow. There was an increase in water in the area because there was a greater amount of snow accumulation during 2000 than in previous years. There appeared to be more steam emitted from Planchón-Peteroa's fumaroles than usual due to the reduction in atmospheric temperature at that time of the year and/or the greater ambient humidity causing the water vapor to condense. Although the increase in fumarolic activity was not determined to be of magmatic origin, SERNAGEOMIN noted that the abundance of water could trigger small phreatic explosions that could potentially emit ash and larger pyroclasts. In addition, water that originates from the zone of craters and travels via the Claro River could be contaminated. SERNAGEOMIN recommended that the Claro River should be monitored to determine if contamination occurs and that flights over the volcano should be conducted in order to photograph variations in fumarolic activity. SERNAGEOMIN plans to seismically monitor the E flank of the volcano in order to detect possible microseismicity.
Information Contacts: José Antonio Naranjo, Jefe, Departamento Geología Aplicada, Servicio Nacional de Geología y Minería (SERNAGEOMIN), Avda. Santa Maria 0104, Casilla 1347, Santiago, Chile (URL: http://www.sernageomin.cl/).
Small eruptions begin in September 2010 after 12 years of quiet
Explosive eruptions began at Planchón-Peteroa volcano in early September 2010, generating plumes reported to have reached altitudes of over 7 km. From the time of our last report on the volcano in March 2001 (BGVN 26:03) into 2010, we have learned of no significant eruptive activity as reported by Servicio Nacional de Geología y Minería (SERNAGEOMIN - the Chilean National Service of Geology and Mining). On several occasions during this ~9-year period, increased fumarolic activity was reported at Planchón-Peteroa. It was typically described as being normal and likely caused by atmospheric changes that made the plumes more visible from greater distances. This increased visible activity was also reported as being common when snow melts in the crater and more steam is produced. The volcano's previous reported eruption occurred in November 1998 (BGVN 24:03).
Beginning 6 September 2010, the ice-covered volcano erupted in a series of small ash and gas clouds (table 2). SERNAGEOMIN reported that the eruptions were probably phreatomagmatic (caused by the interaction of water with magma at depth inside the volcano). During the day, black pyroclastic eruptions reached altitudes of up to 1.2 km above the crater area, and a plume extended ~30 km to the E and, to a limited extent, to the N and S. Pictures from Romeral (about 61 km NW of the volcano) showed emission of gases and gray ash that rose ~200 m. The same day at 0647, SERNAGEOMIN recorded an M 5.2 earthquake at 13.4 km depth, located ~15 km SE of the volcano. According to SERNAGEOMIN, an overflight on 7 September revealed that the 6 September explosions, during which pulses of gas and ash occurred every 40-60 seconds, were possibly phreato-magmatic in origin and similar to the explosions in 1991. Plumes rose 200 m above the crater and ash mostly fell within 10 km to the E.
Table 2. Ash and gas plumes from Planchón-Peteroa as reported by SERNAGEOMIN (abbreviated SERN in table) and Buenos Aires Volcanic Ash Advisory Center (VAAC) from January-October 2010.
| Date | Plume height (km) | Plume drift | Report source | Comments |
| 04, 06, 07 Jan 2010 | 0.25 | -- | SERN | Fumarolic plume only. |
| 28 Jul 2010 | -- | E | VAAC | Gas plume only. |
| 06 Sep 2010 | 0.2-1.2 | 10-30 km E, N, S | SERN | Phreatomagmatic explosions; pulses of gas and ash every 40-60 sec during the eruption. |
| 10 Sep-13 Sep 2010 | -- | -- | SERN | With time, plumes rising from the vent had progressively less ash and higher concentrations of water vapor; juvenile material absent in ash petrographic and mineralogical studies. |
| 18 Sep 2010 | -- | 22 km SE | NASA Earth Observatory | Eruption intensified; ash on snow under plume. |
| 21 Sep 2010 | 6.1 | SE | VAAC | Ash plume. |
| 26 Sep 2010 | 4.3 | SSE | VAAC | Ash plume. |
| 30 Sep-03 Oct 2010 | 3-6.1 | Multiple directions | VAAC | Strongest emission of the past 3 weeks. Ash plume diffused over wide area of Argentina. |
| 06 Oct-12 Oct 2010 | 4-6.1 | Multiple directions | VAAC | Ash plume. |
| 12 Oct 2010 | 4.6 | E | VAAC | Ash plume. |
During 16-30 September 2010, SERNAGEOMIN stated that monitoring data at Planchón suggested the presence of a magmatic body interacting with the volcano's surface hydrothermal system, resulting in smaller eruptions. During this period there were a total of 348 seismic events (attributed to rock fracture) and continuous tremor (attributed to the passage of fluids inside the volcano).
The eruption and resulting plume intensified on 18 September. The volcano is on the border between Chile and Argentina, and satellite imagery showed that the majority of the ash dispersed SE into Argentina. NASA's Earth Observatory website featured a view of the snow-covered ash on 18 September 2010.
Figure 6 shows a dark ash plume rising on 21 September 2010 from Peteroa, the active crater in the complex. An aqua-colored acid lake appears to the NE of Peteroa. Most of the surrounding high-altitude landscape is covered in snow, but fresh ash covered large areas of that snow. Valleys and N-facing (sun-warmed) slopes are snow free, revealing bare brown rocks.
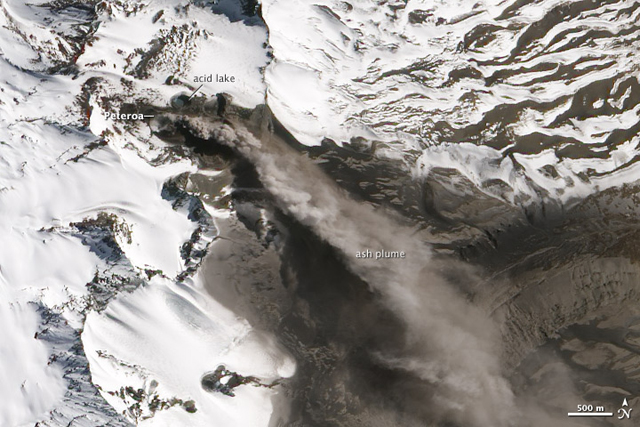 |
Figure 6. This natural-color satellite image of Peteroa crater was acquired on 21 September 2010 by the Advanced Land Imager (ALI) aboard the satellite Earth Observing-1 (EO-1). NASA Earth Observatory image and analysis by Robert Simmon, using ALI data from the NASA EO-1 team. Courtesy of NASA Earth Obseratory Natural Hazards web site. |
On 30 September, SERNAGEOMIN officials flew over the volcano and observed modest pyroclastic eruptions, emissions slightly stronger than those observed for during the previous 3 weeks. The eruptive activity remained constant from the SW crater, which discharged a relatively dense column of ash, gases, fumes, and water vapor. The emission of ash and gas was maintained from the bottom NE edge of the SW crater, but it was more continuous, dense, and vigorous than that observed during the overflight on 7 September 2010. The 30 September ash column emerged from the crater and attained a height ~400 m above the volcano, and spread to the E over a wide area in Argentina. During the 30 September overflight, observers noted a major part of ash plume distributed to the E and then bending to the NE, extending some tens of kilometers, with estimated plume-top altitudes of up to 6 km. A trace, more-dilute plume stretched to the S and SE to maximum altitudes of ~3 km.
On the morning of 1 October 2010, warm, easterly winds (called Puelche-type winds) carried ash and sulfurous smells to the town of Los Queñes (~30 km NE of the volcano). During 6-12 October ash plumes rose to altitudes of 3-6.1 km and drifted in multiple directions. Observations from Romeral and photos sent by staff from a mining company (65 km WNW) showed that plume changed from gray to white on 13 October. The plume was smaller, with heights of less than 200 m above the crater. The Alert Level 4 was continued, before being lowered to Alert Level 3 on 27 October and then to Alert Level 2 on 11 November. The MODVOLC thermal alert system had not detected any thermal anomalies since at least 2000.
Information Contacts: Servicio Nacional de Geología y Minería (SERNAGEOMIN); Buenos Aires Volcanic Ash Advisory Center (VAAC) (URL: http://www.smn.gov.ar/vaac/buenosaires/productos.php); NASA Earth Obseratory (URL: http://earthobservatory.nasa.gov/); MODIS/MODVOLC Hot Spot web site, Hawai'i Institute of Geophysics and Planetology (HIGP) Thermal Alerts System, School of Ocean and Earth Science and Technology (SOEST), University of Hawai'i, 2525 Correa Road, Honolulu, HI (URL: http://modis.higp.hawaii.edu/).
February-June 2011 eruption; ashfall in local towns in May 2011
The last Bulletin report (BGVN 35:11) detailed an explosive eruption that began with gas-and-ash explosions in September 2010 and ended in mid-October 2010. Renewed activity began in February 2011 and continued through June 2011. In this report, we highlight the significant ash events from early-to-mid 2011 as well as the continuous monitoring efforts of Servicio Nacional de Geología y Minería (SERNAGEOMIN) during 2011-2013.
During 17 February-27 June 2011, unrest was detected from Planchón-Peteroa and significant meteorological information (SIGMET) notices were distributed by the Buenos Aires Volcanic Ash Advisory Center (VAAC) (table 3). Ash plumes were reported once or twice a month during this time period, although satellite images were not able to detect many of the events. Ash and gas plumes became continuous during late April, and ash plumes rose as high as 5.8 km altitude on 26 April. On 29 April, SERNAGEOMIN raised the Alert Level to 3 (Yellow).
Table 3. Emissions from Planchón-Peteroa during 18 February-27 June 2011. The Observatorio Volcanológico de los Andes del Sur (OVDAS) maintained a web-camera that contributed to numerous direct observations of emissions and is frequently listed as a source. Courtesy of Buenos Aires VAAC.
| Date | Altitude (km) | Drift Direction | Info Sources | Comments |
| 18 Feb 2011 | 4.3 | SE | SIGMET | No ash visible in satellite images. |
| 18 Mar 2011 | 4.3 | SE | SIGMET; ODVAS | Steam-and-gas plume visible from ODVAS web-camera. No ash visible in satellite images. |
| 26 Mar 2011 | -- | -- | SIGMET | No ash visible in satellite images. |
| 01-16 Apr 2011 | -- | -- | SERNAGEOMIN | White vapor plumes visible from the web-camera based in Romeral. |
| 17 Apr 2011 | 4.6 | NE | SIGMET | No ash visible in satellite images. |
| 18 Apr 2011 | 4.6 | NE | SIGMET | No ash visible in satellite images. |
| 26 Apr 2011 | 5.8 | E | SIGMET | No ash visible in satellite images. |
| 16-19, 21, 25-29 Apr 2011 | 4.2-6.4 | SW and NW | SIGMET; SERNAGEOMIN | Frequent ash plumes. Web-camera images captured plumes containing ash- to lapilli-sized particles during 17-19 and 29 Apr. |
| Alert Level 3 (Yellow) on 29 April 2011 | ||||
| 30 Apr 2011 | 4.2-6.4 | NW and N | SIGMET; SERNAGEOMIN | No ash visible in satellite images. |
| 01 May 2011 | 4-6.1 | NW | SIGMET | No ash visible in satellite images. |
| 02-03 May 2011 | 4.6-5.5 | NE and E | SIGMET; ODVAS | Ash-and-gas plumes. |
| 04-05 May 2011 | 4.3-7.3 | NW and ENE | SERNAGEOMIN; ODVAS | Overflight by SERNAGEOMIN on 4 May. No ash visible in satellite images. Ashfall was reported by proximal towns (see text). |
| 06 May 2011 | 4.6-5.5 | SE | GOES | A thin plume of ash, steam, and gas. |
| 07-10 May 2011 | 4.3-5.5 | SE | SERNAGEOMIN; ODVAS | Gas-and-ash plumes visible from ODVAS web-camera. No ash visible in satellite images. |
| Alert Level 2 (Green) on 13 June 2011 | ||||
| 24-25 Jun 2011 | 4.6 | W, NE, and E | SIGMET | No ash visible in satellite images. |
| 27 Jun 2011 | -- | NW | Buenos Aires VAAC | Gas-and-steam plumes possibly containing ash. |
Seismicity in April 2011 was dominated by volcano-tectonic (VT) events; 405 were detected, and locations were primarily concentrated in an area 25 km NE of the volcanic complex as well as along the N flank, ~6 km from the crater. Earthquakes were MC less than 2. Some tremor (RD of 3 cm2) and 30 long-period (LP) (RD 4 cm2) events were also detected that month. SERNAGEOMIN frequently reported seismic data in terms of RD, which is the value calculated from reduced displacements.
SERNAGEOMIN reported that ash emissions on 17, 18, and 29 April correlated with episodes of tremor with RD oscillating between 1 and 3 cm2. Overflights conducted on 26, 27, and 29 April determined that the active crater had not changed geometry and also appeared structurally stable (figure 7). The observers noted that tephra deposits from the previous explosions were notable SE and SW of the volcano. Deposits from the 29 April explosion were particularly easy to define during the overflight.
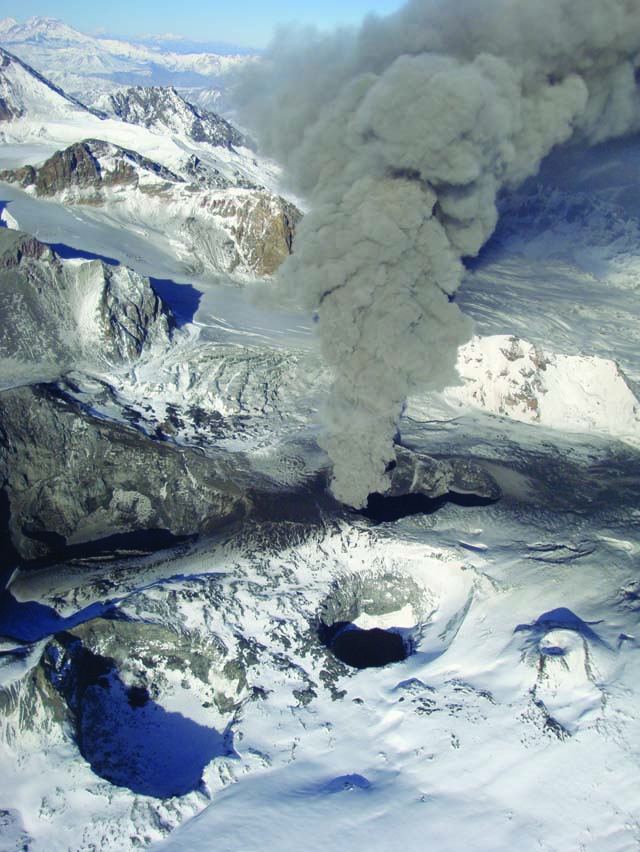 |
Figure 7. This photo of Planchón-Peteroa was taken during one of a series of overflights during 26, 27, and 29 April 2011. A column of ash rose from the active crater and tephra had visibly covered much of the snow immediately SE and SW of the crater. Courtesy of Orlando Rivera, Exploraciones Mineras Andinas S.A. |
Buenos Aires VAAC reported a significant ash plume detected by satellite images on 2 May 2011. The plume drifted between 4.9 and 5.5 km altitude toward the NE at ~7.7 m/s. The OVDAS web-camera also captured images of the plume appearing diffuse and ~3.7 km wide. The VAAC noted that the plume rapidly dissipated during 1315-1845 local time. The following day, continuous emissions of ash, steam, and gas were reported by SIGMET and the VAAC, although satellite images were not able to detect any emissions. By 1000, the VAAC reported SIGMET data for a plume that rose to 4.6-5.5 km altitude, moving E. At 1500, satellite images captured a diffuse and ~15 km wide ash plume. The plume drifted E at 5 m/s and had risen to 5.5 km altitude.
Elevated activity during 4-5 May produced ashfall that reached the towns of Minera Río Teno (about 70 km NW) and Las Leñas (in Argentina, 45 km ENE). An overflight conducted by SERNAGEOMIN confirmed continued ash emissions and explosions that occurred approximately every 30 seconds. The explosive activity rarely produced plumes higher than 1,000 m above the crater. Gray ash deposits were visible downwind of the crater; the wind tended to disperse tephra widely and the observers noted that wind directions were frequently directed to the E, NE, NNE, NNE, and NW. During 30 April-8 May, SERNAGEOMIN noted that seismicity included tremor (RD of 2-3 cm2) and VT earthquakes (ML less than 1.8).
Geologists from SERNAGEOMIN conducted an overflight of Planchón-Peteroa on 13 June 2011. RedMaule interviewed the observers who were on the helicopter which included representatives of SERNAGEOMIN and Oficina Nacional de Emergencia del Ministerio del Interior y Seguridad Pública (OMENI) as well as the mayor of Maule, Chile. The observers noted that persistent degassing continued; a low-level white plume (less than 400 m high), associated with fumarolic activity, was visible rising from the active crater (figure 8). SERNAGEOMIN concluded from the overflight that Alert Level 3 (Yellow) could be reduced to Alert Level 2 (Green/Normal); Alert Level 3 had been in effect since 29 April 2011.
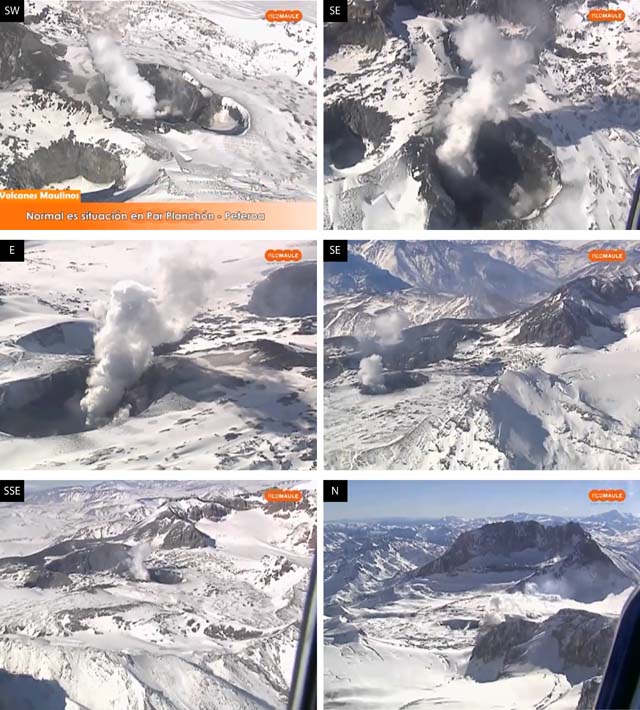 |
Figure 8. During an overflight of Planchón-Peteroa on 13 June 2011, few bare rocks were visible around the active crater due to snow-cover and ice; a low-level plume of white vapor rose from the crater. These six photos are stillshots taken from a video interview camera; note that the look direction varies in each photo with the approximate direction noted in the upper left corner of each photo. The tall peak of Planchón is visible in the background of the photo looking N. Courtesy of SERNAGEOMIN and RedMaule. |
The Buenos Aires VAAC released an ash advisory on 29 October 2011. Satellite images could not detect ash, but a SIGMET was available.
Activity during 2012. An approximate average of 400 earthquakes per month was detected in 2012, and roughly 75% of the events were VT while 25% were cataloged as LP events. The VT events were rarely larger than ML 3.0 and depths were in range of 4-10 km; these earthquakes were frequently clustered in groups that correlated with local faults. LP earthquakes were typically MD ≤ 2.0 and RD ≤ 2.9 cm2. SERNAGEOMIN reported tremor in April, May, November, and December (table 4). One notable seismic swarm occurred on 5 April. Approximately 123 VT earthquakes were detected during 0230-0730; these events were located ~20 km NE of the crater with depths less than 10 km. The largest earthquake was ML 1.7.
Table 4. Tremor was detected during four months in 2012. RD is the value calculated from the reduced displacements of seismicity. Courtesy of SERNAGEOMIN.
| Month | RD in cm2 |
| Apr 2012 | 1.1 |
| May 2012 | 1.1 |
| Nov 2012 | 0.6 |
| Dec 2012 | 0.3 |
On 30 October 2012, the Oficina Nacional de Emergencia del Ministerio del Interior y Seguridad Pública (OMENI) released a report highlighting several communities that would be included in the early warning system designed to report flood risks. The towns included Curicó, Romeral, and Teno, in the region Maule, which are especially vulnerable due to proximity to Planchón-Peteroa's major drainages (figure 9).
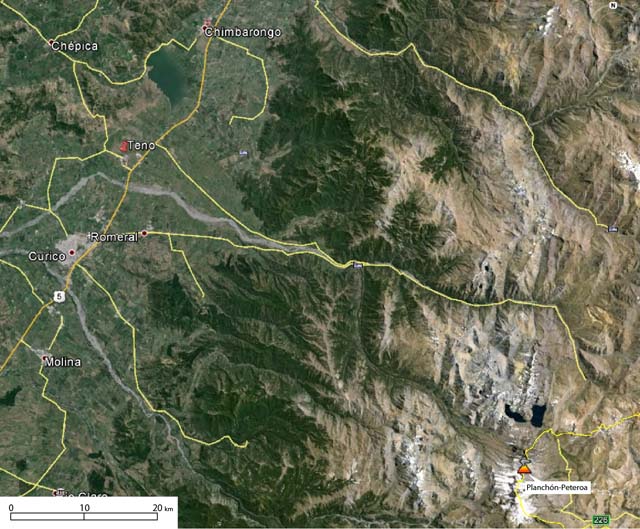 |
Figure 9. This Google Earth image includes the location of Planchón-Peteroa (lower right-hand corner), major towns, and primary roads. The background image is a composite of Landsat images from 2014. Note that the yellow line crossing through the volcanic center is the international border for Chile and Argentina. The scale is approximate. Courtesy of Google Earth. |
On 6 November 2012, the network of web-cameras captured images of a white plume rising from the crater. At 1620, the persistent plume rose to ~1.3 km and drifted NE. SERNAGEOMIN noted that this activity was related to fumarolic emissions.
Activity during 2013. During 2013, an approximate average of 200 earthquakes was detected per month. Of these events, ~80% were VT and ~20% were LP. Magnitudes and depths of the VT earthquakes were comparable to the previous year, although ML values were sparsely reported. LP seismicity was reported in ML, instead of MD and values were in range of 0.3 to 2.0. The reduced displacements (RD) of LP events were frequently reported on a monthly basis with values in range 0.3-8.4.
Tremor was rarely detected in 2013. SERNAGEOMIN reported six episodes of tremor, but these only occurred in January and the calculated RD was 0.5 cm2.
Information Contacts: Observatorio Volcanológico de los Andes del Sur-Servicio Nacional de Geologia y Mineria (OVDAS-SERNAGEOMIN), Avda Sta María No. 0104, Santiago, Chile (URL: http://www.sernageomin.cl/); Buenos Aires Volcanic Ash Advisory Center (VAAC) (URL: http://www.smn.gov.ar/vaac/buenosaires/productos.php); and Oficina Nacional de Emergencia del Ministerio del Interior y Seguridad Pública (OMENI) (URL: http://www.onemi.cl/index.html).
New eruption begins in September 2018; continuous ash emissions and intermittent explosions December 2018-February 2019
Planchón-Peteroa, a large basaltic to dacitic volcanic complex, lies on the remote Chile-Argentina border roughly 200 km S of Santiago, Chile. Its intermittent eruptive history has been characterized by short-lived explosive events with gas and ash plumes from active craters around the Volcán Peteroa area (figure 10). The most recent eruption, from February-June 2011, was a series of sporadic ash and gas plumes which rose as high as 5.5 km altitude and produced ashfall as far as 70 km away (BGVN 38:11). After seven years of little surface activity, a new series of ash emissions and explosive activity began in September 2018; a major seismic swarm in 2016 did not result in surface activity. Information for this report, covering through February 2019, was provided primarily by Servicio Nacional de Geología y Minería (SERNAGEOMIN), Observatorio Volcanológico de Los Andes del Sur (OVDAS) and the Buenos Aires Volcanic Ash Advisory Center (VAAC).
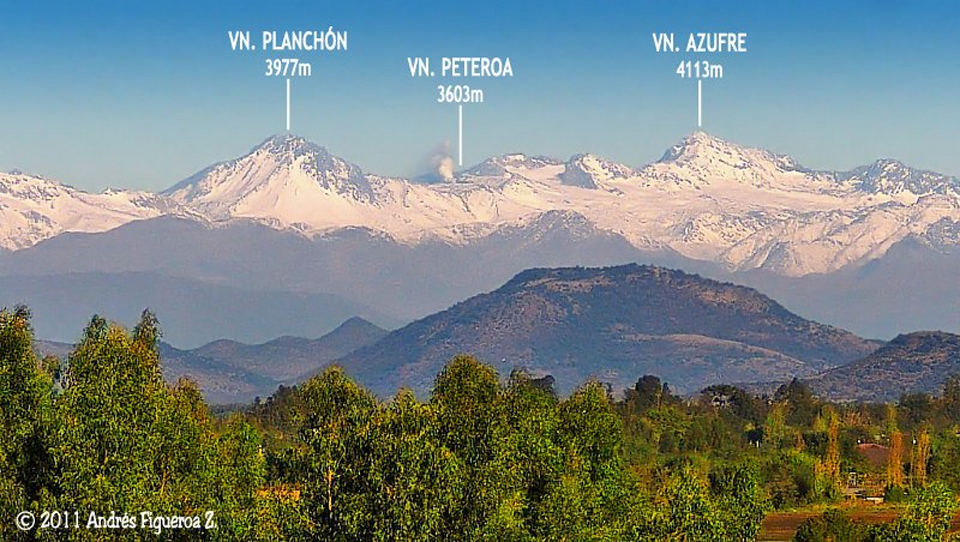 |
Figure 10. The Planchón-Peteroa volcanic complex was last active from February to June 2011, as seen in this image taken on 23 April 2011 from Santa Cruz de Colchagua, located 100 km NW. Image copyright by Andres Figueroa Z (HBOC), courtesy of Cumbres y Montañas de O'Higgins and used with permission from the photographer. |
Planchón-Peteroa remained quiet during 2014 and 2015. A significant seismic swarm during 2016 led SERNAGEOMIN to raise the alert level for nearly the entire year, although no surface eruptive activity took place. A smaller seismic event in 2017 also did not include surface activity. Increased emissions that included particulate material were first reported in September 2018; the first explosions with ash took place in early November 2018. Persistent emissions with dense plumes of ash began in mid-December and continued through February 2019; intermittent pulses and explosions during that time coincided with increased seismic and thermal activity.
Activity during 2014-2015. Background levels of volcano-tectonic (VT) and long-period (LP) earthquakes were reported by SERNAGEOMIN throughout 2014 and 2015. A single seismic event greater than M 3.0 was reported on 11 May 2014, located within 1 km of the crater. Inclinometer, SO2, and thermal data all indicated no significant changes during the period. During March-July 2015 sporadic fumaroles were observed rising less than 200 m from the active crater.
Activity during 2016. An increase in LP seismic events from a few to several hundred per month was noted by SERNAGEOMIN beginning in January 2016. As a result, they increased the Alert Level of the volcano from Green to Yellow on 22 January. The webcam revealed degassing of mainly water vapor reaching close to 200 m above the active crater. During the first two weeks of February 2016 the number of LP events increased ten-fold from 328 in January to 3,634; all the events were smaller than M 1.1. The rate of LP seismicity increased further during the last two weeks of February to 7,301 events, and the steam plumes reached 400 m above the crater. LP seismicity remained high during March with 9,627 measured events; similar numbers of events were sustained through May 2016 (figure 11).
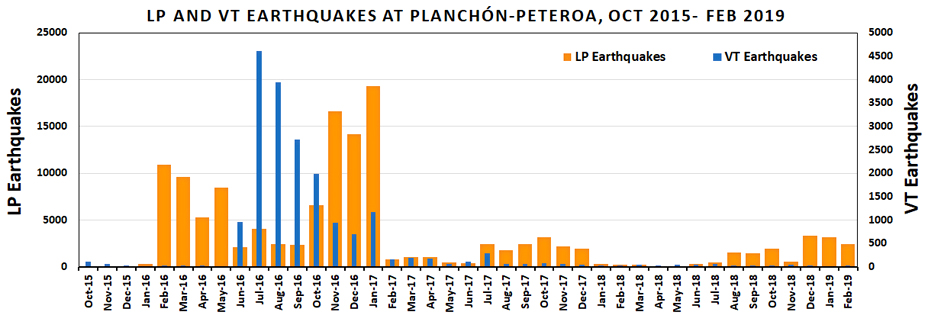 |
Figure 11. Seismicity at Planchón-Peteroa from October 2015 through February 2019. Two periods of increased seismicity were detected prior to 2018, although the only observed changes in surface activity were slight increases in the height and intensity of the steam plumes. The first event, from January 2016-January 2017 included periods with very high numbers of both VT and LP events at different times during the year. The second period of increased seismicity was from July to December 2017; the numbers of VT events were elevated briefly in July, but the LP event numbers remained elevated through December. The number of LP seismic events began increasing again in July 2018; the first particulate emissions were noted in September, and significant explosions with ash began in November 2018. Note two vertical axes on graph, the left represents numbers of LP seismic events in orange, the right represents the number of VT seismic events in blue. Data courtesy of SERNAGEOMIN. |
LP seismicity decreased substantially to only 470 events during the first two weeks of June 2016, leading SERNAGEOMIN to reduce the Alert Level to Green. However, during the second half of June a spike in the VT events from 8 during the first half of the month to 944 caused authorities to raise the Alert Level back to Yellow. This increase in VT seismic events was also accompanied by an increase in the number and spectral frequency of the LP events. They changed from having dominant frequencies between 1.9 and 2 Hz to 4-5 Hz, with a location that moved closer to the crater zone than before, and occurred at depths of around 1.5 km. On 28 June a M 3.4 VT event occurred 4.3 km NNE of the crater at a depth of 4.8 km. LP events numbered between 2,100 and 4,100 events monthly during June-September.
VT seismic events increased to their highest levels of 2016 during July (4,609 events) before beginning a gradual decline through the end of the year, ending with about 700 events in December (figure 11). A strong steam plume rose 550 m above the crater on 4 July 2016 and was accompanied by 400 VT events. The number of LP events increased significantly for the second time during the year beginning in October and remained over 14,000 events through January 2017. Three seismic events with local magnitude (ML) greater than M 3.0 were recorded on 7, 12, and 16 October; the locations of the events were approximately 3 km NNW at an average depth of 5 km. A M 3.4 event was recorded on 19 November. Low-level steam plumes did not rise more than 200 m above the crater for the remainder of the year. SERNAGEOMIN installed two new seismic stations, on 29 November and 15 December 2016.
Activity during 2017. Levels of both VT and LP seismic events declined during January-May 2017. A M 3.5 VT earthquake on 19 February was located 3.7 km NNW of the crater and 4.5 km deep. On 28 March, a M 3.6 event occurred in a similar location. Steam plumes occasionally rose as high as 200 m during the period. SERNAGEOMIN lowered the Alert Level to Green on 17 May 2017 based on the gradual decrease in seismicity to baseline levels accompanied by little to no surface activity.
A seismic swarm of 39 events on 15 June was located 14 km SE and 8-10 km deep. VT seismic events during the first half of July 2017 were located 4-7 km deep under the summit craters and included a M 4.0 event on 8 July. An increase in both VT and LP seismicity in early July led SERNAGEOMIN to raise the Alert Level to Yellow on 10 July (figure 11). The monthly number of VT events dropped below 100 in August and remained low for the rest of the year. A M 3.5 VT event was reported on 5 November, located 6.5 km E and 6 km deep. On 14 November seismometers recorded a 30-minute tremor event. A brief increase in degassing began on 23 November; steam plumes reached 600 m the next day but returned to less than 150 m by the end of the month. SERNAGEOMIN lowered the Alert Level to Green in mid-December 2017 as a result of decreased surface and seismic activity.
Activity during 2018. Low levels of surface and seismic activity persisted into early June 2018. Steam plumes rose no more than 500 m above the crater, numbers of VT events remained low, and the numbers of LP events decreased steadily. In mid-May the amplitude of continuous tremor events began to increase. The frequency of the tremor events had been around 1-2 Hz earlier in the year, but beginning on 21 June they increased to around 5 Hz; this was accompanied by an oscillating amplitude seismic signal referred to as "banded tremor." SERNAGEOMIN interpreted the increase in amplitude and the banded tremor as an indication of increased heat in the system, and as a result raised the Alert Level to Yellow on 6 July 2018. The number of LP seismic events increased steadily beginning in June, along with the amplitude of the seismic events, although there were no apparent changes in surface activity (figure 12). Weak thermal anomalies were first detected in satellite data in mid-August. SERNAGEOMIN noted that the locations of the seismic events were migrating closer to the crater, and the depths were shallowing from June to August 2018.
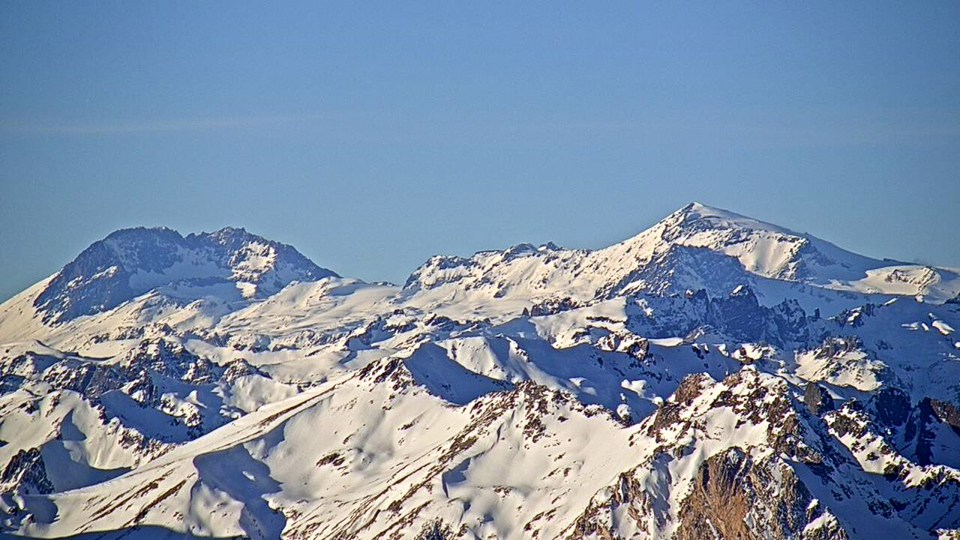 |
Figure 12. No surface activity was seen at Planchón-Peteroa on 11 July 2018; SERNAGEOMIN had raised the Alert Level to Yellow from Green a few days earlier due to increased seismicity. Photo from SERNAGEOMIN webcam located about 10 km W. Courtesy of SERNAGEOMIN. |
SERNAGEOMIN first reported the presence of particulate material in the persistent degassing from the active crater on 21 September 2018, noting that the degassing steam turned "slightly gray" but plumes did not rise more than 600 m above the crater. Mostly-white emissions continued during October, although they specifically mentioned emissions of low-intensity particulate material observed during 13-15 October, rising 600 m above the crater. Three MIROVA thermal alerts appeared on 14 October, the first over 1 MW to be recorded (figure 13). During the second half of October, SERNAGEOMIN noted persistent mostly-white degassing in the webcam that rose up to 700 m above the crater. They also reported webcam images in the second half of October that showed ash emissions rising a short distance above the crater, generally drifting SE, although they did not specify certain dates
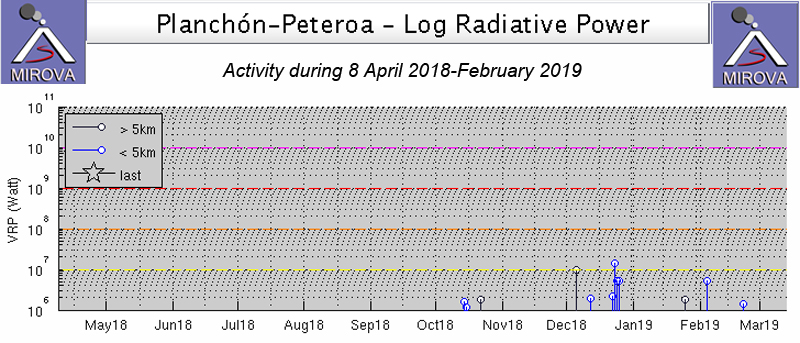 |
Figure 13. A graph of satellite thermal data by the MIROVA project from 8 April 2018 through February 2019 indicates that thermal anomalies were first reported in mid-October 2018; this corresponds with SERNAGEOMIN's observations of emissions containing significant quantities of particular material. Increased thermal activity during December 2018 and February 2019 corresponded with reports of increased explosive activity and ash emissions. Courtesy of MIROVA. |
SERNAGEOMIN reported an explosion with an ash emission visible in the webcam on 7 November 2018; they reported the plume height at about 1,000 m above the crater (figure 14). The Buenos Aires VAAC reported the ash plume drifting SE visible in satellite imagery at 4.3 km altitude. Low-altitude ash emissions were observed in the webcam multiple additional times during November. In a special report issued on 7 December, SERNAGEOMIN reported a 1,300-m-high ash emission that dispersed ESE. The Buenos Aires VAAC reported continuous ash emissions beginning on 14 December that lasted through the rest of the month (figure 15).
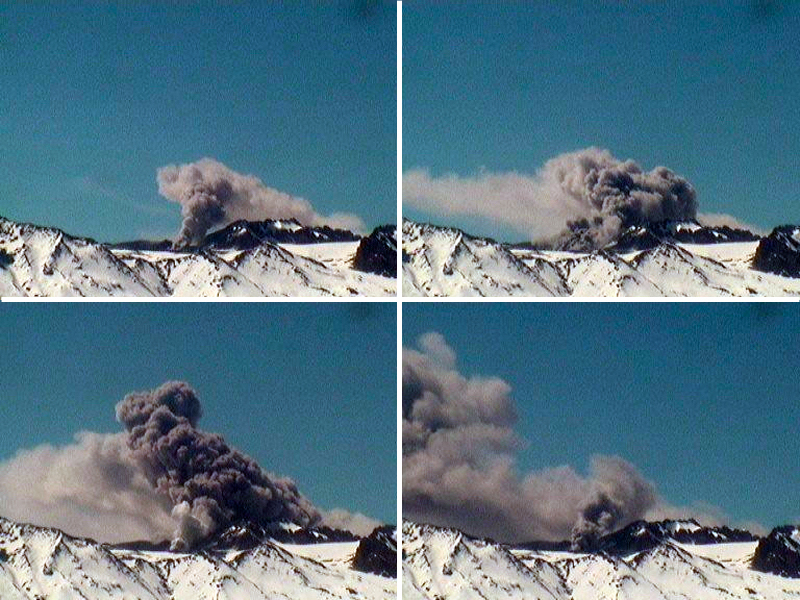 |
Figure 14. A webcam located a few kilometers W of Peteroa captured these images of the ash plume released on 7 November 2018. Courtesy of SERNAGEOMIN. |
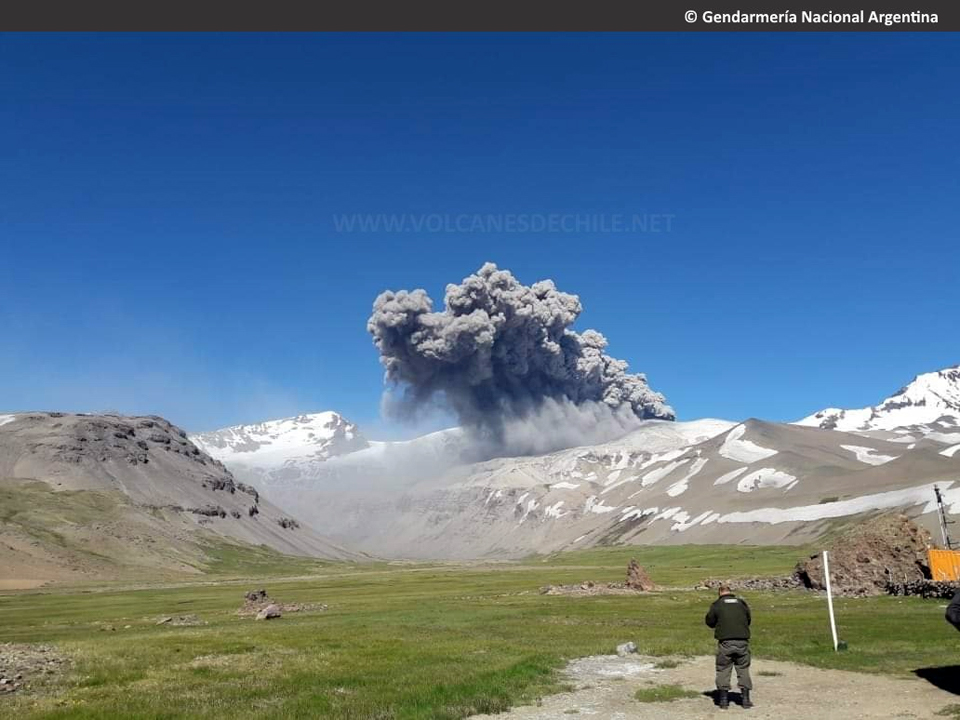 |
Figure 15. An ash cloud from Planchón-Peteroa was photographed from Paso Vergara on the Chile/Argentina border 5 km NE on 14 December 2018; the ash dispersed to the SE. Courtesy of Volcanes de Chile and SEGEMAR (Servicio Geológico Minero Argentino), copyright by Gendarmeria Nacional Argentina. |
Plumes generally drifted SE at 4.6-4.9 km altitude during December, with occasional stronger puffs that were reported as high as 5.8 km altitude (figure 16). On 16 December the webcam recorded high-intensity pulsating ash emissions that drifted 20 km SE. Incandescence was visible around the crater that night. Webcam images showed dark gray plumes during the second half of December, suggesting a high concentration of ash; the pulsating nature of the emissions was observed in the webcam again during 24-27 December, reaching 1,600 m above the crater. Multiple thermal alerts were reported during the second half of the month.
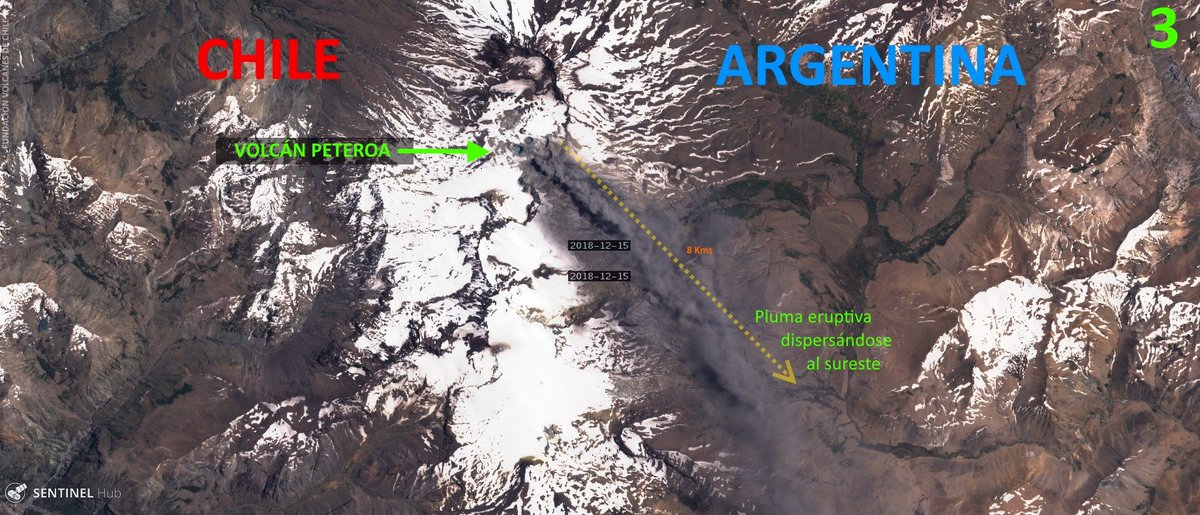 |
Figure 16. Volcanes de Chile annotated this 15 December 2018 Sentinel-2 satellite image showing the ash plume from Planchón-Peteroa drifting SE into Argentina. Courtesy of Sentinel Hub and Volcanes de Chile. |
Activity during January-February 2019. Dense ash plumes were reported daily during January and February 2019 by both SERNAGEOMIN and the Buenos Aires VAAC; plumes heights were generally between 400 m and 1 km above the active crater (figure 17). Higher plumes that reached 2 km above the crater and drifted E were reported on 1 and 3 February (figure 18). SERNAGEOMIN noted that the first of these events was accompanied by an increase in very low frequency seismic activity (VLP).
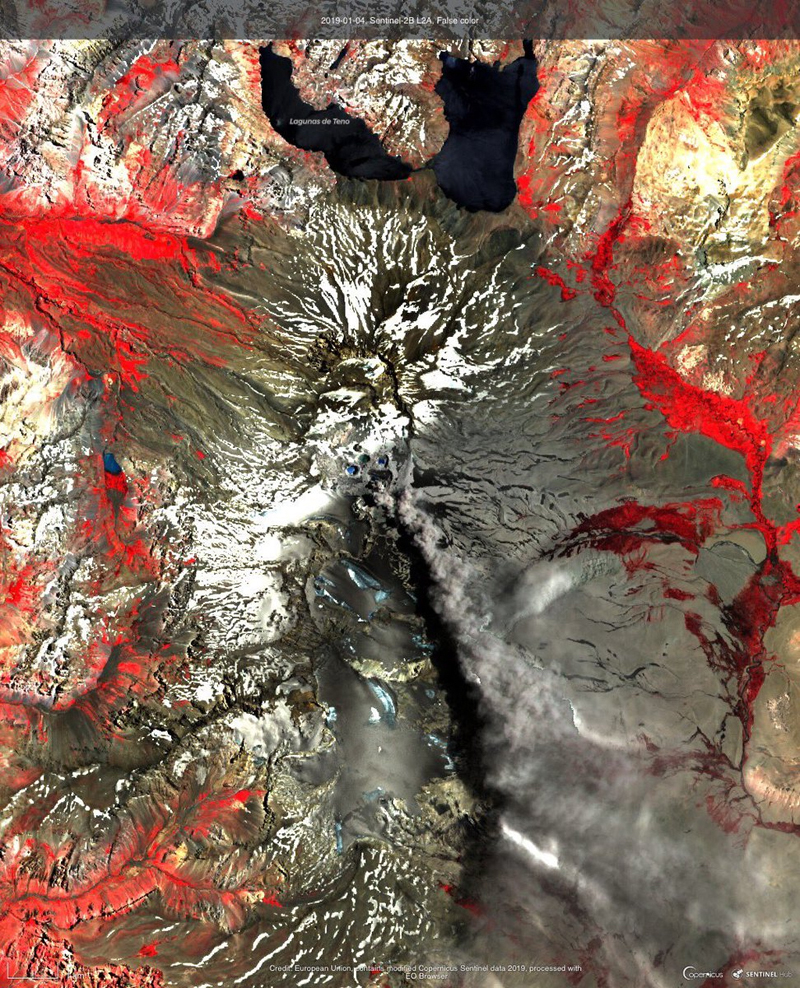 |
Figure 17. Dense ash plumes drifted SE from Planchón-Peteroa on 4 January 2019 as seen in this false-color Sentinel-2B satellite image. Courtesy of Sentinel Hub and Volcanes de Chile. |
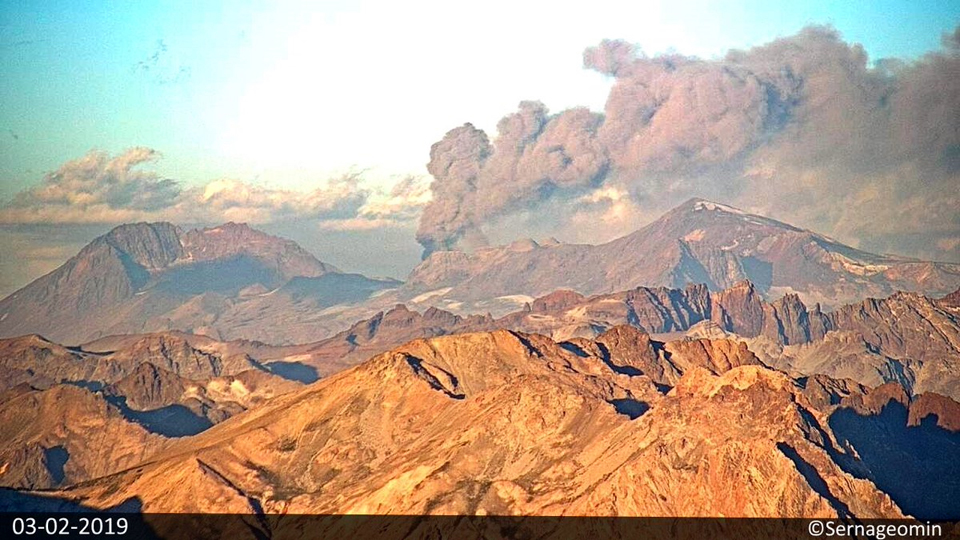 |
Figure 18. Volcanes de Chile captured this image of a dense ash plume drifting SE over Argentina from the SERNAGEOMIN webcam located about 10 km W of Planchón-Peteroa on 3 February 2018. Courtesy of Volcanes de Chile and SERNAGEOMIN. |
Satellite-based SO2 instruments also detected a significant gas plume on 3 February (figure 19). SERNAGEOMIN reported a tremor signal on 14 February 2019 associated with a dense ash plume that rose to 2 km above the summit and drifted NE. Webcam images during the second half of February showed constant degassing; gray plumes drifted mostly SE about 2 km above the summit (figure 20).
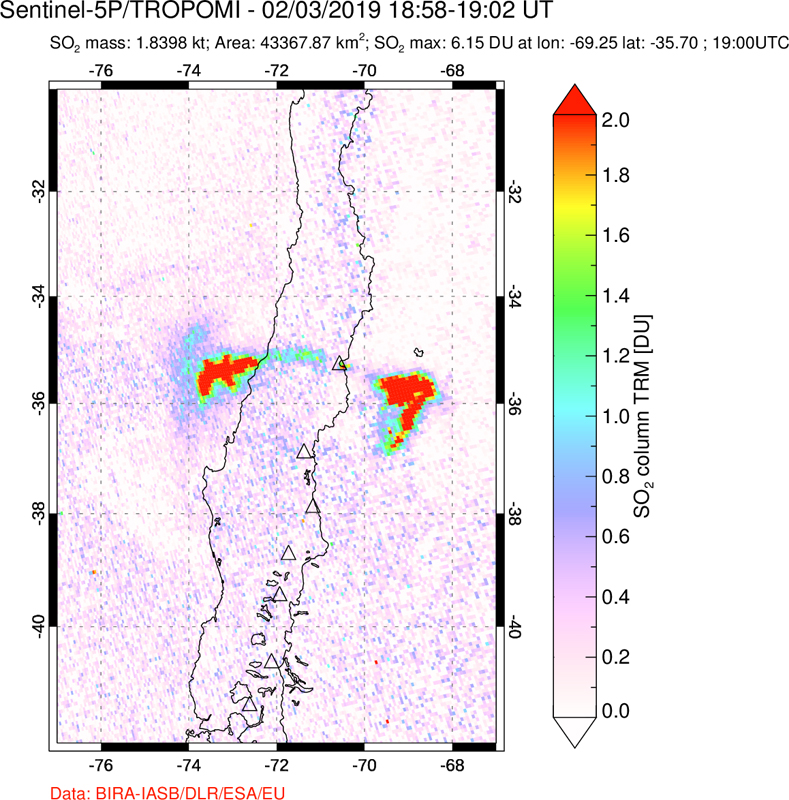 |
Figure 19. The TROPOMI instrument on the Sentinel-5P satellite recorded significant SO2 plumes drifting both E and W of Planchón-Peteroa on 3 February 2019; SERNAGEOMIN reported dense ash emissions the same day. Courtesy of NASA Goddard Space Flight Center. |
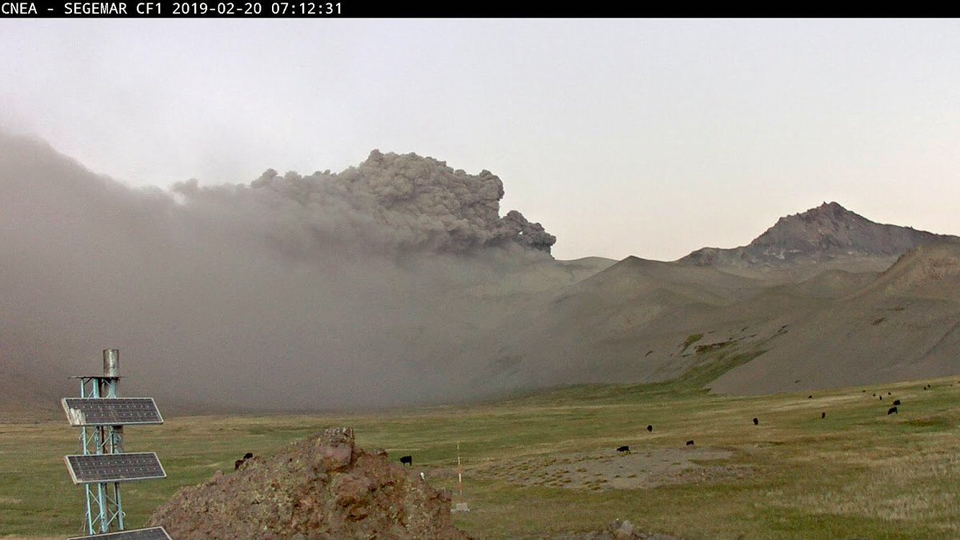 |
Figure 20. Explosive activity at Planchón-Peteroa was recorded in Paso Vergara on the Chile/Argentina border 5 km NE on 20 February 2019 at the SEGEMAR CNEA webcam. Courtesy of SEGEMAR (Servicio Geológico Minero Argentino) and Felipe Aguilera Volcanes. |
Information Contacts: Servicio Nacional de Geología y Minería (SERNAGEOMIN), Observatorio Volcanológico de Los Andes del Sur (OVDAS), Avda Sta María No. 0104, Santiago, Chile (URL: http://www.sernageomin.cl/); Buenos Aires Volcanic Ash Advisory Center (VAAC), Servicio Meteorológico Nacional-Fuerza Aérea Argentina, 25 de mayo 658, Buenos Aires, Argentina (URL: http://www.smn.gov.ar/vaac/buenosaires/inicio.php); MIROVA (Middle InfraRed Observation of Volcanic Activity), a collaborative project between the Universities of Turin and Florence (Italy) supported by the Centre for Volcanic Risk of the Italian Civil Protection Department (URL: http://www.mirovaweb.it/); NASA Goddard Space Flight Center (NASA/GSFC), Global Sulfur Dioxide Monitoring Page, Atmospheric Chemistry and Dynamics Laboratory, 8800 Greenbelt Road, Goddard, Maryland, USA (URL: https://so2.gsfc.nasa.gov/); Servicio Geológico Minero Argentino (SEGEMAR), Av. General Paz 5445 (colectora), Parque Tecnológico Miguelete, Edificio 14 y Edificio 25, San Martín (B1650 WAB) (URL: http://www.segemar.gov.ar/); Sentinel Hub Playground (URL: https://www.sentinel-hub.com/explore/sentinel-playground); Cumbres y Montañas de O'Higgins (URL: https://www.facebook.com/cymohiggins/); Volcanes de Chile (URL: https://www.volcanesdechile.net/, Twitter: @volcanesdechile); Felipe Aguilera Volcanes (Twitter: @FelipeVolcanes, URL: https://twitter.com/FelipeVolcanes).
Frequent ash plumes during March-April; last ash deposit seen in early May 2019
Planchón-Peteroa is located along the Chile-Argentina border and is the northernmost volcano of the Maule region. Eruptions have been intermittent in recent times and have consisted largely of gas-and-steam and ash plumes, with the most recent eruption phase beginning in November 2018. This report covers March through May 2019; the last evidence for ash emissions was during 6-8 May, after which the activity consisted of only gas-and-steam plumes. This report summarizes activity reports by Servicio Nacional de Geología y Minería (SERNAGEOMIN) and Oficina Nacional de Emergencia - Ministerio del Interior (ONEMI), and various satellite data.
During 1-15 March ash plumes reached 2 km above the crater, with an increase in maximum plume heights after the 7th. Elevated sulfur dioxide (SO2) emissions were detected on 8 and 12 March. From 12 to 31 March ash plumes reached maximum heights of 1.6 km above the crater. An ash plume on 26 March reached 1.2 km (figure 21). Ash plumes were frequently imaged by the Sentinel-2 satellite, with the wind dispersing the ash plumes primarily to the SE (figure 22). Degassing was continuous throughout March, and SO2 emissions were detected by the TROPOspheric Monitoring Instrument (TROPOMI, figure 23). Sentinel-2 data showed one thermal anomaly for this period, on 12 March.
|
Figure 21. Screenshots of footage shared by SERNAGEOMIN showing an ash plume reaching 1.2 km above the crater at 1650 on 26 March 2019. Webcam images courtesy of SERNAGEOMIN. |
|
Figure 22. Examples of ash plumes from Planchón-Peteroa during March 2019. The brown plumes are all being blown to the SE. Sentinel-2 natural color (bands 4, 3, 2) satellite images courtesy of Sentinel Hub Playground. |
|
Figure 23. Examples of SO2 emissions at Planchón-Peteroa during March 2019 as measured by Sentinel-5P/TROPOMI. The location of the volcano is indicated in the top-right image. Courtesy of NASA Goddard Space Flight Center. |
Ash plumes continued through April but were less frequently observed in Sentinel-2 satellite data. SERNAGEOMIN reported a reduction in plume height, with a maximum height of 1.5 km above the crater through to the 7th, and a maximum plume height of 400-600 m from the 8th through to the end of the month. Early in the month analysis of the ash showed around 5% juvenile material. SO2 emissions were measured on 3 and 5 April, with values of 320 ± 25 tons per day (t/d) and 634 ± 131 t/d, respectively. Degassing was continuous throughout April and May.
An ash plume was imaged on 1 May in Sentinel-2 imagery, but then cloud cover obscured satellite views through 4 May. A partially-obscured view in a 5 May Suomi NPP / VIIRS image (in NASA Worldview) showed what appeared to be an ash deposit on fresh snow to the SE of the crater. This ash deposit is visible through diffuse clouds in a Sentinel-2 image acquired on 6 May, and additional deposits are visible on 8 May (figure 24). During the rest of May the plumes were largely white with little to no volcanic ash content (figure 25).
|
Figure 24. Ash deposited on snow to the SE of the active Planchón-Peteroa crater through light cloud cover, visible in a Sentinel-2 image (left) acquired on 6 May 2019, and a Landsat 8 image (right) acquired on 8 May. Sentinel-2 natural color (bands 4, 3, 2) and Landsat 8 true color (bands 4, 3, 2) satellite images courtesy of Sentinel Hub Playground. |
|
Figure 25. Continuous degassing at Planchón-Peteroa on 10 May producing a plume composed mainly of water vapor rises to 600 m above the crater. Webcam images courtesy of SERNAGEOMIN. |
Information Contacts: Servicio Nacional de Geología y Minería (SERNAGEOMIN), Observatorio Volcanológico de Los Andes del Sur (OVDAS), Avda Sta María No. 0104, Santiago, Chile (URL: http://www.sernageomin.cl/); Oficina Nacional de Emergencia - Ministerio del Interior (ONEMI), Beaucheff 1637/1671, Santiago, Chile (URL: http://www.onemi.cl/); Global Sulfur Dioxide Monitoring Page, Atmospheric Chemistry and Dynamics Laboratory, NASA Goddard Space Flight Center (NASA/GSFC), 8800 Greenbelt Road, Goddard, Maryland, USA (URL: https://so2.gsfc.nasa.gov/); Sentinel Hub Playground (URL: https://www.sentinel-hub.com/explore/sentinel-playground); NASA Worldview (URL: https://worldview.earthdata.nasa.gov/).
This compilation of synonyms and subsidiary features may not be comprehensive. Features are organized into four major categories: Cones, Craters, Domes, and Thermal Features. Synonyms of features appear indented below the primary name. In some cases additional feature type, elevation, or location details are provided.
Synonyms |
||||
| Banos, Nevado de los | Azufre-Plachón-Peteroa | ||||
Cones |
||||
| Feature Name | Feature Type | Elevation | Latitude | Longitude |
| Peteroa | Submarine cone | 3820 m | 35° 14' 0" S | 70° 34' 0" W |
Craters |
||||
| Feature Name | Feature Type | Elevation | Latitude | Longitude |
| Azufre | Caldera | 4107 m | 35° 16' 5" S | 70° 35' 0" W |
| Planchón | Caldera | 3977 m | 35° 12' 58" S | 70° 34' 0" W |
Thermal |
||||
| Feature Name | Feature Type | Elevation | Latitude | Longitude |
| Azufre, Baños | Thermal | |||
|
|
||||||||||||||||||||||||||||
There is data available for 20 confirmed Holocene eruptive periods.
2018 Nov 7 - 2019 May 7 ± 1 days Confirmed Eruption VEI: 2
| Episode 1 | Eruption | |||||||||||||||
|---|---|---|---|---|---|---|---|---|---|---|---|---|---|---|---|
| 2018 Nov 7 - 2019 May 7 ± 1 days | Evidence from Observations: Reported | ||||||||||||||
|
List of 1 Events for Episode 1
| |||||||||||||||
2011 Feb 17 - 2011 Jun 26 ± 1 days Confirmed Eruption VEI: 2
| Episode 1 | Eruption | Peteroa | |||||||||||||||||||||||||||||||||||||||||||||||||
|---|---|---|---|---|---|---|---|---|---|---|---|---|---|---|---|---|---|---|---|---|---|---|---|---|---|---|---|---|---|---|---|---|---|---|---|---|---|---|---|---|---|---|---|---|---|---|---|---|---|---|
| 2011 Feb 17 - 2011 Jun 26 ± 1 days | Evidence from Observations: Reported | |||||||||||||||||||||||||||||||||||||||||||||||||
| Intermittent ash plumes rose a few hundred meters above the summit beginning on 17 February 2011. Activity increased in mid-April and lasted through early May with frequent ash plumes that rose up to 2 km above the summit and drifted in multiple directions. Ashfall was reported during 4-5 May up to 70 km away. Minor ash emissions in late June were the last reported. | ||||||||||||||||||||||||||||||||||||||||||||||||||
|
List of 8 Events for Episode 1 at Peteroa
| ||||||||||||||||||||||||||||||||||||||||||||||||||
2010 Sep 6 - 2010 Oct 13 Confirmed Eruption VEI: 2
| Episode 1 | Eruption | Peteroa | |||||||||||||||||||||||||||||||||||||||||||||||||||||||||||||||||||||||||||||||||||||||||||||||||||
|---|---|---|---|---|---|---|---|---|---|---|---|---|---|---|---|---|---|---|---|---|---|---|---|---|---|---|---|---|---|---|---|---|---|---|---|---|---|---|---|---|---|---|---|---|---|---|---|---|---|---|---|---|---|---|---|---|---|---|---|---|---|---|---|---|---|---|---|---|---|---|---|---|---|---|---|---|---|---|---|---|---|---|---|---|---|---|---|---|---|---|---|---|---|---|---|---|---|---|---|---|
| 2010 Sep 6 - 2010 Oct 13 | Evidence from Observations: Reported | |||||||||||||||||||||||||||||||||||||||||||||||||||||||||||||||||||||||||||||||||||||||||||||||||||
|
List of 18 Events for Episode 1 at Peteroa
| ||||||||||||||||||||||||||||||||||||||||||||||||||||||||||||||||||||||||||||||||||||||||||||||||||||
1998 Nov 18 - 1998 Nov 21 Confirmed Eruption VEI: 1
| Episode 1 | Eruption | |||||||||||||||||||||||||
|---|---|---|---|---|---|---|---|---|---|---|---|---|---|---|---|---|---|---|---|---|---|---|---|---|---|
| 1998 Nov 18 - 1998 Nov 21 | Evidence from Observations: Reported | ||||||||||||||||||||||||
|
List of 3 Events for Episode 1
| |||||||||||||||||||||||||
1991 Feb 9 - 1991 Mar 2 ± 2 days Confirmed Eruption VEI: 2
| Episode 1 | Eruption | Peteroa | |||||||||||||||||||||||||||||||||||||||||||||||||
|---|---|---|---|---|---|---|---|---|---|---|---|---|---|---|---|---|---|---|---|---|---|---|---|---|---|---|---|---|---|---|---|---|---|---|---|---|---|---|---|---|---|---|---|---|---|---|---|---|---|---|
| 1991 Feb 9 - 1991 Mar 2 ± 2 days | Evidence from Observations: Reported | |||||||||||||||||||||||||||||||||||||||||||||||||
|
List of 8 Events for Episode 1 at Peteroa
| ||||||||||||||||||||||||||||||||||||||||||||||||||
[ 1967 Feb 16 ± 15 days ] Uncertain Eruption
| Episode 1 | Eruption | Peteroa (1889-94 crater) | |||||||||||||||||||
|---|---|---|---|---|---|---|---|---|---|---|---|---|---|---|---|---|---|---|---|---|
| 1967 Feb 16 ± 15 days - Unknown | Evidence from Unknown | |||||||||||||||||||
|
List of 2 Events for Episode 1 at Peteroa (1889-94 crater)
| ||||||||||||||||||||
1962 Jan 16 ± 15 days Confirmed Eruption VEI: 1
| Episode 1 | Eruption | Peteroa | |||||||||||||||||||
|---|---|---|---|---|---|---|---|---|---|---|---|---|---|---|---|---|---|---|---|---|
| 1962 Jan 16 ± 15 days - Unknown | Evidence from Observations: Reported | |||||||||||||||||||
|
List of 2 Events for Episode 1 at Peteroa
| ||||||||||||||||||||
1960 Jul 10 (?) Confirmed Eruption VEI: 1
| Episode 1 | Eruption | Petoroa (1889-94 crater) | |||||||||||||||||||||||||||||
|---|---|---|---|---|---|---|---|---|---|---|---|---|---|---|---|---|---|---|---|---|---|---|---|---|---|---|---|---|---|---|
| 1960 Jul 10 (?) - Unknown | Evidence from Observations: Reported | |||||||||||||||||||||||||||||
|
List of 4 Events for Episode 1 at Petoroa (1889-94 crater)
| ||||||||||||||||||||||||||||||
1959 Nov 6 Confirmed Eruption VEI: 1
| Episode 1 | Eruption | Petoroa (1889-94 crater) | |||||||||||||||||||||||||||||
|---|---|---|---|---|---|---|---|---|---|---|---|---|---|---|---|---|---|---|---|---|---|---|---|---|---|---|---|---|---|---|
| 1959 Nov 6 - Unknown | Evidence from Observations: Reported | |||||||||||||||||||||||||||||
|
List of 4 Events for Episode 1 at Petoroa (1889-94 crater)
| ||||||||||||||||||||||||||||||
1938 Sep - 1938 Oct Confirmed Eruption VEI: 2
| Episode 1 | Eruption | Peteroa | ||||||||||||||||||||||||||||||||||
|---|---|---|---|---|---|---|---|---|---|---|---|---|---|---|---|---|---|---|---|---|---|---|---|---|---|---|---|---|---|---|---|---|---|---|---|
| 1938 Sep - 1938 Oct | Evidence from Observations: Reported | ||||||||||||||||||||||||||||||||||
|
List of 5 Events for Episode 1 at Peteroa
| |||||||||||||||||||||||||||||||||||
1937 Apr - 1937 May 5 ± 4 days Confirmed Eruption VEI: 2
| Episode 1 | Eruption | Petoroa (south of 1889-94 crater) | ||||||||||||||||||||||||||||||||||||||||||||
|---|---|---|---|---|---|---|---|---|---|---|---|---|---|---|---|---|---|---|---|---|---|---|---|---|---|---|---|---|---|---|---|---|---|---|---|---|---|---|---|---|---|---|---|---|---|
| 1937 Apr - 1937 May 5 ± 4 days | Evidence from Observations: Reported | ||||||||||||||||||||||||||||||||||||||||||||
|
List of 7 Events for Episode 1 at Petoroa (south of 1889-94 crater)
| |||||||||||||||||||||||||||||||||||||||||||||
1889 Sep - 1894 (?) Confirmed Eruption VEI: 2
| Episode 1 | Eruption | Peteroa (SE of 1762 crater) | |||||||||||||||||||
|---|---|---|---|---|---|---|---|---|---|---|---|---|---|---|---|---|---|---|---|---|
| 1889 Sep - 1894 (?) | Evidence from Observations: Reported | |||||||||||||||||||
|
List of 2 Events for Episode 1 at Peteroa (SE of 1762 crater)
| ||||||||||||||||||||
1878 Confirmed Eruption VEI: 2
| Episode 1 | Eruption | Peteroa | ||||||||||||||
|---|---|---|---|---|---|---|---|---|---|---|---|---|---|---|---|
| 1878 - Unknown | Evidence from Observations: Reported | ||||||||||||||
|
List of 1 Events for Episode 1 at Peteroa
| |||||||||||||||
[ 1872 ] Uncertain Eruption
| Episode 1 | Eruption | ||||
|---|---|---|---|---|
| 1872 - Unknown | Evidence from Unknown | |||
[ 1869 ] Uncertain Eruption
| Episode 1 | Eruption | ||||
|---|---|---|---|---|
| 1869 - Unknown | Evidence from Unknown | |||
1860 Confirmed Eruption VEI: 2
| Episode 1 | Eruption | Peteroa | |||||||||||||||||||
|---|---|---|---|---|---|---|---|---|---|---|---|---|---|---|---|---|---|---|---|---|
| 1860 - Unknown | Evidence from Observations: Reported | |||||||||||||||||||
| Eruption reported from Peteroa. | ||||||||||||||||||||
|
List of 2 Events for Episode 1 at Peteroa
| ||||||||||||||||||||
[ 1842 ] Uncertain Eruption
| Episode 1 | Eruption | ||||
|---|---|---|---|---|
| 1842 - Unknown | Evidence from Unknown | |||
1837 Feb Confirmed Eruption VEI: 2
| Episode 1 | Eruption | Peteroa | |||||||||||||||||||||||||||||||||||||||
|---|---|---|---|---|---|---|---|---|---|---|---|---|---|---|---|---|---|---|---|---|---|---|---|---|---|---|---|---|---|---|---|---|---|---|---|---|---|---|---|---|
| 1837 Feb - Unknown | Evidence from Observations: Reported | |||||||||||||||||||||||||||||||||||||||
|
List of 6 Events for Episode 1 at Peteroa
| ||||||||||||||||||||||||||||||||||||||||
1835 Confirmed Eruption VEI: 2
| Episode 1 | Eruption | Peteroa | ||||||||||||||
|---|---|---|---|---|---|---|---|---|---|---|---|---|---|---|---|
| 1835 - Unknown | Evidence from Observations: Reported | ||||||||||||||
|
List of 1 Events for Episode 1 at Peteroa
| |||||||||||||||
1762 Dec 3 Confirmed Eruption VEI: 4
| Episode 1 | Eruption | Peteroa (2 km S of Planchón summit) | |||||||||||||||||||||||||||||||||||||||
|---|---|---|---|---|---|---|---|---|---|---|---|---|---|---|---|---|---|---|---|---|---|---|---|---|---|---|---|---|---|---|---|---|---|---|---|---|---|---|---|---|
| 1762 Dec 3 - Unknown | Evidence from Observations: Reported | |||||||||||||||||||||||||||||||||||||||
|
List of 6 Events for Episode 1 at Peteroa (2 km S of Planchón summit)
| ||||||||||||||||||||||||||||||||||||||||
1751 Nov - 1751 Dec Confirmed Eruption VEI: 2
| Episode 1 | Eruption | ||||||||||||||||||||
|---|---|---|---|---|---|---|---|---|---|---|---|---|---|---|---|---|---|---|---|---|
| 1751 Nov - 1751 Dec | Evidence from Observations: Reported | |||||||||||||||||||
|
List of 2 Events for Episode 1
| ||||||||||||||||||||
1660 Confirmed Eruption VEI: 3
| Episode 1 | Eruption | Peteroa | ||||||||||||||
|---|---|---|---|---|---|---|---|---|---|---|---|---|---|---|---|
| 1660 - Unknown | Evidence from Observations: Reported | ||||||||||||||
|
List of 1 Events for Episode 1 at Peteroa
| |||||||||||||||
0900 ± 100 years Confirmed Eruption VEI: 3
| Episode 1 | Eruption | PLB tephra | ||||||||||||||||||||||||||||||||||
|---|---|---|---|---|---|---|---|---|---|---|---|---|---|---|---|---|---|---|---|---|---|---|---|---|---|---|---|---|---|---|---|---|---|---|---|
| 0900 ± 100 years - Unknown | Evidence from Isotopic: 14C (uncalibrated) | ||||||||||||||||||||||||||||||||||
|
List of 5 Events for Episode 1 at PLB tephra
| |||||||||||||||||||||||||||||||||||
5080 BCE ± 75 years Confirmed Eruption VEI: 3
| Episode 1 | Eruption | OPV tephra | |||||||||||||||||||||||||||||||||||||||
|---|---|---|---|---|---|---|---|---|---|---|---|---|---|---|---|---|---|---|---|---|---|---|---|---|---|---|---|---|---|---|---|---|---|---|---|---|---|---|---|---|
| 5080 BCE ± 75 years - Unknown | Evidence from Isotopic: 14C (uncalibrated) | |||||||||||||||||||||||||||||||||||||||
|
List of 6 Events for Episode 1 at OPV tephra
| ||||||||||||||||||||||||||||||||||||||||
There is no Deformation History data available for Planchón-Peteroa.
There is data available for 1 emission periods. Expand each entry for additional details.
| Start Date: 2011 May 02 | Stop Date: 2011 May 02 | Method: Satellite (Aura OMI) |
| SO2 Altitude Min: 6 km | SO2 Altitude Max: 6 km | Total SO2 Mass: 1 kt |
Data Details
| Date Start | Date End | Assumed SO2 Altitude | SO2 Algorithm | SO2 Mass |
| 20110502 | 6.0 | 1.000 |
 Planchón-Peteroa is a complex volcano with several overlapping calderas. Activity began during the Pleistocene with construction of Volcán Azufre, followed by formation of Volcán Planchón, 6 km to the north. The youngest volcano, Volcán Peteroa, consisting of scattered vents between Azufre and Planchón, has been active into historical time and contains a small steaming crater lake. Historical eruptions have been dominantly explosive, although lava flows were erupted in 1837 and 1937.
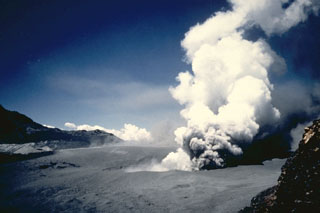 óAn explosive eruption lasting three weeks began on February 9, 1991 from a 200-m-wide crater between Planchon and Peteroa. This photo shows an ash plume rising from the crater on February 11. Ashfall occurred as far as 70 km from the crater. Fish in the Claro and Teno rivers were killed and water supplies were contaminated by tephra and water ejected from the crater lake.
  An aerial view from the NW overlooks Planchón-Peteroa, a complex volcano with several overlapping calderas. In the left foreground is the caldera wall of Planchón volcano. The crater complex of Peteroa is in the center, and Volcán Azufre lies at the upper right. Activity began in the Pleistocene at Volcán Azufre, followed by formation of Volcán Planchón, 6 km to the north. Volcán Peteroa has been active into historical time and contains a small steaming crater lake.
Maps are not currently available due to technical issues.
The maps shown below have been scanned from the GVP map archives and include the volcano on this page. Clicking on the small images will load the full 300 dpi map. Very small-scale maps (such as world maps) are not included.
There are no samples for Planchón-Peteroa in the Smithsonian's NMNH Department of Mineral Sciences Rock and Ore collection.
| Copernicus Browser | The Copernicus Browser replaced the Sentinel Hub Playground browser in 2023, to provide access to Earth observation archives from the Copernicus Data Space Ecosystem, the main distribution platform for data from the EU Copernicus missions. |
| MIROVA | Middle InfraRed Observation of Volcanic Activity (MIROVA) is a near real time volcanic hot-spot detection system based on the analysis of MODIS (Moderate Resolution Imaging Spectroradiometer) data. In particular, MIROVA uses the Middle InfraRed Radiation (MIR), measured over target volcanoes, in order to detect, locate and measure the heat radiation sourced from volcanic activity. |
| MODVOLC Thermal Alerts | Using infrared satellite Moderate Resolution Imaging Spectroradiometer (MODIS) data, scientists at the Hawai'i Institute of Geophysics and Planetology, University of Hawai'i, developed an automated system called MODVOLC to map thermal hot-spots in near real time. For each MODIS image, the algorithm automatically scans each 1 km pixel within it to check for high-temperature hot-spots. When one is found the date, time, location, and intensity are recorded. MODIS looks at every square km of the Earth every 48 hours, once during the day and once during the night, and the presence of two MODIS sensors in space allows at least four hot-spot observations every two days. Each day updated global maps are compiled to display the locations of all hot spots detected in the previous 24 hours. There is a drop-down list with volcano names which allow users to 'zoom-in' and examine the distribution of hot-spots at a variety of spatial scales. |
|
WOVOdat
Single Volcano View Temporal Evolution of Unrest Side by Side Volcanoes |
WOVOdat is a database of volcanic unrest; instrumentally and visually recorded changes in seismicity, ground deformation, gas emission, and other parameters from their normal baselines. It is sponsored by the World Organization of Volcano Observatories (WOVO) and presently hosted at the Earth Observatory of Singapore.
GVMID Data on Volcano Monitoring Infrastructure The Global Volcano Monitoring Infrastructure Database GVMID, is aimed at documenting and improving capabilities of volcano monitoring from the ground and space. GVMID should provide a snapshot and baseline view of the techniques and instrumentation that are in place at various volcanoes, which can be use by volcano observatories as reference to setup new monitoring system or improving networks at a specific volcano. These data will allow identification of what monitoring gaps exist, which can be then targeted by remote sensing infrastructure and future instrument deployments. |
| Volcanic Hazard Maps | The IAVCEI Commission on Volcanic Hazards and Risk has a Volcanic Hazard Maps database designed to serve as a resource for hazard mappers (or other interested parties) to explore how common issues in hazard map development have been addressed at different volcanoes, in different countries, for different hazards, and for different intended audiences. In addition to the comprehensive, searchable Volcanic Hazard Maps Database, this website contains information about diversity of volcanic hazard maps, illustrated using examples from the database. This site is for educational purposes related to volcanic hazard maps. Hazard maps found on this website should not be used for emergency purposes. For the most recent, official hazard map for a particular volcano, please seek out the proper institutional authorities on the matter. |
| IRIS seismic stations/networks | Incorporated Research Institutions for Seismology (IRIS) Data Services map showing the location of seismic stations from all available networks (permanent or temporary) within a radius of 0.18° (about 20 km at mid-latitudes) from the given location of Planchón-Peteroa. Users can customize a variety of filters and options in the left panel. Note that if there are no stations are known the map will default to show the entire world with a "No data matched request" error notice. |
| UNAVCO GPS/GNSS stations | Geodetic Data Services map from UNAVCO showing the location of GPS/GNSS stations from all available networks (permanent or temporary) within a radius of 20 km from the given location of Planchón-Peteroa. Users can customize the data search based on station or network names, location, and time window. Requires Adobe Flash Player. |
| DECADE Data | The DECADE portal, still in the developmental stage, serves as an example of the proposed interoperability between The Smithsonian Institution's Global Volcanism Program, the Mapping Gas Emissions (MaGa) Database, and the EarthChem Geochemical Portal. The Deep Earth Carbon Degassing (DECADE) initiative seeks to use new and established technologies to determine accurate global fluxes of volcanic CO2 to the atmosphere, but installing CO2 monitoring networks on 20 of the world's 150 most actively degassing volcanoes. The group uses related laboratory-based studies (direct gas sampling and analysis, melt inclusions) to provide new data for direct degassing of deep earth carbon to the atmosphere. |
| Large Eruptions of Planchón-Peteroa | Information about large Quaternary eruptions (VEI >= 4) is cataloged in the Large Magnitude Explosive Volcanic Eruptions (LaMEVE) database of the Volcano Global Risk Identification and Analysis Project (VOGRIPA). |
| EarthChem | EarthChem develops and maintains databases, software, and services that support the preservation, discovery, access and analysis of geochemical data, and facilitate their integration with the broad array of other available earth science parameters. EarthChem is operated by a joint team of disciplinary scientists, data scientists, data managers and information technology developers who are part of the NSF-funded data facility Integrated Earth Data Applications (IEDA). IEDA is a collaborative effort of EarthChem and the Marine Geoscience Data System (MGDS). |

