Eruptive activity at Barren Island continued according to notices from the Darwin VAAC. Ash plumes identified in satellite images during 2-3 April rose 0.9-1.5 km (3,000-5,000 ft) a.s.l. and drifted SW and W. Weather conditions prevented views on 4 April. A thermal anomaly over the summit was identified in Sentinel data on 30 March and 4 April.
Sources: Darwin Volcanic Ash Advisory Centre (VAAC), Copernicus
Thermal activity during December 2022-March 2023
Barren Island is part of a N-S-trending volcanic arc extending between Sumatra and Burma (Myanmar). The caldera, which is open to the sea on the west, was created during a major explosive eruption in the late Pleistocene that produced pyroclastic flow and surge deposits. Eruptions dating back to 1787, have changed the morphology of the pyroclastic cone in the center of the caldera, and lava flows that fill much of the caldera floor have reached the sea along the western coast. Previous activity was detected during mid-May 2022, consisting of intermittent thermal activity. This report covers June 2022 through March 2023, which included strong thermal activity beginning in late December 2022, based on various satellite data.
Activity was relatively quiet during June through late December 2022 and mostly consisted of low-power thermal anomalies, based on the MIROVA (Middle InfraRed Observation of Volcanic Activity) graph. During late December, a spike in both power and frequency of thermal anomalies was detected (figure 58). There was another pulse in thermal activity in mid-March, which consisted of more frequent and relatively strong anomalies.
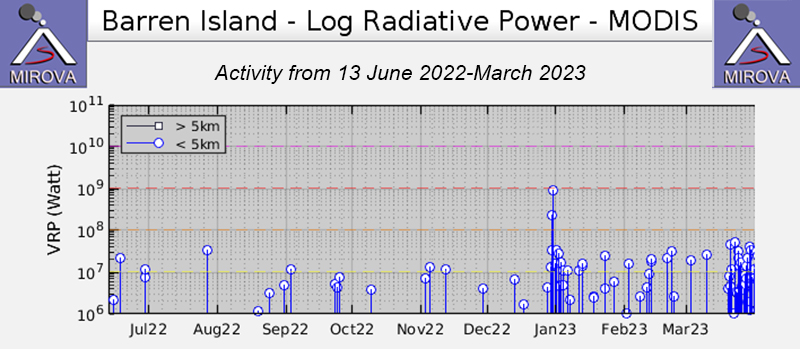 |
Figure 58. Occasional thermal anomalies were detected during June through late December 2022 at Barren Island, but by late December through early January 2023, there was a marked increase in thermal activity, both in power and frequency, according to this MIROVA graph (Log Radiative Power). After this spike in activity, anomalies occurred at a more frequent rate. In late March, another pulse in activity was detected, although the power was not as strong as that initial spike during December-January. Courtesy of MIROVA. |
The Suomi NPP/VIIRS sensor data showed five thermal alerts on 29 December 2022. The number of alerts increased to 19 on 30 December. According to the Darwin VAAC, ash plumes identified in satellite images captured at 2340 on 30 December and at 0050 on 31 December rose to 1.5 km altitude and drifted SW. The ash emissions dissipated by 0940. On 31 December, a large thermal anomaly was detected; based on a Sentinel-2 infrared satellite image, the anomaly was relatively strong and extended to the N (figure 59).
 |
Figure 59. Thermal anomalies of varying intensities were visible in the crater of Barren Island on 31 December 2022 (top left), 15 January 2023 (top right), 24 February 2023 (bottom left), and 31 March 2023 (bottom right), as seen in these Sentinel-2 infrared satellite images. The anomalies on 31 December and 31 March were notably strong and extended to the N and N-S, respectively. Images using “Atmospheric penetration” rendering (bands 12, 11, 8a). Courtesy of Sentinel Hub Playground. |
Thermal activity continued during January through March. Sentinel-2 infrared satellite data showed some thermal anomalies of varying intensity on clear weather days on 5, 10, 15, 20, and 30 January 2023, 9, 14, 19, and 24 February 2023, and 21, 26, and 31 March (figure 59). According to Suomi NPP/VIIRS sensor data, a total of 30 thermal anomalies were detected over 18 days on 2-3, 7, 9-14, 16-17, 20, 23, 25, and 28-31 January. The sensor data showed a total of six hotspots detected over six days on 1, 4-5, and 10-12 February. During March, a total of 33 hotspots were visible over 11 days on 20-31 March. Four MODVOLC thermal alerts were issued on 25, 27, and 29 March.
Information Contacts: Darwin Volcanic Ash Advisory Centre (VAAC), Bureau of Meteorology, Northern Territory Regional Office, PO Box 40050, Casuarina, NT 0811, Australia (URL: http://www.bom.gov.au/info/vaac/); MIROVA (Middle InfraRed Observation of Volcanic Activity), a collaborative project between the Universities of Turin and Florence (Italy) supported by the Centre for Volcanic Risk of the Italian Civil Protection Department (URL: http://www.mirovaweb.it/); Hawai'i Institute of Geophysics and Planetology (HIGP) - MODVOLC Thermal Alerts System, School of Ocean and Earth Science and Technology (SOEST), Univ. of Hawai'i, 2525 Correa Road, Honolulu, HI 96822, USA (URL: http://modis.higp.hawaii.edu/); Sentinel Hub Playground (URL: https://www.sentinel-hub.com/explore/sentinel-playground); NASA Worldview (URL: https://worldview.earthdata.nasa.gov/).
2024: March
| April
2023: April
2022: January
| December
2020: November
| December
2019: January
| March
2018: October
2017: February
2016: January
| February
2015: April
| June
| August
| September
| October
| December
2014: February
| September
2013: February
| October
2010: January
| April
2009: January
| February
| March
| April
| May
| July
| September
| October
| December
2008: July
| November
| December
2007: February
| December
2006: January
| March
| April
| May
| September
| October
| November
2005: May
| June
| July
| August
| September
| October
| November
| December
2004: December
2003: March
Eruptive activity at Barren Island continued according to notices from the Darwin VAAC. Ash plumes identified in satellite images during 2-3 April rose 0.9-1.5 km (3,000-5,000 ft) a.s.l. and drifted SW and W. Weather conditions prevented views on 4 April. A thermal anomaly over the summit was identified in Sentinel data on 30 March and 4 April.
Sources: Darwin Volcanic Ash Advisory Centre (VAAC); Copernicus
According to the Darwin VAAC eruptive activity at Barren Island produced ash plumes during 28 March-1 April. Ash plumes identified in satellite images at 1320 and 1930 on 28 March rose to 2.4 km (8,000 ft) a.s.l. and drifted NW. A strong thermal anomaly over the summit was visible in the 1930 image. Ash dissipated within about four hours. A larger thermal anomaly was visible in a satellite image at 0410 on 31 March. Ash plumes visible in images at 0410 and 1010 on 31 March rose to 2.4 km a.s.l. and drifted W. By 1440 ash was not visible, though weather conditions prevented views. At 1010 on 1 April a continuous ash plume rose to 1.8 km (6,000 ft) a.s.l. and drifted S.
Source: Darwin Volcanic Ash Advisory Centre (VAAC)
The Darwin VAAC reported that continuous ash plumes from Barren Island were identified in satellite images during 0620-1250 on 1 May rising to 4.6 km (15,000 ft) a.s.l. and drifting NW.
Source: Darwin Volcanic Ash Advisory Centre (VAAC)
The Darwin VAAC reported that ash plumes from Barren Island were identified in satellite images at 2340 on 30 December and 0050 on 31 December rising to 1.5 km (5,000 ft) a.s.l. and drifting SW. A large thermal anomaly was also visible. The ash emissions had dissipated by 0940.
Source: Darwin Volcanic Ash Advisory Centre (VAAC)
The Darwin VAAC reported that during 1700-2200 on 8 January and 1200-1700 on 9 January ash plumes from Barren Island rose to 1.2 km (4,000 ft) a.s.l. and drifted W and WSW.
Source: Darwin Volcanic Ash Advisory Centre (VAAC)
The Darwin VAAC reported that on 8 December an ash plume from Barren Island rose to 1.8 km (6,000 ft) a.s.l. and drifted WSW.
Source: Darwin Volcanic Ash Advisory Centre (VAAC)
The Darwin VAAC reported that an eruption at Barren Island on 5 November produced ash plumes that rose 1.5 km (5,000 ft) a.s.l. and drifted SW and WSW.
Source: Darwin Volcanic Ash Advisory Centre (VAAC)
Based on analysis of satellite imagery and wind data, the Darwin VAAC reported that on 14 and 16 March ash plumes from Barren Island rose to altitudes of 0.9 km (3,000 ft) and 1.2 km (4,000 ft) a.s.l., respectively, and drifted W and SW.
Source: Darwin Volcanic Ash Advisory Centre (VAAC)
Based on analysis of satellite imagery and wind data, the Darwin VAAC reported that on 7 March ash plumes from Barren Island rose to an altitude of 1.8 km (6,000 ft) a.s.l. and drifted W and NW, and to an altitude of 1.2 km (4,000 ft) a.s.l. and drifted E and ESE.
Source: Darwin Volcanic Ash Advisory Centre (VAAC)
Based on analysis of satellite imagery and wind data, the Darwin VAAC reported that on 26 January ash plumes from Barren Island rose to an altitude of 0.9 km (3,000 ft) a.s.l. and drifted W.
Source: Darwin Volcanic Ash Advisory Centre (VAAC)
According to a news article, the Geological Survey of India reported a new eruption at Barren Island. Satellite data on 25 September confirmed ash emissions, and either lava flows or ejected tephra on the N flank.
Source: Times of India
The National Institute of Oceanography (NIO), part of the Council of Scientific and Industrial Research (CSIR), reported that a new eruption at Barren Island began on 23 January. Scientists aboard a research vessel were collecting sea floor samples when they observed a sudden ash emission. The team moved closer, about 1.6 km from the volcano, and noted small eruptive episodes lasting 5-10 minutes. Ash emissions were visible in the daytime, and lava fountains feeding lava flows on the flanks were visible at night. The team revisited the volcano on 26 January and observed similar activity during the four hours they stayed. They sampled sediments and water in the vicinity of the eruption and recovered volcanic ejecta.
Source: National Institute of Oceanography (NIO)
Based on analysis of satellite imagery and wind data, the Darwin VAAC reported that during 14-15 February ash plumes from Barren Island rose to an altitude of 1.5 km (5,000 ft) a.s.l. and drifted over 45 km W.
Source: Darwin Volcanic Ash Advisory Centre (VAAC)
Based on analysis of satellite imagery and wind data, the Darwin VAAC reported that during 31 January-2 February ash plumes from Barren Island rose to an altitude of 1.5 km (5,000 ft) a.s.l. and drifted as far as 165 km SW.
Source: Darwin Volcanic Ash Advisory Centre (VAAC)
Based on analysis of satellite imagery and wind data, the Darwin VAAC reported that during 3-4 January an ash plume from Barren Island rose to an altitude of 1.5 km (5,000 ft) a.s.l. and drifted almost 85 km SW.
Source: Darwin Volcanic Ash Advisory Centre (VAAC)
Based on analysis of satellite imagery and wind data, the Darwin VAAC reported that during 8-9 October ash plumes from Barren Island rose to altitudes of 1.5-2.1 km (5,000-7,000 ft) a.s.l. and drifted 75-100 km NE.
Sources: Darwin Volcanic Ash Advisory Centre (VAAC); Darwin Volcanic Ash Advisory Centre (VAAC)
Based on analysis of satellite imagery and wind data, the Darwin VAAC reported that on 22 September an ash plume from Barren Island rose to an altitude of 1.8 km (6,000 ft) a.s.l. and drifted 45 km E.
Source: Darwin Volcanic Ash Advisory Centre (VAAC)
Based on analysis of satellite imagery and wind data, the Darwin VAAC reported that on 19 August ash plumes from Barren Island rose to an altitude of 1.5 km (5,000 ft) a.s.l. and drifted 55 km E.
Source: Darwin Volcanic Ash Advisory Centre (VAAC)
Based on pilot observations, analysis of satellite imagery, and wind data, the Darwin VAAC reported that during 12-13 June ash plumes from Barren Island rose to an altitude of 2.1 km (7,000 ft) a.s.l. and drifted 25-55 km NE.
Source: Darwin Volcanic Ash Advisory Centre (VAAC)
Based on analysis of satellite imagery and wind data, the Darwin VAAC reported that during 5-7 June ash plumes from Barren Island rose to altitudes of 2.4-3 km (8,000-10,000 ft) a.s.l. and drifted 35-45 km NE and E.
Source: Darwin Volcanic Ash Advisory Centre (VAAC)
According to the Darwin VAAC, a pilot observed an ash plume from Barren Island that rose to an altitude of 3 km (10,000 ft) a.s.l. Ash was not identified in satellite images.
Source: Darwin Volcanic Ash Advisory Centre (VAAC)
The Darwin VAAC released an advisory on 9 September based on a Sigmet and noted ash observations from Barren Island at 1428 that day. The low-level plume was not identifiable in satellite images.
Source: Darwin Volcanic Ash Advisory Centre (VAAC)
Based on analysis of satellite imagery and wind data, the Darwin VAAC reported that on 6 February an ash plume from Barren Island rose to an altitude of 1.5 km (5,000 ft) a.s.l. and drifted over 35 km SW. A SIGMET report noted that low-level ash plumes were also observed on 9 February.
Source: Darwin Volcanic Ash Advisory Centre (VAAC)
Based on analysis of satellite imagery and wind data, the Darwin VAAC reported that on 17 October an ash plume from Barren Island rose to an altitude of 3.7 km (12,000 ft) a.s.l. and drifted less than 30 km NW.
Source: Darwin Volcanic Ash Advisory Centre (VAAC)
Based on analysis of satellite imagery and wind data, the Darwin VAAC reported that on 16 February an ash plume from Barren Island rose to an altitude of 6.1 km (20,000 ft) a.s.l. and drifted 220 km SW.
Source: Darwin Volcanic Ash Advisory Centre (VAAC)
Based on analysis of satellite imagery, the Darwin VAAC reported that a plume from Barren Island rose to an altitude of 2.4 km (8,000 ft) a.s.l. and drifting 55 km N on 19 April. However, ash could not be identified from the satellite data.
Source: Darwin Volcanic Ash Advisory Centre (VAAC)
Based on a pilot observation, the Darwin VAAC reported that on 23 January an ash plume from Barren Island rose to an altitude of 3 km (10,000 ft) a.s.l. Ash was not identified in satellite imagery.
Source: Darwin Volcanic Ash Advisory Centre (VAAC)
Based on analyses of satellite imagery, the Darwin VAAC reported that on 11 January an ash plume from Barren Island rose to an altitude of 1.5 km (5,000 ft) a.s.l. and drifted 45 km S.
Source: Darwin Volcanic Ash Advisory Centre (VAAC)
Based on a pilot report, the Darwin VAAC reported that on 3 January a plume from Barren Island rose to an altitude of 1.5 km (5,000 ft) a.s.l. The plume was not identified in satellite imagery; however a meteorological cloud was present in the area.
Source: Darwin Volcanic Ash Advisory Centre (VAAC)
Based on analyses of satellite imagery, the Darwin VAAC reported that on 1 November an ash plume from Barren Island rose to an altitude of 1.8 km (6,000 ft) a.s.l. and drifted about 55-75 km W.
Source: Darwin Volcanic Ash Advisory Centre (VAAC)
Based on analyses of satellite imagery, the Darwin VAAC reported that during 13-14 September ash plumes from Barren Island rose to an altitude of 2.4 km (8,000 ft) a.s.l. and drifted about 20-100 km W and NE.
Source: Darwin Volcanic Ash Advisory Centre (VAAC)
Based on analysis of satellite imagery, the Darwin VAAC reported that during 19-20 July an ash plume from Barren Island rose to an altitude of 1.5 km (5,000 ft) a.s.l. and drifted 45-65 km NE.
Source: Darwin Volcanic Ash Advisory Centre (VAAC)
Based on analysis of satellite imagery, the Darwin VAAC reported that on 20 May an ash plume from Barren Island rose to an altitude of 2.1 km (7,000 ft) a.s.l. and drifted 75 km NE.
Source: Darwin Volcanic Ash Advisory Centre (VAAC)
Based on analysis of satellite imagery, the Darwin VAAC reported that during 23-25 April ash plumes from Barren Island rose to an altitude of 2.4 km (8,000 ft) a.s.l. and drifted 45-65 km NE, E, and SE.
Source: Darwin Volcanic Ash Advisory Centre (VAAC)
Based on analysis of satellite imagery, the Darwin VAAC reported that during 25-26 March ash plumes from Barren Island rose to an altitude of 2.1 km (7,000 ft) a.s.l. and drifted about 110 km S.
Source: Darwin Volcanic Ash Advisory Centre (VAAC)
Based on analysis of satellite imagery, the Darwin VAAC reported that during 20-21 February ash plumes from Barren Island rose to an altitude of 2.4 km (8,000 ft) a.s.l. and drifted about 75-90 km WNW, NW, and N.
Source: Darwin Volcanic Ash Advisory Centre (VAAC)
Based on analysis of satellite imagery, SIGMET notices, and pilot observations, the Darwin VAAC reported that on 5 February an ash plume from Barren Island rose to an altitude of 3 km (10,000 ft) a.s.l. and drifted SSE.
Source: Darwin Volcanic Ash Advisory Centre (VAAC)
Based on analysis of satellite imagery, the Darwin VAAC reported that on 31 January an ash plume from Barren Island drifted about 55 km S.
Source: Darwin Volcanic Ash Advisory Centre (VAAC)
Based on analysis of satellite imagery, the Darwin VAAC reported that on 21 January an ash plume from Barren Island rose to an altitude of 2.4 km (8,000 ft) a.s.l. and drifted N and NW.
Source: Darwin Volcanic Ash Advisory Centre (VAAC)
Based on analysis of satellite imagery, the Darwin VAAC reported that during 18-19 January ash plumes from Barren Island rose to an altitude of 3 km (10,000 ft) a.s.l. and drifted NNE and NE.
Source: Darwin Volcanic Ash Advisory Centre (VAAC)
Based on analysis of satellite imagery, the Darwin VAAC reported that during 7-8 and 10-11 January ash plumes from Barren Island rose to altitudes of 1.8-2.4 km (6,000-8,000 ft) a.s.l. and drifted W and SW.
Source: Darwin Volcanic Ash Advisory Centre (VAAC)
Based on analysis of satellite imagery, the Darwin VAAC reported that during 4-6 January ash plumes from Barren Island rose to an altitude of 2.4 km (8,000 ft) a.s.l. and drifted SW and NW.
Source: Darwin Volcanic Ash Advisory Centre (VAAC)
The Darwin VAAC reported that during 7-8 December pilots observed lava flows on Barren Island; ash plumes were not present. Thermal anomalies were detected on satellite imagery.
Source: Darwin Volcanic Ash Advisory Centre (VAAC)
Based on a pilot observation, the Darwin VAAC reported a lava flow from Barren Island on 17 November. A possible low-level ash plume was seen drifting W on satellite imagery. On 18 November, a pilot reported that an ash plume rose to an altitude of 2.4 km (8,000 ft) a.s.l. and drifted WSW.
Source: Darwin Volcanic Ash Advisory Centre (VAAC)
Thermal anomalies detected by MODIS satellite instruments have occurred at Barren Island from 12 May 2008 through 7 July. Prior to May anomalies had not been recorded since early October 2007. The Indian Coast Guard also reported red glow at night from the central summit area during the second half of June 2008.
Sources: Hawai'i Institute of Geophysics and Planetology (HIGP) Thermal Alerts Team; D. Chandrasekharam, Dept. Earth Sciences, Indian Institute of Technology Bombay
Based on observations of satellite imagery, the Darwin VAAC reported that an ash plume from Barren Island rose to an altitude of 1.5 km (5,000 ft) a.s.l. and drifted S on 23 December.
Source: Darwin Volcanic Ash Advisory Centre (VAAC)
Based on pilot reports, the Darwin VAAC reported that a diffuse ash plume from Barren Island reached an altitude of 2.1 km (7,000 ft) a.s.l. and drifted S on 3 March.
Source: Darwin Volcanic Ash Advisory Centre (VAAC)
Based on satellite imagery, the Darwin VAAC reported that an ash plume from Barren Island reached an altitude of 3 km (10,000 ft) a.s.l. and drifted SW on 8 February.
Source: Darwin Volcanic Ash Advisory Centre (VAAC)
The Darwin VAAC reported that a diffuse plume from Barren Island was visible on satellite imagery on 27 November. The height and direction of the plume were not reported.
Source: Darwin Volcanic Ash Advisory Centre (VAAC)
Based on satellite imagery, the Darwin VAAC reported that diffuse plumes from Barren Island on 8 November reached altitudes of 3 km (10,000 ft) a.s.l. and drifted SW and W.
Source: Darwin Volcanic Ash Advisory Centre (VAAC)
Based on pilot observations, the Darwin VAAC reported that ash-and-steam plumes from Barren Island on 19 and 20 October reached altitudes of 1.5 km (5,000 ft) a.s.l. and drifted WNW.
Source: Darwin Volcanic Ash Advisory Centre (VAAC)
Indian Coast Guard officials noted in a news report on 23 September that the continuing eruption at Barren Island was decreasing in intensity. A surveillance report stated that there was less lava but more "smoke" coming from the volcano.
Source: The Hindu
Based on a pilot report, the Darwin VAAC reported an ash plume from Barren Island on 26 May that reached an altitude below 3 km (10,000 ft) a.s.l. and drifted N at 1230.
Source: Darwin Volcanic Ash Advisory Centre (VAAC)
On 3 May, low-level ash plumes from Barren Island were visible on satellite imagery extending N.
Source: Darwin Volcanic Ash Advisory Centre (VAAC)
A plume emitted from Barren Island was visible on satellite imagery on 2 May at a height near 3.7 km (12,000 ft) a.s.l.
Source: Darwin Volcanic Ash Advisory Centre (VAAC)
A low-level plume emitted from Barren Island was visible on satellite imagery on 19 April extending westward.
Source: Darwin Volcanic Ash Advisory Centre (VAAC)
Based on information from a pilot report and satellite imagery, the Darwin VAAC reported that an ash plume was emitted from Barren Island during 5-6 April. The plume did not rise higher than 4.6 km (15,000 ft) a.s.l.
Source: Darwin Volcanic Ash Advisory Centre (VAAC)
According to a news article, a team of scientists that visited Barren Island around 12 March found that the volcano was still very active and the height of the volcanic cone had increased by 50 m since eruptive activity began in May 2005. In addition, lava flows covered the NW side of the island.
Source: Indo-Asian News Service
During 12-13 January, a team from the Geological Survey of India visited Barren Island. They reported that dense clusters of incandescent tephra of various sizes were ejected from the crater. In addition to the eruption from the main crater, the scientists saw incandescence on the N flank of the volcanic cone and thin layers of incandescent material on the W slope. In comparison to activity during the early stages of the eruption in May-June 2005, activity had diminished considerably. The Darwin VAAC reported that ash plumes emitted from Barren Island during 26-27 January rose to ~3 km (10,000 ft) a.s.l.
Sources: Darwin Volcanic Ash Advisory Centre (VAAC); Geological Survey of India
Satellite imagery showed a thin ash plume emitted from Barren Island extending WNW during 5-7 January.
Source: Darwin Volcanic Ash Advisory Centre (VAAC)
During 21-23 December, ash plumes from Barren Island were visible on satellite imagery at a maximum height of 4.6 km (15,000 ft) a.s.l. on the 21st.
Source: Darwin Volcanic Ash Advisory Centre (VAAC)
An ash plume emitted from Barren Island was visible on satellite imagery on 19 and 20 December at a maximum height of ~3.7 km (12,000 ft a.s.l.).
Source: Darwin Volcanic Ash Advisory Centre (VAAC)
An increase in volcanic activity at Barren Island began on 4 November. During 12-15 November, ash plumes emitted from Barren Island were visible on satellite imagery drifting predominately SSW. Ash was no longer visible on satellite imagery on 16 November. Barren Island began erupting on 28 May 2005.
Source: Darwin Volcanic Ash Advisory Centre (VAAC)
A news article reported on 9 November that volcanic activity increased at Barren Island beginning on 4 November. According to Professor Chaandrasekharam of the Indian Institute of Technology and members of the Indian Coast Guard, since the 4th there were large volumes of gas and ash emissions, and lava flows reached the sea. Professor Chaandrasekharam stated that the current activity is more intense than when the eruption began on 28 May 2005. The recent activity was preceded by nearly ten earthquakes in the region, including M 4.8 and 4.5 earthquakes on 3 November.
Source: Press Trust of India
A low-level plume from Barren Island was visible on satellite imagery on 21 October extending WNW. Barren Island began erupting on 28 May 2005.
Source: Darwin Volcanic Ash Advisory Centre (VAAC)
During 9-11 October, a plume emitted from Barren Island was occasionally visible on satellite imagery at a height of ~3 km (10,000 ft) a.s.l. Barren Island began erupting on 28 May 2005.
Source: Darwin Volcanic Ash Advisory Centre (VAAC)
Low-level plumes from Barren Island were visible on satellite imagery on 28 September and 2 October. The current eruption of Barren Island began on 28 May 2005.
Source: Darwin Volcanic Ash Advisory Centre (VAAC)
A pilot observed a plume emitted from Barren Island on 23 September around 1230 at a height of ~3 km (10,000 ft) a.s.l., extending ~90 km E. On 27 September, a low-level plume was visible on satellite imagery drifting NE. The current eruption of Barren Island began on 28 May 2005.
Source: Darwin Volcanic Ash Advisory Centre (VAAC)
On 1 September, a plume from Barren Island was visible on satellite imagery at a height of ~3 km (10,000 ft) a.s.l. extending ~90 km NE of the summit. The current eruption of Barren Island began on 28 May.
Source: Darwin Volcanic Ash Advisory Centre (VAAC)
A plume from Barren Island was visible on satellite imagery on 25 August at a height of ~4.6 km (15,000 ft) a.s.l. Plumes were visible at a height of ~3 km (10,000 ft) a.s.l. on 29 and 30 August according to a pilot report and satellite imagery, respectively. All plumes drifted E. The current eruption began on 28 May.
Source: Darwin Volcanic Ash Advisory Centre (VAAC)
A pilot reported a plume from Barren Island on 18 August at a height of ~3 km (10,000 ft) a.s.l. Ash was not visible on satellite imagery. Barren Island began erupting on 28 May.
Source: Darwin Volcanic Ash Advisory Centre (VAAC)
According to a pilot's report, ash was visible near Barren Island on 18 July at 0211 at a height of ~6.1 km (~20,000 ft) a.s.l. Ash was observed on satellite imagery on 18 July at 0755 below a height of 4.6 km (15,100 ft) a.s.l.
Source: Darwin Volcanic Ash Advisory Centre (VAAC)
According to a news article, after visiting Barren Island on 14 June scientists determined that volcanic activity had increased since it was first noted on 28 May. Pyroclasts were hurled as high as 100 m above the volcano. The eruption occurred from a new vent on the SW rim of the volcano's crater.
Source: PTI News
Professor Chandrasekharam, from the Indian Institute of Technology, reported that the volcanic activity that began at Barren Island on 28 May continued through 6 June when fresh lava emissions were observed by the Indian Coast Guard. Large amounts of steam were emitted due to the interaction of heavy rains and the hot lava.
According to Dhanapati Haldar, from the Presidency College, Strombolian activity on Barren Island consisted of lava fountaining to a height of ~100 m and "dark smoke" rising to ~1 km above the volcano. Lava accumulated on the W side of the main volcanic cone.
Sources: Dhanapati Haldar, Presidency College; Professor Chandrasekharam from the Indian Institute of Technology
Professor Chandrasekharam, from the Indian Institute of Technology, reported that Indian Coast Guards noticed an eruption at Barren Island that began on the morning of 28 May. During the flank eruption on the NW side of the volcano's central cone, black lava was emitted that did not reach the sea. According to the Darwin VAAC, there were reports of a plume at a height below 3 km (10,000 ft) a.s.l. drifting N on 29 May at 1330.
Sources: Darwin Volcanic Ash Advisory Centre (VAAC); Professor Chandrasekharam from the Indian Institute of Technology
Reports of increased volcanic activity at Barren Island and Narcondam volcanoes during the week of 2 January were found to be false. Professor Chandrasekharam from the Indian Institute of Technology reported that as of 4 January no unusual volcanic activity was occurring at these volcanic islands. Newspaper reports of active "mud volcanoes" in the Andaman Islands caused a great deal of concern and confusion.
Backgrounds. Barren Island, a possession of India in the Andaman Sea about 135 km NE of Port Blair in the Andaman Islands, is the only historically active volcano along the N-S-trending volcanic arc extending between Sumatra and Burma (Myanmar). The 354-m-high island is the emergent summit of a volcano that rises from a depth of about 2,250 m. The small, uninhabited 3-km-wide island contains a roughly 2-km-wide caldera with walls 250-350 m high. The caldera, which is open to the sea on the W, was created during a major explosive eruption in the late Pleistocene that produced pyroclastic-flow and -surge deposits. The morphology of a fresh pyroclastic cone that was constructed in the center of the caldera has varied during the course of historical eruptions. Lava flows fill much of the caldera floor and have reached the sea along the western coast during eruptions in the 19th century and more recently in 1991 and 1995.
Narcondum volcano, an island possession of India in the Andaman Sea, is part of a volcanic arc that continues northward from Sumatra to Burma (Myanmar). The small 3 x 4 km wide conical island, located about 130 km E of North Andaman Island, rises to 710 m, but its base lies an additional 1,000 m beneath the sea. The island is densely vegetated, bounded by cliffs on the southern side, and capped by three peaks. No evidence of historical volcanism is present, although the summit region is less densely vegetated and volcanism at the andesitic volcano is considered to have continued into the Holocene. The island's name means "pit of hell," although the name could have been mistakenly transferred from the historically active Barren Island volcano, 140 km to the SSW.
Source: Professor Chandrasekharam from the Indian Institute of Technology
A team of scientists from India and Italy who visited Barren Island during 3-6 February found fumaroles on parts of the volcano's SW cone that reached temperatures up to 101°C. Neither magma nor gas emissions were observed in any of the various cones. The ground temperature was relatively high (40°C) from the middle to the upper part of the western cone and steaming ground was clearly visible at many sites. Several steam vents were visible within the 1995 lava flows. Blue fumes, which are indicative of the presence of SO2, and the smell of acidic gases were not recorded.
Reports are organized chronologically and indexed below by Month/Year (Publication Volume:Number), and include a one-line summary. Click on the index link or scroll down to read the reports.
Explosions and lava flows from NE flank vent
Reports of strong emissions of "thick smoke" on 30 April prompted a visit to the island on 16 May by geologists from the GSI [see additional information about the start of the eruption in 16:10]. Lava poured continuously from a subsidiary vent on the NE face of the central volcanic cone, travelling N into a valley, then W along the course of the 1803 lava flow (figure 1). An area of ~800 x 200 m had been covered by fresh lava, with an average thickness of 5-6 m. Explosions at the vent occurred at intervals of several seconds, ejecting bombs, lapilli, and ash to heights >50 m.
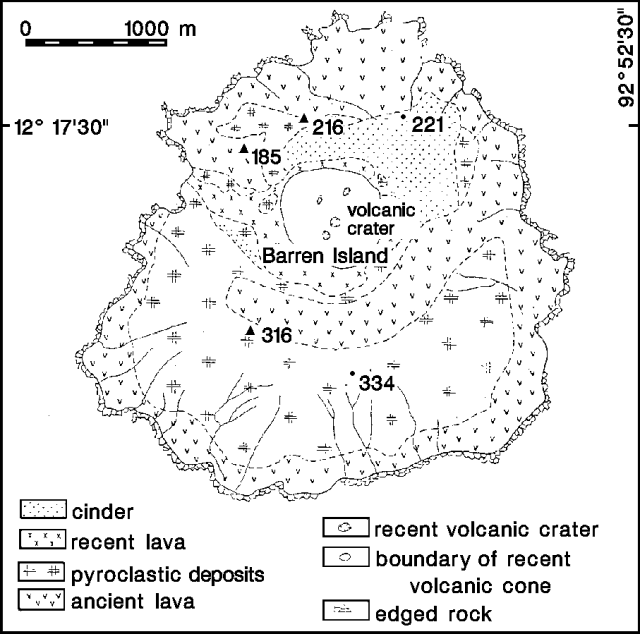 |
Figure 1. Geologic sketch map of Barren Island, by D. Haldar, T. Laskar, and J.K. Biswas. Courtesy of the GSI. |
On 7 June at 1602, John Deed, pilot of Thai Airways International flight 307, observed a gray to dark-gray plume rising ~3 km above the summit and extending roughly 90 km NE. No lava was visible.
Information Contacts: Director General, GSI; Deputy Director General, GSI Eastern Region; T. Fox, ICAO.
Basaltic andesite lava from flank vent reaches sea
Lava production continued from the subsidiary vent on the NE face of the volcanic cone, 80 m below the main crater, during a visit on 26 June. Incandescent material was ejected in a pulsating fountain, to [80] m height, more intensely than during the previous visit on 16 May. Satellite monitoring had indicated a temperature of 1,100°C around the vent on 6 May. A dark plume rose 300-400 m from the crater of a large spatter cone that had formed at the eruptive vent. The main crater remained quiet. The lava flow observed in May had bifurcated, with one branch extending along the NW and W valleys, and a new branch extending S. By 26 June, lava had reached the sea at the boat landing near the NW corner of the island (~1.2 km from the vent); during the 16 May fieldwork, the lava front was still 200 m from shore. Vigorous boiling and thick jets of steam were observed for 100 m along the shore. Studies of water near the shore indicated a considerable decrease in pH, and visibility dropped to <10 cm (Srinivas, 1991). Nearby coral was destroyed.
The following is from a GSI report on lava chemistry and petrography. "Thirteen chemical analyses on samples of recent lava collected on 16 May indentify the rocks as basaltic andesites (table 1). They are porphyritic with phenocrysts of plagioclase (dominant; some grains show labradorite composition), with minor clinopyroxene (augite) and forsteritic olivine, set in a fluidal [intersertal] groundmass of brown glass, plagioclase microlites, and Fe-Ti oxides. The amount of mafic phenocrysts is relatively low. The average ratio between phenocryst and groundmass components is around 0.44. The volumetric composition of the phenocrysts indicates: 72% plagioclase, 17% clinopyroxene, and 11% olivine; while the groundmass consists of 43% plagioclase microlites, 37% glass, and 20% Fe-Ti oxides. The amount of glass in the groundmass is highly variable, exceeding 70% in some sections. There is a complete lack of amphibole grains, in both the phenocrysts and [in] the groundmass."
Table 1. Range and average compositions from 13 chemical analyses of recent lava erupted from Barren Island, collected 16 May 1991. Courtesy of the GSI.
| Element | Range (%) | Average (%) |
| SiO2 | 54.96-56.33 | 55.64 |
| TiO2 | 1.13-1.18 | 1.15 |
| Al2O3 | 17.66-18.62 | 18.20 |
| Fe2O3 | 5.39-9.44 | 6.32 |
| FeO | 0.36-4.23 | 2.36 |
| MnO | 0.18-0.19 | 0.185 |
| MgO | 3.29-3.59 | 3.39 |
| CaO | 7.52-7.93 | 7.79 |
| Na2O | 1.75-2.19 | 2.01 |
| K2O | 0.58-0.79 | 0.69 |
| P2O5 | 0.14-0.18 | 0.16 |
| L.O.I. | 0.16-0.48 | 0.31 |
Information Contacts: Director General, GSI; S. Acharya, SANE.
Eruption plume on satellite image
The eruption was apparently continuing on 17 October, when a NOAA 11 satellite image (at 1354) showed a plume extending ~150 km WNW from a point source at the volcano.
Information Contacts: W. Gould, NOAA.
Eruption likely started by early April; activity apparently declines after cone collapse
SANE provided additional information . . . from passing ships and aircraft, and occasional visits. The eruption's start date remained uncertain, but the first reported activity consisted of gusts of hot air from the N end of the crater on 28 March, and "smoke" observed from a Coast Guard aircraft on 6 April. By 1 May, intensified activity and bigger plumes were seen from ships, and pilots observed numerous dead fish near the island on 9 May. When a GSI team reached Barren Island on 16 May, lava had covered an 800 x 200 m area, and by their next visit on 26 June (16:5 & 8) lava had reached the sea. Continued lava production was reported through July, and accompanying pulsating columns of incandescent tephra were ejected to roughly 60 m height twice in five minutes during observations from Navy aircraft on 30 July. Little information was available on August and September activity.
The eruption was continuing on 24 October, but the 1991 cone collapsed shortly thereafter and only small amounts of "smoke" were intermittently observed during the first week in November.
Information Contacts: S. Acharya, SANE; D. Shackelford, Fullerton, CA.
Secondary steam explosions from lava-flow front; minor fuming from crater
Members of SANE visited . . . in mid-Nov. Since July, the active cone had grown to ~320 m asl and its crater was estimated at 250-300 m in diameter [but see 17:1]. During the 2.5-hour visit, eleven secondary steam explosions occurred from the lava flow at the coast. Incandescent material was sometimes visible after waves struck the flow front. Some regrowth of scorched plants had occurred on the SW corner of the island, and birds had returned. Although no plume was evident from the ground in mid-Nov, three Indian Navy pilots observed fuming during a later overflight, and minor fuming from two vents was visible during fieldwork on 30 November.
Information Contacts: S. Acharya, SANE; D. Shackelford, Fullerton, CA.
Crater enlarges; ash mantles lava surface
By the time of the 15 November visit by members of SANE (16:12), the 1991 cone had enlarged considerably, burying the pre-existing central cone. Partial collapse had occurred on one side of the active cone. The new cone's rim was irregular in height. When they returned during the third week in December, ~2 m of ash mantled the surface of the still-hot lava flow. Gases escaping from the lava formed rootless vents on the ash surface.
Early 1992 fieldwork by the GSI revealed a cooling lava flow and significant morphological changes to the active cone. Gas emerged from rootless vents 2-3 m in diameter and 1 m deep in the ash-covered surface of the flow, where sulfur and reddish oxides were being deposited. The base of the cone was strewn with broken blocks ranging in size from 2 to 75 cm. The height of the now crescent-shaped crater had declined from 305 m to not more than 225 m above sea level, but its diameter had increased from a pre-eruption 60 m to [~400 m]. Two cinder cones [~8-10 m high] had developed in the W part of the lava field, ~100 and 130 m W of the main cone, respectively.
Information Contacts: Director General, GSI, Calcutta; S. Acharya, SANE, Port Blair; D. Shackelford, Fullerton, CA.
Continued gas emission from central crater and lava flow; animal and plant life recovering
A multidisciplinary team from the GSI, IMD, CARI, and the Wildlife Dept visited Barren Island on 21-22 May. Hot gas was emerging from the funnel-shaped [300-m-deep] crater, which had an estimated diameter of [400 m] at the rim. The 1991 lava flow that extended to the coast was covered with rain-compacted scoriae and ash, and had a smooth, flat surface like a paved road. The flow's surface temperature was 40°C, but at 1/3 m depth it exceeded the thermometer's 360°C limit. Gases were emitted from small holes in the flow. A portable seismograph recorded several mild seismic events.
Some burnt ficus trees on the NW coast were sprouting new shoots, but badly charred ones appeared dead. Crabs were plentiful, even on the lava flow, and 25 feral goats were counted in one hour in the surrounding hills. Many birds were visible, but rats were completely absent. The water around the island was clear and of normal temperature, and fish were observed.
Further References. Haldar, D., Laskar, T., Bandyapadhyay, P.C., Sarkar, N.K., and Biswas, J.K., 1992, Volcanic eruption of the Barren Island volcano, Andaman Sea: J. of the Geological Society of India, v. 39, no. 5, p. 411-419.
Haldar, D., Laskar, T., Bandyapadhyay, P.C., Sarkar, N.K., and Biswas, J.K., 1992, A note on the recent eruption of the Barren Island volcano: Indian Minerals, v. 46, no. 1, p. 77-88.
Information Contacts: S. Acharya, SANE.
Minor gas emissions; animal populations recovering from 1991 eruption
A scientific team from the GSI and the Zoological Survey of India visited Barren Island on 8-9 April 1993 to assess the impact of the 1991 eruption on the distribution, habit, and abundance of fauna. Gas emissions were seen coming from small openings in the lava flows near the NW coast, but were not observed from the central crater, which had exhibited fumarolic activity at least as late as May 1992. Water temperatures around the island were normal, except for near the landing area on the NW coast where a temperature of 45°C was recorded. Atmospheric temperature was generally 40-50°C, higher near the NE crater rim.
The eruption reduced the number of bird species and the total bird population; many species that migrated during the eruption have not yet returned. Out of 16 previously reported species, only six were observed during this visit, of which the Pied Emperial Pigeon (Ducula bicolor) was the most abundant. A night survey encountered only one rat species (Rattus rattus) and 51 species of insects from eight orders. Bones of rats, birds, and charred remains of land crabs were commonly seen. No live land crabs or butterflies were observed, though crabs were plentiful during fieldwork by other scientists in May 1992. Feral goats (Capra hircus) were the most noticeable wildlife on the island. The goats have survived well since being brought to the island in 1891, and their population remained almost intact after the eruption, possibly because they took shelter on the S slope of the island.
Information Contacts: K. Chandra, Zoological Survey of India.
New eruption on 20 December; lava flows reach the ocean
A new eruption . . . was first noticed by the Indian Navy on 20 December 1994. A team composed of scientists from the GSI and Zoological Survey of India arrived at the island early on 24 January, and an aerial survey . . . was made on the 31st. As of 22 February, this mainly Strombolian eruption was still "in its initial stage, gradually gaining momentum."
During January and February, thick clouds of pale brownish gas, dark ash particles, and white steam from the crater area were rising ~200 m at intervals of 30 seconds, accompanied by continuous rumbling and intermittent "cracking" sounds. Two new vents were active, the first within the main crater near the SW corner, and the second ~50 m from the summit down the SW flank. The eruption is believed to have started from the flank vent, around which a new 100-m-diameter subsidiary crater had formed.
Incandescent material (cinder and volcanic bombs) rising to heights of 20 m could be seen from 4 km offshore. Particles ranged in size from a few cubic centimeters to ~1 m3, with the average size being slightly less than 10 cm3. Ejecta filled a valley on the S side of the western-most 1991 lava bed. Lava flows traveled ~1.5 km from the active vents into the sea, producing profuse steaming at the ocean entry. The moving lava front was ~50 m wide and 6 m thick by 22 February. Megascopically the lava was basaltic andesite, similar to that erupted during September 1991, with a high percentage of large plagioclase phenocrysts and frequent olivine in a dark-gray glassy groundmass.
On 9 March at around 0530 GMT astronauts on the Space Shuttle noticed a small plume rising from Barren Island. They made a short video recording (~15 seconds) showing a V-shaped plume that extended for ~3 km before dispersing. Visible imagery from the NOAA-14 (at 0730 GMT) and GMS (0430-0830 GMT) satellites failed to reveal a volcanic plume. A photograph taken from the Shuttle on 14 March at 0749 GMT again showed a small plume blowing W towards the Andaman Islands (figure 2). As this issue went to press, an aviation notice to airmen (NOTAM) on 27 March stated that the intensity of the eruption was unpredictable and advised all aircraft to avoid overflying the area.
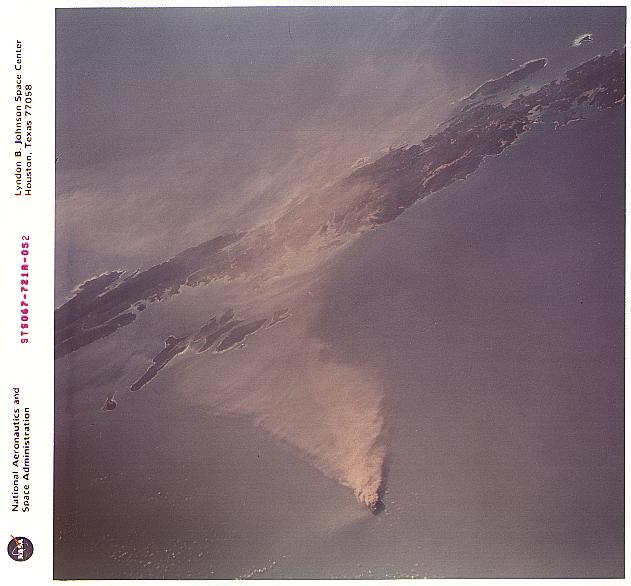 |
Figure 2. Oblique photograph of the Barren Island eruption plume taken from the Space Shuttle, 14 Mar 1995 at 0749 GMT, looking NW. Ash plume is blowing generally W towards the Andaman Islands. NASA photograph STS 067-721A-052. Courtesy of Cindy Evans. |
Information Contacts: Director General, GSI; C. Evans, NASA-SSEOP; J. Lynch, SAB.
Ash plumes from three vents; fire fountaining and lava flows
The GSI made an aerial survey on 2 March and a land survey on 8 March 1995 to monitor the ongoing eruption . . . . Surveys in late January revealed mainly Strombolian emissions from two vents near the S crater wall (figure 3; vents A and B). Lava flows had reached the sea by the end of January.
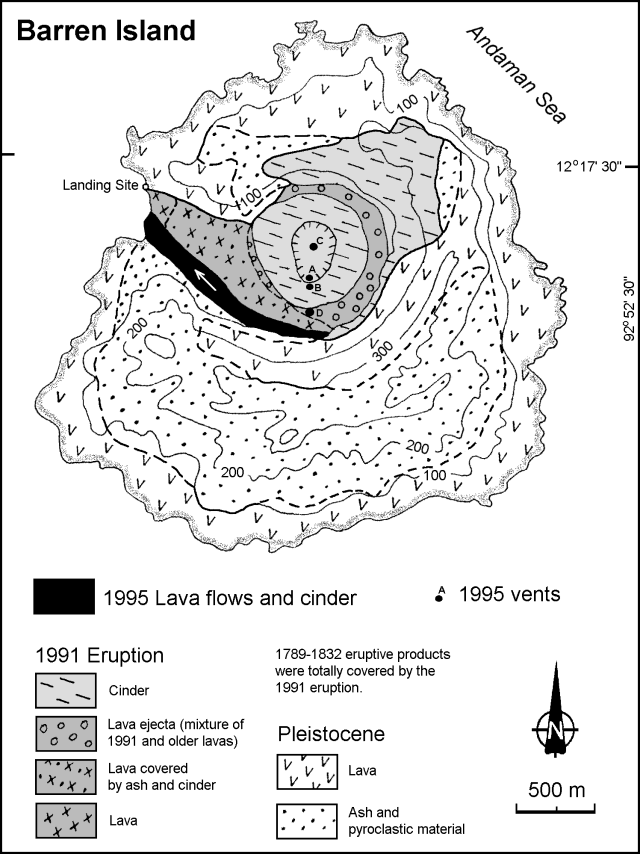 |
Figure 3. Geologic sketch map of Barren Island showing lava flows and distribution of volcanic products from the 1995 and 1991 eruptions. Modified from Haldar and others (1992); courtesy of the GSI. |
The GSI Photogeology and Remote Sensing Division analyzed seven Landsat TM IRS images . . . from November 1994 through February 1995. No signs of eruption were seen on 6 November or 8 December, but conspicuous activity was present on 29 December 1994. Vigorous activity was noted on 9 January. An image from 20 January showed decreasing emissions, but on 25 January the eruption was increasing again. Billowing smoke could be seen through gaps in the cloud cover on 11 February. The lava surface temperature was estimated to be well above 1,000°C on 9 and 25 January, based on preliminary analysis of a few thermally radiant pixels.
On 2 March aerial observers noted thick columns of dark to yellowish gray gas followed by white fumes gushing vigorously from the two vents active in late January. The gas column was rising ~1 km, and the eruption was confined to the S side of the summit crater. Denser air containing volcanic aerosols was encountered ~90 km WSW of the volcano at an altitude of ~2,100 m. Very dense air was noticed ~35 km W, and a very thick gas and smoke cloud was encountered ~15 km W at a height of ~1,500 m.
On 8 March the eruption was largely characterized by phreatomagmatic explosions. In addition to the two previously mentioned vents, the pre-existing conduit in the center of the 1991 crater (figure 3; vent C) was vigorously active. Huge billowing dark emissions from all three summit vents were followed by thick jets of white fumes at intervals of 30-60 seconds, with deep thundering explosions. The combined eruption column rose ~1.5 km before being blown SW by the wind into a horizontal plume. Space Shuttle astronauts observed this plume blowing generally W on 9 and 14 March (20:02).
A fourth vent had also opened at the S foot of the existing volcanic cone by 8 March (figure 3; vent D). It had constructed a small spatter cone from which thick lava was pouring out and a fire fountain was rising ~30 m. Ground temperature ~100-300 m from the foot of the cone was 62-83°C. Hot lava was cascading into the sea along the NW shore, ~200 m S of the landing site, causing the seawater to boil profusely. The lava front thickness had increased from ~6 m on 24 January to ~10 m on 8 March. Ejecta ranged in size up to 10 x 18 x 25 cm. Extensive ashfalls covered the S and W parts of the island, and ash was seen falling as far as 10 km S of the island. Marine life has not been seriously affected; fish were observed ~500 m from shore. Birds were also seen flying over the N part of the island.
Reference. Haldar, D., Laskar, T., Bandyopadhyay, P.C., Sarkar, N.K., and Biswas, J.K., 1992, Volcanic eruption of the Barren Island volcano, Andaman Sea: Journal of the Geological Society of India, v. 39, p. 411-419.
Information Contacts: Director General, GSI; Deputy Director General, GSI Eastern Region.
Lava flow from W flank of cone; central vent explosions
The GSI visited . . . again on 11 May. At that time only the central conduit was vigorously active, with continuing phreatomagmatic eruptions. The vents near the S crater wall and S foot of the volcanic cone, sites of strong activity on 8 March (20:04), were inactive. Seawater temperature at the only landing site ranged widely from 38 to 70°C, and atmospheric temperatures were 70 and 55°C at distances of ~10 and 15 m, respectively, from the advancing lava front.
Fire fountains from the central vent rose to a height of ~150 m. Dark fumes sometimes attained a height of ~400 m. The eruption column was ~100 m across and fed a mushroom-shaped cloud over the crater region. Approximately 90% of the activity from the main conduit was explosive, but eruptive pulses occurred without rumbling sounds. Eruption column fall-out consisted of profuse quantities of cinder, ash, and rock debris.
A new vent at the W foot of the cone, ~1.5 km ESE of the landing site, exhibited continuous emission of very liquid lava and bluish fumes, but no explosive activity. The lava erupted from this vent formed a 15-m-high and 70-m-wide flow front that was slowly advancing W towards the landing site, threatening to engulf it. The lava flow was advancing at a rate of ~2 m/hour on 11 May.
The 1995 lava is a basalt (50.4-52.3% SiO2 and 2.5-3.1% Na2O + K2O) with mega-xenocrysts of plagioclase, clinopyroxene, and olivine in decreasing abundance. The groundmass is composed of glass, plagioclase microlites, and Fe-Ti oxides showing intersertal to very rare fluidal texture. The 1995 lava differs from the lava erupted in 1991 in its absence of wall-rock xenoliths, its greater abundance of mega-xenocrysts, and its groundmass texture. Major elements were determined for ten samples of January 1995 lava. Compared to 1991 lavas (13 samples), the 1995 basalt is deficient in SiO2 and K2O (although total alkali values are similar), but enriched in Al2O3, CaO, and MgO.
Information Contacts: Director General, GSI; Deputy Director General, GSI Eastern Region.
Eruption apparently ends by late June, but aviation notice posted on 2 December
Based on observations in late June 1995, the Indian Coast Guard reported on 1 July that explosive activity in the crater area had stopped, but gas emissions were still coming from the area near the coast. On 2 December an aviation Notice to Airmen (NOTAM) was issued from the United Kingdom for increased activity at Barren Island. However, no eruptive activity was seen on GMS satellite imagery over the area.
Landsat TM images from January 1995 (20:04) showed activity from a subsidiary vent on the S slope of the central crater. Subsequent images from 24 February, 13, 14, and 30 March, and 15 April 1995 also revealed activity from the central crater. Some of the images showed a lava or debris flow present in the WNW channel leading towards the sea. A thermal infrared image on 13 March showed a large hot central vent, and at least two subsidiary vents on the S slope; the image also revealed a lava passageway and the cooler plume.
Further Reference. Haldar, D., Chakraborty, S.C., and Chakraborty, P.P., 1996, The 1995 eruption of the Barren Island volcano in the Andaman Sea: Records, Geological Survey of India, v. 129(3), p. 59-62.
Information Contacts: D. Haldar, Director, GSI Eastern Region, Calcutta; J. Lynch, SAB.
Naval aircraft flight crew sights unconfirmed "volcanic emission of smoke"
On 13 January a volcanic ash advisory statement was issued based on an unspecified naval aircraft report of observed "volcanic emission of smoke" from Barren Island at 1303 GMT. There was no evidence of a plume or ash cloud on either visual or infrared GMS satellite imagery at 0332 or 0425 GMT earlier that day.
Barren Island, a possession of India in the Andaman Sea about 135 km NE of Port Blair in the Andaman Islands, is the only historically active volcano along the N-S-trending volcanic arc extending between Sumatra and Myanmar (Burma). The small, 3-km-wide island contains a 1.6-km-wide somma open to the west with a fresh pyroclastic cone in its center that has been the source of historical eruptions. Lava flows have reached the sea along the western coast during eruptions in the early 19th century and more recently in 1991 and 1995.
Information Contacts: Darwin Volcanic Ash Advisory Centre, Bureau of Meteorology, Northern Territory Regional Office, PO Box 40050, Casuarina, Northern Territory 0811, Australia (URL: http://www.bom.gov.au/info/vaac/).
Fumarolic activity noted during fieldwork in February
A team of scientists from India and Italy carried out detailed geological, volcanological, geochemical, and geothermal investigations on Barren Island (figures 4 and 5) during 3-6 February 2003. The scientific team, led by Dornadula Chandrasekharam, included Piero Manetti, Orlando Vaselli, Bruno Capaccioni, and Mohammad Ayaz Alam. The Indian Coast Guard vessel CGS Lakshmi Bai carried the team from Port Blair on 3 February 2003; the journey takes ~5-6 hours depending on sea conditions. Because of the great depths around the island, it is not possible to anchor, so the team was ferried to the island in a small rubber boat. After the ship returned on the morning of 6 February, a trip around the island was made to see the steep seaward face of the prehistoric caldera wall.
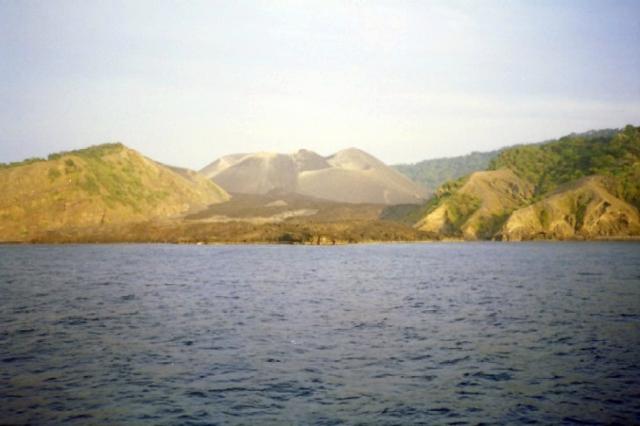 |
Figure 4. Barren Island as seen from the vessel CGS Lakshmi Bai on 3 February 2003. Courtesy of D. Chandrasekharam and others. |
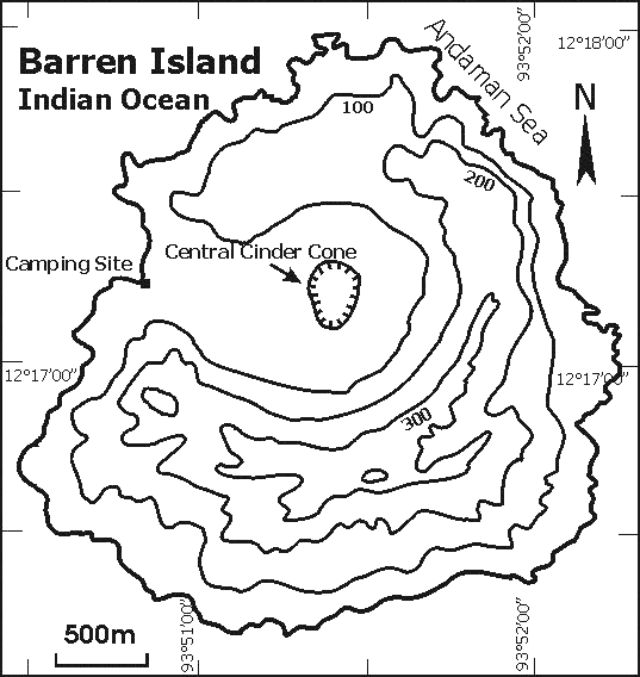 |
Figure 5. Preliminary sketch map of Barren Island. Courtesy of D. Chandrasekharam and others. |
The volcano consists of a caldera, which opens towards the W, with a central polygenetic vent enclosing at least five nested tuff cones. Two spatter cones are located on the W and SE flanks of the central cone (figure 6).
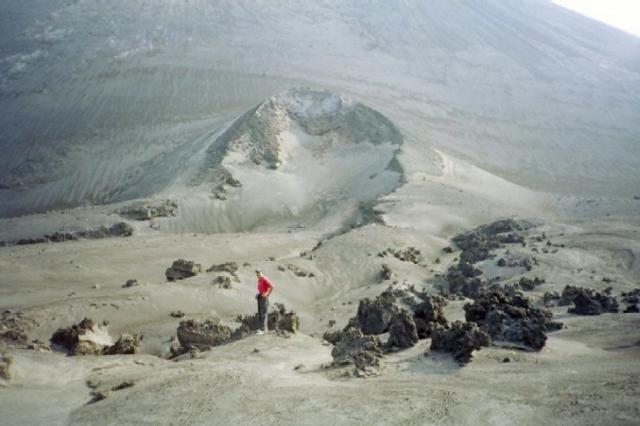 |
Figure 6. A spatter cone on the SW flank of the central cinder cone at Barren Island around 3 February 2003. Courtesy of D. Chandrasekharam and others. |
An eruption in 1991 ended more than 200 years of quiescence. Another eruption in 1994-95 left two spatter cones on its SE and W flanks. From these vents two aa lava flows poured out, both reaching the sea, during two distinct eruptive phases separated by ashfall. The lava flow created a delta into the sea (figure 7). There has been no documented eruptive activity since 1995, but Indian Coast Guards informed the team of renewed activity (strong gas and possible lava emission) in January 2000. The volcano currently exhibits continuing fumarolic activity. Steaming ground was visible at numerous places on the island.
 |
Figure 7. Lava from the 1994-95 eruptions on Barren Island formed a tongue that reached the sea. Courtesy of D. Chandrasekharam and others. |
On 5 February the team climbed the summit of the central cinder cone that showed strongly fumarolic (but not presently active) areas with layers of sulfur deposits (figure 8). The ascent to the crater was relatively difficult since the material on the very steep slope was loose (figure 9). Neither magma nor gas emissions were observed within the craters of the different cones. From the middle to the upper part of the W cone, the ground temperature was relatively high (>40°C), and steaming ground was visible at different sites. Fumarolic activity, with temperatures up to 101°C, was mainly concentrated along the upper crater wall of the SW cone. Blue fumes (indicative of SO2) and the aroma of acidic gases such as HCl were not recorded.
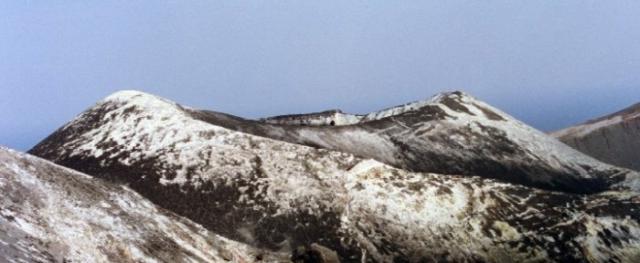 |
Figure 8. Fumarolic deposit on top of the central cinder cone at Barren Island on 5 February 2003. Courtesy of D. Chandrasekharam and others. |
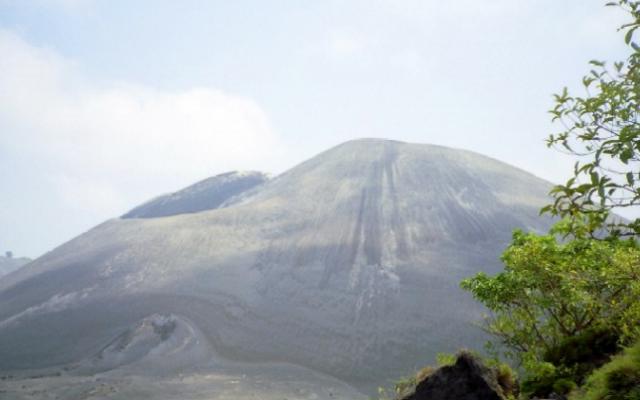 |
Figure 9. Central cinder cone showing steep slopes at Barren Island on 5 February 2003. Courtesy of D. Chandrasekharam and others. |
The pre-caldera deposits were characterized by more than five lava flows (prehistoric?) separated by scoria-fall beds and minor ash, tuff, and cinder deposits. The lava flows varied in thickness from 2 to 3 m, whereas the pyroclastic layers vary in thickness from 1 to 4 m. These lava flows could be clearly seen towards the N part of the main caldera. Towards the SE part of the inner caldera a 5-m-wide, NNE-SSW trending dike was observed. This feeder dike was fine-to-medium grained and contains buff-colored olivine, green pyroxene, and plagioclase phenocrysts. The N and NW part of the caldera has been mantled by a ~50-m-thick sequence of breccias and tuff representing syn/post-caldera phreatic and hydromagmatic activity, whereas the products of a small littoral cone occured mainly towards the W side. The lava flows of the main caldera were highly porphyritic with phenocrysts of green pyroxene (~3 cm) and plagioclase feldspars. Several steam vents could be seen within the 1994-95 lava flows. Some of these vents exhibited a lack of steam emanations at the time of the visit.
The outer and part of the inner caldera contains thick vegetation, which escaped the fury of the recent eruptions. Feral goats and rats dominate the island. Two fresh-water springs were discovered towards the SE part of the caldera. This is possibly the fresh water source for the goats living in this island. Chemical analysis indicates that the water from the springs is potable.
Information Contacts: Dornadula Chandrasekharam, Department of Earth Sciences, Indian Institute of Technology, Bombay 400076, India (URL: http://www.geos.iitb.ac.in/index.php/dc); Piero Manetti, Italian National Science Council (CNR), Institute of Geosciences and Earth Resources (CNR-IGG), Viale Moruzzi, 1, 56124 Pisa, Italy; Orlando Vaselli, Department of Earth Sciences, University of Florence, Via G. La Pira, 4 - 50121 Florence, Italy; Bruno Capaccioni, Institute of Volcanology and Geochemistry, University of Urbino, Loc. La Crocicchia, 61029 Urbino, Italy; Mohammad Ayaz Alam, Research Scholar, Department of Earth Sciences, Indian Institute of Technology, Bombay 400076, India.
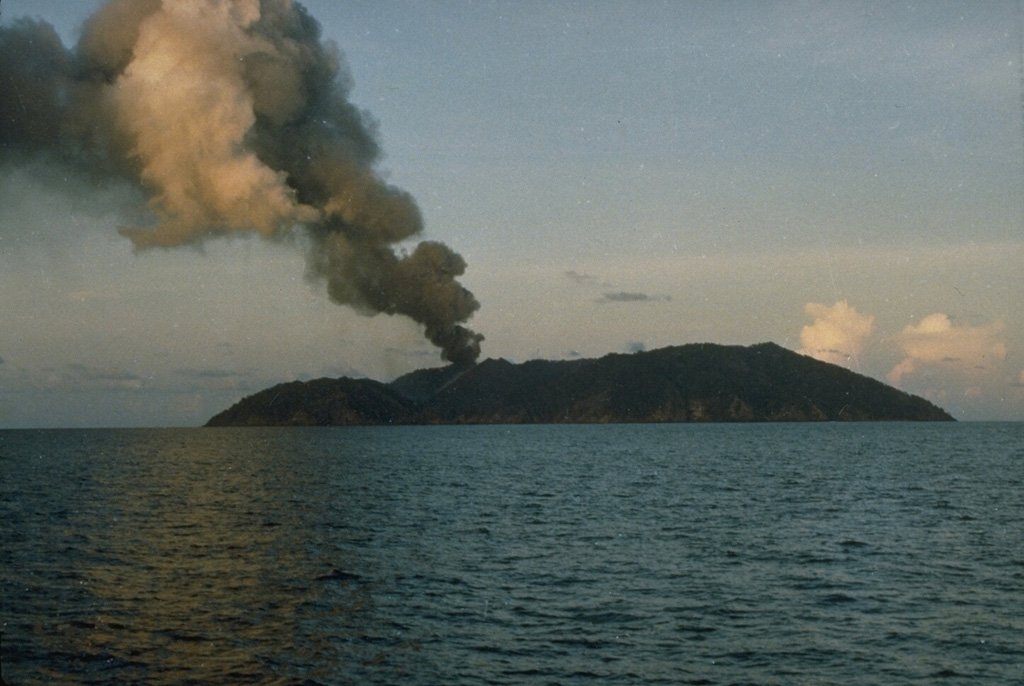
Lava flow and ash discharges seen by Coast Guard personnel on 28 May 2005
Members of the Indian Coast Guard observed a new eruption on the morning of 28 May 2005. An ash plume originated from a vent on the W side of the summit of the central cone; fresh black lava flows did not reach the sea (figure 10). The eruption continued through at least 6 June. Fresh lava emissions had been noted by Indian Coast Guard personnel who patrol the area regularly. A large amount of steam was emitted due to heavy rainfall onto the hot lava surfaces. Heavy monsoon rains prevented access to the island. However, the Geological Survey of India (GSI) was planning a monitoring program and field expedition to the island.
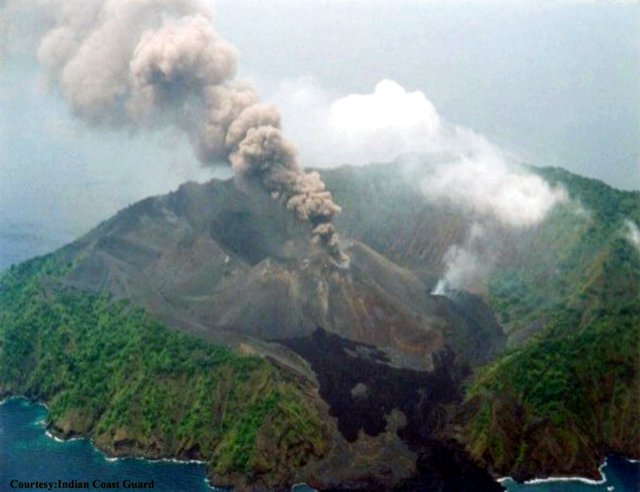 |
Figure 10. Photograph of Barren Island erupting on 28 May 2005 taken from a helicopter. The black lava in the foreground is of 1994-95 eruption. A lava flow that did not reach the sea issues from a steaming flank vent. View is towards the ESE. Courtesy of the Indian Coast Guard. |
Dornadula Chandrasekharam (Indian Institute of Technology) noted on 6 July that by that date the eruption had ceased, with only steam emissions continuing after three weeks of heavy monsoon rains. The Indian Coast Guard also confirmed to Chandrasekharam that the eruption was first noticed on 28 May, contrary to some press reports indicating that activity was seen on the 27th. Patrol helicopters saw no activity on 25 and 26 May, and did not observe the island on the 27th.
Press reports. A report in the 31 May edition of The Hindu stated that defense forces witnessed intermittent billowing smoke and "flame" from the volcano. The same article referenced a Press Trust of India (PTI) report that military forces that landed on the island "experienced a hot breeze and found themselves stepping on fresh lava" where earlier patrol teams had been able to reach the crater. Another article from The Hindu reported that on 2 June teams of the Indian Coast Guard vessel CG Sagar landed on the island in an inflatable raft while a helicopter hovered overhead. The report described eruptive activity consisting of lava and "fireballs" from the crater every few seconds. The purpose of the expedition was to "collect samples of the lava flowing into the rough sea" that would be given to scientists. Coast Guard members and various other government officials made an aerial survey of the island on 3 June according to a PTI report published in The Hindu the next day. The Lt. Governor of Andaman, Ram Kapse, saw "smoke and lava rising from the crater." Coast Guard sources stated that the volume of "smoke" had increased and lava was still flowing out of the crater.
A report in The Daily Telegrams on 17 February 2005 quoted K.N. Mathur, Director General of the GSI, regarding a scientific visit to Barren Island on 16 February. At that time, Mathur noted, the team observed "no serious volcanic activities on the island." A similar report in the 18 February edition of the Trinity Mirror carried a quote from Mathur that "There is no activity in the crater and it remained as it was found during GSI's last visit in 2003." These media reports were reproduced on the GSI website.
Information Contacts: Dornadula Chandrasekharam, Department of Earth Sciences, Centre of Studies in Resources Engineering, Indian Institute of Technology, Bombay 400076, India (URL: http://www.geos.iitb.ac.in/index.php/dc); Geological Survey of India, 27 Jawaharlal Nehru road, Kolkata 700016, India (URL: https://www.gsi.gov.in/); The Daily Telegrams, India; Trinity Mirror, Chennai, India; The Hindu, 859 and 860 Anna Salai, Chennai 600002, Tamil Nadu, India (URL: http://www.hinduonnet.com/); Press Trust of India, PTI Building, 4, Parliament Street, New Delhi 110001, India (URL: http://www.ptinews.com/); Indian Coast Guard, National Stadium Complex, New Delhi 110 001, India.
Eruption continues; ash plumes seen in July and August
Heavy monsoon rains that fell soon after the beginning of the eruption on 28 May made observations and fieldwork difficult, and the eruption appeared to have ended by 6 July (BGVN 30:05). Based on information from the Indian Coast Guard, Dhanapati Haldar noted that as of 6 June the mode of eruption was Strombolian, the same as that observed during 1994-95, with fire fountains rising ~ 100 m, a dark plume rising 1 km, and lava piling up on the W face of the main cone.
On 13 June an Indian Navy ship transported Geological Survey of India scientists Sumit Kr. Mitra, P.C. Bandopadhyay, Sanjeev Raghav, and Tapan Pal to the island. Prior to the visit the volcano was spewing a gray ash plume charged with water vapor from both the main crater and a subsidiary vent on the SW slope. Around 13 June activity at the subsidiary vent decreased considerably and lava debris formed a mound of loose hot fragments. Forceful ejection of bombs and lapilli continued from the main crater. The proximal accumulations of pyroclasts displayed some incandescence. Red-hot lava fragments were forcefully ejecting from the main crater to heights of more than 100 m, accompanied by loud explosions. Strombolian fire fountains every 15-30 seconds created an eruption column and mushroom-shaped plume that blew to the N. Hand specimen study revealed both jet-black and brownish black basaltic fragments. Both types contained large phenocrysts of plagioclase and pyroxene in a finer black groundmass with a porphyritic texture.
A story in the BBC News-World Edition of 11 July about the volcano becoming a tourist attraction served by charter boats included a statement that lava was flowing into the sea. However, the observation was not dated or attributed to a specific source.
According to a pilot's report described in a Volcanic Ash Advisory, ash was visible near Barren Island on 18 July at 0211 at an altitude of ~ 6.1 km. Ash was observed on satellite imagery at 0755 that day below 4.6 km altitude. MODIS imagery from the NASA Terra satellite at 0930 (0400 UTC) showed a distinct brown plume extending around 4.6 km NNE. A plume was again reported by a pilot on 18 August at an altitude of ~ 3 km, although ash was not visible on satellite imagery.
Information Contacts: Geological Survey of India, 27 Jawaharlal Nehru road, Kolkata 700016, India (URL: http://www.gsi.gov.in/); Dhanapati Haldar, Presidency College, Kolkata, India; Jenifer E. Piatt, U.S. Air Force Weather Agency (AFWA), Satellite Applications Branch, Offutt Air Force Base, Nebraska 68113, USA (URL: http://www.557weatherwing.af.mil/); Darwin Volcanic Ash Advisory Centre (VAAC), Bureau of Meteorology, Northern Territory Regional Office, PO Box 40050, Casuarina, Northern Territory 0811, Australia (URL: http://www.bom.gov.au/info/vaac/); BBC News World Edition, Room 7540, BBC Television Centre, Wood Lane, London W12 7RJ, United Kingdom (URL: http://news.bbc.co.uk/).
Lava emissions through September-August; high fire fountains; lava enters sea
The latest eruption of Barren Island began about 28 May 2005 (BGVN 30:05 and 30:07). The following additional information regarding this eruption was provided by Dhanapati Haldar (Presidency College). A photograph (figure 11) taken on 21 July by the Indian Coast Guard indicated that the lava pouring from the main crater had cascaded down to arrive at two points on the W shore. The seawater boiled profusely.
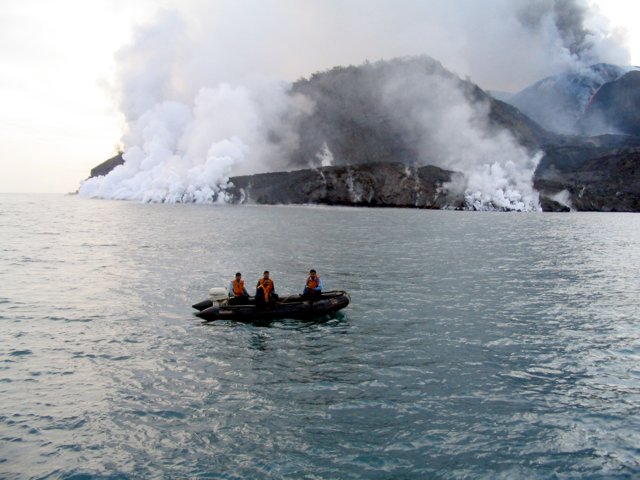 |
Figure 11. Photo taken on 21 July 2005 showing the Barren Island eruption continuing unabated. Lava cascaded down and into the sea along the island's W shore. It entered the sea at two points following the pre-existing lava routes of the 1991 and 1994-95 eruptions. Courtesy of the Indian Coast Guard. |
On 28 August, a senior geologist with the Central Ground Water Board (CGWB), A. Kar, made observations from a ship (figure 12). Kar noted that Strombolian eruptive activity had increased, and was both explosive and effusive in nature. The main crater and a newly created vent on the N flank were active. Streams of hot lava flowed down the slope of the cinder cone at the main crater. This cinder cone was built during the eruption in 1787-1832 and modified during subsequent eruptive pulses in 1991, in 1994-95, and (the current episode) in 2005. Kar's observations on 28 August 2005 noted that the descending lava flows traveled to the W shore, entering the sea near the lone preexisting landing site and ~ 250 m S of it. The latter was where the lava stream had met the sea during the 1994-95 eruption. Gas columns rose to more than 2 km, and fire fountains attained a height of around 300 m.
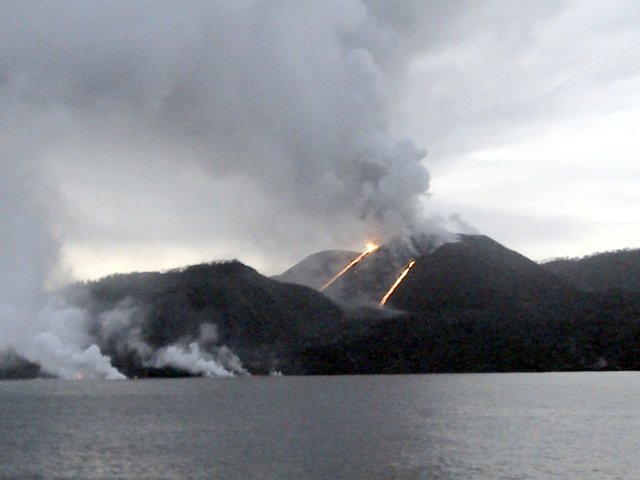 |
Figure 12. Photo taken 26 August 2005 showing Barren Island in Strombolian eruption. The main crater was active, and both explosive and effusive activity had shifted N. Hot lava (seen as incandescent strips) was flowing down the slope of the cinder cone. As before, lava entered the sea at two points on the W shore. Courtesy of A. Kar. |
Kar visited the island again on 2 September and noted that eruptive activity was continuing unabated. As before, a thick gas plume hovered over the N part of the island, and hot lava still flowed down into the sea. The lava coming in contact with sea water was immediately broken into fine particles that were forcefully thrown into the air to a height of nearly 100 m. Accompanying steam rose to a height of about 300-400 m before being drawn away by the prevailing wind. The eruption column's top formed a spectacular mushroom of gas and smoke, blowing to the N. Subsequent reports received from the Indian Coast Guard indicated that the eruption was continuous until at least 25 September.
All the active vents so far observed during 2005 eruption, including the S footwall vent, lie in a zone trending almost N-S. This zone conforms with a pre-existing surficial fracture. This alignment of the active vents had been noted during the 1991 and 1994-95 eruptions, and, as previously mentioned, the lava streams of the current eruption retraced the 1991 and 1994-95 lava routes.
According to Haldar, recent lava samples show large (to 5 mm) megacrysts and phenocrysts of plagioclase (An 93-57), olivine (Fo 85-70), and diopside (Mg 47-44, Fe 16-10). The samples also included a groundmass of glass charged with microlites of plagioclase (An 50-45), augite, olivine, titanomagnetite, and rare orthopyroxene. The 2005 lavas contain relatively few olivine megacrysts, but are rich in plagioclase megacrysts, similar to the 1994-95 lavas.
The bulk chemical composition of the lava falls within the basalt field (table 2), which was comparable with the compositions of the 1994-95 lava. In comparison, the 2005 lava is slightly richer in both MgO and Na2O and slightly lower in SiO2.
Table 2. Analysis of one lava sample (number B1/05) erupted in June 2005 from Barren Island volcano. EMPA stands for electron microprobe analysis. Courtesy of Dhanapati Haldar.
| Analyzed Oxide | Bulk composition (%) | Groundmass glass composition (EMPA) (%) |
| SiO2 | 49.80 | 58.31 |
| TiO2 | 0.82 | 0.69 |
| Al2O3 | 21.04 | 19.38 |
| Fe2O3 (total) | 8.45 | -- |
| FeO (total) | -- | 6.16 |
| MnO | 0.14 | 0.02 |
| MgO | 4.23 | 1.30 |
| CaO | 10.91 | 7.13 |
| Na2O | 3.47 | 5.26 |
| K2O | 0.39 | 0.71 |
| P2O5 | 0.10 | 0.18 |
As this issue went to press Haldar noted that Barren Island continued to vigorously spew lava, gas, and ash at least as late as 10 November 2005. The eruption was unabated since the last week of May 2005.
Information Contacts: Dhanapati Haldar, Presidency College, Kolkata, 4/3K/2 Ho-Chi-Min Sarani, Shakuntala Park, Biren Roy Road (West), Kolkata-700 061, India; Geological Survey of India, 27 Jawaharlal Nehru road, Kolkata 700 016, India (URL: https://www.gsi.gov.in/); Indian Coast Guard, National Stadium Complex, New Delhi 110 001, India (URL: http://indiancoastguard.nic.in/indiancoastguard/).
November 2005-January 2006 ash emissions, lava flows, and pyroclastics
Activity continued at Barren Island since the volcano's latest eruption that began 28 May 2005 (BGVN 30:05, 30:07, and 30:09). The MODVOLC Alerts Team web site has shown that the MODIS (moderate resolution imaging spectroradiometer) satellite recorded nearly daily thermal anomalies from 26 May 2005 (two days earlier than observed by other means). The thermal anomalies continued through 21 January 2006. In contrast, no thermal anomalies were recorded by satellites in the year prior to 26 May 2005.
D. Chandrasekharam of the Indian Institute of Technology and members of the Indian Coast Guard observed that since 4 November the volcano emitted large volumes of gas and ash emissions, and lava flows had reached the sea. Chandrasekharam stated that the early 2006 activity was more intense than when the eruption began in May 2005. The recent activity was preceded by about ten moderate earthquakes in the region, including M 4.8 and 4.5 events on 3 November.
During 12-15 November 2005, ash plumes emitted from Barren Island were visible on satellite imagery drifting predominantly SSW, but they were no longer visible on 16 November. Ash plumes were visible on satellite imagery on 19 and 20 December at a maximum height of ~ 3.7 km, and during 21-23 December at a maximum height of 4.6 km. Satellite imagery showed a thin ash plume from Barren Island extending WNW during 5-7 January 2006.
Two earthquakes occurred in January 2006. On the 6th, an M 5.4 event struck 137 km E of Barren Island, and on the 21st, an M 5.6 event struck 104 km NNW of the island.
To monitor the ongoing volcanism, a team from the Geological Survey of India, including M.M. Mukherjee, P.C. Bandopadhyay, Tapan Pal, and Sri Prasun Ghosh, approached aboard the Indian Coast Guard Ship C.S. GANGA DEVI during 12-13 January 2006. The party sailed to within 0.8 km of Barren Island and studied the nature of the eruption from shipboard. The eruption resembled fireworks projecting different colors over the crater and on the slope of the cone. Dense clusters of incandescent pyroclasts of various sizes ejected forcefully from the crater mouth "with ballistic trajectories." Apart from eruption from the main crater, a "glow of fire" from the N flank of the cone and thin layers of red hot materials on W slope were observed. The Darwin VAAC reported that ash plumes from Barren Island during 26-27 January rose to ~ 3 km.
Information Contacts: D. Chandrasekharam, Indian Institute of Technology, Department of Earth Sciences, Bombay 400076, India (URL: http://www.geos.iitb.ac.in/index.php/dc); Dhanapati Haldar, Presidency College, Kolkata, 4/3K/2 Ho-Chi-Min Sarani, Shakuntala Park, Biren Roy Road (West), Kolkata-700 061, India; Geological Survey of India, 27 Jawaharlal Nehru road, Kolkata 700 016, India (URL: https://www.gsi.gov.in/); Indian Coast Guard, National Stadium Complex, New Delhi 110 001, India (URL: http://indiancoastguard.nic.in/indiancoastguard/); Darwin Volcanic Ash Advisory Center (URL: http://www.bom.gov.au/info/vaac/); MODVOLC Alerts Team, Hawaii Institute of Geophysics and Planetology (HIGP), University of Hawaii at Manoa, 1680 East-West Road, Post 602, Honolulu, HI 96822, USA (URL: http://modis.higp.hawaii.edu/).
Ongoing emissions, including lava, but late-September news reports of slowing pace
Our last report on Barren Island discussed events through much of January 2006 (BGVN 31:01); since that time we have only found sporadic reports of activity.
According to a news article by The Indo-Asian News Service, a team of scientists that visited Barren Island around 12 March 2006 found that the volcano was still very active. The height of the volcanic cone had increased by 50 m since eruptive activity began in May 2005. In addition, lava flows covered the NW side of the island.
Since March 2006 there have been only a few satellite images and pilot reports of continued activity. Based on a pilot report and satellite imagery, the Darwin VAAC reported that an ash plume was emitted during 5-6 April that did not rise higher than 4.6 km altitude. On 19 April a low-level plume extending W was visible on satellite imagery.
On 2 May satellite imagery detected a plume from Barren Island near 3.7 km altitude. The following day low-level ash plumes extended N. Based on a pilot report, the Darwin VAAC reported an ash plume at 1230 on 26 May that remained below 3 km altitude and drifted N.
On 23 September a news report in The Hindu stated that Indian Coast Guard officials indicated that the continuing eruption at Barren Island was decreasing in intensity. The news piece cited a surveillance report statement that there was less lava but more "smoke" from the volcano.
Information Contacts: The Hindu (URL: http://www.hinduonline.com); Indo-Asian News Service (IANS) (URL: http://www.eians.com/); Geological Survey of India, 27 Jawaharlal Nehru road, Kolkata 700 016, India (URL: https://www.gsi.gov.in/); Indian Coast Guard, National Stadium Complex, New Delhi 110 001, India (URL: http://indiancoastguard.nic.in/indiancoastguard/); Darwin Volcanic Ash Advisory Center, Bureau of Meteorology, Northern Territory Regional Office, PO Box 40050, Casuarina, Northern Territory 0811, Australia (URL: http://www.bom.gov.au/info/vaac/).
Aviation reports and thermal hot spots suggest eruptions into September 2007
According to news reports of Indian Coast Guard statements, the eruptive activity that began in late May 2005 (BGVN 30:05) at Barren Island had diminished by late September 2006 (BGVN 31:09). Since then, based upon pilot and satellite data, the Darwin Volcanic Ash Advisory Centre (VAAC) reported multiple ash-and-steam plumes. The plumes reached an altitude of 1.5 km (drifting WNW) on 19 and 20 October 2006, 3 km (drifting SW and W) on 8 November 2006, an unreported altitude and direction on 27 November 2006, 3 km (drifting SW) on 8 February 2007, and 2.1 km (drifting S) on 3 March 2007. The Darwin VAAC had not issued further advisories on Barren Island activity through August 2007.
A compilation of MODIS thermal anomaly data from the Aqua and Terra satellites (figure 13) shows that the eruption began on 26 May 2005 (BGVN 31:01) and has continued through at least 1 September 2007. The level of lava emissions remained high between May 2005 and mid-March 2006. On 17 March 2006 the MODVOLC system identified nine hot pixels in Aqua MODIS data. After that time detectable lava activity decreased and became intermittent, though explosive activity may have been present. More frequent anomalies were detected during April 2006, October-November 2006, and May 2007.
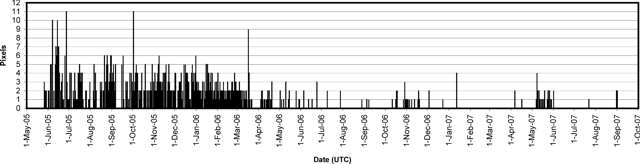 |
Figure 13. Daily thermal anomalies at Barren Island from the MODIS/MODVOLC satellite observations, May 2005 to early September 2007. Vertical scale indicates the daily number of alert pixels detected n a specific thermal image, generally a reflection of the extent of hot lava flows. Anomalies are from both the Aqua and Terra satellites and were accessed for this report in early September 2007. Courtesy of the HIGP MODIS Thermal Alert System. |
Information Contacts: HIGP MODIS Thermal Alert System, Hawai'i Institute of Geophysics and Planetology (HIGP), University of Hawaii and Manoa, 168 East-West Road, Post 602, Honolulu, HI 96822, USA (URL: http://modis.higp.hawaii.edu/); Darwin Volcanic Ash Advisory Centre, Bureau of Meteorology, Northern Territory Regional Office, PO Box 40050, Casuarina, Northern Territory 0811, Australia (URL: http://www.bom.gov.au/info/vaac/).
Satellite imagery of ash plume, 23 December 2007
Thermal anomalies associated with the eruption that began in May 2005 were noted at Barren Island through 1 September 2007 (BGVN 32:07). Anomalies detected on 4 and 5 October 2007 again generated MODIS thermal alerts. On 23 December 2007 the Darwin Volcanic Ash Advisory Centre reported that an ash plume seen on satellite imagery rose to an altitude of 1.5 km and drifted S.
Information Contacts: HIGP MODIS Thermal Alert System, Hawai'i Institute of Geophysics and Planetology (HIGP), University of Hawaii and Manoa, 168 East-West Road, Post 602, Honolulu, HI 96822, USA (URL: http://modis.higp.hawaii.edu/); Darwin Volcanic Ash Advisory Centre, Bureau of Meteorology, Northern Territory Regional Office, PO Box 40050, Casuarina, Northern Territory 0811, Australia (URL: http://www.bom.gov.au/info/vaac/).
Thermal anomalies and red glow indicate that a new eruption started in May 2008
A scientific expedition in February 2008 observed that the morphology of the volcano had changed considerably since 2005. The eruption that began in May 2005 (BGVN 30:05) ejected lava and tephra that built a new scoria cone NE of the previous central cone. Lava flows covered all of the earlier flows, and several new spatter cones were formed. Fumarolic activity was continuing in February, with a large amount of steam from the central cone.
Activity seemingly decreased in late March 2006, as shown by a significant decline in the number and frequency of thermal anomalies (BGVN 32:07). However, intermittent anomalies continued until 5 October 2007, and ash plumes were seen in satellite imagery on 23 December 2007 (BGVN 33:02). Thermal anomalies detected by MODIS instruments began to be detected again on 12 May 2008 at 1935 (UTC), suggesting a renewal of eruptive activity. Anomalies continued to be identified on 19 days through the end of June.
During 15-30 June 2008 observers on an Indian Coast Guard patrol boat could see red glow from the central cone summit at night from a distance of about 10 km. There were also twelve earthquakes between 27 and 29 June, centered SW of Port Blair (140 km SW of Barren Island) in the Andaman Islands.
Information Contacts: Dornadula Chandrasekharam, Dept. Earth Sciences, Centre of Studies in Resources Engineering, Indian Institute of Technology Bombay, Mumbai 400076, India (URL: http://www.geos.iitb.ac.in/index.php/dc); Hawai'i Institute of Geophysics and Planetology (HIGP) Thermal Alerts System, School of Ocean and Earth Science and Technology (SOEST), Univ. of Hawai'i, 2525 Correa Road, Honolulu, HI 96822, USA (URL: http://modis.higp.hawaii.edu/).
Ash plumes and thermal alerts continue through 2008
As previously reported (BGVN 33:06), thermal anomalies on Barren Island detected by MODIS instruments and processed by the MODVOLC system ceased during 6 October 2007 to 11 May 2008 but then went on to register through the end of June 2008. Thermal anomalies remained frequent, and sometimes daily, through the end of the year (figure 14). Some days displayed five or more alerts per day, with the most active day, 20 November 2008, having 12 alert pixels. Although the likely cause of those near-daily thermal anomalies was ongoing eruptions, the island's remoteness and uninhabited setting precludes continuous eye-witness reporting. A new dissertation discusses volcanic rocks on Barren Island (Alam, 2008), and a technical paper on the topic is in review.
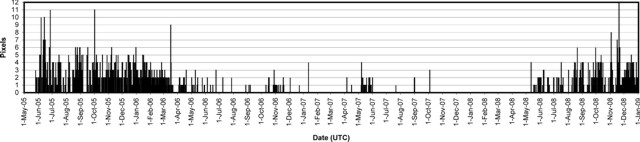 |
Figure 14. Daily thermal anomalies at Barren Island from the MODIS/MODVOLC satellite observations, May 2005 through December 2008. Vertical scale indicates the daily number of alert pixels detected in a specific thermal image, generally a reflection of the extent of hot lava flows. Anomalies are from both the Aqua and Terra satellites, and use UTC dates. Courtesy of the HIGP MODIS Thermal Alert System. |
On 17 November 2008 the Darwin Volcanic Ash Advisory Center (VAAC) reported pilot observations of lava flows on Barren Island, but no visible incandescence or vapor. A possible low-level ash plume was seen on satellite imagery drifting W. On 19 November, a pilot reported that an ash plume rose to an altitude of ~ 2.5 km and drifted WSW. During 7-8 December, the Darwin VAAC again reported pilots observations of lava flows on Barren Island. Although thermal anomalies were detected on satellite imagery, ash plumes were not visible.
Reference. Mohammad Ayaz Alam, 2008, Geological, geochemical and geothermal studies on the Barren Island volcano, Andaman Sea, Indian Ocean: Ph.D. dissertation, Indian Institute of Technology Bombay, Mumbai, India.
Information Contacts: Hawai'i Institute of Geophysics and Planetology (HIGP) Thermal Alerts System, School of Ocean and Earth Science and Technology (SOEST), Univ. of Hawai'i, 2525 Correa Road, Honolulu, HI 96822, USA (URL: http://modis.higp.hawaii.edu/); Darwin Volcanic Ash Advisory Centre (VAAC), Bureau of Meteorology, Northern Territory Regional Office, PO Box 40050, Casuarina, NT 0811, Australia (URL: http://www.bom.gov.au/info/vaac/).
Almost daily thermal alerts and intermittent ash plumes January-September 2009
Our previous report on Barren Island (BGVN 33:11) noted frequent thermal anomalies recorded by MODIS instruments and processed by the MODVOLC system through the last half of 2008. This report notes activity between 1 January and 15 September 2009.
Ash plumes from Barren Island were a frequent occurrence during January 2009, and intermittent from February through 15 September 2009 (table 3). MODVOLC thermal anomalies remained frequent, usually daily, during 1 January 2009 through 15 September 2009.
Table 3. Ash plumes from Barren Island, 4 January 2009-14 September 2009. Courtesy, Darwin Volcanic Ash Advisory Centre, based on satellite imagery, SIGMET notices, and pilot observations.
| Date (2009) | Maximum Altitude | Plume Drift and Distance |
| 04 Jan-06 Jan | 2.4 km | SW, NW |
| 07-08, 10-11 Jan | 1.8-2.4 km | W, SW |
| 18 Jan-19 Jan | 3 km | NNE, NE |
| 21 Jan | 2.4 km | N, NW |
| 31 Jan | -- | S (~55 km) |
| 05 Feb | 3 km | SSE |
| 20 Feb-21 Feb | 2.4 km | WNW, NW, N (~75-90 km) |
| 25 Mar-26 Mar | 2.1 km | S (110 km) |
| 23 Apr-25 Apr | 2.4 km | NE, E, SE (45-65 km) |
| 20 May | 2.1 km | NE (75 km) |
| 19 Jul-20 Jul | 1.5 km | NE (45-65 km) |
| 13 Sep-14 Sep | 2.4 km | W, NE (20-100 km) |
Information Contacts: Darwin Volcanic Ash Advisory Centre (VAAC), Bureau of Meteorology, Northern Territory Regional Office, PO Box 40050, Casuarina, NT 0811, Australia (URL: http://www.bom.gov.au/info/vaac/); Hawai'i Institute of Geophysics and Planetology (HIGP) Thermal Alerts System, School of Ocean and Earth Science and Technology (SOEST), Univ. of Hawai'i, 2525 Correa Road, Honolulu, HI 96822, USA (URL: http://modis.higp.hawaii.edu/).
Occasional ash plumes and frequent thermal alerts ongoing into 2010
During January to mid-September 2009, Barren Island produced occasional ash plumes and stimulated almost daily thermal alerts (BGVN 34:08). Additional ash plumes were reported on 1 November 2009, then again on 3-4, 11, and 23 January 2010 (table 4).
Table 4. Ash plumes from Barren Island, November 2009- January 2010. The plume data are based on satellite imagery, SIGMET notices, and pilot observations. Courtesy of Darwin Volcanic Ash Advisory Centre.
| Date | Maximum altitude | Plume drift and distance |
| 2009 Nov 01 | 1.8 km | 55-75 km W |
| 2010 Jan 03-04 | 1.5 km | -- |
| 2010 Jan 11 | 1.5 km | 45 km S |
| 2010 Jan 23 | 3 km | -- |
MODIS/MODVOLC satellite thermal alerts continued almost daily through the end of December 2009, but then decreased during January-February 2010. Between 1 January and 25 February 2010, only six thermal alerts were recorded (all single pixels).
Information Contacts: Darwin Volcanic Ash Advisory Centre (VAAC), Bureau of Meteorology, Northern Territory Regional Office, PO Box 40050, Casuarina, NT 0811, Australia (URL: http://www.bom.gov.au/info/vaac/); Hawai'i Institute of Geophysics and Planetology (HIGP) Thermal Alerts System, School of Ocean and Earth Science and Technology (SOEST), Univ. of Hawai'i, 2525 Correa Road, Honolulu, HI 96822, USA (URL: http://modis.higp.hawaii.edu/).
Lava takes new path to shore by 30 March 2009; ongoing (2011) thermal alerts
Sheth and others (2009) and reports of the Geological Survey of India (e.g., GSI, 2009) present many new field observations about Barren Island's volcanism, particularly during the years 2005-2009. Although historically lava had flowed out of the caldera towards the W, Sheth and others (2009) noted that by 30 March 2009 a new channelized 'a'a lava flow had overtaken the N caldera wall. The escaping lava had arrived at the sea along the island's NNW coast and began to form a delta there.
Barren Island is a young and growing mafic, island-arc volcano in the Andaman Sea (figure 15). It produced its first historically recorded eruption in 1787 and a series of eruptions followed in later years, including pulsating activity in the past few decades. Our last report on Barren Island (BGVN 35:01) reported occasional ash plumes and decreasing thermal alerts through January 2010. When searched in mid-April 2011, the Darwin Volcanic Ash Advisory Center reported on Barren Island plumes as late as April 2010, with an unconfirmed pilot report in July 2010. A search of MODVOLC-based satellite thermal alerts found they extended through 2010 and into 2011.
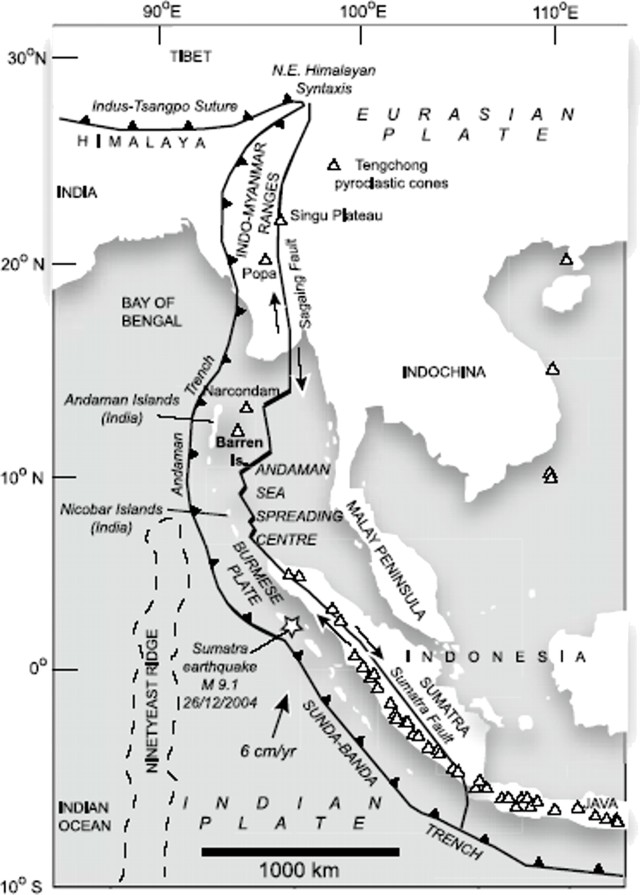 |
Figure 15. Map showing the location of Barren Island as part the N-trending volcanic arc extending between Burma (Myanmar) and Sumatra, Indonesia. Taken from Sheth and others (2009). |
2009 visit. At the end of their paper, Sheth and others (2009) inserted a 'note added in proof' describing an ongoing eruption witnessed first hand on 30 March 2009. We present that note here (with minor omissions, and broken into several paragraphs).
"We would like to report a confirmed, ongoing, lava eruption on Barren Island. The first four authors of this paper and Neeraj Awasthi visited Barren Island yet again, on 30th March 2009, on board the Indian Coast Guard vessel the ICGS Bhikaiji Cama (Captain: Commandant M. Bhatia). The volcano's central cinder cone was continuously emitting dark ash clouds every few seconds from its central crater (reminiscent of the activity in 2007 . . .), and these clouds were expanding and getting deflected towards the S. The pre-existing valley between the cinder cone and the northern caldera wall has been filled up by deposition of new ash in the past year, which has enabled the new, active lava flow to completely abandon the westerly route (taken by all historic and recent lava flows) and to reach the sea over the northern caldera wall.
"This [active] lava flow is not ensuing from the summit crater, but apparently from an intermediate elevation on the cinder cone, though details were hard to distinguish given the distance of the ship from the island. The new, channelized lava flow is currently descending at a steep angle over the northern caldera wall's outer cliff face, and into the sea. Incandescent lava is seen at a few places in it, particularly in the dark. A sizeable steam plume is currently rising from the sea where this new lava flow is entering the sea. The new lava flow has built a structure resembling an alluvial fan along the shore.
"We were able to reach this fan by using a Gemini (inflatable rubber boat) from the ship, carefully circumventing the steam plume and through seawater which was very hot (an estimated ~60-70°C). We could also collect lava samples from the southern edge of this "fan", which are typical clinkery as basalt in hand specimen. A full account of this eruption with photographs and petrological study of the rock will be attempted separately. An interesting possibility is that, were this activity to continue, the new embryonic lava delta will grow thicker and laterally, and merge with the existing lava delta on the western side of the volcano.... In summary, Barren Island is evidently a very active volcano, meriting close study."
References. GSI, 2009, The Barren Island Volcano, Explosive Strombolian type eruption observed during January 2009; Geological Survey of India — Kolkata; Jan 2009 URL: http://www.portal.gsi.gov.in/gsiImages/information/N_BarrenJan09Note.pdf).
Sheth, HC, Ray, JS, Bhutani, R, Kumar, A, and Smitha, RS, 2009, Volcanology and Eruptive Styles of Barren Island: An Active Mafic Stratovolcano in the Andaman Sea, NE Indian Ocean, Bull Volcanol (Apr 2009) 71:1021-1039, DOI: 10.1007/s00445-009-0280-z.
Information Contacts: Darwin Volcanic Ash Advisory Centre (VAAC), Bureau of Meteorology, Northern Territory Regional Office, PO Box 40050, Casuarina, NT 0811, Australia (URL: http://www.bom.gov.au/info/vaac/); Hawai'i Institute of Geophysics and Planetology (HIGP) MODVOLC Thermal Alerts System, School of Ocean and Earth Science and Technology (SOEST), Univ. of Hawai'i, 2525 Correa Road, Honolulu, HI 96822, USA (URL: http://modis.higp.hawaii.edu/).
Evolving eruption emits tephra and continues in January 2011
Barren Island, a young and growing mafic island-arc volcano in the Andaman Sea (figure 16), produced its first historically recorded eruption in 1787; a series of eruptions followed in later years. Evidence of eruptions again became clear in May 2005 as a result observations by the Indian Coast Guard.
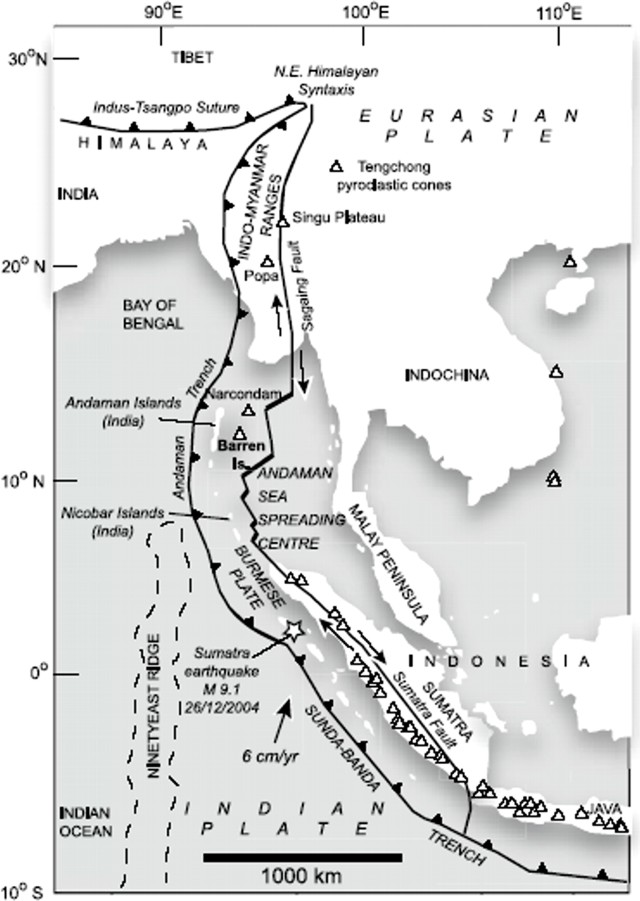 |
Figure 16. Map showing the location of Barren Island as part the S-trending volcanic arc extending between Burma (Myanmar) and Sumatra. It shows major geological and tectonic features of the NE Indian Ocean and SE Asia, along with the locations of the Andaman and Nicobar Islands, Barren Island, and Narcondam. White triangles are Holocene volcanoes (Siebert, and others, 2010). Taken from Sheth and others (2009) and from BGVN 36:03. |
A recent report on Barren Island (BGVN 35:01) reported occasional ash plumes and decreasing thermal alerts through January 2010. In our last report on Barren Island (BGVN 36:03) we described some new details about this volcano, particularly during the years 2005-2009, as reported by Sheth and others (2009) and the Geological Survey of India (GSI, 2009). The current report discusses activity at the volcano during January 2010-April 2011, including observations made by GSI (2011) during a January 2011 field trip and thermal anomalies detected by satellite.
Ash plumes. During 2010 and through mid-2011, the Darwin Volcanic Ash Advisory Centre reported ash plumes from Barren Island. Figure 17 shows a plume rising from the volcano in a 25 September 2010 satellite image.
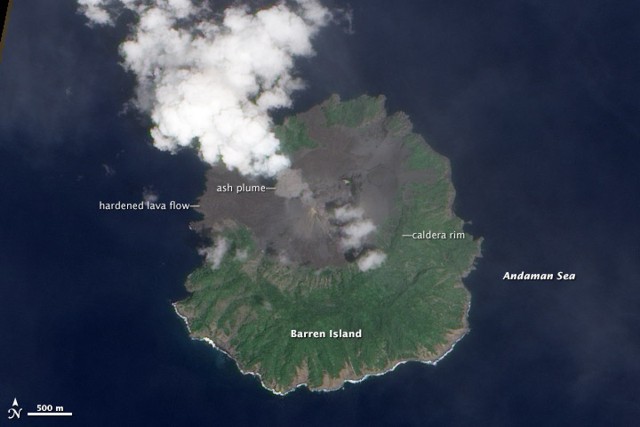 |
Figure 17. A plume of ash rises from Barren Island on 25 September 2010. The Advanced Land Imager (ALI) aboard the Earth Observing-1 (EO-1) satellite shows a dark-gray ash cloud rising from a volcanic cone that fills the island's central caldera. Dark, hardened lava flows cover the caldera floor, some extending to the ocean. Green vegetation covers the caldera rim and the outer slopes. Breaking waves line the southern coastline in white. This remote, uninhabited volcanic island is not monitored directly, but the Indian Coast Guard, passing pilots, and satellites have observed lava flows and ash plumes periodically since 2005. Courtesy of NASA Earth Observatory, image by Robert Simmon using ALI data from the NASA EO-1 team. |
The Darwin VAAC documented other plumes, for example, on 3 January 2010 a pilot reported that a plume rose to an altitude of 1.5 km. On 11 January 2010 an ash plume visible through satellite imagery rose to an altitude of 1.5 km and drifted 45 km S. On 23 January 2010 a pilot observed an ash plume that rose to a reported altitude of 3 km, but it was not identified on satellite imagery.
New insights from GSI. GSI (2011) discussed a scientific expedition to Barren Island made during 2-8 January 2011. The eruption still continued, but with lesser intensity as compared to the violent eruption observed during 2005 to 2009. The eruption was of a pulsative and explosive character (Strombolian type) where dark columns of a dense ash-laden steam with coarser pyroclasts (cinders, juvenile lava blocks) were ejected at 2- to 8-minute intervals.
The eruption discharged from two vents on the parasitic crater. That crater had developed over a subsidiary cinder cone (~ 500 m high) on the S wall of the main cinder cone of the 1991-95 eruption. Coarser incandescent pyroclasts rose sub-vertically to 100-150 m in height and tumbled down the volcanic cone. A thick column of ash-laden gray vapor was ejected to heights of ~ 150-200 m and typically rose in a mushroom shaped ash cloud.
Figure 18 shows the lower portion of an ash plume.
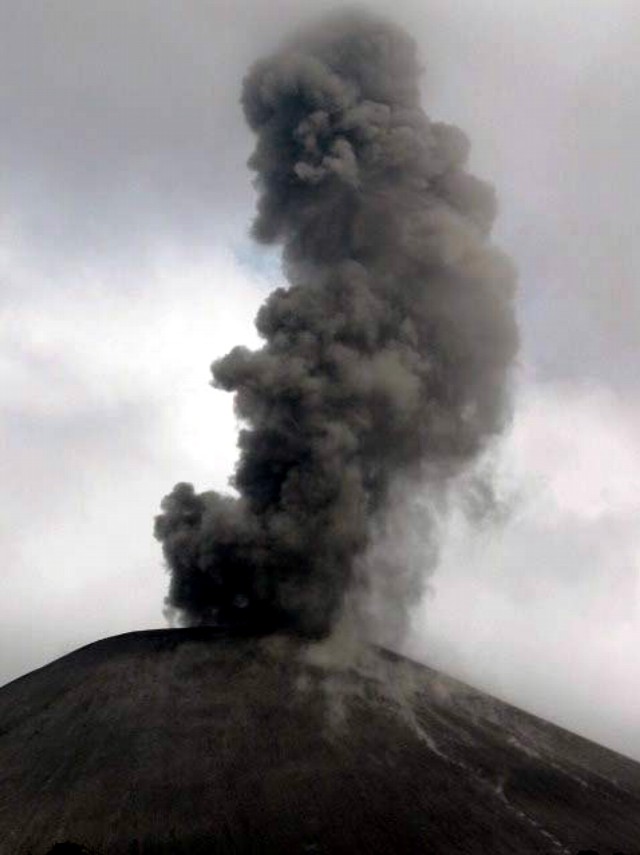 |
Figure 18. Barren Island emitting a column of ash-laden vapor. Bulletin editors noted two minor features: (1) dark spots to the left of the vent suggestive of local ash fall, and (2) small plumes near the ground surface, which appear similar to those discussed in the Fuego report (this issue, BGVN 36:06). Taken from GSI (2011). |
Significant changes were observed in the shape and height of the cinder cone in the 2-km-diameter caldera. The height of the cinder cone increased from ~ 350 m in 2005 to ~ 500 m in 2011. The main approach to the center of the island follows a valley leads to the breached NW side of the caldera wall. The valley was covered totally by a thick pile of repetitive sequences of assorted pyroclasts and lava from recent eruptions. Near the base of the cinder cone, in the NW part of the island, the accumulated thickness of the products from recent eruptions was ~ 100 m. Besides the main pyroclast deposits from lava in the W part of the valley, considerable deposits had filled up the valley in the NNW part of the island, overflowing the caldera wall and covering the pre-historic lava. The recent lava flows reached the sea front attaining a width of ~ 250 m at the coast (figure 19).
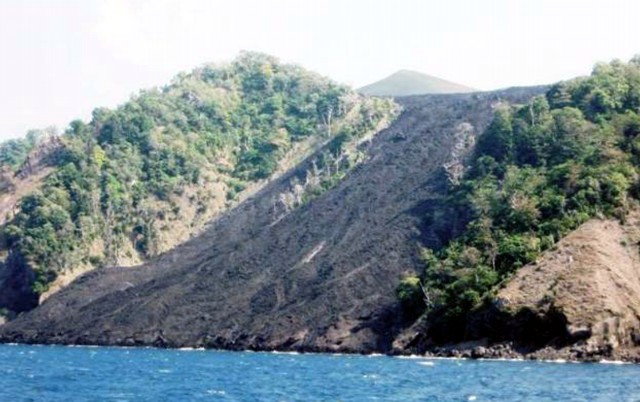 |
Figure 19. Lava flow emplaced between 2009-Jan 2011. Located on the NNW side of Barren Island with a width of flow at the coast of ~250 m. From GSI (2011). |
This is the first report of the lava and pyroclasts of recent eruptions in the NNW part of the island. The main lava flow and pyroclastic deposits discharged from the NW part of the crater,carried towards the W and NNW part of the valley, giving rise to new land forms.
The lava and associated eruptive products of the 1991 and 1994-95 explosions, which were exposed earlier near the mouth of the valley and on the S side of the valley, were covered by the recent tephra The coarser pyroclasts are highly vesiculated basaltic rocks where plagioclase occurs as the dominant phenocryst set in a glassy matrix. The pile of pyroclasts formed very uneven. Maximum height of the accumulated material was ~20 m. Fusion of individual cinders, spatter, and blocks produced bigger blocks.
MODVOLC Thermal Alerts. MODVOLC satellite thermal measurement showed frequent alerts for the following periods: 17 September through 5 November 2010 (nearly daily alerts), 14 December 2010 through 10 January 2011, and 29 March through 11 April 2011 (daily alerts). Alerts were absent during 13 February through 17 September 2010.
Recent history of major ash eruptions. Awasthi and others (2010) measured 14C dates of inorganic carbon in sediment beds, and Sr and Nd isotopic ratios of seven discrete ash layers, in a marine sediment core collected from 32 km SE of the Barren volcano. The study revealed that the volcano had seven major ash eruptions, at ~70, 69, 61, 24, 19, 15, and 10 kiloyears (ka) before present. The ash layers erupted from 70 ka through 19 ka have highly uniform Nd isotopic composition; eruptions since ~15 ka have highly variable isotopic compositions. The authors found that during 10-24 ka, the volcano had large ash eruptions spaced at ~4.5 ka intervals (~10, ~15, 19, and 24 ka). Isotopically correlating the precaldera lavas and ash exposed on the volcano to the uppermost ash layer in the core, the authors inferred that the caldera was younger than the last ~10 ka ash layer found in the core. This represents the hypothesis that the caldera formed as a result of a single, simple, symmetric collapse after Barren Islands major ash eruptions.
References. Awasthi, N., Ray, J.S., Laskar, A.H., Kumar, A., Sudhakar, M., Bhutani, R., Sheth, H.C., and Yadava, M.G., 2010, Major ash eruptions of Barren Island volcano (Andaman Sea) during the past 72 kyr: clues from a sediment core record, Bulletin of Volcanology, v. 72, pp. 1131-1136.
Geological Survey of India, 2009, The Barren Island Volcano, Explosive Strombolian type eruption observed during January 2009, Jan 2009 URL: http://www.portal.gsi.gov.in/ gsiImages/information/ N_BarrenJan09Note.pdf)
Geological Survey of India, 2011, Barren Volcano in January 2011: An explosive pulsative eruption (Strombolian) still continues, Eastern Region Geological Survey of India URL: http://www.portal.gsi.gov.in/gsiDoc/pub/cs_barren-eruption.pdf)
Sheth, H.C. , Ray, J.S., Bhutani, R., Kumar, A., and Smitha, R. S., 2009, Volcanology and eruptive styles of Barren Island: an active mafic stratovolcano in the Andaman Sea, NE Indian Ocean, Bulletin of Volcanology, v. 71, pp. 1021-1039 (DOI: 10.1007/s00445-009-0280-z).
Siebert, L., Simkin, T., and Kimberly, P, 2010, Volcanoes of the World: Third Edition, University of California Press, Berkeley, 551 p.
Information Contacts: Geological Survey of India (GSI), GSI Complex, Bhu Bijnan Bhavan, Block: DK-6, Sector-II, Salt LakeKolkata-700091 West Bengal, India (URL: http://www.portal.gsi.gov.in/); Darwin Volcanic Ash Advisory Centre (VAAC), Bureau of Meteorology, Northern Territory Regional Office, PO Box 40050, Casuarina, NT 0811, Australia (URL: http://www.bom.gov.au/info/vaac/).
Ash plume drifted up to 220 km SW in February 2013
Our last Bulletin report (BGVN 36:06) noted that Barren Island was still erupting during 2011. This report both discusses an April 2010 ash plume that recently came to our attention and reports on activity as late as October 2013. A regional map appears in the last section.
On 19 April 2010, based on analysis of satellite imagery, the Darwin Volcanic Ash Advisory Centre (VAAC) reported that a plume from Barren Island rose to an altitude of 2.4 km and drifted 55 km N. Ash, however, could not be identified from the satellite data.
A Twitter posting included the photo in figure 20, an image apparently acquired in December 2010. The Indian Navy (via Twitter) reported seeing "smoke" and lava was also seen on the island from a surveillance plane on 16 October 2013. A large hot spot is visible on recent MODIS satellite data.
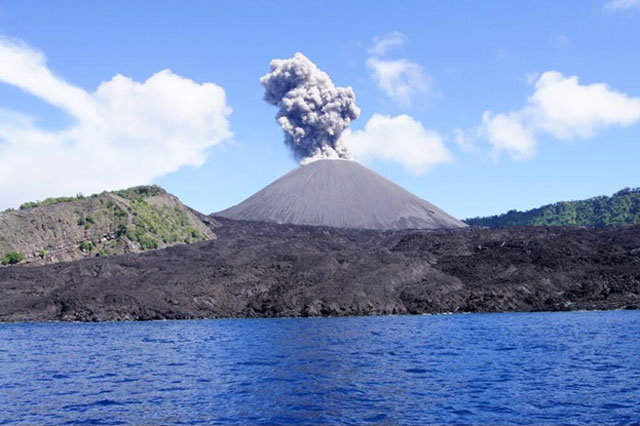 |
Figure 20. A photo of Barren Island emitting a dark ash plume from its main cone. The photo's metadata indicated that it was taken on 10 December 2010. Copyrighted photo by Paul Andrew Johnson and posted on Panoramio photo display website. |
VAAC reported that on 16 February 2013 during 1430 to 2000 (UTC date and time) an ash plume from Barren Island reached an altitude of 6.1 km and drifted 220 km SW. Meteorological clouds masked the ash cloud after 2000 UTC and the VAAC warned that ash could still reside at altitude. The 16 February 2013 plume height was derived from a 1530 UTC MTSAT-2 infrared image and an atmospheric sounding at Penang made at 1200 UTC. The VAAC also created a forecast of the plume's movement based on the Hysplit model data.
Darwin VAAC found that on 17 October 2013 an ash plume rose to an altitude of 3.7 km and drifted ~30 km NW. The plume was first seen in imagery at 0732 UTC and last seen at 0932 UTC. Plume height was derived from MTSAT-2 visible wavelength image, observed ash movement, and comparison to winds from both an atmospheric model and a 0600 UTC sounding.
Regional map. A regional map brings together geography and tectonics of the region centered on Barren Island (figure 21).
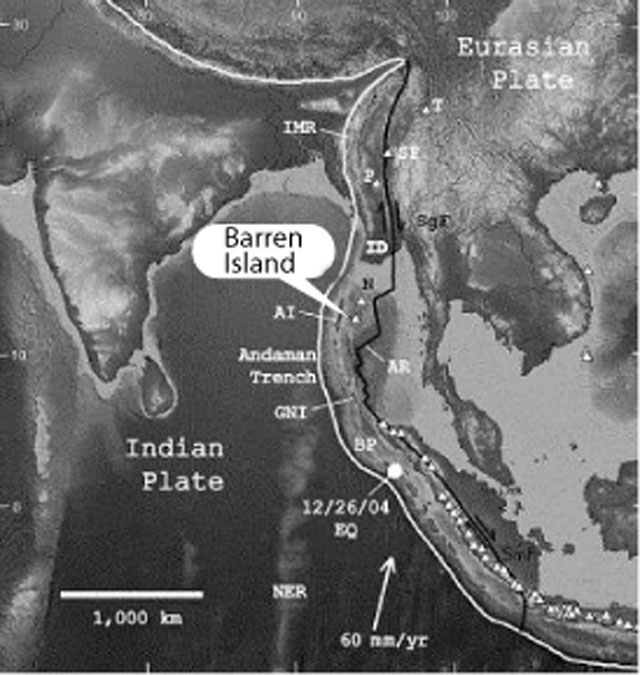 |
Figure 21. Location map for Barren Island seen on the digital version of the wall map "This Dynamic Planet" (Simkin and others, 2005). The background image is from ER Mapper. The oceanic bathymetry and on-land topography translate for this gray-scale image, forming two independent series ranging from dark (low) to light (high). Thus, deep ocean and low land are dark, and shallow ocean and high land are light. White triangles with black borders represent Holocene volcanoes (Siebert and Simkin, 2002). Labeled volcanoes are Barren Island, Narcondam (N); Popa (P) and the Singu Plateau (SP) in Myanmar, the Tengchong pyroclastic cones (T) in southern China. The curving white line is the convergent boundary between the Indian Plate and the Eurasian Plate, including the Burma sub-plate (BP) of the Eurasian Plate. |
At Barren Island's latitude, the convergent boundary is the subduction zone named the Andaman trench; to the S is the Sumatran trench, and to the N is the continental-collision zone marked by the Indo-Myanmar ranges (IMR) and still farther N and W, the Himalayan front. The large white arrow shows the NNE relative-motion vector of ~60 mm/yr for the Indian Plate and the Eurasian PlateW of Sumatra. The 26 December 2004 Sumatran earthquake (Mw 9.3) is marked by a white dot. Taken from Sanjeev Raghav (2011).
References: Luhr, J. F. and Haldar, D., 2006, Barren Island volcano (NE Indian Ocean): island-arc high-alumina basalts produced by troctolite contamination; J. Volcanol. Geotherm. Res., vol. 149, pp. 177-212.
Ray, J.S, Pande K., Awasthi, N. 2013, A minimum age for the active Barren Island volcano, Andaman Sea, Current Science; Special Section: Earth Sciences, Vol. 104, No. 7, 10 April 2013.
Sanjeev, R. 2011, Barren Volcano- A Pictorial Journey From Recorded Past To Observed Recent Part-I Earth Science India, Open Access e-Journal, Popular Issue, IV (III), July, 2011; (URL: www.earthscienceindia.info ).
Siebert, L. and Simkin, T.,2002, Volcanoes of the world: an illustrated catalog of Holocene volcanoes and their eruptions, Smithsonian Institution Global Volcanism Program, Digital Information Series, GVP-3.
Simkin, T., Tilling, R.I., Vogt, P.R., Kirby, S., Kimberly, P., and Stewart, D.B. This Dynamic Planet: World Map of Volcanoes, Earthquakes, Impact Craters, and Plate Tectonics U.S. Geological Survey (2005).
Information Contacts: Darwin Volcanic Ash Advisory Centre (VAAC), Bureau of Meteorology, Northern Territory Regional Office, PO Box 40050, Casuarina Northern Territory 0811 Australia; Twitter (URL: https://twitter.com/twitter); and VolcanoDiscovery (URL: http://www.volcanodiscovery.com/).
Ongoing intermittent ash plumes and thermal anomalies through June 2014
Renewed activity at Barren Island that began in October 2013 (BGVN 38:10) continued at least through June 2014. Ongoing low-level eruptive activity was indicated by intermittent reports of ash plumes and MODIS infrared satellite observations.
Ash plumes seen in satellite imagery on 17 October 2013 corresponded to an episode of MODVOLC thermal alerts that began on 10 October (10 pixels) and continued through 23 October. Additional extended periods of eruptive activity indicated by frequent thermal alerts took place from 12-19 December 2013 and 20 January-12 February 2014. Isolated anomalies were also identified on 13 and 15 November and 1 December 2013, and 1 January, 12 March, and 20 April 2014.
Low-level ash plumes that rose to altitudes as high as ~1.5 km were reported in February 2014. Darwin VAAC reports stated that an ash plume on 6 February rose to ~1.5 km altitude and drifted more than 35 km SW. On 9 February another low-level plume rose from the vent.
Although plumes were infrequently noted on satellite imagery, the crew of the Infiniti Live Aboard dive boat noted that there was a plume visible during each of six visits to the island between January and April 2014 (figures 22 and 23).
Thermal infrared MODIS data processed by the MIROVA system, which uses middle infrared radiation to identify possible volcanic activity, revealed frequent anomalies in April through early May 2014, and in late May to early June; another anomaly was seen in mid-June 2014.
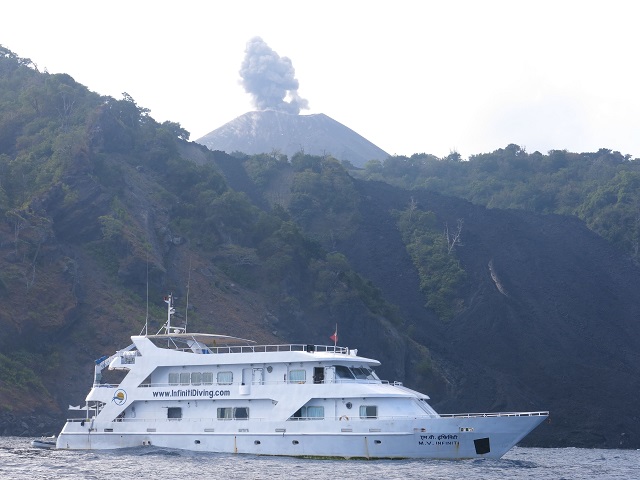 |
Figure 22. The Barren Island cone with a rising plume appears in the background behind a diving ship. According to Vismaya Firodia-Bakshi, the island was "smoking" all six times that the ship visited the islands between January and April 2014. Courtesy of Infiniti Live Aboard (2014). |
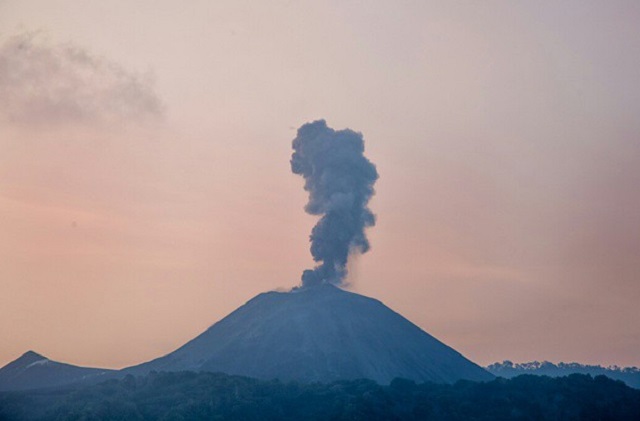 |
Figure 23. Barren Island released a plume that rose a few hundred meters high in April 2014. A previous plume can be seen at left drifting downwind. Courtesy of Infiniti Live Aboard (2014). |
References. Infiniti Live Aboard; 4 July 2014 (URL: http://www.infinitiliveaboard.com/blog/dive-sites-of-barren-island-7) [accessed in February 2015]
Sharma, Jayanth; 2014; Diving in the Barren Islands, Andaman; Wildlife Times (URL: http://www.wildlifetimes.com/photo-story/diving-barren-island-andamans/) [accessed in February 2015]
Information Contacts: Darwin Volcanic Ash Advisory Centre (VAAC) (URL: http://www.bom.gov.au/info/vaac/); Hawai'i Institute of Geophysics and Planetology (HIGP) Thermal Alerts System, School of Ocean and Earth Science and Technology (SOEST) University of Hawai'i at Manoa, 1680 East-West Road, Pacific Ocean Science & Technology (POST) Building Room 602, Honolulu, HI 96822, USA (URL: http://modis.higp.hawaii.edu/); MIROVA, a collaborative project between the Universities of Turin and Florence (Italy) and is supported by the Centre for Volcanic Risk of the Italian Civil Protection Department (URL: http://www.mirovaweb.it/).
Intermittent ash plumes and thermal anomalies continue from July 2014 through February 2017
The eruptive activity at Barren Island that began in October 2013 continued through at least mid-June 2014 (BGVN 39:07). Another eruptive cycle began in March 2015 and continued through 28 February 2016, based on MODIS/MODVOLC thermal anomalies. However, MIROVA hotspots were regular through mid-May 2016, and then sporadic throughout the rest of 2016. The next clear episode began on 15 January 2017 and continued through at least February 2017. Scientists aboard a research ship observed explosions, fire fountains, and lava flows in January 2017.
Activity during October 2013-June 2014. Evidence of renewed activity in the form of lava flows was seen in MODVOLC thermal anomaly data beginning on 12 October 2013. Thermal alert pixels were frequent through 12 February 2014, followed by single anomalies on 12 March and 20 April 2014. Ash plumes were also observed during January-April 2014. Thermal infrared MODIS data processed by the MIROVA system revealed frequent anomalies in April through early May 2014, and in late May to early June; another anomaly was seen in mid-June 2014.
Activity during July 2014-June 2015. No thermal anomalies were seen in MIROVA data for at least five weeks (figure 24), between early June and late July 2014, and then continuing intermittently through the first half of March 2015. The only reported plumes during this time were in the week of 3-9 September 2014 and 22-28 April 2015, but in each case as could not be identified in satellite imagery.
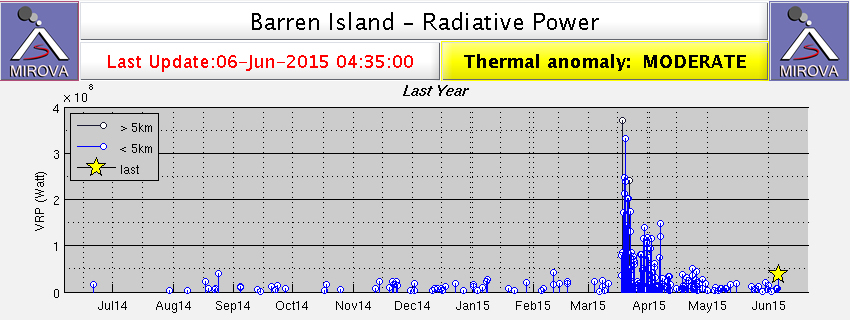 |
Figure 24. Thermal anomaly MIROVA radiative power data from Barren Island during 7 June 2014-6 June 2015. A weak mid-June 2014 anomaly is followed by intermittent weak activity during late July 2014 through mid-March 2015. A strong period of thermal anomalies in March and April 2015 decreased in intensity but continued into early June 2015. Courtesy of MIROVA. |
A strong thermal signature resumed on 17 March 2015 (figure 24) and continued for about three weeks before decreasing in intensity. Lower-level thermal activity continued through the first half of June. Thermal anomalies seen in MODVOLC data also resumed on 17 March, and were frequent through 12 June. Eruptions of ash were observed during 5-7 and 12-13 June 2015, with plumes rising to an altitude of 2-3 km and drifting up to 55 km downwind (table 5).
Table 5. Ash plumes at Barren Island, June 2015-February 2016. Legend: Satellite=analysis of satellite images, wind=wind data. Data provided by the Darwin Volcanic Ash Advisory Centre.
| Date | Max. Altitude (km) | Drift | Basis of report |
| 2015 Jun 5-7 | 2.4-3 | 35-45 km NE, E | Satellite, wind |
| 2015 Jun 12-13 | 2.1 | 25-55 km NE | Pilot, satellite, wind |
| 2015 Aug 19 | 1.5 | 55 km E | Satellite, wind |
| 2015 Sep 22 | 1.8 | 45 km E | Satellite, wind |
| 2015 Oct 8-9 | 1.5-2.1 | 75-100 km NE | Satellite, wind |
| 2016 Jan 3-4 | 1.5 | 85 km SW | Satellite, wind |
| 2016 Jan 31-Feb 2 | 1.5 | 165 km SW | Satellite, wind |
| 2016 Feb 14-15 | 1.5 | Over 45 km W | Satellite, wind |
Activity during July 2015-May 2016. Thermal activity paused again for approximately a month in the second half of June and first half of July 2015. Regular thermal anomalies in MODVOLC data stopped after 12 June and resumed on 16 July. Episodic clusters of anomalies with gaps of 1-3 weeks continued until 28 February 2016. Although MODVOLC data did not show thermal anomalies after February 2016, MIROVA data showed ongoing activity until approximately 17 May (figure 25).
A few ash plumes were seen during this period, on 19 August, 22 September, and 8-9 October 2015 (table 5). There were no reported plumes in November or December 2015, but were seen once again in January and February 2016. Plumes typically rose to an altitude of 1.5-2 km and drifted 45-100 km downwind; the longest plume extended 1665 km SW.
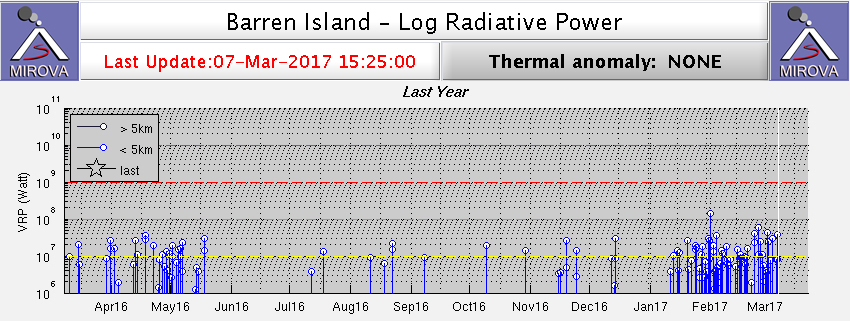 |
Figure 25. Thermal anomaly MIROVA log radiative power data from Barren Island during 21 February 2016-20 February 2017. Regular activity is evident from late February through mid-May 2016. After a gap of about two months, there are only infrequent anomalies through mid-January 2017, after which another episode of frequent anomalies began. Courtesy of MIROVA. |
Activity during June 2016-February 2017. Eruptive activity apparently stopped around 16-17 May 2016 for at least seven weeks. MODIS thermal data captured by MIROVA showed a few anomalies (less than 20) from the second half of July through the first half of December 2016 (figure 25). Considering the remote location and rare direct observations at this island volcano, it is possible that the anomalies represent intermittent lava emissions. Regular thermal anomalies were recorded by both MIROVA and MODVOLC beginning on 15 January that were continuing at the end of February 2017.
The National Institute of Oceanography (NIO), part of the Indian Council of Scientific and Industrial Research (CSIR), reported activity on 23 January 2017. Scientists aboard a research vessel were collecting sea floor samples when they observed a sudden ash emission. The team moved closer, about 1.6 km from the volcano, and noted small eruptive episodes lasting 5-10 minutes. Ash emissions were visible in the daytime, and lava fountains feeding lava flows on the flanks were visible at night. The team revisited the volcano on 26 January and observed similar activity over four hours. They sampled sediments and water in the vicinity of the eruption and recovered volcanic ejecta.
Information Contacts: Darwin Volcanic Ash Advisory Centre (VAAC), Bureau of Meteorology, Northern Territory Regional Office, PO Box 40050, Casuarina, NT 0811, Australia (URL: http://www.bom.gov.au/info/vaac/); The National Institute of Oceanography (NIO), Council of Scientific and Industrial Research (CSIR), New Delhi, India (URL: http://www.nio.org/); Hawai'i Institute of Geophysics and Planetology (HIGP), MODVOLC Thermal Alerts System, School of Ocean and Earth Science and Technology (SOEST), Univ. of Hawai'i, 2525 Correa Road, Honolulu, HI 96822, USA (URL: http://modis.higp.hawaii.edu/); MIROVA (Middle InfraRed Observation of Volcanic Activity), a collaborative project between the Universities of Turin and Florence (Italy) supported by the Centre for Volcanic Risk of the Italian Civil Protection Department (URL: http://www.mirovaweb.it/).
Decreased and intermittent thermal anomalies after mid-March 2017
Following sporadic activity during the second half of 2016, a new period of strong thermal anomalies suggestive of lava flows began in mid-January 2017 (BVGN: 42:03). Scientists on a nearby research vessel observed ash emissions and lava fountains that fed lava flows during 23-26 January. Subsequent possible activity, as shown by MODIS thermal anomalies detected by MIROVA (figure 26), continued at similar levels until mid-March, after the anomalies became more intermittent and decreased in power through at least 2 September. Thermal alerts in MODVOLC were recorded during 15 January-8 March 2017.
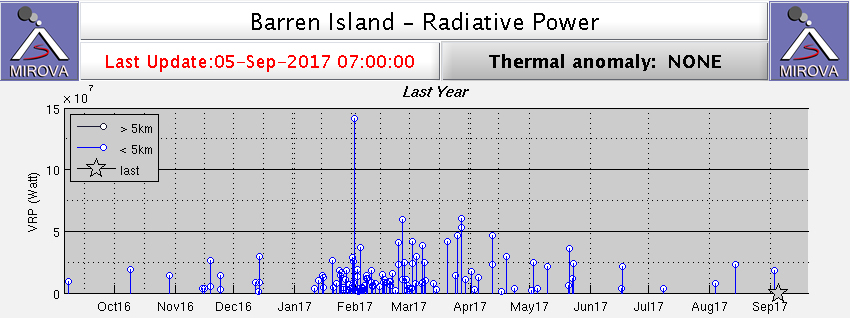 |
Figure 26. Thermal anomaly MIROVA log radiative power data from Barren Island during early September 2016-1 September 2017. Regular, low-moderate activity is evident beginning in late January through April 2017, but it thereafter wanes. Courtesy of MIROVA. |
Geological Survey of India cruise in May 2015. Some observations and photos of activity on 14 and 31 May 2015 have been provided by Sachin Tripathi, a geologist at the Geological Survey of India, who was close to the volcano during the SR-013 cruise of the RV Samudra Ratnakar. On 14 May the plumes were described as light gray "mushroom shaped" clouds. Tripathi further noted that the activity occurred in discrete pulses; he observed two such events during an 8-minute period that sent ash plumes 300-400 m high (figure 27). Eruptive pulses on 31 May lasted about 20-25 seconds, with an interval of 4-5 minutes. The plumes on that day were light gray to gray, and rose to around 50-100 m. The NE portion of the island was covered with ash (figure 28).
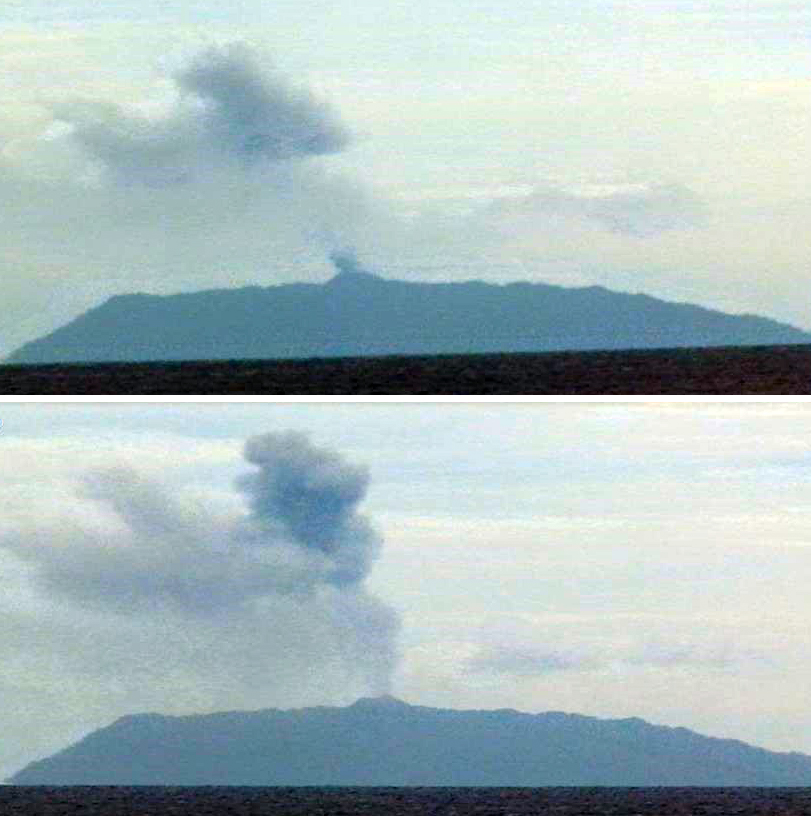 |
Figure 27. Two images from a video that illustrate the pulsating eruption at Barren Island on 14 May 2015. The top image shows the remains of an older plume above the island and a new plume just rising from the summit. The bottom image shows the ash plume rising to about 300-400 m above the island. Courtesy of Sachin Tripathi, Geological Survey of India. |
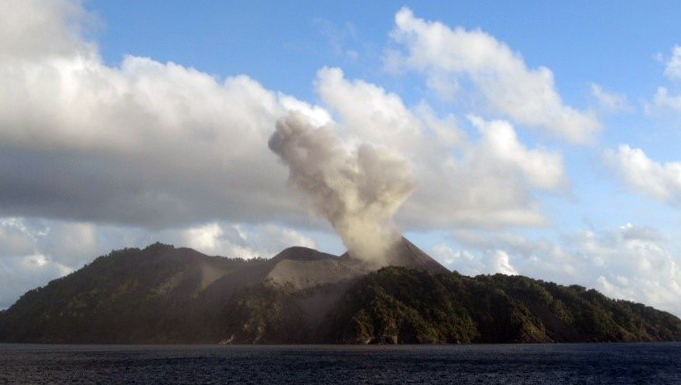 |
Figure 28. Photograph of an ash plume rising from the active vent at Barren Island on 31 May 2015. Ashfall can be seen covering the NE portion of the island. Courtesy of Sachin Tripathi, Geological Survey of India. |
Information Contacts: Sachin Tripathi, Geological Survey of India; MIROVA (Middle InfraRed Observation of Volcanic Activity), a collaborative project between the Universities of Turin and Florence (Italy) supported by the Centre for Volcanic Risk of the Italian Civil Protection Department (URL: http://www.mirovaweb.it/); Hawai'i Institute of Geophysics and Planetology (HIGP) - MODVOLC Thermal Alerts System, School of Ocean and Earth Science and Technology (SOEST), Univ. of Hawai'i, 2525 Correa Road, Honolulu, HI 96822, USA (URL: http://modis.higp.hawaii.edu/).
Eruptions in January-March 2017 and September 2018-January 2019 produce ash plumes, lava fountaining, and lava flows
Barren Island is a remote volcano east of India in the Andaman islands. Recent intermittent eruptions observed since 1991 have consisted of explosions, ash plumes, and lava flows. This report summarizes activity from January 2017 through January 2019 and is based on satellite data and observations. Two main periods of eruptive activity are apparent (figure 29): the first in January-March 2017, and the second in September 2018-January 2019.
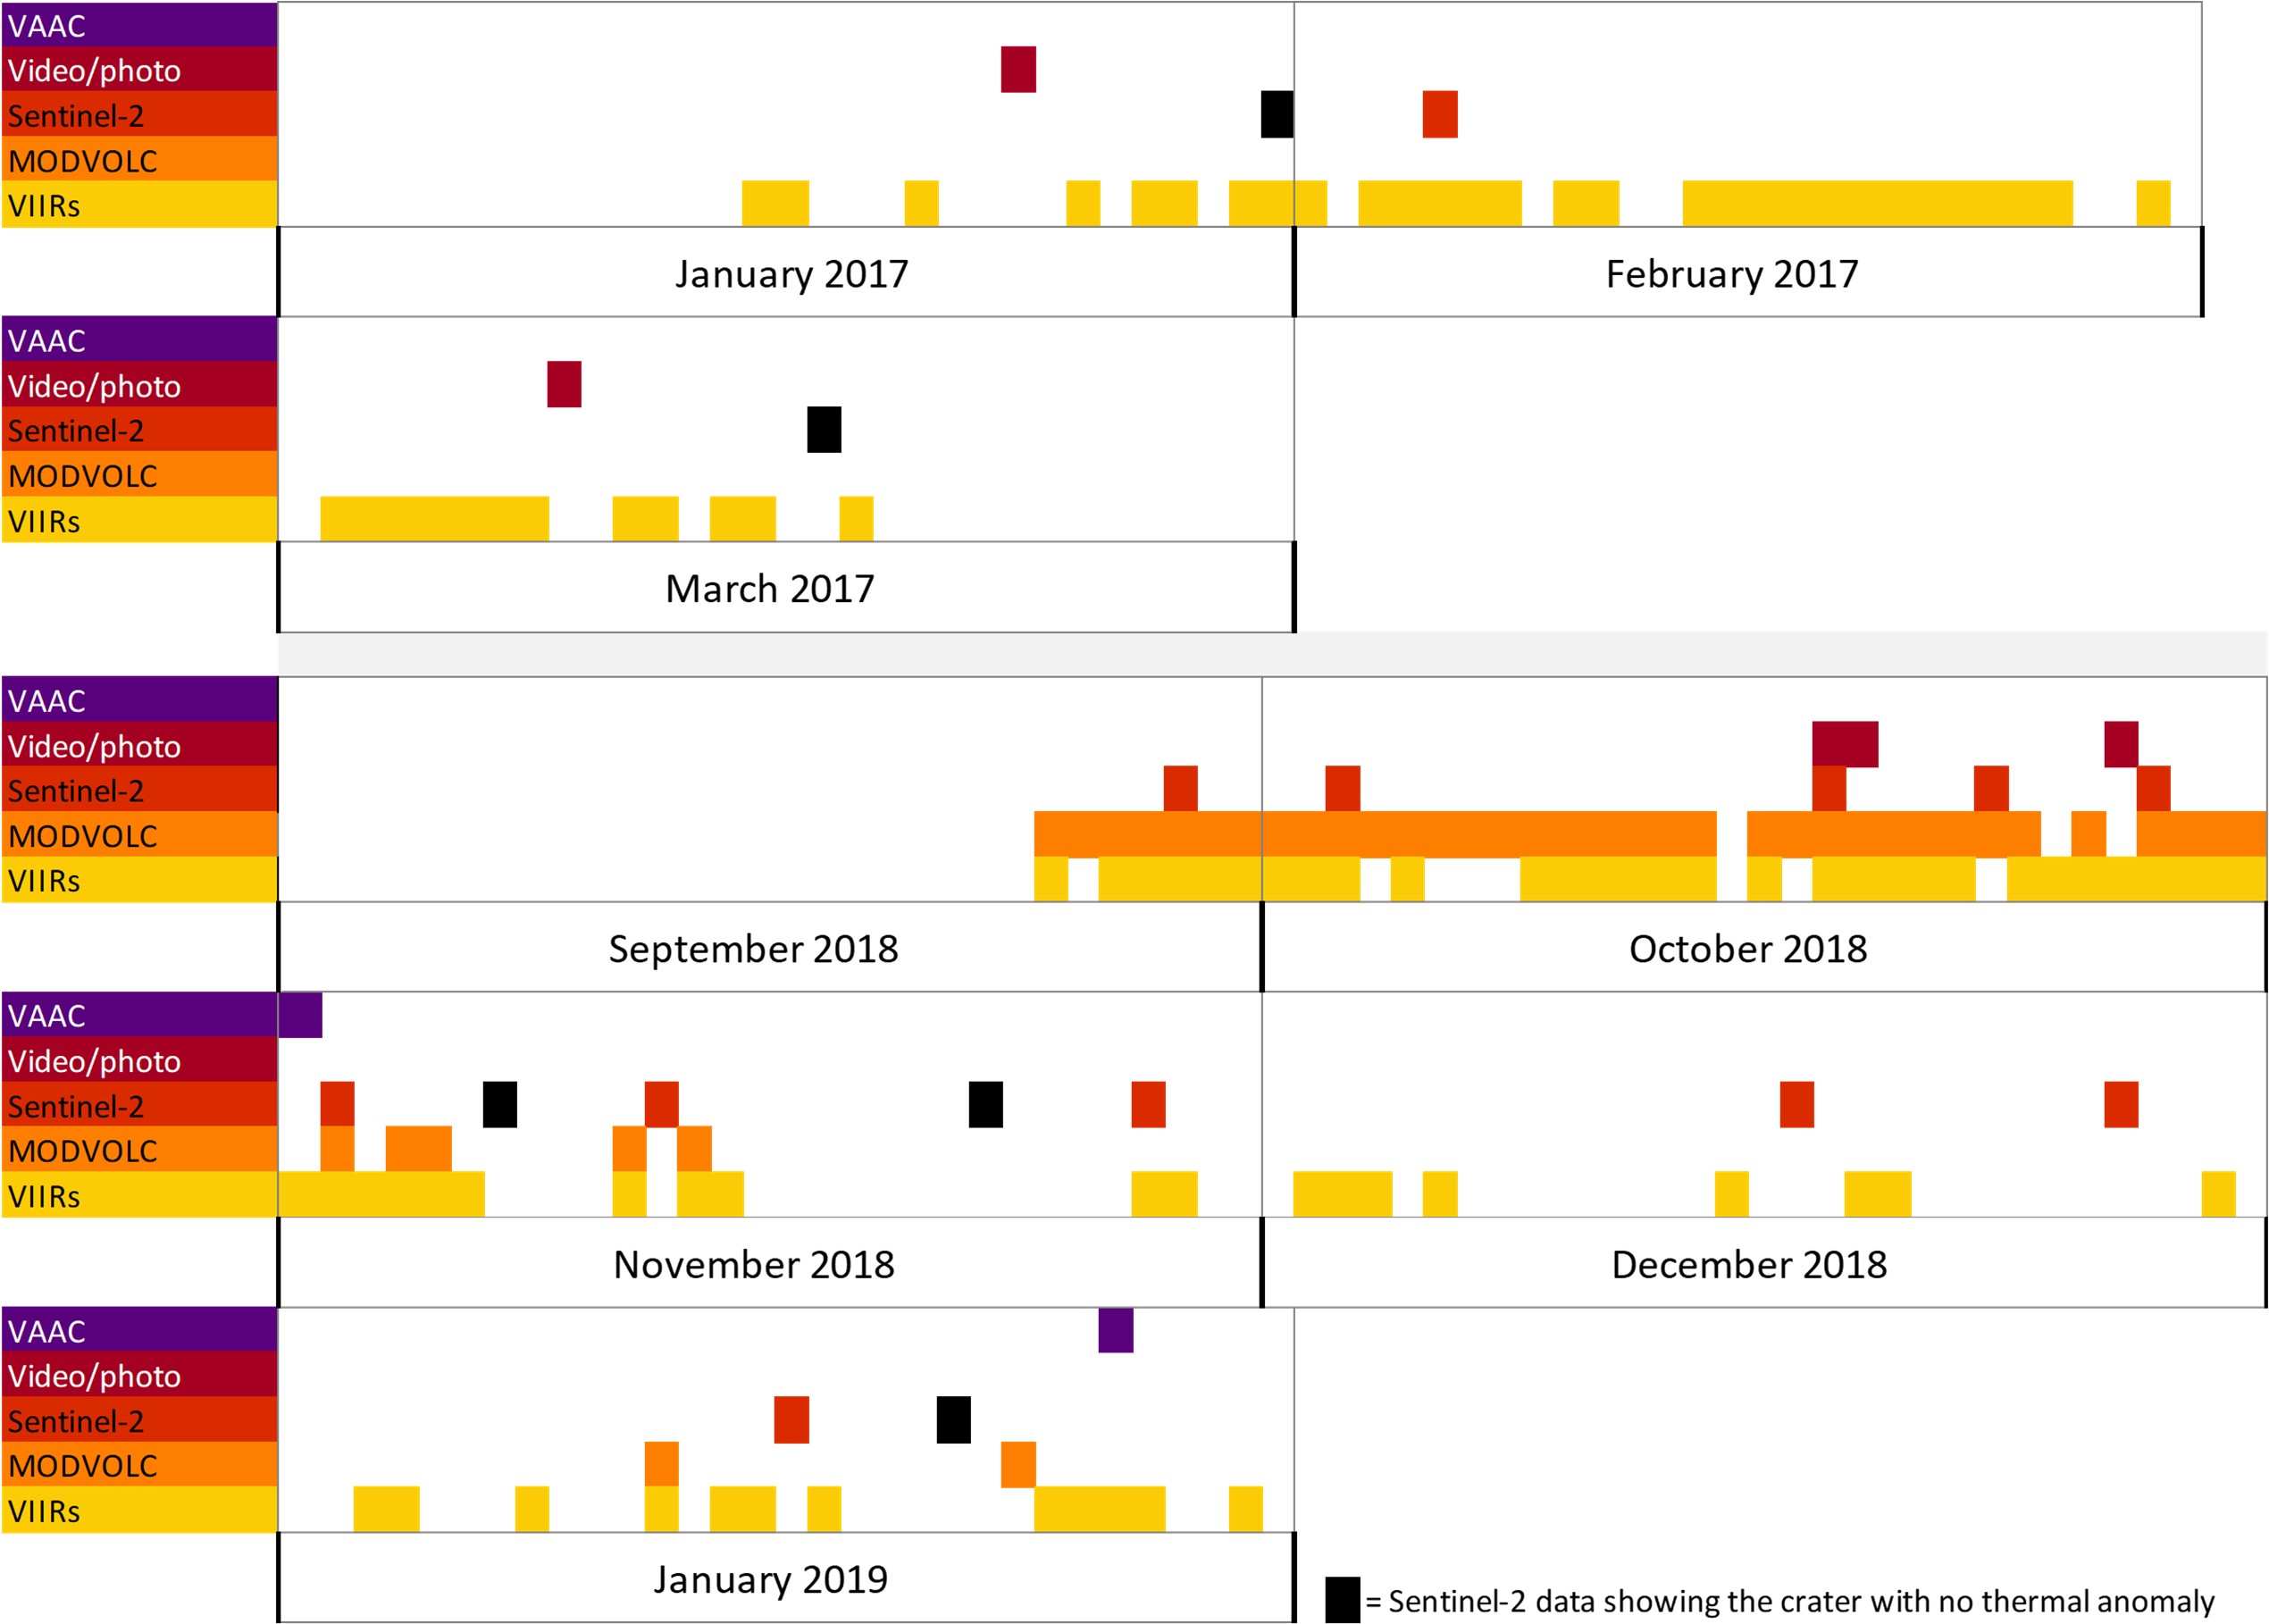 |
Figure 29. Timeline summary of observed activity at Barren Island from January 2017 through January 2019. For Sentinel-2, MODIS, and VIIRs data, the dates indicated are when thermal anomalies are detected. The grey bar indicates a time period where there were no indications of activity. Data courtesy of NASA Worldview, Sentinel Hub Playground, Darwin VAAC, HIGP. |
During January-March 2017 there were frequent thermal anomalies detected by the Suomi NPP/VIIRS sensor, then again during late September to mid-November 2018 (see figure 29). These times coincide with the highest frequency of thermal anomalies detected by the MIROVA algorithm (figure 30). There are intermittent low-energy anomalies detected by MIROVA between these two periods but there are no indications of thermal anomalies in other datasets. The MODVOLC algorithm for MODIS thermal anomalies registered elevated temperatures during the late September to mid-November 2018 period, then on a few isolated dates in January 2019 (figure 31). The anomalies with greater thermal energy in September-October 2018 correspond to lava flows on different flanks of the cone, as shown in Sentinel-2 thermal and visible satellite data (figures 32 and 33). From November 2018 through January 2019 there were intermittent thermal signatures and gas plumes from the crater visible in Sentinel-2 images.
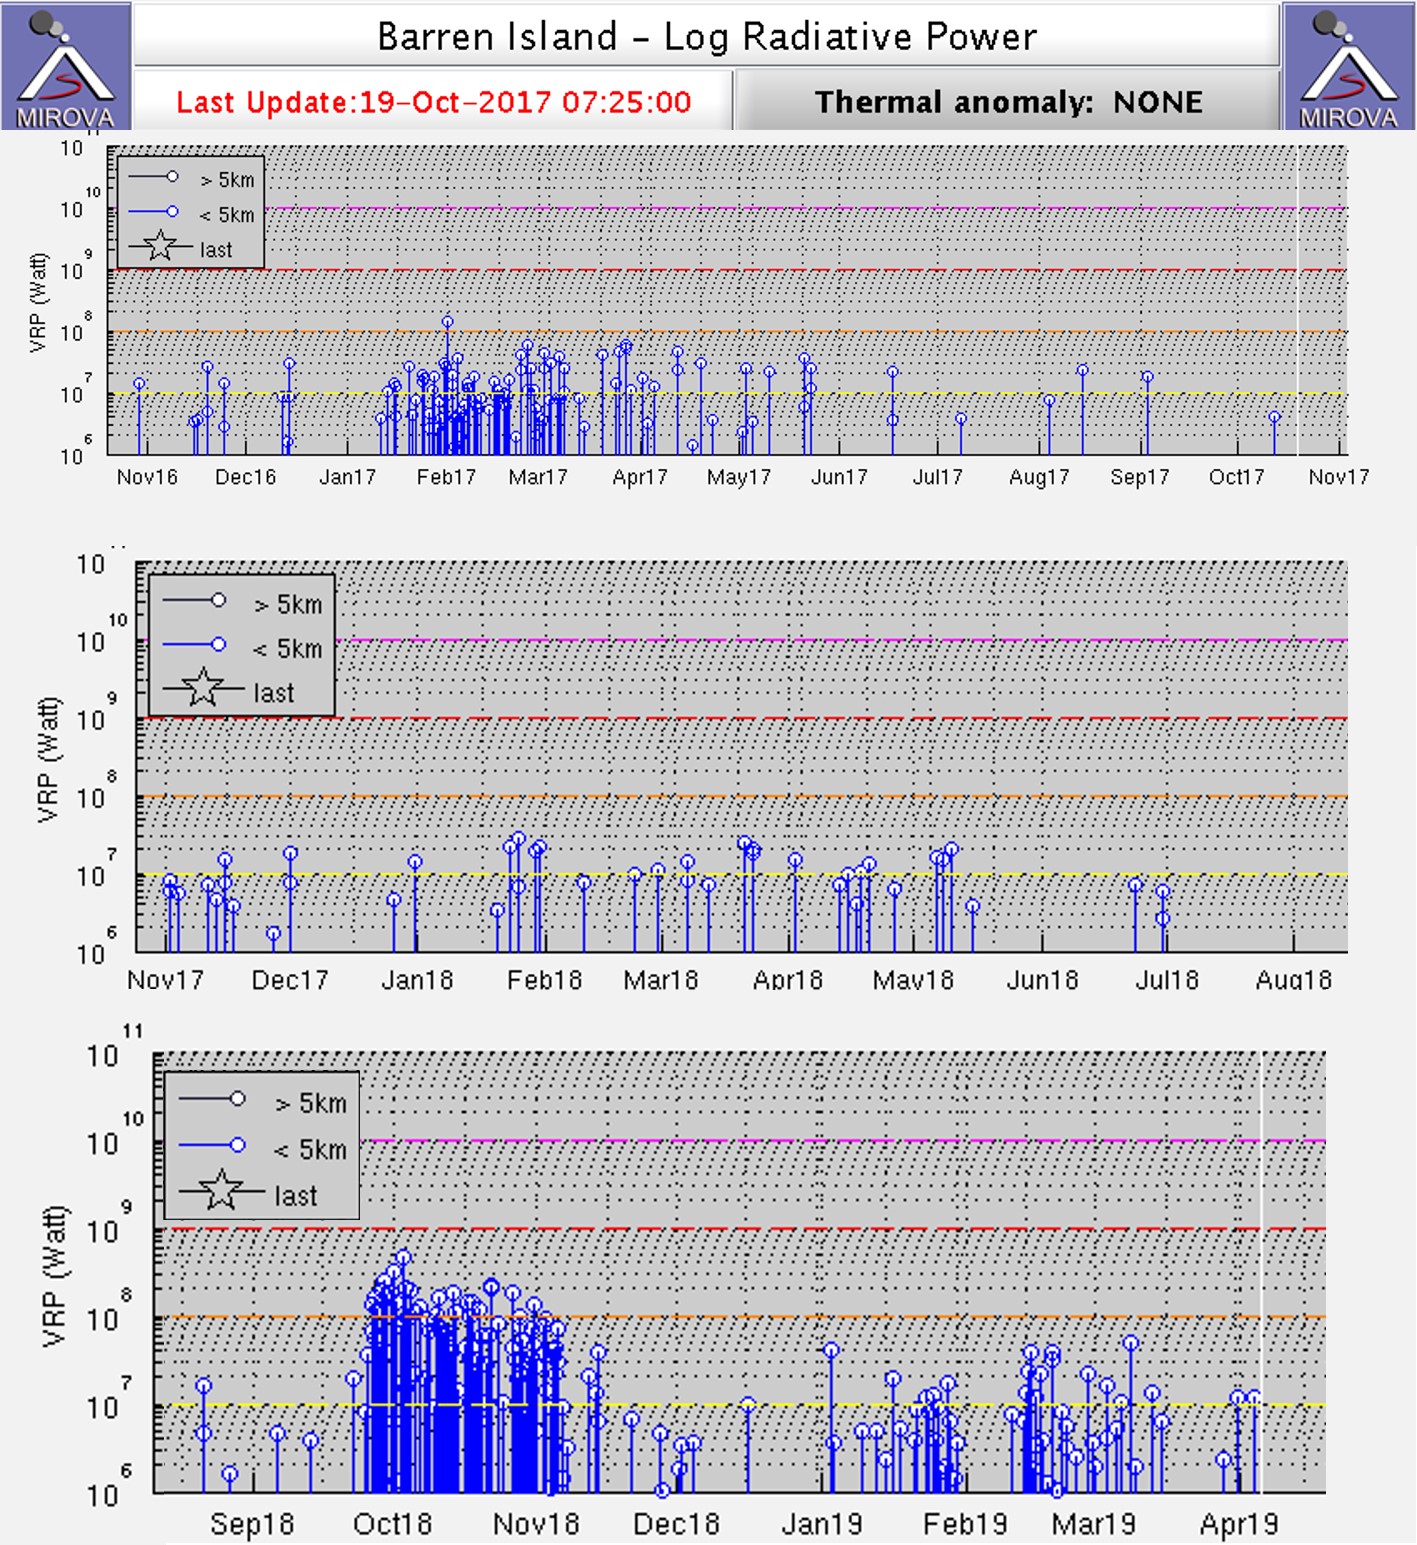 |
Figure 30. Log radiative power MIROVA plot of MODIS infrared data from November 2016 through April 2019 showing elevated activity in January-March 2017 and September 2018-January 2019. Courtesy of MIROVA. |
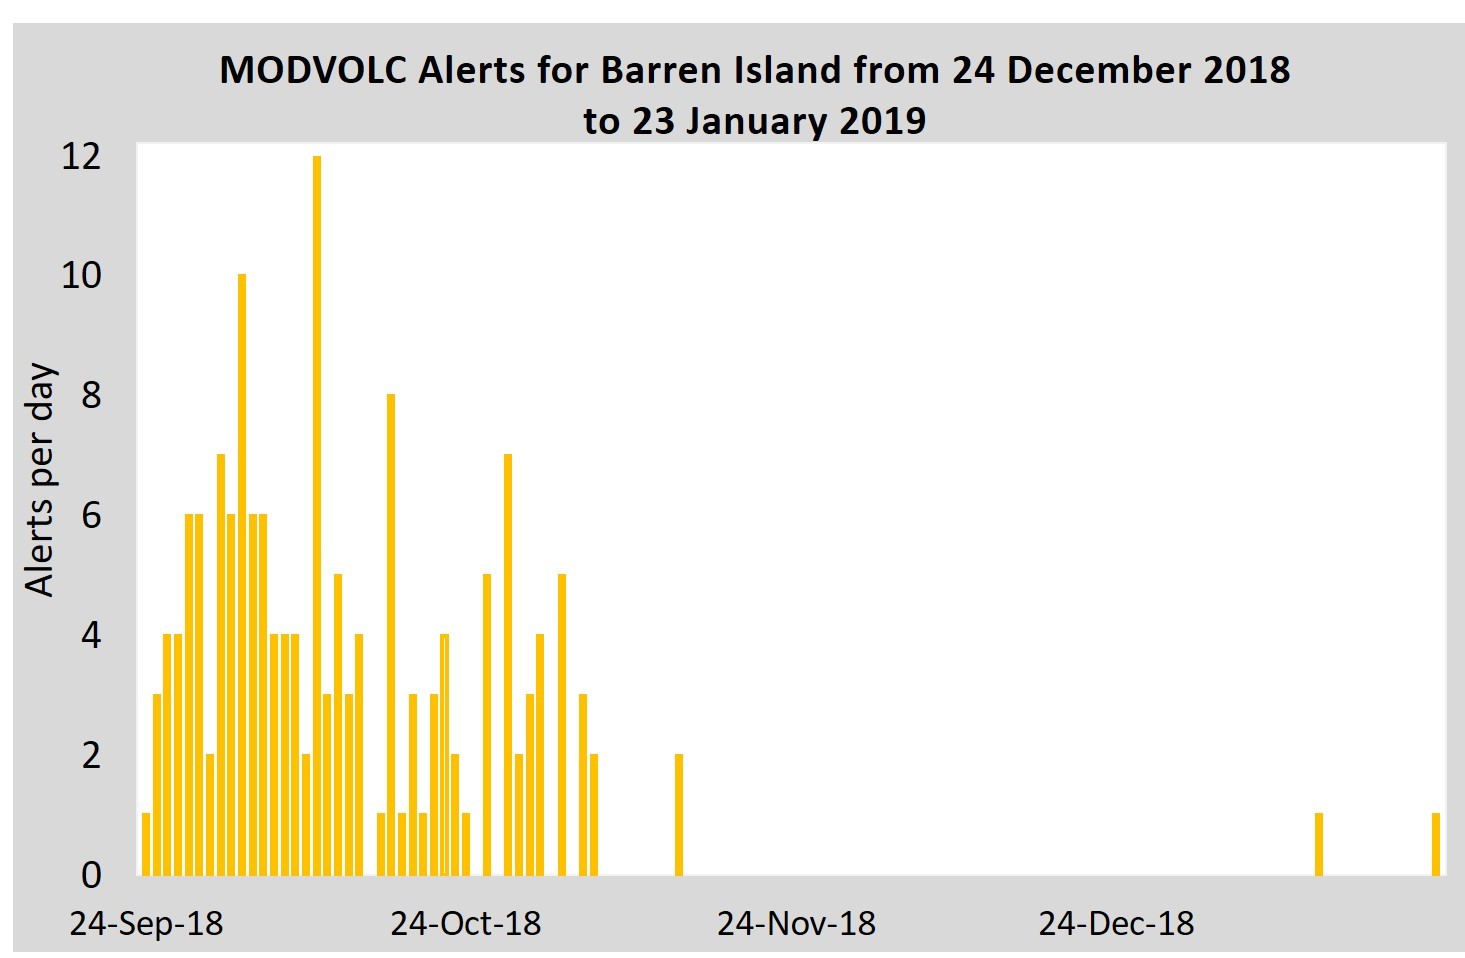 |
Figure 31. Graph of the number of MODVOLC thermal alerts issued from September 2018 to January 2019. There were no earlier alerts back to 1 January 2017. Data courtesy of MODVOLC. |
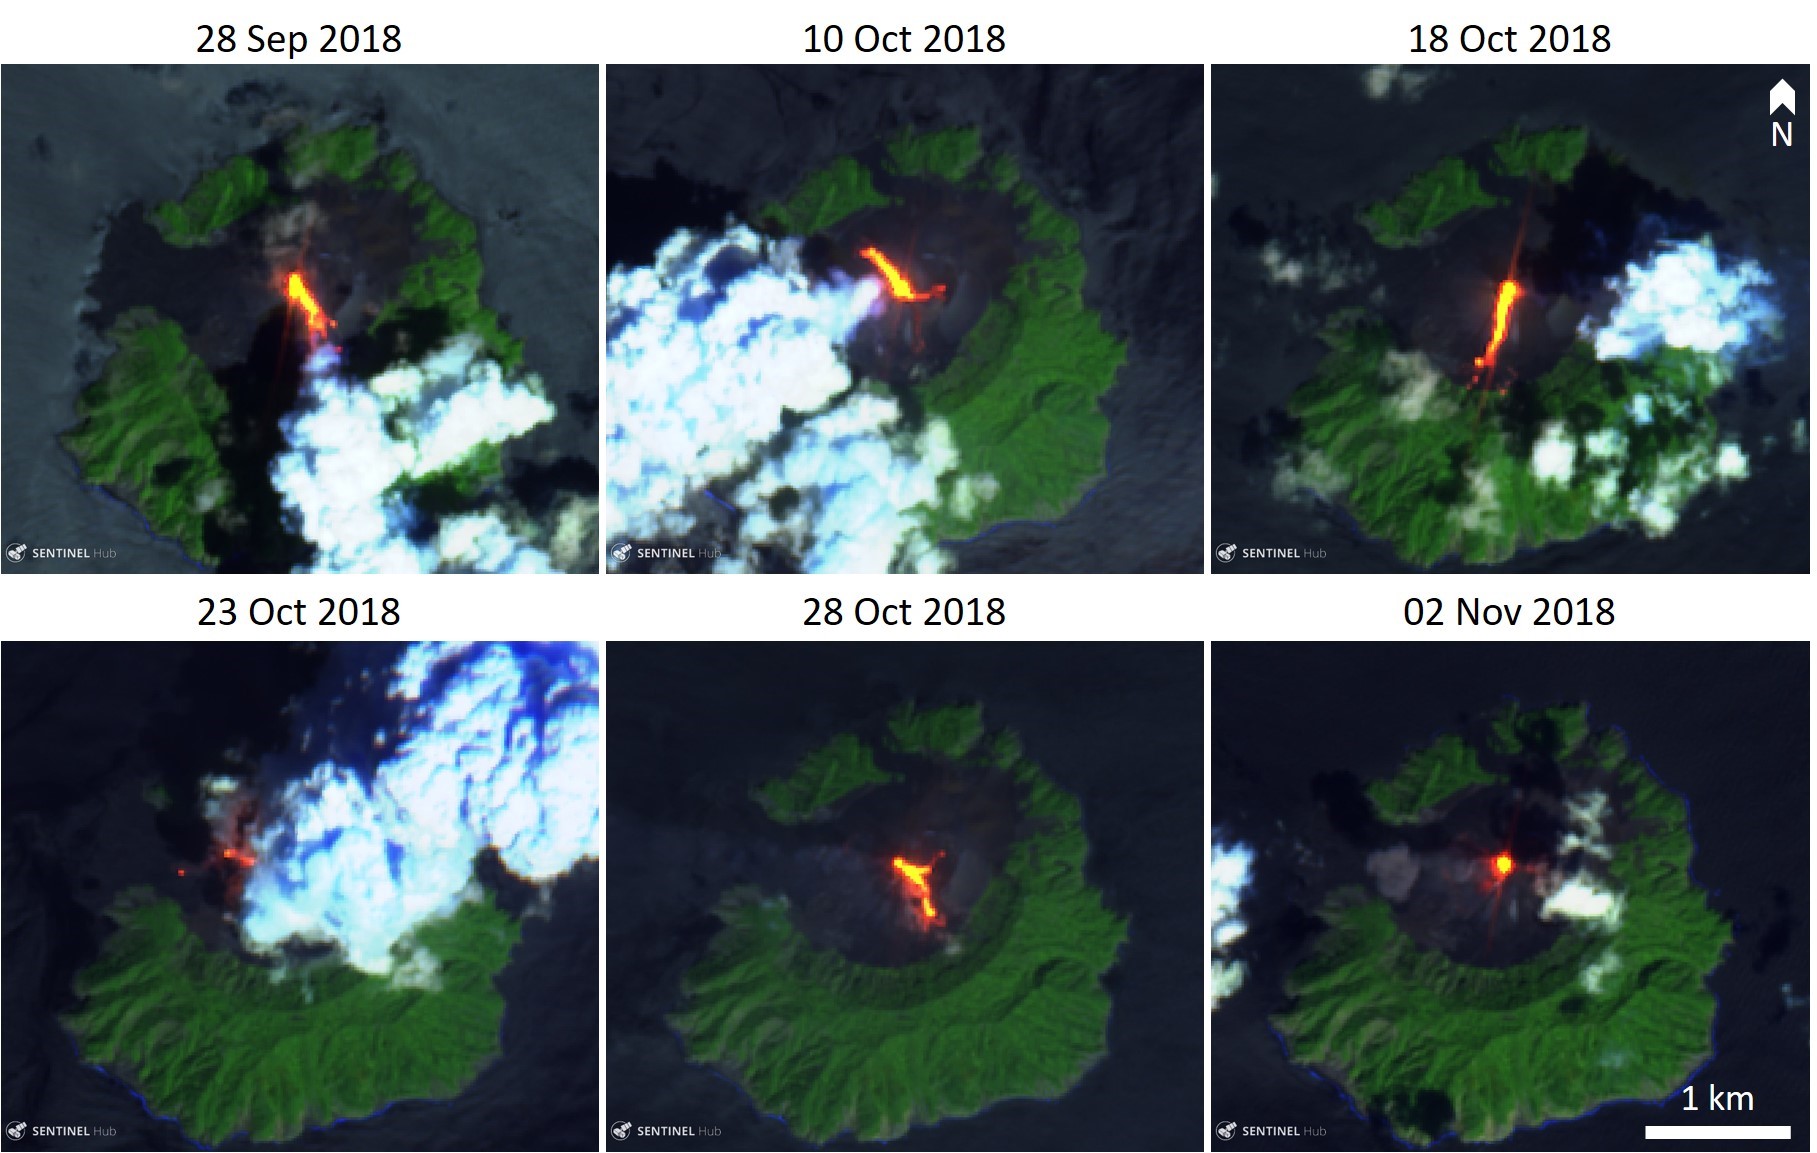 |
Figure 32. Sentinel-2 thermal images showing Barren Island with multiple lava flows that traveled in different directions on the flanks and elevated temperatures in the crater (bright yellow-orange) during September-November 2018. False color images (bands 12, 11, 4) courtesy of Sentinel Hub Playground. |
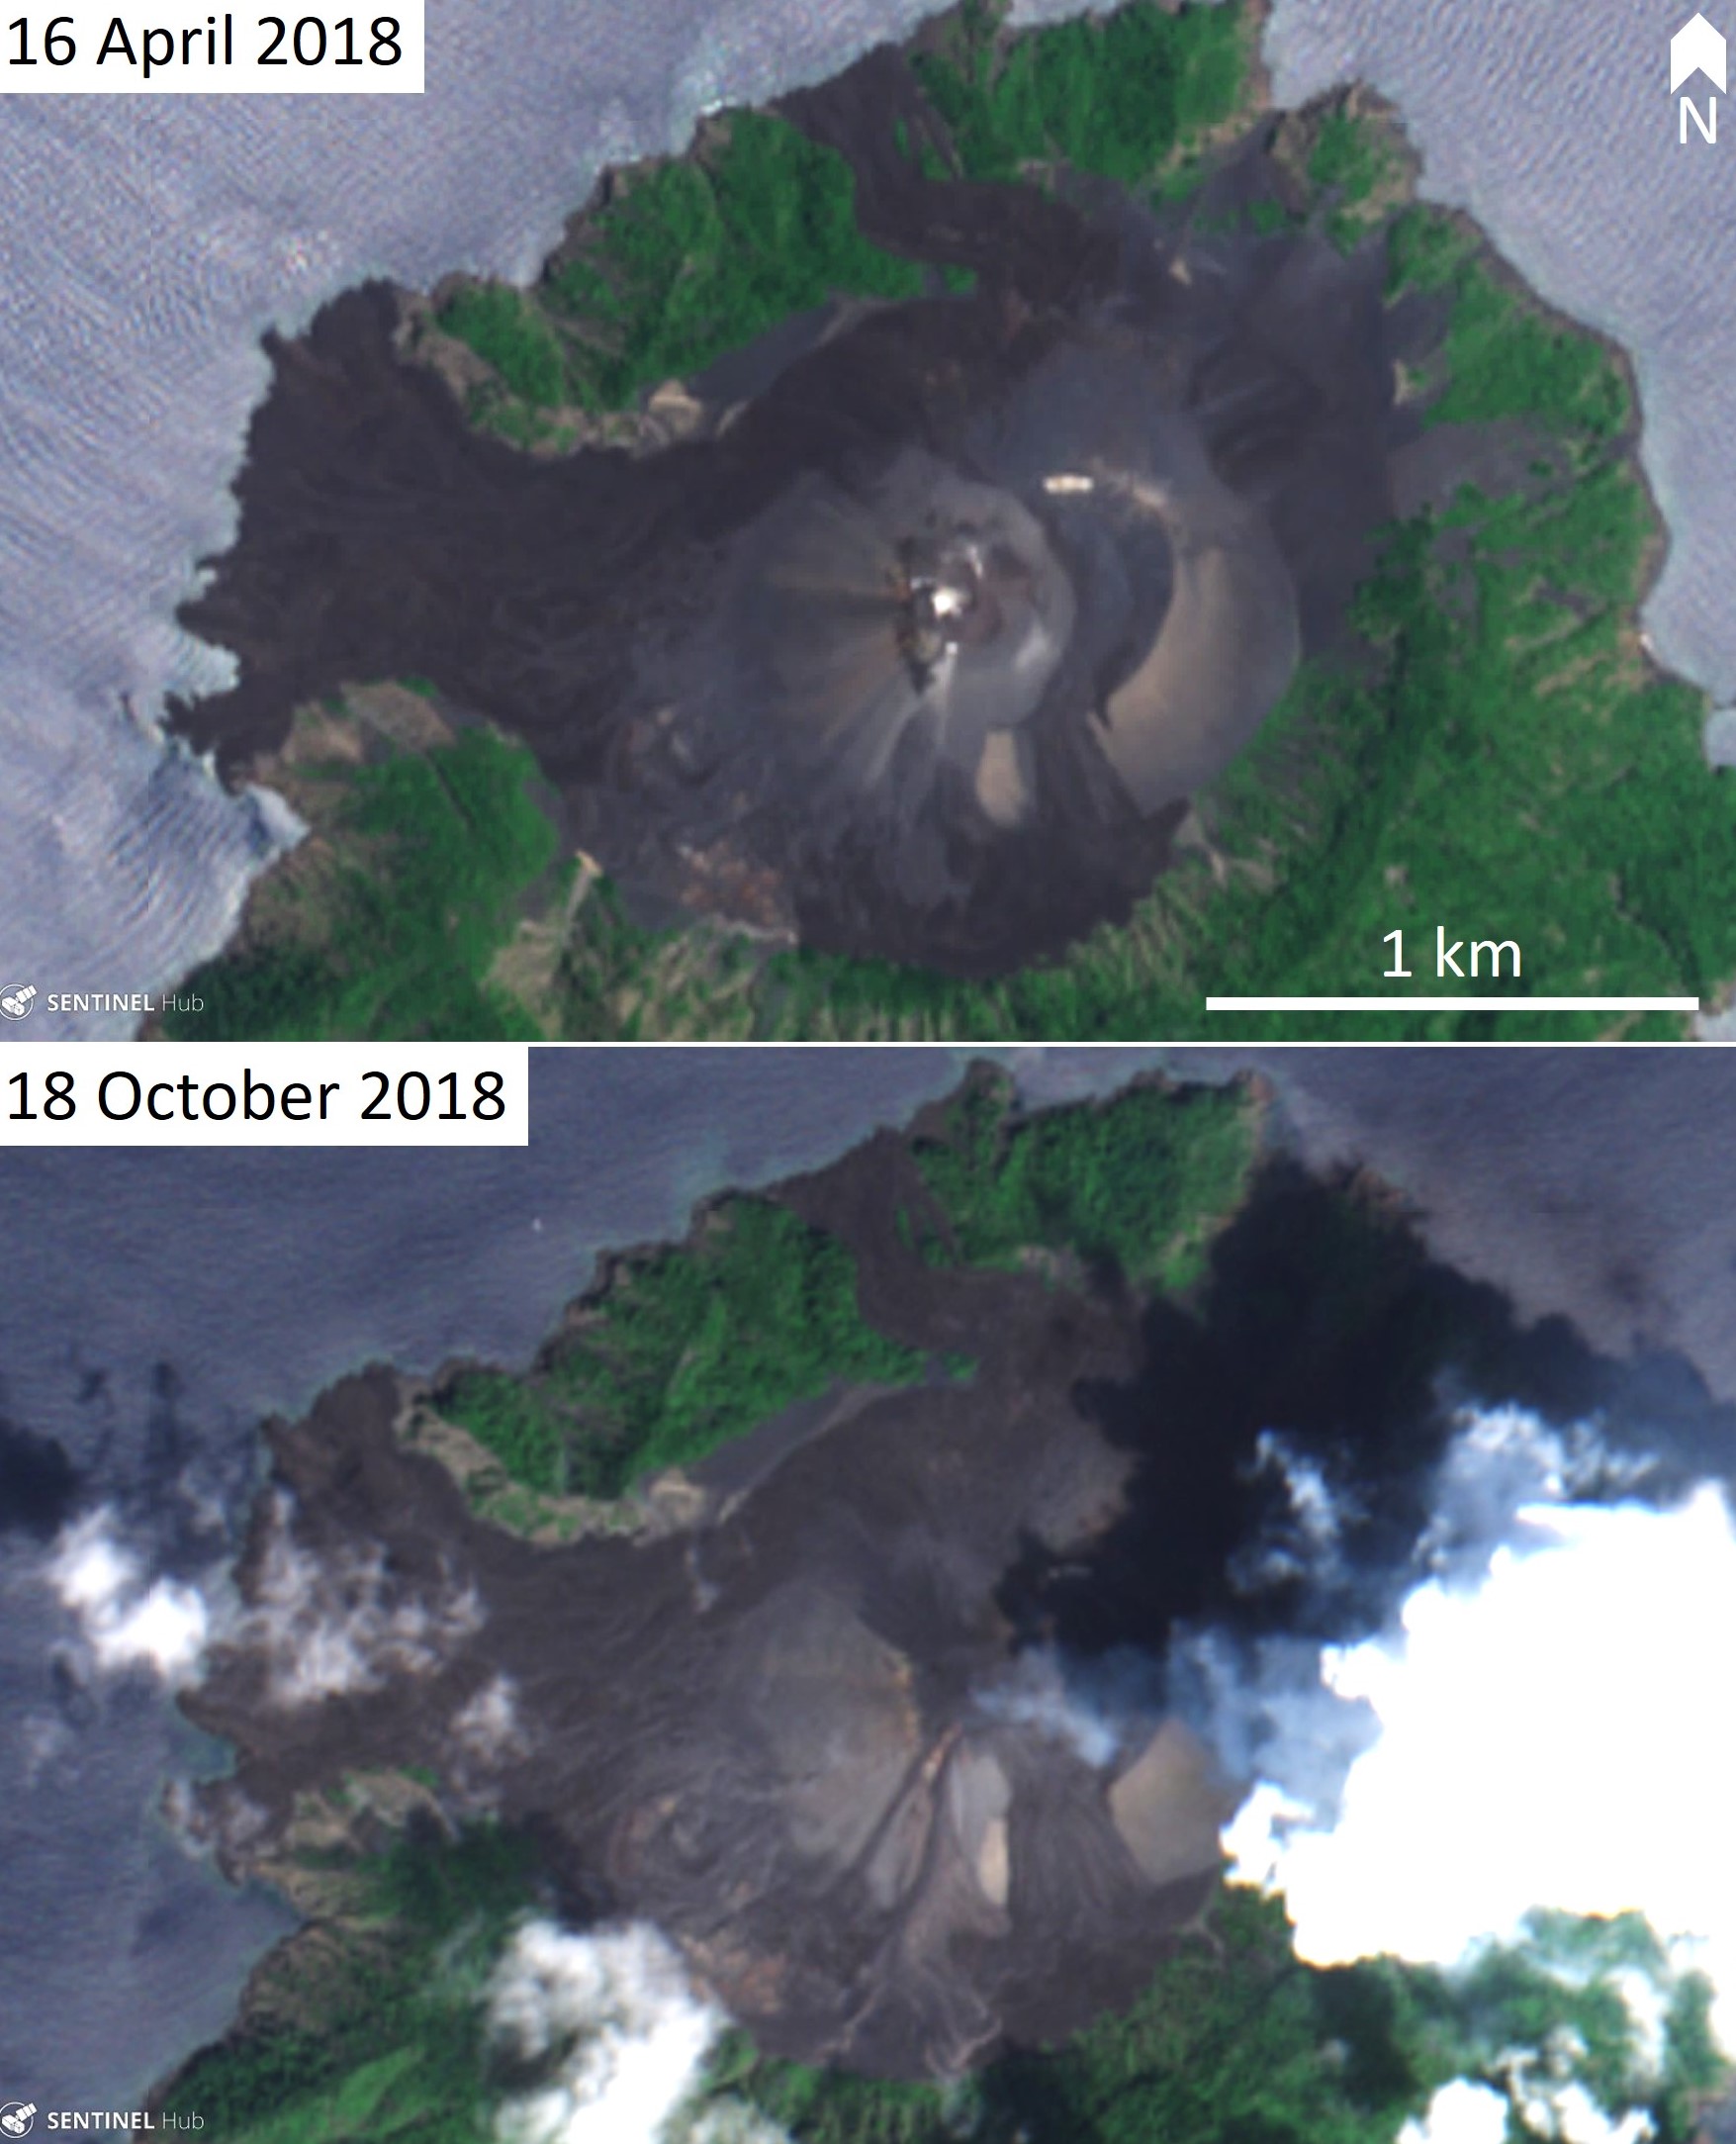 |
Figure 33. Sentinel-2 satellite images of Barren Island showing new lava flows that formed during September-October 2018. The new flows can be seen in the bottom image flowing from the central crater to the NNW, SW, and SSE. Sentinel-2 natural color images (bands 4, 3, 2) courtesy of Sentinel Hub Playground. |
The new eruption was first observed on 23 January 2017, when a research cruise was working nearby. They witnessed explosions that produced incandescent material and small ash plumes (figure 34) with the episodes lasting five to ten minutes. The team noted ash plumes during the day and incandescent material being ejected onto the slopes at night. They observed four hours of activity before leaving the area. The Indian Coast Guard also witnessed the eruption before 25 February, capturing a night-vision video of an explosion that produced an ash plume and ejected incandescent blocks above the crater that impacted the flanks of the volcano (figure 35). An overflight on 23 February 2017 was undertaken to assess the volcanic activity after several reports of activity over the previous days. They observed intermittent explosions ejecting incandescent material and small ash plumes (figure 36).
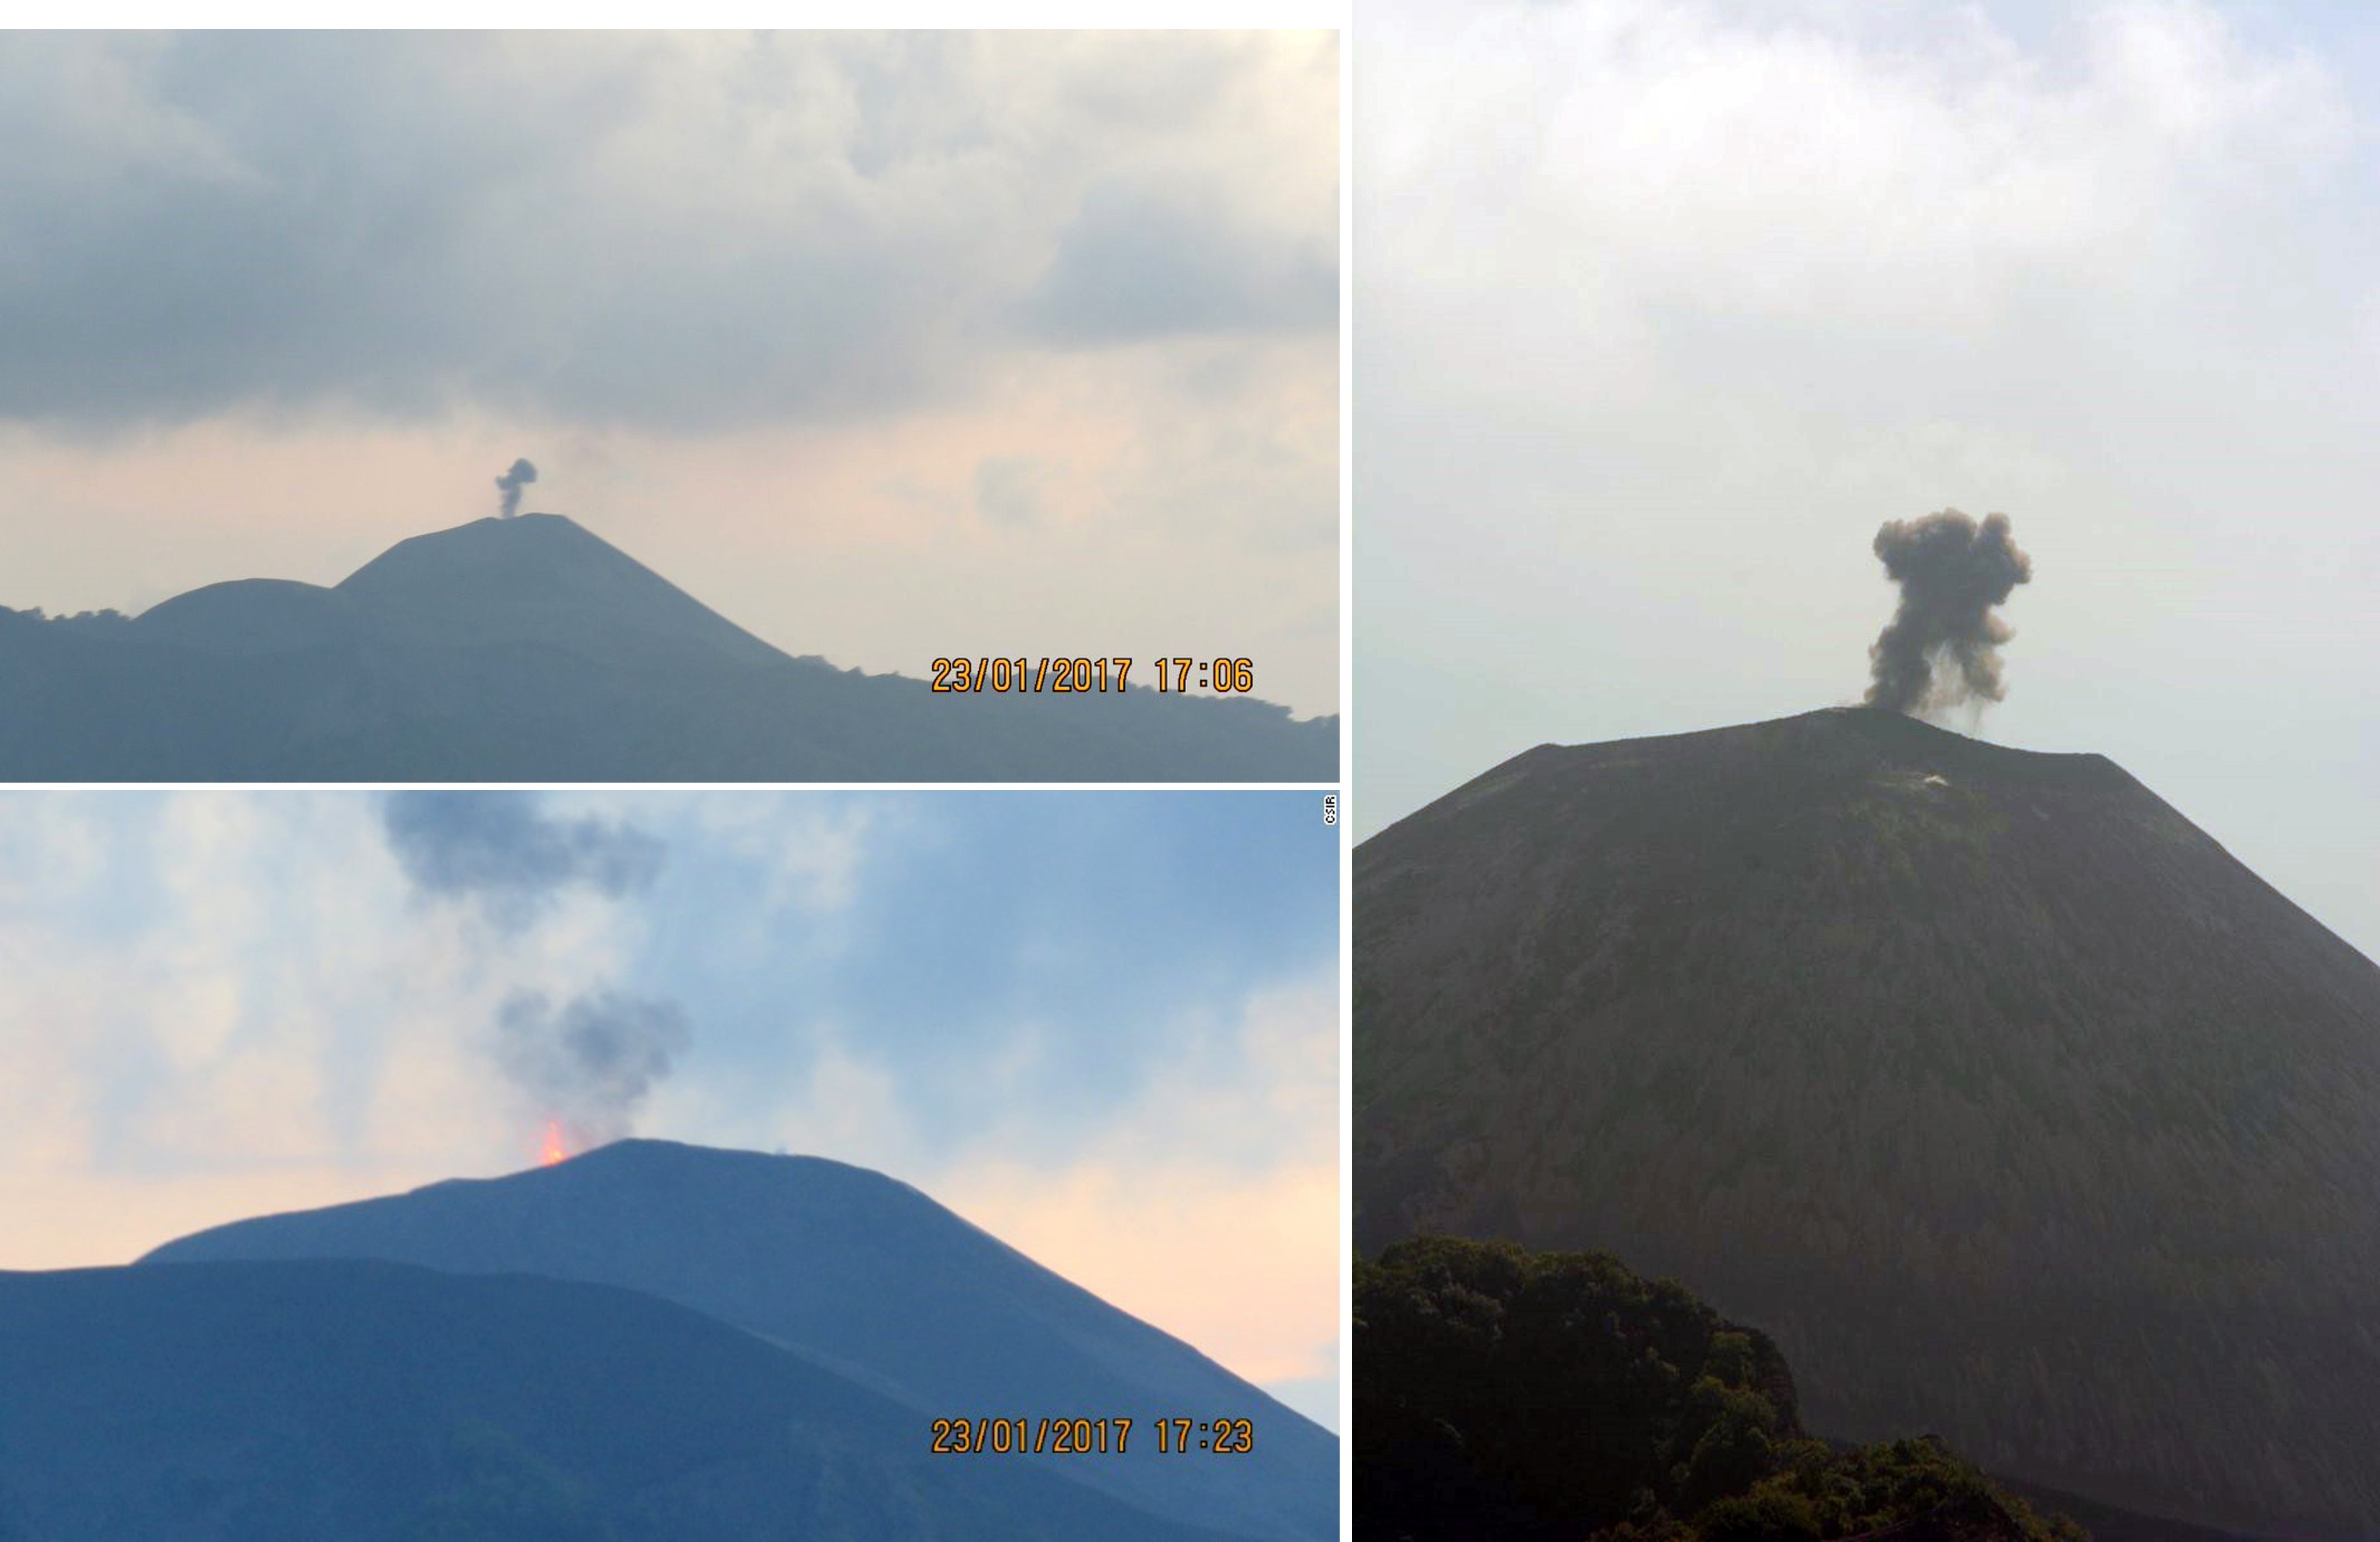 |
Figure 34. Photos of activity at Barren Island ejecting incandescent material and ash plumes on 23 January 2017. Courtesy of CSIR-National Institute of Oceanography. |
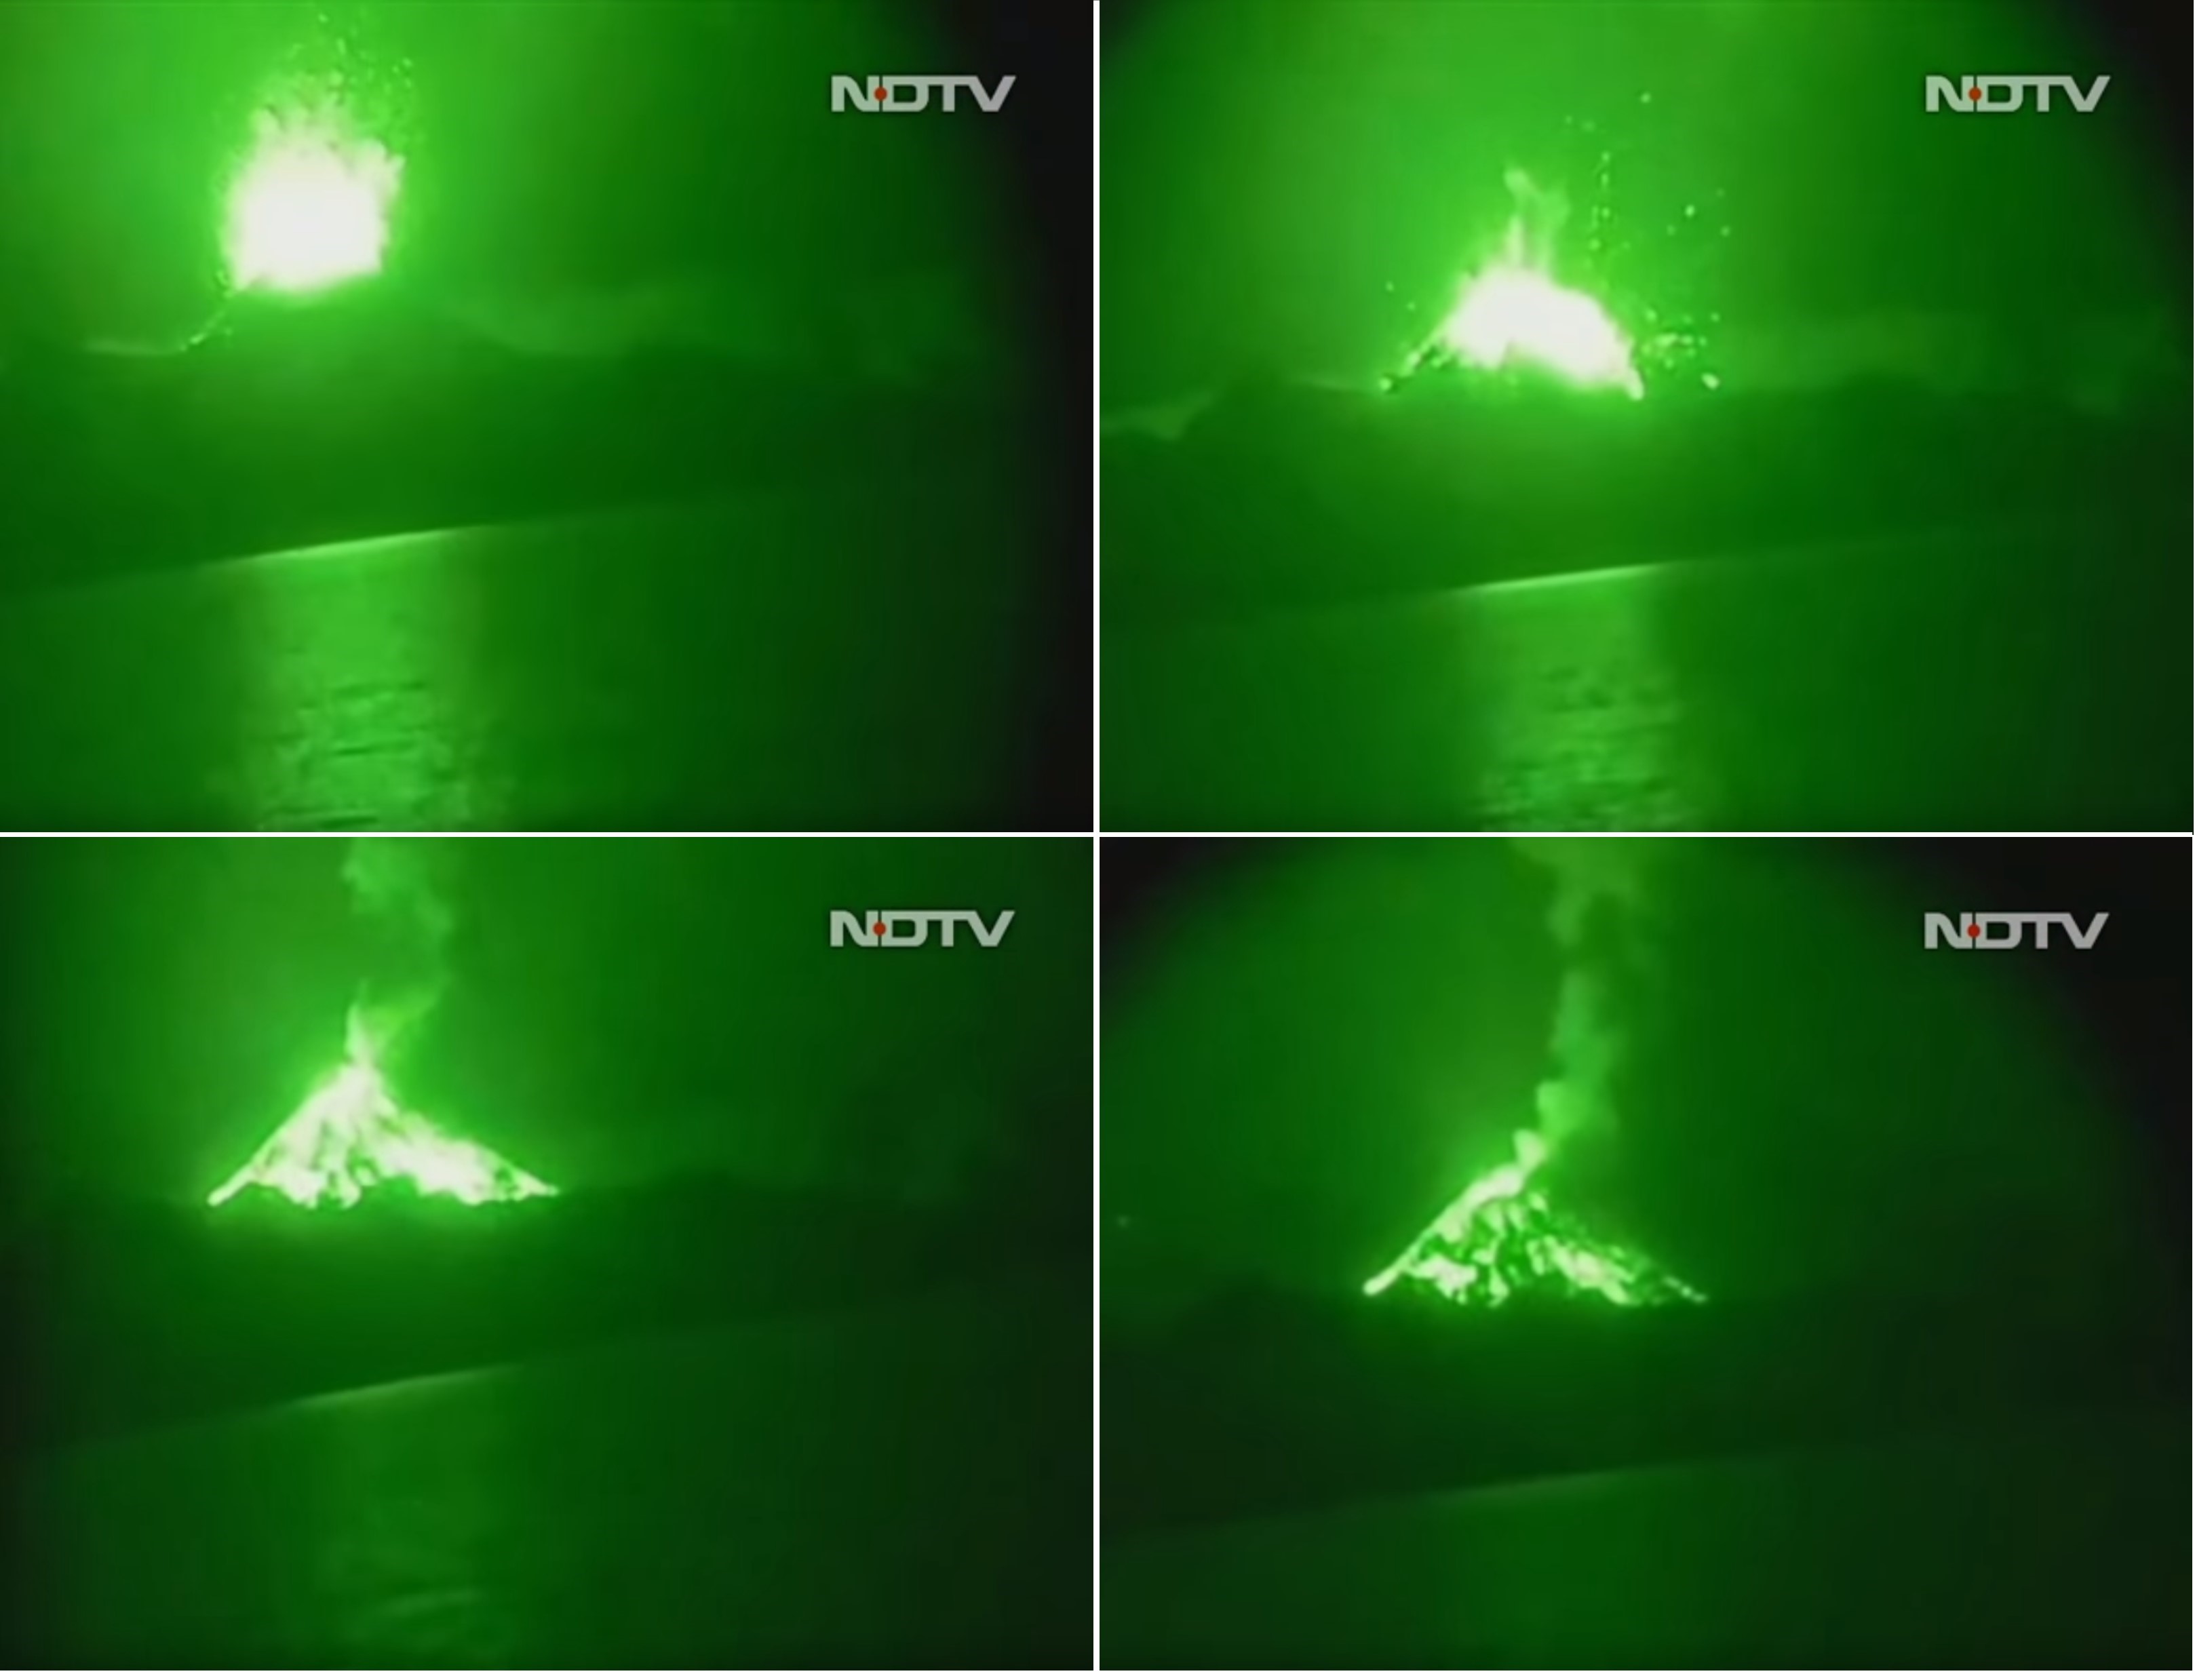 |
Figure 35. An explosion at Barren Island ejecting incandescent blocks that impacted the flanks of the volcano and produced an ash plume. These images are screenshots of a night-vision video taken prior to 25 February 2017. Courtesy of Indian Coast Guard and NDTV. |
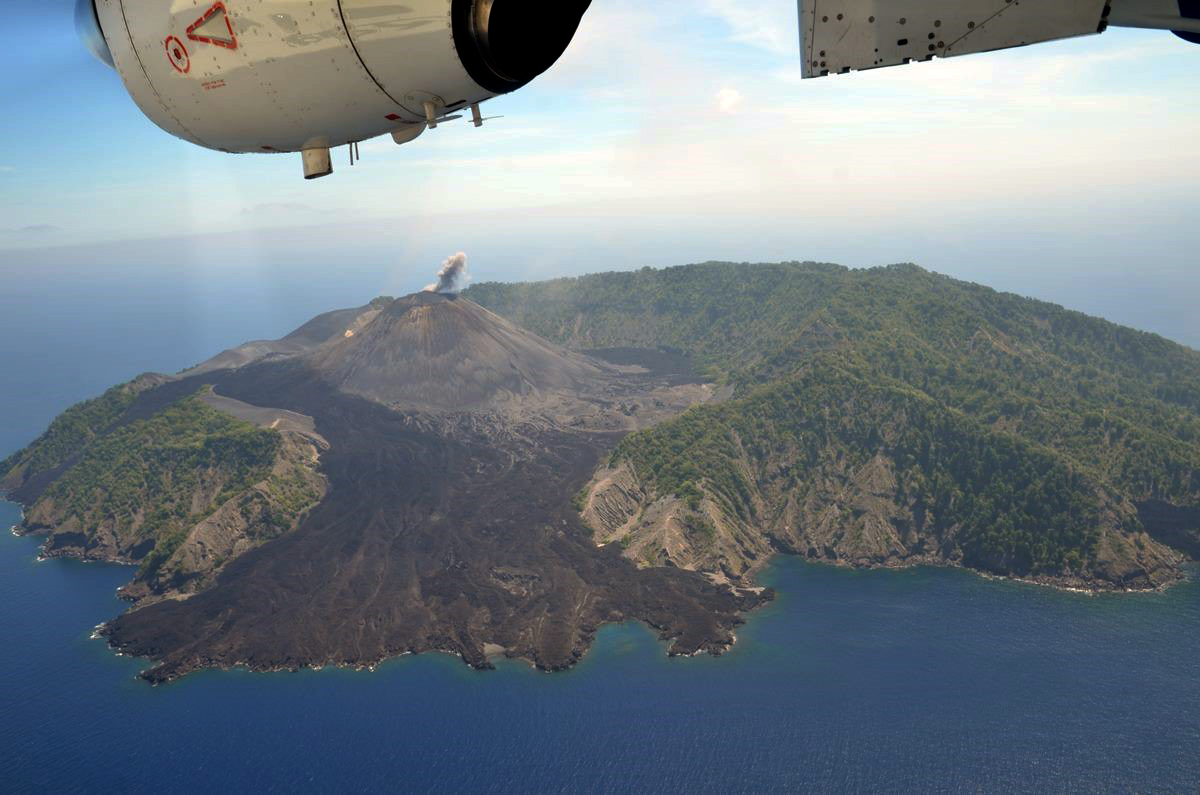 |
Figure 36. Photograph of Barren Island from the W on 23 February 2017 showing a small ash plume. Courtesy of Jagdish Mukhi, Lt. Governor, Andaman and Nicobar Islands. |
On 9 March 2017 a group from the Physical Research Laboratory in Ahmedabad observed the eruption and published a report in Current Science (Ray et al., 2017). Activity consisted of ash plumes that rose a few hundred meters above the crater and the ejection of incandescent material every 10-15 minutes, with blocks and bombs rolling down the flanks of the cone. Later in the month, an ash plume was observed on 24 March (figure 37).
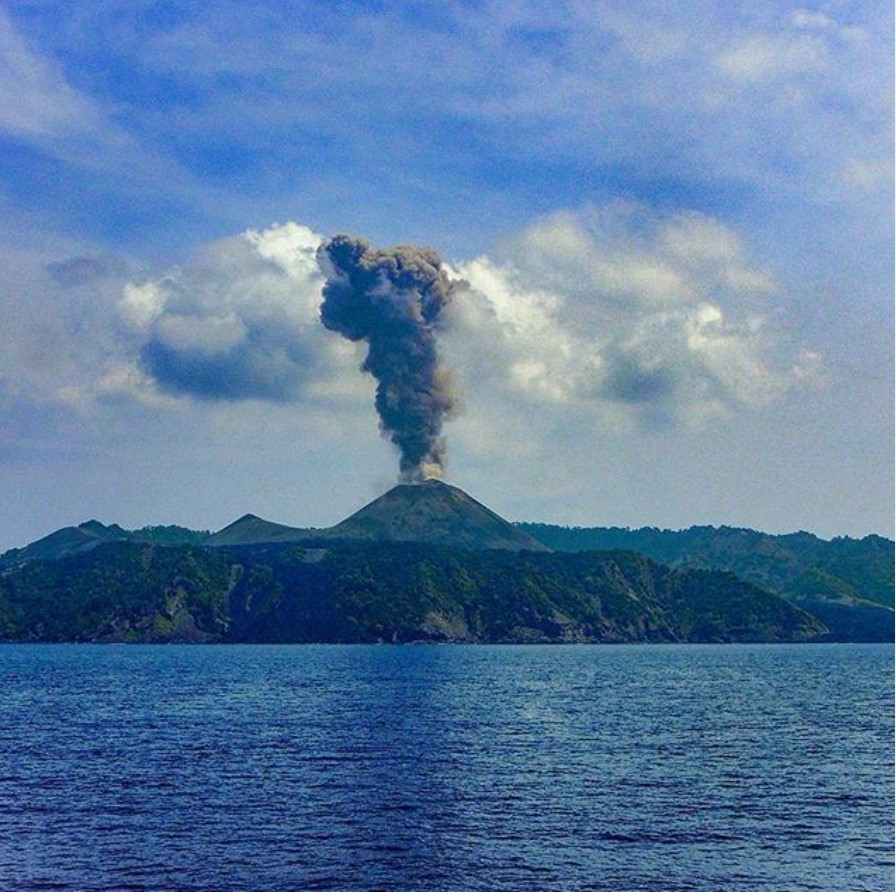 |
Figure 37. An ash plume at Barren Island on 24 March 2017. Photo courtesy of Atmaram Deshpande. |
Along with the lack of activity detected in satellite data, there were no reports of activity after 24 March 2017 until September 2018. While the first indications of a new eruptive in thermal data is on 24 September, the first observations on the 18 and 19 October show lava fountaining at the summit and a lava flow on the flank (figures 38, 39, and 40). These images coincide with Sentinel-2 thermal data showing a lava flow on the SSW flank. A video taken on 27 October shows explosions ejecting incandescent material and small plumes. Darwin VAAC advisories noted ash plumes to about 0.9 km altitude on 1 November and 26 January 2019.
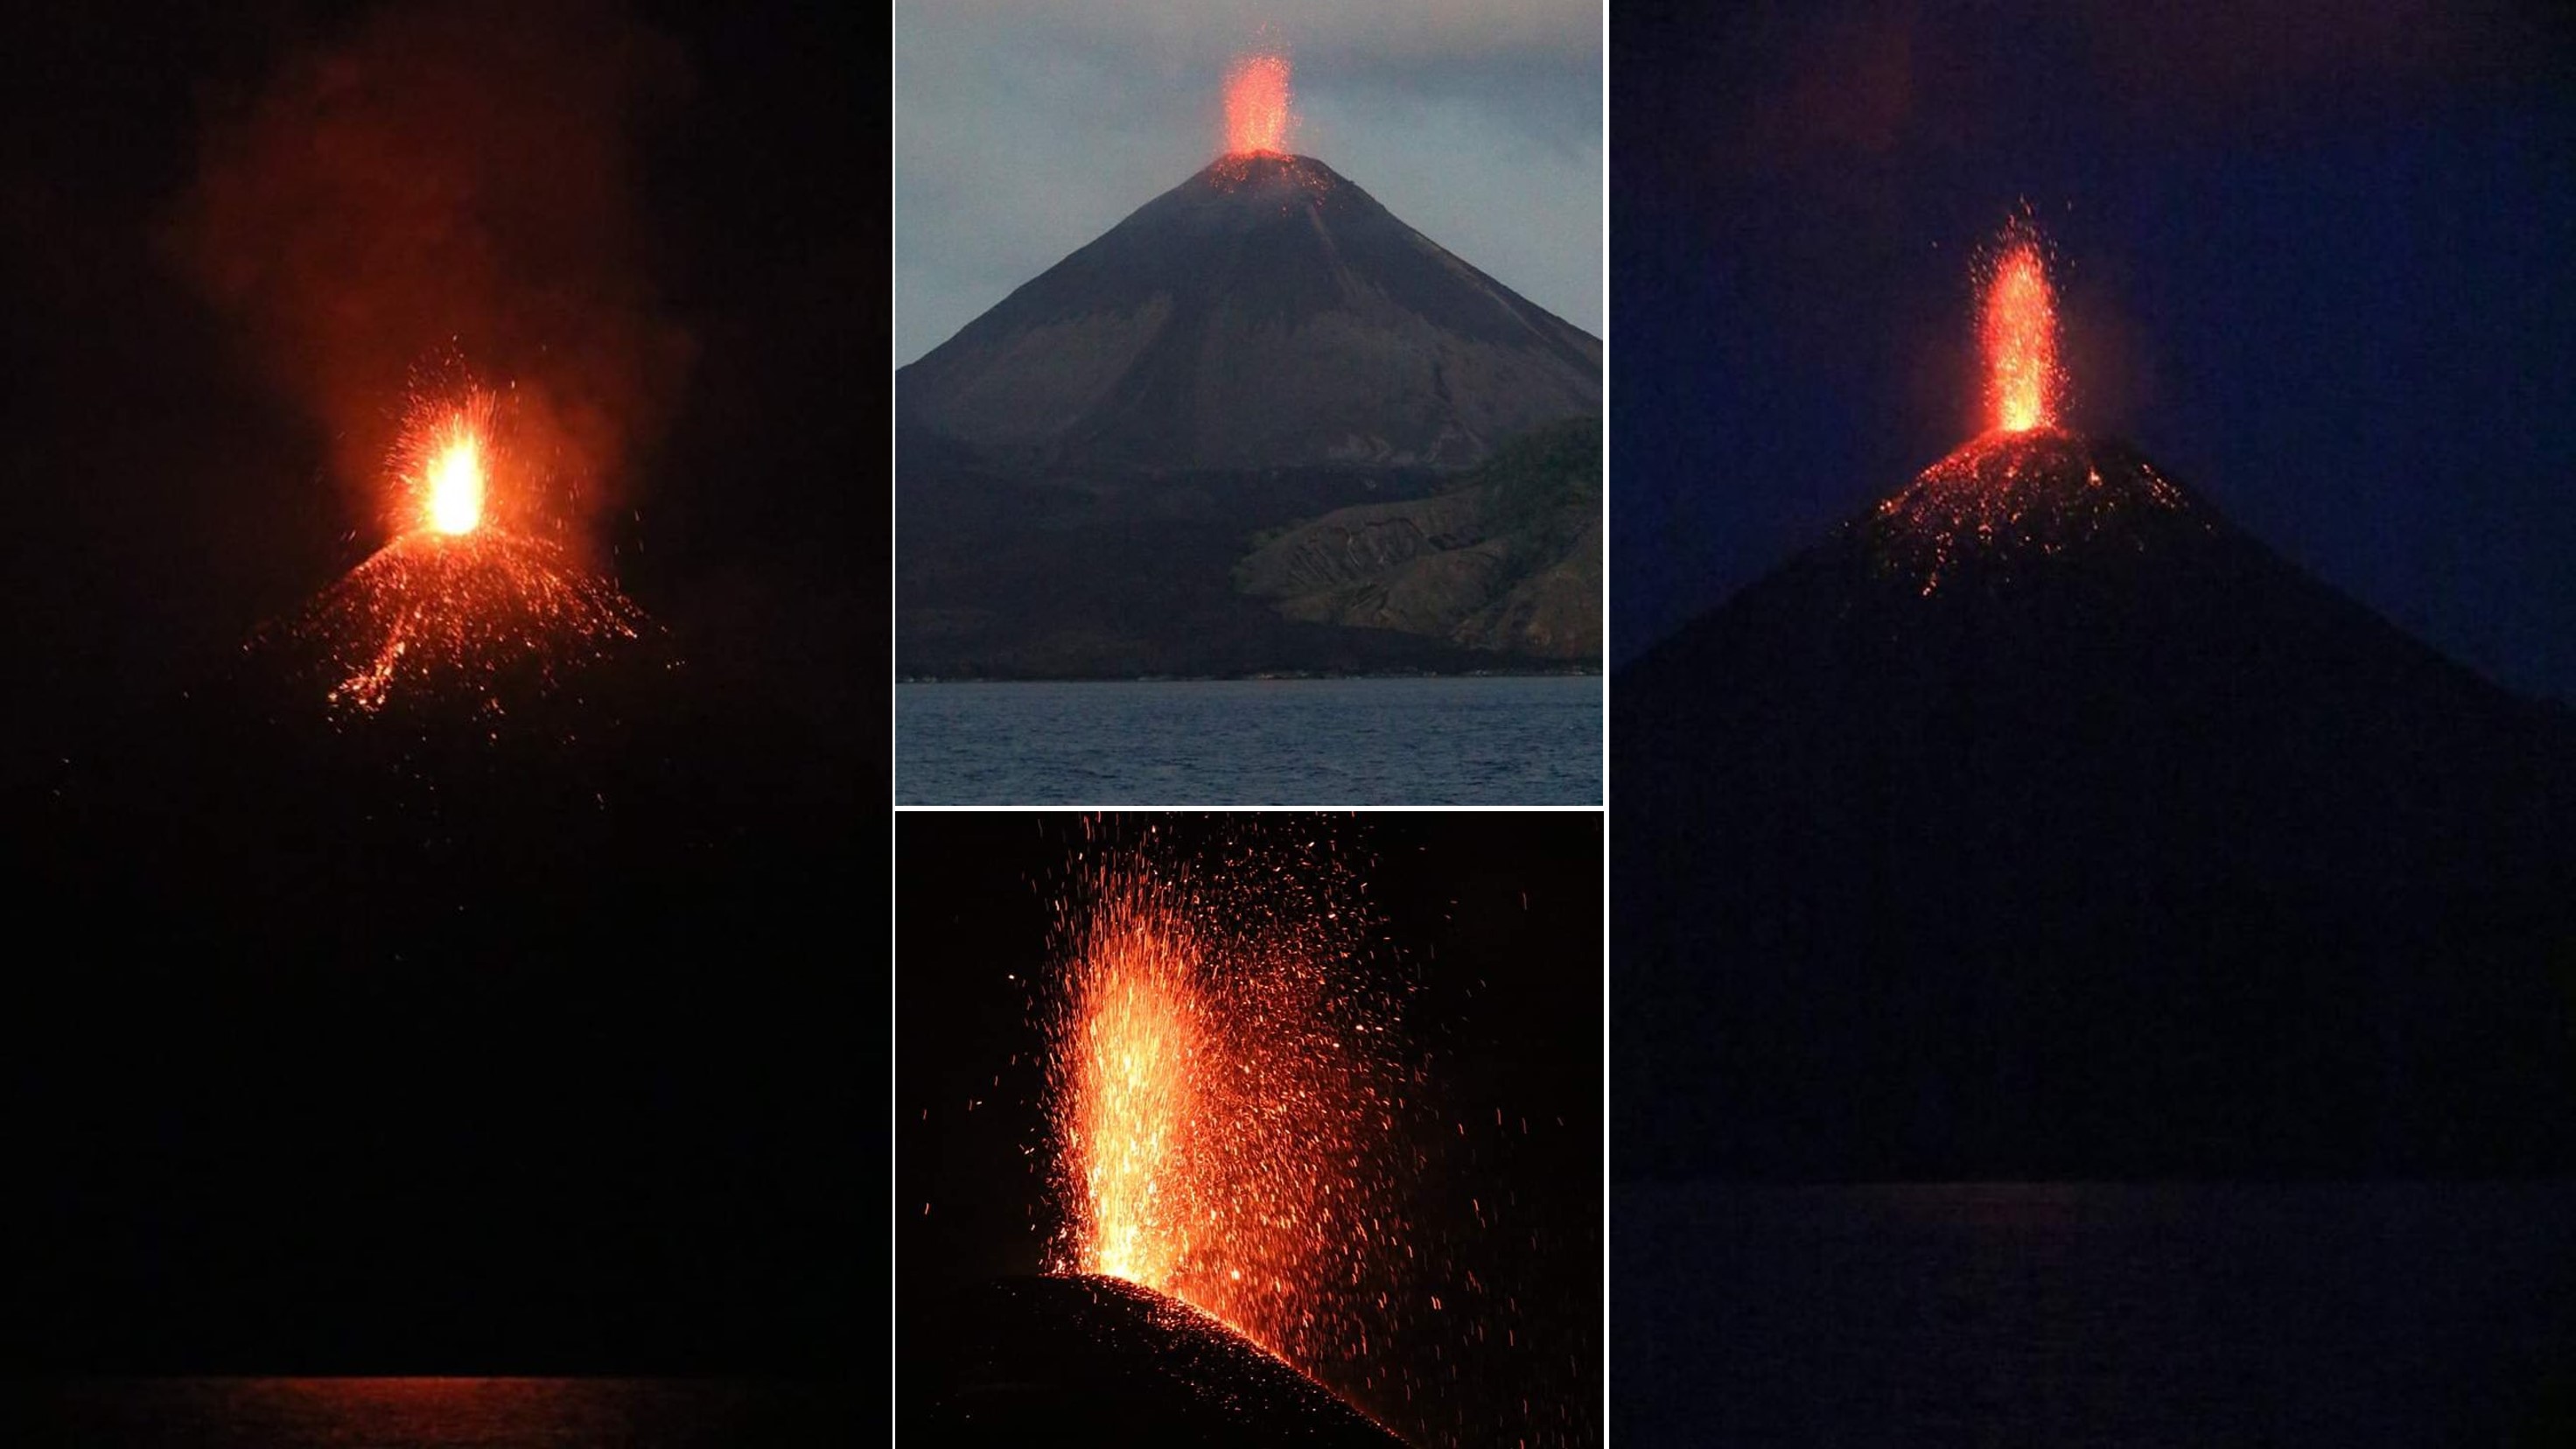 |
Figure 38. Photos of lava fountaining at Barren Island on 18 October 2018. Courtesy of Sugendran. |
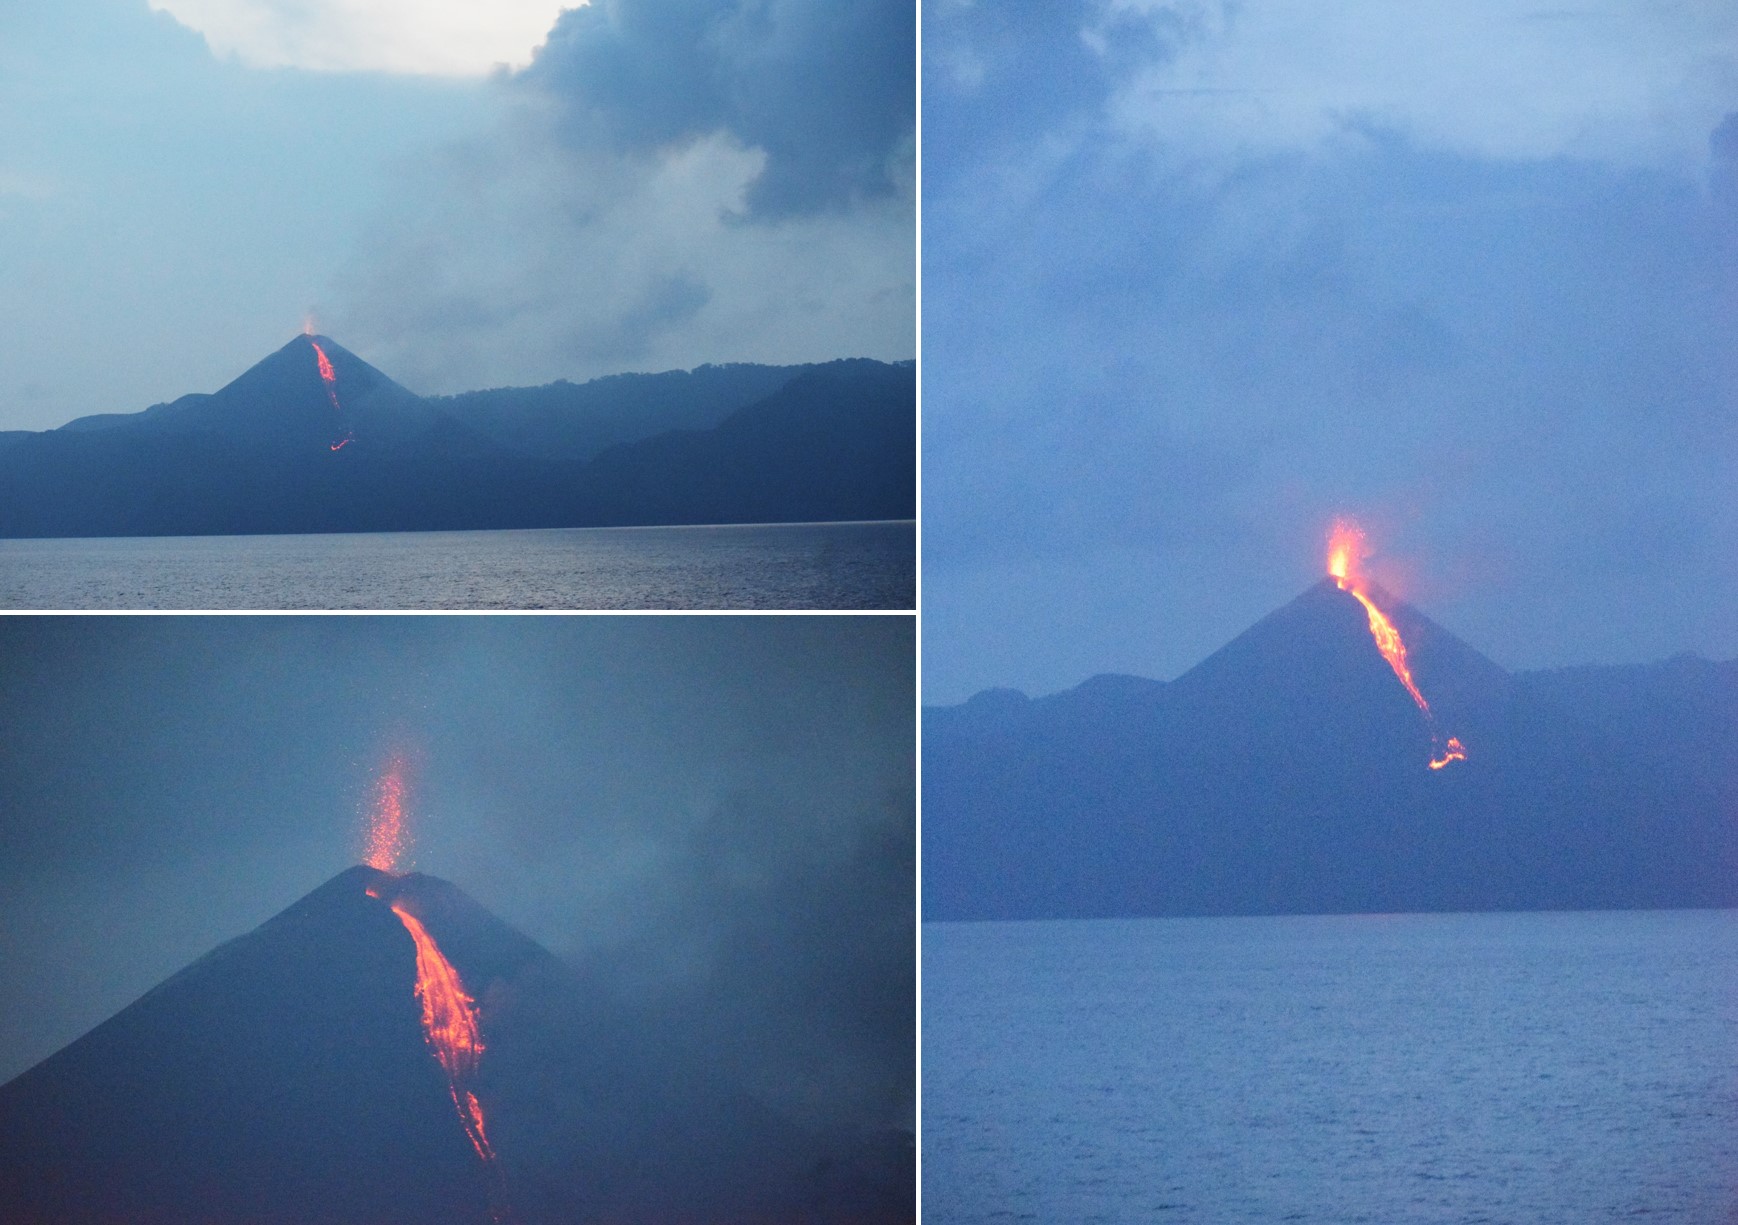 |
Figure 39. Barren Island ejecting incandescent material and producing a lava flow on 19 October 2018. Courtesy of Samrat Kalita. |
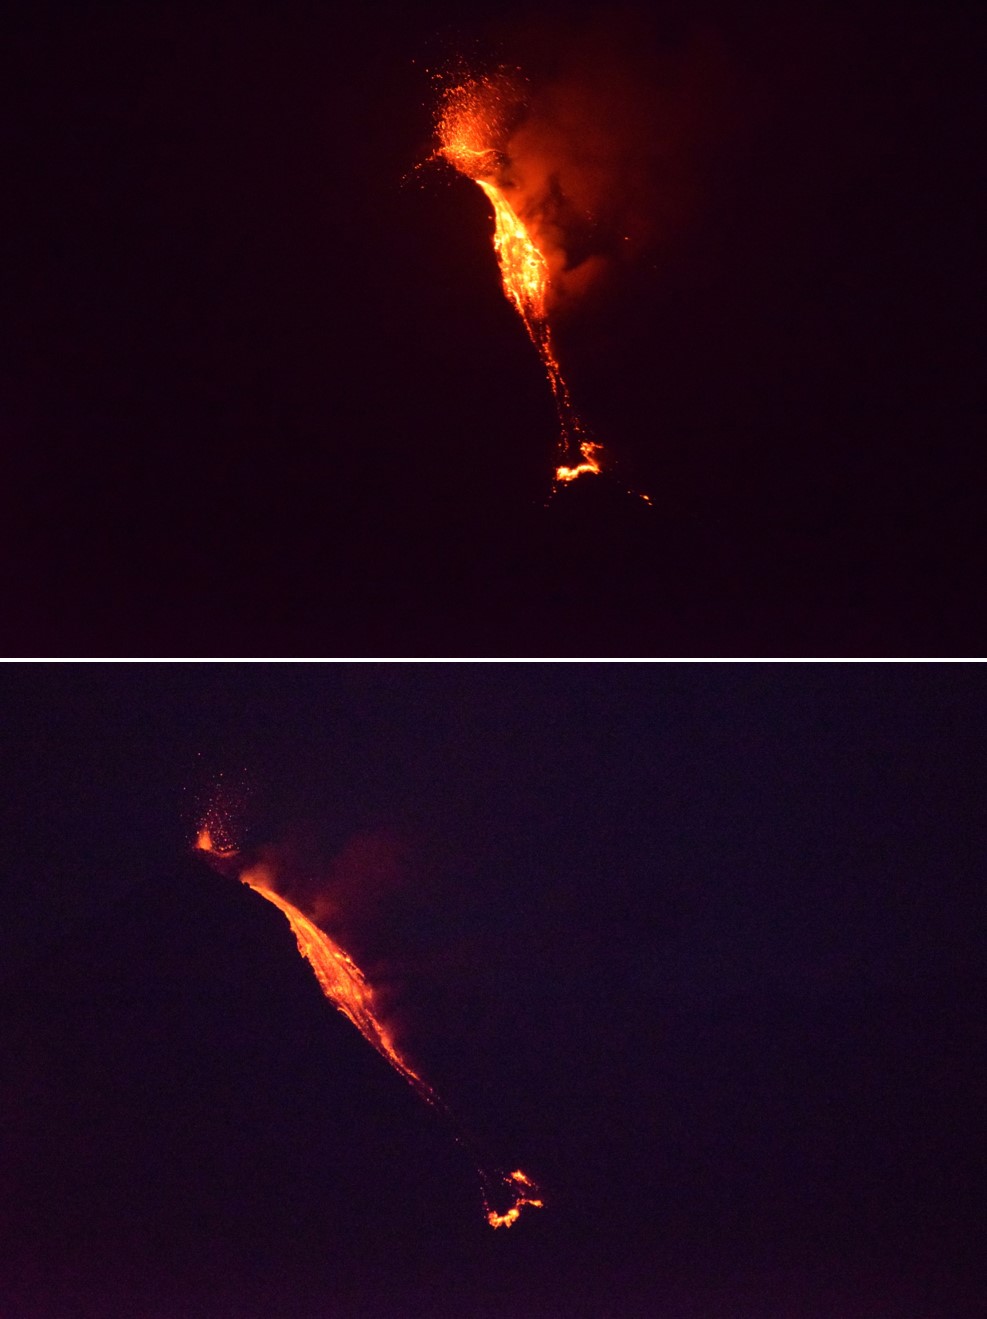 |
Figure 40. Lava fountaining feeding a lava flow on Barren Island on 19 October 2018. Courtesy of Samrat Kalita. |
Reference: Ray, D., Shukla, A.D., Ray, J.S., 2017. Early 2017 activity of the Barren Island volcano: facts versus hype. Current Science, 113(9): 1657-1659.
Information Contacts: Darwin Volcanic Ash Advisory Centre (VAAC), Bureau of Meteorology, Northern Territory Regional Office, PO Box 40050, Casuarina, NT 0811, Australia (URL: http://www.bom.gov.au/info/vaac/); Hawai'i Institute of Geophysics and Planetology (HIGP) - MODVOLC Thermal Alerts System, School of Ocean and Earth Science and Technology (SOEST), Univ. of Hawai'i, 2525 Correa Road, Honolulu, HI 96822, USA (URL: http://modis.higp.hawaii.edu/); Sentinel Hub Playground (URL: https://www.sentinel-hub.com/explore/sentinel-playground); NASA Worldview (URL: https://worldview.earthdata.nasa.gov/); CSIR-National Institute of Oceanography, Raj Bhavan Rd, Dona Paula, Goa 403004, India (URL: https://www.nio.org/); NDTV (URL: https://www.ndtv.com/india-news/watch-indias-only-active-volcano-at-barren-island-filmed-erupting-1667796); Sugendran (TwitterURL: https://twitter.com/sugender); Atmaram Deshpande (Instagram URL: https://www.instagram.com/atmadesh/); Jagdish Mukhi, Lt. Governor, Andaman and Nicobar Islands (Facebook URL: https://www.facebook.com/jagdishmukhi/posts/1504497106227132); Samrat Kalita (Instagram URL: https://www.instagram.com/nibir_samrat/).
Thermal anomalies and small ash plumes during February-April 2019 and September 2019-January 2020
Barren Island is a remote stratovolcano located east of India in the Andaman Islands. Its most recent eruptive episode began in September 2018 and has included lava flows, explosions, ash plumes, and lava fountaining (BGVN 44:02). This report updates information from February 2019 through January 2020 using various satellite data as a primary source of information.
MIROVA (Middle InfraRed Observation of Volcanic Activity) analysis of MODIS satellite data showed intermittent thermal anomalies within 5 km of the summit from mid-February 2019 through January 2020 (figure 41). There was a period of relatively low to no discernible activity between May to September 2019. The MODVOLC algorithm for MODIS thermal anomalies in comparison with Sentinel-2 thermal satellite imagery and Suomi NPP/VIIRS sensor data, registered elevated temperatures during late February 2019, early March, sparsely in April, late October, sparsely in November, early December, and intermittently in January 2020 (figure 42). Sentinel-2 thermal satellite imagery shows these thermal hotspots differing in strength from late February to late January 2020 (figure 43). The thermal anomalies in these satellite images are occasionally accompanied by ash plumes (25 February 2019, 23 October 2019, and 21 January 2020) and gas-and-steam emissions (26 April 2019).
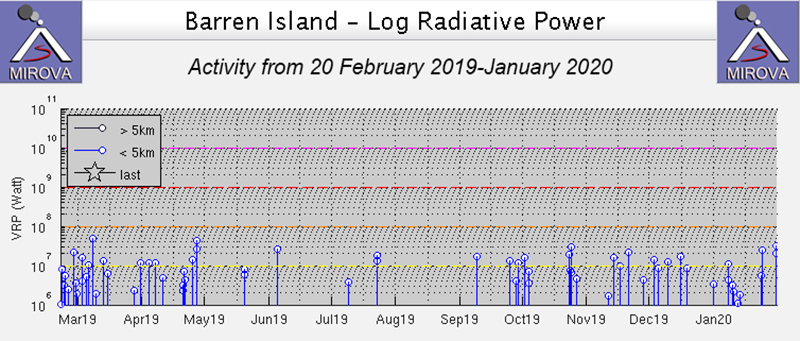 |
Figure 41. Intermittent thermal anomalies at Barren Island for 20 February 2019 through January 2020 occurred dominantly between late March to late April 2019 and late September 2019 through January 2020. Courtesy of MIROVA. |
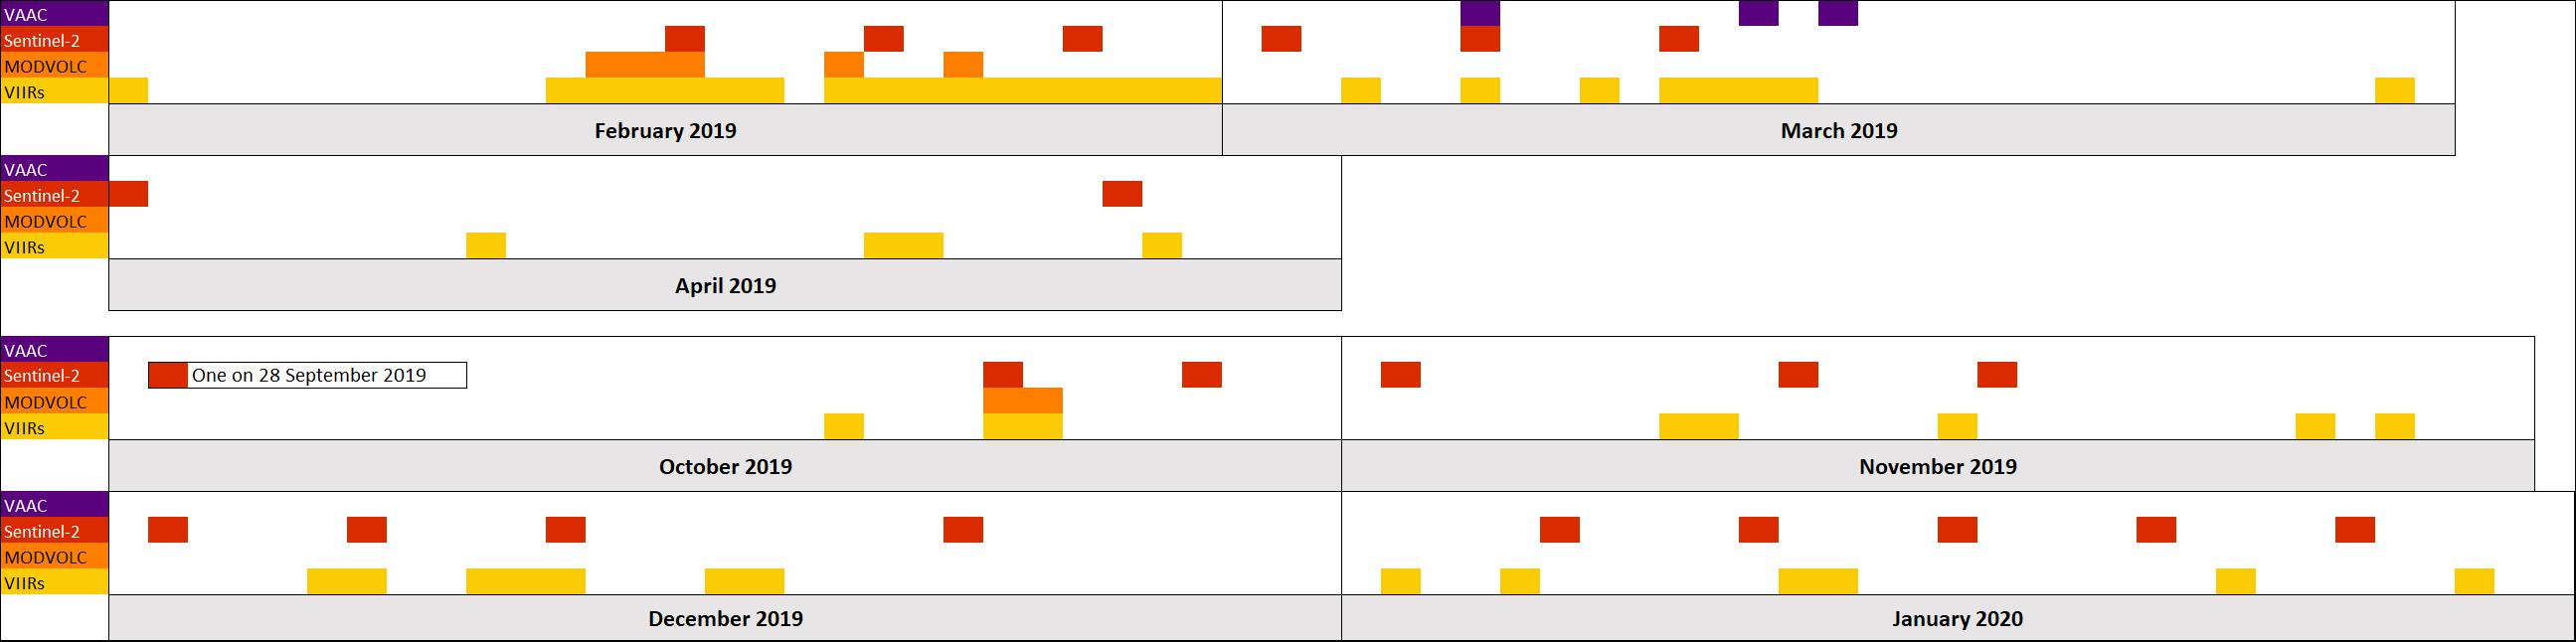 |
Figure 42. Timeline summary of observed activity at Barren Island from February 2019 through January 2020. For Sentinel-2, MODVOLC, and VIIRS data, the dates indicated are when thermal anomalies were detected. White areas indicated no activity was observed, which may also be due to meteoric clouds. Data courtesy of Darwin VAAC, Sentinel Hub Playground, HIGP, and NASA Worldview using the "Fire and Thermal Anomalies" layer. |
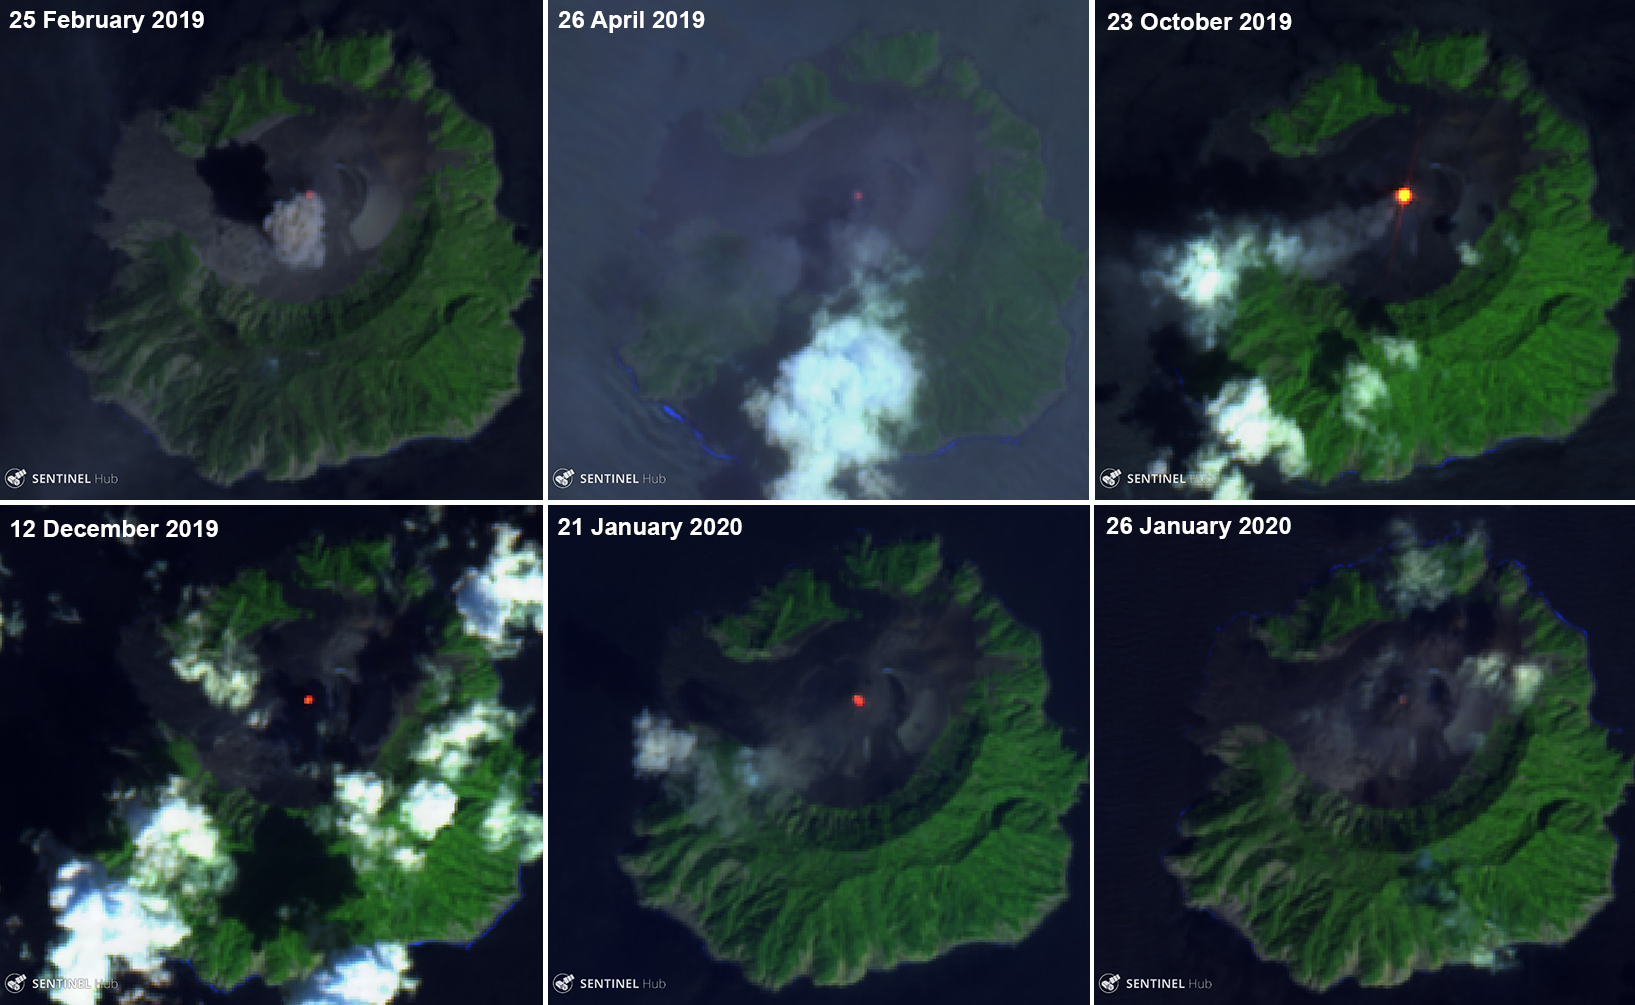 |
Figure 43. Sentinel-2 thermal images show ash plumes, gas-and-steam emissions, and thermal anomalies (bright yellow-orange) at Barren Island during February 2019-January 2020. The strongest thermal signature was observed on 23 October while the weakest one is observed on 26 January. Sentinel-2 False color (bands 12, 11, 4) images courtesy of Sentinel Hub Playground. |
The Darwin Volcanic Ash Advisory Center (VAAC) reported ash plumes rising from the summit on 7, 14, and 16 March 2019. The maximum altitude of the ash plume occurred on 7 March, rising 1.8 km altitude, drifting W and NW and 1.2 km altitude, drifting E and ESE, based on observations from Himawari-8. The VAAC reports for 14 and 16 March reported the ash plumes rising 0.9 km and 1.2 km altitude, respectively drifting W and W.
Information Contacts: MIROVA (Middle InfraRed Observation of Volcanic Activity), a collaborative project between the Universities of Turin and Florence (Italy) supported by the Centre for Volcanic Risk of the Italian Civil Protection Department (URL: http://www.mirovaweb.it/); Hawai'i Institute of Geophysics and Planetology (HIGP) - MODVOLC Thermal Alerts System, School of Ocean and Earth Science and Technology (SOEST), Univ. of Hawai'i, 2525 Correa Road, Honolulu, HI 96822, USA (URL: http://modis.higp.hawaii.edu/); Darwin Volcanic Ash Advisory Centre (VAAC), Bureau of Meteorology, Northern Territory Regional Office, PO Box 40050, Casuarina, NT 0811, Australia (URL: http://www.bom.gov.au/info/vaac/); Sentinel Hub Playground (URL: https://www.sentinel-hub.com/explore/sentinel-playground); NASA Worldview (URL: https://worldview.earthdata.nasa.gov/).
Intermittent weak thermal anomalies during February-July 2020
Barren Island is a remote island east of India in the Andaman Islands. Its most recent eruptive period began in September 2018 with volcanism characterized by thermal anomalies and small ash plumes (BGVN 45:02). This report updates information from February through July 2020 using various satellite data as a primary source of information.
MIROVA (Middle InfraRed Observation of Volcanic Activity) analysis of MODIS satellite data showed intermittent low-power thermal anomalies within 5 km of the summit from early September 2019 through July 2020 (figure 44). The frequency of the thermal anomalies decreased during mid-May 2020 with only six detected between June and July 2020. Sentinel-2 thermal satellite imagery showed weak thermal hotspots in the summit crater on 5 and 10 February, and 5 April (figure 45). In comparison, Suomi NPP/VIIRS sensor data registered elevated temperatures during 13-14 May and 18 July. Intermittent gas-and-steam emissions were also observed in Sentinel-2 satellite imagery on days with little to no cloud coverage. A small ash plume was observed in Sentinel-2 satellite imagery drifting NW on 24 June; there was no thermal anomaly detected that day (figure 46).
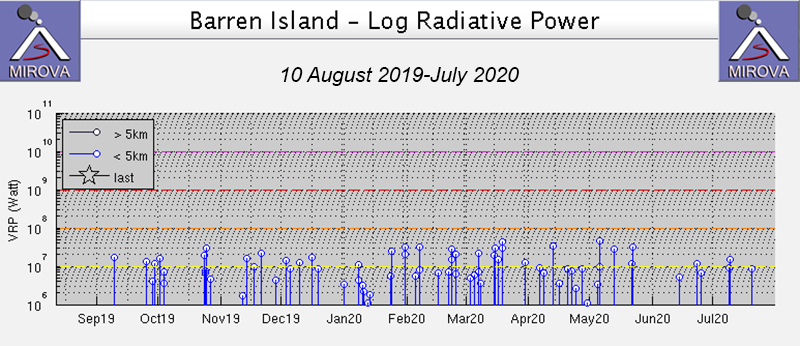 |
Figure 44. Intermittent thermal anomalies at Barren Island for 10 August 2019 through July 2020 were detected by the MIROVA graph (Log Radiative Power). The frequency of the anomalies decreased after mid-May. Courtesy of MIROVA. |
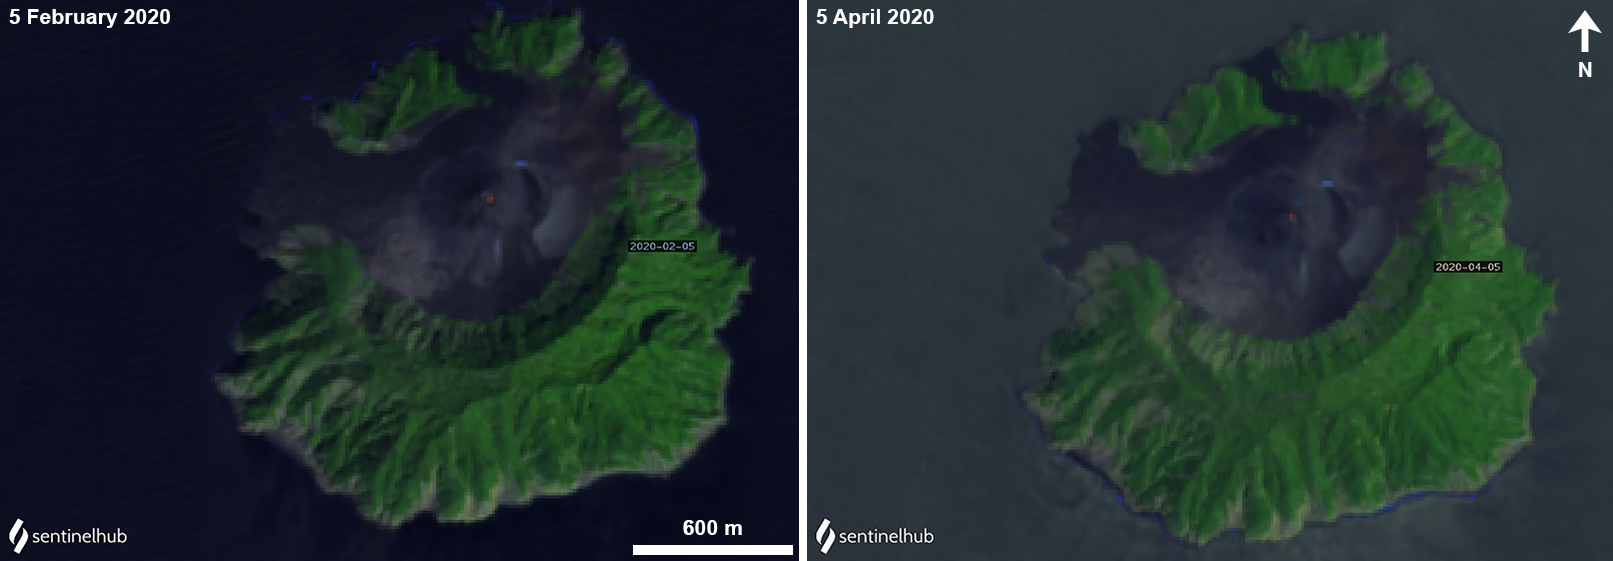 |
Figure 45. Sentinel-2 thermal images show weak thermal anomalies (bright yellow-orange) at Barren Island on 5 February (left) and 5 April (right) 2020. Images with False color (bands 12, 11, 4) rendering courtesy of Sentinel Hub Playground. |
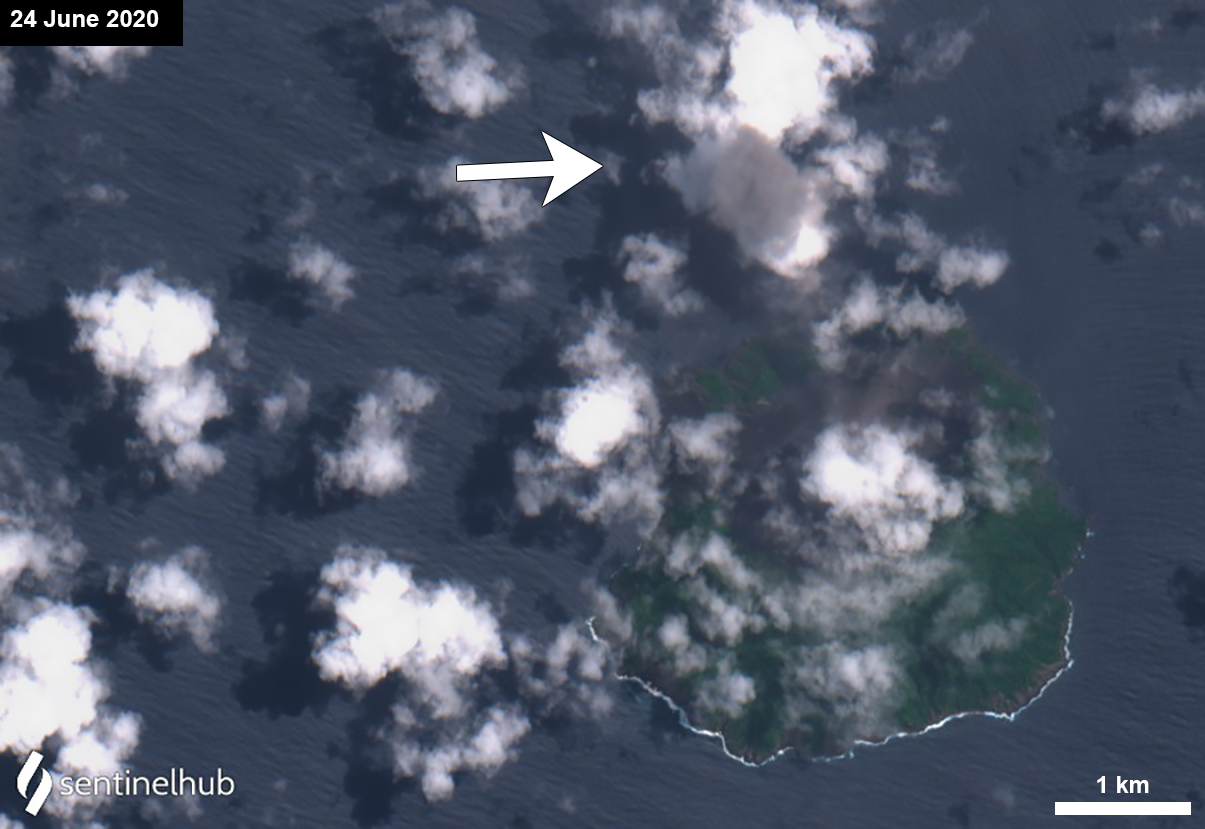 |
Figure 46. Sentinel-2 satellite image showing a small ash plume rising from Barren Island and drifting NW on 24 June 2020. Image with Natural color (bands 4, 3, 2) rendering courtesy of Sentinel Hub Playground. |
Information Contacts: MIROVA (Middle InfraRed Observation of Volcanic Activity), a collaborative project between the Universities of Turin and Florence (Italy) supported by the Centre for Volcanic Risk of the Italian Civil Protection Department (URL: http://www.mirovaweb.it/); Sentinel Hub Playground (URL: https://www.sentinel-hub.com/explore/sentinel-playground); NASA Worldview (URL: https://worldview.earthdata.nasa.gov/).
Ash emissions in November and December 2020, then thermal anomalies through February 2021
Barren Island, an uninhabited possession of India in the Andaman Sea, had numerous historical eruptions observed during 1787-1832. No further evidence of activity was found until 1991 when ash plumes, Strombolian explosions, and lava flows that reached the ocean were observed. Intermittent similar eruptions since 2005 have lasted for months to years. Its remoteness makes ground observations rare, but satellite data and reports from the Darwin VAAC (Volcanic Ash Advisory Center) suggest that the most recent eruption which began in September 2018 with lava fountaining, lava flows, and ash emissions has continued with intermittent thermal anomalies at the summit and minor ash emissions since early 2019. This report covers activity from July 2020-February 2021.
The MIROVA thermal anomaly data from April 2020 through February 2021 indicate low levels of thermal activity from April through October 2020. Pulses of activity in early November and late January-early February 2021 correspond to increased thermal activity seen in satellite images during that time (figure 47). Ash emissions were reported by the Darwin VAAC in early November and early December 2020. A strong thermal anomaly was present in satellite imagery on 11 November, and moderate anomalies appeared during February 2021. In addition, during November-February faint thermal anomalies and/or small ash emissions were present in one or more satellite images each month.
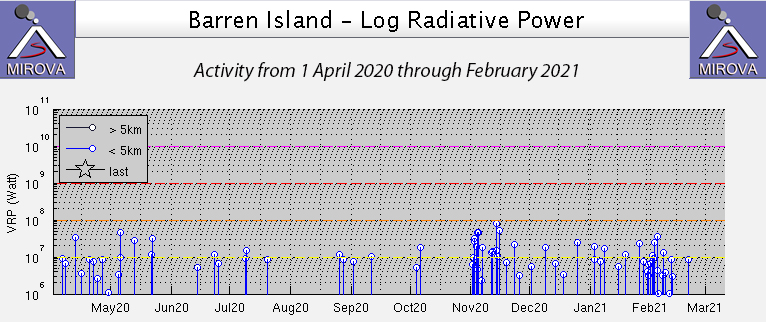 |
Figure 47. The MIROVA thermal anomaly data from April 2020 through February 2021 indicate low levels of thermal activity from April through October 2020. Pulses of activity in early November and late January-early February 2021 corresponded to increased thermal activity seen in satellite images. Courtesy of MIROVA. |
After a small ash plume was observed on 24 June 2020 in Sentinel-2 satellite imagery (BGVN 45:08), the only evidence of further activity was a very weak thermal anomaly present inside the summit crater of the pyroclastic cone on 19 July 2020. Satellite images were mostly cloudy during August-October 2020, although the few clear images each month showed no sign of thermal anomalies or ash emissions. Single MODVOLC thermal alerts were issued for Barren Island on 2 and 4 November 2020. The Darwin VAAC reported continuous ash emissions drifting SW at 1.5 km altitude on 5 November. A very faint thermal anomaly was present inside the summit of the pyroclastic cone the next day. A large thermal anomaly and small ash plume were captured in satellite images on 11 November (figure 48). The bright anomaly at the center of the cone was surrounded by a weaker anomaly suggesting incandescent ejecta on the flanks of the cone. A smaller thermal anomaly and similar ash plume were visible in the 16 November 2020 Sentinel-2 satellite images (figure 49).
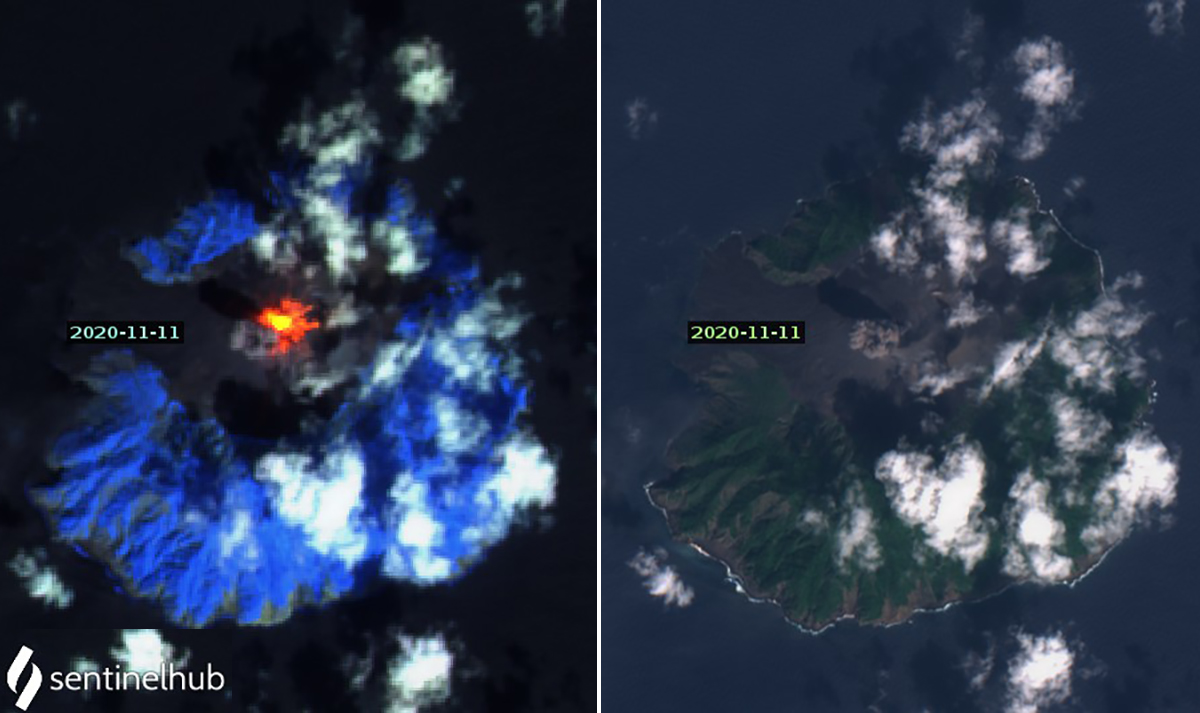 |
Figure 48. A large thermal anomaly and small ash plume at Barren Island were captured in Sentinel-2 satellite images on 11 November 2020. In the left image the bright anomaly at the center of the cone was surrounded by a weaker anomaly suggesting incandescent ejecta on the flanks of the cone. Image uses Atmospheric penetration rendering (bands 12, 11, 8a). The ash emission immediately W of the summit crater is more visible in the Natural color rendering (right, bands 4,3,2). Courtesy of Sentinel Hub Playground. |
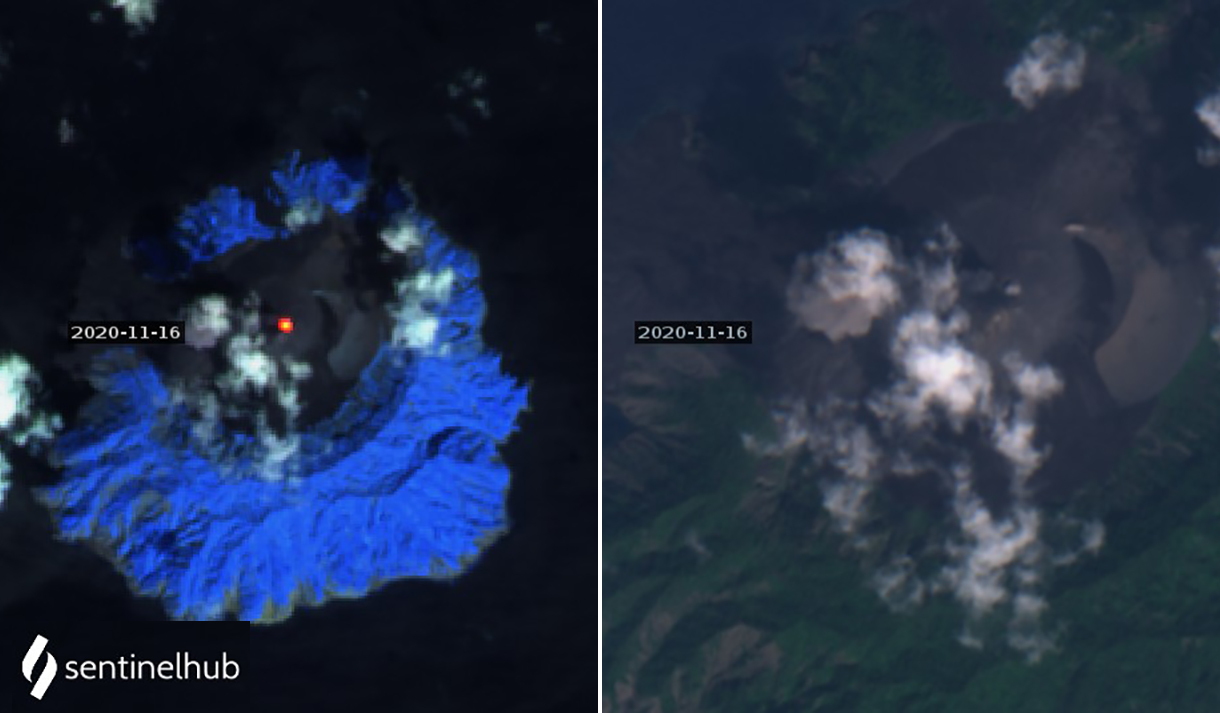 |
Figure 49. A thermal anomaly at the summit and a discrete ash emission slightly W of the summit of Barren Island were captured in Sentinel-2 satellite imagery on 16 November 2020. Left image uses Atmospheric penetration rendering (bands 12, 11, 8a) and right image shows a closeup of the summit and ash plume in Natural color rendering (bands 4, 3, 2). Courtesy of Sentinel Hub Playground. |
The Darwin VAAC issued an ash advisory on 8 December 2020 of an ash plume drifting W at 1.8 km altitude. It was only visible in satellite imagery for about two hours before dissipating. A small thermal anomaly appeared at the summit on 21 December. During January 2021 faint thermal anomalies were visible on 5, 20, and 25 January, and ash plumes could be seen on 15 and 25 January in Sentinel-2 images (figure 50). The strength of the thermal activity increased during February 2021, with satellite evidence recorded on 4, 9, 19, and 24 February; an ash emission was visible on 9 February (figure 51).
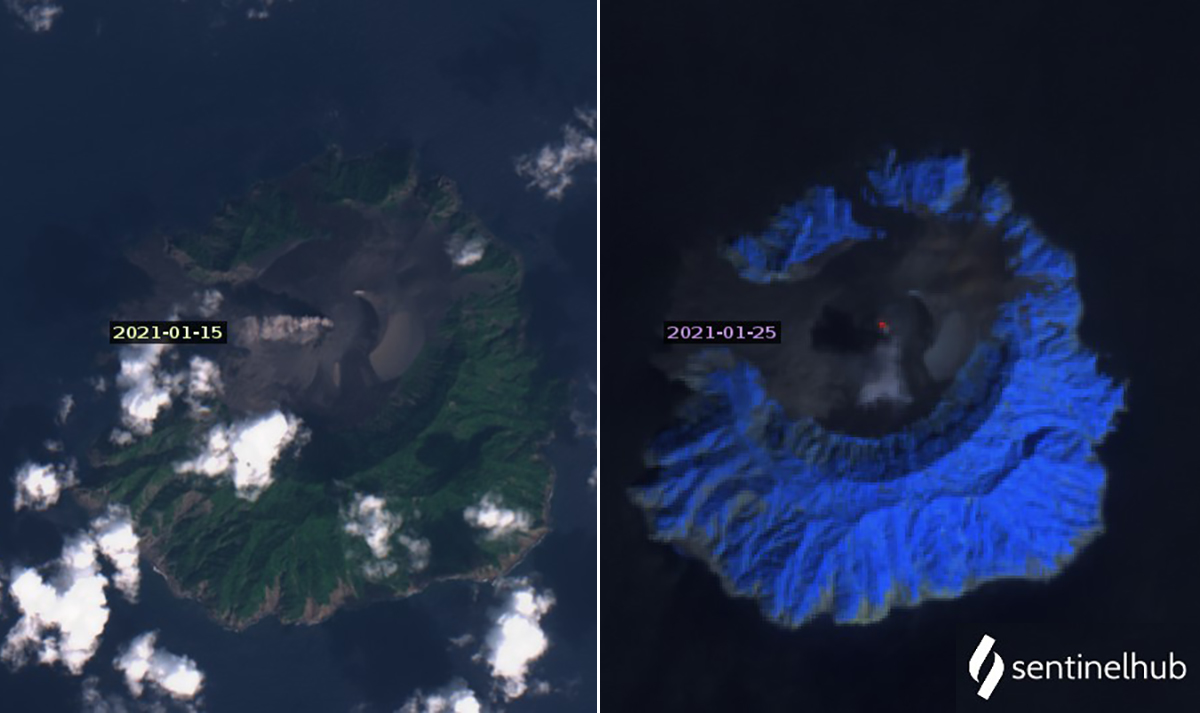 |
Figure 50. Ash plumes and thermal anomalies at Barren Island were present in Sentinel-2 satellite images several times during January 2021. The left image from 15 January shows an ash plume drifting W from the summit using Natural color rendering (bands 4, 3, 2). The right image shows a weak thermal anomaly at the summit on 25 January with an ash plume drifting S using Atmospheric penetration rendering (bands 12, 11, and 8A). Courtesy of Sentinel Hub Playground. |
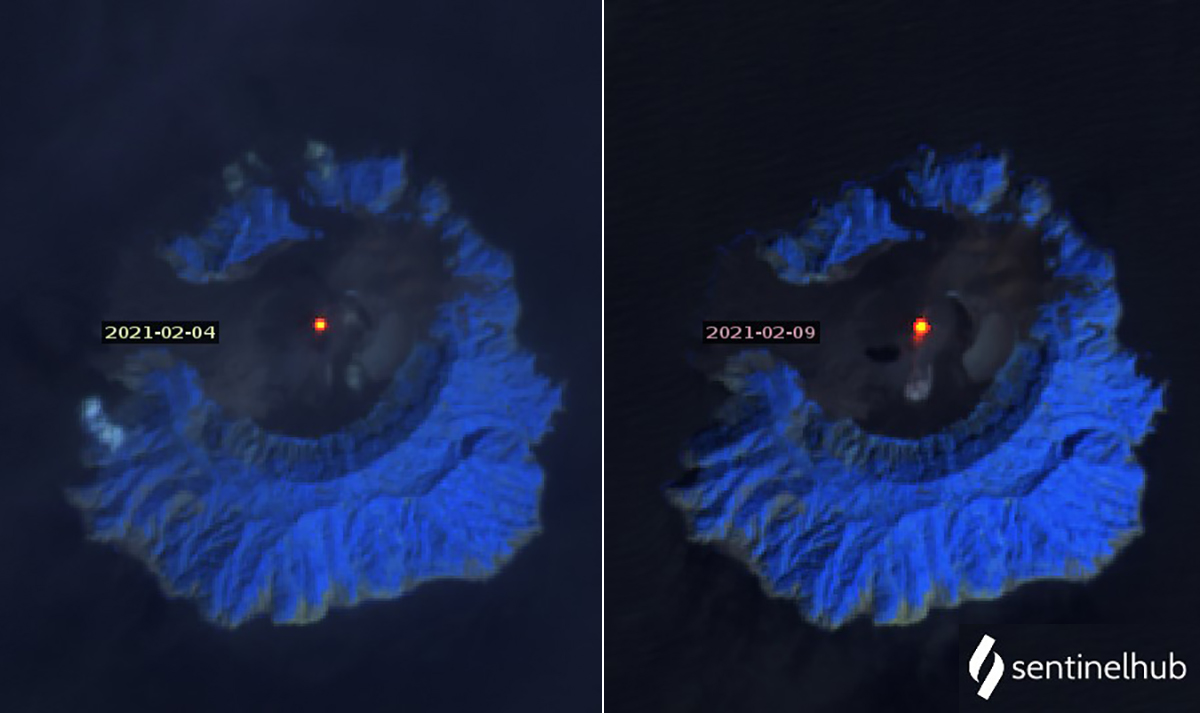 |
Figure 51. Sentinel-2 satellite images showed thermal anomalies at Barren Island several times during February 2020 including on 4 (left) and 9 (right) February. An ash emission drifted S from the summit on 9 February. Images use Atmospheric penetration rendering (bands 12, 11, 8a). Courtesy of Sentinel Hub Playground. |
Information Contacts: Sentinel Hub Playground (URL: https://www.sentinel-hub.com/explore/sentinel-playground); Darwin Volcanic Ash Advisory Centre (VAAC), Bureau of Meteorology, Northern Territory Regional Office, PO Box 40050, Casuarina, NT 0811, Australia (URL: http://www.bom.gov.au/info/vaac/); MIROVA (Middle InfraRed Observation of Volcanic Activity), a collaborative project between the Universities of Turin and Florence (Italy) supported by the Centre for Volcanic Risk of the Italian Civil Protection Department (URL: http://www.mirovaweb.it/); Hawai'i Institute of Geophysics and Planetology (HIGP) - MODVOLC Thermal Alerts System, School of Ocean and Earth Science and Technology (SOEST), Univ. of Hawai'i, 2525 Correa Road, Honolulu, HI 96822, USA (URL: http://modis.higp.hawaii.edu/).
Thermal anomalies and ash emissions persist during March-August 2021
Barren Island is a remote island east of India in the Andaman Islands. Numerous eruptions were reported during 1787-1832, and then more starting in 1991, consisting of ash plumes, Strombolian explosions, and lava flows. The current eruption began in 2018, and typical activity includes ash emissions and thermal anomalies (BGVN 46:03). This report describes similar thermal activity and ash plumes during March through August 2021 using various satellite data as a primary source of information. During 23 August through November 2021 a total of three thermal anomalies were detected on 13-14 and 19 October in Suomi NPP/VIIRS sensor data.
Activity during this reporting period was relatively low, characterized primarily by thermal anomalies. The MIROVA thermal anomaly data from March through August 2021 showed intermittent low- to moderate-levels of thermal activity; during mid-May a single cluster of several anomalies was detected (figure 52). Between July and August, the number of anomalies declined to a total of five. The cluster of activity was also reflected in Suomi NPP/VIIRS sensor data over 18 days on 2, 4, 12, 14, 19, 26 March, 9 and 19 April, 2, 6, 8, 10, 13, 31 May, 3 and 13 June, 26 July, and 21 August. Gray ash emissions were visible rising above the volcano on 15 May and 14 July in Natural Color Sentinel-2 satellite images (figure 53). Eight thermal anomalies were detected in the summit crater on clear weather days in Sentinel-2 infrared satellite images on 1 and 6 March, 25 April, 5 and 15 May, 4 June, 29 July, and 23 August (figure 54).
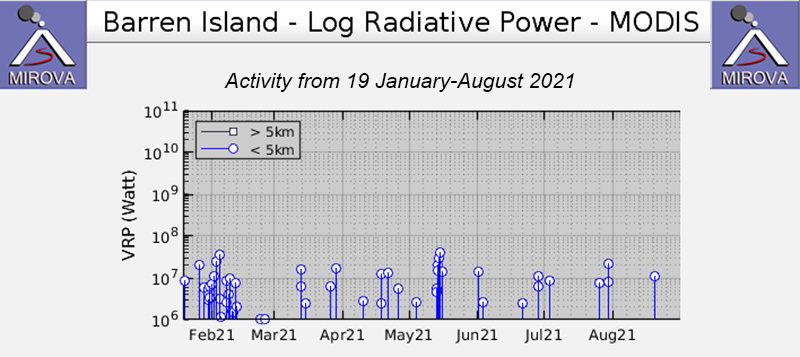 |
Figure 52. The MIROVA thermal anomaly data (Log Radiative Power) from March through August 2021 showed low- to moderate- levels of thermal activity. A single cluster of several anomalies was detected in mid-May. Courtesy of MIROVA. |
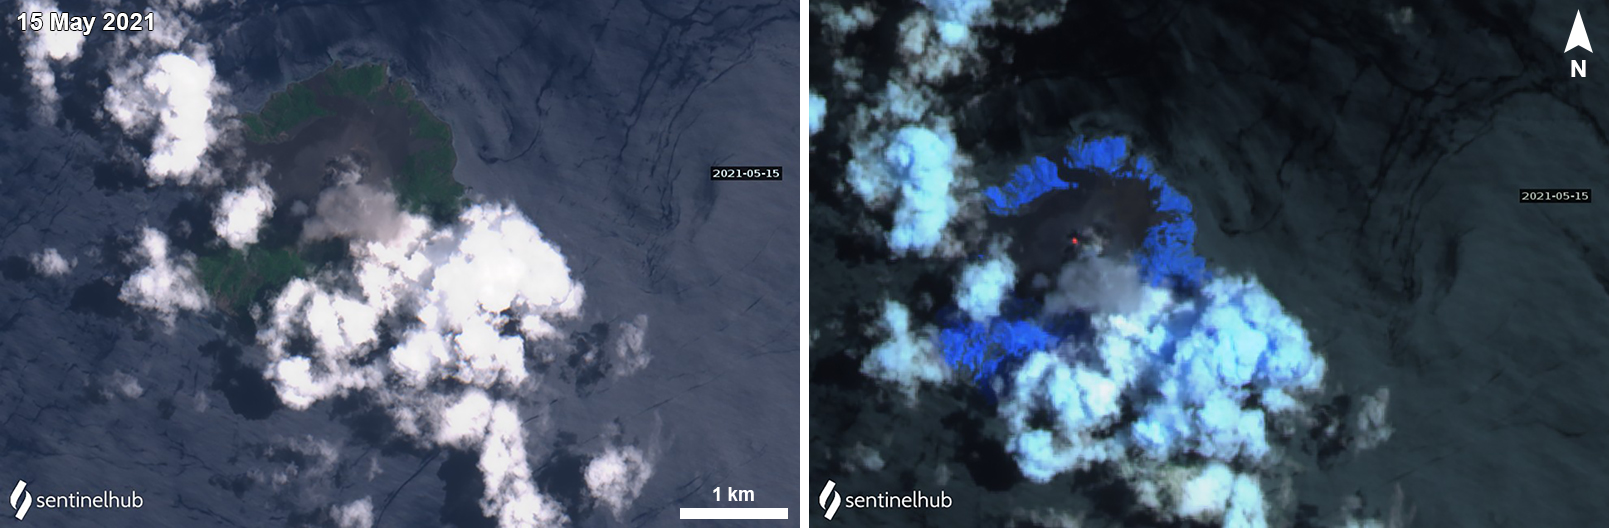 |
Figure 53. A discrete ash emission and a thermal anomaly at the summit of Barren Island were detected in Sentinel-2 satellite imagery on 15 May 2021. Left image uses “Natural Color” rendering (bands 4, 3, 2) and right image uses “Atmospheric penetration” rendering (bands 12, 11, 8a). Courtesy of Sentinel Hub Playground. |
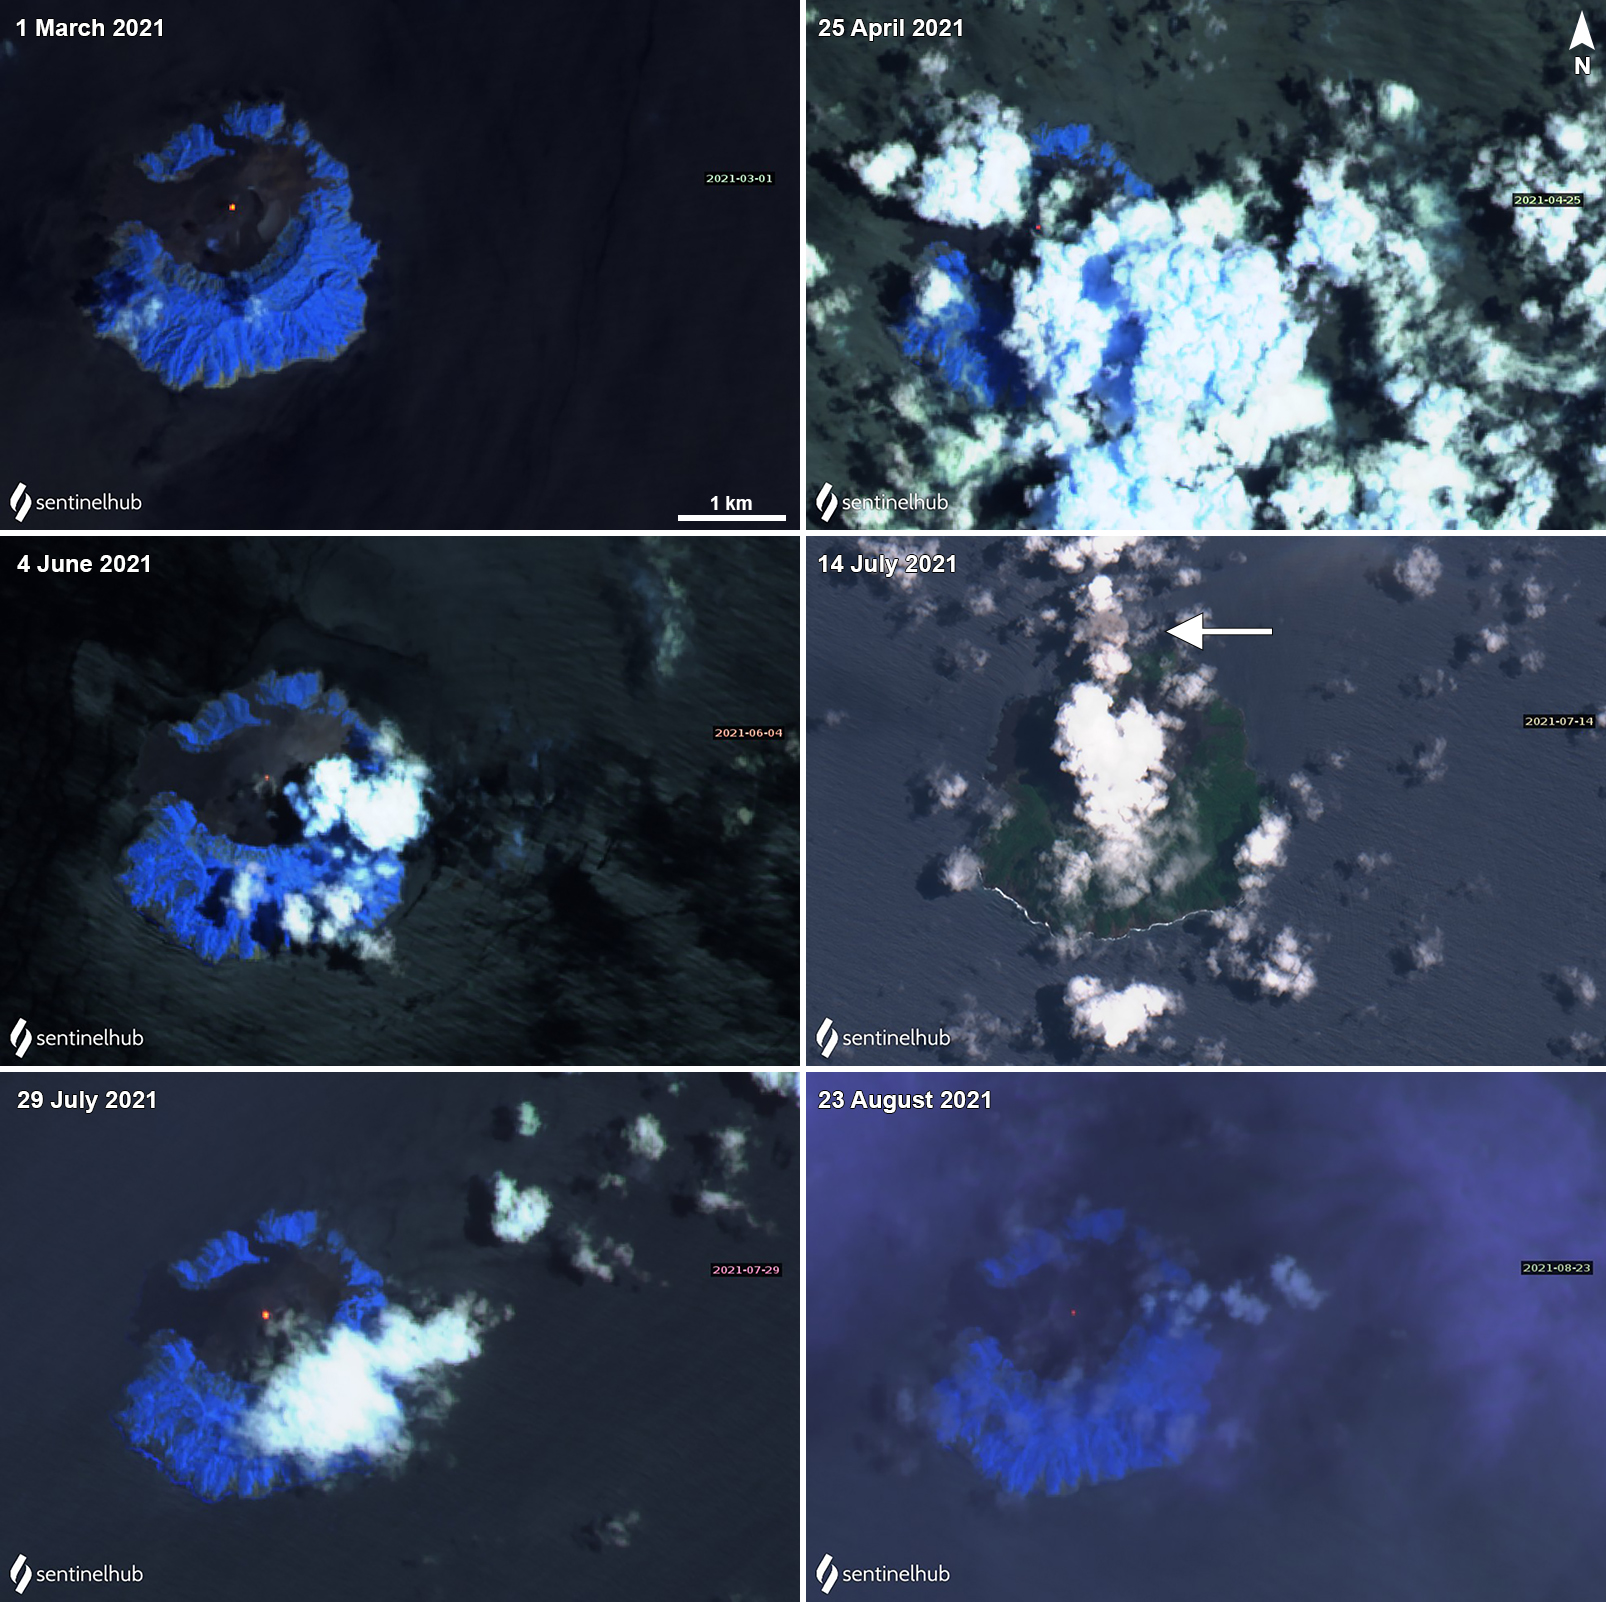 |
Figure 54. A small thermal anomaly persisted in the summit crater at Barren Island, which decreased in power over time, was detected in Sentinel-2 infrared satellite imagery on 1 March (top left), 25 April (top right), 4 June (middle left), 29 July (bottom left), and 23 August (bottom right) 2021. On 14 July (middle right) a small ash emission was visible drifting N of the volcano (white arrow). Images using “Atmospheric penetration” rendering (bands 12, 11, 8a) except for 14 July which uses “Natural Color” rendering (bands 4, 3, 2). Courtesy of Sentinel Hub Playground. |
Information Contacts: MIROVA (Middle InfraRed Observation of Volcanic Activity), a collaborative project between the Universities of Turin and Florence (Italy) supported by the Centre for Volcanic Risk of the Italian Civil Protection Department (URL: http://www.mirovaweb.it/); Sentinel Hub Playground (URL: https://www.sentinel-hub.com/explore/sentinel-playground); NASA Worldview (URL: https://worldview.earthdata.nasa.gov/).
Ash emissions in early January 2022, and notable thermal anomalies through the month
The remote island of Barren Island is located east of India in the Andaman Islands. Eruptions date back to 1787, with activity consisting of ash plumes, Strombolian explosions, and lava flows. The most recent eruption began in September 2018, with activity that included ash emissions and thermal anomalies (BGVN 46:12). This report covers similar activity during September 2021 through May 2022 using various satellite data as a primary source of information. Apparent eruptive activity continued until the end of January 2022, after which there was ongoing heat detected from the upper flanks of the central cone for a few months and a stronger thermal anomaly in the crater on 15 May.
The Suomi NPP/VIIRS sensor data showed 11 thermal anomalies over eight days on 14 and 19 October, 29-31 December 2021, and 1, 2, and 6 January 2022. Two MODVOLC thermal alerts were issued on 16 January 2022. Some of this thermal activity was visible in Sentinel-2 infrared satellite imagery on clear weather days on 6, 11, 21, and 31 December 2021, and 5, 25, and 30 January 2022 (figure 55).
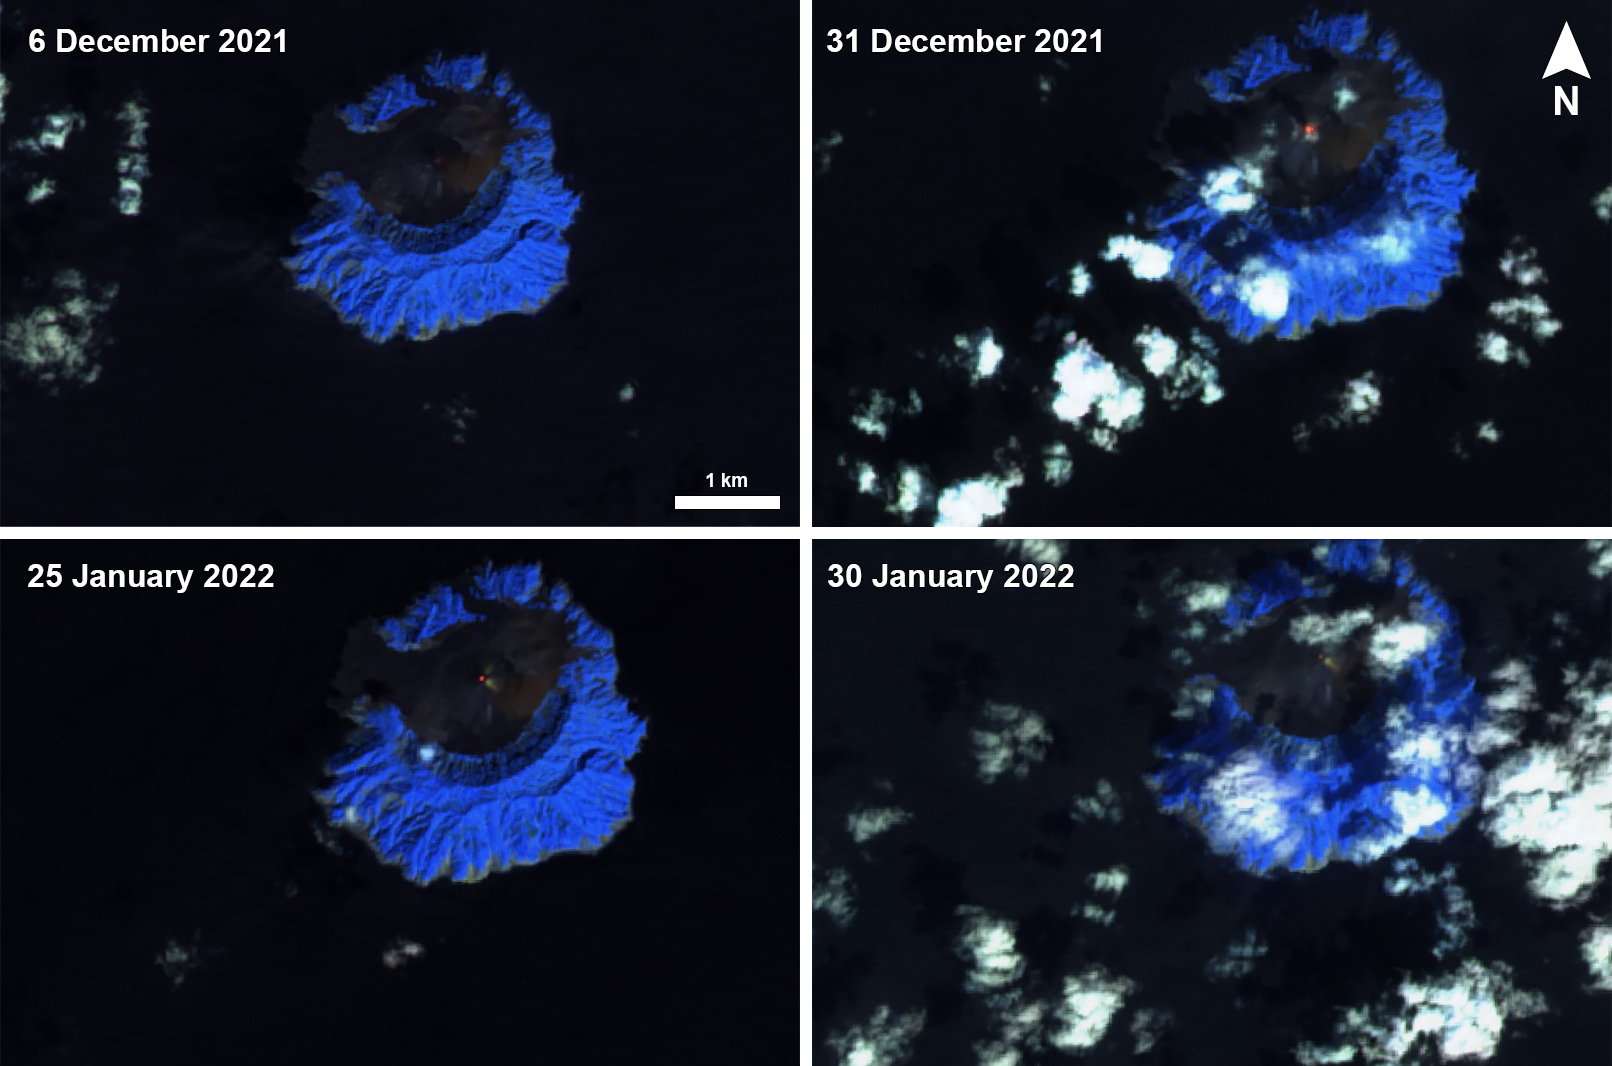 |
Figure 55. Weak thermal anomalies were visible at the summit crater of Barren Island on 6 and 31 December 2021 (top left and right) and 25 and 30 January 2022 (bottom left and right). The anomalies were stronger on 31 December and 25 January. Images using “Atmospheric penetration” rendering (bands 12, 11, 8a). Courtesy of Sentinel Hub Playground. |
A continuous ash emission was reported during 1700-2200 on 8 January 2022 that rose to 1.2 km altitude and drifted WNW, according to visible and RGB satellite images from HIMAWARI-8. Ash plumes were also visible during 1200-1700 on 9 January, rising to 1.2 km altitude and drifting W to SW, based on data from the HIMAWARI-8 satellite, according to the Darwin VAAC.
The MIROVA thermal anomaly data from September 2021 through May 2022 showed intermittent low- to moderate-levels of thermal activity, with the greatest number of anomalies (12) occurring in March 2022 (figure 56). By May, only two were detected. After January 2022 no thermal anomalies were detected in Sentinel-2 infrared images, Suomi NPP/VIIRS sensor data, or MODVOLC thermal data until 15 May, when a weak thermal hotspot was visible in infrared satellite data at the summit crater (figure 57).
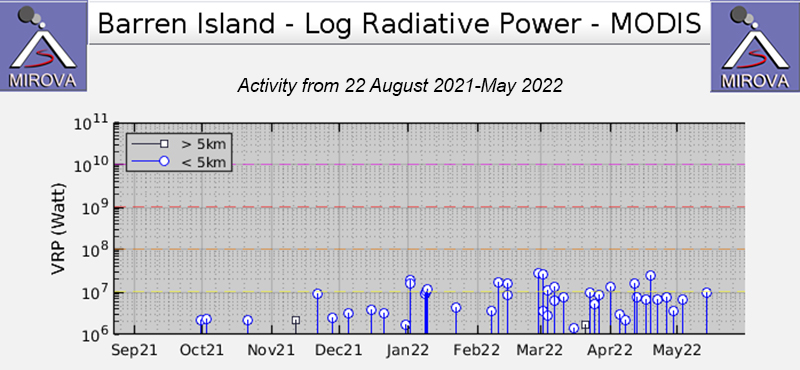 |
Figure 56. The MIROVA thermal anomaly data (Log Radiative Power) from September 2021 through May 2022 showed intermittent low to moderate levels of thermal activity beginning in early October. The number of anomalies increased slightly during March through May 2022. Three low-power anomalies were recorded in October, two in November, four in December 2021, six in January 2022, five in February, twelve in March nine in April, and two in May. Courtesy of MIROVA. |
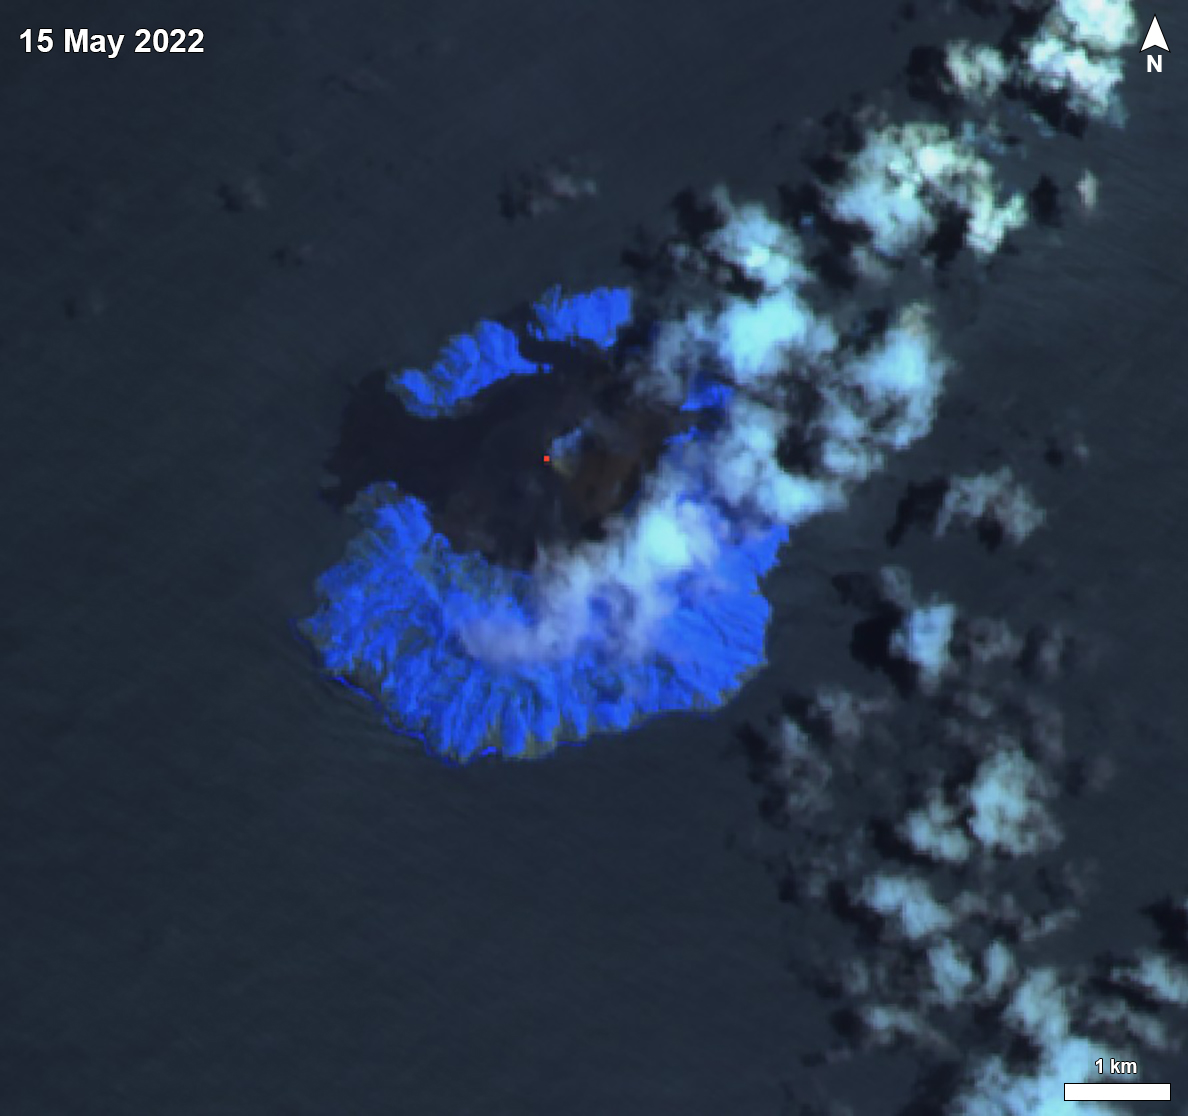 |
Figure 57. A single weak thermal anomaly was detected at the summit of Barren Island on 15 May 2022 in Sentinel-2 satellite imagery, accompanied by weak gas-and-steam emissions moving NE. Image using “Atmospheric penetration” rendering (bands 12, 11, 8a). Courtesy of Sentinel Hub Playground. |
Information Contacts: Darwin Volcanic Ash Advisory Centre (VAAC), Bureau of Meteorology, Northern Territory Regional Office, PO Box 40050, Casuarina, NT 0811, Australia (URL: http://www.bom.gov.au/info/vaac/); MIROVA (Middle InfraRed Observation of Volcanic Activity), a collaborative project between the Universities of Turin and Florence (Italy) supported by the Centre for Volcanic Risk of the Italian Civil Protection Department (URL: http://www.mirovaweb.it/); Hawai'i Institute of Geophysics and Planetology (HIGP) - MODVOLC Thermal Alerts System, School of Ocean and Earth Science and Technology (SOEST), Univ. of Hawai'i, 2525 Correa Road, Honolulu, HI 96822, USA (URL: http://modis.higp.hawaii.edu/); Sentinel Hub Playground (URL: https://www.sentinel-hub.com/explore/sentinel-playground); NASA Worldview (URL: https://worldview.earthdata.nasa.gov/).
Thermal activity during December 2022-March 2023
Barren Island is part of a N-S-trending volcanic arc extending between Sumatra and Burma (Myanmar). The caldera, which is open to the sea on the west, was created during a major explosive eruption in the late Pleistocene that produced pyroclastic flow and surge deposits. Eruptions dating back to 1787, have changed the morphology of the pyroclastic cone in the center of the caldera, and lava flows that fill much of the caldera floor have reached the sea along the western coast. Previous activity was detected during mid-May 2022, consisting of intermittent thermal activity. This report covers June 2022 through March 2023, which included strong thermal activity beginning in late December 2022, based on various satellite data.
Activity was relatively quiet during June through late December 2022 and mostly consisted of low-power thermal anomalies, based on the MIROVA (Middle InfraRed Observation of Volcanic Activity) graph. During late December, a spike in both power and frequency of thermal anomalies was detected (figure 58). There was another pulse in thermal activity in mid-March, which consisted of more frequent and relatively strong anomalies.
|
Figure 58. Occasional thermal anomalies were detected during June through late December 2022 at Barren Island, but by late December through early January 2023, there was a marked increase in thermal activity, both in power and frequency, according to this MIROVA graph (Log Radiative Power). After this spike in activity, anomalies occurred at a more frequent rate. In late March, another pulse in activity was detected, although the power was not as strong as that initial spike during December-January. Courtesy of MIROVA. |
The Suomi NPP/VIIRS sensor data showed five thermal alerts on 29 December 2022. The number of alerts increased to 19 on 30 December. According to the Darwin VAAC, ash plumes identified in satellite images captured at 2340 on 30 December and at 0050 on 31 December rose to 1.5 km altitude and drifted SW. The ash emissions dissipated by 0940. On 31 December, a large thermal anomaly was detected; based on a Sentinel-2 infrared satellite image, the anomaly was relatively strong and extended to the N (figure 59).
|
Figure 59. Thermal anomalies of varying intensities were visible in the crater of Barren Island on 31 December 2022 (top left), 15 January 2023 (top right), 24 February 2023 (bottom left), and 31 March 2023 (bottom right), as seen in these Sentinel-2 infrared satellite images. The anomalies on 31 December and 31 March were notably strong and extended to the N and N-S, respectively. Images using “Atmospheric penetration” rendering (bands 12, 11, 8a). Courtesy of Sentinel Hub Playground. |
Thermal activity continued during January through March. Sentinel-2 infrared satellite data showed some thermal anomalies of varying intensity on clear weather days on 5, 10, 15, 20, and 30 January 2023, 9, 14, 19, and 24 February 2023, and 21, 26, and 31 March (figure 59). According to Suomi NPP/VIIRS sensor data, a total of 30 thermal anomalies were detected over 18 days on 2-3, 7, 9-14, 16-17, 20, 23, 25, and 28-31 January. The sensor data showed a total of six hotspots detected over six days on 1, 4-5, and 10-12 February. During March, a total of 33 hotspots were visible over 11 days on 20-31 March. Four MODVOLC thermal alerts were issued on 25, 27, and 29 March.
Information Contacts: Darwin Volcanic Ash Advisory Centre (VAAC), Bureau of Meteorology, Northern Territory Regional Office, PO Box 40050, Casuarina, NT 0811, Australia (URL: http://www.bom.gov.au/info/vaac/); MIROVA (Middle InfraRed Observation of Volcanic Activity), a collaborative project between the Universities of Turin and Florence (Italy) supported by the Centre for Volcanic Risk of the Italian Civil Protection Department (URL: http://www.mirovaweb.it/); Hawai'i Institute of Geophysics and Planetology (HIGP) - MODVOLC Thermal Alerts System, School of Ocean and Earth Science and Technology (SOEST), Univ. of Hawai'i, 2525 Correa Road, Honolulu, HI 96822, USA (URL: http://modis.higp.hawaii.edu/); Sentinel Hub Playground (URL: https://www.sentinel-hub.com/explore/sentinel-playground); NASA Worldview (URL: https://worldview.earthdata.nasa.gov/).
The Global Volcanism Program has no synonyms or subfeatures listed for Barren Island.
|
|
||||||||||||||||||||||||
There is data available for 17 confirmed Holocene eruptive periods.
2022 Dec 30 - 2023 Aug 18 Confirmed Eruption Max VEI: 2
| Episode 1 | Eruption Episode | |||||||||||||||||||||||||
|---|---|---|---|---|---|---|---|---|---|---|---|---|---|---|---|---|---|---|---|---|---|---|---|---|---|
| 2022 Dec 30 - 2023 Aug 18 | Evidence from Observations: Reported | ||||||||||||||||||||||||
|
List of 3 Events for Episode 1
| |||||||||||||||||||||||||
[ 2022 May 15 - 2022 May 15 ] Uncertain Eruption
| Episode 1 | Uncertain Episode | |||||||||||||||
|---|---|---|---|---|---|---|---|---|---|---|---|---|---|---|---|
| 2022 May 15 - 2022 May 15 | Evidence from Observations: Satellite (infrared) | ||||||||||||||
|
List of 1 Events for Episode 1
| |||||||||||||||
2018 Sep 25 - 2022 Jan 30 Confirmed Eruption Max VEI: 1
| Episode 1 | Eruption Episode | |||||||||||||||||||||||||||||||||||
|---|---|---|---|---|---|---|---|---|---|---|---|---|---|---|---|---|---|---|---|---|---|---|---|---|---|---|---|---|---|---|---|---|---|---|---|
| 2018 Sep 25 - 2022 Jan 30 | Evidence from Observations: Reported | ||||||||||||||||||||||||||||||||||
|
List of 5 Events for Episode 1
| |||||||||||||||||||||||||||||||||||
2017 Jan 15 - 2017 Mar 24 Confirmed Eruption Max VEI: 2
| Episode 1 | Eruption Episode | |||||||||||||||||||||||||||||||||||||||||||||||||||||||
|---|---|---|---|---|---|---|---|---|---|---|---|---|---|---|---|---|---|---|---|---|---|---|---|---|---|---|---|---|---|---|---|---|---|---|---|---|---|---|---|---|---|---|---|---|---|---|---|---|---|---|---|---|---|---|---|
| 2017 Jan 15 - 2017 Mar 24 | Evidence from Observations: Reported | ||||||||||||||||||||||||||||||||||||||||||||||||||||||
|
List of 9 Events for Episode 1
| |||||||||||||||||||||||||||||||||||||||||||||||||||||||
2015 Mar 17 - 2016 May 17 ± 1 days Confirmed Eruption Max VEI: 2
| Episode 1 | Eruption Episode | Main cone | ||||||||||||||||||||||||||||||||||||||||||||||||||||||||||||||||||||||||||||||||||||||||||||||||||||||||||||||||||||||||||||||||||||||||||||||||||||||||||||||||||||||||||||||||||||||||||||||||||
|---|---|---|---|---|---|---|---|---|---|---|---|---|---|---|---|---|---|---|---|---|---|---|---|---|---|---|---|---|---|---|---|---|---|---|---|---|---|---|---|---|---|---|---|---|---|---|---|---|---|---|---|---|---|---|---|---|---|---|---|---|---|---|---|---|---|---|---|---|---|---|---|---|---|---|---|---|---|---|---|---|---|---|---|---|---|---|---|---|---|---|---|---|---|---|---|---|---|---|---|---|---|---|---|---|---|---|---|---|---|---|---|---|---|---|---|---|---|---|---|---|---|---|---|---|---|---|---|---|---|---|---|---|---|---|---|---|---|---|---|---|---|---|---|---|---|---|---|---|---|---|---|---|---|---|---|---|---|---|---|---|---|---|---|---|---|---|---|---|---|---|---|---|---|---|---|---|---|---|---|---|---|---|---|---|---|---|---|---|---|---|---|---|---|---|---|
| 2015 Mar 17 - 2016 May 17 ± 1 days | Evidence from Observations: Satellite (infrared) | ||||||||||||||||||||||||||||||||||||||||||||||||||||||||||||||||||||||||||||||||||||||||||||||||||||||||||||||||||||||||||||||||||||||||||||||||||||||||||||||||||||||||||||||||||||||||||||||||||
|
List of 37 Events for Episode 1 at Main cone
| |||||||||||||||||||||||||||||||||||||||||||||||||||||||||||||||||||||||||||||||||||||||||||||||||||||||||||||||||||||||||||||||||||||||||||||||||||||||||||||||||||||||||||||||||||||||||||||||||||
2013 Oct 12 - 2014 Jun 1 ± 15 days Confirmed Eruption Max VEI: 2
| Episode 1 | Eruption Episode | Main cone | ||||||||||||||||||||||||||||||||||||||||||||||||||||||||||||||||||||||||||||||||||||||||||||||
|---|---|---|---|---|---|---|---|---|---|---|---|---|---|---|---|---|---|---|---|---|---|---|---|---|---|---|---|---|---|---|---|---|---|---|---|---|---|---|---|---|---|---|---|---|---|---|---|---|---|---|---|---|---|---|---|---|---|---|---|---|---|---|---|---|---|---|---|---|---|---|---|---|---|---|---|---|---|---|---|---|---|---|---|---|---|---|---|---|---|---|---|---|---|---|---|
| 2013 Oct 12 - 2014 Jun 1 ± 15 days | Evidence from Observations: Reported | ||||||||||||||||||||||||||||||||||||||||||||||||||||||||||||||||||||||||||||||||||||||||||||||
|
List of 17 Events for Episode 1 at Main cone
| |||||||||||||||||||||||||||||||||||||||||||||||||||||||||||||||||||||||||||||||||||||||||||||||
2013 Feb 16 - 2013 Feb 16 Confirmed Eruption Max VEI: 2
| Episode 1 | Eruption Episode | Summit caldera | |||||||||||||||||||
|---|---|---|---|---|---|---|---|---|---|---|---|---|---|---|---|---|---|---|---|---|
| 2013 Feb 16 - 2013 Feb 16 | Evidence from Observations: Reported | |||||||||||||||||||
|
List of 2 Events for Episode 1 at Summit caldera
| ||||||||||||||||||||
2010 Sep 17 - 2011 Jun 22 Confirmed Eruption Max VEI: 1
| Episode 1 | Eruption Episode | Summit caldera and N flank | ||||||||||||||||||||||||||||||||||||||||||||||||||||||||||||||||||||||||||||||||||||||||||||||||||||||||||||||||||
|---|---|---|---|---|---|---|---|---|---|---|---|---|---|---|---|---|---|---|---|---|---|---|---|---|---|---|---|---|---|---|---|---|---|---|---|---|---|---|---|---|---|---|---|---|---|---|---|---|---|---|---|---|---|---|---|---|---|---|---|---|---|---|---|---|---|---|---|---|---|---|---|---|---|---|---|---|---|---|---|---|---|---|---|---|---|---|---|---|---|---|---|---|---|---|---|---|---|---|---|---|---|---|---|---|---|---|---|---|---|---|---|---|---|---|---|
| 2010 Sep 17 - 2011 Jun 22 | Evidence from Observations: Reported | ||||||||||||||||||||||||||||||||||||||||||||||||||||||||||||||||||||||||||||||||||||||||||||||||||||||||||||||||||
|
List of 21 Events for Episode 1 at Summit caldera and N flank
| |||||||||||||||||||||||||||||||||||||||||||||||||||||||||||||||||||||||||||||||||||||||||||||||||||||||||||||||||||
2008 May 13 - 2010 Apr 19 (?) Confirmed Eruption Max VEI: 2
| Episode 1 | Eruption Episode | |||||||||||||||||||||||||||||||||||||||||||||||||||||||
|---|---|---|---|---|---|---|---|---|---|---|---|---|---|---|---|---|---|---|---|---|---|---|---|---|---|---|---|---|---|---|---|---|---|---|---|---|---|---|---|---|---|---|---|---|---|---|---|---|---|---|---|---|---|---|---|
| 2008 May 13 - 2010 Apr 19 (?) | Evidence from Observations: Reported | ||||||||||||||||||||||||||||||||||||||||||||||||||||||
|
List of 9 Events for Episode 1
| |||||||||||||||||||||||||||||||||||||||||||||||||||||||
2005 May 26 - 2007 Dec 23 (?) Confirmed Eruption Max VEI: 2
| Episode 1 | Eruption Episode | Central cone summit, N, S, and SW flanks | |||||||||||||||||||||||||||||||||||||||
|---|---|---|---|---|---|---|---|---|---|---|---|---|---|---|---|---|---|---|---|---|---|---|---|---|---|---|---|---|---|---|---|---|---|---|---|---|---|---|---|---|
| 2005 May 26 - 2007 Dec 23 (?) | Evidence from Observations: Reported | |||||||||||||||||||||||||||||||||||||||
|
List of 6 Events for Episode 1 at Central cone summit, N, S, and SW flanks
| ||||||||||||||||||||||||||||||||||||||||
[ 2000 Jan 16 ± 15 days ] Uncertain Eruption
| Episode 1 | Eruption Episode | ||||||||||||||||||||
|---|---|---|---|---|---|---|---|---|---|---|---|---|---|---|---|---|---|---|---|---|
| 2000 Jan 16 ± 15 days - Unknown | Evidence from Unknown | |||||||||||||||||||
|
List of 2 Events for Episode 1
| ||||||||||||||||||||
1994 Dec 20 (in or before) - 1995 Jun 5 ± 8 days Confirmed Eruption Max VEI: 2
| Episode 1 | Eruption Episode | Central cone summit, SW & S flanks | |||||||||||||||||||||||||||||||||||||||
|---|---|---|---|---|---|---|---|---|---|---|---|---|---|---|---|---|---|---|---|---|---|---|---|---|---|---|---|---|---|---|---|---|---|---|---|---|---|---|---|---|
| 1994 Dec 20 (in or before) - 1995 Jun 5 ± 8 days | Evidence from Observations: Reported | |||||||||||||||||||||||||||||||||||||||
|
List of 6 Events for Episode 1 at Central cone summit, SW & S flanks
| ||||||||||||||||||||||||||||||||||||||||
1991 Apr 1 - 1991 Oct 31 ± 7 days Confirmed Eruption Max VEI: 2
| Episode 1 | Eruption Episode | Central cone summit and NE flank | |||||||||||||||||||||||||||||||||||||||||||||||||||||||||||
|---|---|---|---|---|---|---|---|---|---|---|---|---|---|---|---|---|---|---|---|---|---|---|---|---|---|---|---|---|---|---|---|---|---|---|---|---|---|---|---|---|---|---|---|---|---|---|---|---|---|---|---|---|---|---|---|---|---|---|---|---|
| 1991 Apr 1 - 1991 Oct 31 ± 7 days | Evidence from Observations: Reported | |||||||||||||||||||||||||||||||||||||||||||||||||||||||||||
|
List of 10 Events for Episode 1 at Central cone summit and NE flank
| ||||||||||||||||||||||||||||||||||||||||||||||||||||||||||||
[ 1852 ] Uncertain Eruption
| Episode 1 | Eruption Episode | ||||||||||||||||||||
|---|---|---|---|---|---|---|---|---|---|---|---|---|---|---|---|---|---|---|---|---|
| 1852 - Unknown | Evidence from Unknown | |||||||||||||||||||
|
List of 2 Events for Episode 1
| ||||||||||||||||||||
1832 Mar Confirmed Eruption Max VEI: 2 (?)
| Episode 1 | Eruption Episode | ||||||||||||||||||||||||||||||
|---|---|---|---|---|---|---|---|---|---|---|---|---|---|---|---|---|---|---|---|---|---|---|---|---|---|---|---|---|---|---|
| 1832 Mar - Unknown | Evidence from Observations: Reported | |||||||||||||||||||||||||||||
|
List of 4 Events for Episode 1
| ||||||||||||||||||||||||||||||
1803 Nov - 1804 Jan 31 (in or after) Confirmed Eruption Max VEI: 2
| Episode 1 | Eruption Episode | |||||||||||||||||||||||||
|---|---|---|---|---|---|---|---|---|---|---|---|---|---|---|---|---|---|---|---|---|---|---|---|---|---|
| 1803 Nov - 1804 Jan 31 (in or after) | Evidence from Observations: Reported | ||||||||||||||||||||||||
|
List of 3 Events for Episode 1
| |||||||||||||||||||||||||
1795 Dec 20 - 1795 Dec 21 (in or after) Confirmed Eruption Max VEI: 2
| Episode 1 | Eruption Episode | ||||||||||||||||||||
|---|---|---|---|---|---|---|---|---|---|---|---|---|---|---|---|---|---|---|---|---|
| 1795 Dec 20 - 1795 Dec 21 (in or after) | Evidence from Observations: Reported | |||||||||||||||||||
|
List of 2 Events for Episode 1
| ||||||||||||||||||||
1789 Mar 24 Confirmed Eruption Max VEI: 2
| Episode 1 | Eruption Episode | |||||||||||||||||||||||||
|---|---|---|---|---|---|---|---|---|---|---|---|---|---|---|---|---|---|---|---|---|---|---|---|---|---|
| 1789 Mar 24 - Unknown | Evidence from Observations: Reported | ||||||||||||||||||||||||
|
List of 3 Events for Episode 1
| |||||||||||||||||||||||||
1787 May 12 Confirmed Eruption Max VEI: 2
| Episode 1 | Eruption Episode | |||||||||||||||||||||||||
|---|---|---|---|---|---|---|---|---|---|---|---|---|---|---|---|---|---|---|---|---|---|---|---|---|---|
| 1787 May 12 - Unknown | Evidence from Observations: Reported | ||||||||||||||||||||||||
|
List of 3 Events for Episode 1
| |||||||||||||||||||||||||
8060 BCE ± 100 years Confirmed Eruption
| Episode 1 | Eruption Episode | ||||||||||||||||||||
|---|---|---|---|---|---|---|---|---|---|---|---|---|---|---|---|---|---|---|---|---|
| 8060 BCE ± 100 years - Unknown | Evidence from Correlation: Tephrochronology | |||||||||||||||||||
|
List of 2 Events for Episode 1
| ||||||||||||||||||||
There is no Deformation History data available for Barren Island.
There is data available for 1 emission periods. Expand each entry for additional details.
| Start Date: 2006 Apr 05 | Stop Date: 2006 Apr 05 | Method: Satellite (Aura OMI) |
| SO2 Altitude Min: 5 km | SO2 Altitude Max: 5 km | Total SO2 Mass: 0 kt |
Data Details
| Date Start | Date End | Assumed SO2 Altitude | SO2 Algorithm | SO2 Mass |
| 20060405 | 5.0 | 0.200 |
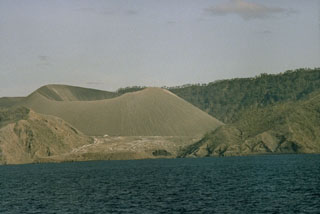 An eruption in 1991 dramatically modified the morphology of the central scoria cone on the small Barren Island, one of the Andaman Islands, north of Sumatra. During the eruption the height of the cinder cone was reduced from 305 to 225 m, and the diameter of its crater increased from 60 to about 200 m. Two small scoria cones also formed in the lava field west of the main cone.
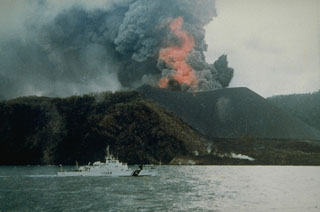 Barren Island erupted for the first time in the 20th century in April 1991. Strombolian eruptions from the central cone produced ash plumes and incandescent ejecta, and a lava flow that is visible in the foreground and reached the W coast of the island. By the time of this 25 September photograph, all subsidiary vents had merged to form an enlarged summit crater.
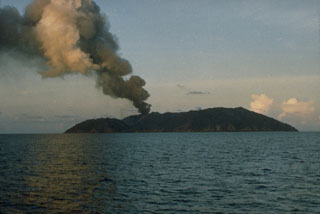 An ash plume in 1991 rises above Barren Island along the volcanic arc connecting north of Sumatra. The 3-km-wide island contains a 1.6-km-wide crater that is partially filled by a scoria cone that has been the source of eruptions since the first was recorded in 1787. Lava flows reached the coast during several recent eruptions.
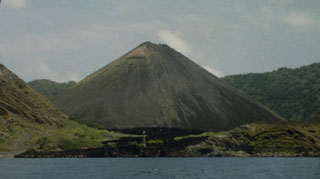 Prior to the 1991 eruption, the central scoria cone in the crater of Barren Island was 305 m high with a 60-m-wide crater at its summit. The black lava flow in the foreground erupted during 1803-1804 and extends from the base of the cone to the west coast. This lava flow was the first known in historical time from Barren Island.
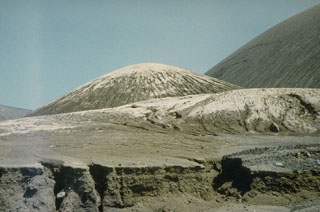 Light-colored volcanic ash from the 1991 eruption mantles the surface of a lava flow from the same eruption, and the scoria cone in the center of the photo. The slopes of the central cone, the source of the ashfall, is the larger feature to the right.
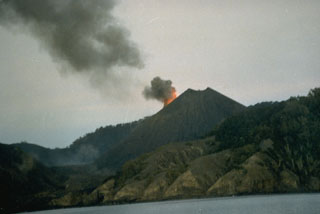 The central scoria cone of Barren Island is seen here from the SW erupting in May 1991. The 1991 eruption, the first of the 20th century from Barren Island, included explosive activity from a vent on the upper NE flank and lava flows that reached the west coast of the island.
 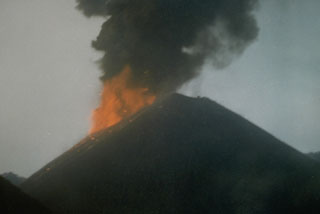 Incandescent ejecta and an ash plume from Strombolian eruptions that began in April 1991 are seen in this 16 May 1991 view of the scoria cone in the center of Barren Island. The 1991 eruption was the first from Barren Island in the 20th century.
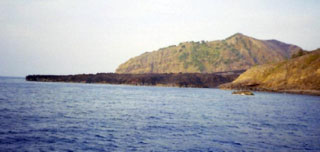 The lava delta extending across the photo formed during the 1994-1995 eruption of Barren Island. The eruption was first noticed by the Indian Navy on 20 December 1994. Explosive activity was observed from satellite images and during visits from January to March and May 1995. Four vents were active from the summit to the S flank of the cone along a N-S south line. A new vent was observed on 11 May on the W flank of the cone that produced a lava flow.
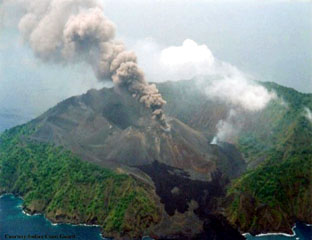 Barren Island is shown erupting on 28 May 2005 from the WNW. The black lava flow in the foreground is from the 1994-95 eruption. A lava flow is being extruded from a flank vent below the white plume. Eruptions that began on 26 May occurred from the summit of the scoria cone as well as flank vents. Lava flows later reached the W coast along the same path as flows from the 1991 and 1994-95 eruptions.
 A lava flow enters the sea along the W coast of Barren Island on 21 July 2005. The flow entered the sea at two points following the routes of the previous 1991 and 1994-95 lava flows. A plume from the summit crater of the central scoria cone is visible to the upper right, along with an active lava channel descending the flanks.
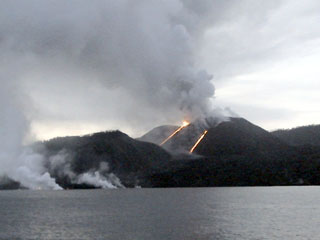 A view from off the west coast of Barren Island on 26 August 2005 shows a Strombolian eruption from the central scoria cone. The main crater was active and both explosive and effusive activity had shifted to the N. Two incandescent lava flows are visible along the slopes of the scoria cone, and steam-and-gas plumes mark the entry point of the lava flows into the sea.
The maps shown below have been scanned from the GVP map archives and include the volcano on this page. Clicking on the small images will load the full 300 dpi map. Very small-scale maps (such as world maps) are not included. The maps database originated over 30 years ago, but was only recently updated and connected to our main database. We welcome users to tell us if they see incorrect information or other problems with the maps; please use the Contact GVP link at the bottom of the page to send us email.
The following 44 samples associated with this volcano can be found in the Smithsonian's NMNH Department of Mineral Sciences collections, and may be availble for research (contact the Rock and Ore Collections Manager). Catalog number links will open a window with more information.
| Catalog Number | Sample Description | Lava Source | Collection Date |
|---|---|---|---|
| NMNH 117273-1 | Lava | -- | -- |
| NMNH 117273-10 | Lava | -- | -- |
| NMNH 117273-11 | Lava | -- | -- |
| NMNH 117273-12 | Lava | -- | -- |
| NMNH 117273-13 | Lava | -- | -- |
| NMNH 117273-14 | Lava | -- | -- |
| NMNH 117273-15 | Lava | -- | -- |
| NMNH 117273-16 | Volcanic Bomb | -- | -- |
| NMNH 117273-17 | Lava | -- | -- |
| NMNH 117273-18 | Pumice | -- | -- |
| NMNH 117273-19 | Pumice | -- | -- |
| NMNH 117273-2 | Lava | -- | -- |
| NMNH 117273-20 | Lava | -- | -- |
| NMNH 117273-21 | Lava | -- | -- |
| NMNH 117273-22 | Scoria | -- | -- |
| NMNH 117273-23 | Basaltic Scoria | -- | -- |
| NMNH 117273-24 | Volcanic Ash | -- | -- |
| NMNH 117273-25 | Volcanic Ash | -- | -- |
| NMNH 117273-26 | Volcanic Ash | -- | -- |
| NMNH 117273-27 | Volcanic Ash | -- | -- |
| NMNH 117273-28 | Volcanic Ash | -- | -- |
| NMNH 117273-3 | Lava | -- | -- |
| NMNH 117273-4 | Lava | -- | -- |
| NMNH 117273-5 | Lava | -- | -- |
| NMNH 117273-6 | Lava | -- | -- |
| NMNH 117273-7 | Lava | -- | -- |
| NMNH 117273-8 | Lava | -- | -- |
| NMNH 117273-9 | Lava | -- | -- |
| NMNH 117583-1 | Ash | -- | -- |
| NMNH 117583-10 | Ash | -- | -- |
| NMNH 117583-2 | Ash | -- | -- |
| NMNH 117583-23 | Basalt | -- | -- |
| NMNH 117583-24 | Basalt | -- | -- |
| NMNH 117583-25 | Basalt | -- | -- |
| NMNH 117583-26 | Plagioclase | -- | -- |
| NMNH 117583-27 | Basalt | -- | -- |
| NMNH 117583-28 | Basalt | -- | -- |
| NMNH 117583-3 | Fumarole Deposit | -- | -- |
| NMNH 117583-4 | Ash | -- | -- |
| NMNH 117583-5 | Ash | -- | -- |
| NMNH 117583-6 | Basalt | -- | -- |
| NMNH 117583-7 | Basalt | -- | -- |
| NMNH 117583-8 | Basalt | -- | -- |
| NMNH 117583-9 | Ash | -- | -- |
| Copernicus Browser | The Copernicus Browser replaced the Sentinel Hub Playground browser in 2023, to provide access to Earth observation archives from the Copernicus Data Space Ecosystem, the main distribution platform for data from the EU Copernicus missions. |
| MIROVA | Middle InfraRed Observation of Volcanic Activity (MIROVA) is a near real time volcanic hot-spot detection system based on the analysis of MODIS (Moderate Resolution Imaging Spectroradiometer) data. In particular, MIROVA uses the Middle InfraRed Radiation (MIR), measured over target volcanoes, in order to detect, locate and measure the heat radiation sourced from volcanic activity. |
| MODVOLC Thermal Alerts | Using infrared satellite Moderate Resolution Imaging Spectroradiometer (MODIS) data, scientists at the Hawai'i Institute of Geophysics and Planetology, University of Hawai'i, developed an automated system called MODVOLC to map thermal hot-spots in near real time. For each MODIS image, the algorithm automatically scans each 1 km pixel within it to check for high-temperature hot-spots. When one is found the date, time, location, and intensity are recorded. MODIS looks at every square km of the Earth every 48 hours, once during the day and once during the night, and the presence of two MODIS sensors in space allows at least four hot-spot observations every two days. Each day updated global maps are compiled to display the locations of all hot spots detected in the previous 24 hours. There is a drop-down list with volcano names which allow users to 'zoom-in' and examine the distribution of hot-spots at a variety of spatial scales. |
|
WOVOdat
Single Volcano View Temporal Evolution of Unrest Side by Side Volcanoes |
WOVOdat is a database of volcanic unrest; instrumentally and visually recorded changes in seismicity, ground deformation, gas emission, and other parameters from their normal baselines. It is sponsored by the World Organization of Volcano Observatories (WOVO) and presently hosted at the Earth Observatory of Singapore.
GVMID Data on Volcano Monitoring Infrastructure The Global Volcano Monitoring Infrastructure Database GVMID, is aimed at documenting and improving capabilities of volcano monitoring from the ground and space. GVMID should provide a snapshot and baseline view of the techniques and instrumentation that are in place at various volcanoes, which can be use by volcano observatories as reference to setup new monitoring system or improving networks at a specific volcano. These data will allow identification of what monitoring gaps exist, which can be then targeted by remote sensing infrastructure and future instrument deployments. |
| Volcanic Hazard Maps | The IAVCEI Commission on Volcanic Hazards and Risk has a Volcanic Hazard Maps database designed to serve as a resource for hazard mappers (or other interested parties) to explore how common issues in hazard map development have been addressed at different volcanoes, in different countries, for different hazards, and for different intended audiences. In addition to the comprehensive, searchable Volcanic Hazard Maps Database, this website contains information about diversity of volcanic hazard maps, illustrated using examples from the database. This site is for educational purposes related to volcanic hazard maps. Hazard maps found on this website should not be used for emergency purposes. For the most recent, official hazard map for a particular volcano, please seek out the proper institutional authorities on the matter. |
| IRIS seismic stations/networks | Incorporated Research Institutions for Seismology (IRIS) Data Services map showing the location of seismic stations from all available networks (permanent or temporary) within a radius of 0.18° (about 20 km at mid-latitudes) from the given location of Barren Island. Users can customize a variety of filters and options in the left panel. Note that if there are no stations are known the map will default to show the entire world with a "No data matched request" error notice. |
| UNAVCO GPS/GNSS stations | Geodetic Data Services map from UNAVCO showing the location of GPS/GNSS stations from all available networks (permanent or temporary) within a radius of 20 km from the given location of Barren Island. Users can customize the data search based on station or network names, location, and time window. Requires Adobe Flash Player. |
| DECADE Data | The DECADE portal, still in the developmental stage, serves as an example of the proposed interoperability between The Smithsonian Institution's Global Volcanism Program, the Mapping Gas Emissions (MaGa) Database, and the EarthChem Geochemical Portal. The Deep Earth Carbon Degassing (DECADE) initiative seeks to use new and established technologies to determine accurate global fluxes of volcanic CO2 to the atmosphere, but installing CO2 monitoring networks on 20 of the world's 150 most actively degassing volcanoes. The group uses related laboratory-based studies (direct gas sampling and analysis, melt inclusions) to provide new data for direct degassing of deep earth carbon to the atmosphere. |
| Large Eruptions of Barren Island | Information about large Quaternary eruptions (VEI >= 4) is cataloged in the Large Magnitude Explosive Volcanic Eruptions (LaMEVE) database of the Volcano Global Risk Identification and Analysis Project (VOGRIPA). |
| EarthChem | EarthChem develops and maintains databases, software, and services that support the preservation, discovery, access and analysis of geochemical data, and facilitate their integration with the broad array of other available earth science parameters. EarthChem is operated by a joint team of disciplinary scientists, data scientists, data managers and information technology developers who are part of the NSF-funded data facility Integrated Earth Data Applications (IEDA). IEDA is a collaborative effort of EarthChem and the Marine Geoscience Data System (MGDS). |

