
The Philippine Institute of Volcanology and Seismology (PHIVOLCS) reported increased seismic activity at Mayon. During 0000-1730 on 6 September the seismic network recorded 26 volcanic earthquakes with local magnitudes of 0.4-2.7 which were located 5-10 km beneath the NE flank. Variable inflation had been detected at the NE sector since October 2024 and at the S and SW sectors since March 2025, based on continuous GPS, electronic tilt, and Electronic Distance Measurement (EDM) ground deformation data. Sulfur dioxide emissions remained near background levels, averaging 430 tonnes/day (t/d) in 2025, with the latest measurement of 609 t/d on 3 September. The Alert Level remained at 1 (on a 0-5 scale); the public was warned to stay out of the 6-km-radius Permanent Danger Zone (PDZ) and pilots were advised to avoid flying close to the summit.
Source: Philippine Institute of Volcanology and Seismology (PHIVOLCS)
Lava flows, pyroclastic flows, ash emissions, and seismicity during April-September 2023
Mayon is located in the Philippines and has steep upper slopes capped by a small summit crater. Historical eruptions date back to 1616 CE that have been characterized by Strombolian eruptions, lava flows, pyroclastic flows, and mudflows. Eruptions mostly originated from a central conduit. Pyroclastic flows and mudflows have commonly descended many of the approximately 40 drainages that surround the volcano. The most recent eruption occurred during June through October 2022 and consisted of lava dome growth and gas-and-steam emissions (BGVN 47:12). A new eruption was reported during late April 2023 and has included lava flows, pyroclastic density currents, ash emissions, and seismicity. This report covers activity during April through September 2023 based on daily bulletins from the Philippine Institute of Volcanology and Seismology (PHIVOLCS).
During April through September 2023, PHIVOLCS reported near-daily rockfall events, frequent volcanic earthquakes, and sulfur dioxide measurements. Gas-and-steam emissions rose 100-900 m above the crater and drifted in different directions. Nighttime crater incandescence was often visible during clear weather and was accompanied by incandescent avalanches of material. Activity notably increased during June when lava flows were reported on the S, SE, and E flanks (figure 52). The MIROVA graph (Middle InfraRed Observation of Volcanic Activity) showed strong thermal activity coincident with these lava flows, which remained active through September (figure 53). According to the MODVOLC thermal algorithm, a total of 110 thermal alerts were detected during the reporting period: 17 during June, 40 during July, 27 during August, and 26 during September. During early June, pyroclastic density currents (PDCs) started to occur more frequently.
 |
Figure 52. Infrared (bands B12, B11, B4) satellite images show strong lava flows descending the S, SE, and E flanks of Mayon on 13 June 2023 (top left), 23 June 2023 (top right), 8 July 2023 (bottom left), and 7 August 2023 (bottom right). Courtesy of Copernicus Browser. |
 |
Figure 53. Strong thermal activity was detected at Mayon during early June through September, according to this MIROVA graph (Log Radiative Power) due to the presence of active lava flows on the SE, S, and E flanks. Courtesy of MIROVA. |
Low activity was reported during much of April and May; gas-and-steam emissions rose 100-900 m above the crater and generally drifted in different directions. A total of 52 rockfall events and 18 volcanic earthquakes were detected during April and 147 rockfall events and 13 volcanic events during May. Sulfur dioxide flux measurements ranged between 400-576 tons per day (t/d) during April, the latter of which was measured on 29 April and between 162-343 t/d during May, the latter of which was measured on 13 May.
Activity during June increased, characterized by lava flows, pyroclastic density currents (PDCs), crater incandescence and incandescent rockfall events, gas-and-steam emissions, and continued seismicity. Weather clouds often prevented clear views of the summit, but during clear days, moderate gas-and-steam emissions rose 100-2,500 m above the crater and drifted in multiple directions. A total of 6,237 rockfall events and 288 volcanic earthquakes were detected. The rockfall events often deposited material on the S and SE flanks within 700-1,500 m of the summit crater and ash from the events drifted SW, S, SE, NE, and E. Sulfur dioxide emissions ranged between 149-1,205 t/d, the latter of which was measured on 10 June. Short-term observations from EDM and electronic tiltmeter monitoring indicated that the upper slopes were inflating since February 2023. Longer-term ground deformation parameters based on EDM, precise leveling, continuous GPS, and electronic tilt monitoring indicated that the volcano remained inflated, especially on the NW and SE flanks. At 1000 on 5 June the Volcano Alert Level (VAL) was raised to 2 (on a 0-5 scale). PHIVOLCS noted that although low-level volcanic earthquakes, ground deformation, and volcanic gas emissions indicated unrest, the steep increase in rockfall frequency may indicate increased dome activity.
A total of 151 dome-collapse PDCs occurred during 8-9 and 11-30 June, traveled 500-2,000 m, and deposited material on the S flank within 2 km of the summit crater. During 8-9 June the VAL was raised to 3. At approximately 1947 on 11 June lava flow activity was reported; two lobes traveled within 500 m from the crater and deposited material on the S (Mi-isi), SE (Bonga), and E (Basud) flanks. Weak seismicity accompanied the lava flow and slight inflation on the upper flanks. This lava flow remained active through 30 June, moving down the S and SE flank as far as 2.5 km and 1.8 km, respectively and depositing material up to 3.3 km from the crater. During 15-16 June traces of ashfall from the PDCs were reported in Sitio Buga, Nabonton, City of Ligao and Purok, and San Francisco, Municipality of Guinobatan. During 28-29 June there were two PDCs generated by the collapse of the lava flow front, which generated a light-brown ash plume 1 km high. Satellite monitors detected significant concentrations of sulfur dioxide beginning on 29 June. On 30 June PDCs primarily affected the Basud Gully on the E flank, the largest of which occurred at 1301 and lasted eight minutes, based on the seismic record. Four PDCs generated between 1800 and 2000 that lasted approximately four minutes each traveled 3-4 km on the E flank and generated an ash plume that rose 1 km above the crater and drifted N and NW. Ashfall was recorded in Tabaco City.
Similar strong activity continued during July; slow lava effusion remained active on the S and SE flanks and traveled as far as 2.8 km and 2.8 km, respectively and material was deposited as far as 4 km from the crater. There was a total of 6,983 rockfall events and 189 PDCs that affected the S, SE, and E flanks. The volcano network detected a total of 2,124 volcanic earthquakes. Continuous gas-and-steam emissions rose 200-2,000 m above the crater and drifted in multiple directions. Sulfur dioxide emissions averaged 792-4,113 t/d, the latter of which was measured on 28 July. During 2-4 July three PDCs were generated from the collapse of the lava flow and resulting light brown plumes rose 200-300 m above the crater. Continuous tremor pulses were reported beginning at 1547 on 3 July through 7 July at 1200, at 2300 on 8 July and going through 0300 on 10 July, and at 2300 on 16 July, as recorded by the seismic network. During 6-9 July there were 10 lava flow-collapse-related PDCs that generated light brown plumes 300-500 m above the crater. During 10-11 July light ashfall was reported in some areas of Mabinit, Legazpi City, Budiao and Salvacion, Daraga, and Camalig, Albay. By 18 July the lava flow advanced 600 m on the E flank as well.
During 1733 on 18 July and 0434 on 19 July PHIVOLCS reported 30 “ashing” events, which are degassing events accompanied by audible thunder-like sounds and entrained ash at the crater, which produced short, dark plumes that drifted SW. These events each lasted 20-40 seconds, and plume heights ranged from 150-300 m above the crater, as recorded by seismic, infrasound, visual, and thermal monitors. Three more ashing events occurred during 19-20 July. Short-term observations from electronic tilt and GPS monitoring indicate deflation on the E lower flanks in early July and inflation on the NW middle flanks during the third week of July. Longer-term ground deformation parameters from EDM, precise leveling, continuous GPS, and electronic tilt monitoring indicated that the volcano was still generally inflated relative to baseline levels. A short-lived lava pulse lasted 28 seconds at 1956 on 21 July, which was accompanied by seismic and infrasound signals. By 22 July, the only lava flow that remained active was on the SE flank, and continued to extend 3.4 km, while those on the S and E flanks weakened markedly. One ashing event was detected during 30-31 July, whereas there were 57 detected during 31 July-1 August; according to PHIVOLCS beginning at approximately 1800 on 31 July eruptive activity was dominated by phases of intermittent ashing, as well as increased in the apparent rates of lava effusion from the summit crater. The ashing phases consisted of discrete events recorded as low-frequency volcanic earthquakes (LFVQ) typically 30 seconds in duration, based on seismic and infrasound signals. Gray ash plume rose 100 m above the crater and generally drifted NE. Shortly after these ashing events began, new lava began to effuse rapidly from the crater, feeding the established flowed on the SE, E, and E flanks and generating frequent rockfall events.
Intensified unrest persisted during August. There was a total of 4,141 rockfall events, 2,881 volcanic earthquakes, which included volcanic tremor events, 32 ashing events, and 101 PDCs detected throughout the month. On clear weather days, gas-and-steam emissions rose 300-1,500 m above the crater and drifted in different directions (figure 54). Sulfur dioxide emissions averaged 735-4,756 t/d, the higher value of which was measured on 16 August. During 1-2 August the rate of lava effusion decreased, but continued to feed the flows on the SE, S, and E flanks, maintaining their advances to 3.4 km, 2.8 km, and 1.1 km from the crater, respectively (figure 55). Rockfall and PDCs generated by collapses at the lava flow margins and from the summit dome deposited material within 4 km of the crater. During 3-4 August there were 10 tremor events detected that lasted 1-4 minutes. Short-lived lava pulse lasted 35 seconds and was accompanied by seismic and infrasound signals at 0442 on 6 August. Seven collapses were recorded at the front of the lava flow during 12-14 August.
 |
Figure 54. Photo of Mayon showing a white gas-and-steam plume rising 800-1,500 m above the crater at 0645 on 25 August. Courtesy of William Rogers. |
 |
Figure 55. Photo of Mayon facing N showing incandescent lava flows and summit crater incandescence taken at 1830 on 25 August 2023. Courtesy of William Rogers. |
During September, similar activity of slow lava effusion, PDCs, gas-and-steam emissions, and seismicity continued. There was a total of 4,452 rockfall events, 329 volcanic earthquakes, which included volcanic tremor events, two ashing events, and 85 PDCs recorded throughout the month. On clear weather days, gas-and-steam emissions rose 100-1,500 m above the crater and drifted in multiple directions. Sulfur dioxide emissions averaged 609-2,252 t/d, the higher average of which was measured on 6 September. Slow lava effusion continued advancing on the SE, S, and E flanks, maintaining lengths of 3.4 km, 2.8 km, and 1.1 km, respectively. Rockfall and PDC events generated by collapses along the lava flow margins and at the summit dome deposited material within 4 km of the crater.
Information Contacts: Philippine Institute of Volcanology and Seismology (PHIVOLCS), Department of Science and Technology, University of the Philippines Campus, Diliman, Quezon City, Philippines (URL: http://www.phivolcs.dost.gov.ph/); MIROVA (Middle InfraRed Observation of Volcanic Activity), a collaborative project between the Universities of Turin and Florence (Italy) supported by the Centre for Volcanic Risk of the Italian Civil Protection Department (URL: http://www.mirovaweb.it/); Hawai'i Institute of Geophysics and Planetology (HIGP) - MODVOLC Thermal Alerts System, School of Ocean and Earth Science and Technology (SOEST), Univ. of Hawai'i, 2525 Correa Road, Honolulu, HI 96822, USA (URL: http://modis.higp.hawaii.edu/); Copernicus Browser, Copernicus Data Space Ecosystem, European Space Agency (URL: https://dataspace.copernicus.eu/browser/); William Rogers, Legazpi City, Albay Province, Philippines.
2025: September
2024: January
| February
| May
| July
2023: May
| June
| July
| August
| September
| October
| November
| December
2022: August
| October
| November
2021: July
2020: April
2019: March
2018: January
| February
| March
| April
| May
| June
| July
| August
| November
| December
2016: September
2014: August
| September
| October
| November
| December
2013: May
| June
2012: December
2011: January
| June
2010: January
| February
2009: July
| August
| September
| October
| November
| December
2008: August
2006: February
| July
| August
| September
| October
| November
| December
2005: August
2004: May
| July
| September
| October
| December
2003: March
| May
| September
| October
2002: February
| October
2001: January
| February
| March
| April
| May
| June
| July
| August
| November
The Philippine Institute of Volcanology and Seismology (PHIVOLCS) reported increased seismic activity at Mayon. During 0000-1730 on 6 September the seismic network recorded 26 volcanic earthquakes with local magnitudes of 0.4-2.7 which were located 5-10 km beneath the NE flank. Variable inflation had been detected at the NE sector since October 2024 and at the S and SW sectors since March 2025, based on continuous GPS, electronic tilt, and Electronic Distance Measurement (EDM) ground deformation data. Sulfur dioxide emissions remained near background levels, averaging 430 tonnes/day (t/d) in 2025, with the latest measurement of 609 t/d on 3 September. The Alert Level remained at 1 (on a 0-5 scale); the public was warned to stay out of the 6-km-radius Permanent Danger Zone (PDZ) and pilots were advised to avoid flying close to the summit.
Source: Philippine Institute of Volcanology and Seismology (PHIVOLCS)
PHIVOLCS reported that 0-3 daily rockfalls and volcanic earthquakes at Mayon were detected by the seismic network during 16-22 July. Moderate levels of emissions drifted mainly NW, W, and SW and occasionally ENE. Faint crater incandescence was only visible using a telescope. A phreatic explosion occurred at 1816 on 18 July and lasted for 45 seconds based on seismic data. According to the Tokyo VAAC the plume rose 2.7 km (9,000 ft) a.s.l., or about 280 m above the summit, and drifted WNW. There were 11 rockfalls recorded during 18-19 July. The Alert Level remained at 1 (on a 0-5 scale); the public was reminded to stay out of the 6-km-radius Permanent Danger Zone (PDZ) and pilots were advised to avoid flying close to the summit.
Source: Philippine Institute of Volcanology and Seismology (PHIVOLCS)
The Tokyo VAAC reported that at 1529 on 30 May an ash plume from Mayon rose to 2.7 km (9,000 ft) a.s.l. and drifted N based on information from PHIVOLCS. Ash was not identified in satellite images.
Source: Tokyo Volcanic Ash Advisory Center (VAAC)
At 1730 on 5 March PHIVOLCS lowered the Alert Level for Mayon to 1 (on a 0-5 scale), noting that activity levels had steadily declined over the past two months. The number of volcanic earthquakes declined to an average of 2-3 events per day during the first week of January. Rockfalls from the summit dome occurred at a rate of 0-1 events per day, indicating that lava dome growth had slowed. Sulfur dioxide flux averaged 1,148 tonnes per day (t/d) in 2024, with a high value of 2,394 t/d on 22 January to a low of 420 t/d on 5 March; overall sulfur dioxide emissions remained above the background level of 500 t/d and were consistent with a non-eruptive, degassing dome. Electronic Distance Measuring (EDM), continuous GPS, and electronic tilt monitoring data showed that the volcano remained inflated overall, though deflation was detected at the mid-north flanks and inflation was detected at the upper flanks and generally on the S flank. Incandescence at the summit was weak and only visible with the aid of a telescope. No movement of the lava flows in the Mi-Isi (S), Bonga (SE), and Basud (E) drainages was observed. Residents were reminded to stay away from the 6-km-radius Permanent Danger Zone (PDZ) and pilots were advised to avoid flying close to the summit.
Source: Philippine Institute of Volcanology and Seismology (PHIVOLCS)
PHIVOLCS reported that unrest continued at Mayon during 7-13 February. Crater incandescence was visible daily. The seismic network recorded a few volcanic earthquakes and rockfall signals during the week. Moderate emissions were observed almost daily that rose as high as 500 m above the summit and drifted multiple directions. On 10 February sulfur dioxide gas emissions were measured at 1,875 tonnes per day. The Alert Level remained at 2 (on a 0-5 scale). Residents were reminded to stay away from the 6-km-radius Permanent Danger Zone (PDZ) and pilots were advised to avoid flying close to the summit.
Source: Philippine Institute of Volcanology and Seismology (PHIVOLCS)
PHIVOLCS reported that unrest continued at Mayon during 31 January-6 February. Crater incandescence was visible daily. The seismic network recorded a few volcanic earthquakes and rockfall signals during the week. A phreatic explosion was recorded by the seismic network at 1647 on 4 February and lasted for two minutes and 49 seconds. The explosion produced an ash-and-steam plume that rose 1.2 km above the summit and drifted SW, ejected blocks onto the flanks, and generated pyroclastic density currents that descended the flanks. Booming noises were reported by residents. The Alert Level remained at 2 (on a 0-5 scale). Residents were reminded to stay away from the 6-km-radius Permanent Danger Zone (PDZ) and pilots were advised to avoid flying close to the summit.
Sources: Philippine Institute of Volcanology and Seismology (PHIVOLCS); Tokyo Volcanic Ash Advisory Center (VAAC)
PHIVOLCS characterized activity at Mayon as “decreased unrest” during 19-26 December. The seismic network recorded 0-6 daily volcanic earthquakes and a total of two rockfall events during 21-24 December. Emissions were visible daily, rising as high as 500 m above the summit and drifting NW, W, and SW. The Tokyo VAAC reported that at 0852 on 23 December an ash emission was identified in a satellite image rising to 2.4 km (8,000 ft) a.s.l. and drifting WSW based on satellite data and information from PHIVOLCS. The Alert Level remained at 2 (on a 0-5 scale). Residents were reminded to stay away from the 6-km-radius Permanent Danger Zone (PDZ) and pilots were advised to avoid flying close to the summit.
Sources: Philippine Institute of Volcanology and Seismology (PHIVOLCS); Tokyo Volcanic Ash Advisory Center (VAAC)
PHIVOLCS characterized activity at Mayon as “decreased unrest” during 12-19 December. The seismic network recorded 1-4 daily volcanic earthquakes and 1-2 rockfall events during 12-15 December. The summit was occasionally obscured by weather conditions, though on most days emissions were visible drifting in multiple directions. The Tokyo VAAC reported that at 1447 on 17 December an ash emission was identified in a satellite image rising to 2.4 km (8,000 ft) a.s.l. and drifting WSW based on satellite data and information from PHIVOLCS. The Alert Level remained at 2 (on a 0-5 scale). Residents were reminded to stay away from the 6-km-radius Permanent Danger Zone (PDZ) and pilots were advised to avoid flying close to the summit.
Source: Philippine Institute of Volcanology and Seismology (PHIVOLCS)
PHIVOLCS lowered the Alert Level for Mayon to 2 (on a 0-5 scale) at 0800 on 8 December due to a continuing decline in activity during the previous several weeks. Volcanic earthquakes indicating lava extrusion, degassing, and occasional fracturing beneath the edifice decreased from an average of 11 events per day in November to almost zero events per day in the first week of December. Similarly, the average number of daily rockfalls and pyroclastic density currents (PDCs, or pyroclastic flows) decreased from monthly averages of 122 to 87 and 5 to 2 events per day, respectively, from October to November; there were almost zero events per day in the first week of December. Incandescence at the summit crater and from lava flows had declined starting in the last week of November. The length of the lava flows in the Mi-Isi (S), Bonga (SE), and Basud (E) drainages had remained at 2.8 km, 3.4 km, and 1.1 km, respectively, since July and August; the newest lava deposits observed since 23 November were in the Bonga within 400 m of the summit. Sulfur dioxide gas emissions peaked at 4,756 tonnes per day (t/d) on 16 August and had been variable but declining overall since; a monthly average of 1,417 t/d in November decreased to an average of 1,095 t/d in December. Electronic Distance Measuring (EDM), continuous GPS, and electronic tilt monitoring data showed continuing deformation. Deflation was detected in GPS data beginning around August-September and in tilt data starting in November. Net inflation in the longer-term was indicated in electronic tilt data as far back as June and in EDM data starting in February. Residents were reminded to stay away from the 6-km-radius Permanent Danger Zone (PDZ) and pilots were advised to avoid flying close to the summit.
Source: Philippine Institute of Volcanology and Seismology (PHIVOLCS)
PHIVOLCS reported that slow lava effusion at Mayon’s summit crater continued during 29 November-5 December. The length of the lava flows in the Mi-Isi (S), Bonga (SE), and Basud (E) drainages remained at 2.8 km, 3.4 km, and 1.1 km, respectively. Collapses at the lava dome produced rockfalls and occasional pyroclastic density currents (PDCs, or pyroclastic flows) that descended the flanks as far as 4 km. Each day seismic stations recorded 0-4 rockfall events and 1-10 volcanic earthquakes. Sulfur dioxide emissions averaged 1,202-1,279 tonnes per day. The Alert Level remained at 3 (on a 0-5 scale) and residents were reminded to stay away from the 6-km-radius Permanent Danger Zone (PDZ). PHIVOLCS recommended that civil aviation authorities advise pilots to avoid flying close to the summit.
Source: Philippine Institute of Volcanology and Seismology (PHIVOLCS)
PHIVOLCS reported that slow lava effusion at Mayon’s summit crater continued during 22-28 November. The lengths of the lava flows in the Mi-Isi (S), Bonga (SE), and Basud (E) drainages remained at 2.8 km, 3.4 km, and 1.1 km, respectively. Collapses at the lava dome produced rockfalls and occasional pyroclastic density currents (PDCs, or pyroclastic flows) that descended the flanks as far as 4 km. Seismic stations recorded 7-111 daily rockfall events and 0-7 daily volcanic earthquakes. Two earthquakes indicated Strombolian explosions during 26-27 November. A total of three PDC events were recorded during the week. Sulfur dioxide emissions averaged 857-1,992 tonnes per day. Lahars descended the Buyoan-Padang and Mi-Isi drainages during 25-26 November. The Alert Level remained at 3 (on a 0-5 scale) and residents were reminded to stay away from the 6-km-radius Permanent Danger Zone (PDZ). PHIVOLCS recommended that civil aviation authorities advise pilots to avoid flying close to the summit.
Source: Philippine Institute of Volcanology and Seismology (PHIVOLCS)
PHIVOLCS reported that slow lava effusion at Mayon’s summit crater continued during 13-21 November. The lengths of the lava flow in the Mi-Isi (S), Bonga (SE), and Basud (E) drainages remained at 2.8 km, 3.4 km, and 1.1 km, respectively. Collapses at the lava dome produced rockfalls and occasional pyroclastic density currents (PDCs, or pyroclastic flows) that descended the flanks as far as 4 km. Seismic stations recorded 37-166 rockfall events each day. During 14-15 and 20-21 November there were 8-9 daily volcanic earthquakes, including 2-5 volcanic tremors, each lasting 1-4 minutes; three volcanic earthquakes were recorded during 17-18 November, and one was recorded during 19-20 November. There were 1-2 daily PDC events detected during 14-15 November and 17-21 November. Sulfur dioxide emissions averaged 1,408 and 1,709 tonnes per day on 14 and 16 November, respectively. One ash emission was recorded during 20-21 November. The Alert Level remained at 3 (on a 0-5 scale) and residents were reminded to stay away from the 6-km-radius Permanent Danger Zone (PDZ). PHIVOLCS recommended that civil aviation authorities advise pilots to avoid flying close to the summit.
Source: Philippine Institute of Volcanology and Seismology (PHIVOLCS)
PHIVOLCS reported that slow lava effusion at Mayon’s summit crater continued during 8-14 November. The lengths of the lava flows in the Mi-Isi (S), Bonga (SE), and Basud (E) drainages remained at 2.8 km, 3.4 km, and 1.1 km, respectively. Collapses at the lava dome produced rockfalls and occasional pyroclastic density currents (PDCs, or pyroclastic flows) that descended the flanks as far as 4 km; There were 0-10 daily PDC events. Seismic stations recorded 73-157 rockfall events each day, and 12-127 tremor events that lasted 1-39 minutes during 8 and 11-14 November. There were 14, 3, and 46 volcanic earthquakes on 8, 9, and 14 November, respectively. Sulfur dioxide emissions, measured almost daily, averaged between 715 and 2,295 tonnes per day, with the highest value recorded on 13 November. The Alert Level remained at 3 (on a 0-5 scale) and residents were reminded to stay away from the 6-km-radius Permanent Danger Zone (PDZ). PHIVOLCS recommended that civil aviation authorities advise pilots to avoid flying close to the summit.
Source: Philippine Institute of Volcanology and Seismology (PHIVOLCS)
PHIVOLCS reported that slow lava effusion at Mayon’s summit crater continued during 1-7 November. The lengths of the lava flow in the Mi-Isi (S), Bonga (SE), and Basud (E) drainages remained at 2.8 km, 3.4 km, and 1.1 km, respectively. Collapses at the lava dome produced rockfalls and occasional pyroclastic density currents (PDCs, or pyroclastic flows) that descended the flanks as far as 4 km. Each day, seismic stations recorded 84-175 rockfall events and 66-187 daily volcanic earthquakes including 62-179 tremor events that each lasted 1-49 minutes. There were 0-4 daily PDC events. Sulfur dioxide emissions, measured almost daily, averaged between 920 and 1,539 tonnes per day, with the highest value recorded on 1 November. The Alert Level remained at 3 (on a 0-5 scale) and residents were reminded to stay away from the 6-km-radius Permanent Danger Zone (PDZ). PHIVOLCS recommended that civil aviation authorities advise pilots to avoid flying close to the summit.
Source: Philippine Institute of Volcanology and Seismology (PHIVOLCS)
PHIVOLCS reported that slow lava effusion at Mayon’s summit crater continued during 11-17 October. The lengths of the lava flow in the Mi-Isi (S), Bonga (SE), and Basud (E) drainages remained at 2.8 km, 3.4 km, and 1.1 km, respectively. Collapses at the lava dome produced incandescent rockfalls and occasional pyroclastic density currents (PDCs, or pyroclastic flows) that descended the flanks as far as 4 km. Each day the seismic network recorded 97-226 rockfall events and 40-137 volcanic earthquakes mostly characterized as tremor events that each lasted 1-72 minutes. There were 48-53 daily PDC events during 25-26 October and 1-4 daily PDC events during the rest of the week. Sulfur dioxide emissions, measured almost daily, averaged between 600 and 1,257 tonnes per day, with the highest value recorded on 29 October. The Alert Level remained at 3 (on a 0-5 scale) and residents were reminded to stay away from the 6-km-radius Permanent Danger Zone (PDZ). PHIVOLCS recommended that civil aviation authorities advise pilots to avoid flying close to the summit.
Source: Philippine Institute of Volcanology and Seismology (PHIVOLCS)
PHIVOLCS reported that slow lava effusion at Mayon’s summit crater continued during 11-17 October. The lengths of the lava flow in the Mi-Isi (S), Bonga (SE), and Basud (E) drainages remained at 2.8 km, 3.4 km, and 1.1 km, respectively. Collapses at the lava dome and from the margins of the lava flows produced incandescent rockfalls and occasional pyroclastic density currents (PDCs, or pyroclastic flows) that descended the flanks as far as 4 km. Each day, seismic stations recorded 43-175 rockfall events and 9-70 daily volcanic earthquakes including 2-67 tremor events that lasted as short as one minute to as long as about four and a half hours. Sulfur dioxide emissions measured near-daily averages between 727 and 1,521 tonnes per day, with the highest value recorded on 17 October. Short-lived bursts of gas were recorded in seismic and infrasound data at 1836 on 20 October and 0006 on 21 October. A period of increased lava effusion that started at 2210 on 21 October was characterized by more intense incandescence at the summit crater, followed by rockfalls and lava flows in the Mi-Isi and Bonga drainages. One PDC per day was recorded on 19, 21, and 22 October and two were recorded during 23-24 October; 53 were recorded during 24-25 October, accompanying a second period of increased effusion on 24 October. The Alert Level remained at 3 (on a 0-5 scale) and residents were reminded to stay away from the 6-km-radius Permanent Danger Zone (PDZ). PHIVOLCS recommended that civil aviation authorities advise pilots to avoid flying close to the summit.
Source: Philippine Institute of Volcanology and Seismology (PHIVOLCS)
PHIVOLCS reported that slow lava effusion at Mayon’s summit crater continued during 11-17 October. The lengths of the lava flow in the Mi-Isi (S), Bonga (SE), and Basud (E) drainages remained at 2.8 km, 3.4 km, and 1.1 km, respectively. Collapses at the lava dome and from the margins of the lava flows produced incandescent rockfalls and occasional pyroclastic density currents (PDCs, or pyroclastic flows) that descended the flanks as far as 4 km. Each day seismic stations recorded 100-126 rockfall events and 1-3 PDC events. There were 1-2 daily volcanic earthquakes during 10-14 October, and 26-37 daily volcanic earthquakes during 15-17 October that also included 24-32 tremor events that lasted 1-32 minutes each. Sulfur dioxide emissions measured almost daily averaged between 797 and 1,255 tonnes per day, with the highest value recorded on 12 October. The Alert Level remained at 3 (on a 0-5 scale) and residents were reminded to stay away from the 6-km-radius Permanent Danger Zone (PDZ). PHIVOLCS recommended that civil aviation authorities advise pilots to avoid flying close to the summit.
Source: Philippine Institute of Volcanology and Seismology (PHIVOLCS)
PHIVOLCS reported that slow lava effusion at Mayon’s summit crater continued during 3-10 October. The lengths of the lava flow in the Mi-Isi (S), Bonga (SE), and Basud (E) drainages remained at 2.8 km, 3.4 km, and 1.1 km, respectively. Collapses at the lava dome and from the margins of the lava flows produced incandescent rockfalls and occasional pyroclastic density currents (PDCs, or pyroclastic flows) that descended the flanks as far as 4 km. Each day seismic stations recorded 92-180 rockfall events, 0-6 PDC events, and 4-30 daily volcanic earthquakes. Sulfur dioxide emissions measured almost daily averaged between 690 and 1,969 tonnes per day, with the highest value recorded on 3 October. The Alert Level remained at 3 (on a 0-5 scale) and residents were reminded to stay away from the 6-km-radius Permanent Danger Zone (PDZ). PHIVOLCS recommended that civil aviation authorities advise pilots to avoid flying close to the summit.
Source: Philippine Institute of Volcanology and Seismology (PHIVOLCS)
PHIVOLCS reported that the eruption at Mayon continued during 26 September-3 October. The lengths of the lava flow in the Mi-Isi (S), Bonga (SE), and Basud (E) drainages remained at 2.8 km, 3.4 km, and 1.1 km, respectively. Collapses at the lava dome and from the margins of the lava flows produced rockfalls and pyroclastic density currents (PDCs, or pyroclastic flows) that descended the flanks as far as 4 km. Each day seismic stations recorded 68-144 rockfall events, 1-3 PDC events, and 1-34 daily volcanic earthquakes. Two tremor events, each lasting one minute, were recorded during 27-28 September and 1-2 October. Sulfur dioxide emissions measured almost daily averaged between 716 and 1,593 tonnes per day, with the highest value recorded on 1 October. The Alert Level remained at 3 (on a 0-5 scale) and residents were reminded to stay away from the 6-km-radius Permanent Danger Zone (PDZ). PHIVOLCS recommended that civil aviation authorities advise pilots to avoid flying close to the summit.
Source: Philippine Institute of Volcanology and Seismology (PHIVOLCS)
PHIVOLCS reported that the eruption at Mayon continued during 19-26 September. The lengths of the lava flow in the Mi-Isi (S), Bonga (SE), and Basud (E) drainages remained at 2.8 km, 3.4 km, and 1.1 km, respectively. Collapses at the lava dome and from the margins of the lava flows produced rockfalls and pyroclastic density currents (PDCs, or pyroclastic flows) that descended the flanks as far as 4 km. Each day seismic stations recorded 107-207 rockfall events, 0-6 PDC events, and 2-15 daily volcanic earthquakes. Sulfur dioxide emissions measured almost daily averaged between 868 and 1,507 tonnes per day, with the highest value recorded on 22 September. The Alert Level remained at 3 (on a 0-5 scale) and residents were reminded to stay away from the 6-km-radius Permanent Danger Zone (PDZ). PHIVOLCS recommended that civil aviation authorities advise pilots to avoid flying close to the summit.
Source: Philippine Institute of Volcanology and Seismology (PHIVOLCS)
PHIVOLCS reported that the eruption at Mayon continued during 12-19 September. The lengths of the lava flow in the Mi-Isi (S), Bonga (SE), and Basud (E) drainages remained at 2.8 km, 3.4 km, and 1.1 km, respectively. Collapses at the lava dome and from the margins of the lava flows produced rockfalls and pyroclastic density currents (PDCs, or pyroclastic flows) that descended the flanks as far as 4 km. Each day seismic stations recorded 101-160 rockfall events, 1-6 PDC events, and 3-12 daily volcanic earthquakes. During 12-13 September the volcanic earthquake signals included one indicating an ash emission and a tremor event that lasted one minute. Daily sulfur dioxide emissions averaged between 765 and 1,551 tonnes per day, with the highest value recorded on 16 September. Electronic Distance Measuring (EDM), precise leveling, continuous GPS, and electronic tilt monitoring data showed that the volcano remained generally inflated relative to baseline levels; tilt and GPS monitoring data indicated pronounced inflation of the mid SE flank since the beginning of August 2023. The Alert Level remained at 3 (on a 0-5 scale) and residents were reminded to stay away from the 6-km-radius Permanent Danger Zone (PDZ). PHIVOLCS recommended that civil aviation authorities advise pilots to avoid flying close to the summit.
Source: Philippine Institute of Volcanology and Seismology (PHIVOLCS)
PHIVOLCS reported that the eruption at Mayon continued during 6-12 September. The lengths of the lava flow in the Mi-Isi (S), Bonga (SE), and Basud (E) drainages remained at 2.8 km, 3.4 km, and 1.1 km, respectively. Collapses at the lava dome and from the lava flows produced incandescent rockfalls and pyroclastic density currents (PDCs, or pyroclastic flows) that descended the flanks as far as 4 km. Each day seismic stations recorded 118-239 rockfall events, 0-3 PDC events, and 3-35 daily volcanic earthquakes. Daily sulfur dioxide emissions averaged between 609 and 2,252 tonnes per day, with the highest value recorded on 8 September. One ash emission was recorded during 11-12 September. The Alert Level remained at 3 (on a 0-5 scale) and residents were reminded to stay away from the 6-km-radius Permanent Danger Zone (PDZ). PHIVOLCS recommended that civil aviation authorities advise pilots to avoid flying close to the summit.
Source: Philippine Institute of Volcanology and Seismology (PHIVOLCS)
PHIVOLCS reported that the eruption at Mayon continued during 30 August-5 September, with slow lava effusion from the summit crater feeding flows on the S, SE, and E flanks. The lengths of the lava flow in the Mi-Isi (S), Bonga (SE), and Basud (E) drainages remained at 2.8 km, 3.4 km, and 1.1 km, respectively. Collapses at the lava dome and from the lava flows produced incandescent rockfalls and pyroclastic density currents (PDCs, or pyroclastic flows) that descended the three drainages as far as 4 km. Each day seismic stations recorded 115-196 rockfall events and 1-6 PDC events. There were 2-37 daily volcanic earthquakes; those totals included three tremor events, each with durations of 1-38 minutes, during 1-2 September. Sulfur dioxide emissions were measured on a few days and averaged between 1,673 and 2,247 tonnes per day, with the highest value recorded on 3 September. The Alert Level remained at 3 (on a 0-5 scale) and residents were reminded to stay away from the 6-km-radius Permanent Danger Zone (PDZ). PHIVOLCS recommended that civil aviation authorities advise pilots to avoid flying close to the summit.
Source: Philippine Institute of Volcanology and Seismology (PHIVOLCS)
PHIVOLCS reported that the eruption at Mayon continued during 23-29 August, with slow lava effusion from the summit crater feeding flows on the S, SE, and E flanks. The lengths of the lava flow in the Mi-Isi (S), Bonga (SE), and Basud (E) drainages remained at 2.8 km, 3.4 km, and 1.1 km, respectively. Collapses at the lava dome and from the lava flows produced incandescent rockfalls and pyroclastic density currents (PDCs, or pyroclastic flows) that descended the three drainages as far as 4 km. Each day seismic stations recorded 109-186 rockfall events and 1-6 PDC events. There were 2-56 daily volcanic earthquakes; those totals included 1-39 tremor events, each with durations of 1-36 minutes, during 23-27 August. Sulfur dioxide emissions were measured on a few days and averaged between 735 and 1,298 tonnes per day, with the highest value recorded on 26 August. The Alert Level remained at 3 (on a 0-5 scale) and residents were reminded to stay away from the 6-km-radius Permanent Danger Zone (PDZ). PHIVOLCS recommended that civil aviation authorities advise pilots to avoid flying close to the summit.
Source: Philippine Institute of Volcanology and Seismology (PHIVOLCS)
PHIVOLCS reported that the eruption at Mayon continued during 16-22 August, with slow lava effusion from the summit crater feeding flows on the S, SE, and E flanks. The lengths of the lava flow in the Mi-Isi (S), Bonga (SE), and Basud (E) drainages remained at 2.8 km, 3.4 km, and 1.1 km, respectively. Collapses at the lava dome and from the lava flows produced incandescent rockfalls and pyroclastic density currents (PDCs, or pyroclastic flows) that descended the three drainages as far as 4 km. Each day seismic stations recorded 60-154 rockfall events and 1-7 PDC events, though no PDC events were recorded during 21-22 August. There were 23-175 volcanic earthquakes, including 4-96 tremor events, each with durations of 1-80 minutes. Sulfur dioxide emissions averaged between 753 and 4,756 tonnes per day, with the highest value recorded on 16 August. The Alert Level remained at 3 (on a 0-5 scale) and residents were reminded to stay away from the 6-km-radius Permanent Danger Zone (PDZ). PHIVOLCS recommended that civil aviation authorities advise pilots to avoid flying close to the summit.
Source: Philippine Institute of Volcanology and Seismology (PHIVOLCS)
PHIVOLCS reported that the eruption at Mayon continued during 9-15 August, with slow lava effusion from the summit crater feeding flows on the S, SE, and E flanks. The length of the lava flow in the Mi-Isi (S) drainage remained at 2.8 km and the flow in the Bonga (SE) drainage was 3.4 km long. The advancing flow in the Basud (E) drainage reached 1 km long by 9 August and was 1.1 km by 13 August. Collapses at the lava dome and from the lava flows produced incandescent rockfalls and pyroclastic density currents (PDCs, or pyroclastic flows) that descended the Mi-Isi, Bonga, and Basud drainages as far as 4 km. Each day seismic stations recorded 45-201 rockfall events and 1-4 PDC events. There 42-259 volcanic earthquakes, including 42-91 low-frequency volcanic earthquakes and 56-167 tremor events, each with durations of 1-45 minutes. Sulfur dioxide emissions were reported on most days, averaging between 799 and 2,689 tonnes per day, with the highest value recorded on 10 August. There was a total of five emissions of short, dark ash plumes (called “ashing” by PHIVOLCS) during 10-12 August. The Alert Level remained at 3 (on a 0-5 scale) and residents were reminded to stay away from the 6-km-radius Permanent Danger Zone (PDZ). PHIVOLCS recommended that civil aviation authorities advise pilots to avoid flying close to the summit.
Source: Philippine Institute of Volcanology and Seismology (PHIVOLCS)
PHIVOLCS reported that the eruption at Mayon continued during 2-8 August, with slow lava effusion from the summit crater feeding flows on the S, SE, and E flanks. The length of the lava flow in the Mi-Isi (S) drainage remained at 2.8 km, the flow in the Basud (E) drainage remained at 600 m long, and the flow in the Bonga (SE) drainage was 3.4 km long. Collapses at the lava dome and from the lava flows produced incandescent rockfalls and pyroclastic density currents (PDCs, or pyroclastic flows) that descended the Mi-Isi, Bonga, and Basud drainages as far as 4 km. Each day seismic stations recorded 66-225 rockfall events, 1-9 PDC events, and 44-272 low-frequency volcanic earthquakes. Sulfur dioxide emissions were reported on most days, averaging between 969 and 3,465 tonnes per day, with the highest value recorded on 2 August. There was a total of 27 emissions of short, dark ash plumes (called “ashing” by PHIVOLCS) during 1-4 August. Daily seismicity during 3-8 August included 10-197 tremor events, each with durations of 1-18 minutes. A short-lived (35 seconds) ejection of lava at 0442 on 6 August was accompanied by seismic and infrasound signals. The Alert Level remained at 3 (on a 0-5 scale) and residents were reminded to stay away from the 6-km-radius Permanent Danger Zone (PDZ). PHIVOLCS recommended that civil aviation authorities advise pilots to avoid flying close to the summit.
Source: Philippine Institute of Volcanology and Seismology (PHIVOLCS)
PHIVOLCS reported that the eruption at Mayon continued during 26 July through 1 August, with slow lava effusion from the summit crater feeding flows on the S, SE, and E flanks. The length of the lava flow in the Mi-Isi (S) drainage remained at 2.8 km, the flow in the Basud (E) drainage remained at 600 m long, and the flow in the Bonga (SE) drainage advanced to 3.4 km on 30 July. Collapses at the lava dome and from the lava flows produced incandescent rockfalls and pyroclastic density currents (PDCs, or pyroclastic flows) that descended the Mi-Isi, Bonga, and Basud drainages as far as 4 km. Each day seismic stations recorded 18-114 rockfall events, 0-1 PDC events, and 11-256 low-frequency volcanic earthquakes (LFVQs). During 29-31 July PDC and rockfall events were not detected due to a loss of power at the Anoling, Camalig Observation Station (VMAN). Sulfur dioxide emissions were reported on most days; variable amounts averaged between 1,258 and 4,113 tonnes per day, with the highest value recorded on 28 July. An ash emission was reported during 30-31 July. Beginning around 1800 on 31 July through the morning of 1 August eruptive activity was dominated by 57 events characterized by short, dark ash plumes that rose 100 m above the summit and drifted generally NE (called “ashing” by PHIVOLCS). In addition, there was an increase in the rate of lava effusion from the summit crater; new lava began to rapidly effuse from the crater, feeding the established lava flows on the S, E, and SE drainages. The Alert Level remained at 3 (on a 0-5 scale) and residents were reminded to stay away from the 6-km-radius Permanent Danger Zone (PDZ). PHIVOLCS recommended that civil aviation authorities advise pilots to avoid flying close to the summit.
Source: Philippine Institute of Volcanology and Seismology (PHIVOLCS)
PHIVOLCS reported that the eruption at Mayon continued during 19-25 July, with slow lava effusion from the summit crater feeding lava flows on the S, SE, and E flanks. The length of the lava flow in the Mi-Isi (S) drainage remained at 2.8 km and the flow in the Bonga (SE) drainage advanced to 2.8 km by 23 July. The lava flow in the Basud drainage on the E flank did not advance, remaining 600 m long. Collapses at the lava dome and from the lava flows produced incandescent rockfalls and pyroclastic density currents (PDCs, or pyroclastic flows) that descended the Mi-Isi, Bonga, and Basud drainages as far as 4 km. Seismicity was dominated by weak low-frequency volcanic earthquakes (LFVQs) originating from a shallow source and were associated with a rapid release of volcanic gases from the summit crater. Some of the events produced audible thunder-like sounds and short dark ash plumes that drifted SW. Between 1733 on 18 July and 0434 on 19 July there were 30 of these events (called “ashing” by PHIVOLCS) recorded by seismic, infrasound, and visual and thermal monitors; each lasted 20-40 seconds long and generated ash plumes that rose 150-300 m above the summit. Sulfur dioxide emissions were reported on most days; variable amounts averaged between 1,581 and 3,135 tonnes per day, with the highest value recorded on 24 July. Each day seismic stations recorded 137-175 rockfall events, 3-4 PDC events, and 5-304 LFVQs. During 19-20 the network recorded three ashing events. At 1956 on 21 July a short-lived (28 seconds) ejection of lava was accompanied by seismic and infrasound signals. The Disaster Response Operations Monitoring and Information Center (DROMIC) reported that as of 1800 on 24 July there were 5,372 families, or 18,782 individuals, that were either in evacuation shelters or staying in other types of alternative housing. The Alert Level remained at 3 (on a 0-5 scale) and residents were reminded to stay away from the 6-km-radius Permanent Danger Zone (PDZ). PHIVOLCS recommended that civil aviation authorities advise pilots to avoid flying close to the summit.
Sources: Philippine Institute of Volcanology and Seismology (PHIVOLCS); Disaster Response Operations Monitoring and Information Center (DROMIC)
PHIVOLCS reported that the eruption at Mayon continued during 11-18 July, with slow lava effusion from the summit crater feeding lava flows on the S and SE flanks. The length of the lava flow in the Mi-Isi (S) drainage remained at 2.8 km and the flow in the Bonga (SE) drainage advanced to 2.4 km by 18 July. The lava flow in the Basud drainage on the E flank was 600 m long. Collapses at the lava dome and from the lava flows produced incandescent rockfalls and pyroclastic density currents (PDCs, or pyroclastic flows) that descended the Mi-Isi and Bonga drainages; material also traveled as far as 4 km down the Basud drainage. Steam-and-gas plumes rose 200-750 m above the summit and drifted WSW, W, and ESE during 11-14 July; emissions were not reported on the other days of the week. Sulfur dioxide emissions were reported on most days and showed an increasing trend, averaging between 1,128 and 2,989 tonnes per day, with the highest value recorded on 15 July. Each day seismic stations recorded 150-423 rockfall events and 3-10 PDC events (from dome and lava-front collapses). There were 3-39 volcanic earthquakes recorded on most days, though 184 and 267 were recorded during 16-17 July and 17-18 July, respectively. At 2300 on 16 July the seismic network began recording a continuous series of weak low-frequency volcanic earthquakes (LFVQs). Some of the events were detected by infrasound sensors and produced audible rumbling sounds during the evening of 17 July and the morning of 18 July. By 1530 on 18 July a total of 573 LFVQs had been detected. Most of the events originated from a shallow source and were associated with a rapid release of volcanic gases, though visually there were no changes in effusive activity. The Disaster Response Operations Monitoring and Information Center (DROMIC) reported that as of 1800 on 17 July there were 5,801 families, or 20,257 individuals, that were either in evacuation shelters or staying in other types of alternative housing. The Alert Level remained at 3 (on a 0-5 scale) and residents were reminded to stay away from the 6-km-radius Permanent Danger Zone (PDZ). PHIVOLCS recommended that civil aviation authorities advise pilots to avoid flying close to the summit.
Sources: Philippine Institute of Volcanology and Seismology (PHIVOLCS); Disaster Response Operations Monitoring and Information Center (DROMIC)
PHIVOLCS reported that eruptive activity continued at Mayon during 5-11 July. Daily steam-and-gas emissions rose as high as 1 km above the crater and drifted in multiple directions. Average daily measurements of sulfur dioxide emissions fluctuated between 721 and 1,621 tonnes per day. Slow lava effusion from the summit crater continued to feed lava flows on the flanks. The length of the lava flow in the Mi-Isi (S) drainage remained at 2.8 km. The flow in the Bonga (SE) drainage advanced 100 m during 10-11 July, with a total length of 1.4 km. The growing lava dome remained unstable and produced incandescent rockfalls and pyroclastic density currents (PDCs, or pyroclastic flows) that descended the Basud (E) drainage as far as 4 km. Seismic stations recorded 216-511 daily rockfall events, 5-39 daily PDC events (from dome and lava front collapse) lasting 1-3 minutes, and 1-109 volcanic earthquakes. Ashfall was reported during 10-11 July in Legazpi City (13 km SSE), and Budiao (8.1 km S), Salvacion (8.6 km S), Daraga (12 km S), and Camalig (11 km SSW), in Albay. The Disaster Response Operations Monitoring and Information Center (DROMIC) reported that as of 1800 on 10 July, the number of displaced persons and total number of overall affected persons from 26 barangays in the province of Albay increased to 20,141 and 38,376, respectively. The Alert Level remained at 3 (on a 0-5 scale). Residents were reminded to stay away from the 6-km-radius Permanent Danger Zone (PDZ), and PHIVOLCS recommended that civil aviation authorities advise pilots to avoid flying close to the summit.
Sources: Philippine Institute of Volcanology and Seismology (PHIVOLCS); Disaster Response Operations Monitoring and Information Center (DROMIC)
PHIVOLCS reported that eruptive activity continued at Mayon during 27 June-4 July. Daily steam-and-gas emissions rose as high as 2.5 km above the crater and drifted multiple directions. Average daily measurements of sulfur dioxide emissions fluctuated between 595 and 1,002 tonnes per day. Slow lava effusion fed the growing dome and flows that advanced down the Mi-Isi (S) and Bonga (SE) drainages. Maximum lava flow lengths along the Mi-Isi drainage extended from 1.6 km on 28 June to 2.7 km by 2 July; the maximum in the Bonga drainage was 1.2 km during 27-28 June, reached 1.3 km on 29 June, and remained at that distance through 2 July. The dome remained unstable and produced incandescent rockfalls and pyroclastic density currents (PDCs, or pyroclastic flows) that sent material up to 4 km away from the crater; seismic stations recording 254-397 daily rockfall events and 4-17 daily PDC events (each lasting 2-4 min). An advisory report about increased activity on 30 June noted four dome-collapse PDC events between 1809 and 2000 that traveled 3-4 km down the Basud drainage, each lasted four minutes. Ashfall was reported during 29 June-1 July in Tabaco (about 13 km NW). The Disaster Response Operations Monitoring and Information Center (DROMIC) reported that as of 1800 on 3 July there were 18,717 people displaced from 26 barangays within the province of Albay, and overall 37,944 were affected. The Alert Level remained at 3 (on a 0-5 scale). Residents were reminded to stay away from the 6-km-radius Permanent Danger Zone (PDZ), and PHIVOLCS recommended that civil aviation authorities advise pilots to avoid flying close to the summit.
Sources: Philippine Institute of Volcanology and Seismology (PHIVOLCS); Disaster Response Operations Monitoring and Information Center (DROMIC)
PHIVOLCS reported that eruptive activity continued at Mayon during 20-27 June. Slow aseismic lava effusion few a growing lava dome in the summit crater and fed lava flows that advanced down the Mi-isi (S) and Bonga (SE) drainages. Previously reported maximum lava flow lengths of 2.5 km along the Mi-isi and 1.8 km along the Bonga drainages were revised on 24 June to 1.3 km and 1.2 km, respectively; by 27 June the Mi-isi flow was 1.6 km long. The dome remained unstable and produced incandescent rockfalls and pyroclastic density currents (PDCs, or pyroclastic flows). The collapse material traveled as far as 3.3 km away from the crater. Daily steam-and-gas emissions rose as high as 800 m above the crater and drifted SW, WSW, and W. Average daily measurements of sulfur dioxide emissions fluctuated between 507 and 925 tonnes per day. Each day, seismic stations recorded 241-339 rockfall events and 1-17 PDC events, each lasting up to five minutes. On 26 June PHIVOLCS released an advisory due to increased seismic activity and ground deformation, noting that the number of volcano-tectonic earthquakes increased during the week; there were two during 20-21 June, two during 23-24 June, and 107 during 26-27 June. The increased seismicity was accompanied by a sharp increase in ground tilt on the SW part of the volcano. The Disaster Response Operations Monitoring and Information Center (DROMIC) reported that as of 1600 on 27 June, the increased unrest had affected a total of 41,488 people and displaced a total of 20,138 people from 26 barangays within the province of Albay. The Alert Level remained at 3 (on a 0-5 scale). Residents were reminded to stay away from the 6-km-radius Permanent Danger Zone (PDZ), and PHIVOLCS recommended that civil aviation authorities advise pilots to avoid flying close to the summit.
Sources: Philippine Institute of Volcanology and Seismology (PHIVOLCS); Disaster Response Operations Monitoring and Information Center (DROMIC)
PHIVOLCS reported that lava-dome extrusion at Mayon’s summit crater continued during 14-20 June, generating frequent lava flows and pyroclastic density currents (PDCs, or pyroclastic flows), and additional evacuations. Sulfur dioxide emissions ranged from 149-193 tonnes per day (t/d) during 13-14 June, rising to 826-1,004 t/d during 15-18 June (above normal baseline values of 500 t/d), and then dropping to 389 t/d on 19 June. The total number of rockfalls ranged from 265-309 events per day, resulting from partial collapses of the growing lava dome and lava flows. PDCs were recorded during 13-14 June (7), 14-15 June (3), 15-16 June (13), 16-17 June (9), 17-18 June (11), 18-19 June (5), and 19-20 June (2); each event lasted 2-6 minutes based on seismic signals. Lava flows remained active, with debris collapses throughout the week sending material into the Mi-Isi (S) and Bonga (SE) drainages. By 20 June lava flows reached 2.5 km down the Mi-Isi and 1.8 km down the Bonga drainages, and debris flows extended 3.3 km from the crater. Ashfall during 15-16 June was reported in the communities of Buga (36 km W), Nabonton (9 km W), Ligao (16 km W), Purok 7 (12 km S), and San Francisco (11 km SW). The Disaster Response Operations Monitoring and Information Center (DROMIC) reported that by 20 June there had been 38,975 people affected, 20,139 displaced, and 18,749 taking shelter in 28 evacuation centers across Albay. The Alert Level remained at 3 (on a 0-5 scale), and residents were reminded to stay away from the 6-km-radius Permanent Danger Zone (PDZ).
Sources: Philippine Institute of Volcanology and Seismology (PHIVOLCS); Disaster Response Operations Monitoring and Information Center (DROMIC)
PHIVOLCS reported that the rate of lava-dome extrusion at Mayon’s summit crater increased, leading to an Alert Level increase and evacuations. Sulfur dioxide emissions were at or near baseline levels of 500 tonnes per day, averaging 574 and 332 tonnes per day on 6 and 7 June, respectively. The total number of rockfalls increased from 54 during 1-4 June to 267 during 5-8 June. Additionally, the volumes of the individual rockfall events became larger on 3 June. The rockfalls were generated by partial collapses of the growing lava dome and indicated an increasing extrusion rate. Three pyroclastic density currents (PDCs, or pyroclastic flows) were recorded at 0618, 0953, and 1100 on 8 June, each lasting 4-5 minutes based on the seismic signals. The PDCs traveled as far as 2 km down the Mi-Isi (S), Bonga (SE), and Basud (E) drainages and indicated that new, less degassed lava was collapsing from the summit dome. The Alert Level was raised to 3 (on a 0-5 scale) at 1200 on 8 June and recommended the evacuation of the 6-km radius Permanent Danger Zone.
Six PDCs generated by collapses at the lava dome and 199 rockfall events were recorded during 8-9 June, based on seismic data and visual observations. Material from the rockfalls and PDCs descended the S flank within 2 km. Steam-and-gas plumes from the dome rose 800 m and drifted S, and light-brown ash plumes from the rockfalls drifted S. Minor crater incandescence from newly extruded lava and incandescent rockfalls were observed through the night. Rockfall events continued during 9-10 June with total of 59. A new dome, contacting a part of the remnant dome on the SE part of the crater floor, was visible during the morning of 10 June. Sulfur dioxide emissions increased to moderate levels, averaging 1,205 tonnes per day that same day. The DROMIC report stated that 9,314 people from 21 neighborhoods (barangays) spanning six municipalities were in evacuation centers by 10 June.
A total of 177 rockfalls traveled as far as 700 m down the S and SE flanks during 10-11 June. Plumes of steam and gas from the dome and minor ash plumes from the rockfalls descended the flanks and then drifted E and SE. Incandescence from the dome and rockfalls was visible at night. Sulfur dioxide emissions averaged 642 tonnes per day on 11 June. Lava flows emerged at about 1947 on 11 June and produced two 500-m-long lobes; lava avalanches from the ends of the flows descended the Mi-Isi, Bonga, and Basud drainages within 2 km of the summit. Effusion of the lava flows was preceded by slight inflation at the upper flanks based on tiltmeter data and accompanied by minor seismicity. During 11-12 June the monitoring network recorded 260 rockfall events, and three collapses at the dome that produced PDCs (each lasting 2-4 minutes). The lava flows continued to be active. There were 14,360 people that had evacuated by 12 June; of those, 584 people were staying in places other than evacuation centers.
During 12-13 June the monitoring network recorded 221 rockfall events and collapses at the dome that produced PDCs (each lasting 2-4 minutes). Lava continued to slowly effuse at the summit crater and collapsed material traveled 1 km down the Mi-isi and Bonga drainages. One PDC lasting two minutes was observed and detected by the seismic network. Diffuse ash from the rockfalls and steam-and-gas emissions from the dome drifted downslope and then NE. Rockfalls exposed incandescent material at the summit. By 13 June a total of 16,152 people had evacuated; of those, 15,493 people were in evacuation shelters and 659 people were staying with friends and family.
Sources: Philippine Institute of Volcanology and Seismology (PHIVOLCS); Disaster Response Operations Monitoring and Information Center (DROMIC)
Daily visual and webcam observations of Mayon’s summit crater revealed more frequent rockfalls at the summit lava dome starting in the last week of April, indicating aseismic dome growth. The lava dome increased in volume by about 83,000 cubic meters during 3 February-9 May, with a total addition of nearly 164,000 cubic meters since 20 August 2022. Sulfur dioxide emission averages were as high as 576 tons per day on 29 April and 162 tons per day on 23 May. A total of 26 volcanic earthquakes had been recorded since 1 April. Electronic Distance Measuring (EDM), precise leveling, continuous GPS, and electronic tilt monitoring data showed that the volcano had been slightly inflated, especially on the NW and SE flanks, since 2020. Short-term inflation on the upper flanks had been detected since February.
From 0500 on 4 June to 0500 on 5 June the number of rockfalls increased from an average of 5 events per day to 49 events per day. At 1000 on 5 June the Alert Level was raised to 2 (on a 0-5 scale). PHIVOLCS noted that although low-level volcanic earthquakes, ground deformation, and volcanic gas emissions indicated unrest, the steep increase in rockfall frequency may indicate increased dome activity. Residents were reminded to stay away from the 6-km-radius Permanent Danger Zone (PDZ).
Source: Philippine Institute of Volcanology and Seismology (PHIVOLCS)
PHIVOLCS reported that white gas-and-steam plumes from Mayon crept downslope and drifted generally W during 9-15 November. Sulfur dioxide emissions averaged 276 per day on 3 November. Faint crater incandescence was observed at night during 9-12 November. Five volcanic earthquakes were detected during 10-13 November. Electronic Distance Measuring (EDM), precise leveling, continuous GPS, and electronic tilt monitoring data showed that the volcano had been slightly inflated, especially on the NW and SE flanks, since 2020. The Alert Level remained at 2 (on a 0-5 scale) and the public was reminded to stay outside of the 6-km-radius Permanent Danger Zone.
Source: Philippine Institute of Volcanology and Seismology (PHIVOLCS)
On 28 October PHIVOLCS warned of potential lahars around Mayon due to intense rains from an impending tropical storm. The rains could generate lahars in several drainages, including in the Miisi, Binaan, Anoling, Quirangay, Maninila, Masarawag, Muladbucad, Nasisi, Mabinit, Matan-ag, and Basud. Communities along the middle and lower flanks and in areas downstream were vulnerable to lahars. The Alert Level remained at 2 (on a 0-5 scale) and the public was reminded to stay outside of the 6-km-radius Permanent Danger Zone.
Source: Philippine Institute of Volcanology and Seismology (PHIVOLCS)
PHIVOLCS reported that white steam plumes from Mayon rose no higher than 500 m above the summit and drifted E. Sulfur dioxide emissions averaged 301 tonnes per day on 12 October. One volcanic earthquake was detected during 16-17 October. Electronic Distance Measuring (EDM), precise leveling, continuous GPS, and electronic tilt monitoring data showed that the volcano had been slightly inflated, especially on the NW and SE flanks, since 2020. The Alert Level remained at 2 (on a 0-5 scale) and the public was reminded to stay outside of the 6-km-radius Permanent Danger Zone.
Source: Philippine Institute of Volcanology and Seismology (PHIVOLCS)
PHIVOLCS reported that since the Alert Level for Mayon was raised to 1 (on a 0-5 scale) on 21 August monitoring data had showed nothing notable. Changes in morphology of the dome and minor aseismic extrusion estimated at about 40,000 cubic meters was detected during 6 June-20 August based on daily visual and camera monitoring data. Based on these observations, the lava dome grew an additional 48,000 cubic meters by 4 October; re-mobilized light-colored ash had been deposited in Miisi Gully (S flank) beginning 2 October, likely derived from lava fragmentation during the extrusion process. Freshly extruded lava at the base of the summit lava dome was seen during an aerial survey conducted on 7 October. PHIVOLCS raised the Alert Level to 2 that same day. Daily white steam plumes were visible drifting down-flank and then to the W, WSW, and SSW during 8-10 October.
Electronic Distance Measuring (EDM), precise leveling, continuous GPS, and electronic tilt monitoring data showed that the volcano had been slightly inflated, especially on the NW and SE flanks, since 2020. Short-term inflation on the W to SW flanks and short-term deflation on the E and SE flanks had been detected since August.
Source: Philippine Institute of Volcanology and Seismology (PHIVOLCS)
On 21 August PHIVOLCS raised the Alert Level for Mayon to 1 (on a 0-5 scale) noting changes at the summit lava dome that was emplaced in 2018. Changes in morphology of the dome and minor extrusion estimated at about 40,000 cubic meters was detected during 6 June-20 August based on daily visual and camera monitoring data. Minor inflation, particularly on the NW and SE flanks, had been recorded since April. Sulfur dioxide emissions averaged 688 tonnes/day on 12 August, near baseline levels. Seismic activity was at baseline levels for most of 2022, though short-lived spikes in the number of low-frequency volcanic earthquakes were recorded on 26 May and 20 June. Based on the data PHIVOLCS stated that the dome growth was likely the result of gas pressurization at shallow depths.
Source: Philippine Institute of Volcanology and Seismology (PHIVOLCS)
On 30 July PHIVOLCS lowered the Alert Level for Mayon to 0 (on a 0-5 scale) noting that activity had declined to baseline levels over the previous several months. Ground deformation data indicated tectonic origins rather than magmatic or hydrothermal causes. The frequency of volcanic earthquakes had declined to baseline levels (0-5 events/day) during the previous six months and sulfur dioxide flux had dropped to 156 tonnes/day on 14 July, below the baseline of 500 tonnes/day. Dim crater incandescence from hot gas emissions at the summit continued to be visible in camera images; the last time it was visually observed was in May 2021. PHIVOLCS reminded residents to stay away from the 6-km-radius Permanent Danger Zone.
Source: Philippine Institute of Volcanology and Seismology (PHIVOLCS)
PHIVOLCS reported that during 7-14 April white steam plumes periodically emitted from Mayon rose as high as 400 m above the summit and drifted mainly NW, W, and SW. Crater incandescence was visible nightly. The Alert Level remained at 2 (on a 0-5 scale) and PHIVOLCS reminded residents to stay away from the 6-km-radius Permanent Danger Zone and the 7-km Extended Danger Zone on the SSW and ENE flanks.
Source: Philippine Institute of Volcanology and Seismology (PHIVOLCS)
PHIVOLCS reported that during 13-19 March white steam plumes periodically emitted from Mayon drifted mainly W and SW, and crater incandescence was visible nightly. Three phreatic events, recorded at 1510, 1518, and 1534 on 12 March, generated light-brown-to-grayish ash plumes that rose 500-1,000 m above the crater rim and drifted SW. Six phreatic events on 13 March, recorded at 0906, 0939, 0946, 0955, 1000, and 1059, produced ash plumes that rose 200-700 m and drifted W. A phreatic event at 1855 on 14 March generated an ash plume that rose 500 m and drifted SW. The Alert Level remained at 2 (on a 0-5 scale) and PHIVOLCS reminded residents to stay away from the 6-km-radius Permanent Danger Zone and the 7-km Extended Danger Zone on the SSW and ENE flanks.
Source: Philippine Institute of Volcanology and Seismology (PHIVOLCS)
PHIVOLCS reported that during 6-11 March white steam plumes periodically emitted from Mayon drifted WNW, WSW, and SW, and crater incandescence was visible each night. As many as six volcanic earthquakes and two rockfalls per day were recorded by the seismic network. Phreatic events recorded at 0811 on 7 March and 0627 on 8 March generated grayish ash plumes that rose 500 and 300 m above the crater, respectively, and drifted SW. The Alert Level remained at 2 (on a 0-5 scale) and PHIVOLCS reminded residents to stay away from the 6-km-radius Permanent Danger Zone and the 7-km Extended Danger Zone on the SSW and ENE flanks.
Source: Philippine Institute of Volcanology and Seismology (PHIVOLCS)
PHIVOLCS reported that during 5-11 December white steam plumes periodically emitted from Mayon drifted mainly WSW. Crater incandescence was sometimes visible at night. A four-minute long event recorded by the seismic network began at 1224 on 9 December, and produced a grayish-brown ash plume that drifted W. The Alert Level remained at 2 (on a 0-5 scale) and PHIVOLCS reminded residents to stay away from the 6-km-radius Permanent Danger Zone and the 7-km Extended Danger Zone on the SSW and ENE flanks.
Source: Philippine Institute of Volcanology and Seismology (PHIVOLCS)
PHIVOLCS reported that during 27 November-4 December white steam plumes rose from Mayon daily, and crater incandescence was visible almost nightly. At 0533 on 27 November a phreatic event generated a grayish-white ash plume that rose 300-500 m and drifted SW. A one-minute-long event that began at 0941 on 30 November produced another grayish-white ash plume. The Alert Level remained at 2 (on a 0-5 scale) and PHIVOLCS reminded residents to stay away from the 6-km-radius Permanent Danger Zone and the 7-km Extended Danger Zone on the SSW and ENE flanks.
Source: Philippine Institute of Volcanology and Seismology (PHIVOLCS)
PHIVOLCS reported that during 21-26 November white steam plumes periodically emitted from Mayon rose as high as 750 m and drifted WSW and SW. Crater incandescence was visible at night during 24-27 November. Two phreatic explosions were recorded during 0759 and 0805 on 26 November. The events generated grayish ash plumes that rose 300-500 m and drifted SW. The Alert Level remained at 2 (on a 0-5 scale) and PHIVOLCS reminded residents to stay away from the 6-km-radius Permanent Danger Zone and the 7-km Extended Danger Zone on the SSW and ENE flanks.
Source: Philippine Institute of Volcanology and Seismology (PHIVOLCS)
PHIVOLCS reported that during 14-20 November white steam plumes emitted from Mayon drifted downslope and then in multiple directions. Crater incandescence was visible at night. The Alert Level remained at 2 (on a 0-5 scale) and PHIVOLCS reminded residents to stay away from the 6-km-radius Permanent Danger Zone and the 7-km Extended Danger Zone on the SSW and ENE flanks.
Source: Philippine Institute of Volcanology and Seismology (PHIVOLCS)
PHIVOLCS reported that at 1243 on 8 November and at 0739 on 12 November small, short-lived brownish ash plumes from Mayon, associated with a degassing events, drifted WSW and SW, respectively. There was no accompanying seismic or infrasound record from these events. On 11 November a volcanic earthquake was associated with a short-lived lava fountaining event at 0840. The event lasted for 36 seconds based on the seismic record and produced a brownish-gray ash plume that drifted SW. Crater incandescence was visible most nights during 7-13 November. The Alert Level remained at 2 (on a 0-5 scale) and PHIVOLCS reminded residents to stay away from the 6-km-radius Permanent Danger Zone and the 7-km Extended Danger Zone on the SSW and ENE flanks.
Source: Philippine Institute of Volcanology and Seismology (PHIVOLCS)
PHIVOLCS reported that at 0653 on 27 August a short-lived degassing event at Mayon produced a light-brown ash plume that rose 200 m above the summit rim and drifted NE. During 28 August-3 September white steam plumes rose as high as 1 km and drifted in multiple directions. Crater incandescence was visible nightly. The Alert Level remained at 2 (on a 0-5 scale) and PHIVOLCS reminded residents to stay away from the 6-km-radius Permanent Danger Zone and the 7-km Extended Danger Zone on the SSW and ENE flanks.
Source: Philippine Institute of Volcanology and Seismology (PHIVOLCS)
PHIVOLCS reported that at 1509 on 13 July a minor rockfall descended the Mi-isi drainage on Mayon’s S flank, generating a brownish ash cloud. The event was preceded by heavy rainfall on the upper flanks. Sulfur dioxide emissions were 2,398 tonnes/day. Precise leveling data obtained during 2-14 April indicated inflation relative to data collected in late March; electronic tilt data showed pronounced inflation on the mid-flank beginning on 25 June possibly due to a deep aseismic magma intrusion. The Alert Level remained at 2 (on a 0-5 scale) and PHIVOLCS reminded residents to stay away from the 6-km-radius Permanent Danger Zone and the 7-km Extended Danger Zone on the SSW and ENE flanks.
Source: Philippine Institute of Volcanology and Seismology (PHIVOLCS)
PHIVOLCS reported that white steam plumes from Mayon rose 750 m above the crater rim on 30 June and drifted NE, N, NW, and SW. On 1 July white plumes drifted down the flanks. A short-lived event at 1234 produced a gray gas plume. Crater incandescence was visible at night. The Alert Level remained at 2 (on a 0-5 scale) and PHIVOLCS reminded residents to stay away from the 6-km-radius Permanent Danger Zone and the 7-km Extended Danger Zone on the SSW and ENE flanks.
Source: Philippine Institute of Volcanology and Seismology (PHIVOLCS)
PHIVOLCS reported that during 23-29 May white steam plumes from Mayon drifted WNW, WSW, and SW, sometimes rising 250-300 m above the crater rim. Crater incandescence was visible each night. The Alert Level remained at 2 (on a 0-5 scale) and PHIVOLCS reminded residents to stay away from the 6-km-radius Permanent Danger Zone and the 7-km Extended Danger Zone on the SSW and ENE flanks.
Source: Philippine Institute of Volcanology and Seismology (PHIVOLCS)
PHIVOLCS reported that during 18-24 April white steam plumes from Mayon drifted NW, W, SW, and NE. Crater incandescence was visible at night. The sulfur dioxide flux was 796 tonnes/day on 17 April. The Alert Level remained at 2 (on a 0-5 scale) and PHIVOLCS reminded residents to stay away from the 6-km-radius Permanent Danger Zone and the 7-km Extended Danger Zone on the SSW and ENE flanks.
Source: Philippine Institute of Volcanology and Seismology (PHIVOLCS)
PHIVOLCS reported that during 11-17 April white steam plumes from Mayon drifted NW, WNW, WSW, and SW. Crater incandescence was visible at night. The sulfur dioxide flux was 2,800, 1,918, 1,621, and 1,617 tonnes/day on 11, 12, 13, and 16 April, respectively. The Alert Level remained at 2 (on a 0-5 scale) and PHIVOLCS reminded residents to stay away from the 6-km-radius Permanent Danger Zone and the 7-km Extended Danger Zone on the SSW and ENE flanks.
Source: Philippine Institute of Volcanology and Seismology (PHIVOLCS)
PHIVOLCS reported that during 4-10 April white steam plumes from Mayon drifted WNW, WSW, and SW. Crater incandescence was visible at night. The sulfur dioxide flux was 899 tonnes/day on 5 April. Tiltmeter data recorded deflation since 20 February despite short-term episodes of inflation at the lower and middle flanks. Precise leveling data showed deflation during 22-29 March relative to surveys conducted during 10-19 March. Overall ground deformation data suggested inflation compared to baseline levels. The Alert Level remained at 2 (on a 0-5 scale) and PHIVOLCS reminded residents to stay away from the 6-km-radius Permanent Danger Zone and the 7-km Extended Danger Zone on the SSW and ENE flanks.
Source: Philippine Institute of Volcanology and Seismology (PHIVOLCS)
On 29 March PHIVOLCS lowered the Alert Level for Mayon to 2 (on a 0-5 scale) noting a deflationary trend since 20 February, decreased seismicity, a lower sulfur dioxide flux, and decreased surficial activity. During the previous two weeks the number of rockfalls from collapse of unstable lava-flow deposits fell from a peak of 82 to less than 10 per day. Sulfur dioxide flux ranged from 500 to 2,000 tonnes/day during the previous two weeks, lower than 700-4,500 tonnes/day during 13 January-8 March. Lava last effused from the crater on 18 March, and crater incandescence from hot gas emissions had become faint. Fewer rockfalls and pyroclastic flows were noted as the lava flows stabilized; at 0934 on 27 March one pyroclastic flow traveled down the Bonga-Buyuan drainage and produced a dirty-white ash cloud that drifted SW. During 30 March-3 April a few rockfalls were recorded, there was faint crater incandescence, and steam plumes drifted SW, WNW, and NW. PHIVOLCS reminded residents to stay away from the 6-km-radius Permanent Danger Zone.
Source: Philippine Institute of Volcanology and Seismology (PHIVOLCS)
PHIVOLCS reported that during 21-27 March activity at Mayon included periods of gravity-driven lava advancement, gas-and-steam emissions, rockfalls, and quiescence. Lava flows were about 3.3 km, 4.5 km, and 1.9 km long in the Mi-isi (S), Bonga (SE), and Basud (E) drainages, respectively. Steam-and-gas emissions drifted mainly SW. At 1039 and 2133 on 23 March pyroclastic flows traveled 4-5 km down the Mi-isi drainage, producing light brown ash clouds that drifted SW. The Alert Level remained at 3 (on a 0-5 scale) and PHIVOLCS reminded residents to stay away from the 6-km-radius Permanent Danger Zone and the 7-km Extended Danger Zone on the SSW and ENE flanks.
Source: Philippine Institute of Volcanology and Seismology (PHIVOLCS)
PHIVOLCS reported that during 13-20 March activity at Mayon was mostly characterized by periods of gravity-driven lava advancement, gas-and-steam emissions, rockfalls, and quiescence. Lava flows extended 3.3 km, 4.5 km, and 1.9 km long in the Mi-isi (S), Bonga (SE), and Basud (E) drainages, respectively. Sulfur dioxide emissions were between 969 and 2,077 tonnes/day. Steam-and-gas emissions drifted SW. An episode of lava fountaining was recorded during 0831-0832 on 14 March and produced a light-gray ash plume that rose 200 m above the crater and drifted SW. At 1347 on 16 March a pyroclastic flow traveled 4-5 km down the Mi-isi and Basud drainages. The Alert Level remained at 3 (on a 0-5 scale) and PHIVOLCS reminded residents to stay away from the 6-km-radius Permanent Danger Zone and the 7-km Extended Danger Zone on the SSW and ENE flanks.
Source: Philippine Institute of Volcanology and Seismology (PHIVOLCS)
PHIVOLCS reported that during 6-13 March activity at Mayon was characterized by periods of gravity-driven lava advancement, gas-and-steam emissions, lava fountains, and quiescence. Episodes of weak lava fountaining during 6-10 March were accompanied by ash plumes that rose 100-300 m above the crater and drifted mainly SW. Rumbling sounds were audible at least within a 10-km radius. Active lava flows extended 3.3 km, 4.5 km, and 1.9 km long in the Mi-isi (S), Bonga (SE), and Basud (E) drainages, respectively. Steam plumes rose 2.4 km and drifted SW on 10 March. The next day white-and-gray plumes rose 2.5 km and drifted SW. The Alert Level remained at 3 (on a 0-5 scale) and PHIVOLCS reminded residents to stay away from the 6-km-radius Permanent Danger Zone and the 7-km Extended Danger Zone on the SSW and ENE flanks.
Source: Philippine Institute of Volcanology and Seismology (PHIVOLCS)
PHIVOLCS reported that during 27 February-5 March activity at Mayon was characterized by lava effusion from the summit crater, lava fountains, steam and ash emissions, advancing lava flows on the flanks, and pyroclastic flows. Weak and intermittent lava fountains generated steam and ash plumes that rose as high as 800 m and drifted in multiple directions; rumbling sounds were audible at least within a 10-km radius. Active lava flows extended 3.3 km, 4.5 km, and 1.9 km in the Mi-isi (S), Bonga (SE), and Basud (E) drainages, respectively. During 27 February-5 March pyroclastic flows generated by collapses of lava at the fronts and margins of flows traveled 4-5 km down the flanks. On 6 March PHIVOLCS lowered the Alert Level to 3 (on a 0-5 scale) noting a decline in the intensity and frequency of events during the previous week. Data from precise leveling surveys and real-time electronic tilt continued to record deflation of the lower flanks that began on 20 February. The report reminded residents to stay away from the 6-km-radius Permanent Danger Zone and the 7-km Extended Danger Zone on the SSW and ENE flanks.
Source: Philippine Institute of Volcanology and Seismology (PHIVOLCS)
PHIVOLCS reported that during 21-27 February activity at Mayon continued to be characterized by daily lava effusion from the summit crater, lava fountains on most days, steam-and-ash emissions, advancing lava flows on the flanks, and pyroclastic flows. Weak and sporadic lava fountaining events each lasted between 2 and 77 minutes, and were sometimes accompanied by rumbling sounds audible within a 10-km radius. Each day there were 1-21 pyroclastic flows generated by lava-collapse events traveling as far as 5 km down the Mi-isi, Bonga-Buyuan, and Basud drainages. The Alert Level remained at 4 (on a 0-5 scale) and the public was warned to remain outside of the Danger Zone defined as an area within an 8-km radius.
Source: Philippine Institute of Volcanology and Seismology (PHIVOLCS)
PHIVOLCS reported that during 14-20 February daily activity at Mayon continued to be characterized by lava effusion from the summit crater, rockfalls, lava fountains, steam emissions, advancing lava flows on the flanks, and pyroclastic flows. Weak and sporadic lava fountaining events each lasted between 5 and 239 minutes, and were sometimes accompanied by rumbling sounds audible with a 10-km radius. Heavy rainfall on 14 February caused lahars in the Anoling drainage, and sediment-laden streams in most channels where pyroclastic flow deposits were emplaced. During 16-17 February lava fountains were 200-500 m tall and generated steam plumes that drifted SW, WSW, and NW. A lava-fountaining event that began at 0103 on 17 February lasted for 12 hours and 18 minutes. Lava flows 3.3 km, 4.5 km, and 900 m long in the Mi-isi (S), Bonga (SE), and Basud (E) drainages, respectively, continued to be active. Pyroclastic flows traveled 4.2-4.6 km in the Mi-isi, Bonga, and Basud drainages. The Alert Level remained at 4 (on a 0-5 scale) and the public was warned to remain outside of the Danger Zone, defined as an area within an 8-km radius.
Source: Philippine Institute of Volcanology and Seismology (PHIVOLCS)
PHIVOLCS reported that during 7-13 February activity at Mayon continued to be characterized daily by lava effusion from the summit crater, rockfalls, lava fountains, steam emissions, advancing lava flows on the flanks, and pyroclastic flows. Numerous rockfall events were generated from the front and margins of advancing lava flows. Lava fountaining was nearly continuous during 6-10 February, with around 290 lava-fountaining events recorded by the seismic network from 0557 on 5 February until around 0700 on 10 February. The events each lasted between 3 and 233 minutes, and were accompanied by rumbling sounds audible with a 10-km radius. Lava fountaining was sporadic during 11-13 February. Lava fountains during phases of both nearly continuous and sporadic activity rose as tall as 400 m, and produced steam plumes up to 2.5 km above the crater that drifted in multiple directions. Lava flows advanced to 3.3 km, 4.5 km, and 900 m in the Mi-isi (S), Bonga (SE), and Basud (E) drainages, respectively. Pyroclastic density currents traveled 4.2-4.6 km in the Mi-isi, Bonga, and Basud drainages. The Alert Level remained at 4 (on a 0-5 scale) and the public was warned to remain outside of the Danger Zone defined as an area within an 8-km radius.
Source: Philippine Institute of Volcanology and Seismology (PHIVOLCS)
PHIVOLCS reported that during 31 January-6 February daily activity at Mayon continued to be characterized by lava effusion from the summit crater, rockfalls, pyroclastic flows (31 January-1 February), ash and steam emissions, advancing lava flows on the flanks, and weak and sporadic lava fountains. Numerous rockfall events were generated by the growing and collapsing summit lava dome and from the front and margins of advancing lava flows. On 31 January pyroclastic flows traveled as far as 2 km in the Mi-isi (S), Basud (E), and Bonga (SE) drainages. White-to-light-gray ash plumes generally rose to low heights, though five events generated ash plumes that rose as high as 1 km above the crater rim. An event on 2 February also produced an ash plume that rose 1 km. The first of two lava fountaining events on 4 February lasted sporadically for 114 minutes, generated an ash plume that rose 500 m, and produced booming sounds heard within a 10-km radius. During 5-6 February high volumes of effused lava extended the lava flows in the Mi-isi, Bonga-Buyuan, and Basud drainages to 3.2, 4.5, and 3 km, respectively. The Alert Level remained at 4 (on a 0-5 scale) and the public was warned to remain outside of the Danger Zone defined as an area within an 8-km radius.
Source: Philippine Institute of Volcanology and Seismology (PHIVOLCS)
PHIVOLCS reported that during 23-29 January there were 2-7 daily episodes of intense and sporadic lava fountaining at Mayon, each lasting 7-74 minutes. The lava fountains rose as high as 600 m above the crater rim, and fed flows in the Mi-isi and Bonga drainages and incandescent rockfalls on the summit area. Ash plumes rose 3-5 km above the crater. As many as three pyroclastic flows each day were detected by the seismic network, and had runout distances exceeding 5 km in the Buyuan drainage. Numerous rockfall events were generated by the growing and collapsing summit lava dome and traveled into the Bonga drainage, and from the front and margins of the advancing 3-km-long lava flow on the Mi-isi drainage. The Buyuan lava flow was 1 km long. Sulfur dioxide gas emissions were between 1,252 and 2,466 tonnes/day during 23-25 January. Heavy rain triggered lahars in the Binaan drainage during 28-29 January.
A cycle of energetic lava effusion with sporadic lava fountaining, and pyroclastic flows from lava-collapse events, occurred late on 29 January. The events were mostly visually obscured, and indicated by seismic data. The period began with a large-volume lava collapse at 1950 at the summit crater that generated pyroclastic flows in the Mi-isi and Bonga drainages. Lava fountaining was detected at 2016 and lasted eight minutes. This was followed by large-volume lava effusion that lasted 96 minutes, and was interspersed with sporadic lava fountaining and/or pyroclastic flows. Sporadic lava fountaining was visually and seismically detected until 2306, with lava fountains rising as high as 200 m. Ash plumes rose 1.5 km above the crater. Significant ashfall was reported in Camalig and Guinobatan, Albay before 2100, possibly resulting from the lava fountaining and pyroclastic flows.
Source: Philippine Institute of Volcanology and Seismology (PHIVOLCS)
PHIVOLCS reported that during 16-17 January Mayon’s seismic network recorded 143 lava collapse events associated with rockfalls along the front and margins of advancing lava and pyroclastic flows in the Miisi (S), Matanag (SE), and Buyuan (SE) drainages. These events generated ash plumes that drifted SW. During 17-20 January effusion of lava at the summit and collapse events continued. Two pyroclastic flows traveled around 3 km down the Miisi drainage. Rockfall events were generated by the collapsing lava front and margins of the advancing 3-km-long lava flow in the Miisi drainage, and from the summit into the Matanag, Buyuan, and Bonga (SE) drainages. Ash plumes continued to drift SW. Sulfur dioxide gas emissions were 1,478 tonnes/day on 18 January and 1,131 tonnes/day on 19 January. During 20-21 January there were 14 rockfall events and 10 pyroclastic flows recorded by the seismic network.
During 21-22 January there were 64 rockfall events and one pyroclastic flow recorded. Strombolian activity generated lava fountains 500 and 200 m high at 1045 on 21 January and at 0225 on 22 January, respectively. Ash plumes rose 1.3 km high and drifted SW, causing ashfall in Oas and Guinobatan (12 km SW). Lava flowed more voluminously, adding to the advancing Miisi lava flow (over 3 km long) and feeding two new lava flows on the Bonga and upper Buyuan drainages.
At 1243 on 22 January an eight-minute-long phreatomagmatic event generated a dense, 5-km-high ash plume that drifted W. Ashfall was reported in the municipalities of Guinobatan, Camalig (11 km SSW), Oas, Polangui (20 km WNW), and Iriga City (34 km NW). The event also generated pyroclastic flows that traveled as far as 4 km down multiple drainages including Miisi, Bonga, Buyuan, Basud, San Andres, Buang, Anoling. PHIVOLCS raised the Alert Level to 4 (on a 0-5 scale) and extend the Danger Zone to an 8-km radius. A minor event at 1725 produced a 500-m-high ash plume. Between 2137 on 22 January and 0525 on 23 January there were five episodes of intense and sporadic lava fountaining, each lasting 3-30 minutes. The lava fountains rose 500-700 m high, and generated ash plumes that rose 2.5-3 km above the crater. The events fed lava flows on the Miisi and Bonga drainages, sprayed near-vent lava spatter, and fed incandescent rockfalls around the summit area. The Buyuan lava flow was 200 m long. According to news articles posted on 23 January about 40,000 people have been evacuated, and airports in the cities of Legazpi City (13 km SSE) and Naga (66 km NW), and on the nearby island of Masbate (100 km S) were closed.
Source: Philippine Institute of Volcanology and Seismology (PHIVOLCS)
PHIVOLCS reported that a phreatic eruption at Mayon was detected at 1621 on 13 January, generating an ash plume that rose 2.5 km and drifted SW. The seismic network recorded the event for 1 hour and 47 minutes. Trace amounts of ash fell in Barangays Anoling (4 km S), Sua (6 km SSW), Quirangay (6 km SSW), Tumpa (7 km SW), Ilawod (10 km SSW), and Salugan (9 km SSW) of Camalig, and in Barangays Tandarora (10 km SW), Maninila (18 km S), and Travesia (10 km SW) in Guinobatan. A sulfur odor was noted by residents of Camalig. Rumbling sounds were heard by residents in Anoling. The Alert Level was raised to 2 (on a 0-5 scale). Faint crater incandescence was first observed at 2216. A phreatic eruption began at 0849 on 14 January and lasted about five minutes, and another was detected at 1143 and lasted 15 minutes. Steam-and-ash plumes from both events rose from the crater but were mostly obscured by weather clouds. Anoling residents noted rumbling sounds and a sulfur odor, and minor amounts of ash fell in Camalig.
On 14 January PHIVOLCS raised the Alert Level to 3, noting a marked increase in activity characterized by three phreatic eruptions and 158 rockfall events between 1621 on 13 January and 1925 on 14 January. Bright crater incandescence was evident, signifying growth of a new lava dome and lava beginning to flow on the S flank. The report reminded residents to stay away from the 6-km-radius Permanent Danger Zone (PDZ) and the 7-km Extended Danger Zone (EDZ) on the S flank.
Three collapses of material occurred on 15 January, producing rockfall or small-volume pyroclastic density currents. They were detected by the seismic network at 0941, 1005, and 1107 and lasted five, seven, and eight minutes, respectively. The first two events appeared to have been from collapses of the lava-flow front and generated ash plumes that drifted SW and ashfall in multiple Barangays including Travesia, Muladbucad Grande (8 km W), Maninila, and Masarawag (5 km W) of the Guinobatan municipality, and several Barangays in the Camalig municipality. An ash plume from the third event rose about 1 km above the crater and drifted WSW.
During 15-16 January the new lava dome in the summit crater continued to effuse. Lava flows advanced 2 km down the Miisi drainage (S), and a small-volume flow was emplaced on the upper slopes of the Bonga drainage (SSE). The seismic network recorded multiple events including short-duration lava fountaining, 75 lava-collapse events corresponding to rockfalls along the front and margins of advancing lava, and short pyroclastic flows in the Miisi drainage. Ash plumes from collapse events in the summit crater produced ash plumes that rose 2 km and caused ashfall in Camalig, Guinobatan, and Polangui.
Source: Philippine Institute of Volcanology and Seismology (PHIVOLCS)
On 8 September PHIVOLCS noted that recent changes at Mayon prompted a change in the Alert level from 0 to 1 (on a 0-5 scale). Continuous gas measurements consistently showed increased sulfur dioxide emissions above the baseline level of 500 tonnes/day, sometimes as high as 1,000 tonnes/day, since July. Global Positioning System data and tilt measurements showed a consistent inflationary trend since July, and precise leveling and electronic distance surveys the last week of August also indicated edifice inflation, possibly due to magma movement at depth. An earthquake swarm (146 events) located 10 km SE during 3-6 August likely indicated rock fracturing processes but may or may not be associated with magmatic activity. Steam emissions from the crater ranged from weak to moderate. PHIVOLCS reminded residents of the 6-km-radius Permanent Danger Zone (PDZ) around the volcano.
Source: Philippine Institute of Volcanology and Seismology (PHIVOLCS)
On 19 December PHIVOLCS reported that since the last seismic swarm detected at Mayon on 29 November a general decline in the overall activity was noted. Specifically, for the previous three weeks, seismic activity had declined to an average 2-3 mostly volcano-tectonic earthquakes daily, few low-frequency earthquakes were detected, and a few minor rockfall events occurred; deformation data did not indicate magma intrusion; sulfur dioxide emissions had declined on 2 October to below 500 tonnes/day which is the baseline value during periods of quiescence; no lava flows had been observed since 19 October. The Alert Level was lowered to 2 (on a 0-5 scale). PHIVOLCS reminded residents of the 6-km-radius Permanent Danger Zone (PDZ) around the volcano.
Source: Philippine Institute of Volcanology and Seismology (PHIVOLCS)
PHIVOLCS reported that during 9-16 December white plumes were occasionally observed rising from Mayon's crater and drifted WNW and WSW, sometimes downslope. Three volcanic earthquakes were recorded on 9 December and one was recorded on 11 December. Alert Level remained at 3 (on a 0-5 scale). PHIVOLCS reminded residents of the 6-km-radius Permanent Danger Zone (PDZ) around the volcano and the 7-km Extended Danger Zone (EDZ) on the SE flank.
Source: Philippine Institute of Volcanology and Seismology (PHIVOLCS)
PHIVOLCS reported that during 3-8 December white plumes were occasionally observed rising from Mayon's crater and drifted WSW, SSW, and NW, sometimes downslope. Inclement weather prevented views of the summit on some days. As many as three volcanic earthquakes were recorded per day. Alert Level remained at 3 (on a 0-5 scale). PHIVOLCS reminded residents of the 6-km-radius Permanent Danger Zone (PDZ) around the volcano and the 7-km Extended Danger Zone (EDZ) on the SE flank.
Source: Philippine Institute of Volcanology and Seismology (PHIVOLCS)
PHIVOLCS reported that during 18-25 November white plumes rose from Mayon's crater and drifted WSW, WNW, NE, and SE, often downslope. As many as six volcanic earthquakes and one rockfall event were recorded per day. Sulfur dioxide emissions were below baseline levels. Alert Level remained at 3 (on a 0-5 scale). PHIVOLCS reminded residents of the 6-km-radius Permanent Danger Zone (PDZ) around the volcano and the 7-km Extended Danger Zone (EDZ) on the SE flank.
Source: Philippine Institute of Volcanology and Seismology (PHIVOLCS)
PHIVOLCS reported that during 12-18 November white plumes rose from Mayon's crater and drifted S, SSW, SW, WSW, and WNW, often downslope. As many as three volcanic earthquakes and one rockfall event were recorded per day. Data from a deformation study conducted during 9-13 November indicated deflation relative to results from a 21-28 October survey, although the volcano remained inflated relative to the baseline. Alert Level remained at 3 (on a 0-5 scale). PHIVOLCS reminded residents of the 6-km-radius Permanent Danger Zone (PDZ) around the volcano and the 7-km Extended Danger Zone (EDZ) on the SE flank.
Source: Philippine Institute of Volcanology and Seismology (PHIVOLCS)
PHIVOLCS reported that during 5-11 November white plumes rose from Mayon's crater and drifted S, SW, WSW, WNW, and NW, sometimes downslope. Weak incandescence from the crater was noted some nights. As many as five volcanic earthquakes were recorded per day. The Alert Level remained at 3 (on a 0-5 scale).
Source: Philippine Institute of Volcanology and Seismology (PHIVOLCS)
PHIVOLCS reported that during 28 October-4 November white plumes rose from Mayon's crater and drifted SW, WSW, WNW, and NW, sometimes down the flanks. Weak incandescence from the crater was noted at night on 28 October. A few volcanic earthquakes and rockfall signals were recorded during 29-31 October and 4 November. A 4 November report noted that ground deformation had been detected since the beginning of 2014. Tilt data from the network on the NW flank indicated continuing inflation since August, subsequent to a period of inflation in June and July. The inflation events were thought to correspond to a magma body, approximately 107 cubic meters, slowly intruding at depth. Precise leveling measurements also indicated sustained inflation. The Alert Level remained at 3 (on a 0-5 scale).
Source: Philippine Institute of Volcanology and Seismology (PHIVOLCS)
PHIVOLCS reported that during 22-28 October white plumes rose from Mayon's crater and drifted SW, WSW, WNW, and NW. A few volcanic earthquakes and rockfall signals were recorded during 23-25 and 28 October. Weak crater incandescence from the crater was noted at night on 22, 25, and 27 October. The Alert Level remained at 3 (on a 0-5 scale).
Source: Philippine Institute of Volcanology and Seismology (PHIVOLCS)
PHIVOLCS reported that during 14-21 October white plumes rose from Mayon's crater and drifted NW, W, WSW, SW, and SE. On 14 October a seismic signal indicating a rockfall was recorded and a brief period of incandescence from the crater was observed. A few volcanic earthquakes were recorded during 18-21 October. On 19 October weak incandescence from the crater was noted. A new lava flow first observed that same day was 300-400 m long on 20 October based on an aerial survey. Weak crater incandescence from the lava dome was again seen on 21 October. The Alert Level remained at 3 (on a 0-5 scale).
Source: Philippine Institute of Volcanology and Seismology (PHIVOLCS)
PHIVOLCS reported that during 8-12 October white plumes rose from Mayon's crater and drifted NW, NE, ESE, SE, and SSW. During an overflight of Mayon on 12 October volcanologists observed a 350-m-long lava flow traveling down the SE flank, on the E side of Bonga Gully. The report noted that the small number of volcanic earthquakes and rockfall signals recorded during the previous few days indicated slow lava extrusion from the crater and a slow-moving lava flow. The Alert Level remained at 3 (on a 0-5 scale).
Source: Philippine Institute of Volcanology and Seismology (PHIVOLCS)
PHIVOLCS reported that during 1-7 October the seismic network at Mayon recorded 0-7 rockfall events per day. White steam plumes drifted SSE, ESE, and NW. Alert Level remained at 3 (on a 0-5 scale).
Source: Philippine Institute of Volcanology and Seismology (PHIVOLCS)
PHIVOLCS reported that during 24-30 September the seismic network at Mayon recorded 0-9 volcanic earthquakes and 1-6 rockfall events per day. White steam plumes drifted SW and NW. According to a news article, the Albay Public Safety and Emergency Management Office noted that more than 54,000 people were in evacuation shelters. The Alert Level remained at 3 (on a 0-5 scale).
Sources: Philippine Institute of Volcanology and Seismology (PHIVOLCS); ABS-CBN News
PHIVOLCS reported that during 16-17 September the seismic network at Mayon recorded 38 volcanic earthquakes and 277 rockfall events. Bright incandescence from the crater was visible at night, and rolling incandescent rocks in the uppermost part of Bonga Gully indicated that the lava dome was breaching the SE part of the crater. The Alert Level was raised to 3 (on a 0-5 scale). PHIVOLCS recommended enforcement of the 6-km radius Permanent Danger Zone (PDZ) around the volcano and the 7-km Extended Danger Zone (EDZ) on the SE flank. On 17 September a news article indicated that almost 24,000 people from villages within an 8-km radius from the crater had been evacuated.
During 17-18 September the network recorded 142 volcanic earthquakes and 251 rockfall events. Although rain clouds prevented visual observations of the crater, white steam plumes drifting SSW were noted. The network recorded 38 volcanic earthquakes and 277 rockfall events during 18-19 September; cloud cover prevented visual observations. During 19-21 September four volcanic earthquakes along with 8-22 rockfall events per day were recorded. White steam plumes drifted ENE and NNE during 20-21 September. During 21-23 September three volcanic earthquakes per day and 13-18 rockfall events per day were recorded; white steam plumes drifted NNE, NE, ENE, and SW.
Sources: Philippine Institute of Volcanology and Seismology (PHIVOLCS); Associated Press
PHIVOLCS reported Mayon’s earthquakes, rockfall events, and an inflationary trend from leveling surveys on 15 September. A noticeable escalation occurred later that day, including 39 rockfall events and 32 low-frequency volcanic earthquakes. Crater glow became visible around 2000 and PHIVOLCS released an informational bulletin at 2200 announcing Alert Level 3. On 16 September incandescent rockfalls spread to the upper reaches of Bonga Gully on the SE flank.
News reports highlighted the evacuation orders announced by the governor of Albay province, which included the 6 km permanent danger zone surrounding the volcano; an assisted evacuation was enforced for the 6-8 km extended danger zone. In an interview with the press, the governor noted that some residents had already fled their homes in Guinobatan (11.8 km SW) on the evening of 15 September.
Sources: Philippine Institute of Volcanology and Seismology (PHIVOLCS); ABS-CBN News
During 27 August-2 September PHIVOLCS reported no incandescence from Mayon, despite the emergence of a summit dome, slight ground deformation, and increased volcanic gas emission. Precise leveling surveys measured the third week of August showed inflationary changes in the edifice since a survey in February 2014. On most days seismic instruments recorded several rock falls and a few earthquakes. Observers noted moderate emission of white steam plumes that drifted SW, WSW, NE, SSW, NNW, WNW, and NW. The Alert Level remained at 2 (on a scale of 0-5).
Source: Philippine Institute of Volcanology and Seismology (PHIVOLCS)
During 20-26 August PHIVOLCS reported no incandescence at Mayon, despite the emergence of a summit dome, slight ground deformation, and increased volcanic gas emission. On most days seismic instruments recorded a few rock falls and sparse earthquakes. During 20-25 August observers noted moderate emission of white steam plumes that drifted SW, WSW, NE, ENE, and SSW. The Alert Level remained at 2 (on a scale of 0-5).
Source: Philippine Institute of Volcanology and Seismology (PHIVOLCS)
During 13-19 PHIVOLCS reported growth of the new summit dome, slight ground deformation, and increased volcanic gas emission at Mayon. On 16-17 August a few rockfalls and one earthquake were detected. On 16-18 August moderate emission of white steam plumes drifted SE, SW, NNE and NE. PHIVOLCS had raised the Alert Level to 2 (on a scale of 0-5) on 15 August.
Source: Philippine Institute of Volcanology and Seismology (PHIVOLCS)
PHIVOLCS reported that during 5-10 June white to off-white steam plumes that drifted WSW, NW, WNW, NNE, and NE, and occasional bluish fumes, were observed at Mayon. Incandescence emanated from the crater during most evenings into early mornings; cloud cover prevented crater observations during 7-8 and 10-11 June. During 5-6 and 9-10 June the seismic network recorded one volcanic earthquake each period, and during 6-7 June one rockfall signal was detected. The Alert Level remained at 1; PHIVOLCS reminded the public not to enter the 6-km-radius Permanent Danger Zone (PDZ).
Source: Philippine Institute of Volcanology and Seismology (PHIVOLCS)
PHIVOLCS reported that during 30-31 May diffuse, short-lived, bluish, hydrogen sulfide emissions rose from Mayon, and incandescence from the crater was observed. Sulfur dioxide emissions fluctuated between 5 and 388 tonnes per day, remaining below the normal level of 500 tonnes per day. Seismicity was low, while a recently concluded ground deformation survey indicated slight inflation compared to February survey data. Based on the visual observations, and despite that most monitoring parameters remained within baseline levels, PHIVOLCS raised the Alert Level to 1 and reminded the public not to enter the 6-km-radius Permanent Danger Zone (PDZ).
Source: Philippine Institute of Volcanology and Seismology (PHIVOLCS)
At 0800 on 8 May, PHIVOLCS reported that two rockfalls at Mayon had been detected within the previous 24 hours. Seismicity remained within background levels and indicated no increase in overall volcanic activity. The Alert Level remained at 0 and the public was reminded not to enter the 6-km-radius Permanent Danger Zone (PDZ).
Source: Philippine Institute of Volcanology and Seismology (PHIVOLCS)
PHIVOLCS reported that a small phreatic eruption from Mayon occurred at 0800 on 7 May and lasted for 2 minutes and 26 seconds. A gray-to-brown ash cloud rose 500 m above the crater and drifted WSW. Ash fell in areas WNW, affecting the barangays of Muladbucad (10 km WSW), Guinobatan (11 km SW), Nabonton (10 km W), Nasisi (11 km W), Basag (10 km W), Tambo, Ligao City (19 km WSW), Albay (19 km SW), and areas upslope of these barangays. One rockfall was detected. Seismicity and gas emissions remained within background levels and indicated no intensification of activity. The Alert Level remained at 0 and the public was reminded not to enter the 6-km-radius Permanent Danger Zone (PDZ).
According to a news article, the eruption ejected large "room-sized rocks" towards about 30 climbers, killing five and injuring eight.
Source: Philippine Institute of Volcanology and Seismology (PHIVOLCS)
PHIVOLCS reported that since the Alert Level for Mayon was lowered to 1 on 2 March, seismicity decreased, and ground and tilt monitoring data suggested regional faulting and not magmatic intrusion. Steaming from the crater was diffuse and crater incandescence had ceased in March. Sulfur dioxide emissions had decreased to below baseline levels. On 27 November the Alert Level was lowered to 0 and the public was reminded not to enter the 6-km-radius Permanent Danger Zone (PDZ).
Source: Philippine Institute of Volcanology and Seismology (PHIVOLCS)
PHIVOLCS reported that a deformation survey of Mayon conducted during 31 May-4 June showed slight inflation since a 6-10 March survey. White steam emitted from the summit crater during 8-13 June crept down the NW and WNW flanks. Incandescence from the crater was also observed. The Alert Level remained at 1 and the public was reminded not to enter the 6-km-radius Permanent Danger Zone (PDZ).
Source: Philippine Institute of Volcanology and Seismology (PHIVOLCS)
During 25-27 January, PHIVOLCS reported that one volcanic earthquake at Mayon was detected each day by the seismic network. Although cloud cover mostly prevented observation during 25-31 January, emissions of white steam were occasionally observed during cloud breaks. Incandescence from the crater was seen at night during 30-31 January. The Alert Level remained at 1 and the public was reminded not to enter the 6-km-radius Permanent Danger Zone (PDZ).
Source: Philippine Institute of Volcanology and Seismology (PHIVOLCS)
PHIVOLCS reported that a deformation survey of Mayon conducted in November and December 2010 showed inflation since a survey in 2008. During 18-25 January, up to two daily volcanic earthquakes were detected by the seismic network. Although cloud cover often prevented observations of the summit area, white steam emissions from the crater and nighttime crater incandescence were occasionally observed. The Alert Level remained at 1 and the public was reminded not to enter the 6-km-radius Permanent Danger Zone (PDZ).
Source: Philippine Institute of Volcanology and Seismology (PHIVOLCS)
On 2 March, PHIVOLCS reported that, after the Alert Level for Mayon was lowered to 2 on 13 January, seismicity remained at normal levels, deflation was measured, and sulfur dioxide emissions were consistent with post-eruption levels. Rising steam and incandescence from the crater was not indicative of any new activity. The Alert level was lowered to 1 and the public was reminded not to enter the 6-km-radius Permanent Danger Zone (PDZ).
Source: Philippine Institute of Volcanology and Seismology (PHIVOLCS)
PHIVOLCS reported that steam emissions were seen rising from Mayon's crater from 5 to 12 January during periods of clearer weather; meteorological clouds often prevented observations of the summit. Weak incandescence from the crater was occasionally seen at night. The majority of the seismic signals originated from rockfalls and detached lava fragments rolling down the flanks. Sulfur dioxide emissions fluctuated between 670 and 1,900 tonnes per day. On 12 January, PHIVOLCS noted that ground deformation measurements showed a deflationary trend compared to a 2 December 2009 survey. These measurements, along with decreased seismicity and sulfur dioxide output, prompted PHIVOLCS to lower the Alert Level to 2 on 13 January.
Source: Philippine Institute of Volcanology and Seismology (PHIVOLCS)
PHIVOLCS reported declining activity at Mayon from 28 December to 2 January. Steam plumes were emitted from the crater, but ash plumes were last seen on 29 December. In addition, the majority of the seismic signals originated from rockfalls and detached lava fragments rolling down the flanks from advancing lava flows. Sulfur dioxide emissions also decreased from close to 9,000 tonnes per day to about 2,600 tonnes per day. PHIVOLCS lowered the Alert Level from 4 to 3, and reminded the public that no human activity should occur within the 6-km radius Permanent Danger Zone (PDZ) around the volcano and the 7-km Extended Danger Zone (EDZ) on the SE flank. During 2-5 January, seismic activity indicated rockfall events related to the detachment of lava fragments at the upper slopes. Cloud cover at the summit prevented observations of steam plumes. Incandescence from the crater at night was noted.
Source: Philippine Institute of Volcanology and Seismology (PHIVOLCS)
PHIVOLCS reported that during 23-29 December about 240 explosions from Mayon were seen during times of good visibility. Off-white, brownish, or grayish ash plumes rose as high as 2 km above the crater rim and drifted W and SW. Lava flowed down the Bonga-Buyuan (SE), Miisi (S), and Lidong (ESE) gullies, and on 29 December was 5.8 km from the summit crater in the Buyuan channel. Intermittent rumbling and booming noises were noted and seismicity continued to be elevated. Detached incandescent fragments descended the flanks. Sulfur dioxide emissions fluctuated between about 2,300 and 9,000 tonnes per day. On 24 December lava fountains rose 500 m above the summit crater. Three pyroclastic flows on 25 December traveled 2 km.
Source: Philippine Institute of Volcanology and Seismology (PHIVOLCS)
PHIVOLCS reported that during 14-19 December sulfur dioxide emissions from Mayon fluctuated between 750 and 2,034 tonnes per day. During 15-16 December, detached fragments from lava accumulating in the summit crater traveled as far as 4 km down the SE-flank Bonga-Buyuan gully, and lava flows traveled 700-800 m. Occasionally detached lava fragments produced small pyroclastic surges down the SW flank that generated light ashfall 13 km S and W in Camalig and Guinobatan, respectively. Steam plumes rose 200 m above the crater rim and drifted SW and WSW. During 17-20 December the seismic network detected 66 explosion-type signals; only 23 events were seen during periods of good visibility. These explosions produced dark gray to dark brown ash plumes that rose 500-2,000 m above the crater rim and drifted SW. Harmonic tremor was detected by the seismic network. Brownish-colored steam and intensified incandescence at night were noted.
On 20 December lava flows had advanced 4.5 km from the crater. PHIVOLCS raised the Alert Level to 4 (on a scale of 0-5) and recommended that the Extended Danger Zone (EDZ) encompass an area 8 km S from the summit and 7 km N from the summit. During 20-22 December the rate and intensity of seismic signals dramatically increased. The sulfur dioxide emission rate also increased; 6,089-6,529 tonnes per day was measured. Booming and rumbling sounds, and intensified crater incandescence, were noted. Lava fountains rose 200 m above the crater and lava flowed as far as 5 km down the Bonga-Buyuan, Miisi, and Lidong gullies.
According to news articles, more than 47,000 people from 30 villages were in evacuation centers across Albay province. About 3,000-6,000 residents had not evacuated.
Sources: Inquirer.net; Philippine Institute of Volcanology and Seismology (PHIVOLCS); Associated Press
According to news articles, PHIVOLCS reported that on 11 December an explosion from Mayon was detected by the seismic network. On 14 December, incandescence emanated from the lava dome in the summit crater and incandescent material traveled as far as 3 km down the S and SE flanks. At least five minor explosions were detected by the seismic network. Some local ashfall was reported. The Alert Level was raised to 3, prompting the order to evacuate about 50,000 people living within an 8-km radius from the base of the volcano.
Sources: The Manila Times; Inquirer.net; Philippine Daily Inquirer
According to news articles, an explosion from Mayon on 11 November prompted authorities to evacuate about 700 families from nearby areas. Incandescence from the crater at night on 14 November was visible from 15 km away.
Source: The Philippine Star
PHIVOLCS reported that on 11 November an explosion from Mayon's summit crater ejected incandescent rock fragments that were seen from nearby areas. Cloud cover prevented observations of an ash plume, however field investigations after the event revealed ashfall to the SW. The Alert Level remained at 2 (on a scale of 0-5). The 7-km Extended Danger Zone (EDZ) on the SE flank and the 6-km Permanent Danger Zone (PDZ) in all other areas remained in effect.
Source: Philippine Institute of Volcanology and Seismology (PHIVOLCS)
PHIVOLCS reported that on 28 October a minor ash explosion from Mayon produced a brownish ash plume that rose 600 m above the crater and drifted NE. The Alert Level remained at 2 (on a scale of 0-5). The 7-km Extended Danger Zone (EDZ) on the SE flank and the 6-km Permanent Danger Zone (PDZ) in all other areas remained in effect.
Source: Philippine Institute of Volcanology and Seismology (PHIVOLCS)
PHIVOLCS reported that 11 earthquakes from Mayon were detected during 14-15 September. Steam plumes drifted NW and ENE and the sulfur dioxide gas output decreased. Faint incandescence was observed at night. On 15 September, three ash explosions produced a brownish plume that rose no more than 700 m above the crater and drifted SW. The Alert Level remained at 2 (on a scale of 0-5). The 7-km Extended Danger Zone (EDZ) on the SE flank and the 6-km Permanent Danger Zone (PDZ) in all other areas remained in effect.
Source: Philippine Institute of Volcanology and Seismology (PHIVOLCS)
According to a news article from 6 August, a volcanologist from PHIVOLCS reported that the number of earthquakes from Mayon had decreased, but the volume of sulfur dioxide emissions had increased sharply during the previous 24 hours. On 4 August, sulfur dioxide was emitted at a rate of 707 tonnes per day, down from 915 tonnes per day on 30 July. The rate increased to 1,977 tonnes per day on 5 August. Authorities declared four villages off-limits to people.
Source: Philippine Daily Inquirer
PHIVOLCS reported that a "cone-shaped pile of hot, steaming old rocks," possibly from a previous eruption of Mayon, were seen during an overflight on 8 July and may be the source of recent summit incandescence. On 9 July, a leveling survey revealed that 1 cm of uplift previously measured during 15-22 June had been sustained. Incandescence at the summit crater had also intensified and was visible from the Lignon Hill Observatory (about 11 km SSE) without the aid of telescopes. Steam emissions were also noted. On 10 July, PHIVOLCS raised the Alert Level for Mayon from 1 (low level unrest) to 2 (moderate unrest) on a scale of 0-5.
Source: Philippine Institute of Volcanology and Seismology (PHIVOLCS)
According to news articles, PHIVOLCS implemented increased monitoring of Mayon after a recent rise in seismicity. Incandescence in the crater and a slight increase in sulfur dioxide gas output over background levels were also noted. The Alert Level remained at 1 (on a scale of 0-5). The 7-km Extended Danger Zone (EDZ) on the SE flank and the 6-km Permanent Danger Zone (PDZ) in all other areas remained in effect.
Source: GMA News
On 10 August, a mild explosion from Mayon produced an ash plume to an altitude of 2.7 km (8,900 ft) a.s.l. and drifted ENE. PHIVOLCS reported that during the previous few weeks seismic activity had increased slightly and incandescence at the crater had intensified. The Alert Level remained at 1. The 7-km Extended Danger Zone (EDZ) on the SE flank and the 6-km Permanent Danger Zone (PDZ) in all other areas remained in effect.
Source: Philippine Institute of Volcanology and Seismology (PHIVOLCS)
According to news articles, the National Disaster Coordinating Council in Manila estimated that 100,000 people still remained in shelters from typhoon Durian that struck on 30 November and triggered lahars down Mayon's flanks. An estimated 1,200 people are dead or missing. Media sources on 9 December reported that approximately 15,000 people from 12 villages were evacuated from areas around Mayon (in Albay province) in anticipation of more lahars following another typhoon. On 11 December, reports indicated that the second typhoon, Utor, had passed Albay without triggering lahars.
Sources: Associated Press; Associated Press; Agence France-Presse (AFP)
A typhoon that struck the Philippines on 30 November mobilized material from the flanks of Mayon that resulted in significant lahars. Several villages around the flanks were buried by up to 1.5 m (5 ft) of debris. Depending on the news source, the death toll ranges from about 325 to 400 and about 300 to 400 people are still missing.
Sources: Associated Press; Associated Press
PHIVOLCS announced the lowering of the Alert status for Mayon from Alert Level 2 to Alert Level 1 on 25 October. The 7-km Extended Danger Zone (EDZ) on the SE flank remained in effect.
Source: Philippine Institute of Volcanology and Seismology (PHIVOLCS)
PHIVOLCS reported that on 11 and 12 October steaming from Mayon was moderate and one volcanic earthquake was recorded.
Source: Philippine Institute of Volcanology and Seismology (PHIVOLCS)
PHIVOLCS reported on 1 October that fumarolic activity from Mayon produced steam plumes that drifted ENE. Intense incandescence was observed at the summit. Observations were not possible 2-3 October due to cloud cover. According to news articles, the Alert Level was lowered to 2 on 3 October.
Sources: The Manila Times; Philippine Institute of Volcanology and Seismology (PHIVOLCS)
In a 27 September report, PHIVOLCS noted continuing volcanic earthquakes, tremor episodes, and intermittent discharge of incandescent lava fragments along with intense glow from the crater. Steaming from the crater was moderate with white plumes drifting SW.
Source: Philippine Institute of Volcanology and Seismology (PHIVOLCS)
Surface activity at Mayon consisted of incandescent lava fragments rolling down the slopes and glow coming from the summit crater. Moderate white steam emissions continued from the summit. The number of daily volcanic earthquakes was low during 20-24 September, with 1-3 events per day. On the 25th there were 14 earthquakes recorded. There were also 114 tremor episodes that day, also a high for the week ending on 26 September. Sulfur dioxide flux remained above normal, between 1,200 and 2,200 metric tons/day.
Source: Philippine Institute of Volcanology and Seismology (PHIVOLCS)
Seismic activity and lava extrusion from Mayon continued to remain low during 13-19 September. Steam plumes from the summit crater reached heights of 300 m above the crater (9,000 ft a.s.l.) and drifted mainly SW, NE, and SE. The Alert Level remained at 3 with a 6-km-radius Permanent Danger Zone and 7 km Extended Danger Zone on the SE slopes in effect.
Source: Philippine Institute of Volcanology and Seismology (PHIVOLCS)
Seismic activity and lava extrusion from Mayon decreased during 6-12 September. Steam plumes from the summit crater drifted mainly W, N, and E. Ground-deformation measurements showed an overall deflation. On 11 September, the Alert Level was lowered from 4 to 3 (scale is 0-5, 0 referring to No Alert status).
Sources: Reuters; News Balita; Philippine Institute of Volcanology and Seismology (PHIVOLCS)
Occasional explosions at Mayon continued during 30 August-5 September. According to seismic data, four explosions were registered on 31 August. Ashfall was reported in surrounding cities including Tabaco (about 13 km NW) and Guinobatan (about 13 km SW). One small explosion was registered on 3 September. Lava extrusion and collapsing lava-flow fronts on the SE slopes continued to produce blocks and small fragments during the reporting period.
Sources: The Daily Tribune; Inquirer.net; Philippine Institute of Volcanology and Seismology (PHIVOLCS)
According to PHIVOLCS and news reports, lava extrusion and associated rockfalls on the SE slopes of Mayon continued during 23-29 August. On 24 and 28 August, moderate gray-and-white plumes were observed drifting to the NE, SE, and WNW.
Sources: Manila Bulletin; Philippine Institute of Volcanology and Seismology (PHIVOLCS); ABS-CBN News; News Balita
PHIVOLCS reported that explosions from Mayon continued during 16-19 August. On 17 August, ash-and-steam plumes drifted at least 5.3 km NE and reached the town Calbayog, where light ashfall was reported. Lava extrusion and collapsing lava-flow fronts that produced blocks and small fragments on the SE slopes continued during the reporting period. On 18 August, the Mibinit/Bonga valley lava flows reached ~6.8 km SE from the summit. The following day, PHIVOLCS estimated that the volume of erupted volcanic deposits was 36 to 41 million cubic meters.
Source: Philippine Institute of Volcanology and Seismology (PHIVOLCS)
During 9-15 August, explosive activity continued at Mayon after a brief respite on 8 August. Based on interpretations of seismic data, minor explosions during 9-11 and 13-15 August were accompanied by lava extrusion and collapsing lava flow fronts that produced blocks and small fragments. Visual observations were usually obscured by clouds, but on 11 August an ash plume was seen drifting ESE. On 12 August, out of four explosions that occurred, one produced a pyroclastic flow that traveled over the SE and E slopes and generated a plume that rose 500 m high and drifted NE. On 15 August, a brief break in the clouds allowed for a view and confirmation of fresh pyroclastic deposits from activity the previous days. About 40,000 people remained in evacuation centers. The Extended Danger Zone of 8 km in the SE sector was still in effect.
Source: Philippine Institute of Volcanology and Seismology (PHIVOLCS)
PHIVOLCS reported that during 2-8 August, lava from Mayon continued to flow mainly SSE along the Mabinit channel and subsequently over a broad sector of the upper and middle SE slopes. During 17 July-3 August, the volume of lava discharged amounted to 17 million cubic meters. Voluminous steaming accompanied lava extrusion. On 4 August, lava flows extended 30 m beyond the 6-km-radius region designated as the Permanent Danger Zone. Areas SE and E experienced light ash fall on 4 August generated by the collapse of deposits. On 6 August, lava flows spilled into the Bonga Valley, E of the Mabinit Chanel.
The Tokyo VAAC reported an eruption cloud at 2331 that reached an altitude of 3.4 km (11,000 ft) a.s.l. and drifted E. On 7 August, the Alert Level was raised to 4 (scale is 0-5, 0 referring to No Alert status) and the Extended Danger Zone (8 km from the summit) was defined. Three explosions (out of nine in a 24-hour period) at 2236, 2246, and 2249 produced incandescent ejections of lava fragments, ash, gas, and steam. According to news reports, ~40,000 people were evacuated from inside the Extended Danger Zone to 20 evacuation centers on 7 and 8 August.
Sources: Tokyo Volcanic Ash Advisory Center (VAAC); Philippine Institute of Volcanology and Seismology (PHIVOLCS); Associated Press
Lava flows from Mayon in the SE sector of the Bonga gully advanced ~1.35 km during 26 July-1 August to reach a maximum distance of 5.8 km SSE from the summit on 1 August. Smaller lava flows and incandescent blocks descended adjacent gullies. On July 29, light ash accumulation was reported about 12 km S and SE, in Daraga municipality and Legazpi City and vicinity, respectively. Emissions of sulfur-dioxide reached ~12,500 tons per day on 31 July, a record high for the current period of unrest.
Source: Philippine Institute of Volcanology and Seismology (PHIVOLCS)
PHIVOLCS reported that during 19-24 July lava flows from Mayon traveled SSE a maximum distance of 4 km from the summit toward the Bonga gully and branched off to the W and E. Incandescent blocks shed from the toe and margins of the flows were visible at night and traveled SE. Ash plumes generated from the rolling blocks produced light ash fall 8.5 km E of the summit in Sta. Misericordia. On 20 July, pyroclastic flows were observed on the SE slopes prompting ~100 families to evacuate. On 22 July, lava flows advanced SE towards the Mabinit channel. The lava flows were within the 6 km radius Permanent Danger Zone.
Sources: Philippine Institute of Volcanology and Seismology (PHIVOLCS); Gulf News; Agence France-Presse (AFP)
Phreatic eruptions at Mayon on 13 July produced ash that fell up to approximately 5.3 km NE in Calbayog, Malilipot. The Alert Level was raised from 1 to 3 (scale is 0-5, 0 referring to No Alert status) after observers reported lava flows on the SE slopes, the predominant direction for lava flows and rockfalls. On 16 July, a danger zone 6 km from the summit was extended to 7 km in the SE area. Incandescent material was shed from an 800 m long lava flow moving SSE towards Bonga gully on 16 and 17 July. On 18 July, PHIVOLCS reported that the lava flow reached 1 km in length and incandescent boulders rolled 3 km towards the Bonga gully.
Sources: Associated Press; Manila Standard Today; Philippine Institute of Volcanology and Seismology (PHIVOLCS); Associated Press
PHIVOLCS reported that about nine earthquakes related to explosive activity took place at Mayon around 23 February. Cloudy conditions prevented observations of the volcano, but seismic events probably accompanied minor ash explosions. This was supported by reports from residents near the volcano who heard rumbling. The seismic network also recorded two low-frequency volcanic earthquakes associated with shallow magma movement. The sulfur-dioxide flux averaged 1,740 metric tons per day (t/d), similar to values obtained during the last measurement on 28 November 2005. The flux was well above the usual 500 t/d measured at the volcano. Mayon remained at Alert Level 2, with a 6-km-radius Permanent Danger Zone in effect.
Source: Philippine Institute of Volcanology and Seismology (PHIVOLCS)
A minor explosion at Mayon on 21 February at 0941 produced an ash plume that rose to ~500 m above the volcano's crater (or 9,700 ft a.s.l.) and drifted SW. Ash was deposited on the upper slopes of the volcano. The ash emission was accompanied by a small explosion-type earthquake, recorded only by seismographs around the volcano.
Prior to the explosion, an increase in seismicity was recorded at the volcano. Between 1545 on 20 February and 0520 on 21 February, there were 147 low-frequency volcanic earthquakes recorded, considerably above the five or fewer events per day that are normally recorded. Some minor rockfalls were indicated and probably resulted from detachment of lava blocks from the summit. Steaming was observed. No incandescence was visible at the crater due to clouds obscuring the volcano. Mayon remained at Alert Level 2, with a 6-km-radius Permanent Danger Zone in effect. PHIVOLCS expects similar ash explosions in the coming days as magma intrudes the summit area and releases volcanic gases.
Source: Philippine Institute of Volcanology and Seismology (PHIVOLCS)
PHIVOLCS reported on 23 August that an aerial survey of Mayon conducted on 17 August revealed that lava had accumulated within the volcano's summit crater. The lava dome was extruding very slowly and the volume of lava was contained within the crater. PHIVOLCS warned that the volcano remains at Alert Level 2, and that people cannot enter the Permanent Danger Zone of 6 km radius around the volcano.
Source: Philippine Institute of Volcanology and Seismology (PHIVOLCS)
According to a news report, strong rains brought by typhoon Yoyong in the Philippines caused lahars to flow down the stream channels of Mayon, particularly in the Padang settlement, and Legazpi City (~14 km SE of the volcano's summit). The Provincial Disaster Management Officer stated that the lahars would not cause damage to homes or rice fields, and that villagers residing near the volcano were not asked to evacuate.
Source: ABS-CBN News
According to a news report, seismicity increased at Mayon during 18-19 October. Based on information from PHIVOLCS, the article reported that seven low-frequency earthquakes and harmonic tremor were recorded in a 24-hour period.
Source: ABS-CBN News
On 12 September, faint glow was visible at Mayon's summit that coincided with a slight increase in overall background tremor. According to PHIVOLCS, these observations indicated a possible renewed episode of volcanic unrest, probably due to small incremental intrusions of magma at shallow depths that caused the intensified glow at the summit. They reported that small explosions, similar to the events on 3 June and 22 July 2004, may be expected as pockets of gas beneath the crater are suddenly released. There were no significant changes in ground deformation or sulfur-dioxide flux. According to a news report, volcanic material was emitted from Mayon late on 12 September, setting fire to grass on the volcano's slopes. People were reminded to remain outside of the 6-km Permanent Danger Zone. Mayon was at Alert Level 2 (on a scale of 0-5).
Source: Philippine Institute of Volcanology and Seismology (PHIVOLCS)
According to a news article, during the week of 18 July emissions from Mayon deposited ash on two villages near the volcano. Reportedly, a PHIVOLCS scientist stated that the explosions may have occurred due to water contacting hot rocks.
Source: Associated Press
According to a news article, PHIVOLCS reported that three volcanic earthquakes were recorded at Mayon during the week of 9 May, suggesting a renewed period of unrest. In addition, incandescence was visible in the crater and moderate steaming was seen. On 12 May, the sulfur-dioxide flux increased from the normal level of ~500 tons per day to ~1,170 tons. People were reminded not to enter the 6-km-diameter Permanent Danger Zone around Mayon.
Source: ABS-CBN News
According to news reports, the continuing unrest at Mayon led authorities to extend the 6-km-radius Permanent Danger Zone to 7 km in the SE quadrant of the volcano on 13 October. Seismicity and SO2 emissions increased during the previous week. During a 24-hour-monitoring period, ending the night of 17 October, 16 volcanic earthquakes were recorded beneath Mayon's lower flanks. Authorities maintained Alert Level 2 (on a scale of 0-5).
Source: Manila Bulletin
PHIVOLCS raised the Alert Level at Mayon from 1 to 2 (on a scale of 0-5) on 11 October after incandescence was seen in the E portion of the volcano's crater, sulfur-dioxide emission rates increased from ~1,600 tons on 1 October to ~2,380 tons on 9 October, and the number of volcanic earthquakes had been increasing slightly for several weeks. PHIVOLCS believes that slow magma intrusion may be occurring. The 6-km-radius Permanent Danger Zone remained in effect.
Source: Philippine Institute of Volcanology and Seismology (PHIVOLCS)
During 14 August to 18 September, seismicity at Mayon remained within background levels (less than five earthquakes/day). No volcanic earthquakes were recorded after 14 September. Moderate volcanic-gas emissions were observed during most of the report period. The sulfur-dioxide flux remained above baseline repose levels. Mayon remained at Alert Level 1 (on a scale of 0-5), with a 6-km-radius Permanent Danger Zone.
Source: Philippine Institute of Volcanology and Seismology (PHIVOLCS)
On 14 May at 1813 a small and brief explosion at Mayon's summit crater produced a small NW-drifting ash puff that rose less than 100 m above the crater. Two seismic stations recorded this as a small-amplitude event. PHIVOLCS stated that there had been a succession of minor emissions in the past few months and that ongoing unrest may lead to more vigorous activity. The Alert Level remained at 1 (on a scale of 0-5), but PHIVOLCS indicated it would consider increasing the Alert Level if the current pace of unrest is sustained.
Source: Philippine Institute of Volcanology and Seismology (PHIVOLCS)
On 6 May at 0721 a small explosion occurred at Mayon. The brownish ash-and-steam column produced from the explosion rose about 450 m above Mayon's summit crater and drifted SW. No significant seismicity was recorded prior to the explosion. Electronic tiltmeters on the N and S flanks continued to show inflation of the volcanic edifice. Likewise, a leveling survey conducted on 24 April showed a general inflation of the N flank. Mayon remained at Alert Level 1 (on a scale of 0-5). PHIVOLCS emphasized that the 6-km-radius Permanent Danger Zone remained in effect.
Source: Philippine Institute of Volcanology and Seismology (PHIVOLCS)
PHIVOLCS raised the Alert Level at Mayon from 0 to 1 (on a scale of 0-5) after an explosion occurred on 17 March at 1819. The brief burst of ash and steam rose to ~1 km above the summit and drifted WNW. Prior to the explosion no significant seismicity was recorded. During 0900-1100 SO2 emission rates were higher than normal at 890 tons per day (500 tons are normally measured during repose), and electronic tiltmeters on the volcano's N and S flanks indicated a slight inflation of the edifice beginning on 13 March. PHIVOLCS emphasized that the 6-km-radius Permanent Danger Zone was in effect.
Sources: Philippine Institute of Volcanology and Seismology (PHIVOLCS); Associated Press
According to news articles, the Alert Level at Mayon was raised from 0 to 1 (on a scale of 0-5) after increased seismicity and gas emission were recorded. The amount of SO2 emitted increased from ~950 tons/per day during the previous week, to ~2,670 tons on 29 October. Residents near the volcano were notified that they must not enter the 6-km radius Permanent Danger Zone, especially on the SE side of the volcano.
Sources: Associated Press; ABS-CBN News
A continuous decline in volcanic activity has occurred at Mayon since the volcano's Alert Level was reduced from 2 to 1 on 19 October 2001. On 5 February PHIVOLCS further decreased the Alert Level to 0 because all measured parameters had decreased. Incandescence, probably from still-hot residual magma beneath the crater, remained visible at the summit.
Source: Philippine Institute of Volcanology and Seismology (PHIVOLCS)
News reports on 21 November stated that lahars were generated at Mayon after several days of heavy rainfall mixed with unconsolidated material on the volcano's slopes. According to the civil defense, flooding caused more than 4,800 families to be evacuated from their homes.
Source: Philippine Institute of Volcanology and Seismology (PHIVOLCS)
During the week seismicity was relatively low, SO2 emission rates were well above the baseline value of 500 metric tons per day, the edifice was slightly inflated, and steaming and incandescence were occasionally visible at the crater. The volcano remained at Alert Level 3.
Source: Philippine Institute of Volcanology and Seismology (PHIVOLCS)
Volcanic activity remained low at Mayon during 22-28 August. There was relatively little seismic activity, slight inflation, occasional observations of incandescence at the summit, and a moderate amount of steam emitted from the volcano. SO2 emission rates remained well above the baseline value of 500 metric tons per day. PHIVOLCS reminded residents along the banks of major channels that lahars and torrential stream flows during heavy rains could remobilize material from pyroclastic-flow deposits. The volcano remained at Alert Level 3.
Source: Philippine Institute of Volcanology and Seismology (PHIVOLCS)
Volcanic activity remained relatively low at Mayon during the week. Few rockfalls were observed, seismicity was relatively low, incandescence was not visible in the crater, and no inflation was detected at the volcano's summit. SO2 emission rates reflected continuous degassing of residual magma. Because volcanic and seismic activity had been declining for the previous 2 weeks, on 21 August PHIVOLCS decreased the Alert Level at the volcano from 4 (hazardous eruption imminent) to 3 (increased tendency towards eruption). As a consequence, the Extended Danger Zone (EDZ) in the SE returned to the original 6-kilometer radius Permanent Danger Zone (PDZ).
Source: Philippine Institute of Volcanology and Seismology (PHIVOLCS)
A decline in seismic and volcanic activity occurred at Mayon beginning on 8 August. The level of seismicity remained above background, but declined to non-eruptive conditions. The volcano's edifice was less inflated than during previous weeks. Continuing low-level activity in the crater area produced a high SO2 emission rate and visible incandescence. On 9 August PHIVOLCS decreased the Alert Level from 5 (the highest) to 4. The 6-km-radius Permanent Danger Zone and the 7-km-radius Extended Danger Zone remained in effect.
Sources: Inquirer.net; Philippine Institute of Volcanology and Seismology (PHIVOLCS)
Volcanic activity during 1-4 August at Mayon consisted of high SO2 emission, high- and low-frequency harmonic tremor and low-frequency volcanic earthquakes, slight inflation of the edifice, and the ejection of lava fragments up to 100 m above the crater rim. PHIVOLCS stated that activity had decreased since the 26 July eruptions and the volcano was in a mild state of eruption. According to news reports, approximately 26,500 people were still evacuated from their homes near the volcano. Mayon remained at Alert level 5, the highest level.
Sources: Manila Bulletin; Philippine Institute of Volcanology and Seismology (PHIVOLCS); Associated Press
After the pyroclastic-flow producing eruptions on 26 July Mayon entered an effusive eruptive phase. During 27-31 July lava flowed up to 3.75 km toward the SE in the Bonga Gully, accompanied by numerous high-frequency short-duration tremor events caused by rock fragments detaching from the newly deposited lava flow. Incandescence was visible at the crater, and thick steam plumes and occasional short-lived ash emissions were seen. SO2 emission rates were high, with a maximum of 9,900 metric tons measured on 31 July, which was well above the baseline value of 500 metric tons/day. Due to the possibility of further explosions, Alert Level 5 (the highest level) remained in effect. According to news reports, on 31 July officials allowed residents who live outside of the 7-km danger zone to return to their homes.
Sources: Reuters; Philippine Institute of Volcanology and Seismology (PHIVOLCS); Associated Press
Volcanic activity at Mayon was similar to the previous week. During 17-23 July seismicity consisted of four high-frequency and 37 low-frequency earthquakes, and 203 high-frequency short-duration harmonic tremors. An average of 4,100 metric tons per day of SO2 was emitted from the volcano, which was still above the baseline value of 500 metric tons per day. There was an overall deflationary trend and the intensity of incandescence observed at the crater ranged from barely visible to bright. Rockfalls occasionally rolled from the crater SE towards the Bonga Gully. The volcano remained at Alert Level 3 (on a scale of 0-5).
Source: Philippine Institute of Volcanology and Seismology (PHIVOLCS)
Volcanic activity continued to decrease at Mayon during 8-16 July, with low seismicity, occasional SE-directed rockfalls, and a general decrease in SO2 emission rates. Although the volcano's edifice remained slightly inflated, a gradual deflationary trend was detected. The activity decrease led PHIVOLCS to reduce the Alert level from 4 (hazardous eruption imminent) to 3 (increased tendency towards eruption). Authorities removed the 7-km-radius Extended Danger Zone in the SE, but left the 6-km-radius Permanent Danger Zone in effect on a long-term basis.
Source: Philippine Institute of Volcanology and Seismology (PHIVOLCS)
A decrease in volcanic activity began on 3 July that led PHIVOLCS to reduce the Alert Level on 4 July from 5 (hazardous eruption in progress) to 4 (hazardous eruption imminent). In comparison to the previous week SO2 emissions decreased, seismic activity was lower, the rate of inflation of the volcano's edifice decreased, and there was no ash in the steam clouds that emanated from the crater. Alert Level 4 was maintained due to the possibility of minor ash puffs and secondary explosions caused by the contact of water with the voluminous hot lava. The extended danger zone was reduced from 8 km to 7 km in radius. On 4 July ~20,000 people who were evacuated from the most distal parts of the evacuation zone were permitted to return to their homes.
Sources: Philippine Institute of Volcanology and Seismology (PHIVOLCS); Associated Press
After the large eruption on 24 June volcanic activity returned to relatively low levels for several days. During this period, rockfalls dominated the seismic records as lava slowly flowed to the SE down the Bonga Gully. PHIVOLCS reported that due to diminished lava extrusion lava was not expected to reach populated areas. Volcanic activity increased on 29 June when explosions occurred at 1605 and 1702. These explosions generated pyroclastic flows that traveled down the Bonga Gully and generated billowing ash clouds that ascended to ~4 km above the volcano. The pyroclastic flows reached ~3 km to the SE of the summit towards the general direction of Matanag Gully. During the eruption a portion of the Upper Basud Gully in the volcano's eastern sector collapsed. On 1 July, SO2 emission rates were as high as 8,700 metric tons per day, a value about 5-fold higher than on 29 June. By 2 June the rate of SO2 emission greatly decreased to 840 tons per day. PHIVOLCS stated that due to the ongoing significant inflation of the volcanic cone and anomalous rapid decline of SO2 emission rates a high likelihood of continued explosive eruptions in the coming days remains. Accordingly, the hazard status remained in the top category, Alert Level 5 (hazardous eruption in progress).
Sources: Reuters; Philippine Institute of Volcanology and Seismology (PHIVOLCS); Associated Press
A large, pyroclastic-flow producing eruption began at Mayon on 24 June at 1245. The first signs of heightened volcanic activity occurred on 19 June when tremor began that was associated with increased lava extrusion. SO2 emission increased to 6,000 metric tons on 19 June in comparison to an average of 1,700 metric tons per day the previous week. In addition, intense incandescence was observed at the dome and slight inflation was detected. By 23 June lava was rapidly flowing SE along the Bonga Gully towards the town of Mabinit, reaching 3.4 km from the volcano's summit. The same day at 1909 lava fountains rose at least 50 m above the summit crater rim. Due to the increase in activity PHIVOLCS raised the Alert Level to 4 (hazardous eruption possible within days).
On 24 June a series of strong explosions produced ash clouds that rose up to 1 km above the volcano and drifted to the N. At 1245 a pyroclastic flow descended about 4 km SE down the Bonga and Buyuan gullies, generating an ash cloud that ascended to 2.3 km. Beginning at 1644 explosions sent ash clouds to ~5 km above the summit crater. The largest eruption produced an ash cloud that rose to 10 km above the volcano. Ash generated from the pyroclastic flows and from the summit eruptions drifted to the NE towards the town of Malilipot. PHIVOLCS increased the Alert Level to 5 (hazardous eruption in progress) and the danger zone was extended from 7 to 8 km in radius. PHIVOLCS also announced that all areas within the declared danger zone should be immediately evacuated. The areas at greatest risk were near the Mabinit, Bonga, Matanag, and Buyuan gullies. After the large eruptions on 24 June a lull in activity occurred until at least 0630 on 26 June. This interval was marked by a decrease in seismic activity and only three small explosions. PHIVOLCS maintained Alert Level 5 due to the possibility of more explosive volcanic activity.
News agencies reported that ~25,000 residents near the volcano were evacuated on 24 June. Many returned to their homes the following day despite the evacuation order. There were no reports of injuries directly from the eruptions. On 25 June area airports were closed. News articles noted the possibility that rain from a tropical storm in the area could mix with ash and generate dangerous lahars. The provincial government declared a state of calamity in affected areas.
Sources: Reuters; Philippine Institute of Volcanology and Seismology (PHIVOLCS); Associated Press
A high level of high-frequency low-duration harmonic tremor was detected on Mayon that was associated with near-continuous detachment of hot rock fragments from the summit lava dome. In addition, moderate amounts of steam emanated from the crater, crater glow was fair-to-bright, and SO2 emission (average of ~2,700 metric tons per day) was well above the baseline value of 500 metric tons per day. Alert Level 3 remained in effect, prohibiting entry within the 6-km-radius permanent danger zone.
Sources: The Philippine Star; Philippine Institute of Volcanology and Seismology (PHIVOLCS)
Rockfalls, small avalanches, moderate steam emission, and fair-to-bright crater glow dominated the visible volcanic activity at Mayon during the week. Partial lava-dome collapses occurred on 11 June at 1347 and on 12 June at 1819. The 11 June collapse produced a small pyroclastic flow that descended the Bonga Gully, reaching an elevation of 1,480 m and producing a thin ash cloud that drifted to the E. The 12 June collapse sparked a period of vigorous, continuous emission of lava fragments for ~1 hour. During the week up to 198 rockfall events were detected per day. A maximum of 2,700 metric tons of SO2 was measured per day, which was lower than the previous week but above the baseline value of 500 tons/day. Alert Level 3 remained in effect, prohibiting entry within the 6-km-radius permanent danger zone. PHIVOLC warned that residents around the volcano, especially those staying in areas facing the Bonga Gully and the SE sector, should be vigilant and prepared to evacuate at any time.
Sources: The Philippine Star; Philippine Institute of Volcanology and Seismology (PHIVOLCS)
During the week a large amount of high-frequency short-duration harmonic tremor occurred at Mayon. The tremor was associated with the intermittent descent of small lava avalanches and incandescent volcanic material down the Bonga Gully on the SE flank of the volcano. Moderate amounts of steam were observed rising from the summit crater where incandescence was occasionally observed. SO2 emission (up to 2,900 metric tons/day) was above the baseline value of 500 tons/day. Alert Level 3 remained in effect, prohibiting entry within the 6-km-radius permanent danger zone. PHIVOLCS warned that residents around the volcano, especially those staying in areas facing the Bonga Gully and the SE sector, should be vigilant and prepared to evacuate at any time.
Source: Philippine Institute of Volcanology and Seismology (PHIVOLCS)
During the week seismic activity was relatively low at Mayon and was associated with occasional rockfalls that descended to the SE down the Bonga Gully. In addition, moderate steaming occurred, incandescence was occasionally observed at the crater, and SO2 emission (up to 5,700 metric tons/day) was above the baseline value of 500 tons/day. On 28 May at 1036 the seismic network recorded a low-frequency volcanic earthquake that was inferred from seismic data to be associated with an ash puff. The ash puff not visible due to meteorological cloud cover. Alert Level 3 remained in effect, prohibiting entry within the 6-km-radius permanent danger zone. PHIVOLCS warned that residents around the volcano, especially those staying in areas facing the Bonga Gully and the SE sector, should be vigilant and prepared to evacuate at any time.
Source: Philippine Institute of Volcanology and Seismology (PHIVOLCS)
Elevated levels of volcanic activity continued at Mayon. Rockfalls were produced from fragments that were shed off of the summit lava dome. Seismic activity was relatively low. SO2 emission rates were at a very high level of ~7,400 metric tons per day, which is significantly above the baseline value of 500 tons/day. Moderate steaming occurred and Intensity I (faint) and II (fair, visible with the naked eye) incandescence was occasionally observed at the crater. Weak-to-moderate ash-and-steam venting occurred from the lava dome. Electronic distance meter (EDM) data indicated a general, but minor, inflation of the volcanic edifice. Alert Level 3 remained in effect, prohibiting entry within the 6-km-radius permanent danger zone. PHIVOLCS warned that residents around the volcano, especially those staying in areas facing the Bonga Gully and the SE sector, should be vigilant and prepared to evacuate at any time.
Sources: Philippine Institute of Volcanology and Seismology (PHIVOLCS); Associated Press
Volcanic activity increased at Mayon, with a lava dome collapse occurring on 13 May. On 12 May seismographs detected a series of explosions at Mayon's summit crater. The following day the SE-facing portion of the lava dome partially collapsed, leaving a V-shaped opening in the dome. The collapse produced small lava avalanches that reached a maximum runout distance of 300 m down the Bonga Gully. After the collapse, incandescence was observed at the dome and lava fragments fell into the gully. Seismic activity indicated frequent earthquakes, tremor, and explosions. On 14 May rockfalls dominated the seismicity. On 15 May there was a lull in activity, with no rockfalls or lava avalanches occurring. Alert Level 3 remained in effect, prohibiting entry within the 6-km-radius permanent danger zone. PHIVOLCS warned that lava flows and/or pyroclastic flows could be produced in the future and residents just outside of the permanent danger zone should be prepared to evacuate at any time.
Sources: Philippine Institute of Volcanology and Seismology (PHIVOLCS); Agence France-Presse (AFP); Associated Press
At 1848 on 7 May an explosion occurred at Mayon that was recorded by the seismic network on the volcano, but was not observed due to cloudy conditions. After the eruption, faint incandescence was visible at the crater with the naked eye during 1915-1945; the incandescence was graded as level 2 intensity. During the week ending on 29 April there had been a total of 33 low-frequency earthquakes and 12 high-frequency short-duration harmonic tremors. The SO2 flux during the same period averaged 3,100 metric tons/day, which is still significantly above the baseline value of 500 tons/day. Deformation monitoring showed that the volcano was inflated, but the present trend revealed insignificant change. Moderate steaming was typical. The crater was visible, but no glow was observed. Alert Level 3 remained in effect, prohibiting entry within the 6-km-radius permanent danger zone.
Source: Philippine Institute of Volcanology and Seismology (PHIVOLCS)
PHIVOLCS reported that during the week ending on 22 April there had been a total of 42 low-frequency earthquakes and 11 high-frequency short-duration harmonic tremors. The SO2 flux during the same period averaged 3,400 metric tons/day, which is still significantly above the baseline value of 500 tons/day. Deformation monitoring showed that the volcano was inflated, but the present trend revealed insignificant change. Moderate steaming was typical. The crater was visible, but no glow was observed. Alert Level 3 remained in effect, prohibiting entry within the 6-km-radius permanent danger zone.
Source: Philippine Institute of Volcanology and Seismology (PHIVOLCS)
PHIVOLCS reported that during the week ending on 15 April there had been a total of 60 low-frequency earthquakes and 13 high-frequency short-duration harmonic tremors. The SO2 flux during the same period averaged 3,400 metric tons/day, which is still significantly above the baseline value of 500 tons/day. Deformation monitoring showed that the volcano was inflated, but the present trend revealed insignificant change. Moderate steaming was typical. Faint incandescence was observed at the crater using a telescope for approximately an hour on both 16 and 17 April; the incandescence was graded as level 1 intensity. Alert Level 3 remained in effect, prohibiting entry within the 6-km-radius permanent danger zone.
Source: Philippine Institute of Volcanology and Seismology (PHIVOLCS)
PHIVOLCS reported that during the week ending on 8 April there had been a total of 116 low-frequency volcanic earthquakes, six high-frequency volcanic earthquakes, and three high-frequency short-duration harmonic tremors. The SO2 flux during the same period averaged 3,400 metric tons/day, which is still significantly above the baseline value of 500 tons/day. Deformation monitoring showed that the volcano was inflated, but the present trend revealed insignificant change. Moderate steaming was typical. During most of the week no glow was observed at the crater, except during 1915 to 2223 on 10 April when faint incandescence was observed at the crater using a telescope; the incandescence was graded as level 1 intensity. Alert Level 3 remained in effect, prohibiting entry within the 6-km-radius permanent danger zone.
Source: Philippine Institute of Volcanology and Seismology (PHIVOLCS)
The last reported observations of Mayon by the PHIVOLCS occurred on 6 April. At 0754 a small eruption produced an ash puff that reached 200 m above the crater rim before drifting to the WSW. The same day 17 low-frequency volcanic earthquakes were recorded and ~2,600 metric tons of SO2 were measured, a value significantly above the baseline value of 500 tons/day. Deformation monitoring showed that the volcano was inflated, but the present trend revealed insignificant change. The crater was visible, but no glow was observed. Moderate steaming was typical. Alert Level 3 remained in effect, prohibiting entry within the 6-km-radius permanent danger zone.
Source: Philippine Institute of Volcanology and Seismology (PHIVOLCS)
PHIVOLCS reported that during the week ending on 1 April there had been a total of 23 low-frequency earthquakes. The SO2 flux during the same period averaged 2,174 metric tons/day, which is still significantly above the baseline value of 500 tons/day. Deformation monitoring showed that the volcano was inflated, but the present trend revealed insignificant change. The crater was visible, but no glow was observed. Moderate steaming was typical. Alert Level 3 remained in effect, prohibiting entry within the 6-km-radius permanent danger zone.
Source: Philippine Institute of Volcanology and Seismology (PHIVOLCS)
PHIVOLCS reported that during the week ending on 25 March there had been a total of 86 low-frequency volcanic earthquakes with relative amplitudes of 45 mm. The SO2 flux during the same period averaged 2,975 metric tons/day, which is still significantly above the baseline value of 500 tons/day. Deformation monitoring showed that the volcano was inflated, but the present trend revealed insignificant change. The crater was visible, but no glow was observed. Moderate steaming was typical. Alert Level 3 remained in effect, prohibiting entry within the 6-km-radius permanent danger zone.
Source: Philippine Institute of Volcanology and Seismology (PHIVOLCS)
PHIVOLCS reported that during 15 to 19 March, 10-37 low-frequency earthquakes were recorded daily. An average of 2,900 metric tons per day (t/d) of SO2 was recorded during the previous week, which was significantly above the baseline value of 500 t/d. Many days a slight inflationary trend was detected at the volcano's edifice and moderate steaming was seen. No incandescence was observed at the crater. PHIVOLCS warned that instrumental and visual observations suggested that an eruption may occur in the coming weeks and that the volcano remained at Alert Level 3. Observations revealed that the lava dome growing at the summit had overlapped the pre-existing SE rim of the summit crater. Further growth of the lava dome towards the SE could result in rockfalls and avalanches that would be channeled down the SE-flank Bonga Gully. In addition, large pyroclastic flows could occur down the volcano's SE slope.
Source: Philippine Institute of Volcanology and Seismology (PHIVOLCS)
PHIVOLCS reported that during 7 to 13 March, 6-33 low-frequency earthquakes were recorded daily. One SO2 emission measurement was made during the week on 4 March, with a reading of 1,750 metric tons. Like the previous weeks, a slight inflationary trend was detected at the volcano's edifice and weak-to-moderate steaming was occasionally seen. At 1509 on 11 March a brief ash discharge reached a height of 150 m and drifted to the SW. At 1940 the same day faint incandescence was observed at the crater using a telescope; graded as level 1 intensity. Mayon remained at Alert Level 3 (on a scale of 0-5).
Source: Philippine Institute of Volcanology and Seismology (PHIVOLCS)
PHIVOLCS reported that during 28 February to 6 March, 15 to 50 low-frequency earthquakes were recorded daily. An average of 1,855 metric tons per day (t/d) of SO2 was recorded during the previous week, which was significantly above the baseline value of 500 t/d. A slight inflationary trend was detected at the volcano's edifice, no incandescence was observed at the crater, and weak-to-moderate steaming was occasionally seen. Mayon remained at Alert Level 3 (on a scale of 0-5).
Source: Philippine Institute of Volcanology and Seismology (PHIVOLCS)
PHIVOLCS reported that during the week the number of earthquakes recorded at Mayon was similar to the previous week, and lower SO2 emission rates were recorded. Between 6 and 30 low-frequency volcanic earthquakes were recorded daily during 21-26 February. SO2 emission rates decreased from a maximum value of ~3,000 metric tons per day (t/d) on 20 February, to 1,700 t/d on 21 February. The minimum value was ~1,000 t/d on 24 February. During the week there was an inflationary trend at Mayon's edifice and no incandescence was observed at the volcano's crater. Weak-to-moderate steaming was occasionally observed. Mayon remained at Alert Level 3 (on a scale of 0-5).
Source: Philippine Institute of Volcanology and Seismology (PHIVOLCS)
PHIVOLCS reported that activity decreased at Mayon in comparison to the previous week with a slightly lower number of earthquakes and lower SO2 emission rates. Between 19 and 31 low-frequency volcanic earthquakes were recorded daily during 13-20 February. SO2 emission rates decreased from ~7,100 metric tons per day (t/d) on 12 February, to 2,700 t/d on 13 February. The highest SO2 emission rate recorded during the week was 4,800 t/d on 15 February. During the week there was an inflationary trend at Mayon. The volcano was obscured by clouds so that crater glow and steaming activity could not be observed. Mayon remained at Alert Level 3 (on a scale of 0-5). PHIVOLCS reported that they plan to lower the Alert Level to 2 if volcanic activity continues to decrease.
Source: Philippine Institute of Volcanology and Seismology (PHIVOLCS)
The PHIVOLCS reported that volcanic activity remained high at Mayon. Abundant low-frequency volcanic earthquakes associated with dome growth took place on 7, 8, 9, 11, and 12 February and consisted of 29, 30, 29, 45, and 30 events, respectively. Also on 12 February seismometers detected 2 rockfalls. The crater emitted voluminous steam and sulfur, with a maximum of ~7,100 metric tons of SO2 detected on 12 February. Tiltmeters on the volcano's N flank continued to detect slight edifice inflation. On 11 February, PHIVOLCS reported that most of the springs in the E and S quadrants of the volcano showed a decrease in discharge, despite increasing rainfall. Inclement weather prevented observations of the volcano. Mayon remained at Alert Level 3 (on a scale of 0-5).
Source: Philippine Institute of Volcanology and Seismology (PHIVOLCS)
PHIVOLCS reported that numerous shallow earthquakes, high SO2 emission rates, and sustained inflation during the week reflected the active state of the growing summit lava dome. They reported that during the week up to 46 volcanic earthquakes were recorded per day, the SO2 emission rate increased from 2,600 metric tons per day (t/d) on 1 February to 5,330 t/d on 5 February, and electronic tiltmeters on the N flank of the cone continued to detect inflation at the volcano's edifice. Incandescence was visible periodically at the summit. On 1 February, officials recommended that residents of the five towns within the 6-km-radius Permanent Danger Zone evacuate the area. In addition, PHIVOLCS warned residents just outside of the Permanent Danger Zone to be alert for potential hazardous volcanic flows, which may be channeled by rivers and gullies that radiate from the summit. Mayon remained at Alert Level 3 (on a scale of 0-5).
Sources: Reuters; Philippine Institute of Volcanology and Seismology (PHIVOLCS); Agence France-Presse (AFP)
PHIVOLCS reported that the increase in volcanic activity, which has occurred since a lava dome was spotted in Mayon's summit crater on 10 January, led them to raise the Alert Level from 2 to 3 (an increased tendency towards eruption, with magmatic outbursts possible within the coming weeks) on 25 January. During the previous week the monitoring networks had detected numerous volcanic earthquakes, continued inflation at the edifice, and very high gas emission from the summit crater (5,040 metric tons per day). In addition, several ash ejections coincided with earthquakes that originated from beneath the lava dome, which appeared to grow during the week. The ash-laden volcanic plumes typically rose up to 500 m above the crater and generally drifted with the prevailing wind to the WNW and NW.
Sources: Philippine Institute of Volcanology and Seismology (PHIVOLCS); Associated Press
PHIVOLCS reported that activity increased at Mayon during the week and that all indicators suggested that the lava dome in the summit crater was becoming active although no new lava had reached the surface yet. During 17 and 18 January, 36 low-frequency-type volcanic earthquakes occurred over 24 hours, which scientists believed was caused by continued magma movement beneath the summit lava dome. During 19-23 January the number of recorded earthquakes increased to 60 events per day; tiltmeters continued to record inflation; and SO2 emission rates increased to 8,070 tons/day (a more than 4-fold increase from that seen in previous weeks). The Lignon Hill observatory reported that ash-entrained steam briefly erupted from the summit lava dome at 0932 on 22 January accompanied by a volcanic earthquake. The volcano remained at Alert Level 2.
Source: Philippine Institute of Volcanology and Seismology (PHIVOLCS)
An aerial survey by the Philippine Institute of Volcanology and Seismology (PHIVOLCS) on 10 January confirmed the presence of a lava dome inside the summit crater. The lava dome appeared to have a spiny, blocky surface, was emitting voluminous steam, and exhibited slight incandescence. The SO2 emission rate was 2,300 metric tons per day (t/d), high above the 500 t/d level usually observed during quiescent periods. Seismicity related to dome growth remained significant. Deformation measured by electronic tiltmeters on the N flank indicated intrusion of magma into the upper levels of the volcano. Similar activity continued through the 15th. Alert Level 2 (sustained unrest with indications of magmatic activity) remained in effect.
Source: Philippine Institute of Volcanology and Seismology (PHIVOLCS)
The Philippine Institute of Volcanology and Seismology (PHIVOLCS) stated in the 09 January Mayon Bulletin that major monitored parameters strongly suggest that activity is rapidly progressing beyond the usual background conditions at the volcano. Reports by the Ligñon Hill Observatory in Legazpi City disclosed that lava dome growth was occurring at the volcano's summit, with coinciding, slight ground tilt. In addition, voluminous volcanic gases were released from the summit crater, and there was a significant increase in earthquake occurrences for about a week that they believe is related to magma ascent. As of 9 January, near-continuous cloud cover prevented observations of the dome to determine if lava was present in the crater. Because reactivation of the volcano may eventually lead to the production of lava flows or pyroclastic flows, PHIVOLCS put the volcano at Alert Level 2 (increased and sustained volcanic unrest) and maintained the 6-km-radius Permanent Danger Zone.
Sources: Reuters; Philippine Institute of Volcanology and Seismology (PHIVOLCS); Associated Press
Reports are organized chronologically and indexed below by Month/Year (Publication Volume:Number), and include a one-line summary. Click on the index link or scroll down to read the reports.
Increased activity
Information Report 28 (01 July 1968) Increased activity
The following report was received [at] 1847 GMT on 01 July 1968. "24-hour alert with increasing activity of Mayon and new eruption possibly in offing. Observance of increase in amount of steam emission from summit and more apparent crater glow. Also reported increase in tremors recorded by seismograph at site."
Information Contacts: Philippine Volcanology Commission via American Embassy, Manila, Philippines.
Steam and ash emissions followed by mudflows down all flanks
Card 0106 (08 October 1968) Steam and ash emissions; high seismicity
The following report was received [on] 2 October 1968. Reddish-brown ash smoke shot up from Mayon's peak at 1240 today, as the volcano stepped up its steaming activity. Mayon started emitting steam and white smoke at 0900, according to Vicente Belbis, COMVOL observer at the Mayon resthouse.
Seismograph recordings for the past 24-hour period ending at 0600 today showed that Mayon is still giving off volcanic tremors. The seismic level of Mt. Mayon remains high and its crater's emission shows that its activity was above normal. Mayon also puffed out ashes at noon yesterday.
What worried the volcanologists was the accumulated mud which could cascade down the volcano's side in the event of strong rains. Because of the threat of mudflows, they urged the safety measures remain in effect.
Card 0112 (09 October 1968) Decreased activity
The following reprt was received [at] 1300 on 8 October 1968. "Light increase level seismic activity and marked decrease in volume crateral steam emission characterized behavior Mayon for past 24 hours. Apparent that Mayon now at low point activity, which, as in past, usually characterized by ash puffs, crater glow and increase volume steam emission, expected within short period."
Card 0129 (14 October 1968) Moderate steam emissions from crater
The following report was received [on] 14 October 1968. "Mayon Volcano, Philippines. As of 12 October [at] 1100. Moderate crater steam emission persists. Low seismic activity. As of 13 October [at] 1300 steam activity continues in crater. Lull in seismicity. As of 14 October [at] 1200 steam emission now mild, but renewed volcanic microseisms of appreciable magnitude."
Card 0139 (15 October 1968) Moderate steaming and low seismicity; mudflow hazard
The following report was received [on] 15 October 1968. "Mayon status as of 15 October [at] 1415. Continuing moderate steaming in crater. Low seismic activity. Intermittent heavy rains, continuing for third day, soaking old and hardened mudflow to fluid masses. Additional mud and boulders coming from upper slopes. Together they pose greater danger to those inhabiting area. Expect new advances by old mudflow aside from possible fresh flow of mud and boulders from upper slopes."
Card 0142 (16 October 1968) Increased seismicity; mudflows down all flanks
The following report was received [on] 16 October 1968. "16 October 0800 Z Mayon exhibited marked increase seismic activity admidst down rushing of mudflows. Mudflows triggered by intermittent heavy rains seem to have affected all sectors around volcano yesterday afternoon. Initial OMCC report indicated that all known critical areas in the SW, S, and SE sectors hit again.
"NE sector, now only beginning to feel effects of mudflow, had its big river channel near Santo Domingo nearly filled by mud and boulders. Mudflow level now only about a meter below concrete bridge which previously stood 10 meters above riverbed. More mudflows expected as result of continued rain. OMCC and COMVOL repeat warning against mudflows. Concerned should follow maximum precaution."
Card 0144 (17 October 1968) Seismicity continues to rise; most stream channels filled with mud
The following report was received [on] 17 October 1968. "17 October 0500Z. Continued build-up in seismic activity seems to indicate Mayon pulling out of trauma to begin another period of peak activity. Low, heavy rain clouds blanket volcano. Apparent most stream channels already nearly filled with mud and boulders. Continue maximum precaution. Watch for possible mudflows."
Information Contacts: Card 0106 (08 October 1968) Vicente Belbis, COMVOL Observer, Legazpi City, Philippines.
Card 0112 (09 October 1968) Philippine Volcanology Commission via American Embassy, Manila, Philippines.
Card 0129 (14 October 1968) Philippine Volcanology Commission via American Embassy, Manila, Philippines.
Card 0139 (15 October 1968) Philippine Volcanology Commission via American Embassy, Manila, Philippines.
Card 0142 (16 October 1968) Philippine Volcanology Commission via American Embassy, Manila, Philippines.
Card 0144 (17 October 1968) Philippine Volcanology Commission via American Embassy, Manila, Philippines.
Steaming from summit area; faint night glow
Card 0324 (08 January 1969) Steaming from summit area; faint night glow
The following report was received from Kurt Fredriksson, who is at the site of the volcano, on 7 January 1968. "Walked to ash-mud flow south of rest house and climbed to 7,000 feet. All ashes have washed down. Only in protected places, a little left but not clear if material water reworked. Some induration by iron-oxide precipitation. Plenty steam from summit plus many vents mostly south and a little lower. One smoke hole about 100 m below summit on north side. No seismic activity except micro-tremors as recorded by seismograph at rest house. Observed faint glow late at night."
Information Contacts: Kurt Fredricksson, Smithsonian Institution.
Summit crater glow seen in early November; several new steam vents
Summit crater glow was observed between 2002 and 2125 on 6 November from COMVOL observation stations. Glow was continuous and deep red for the first 3 minutes, then became intermittent and yellowish in color. The next day, steam emission, under increased pressure, occasionally varied in volume and intermittently changed from the normal white color to brown. Several new steam vents had formed outside the crater, on the upper flank. Glow was again observed during the night of 8-9 November and volcanic tremor was recorded.
Reference. Moore, J.G., and Melson, W.G., 1969, Nuées ardentes of the 1968 eruption of Mayon volcano, Philippines: BV, v. 33, no. 2, p. 600-620.
Information Contacts: G. Andal, COMVOL, Quezon City.
Glow and harmonic tremor continue
"Crater glow at the summit, observed on 6 November, was followed by increased volcanic tremor 2 days later. Aerial investigations disclosed bluish fumes in the SW portion of the crater. At 0116 on 12 November an imperceptible volcanic earthquake with a rather large double amplitude was recorded, lasting more than one minute. Drying of vegetation on the upper flank (about 1,700 m elevation) was noted on 18 November. On 22 December, 13 large-amplitude volcanic tremors were recorded, accompanied by increased steam emission forming a cauliflower-shaped cloud. Glow, accompanied by volcanic tremor, was continuing as of late January."
Information Contacts: G. Andal, COMVOL, Quezon City.
Moderate eruption: lava flow, ash clouds, and evacuation
"An eruption started at about 2030 on 7 May and gradually increased in intensity, reaching a maximum on 22 May. The event was characterized by weak lava flow extrusion at the start, and at the height of the eruption there was a fascinating night display as incandescent basaltic [andesite] lava flowed down the SW flank. Strong earthquakes were felt at the Mayon Rest House Observatory (on the N flank, elevation 760 m, figure 1) on 26 May, accompanied by voluminous ejection of ash-laden clouds and spattering of incandescent pyroclastic materials. From then on, activity began to decline, punctuated at first by short lulls, which became longer each day until ash ejections, rumblings, and volcanic tremor ceased on 29 May. Small amounts of lava continued to be extruded as of 2 June. This decline in activity suggests that the critical period of the eruption has apparently passed.
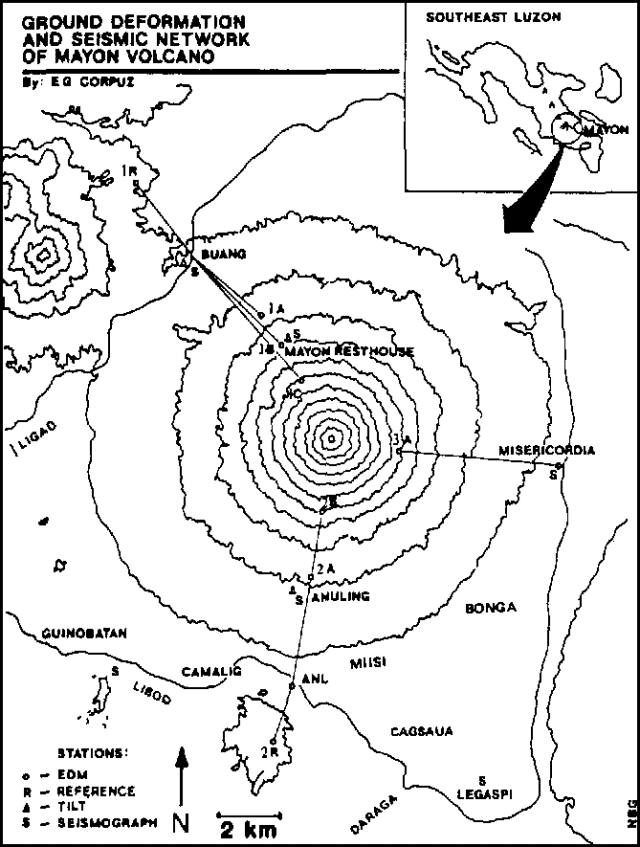 |
Figure 1. Location map of Mayon volcano showing ground deformation and seismic network, after Corpuz (1985). |
"No casualties were reported during the eruption, but 8,000 people on the SW sector of the volcano and within an 8 km radius had to be evacuated. An additional 15,000 people evacuated voluntarily due to their fear of the eruption, even though they were not within the declared danger zone." Activity briefly intensified early on 7 March, when ash-laden clouds and a little incandescent material were ejected.
The following information was provided by Chris Newhall. The new aa lava flow emerged from a breach in the summit crater wall and traveled down the SW flank directly over the 1968 flow. By 26 May, the nose of the new lava was about 200 m beyond the end of the 1968 flow. The breach grew to about 1/3 of the crater's circumference and about 100 m depth before it began to fill in during the later stages of the eruption. Maximum eruption cloud height was about 3 km above the summit. Ash contents were low and maximum ashfalls were only a few millimeters. Harmonic tremor was nearly continuous during the period of maximum activity and shallow explosion earthquakes were also recorded.
Information Contacts: G. Andal, COMVOL, Quezon City; C. Newhall, Dartmouth College.
Lava extrusion ends, but small ash explosions continue
Lava extrusion ended on 6 July, more than a month after activity began to decline. Harmonic tremor had accompanied the extrusion, increasing in magnitude when the lava flow rate increased. Hollow rumbling sounds were occasionally heard. Some ash puffs continued to be ejected, the most recent at 1727 on 21 August, saturating a nearby seismograph. Chemical analysis of the ash and petrographic analysis of the lava both indicated a basaltic andesite composition. COMVOL recommended the return of the last of the evacuees on 7 July, after recommending a partial end to the evacuation several weeks earlier.
Further Reference. Peña, O., 1978, Notes on the Mayon eruption from May 3-July 4, 1978 and COMVOL's role: COMVOL Letter, v. 10, no. 3-4, p. 1-3.
Information Contacts: G. Andal, COMVOL, Quezon City.
Seismic activity and crater glow
Seismic activity and crater glow were observed at Mayon 14-28 July. The same type of activity preceded the 1978 eruption. COMVOL has established a close watch on the volcano and will monitor any changes.
Information Contacts: G. Andal, COMVOL, Quezon City; J. Wolfe, Pan Asean Technical Services, Manila.
Harmonic tremor
Short-duration harmonic tremor began to be recorded at Mayon on 16 August. Bursts of tremor continued, but have become less frequent since the 16th. Similar seismicity preceded the 1978 eruption and accompanied crater glow in July 1979.
Information Contacts: O. Peña, COMVOL, Quezon City.
Occasional tremor episodes through November
Occasional tremor continued through November, and as of the 30th, 214 episodes had been recorded.
Information Contacts: O. Peña, COMVOL, Quezon City.
Steam emission, crater glow, and seismicity
A moderate quantity of dirty white steam rose weakly to 200 m above the crater rim on 4 December at 1247, accompanied by short-duration harmonic tremor on the Mayon Resthouse Observatory seismograph. Faint crater glow was first noted at 2315 the same day. Additional steam emission was observed 12 and 14 December. Episodes of tremor and discrete earthquakes continued through December.
Information Contacts: O. Peña, COMVOL, Quezon City.
Mudflows from typhoon rains
At about 2000 on 30 June, mudflows triggered by continuous rains accompanying Typhoon Daling swept villages in the S and E sectors of Mayon. Preliminary estimates set casualties at about 100 persons with many more missing [but see 6:7].
Information Contacts: O. Peña, COMVOL, Quezon City.
Mudflow casualties updated
Updated casualty figures indicate that the S- and E-flank mudflows triggered 30 June by typhoon Daling killed 40 persons, injured nine, and left seven missing. Other reported casualties were caused by the typhoon itself and associated flooding.
Further Reference. Gianan, O., 1982, A volcano disaster preparedness plan: mechanics of implementation of "Operation Mayon": Proceedings of the First Seminar Workshop on Philippine Volcanoes and Volcanic Terranes, Quezon City, Dec. 1982, p. 88-97.
Information Contacts: O. Peña, COMVOL, Quezon City.
Eruption clouds to 15 km; pyroclastic flows; lava flows
Slow summit lava production started 10 September at 0821, after at least 12 hours of harmonic tremor [but eruptive activity started the previous evening (9:9)]. Activity was dominantly Strombolian 10-11 September. On the 10th, aerial observers reported that lava from the summit crater was slowly spilling over the rim. Incandescent blocks rolled 600 m down the NW flank, destroying or incinerating trees in their path. Ash-laden clouds rose several hundred meters above the summit. PHIVOLCS recommended the evacuation of people living in a danger zone within 8 km of the crater. The next day, ash-laden steam clouds were ejected to heights of as much as 3 km at intervals of 1-5 minutes. The strongest explosion, accompanied by loud detonations, began at about noon, producing a steam and ash column that rose 3 km and deposited as much as 2 cm of ash. Two lava flows about 200 m wide advanced at about 3 m per minute to about 2 km from the summit crater by evening.
Activity intensified and became more Vulcanian in character beginning on the 12th. Pyroclastic flows reached several kilometers from the summit. Nine explosions occurred within 3 hours starting around 1100, sending ash to 14.5 km altitude. The day's strongest explosion, at 1553, sent ash to nearly 15 km altitude. Incandescent tephra was evident in the eruption columns. Smaller explosions took place at 1-5-minute intervals. Sixteen additional "fairly strong" explosions occurred in a 17-hour period ending midmorning 13 September. Activity on the 13th was characterized by persistent ash emission to 3 km above the crater but no large eruption columns were observed. A total of 26 strong explosions ejecting incandescent tephra were recorded in a 12-hour period ending the morning of 14 September. Rain falling on nearby towns deposited 7.5 cm of wet ash. Three lava flows continued to advance down the NW, N, and SW flanks.
More than 16,000 people were evacuated from 36 villages, most of which were within the 8-km danger zone. Nine people were reported killed, eight by burial in volcanic debris and one by hot steam [but note that PHIVOLCS reported in 9:9 that no casualties were directly attributed to the eruption and mudflows].
Information Contacts: R. Punongbayan, PHIVOLCS, Quezon City; UPI; AP; DPA.
Explosive activity reintensifies; 73,000 evacuated
Quoted material is from PHIVOLCS.
"Eruptive activity started 9 September at 1923. Initial activity was dominantly Strombolian, with incandescent spattering at the summit and production of small lava flows. A mound of solidified lava inside the crater blocked the 1968 notch at the SW rim, so the small lava flows and initial pyroclastic flows (see below) moved predominantly NW.
"A fairly strong eruption 10 September at 2300 marked the start of Vulcanian activity. Ash-laden steam clouds rose 5 km above the summit and a pyroclastic flow moved down to the NW, reaching 700 m elevation. Stronger explosions 11 September reopened the notch at the SW rim, so more of the later lava and pyroclastic flows moved SW than NW. The eruption continued to intensify, peaking 13 September. Cauliflower-shaped, ash-laden steam clouds accompanied by rumbling sounds reached a maximum height of 15 km before drifting SW, W, and NW. Continuous volcanic tremors with increasing amplitude were recorded, punctuated by explosion earthquakes. Two lava flows emerged through the SW breach. One reached 500 m elevation, adjacent to and W of the 1978 flow. The other, a little farther W, advanced to 1,400 m elevation (figure 2). The new lava is porphyritic augite-hypersthene andesite.
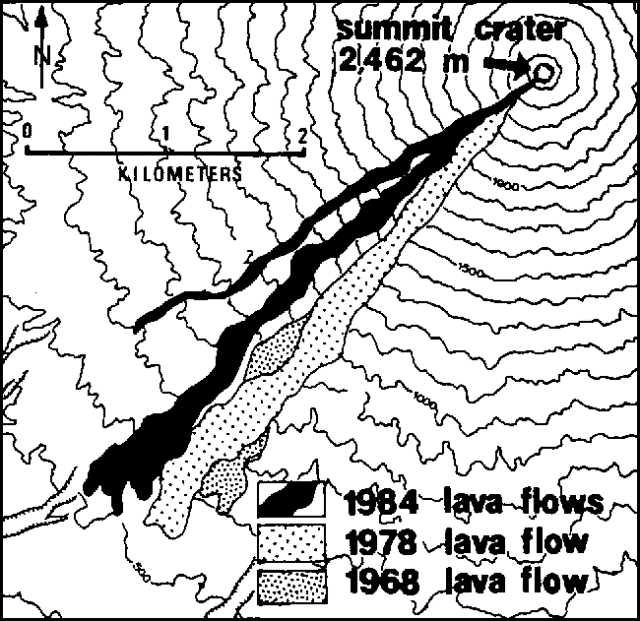 |
Figure 2. Map of Mayon showing the extent of the 1984 lava flows, after Corpuz (1985). |
"Activity gradually declined 14-21 September. A mild eruption 22 September at 0502 was accompanied by a volcanic earthquake felt at intensity II on the MRF scale at the Mayon Resthouse Observatory. A relatively quiet period followed. A very strong explosion 23 September at 0433 ejected voluminous ash-laden steam clouds that reached 10 km in height. Incandescent tephra rose 2 km above the summit and spread in all directions, covering the summit area with red-hot tephra to about 1,500 m elevation. A large notch was formed in the SE rim of the crater and a smaller one in the E rim. Subsequent pyroclastic flows were directed predominantly SE and E, although some moved in other directions along gullies. Ash fell within about 50 km SW, W, and NW of the summit. Areas E and NE of the volcano received most of the fine airfall tephra generated by pyroclastic flows. The eruption continued to intensify until the 24th. Voluminous ash emission, sometimes sustained for 5 minutes, occurred at intervals of 2-15 minutes, accompanied by strong detonations and at times by electrical discharges. Maximum height of the eruption clouds was 15 km. On 24 September at 1614, a nuée ardente [almost] reached the nearest village. A large volume of pyroclastic flow material was deposited on the SE flank. The eruption started to decline 25 September. By 5 October activity was limited to weak steaming and faint to moderate crater glow, accompanied by volcanic tremors and discrete earthquakes."
Press sources reported reintensification of the eruption 6 October. Ash-laden steam clouds rose as much as 1.7 km above the summit and lava flowed 1 km from the crater.
"Mudflows generated by rain destroyed three sections of the Legaspi-Santo Domingo highway roughly 8 km SE of the volcano. Larger mudflows on the 27th overran the same portion of highway. Two bridges were destroyed along the Malilipot-Santo Domingo highway, roughly 8 km E of Mayon."
As of 30 September, press sources reported that 6,500 hectares of farmland had been covered by mudflows.
"Implementation of the Mayon preparedness plan was fairly smooth. On 10 September, the area within 6 km of the summit was declared off-limits and all residents were recommended for evacuation. On 12 September, the danger zone was extended to 8 km from the summit on the S and SW flanks. About 26,000 people were evacuated during the first phase of the eruption. On 23 September, the danger zone was expanded again, to 10 km from the summit on the SE side and 8 km from the summit around the rest of the volcano. All residents of that area were recommended for evacuation and the number of evacuees swelled to more than 73,000 at 50 centers. No casualties were attributed directly to the eruption or mudflows."
Reference. Corpuz, E., 1985, Chronology of the September-October 1984 eruption of Mayon volcano, Philippines in Punongbayan, R.S. (ed.), 1985, Special issue on the 1984 eruption of Mayon: Philippine Journal of Volcanology, v. 2, p. 36-51 (9 papers, 205 p.).
Further Reference. Umbal, J., 1987, Recent lahars of Mayon volcano in Geologic hazards and disaster preparedness systems: National Science and Technology Authority, p. 56-76.
Information Contacts: PHIVOLCS, Quezon City; DPA; AP.
Eruption clouds from 23 September seen on satellite images
Yosihiro Sawada observed a series of plumes from the September 1984 eruption of Mayon (table 1) on images from the GMS satellite. Problems with the scanning system of the GMS limited images to every 6 hours during the spring and summer, and at times prevented data returns from its southern zone of coverage.
Table 1. Series of plumes from the September 1984 eruption of Mayon observed on images from the GMS satellite. Plume lengths and widths were measured from images rather than digital data. Courtesy of Yosihiro Sawada.
| Date | Hour | Density | Width (km) | Length (km) | Movement Direction |
| 09 Sep 1984 | ?14 | diffuse | 30 | 60 | W |
| 11 Sep 1984 | ?14 | diffuse | 50 | 70 | WSW |
| 12 Sep 1984 | ?14 | diffuse | 20 | 60 | W |
| 13 Sep 1984 | ?00 | diffuse | 70 | 110 | SW |
| 13 Sep 1984 | 08 | diffuse | 20 | 70 | SW |
| 13 Sep 1984 | 14 | diffuse | 20 | 90 | SW |
| 15 Sep 1984 | 08 | diffuse | 20 | 70 | NW |
| 15 Sep 1984 | 14 | diffuse | 30 | 40 | NW |
| 16 Sep 1984 | 08 | diffuse | 30 | 70 | W |
| 16 Sep 1984 | 14 | diffuse | 30 | 40 | W |
| 16 Sep 1984 | 20 | diffuse | 30 | 80 | W |
| 17 Sep 1984 | 02 | diffuse | 30 | 40 | W |
| 18 Sep 1984 | 02 | diffuse | 30 | 40 | SW |
| 18 Sep 1984 | 08 | diffuse | 40 | 50 | W |
| 18 Sep 1984 | 14 | diffuse | 30 | 60 | W |
| 18 Sep 1984 | 20 | diffuse | 30 | 60 | W |
| 19 Sep 1984 | 02 | diffuse | 30 | 60 | W |
| 20 Sep 1984 | 02 | diffuse | 40 | 70 | NW |
| 22 Sep 1984 | 02 | diffuse | 40 | 60 | W |
| 23 Sep 1984 | 08 | dense | 40 | 120 | W |
| 23 Sep 1984 | 14 | dense | 80 | 260 | W |
| 23 Sep 1984 | 20 | dense | 40 | 140 | W |
| 24 Sep 1984 | 02 | dense | 40 | 220 | W |
| 24 Sep 1984 | 08 | dense | 80 | 190 | W |
| 24 Sep 1984 | 14 | dense | 70 | 100 | SW |
| 24 Sep 1984 | 20 | diffuse | 70 | 80 | SW |
| 25 Sep 1984 | 02 | diffuse | 40 | 40 | SW |
| 25 Sep 1984 | 08 | diffuse | 40 | 80 | W |
| 25 Sep 1984 | 14 | diffuse | 40 | 60 | NW |
Eruption clouds from Mayon's intense activity 23-24 September appeared much larger and denser on satellite imagery than those from the early- to mid-September activity. A moderate plume on 23 September at 0800 had grown much larger 6 hours later (figure 3, left and right) and plumes remained large and dense through 1400 the next day. Declining activity remained visible until 26 September at 1400.
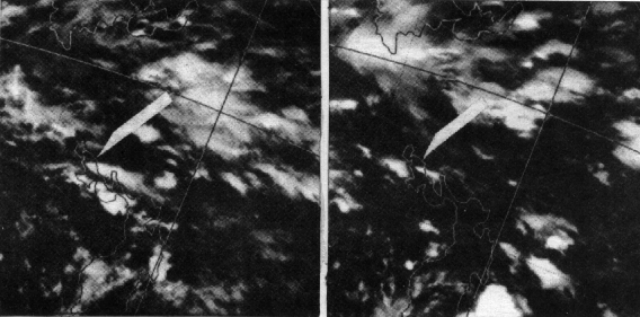 |
Figure 3. GMS infrared satellite images with arrows pointing to eruption clouds from Mayon, 23 September 1984 at 0800 (left) and 1400 (right). Land areas are outlined with fine white lines. Courtesy of Yosihiro Sawada. |
Further Reference. Sawada, Y., 1987, Study on analysis of volcanic eruption cloud image data obtained by the Geostationary meteorological Satellite (GMS): Technical Reports of the Meteorological Research institute (Japan), no. 22, 335 p.
Information Contacts: Y. Sawada, Meteorological Research Institute, Tsukuba, Japan.
Lahars and faint crater glow
Since late 1987, white emissions from Mayon have remained volumetrically moderate, obscuring 20-50% of the crater. Bluish fumes accompanying steam emission were first noted on 26 July and were also seen on 1, 2, and 9 August, moving downslope to the NE and E. On 19 July, there was one report of rumbling noises. A lahar on 14 August (at about 2100) moved SE down Basud, Matanag, and Mabinit gullies and was recorded on the Santa Misericordia Station (SMS) about 8 km E of the crater (figure 4). Field observations indicated that the lahar eroded 1.3 m of the Matanag gully near the Buyuan-Matanag road. Rainfall measured 56.0 mm at the SMS station.
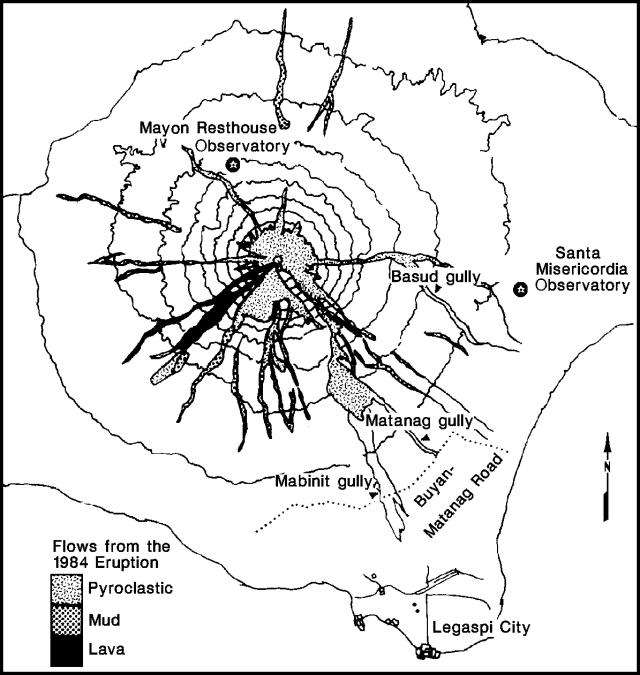 |
Figure 4. Map of Mayon showing gullies affected by the 14 August 1988 lahars and relative positions of seismograph stations. Modified from a PHIVOLCS hazard map, 1984 eruption. |
Faint crater glow was first seen during the night of 15 August from the SMS station and from Bogtong, Legaspi City (12 km SE of the crater). From 16 to 22 August, four high-frequency and 18 low-frequency events were registered by seismographs around the volcano. The water tube tiltmeter readings at the Mayon Resthouse Observatory (3.5 km N of the crater) have indicated an inflationary trend since March 1988.
Information Contacts: PHIVOLCS.
Crater glow; new areas of steaming
Faint crater glow was observed at Mayon almost nightly during September. White steam emission, occasionally accompanied by bluish fumes, remained moderate, occupying 1/2 of the vent area. When PHIVOLCS volcanologists climbed the volcano on 8 September, the crater was 40-50 m deep and new areas of steaming had developed near the summit. A temperature of 285°C was measured at one of several fumaroles. Strong static charges at the summit caused hair to stand on end. On 29 September, a mudflow with a velocity of 2.3 m/s traveled down Basud gully, along the volcano's SE slope.
During September, 36 high-frequency and 31 low-frequency earthquakes were recorded plus 129 low-frequency and 16 high-frequency tremor episodes. From 1 to 9 October, 19 high-frequency and seven low-frequency earthquakes were detected in addition to 71 harmonic tremor episodes.
Information Contacts: PHIVOLCS.
Crater glow and steam emissions continue; mudflow damage
Faint crater glow continued to be observed during nights with good visibility in October and November. Moderate steam emission covered 30-50% of the crater and blue volcanic fumes sometimes moved slowly downslope.
In October and November, 77 high-frequency events, 59 low-frequency events, and 119 harmonic tremor episodes were recorded. Mudflows were detected (by seismographs and by a lahar mapping team) along the SE slopes on 12 and 23 October, and along the SE and SW slopes on 4, 6, 20, and 21 November. The 12 October lahar moved at 2.5 m/s down Basud gully between 2347 and 0141 the next morning. On the 23rd, three lahars with velocities of about 3.2 m/s were triggered by a typhoon. The Basud River was incised by 4 m (near the Lidong-Basud boundary), and a jeep caught by a flow surge along the river was partially buried by debris. Continuous undercutting caused 3-4 m of a cement road to collapse and a house was carried away by a flow. No casualties were reported.
Information Contacts: PHIVOLCS.
Explosion generates pyroclastic flow that kills 68 people; activity continuing
An explosion at 1311 on 2 February generated a pyroclastic flow that traveled 6 km SSE down the Bonga gully and spread out over most of the fan built by 1984 pyroclastic flows. A cauliflower-shaped cloud rose 4.5 km above the summit, and ash fell near Camalig, about 9 km SW. A seismograph 4 km N of the summit recorded the explosion earthquake, which lasted for 6 minutes and 40 seconds, and corresponded with a booming sound. The eruption lasted for about 30 minutes.
Prior to the 2 February eruption, PHIVOLCS conducted visual observations, and seismic monitoring from three permanent stations around the volcano: Mayon Rest House Observatory (MRHO), on the N slope 4 km from the summit; Sta. Misericordia Observatory (SMO), in Sto. Domingo on the E slope 7 km from the summit; and the Lignon Hill Observatory (LHO), in Legaspi City on the SE slope 12 km from the summit. Ground deformation measurements were done at MRHO using a water-tube tiltmeter, a precise leveling line on the N slopes, and two electronic distance meter lines on the N and E slopes. White steam emission varied from wispy to moderate through 1992 and into 1993, with no increase or discoloration prior to the explosion. Seismicity over the same period was usually low, with 0-10 events/day, again with no significant increase before the 2 February event. No inflation or crater glow was observed. PHIVOLCS has since installed six additional seismic stations, with three telemetered seismic stations planned. Teams were also deployed to make ground deformation measurements.
A part of the SE crater rim and/or a block of the wall of the Bonga gully slumped into the gully 1900-1930 on 2 February. There were a few small ash emissions on 3 February. A degassed plug of lava was also growing in the crater, causing incandescent rocks to tumble into Bonga gully. There were two small explosions on 6 February at 0400 and 1600. The one at 0400 produced a small pyroclastic flow. A NOTAM advising all pilots to avoid flying over the area was issued on 4 February. Eruptions larger than the initial explosion occurred on 12 February at 1127 and 1230. The first eruption produced an ash cloud that rose about 1.5 km, and a pyroclastic flow 4 km down the Bonga gully. The second sent an ash cloud to 3 km height and a pyroclastic flow 5 km down the Matanag gully, also on the SE flank of the volcano.
COSPEC measurements from a helicopter detected 1,415 metric tons/day (t/d) SO2 on 3 February. Additional measurements 6, 7, and 8 February were 700, 800, and 900 t/d, respectively.
Press sources have reported at least 68 dead and over 100 injured, almost all resulting from the 2 February pyroclastic flow. No casualties were reported from the 12 February eruptions. An evacuation order has been issued for the area within 6 km of the summit, already off-limits for settlement. Most of the dead were farmers tending crops within the 6 km danger zone. A zone within 10 km on the SE side of the volcano has also been evacuated. The evacuated population was about 60,000 on 17 February.
Information Contacts: PHIVOLCS; AP.
Eruption continues; pyroclastic flows; lava extrusion
Eruptive activity ... continued following the 2 February eruption that killed at least 70 people (18:1). The pyroclastic flow associated with that event traveled 6 km SSE down the Bonga Gully and covered approximately 4 km2 (figure 5). The total volume of the flow, roughly 1-2 x 10⁶ m3, is much less than that of the 1984 pyroclastic flows (30 x 106 m3). As much as half of the volume of the 2 February flow may have been pre-1993 rock that was scoured from the gully as the flow descended. Calculations based on eyewitness accounts suggest an early speed for the flow of >120 km/hour. Up to 5 mm of ash fell 9 km SW of the volcano.
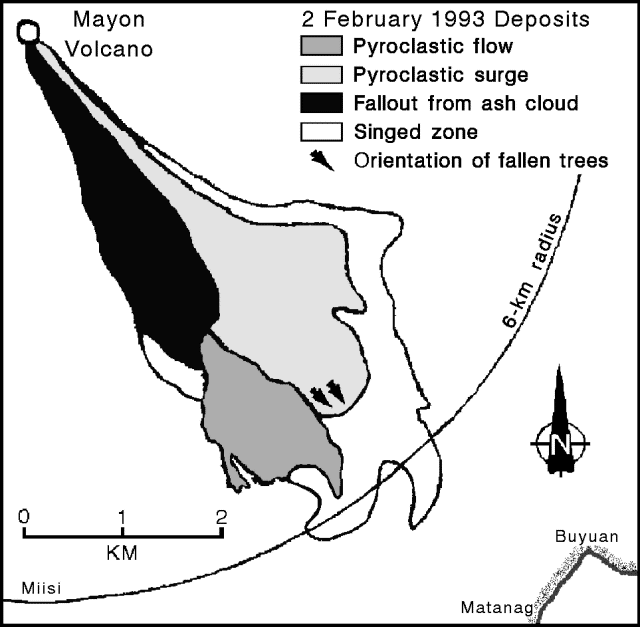 |
Figure 5. Sketch map showing the extent of the 2 February 1993 pyroclastic deposits. Courtesy of PHIVOLCS. |
Between 2 February and 19 March, activity consisted principally of slow lava extrusion, occasional ash puffs (100-500 m high), explosions (figure 6), and small pyroclastic flows generated by the collapse of lava deposits on the steep-sloped summit (table 2). Triggered by explosions or gravity, the collapses resulted in incandescent blocks rolling down the Bonga Gully. When a larger block (103-105 m3) spalled or slumped from the front of the slowly advancing lava flow, it formed a small collapse-type pyroclastic flow that traveled as far as 4 km. Ash columns from the pyroclastic flows rose as high as 1 km above the crater unless strong winds sheared them off at a lower elevation. Such flows occurred on 12-13 February, 28 February-3 March, 10 March, and 15-17 March. On 15 March the number of explosion-type seismic signals increased and a new lava flow was observed at the summit.
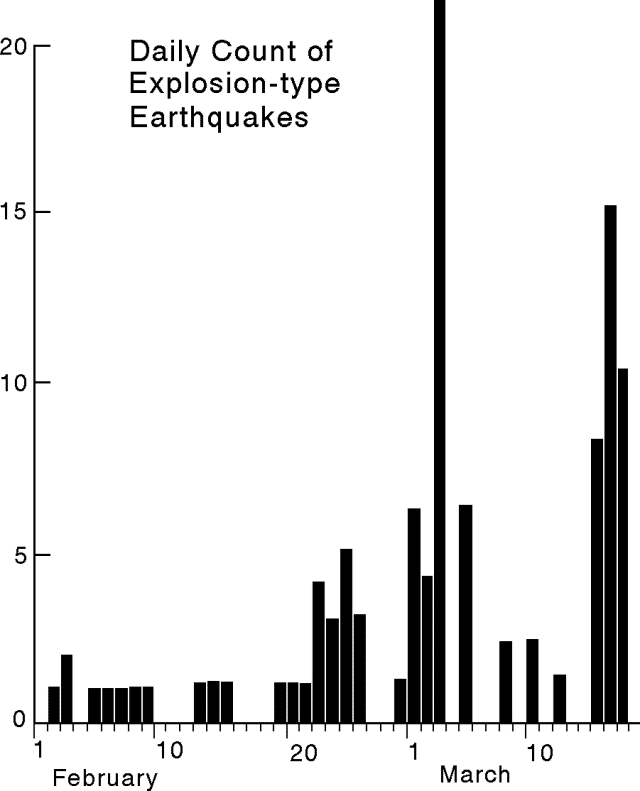 |
Figure 6. Explosion-type earthquake count recorded at Mayon, 1 February to 18 March 1993. Courtesy of PHIVOLCS. |
Table 2. Significant events at Mayon, 6 February-19 March 1993. Courtesy of PHIVOLCS.
| Date | Time | Event |
| 06 Feb 1993 | 0425 | Collapse-type pyroclastic flow travels 3 km. |
| 10-11 Feb 1993 | -- | Intermittent lava extrusion and formation of 200-m-long lava deposit. |
| 12 Feb 1993 | 1126 | Explosion generates a 1.5-km-high ash column. Collapse-type pyroclastic flow travels 3 km. |
| 12 Feb 1993 | 1230 | Explosion generates 3-km-high ash column. Collapse-type pyroclastic flow travels 3 km. |
| 12 Feb 1993 | 1509 | Ash ejection to 1 km. |
| 12 Feb 1993 | 1512 | Ash ejection 1.5 km high; cauliflower-shaped cloud. |
| 12 Feb 1993 | 2100 | Intermittent lava extrusion. |
| 13 Feb 1993 | 0445 | Explosion generates a cauliflower-shaped cloud 1 km high. Collapse-type pyroclastic flow travels 3.5 km. |
| 17-28 Feb 1993 | -- | Intermittent, slow lava extrusion; formation of 200-m-long lava flow. |
| 01 Mar 1993 | 0659 | Collapse-type pyroclastic flow travels 2.5 km. |
| 03 Mar 1993 | 1530 | Explosion-generated 1-km-high ash column. Collapse-type pyroclastic flow travels 4 km. |
| 10 Mar 1993 | 0344 | Collapse-type pyroclastic flow travels 1.5 km. |
| 15 Mar 1993 | 0140 | Start of lava extrusion. |
| 15 Mar 1993 | 2130 | Collapse-type pyroclastic flow travels 1.5 km. |
| 15 Mar 1993 | 2258 | Collapse-type pyroclastic flow travels 1.5 km. |
| 15 Mar 1993 | 2332 | Collapse-type pyroclastic flow travels 2 km. |
| 16 Mar 1993 | 2303 | Collapse-type pyroclastic flow travels 4 km. |
| 17-19 Mar 1993 | -- | Significant increase in the rate of lava extrusion at the summit. Collapse of lava becomes more frequent and produces numerous small collapse-type pyroclastic flows that travel 2-3 km. |
COSPEC measurements of SO2 began on 3 February (figure 7). Temporary decreases to 200-400 t/d on 12-13 February and 28 February were followed by small collapse-type pyroclastic flows. Most measurements after 7 March were ground-based instead of air-based. The ground-based measurements may not record all the SO2 that air-based measurements record because no available roads allow complete, rapid circumnavigation of Mayon. On 10 March, however, the two techniques were cross-checked and their values agreed.
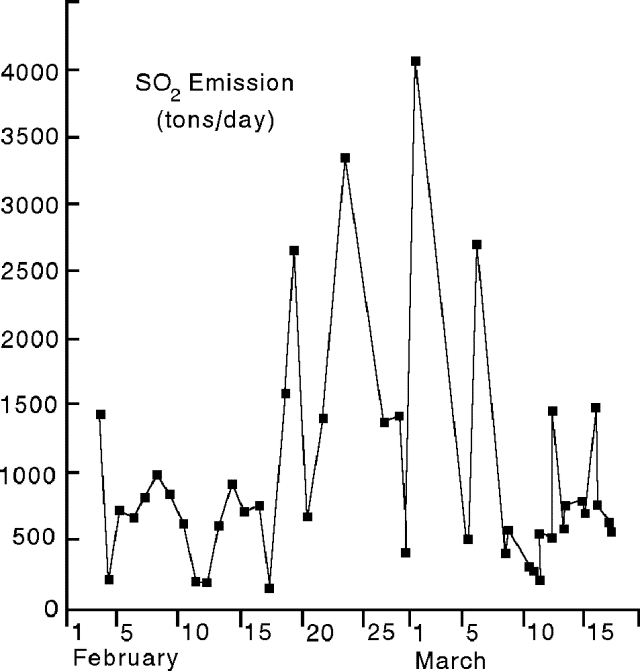 |
Figure 7. COSPEC measurements of SO2 emission at Mayon, 31 January-18 March, 1993. Courtesy of PHIVOLCS. |
During the last half of February, moderate to heavy rains on the SE flank remobilized the new pyroclastic deposits and generated small lahars. All lahars remained essentially confined to the channels.
There were numerous reports of a 2-3 m drop of the water table in the vicinity of Mayon in late 1992 and January 1993 as evidenced by water wells drying or decreasing production. Local observers also stated that similar drops occurred before the 1968, 1978, and 1984 eruptions, but that those drops were not as pronounced as the current one. A climber observed an increase in rockfalls and deepening of the Bonga Gully 6 days before the 2 February eruption but did not report his observations until after the eruption. Just prior to the 1984 eruption of Mayon he had reported a bulging of the normally concave crater floor into a convex dome. A PHIVOLCS observer reported that the temperature of a crater fumarole increased from 97°C in May 1991 to 150°C in July 1992.
Stephen O'Meara observed Mayon from 27 February to 7 March and reported the following.
Three N-S-trending vents or fissures in the summit crater were visible from the ruins near the village of Cagsaua (10 km SE of the summit) on 27 and 28 February. The N vent (also the highest) was the most active. At times the vents were clearly visible; at other times the entire throat of the summit crater was filled with a large, white, cauliflower-shaped cloud that did not rise above the crater. The steam cloud appeared to contain ash on 28 February.
Winds on the morning of 1 March blew the steam plume to Legazpi City, 14 km SE of the summit. It contained a dark gray tinge and smelled of sulfur. At 0700 a slow, silent pyroclastic flow traveled down the Bonga Gully. Simultaneously, a smaller flow moved S down the Miisi Gully. The gray cloud from the Bonga flow appeared to be composed of many segments produced by frequent bursts, but this may have been an illusion caused by strong winds. Ash fell on the S flank of the volcano.
At Arimbay (approximately 2.5 km N of Legazpi City), the smell of sulfur was noticed about 5 minutes prior to the arrival of a lahar at 1530 on 3 March. The knee-deep lahar was warm but not boiling. Approximately 1.5 m of mud, stones, and boulders deposited by previous lahars blocked traffic on the Legazpi-Tabaco road in Arimbay. Also on 3 March, a pyroclastic flow, larger and darker than the one seen on 1 March, "casually" rolled down the Bonga Gully.
On 4 March a reddish brown ash cloud traveled down the Bonga Gully, but did not develop into a strong pyroclastic flow. The cloud remained confined to the upper half of the gully. At 0100 on 5 March a faint crater glow was noticed with just a "spark" coming from the N vent. One small gray ash puff occurred between 0530 and 0730 and was confined to the crater. A reddish-brown ash puff seen in the afternoon also remained in the crater. Crater glow was observed before sunrise on 6 March and a reddish-brown ash puff similar to that observed on 5 March occurred in the early morning. At approximately 0800 on 7 March a larger, darker, gray ash eruption lasted 5 minutes. Nothing traveled down the Bonga, but a tiny pyroclastic flow may have traveled S down the Miisi Gully.
Information Contacts: PHIVOLCS; S. O'Meara, Sky & Telescope, Belmont, MA; Chris Newhall, USGS.
Strombolian eruption; activity wanes
Lava fountaining began on 21 March after almost 2 months of intermittent precursors, including a small, but deadly, phreatomagmatic eruption on 2 February. Following the 2 February eruption, sluggish and intermittent production of lava continued until 19 March when its extrusion rate increased. Several tens of small collapse-type pyroclastic flows on both 19 and 20 March resulted from portions of the flow front detaching and rolling down the steep upper slopes of the volcano. On the night of 21 March, lava fountaining to heights of several hundred meters began, forming a small cone at the head of Bonga Gully where it descends from the summit crater. Most of the lava fell back into the crater and around the vent, but eventually flowed SSE down Bonga Gully. By 26 March the flow front was 4.5 km from the summit, and the estimated volume of lava extruded was 60 x 106 m3, more than half the volume of the 1984 flow. Ash-bearing steam clouds from the fountains rose 2-3.5 km above the crater and deposited a few millimeters of ash on nearby towns. This was less ash than resulted from the pyroclastic flows, which stopped when fountaining began.
The fountaining episodes typically lasted 20 minutes; the longest lasted 50 minutes. They were separated by repose periods lasting 30 minutes to 1 hour. Some episodes were followed by 10-20 minutes of intermittent 2-Hz tremor, the amplitude of which varied greatly suggesting that each tremor episode consisted of a series of tremor events. The tremor did not correlate with any visible steaming. Continuous, strong gas jets, glowing "like a blowtorch" and emitting a continuous "jet plane sound," were visible from Legazpi city, 14 km SE of the summit. They appeared to be in the summit crater, 100-200 m upslope from the vent.
COSPEC measurements of SO2 flux increased from 4,000 metric tons/day (t/d) on 1 March, to 5000 t/d on 24 March. On 26 March, the SO2 flux measured in the morning was 3,920 t/d rising to 7,600 and 8,800 t/d in the afternoon (two sets of measurements).
By 2 April, lava fountaining had ceased, and little or no new material was feeding the flow. Seismicity was low to moderate and dominated by small explosion-type earthquakes. Ash puffs were rare and weak. A single small pyroclastic flow occurred on 1 April, originating in the crater. The glow from the crater persisted, but was considerably dimmer and the gas jets burning in the crater had disappeared. However, SO2 emission remained high and variable, 3,000-8,000 t/d, and the volcano was not deflating.
The lava flow front, still about 5.4 km from the vent, was not expected to advance much farther, having moved only a few meters on 1 April. The flow was confined to Matanag Gully except for a small finger that reached the lower Bonga Channel. Lateral levees and pressure ridges were well defined.
On 9 April a dirty-white steam plume rose only 50 m above the crater rim. At night, a faint glow from the crater was visible. Small "explosion-type" earthquakes, continued; 57 were detected in the 24-hour period beginning at 1700 on 8 April. Most, however, were associated with incandescent materials detaching from the lava deposits in the Bonga Gully. The rate of SO2 emission was 2,272 t/d.
More than 45,000 people fled their homes during the early stages of the eruption, from 2 February to 19 March, filling 43 evacuation centers. An additional 12,000 evacuated their homes as the eruption entered its Strombolian phase on 19-21 March. Since the 2 February event, which killed 75 people, no deaths directly attributable to the eruption have been reported.
Information Contacts: PHIVOLCS; Chris Newhall, USGS; Reuters.
Crater glow and steam emissions
On the evening of 23 August, staff at the Lignon Hill Observatory in Legazpi observed moderate to intense glow from the crater of Mayon. Moderate steam emissions rising ~300 m above the summit preceded the observation of glow. The Philippine Institute of Volcanology and Seismology (PHIVOLCS) increased the Alert Level to 2, indicating that volcanic activity had increased slightly. PHIVOLCS also recommended strict compliance with the 6-km-radius permanent danger zone, an area restricted to regular human activity, especially below the Bonga channel on the SE flank. The PHIVOLCS Quick Response Team was dispatched to augment monitoring staff at the Lignon Hill and Mayon Resthouse observatories.
The summit crater continued to exhibit glow on 25 August, with varying intensity, and there was moderate steam emission. COSPEC measurements of SO2 levels in the steam plume were ~630 metric tons/day (t/d), well above the 100-200 t/d measured during quiet periods. No unusual seismicity was detected. The last sighting of crater glow was on 2 September, although it was not until 12 September that SO2 measurements by COSPEC decreased to near background.
As of mid-September, the dominant seismicity consisted of occasional high-frequency volcanic earthquakes (<5 events/day); they were large enough to be located, and occurred within the E and N parts of the edifice. Observations of the crater area disclosed that some multi-phase events were due to large lava blocks detaching from the vent. The vent is open to the SE as a result of the 1993 explosions. A preliminary investigation of a water well in Malilipot (ENE of the summit) on 25 August revealed a slight decrease in water level, also an indicator of volcanic unrest. However, further measurements of water wells on the SE and S margins of lahar fans around Mayon, where most wells are located, did not show measurable or significant changes. PHIVOLCS therefore concluded that little ground deformation was taking place.
Information Contacts: Ernesto G. Corpuz, Chief of Volcano Monitoring Division, Philippine Institute of Volcanology and Seismology (PHIVOLCS), 5th & 6th Floors Hizon Building, 29 Quezon Avenue, Quezon City, Philippines.
Explosion on 22 June sends a plume to ~10-12 km altitude
At 1658 on 22 June Mayon emitted an ash column that rose 7-10 km above the vent (figure 8). The emission was recorded by the seismic network of the Philippines Institute of Volcanology and Seismology (PHIVOLCS) as an explosion that lasted for 10 minutes. No volcanic earthquakes nor other visible signs of abnormal activity were observed before the explosion. During May, however, low-frequency volcanic earthquakes had been recorded intermittently, accompanied by faint crater glow.
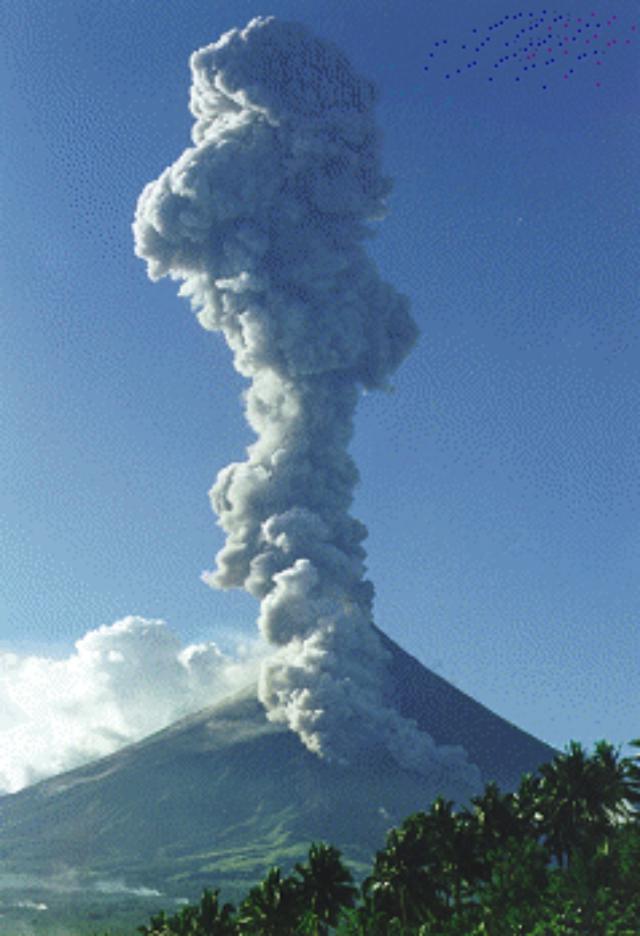 |
Figure 8. A column of steam and ash rising from Mayon's crater and a pyroclastic flow descending its SE flank during its sudden isolated explosion on 22 June. Photograph courtesy of PHILVOCS. |
The explosion represented an isolated event as activity immediately declined to typical incidents of weak steaming without measurable seismicity. Faint glow was seen the next day at the summit crater. An aerial survey noted a new explosion pit at the summit; the small diameter pit was later described as a deep hole lined with sulfur deposits (figure 9). The presence of sulfur suggested that lava had not yet ascended to the surface.
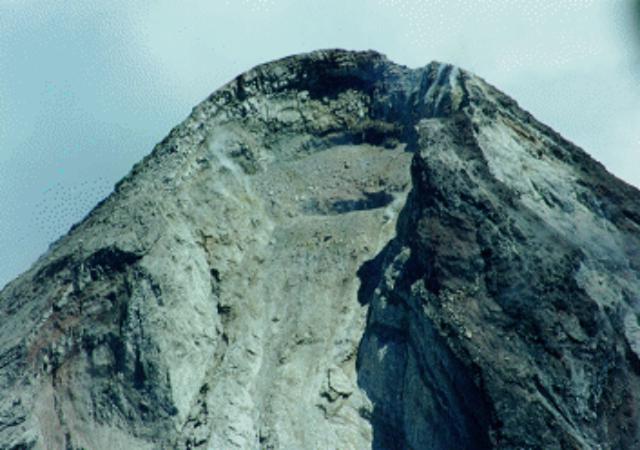 |
Figure 9. The crater of Mayon as it appeared after the 22 June explosion. A new, circular explosion pit developed on the crater floor; the shadow formed along the rim of this pit can be seen in this NW-looking photo shot through the breech. Courtesy of PHILVOCS. |
Beginning at 0700 on 25 June there was a slight increase in seismicity and SO2 emission. The COSPEC measured an SO2 flux of 4,800 tons/day, compared with 4,200 tons/day the previous day. SO2 fluxes normally average 500 tons/day. A short interval of high-frequency tremor was also recorded.
Tremor, light steaming, low-frequency volcanic earthquakes, and elevated SO2 fluxes continued for several days. Also, deformation surveys conducted with laser-ranging EDM equipment indicated sustained inflation on the SE slope.
PHIVOLCS maintained an alert status of "Level 1," advising the public not to venture within 6 km of the summit area (figure 10). In particular, residents were advised to avoid the Bonga pyroclastic fan, an area on the SE side of the volcano that contains a deep canyon and lies directly below the crater rim notch. This fan was the site of most of the fatalities in the 1993 eruption and is considered the area most vulnerable to future pyroclastic flows.
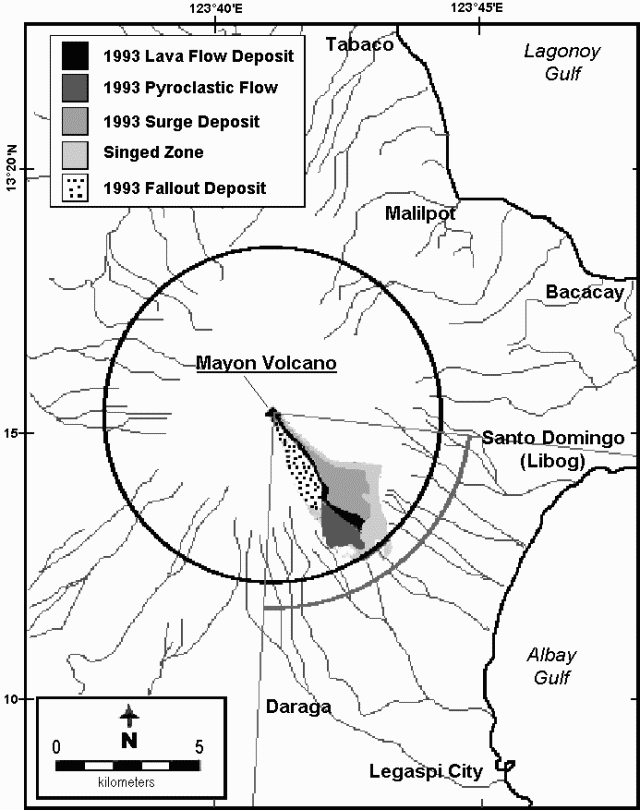 |
Figure 10. Details on Mayon and vicinity taken from a volcanic hazards map (PHILVOCS, 1999). The legend describes some effects of the 1993 eruption. The solid black circle represents the 6-km-radius safety zone currently in effect. An additional 1-km-wide precautionary zone lies to the SE of the volcano below the Bonga Pyroclastic Fan. Some local cities and river drainage are also shown. Courtesy of PHILVOCS. |
Reference. Philippine Institute of Volcanology and Seismology (PHIVOLCS), 1999, 1999 Mayon permanent danger & high susceptibility areas (map), URL: http://www.philonline.com/~seismo/Volcanoes/Mayon/MayonHazMaps.htm.
Information Contacts: Raymundo S. Punongbayan and Ronnie Torres, Philippine Institute of Volcanology and Seismology (PHIVOLCS), C.P. Garcia St. Diliman, Quezon City Philippines (URL: http://www.phivolcs.dost.gov.ph/).
Summit-crater dome growth and escalating eruptions herald evacuations
Mayon stratovolcano, in SE Luzon, entered a period of increasing unrest in May 1999. This has led to significant ash eruptions, lava flows, and pyroclastic flows-and associated rises in the hazard status. On 22 June 1999 an eruption sent an ash plume 10 km above the summit and the volcano continued to exhibit activity that could signify additional eruptions (BGVN 24:06). After this event the hazard status was raised from Alert Level 1 (slight unrest) to Alert Level 2 (moderate unrest, no eruption imminent). Another ash explosion on 5 January 2000 produced a 5-km-high ash column.
A lava dome was spotted growing in the summit crater on 12 February. Accordingly, on the 15th the hazard status was raised to Alert Level 3 (intensifying unrest, magma close to the crater, eruption within weeks). Dome theodolite measurements showed continuing growth and, as of 23 February, the dome was ~74 m wide by ~24 m high. On 19 February, portions of the dome began to glow, presumably as magma forced cracks to open. At the time of this report, the dome already overlapped the SE side of the crater, which was unconfined and open. On 20 February some lava fragments detached from the dome and incandescent rockfalls descended the SE flank, traveling within a large channel called the Bonga Gully.
As of 23 February, PHIVOLCS had recommended evacuation to at least 7 km from the summit in the SE and to at least 6 km elsewhere. The former is a permanent danger zone. Activity continued to increase during the night of 23-24 February, with minor explosions and lava fountaining, prompting a change in the hazard status to Alert Level 4 (hazardous eruption imminent, possible within days) at 0300 on 24 February. No additional evacuation was recommended, but people residing within 8 km of the summit were advised to prepare for evacuation. Later that morning, at 0829, a pyroclastic flow descended the SE flank towards the Bonga Gully. This caused the hazard status to rise to Alert Level 5 (hazardous eruption in progress). Eruptive and seismic activity continued into early March. Additional details will be provided in next month's Bulletin.
Information Contacts: Raymundo S. Punongbayan and Ernesto Corpuz, Philippine Institute of Volcanology and Seismology (PHIVOLCS), C.P. Garcia St. Diliman, Quezon City Philippines (URL: http://www.phivolcs.dost. gov.ph/).
Strong explosions, lava flows, and pyroclastic flows following dome growth
Volcanic unrest that began in May 1999, and intermittent explosive eruptions beginning in June 1999, eventually led to growth of a lava dome on 12 February 2000. By 23 February PHIVOLCS had recommended evacuation to 7 km from the summit in the SE and to 6 km for the rest of the volcano. The latter is a permanent danger zone.
At 2206 on 23 February the seismic network detected an explosion-type earthquake that coincided with rumbling and minor ejection of lava fragments from the summit. This earthquake was followed shortly by bright incandescence, indicating that lava emission and ejection had intensified. Low-frequency volcanic earthquakes then occurred beginning at 2217 and lasting until about 2326 when the seismographs began to record harmonic tremor. The tremor became pronounced at about 0034 on 24 February and was accompanied by minor lava fountaining to 50 m above the summit lava dome. The hazard status was raised to Alert Level 4 (hazardous eruption imminent, possible within days) at 0300 on 24 February. No additional evacuation was recommended, but residents within 8 km of the summit were advised to prepare for evacuation.
At 0826 on 24 February another explosion-type earthquake was recorded by the seismographs at Anoling, Sta. Misericordia, and Mayon Resthouse Observatory. The summit was obscured, but at 0829 a pyroclastic flow descended SE towards the Bonga Gully with a run-out distance of ~7.2 km, reaching the distal end of the Bonga fan. The hazard status was then raised to Alert Level 5, (hazardous eruption in progress). Because pyroclastic flows could continue to sweep down along well-incised gullies and channels, especially the Bonga Gully, PHIVOLCS recommended extension of the danger zone to 8 km along the SE sector of Mayon Volcano. Likewise, ashfall was expected mainly W, SW, and NW of the crater.
The SO2 emission rate increased on 24 February to 4,070-5,700 metric tons/day (t/d). Ground deformation measurements showed that the volcanic edifice swelled significantly in the previous two days, consistent with the growth of the lava dome.
By the morning of 25 February activity was mainly lava extrusion, with a flow channeled along the Bonga Gully. COSPEC readings conducted on 24 February reached 13,500 t/d. The abrupt increase in this value may be attributed to the series of highly gas-charged ash ejections comprising the volcanic plume.
Following a quiet interval that started at 1420 on 26 February, more vigorous activity resumed on the evening of the 27th. Seven ash-and-gas explosions occurred between 1950 and 2237, the most significant of which (at 2144 and 2237) were accompanied by lava fountaining with ejection of volcanic bombs. Large incandescent fragments were ejected to ~500 m above the crater rim. Ground deformation measurements showed that the edifice remained inflated. COSPEC readings of SO2 flux remained significantly above normal at 4,900 t/d. Explosion earthquakes and harmonic tremor accompanied the lava fountaining and persisted even when the activity had apparently subsided.
Explosive eruptions during 28 February-1 March. Mayon had another series of explosive eruptions during 0700 to 2100 on 28 February, with the most significant eruptions occurring at 1641, 1732, and 1940. The first explosion produced a 5-6-km-high eruption column and generated a large pyroclastic flow that descended the W portion of the Bonga Gully on the SE flank and entered the Mabinit channel to the S. This was followed by voluminous eruption clouds beginning at 1732 that rose to ~10 km above the summit and generated multiple pyroclastic flows to the SW, S, and SE. Vigorous explosions sustained the eruption column and discharged large volcanic fragments that splattered the upper portions of the cone. Thick ash clouds hovered around the volcano and created frequent lightning discharges.
Most of the ash clouds were eventually carried to the SW and W, affecting Ligao, Guinobatan, and Camalig. However, the pyroclastic flows did not travel beyond the present danger zones. The ash clouds contained high concentrations of sulfur dioxide, with COSPEC-recorded emission rates of 13,000 t/d, as expected for an eruption cloud. Aircraft were warned to avoid lingering ash clouds to the W of the volcano. The E side, towards the Legaspi airport, remained free from volcanic ash, debris, and SO2 emissions.
Electronic distance measurements revealed that the volcano's edifice remained inflated. Such inflation was thought to be caused by the ascent of magma as indicated by the near-continuous seismic tremor associated with active magma transport.
The series of major ash ejections and subsequent pyroclastic flows that occurred along Bonga Gully, Mabinit, and Miisi Channels started at 1641 on 28 February 2000. The maximum height estimated for the vertical ash plume was 12 km during the 1732 event. The approximate runout of the pyroclastic flows reached to ~5-6 km downslope. Severe ashfall occurred in the SW sector of the volcano, especially at Barangay Tumpa in Camalig and Barangays Maninila and Masarawag in Guinobatan. Lava fountaining with ballistic bombs was also frequently observed starting at 1732 with maximum heights estimated at 1 km.
After the vigorous activities late in the afternoon to early evening on 28 February, only quiet effusion of lava was noted during times when the summit was not obscured through the morning of 29 February.
Another series of ash ejections began at 1211 on 29 February. The largest event occurred at 1501 and produced a 14-km-high eruption column. This event also generated several pyroclastic flows that descended all sides of the volcano. Pyroclastic flows that were channeled by gullies in the SW, S, and SE reached up to 5-6 km from the summit. Smaller pyroclastic flows that followed gullies in other sectors stopped ~2-3 km from the crater. Ash from the tall eruption column and from pyroclastic flows drifted to the W and SW. The ash ejections were generally accompanied by rumbling sounds. Vigorous lava fountaining began at 1531 and ballistic projectiles fell within 1.5 km of the crater. Lava flows were observed on 1 March to have reached the 1,000 m elevation, or about 2.3 km from the summit.
COSPEC measurements on 29 February were hampered by thick ash cover. Ground deformation measurements made the morning of 29 February along the Buang and Masarawag EDM lines showed that the volcano edifice remain inflated. Significant potential was noted for lahars along major tributaries draining from the NW due to the presence of ash and pyroclastic-flow deposits, which could be eroded and remobilized during heavy rainfall.
Mayon exhibited another series of eruptions that began on 1 March and produced dense and highly convective ash columns that rose up to 7 km above the summit. Part of the eruption column would occasionally collapse to produce pyroclastic flows that traveled along major gullies around the volcano. Pyroclastic flows were observed along the main gullies facing Anoling. The largest of these pyroclastic flows occurred along Bonga Gully and traveled ~6 km from the crater, while smaller flows at other gullies descended some 4 km downslope. Explosive eruptions produced lava fountaining with discrete ballistic volcanic fragments hurled out to ~500 m above the crater rim. Frequent rumbling accompanied the explosions, which lasted until 1609. By the end of this episode of explosive activity, quiet lava extrusion followed and continued to be observed up to the present. Areas SW and W of the volcano were severely affected by ashfall with the most significant deposition in Camalig, Guinobatan, and Ligao. Minor ash and steam were continuously being generated by lava deposits from the summit crater and Bonga Gully and drifted to the SW and W areas by prevailing winds.
Lava emission phase. Mayon was relatively quiet during 2 March as the seismic network recorded short-duration harmonic tremors and some discrete low-frequency volcanic earthquakes. This departs from the continuous tremor recorded in the past days during periods of relative quiet. The volcano has apparently entered a phase of lava emission with sporadic episodes of minor ash puffs. Ash and steam emission from both the summit crater and new lava flow deposits produced a haze over the SW sector, particularly in the municipalities of Camalig, Guinobatan, and Ligao. SO2-flux measurements on 2 March yielded a value of 14,500 t/d. Ash clouds derived from the new lava flow deposits apparently produced a significant portion of this emission rate. Ground deformation measurements indicated that the volcano deflated slightly following the 1 March ash ejections.
Lava emission with sporadic episodes of minor ash puffs dominated the eruptive activity on 3 March. This relatively quiet state was reflected in the low-level but significant seismicity comprised by short-duration harmonic tremors and some discrete low-frequency volcanic earthquakes. Thick clouds covered the summit area, but below the cloud line and on the middle and lower slopes of the volcano ash clouds and steam emanated from the new lava flows and pyroclastic-flow deposits. A high emission rate of 8,900 t/d SO2 was measured by COSPEC. Much of the ash and steam clouds resulting from this degassing drifted to the W and SW sections of the volcano due to prevailing winds. The haze produced by fine ash suspended in the air temporarily precluded ground deformation measurements.
Potential exists for hot lahar flows due to the presence of highly erodible pyroclastic deposits, which may be remobilized during heavy rainfall. Gullies with confirmed pyroclastic-flow deposits in their headwaters, which may therefore be sites for future lahars, are the Mabinit and Matanag river channels in Legaspi City, Miisi channel in Daraga, Basud-Lidong channel in Sto. Domingo, San Vicente and Buang channels in Tabaco, and the Bulawan channel in Malilipot.
Short-duration harmonic tremors and low-frequency volcanic earthquakes continued on 4 March. This type of seismicity indicated that eruptive activity was limited to quiet lava emission. Ground deformation measurements showed that the volcano was still inflated in its lower portion, while the SO2 emission rate was determined to be at a minimum of 12,100 t/d. Preliminary estimates of the volume of deposits emplaced by the eruptions yielded at least 40 million cubic meters of lava flow and pyroclastic flow deposits. Lava flow deposits account for the major proportion of this estimate.
Activity for the next day was mainly characterized by gentle outpouring of lava. During cloudbreaks the night of 5-6 March, intense glow from the crater and from some portions of the advancing lava flow along the upper and middle Bonga gully were evident. Rockfalls and minor collapses along the length of the flow contributed to some localized ash and steam emission. However, the majority of the thick volcanic plume came from the summit crater which emitted about 8,300 t/d of SO2. The PHIVOLCS seismic network continued to record short-duration harmonic tremors and low-frequency volcanic earthquakes. Ground deformation measurements showed some slight inflation of the volcano on the lower NW flank. The very high sulfur dioxide emission rate, occurrence of tremor and volcanic earthquakes associated with magma ascent, and slight swelling of the Mayon edifice indicate that some ascent of magma is still ongoing. Due to cessation of explosive eruptions, the sky W and SW of the volcano was generally clear of ash.
During 6 March the volcano exhibited quiet lava effusion accompanied by intense crater glow and rolling incandescent materials along the upper and middle reaches of the Bonga Gully. Moderate to strong emission of steam drifted generally to the N from the summit crater. The high steam output also yielded an elevated SO2 emission rate of at least 8,800 t/d. Seismic activity consisted of 11 low-frequency volcanic earthquakes and 25 episodes of short-duration tremors. Slight inflation of the lower NW flank of the volcano continued.
At 0746 on 7 March, a parallel collapse of the new lava flow deposit in the upper middle slopes produced a voluminous secondary pyroclastic flow. The billowing ash cloud descended the Bonga Gully to the SE.
The seismic network recorded low-frequency volcanic earthquakes and short-duration harmonic tremors on 7 March. The measured SO2 gas emission rate of 3,900 t/d, although low compared to recent measurements, was still well above the volcano's baseline level. Likewise, ground deformation surveys showed that the edifice was slightly inflated. At night on 7-8 March, when the volcano's summit area was visible, intense crater glow continued.
A PHIVOLCS report on the morning of 9 March noted that since the last eruption of 1 March, a waning trend in Mayon's overall activity has been evident. The number of volcanic earthquakes decreased and remained at unremarkable levels. In addition, tremor associated with emission of lava from the crater ceased. Seismic activity only reflected sporadic surface disturbances such as occasional rockfalls caused by oversteepened slopes. The Electronic Distance Meter (EDM) and precise leveling surveys also showed a return to the baseline levels, indicating a probable deflation of the edifice. Mayon continued to vent a large amount of steam, but the SO2 component measured by COSPEC had decreased. Although the summit and isolated spots on the new lava flow deposits continued to glow at night, this incandescence was attributed to residual heat.
In view of these recent developments at Mayon, PHIVOLCS lowered the volcano status to Alert Level 4. On 9 March the 8-km-radius extended danger zone in the SE quadrant was reduced to 7 km. PHIVOLCS emphasized that the 6-km radius Permanent Danger Zones should remain evacuated at all times because of instability of new pyroclastic and lava deposits that may be dislodged towards the lower slopes with resultant secondary explosions and life-threatening secondary pyroclastic flows.
Information Contacts: Raymundo S. Punongbayan and Ernesto Corpuz, Philippine Institute of Volcanology and Seismology (PHIVOLCS), C.P. Garcia St. Diliman, Quezon City Philippines (URL: http://www.phivolcs.dost. gov.ph/).
Decreasing activity; small eruptions, lava flows, secondary pyroclastic flows
Volcanic unrest that began at Mayon during May 1999 led to growth of the lava dome beginning on 12 February 2000, and continued in the form of explosive eruptions from 23 February through 1 March (BGVN 25:02). Since the 1 March 2000 eruption, observations have indicated that activity is declining.
After 1 March activity was relatively quiet with the largest event being an ash puff that was produced on 12 March when hot lava at the summit came in contact with surface water. The ash puff rose to a height of ~1 km and drifted to the NW. After 1 March there was moderate seismicity, high volcanic gas outputs, no increase in ground deformation, continuing glow of the summit, and new lava effusion. These conditions were associated with very gradual return to repose. Therefore on 16 March PHIVOLCS reduced the alert status of Mayan volcano from Alert Level 4 (hazardous eruption imminent, possible within days) to alert Level 3 (less probability of a hazardous eruption).
On 17 March at 1254, 1350, 1609, and 1619 partial collapse of the new lava flow on the volcano's upper middle slopes produced voluminous secondary pyroclastic flows, with the associated ash clouds blown to the SW. On 19 March at 0138, 0203, and 0300 similar secondary pyroclastic flows occurred with ash clouds that blew NE. The billowing ash clouds did not originate from the crater, but from the side of the lava flow that failed on the volcano's upper slope, and from descending detached lava fragments along Bonga Gully. Scientists expected the series of secondary pyroclastic flows due to the instability of volcanic material deposited on steep ground.
After 25 March the number of low-frequency volcanic earthquakes was relatively high (up to 40 per day), presumably due to strong jetting of hot gases emanating from the crater. In addition, relatively high levels of SO2 emissions (up to 9,000 metric tons per day) also occurred after 1 March that were associated with degassing of residual magma. Since the volcano showed no signs of an imminent eruption, on 1 April PHIVOLCS reduced the Alert Level to 2 (the probability of hazardous explosive eruption is minimal). The volcanic system is expected to continue producing earthquakes and to vent a large amount of gas because fresh magma still resides along the whole length of the volcanic conduit and near the summit. Due to the possibility of sudden explosions caused by the release of gas from localized pockets within the magmatic system, and the threat of secondary pyroclastic flows, rockfalls, and ash fallout, PHIVOLCS maintains off-limit zones around the volcano up to 7 km in radius.
Information Contacts: Raymundo S. Punongbayan and Ernesto Corpuz, Philippine Institute of Volcanology and Seismology (PHIVOLCS), C.P. Garcia St. Diliman, Quezon City, Philippines (URL: http://www.phivolcs.dost. gov.ph/).
April 2000-May 2001 summary; dome growth beginning in January 2001
Since the last report (BGVN 25:04), activity was variable at Mayon. The following report covers activity during April 2000-May 2001, but does not include the event that began on 24 June 2001; details of that eruption will appear in a subsequent issue. This report was compiled from reports posted on the Philippine Institute of Volcanology and Seismology (PHIVOLCS) website.
April-June 2000. Mayon's hazard status remained at 2 (on a scale of 0-5) as of 2 April. At that time, no entry was allowed within the 6-km-radius Permanent Danger Zone (PDZ) and the 7-km-radius Extended Danger Zone (EDZ) in the SE sector. Low-frequency (LF) and high-frequency (HF) earthquakes, and short-duration HF tremors, were recorded. Around this time, SO2 flux increased from 3,600 metric tons/day (t/d) to 6,210 t/d. The summit crater emitted a weak to moderate steam plume which drifted WSW. Faint crater glow was observed during the evening. Similar activity continued through the end of April, although the SO2 emission rate had decreased to 4,061 t/d as of 26 April.
Seismicity during 2-3 May included seven LF earthquakes with relative amplitudes of 55-56 mm, but there was no other variation in activity. On May 3 PHIVOLCS raised the Alert Level from 2 to 3. The next Mayon volcano bulletin, issued on 1 June, noted that SO2 flux on 21 May was 680 t/d, slightly above the baseline of 500 t/d.
By 1 June the hazard status had been decreased to Alert Level 0. Seismicity had also decreased markedly; only two HF events and two short- duration HF tremors were reported on 1 June. Crater illumination resumed the same day. SO2 flux readings were not available for the month.
July 2000. On 16 July at 0629 a phreatic explosion occurred that was visible only from the E due to thick clouds on the other sides. The explosion produced a small volume of gray ash as well as steam clouds that rose ~1 km above the summit before drifting NNE. Mayon Volcano Observatory at Ligñon Hill (MVO) seismographs recorded an explosion-type seismic signal that lasted for 1.5 minutes. Tiltmeters at Buang and Mayon Resthouse stations did not, however, detect significant ground movement, which suggested that the explosion was caused by shallow activity.
On 30 July at 1315, Mayon produced a mild ash ejection. MVO reported a small ash plume that rose 1 km. Seismicity associated with the event lasted for about 1 minute. As with the 16 July event, other monitoring, including SO2 flux readings, did not indicate further activity. Mayon's Alert Level was undisclosed for the month.
August-December 2000. A mild ash ejection at 1432 on 31 August sent a small gray ash cloud ~1 km above the summit. An activity update on 1 September noted that small explosions similar to those in July had occurred in the previous weeks. PHIVOLCS suggested that these shallow explosions were probably due to rainwater seepage into the February-March 2000 lava deposits (BGVN 25:04). No further reports were issued in 2000.
January 2001. A resurgence of activity was observed as of [8] January. MVO reported an apparently growing lava dome which emitted voluminous gases from its summit. During the previous week there had been increases in both the number of earthquakes and in tilt, presumably due to magma ascent. [These] events led PHIVOLCS to set the Alert Level to 2.
On 10 January aerial observers noted that the dome appeared to have a spiny, blocky surface, which resulted from the crater floor being pushed upward by rising magma. Slight incandescence was also emanating from the crater. Correlation spectrometer (COSPEC) measurements detected an elevated SO2 emission rate of 2,300 t/d. Seismicity also remained elevated. Ground deformation measured on the N flank continued to indicate tilting. Over the next week, activity remained high. Crater glow, however, was weak, and only visible from a distance with a telescope.
Activity escalated further after 19 January. Sixty seismic events occurred on 20 January, and a high number of earthquakes continued to occur. SO2 flux spiked up to ~8,070 t/d. A brown steam puff rose from the lava dome at 0932 on 22 January. This brief emission of ash-laden steam coincided with a volcanic earthquake. A second ash emission occurred later the same day. Alert Level 3 became effective as of 25 January. Five ash emissions rose from Mayon's summit on 28 January followed by two more the next day. Plumes rose ~500 m and generally drifted WNW or NW. The earthquakes associated with these late January events were noticeably larger than those in previous weeks. Inflation of the edifice was also detected.
February-May 2001. The Alert Level remained at 3 for the entire period; high seismicity and moderate steaming prevailed. Inflationary trends were shown by tiltmeter readings through the end of March, when uplift tapered off slightly. On 24 February a small ash-and-steam plume rose 250 m and was blown ENE. SO2 flux decreased through February with a reading of 2,889 t/d on the 28th. Crater glow was observed rarely during February, and not at all during March.
On 2 April the SO2 flux rose to 7,205 t/d, but then dropped to 444 t/d two days later. SO2 emission rates ranged from ~2,000 to 4,000 t/d during the rest of April. Low-intensity crater glow was observed sporadically during the month. On 7 May more intense crater glow was observed. A small ash emission occurred at 1752 on 11 May and sent material 50 m above the summit.
On 12 May a series of explosions were detected by a seismometer S of the summit. Ash ejection occurred, and late in the day the SE portion of the dome partially collapsed, causing a small lava avalanche that reached ~300 m down into Bonga Gully. Following the avalanche, MVO workers noted incandescence at the dome and continuing rockfalls into the gully. Workers speculated that active magma transport upward toward the crater was increasing.
Rockfalls due to molten lava fragments rolling down from the dome dominated activity during 13-14 May. When conditions cleared briefly on 14 May observers saw that the partial dome collapse had produced a V-shaped gash; this breach was the source of the outpouring lava. Avalanches had reached 500 m downslope as of this date.
Rockfalls and lava emissions ceased on 15 May but resumed the following day. Fresh lava began to refill the previously formed gash. SO2 flux remained high, and tiltmeters detected consistent inflation through 31 May. Similar activity, accompanied by elevated seismicity that included rockfall-induced signals, continued through the month.
Information Contacts: Raymundo S. Punongbayan and Ernesto Corpuz, Philippine Institute of Volcanology and Seismology (PHIVOLCS), C.P. Garcia Avenue, U.P. Diliman, 1101 Quezon City, Philippines (URL: http://www.phivolcs.dost.gov.ph/).
Eruption escalates; pyroclastic flow on 24 June
The following report covers activity during 28 May through most of June 2001, and discusses the high-energy event that began 24 June. This report was compiled from those posted on the Philippine Institute of Volcanology and Seismology (PHIVOLCS) website. Until the evening of 23 June the five-step PHIVOLCS hazard status system for Mayon stood at Alert Level 3, a status that implies a rapid rate of magma supply and that an explosive eruption may occur within weeks. This projection proved true as both the monitored parameters and the vigor or eruptive events rose significantly in late June. A pyroclastic flow on 24 June stimulated the rise to Alert Level 5, and this status remained for all or most of the month. Tables 3 and 5 summarize SO2 flux and seismic data; table 4 describes the qualitative scale of crater glow intensity.
Table 3. SO2 fluxes for Mayon during 28 May through June 2001; questionable values that were ambiguously referred to in the daily report appear in parentheses. Mayon's stated baseline values have been ~ 500 metric tons per day (tons/day). Values were measured by COSPEC. Taken from reports posted on the PHIVOLCS website.
| Date | SO2 flux (metric tons/day) |
| 30 May 2001 | 2,406 |
| 31 May 2001 | 2,924 |
| 01 Jun 2001 | (2,900) |
| 08 Jun 2001 | 4,312 |
| 10 Jun 2001 | 4,115 |
| 11 Jun 2001 | 2,358 |
| 13 Jun 2001 | 1,956 |
| 14 Jun 2001 | 936 |
| 18 Jun 2001 | 4,664 |
| 19 Jun 2001 | 5,978 |
| 20 Jun 2001 | 5,652 |
| 21 Jun 2001 | 9,448 |
| 25 Jun 2001 | (4,640) |
| 26 Jun 2001 | 3,620 |
| 27 Jun 2001 | 4,002 |
| 29 Jun 2001 | 1,674 |
Table 4. Qualitative scale of the intensity of crater glow used at Mayon. Through mid-June, crater glow fell into one of the first three categories; heightened activity led to stronger glow and Intensity IV was introduced; it was first reported for the evening of 23 June. Crater glow was often mentioned in daily reports, sometimes with descriptions of the incandescent part(s) of the dome or lava flows. Courtesy of PHIVOLCS.
| Intensity | Crater glow |
| I | Faint crater glow |
| II | Fairly visible with naked eye |
| III | Bright |
| IV | Intense |
Table 5. Mayon seismic data at Upper Anoling station as posted on daily reports in June, with the relative amplitudes shown in parentheses where clearly stated. Dashes are used to represent undisclosed values. "Tremor" refers to short-duration high-frequency harmonic tremor linked to rockfalls. Some intervals of continuous tremor appeared in late June as noted in the comments. Courtesy of PHIVOLCS.
| Date | High-frequency earthquake | Low-frequency earthquake | Tremor | Comment |
| 01 Jun 2001 | 1 (4 mm) | 5 (16 mm) | 48 (19 mm) | -- |
| 02 Jun 2001 | 4 | 7 | 42 | -- |
| 03 Jun 2001 | 1 (23.0 mm) | 2 (2.2 mm) | 45 (8.0 mm) | -- |
| 04 Jun 2001 | 4 (42 mm) | 11 (28 mm) | 57 (maximum deflection) | -- |
| 05 Jun 2001 | -- | 6 (5.5 mm) | 118 (maximum deflection) | -- |
| 06 Jun 2001 | -- | 5 (6.2 mm) | 65 (44 mm) | -- |
| 07 Jun 2001 | -- | 4 (10 mm) | 118 (13 mm) | -- |
| 08 Jun 2001 | 2 (14 mm) | 8 (21 mm) | 116 (14 mm) | -- |
| 09 Jun 2001 | -- | 18 (15 mm) | 82 (19 mm) | -- |
| 10 Jun 2001 | -- | 10 (10 mm) | 126 (19 mm) | -- |
| 11 Jun 2001 | -- | 6 (1.5 mm) | 143 (14 mm) | -- |
| 12 Jun 2001 | -- | 6 (3.0 mm) | 103 (15 mm) | -- |
| 13 Jun 2001 | -- | -- | 198 (12 mm) | -- |
| 14 Jun 2001 | -- | 3 (10 mm) | 232 (12 mm) | -- |
| 15 Jun 2001 | -- | 1 (28 mm) | 172 (16 mm) | -- |
| 16 Jun 2001 | -- | -- | 157 (20 mm) | -- |
| 17 Jun 2001 | 1 (7 mm) | -- | 230 (13 mm) | -- |
| 18 Jun 2001 | 2 (32 mm) | -- | 196 (9 mm) | -- |
| 19 Jun 2001 | -- | -- | 200 (24 mm) | -- |
| 20 Jun 2001 | -- | -- | 76 (14 mm) | Continuous high-frequency harmonic tremor (1.5-3.0 mm) |
| 21 Jun 2001 | -- | -- | 265 (21 mm) | Continuous high-frequency harmonic tremor (1.5 mm) |
| 22 Jun 2001 | -- | -- | 216 (23 mm) | One explosion earthquake (23 mm) |
| 23 Jun 2001 | -- | 8 (13 mm) | 211 (23 mm) | -- |
| 24 Jun 2001 | -- | 14 (17 mm) | 132 (50 mm) | 12 additional low-frequency tremors (34 mm) and continuous harmonic tremor (3 mm) |
| 25 Jun 2001 | -- | -- | -- | -- |
| 26 Jun 2001 | -- | 24 | 84 | -- |
| 27 Jun 2001 | -- | -- | -- | -- |
| 28 Jun 2001 | -- | 9 | 67 | -- |
| 29 Jun 2001 | -- | 6 | 10 | -- |
| 30 Jun 2001 | -- | 10 | 24 | -- |
Activity during 1-8 June 2001. During this time period, seismic instruments registered generally increasing numbers of tremors (table 5). Many of these tremors were of high frequency but short duration and inferred to be associated with mass-wasting of lava-dome fragments that descended from the volcano's SE rim. Other kinds of tremor were seen later in the month (see table 5).
The summit lava dome glowed brightly (Intensity III, table 4) during cloud breaks on the night of 1 June. During 2-8 June crater glow held steady at a Level II intensity except for 4 and 6 June when it varied between Level II and Level III. Incandescent materials occasionally rolled down from Mayon's summit, traveling along the SE slopes in the upper Bonga Gully. Glow came from detached zones of extruding, pasty lava at the dome's W base and SE face. On 3 and 6 June moderate to weak steaming issued from the summit crater.
Activity during 9-16 June 2001. As observed from Legazpi City and vicinity, lava fragments frequently detached from the summit dome and slid or rolled into the Bonga Gully to the SE and deposited a pyroclastic fan on Mayon's middle to upper slopes. Nearly continuous rockfalls produced distinct ground tremor with high-frequency spectra. PHIVOLCS noted that recordings of these multiple rockfall events from the reference station in Upper Anoling graded into each other, indicating more vigorous extrusions and rockfall events than those recorded by the station.
Ground-deformation surveys using EDM (Electronic Distance Meter) instruments were unable to make readings due to weather during 2-8 June. The previous reading, made on 28-29 May 2001, found universal inflation (i.e. displacements along the line LHO-Lower Slope measured -9 mm and the line Buan-MRHO, -6 mm). Ground deformation recorded on 10 June again indicated a minor degree of inflation (the line Buang-MRHO, -1 mm).
At 1819 on 12 June, part of the summit lava dome collapsed and heralded a period of vigorous rockfalls from the lava dome; however, no lava flow formed. Bright glow (Intensity III) occurred at a point in the mid-portion of the dome where extruding pasty lava squeezed out.
On 10 June moderate steam emission at the summit correlated with an SO2 flux of 4,115 metric tons/day (t/d) (table 3). At this point in time, Mayon was still considered to be in a mild state of eruption with magma only slowly intruding the summit. On 11 June PHIVOLCS noticed an increase in the overall tempo of unrest, including days with elevated numbers of rockfall-induced tremor.
At 1347 on 11 June the dome partially collapsed and produced a small pyroclastic flow that descended along the Bonga Gully. The flow reached about 1,480 m elevation and produced a thin ash cloud, which drifted E. Similarly, on 12 June at about 1819 the summit lava dome again partly collapsed, spawning vigorous, continuous emissions of lava fragments until about 1930.
Activity during 17-23 June 2001. On 23 June mild explosive activity and lava fountaining took place. Prior to that, a significant change in the pace of unrest was indicated by the appearance of tremor at 0405 on 19 June. A lava flow spotted during a cloud break from 1008-0152 enabled observers to see an intense glow emitted by the dome and the margins of a newly emplaced lava flow, which extended to about 500 m below the summit dome (to ~1,800-1,900 m elevation). The tremor so dominated the seismic record that discrete rockfall counts dropped. Only 76 rockfall-related tremors were registered, although extrusive activity had clearly increased. The lava flow signified that hotter, more fluid, and more voluminous lavas were being extruded. The new lava corresponded to a sudden increase in sulfur dioxide emissions from 1,700 metric tons/day (t/d) the previous week to nearly 6,000 t/d on 19 June.
By 20 June the volcanic edifice had inflated slightly as recorded by ground-deformation surveys. Tiltmeters midway up on the NE edifice, at the Buan-Mayon Resthouse station, registered accelerating inflation. During 1209-1218 on 20 June a portion of the lava dome collapsed, generating brownish dust clouds along the Bonga Gully.
On 21 June lavas were seen exiting from two points of the dome. Two lobes descended, both on the SE side (in the general direction of the settlements of Buyuan and Mabinit). Magma ascent through the uppermost levels of the volcano's conduit appeared to be associated with high-frequency harmonic tremor at all five seismic stations in the vicinity of the volcano. Magma intruding the summit area also exerted pressure on the edifice and influenced ground tiltmeters. The COSPEC instrument measured the highest SO2 flux of the June episode: ~9,000 t/d.
The main lava flow moved SE in the general direction of Mabinit on 21 June, and the lowermost toe of the lava flow descended 300 m farther, to ~1,500 m elevation. On 22 June the lava flow reached 1,200 m elevation; by 23 June, it had descended 3.4 km from the summit to reach 600 m elevation.
At 1909 on 23 June, lava fountaining in the summit crater ejected material at least 50 m above the rim, with the bulk of pyroclasts falling to the SE (into the upper Bonga Gully). As lava flows continued to travel SE they generated high-frequency tremor. Activity was still dominated by relatively rapid but quiet effusion of lava. At this point the seismicity lacked clear explosion signals and deformation measurements lacked inflation signals; it was believed that such signals would presumably accompany a major explosive eruption (if one were to occur).
Activity during 24-30 June 2001. At 2000 on 23 June the Alert Level was raised from 3 to 4 when the already substantial lava extrusions changed from quiet effusions to more explosive, but nonetheless non-destructive, Strombolian outbursts. The latter were first observed in the crater at 1909 on 23 June. Small explosions in the crater sent molten lava up to 50 m above the rim.
At 0317 on 24 June, a series of strong explosions were audible as far as Lignon Hill Observatory, 12 km SSE of the volcano. Accompanying ash columns reached 1 km above the summit. Visible molten lava fragments were thrown to 300 m in height. Lofted ash blew N and ash fell in the barangays (settlements) Amtic and Tambo of Ligao City and barangays San Vicente, San Antonio, Quinastillojan, Bantayan, Tabiguian, and Buang of Tabaco City.
At 1245 on 24 June a pyroclastic flow descended the Bonga and Buyuan Gullies to ~600 m elevation, about 4 km from the summit. An explosion from the crater also produced a 5-km-high column. Ash associated with the pyroclastic flow ascended to ~2.4 km altitude. The two ash-laden clouds then drifted NE, in the general direction of Malilipot (a town 10 km away on the coast).
The 24 June pyroclastic flows signaled the start of explosive eruptions with tall columns. At 1300 the hazard status was raised from 4 ("Hazardous Eruption Possible Within Days") to 5 ("Hazardous Eruption in Progress"). Concomitant with Alert Level 5, the previously delineated 7-km-radius Extended Danger Zone in the SE sector was extended to a radius of 8 km. People within these new zones evacuated. Areas to the E and NE of the volcano were considered prone to heavy ashfall due to prevailing winds.
Another major eruption sequence began at 1444 on 24 June, characterized by strong explosions, multiple pyroclastic flows around the volcano, and lava flows into SE-flank gullies. Following drainages, the pyroclastic flows passed the settlements of Basud, Buyuan, Mabinit-Bonga, Miisi, Anoling, Maninila, Nabonton, and Buang, all within the 6-km-radius Permanent Danger Zone (PDZ).
The main eruption cloud discharged from the crater rose to about 10 km altitude and moderate-to-heavy ash blew mainly NE towards Malilipot. Residents ~5 km N of Malipot (in Tabaco) along the coast also experienced light ashfalls. Lava flows and dilute ash clouds dominated activity after 1541. Activity waned in the early morning of 25 June. Beginning at 0037 on 25 June seismicity diminished from continuous tremors into discrete events.
On 26 June Mayon lapsed into an apparently quiet state; however, SO2 flux remained high at 4,640 t/d and reflected active degassing from both the crater as well as from newly extruded lavas covering the summit area. Lava still flowed SE from the summit area along Bonga Gully on the 26th, but its lowermost portions moved slowly. The lava by then extended ~4.3 km from the summit. Its flow front constantly shed incandescent boulders that released gases and ash, burning vegetation along its path. However, the crater's diminished extrusion rate led PHIVOLCS scientists to conclude that the lava flow was unlikely to reach populated areas.
Although outward quiet prevailed for most of 24-30 June, several explosion signals occurred during 26-27 June. One explosion sent an ash cloud to about a kilometer above the summit and caused small lava avalanches in the upper Bonga Gully. Lava continued to trickle from the summit towards the SE along the Bonga Gully. From this time through at least 29 June crater glow stood at Intensity II and lava continued to descend from the summit crater.
Heavy rains fell on the night of 27 June. A team dispatched to the Padang area watched the river channel for lahars. Only a muddy stream flow was observed and rains eventually abated after about an hour. The swollen, muddy streams after this time meant that smaller amplitude volcanic earthquakes were often obscured by the seismic noise produced by the streams. Ground deformation measurements employing EDM instruments and electronic tiltmeters continued to indicate inflation of the edifice. Observers also noticed small rockfalls, and vigorous steaming of the hot lava deposits.
At 1605 and 1702 on 30 June, explosions generated pyroclastic flows that swept the upper and middle slopes within the Bonga Gully and produced billowing ash clouds to about 4 km altitude. Their runout distance reached ~3 km from the summit (in the general direction of Matanag). During the eruption an undisclosed portion of the volcano's E sector also collapsed along the Upper Basud Gully.
Information Contacts: Raymundo S. Punongbayan and Ernesto Corpuz, Philippine Institute of Volcanology and Seismology (PHIVOLCS), C.P. Garcia Avenue, U.P. Diliman, 1101 Quezon City, Philippines (URL: http://www.phivolcs.dost.gov.ph/).
Two main episodes in 2001; quiet seen in late August
Mayon has undergone two eruptive episodes thus far in 2001. The first episode began in January 2001 and involved a period of unrest that culminated in explosive eruptions on 24 and 29 June. The second episode took place on 20 July, climaxing on 26 July. Low-level lava spattering and active degassing continued for days after the latter climax but activity dropped in early August.
The stratovolcano was last reported on through 31 May 2001 (BGVN 26:05); the present report covers through mid-August 2001. The volcano's Alert Levels are discussed in more detail in the last section.
Precursors and minor explosive activity. Unrest during the year 2001 was first recognized on 8 January when the Lignon Hill Observatory (LHO) in Legaspi City (11.5 km SE of the summit) reported a blocky lava dome growing on top of the summit. Lava dome extrusions occurred before an explosive eruption the previous year, so the January 2001 dome was an ominous sign of renewed activity. From January to April 2001, the dome slowly grew and sporadic ash explosions accompanied or followed periods of seismic unrest. The hazard status was set at Alert Level 2, signifying the ascent of magma.
During the second week of May, LHO staff noticed that the growing summit lava dome overlapped the unconfined side of the SE crater rim. At 1752 on 11 May a minor explosion ejected ash and vapor to 50 m above the summit. A series of similar small explosions followed on 12 May that were likely triggered by magma intruding into the dome. As a result, the SE portion of the dome partially collapsed.
Subsequently, the SE flank of the dome facing the observatory glowed conspicuously and lava fragments began to detach from the summit lava dome. Rockfalls were episodic at first and it was not clear initially whether detaching lava was caused by instability of the growing dome or due to the effects of increased internal pressure.
In time, observations from Bonga, ~8 km SE of the summit, indicated that incandescent rockfalls were apparently caused by slowly ascending magma entering the dome. The magma was degassed but hot, presumably a remnant of magma erupted during 2000. PHIVOLCS later postulated that ascending magma punched an exit point on the SE flank of the growing lava dome. This material then spilled into the Bonga Gully, with hot lava boulders as big as trucks falling, rolling, and sliding to form a pyroclastic apron on slopes at 1,800-2,000 m elevation. Rockfall activity, monitored via the seismic network, progressively increased in frequency until magma discharge was sufficient to form a stubby lava flow on 17 June. By 20 June, the seismograms displayed more or less merging codas of high-frequency tremor, which suggested that lava extrusion dominated earlier rockfall activity. As seen earlier, the lava flow was thought to represent relatively fresh but still degassed magma.
Lava fills crater then extends 5 km. By 22 June, lava had already buried the summit dome and partially filled the crater. Lava was no longer exiting from a single patch at the side of the dome but from the whole breadth of the SE summit.
Episodes of conspicuous summit glow began on 23 June, and intensified to a pulsating light-yellow incandescence by early evening. The summit did not stay quiet for long because the crater began to vent voluminous gases and to shower spatter around the summit. COSPEC readings indicated an SO2 flux of ~7,000 metric tons per day (t/d), well above the baseline of ~500 t/d. At about 1909 on 23 June, a period of low-level lava fountaining began to feed lava flows that eventually descended from the summit elevation to ~500 m elevation-a distance of ~5 km.
When lava fountaining commenced the Alert Level rose from 3 to 4. This status meant that PHIVOLCS considered a hazardous eruption imminent, within hours to days. The corresponding Level 4 Bulletin carried with it a recommendation to evacuate areas within the 6-km-radius Permanent Danger Zone (PDZ) and a 7-km-radius Extended Danger Zone (EDZ) in the SE sector. The EDZ provided a buffer zone to the Bonga Gully, which descends from near the crater mouth to the lower mid-slopes (~600 m elevation) to the SE, a distance of ~4 km. By 0100 on 24 June the PDZ and EDZ were fully evacuated through the efforts of a group called "Task Force Mayon," a military and civilian organization charged with implementing the evacuation of the danger zones. Temporary shelters received ~25,000 people.
At 0317 on 24 June a series of explosions fed an ash column that rose to ~1 km above the volcano's summit. A thin blanket of ash fell mainly on the northern half of the volcano in the vicinity of barangays (hamlets) Amtic and Tambo of Ligao City and San Vicente, San Antonio, Quinastillojan, Bantayan, Tabiguian, and Buang of Tabaco City.
First substantial pyroclastic flows. Although lava fountaining and small ash puffs signaled the start of explosive activity, it was not until 1245 on 24 June that the first major pyroclastic flow occurred. It followed the eastern branch of the Bonga Gully in the general direction of Barangay Buyuan. PHIVOLCS promptly raised the status to the highest Alert Level, 5, first verbally to provincial disaster-mitigation officials shortly after 1245, followed by an official bulletin released by 1300. Alert Level 5 provided a reminder that hazardous eruptions were taking place. Although the 1245 pyroclastic flow was short-lived and ran down to the middle slopes only (~700-1,000 m elevation), this again-elevated status emphasized that more explosive eruptions were expected.
At 1444 on 24 June, large explosions commenced and generated multiple pyroclastic flows around the cone. Ash clouds from the eruption column and pyroclastic flows enveloped the volcano in ash and rose to ~10 km altitude. Although the volcano seemed to disappear within its own eruption clouds, giving the impression of massive explosions that might have threatened the lowlands, the pyroclastic flows and lava flows were all contained within the PDZ, with maximum runouts to only ~5.5 km.
Considerable airfall ash blanketed the northern areas, particularly the cities of Ligao and Tabaco, but this was chiefly a function of wind velocity and direction, because the wind mostly comes from the SW this time of the year.
Eruptions continued until 1921 on 24 June when seismographs began to record diminishing eruption intensity as indicated by decreasing harmonic tremor amplitudes. However, sporadic explosive eruptions continued throughout the evening as LHO noted light ashfall in Legaspi up to about 2135 that day. Thereafter, during 25-28 June, Mayon remained quiet, although Alert Level 5 was maintained in anticipation of more explosions.
At around 1605 and 1702 on 29 June, Mayon erupted again and sent relatively small pyroclastic flows down the Bonga Gully to the SE. Over the period 30 June to 19 July, Mayon's apparent activity waned and the hazard status was eventually lowered to level 3 (which states that an eruption may still be expected within the coming weeks). Observations in support of reduced activity included a general deflation of the edifice, decreased seismic activity, lowered gas emission rates, and the disappearance of summit incandescence. The first eruptive episode ended and scientists inferred that intrusions into the cone had ceased.
Activity during late July 2001. Mayon's eruptive episode during July 2001 was essentially a continuation of June's activity. On 20 July seismographs around the volcano recorded high-frequency, short-duration tremor associated with rockfalls. The number of seismically detected rockfalls had already declined from the pre-June 24 eruption level of more than 200 events per day to (by 19 July 2001) a post-eruption level of less than ~10 events per day. The latter number was attributed to unstable, freshly deposited lavas on steep upper slopes.
Scientists were alerted when the S-flank seismic station at ~800 m elevation registered an abrupt increase, from 5 rockfall events on 19 January to 48 events on 20 January. Over the same time period an upper seismic station (at 1,700 m elevation) recorded a jump from 25 to 142 events. Incandescent rockfalls became persistent.
Other striking changes soon occurred. On 21 July the SO2 flux tripled, to 7,400 t/d. The uppermost electronic tiltmeter (at 1,700 m elevation) fluctuated by ~20 µrad. Crater glow increased and rockfall occurrences peaked.
PHIVOLCS inferred that Mayon had again entered a mild eruptive stage. The character of unrest resembled activity observed between mid May and 20 June, prior to explosive eruptions on 24 June. Scientists recognized that an explosive and hazardous eruption could occur anytime. By 23 July, PHIVOLCS gave the Albay provincial government a notice of increasing unrest and by 25 July, the Municipal Mayors were informed of reactivation and possible explosive eruption of Mayon.
Overall, unrest was accelerating. On the morning on 25 July, the bulletin also added that the current extrusion of lava was clear evidence of eruption and that more explosive eruptions were expected. At 0418 on 25 July seismometers detected more or less continuous high-frequency tremor. Although clouds shrouded Mayon, volcanologists believed these signals indicated that a lava flow had extruded from the dome, an idea confirmed when observers saw a short lava tongue draping the SE slope just below the summit crater.
During 0219-0315 on 26 July, LHO staff saw mild lava fountaining that reached to ~70 m high. This prompted the return to Alert Level 4 at 0400 on 26 July and a rapid evacuation. During quiet times, farmers work portions of land within the 6-km-radius PDZ, but at Alert 4, people in this zone are required to evacuate as quickly as possible. As in the previous 24 June eruption, a 7-km-radius SE-flank EDZ was also declared (to include river gullies upstream of barangays Mabinit, Bonga, Buyuan and Matanag). But, lava fountaining declined at about 0400 and the volcano seemed quiet. This led some people to be initially lax, and some farmers viewed the lull as an opportunity to gather their livestock near the Bonga Gully. PHIVOLCS firmly advised not to proceed. This warning proved justified when at 0538 a brief burst from the crater sent an ash cloud to ~500 m above the summit. This was accompanied by a low-frequency type earthquake that lasted for about a minute. A lack of urgency towards evacuating may have been widespread. Legaspi City Mayor Rosal made the following admission, which appeared in The Philippine Star the next day. "We were surprised by its sudden explosion. We were told to evacuate last night but we did not know it would explode so fast."
At 0745 on 26 July there occurred another ash explosion with similar seismic signature. In retrospect, sequences of low-frequency seismic events were detected by the Mayon Resthouse station (780 m elevation) before the onset of explosive eruptions at 0756 on 26 July. These events were not detected at other stations or were obscured by high-frequency tremor associated with both lava flowing out at the uppermost elevations and lava fragments detaching from the advancing lava flow.
The 0756 eruption produced a turbulent head of steam and ash, followed by a column of roiling dark-gray ash clouds. The column convected to ~10 km altitude while pyroclastic flows descended the Bonga (SE flank) and Basud (E flank) gullies. Upper-level winds conveyed the topmost eruption column to the SW. Lower-level winds carried fine ash lofted upwards (elutriated) from pyroclastic flows to the SE. Accordingly, the main ashfall deposit reached ~7 mm or more in thickness to the SW (in Camalig); it included scoria up to 10 cm diameter and perhaps larger. Most scoria fragments broke up upon impact with hard surfaces such as concrete and asphalt, but scoria clasts that landed on softer ground were preserved. A second ashfall deposit occurred to the S, SE, and ESE (in Legazpi, Daraga, and Lidong, respectively), amounting to ~5 mm thickness during this initial eruption. Additional lighter ashfalls occurred to the S (in Daraga) and to the SW (in Guinobatan).
A brief helicopter flight over Albay Gulf looking at Legaspi and Santo Domingo showed the dark curtain of ash progressively blanketing these localities. Pyroclastic flows remained well within the PDZ, a fact used to conclude that additional areas were not endangered. Only small-volume pyroclastic flows were seen descending the S-flank regions (Mi-isi and Anoling gullies).
The eruption that began on 0756 on 26 July lasted for about an hour. Ash clouds remained suspended throughout the day, even when Typhoon Feria's rains swept over Mayon. At 1420 that day another episode of eruptions began. Although the suspended ash and rain clouds covered Mayon, harmonic tremor and booming sounds signified explosive discharge until about 1500. A third and final eruption episode occurred from 1749 until 1810. Like the second period of eruptions, ash and rain clouds obscured much of the volcano from Legaspi. From Santo Domingo, however, pyroclastic flows were seen descending the Basud Gully. A ground survey to Bonga, facing this gully in the SE indicated that very small pyroclastic flows were passing here, yet there were large pyroclastic flows to the E.
When the eruption cleared the following day, observers recognized that the septum between the Bonga and Basud Gullies near the summit had breached. It is therefore very likely that late-stage pyroclastic flows during the third eruptive episode were funneled through Basud and little material was channeled along the Bonga Gully. This demonstrates the high probability that subsequent flows will also affect the eastern sector and not just the SE. Fortunately, flow runouts remained within defined danger zones.
On 27 July Mayon entered an effusive state as lava from the summit fed a flow that eventually reached ~3.75 km to the SE at an elevation of ~650 m. This was smaller than the lava flow extruded in June; it traveled farther and eventually reached ~5.5 km down the SE slope at ~500 m elevation. Hazy conditions in the SE foothills were caused by ash-and-steam plumes from the summit and from pyroclastic-and lava-flow deposits. Seismicity remained active, with signals from sporadic explosions and persistent background tremor related to lava flows and other surface events. Numerous (206) discrete rockfall signatures, for example, were detected by the seismic network and many of these were visually confirmed from LHO. The resumption of rockfalls was interpreted to not result from another intrusion but from loosened lava debris on steep slopes.
The SO2 flux at 6,450 t/d remained very high on 27 July and even on the following days, SO2 emission rates varied between 3,265 and 9,915 t/d. Voluminous degassing coincided with loud roaring from the crater, which caused some residents of Santo Domingo, at least 8 km E of the crater, to evacuate. According to residents, the last time they heard the crater degas loudly was prior to the resurgence on 23 September 1984, so that they were troubled when they heard another explosive eruption after 26 July 2001. The concern was not at all unfounded. Although incandescence of the summit already diminished to faint conditions as observed from LHO, some low-level fountaining became evident on video cameras with night vision. The cameras clearly showed blobs of lava thrown 100 m above the crater rim. This new observation, along with elevated seismic and SO2 levels, and other monitored parameters, kept the alert status at Level 5.
Waning activity. It was not until there were clearer signals of gradual decline of activity that PHIVOLCS lowered the Alert Level 5 status to Level 4. A bulletin on 9 August 2001 explicitly noted the cessation of explosive eruptions.
After 10 August seismic activity decreased. Background tremor associated with active magma transport had stopped and rockfall occurrences had become insignificant. The number of low-frequency volcanic earthquakes occurring daily was still above baseline, up to 22 events, but this is not unusual after an eruption of Mayon and was probably related to shallow magma degassing. The SO2 fluxes, up to 6,600 t/d, were still very high, presumably for the same reason. Electronic tiltmeters supported the idea of substantial degassing, showing a general deflation episode following the 26 July eruption. In summary, while various monitoring parameters continued to show significant unrest of Mayon, the general trend was one of declining activity. This information may be used to eventually lower alerts over the volcano and allow the return of evacuees to their homes by the end of August 2001.
June and July eruptions compared. The eruptions in June appeared to be more voluminous and produced more lavas than tephra. The estimated volume of 15 x 106 m3 was in the ratio 2/3 lava and 1/3 pyroclastics. The June eruptions also produced pyroclastic flows that ran through many gullies radiating around the cone. The 26 July eruption produced roughly similar proportions of lava and tephra (namely, 5 x 10⁶ m3 lava; 6 x 10⁶ m3 tephra).
When the 26 July pyroclastic flows poured down the SE and E flanks, the low-altitude SE winds caused Legaspi City to be enveloped in ashfall. Legaspi City generally remains ash-free due to seasonal wind patterns. Not fully prepared to cope with ashfall, many residents panicked even though the threats to life were virtually nil. Phone lines jammed and vehicle traffic was backed up for several kilometers on the highway from Rawis, Legaspi City to Padang, and Santo Domingo. Busy communication networks also prevented PHIVOLCS from relaying real-time information by telephone to the central office in Quezon City. Fortunately, anticipation of explosive eruptions earlier that day meant that warnings to local and national authorities were already sent out. A notice to the Volcanic Ash Advisory Center in Tokyo was also made that morning.
Another marked difference between the June and July 2001 unrest was the time interval between perceived disquiet to the day of explosive eruption. The 24 June eruption was preceded by over a month of seemingly increasing rockfall activity. In a sense, rockfalls were an indicator of magma-discharge rates and the number of rockfalls per day progressively increased up until lava-flow extrusion. In contrast, the period between the onset of rockfalls and the 26 July eruption was barely a week, so that magma-discharge rates jumped abruptly before the onset of lava extrusion and explosive discharge.
Background provided by PHIVOLCS. The towering Mayon stratovolcano is famous for its highly conical shape and its symmetry. It is the most active volcano in the Philippines, with 47 historical eruptions since 1616. The typical eruption episode lasting from a few days to about a month produces a sequence of basaltic andesite lava flows, pyroclastic flows, and tephra falls. Based on geological studies on the nature and extent of deposits, a 6-km-radius "Permanent Danger Zone" (PDZ) has been defined to discourage people from permanently occupying hazardous areas.
Table 6 shows the Mayon warning scheme devised by PHIVOLCS. It is similar to the one employed at Pinatubo. Six alert levels provide the general activity status.
Table 6. A simplified version of the current warning scheme used at Mayon. Courtesy of PHIVOLCS.
| Alert Level | Meaning |
| 0 | Volcano is quiet; no eruption in foreseeable future |
| 1 | Little unrest, possibly of hydrothermal, magmatic or tectonic activity |
| 2 | Moderate unrest of magmatic origin; may lead to an eruption |
| 3 | High unrest; tendency towards an eruption within weeks |
| 4 | Eruption imminent within days |
| 5 | Hazardous eruption in progress |
It has been suggested that Mayon erupts every 10 years, referring to the eruptions of 1928, 1938, and 1947. Then there were the eruptions of 1968 and 1978 as well as the interval between 1984 and 1993 events. Yet in recent years, it seems that this general periodicity has changed. The Millennium eruption, 24 February to 7 March 2000, occurred just 7 years after the 1993 outbursts. A similar period of repose is evident in the interval 1978-84. In fact, close inspection of the historical record suggests other intervals with eruption repose periods of less than 10 years.
Information Contacts: Ernesto Corpuz, Philippine Institute of Volcanology and Seismology, C.P. Garcia Ave., Univ. Philippines Campus, U.P. Diliman, 1101 Quezon City.
Declining activity prompts PHIVOLCS to lower Alert Level to 0
Eruptions at Mayon in June and July 2001 were followed by a decrease in seismic activity beginning on 10 August. Low-frequency volcanic earthquakes and SO2 fluxes were still high and were probably related to shallow magma degassing. While various monitoring parameters continued to reflect significant unrest, the general trend was one of declining activity (BGVN 26:08).
Volcanic activity remained low during August. There was relatively little seismicity, slight inflation, occasional observations of incandescence at the summit, and a moderate amount of steam emission. SO2 flux remained well above the baseline of 500 metric tons per day (t/d) (table 7). SO2 emission rates reflected continued degassing of cooling magma, and ground-deformation data continued to indicate the absence of magma intrusion. On 21 August the Alert Level was lowered to 3 and, following a continued decrease in activity, on 19 October it was lowered to 1.
Table 7. Earthquakes, tremor, and SO2 flux at Mayon during 13-30 August. Differences in reported daily and weekly data during 20-26 August could not be resolved by press time. Courtesy PHIVOLCS.
| Date | High-freq volc EQ's | Low-freq volc EQ's (amplitude) | High-freq short-duration volc tremor (amplitude) | Low-freq short-duration volc tremor (amplitude) | Avg SO2 flux (t/d) |
| 13-19 Aug 2001 | 4 | 62 | 40 (31.0, 58.0, 3.2, and 40.0 mm) | 17 | 4,757 |
| 21 Aug 2001 | -- | -- | -- | -- | 4,784 |
| 22 Aug 2001 | -- | 1 | 3 | 6 | 5,315 |
| 23 Aug 2001 | -- | 17 | -- | 6 | -- |
| 24 Aug 2001 | -- | 5 | 1 | -- | 3,989 |
| 25 Aug 2001 | -- | 4 (4.0 and 5.0 mm) | 2 | -- | 2,191 |
| 26 Aug 2001 | -- | 10 (12.0 mm) | -- | -- | 2,044 |
| 20-26 Aug 2001 | -- | 54 | 14 (14.0, 3.4, and 11.0 mm) | 10 | 3,771 |
| 27 Aug 2001 | -- | 13 (12.0 mm) | 1 (45.0 mm) | -- | 1,550 |
| 28 Aug 2001 | -- | 10 (7.0 mm) | 4 (7.0 mm) | -- | 3,863 |
| 29 Aug 2001 | -- | 3 (11.0 mm) | 3 (6.5 mm) | -- | 5,576 |
| 30 Aug 2001 | -- | 15 (14.0 mm) | -- | -- | -- |
News reports on 21 November stated that lahars were generated after several days of heavy rainfall mixed with unconsolidated material on the volcano's slopes. According to the civil defense, flooding caused more than 4,800 families to be evacuated from their homes.
The Philippine Institute of Volcanology and Seismology (PHIVOLCS) reported that since 19 October 2001, when the Alert Level was lowered to 1, all measured parameters had continued to decrease to near-baseline levels. Ground deformation data from electronic tiltmeters continued to indicate the volcano's deflated condition, and SO2 emission rates yielded relatively low values of 450-900 t/d. The observations implied that no active magma intrusion was occurring beneath the active cone. Although incandescence was still visible at night, PHIVOLCS suggested that it was likely due to still-hot magma beneath the crater. As a result of the low activity, on 5 February PHIVOLCS lowered the Alert Level to 0, but reminded the public to avoid the 6 km Permanent Danger Zone, and residents near major river channels emanating from the volcano were advised to be on alert during heavy rainfall because loose pyroclastic deposits could be remobilized as life-threatening stream flows and lahars.
Information Contacts: Philippine Institute of Volcanology and Seismology (PHIVOLCS), C.P. Garcia Ave., Univ. Philippines Campus, U.P. Diliman, 1101 Quezon City; Associated Press.
Small ash puff on 11 October 2002; explosions on 17 March and 5 April 2003
Until 11 October 2002, no significant volcanic activity had been reported since eruptions in June and July 2001 (BGVN 26:08). Subsequent deflation, combined with declining seismicity and sulfur dioxide flux, resulted in the Alert Level being lowered to 0 (no eruption is forecast in the foreseeable future, but entry in the 6-km radius Permanent Danger Zone (PDZ) is not advised because phreatic explosions and ash puffs may occur without precursors) in February 2002 (BGVN 27:04).
Mayon remains intermittently active, with tremor episodes, a small ash puff in October 2002, steam emission in January 2003, and an explosion and ash plume in March 2003. Small ash explosions on 5 May and 6 April will be described in the next Bulletin.
Activity during October 2002. At 0635 on 11 October 2002 the volcano produced a small ash puff that reached 500 m above the summit crater. The small ash cloud from this minor explosion quickly diffused and drifted E without noticeable deposits on the slopes. The ash puff followed a series of imperceptible volcanic tremors that began in the early hours of 22 September and occurred sporadically until the last tremor was recorded on 9 October. The 11 October report from the Philippine Institute of Volcanology and Seismology (PHIVOLCS) also noted that slight swelling of the volcano's edifice was detected by an electronic tiltmeter on the S flank. However, the Alert Level remained at 0.
A 30 October notice from PHIVOLCS indicated that the number of volcanic earthquakes, although imperceptible, remained significantly above background levels since the ash emission of 11 October. Another notable observation was the occurrence of small volcanic tremors and consistent inflation detected by electronic tiltmeters, which suggested that magma was intruding into the volcano. Gas output from the summit had increased from recent emission rates of ~950 metric tons per day (t/d) to ~2,200 t/d on 29 October. Because of these consistent increases in monitored parameters, PHIVOLCS raised the Alert Level to 1. Although a major explosive eruption was still considered unlikely at this stage, the persistent unrest over the previous weeks clearly indicates a shift from its former period of repose. Alert Level 1 is meant to call attention to increased volcanic activity specifically an increased likelihood for steam-driven or ash explosions to occur with little or no warning. During the last week of October PHIVOLCS augmented its monitoring network around Mayon with additional personnel and equipment.
Activity during January 2003. A brief period of vigorous steam emission occurred at 1753 on 31 January after an episode of volcanic tremor the previous day. The steam ejection lasted for about a minute and produced a dirty white steam cloud that rose ~500 m above the summit crater. A low-frequency, short duration, harmonic tremor coincided with the steam venting. The sulfur dioxide emission rate increased slightly to 764 t/d on 31 January from the previous reading of 441 t/d taken on 21 January, which followed several episodes of low-frequency volcanic tremor during the previous weeks.
Activity during March 2003. An explosion from the crater at 1819 on 17 March sent ash and steam ~1 km above the summit before it was blown WNW by winds. The explosion was recorded as a high-frequency seismic signal, indicating a sudden release of pressure. No significant seismicity was apparent prior to the event. Measurements of SO2 flux within the emission plume between 0900 and 1100 earlier that morning averaged ~890 t/d, which is more than the usual 500 t/d typical during periods of repose. Electronic tiltmeters on the N and S flanks indicated slight inflation of the edifice beginning on 13 March. Due to the increased possibility of additional ash ejections, the hazard status was raised to Alert Level 1.
Information Contacts: Philippine Institute of Volcanology and Seismology (PHIVOLCS), Department of Science and Technology, PHIVOLCS Building, C.P. Garcia Avenue, University of the Philippines Campus, Diliman, Quezon City, Philippines (URL: http://www.phivolcs. dost.gov.ph/).
Three small ash-and-steam explosions during April-May 2003
The Philippine Institute of Volcanology and Seismology (PHIVOLCS) reported small ash and steam explosions from the Mayon volcano on 5 April, 6 May, and 14 May 2003. The alert status for the area around the volcano remained at Alert Level 1 on a scale of 0-5 (indicating an increased likelihood for steam-driven or ash explosions to occur with little or no warning). PHIVOLCS reminded the public to continue avoiding entry into the 6-km-radius Permanent Danger Zone (PDZ), especially in the sectors where life-threatening volcanic flows might be channeled by gullies.
Activity during April 2003. Following a small ash explosion on 17 March 2003 (BGVN 28:03), a brief burst of ash and steam occurred at about 0600 on 5 April. The ash column rose to ~1.5 km above the summit crater before being blown SW. The explosion was recorded as a low-frequency volcanic earthquake, signifying a shallow source. Prior to the explosion, the volcano's seismic network had detected three small low-frequency volcanic earthquakes and three low-frequency short-duration harmonic tremors in the past 24 hours. Electronic tiltmeters indicated continuing slight inflation of the edifice. The increases in activity strongly indicated the likelihood of sudden ash explosions. Although no major eruption was expected immediately after the explosion of 5 April, there was growing evidence that magma was ascending the volcano's conduit.
Activity during May 2003. A small explosion from the crater at 0721 on 6 May produced a brownish ash-and-steam column that rose to ~450 m above the summit crater and was blown SW. The ash-and-steam column rose slowly with minimal noticeable force and was not detected by the volcano's seismic network, indicating a very shallow source. No significant seismicity occurred prior to the explosion. However, electronic tiltmeters on the N and S flanks continued to show inflation. Likewise, a precise leveling survey on 24 April 2003 showed a general inflation of the N flank. Alert Level 1 remained in effect.
At 1813 on 14 May, a small ash puff was emitted from the summit crater. This very brief explosion caused a small volume of ash and steam to rise less than 100 m above the crater and to later be blown NW. The Mayon Resthouse and Sta Misericordia seismic stations recorded the ash puff as a small-amplitude event. Prior to the ash explosion, one short-duration tremor was recorded. Volcanic gas outputs were notably moderate in volume, and the sulfur dioxide emission rates increased from the previous 1,824 metric tons per day (t/d) to ~3,088 t/d. The seismic characteristics associated with the ash and steam emission appeared similar to, though smaller than, previous explosions since 22 October 2002, indicating that this ash puff was very minor. This assessment was also consistent with the smaller volume of ash produced.
Information Contacts: Philippine Institute of Volcanology and Seismology (PHIVOLCS), Department of Science and Technology, PHIVOLCS Building, C.P. Garcia Avenue, University of the Philippines Campus, Diliman, Quezon City, Philippines (URL: http://www.phivolcs.dost. gov.ph/).
Elevated sulfur-dioxide flux after mid-September; crater glow in October
The Philippine Institute of Volcanology and Seismology (PHIVOLCS) reported on 18 September 2003 that earthquake activity at Mayon had been within background levels (< 5 events/day) since 14 August with no volcanic earthquakes over the previous five days and moderate volcanic gas outputs. However, the sulfur dioxide (SO2) flux at 1,237 metric tons per day (t/d) was above baseline levels, having increased from 829 t/d since 5 September. In view of increased SO2 gas emissions, and recent significant earthquake occurrences, PHIVOLCS set the hazard status at Alert Level 1 (on a scale of 0-5).
For the period 29 September-5 October, 16 low-frequency volcanic earthquakes (19.0 mm amplitude), five high-frequency volcanic earthquakes (26.0 mm amplitude), and four high-frequency short-duration volcanic earthquakes (2.5 mm amplitude) were recorded, accompanied by weak to moderate steaming and no visible crater glow. During 6-12 October, 29 low-frequency volcanic earthquakes (14.0 mm amplitude), four high-frequency volcanic earthquakes (6.2 mm amplitude), and two high-frequency short duration volcanic earthquakes (2.0 mm amplitude) were recorded, with moderate steaming and faint crater glow.
PHIVOLCS reported on 9 October that a faint glow had been seen by telescope at the inner E portion of the summit crater between 2330 on 8 October and 0048 on 9 October, and again between 1630 and 1650 on 9 October. Low-frequency volcanic earthquakes occurred four and six times, respectively, during 8 and 9 October. Steam emission remained moderate, with visible plumes barely rising above the crater rim. Mayon's SO2 flux on 9 October rose to 2,386 t/d from 1,616 t/d on 1 October.
On 11 October PHIVOLCS noted persistent and significant incandescence inside the summit crater, apparently from lava in the E portion of the volcano's conduit. Seismicity over the previous 24 hours was relatively low (three low-frequency volcanic earthquakes). The Alert Level was raised to 2, signifying instability that may lead to ash explosions or a magmatic eruption.
Information Contacts: Philippine Institute of Volcanology and Seismology (PHIVOLCS), Department of Science and Technology, PHIVOLCS Building, C.P. Garcia Avenue, University of the Philippines Campus, Diliman, Quezon City, Philippines (URL: http://www.phivolcs. dost.gov.ph/).
Minor activity in June, July, and September 2004; reported ash emission
An explosion-type volcanic earthquake detected by the Upper Anoling seismic station on the afternoon of 3 June 2004 was not visually observed due to thick clouds covering the summit. Residents closer to the Upper Anoling Seismic Station and Mayon Resthouse did not notice any unusual activity. No traces of ash or changes in the crater wall were observed. Sulfur dioxide (SO2) emission rose from 1,169 metric tons/day (t/d) on 12 May to 2,521 t/d on 4 June, then decreased to 1,514 t/d on 18 June. Precise leveling measurements showed a slight but deflation of the edifice. The number of low-frequency volcanic earthquakes and low-frequency short-duration harmonic tremors increased in June to almost twice the number recorded in May. In addition, faint crater glow continued to be observed at the summit, as it had since 7 October 2003.
Another explosion was recorded on 22 July 2004. According to news reports, ash from that event was deposited in two local villages.
Sulfur dioxide (SO2) emissions remained only slightly above baseline at 829 metric tons per day as of 6 September 2004. On the evening of 12 September 2004 the very faint glow at the summit of Mayon intensified slightly. The brighter incandescence, observable from Lignon Hill Volcano Observatory and in Legaspi City proper, coincided with a slight increase in the overall background tremor detected by seismographs around the volcano. However, there were no significant changes in ground deformation or SO2 measurements. A news report also noted that volcanic material emitted from the crater that day set fire to grass on the volcano's slopes.
The hazard status remained at Alert Level 2, indicating a low level of volcanism. PHIVOLCS reminded the public to refrain from venturing into the 6-km Permanent Danger Zone because life-threatening volcanic flows may occur with little or no warning.
Information Contacts: Philippine Institute of Volcanology and Seismology (PHIVOLCS), Department of Science and Technology, PHIVOLCS Building, C.P. Garcia Avenue, Univ. of the Philippines Campus, Diliman, Quezon City, Philippines (URL: http://www.phivolcs.dost.gov.ph/); Associated Press (URL: http://www.ap.org/); The Australian (URL: http://www.theAustralian.news.com.au/).
Eruptions resume in February 2006 after a 2-year hiatus
Since the previous report in December 2004 (BGVN 29:12) Mayon had remained quiet until 21 February 2006. On that day the Philippine Institute of Volcanology and Seismology (PHIVOLCS) reported that a minor explosion at 0941 produced an ash plume that rose ~ 500 m above the volcano's crater and drifted SW. Ash was deposited on the upper slopes of the volcano. The ash emission was accompanied by a small explosion-type earthquake, recorded only by seismographs around the volcano.
Prior to the explosion PHIVOLCS had seen an increase in seismicity at the volcano. Between 1545 on 20 February and 0520 on 21 February, there were 147 low-frequency earthquakes recorded, a number considerably above the five or fewer events per day normally detected. Seismicity also indicated some minor rockfalls, which probably resulted from lava blocks detaching from the summit. Steaming was observed. No incandescence was visible at the crater due to clouds obscuring the volcano.
PHIVOLCS reported that about nine earthquakes related to explosive activity took place at Mayon around 23 February. Cloudy conditions prevented visual observations, but the seismic events detected probably signified minor ash explosions. This was supported by reports from local residents who heard rumbling. The seismic network also recorded two low-frequency earthquakes associated with shallow magma movement. The SO2 flux averaged 1,740 metric tons per day (t/d), similar to values obtained during the last measurements on 28 November 2005. The flux was well above the usual 500 t/d measured at the volcano. Mayon remained at Alert Level 2, with a 6-km-radius Permanent Danger Zone in effect. At this point the possibility of more violent eruptions triggered warnings to tourists and the public in general to remain outside of the danger zone.
Information Contacts: Philippine Institute of Volcanology and Seismology (PHIVOLCS), Department of Science and Technology, PHIVOLCS Building, C.P. Garcia Avenue, Univ. of the Philippines Campus, Diliman, Quezon City, Philippines (URL: http://www.phivolcs.dost.gov.ph/).
New eruptive pulse starting 13 July; lava flows; thousands evacuated
Mayon was last reported on in March 2006 (BGVN 31:03), discussing an eruption in February 2006. Low-level activity and seismicity prevailed through early July. This report covers an eruptive pulse that began on 13 July 2006 and continued through August 2006. On 13 July there were phreatic eruptions that produced light ashfall in the areas of Calbayog and Malilipot. At 2200 on 14 July, authorities raised the Alert Level from 1 to 3 due to moderate white steam drifting NE and lava flows extending 0.7-1.0 km from the summit onto the SE slopes. On 15 July, the lava flow continued its SE progression towards Bonga gully.
On 16 July, the 6 km radius hazard zone known as the Permanent Danger Zone (PDZ) established around the SE area, was extended to 7 km and during the period covered by this report the radius of the danger zone around the southern sector was extended to 8 km. On 18 July, the Philippine Institute of Volcanology and Seismology (PHIVOLCS) reported that the lava flow had reached 1 km in length and incandescent boulders had rolled 3 km towards the Bonga gully. Seismicity, reported SO2 fluxes, and posted alert levels appear in table 8.
Table 8. Mayon's reported seismicity, SO2 fluxes, and alert levels during 15 July 2006 to 24 August 2006. "?" indicates information not available. Courtesy of PHIVOLCS.
| Date | Volcanic earthquakes | Tremor episodes | SO2 flux (t/d) | Alert Level |
| 15 Jul 2006 | -- | 111 | 2,211 | 3 |
| 17 Jul 2006 | -- | 314 | 1,513 | 3 |
| 18 Jul 2006 | -- | -- | -- | 3 |
| 19 Jul 2006 | -- | 250 | 2,157 | 3 |
| 20 Jul 2006 | -- | -- | -- | -- |
| 21 Jul 2006 | -- | -- | -- | -- |
| 22 Jul 2006 | -- | -- | -- | -- |
| 23 Jul 2006 | -- | -- | -- | -- |
| 24 Jul 2006 | 11 | 324 | 7,020 | 3 |
| 25 Jul 2006 | 12 | 564 | 5,886 | 3 |
| 26 Jul 2006 | 7 | 316 | 9,275 | 3 |
| 27 Jul 2006 | 6 | 421 | 4,550 | 3 |
| 28 Jul 2006 | 8 | 423 | 8,724 | 3 |
| 29 Jul 2006 | 4 | 394 | 6,099 | 3 |
| 31 Jul 2006 | -- | 388 | 12,548 | 3 |
| 01 Aug 2006 | -- | 354 | 7,418 | 3 |
| 02 Aug 2006 | 16 | 450 | 7,050 | 3 |
| 03 Aug 2006 | 51 | 343 | 4,760 | 3 |
| 04 Aug 2006 | 18 | 354 | 2,965 | 3 |
| 05 Aug 2006 | 18 | 354 | 2,965 | 3 |
| 06 Aug 2006 | 12 | 371 | 1,919 | 3 |
| 07 Aug 2006 | -- | -- | -- | -- |
| 08 Aug 2006 | 109 | 344 | 12,745 | 4 |
| 09 Aug 2006 | 21 | 294 | 7,829 | 4 |
| 10 Aug 2006 | 3 | 501 | 6,573 | 4 |
| 11 Aug 2006 | 6 | 213 | 6,876 | 4 |
| 12 Aug 2006 | 6 | 191 | 3,423 | 4 |
| 13 Aug 2006 | 13 | 158 | 5,427 | 4 |
| 14 Aug 2006 | 16 | 152 | 3,493 | 4 |
| 16 Aug 2006 | 15 | 154 | 8,086 | 4 |
| 17 Aug 2006 | 5 | 130 | 2,937 | 4 |
| 18 Aug 2006 | 32 | 307 | 2,937 | 4 |
| 19 Aug 2006 | 22 | 240 | 2,712 | 4 |
| 20 Aug 2006 | 15 | 253 | 6,634 | 4 |
| 21 Aug 2006 | 15 | 274 | 5,390 | 4 |
| 22 Aug 2006 | 24 | 431 | 2,445 | 4 |
| 23 Aug 2006 | 10 | 316 | 5,215 | 4 |
| 24 Aug 2006 | 18 | 451 | 6,328 | 4 |
Pyroclastic flows on the SE slopes prompted approximately 100 families to evacuate on 20 July. On 22 July, lava flows advanced NE towards the Mabinit channel. By 24 July, lava flows had traveled SSE, ~4 km from the summit toward Bonga gully, and branched off to the W and E. Incandescent blocks shed from the toe and margins of the flows traveled SE and were visible at night. Additionally, on 24 July seismographs recorded more than 324 tremor episodes and 11 volcanic earthquakes. SO2 emissions from the summit crater reached 7,000 metric tons per day, several times larger than fluxes reported earlier.
PHIVOLCS reported lava flow advance in terms of straight-line distances, which progressed as follows: 26 July, 4.45 km; 27 July, 4.7 km; and 29 July, 5.4 km. During this time, SO2 rates remained high (table 8), suggesting fresh magma at shallow levels in the volcano. The number of tremor episodes and earthquakes also remained high. Tremor was thought to indicate near-continuous lava blocks detaching from the lava flows. Volcanic earthquakes were thought to reflect ascending magma. Figure 11 shows the lava flow front on 29 July.
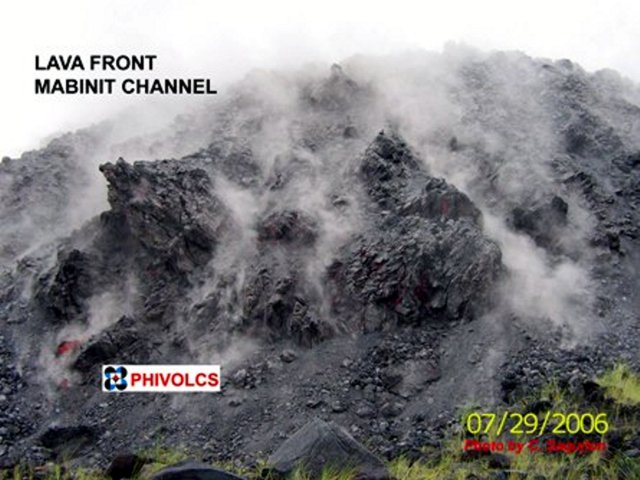 |
Figure 11. Photograph taken on 29 July 2006 at Mayon showing the lava front as it continued to advance down the Mabinit channel. Courtesy of C. Sagution, PHIVOLCS. |
On 29 July, light ash accumulation was reported about 12 km S and SE, in Daraga municipality and Legazpi City and vicinity, respectively. Emissions of sulfur-dioxide reached ~ 12,500 tons per day on 31 July, a record high for this reporting interval. By 1 August, in the SE sector of the Bonga gully, lava flows had advanced ~1.35 km, and in the SSE sector they had advanced a maximum distance of 5.8 km from the summit.
According to a Philippine Information Agency (PIA) press report, military and police checkpoints were set up on 2 August around the 6-km-radius PDZ to prohibit entry. A large lava deposit had grown on the SE flanks. The lava which faced Legazpi and Daraga, had piled up during the initial two weeks of the eruption and threatened to cross the PDZ. PHIVOLCS had reported that the advancing incandescent front of the lava flow was ~20 m high and 50 m wide (figure 12). PHIVOLCS estimated that the lava front could breach the 6-km-radius PDZ within two to three days.
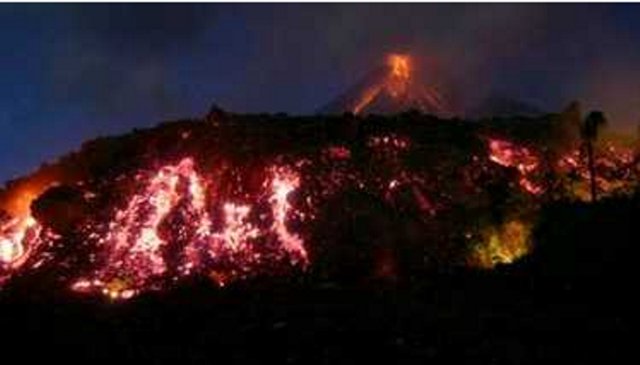 |
Figure 12. On the evening of 3 August 2006, lava advancing down the Mayon's Mabinit channel formed this impressive front. For scale, note tree at right. Although the government had issued an evacuation warning, many tourists flocked to the scene to watch the lava flows. Courtesy of Romeo Ranoco (Reuters). |
An overflight of Mayon on 6 August revealed that lavas discharging from the summit crater extended along the Mabinit channel and spilled into the Bonga gully, E of the Mabinit channel. Due to the decreased supply of lava to the Mabinit channel, the flow there was expected to cease a short distance beyond the 6-km-radius PDZ. Six ash explosions sent ash columns up to 800 m above the summit, prompting PHIVOLCS to raise the alert level from 3 to 4, indicating an eruption is imminent. According to the Manila Bulletin Online, as many as 50,00 people in the Albay province were evacuated.
On 7 August, an advancing lava flow crossed 100 m beyond the 6-km-radius PDZ. According to the Manila Standard Today, authorities warned residents of more lava and fires as the lava flows crept along the Mabinit and Bonga gullies.
During 9-15 August, explosive activity continued at Mayon after a brief respite on 8 August. Based on interpretations of seismic data, minor explosions during 9-11 and 13-15 August were accompanied by lava extrusion and collapsing lava flow fronts that released blocks and small fragments. A drop in SO2 emissions on 9 August worried volcanologists that something had blocked the flow of magma in Mayon's conduit and could therefore cause a build up in pressure resulting in a larger eruption. Visual observations were commonly obscured by clouds. On 11 August an ash plume was seen drifting ESE. On 12 August, four explosions occurred; one produced a pyroclastic flow that traveled over the SE and E slopes and generated a plume that rose to an altitude of 500 m and then drifted NE. On 15 August, a brief break in the clouds allowed for a view and confirmed the presence of fresh pyroclastic deposits from activity in the previous days. Approximately 40,000 people remained in evacuation centers and authorities maintained an Extended Danger Zone at 8 km from the summit in the SE sector.
PHIVOLCS reported that explosions from Mayon continued during 16-19 August. On 17 August, ash-and-steam plumes drifted at least 5.3 km NE and reached the town Calbayog, where light ashfall was reported. Lava extrusion continued and on the SE slopes lava-flow fronts shed blocks and small fragments. On 18 August, the Mibinit and Bonga gully lava flows reached ~ 6.8 km SE from the summit. PHIVOLCS estimated the volume of erupted materials at between 36 and 41 million cubic meters.
Information Contacts: Philippine Institute of Volcanology and Seismology (PHIVOLCS), PHIVOLCS Building, C.P. Garcia Avenue, U.P. Campus, Diliman, Quezon City, Philippines, Reuters Alert Network (URL: http://www.alertnet.org/thenews/newsdesk/MAN212904.htm); The Associated Press (URL: http://www.ap.org/); Manila Standard Today (URL: http://manilastandard.net/); Manila Bulletin Online (URL: http://www.mb.com.ph/).
Lava extruding but with less vigor
During 6 September to 3 October 2006, the Philippine Institute of Volcanology and Seismology (PHIVOLCS) described lava extrusion and associated rockfalls on Mayon's SE slopes. This continued the previous pattern seen during 23 August-5 September 2006 (BGVN 31:07). Mayon's eruptive vigor generally declined by mid-September into October. Background on Mayon's geography follows (figures 13-15 and table 9).
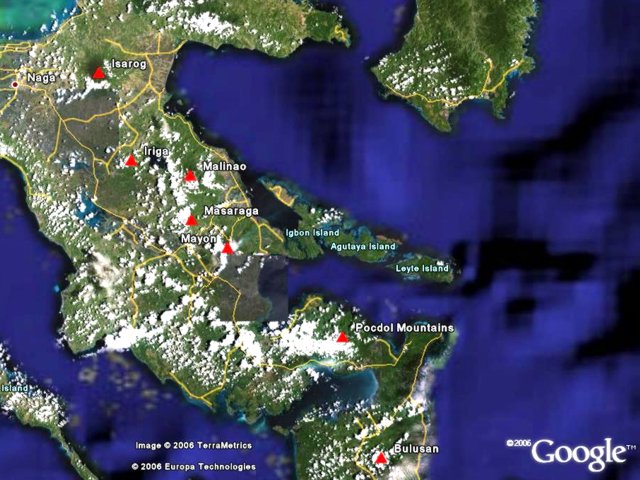 |
Figure 13. Satellite image of the SE area of the Philippine island of Luzon showing Mayon volcano and surrounding volcanoes and towns. Courtesy of Google Earth. |
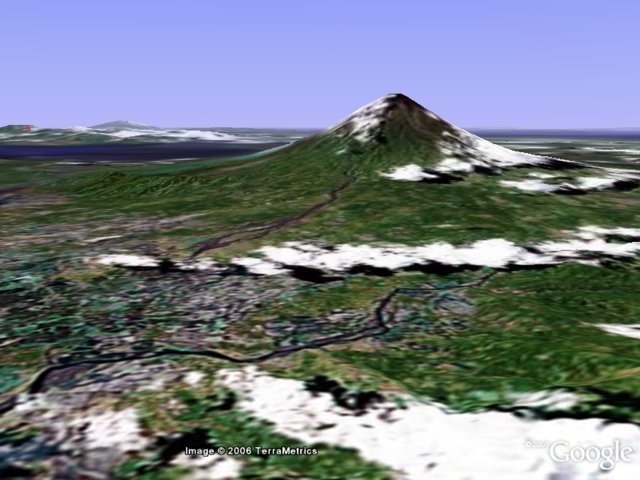 |
Figure 14. Oblique aerial image of Mayon, looking from the N at an eye altitude of 1.78 km. Courtesy of Google Earth. |
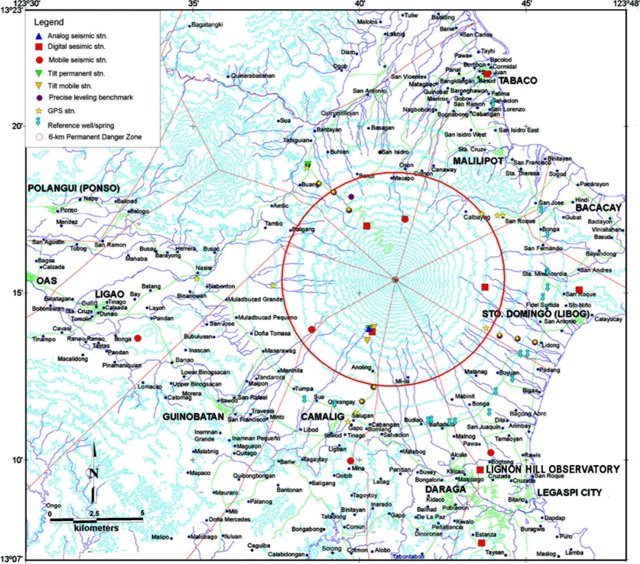 |
Figure 15. Contour map of Mayon volcano showing surrounding towns (see table 9 for more detailed list of names of nearby settlements) . The prominent circle around the volcano delineates the 6-km Permanent Danger Zone. Scale is 1:50,000. Courtesy of PHIVOLCS. |
Table 9. An alphabetical list including some of the settlements and other place names on and surrounding Mayon volcano, and their bearings and distances from the summit. Taken from the PHIVOLCS map referenced below.
| Town Name | Bearing | Distance (km) |
| Alcala | SSE | 9.6 |
| Amtic | NW | 7.7 |
| Anoling | SSW | 6.1 |
| Arimbay | SE | 10.9 |
| Bacacay | ENE | 12 |
| Baligang | WNW | 6.2 |
| Banadero | S | 8 |
| Bantayan | NNW | 9.5 |
| Baranghawon | NNE | 11.4 |
| Basag | W | 9.6 |
| Basagan | N | 8.8 |
| Bigaa | ESE | 10.1 |
| Binanowan | W | 10.7 |
| Binitayan | NE | 10.5 |
| Binogsacan | SW | 12.5 |
| Bonga | SE | 8.5 |
| Bongabong | NNE | 9.3 |
| Bono? | NNW | 7.8 |
| Boring | N | 8.2 |
| Buang | NW | 7.4 |
| Bubulusan | WSW | 10.3 |
| Budiao | S | 8.1 |
| Buhian | NNW | 8.3 |
| Burabod | SE | 9.9 |
| Buyuan | SE | 8.1 |
| Cabangan | SSW | 8.1 |
| Cagsawa | S | 10 |
| Calbayog | NE | 6.5 |
| Camalig | S | 8.8 |
| Canaway | NNE | 7.6 |
| Comon | N | 6.8 |
| Daraga | SSE | 12.2 |
| Dita | SE | 10.3 |
| Dona Tomasa | WSW | 8.5 |
| Fidel Surtida | E | 9.9 |
| Guinobat | N | 11 |
| Guinobatan | SW | 11.8 |
| Hindi | NE | 10.4 |
| Ilawod | SW | 11.5 |
| Kilicao | SSE | 10.3 |
| Legaspi City | SSE | 13.5 |
| Libod | SSW | 10 |
| Lidong | ESE | 8.7 |
| Ligao | W | 14 |
| Lower Bonga | ENE | 8.1 |
| Mabinet | SSE | 8.5 |
| Magapo | NW | 5.7 |
| Maipon | SW | 10 |
| Malilipot | NE | 9 |
| Maninila | SW | 8.1 |
| Mariroc | N | 9.7 |
| Masarawag | SW | 8.1 |
| Matagbac | N | 11 |
| Matanag | SE | 8.4 |
| Matnog | SSE | 8.4 |
| Mayon Rest House Observatory | NW | 3.6 |
| Miisi | S | 6 |
| Muladbucad Grande | W | 8.9 |
| Muladbucad Pequeno | W | 8.8 |
| Nabonton | W | 10.3 |
| Nasisi | W | 10.8 |
| Oson | N | 7.3 |
| Padang | ESE | 9.4 |
| Pingabobong | N | 8.3 |
| Quinastillohan | N | 10 |
| Quirangay | SSW | 7.3 |
| Rawis | SSE | 11.7 |
| Sabinitayan | NE | 10.5 |
| Salugan | SSW | 7.8 |
| Salvacion | S | 8.6 |
| San Andres | E | 10.4 |
| San Antonio | N | 10.2 |
| San Fernando | E | 8.2 |
| San Francisco | NE | 8.8 |
| San Isidro | NNE | 9.3 |
| San Joaquin | SE | 11 |
| San Lorenzo | NNE | 11.7 |
| San Rafael | SW | 10.8 |
| San Roque | E | 8.8 |
| San Vincente | N | 11.4 |
| Sta. Misericordia | E | 8.2 |
| Sta. Misericordia Observatory | E | 7.9 |
| Sta. Cruz | NNE | 8.7 |
| Sto. Domingo | ESE | 10 |
| Sua | SSW | 8.1 |
| Sugod | NE | 10.6 |
| Tabaco | NNE | 12.5 |
| Tabiguian | NW | 8.8 |
| Tagas | NNE | 11.2 |
| Tambo | WNW | 7.9 |
| Tandarora | SW | 9.4 |
| Travesia | SW | 10.8 |
| Tumpa | SW | 8 |
| Upper Bongo | ENE | 8.3 |
Seismicity and lava extrusion generally decreased during 6-26 September. SO2 fluxes broadly declined, generally ranging between 1,200 and 3,000 tons per day, although the 25 August and 2 September readings were outliers, ~ 5,400 and ~ 6,600 tons per day, respectively. Ground-deformation measurements showed an overall deflation. On 11 September, the Alert Level was lowered from 4 to 3 (on a scale of 0-5, with 0 referring to No Alert status).
During late September surface activity was characterized by intermittent spalling of incandescent lava fragments and glow from the summit crater. Steaming at the summit was moderate with white plumes drifting NNE and SE. Low-frequency tremor continued to indicate elevated unrest. Alert Level 3 remained in effect, meaning that the new Extended Danger Zone (EDZ) of 7 km from the summit crater in the SE sector and the normal 6 km-radius Permanent Danger Zone (PDZ) for other areas continued. Table 10 lists Mayon's reported seismicity from 25 August-27 September 2006, continuing the list developed in BGVN 31:07.
Table 10. Summary of 25 August-3 October 2006 events observed at Mayon volcano for 24-hour periods ending at 0800 hours on the date indicated. The SO2 emission rates apply to the gas within the volcanic plume. No data was available for 10, 28, or 29 September. Courtesy of PHIVOLCS.
| Date | Volcanic Earthquakes | Tremor Episodes | Low-frequency Harmonic Tremor | SO2 Emission Rate (tons/day) | Comments |
| 25 Aug 2006 | 17 | 303 | -- | 5401 (magma degassing) | Mild state of eruption, Alert Level 4. |
| 01 Sep 2006 | 25 | 277 | -- | -- | Lava extrusion, four explosions. |
| 02 Sep 2006 | 31 | 248p | -- | 6585 (high) | Small explosion. |
| 03 Sep 2006 | 9 | high | -- | 2021 | -- |
| 04 Sep 2006 | -- | 305 | -- | 2961 | -- |
| 05 Sep 2006 | 0 | 455 | -- | 1447 | -- |
| 06 Sep 2006 | 13 | 295 | -- | 2032 | -- |
| 07 Sep 2006 | 10 | 315 | -- | -- | -- |
| 08 Sep 2006 | 26 | 333 | -- | 1841 | -- |
| 09 Sep 2006 | 2 | 300 | -- | 1701 | -- |
| 11 Sep 2006 | 6 | 206 | -- | 1500 | -- |
| 12 Sep 2006 | 0 | 253 | -- | 1500 | Begin Alert Level 3. |
| 13 Sep 2006 | 8 | 108 | -- | 1500 | -- |
| 14 Sep 2006 | 18 | 111 | -- | 1500 | -- |
| 15 Sep 2006 | 12 | 104 | continuous | 1600 | -- |
| 16 Sep 2006 | 2 | 31 | continuous | 1400 | -- |
| 17 Sep 2006 | -- | 57 | -- | 1800 | -- |
| 18 Sep 2006 | 2 | 57 | continuous | 1500 | -- |
| 19 Sep 2006 | -- | 47 | -- | 1500 | -- |
| 20 Sep 2006 | 1 | 33 | continuous | 1200 | -- |
| 21 Sep 2006 | 3 | 20 | continuous | 2200 | -- |
| 22 Sep 2006 | 2 | 80 | continuous | 1600 | Lava extrusion. |
| 23 Sep 2006 | 1 | 14 | continuous | 1599 | Decline in lava extrusion. |
| 24 Sep 2006 | 6 | 21 | continuous | -- | Intense crater glow. |
| 25 Sep 2006 | 14 | 114 | -- | 1300 | Crater glow, lava extrusion. |
| 26 Sep 2006 | 12 | 65 | -- | 1200 | -- |
| 27 Sep 2006 | 7 | 18 | -- | None measured due to rain. | Crater glow, lava fragments. |
| 30 Sep 2006 | 0 | 3 | -- | None measured due to weather. | White plumes drifting ENE. |
| 01 Oct 2006 | 0 | 0 | -- | None measured due to weather. | White plumes drifting ENE. |
| 02 Oct 2006 | 0 | 0 | -- | None measured due to weather. | -- |
| 03 Oct 2006 | 0 | 0 | -- | -- | -- |
Reference. PHIVOLCS, (date unknown), Geologic map of the deposits and features of the 1984 eruption of Mayon Volcano: PHIVOLCS, prepared by H.B. Ruelo, scale 1:50,000.
Information Contacts: Philippine Institute of Volcanology and Seismology (PHIVOLCS), University of the Philippines Campus, Diliman, Quezon City, Philippines (URL: http://www.phivolcs.dost.gov.ph/).
Eruption ends on 1 October 2006; typhoon causes deadly lahars
The eruption from Mayon that began on 13 July 2006 (BGVN 31:07) ended in early October. By mid-September 2006, the volcano's eruptive vigor had decreased (BGVN 31:08). According to reports by the Philippine Institute of Volcanology and Seismology (PHIVOLCS) through 3 October, low-frequency harmonic tremor was not recorded after 24 September, crater glow was last seen on 27 September, and tremor episodes were not detected after 30 September. Sulfur-dioxide flux was also low on 26 September, 1,200 metric tons per day (t/d), but could not be measured the following week due to poor weather. On 3 October PHIVOLCS noted that there had been a continuous decline in overall activity since 11 September. Lava extrusion apparently ceased on 1 October 2006, as reported by the Ligñon Hill Observatory. As a result, the hazard status was lowered to Alert Level 2, indicating that the possibility of a hazardous eruption was remote.
Fumarolic activity on 30 September and 1 October produced white steam plumes that drifted ENE. On 11 and 12 October steaming was moderate and one volcanic earthquake was recorded. During the first week of October, six low-frequency volcanic earthquakes and one low-frequency short duration harmonic tremor were recorded. Crater glow was seen again on 4 October. The SO2 flux measured on 6 October remained low at 1,600 t/d.
On 25 October, PHIVOLCS announced the lowering of the hazard status to Alert Level 1. The 7-km Extended Danger Zone on the SE flank remained in effect. At that time the number of daily volcanic earthquakes was below background levels (1-5 per day), tremor episodes were rare, there was no ground deformation, SO2 emission was within the typical 1,600-2,650 t/d range, and the observed glow remained at a consistent intensity.
Lahars caused by tropical storm. Typhoon Durian, also called Reming, struck the Philippines on 30 November and mobilized material from the flanks of Mayon that resulted in significant lahars, burying thousands of homes under 1.5 m of volcanic debris, mud, and flood waters. Official government information releases as of 13 December noted that the torrential rains and mudslides, particularly in the area of Mayon, killed 720 people, injured 2,360 others, and left 762 people missing. In addition, 328,218 houses were partially damaged and 214,400 houses were destroyed. A map produced by the United Nations Institute for Training and Research (UNITAR) Operational Satellite Applications Programme (UNOSAT) indicated that about 51 km2 on the flanks of Mayon was damaged by the flooding and mudslides.
Information Contacts: Philippine Institute of Volcanology and Seismology (PHIVOLCS), University of the Philippines Campus, Diliman, Quezon City, Philippines (URL: http://www.phivolcs.dost.gov.ph/); Associated Press (URL: http://www.ap.org/); Agence France-Presse (URL: http://www.afp.com/); United Nations Institute for Training and Research (UNITAR) Operational Satellite Applications Programme (UNOSAT), Palais des Nations, CH - 1211 Geneva 10, Switzerland (URL: http://www.unosat.org/); United Nations Office for the Coordination of Humanitarian Affairs (OCHA) (URL: https://reliefweb.int/).
Mild phreatic explosion with ash plume on 10 August 2008
Our last report on Mayon (BGVN 32:05) discussed an eruption from 13 July to early October 2006, along with deadly lahars down Mayon's flanks caused by a typhoon that struck the Philippines on 30 November 2006. On 25 October 2006, the Philippine Institute of Volcanology and Seismology (PHIVOLCS) lowered the hazard status to Alert Level 1 (low level unrest).
The U.S. Air Force Weather Agency (AFWA) reported that an eruption had occurred on 4 June 2007. It sent a steam-and-ash plume seen on satellite imagery up to 4 km altitude, which blew toward the SW.
There were no further reports on Mayon until August 2008. On 10 August PHIVOLCS reported a mild explosion that produced an ash plume that rose to an altitude of 2.7 km and drifted ENE. According to PHIVOLCS, seismic activity during the weeks before the explosion had increased slightly and incandescence at the crater had intensified. Some inflation of the volcanic edifice also was apparent. The seismic network recorded the ash ejection as an explosion-type earthquake that lasted for one minute. Immediately after the explosion, visual observation becomes hampered by the thick clouds. Precise leveling surveys during 10-22 May 2008 compared to 17 February-2 March 2008 showed the edifice inflated.
A news account inThe Philippine Star described the explosion as phreatic and ash bearing, based on discussions with PHIVOLCS staff.
Information Contacts: Philippine Institute of Volcanology and Seismology (PHIVOLCS), University of the Philippines Campus, Diliman, Quezon City, Philippines (URL: http://www.phivolcs.dost.gov.ph/); U.S. Air Force Weather Agency, Public Affairs Office; 106 Peacekeeper Dr., Ste 2NE; Offutt AFB, NE 68113-4039, USA; The Philippine Star (URL: http://www.philstar.com/).
Increased activity in mid-2009; November 2009 eruption
On 10 August 2008 an explosion and resulting ash plume followed weeks of increased activity and summit incandescence (BGVN 34:02). According to a Philippine Information Agency (PIA) Daily News Reader press release, the 10 August eruption was followed by an M 5.8 earthquake on 15 August and a series of aftershocks that continued through at least 20 August.
On 10 July 2009, the Philippine Institute of Volcanology and Seismology (PHIVOLCS) noted increased activity beginning in June 2009. According to PHIVOLCS, there was a rise in low-frequency volcanic earthquakes, a ground uplift of ~ 1 cm, moderate steam emissions, and summit incandescence. An 8 July overflight discovered the crater contained a "cone-shaped pile of hot, steaming old rocks." The fresh deposits were possibly from a previous eruption, and may have been the source of the glow in the crater. The Alert Level for Mayon was raised from 1 (low level unrest) to 2 (unrest which could lead to more ash explosions or eventually to hazardous magmatic eruptions).
According to a 6 August 2009 article from the Philippine Daily Inquirer, resident PHIVOLCS volcanologist Eduardo Laguerta reported that the number of earthquakes at Mayon had decreased by early August 2009. However, the Inquirer reported that SO2 emissions had increased, with a maximum of 1,977 tons per day on 6 August, compared to 500 tons per day when there is no activity.
PHIVOLCS reported that 11 earthquakes were detected during 14-15 September, with steam plumes drifting NW and ENE. On 15 September, three ash explosions produced a brownish ash plume that rose 700 m above the crater and drifted SW. On 28 October a minor explosion produced a brownish ash plume that rose 600 m above the crater and drifted NE, preceded by 13 volcanic earthquakes over the previous 24-hour period.
On 11 November 2009 another ash eruption occurred at 0158 that lasted for ~ 3 minutes and ejected incandescent rock fragments seen from nearby villages. The explosion was accompanied by rumbling sounds and light ashfall in surrounding areas to the SW, W, and NW. According to the Inquirer, a second explosion was recorded at 0702, with an ash plume reaching 300 m above the crater. The Inquirer reported that residents in Daraga township to the S were ordered to evacuate early, but that further mass evacuations would not be ordered until the Alert Level was raised to Level 3. An aviation ash advisory from the Tokyo VAAC noted continuous ash erupting in MTSAT-IR satellite imagery at 0800 on 11 November.
A 21 November 2009 article from Vox Bikol confirmed that as of 17 November, Mayon continued to exhibit summit incandescence and emit fluctuating amounts of SO2. Due to the continuing unrest PHIVOLCS installed additional seismic monitoring equipment, including three sets of broadband instruments from the Japan International Cooperating Agency (JICA).
A news article from Vox Bikol stated that PHIVOLCS did not observe summit incandescence during 2-3 December due to heavy cloud cover, but as of 4 December 2009 ground deformation and moderate steam emissions were continuing. PHIVOLCS continued to enforce the 6-km-radius Permanent Danger Zone (PDZ) and the 7-km-radius Extended Danger Zone (EDZ) on the SE flank, and urged residents to avoid river channels that are prone to lahars.
Information Contacts: Philippine Institute of Volcanology and Seismology (PHIVOLCS), University of the Philippines Campus, Diliman, Quezon City, Philippines (URL: http://www.phivolcs.dost.gov.ph/); Philippine Daily Inquirer (URL: http://www.inquirer.net/); Tokyo Volcanic Ash Advisory Center (VAAC), Tokyo, Japan (URL: http://ds.data.jma.go.jp/svd/vaac/data/); Vox Bikol (URL: http://www.voxbikol.com/); Philippine Information Agency (URL: http://www.pia.gov.ph/).
December 2009 eruption causes evacuation of more than 47,000 people
After erupting in September and November 2009 (BGVN 34:10), monitoring of Mayon by the Philippine Institute of Volcanology and Seismology (PHIVOLCS) continued. Renewed eruptions began on 14 December 2009 with ash columns reaching as high as 1,000 m above the summit, incandescent materials rolling downslope from the crater, and a lava flow descending SE from the summit (table 11). More than 47,000 people were ordered to evacuate for nearly three weeks (figure 16), requiring them to abandon homes and farms (figure 17). International news attention was acute, highlighting evacuations, the volcano's grandeur, and glow over substantial areas in long-exposure night photos.
Table 11. Daily summaries of observations reported at Mayon, including seismicity, SO2 emission rates, and other observations (including Alert Levels) during 14 December 2009-12 January 2010. Numbers of events represent counts from the seismic monitoring network over a 24-hour period prior to the stated reporting date/time (except as noted). Rockfall events are related to the detatchment of fresh lava fragments at the volcano's upper slopes. Ash explosions and other observation are based on actual sightings. SO2 emission rates, measured by FLYSPEC, are for the day before the reporting date. Courtesy of PHIVOLCS.
| Report Date (local time) | Volcanic earthquakes and rockfalls | Ash explosions | SO2 flux (t/d) | Observations |
| 14 Dec 2009 (2000) | VE: 23(0800-1600) | 6 (3 minutes at 0704) | 535 | Ash columns (gray to brown) to 1 km above summit, drifting WSW and WNW; incandescent materials rolling downslope ~3 km towards Bonga, Buyuan, Mabinit channels. Alert Level raised to 3. |
| 15 Dec 2009 (0800) | VE: 83 | -- | 757 | Incandescent lava fragments from summit crater rolling downslope ~3 km. |
| 16 Dec 2009 (0800) | VE: 78 | -- | 750 | Lava front (~700-800 m from summit) and incandescent fragments ~3-4 km along Bonga gully. |
| 18 Dec 2009 (0700) | VE: 248 | 7 | 1,065 | Dark gray to dark brown ash columns up to 1 km above summit, drifting SW; crater glow. |
| 19 Dec 2009 (0700) | VE: 197 | 15 | 2,034 | 18 volcanic earthquakes; white to grayish ash columns up to 2 km above summit, drifting SW; steam dirty white to light brown; crater glow, continuous rolling downslope of incandescent materials from crater. |
| 20 Dec 2009 (0700) | VE: 222 | -- | 7,024 | Dirty white to gray ash columns to 500 m above summit, drifting SW; crater glow, continuous rolling downslope of incandescent materials; lava flow ~4.5 km along Bonga-Buyuan gully; Alert Level raised to 4. |
| 21 Dec 2009 (0700) | VE: 1,942 | many | 6,089 | Intensified crater glow and rolling incandescent fragments from crater; lava flows along Bonga-Buyuan (to ~5 km from crater), Miisi, Lidong gullies; lava fountains rose ~200 m. |
| 22 Dec 2009 (0700) | VE: 1,266 | reported | 6,529 | Lava flows along Bonga-Buyuan (to ~5 km from crater), Miisi, Lidong gullies. |
| 23 Dec 2009 (0700) | VE: 1,051 | 66 | 6,737 | Ash columns (gray to light brown) to 1 km above summit, drifting SW; lava continuously flowed along Bonga-Buyuan, Miisi, Lidong gullies. |
| 24 Dec 2009 (0700) | VE: 815 | 21 | 5,737 | Ash columns to 1.5 km above summit; lava fountains reached 500 m; lava continuously flowed along Bonga-Buyuan, Miisi, Lidong gullies. |
| 25 Dec 2009 (0700) | VE: 871 RF: 98 | 96 | 2,738 | Ash columns (gray to light brown) up to 2 km above summit; three rockfall events generated pyroclastic flows that moved down ~2 km from crater. |
| 26 Dec 2009 (0700) | VE: 406 RF: 142 | 33 | 8,993 | Ash columns (dirty white to brownish) up to 1 km; lava and rolling incandescent fragments along Bonga-Buyuan, Miisi, Lidong gullies. |
| 27 Dec 2009 (0700) | VE: 44 RF: 297 | 9 | 2,304 | Ash columns (dirty white to brown) with lava fragments up to 800-1,000 m above summit; flowing lava and rolling incandescent lava fragments; edifice remained inflated. |
| 28 Dec 2009 (0700) | VE: 44 RF: 137 | 7 | 4,329 | Ash columns (dirty white to light gray) with lava fragments up to 2 km, drifting SW; lava flows along Bonga-Buyuan, Miisi, Lidong gullies; rolling incandescent fragments. |
| 29 Dec 2009 (0700) | VE: 38 RF: 171 | 9 | 3,416 | Ash columns (dirty white to brown) to 2 km, drifting W and SW; lava flowed along Bonga-Buyuan (to 5.8 km), Miisi, Lidong gullies; rolling incandescent fragments. |
| 30 Dec 2009 (0700) | VE: 16 RF: 150 | 1 | 4,397 | Dirty white ash column ~100 m, drifted NW; lava flowed along Bonga-Buyuan (to 5.9 km from summit), Miisi, Lidong gullies; volcanic edifice remained inflated in NE sector. |
| 31 Dec 2009 (0800) | VE: 60 RF: 267 | -- | 1,158 | Lava extrusion and rolling incandescent fragments along Bongo gully; white steam drifted WSW; volcanic edifice remained inflated in NE sector. |
| 01 Jan 2010 (0700) | VE: 28 RF: 91 | 0 | 1,255 | White steam drifted WSW; flowing lava and rolling incandescent lava fragments. |
| 02 Jan 2010 (0800) | VE: 13 RF: 68 | -- | 2,621 | White steam; Alert Level lowered to 3. |
| 03 Jan 2010 (0700) | VE: 9 RF: 30 | -- | 2,094 | -- |
| 04 Jan 2010 (0700) | VE: 7 RF: 33 | -- | -- | -- |
| 05 Jan 2010 (0700) | VE: 3 RF: 21 | -- | -- | -- |
| 06 Jan 2010 (0700) | VE: 4 RF: 21 | -- | 1,914 | White steam; pale glow from crater at night. |
| 07 Jan 2010 (0700) | VE: 20 RF: 20 | -- | 672 | White steam from summit crater. |
| 08 Jan 2010 (0700) | VE: 5 RF: 29 | -- | 1,077 | -- |
| 09 Jan 2010 (0700) | VE: 5 RF: 20 | -- | 1,345 | Glow from crater at night. |
| 10 Jan 2010 (0700) | VE: 8 RF: 12 | -- | 759 | White steam from summit crater; pale glow from crater at night. |
| 11 Jan 2010 (0700) | VE: 4 RF: 18 | -- | -- | White steam from summit crater, reaching 300-500 m above crater rim, drifting WSW; pale glow from crater at night. |
| 12 Jan 2010 (0700) | VE: 6 RF: 17 | -- | 820 | White steam from summit crater; pale glow from crater at night; ground deformation at Buang and Lidong level lines showed deflation compared to 2 December 2009 survey. |
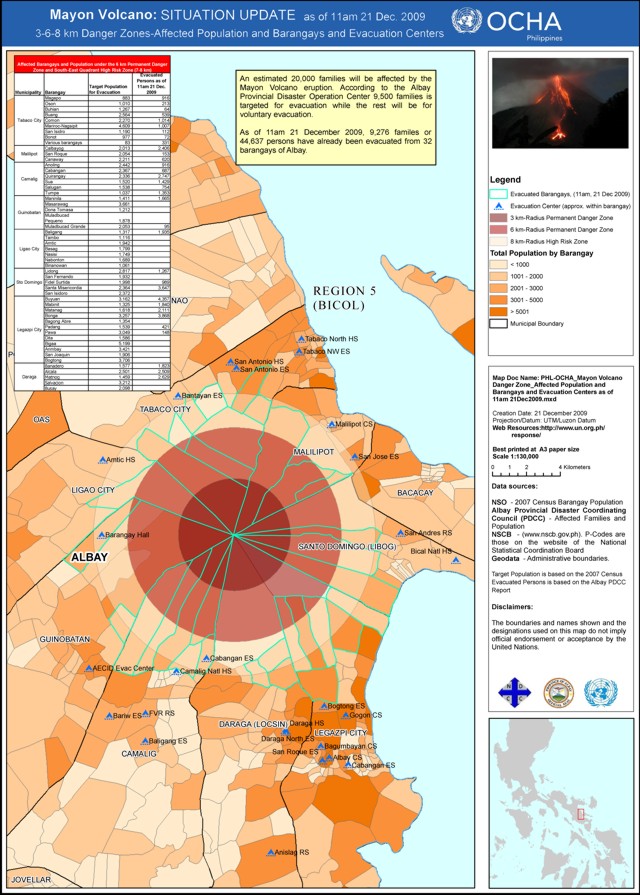 |
Figure 16. A Mayon map variously showing volcanic hazard (3-, 6-, and 8-km radius danger zones), evacuation centers, Albay Province census data (shaded areas defined on legend), and the actual evacuated population (44,637 people). The locations evacuated (table at upper left) were within the 6-km Permanent Danger Zone and SE Quadrant High-Risk Zone (7-8 km radial distance) and came from eight municipalities and their 32 subdivisions (barangays). The table shows both the targeted number of evacuees and the actual number as of 1100 on 21 December. Courtesy of the United Nations OCHA, 21 December 2009. |
 |
Figure 17. A farmer tills the soil while Mayon steams in the background. Many residents in threatened areas were reluctant to leave their homes and livestock. Date and photographer unknown. Courtesy of AFP. |
At the onset of the eruption, after a minor ash explosion at 0740 on 14 December, five more minor ash explosions occurred at the summit crater. These explosions produced brownish to grayish ash clouds which were blown by strong winds WSW and WNW. The explosions lasted for ~3 minutes and were registered on the seismograph as explosion earthquakes. Twenty-three volcanic earthquakes were also recorded from 0800 to 1600. During the morning of 14 December the sulfur dioxide (SO2) emission rate measured by FLYSPEC [a miniature, light-weight ultraviolet correlation spectrophotometer (Horton and others, 2006)] was 757 metric tons/day (t/d). At 1800, incandescent materials originating from the summit crater were seen rolling downslope SE ~3 km in the direction of Bonga, Buyuan, and Mabinit channels.
On 14 December 2009 PHIVOLCS raised the hazard status to Alert Level 3 (meaning that magma is close to the crater and a hazardous explosive eruption is possible). The alert was again raised, to Level 4 (meaning a hazardous explosive eruption is possible within days), on 20 December. After decreased activity the Alert was lowered to Level 3 on 2 January 2010.
Satellite observations and measurements. Figure 18 shows a satellite image of Mayon captured on 15 December 2009. NASA's Jesse Allen noted that "A small plume of ash and steam is blowing west from the summit. Dark-colored lava or debris flows from previous eruptions streak the flanks of the mountain. A ravine on the southeast slope is occupied by a particularly prominent lava or debris flow."
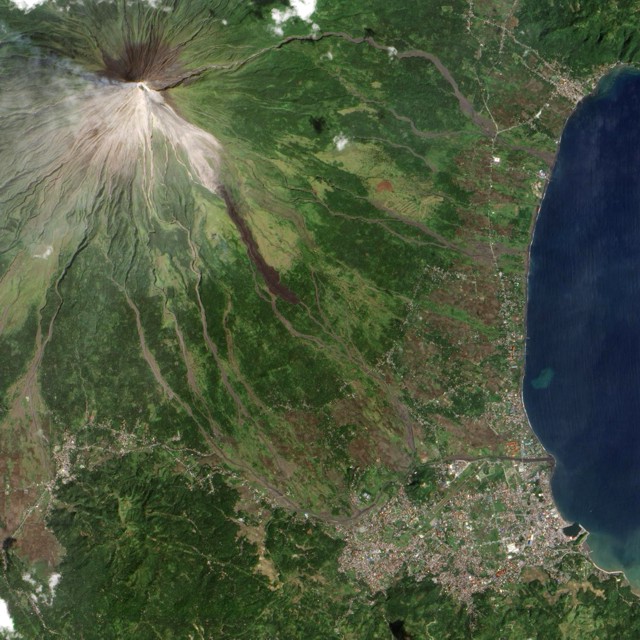 |
Figure 18. A natural-color image of Mayon taken 15 December 2009 (N to the top; for approximate scale, the distance from the summit to the coast is ~10 km). Image acquired by the Advanced Land Imager on NASA's Earth Observing-1 (EO-1) satellite. Courtesy of NASA. |
MODIS/MODVOLC satellite thermal alerts were measured nearly daily during 14-31 December 2009; alerts were absent after 31 December 2009 and at least as late as 12 January 2010. It is noted that during 3 passes of the MODIS satellite (on 24 December at 1715 UTC, 25 December at 1330 UTC, and 28 December at 1400 UTC), 11-pixel alerts occurred each pass that gave some idea of the area covered by the thermal anomaly. Prior to this period, alerts were measured only during an eruption of Mayon from 15 July-25 September 2006 (BGVN 31:07, 31:08, 32:05, and 34:02).
Evacuation. The alert status rose from Level 3 to 4 (on a scale of 1-5) on 20 December (table 11). According to a news article by Sophia Dedace at GMANews.TV on 14 January 2010, between 14 December and 2 January, the threatening eruption prompted the provincial government to evacuate more than 47,000 residents located within Mayon danger zones.
Reference. Horton, K.A., Williams-Jones, G., Garbeil, H., Elias, T., Sutton, A.J., Mouginis-Mark, P., Porter, J.N., and Clegg, S., 2006, Real-time measurement of volcanic SO2 emissions: validation of a new UV correlation spectrometer (FLYSPEC): Bull. Volc., v. 68, no. 4, p. 323-327 (doi:10.1007/s00445-005-0014-9).
Information Contacts: Philippine Institute of Volcanology and Seismology (PHIVOLCS), Department of Science and Technology, University of the Philippines Campus, Diliman, Quezon City, Philippines (URL: http://www.phivolcs.dost.gov.ph/); Philippine Daily Inquirer (URL: http://www.inquirer.net/); Vox Bikol (URL: http://www.voxbikol.com/); Philippine Information Agency (URL: http://pia.gov.ph/); GMANews.TV, 6/F GMA Network Center, EDSA corner Timog Avenue, Diliman, Quezon City, 1101, PHILIPPINES (URL: http://www.gmanews.tv/index.html); Jesse Allen, NASA (URL: https://www.nasa.gov/), and MODIS/MODVOLC Thermal Alerts, Hawai'i Institute of Geophysics and Planetology (HIGP) Thermal Alerts System, School of Ocean and Earth Science and Technology (SOEST), Univ. of Hawai'i, 2525 Correa Road, Honolulu, HI 96822, USA (URL: http://modis.higp.hawaii.edu/); Agence France Presse (URL: http://www.afp.com/).
Brief seismic crisis in May 2011, low activity follows
Mayon volcano (figure 19) underwent an eruptive crisis in late 2009 into early 2010 and a seismic crisis in May 2011. This report provides some final remarks on the late 2009 to early 2010 eruptive crisis, and summarizes activity through 23 September 2011. Our previous report summarized the heightened activity in December 2009, which culminated in the evacuation of 47,000 people from their homes (BGVN 34:12). The eruption waned following the evacuation, and, accordingly, the Philippine Institute of Volcanology and Seismology (PHIVOLCS) lowered the Alert Level from a high of 4 to 3 (on a scale from 0 to 5) on 2 January 2010. At that point, ~2,000 evacuees were still unable to return to their homes. On 13 January, the Alert Level was lowered from 3 to 2, and, according to Sophia Dedace (GMANews), enabled the remaining evacuees to return to their homes. Dedace reported that Governor Joey Salceda estimated the damage to agriculture and infrastructure from Mayon's 2009-2010 eruption at 26.2 million Philippine pesos (~$600,000 USD).
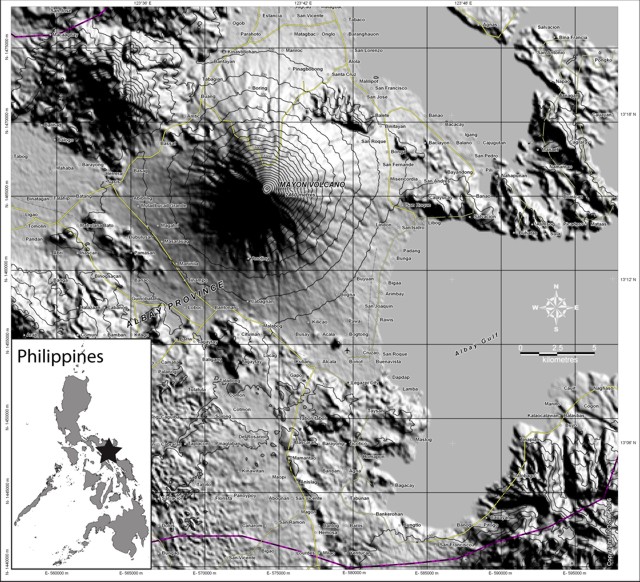 |
Figure 19. Maps showing geographic location (star on index map) and shaded relief map of Mayon volcano. Index map courtesy of Ginkgo Maps; shaded relief map courtesy of United Nations Institute for Training and Research's (UNITAR's) Operational Satellite Applications Programme (UNOSAT). |
On 2 March 2010, amid continually declining activity at Mayon, PHIVOLCS lowered the Alert Level from 2 to 1. As of 23 September 2011, the Alert Level remained unchanged, indicating, as stated by PHIVOLCS, "low level unrest" and that "no eruption [is] imminent." At Alert Level 1 (and all higher levels), access is prohibited within the 6-km-radius Permanent Danger Zone.
With the exception of May 2011, seismicity (figure 20) typically consisted of no more than a few volcanic earthquakes and rockfall events per day (i.e. less than 50 of either type per month) and relatively low SO2 flux (averaged per month on figure 20). Mayon typically vented ash-free steam at weak-to-moderate intensities, and crater glow persisted, observable by residents at night.
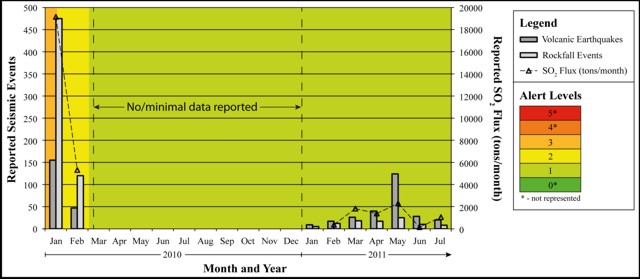 |
Figure 20. Reported volcanic earthquakes and seismically detected rockfall events per month (dark and light gray bars, respectively, left axis) and SO2 flux (open triangles and dashed line) averaged per month (right axis) at Mayon from 1 January 2010 to July 2011. Background colors indicate the Alert Level corresponding to the scale to the right of the figure. Little if any data are available from March through December 2010, presumably due to low activity during this interval. Data courtesy of Philippine Institute of Volcanology and Seismology (PHIVOLCS). |
During May 2011 there was a significant increase in seismicity, reaching a daily maximum of 38 volcanic earthquakes on 25 May. This increase coincided with a slight increase in the SO2 flux (averaged per month, figure 20). The increase in both seismicity and SO2 flux was short-lived, and activity declined to relatively low levels by June 2011.
Information Contacts: Philippine Institute of Volcanology and Seismology (PHIVOLCS), Department of Science and Technology, University of the Philippines Campus, Diliman, Quezon City, Philippines (URL: http://www.phivolcs.dost.gov.ph/); GMANews.TV, 6/F GMA Network Center, EDSA corner Timog Avenue, Diliman, Quezon City, 1101, PHILIPPINES (URL: http://www.gmanews.tv/index.html); United Nations Institute for Training and Research's (UNITAR's) Operational Satellite Applications Programme (UNOSAT), Palais des Nations, CH-1211 Geneva 10, Switzerland (URL: http://www.unitar.org/unosat/); Ginkgo Maps (URL: http://www.ginkgomaps.com/).
Mainly calm during 2009-2013; 7 May 2013 explosion kills five climbers
Mayon's emissions, often small, gas-driven, ash-bearing, and without visible magmatic components, were generally minor during 2009 through early June 2013. After erupting in late 2009, Mayon seismicity generally declined to baseline levels through 23 September 2011 (BGVN 36:09). This report summarizes seismic activity from the end of the last report into early June 2013. The summit crater released a sudden minor phreatic eruption on 7 May 2013 that would have been harmless except for the ejection of some large blocks and the presence of dozens of climbers on the nearby upper slopes; five died.
According to the Philippine Institute of Volcanology and Seismology (PHIVOLCS), small ground and tilt deformations observed since 2 March 2010 were probably due to regional faulting and not magmatic intrusion. A report published by PHIVOLCS on 27 November 2012 noted that precise leveling surveys found slight inflation of the lower N and E slopes; ground tilt changes were not fully consistent with volcanic ground deformation, but rather with incremental motion along a nearby segment of the Philippine fault zone.
That November 2013 report also noted that steaming had waned significantly by 27 November 2012. Steaming from the crater varied, but was, by November 2012, weak and occasionally wispy. The report indicated that crater incandescence had ceased since March 2012. Sulfur dioxide emissions had decreased to below baseline levels of 500 metric tons/day. As a result of diminished activity, PHIVOLCS decreased the Alert Level to 0 on 27 November 2012; however, the public was reminded not to enter the 6-km-radius Permanent Danger Zone.
The next available report on Mayon indicated that a small phreatic eruption occurred on 7 May 2013 lasting in the range of 73-146 seconds. PHIVOLCS observed that a gray-to-brown ash cloud rose 500 m above the crater and drifted WSW. Traces of ash fell in areas WNW, affecting communities up to 19 km away. The seismic network detected a single associated rockfall event. Seismicity and gas emissions remained within background levels and indicated no increase in activity. The Alert Level remained at 0.
Gas-driven explosion and fatalities on 7 May. PHIVOLCS posted a photo of the eruption taken at distance (figure 21). According to news reports, that 7 May event was fatal to climbers who had ventured to [500 m] of the summit, a point well within the 6-km-radius Permanent Danger Zone. Multiple news articles (including those in Interaksyon, The Philippine Star, Associated Press, Sunstar, and GMA Network) noted that the 7 May 2013 phreatic eruption at 0800 ejected large rocks towards climbers, killing five and injuring at least seven. A climber was quoted as saying that their team was resting when they heard a loud rumbling and then saw falling rocks "as big as a living room." A local tour operator said "It rained like hell with stones. It was sudden and there was no warning."
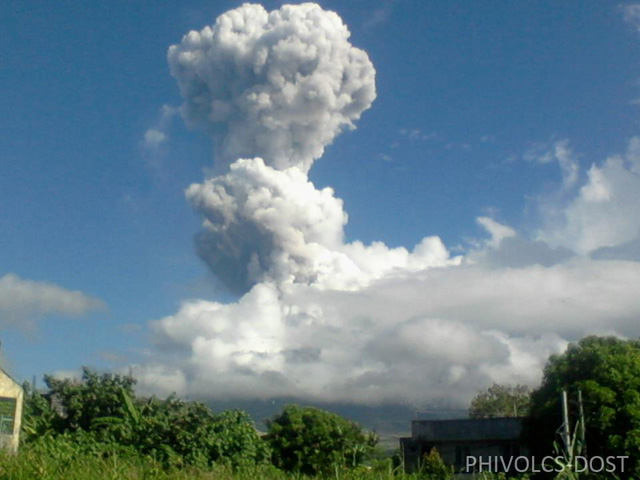 |
Figure 21. Photo taken at 0800 on 7 May 2013 of a phreatic eruption at Mayon. Dense billowy plume is largely white with areas of brown to gray. News reports said eruptions like this were, according to PHIVOLCS, a regular occurrence. PHIVOLCS reported this plume as 500 m tall. According to news reports, rocks discharged by this eruption at 0800 killed five climbers and injured at least seven others in a region close to the summit and well within an exclusionary zone. Courtesy of PHIVOLCS. |
One of the more detailed news reports, a 7 May article by Andrei Medina and Amanda Fernandez in GMA News, said that at least two groups of climbers were on the volcano at the time of the explosion. One of those groups, 20 climbers, incurred all five fatalities. Those fatalities included 4 foreigners [Europeans] and one Filipino tour guide. The article said that (according to Bernardo Rafaelito Alejandro, head of the Office of Civil Defense in Bicol) the foreign nationals and their guide were about half a kilometer from the crater when the 0800 explosion occurred. Another group, consisting of about seven climbers on another trail suffered three injuries (all Indonesians). Other articles raised sometimes inconsistent details about the number, composure, and locations of the various groups on the volcano.
Although authorities had set the Alert Level at the lowest risk (0, at a scale reaching up to 6) at the time of the eruption, and it remained so immediately thereafter, they had previously established the Permanent Danger Zone. In accord with this information, the article said that Albay Governor Joey Salceda said that the mountain climbing activities of the two groups affected were unauthorized. He added the tourist guides also failed to secure a permit from the Albay Public Safety and Emergency Management Office (APSEMO) and the Department of Tourism." The article went further to say that Bernardo Rafaelito Alejandro, head of the Office of Civil Defense in Bicol, said there was no need to evacuate the residents near the volcano, adding such eruptions are expected from an active volcano, and evacuation only occurs during an Alert Level 3.
An 11 May article by Cet Dematera and Celso Amo in The Philippine Star noted that the bodies of the four foreign nationals had been retrieved from Mayon's slopes. Another climber on Mayon during the 7 May eruption, Boonchai Jattupornpong, had lost contact with fellow Thai climbers, but had survived for 4 days by gathering rainwater. He was found, carried out, and brought to a hospital suffering burns, cuts, and a fractured arm. The composite disaster team involved in the search, rescue, and retrieval operations after the 7 May disaster was recommended for awards and commendation, including a possible Bronze Cross medal award or equivalent, for bravery and heroism by the Albay Provincial Governments.
Rockfalls, degassing, and incandescence. On 8 May 2013, PHIVOLCS reported that two rockfalls at Mayon had been detected within the previous 24 hours. Seismicity remained within background levels and indicated no increase in overall volcanic activity.
On 31 May 2013, PHIVOLCS raised the Alert Level to 1 as a precaution because, during the previous 36-hours, a visible but weak and short-lived hydrogen sulfide (H2S) emission was observed, along with a persistent incandescence. PHIVOLCS was concerned that the incandescence might reflect a steady emission of magmatic gas. However, PHIVOLCS also noted that seismicity remained markedly low and sulfur dioxide (SO2) measurements remained below the normal level. A ground deformation survey indicated slight edifice inflation compared to a 13 February 2013 survey.
According to PHIVOLCS, white to off-white steam plumes drifted in various directions during 5-10 June. Occasionally, bluish fumes were noted. During most evenings during this period, PHIVOLCS observed incandescence from the crater, although cloud cover sometimes obscured the volcano. The seismic network recorded one volcanic earthquake during 5-6 June and another one during 9-10 June. During 6-7 June, a single rockfall signal was detected.
Information Contacts: Philippine Institute of Volcanology and Seismology (PHIVOLCS) (URL: http://www.phivolcs.dost.gov.ph); InterAksyon (URL: http://www.interaksyon.com); The Philippine Star (URL: http://www.philstar.com/); Sunstar (URL: http://www.sunstar.com.ph/).
Quiet during May 2013-November 2013; super-typhoon and lahars
Following the phreatic eruption on 7 May 2013 that killed 7 climbers (BGVN 38:04), there has been little increase in volcanic activity at Mayon volcano. Seismicity has mostly receded to baseline levels, aside from occasional volcanic earthquakes. These earthquakes occur about once every other day, with minimal earthquakes in June and September. The activity reported by the Philippine Institute of Volcanology and Seismology (PHIVOLCS) in table 12 below represents a continuation of table 11 from a previous Bulletin report (BGVN 34:12). Rockfalls and earthquakes are plotted in figure 22.
Table 12. Almost daily summaries of observations at Mayon, including seismicity and SO2emission rates during 1 June -23 November 2013. Number of events represent counts from the seismic monitoring network over a 24-hour period prior to the stated reporting date/time (except as noted). For example RF: 1 means 1 rockfall; and VE: 2 means 2 volcanic earthquakes. Rockfall events are related to the detachment of lava fragments at the volcano's upper slopes. No ash explosions were recorded during this time period. SO2 emission rates, measured by FLYSPEC [a miniature, light-weight ultraviolet correlation spectrometer (Horton and others, 2006)], are for the day before the reporting date. Courtesy of PHIVOLCS.
| Report Date(local time), 2013 | Volcanic earthquakes (VE) and rockfalls (RF) | SO2 flux (tonnes/day) |
| 01 June | -- | 131 |
| 02 June | RF: 1 | -- |
| 05 June | VE: 1 | -- |
| 07 June | RF: 1 | -- |
| 10 June | VE: 1 | -- |
| 13 June | VE: 1 | -- |
| 14 June | -- | 133 |
| 18 June | VE: 1 | -- |
| 01 July | RF: 2 | -- |
| 02 July | VE: 1 | -- |
| 05 July | VE: 2 | -- |
| 13 July | VE: 1 RF: 2 | -- |
| 17 July | VE: 2 | -- |
| 18 July | VE: 2 RF: 1 | -- |
| 19 July | VE: 2 | -- |
| 21 July | VE: 1 | -- |
| 27 July | VE: 1 | -- |
| 28 July | VE: 2 | -- |
| 31 July | VE: 2 | -- |
| 01 August | RF: 1 | -- |
| 02 August | RF: 1 | -- |
| 05 August | VE: 1 | -- |
| 06 August | VE: 1 | -- |
| 07 August | VE: 2 | -- |
| 08 August | VE: 2 | -- |
| 09 August | VE: 2 | -- |
| 11 August | VE: 2 | -- |
| 14 August | -- | 322 |
| 16 August | VE: 1 | -- |
| 21 August | VE: 1 | -- |
| 23 August | VE: 1 | 107 |
| 24 August | VE: 1 | -- |
| 30 August | -- | 183 |
| 10 September | -- | 218 |
| 17 September | VE: 1 | -- |
| 28 September | VE: 1 | |
| 02 October | VE: 1 | -- |
| 03 October | VE: 1 | -- |
| 05 October | VE: 3 | -- |
| 07 October | VE: 1 | -- |
| 09 October | VE: 1 | 159 |
| 10 October | VE: 1 | -- |
| 13 October | VE: 1 | -- |
| 16 October | -- | 466 |
| 22 October | VE: 1 | 260 |
| 23 October | VE: 1 | -- |
| 24 October | VE: 2 | -- |
| 25 October | -- | 84 |
| 31 October | VE: 4 | -- |
| 13 November | VE: 2 | -- |
| 15 November | VE: 1 | -- |
| 17 November | VE: 1 | -- |
| 18 November | VE: 1 | -- |
| 19 November | VE: 1 | -- |
| 20 November | VE: 1 | -- |
| 21 November | VE: 3 | -- |
| 22 November | VE: 2 | -- |
| 23 November | VE: 5 | 211 |
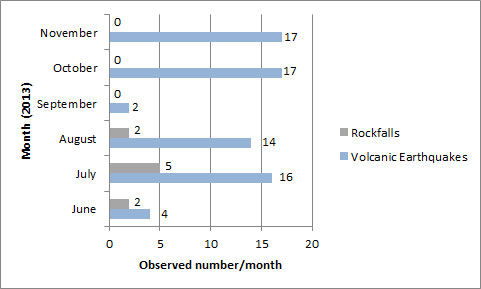 |
Figure 22. Graph showing distribution of volcanic earthquakes and rockfalls from June 2013 to November 2013. Created by Bulletin editors from PHIVOLCS reports. |
When cloud cover and heavy rain does not inhibit observations, PHIVOLCS had consistently recorded white steam plumes that drifted in various directions from June to November 2013. Bluish fumes, a sign of hydrogen sulfide, were witnessed on 5 and 7 June, 15 and 23 August, and 7 and 28 September. Ground deformation surveys in the second week of August showed that the inflationary trend was continuing. In May 2013, electronic tilt meters measured Mayon's edifice to be slightly inflated compared to January 2010.
Crater glow of Intensity 1 was observed numerous times from June to September. According PHIVOLCS, a crater glow of Intensity 1 is faint, Intensity 2 is more visible to the naked eye, Intensity 3 is bright, and Intensity 4 is intense. Crater glow likely results from incandescence of new lava, or newly exposed lava, reflecting off local crater walls, clouds, or steam.
PHIVOLCS interprets enhanced crater glow as a sign of SO2 clouds, but there had been little SO2 fluctuation from June to November. Mayon's Alert status remained at Level 1 following the increase from Level 0 on 31 May 2013. However, PHIVOLCS continues to advise residents and visitors to avoid the 6-kilometer radius Permanent Danger Zone (PDZ) due to hazards such as rockfalls, landslides, sudden ash emissions, and phreatic eruptions. Level 1 is the 2nd value on a scale from 0 to 5, with 5 signifying an ongoing hazardous eruption; level 1 indicates an abnormal condition, but no magmatic eruption is imminent.
On 6 November 2013, PHIVOLCS issued a warning for super-typhoon Haiyan, locally known as Yolanda, indicating that excessive rainfall might trigger landslides and lahars at Mayon. Peak winds during Haiyan were consistently 170 mph, making the storm a super-typhoon as classified by NOAA ("maximum sustained 1-minute surface winds of at least [150 miles per hour]"). With the potential of large-magnitude lahars, the province of Albay started an evacuation of about 103,200 people along areas downstream, as shown in figure 23. According to the news source, Inquirer, adjacent communities, including Guinobatan, Legaspi City, Sto. Domingo, Daraga and Ligao City, were at risk for inundation, burial and washout. PHIVOLCS also issued precautions concerning debris flows from landslides of Mt. Masaraga, an old volcanic edifice N of Mayon.
 |
Figure 23. Super-typhoon Haiyan left destruction in its wake after hitting the Philippines in early November. In this photo from the Associated Press, residents downstream from Mayon were evacuated due to the possibility of lahars engulfing nearby communities (Daily Mail). |
Information Contacts: Philippine Institute of Volcanology and Seismology (PHIVOLCS); Associated Press (URL: http://www.ap.org/); Daily Mail (URL: http://www.dailymail.co.uk); NOAA (URL: http://www.aoml.noaa.gov); and Philippine Daily Inquirer (URL: http://www.inquirer.net/).
New lava dome appears in summit crater, August 2014; evacuations due to rockfall hazard
The Philippine Institute of Volcanology and Seismology (PHIVOLCS) reported that visual observations of Mayon volcano's summit crater on 12 August 2014 revealed the growth of a new lava dome approximately 30-50 m high. This event was preceded by inferred low-volume intrusions that cause inflation and increased sulfur dioxide (SO2) emissions (beyond the baseline level of 500 tonnes/day) over the previous two months. The sulfur dioxide flux was 850 t/d on 11 August (table 13). Volcanic earthquakes and rockfalls, however, remained at baseline levels, and almost no crater glow had been observed since May 2014.
Table 13. Measured sulfur dioxide flux (metric tons/day) at Mayon, 11 August-29 September 2014. Baseline level for SO2 is 500 t/d (during quiescence) based on continuous gas measurements since June 2014. Courtesy of PHIVOLCS.
| Date | SO2 flux, t/d |
| 11 Aug 2014 | 850 |
| 19 Aug 2014 | 309 |
| 22 Aug 2014 | 1,266 |
| 29 Aug 2014 | 1,170 |
| 02 Sep 2014 | 611 |
| 06 Sep 2014 | 2,360 |
| 12 Sep 2014 | 457 |
| 14 Sep 2014 | 6,253 |
| 17 Sep 2014 | 757 |
| 22 Sep 2014 | 1,046 |
| 23 Sep 2014 | 569 |
| 24 Sep 2014 | 606 |
| 26 Sep 2014 | 680 |
| 27 Sep 2014 | 1,265 |
| 29 Sep 2014 | 1,421 |
The emergence of the new dome prompted PHIVOLCS to raise the Alert Level on 15 August from 1 to 2 (on a scale of 0-5) (see table 14). Sulfur dioxide flux remained high over the next month, suddenly rising to over 6,000 t/d on 14 September. On 15 September PHIVOLCS raised the Alert Level to 3 and reported that activity had escalated, including 39 rockfalls during 0500-0800 and 32 low-frequency volcanic earthquakes. Crater glow became visible around 2000, and thermal anomalies were detected in MODIS data by MODVOLC (2 pixels). According to a news article some residents in Guinobatan (11.8 km SW) had already evacuated.
White plumes rose from the crater on 16 September (figure 24), with incandescence seen later and incandescent material descending the upper reaches of Bonga Gully on the SE flank. During the previous 24 hours, there were 32 volcanic earthquakes and 72 rockfall events. Incandescent material moving down the cone was obvious at night on 17 September (figure 25), and a news article indicated that almost 24,000 people from villages within an 8-km radius from the crater had been evacuated.
Seismicity and rockfalls increased over the next few days, though clouds prevented visual observations. During 17-18 September the network recorded 142 volcanic earthquakes and 251 rockfall events. White steam plumes drifting SSW were noted. The network recorded 38 volcanic earthquakes and 277 rockfall events during 18-19 September. During 19-21 September four volcanic earthquakes along with 8-22 rockfall events per day were recorded. White steam plumes drifted ENE and NNE during 20-21 September. During 21-23 September three volcanic earthquakes per day and 13-18 rockfalls per day were recorded; white steam plumes drifted NNE, NE, ENE, and SW.
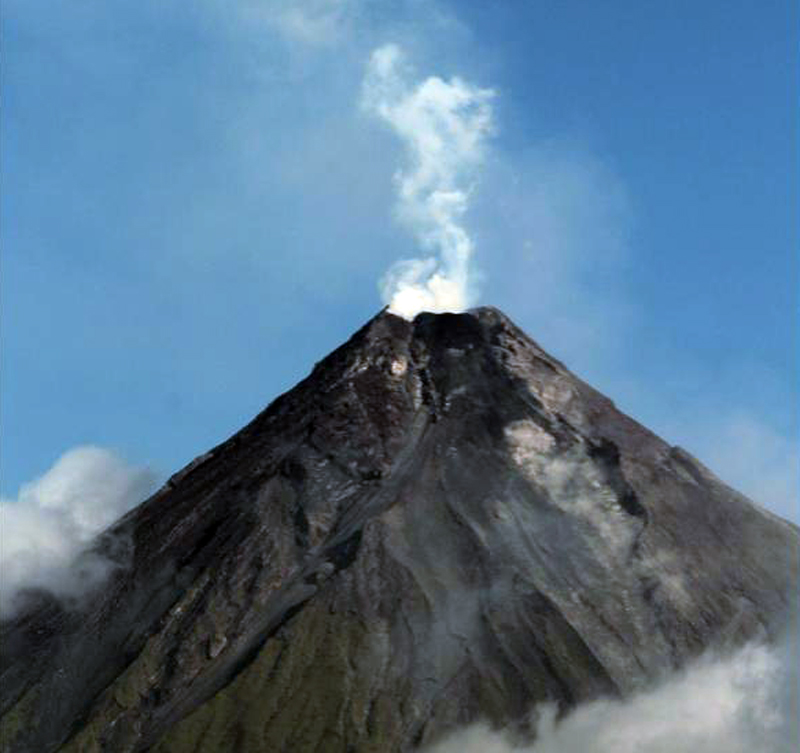 |
Figure 24. Mayon volcano emits white plumes as seen from Legazpi, Albay province, SE of Manila on 16 September 2014. Courtesy of Charism SAYAT/AFP/Getty Images via The Weather Channel. |
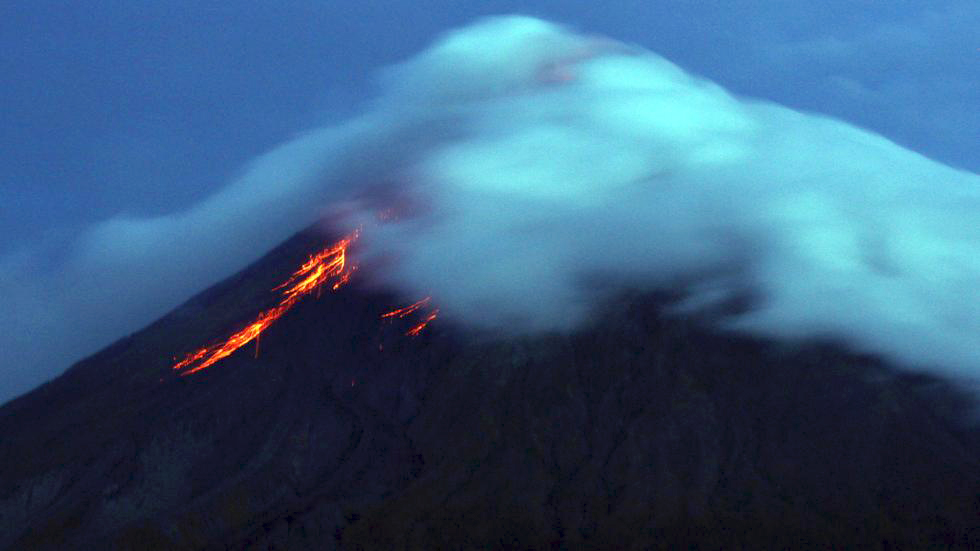 |
Figure 25. Lava flows from the crater of Mayon volcano seen from Legazpi City, Albay province, southeast of Manila on 17 September 2014. Courtesy of Charism SAYAT/AFP/Getty Images via The Weather Channel. |
According to a news article, the Albay Province Public Safety and Emergency Management Office stated that more than 54,000 people were in evacuation shelters as of 30 September. On 12 October the Office of the Governor of Albay issued a statement noting that 12,602 families (about 56,000 people) had been relocated to 46 evacuation centers.
Volcanic earthquakes (up to nine per day) and rockfalls (as many as six per day) continued to be detected at least through 12 October. During an overflight on 12 October 2014, volcanologists from PHIVOLCS observed a 350-m-long lava flow traveling down the SE flank, on the E side of Bonga Gully. The report noted that the small number of volcanic earthquakes and rockfall signals during the previous few days indicated slow lava extrusion from the crater and a slow-moving lava flow downslope. On 14 October a seismic signal indicating a rockfall was recorded and a brief period of incandescence from the crater was observed. During 14-21 October white plumes rose from the crater and drifted NW, W, WSW, SW, and SE, and a few volcanic earthquakes were recorded during 18-21 October. On 19 October weak incandescence from the crater was noted. A new lava flow first observed later that same day was 300-400 m long by 20 October, based on an aerial survey. Weak crater incandescence from the lava dome was again seen on 21 October.
During 22 October-4 November 2014, white plumes rose from the crater and drifted SW, WSW, WNW, and NW. Weak incandescence from the crater was noted at night on 22, 25, 27, and 28 October, and a few volcanic earthquakes and rockfall signals were periodically recorded.
A PHIVOLCS report on 4 November 2014 noted that ground deformation continued to be detected (since the beginning of 2014). Tilt data from the network on the NW flank indicated continuing inflation since August, subsequent to a period of inflation in June and July. Precise leveling measurements also indicated sustained inflation.
White plumes continued to rise from the crater in November and early December 2014, and weak incandescence was noted some nights. As many as five volcanic earthquakes were recorded per day. Data from a deformation study conducted during 9-13 November 2014 indicated deflation relative to 21-28 October, although the volcano remained inflated relative to the baseline.
On 19 December 2014, PHIVOLCS reported a general decline in the overall activity since a seismic swarm last detected on 29 November. Specifically, for the previous three weeks, seismic activity had declined to an average 2-3 mostly volcano-tectonic earthquakes daily, a few low-frequency earthquakes, and a few minor rockfall events. In addition, deformation data did not indicate magma intrusion; sulfur dioxide emissions had declined on 2 October 2014 to below the baseline value; no lava flows had been observed since 19 October.
The Alert Level was lowered to 2 (on a 0-5 scale) on 19 December 2014. Activity continued to decrease; the Alert Level was reduced to 1 (abnormal) on 3 September 2015 and to 0 (no alert) on 12 February 2016.
Table 14. Mayon volcano Alert Levels as revised on 15 August 2014. Courtesy of PHIVOLCS.
| Alert Level | Main Criteria | Interpretation/Recommendations |
| 0. No Alert | Quiet. All monitored parameters within background levels. | No eruption in foreseeable future. Entry in the 6-km radius Permanent Danger Zone (PDZ) is not advised because phreatic explosions and ash puffs may occur without precursors. |
| 1. Abnormal | Low level unrest. Slight increase in seismicity. Slight increase in SO2 gas output above the background level. Very faint glow of the crater may occur but no conclusive evidence of magma ascent. Phreatic explosion or ash puffs may occur. | No eruption imminent. Activity may be hydrothermal, magmatic or tectonic in origin. No entry in the 6-km radius PDZ. |
| 2. Increasing unrest | Moderate unrest. Low to moderate level of seismic activity. Increasing SO2 flux Faint/intermittent crater glow. Swelling of edifice may be detected. Confirmed reports of decrease in flow of wells and springs during rainy season. | Unrest probably of magmatic origin; could eventually lead to eruption. 6-km radius Danger Zone may be extended to 7 km in the sector where the crater rim is low. |
| 3. Increased tendency towards eruption | Relatively high unrest. Volcanic quakes and tremor may become more frequent. Further increase in SO2 flux. Occurrence of rockfalls in summit area. Vigorous steaming / sustained crater glow. Persistent swelling of edifice. | Magma is close to the crater. If trend is one of increasing unrest, eruption is possible within weeks. Extension of Danger Zone in the sector where the crater rim is low will be considered. |
| 4. Hazardous eruption imminent | Intense unrest. Persistent tremor, many "low frequency"-type earthquakes. SO2 emission level may show sustained increase or abrupt decrease. Intense crater glow. Incandescent lava dome, lava fountain, lava flow in the summit area. | Hazardous eruption is possible within days. Extension of Danger zone to 8 km or more in the sector where the crater rim is low will be recommended. |
| 5. Hazardous eruption | Hazardous eruption ongoing. Occurrence of pyroclastic flows, tall eruption columns and extensive ashfall. | Pyroclastic flows may sweep down along gullies and channels, especially along those fronting the low part(s) of the crater rim. Additional danger areas may be identified as eruption progresses. Danger to aircraft, by way of ash cloud encounter, depending on height of eruption column and/or wind drift. |
Information Contacts: Philippine Institute of Volcanology and Seismology (PHIVOLCS), Department of Science and Technology, University of the Philippines Campus, Diliman, Quezon City, Philippines (URL: http://www.phivolcs.dost.gov.ph/); Office of the Governor of Albay, Philippines (URL: http://albay.gov.ph/); Philippine Daily Inquirer (URL: http://www.inquirer.net/); Associated Press (URL: http://www.ap.org/); The Weather Channel, 17 Sept. 2014 (URL: https://weather.com/); Inquirer.net (URL: http://newsinfo.inquirer.net/641491/phivolcs-volume-of-magma-moving-up-mayon-similar-to-2009-eruption); BBC News (URL: http://www.bbc.com/news/world-asia-29217253); Daily Mail (URL: http://www.dailymail.co.uk/).
Explosion on 13 January 2018 begins new eruptive episode; 5-km-high ash plume on 22 January
Steep-sloped and symmetrical Mayon has recorded historical eruptions back to 1616 that range from Strombolian fountaining to basaltic and andesitic flows, as well as large ash plumes, and devastating pyroclastic flows and lahars. A lava dome that grew during August-October 2014 resulted in rockfalls, pyroclastic flows, and lava flows from the summit crater that led to evacuations in nearby communities (BGVN 41:03). Activity declined during November and December 2014 and remained low throughout 2015. By February 2016 the Alert Level was reduced to 0 (on a 0-5 scale) by the Philippine Institute of Volcanology and Seismology (PHIVOLCS) which monitors the volcano. A seismic swarm in August 2016, and the beginning of a new eruption in January 2018 are covered in this report with information provided primarily by PHIVOLCS.
After a brief seismic swarm in August 2016, Mayon remained quiet until a phreatic explosion on 13 January 2018 sent an ash plume 2,500 m above the summit and scattered ash over numerous nearby communities. The growth of a new lava dome sent lava flows down the flanks and ash plumes multiple kilometers above the summit during subsequent weeks. Lava fountaining produced incandescence at the summit for many weeks. Lava collapse events from the flow fronts sent pyroclastic density currents (PDC's) down multiple ravines during January and February 2018. Lava fountaining activity became nearly continuous at the beginning of February but began to taper off by mid-month. Flows had reached as far as 4.5 km down ravines, and lava-collapse generated pyroclastic density currents reached 5 km from the summit crater. The pyroclastic activity continued through February from the gravity-driven collapsing flow fronts even though fountaining and lava effusion had decreased. Brief periods of fountaining and gravity-driven lava flow were noted throughout March 2018, but activity had essentially ceased by month's end.
Activity during 2016-2017. Very low seismicity of 0-2 volcanic earthquakes per day was typical for January and early February 2016; the largest number recorded was 12 on 9 January. On 12 February 2016, PHIVOLCS noted that seismicity had remained at baseline levels of 0-2 earthquakes per day for the previous six months, indicating that rock fracturing associated with magmatic activity had diminished. Ground deformation information suggested a return to pre-2014 eruption positions, and low levels of SO2 flux had been consistent since November 2015. They reduced the Alert Level to 0.
Increasing SO2 flux above 1,000 tons/day beginning in July 2016 was accompanied by ground deformation measurements suggesting renewed inflation. A brief swarm of 146 earthquakes was recorded by the Mayon Volcano Observatory's seismic network from 3-6 August; they were located 10 km away on the SE flank. This change led PHIVOLCS to raise the Alert Level back to 1 on 8 September 2016. Seismicity and SO2 levels remained very low through the end of 2016, but GPS data suggested continued inflation. Slight inflation was recorded throughout 2017. Rare days of small seismic swarms of more than 10 earthquakes occurred during 2017, but otherwise seismicity and SO2 flux values remained within background levels.
Activity during January 2018. A sudden phreatic eruption at 1621 local time on 13 January 2018 sent a gray steam-and-ash plume 2,500 m above the summit that drifted SW. The activity lasted for a little under two hours. Traces of ash fell on the Barangays of Anoling (4 km SW), Sua (6 km SW), Quirangay (9 km SW), Tumpa (9 km SW), Ilawod (10 km SW), and Salugan (8 km SW) in the city of Camalig and in the Barangays of Tandarora (26 km WSW), Maninila (8 km SW), and Travesia (10 km SW) in the municipality of Guinobatan. Incandescence at the summit crater was first observed a few hours later. As a result, PHIVOLCS raised the Alert Level from 1 to 2 early the next day.
Two more phreatic explosions occurred the following morning (14 January) at 0849 and 1143 that each produced ash plumes, but they were largely obscured by summit clouds. Minor amounts of ash were reported in Camalig. By the evening, PHIVOLCS had raised the Alert Level again to 3 after three explosions, 158 rockfall events, and the observation of bright incandescence at the summit crater. By 2000 on 14 January they noted the growth of a new lava dome and the beginnings of a lava flow towards the southern flank.
Two lava collapse events on the morning on 15 January each lasted 5-10 minutes. They originated from the lava flow front and produced rockfall and small-volume pyroclastic density currents. Ash plumes drifted SW and rained ash on Travesia, Muladbucad Grande, Maninila, Masarawag, Poblacion, Iraya, Ilawod, Calzada, Inamnan Grande, Inamnan Pequeno, Maguiron, Quitago and Mauraro in the municipality of Guinobatan and on the Baranguays of Cabangan, Anoling, Sua, Tumpa, Quirangay, Gapo, and Sumlang, and Baranguays 1 to 7 in the municipality of Camalig. A degassing event at 1107 produced a grayish to dirty white ash column that rose to a maximum of height of approximately 1,000 m above the summit before drifting WSW.
Lava effusion continued from the summit during 16-21 January 2018 with flows down the Mi-isi and Bonga gullies and occasional short-duration lava fountaining. Tens of daily lava collapse events accompanied the growth of the flow in the Mi-isi gully which had reached about 3 km from the summit by 18 January. Debris from the growing summit dome also descended the Matanag and Buyuan Gullies. Pyroclastic density currents descended the Mi-isi, Matanag, and Buyuan Gullies. Ash plumes rose up to 2 km and drifted SW from the summit crater and caused ashfall in Camalig, Guinobatan, and Polangui (figures 26-28).
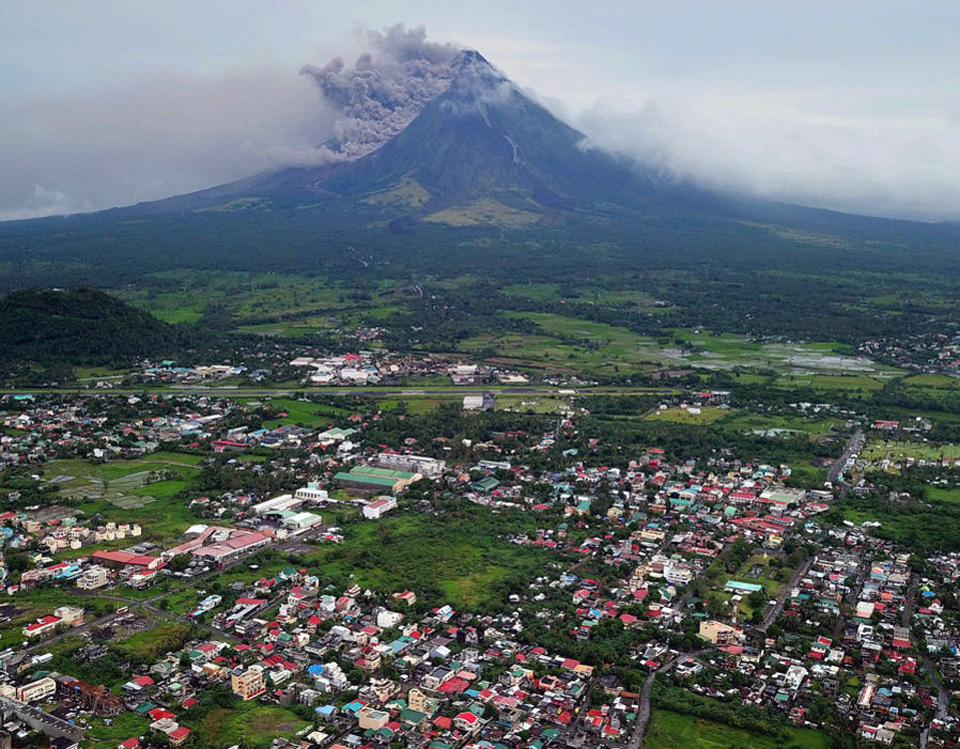 |
Figure 26. Mayon emitted ash and steam along with pyroclastic density currents that flowed down the SW flank on 16 January 2018. View is looking N from S of the airport in Lagazpi City, Philippines, about 12 km S. Courtesy of The Express, photo from European Pressphoto Agency. |
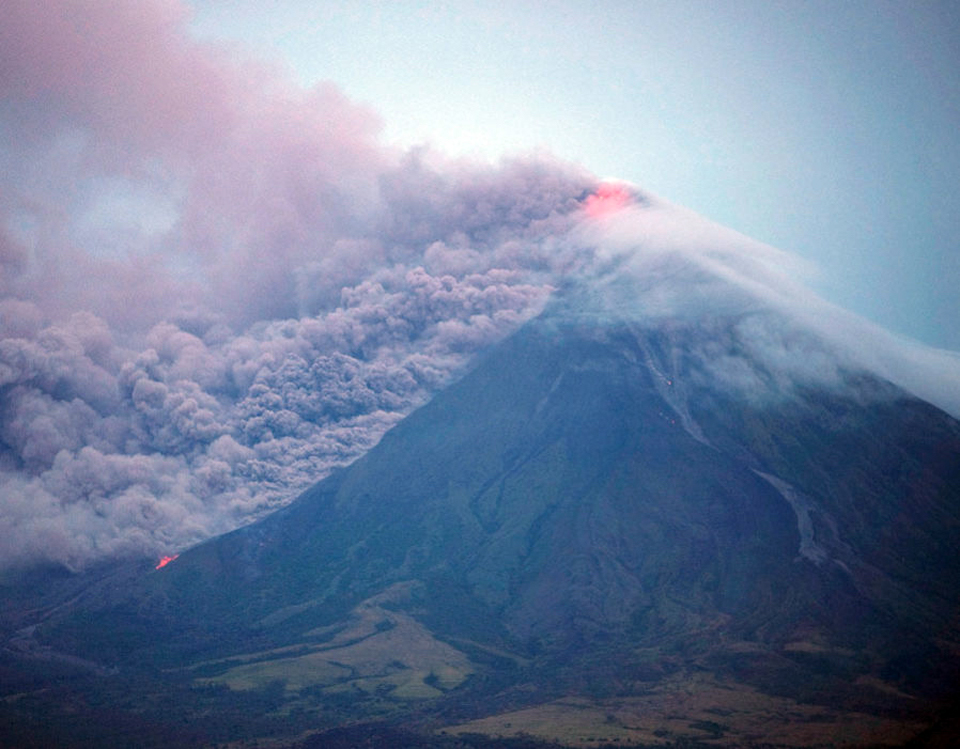 |
Figure 27. Pyroclastic density currents (PDC's) descended the W flank of Mayon on 16 January 2018. Incandescence at the base of the PDC was also visible. Lava was fountaining at the summit and incandescent blocks were rolling down the Mi-isi drainage on the S flank. Image taken near Legazpi city, 12 km S. Courtesy of The Express, photo from European Pressphoto Agency. |
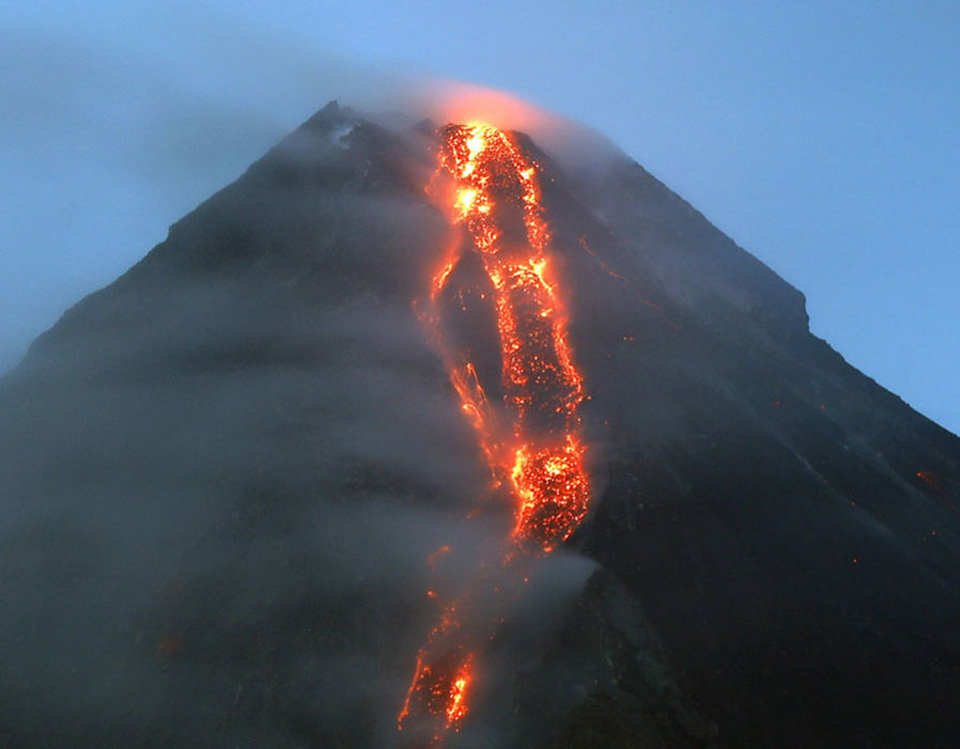 |
Figure 28. Lava flows at Mayon descended the Mi-isi drainage on the S flank and were visible from Legazpi city on 17 January 2018. Courtesy of The Express, photo from European Pressphoto Agency. |
Activity increased on 22 January 2018 with lava fountains at the summit reaching 200-500 m high, the lava flow into the Mi-isi drainage extending beyond 3 km, and two new flows in the Bonga gully and upper Buyuan watershed. A dense 5-km-tall ash plume erupted at 1243 during a phreatomagmatic event that lasted for 8 minutes (figure 29). It generated pyroclastic density currents in several drainages within 4 km of the summit vent including Mi-isi, Bonga, Buyuan, Basud, San Andres, Buang, Anoling and other minor drainages. Ash was blown W and fell on the municipalities of Guinobatan, Camalig, Oas, Polangui and Iriga City. Five additional episodes of lava fountaining to 700 m occurred overnight that fed the Mi-isi and Bonga gully flows, and generated ash plumes to 2.5 and 3 km above the summit. This increase in activity led PHIVOLCS to raise the Alert Level to 4. By the following day, more than 50,000 people had evacuated to emergency shelters and civil aviation authorities temporarily closed airports in the cities of Legazpi and Naga.
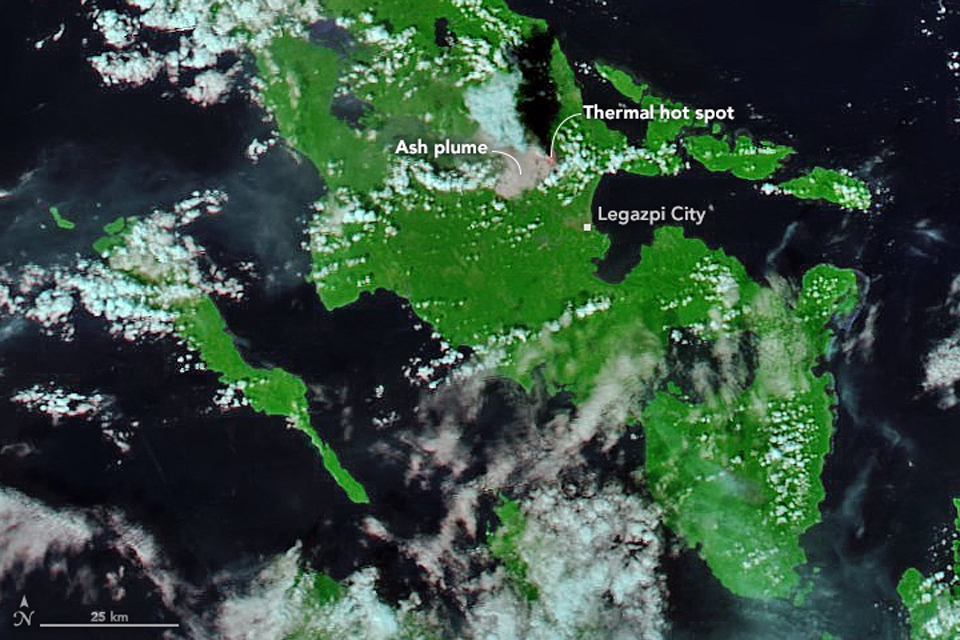 |
Figure 29. The Moderate Resolution Imaging Spectroradiometer (MODIS) on NASA's Aqua satellite acquired this image of the area around Mayon in the Philippines on 22 January 2018. The image combines natural-color data with thermal infrared bands (7-2-1). The substantial ash plume from the explosion that day rose to 10.9 km altitude and drifted NW and W, and the emerging lava dome appeared as a thermal hotspot at the summit. Courtesy of NASA Earth Observatory. |
Numerous episodes of intense lava fountains during the nights of 23-26 January each lasted from a few minutes to more than an hour. They generated 150-600 m high fountains and continued to feed the flows in the Mi-isa and Bonga gullies. Ash plumes also rose from 0.5-5 km above the crater. The Mi-isa gully flow remained at 3 km from the summit, and the Buyuan flow had reached 1 km by 24 January. Pyroclastic density currents in the Mi-isi, Lidong/Basud, and Buyuan drainages were also observed. The PDCs in the Buyuan drainage traveled more than 5 km from the summit crater (figures 30-33).
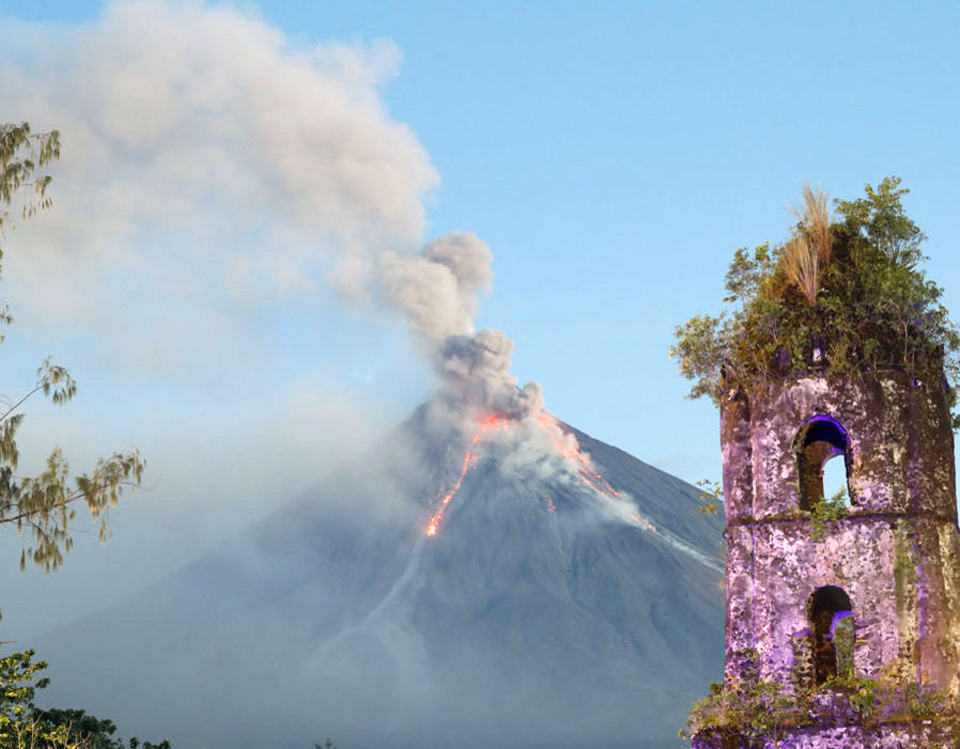 |
Figure 30. Ash and steam plumes rose from the summit crater of Mayon while lava flows descended drainages on the S flank as seen from the town of Daraga, 10 km S, on 23 January 2018. Courtesy of The Express, photo from European Pressphoto Agency. |
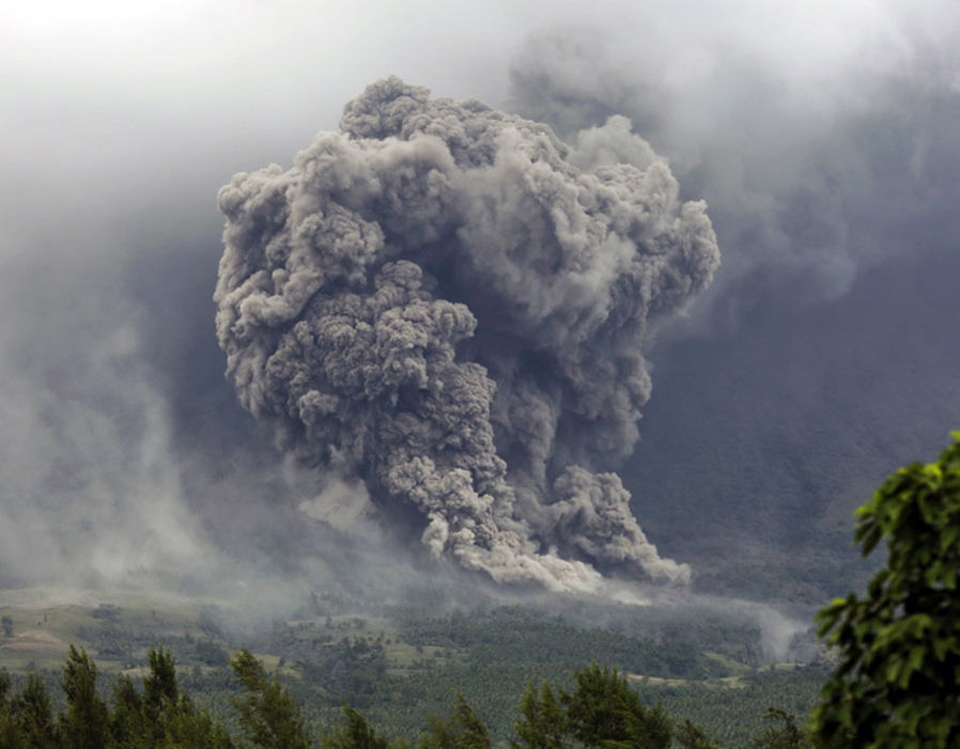 |
Figure 31. An ash plume rises, likely from a pyroclastic density current, in a drainage on the SE flank of Mayon, a few kilometers N of the town of Daraga on 23 January 2018. Courtesy of The Express, photo from European Pressphoto Agency. |
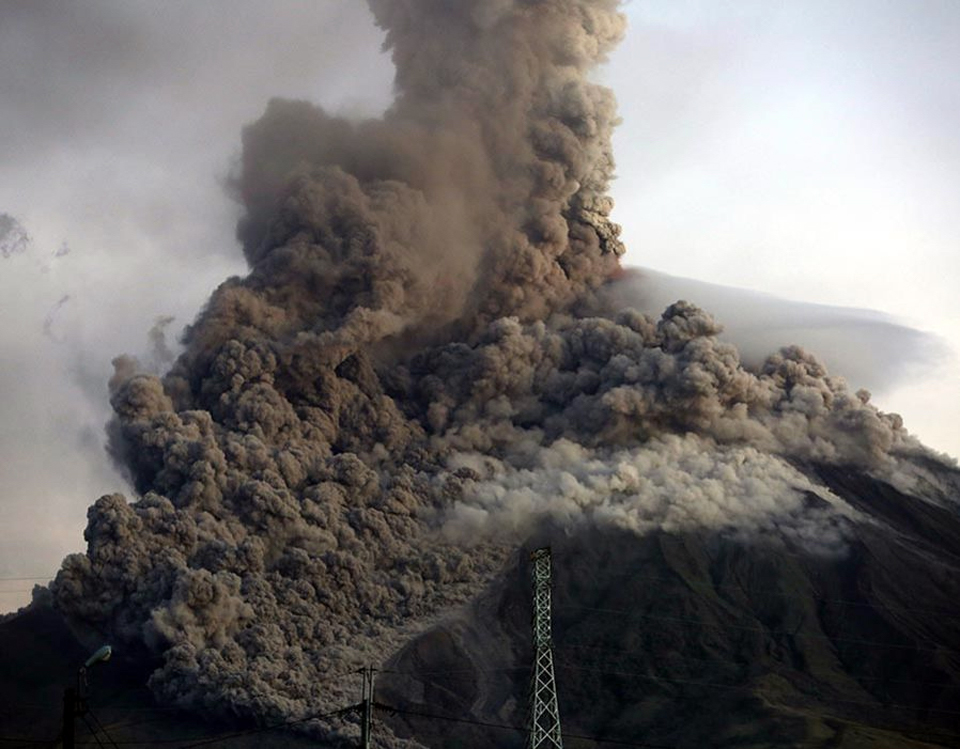 |
Figure 32. Ash and pyroclastic density currents emerged from the summit of Mayon on 24 January 2018, sending ashfall to nearby communities and filling drainages with pyroclastic debris. Image taken from Daraga, 10 km S. Courtesy of The Express, photo from European Pressphoto Agency. |
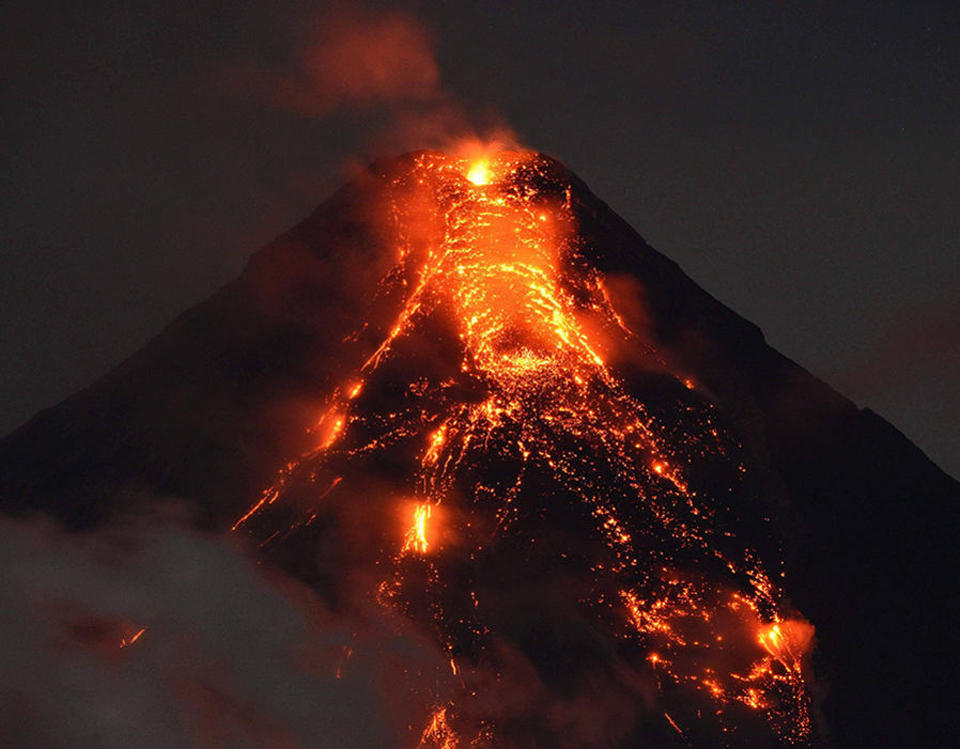 |
Figure 33. Lava flows were very active on the S flank of Mayon, visible from about 12 km SSE in Legazpi on 25 January 2018. Courtesy of The Express, AFP/Getty Images. |
By the evening of 26 January 2018, the lava fountaining episodes had transitioned into aseismic lava effusion, feeding incandescent flows into the Bonga and Mi-isi gullies on the S flank, and advancing the flow in the Bonga significantly downslope to 1.8 km. Fewer fountaining episodes continued during 27-28 January. Heavy rainfall during 28-29 January remobilized deposits from pyroclastic density currents and generated sediment-laden stream flows in several channels (figure 34) and channel-confined lahars on the Binaan Channel.
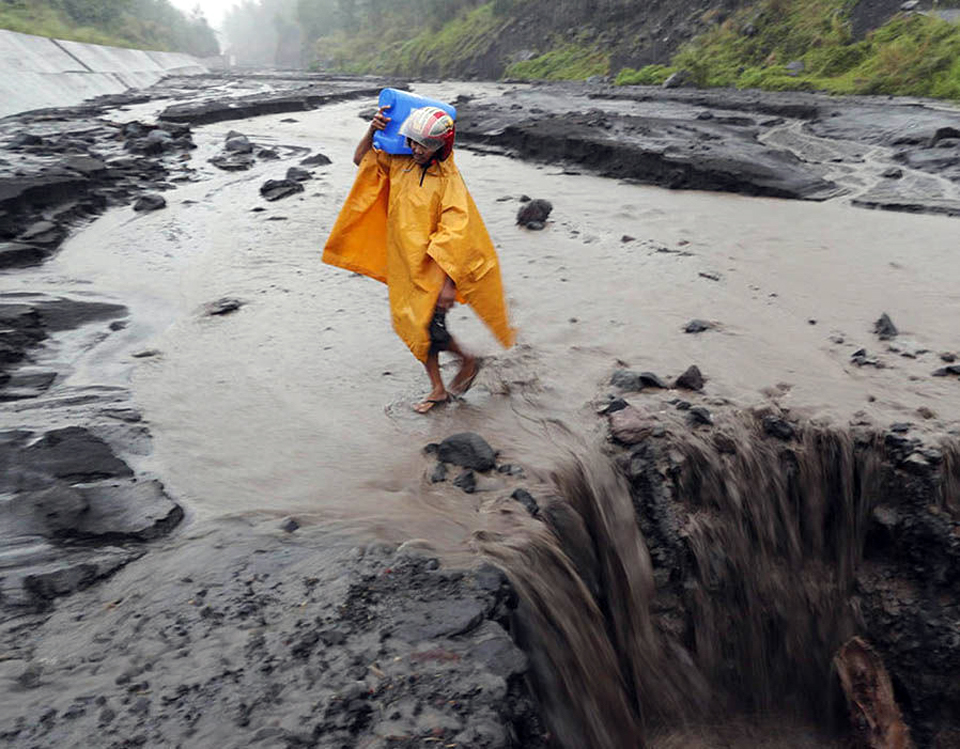 |
Figure 34. Sediment-laden streams posed hazards to residents of Camalig (11 km SW) at Mayon on 28 January 2018 after heavy rains and numerous PDC's had filled the drainages with debris. Courtesy of The Express, photo from European Pressphoto Agency. |
A significant increase in lava effusion and fountaining at the summit during the evening of 29 January 2018 fed PDCs into the Mi-isi and Bonga Gullies, and resulted in significant ashfall in Camalig and Guinobatan to the SW. Intermittent lava fountaining to 200 m, flow-front collapses that generated PDC events, low-level ash emissions, and slow lava effusion from the summit crater continued during 30 January-4 February (figures 35 and 36). The Mi-isi and Basud lava flows had advanced to 3.2 and 3.6 km, respectively, from the summit crater by 1 February, and the Bonga-Buyuan flow had advanced 4.3 km by 3 February.
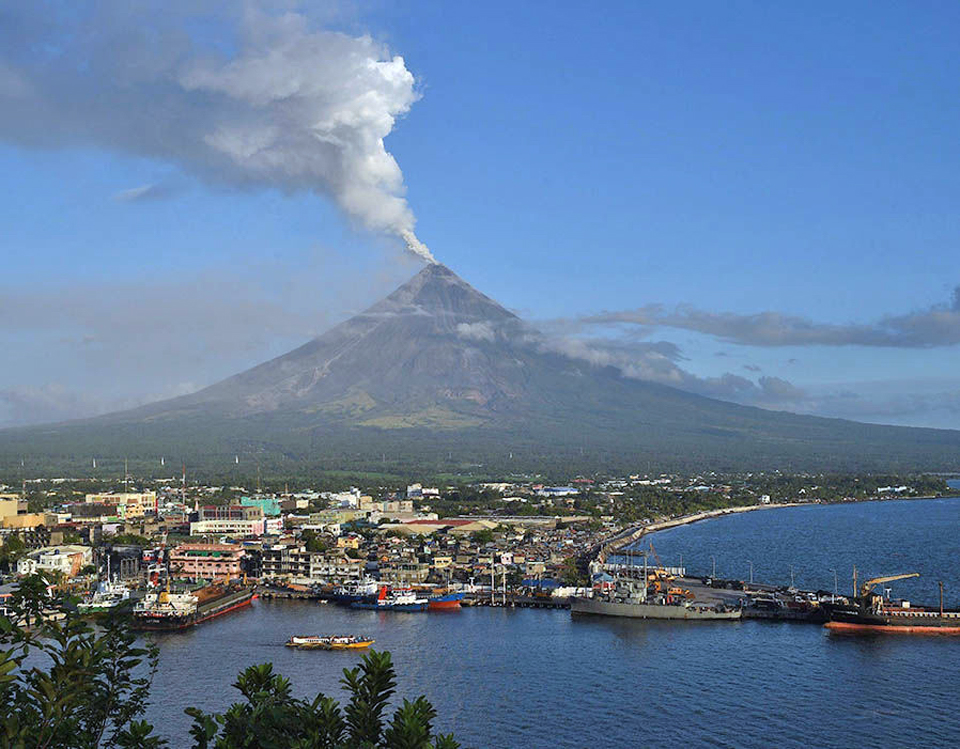 |
Figure 35. Steam-and-ash plumes rose steadily above Mayon on 31 January 2018. Image taken at the port in Legazpi City, about 15 km S. Courtesy of The Express, Getty Images. |
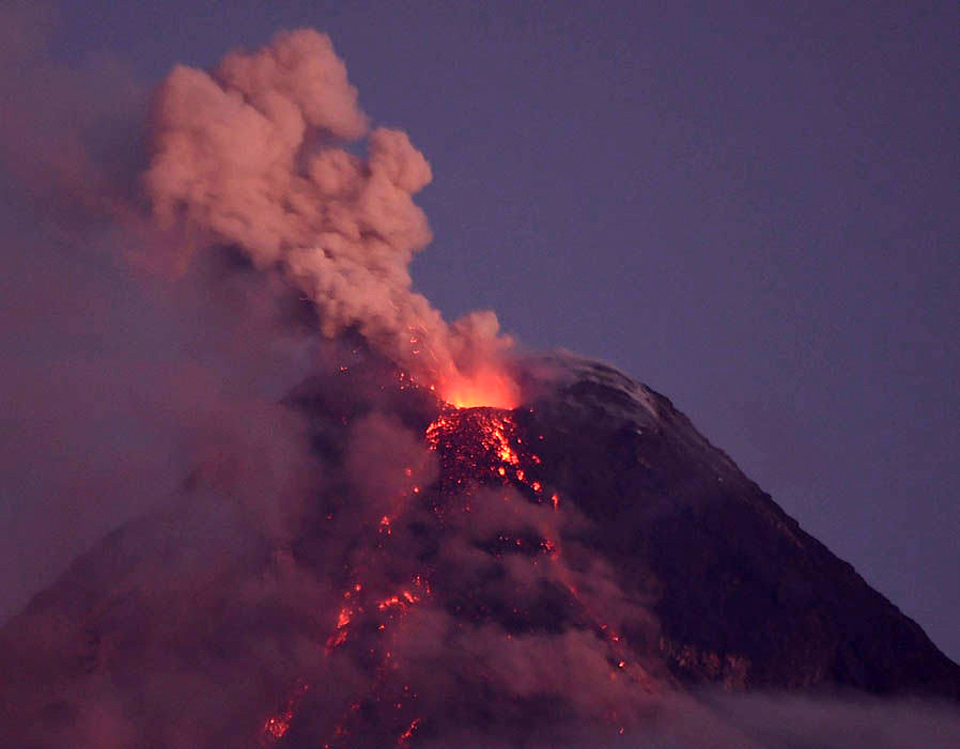 |
Figure 36. Lava effusion at the summit of Mayon had decreased from a week earlier (see figure 33) by 31 January 2018. Courtesy of The Express, Getty Images. |
Activity during February-March 2018. Lava fountaining reached 550 m above the summit crater on 5 February and increased to near-continuous activity the next day. Lava flows and incandescent rockfalls were observed throughout the night in the Mi-isi and Bonga-Buyuan channels. High volumes of incandescent lava flows advanced to 3.2, 4.5, and approximately 3.0 km down the Mi-isi, Bonga-Buyuan and Basud channels. Pyroclastic density currents from the collapsing flow fronts reached 4.6, 4.4, and 4.2 km from the summit crater in the same drainages during 7 February. Near-continuous fountaining accompanied by steam plumes that rose up to 800 m continued through 10 February.
Lava fountaining became sporadic and weak beginning on 11 February. Heavy rainfall during 13 February generated channel-confined lahars in the Anoling channel. By 14 February, lava flows remained at 3.3 km, 4.5 km, and 900 m down the Mi-isi, Bonga and Basud gullies, and PDCs had deposited material to distances of 4.6, 4.5, and 4.2 km in the same drainages. Intermittent lava fountaining continued through 22 February. The fountains generally rose 100-600 m above the summit and were often audible more than 10 km from the summit.
Quieter lava effusion with fewer fountaining events was more typical behavior beginning on 23 February. Numerous episodes of lava-collapse pyroclastic density currents were visually observed on the Mi-isi, Basud, and Bonga-Buyuan Gullies within 2-4 kilometers of the summit crater during the second half of February. Deflation of the lower slopes that began on 20 February was recorded by electronic tiltmeter, consistent with the transition to seismically quieter lava effusion at the summit crater. However, the overall electronic tiltmeter and the continuous GPS data indicated that the volcano was still inflated relative to October and November 2017 levels.
Weak fountaining, lava effusion, and degassing were noted during 25-28 February. The sporadic fountains generated plumes that rose 800 m, and weak effusion continued to feed the flows in the drainages. Gravity-driven lava flow movement and degassing with ash plumes rising 600 m above the summit were the primary activity at Mayon on 1 March, although occasional lava fountaining events were still observed. Based on the decrease in activity at the summit, the decrease in seismicity, continued deflation, and significantly lower SO2 emissions, PHIVOLCS lowered the Alert Level to 3 on 6 March 2018.
Brief periods of weak fountaining and lava flows were observed during 7-24 March. The fountaining generated dark gray ash plumes that rose 100-300 m above the summit crater before drifting SW, and were sometimes audible more than 10 km from the summit crater. At night, lava flows continued moving downslope within 3.3, 4.5, and 1.9 km of the crater in the Mi-isi, Bonga, and Basud gullies. Steam plumes rose as high as 2.5 km above the summit before drifting SW on 7 March. Intermittent bluish steam-laden plumes rose to 700 m before drifting SW on 14 March. A slight inflation of the lower flanks beginning on 11 March 2018 was recorded by electronic tiltmeters through at least 22 March. Overall deformation data indicated that the edifice was still inflated relative to pre-eruption baselines.
Beginning around 24 March 2018, the primary activity consisted of intermittent lava collapse events in the Mi-isi gully located between 4-5 km from the summit and steam-laden plumes that drifted SW from the summit. Lava flow effusion at the crater was last detected on 18 March. Ground deformation since 20 February 2018 recorded deflation despite short-term episodes of inflation of its lower and middle slopes, and incandescence at the summit had diminished from intense to faint. Lava flows had begun to stabilize, producing fewer rockfalls and infrequent pyroclastic density currents, the last of which was observed on 27 March 2018. This continued decrease in activity led PHIVOLCS to lower the Alert Level to 2 on 29 March 2018.
VAAC, SO2, and MIROVA information. The Tokyo VAAC reported the first ash emission from Mayon on 13 January 2018 as a plume that rose to 5.2 km altitude and drifted SW. Many subsequent ash emissions were obscured by meteoric clouds and were only occasionally observed in satellite imagery. The ash plume from the large explosion on 22 January was observed in satellite imagery at 10.9 km altitude drifting NW. Numerous daily VAAC reports were issued through February; they were intermittent in March, ending on 23 March 2018. Plumes generally were reported at 5.2-7.6 km altitudes. Small sulfur dioxide plumes were captured by the OMI and OMPS satellite instruments on several days between 22 and 31 January 2018 (figure 37).
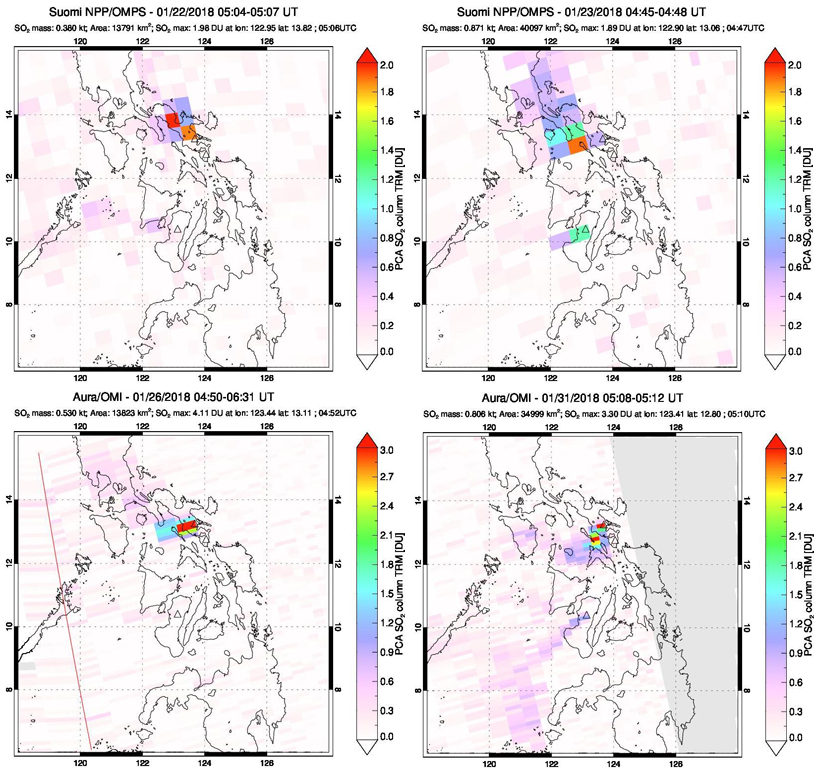 |
Figure 37. SO2 anomalies from Mayon were captured by the OMPS and OMI instruments on the SUOMI and AURA satellites during January 2018. Upper left: 22 January 2018; upper right: 23 January 2018; lower left: 26 January 2018; lower right: 31 January 2018. Courtesy of NASA Goddard Space Flight Center. |
The MIROVA project thermal anomaly graph of log radiative power clearly captured the onset of activity at Mayon in mid-January 2018 (figure 38). Thermal activity increased through early February and then slowly decreased through mid-March 2018 when lava effusion ended.
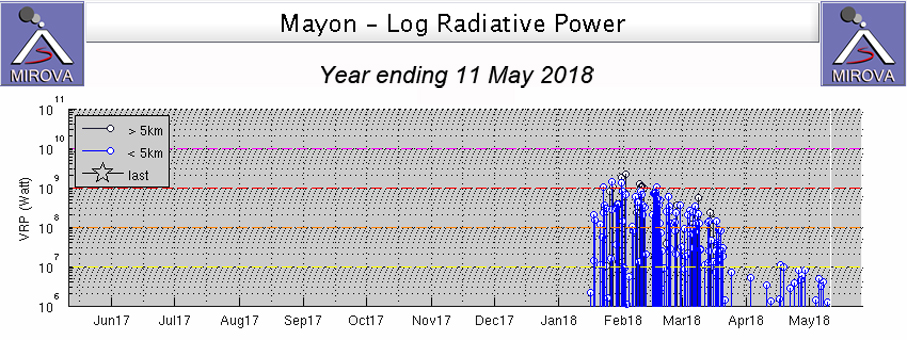 |
Figure 38. The sudden onset of thermal activity at Mayon is apparent in this MIROVA project graph of log radiative power for the year ending on 11 May 2018. The data is based on the satellite-based MODIS infrared thermal imagery. Thermal activity peaked at the end of January and dropped off gradually through mid-March 2018; it then decreased abruptly after that. Courtesy of MIROVA. |
Information Contacts: Philippine Institute of Volcanology and Seismology (PHIVOLCS), Department of Science and Technology, University of the Philippines Campus, Diliman, Quezon City, Philippines (URL: http://www.phivolcs.dost.gov.ph/); Tokyo Volcanic Ash Advisory Center (VAAC), 1-3-4 Otemachi, Chiyoda-ku, Tokyo, Japan (URL: http://ds.data.jma.go.jp/svd/vaac/data/); MIROVA (Middle InfraRed Observation of Volcanic Activity), a collaborative project between the Universities of Turin and Florence (Italy) supported by the Centre for Volcanic Risk of the Italian Civil Protection Department (URL: http://www.mirovaweb.it/); NASA Earth Observatory, EOS Project Science Office, NASA Goddard Space Flight Center, Goddard, Maryland, USA (URL: http://earthobservatory.nasa.gov/); NASA Goddard Space Flight Center (NASA/GSFC), Global Sulfur Dioxide Monitoring Page, Atmospheric Chemistry and Dynamics Laboratory, 8800 Greenbelt Road, Goddard, Maryland, USA (URL: https://so2.gsfc.nasa.gov/); The Express (URL: https://www.express.co.uk); European Pressphoto Agency (EPA) (URL: http://www.epa.eu/); Getty Images (URL: https://www.gettyimages.com/); Agence France Presse (AFP) (URL: https://www.afp.com/).
Low activity during April-September with some ash plumes and ongoing crater incandescence
Mayon is a frequently active volcano in the Philippines that produces ash plumes, lava flows, pyroclastic flows, and lahars. In early 2018, eruptive activity included lava fountaining that reached 700 m above the summit, and lava flows that traveled down the flanks and collapsed to produce pyroclastic flows (figure 39). Lava fountaining and lava flows decreased then ceased towards late March. Lava effusion was last detected on 18 March 2018, and the last pyroclastic flow for this eruptive episode occurred on 27 March 2018 (see BVGN 43:04). The hazard status for was lowered from alert level 4 to 3 (on a scale of 0 to 5) on 6 March 2018 due to decreased seismicity and degassing; the level was lowered again to 2 on 29 March. This report summarizes the activity during April through September 2018 and is based on daily bulletins issued by the Philippine Institute of Volcanology and Seismology (PHIVOLCS) and satellite data.
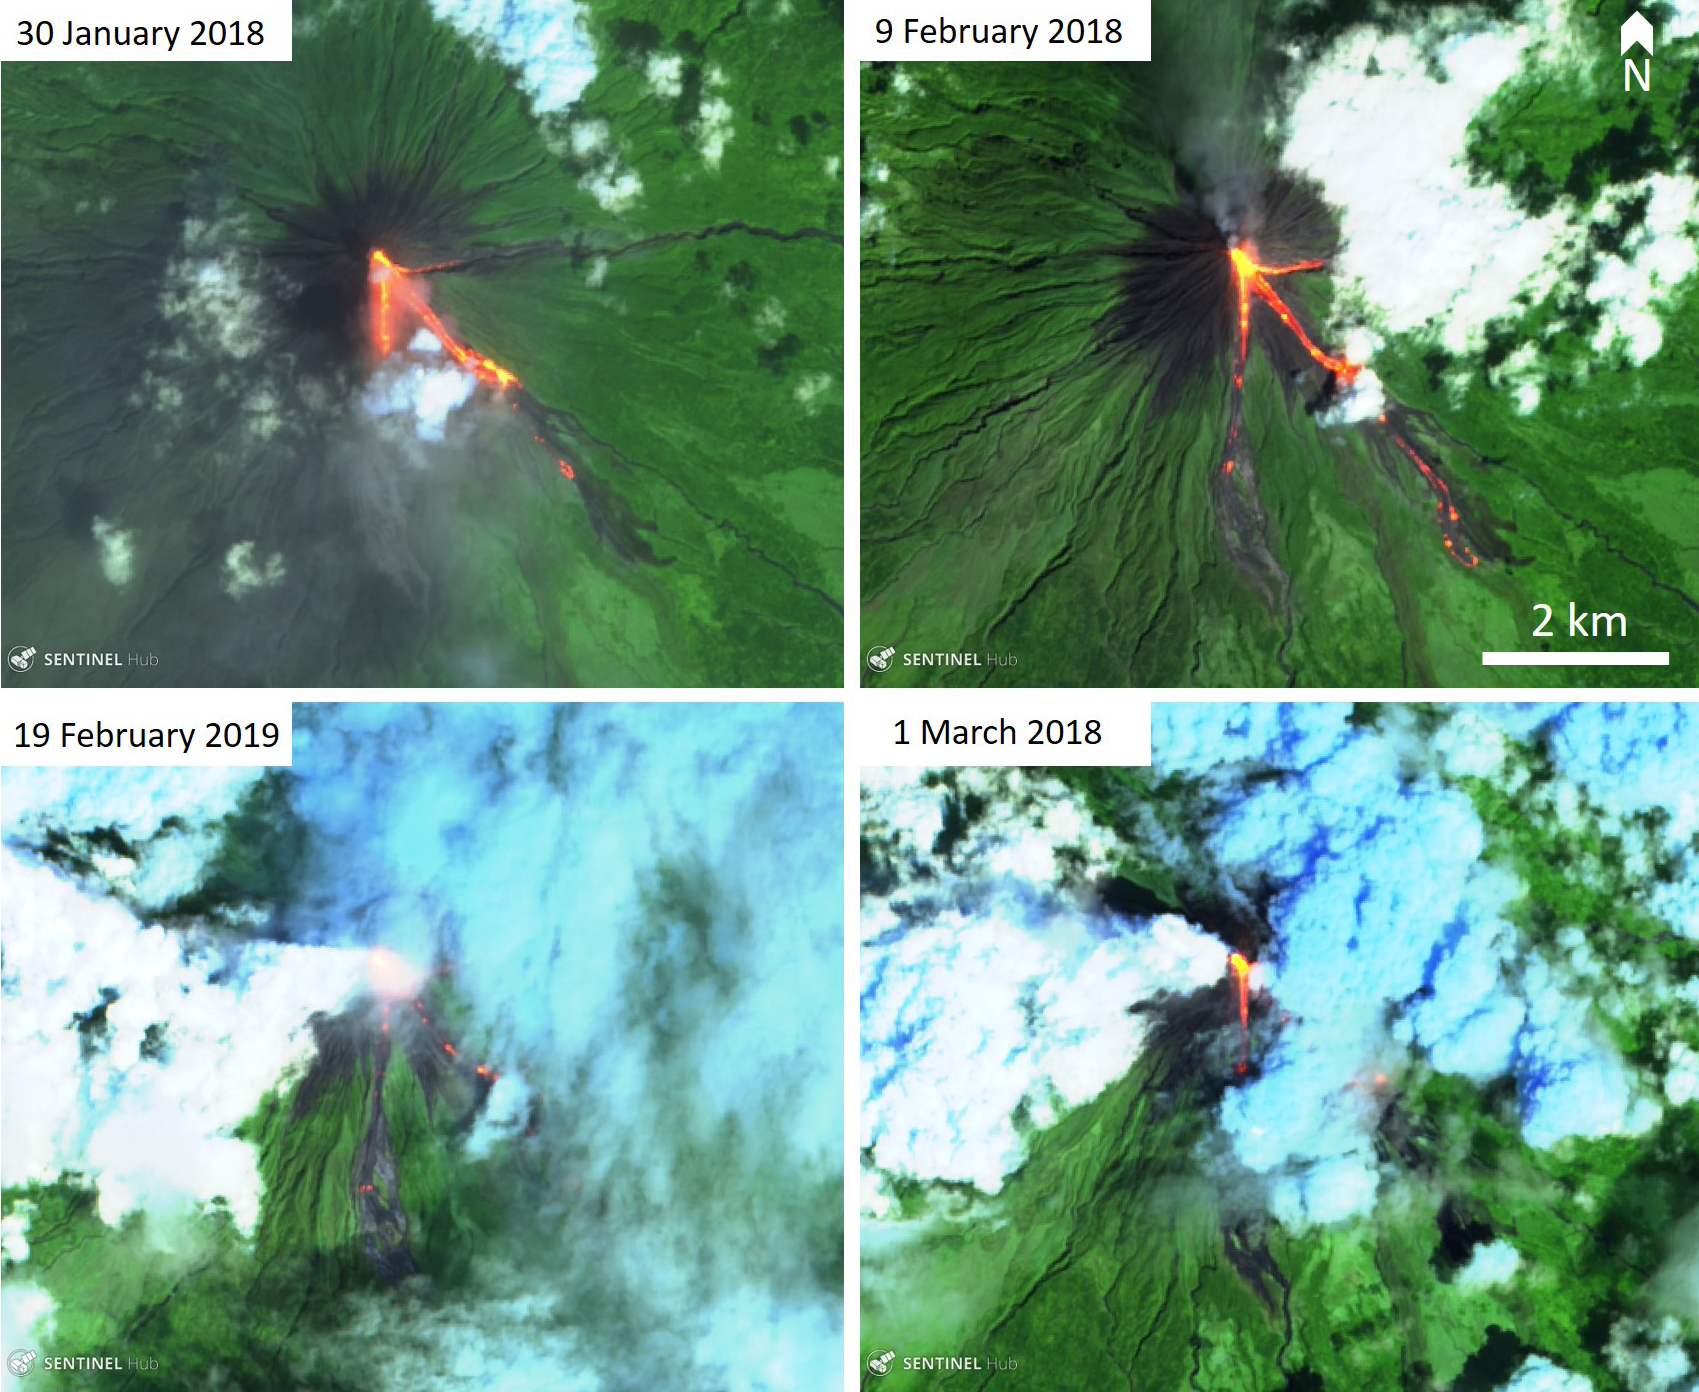 |
Figure 39. Sentinel-2 thermal satellite images showing the lava flow activity at Mayon during January through March 2018. Three lava flow lobes flowed down the Mi-isi, Bonga-Buyuan, and Basud channels, and are shown in bright orange/red in these images. False color images created using bands 12, 11, 4. Courtesy of Sentinel Hub Playground. |
The hazard status remained on Alert level 2 (increasing unrest) throughout the reporting period. Activity was minimal with low seismicity (zero to four per day) and a total of 19 rockfall events throughout the entire period. White to light-brown plumes that reached a maximum of 1 km above the crater were observed almost every day from April through September (figure 40). Two short-lived light brown plumes were noted on 27 and 28 August and both reached 200 m above the crater.
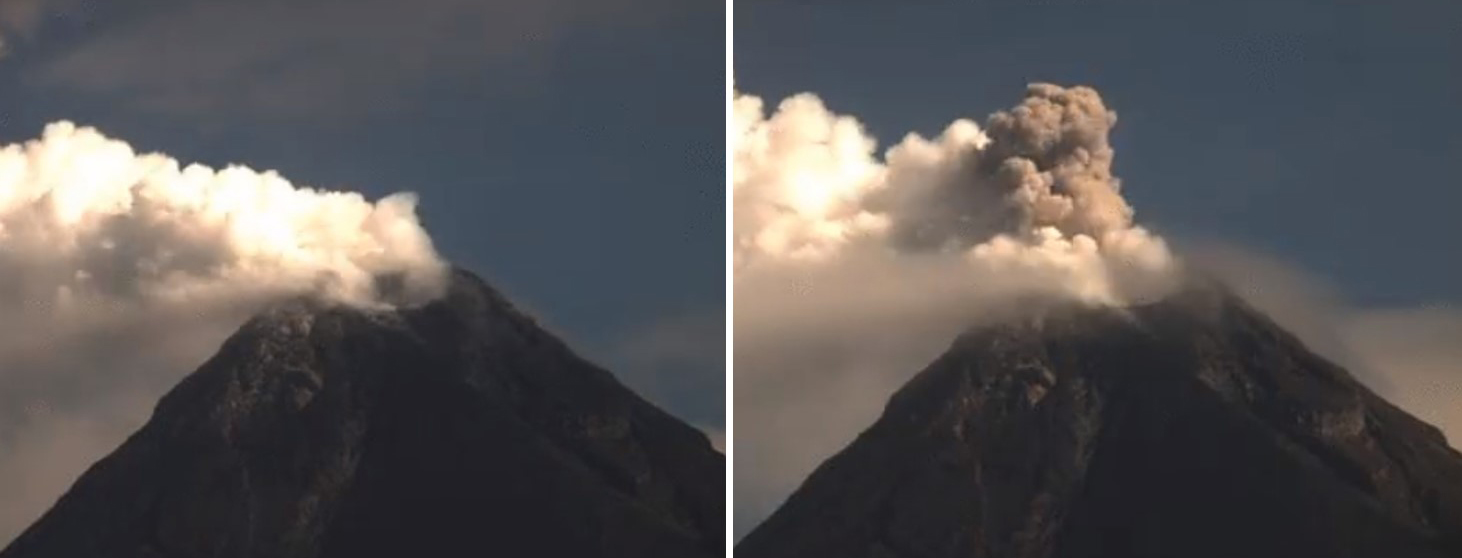 |
Figure 40. An emission of white steam-and-gas at Mayon and a dilute brown plume that reached 200 m above the crater was seen on 24 May 2018. Courtesy of PHIVOLCS. |
On the days that sulfur dioxide was measured, the amount ranged from 436 to 2,800 tons per day (figure 41). Mayon remains inflated relative to 2010 baselines but the edifice has experienced deflation since 20 February, a period of inflation from 2-14 April, and slight inflation of the mid-slopes beginning 5 May, which then became more pronounced beginning 25 June. No other notable inflation or deflation was described throughout the reporting period.
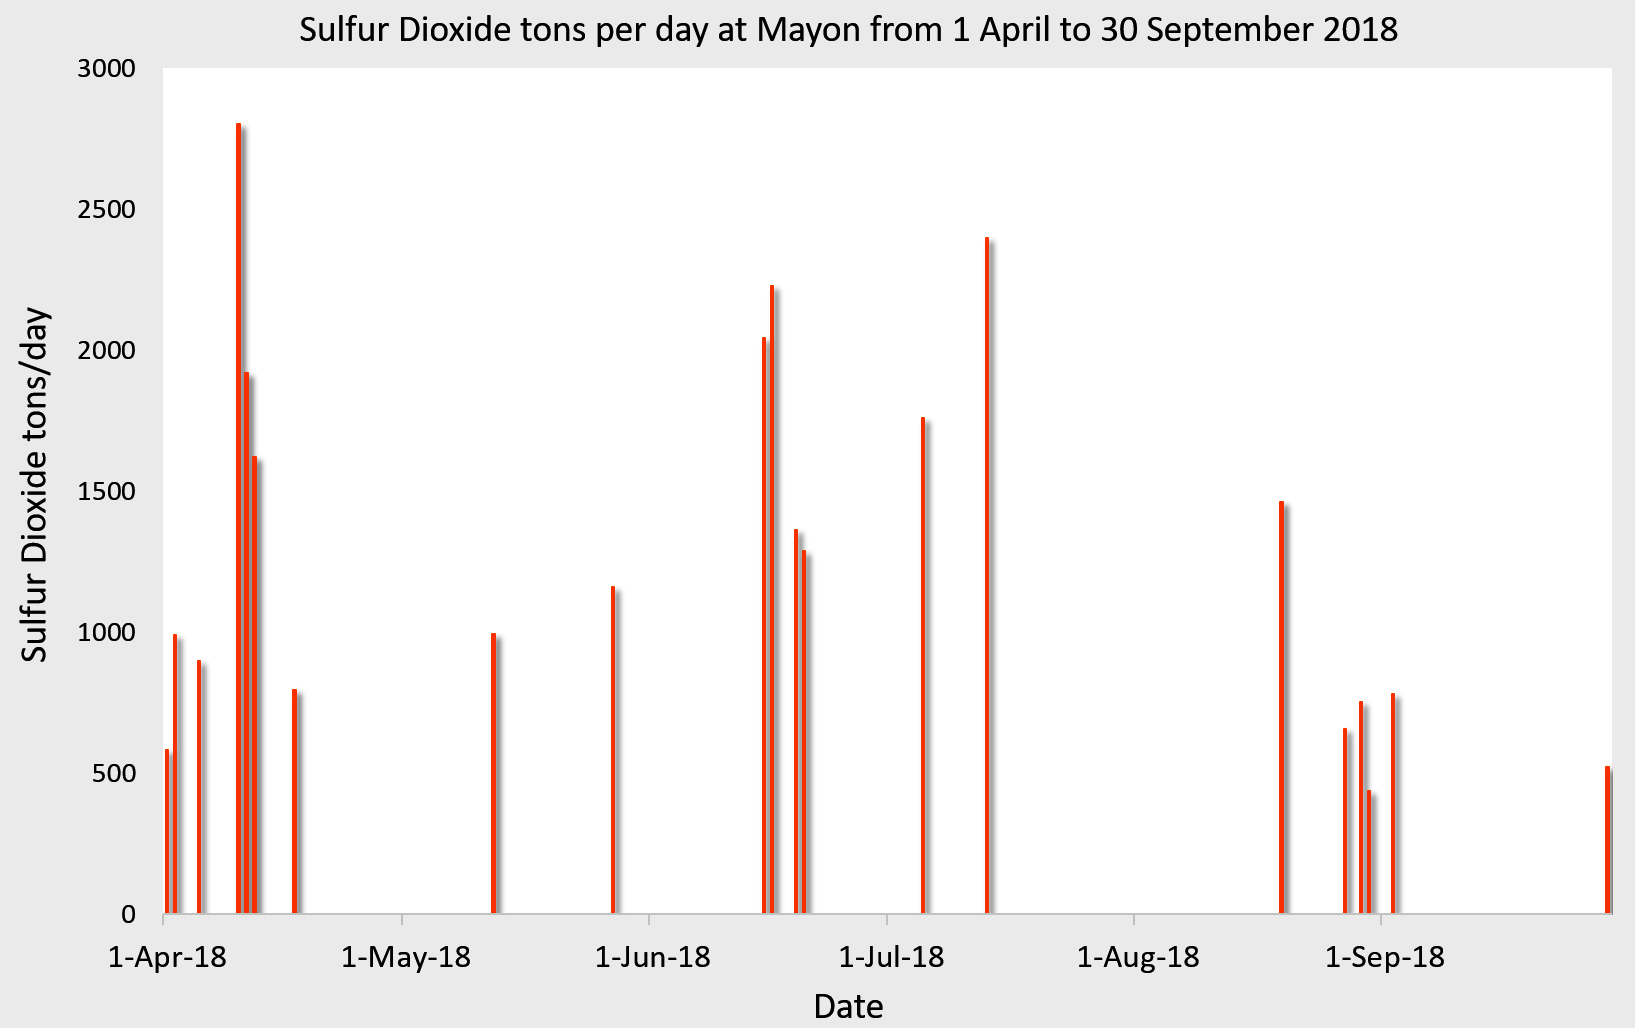 |
Figure 41. Measurements of sulfur dioxide output at Mayon during 1 April-30 September 2018. Data courtesy of PHIVOLCS. |
Incandescence at the summit was observed almost every night (when weather permitted) from April through to the end of September 2018, and this elevated crater temperature is also seen in satellite thermal imagery (figure 42). Thermal satellite data showed a slight increase in output during April through to June, although not as high as the earlier 2018 activity, with a decline in thermal output starting in July (figure 43).
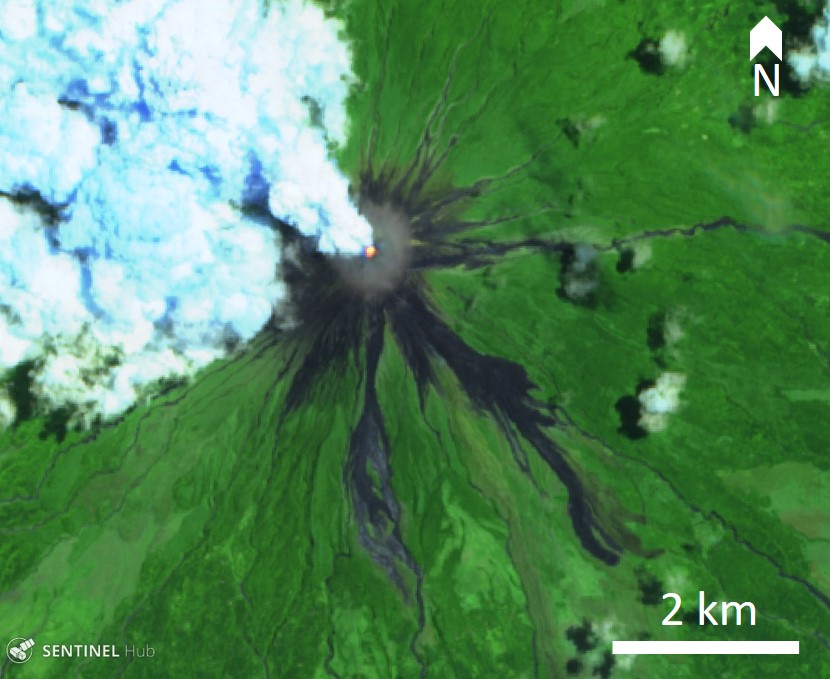 |
Figure 42. Sentinel-2 thermal satellite image showing an elevated thermal signature in the crater of Mayon and a steam-and-gas plume on 15 May 2018. Similar indications of activity in the crater were frequently imaged on cloud-free days from April through September. False color image created using bands 12, 11, 4. Courtesy of Sentinel Hub Playground. |
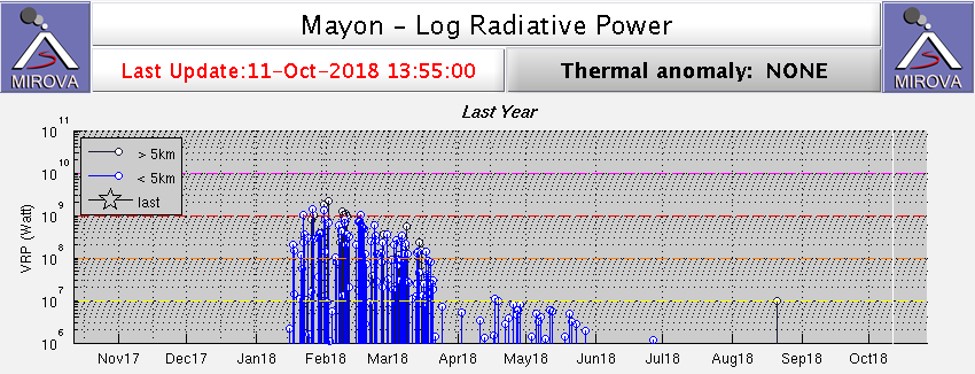 |
Figure 43. Log radiative power MIROVA plot of MODIS thermal data for the year ending 11 October 2018 at Mayon. An elevated period of activity reflecting the lava flows in January through March is notable, followed by a second period of lower intensity activity during May into June, then a prolonged period of reduced activity through to the end of the reporting period; the August anomaly was not at the volcano. Courtesy of MIROVA. |
Information Contacts: Philippine Institute of Volcanology and Seismology (PHIVOLCS), Department of Science and Technology, University of the Philippines Campus, Diliman, Quezon City, Philippines (URL: http://www.phivolcs.dost.gov.ph/); MIROVA (Middle InfraRed Observation of Volcanic Activity), a collaborative project between the Universities of Turin and Florence (Italy) supported by the Centre for Volcanic Risk of the Italian Civil Protection Department (URL: http://www.mirovaweb.it/); Sentinel Hub Playground (URL: https://www.sentinel-hub.com/explore/sentinel-playground).
Intermittent ash emissions; persistent summit incandescence, October 2018-April 2019
Steep-sloped and symmetrical Mayon has recorded historical eruptions back to 1616 that range from Strombolian fountaining to basaltic and andesitic flows, as well as large ash plumes, and devastating pyroclastic flows and lahars. A phreatic explosion with an ash plume in mid-January 2018 began the latest eruptive episode which included the growth of a lava dome with pyroclastic flows down the flanks and lava fountaining (BGVN 43:04). Activity tapered off during March; occasional ash emissions continued through August 2018. Minor ash emissions and summit incandescence were intermittent from October 2018-April 2019, the period covered in this report. Information is provided primarily by the Philippine Institute of Volcanology and Seismology (PHIVOLCS).
Pyroclastic density currents were reported in early November 2018; ash plumes were produced from phreatic events a few times during both November and December 2018. Emissions produced SO2 anomalies during January-March 2019; a series of events in early March generated several small ash plumes. Satellite images showing a thermal anomaly at the summit were recorded multiple times each month from October 2018-April 2019 (figure 44).
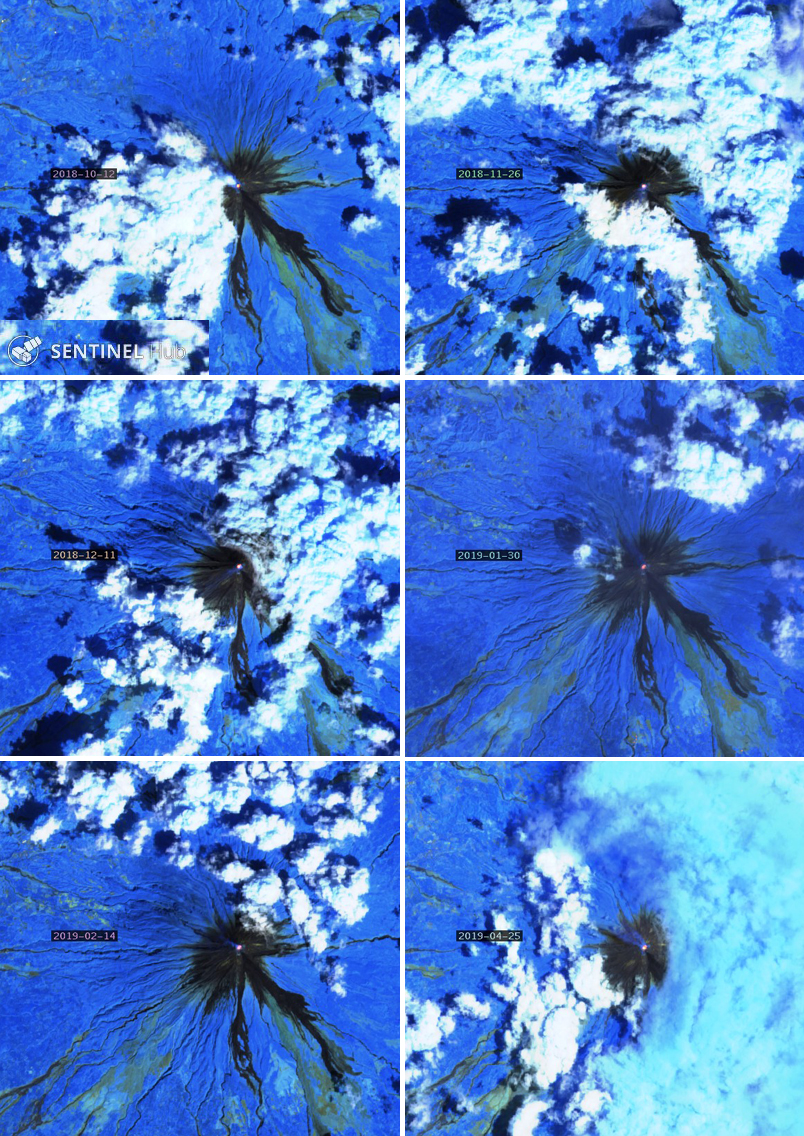 |
Figure 44. Small but distinct persistent thermal anomalies were recorded in satellite imagery from the summit of Mayon during October 2018-April 2019. Top left: 12 October 2018. Top right: 26 November 2018. Middle left: 11 December 2018. Middle right: 30 January 2019. Bottom left: 14 February 2019. Bottom right: 25 April 2019. All images are using the "Atmospheric penetration" filter (bands 12, 11, 8A). Courtesy of Sentinel Hub Playground. |
Very little activity was reported at Mayon during October 2018. Steam plumes rose daily from 250-750 m above the summit before drifting with the prevailing winds and dissipating. Incandescence was observed at the summit most nights during the month, and seismicity remained low with only a few earthquakes reported. Leveling data obtained during 30 August-3 September indicated significant short-term deflation of the volcano relative to 17-24 July 2018. New leveling data obtained on 22-31 October indicated inflation of the SE quadrant and short-term deflation on the N flank relative to the 30 August-3 September data. The volcano remained inflated compared with 2010 baseline data. Electronic tilt data showed pronounced inflation of the mid-slopes beginning 25 June 2018.
Activity increased during November 2018. In addition to steam plumes rising to 750 m and an incandescent glow at the summit most nights, pyroclastic density currents and ash plumes were reported. The seismic monitoring network recorded pyroclastic density currents on 5 and 6 November. On 8 November around noontime, a small, short-lived brownish ash plume, associated with degassing, drifted WSW from the summit. A seismic event on the morning of 11 November was associated with a short-lived fountaining event that produced a brownish-gray ash plume that drifted SW. Another similar plume was reported on the morning of 12 November, also drifting SW before dissipating. Two phreatic events were observed on the morning of 26 November. They produced grayish to grayish-white ash plumes that rose 300-500 m above the summit before drifting SW. The following morning, another event produced a grayish ash plume 500 m above the summit that drifted SW. On 30 November a 1-minute-long ash emission event produced a grayish white plume that also drifted SW.
Steam plume emissions and incandescence at night continued at Mayon during December 2018. The seismic network recorded a four-minute-long event shortly after noon on 9 December that produced a grayish-brown ash plume which drifted W. Precise leveling data obtained on 8-13 December 2018 indicated a slight inflation of the volcano relative to 22-31 October 2018. A 30-second-long ash emission event in the afternoon on 18 December produced a brownish ash plume. Two phreatic events were observed on the morning of 27 December. They produced grayish to grayish-white ash plumes that rose 600 and 200 m above the summit, before drifting SW (figure 45).
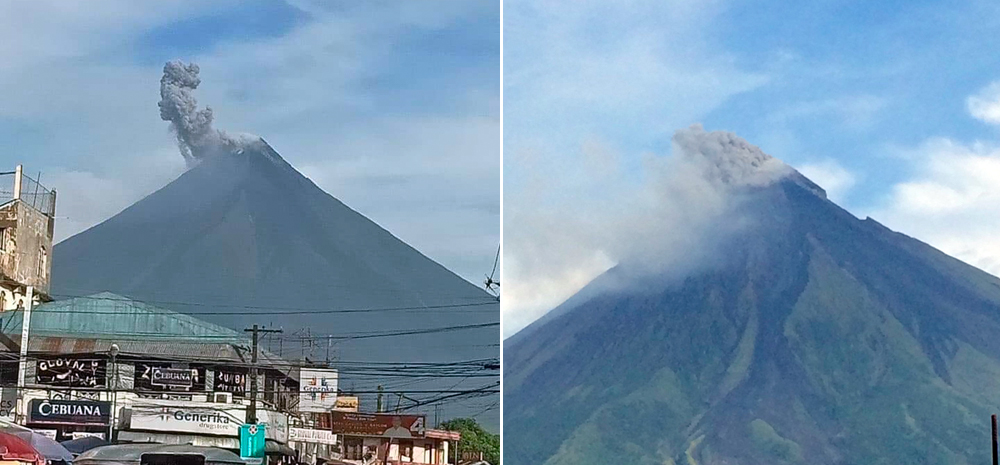 |
Figure 45. Ash plumes rose a few hundred m from the summit of Mayon on 27 December 2018. Courtesy of Twitter users "k i t" (left) and "georgianne" (right). |
Very little surface activity except for white steam-laden plumes that crept downslope and drifted NW or SW was noted during January 2019. Incandescence at the summit, visible with the naked eye, became more frequent during February 2019, along with continued steam plumes. Precise leveling data obtained on 25 January-3 February 2019 indicated a slight deflation relative to 8-13 December 2018. However, continuous GPS and electronic tilt data showed inflation of the mid-slopes since June 2018. Small SO2 plumes were detected by the TROPOMI satellite instrument a few times during January-March 2019 (figure 46).
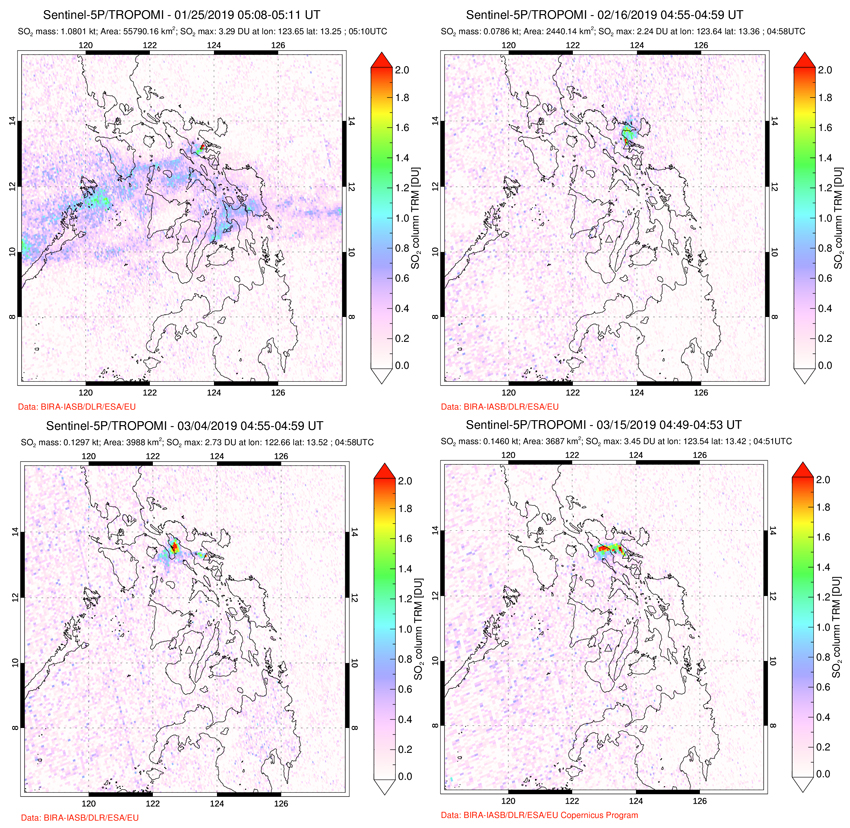 |
Figure 46. Emissions of SO2 that exceeded 2 DU (Dobson Units) occurred a few times at Mayon during January-March 2019. Top left: 25 January. Top right: 16 February. Lower left: 4 March. Lower right: 15 March. Courtesy of NASA Goddard Space Flight Center. |
Steam plumes rose 250-500 m above the summit and drifted generally W in early March 2019; incandescence continued daily at the summit. Phreatic events occurred on 7 and 8 March, producing ash plumes that rose 500 and 300 m from the summit before drifting SW (figure 47). Three more phreatic events occurred on the afternoon of 12 March; they produced light brown to grayish ash plumes that rose 500, 1,000, and 500 m, respectively, and drifted SW. Six phreatic events occurred throughout the day on 13 March, producing ash plumes that rose 200-700 m above the summit and drifted W. A single explosion the next day produced a 500-m-tall ash plume. The Tokyo VAAC reported an ash plume visible for several hours in satellite imagery drifting W at 3.7 km altitude on 13 March (UTC). An increase in the daily number of rockfall events from 1-2 per day to 5-10 per day was noted during the second half of March. Precise leveling data obtained on 20-26 March 2019 indicated a slight inflation relative to 25 January-3 February 2019.
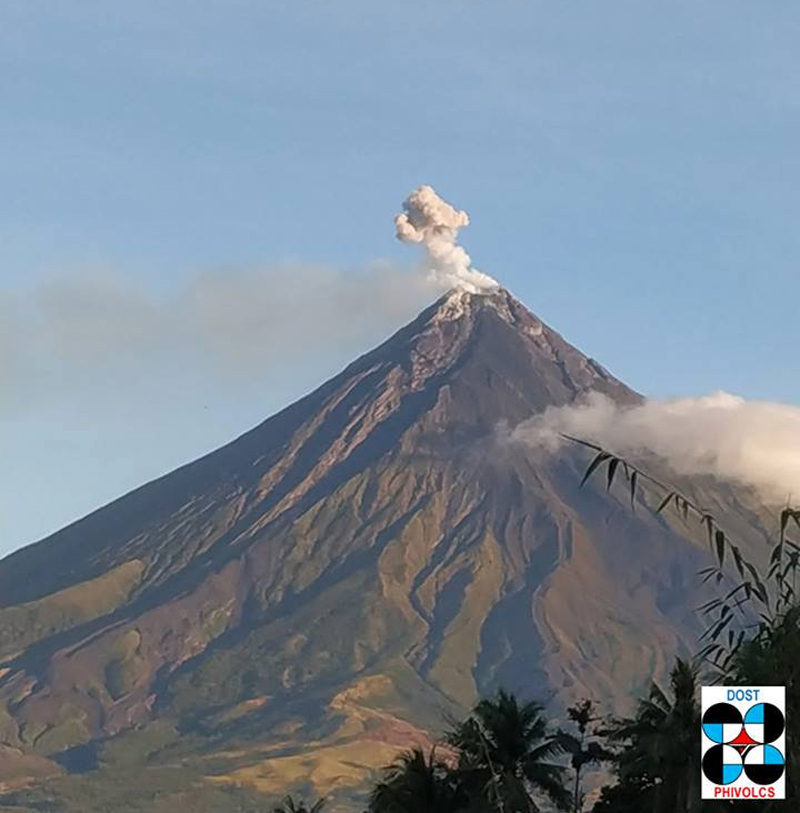 |
Figure 47. A small ash emission at Mayon was reported by PHIVOLCS on 8 March 2019; the plume rose 300 m from the summit and drifted SW. Courtesy of PHIVOLCS. |
Steam plumes drifted SW or NW throughout April, rising 200-400 m from the summit. Incandescence could be observed at night for the first half of the month. Leveling data obtained during 9-17 April 2019 indicated a slight inflation relative to 20-26 March 2019. Seismicity remained low during the month with only occasional volcanic earthquakes and rockfall events. Lenticular clouds around the summit were observed (figure 48), but these are an unusual meteorological occurrence caused by weather conditions not related to volcanic activity.
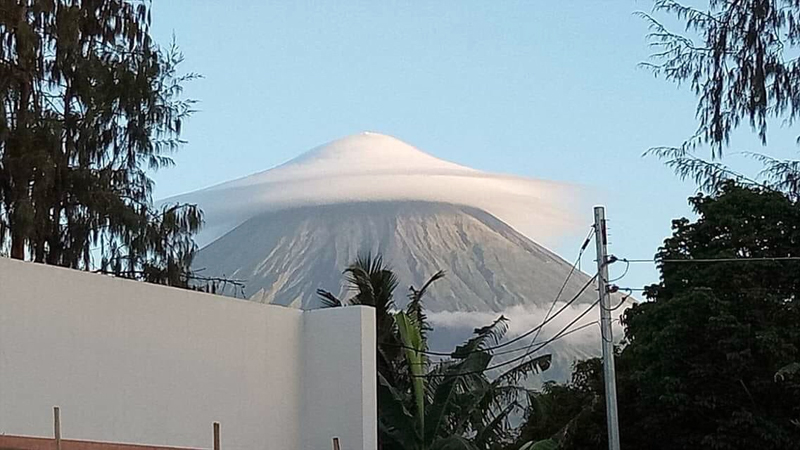 |
Figure 48. A double lenticular cloud surrounded the summit of Mayon early in the morning on 23 April 2019 and was captured by a local observer; it was not related to volcanic activity. Courtesy of Twitter user Ivan. |
Information Contacts: Philippine Institute of Volcanology and Seismology (PHIVOLCS), Department of Science and Technology, University of the Philippines Campus, Diliman, Quezon City, Philippines (URL: http://www.phivolcs.dost.gov.ph/); Global Sulfur Dioxide Monitoring Page, Atmospheric Chemistry and Dynamics Laboratory, NASA Goddard Space Flight Center (NASA/GSFC), 8800 Greenbelt Road, Goddard, Maryland, USA (URL: https://so2.gsfc.nasa.gov/); Tokyo Volcanic Ash Advisory Center (VAAC), 1-3-4 Otemachi, Chiyoda-ku, Tokyo, Japan (URL: http://ds.data.jma.go.jp/svd/vaac/data/); Sentinel Hub Playground (URL: https://www.sentinel-hub.com/explore/sentinel-playground); Twitter user "Ivan", Naga City, Philippines (URL: https://twitter.com/ivanxlcsn); Twitter user "k i t", Legazpi City, Philippines (URL: https://twitter.com/jddmgc); Twitter user "georgianne", Costa Leona, Philippines (URL: https://twitter.com/xolovesgia_).
Gas-and-steam plumes and summit incandescence during May-October 2019
Mayon, located in the Philippines, is a highly active stratovolcano with recorded historical eruptions dating back to 1616. The most recent eruptive episode began in early January 2018 that consisted of phreatic explosions, steam-and-ash plumes, lava fountaining, and pyroclastic flows (BGVN 43:04). The previous report noted small but distinct thermal anomalies, gas-and-steam plumes, and slight inflation (BGVN 44:05) that continued to occur from May into mid-October 2019. This report includes information based on daily bulletins from the Philippine Institute of Volcanology and Seismology (PHIVOLCS) and Sentinel-2 satellite imagery.
Between May and October 2019, white gas-and-steam plumes rose to a maximum altitude of 800 m on 17 May. PHIVOLCS reported that faint summit incandescence was frequently observed at night from May-July and Sentinel-2 thermal satellite imagery showed weaker thermal anomalies in September and October (figure 49); the last anomaly was identified on 12 October. Average SO2 emissions as measured by PHIVOLCS generally varied between 469-774 tons/day; the high value of the period was on 25 July, with 1,171 tons/day. Small SO2 plumes were detected by the TROPOMI satellite instrument a few times during May-September 2019 (figure 50).
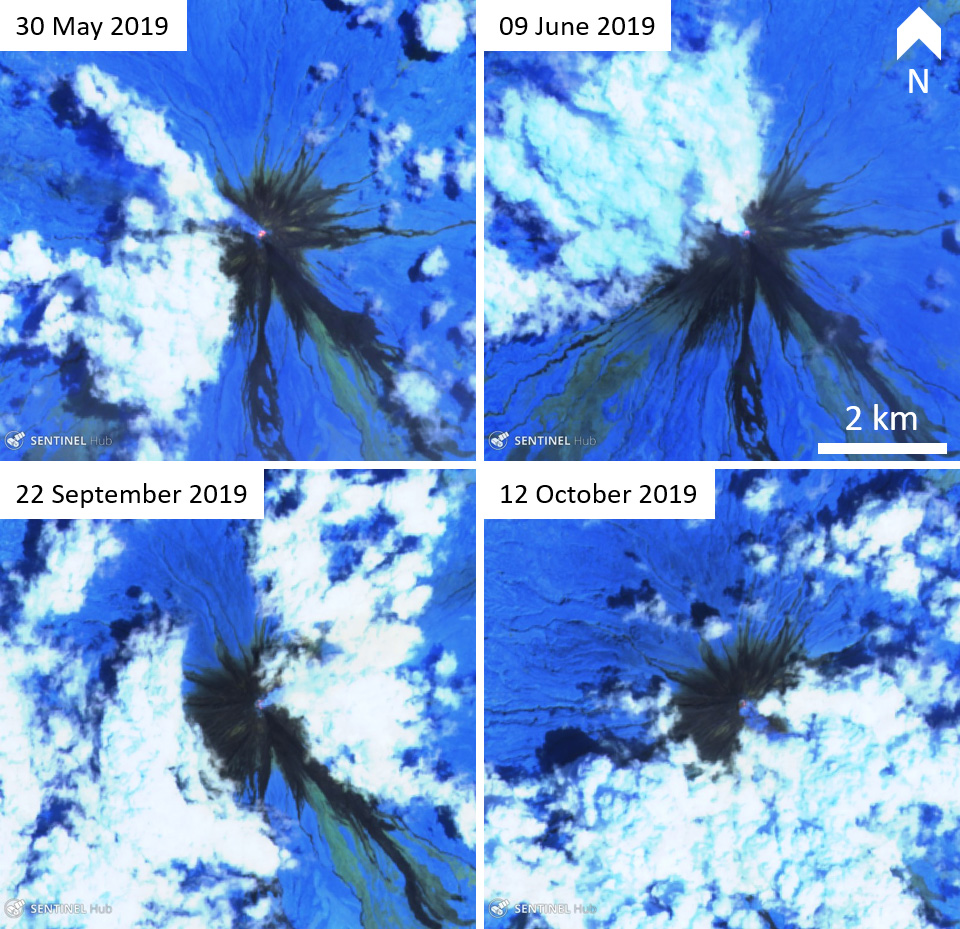 |
Figure 49. Sentinel-2 thermal satellite imagery of Mayon between May-October 2019. Small thermal anomalies were recorded in satellite imagery from the summit and some white gas-and-steam plumes are visible. Top left: 30 May 2019. Top right: 9 June 2019. Bottom left: 22 September 2019. Bottom right: 12 October 2019. Sentinel-2 satellite images with "Atmospheric penetration" (bands 12, 11, 8A) rendering; courtesy of Sentinel Hub Playground. |
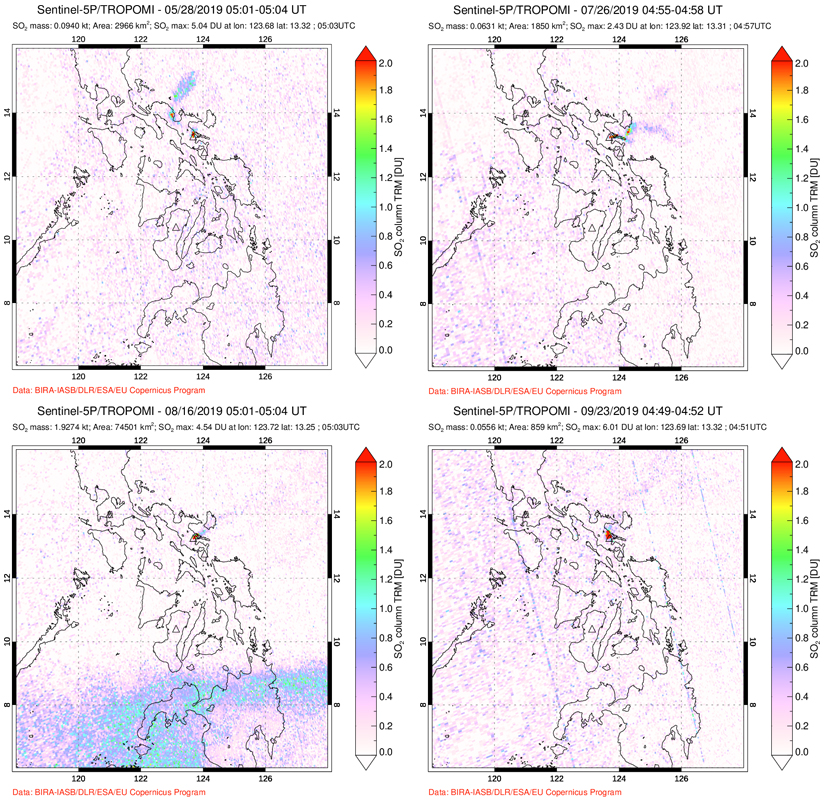 |
Figure 50. Small SO2 plumes rising from Mayon during May-September 2019 recorded in DU (Dobson Units). Top left: 28 May 2019. Top right: 26 July 2019. Bottom left: 16 August 2019. Bottom right: 23 September 2019. Courtesy of NASA Goddard Space Flight Center. |
Continuous GPS data has shown slight inflation since June 2018, corroborated by precise leveling data taken on 9-17 April, 16-25 July, and 23-30 October 2019. Elevated seismicity and occasional rockfall events were detected by the seismic monitoring network from PHIVOLCS from May to July; recorded activity decreased in August. Activity reported by PHIVOLCS in September-October 2019 consisted of frequent gas-and-steam emissions, two volcanic earthquakes, and no summit incandescence.
Information Contacts: Philippine Institute of Volcanology and Seismology (PHIVOLCS), Department of Science and Technology, University of the Philippines Campus, Diliman, Quezon City, Philippines (URL: http://www.phivolcs.dost.gov.ph/); Sentinel Hub Playground (URL: https://www.sentinel-hub.com/explore/sentinel-playground); Global Sulfur Dioxide Monitoring Page, Atmospheric Chemistry and Dynamics Laboratory, NASA Goddard Space Flight Center (NASA/GSFC), 8800 Greenbelt Road, Goddard, Maryland, USA (URL: https://SO2.gsfc.nasa.gov/).
Lava dome growth and gas-and-steam emissions during August-November 2022
Mayon, located in the Philippines, has steep upper slopes capped by a small summit crater. Recorded eruptions date back to 1616 CE and are characterized by Strombolian eruptions, lava flows, pyroclastic flows, and mudflows. Eruptions mostly originated from a central conduit. Pyroclastic flows and mudflows have commonly descended many of the approximately 40 drainages that surround the volcano. The most recent eruption occurred during January 2018 through October 2019 and included phreatic explosions, gas-and-ash plumes, lava fountaining, and pyroclastic flows (BGVN 43:04). Based on ground deformation parameters from EDM, Precise Leveling, electronic tilt and continuous GPS monitoring, slight inflation has been observed since 2020. More recent activity has been relatively low, consisting of small thermal anomalies, gas-and-steam plumes, and some inflation (BGVN 44:11). This report covers a new eruption during June through November 2022 using daily bulletins from the Philippine Institute of Volcanology and Seismology (PHIVOLCS).
Low activity was reported during June; minor inflation, particularly on the NW and SE flanks have been recorded since April 2022. According to PHIVOLCS, changes in morphology of the summit lava dome emplaced in 2018 resulted in the increase in the Volcano Alert Level (VAL) from 0 to 1 (on a scale of 0-5). Minor extrusion was estimated at about 40,000 cubic meters during 6 June through 20 August, based on daily visual and camera monitoring data. Seismicity was at baseline levels for most of 2022, though short-lived spikes in the number of low-frequency volcanic earthquakes were recorded on 26 May and 20 June. PHIVOLCS reports that based on this data, dome growth was likely the result of gas pressurization at shallow depths.
Activity during August 2022 mostly consisted of moderate gas-and-steam emissions that rose as high as 900 m above the crater and drifted in different directions. Weather clouds often obscured the summit, thus crater incandescence could not be determined on a majority of days during early-to-mid-August. Sulfur dioxide emissions were measured on 12 August and were an average of 688 tons/day (t/d). During 25-31 August faint crater incandescence was reported based on telescope observations. Sulfur dioxide emissions decreased to 195 t/d based on measurements made on 30 August. Similar low activity continued during September; moderate gas-and-steam emissions rose 100-300 m and drifted in multiple directions. Faint crater incandescence was visible based on telescope observations on clear weather days. A single volcanic earthquake was detected on each day during 6-8, 13, 23-24, and 29 September. Sulfur dioxide emissions were measured on 6, 7, 13, and 24 September and ranged between 339 t/d and 599 t/d. Three volcanic earthquakes were detected on 26 September.
During October, moderate gas-and-steam emissions rose 200-800 m above the crater and drifted in different directions. Sulfur dioxide measurements were made on 1, 12, 13 October with values that ranged from 260 t/d to 391 t/d. Beginning on 2 October, re-mobilized, light-colored ash was deposited in Miisi Gully (S flank), which was likely derived from lava fragmentation as the lava dome continued to grow, according to PHIVOLCS. Three volcanic earthquakes were detected on 3 October. Daily visual and camera monitoring data showed that the lava dome grew an additional 48,000 cubic meters during 20 August through 4 October. One volcanic earthquake was detected each day on 5, 6, 17, and 23 October. Occasional faint crater incandescence was visible in clear weather and sometimes when using a telescope. On 7 October an aerial survey was conducted and reported that freshly extruded lava was visible at the base of the summit lava dome (figure 51). As a result, the VAL was raised to a 2 (on a 0-5 scale). There were two volcanic earthquakes detected each day on 19 and 22 October.
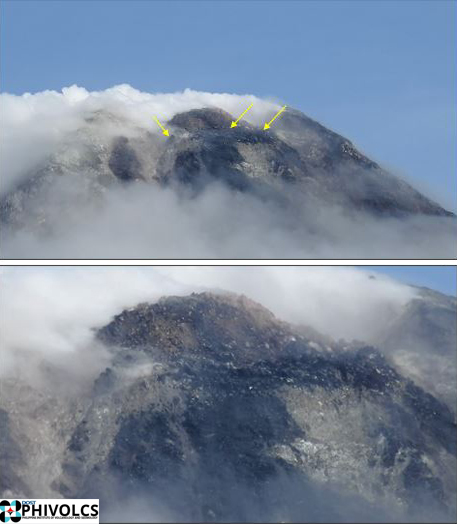 |
Figure 51. Aerial photos showing the summit lava dome at Mayon on 7 October 2022 with fresh lava effusions at the base (yellow arrows). Courtesy of PHIVOLCS. |
Faint crater incandescence persisted on clear weather days during November. Gas-and-steam emissions also continued, rising 200-250 m above the crater and drifting NE, WNW, WSW, W, and SW. Three volcanic earthquakes were detected each day on 1 and 12 November. Sulfur dioxide emissions were measured on 3 and 23 November with values that ranged from 276 t/d to 788 t/d. A single volcanic earthquake was detected each day on 7, 10, 14, and 28 November.
Information Contacts: Philippine Institute of Volcanology and Seismology (PHIVOLCS), Department of Science and Technology, University of the Philippines Campus, Diliman, Quezon City, Philippines (URL: http://www.phivolcs.dost.gov.ph/).
Lava flows, pyroclastic flows, ash emissions, and seismicity during April-September 2023
Mayon is located in the Philippines and has steep upper slopes capped by a small summit crater. Historical eruptions date back to 1616 CE that have been characterized by Strombolian eruptions, lava flows, pyroclastic flows, and mudflows. Eruptions mostly originated from a central conduit. Pyroclastic flows and mudflows have commonly descended many of the approximately 40 drainages that surround the volcano. The most recent eruption occurred during June through October 2022 and consisted of lava dome growth and gas-and-steam emissions (BGVN 47:12). A new eruption was reported during late April 2023 and has included lava flows, pyroclastic density currents, ash emissions, and seismicity. This report covers activity during April through September 2023 based on daily bulletins from the Philippine Institute of Volcanology and Seismology (PHIVOLCS).
During April through September 2023, PHIVOLCS reported near-daily rockfall events, frequent volcanic earthquakes, and sulfur dioxide measurements. Gas-and-steam emissions rose 100-900 m above the crater and drifted in different directions. Nighttime crater incandescence was often visible during clear weather and was accompanied by incandescent avalanches of material. Activity notably increased during June when lava flows were reported on the S, SE, and E flanks (figure 52). The MIROVA graph (Middle InfraRed Observation of Volcanic Activity) showed strong thermal activity coincident with these lava flows, which remained active through September (figure 53). According to the MODVOLC thermal algorithm, a total of 110 thermal alerts were detected during the reporting period: 17 during June, 40 during July, 27 during August, and 26 during September. During early June, pyroclastic density currents (PDCs) started to occur more frequently.
|
Figure 52. Infrared (bands B12, B11, B4) satellite images show strong lava flows descending the S, SE, and E flanks of Mayon on 13 June 2023 (top left), 23 June 2023 (top right), 8 July 2023 (bottom left), and 7 August 2023 (bottom right). Courtesy of Copernicus Browser. |
|
Figure 53. Strong thermal activity was detected at Mayon during early June through September, according to this MIROVA graph (Log Radiative Power) due to the presence of active lava flows on the SE, S, and E flanks. Courtesy of MIROVA. |
Low activity was reported during much of April and May; gas-and-steam emissions rose 100-900 m above the crater and generally drifted in different directions. A total of 52 rockfall events and 18 volcanic earthquakes were detected during April and 147 rockfall events and 13 volcanic events during May. Sulfur dioxide flux measurements ranged between 400-576 tons per day (t/d) during April, the latter of which was measured on 29 April and between 162-343 t/d during May, the latter of which was measured on 13 May.
Activity during June increased, characterized by lava flows, pyroclastic density currents (PDCs), crater incandescence and incandescent rockfall events, gas-and-steam emissions, and continued seismicity. Weather clouds often prevented clear views of the summit, but during clear days, moderate gas-and-steam emissions rose 100-2,500 m above the crater and drifted in multiple directions. A total of 6,237 rockfall events and 288 volcanic earthquakes were detected. The rockfall events often deposited material on the S and SE flanks within 700-1,500 m of the summit crater and ash from the events drifted SW, S, SE, NE, and E. Sulfur dioxide emissions ranged between 149-1,205 t/d, the latter of which was measured on 10 June. Short-term observations from EDM and electronic tiltmeter monitoring indicated that the upper slopes were inflating since February 2023. Longer-term ground deformation parameters based on EDM, precise leveling, continuous GPS, and electronic tilt monitoring indicated that the volcano remained inflated, especially on the NW and SE flanks. At 1000 on 5 June the Volcano Alert Level (VAL) was raised to 2 (on a 0-5 scale). PHIVOLCS noted that although low-level volcanic earthquakes, ground deformation, and volcanic gas emissions indicated unrest, the steep increase in rockfall frequency may indicate increased dome activity.
A total of 151 dome-collapse PDCs occurred during 8-9 and 11-30 June, traveled 500-2,000 m, and deposited material on the S flank within 2 km of the summit crater. During 8-9 June the VAL was raised to 3. At approximately 1947 on 11 June lava flow activity was reported; two lobes traveled within 500 m from the crater and deposited material on the S (Mi-isi), SE (Bonga), and E (Basud) flanks. Weak seismicity accompanied the lava flow and slight inflation on the upper flanks. This lava flow remained active through 30 June, moving down the S and SE flank as far as 2.5 km and 1.8 km, respectively and depositing material up to 3.3 km from the crater. During 15-16 June traces of ashfall from the PDCs were reported in Sitio Buga, Nabonton, City of Ligao and Purok, and San Francisco, Municipality of Guinobatan. During 28-29 June there were two PDCs generated by the collapse of the lava flow front, which generated a light-brown ash plume 1 km high. Satellite monitors detected significant concentrations of sulfur dioxide beginning on 29 June. On 30 June PDCs primarily affected the Basud Gully on the E flank, the largest of which occurred at 1301 and lasted eight minutes, based on the seismic record. Four PDCs generated between 1800 and 2000 that lasted approximately four minutes each traveled 3-4 km on the E flank and generated an ash plume that rose 1 km above the crater and drifted N and NW. Ashfall was recorded in Tabaco City.
Similar strong activity continued during July; slow lava effusion remained active on the S and SE flanks and traveled as far as 2.8 km and 2.8 km, respectively and material was deposited as far as 4 km from the crater. There was a total of 6,983 rockfall events and 189 PDCs that affected the S, SE, and E flanks. The volcano network detected a total of 2,124 volcanic earthquakes. Continuous gas-and-steam emissions rose 200-2,000 m above the crater and drifted in multiple directions. Sulfur dioxide emissions averaged 792-4,113 t/d, the latter of which was measured on 28 July. During 2-4 July three PDCs were generated from the collapse of the lava flow and resulting light brown plumes rose 200-300 m above the crater. Continuous tremor pulses were reported beginning at 1547 on 3 July through 7 July at 1200, at 2300 on 8 July and going through 0300 on 10 July, and at 2300 on 16 July, as recorded by the seismic network. During 6-9 July there were 10 lava flow-collapse-related PDCs that generated light brown plumes 300-500 m above the crater. During 10-11 July light ashfall was reported in some areas of Mabinit, Legazpi City, Budiao and Salvacion, Daraga, and Camalig, Albay. By 18 July the lava flow advanced 600 m on the E flank as well.
During 1733 on 18 July and 0434 on 19 July PHIVOLCS reported 30 “ashing” events, which are degassing events accompanied by audible thunder-like sounds and entrained ash at the crater, which produced short, dark plumes that drifted SW. These events each lasted 20-40 seconds, and plume heights ranged from 150-300 m above the crater, as recorded by seismic, infrasound, visual, and thermal monitors. Three more ashing events occurred during 19-20 July. Short-term observations from electronic tilt and GPS monitoring indicate deflation on the E lower flanks in early July and inflation on the NW middle flanks during the third week of July. Longer-term ground deformation parameters from EDM, precise leveling, continuous GPS, and electronic tilt monitoring indicated that the volcano was still generally inflated relative to baseline levels. A short-lived lava pulse lasted 28 seconds at 1956 on 21 July, which was accompanied by seismic and infrasound signals. By 22 July, the only lava flow that remained active was on the SE flank, and continued to extend 3.4 km, while those on the S and E flanks weakened markedly. One ashing event was detected during 30-31 July, whereas there were 57 detected during 31 July-1 August; according to PHIVOLCS beginning at approximately 1800 on 31 July eruptive activity was dominated by phases of intermittent ashing, as well as increased in the apparent rates of lava effusion from the summit crater. The ashing phases consisted of discrete events recorded as low-frequency volcanic earthquakes (LFVQ) typically 30 seconds in duration, based on seismic and infrasound signals. Gray ash plume rose 100 m above the crater and generally drifted NE. Shortly after these ashing events began, new lava began to effuse rapidly from the crater, feeding the established flowed on the SE, E, and E flanks and generating frequent rockfall events.
Intensified unrest persisted during August. There was a total of 4,141 rockfall events, 2,881 volcanic earthquakes, which included volcanic tremor events, 32 ashing events, and 101 PDCs detected throughout the month. On clear weather days, gas-and-steam emissions rose 300-1,500 m above the crater and drifted in different directions (figure 54). Sulfur dioxide emissions averaged 735-4,756 t/d, the higher value of which was measured on 16 August. During 1-2 August the rate of lava effusion decreased, but continued to feed the flows on the SE, S, and E flanks, maintaining their advances to 3.4 km, 2.8 km, and 1.1 km from the crater, respectively (figure 55). Rockfall and PDCs generated by collapses at the lava flow margins and from the summit dome deposited material within 4 km of the crater. During 3-4 August there were 10 tremor events detected that lasted 1-4 minutes. Short-lived lava pulse lasted 35 seconds and was accompanied by seismic and infrasound signals at 0442 on 6 August. Seven collapses were recorded at the front of the lava flow during 12-14 August.
|
Figure 54. Photo of Mayon showing a white gas-and-steam plume rising 800-1,500 m above the crater at 0645 on 25 August. Courtesy of William Rogers. |
|
Figure 55. Photo of Mayon facing N showing incandescent lava flows and summit crater incandescence taken at 1830 on 25 August 2023. Courtesy of William Rogers. |
During September, similar activity of slow lava effusion, PDCs, gas-and-steam emissions, and seismicity continued. There was a total of 4,452 rockfall events, 329 volcanic earthquakes, which included volcanic tremor events, two ashing events, and 85 PDCs recorded throughout the month. On clear weather days, gas-and-steam emissions rose 100-1,500 m above the crater and drifted in multiple directions. Sulfur dioxide emissions averaged 609-2,252 t/d, the higher average of which was measured on 6 September. Slow lava effusion continued advancing on the SE, S, and E flanks, maintaining lengths of 3.4 km, 2.8 km, and 1.1 km, respectively. Rockfall and PDC events generated by collapses along the lava flow margins and at the summit dome deposited material within 4 km of the crater.
Information Contacts: Philippine Institute of Volcanology and Seismology (PHIVOLCS), Department of Science and Technology, University of the Philippines Campus, Diliman, Quezon City, Philippines (URL: http://www.phivolcs.dost.gov.ph/); MIROVA (Middle InfraRed Observation of Volcanic Activity), a collaborative project between the Universities of Turin and Florence (Italy) supported by the Centre for Volcanic Risk of the Italian Civil Protection Department (URL: http://www.mirovaweb.it/); Hawai'i Institute of Geophysics and Planetology (HIGP) - MODVOLC Thermal Alerts System, School of Ocean and Earth Science and Technology (SOEST), Univ. of Hawai'i, 2525 Correa Road, Honolulu, HI 96822, USA (URL: http://modis.higp.hawaii.edu/); Copernicus Browser, Copernicus Data Space Ecosystem, European Space Agency (URL: https://dataspace.copernicus.eu/browser/); William Rogers, Legazpi City, Albay Province, Philippines.
|
|
||||||||||||||||||||||||||
There is data available for 65 confirmed eruptive periods.
2024 May 30 - 2024 Jul 18 Confirmed Eruption (Explosive / Effusive) VEI: 1
| Episode 1 | Eruption (Explosive / Effusive) | ||||||||||||||||||||||||
|---|---|---|---|---|---|---|---|---|---|---|---|---|---|---|---|---|---|---|---|---|---|---|---|---|
| 2024 May 30 - 2024 Jul 18 | Evidence from Observations: Reported | |||||||||||||||||||||||
|
List of 3 Events for Episode 1
|
||||||||||||||||||||||||
2023 Apr 27 ± 2 days - 2024 Feb 4 Confirmed Eruption (Explosive / Effusive) VEI: 2
| Episode 1 | Eruption (Explosive / Effusive) | ||||||||||||||||||||||||||||||||||||||||||||||||||||||||||||||||||||||||||
|---|---|---|---|---|---|---|---|---|---|---|---|---|---|---|---|---|---|---|---|---|---|---|---|---|---|---|---|---|---|---|---|---|---|---|---|---|---|---|---|---|---|---|---|---|---|---|---|---|---|---|---|---|---|---|---|---|---|---|---|---|---|---|---|---|---|---|---|---|---|---|---|---|---|---|
| 2023 Apr 27 ± 2 days - 2024 Feb 4 | Evidence from Observations: Reported | |||||||||||||||||||||||||||||||||||||||||||||||||||||||||||||||||||||||||
|
List of 13 Events for Episode 1
|
||||||||||||||||||||||||||||||||||||||||||||||||||||||||||||||||||||||||||
2022 Jun 6 - 2022 Oct 7 Confirmed Eruption (Explosive / Effusive) VEI: 0
| Episode 1 | Eruption (Explosive / Effusive) | ||||||||||||||||||||||||
|---|---|---|---|---|---|---|---|---|---|---|---|---|---|---|---|---|---|---|---|---|---|---|---|---|
| 2022 Jun 6 - 2022 Oct 7 | Evidence from Observations: Reported | |||||||||||||||||||||||
|
List of 3 Events for Episode 1
|
||||||||||||||||||||||||
2018 Jan 13 - 2019 Jul 31 ± 30 days Confirmed Eruption (Explosive / Effusive) VEI: 3
| Episode 1 | Eruption (Explosive / Effusive) | Summit crater | ||||||||||||||||||||||||||||||||||||||||||||||||||||||||||||||||||||||||||||||||||||||||||||||||||||||||||||||||||||||||||||||||||||||||||||||||||||||||||||||||||||||||||||||||||||||||||||||||||||||||||||||||||||||||||||||||||||||||||||||||||||||||||||||||||||||||||||||||||||||||||||||||||||||||||||||||||||||||||||||||||||||||||||||||||||||||||||||||||||||||||||||||||||||||||||||||||||||||||||||||||||||||||||||||||||||||||||||||||||||||||||||||||||||||||||||||||||||||||||||||||||||||||||||||||||||||||||||||||||||||||||||||||||||||||||||||||||||||||||||||||||||||||||||||||||||||||||||||||||||||||||||||||||||||||||||||||||||||||||||||||||||||||||||||||||||||||||||||||||||||||||||||||||||||||||||||||||||||||||||||||||||||||||||||||||||||||||||||||||||||||||||||||||||||||||||||||||||||||||||||||||||||||||||||||||||||||||||||||||||||||||||||||||||||||||||||||||||||||||||||||||||||||||||||||||||||||||||||||||||||||||||||||||||||||||||||||||||||||||||||||||||||||||||||||||||||||||||||||||||
|---|---|---|---|---|---|---|---|---|---|---|---|---|---|---|---|---|---|---|---|---|---|---|---|---|---|---|---|---|---|---|---|---|---|---|---|---|---|---|---|---|---|---|---|---|---|---|---|---|---|---|---|---|---|---|---|---|---|---|---|---|---|---|---|---|---|---|---|---|---|---|---|---|---|---|---|---|---|---|---|---|---|---|---|---|---|---|---|---|---|---|---|---|---|---|---|---|---|---|---|---|---|---|---|---|---|---|---|---|---|---|---|---|---|---|---|---|---|---|---|---|---|---|---|---|---|---|---|---|---|---|---|---|---|---|---|---|---|---|---|---|---|---|---|---|---|---|---|---|---|---|---|---|---|---|---|---|---|---|---|---|---|---|---|---|---|---|---|---|---|---|---|---|---|---|---|---|---|---|---|---|---|---|---|---|---|---|---|---|---|---|---|---|---|---|---|---|---|---|---|---|---|---|---|---|---|---|---|---|---|---|---|---|---|---|---|---|---|---|---|---|---|---|---|---|---|---|---|---|---|---|---|---|---|---|---|---|---|---|---|---|---|---|---|---|---|---|---|---|---|---|---|---|---|---|---|---|---|---|---|---|---|---|---|---|---|---|---|---|---|---|---|---|---|---|---|---|---|---|---|---|---|---|---|---|---|---|---|---|---|---|---|---|---|---|---|---|---|---|---|---|---|---|---|---|---|---|---|---|---|---|---|---|---|---|---|---|---|---|---|---|---|---|---|---|---|---|---|---|---|---|---|---|---|---|---|---|---|---|---|---|---|---|---|---|---|---|---|---|---|---|---|---|---|---|---|---|---|---|---|---|---|---|---|---|---|---|---|---|---|---|---|---|---|---|---|---|---|---|---|---|---|---|---|---|---|---|---|---|---|---|---|---|---|---|---|---|---|---|---|---|---|---|---|---|---|---|---|---|---|---|---|---|---|---|---|---|---|---|---|---|---|---|---|---|---|---|---|---|---|---|---|---|---|---|---|---|---|---|---|---|---|---|---|---|---|---|---|---|---|---|---|---|---|---|---|---|---|---|---|---|---|---|---|---|---|---|---|---|---|---|---|---|---|---|---|---|---|---|---|---|---|---|---|---|---|---|---|---|---|---|---|---|---|---|---|---|---|---|---|---|---|---|---|---|---|---|---|---|---|---|---|---|---|---|---|---|---|---|---|---|---|---|---|---|---|---|---|---|---|---|---|---|---|---|---|---|---|---|---|---|---|---|---|---|---|---|---|---|---|---|---|---|---|---|---|---|---|---|---|---|---|---|---|---|---|---|---|---|---|---|---|---|---|---|---|---|---|---|---|---|---|---|---|---|---|---|---|---|---|---|---|---|---|---|---|---|---|---|---|---|---|---|---|---|---|---|---|---|---|---|---|---|---|---|---|---|---|---|---|---|---|---|---|---|---|---|---|---|---|---|---|---|---|---|---|---|---|---|---|---|---|---|---|---|---|---|---|---|---|---|---|---|---|---|---|---|---|---|---|---|---|---|---|---|---|---|---|---|---|---|---|---|---|---|---|---|---|---|---|---|---|---|---|---|---|---|---|---|---|---|---|---|---|---|---|---|---|---|---|---|---|---|---|---|---|---|---|---|---|---|---|---|---|---|---|---|---|---|---|---|---|---|---|---|---|---|---|---|---|---|---|---|---|---|---|---|---|---|---|---|---|---|---|---|---|---|---|---|---|---|---|---|---|---|---|---|---|---|---|---|---|---|---|---|---|---|---|---|---|---|---|---|---|---|---|---|---|---|---|---|---|---|---|---|---|---|---|---|---|---|---|---|---|---|---|---|---|---|---|---|---|---|---|---|---|---|---|---|---|---|---|---|---|---|---|---|---|---|---|---|---|---|---|---|---|---|---|---|---|---|---|---|---|---|---|---|---|---|---|---|---|---|---|---|---|---|---|---|---|---|---|---|---|---|---|---|---|---|---|---|---|---|---|---|---|---|---|---|---|---|---|---|---|---|---|---|---|---|---|---|---|---|---|---|---|---|---|---|---|---|---|---|---|---|---|---|---|---|---|---|---|---|---|---|---|---|---|---|---|---|---|---|---|---|---|---|---|---|---|---|---|---|---|---|---|---|---|---|---|---|---|---|---|---|---|---|---|---|---|---|---|---|---|---|---|---|---|---|---|---|---|---|---|---|---|---|---|---|---|---|---|---|---|---|---|---|---|---|---|---|---|---|---|---|---|---|---|---|---|---|---|---|---|---|---|---|---|---|---|---|---|---|---|---|---|---|---|---|---|
| 2018 Jan 13 - 2018 Aug 28 | Evidence from Observations: Reported | ||||||||||||||||||||||||||||||||||||||||||||||||||||||||||||||||||||||||||||||||||||||||||||||||||||||||||||||||||||||||||||||||||||||||||||||||||||||||||||||||||||||||||||||||||||||||||||||||||||||||||||||||||||||||||||||||||||||||||||||||||||||||||||||||||||||||||||||||||||||||||||||||||||||||||||||||||||||||||||||||||||||||||||||||||||||||||||||||||||||||||||||||||||||||||||||||||||||||||||||||||||||||||||||||||||||||||||||||||||||||||||||||||||||||||||||||||||||||||||||||||||||||||||||||||||||||||||||||||||||||||||||||||||||||||||||||||||||||||||||||||||||||||||||||||||||||||||||||||||||||||||||||||||||||||||||||||||||||||||||||||||||||||||||||||||||||||||||||||||||||||||||||||||||||||||||||||||||||||||||||||||||||||||||||||||||||||||||||||||||||||||||||||||||||||||||||||||||||||||||||||||||||||||||||||||||||||||||||||||||||||||||||||||||||||||||||||||||||||||||||||||||||||||||||||||||||||||||||||||||||||||||||||||||||||||||||||||||||||||||||||||||||||||||||||||||||||||||||||||||
|
List of 277 Events for Episode 1 at Summit crater
|
|||||||||||||||||||||||||||||||||||||||||||||||||||||||||||||||||||||||||||||||||||||||||||||||||||||||||||||||||||||||||||||||||||||||||||||||||||||||||||||||||||||||||||||||||||||||||||||||||||||||||||||||||||||||||||||||||||||||||||||||||||||||||||||||||||||||||||||||||||||||||||||||||||||||||||||||||||||||||||||||||||||||||||||||||||||||||||||||||||||||||||||||||||||||||||||||||||||||||||||||||||||||||||||||||||||||||||||||||||||||||||||||||||||||||||||||||||||||||||||||||||||||||||||||||||||||||||||||||||||||||||||||||||||||||||||||||||||||||||||||||||||||||||||||||||||||||||||||||||||||||||||||||||||||||||||||||||||||||||||||||||||||||||||||||||||||||||||||||||||||||||||||||||||||||||||||||||||||||||||||||||||||||||||||||||||||||||||||||||||||||||||||||||||||||||||||||||||||||||||||||||||||||||||||||||||||||||||||||||||||||||||||||||||||||||||||||||||||||||||||||||||||||||||||||||||||||||||||||||||||||||||||||||||||||||||||||||||||||||||||||||||||||||||||||||||||||||||||||||||||
| Episode 2 | Eruption (Explosive / Effusive) | Summit crater | ||||||||||||||||||||||||||||||||||||||||||||||||||||||||||||||||||||||||||||||||||||||||||||||||||
|---|---|---|---|---|---|---|---|---|---|---|---|---|---|---|---|---|---|---|---|---|---|---|---|---|---|---|---|---|---|---|---|---|---|---|---|---|---|---|---|---|---|---|---|---|---|---|---|---|---|---|---|---|---|---|---|---|---|---|---|---|---|---|---|---|---|---|---|---|---|---|---|---|---|---|---|---|---|---|---|---|---|---|---|---|---|---|---|---|---|---|---|---|---|---|---|---|---|---|---|
| 2018 Nov 8 - 2018 Dec 27 | Evidence from Observations: Reported | ||||||||||||||||||||||||||||||||||||||||||||||||||||||||||||||||||||||||||||||||||||||||||||||||||
|
List of 18 Events for Episode 2 at Summit crater
|
|||||||||||||||||||||||||||||||||||||||||||||||||||||||||||||||||||||||||||||||||||||||||||||||||||
| Episode 3 | Eruption (Explosive / Effusive) | Summit crater | |||||||||||||||||||||||||||||||||||||||||||||||||||||||||||||||||||||||||||||||||||||||||||||||||||||||||||||||||||||||||||||||||||||
|---|---|---|---|---|---|---|---|---|---|---|---|---|---|---|---|---|---|---|---|---|---|---|---|---|---|---|---|---|---|---|---|---|---|---|---|---|---|---|---|---|---|---|---|---|---|---|---|---|---|---|---|---|---|---|---|---|---|---|---|---|---|---|---|---|---|---|---|---|---|---|---|---|---|---|---|---|---|---|---|---|---|---|---|---|---|---|---|---|---|---|---|---|---|---|---|---|---|---|---|---|---|---|---|---|---|---|---|---|---|---|---|---|---|---|---|---|---|---|---|---|---|---|---|---|---|---|---|---|---|---|---|---|---|---|
| 2019 Mar 7 (?) - 2019 Jul 31 ± 30 days | Evidence from Observations: Reported | |||||||||||||||||||||||||||||||||||||||||||||||||||||||||||||||||||||||||||||||||||||||||||||||||||||||||||||||||||||||||||||||||||||
|
List of 25 Events for Episode 3 at Summit crater
|
||||||||||||||||||||||||||||||||||||||||||||||||||||||||||||||||||||||||||||||||||||||||||||||||||||||||||||||||||||||||||||||||||||||
2014 Aug 12 - 2014 Oct 19 Confirmed Eruption (Explosive / Effusive) VEI: 0
| Episode 1 | Eruption (Explosive / Effusive) | Summit crater | |||||||||||||||||||||||||||||||||||||||||||||||||||||||||||||||||||||||||||||||||||||||||||||
|---|---|---|---|---|---|---|---|---|---|---|---|---|---|---|---|---|---|---|---|---|---|---|---|---|---|---|---|---|---|---|---|---|---|---|---|---|---|---|---|---|---|---|---|---|---|---|---|---|---|---|---|---|---|---|---|---|---|---|---|---|---|---|---|---|---|---|---|---|---|---|---|---|---|---|---|---|---|---|---|---|---|---|---|---|---|---|---|---|---|---|---|---|---|---|
| 2014 Aug 12 - 2014 Oct 19 | Evidence from Observations: Reported | |||||||||||||||||||||||||||||||||||||||||||||||||||||||||||||||||||||||||||||||||||||||||||||
|
List of 17 Events for Episode 1 at Summit crater
|
||||||||||||||||||||||||||||||||||||||||||||||||||||||||||||||||||||||||||||||||||||||||||||||
2013 May 7 - 2013 May 7 Confirmed Eruption (Explosive / Effusive) VEI: 1
| Episode 1 | Eruption (Explosive / Effusive) | Summit crater | |||||||||||||||||||||||||||||||||||||||||||
|---|---|---|---|---|---|---|---|---|---|---|---|---|---|---|---|---|---|---|---|---|---|---|---|---|---|---|---|---|---|---|---|---|---|---|---|---|---|---|---|---|---|---|---|---|
| 2013 May 7 - 2013 May 7 | Evidence from Observations: Reported | |||||||||||||||||||||||||||||||||||||||||||
| A small phreatic eruption on 7 May 2013 produced an ash plume that rose 500 m; traces of ash fell up to 19 km away. It also produced large blocks of ejecta that landed nearby, causing five fatalities to hikers located within 500 m of the summit. | ||||||||||||||||||||||||||||||||||||||||||||
|
List of 7 Events for Episode 1 at Summit crater
|
||||||||||||||||||||||||||||||||||||||||||||
2009 Sep 15 - 2010 Jan 1 (?) Confirmed Eruption (Explosive / Effusive) VEI: 2
| Episode 1 | Eruption (Explosive / Effusive) | |||||||||||||||||||||||||||||||||||||||||||||||||||||||||||
|---|---|---|---|---|---|---|---|---|---|---|---|---|---|---|---|---|---|---|---|---|---|---|---|---|---|---|---|---|---|---|---|---|---|---|---|---|---|---|---|---|---|---|---|---|---|---|---|---|---|---|---|---|---|---|---|---|---|---|---|
| 2009 Sep 15 - 2010 Jan 1 (?) | Evidence from Observations: Reported | ||||||||||||||||||||||||||||||||||||||||||||||||||||||||||
|
List of 10 Events for Episode 1
|
|||||||||||||||||||||||||||||||||||||||||||||||||||||||||||
2008 Aug 10 - 2008 Aug 10 Confirmed Eruption (Explosive / Effusive) VEI: 1
| Episode 1 | Eruption (Explosive / Effusive) | ||||||||||||||||||||||||||||||||||
|---|---|---|---|---|---|---|---|---|---|---|---|---|---|---|---|---|---|---|---|---|---|---|---|---|---|---|---|---|---|---|---|---|---|---|
| 2008 Aug 10 - 2008 Aug 10 | Evidence from Observations: Reported | |||||||||||||||||||||||||||||||||
|
List of 5 Events for Episode 1
|
||||||||||||||||||||||||||||||||||
2006 Jul 13 - 2006 Oct 1 Confirmed Eruption (Explosive / Effusive) VEI: 1
| Episode 1 | Eruption (Explosive / Effusive) | |||||||||||||||||||||||||||||||||||||||||||||||||||||||||||||||||||||
|---|---|---|---|---|---|---|---|---|---|---|---|---|---|---|---|---|---|---|---|---|---|---|---|---|---|---|---|---|---|---|---|---|---|---|---|---|---|---|---|---|---|---|---|---|---|---|---|---|---|---|---|---|---|---|---|---|---|---|---|---|---|---|---|---|---|---|---|---|---|
| 2006 Jul 13 - 2006 Oct 1 | Evidence from Observations: Reported | ||||||||||||||||||||||||||||||||||||||||||||||||||||||||||||||||||||
|
List of 12 Events for Episode 1
|
|||||||||||||||||||||||||||||||||||||||||||||||||||||||||||||||||||||
2006 Feb 21 - 2006 Feb 23 Confirmed Eruption (Explosive / Effusive) VEI: 1
| Episode 1 | Eruption (Explosive / Effusive) | |||||||||||||||||||||||||||||||||||||||
|---|---|---|---|---|---|---|---|---|---|---|---|---|---|---|---|---|---|---|---|---|---|---|---|---|---|---|---|---|---|---|---|---|---|---|---|---|---|---|---|
| 2006 Feb 21 - 2006 Feb 23 | Evidence from Observations: Reported | ||||||||||||||||||||||||||||||||||||||
|
List of 6 Events for Episode 1
|
|||||||||||||||||||||||||||||||||||||||
2005 Aug 17 (on or before) Confirmed Eruption (Explosive / Effusive) VEI: 0
| Episode 1 | Eruption (Explosive / Effusive) | |||||||||||||||||||
|---|---|---|---|---|---|---|---|---|---|---|---|---|---|---|---|---|---|---|---|
| 2005 Aug 17 (on or before) - Unknown | Evidence from Observations: Reported | ||||||||||||||||||
|
List of 2 Events for Episode 1
|
|||||||||||||||||||
2004 Jun 3 - 2004 Sep 12 (?) Confirmed Eruption (Explosive / Effusive) VEI: 1
| Episode 1 | Eruption (Explosive / Effusive) | |||||||||||||||||||||||||||||||||||||||
|---|---|---|---|---|---|---|---|---|---|---|---|---|---|---|---|---|---|---|---|---|---|---|---|---|---|---|---|---|---|---|---|---|---|---|---|---|---|---|---|
| 2004 Jun 3 - 2004 Sep 12 (?) | Evidence from Observations: Reported | ||||||||||||||||||||||||||||||||||||||
|
List of 6 Events for Episode 1
|
|||||||||||||||||||||||||||||||||||||||
[ 2003 Oct 8 - 2003 Oct 11 (?) ] Uncertain Eruption
| Episode 1 | Eruption (Explosive / Effusive) | ||||||||||||||||||||||||
|---|---|---|---|---|---|---|---|---|---|---|---|---|---|---|---|---|---|---|---|---|---|---|---|---|
| 2003 Oct 8 - 2003 Oct 11 (?) | Evidence from Unknown | |||||||||||||||||||||||
|
List of 3 Events for Episode 1
|
||||||||||||||||||||||||
2003 Mar 17 - 2003 May 14 Confirmed Eruption (Explosive / Effusive) VEI: 2
| Episode 1 | Eruption (Explosive / Effusive) | ||||||||||||||||||||||||||||||||||
|---|---|---|---|---|---|---|---|---|---|---|---|---|---|---|---|---|---|---|---|---|---|---|---|---|---|---|---|---|---|---|---|---|---|---|
| 2003 Mar 17 - 2003 May 14 | Evidence from Observations: Reported | |||||||||||||||||||||||||||||||||
|
List of 5 Events for Episode 1
|
||||||||||||||||||||||||||||||||||
2002 Oct 11 - 2002 Oct 11 Confirmed Eruption (Explosive / Effusive) VEI: 1
| Episode 1 | Eruption (Explosive / Effusive) | ||||||||||||||||||||||||||||||||||
|---|---|---|---|---|---|---|---|---|---|---|---|---|---|---|---|---|---|---|---|---|---|---|---|---|---|---|---|---|---|---|---|---|---|---|
| 2002 Oct 11 - 2002 Oct 11 | Evidence from Observations: Reported | |||||||||||||||||||||||||||||||||
|
List of 5 Events for Episode 1
|
||||||||||||||||||||||||||||||||||
2001 Jan 8 - 2001 Aug 8 Confirmed Eruption (Explosive / Effusive) VEI: 3
| Episode 1 | Eruption (Explosive / Effusive) | |||||||||||||||||||||||||||||||||||||||||||||||||||||||||||||||||||||||||||||||||||||||||
|---|---|---|---|---|---|---|---|---|---|---|---|---|---|---|---|---|---|---|---|---|---|---|---|---|---|---|---|---|---|---|---|---|---|---|---|---|---|---|---|---|---|---|---|---|---|---|---|---|---|---|---|---|---|---|---|---|---|---|---|---|---|---|---|---|---|---|---|---|---|---|---|---|---|---|---|---|---|---|---|---|---|---|---|---|---|---|---|---|---|
| 2001 Jan 8 - 2001 Aug 8 | Evidence from Observations: Reported | ||||||||||||||||||||||||||||||||||||||||||||||||||||||||||||||||||||||||||||||||||||||||
|
List of 16 Events for Episode 1
|
|||||||||||||||||||||||||||||||||||||||||||||||||||||||||||||||||||||||||||||||||||||||||
2000 Jul 16 - 2000 Aug 31 Confirmed Eruption (Explosive / Effusive) VEI: 2
| Episode 1 | Eruption (Explosive / Effusive) | |||||||||||||||||||||||||||||||||||||||
|---|---|---|---|---|---|---|---|---|---|---|---|---|---|---|---|---|---|---|---|---|---|---|---|---|---|---|---|---|---|---|---|---|---|---|---|---|---|---|---|
| 2000 Jul 16 - 2000 Aug 31 | Evidence from Observations: Reported | ||||||||||||||||||||||||||||||||||||||
|
List of 6 Events for Episode 1
|
|||||||||||||||||||||||||||||||||||||||
1999 Jun 22 - 2000 Mar 19 Confirmed Eruption (Explosive / Effusive) VEI: 3
| Episode 1 | Eruption (Explosive / Effusive) | ||||||||||||||||||||||||||||||||||||||||||||||||||||||||||||||||||||||||||
|---|---|---|---|---|---|---|---|---|---|---|---|---|---|---|---|---|---|---|---|---|---|---|---|---|---|---|---|---|---|---|---|---|---|---|---|---|---|---|---|---|---|---|---|---|---|---|---|---|---|---|---|---|---|---|---|---|---|---|---|---|---|---|---|---|---|---|---|---|---|---|---|---|---|---|
| 1999 Jun 22 - 2000 Mar 19 | Evidence from Observations: Reported | |||||||||||||||||||||||||||||||||||||||||||||||||||||||||||||||||||||||||
|
List of 13 Events for Episode 1
|
||||||||||||||||||||||||||||||||||||||||||||||||||||||||||||||||||||||||||
1993 Feb 2 - 1993 Apr 4 Confirmed Eruption (Explosive / Effusive) VEI: 2 (?)
| Episode 1 | Eruption (Explosive / Effusive) | |||||||||||||||||||||||||||||||||||||||||||||||||||||||||||||||||||||||||||||||
|---|---|---|---|---|---|---|---|---|---|---|---|---|---|---|---|---|---|---|---|---|---|---|---|---|---|---|---|---|---|---|---|---|---|---|---|---|---|---|---|---|---|---|---|---|---|---|---|---|---|---|---|---|---|---|---|---|---|---|---|---|---|---|---|---|---|---|---|---|---|---|---|---|---|---|---|---|---|---|---|
| 1993 Feb 2 - 1993 Apr 4 | Evidence from Observations: Reported | ||||||||||||||||||||||||||||||||||||||||||||||||||||||||||||||||||||||||||||||
|
List of 14 Events for Episode 1
|
|||||||||||||||||||||||||||||||||||||||||||||||||||||||||||||||||||||||||||||||
1984 Sep 9 - 1984 Oct 6 Confirmed Eruption (Explosive / Effusive) VEI: 3
| Episode 1 | Eruption (Explosive / Effusive) | |||||||||||||||||||||||||||||||||||||||||||||||||||||||||||||||||||||||||||||||||||||||||
|---|---|---|---|---|---|---|---|---|---|---|---|---|---|---|---|---|---|---|---|---|---|---|---|---|---|---|---|---|---|---|---|---|---|---|---|---|---|---|---|---|---|---|---|---|---|---|---|---|---|---|---|---|---|---|---|---|---|---|---|---|---|---|---|---|---|---|---|---|---|---|---|---|---|---|---|---|---|---|---|---|---|---|---|---|---|---|---|---|---|
| 1984 Sep 9 - 1984 Oct 6 | Evidence from Observations: Reported | ||||||||||||||||||||||||||||||||||||||||||||||||||||||||||||||||||||||||||||||||||||||||
|
List of 16 Events for Episode 1
|
|||||||||||||||||||||||||||||||||||||||||||||||||||||||||||||||||||||||||||||||||||||||||
1978 Mar 7 - 1978 Sep 16 (?) ± 15 days Confirmed Eruption (Explosive / Effusive) VEI: 2
| Episode 1 | Eruption (Explosive / Effusive) | ||||||||||||||||||||||||||||||||||||||||||||||||||||||||||||||||
|---|---|---|---|---|---|---|---|---|---|---|---|---|---|---|---|---|---|---|---|---|---|---|---|---|---|---|---|---|---|---|---|---|---|---|---|---|---|---|---|---|---|---|---|---|---|---|---|---|---|---|---|---|---|---|---|---|---|---|---|---|---|---|---|---|
| 1978 Mar 7 - 1978 Sep 16 (?) ± 15 days | Evidence from Observations: Reported | |||||||||||||||||||||||||||||||||||||||||||||||||||||||||||||||
|
List of 11 Events for Episode 1
|
||||||||||||||||||||||||||||||||||||||||||||||||||||||||||||||||
1968 Apr 21 - 1968 May 20 Confirmed Eruption (Explosive / Effusive) VEI: 3
| Episode 1 | Eruption (Explosive / Effusive) | ||||||||||||||||||||||||||||||||||||||||||||||||||||||||||||||||||||||||||||||||||||||||||||||
|---|---|---|---|---|---|---|---|---|---|---|---|---|---|---|---|---|---|---|---|---|---|---|---|---|---|---|---|---|---|---|---|---|---|---|---|---|---|---|---|---|---|---|---|---|---|---|---|---|---|---|---|---|---|---|---|---|---|---|---|---|---|---|---|---|---|---|---|---|---|---|---|---|---|---|---|---|---|---|---|---|---|---|---|---|---|---|---|---|---|---|---|---|---|---|
| 1968 Apr 21 - 1968 May 20 | Evidence from Observations: Reported | |||||||||||||||||||||||||||||||||||||||||||||||||||||||||||||||||||||||||||||||||||||||||||||
|
List of 17 Events for Episode 1
|
||||||||||||||||||||||||||||||||||||||||||||||||||||||||||||||||||||||||||||||||||||||||||||||
1947 Jan 8 - 1947 Feb Confirmed Eruption (Explosive / Effusive) VEI: 2
| Episode 1 | Eruption (Explosive / Effusive) | |||||||||||||||||||||||||||||||||||||||||||||||||||||||||||
|---|---|---|---|---|---|---|---|---|---|---|---|---|---|---|---|---|---|---|---|---|---|---|---|---|---|---|---|---|---|---|---|---|---|---|---|---|---|---|---|---|---|---|---|---|---|---|---|---|---|---|---|---|---|---|---|---|---|---|---|
| 1947 Jan 8 - 1947 Feb | Evidence from Observations: Reported | ||||||||||||||||||||||||||||||||||||||||||||||||||||||||||
|
List of 10 Events for Episode 1
|
|||||||||||||||||||||||||||||||||||||||||||||||||||||||||||
1943 Confirmed Eruption (Explosive / Effusive) VEI: 1
| Episode 1 | Eruption (Explosive / Effusive) | ||||||||||||||||||||||||
|---|---|---|---|---|---|---|---|---|---|---|---|---|---|---|---|---|---|---|---|---|---|---|---|---|
| 1943 - Unknown | Evidence from Observations: Reported | |||||||||||||||||||||||
|
List of 3 Events for Episode 1
|
||||||||||||||||||||||||
1941 Sep 13 Confirmed Eruption (Explosive / Effusive) VEI: 1
| Episode 1 | Eruption (Explosive / Effusive) | ||||||||||||||||||||||||
|---|---|---|---|---|---|---|---|---|---|---|---|---|---|---|---|---|---|---|---|---|---|---|---|---|
| 1941 Sep 13 - Unknown | Evidence from Observations: Reported | |||||||||||||||||||||||
|
List of 3 Events for Episode 1
|
||||||||||||||||||||||||
1939 Aug 21 Confirmed Eruption (Explosive / Effusive) VEI: 1
| Episode 1 | Eruption (Explosive / Effusive) | |||||||||||||||||||
|---|---|---|---|---|---|---|---|---|---|---|---|---|---|---|---|---|---|---|---|
| 1939 Aug 21 - Unknown | Evidence from Observations: Reported | ||||||||||||||||||
|
List of 2 Events for Episode 1
|
|||||||||||||||||||
1938 Jun 5 Confirmed Eruption (Explosive / Effusive) VEI: 2
| Episode 1 | Eruption (Explosive / Effusive) | |||||||||||||||||||||||||||||||||||||||||||||||||
|---|---|---|---|---|---|---|---|---|---|---|---|---|---|---|---|---|---|---|---|---|---|---|---|---|---|---|---|---|---|---|---|---|---|---|---|---|---|---|---|---|---|---|---|---|---|---|---|---|---|
| 1938 Jun 5 - Unknown | Evidence from Observations: Reported | ||||||||||||||||||||||||||||||||||||||||||||||||
|
List of 8 Events for Episode 1
|
|||||||||||||||||||||||||||||||||||||||||||||||||
1928 Jan (?) - 1928 Aug 26 ± 5 days Confirmed Eruption (Explosive / Effusive) VEI: 3
| Episode 1 | Eruption (Explosive / Effusive) | |||||||||||||||||||||||||||||||||||||||||||||||||||||||||||
|---|---|---|---|---|---|---|---|---|---|---|---|---|---|---|---|---|---|---|---|---|---|---|---|---|---|---|---|---|---|---|---|---|---|---|---|---|---|---|---|---|---|---|---|---|---|---|---|---|---|---|---|---|---|---|---|---|---|---|---|
| 1928 Jan (?) - 1928 Aug 26 ± 5 days | Evidence from Observations: Reported | ||||||||||||||||||||||||||||||||||||||||||||||||||||||||||
|
List of 10 Events for Episode 1
|
|||||||||||||||||||||||||||||||||||||||||||||||||||||||||||
1902 Confirmed Eruption (Explosive / Effusive) VEI: 1
| Episode 1 | Eruption (Explosive / Effusive) | |||||||||||||||||||||||||||||
|---|---|---|---|---|---|---|---|---|---|---|---|---|---|---|---|---|---|---|---|---|---|---|---|---|---|---|---|---|---|
| 1902 - Unknown | Evidence from Observations: Reported | ||||||||||||||||||||||||||||
|
List of 4 Events for Episode 1
|
|||||||||||||||||||||||||||||
1900 Mar 1 - 1900 Mar 6 Confirmed Eruption (Explosive / Effusive) VEI: 2
| Episode 1 | Eruption (Explosive / Effusive) | |||||||||||||||||||||||||||||||||||||||||||||||||||||||||||||||||||||
|---|---|---|---|---|---|---|---|---|---|---|---|---|---|---|---|---|---|---|---|---|---|---|---|---|---|---|---|---|---|---|---|---|---|---|---|---|---|---|---|---|---|---|---|---|---|---|---|---|---|---|---|---|---|---|---|---|---|---|---|---|---|---|---|---|---|---|---|---|---|
| 1900 Mar 1 - 1900 Mar 6 | Evidence from Observations: Reported | ||||||||||||||||||||||||||||||||||||||||||||||||||||||||||||||||||||
|
List of 12 Events for Episode 1
|
|||||||||||||||||||||||||||||||||||||||||||||||||||||||||||||||||||||
1897 May 23 (on or before) - 1897 Jul 23 Confirmed Eruption (Explosive / Effusive) VEI: 4 (?)
| Episode 1 | Eruption (Explosive / Effusive) | |||||||||||||||||||||||||||||||||||||||||||||||||||||||||||||||||||||||||||||||||||||||||
|---|---|---|---|---|---|---|---|---|---|---|---|---|---|---|---|---|---|---|---|---|---|---|---|---|---|---|---|---|---|---|---|---|---|---|---|---|---|---|---|---|---|---|---|---|---|---|---|---|---|---|---|---|---|---|---|---|---|---|---|---|---|---|---|---|---|---|---|---|---|---|---|---|---|---|---|---|---|---|---|---|---|---|---|---|---|---|---|---|---|
| 1897 May 23 (on or before) - 1897 Jul 23 | Evidence from Observations: Reported | ||||||||||||||||||||||||||||||||||||||||||||||||||||||||||||||||||||||||||||||||||||||||
|
List of 16 Events for Episode 1
|
|||||||||||||||||||||||||||||||||||||||||||||||||||||||||||||||||||||||||||||||||||||||||
1896 Aug 31 - 1896 Sep 27 Confirmed Eruption (Explosive / Effusive) VEI: 2
| Episode 1 | Eruption (Explosive / Effusive) | ||||||||||||||||||||||||||||||||||
|---|---|---|---|---|---|---|---|---|---|---|---|---|---|---|---|---|---|---|---|---|---|---|---|---|---|---|---|---|---|---|---|---|---|---|
| 1896 Aug 31 - 1896 Sep 27 | Evidence from Observations: Reported | |||||||||||||||||||||||||||||||||
|
List of 5 Events for Episode 1
|
||||||||||||||||||||||||||||||||||
1895 Jul 20 - 1895 Nov 26 Confirmed Eruption (Explosive / Effusive) VEI: 2
| Episode 1 | Eruption (Explosive / Effusive) | Summit and east flank | ||||||||||||||||||||||||||||||||||||||||||||||||
|---|---|---|---|---|---|---|---|---|---|---|---|---|---|---|---|---|---|---|---|---|---|---|---|---|---|---|---|---|---|---|---|---|---|---|---|---|---|---|---|---|---|---|---|---|---|---|---|---|---|
| 1895 Jul 20 - 1895 Nov 26 | Evidence from Observations: Reported | ||||||||||||||||||||||||||||||||||||||||||||||||
|
List of 8 Events for Episode 1 at Summit and east flank
|
|||||||||||||||||||||||||||||||||||||||||||||||||
1893 Oct 3 (?) - 1893 Oct 31 Confirmed Eruption (Explosive / Effusive) VEI: 1
| Episode 1 | Eruption (Explosive / Effusive) | |||||||||||||||||||||||||||||||||||||||||||||||||||||||||||
|---|---|---|---|---|---|---|---|---|---|---|---|---|---|---|---|---|---|---|---|---|---|---|---|---|---|---|---|---|---|---|---|---|---|---|---|---|---|---|---|---|---|---|---|---|---|---|---|---|---|---|---|---|---|---|---|---|---|---|---|
| 1893 Oct 3 (?) - 1893 Oct 31 | Evidence from Observations: Reported | ||||||||||||||||||||||||||||||||||||||||||||||||||||||||||
|
List of 10 Events for Episode 1
|
|||||||||||||||||||||||||||||||||||||||||||||||||||||||||||
1891 Oct 3 - 1892 Feb 29 Confirmed Eruption (Explosive / Effusive) VEI: 2
| Episode 1 | Eruption (Explosive / Effusive) | |||||||||||||||||||||||||||||||||||||||||||||||||
|---|---|---|---|---|---|---|---|---|---|---|---|---|---|---|---|---|---|---|---|---|---|---|---|---|---|---|---|---|---|---|---|---|---|---|---|---|---|---|---|---|---|---|---|---|---|---|---|---|---|
| 1891 Oct 3 - 1892 Feb 29 | Evidence from Observations: Reported | ||||||||||||||||||||||||||||||||||||||||||||||||
|
List of 8 Events for Episode 1
|
|||||||||||||||||||||||||||||||||||||||||||||||||
1890 Sep 10 - 1890 Sep 30 Confirmed Eruption (Explosive / Effusive) VEI: 2
| Episode 1 | Eruption (Explosive / Effusive) | ||||||||||||||||||||||||||||||||||
|---|---|---|---|---|---|---|---|---|---|---|---|---|---|---|---|---|---|---|---|---|---|---|---|---|---|---|---|---|---|---|---|---|---|---|
| 1890 Sep 10 - 1890 Sep 30 | Evidence from Observations: Reported | |||||||||||||||||||||||||||||||||
|
List of 5 Events for Episode 1
|
||||||||||||||||||||||||||||||||||
1888 Dec 15 Confirmed Eruption (Explosive / Effusive) VEI: 1
| Episode 1 | Eruption (Explosive / Effusive) | ||||||||||||||||||||||||
|---|---|---|---|---|---|---|---|---|---|---|---|---|---|---|---|---|---|---|---|---|---|---|---|---|
| 1888 Dec 15 - Unknown | Evidence from Observations: Reported | |||||||||||||||||||||||
|
List of 3 Events for Episode 1
|
||||||||||||||||||||||||
1886 Jul 8 - 1887 Mar 10 Confirmed Eruption (Explosive / Effusive) VEI: 3
| Episode 1 | Eruption (Explosive / Effusive) | ||||||||||||||||||||||||||||||||||||||||||||||||||||||||||||||||
|---|---|---|---|---|---|---|---|---|---|---|---|---|---|---|---|---|---|---|---|---|---|---|---|---|---|---|---|---|---|---|---|---|---|---|---|---|---|---|---|---|---|---|---|---|---|---|---|---|---|---|---|---|---|---|---|---|---|---|---|---|---|---|---|---|
| 1886 Jul 8 - 1887 Mar 10 | Evidence from Observations: Reported | |||||||||||||||||||||||||||||||||||||||||||||||||||||||||||||||
|
List of 11 Events for Episode 1
|
||||||||||||||||||||||||||||||||||||||||||||||||||||||||||||||||
1885 Nov 21 - 1885 Dec 2 Confirmed Eruption (Explosive / Effusive) VEI: 2
| Episode 1 | Eruption (Explosive / Effusive) | |||||||||||||||||||||||||||||
|---|---|---|---|---|---|---|---|---|---|---|---|---|---|---|---|---|---|---|---|---|---|---|---|---|---|---|---|---|---|
| 1885 Nov 21 - 1885 Dec 2 | Evidence from Observations: Reported | ||||||||||||||||||||||||||||
|
List of 4 Events for Episode 1
|
|||||||||||||||||||||||||||||
1881 Jul 6 - 1882 Aug Confirmed Eruption (Explosive / Effusive) VEI: 3
| Episode 1 | Eruption (Explosive / Effusive) | Summit and south and SW flanks | ||||||||||||||||||||||||||||||||||||||||||||||||
|---|---|---|---|---|---|---|---|---|---|---|---|---|---|---|---|---|---|---|---|---|---|---|---|---|---|---|---|---|---|---|---|---|---|---|---|---|---|---|---|---|---|---|---|---|---|---|---|---|---|
| 1881 Jul 6 - 1882 Aug | Evidence from Observations: Reported | ||||||||||||||||||||||||||||||||||||||||||||||||
|
List of 8 Events for Episode 1 at Summit and south and SW flanks
|
|||||||||||||||||||||||||||||||||||||||||||||||||
1876 Nov 26 - 1876 Nov 26 Confirmed Eruption (Explosive / Effusive) VEI: 1
| Episode 1 | Eruption (Explosive / Effusive) | ||||||||||||||||||||||||
|---|---|---|---|---|---|---|---|---|---|---|---|---|---|---|---|---|---|---|---|---|---|---|---|---|
| 1876 Nov 26 - 1876 Nov 26 | Evidence from Observations: Reported | |||||||||||||||||||||||
|
List of 3 Events for Episode 1
|
||||||||||||||||||||||||
1876 Apr Confirmed Eruption (Explosive / Effusive) VEI: 1
| Episode 1 | Eruption (Explosive / Effusive) | ||||||||||||||||||||||||
|---|---|---|---|---|---|---|---|---|---|---|---|---|---|---|---|---|---|---|---|---|---|---|---|---|
| 1876 Apr - Unknown | Evidence from Observations: Reported | |||||||||||||||||||||||
|
List of 3 Events for Episode 1
|
||||||||||||||||||||||||
1873 Jun 20 - 1873 Jul 22 Confirmed Eruption (Explosive / Effusive) VEI: 2
| Episode 1 | Eruption (Explosive / Effusive) | ||||||||||||||||||||||||||||||||||
|---|---|---|---|---|---|---|---|---|---|---|---|---|---|---|---|---|---|---|---|---|---|---|---|---|---|---|---|---|---|---|---|---|---|---|
| 1873 Jun 20 - 1873 Jul 22 | Evidence from Observations: Reported | |||||||||||||||||||||||||||||||||
|
List of 5 Events for Episode 1
|
||||||||||||||||||||||||||||||||||
1872 Sep 5 - 1872 Sep 9 Confirmed Eruption (Explosive / Effusive) VEI: 1
| Episode 1 | Eruption (Explosive / Effusive) | |||||||||||||||||||||||||||||
|---|---|---|---|---|---|---|---|---|---|---|---|---|---|---|---|---|---|---|---|---|---|---|---|---|---|---|---|---|---|
| 1872 Sep 5 - 1872 Sep 9 | Evidence from Observations: Reported | ||||||||||||||||||||||||||||
|
List of 4 Events for Episode 1
|
|||||||||||||||||||||||||||||
1871 Dec 8 - 1872 Jan Confirmed Eruption (Explosive / Effusive) VEI: 3
| Episode 1 | Eruption (Explosive / Effusive) | |||||||||||||||||||||||||||||||||||||||||||||||||||||||||||
|---|---|---|---|---|---|---|---|---|---|---|---|---|---|---|---|---|---|---|---|---|---|---|---|---|---|---|---|---|---|---|---|---|---|---|---|---|---|---|---|---|---|---|---|---|---|---|---|---|---|---|---|---|---|---|---|---|---|---|---|
| 1871 Dec 8 - 1872 Jan | Evidence from Observations: Reported | ||||||||||||||||||||||||||||||||||||||||||||||||||||||||||
|
List of 10 Events for Episode 1
|
|||||||||||||||||||||||||||||||||||||||||||||||||||||||||||
1868 Dec 17 Confirmed Eruption (Explosive / Effusive) VEI: 2
| Episode 1 | Eruption (Explosive / Effusive) | ||||||||||||||||||||||||||||||||||||||||||||
|---|---|---|---|---|---|---|---|---|---|---|---|---|---|---|---|---|---|---|---|---|---|---|---|---|---|---|---|---|---|---|---|---|---|---|---|---|---|---|---|---|---|---|---|---|
| 1868 Dec 17 - Unknown | Evidence from Observations: Reported | |||||||||||||||||||||||||||||||||||||||||||
|
List of 7 Events for Episode 1
|
||||||||||||||||||||||||||||||||||||||||||||
[ 1863 May 30 ] Uncertain Eruption
| Episode 1 | Eruption (Explosive / Effusive) | ||||
|---|---|---|---|---|
| 1863 May 30 - Unknown | Evidence from Unknown | |||
1862 Confirmed Eruption (Explosive / Effusive) VEI: 2
| Episode 1 | Eruption (Explosive / Effusive) | |||||||||||||||||||||||||||||
|---|---|---|---|---|---|---|---|---|---|---|---|---|---|---|---|---|---|---|---|---|---|---|---|---|---|---|---|---|---|
| 1862 - Unknown | Evidence from Observations: Reported | ||||||||||||||||||||||||||||
|
List of 4 Events for Episode 1
|
|||||||||||||||||||||||||||||
1861 Confirmed Eruption (Explosive / Effusive) VEI: 1
| Episode 1 | Eruption (Explosive / Effusive) | ||||||||||||||||||||||||
|---|---|---|---|---|---|---|---|---|---|---|---|---|---|---|---|---|---|---|---|---|---|---|---|---|
| 1861 - Unknown | Evidence from Observations: Reported | |||||||||||||||||||||||
|
List of 3 Events for Episode 1
|
||||||||||||||||||||||||
1860 Confirmed Eruption (Explosive / Effusive)
| Episode 1 | Eruption (Explosive / Effusive) | |||||||||||||||||||
|---|---|---|---|---|---|---|---|---|---|---|---|---|---|---|---|---|---|---|---|
| 1860 - Unknown | Evidence from Observations: Reported | ||||||||||||||||||
|
List of 2 Events for Episode 1
|
|||||||||||||||||||
1859 Confirmed Eruption (Explosive / Effusive)
| Episode 1 | Eruption (Explosive / Effusive) | ||||||||||||||||||||||||
|---|---|---|---|---|---|---|---|---|---|---|---|---|---|---|---|---|---|---|---|---|---|---|---|---|
| 1859 - Unknown | Evidence from Observations: Reported | |||||||||||||||||||||||
|
List of 3 Events for Episode 1
|
||||||||||||||||||||||||
1858 Jan - 1858 Dec Confirmed Eruption (Explosive / Effusive) VEI: 2
| Episode 1 | Eruption (Explosive / Effusive) | |||||||||||||||||||||||||||||||||||||||||||||||||||||||||||
|---|---|---|---|---|---|---|---|---|---|---|---|---|---|---|---|---|---|---|---|---|---|---|---|---|---|---|---|---|---|---|---|---|---|---|---|---|---|---|---|---|---|---|---|---|---|---|---|---|---|---|---|---|---|---|---|---|---|---|---|
| 1858 Jan - 1858 Dec | Evidence from Observations: Reported | ||||||||||||||||||||||||||||||||||||||||||||||||||||||||||
|
List of 10 Events for Episode 1
|
|||||||||||||||||||||||||||||||||||||||||||||||||||||||||||
1857 Confirmed Eruption (Explosive / Effusive) VEI: 2
| Episode 1 | Eruption (Explosive / Effusive) | ||||||||||||||||||||||||
|---|---|---|---|---|---|---|---|---|---|---|---|---|---|---|---|---|---|---|---|---|---|---|---|---|
| 1857 - Unknown | Evidence from Observations: Reported | |||||||||||||||||||||||
|
List of 3 Events for Episode 1
|
||||||||||||||||||||||||
1855 Mar 22 Confirmed Eruption (Explosive / Effusive) VEI: 2
| Episode 1 | Eruption (Explosive / Effusive) | ||||||||||||||||||||||||
|---|---|---|---|---|---|---|---|---|---|---|---|---|---|---|---|---|---|---|---|---|---|---|---|---|
| 1855 Mar 22 - Unknown | Evidence from Observations: Reported | |||||||||||||||||||||||
|
List of 3 Events for Episode 1
|
||||||||||||||||||||||||
1853 Jul 13 - 1853 Aug 26 Confirmed Eruption (Explosive / Effusive) VEI: 3
| Episode 1 | Eruption (Explosive / Effusive) | |||||||||||||||||||||||||||||||||||||||||||||||||
|---|---|---|---|---|---|---|---|---|---|---|---|---|---|---|---|---|---|---|---|---|---|---|---|---|---|---|---|---|---|---|---|---|---|---|---|---|---|---|---|---|---|---|---|---|---|---|---|---|---|
| 1853 Jul 13 - 1853 Aug 26 | Evidence from Observations: Reported | ||||||||||||||||||||||||||||||||||||||||||||||||
|
List of 8 Events for Episode 1
|
|||||||||||||||||||||||||||||||||||||||||||||||||
1851 May 26 - 1851 Jun Confirmed Eruption (Explosive / Effusive) VEI: 1
| Episode 1 | Eruption (Explosive / Effusive) | |||||||||||||||||||||||||||||
|---|---|---|---|---|---|---|---|---|---|---|---|---|---|---|---|---|---|---|---|---|---|---|---|---|---|---|---|---|---|
| 1851 May 26 - 1851 Jun | Evidence from Observations: Reported | ||||||||||||||||||||||||||||
|
List of 4 Events for Episode 1
|
|||||||||||||||||||||||||||||
1846 May 11 - 1846 May 11 Confirmed Eruption (Explosive / Effusive) VEI: 3
| Episode 1 | Eruption (Explosive / Effusive) | ||||||||||||||||||||||||
|---|---|---|---|---|---|---|---|---|---|---|---|---|---|---|---|---|---|---|---|---|---|---|---|---|
| 1846 May 11 - 1846 May 11 | Evidence from Observations: Reported | |||||||||||||||||||||||
|
List of 3 Events for Episode 1
|
||||||||||||||||||||||||
1845 Jan 20 ± 1 days - 1845 Jan 30 ± 1 days Confirmed Eruption (Explosive / Effusive) VEI: 3
| Episode 1 | Eruption (Explosive / Effusive) | |||||||||||||||||||||||||||||||||||||||||||||||||
|---|---|---|---|---|---|---|---|---|---|---|---|---|---|---|---|---|---|---|---|---|---|---|---|---|---|---|---|---|---|---|---|---|---|---|---|---|---|---|---|---|---|---|---|---|---|---|---|---|---|
| 1845 Jan 20 ± 1 days - 1845 Jan 30 ± 1 days | Evidence from Observations: Reported | ||||||||||||||||||||||||||||||||||||||||||||||||
|
List of 8 Events for Episode 1
|
|||||||||||||||||||||||||||||||||||||||||||||||||
1839 Confirmed Eruption (Explosive / Effusive) VEI: 2
| Episode 1 | Eruption (Explosive / Effusive) | ||||||||||||||||||||||||
|---|---|---|---|---|---|---|---|---|---|---|---|---|---|---|---|---|---|---|---|---|---|---|---|---|
| 1839 - Unknown | Evidence from Observations: Reported | |||||||||||||||||||||||
|
List of 3 Events for Episode 1
|
||||||||||||||||||||||||
1834 - 1835 May Confirmed Eruption (Explosive / Effusive) VEI: 3
| Episode 1 | Eruption (Explosive / Effusive) | |||||||||||||||||||||||||||||||||||||||||||||||||
|---|---|---|---|---|---|---|---|---|---|---|---|---|---|---|---|---|---|---|---|---|---|---|---|---|---|---|---|---|---|---|---|---|---|---|---|---|---|---|---|---|---|---|---|---|---|---|---|---|---|
| 1834 - 1835 May | Evidence from Observations: Reported | ||||||||||||||||||||||||||||||||||||||||||||||||
|
List of 8 Events for Episode 1
|
|||||||||||||||||||||||||||||||||||||||||||||||||
1827 Jun 27 - 1828 Feb 28 Confirmed Eruption (Explosive / Effusive) VEI: 2
| Episode 1 | Eruption (Explosive / Effusive) | |||||||||||||||||||||||||||||||||||||||||||||||||
|---|---|---|---|---|---|---|---|---|---|---|---|---|---|---|---|---|---|---|---|---|---|---|---|---|---|---|---|---|---|---|---|---|---|---|---|---|---|---|---|---|---|---|---|---|---|---|---|---|---|
| 1827 Jun 27 - 1828 Feb 28 | Evidence from Observations: Reported | ||||||||||||||||||||||||||||||||||||||||||||||||
|
List of 8 Events for Episode 1
|
|||||||||||||||||||||||||||||||||||||||||||||||||
1814 Feb 1 - 1814 Feb 15 (on or after) Confirmed Eruption (Explosive / Effusive) VEI: 4
| Episode 1 | Eruption (Explosive / Effusive) | |||||||||||||||||||||||||||||||||||||||||||||||||||||||||||||||||||||||||||||||
|---|---|---|---|---|---|---|---|---|---|---|---|---|---|---|---|---|---|---|---|---|---|---|---|---|---|---|---|---|---|---|---|---|---|---|---|---|---|---|---|---|---|---|---|---|---|---|---|---|---|---|---|---|---|---|---|---|---|---|---|---|---|---|---|---|---|---|---|---|---|---|---|---|---|---|---|---|---|---|---|
| 1814 Feb 1 - 1814 Feb 15 (on or after) | Evidence from Observations: Reported | ||||||||||||||||||||||||||||||||||||||||||||||||||||||||||||||||||||||||||||||
|
List of 14 Events for Episode 1
|
|||||||||||||||||||||||||||||||||||||||||||||||||||||||||||||||||||||||||||||||
[ 1811 Oct 5 - 1811 Oct 6 ] Uncertain Eruption
| Episode 1 | Eruption (Explosive / Effusive) | |||||||||||||||||||||||||||||||||||||||
|---|---|---|---|---|---|---|---|---|---|---|---|---|---|---|---|---|---|---|---|---|---|---|---|---|---|---|---|---|---|---|---|---|---|---|---|---|---|---|---|
| 1811 Oct 5 - 1811 Oct 6 | Evidence from Unknown | ||||||||||||||||||||||||||||||||||||||
|
List of 6 Events for Episode 1
|
|||||||||||||||||||||||||||||||||||||||
1800 Oct 30 - 1800 Oct 31 Confirmed Eruption (Explosive / Effusive) VEI: 2
| Episode 1 | Eruption (Explosive / Effusive) | ||||||||||||||||||||||||||||||||||||||||||||
|---|---|---|---|---|---|---|---|---|---|---|---|---|---|---|---|---|---|---|---|---|---|---|---|---|---|---|---|---|---|---|---|---|---|---|---|---|---|---|---|---|---|---|---|---|
| 1800 Oct 30 - 1800 Oct 31 | Evidence from Observations: Reported | |||||||||||||||||||||||||||||||||||||||||||
|
List of 7 Events for Episode 1
|
||||||||||||||||||||||||||||||||||||||||||||
[ 1767 Oct 24 ] Discredited Eruption
1766 Jul 20 - 1766 Jul 25 Confirmed Eruption (Explosive / Effusive) VEI: 3
| Episode 1 | Eruption (Explosive / Effusive) | |||||||||||||||||||||||||||||||||||||||||||||||||
|---|---|---|---|---|---|---|---|---|---|---|---|---|---|---|---|---|---|---|---|---|---|---|---|---|---|---|---|---|---|---|---|---|---|---|---|---|---|---|---|---|---|---|---|---|---|---|---|---|---|
| 1766 Jul 20 - 1766 Jul 25 | Evidence from Observations: Reported | ||||||||||||||||||||||||||||||||||||||||||||||||
|
List of 8 Events for Episode 1
|
|||||||||||||||||||||||||||||||||||||||||||||||||
1616 Feb 19 - 1616 Feb 23 Confirmed Eruption (Explosive / Effusive) VEI: 3
| Episode 1 | Eruption (Explosive / Effusive) | |||||||||||||||||||||||||||||||||||||||||||||||||
|---|---|---|---|---|---|---|---|---|---|---|---|---|---|---|---|---|---|---|---|---|---|---|---|---|---|---|---|---|---|---|---|---|---|---|---|---|---|---|---|---|---|---|---|---|---|---|---|---|---|
| 1616 Feb 19 - 1616 Feb 23 | Evidence from Observations: Reported | ||||||||||||||||||||||||||||||||||||||||||||||||
|
List of 8 Events for Episode 1
|
|||||||||||||||||||||||||||||||||||||||||||||||||
0470 ± 75 years Confirmed Eruption (Explosive / Effusive)
| Episode 1 | Eruption (Explosive / Effusive) | |||||||||||||||||||
|---|---|---|---|---|---|---|---|---|---|---|---|---|---|---|---|---|---|---|---|
| 0470 ± 75 years - Unknown | Evidence from Isotopic: 14C (uncalibrated) | ||||||||||||||||||
|
List of 2 Events for Episode 1
|
|||||||||||||||||||
3100 BCE ± 300 years Confirmed Eruption (Explosive / Effusive)
| Episode 1 | Eruption (Explosive / Effusive) | ||||
|---|---|---|---|---|
| 3100 BCE ± 300 years - Unknown | Evidence from Isotopic: 14C (uncalibrated) | |||
This compilation of synonyms and subsidiary features may not be comprehensive. Features are organized into four major categories: Cones, Craters, Domes, and Thermal Features. Synonyms of features appear indented below the primary name. In some cases additional feature type, elevation, or location details are provided.
Synonyms |
| Albay Volcano |
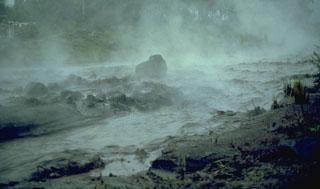 A hot lahar sweeps down a channel on the SW flank of Mayon in the Philippines on 14 September 1984, five days after the onset of an eruption. The water temperature of this lahar was about 80°C. Note the large block in the center of the channel that is being transported by the lahar.
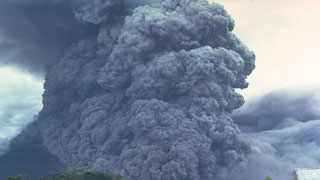 A pyroclastic flow travels down the SE flank of Mayon volcano in the Philippines on 24 September 1984. An ash plume rises above the moving pyroclastic flow, which was the largest of a series of pyroclastic flows that occurred during an eruption that began on 9 September. The pyroclastic flow traveled 7 km from the summit vent; velocities of 50 m/s were estimated from photographs.
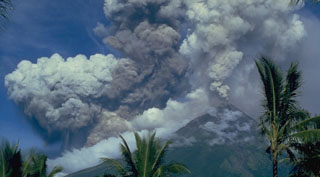 A light-colored plume rises above the summit of Mayon volcano on 14 September 1984, seen here from Cagsawa on the SSE flank. The darker and denser column to its left is an ash plume rising from the pyroclastic flow moving down the SW flank.
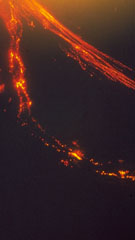 An incandescent lava flow descends the SW flank of Mayon (left). This 18 September 1984 time-lapse photo taken from near Masarawag also shows incandescent blocks to the right that were ejected by explosive eruptions and are cascading down the south flank.
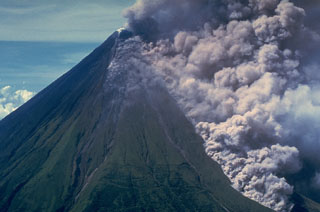 An ash plume rises above a pyroclastic flow traveling down the Buang valley on the upper NW flank of Mayon volcano in the Philippines on 12 September 1984. The front of the advancing pyroclastic flow is visible at the lower right. These pyroclastic flows traveled down to 100 m elevation at rates of about 20 m/s.
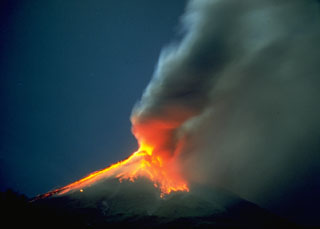 This time-lapse photo taken on 12 September 1984 shows incandescent blocks that were ejected by explosive eruptions and are cascading down the flanks of Mayon. The incandescence is reflected in the base of the ash plume to the right.
 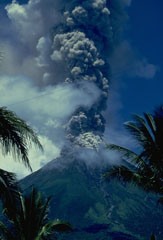 An ash plume rises to 12.5 km above the summit of Mayon volcano on 13 September 1984, seen here from Santa Misericordia on the E flank. This marked the peak of the first phase of the eruption which began on 9 September. The first phase lasted until 18 September and included the eruption of pyroclastic flow that traveled down the NNW flank and lava flows down the SW.
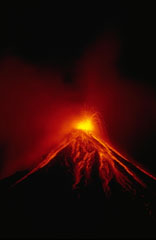 A Strombolian eruption on 15 September 1984 ejected incandescent blocks that rolled down the flanks of Mayon. Sustained lava fountaining produced lava agglutinate that congealed on the upper flanks around the vent. This eruption, which began on 9 September, also produced powerful vertical explosions and pyroclastic flows that traveled out to 7 km from the summit.
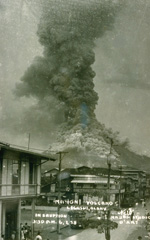 This commercial print of an eruption of Mayon volcano on June 7, 1938, shows a powerful vertical eruption column rising above the summit and pyroclastic flows sweeping down the flanks. During this eruption a lava flow traveled down the east flank to 570 m elevation, and shorter lava flows descended the SSW, west, NW, and NNE flanks.
 Mayon in SE Luzon is one of the most active volcanoes in the Philippines. It rises above the Albay Gulf and is the result of eruptions from a single central conduit. Frequent eruptions have been recorded since 1616 and have typically included powerful explosive activity accompanied by pyroclastic flows, lahars, and lava flows that descended to the lower flanks.
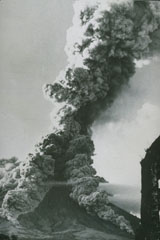 As ash plume rises above the summit of Mayon volcano on 27 April 1968 as pyroclastic flows travel down the SW and S flanks. This view from the SSW flank shows the Camalig church to the right, which was damaged by pyroclastic flows during the 1814 eruption. The 1968 eruption began on 21 April and lasted until 20 May.
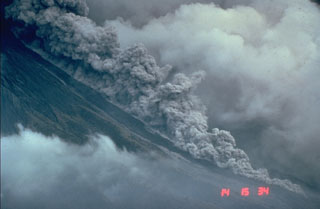 Pyroclastic flows are hot avalanches of rock, ash, and gas that sweep down the flanks of volcanoes at high velocities. This photo shows a relatively small pyroclastic flow at Mayon volcano in the Philippines on 23 September 1984. These hot, ground-hugging flows can travel at velocities to about 100 km/hour and reach areas well beyond the flanks of a volcano. Their high temperatures make them lethal to anything in their path. Hot ash plumes rise above the denser basal portion that can contain abundant solid blocks and ash.
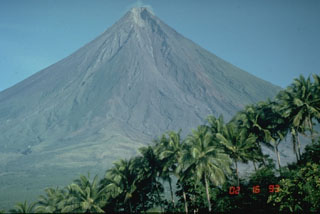 Mayon in the Philippines is one of Earth's best examples of a classic, conical stratovolcano. Its symmetrical morphology is the exception rather than the rule and is the result of eruptions that are restricted to a single central conduit at the summit. Eruptions are frequent enough to overcome erosion processes that quickly modify the slopes of most volcanoes.
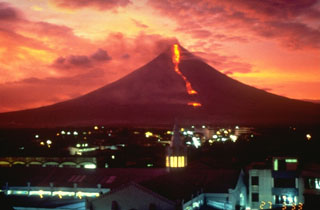 An incandescent lava flow, seen in this sunset view from Legaspi City, descends the SE flank towards the village of Buyuan on 27 March 1993. The eruption began on 2 February with an explosion and pyroclastic flow that traveled 6 km down the E flank and killed 75 people. During the rest of the eruption, which ended in early April, slow lava effusion was accompanied by small pyroclastic flows and ash emissions.
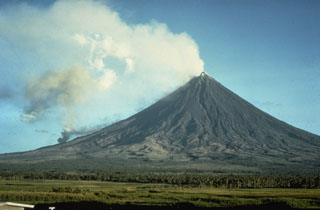 A gas-and-steam plume rises from the summit of Mayon volcano in this May 1968 view from Legaspi City on the SSE flank. The smaller plume on the lower left flank is from the lava flow front that descended 4 km from the summit.
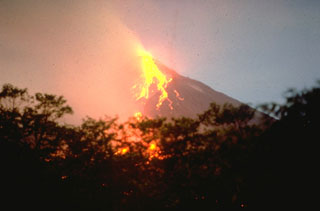 Incandescent blocks roll down the SW flanks of Mayon on 18 May 1978, seen from near Camalig on the SW flank. During the eruption a lava flow traveled a distance of more than 4 km over the top of the 1968 lava flow to about 550 m elevation. The 1978 eruption began on 7 March and continued through the summer.
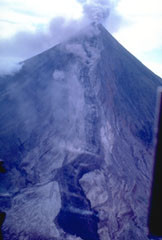 A lava flow descends the Bonga valley on the east flank of Mayon in March 1993. The lava flow had descended 4.5 km by 26 March and partially filled the deep Bonga valley, which was excavated by pyroclastic flows during the 1984 eruption.
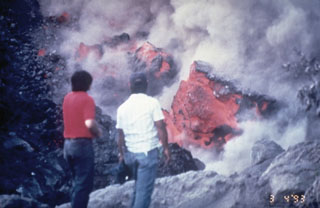 Volcanologists of the Philippines Institute of Volcanology and Seismology examine the front of a slow-moving lava flow that is advancing down the SW flank of Mayon volcano in March 1993. The incandescent interiors of lava blocks are exposed as they tumble down the sides of the flow.
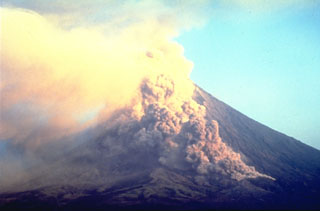 A small pyroclastic flow descends the Bonga valley on the E flank of Mayon in March 1993. Collapse of a lava flow front traveling down the valley produced many small pyroclastic flows during the 1993 eruption. A large pyroclastic flow on 2 February, the first day of the eruption, traveled 6 km down this same valley and killed 75 people.
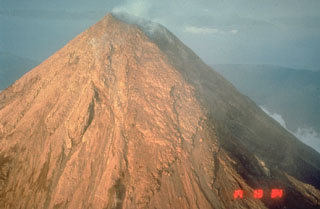 The upper flanks of the symmetrical Mayon are exceptionally steep, averaging 35-40 degrees. They are covered with solidified lava agglutinate, the molten ejecta of lava fountains. This 1984 photo from the WSW shows a 250-m-deep, 3-km-long gully in the shadow at the right that was eroded by pyroclastic flows during the 1984 eruption.
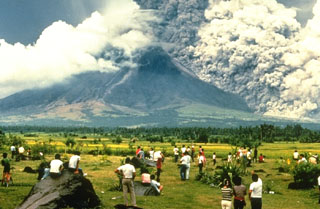 A crowd of spectators watches a pyroclastic flow sweeping down the SE flank of Mayon volcano on 24 September 1984. They stand on the surface of a deposit from a large lahar emplaced during an eruption in 1814. The pyroclastic flow seen here traveled about 6 km. Strong explosions the previous day created notches in the SE and east crater rims that funneled pyroclastic flows down ravines in those directions.
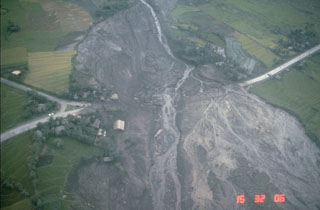 Lahars from the 1984 eruption of Mayon volcano swept down the NW and SW flanks. This 24 September view shows lahar deposits burying the highway at the Santa Domingo junction on the lower E flank, about 8 km from the summit. Lahars from this eruption reached the Albay Gulf at several points.
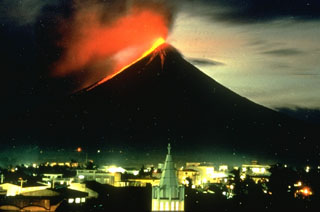 A nighttime view from Legaspi City on 14 September 1984 shows incandescent lava flows descending the SW flank of Mayon volcano in the Philippines. The flows traveled about 4 km to the lower flanks of the volcano, adjacent to previous flows from eruptions in 1968 and 1978.
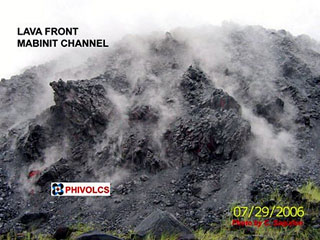 A lava flow front at Mayon is seen here on 29 July 2006 as it continued to advance down the Mabinit channel. Phreatic eruptions had begun on 13 July and lava extrusion was noted the following day, eventually reaching over 6 km to the SSE. Intermittent explosions continued and lava effusion ceased on 1 October. Pyroclastic flows occurred on 20 July and 12 August.
 The following 86 samples associated with this volcano can be found in the Smithsonian's NMNH Department of Mineral Sciences collections, and may be availble for research (contact the Rock and Ore Collections Manager). Catalog number links will open a window with more information.
| Catalog Number | Sample Description | Lava Source | Collection Date |
|---|---|---|---|
| NMNH 101592 | Unidentified | -- | -- |
| NMNH 111124 | Hypersthene Andesite | -- | -- |
| NMNH 111125-1 | Hypersthene Andesite | -- | -- |
| NMNH 111125-2 | Andesite | -- | -- |
| NMNH 111127-1 | Andesite | -- | -- |
| NMNH 111127-2 | Andesite | -- | -- |
| NMNH 111127-3 | Andesite | -- | -- |
| NMNH 111127-4 | Andesite | -- | -- |
| NMNH 111127-5 | Andesite | -- | -- |
| NMNH 111127-6 | Andesite | -- | -- |
| NMNH 111127-7 | Andesite | -- | -- |
| NMNH 111127-8 | Andesite | -- | -- |
| NMNH 111128 | Diorite | -- | -- |
| NMNH 111129-1 | Unidentified | -- | -- |
| NMNH 111129-2 | Extrusive Volcanic Rock | -- | -- |
| NMNH 111129-3 | Extrusive Volcanic Rock | -- | -- |
| NMNH 111129-4 | Extrusive Volcanic Rock | -- | -- |
| NMNH 111129-5 | Extrusive Volcanic Rock | -- | -- |
| NMNH 111130 | Andesite | -- | -- |
| NMNH 111131 | Andesite | -- | -- |
| NMNH 111132 | Diorite | -- | -- |
| NMNH 111133 | Hypersthene Diorite | -- | -- |
| NMNH 111134 | Hypersthene Diorite | -- | -- |
| NMNH 111135 | Pumice | -- | -- |
| NMNH 111136-1 | Andesite Volcanic Ash | -- | -- |
| NMNH 111136-2 | Andesite Volcanic Ash | -- | -- |
| NMNH 111136-4 | Andesite Volcanic Ash | -- | -- |
| NMNH 111136-5 | Andesite Volcanic Ash | -- | -- |
| NMNH 111136-6 | Andesite Volcanic Ash | -- | -- |
| NMNH 111137 | Andesite | -- | -- |
| NMNH 111138 | Andesite Volcanic Ash | -- | -- |
| NMNH 111139 | Andesite Volcanic Ash | -- | -- |
| NMNH 111140 | Andesite Volcanic Ash | -- | -- |
| NMNH 111141 | Andesite Volcanic Ash | -- | -- |
| NMNH 111142 | Andesite | -- | -- |
| NMNH 111143-1 | Andesite | -- | -- |
| NMNH 111143-2 | Andesite | -- | -- |
| NMNH 111143-3 | Andesite | -- | -- |
| NMNH 111144-1 | Andesite | -- | -- |
| NMNH 111144-2 | Andesite | -- | -- |
| NMNH 111144-3 | Andesite | -- | -- |
| NMNH 111145 | Pumice | -- | -- |
| NMNH 111146 | Pumice | -- | -- |
| NMNH 111147 | Pumice | -- | -- |
| NMNH 111148 | Andesite Volcanic Ash | -- | -- |
| NMNH 111149 | Andesite | -- | -- |
| NMNH 111150 | Andesite | -- | -- |
| NMNH 111151 | Andesite | -- | -- |
| NMNH 111152-1 | Andesite | -- | -- |
| NMNH 111152-2 | Andesite | -- | -- |
| NMNH 111153 | Andesite | -- | -- |
| NMNH 111154-1 | Andesite | -- | -- |
| NMNH 111154-2 | Andesite Volcanic Ash | -- | -- |
| NMNH 111154-3 | Andesite | -- | -- |
| NMNH 111155 | Andesite Volcanic Ash | -- | -- |
| NMNH 111156 | Andesite | -- | -- |
| NMNH 111157 | Andesite | -- | -- |
| NMNH 111158 | Andesite | -- | -- |
| NMNH 111158-1 | Andesite | -- | -- |
| NMNH 111159 | Andesite | -- | -- |
| NMNH 111159-1 | Andesite Volcanic Ash | -- | -- |
| NMNH 111159-1 | Volcanic Ash | -- | -- |
| NMNH 111159-2 | Andesite Volcanic Ash | -- | -- |
| NMNH 111159-2 | Volcanic Ash | -- | -- |
| NMNH 111161 | Andesite | -- | -- |
| NMNH 111163 | Andesite Volcanic Ash | -- | -- |
| NMNH 111164-1 | Andesite | -- | -- |
| NMNH 111164-2 | Andesite | -- | -- |
| NMNH 111164-3 | Andesite | -- | -- |
| NMNH 111165-1 | Andesite | -- | -- |
| NMNH 111165-2 | Andesite | -- | -- |
| NMNH 111166 | Andesite | -- | -- |
| NMNH 111167 | Andesite | -- | -- |
| NMNH 111168 | Andesite | -- | -- |
| NMNH 111169 | Andesite Volcanic Ash | -- | -- |
| NMNH 111170 | Andesite Volcanic Ash | -- | -- |
| NMNH 111171-1 | Andesite | -- | -- |
| NMNH 111171-2 | Andesite | -- | -- |
| NMNH 116040 | Basaltic Andesite | -- | -- |
| NMNH 116041 | Basaltic Andesite | -- | -- |
| NMNH 116042 | Basaltic Andesite | -- | -- |
| NMNH 116043 | Basaltic Andesite | -- | -- |
| NMNH 116044 | Basaltic Andesite | -- | -- |
| NMNH 116045 | Basaltic Andesite | -- | -- |
| NMNH 116567 | Lava | -- | -- |
| NMNH 75272 | Volcanic Dust | -- | -- |
| Copernicus Browser | The Copernicus Browser replaced the Sentinel Hub Playground browser in 2023, to provide access to Earth observation archives from the Copernicus Data Space Ecosystem, the main distribution platform for data from the EU Copernicus missions. |
| MIROVA | Middle InfraRed Observation of Volcanic Activity (MIROVA) is a near real time volcanic hot-spot detection system based on the analysis of MODIS (Moderate Resolution Imaging Spectroradiometer) data. In particular, MIROVA uses the Middle InfraRed Radiation (MIR), measured over target volcanoes, in order to detect, locate and measure the heat radiation sourced from volcanic activity. |
| MODVOLC Thermal Alerts | Using infrared satellite Moderate Resolution Imaging Spectroradiometer (MODIS) data, scientists at the Hawai'i Institute of Geophysics and Planetology, University of Hawai'i, developed an automated system called MODVOLC to map thermal hot-spots in near real time. For each MODIS image, the algorithm automatically scans each 1 km pixel within it to check for high-temperature hot-spots. When one is found the date, time, location, and intensity are recorded. MODIS looks at every square km of the Earth every 48 hours, once during the day and once during the night, and the presence of two MODIS sensors in space allows at least four hot-spot observations every two days. Each day updated global maps are compiled to display the locations of all hot spots detected in the previous 24 hours. There is a drop-down list with volcano names which allow users to 'zoom-in' and examine the distribution of hot-spots at a variety of spatial scales. |
|
WOVOdat
Single Volcano View Temporal Evolution of Unrest Side by Side Volcanoes |
WOVOdat is a database of volcanic unrest; instrumentally and visually recorded changes in seismicity, ground deformation, gas emission, and other parameters from their normal baselines. It is sponsored by the World Organization of Volcano Observatories (WOVO) and presently hosted at the Earth Observatory of Singapore.
GVMID Data on Volcano Monitoring Infrastructure The Global Volcano Monitoring Infrastructure Database GVMID, is aimed at documenting and improving capabilities of volcano monitoring from the ground and space. GVMID should provide a snapshot and baseline view of the techniques and instrumentation that are in place at various volcanoes, which can be use by volcano observatories as reference to setup new monitoring system or improving networks at a specific volcano. These data will allow identification of what monitoring gaps exist, which can be then targeted by remote sensing infrastructure and future instrument deployments. |
| Volcanic Hazard Maps | The IAVCEI Commission on Volcanic Hazards and Risk has a Volcanic Hazard Maps database designed to serve as a resource for hazard mappers (or other interested parties) to explore how common issues in hazard map development have been addressed at different volcanoes, in different countries, for different hazards, and for different intended audiences. In addition to the comprehensive, searchable Volcanic Hazard Maps Database, this website contains information about diversity of volcanic hazard maps, illustrated using examples from the database. This site is for educational purposes related to volcanic hazard maps. Hazard maps found on this website should not be used for emergency purposes. For the most recent, official hazard map for a particular volcano, please seek out the proper institutional authorities on the matter. |
| IRIS seismic stations/networks | Incorporated Research Institutions for Seismology (IRIS) Data Services map showing the location of seismic stations from all available networks (permanent or temporary) within a radius of 0.18° (about 20 km at mid-latitudes) from the given location of Mayon. Users can customize a variety of filters and options in the left panel. Note that if there are no stations are known the map will default to show the entire world with a "No data matched request" error notice. |
| UNAVCO GPS/GNSS stations | Geodetic Data Services map from UNAVCO showing the location of GPS/GNSS stations from all available networks (permanent or temporary) within a radius of 20 km from the given location of Mayon. Users can customize the data search based on station or network names, location, and time window. Requires Adobe Flash Player. |
| DECADE Data | The DECADE portal, still in the developmental stage, serves as an example of the proposed interoperability between The Smithsonian Institution's Global Volcanism Program, the Mapping Gas Emissions (MaGa) Database, and the EarthChem Geochemical Portal. The Deep Earth Carbon Degassing (DECADE) initiative seeks to use new and established technologies to determine accurate global fluxes of volcanic CO2 to the atmosphere, but installing CO2 monitoring networks on 20 of the world's 150 most actively degassing volcanoes. The group uses related laboratory-based studies (direct gas sampling and analysis, melt inclusions) to provide new data for direct degassing of deep earth carbon to the atmosphere. |
| Large Eruptions of Mayon | Information about large Quaternary eruptions (VEI >= 4) is cataloged in the Large Magnitude Explosive Volcanic Eruptions (LaMEVE) database of the Volcano Global Risk Identification and Analysis Project (VOGRIPA). |
| EarthChem | EarthChem develops and maintains databases, software, and services that support the preservation, discovery, access and analysis of geochemical data, and facilitate their integration with the broad array of other available earth science parameters. EarthChem is operated by a joint team of disciplinary scientists, data scientists, data managers and information technology developers who are part of the NSF-funded data facility Integrated Earth Data Applications (IEDA). IEDA is a collaborative effort of EarthChem and the Marine Geoscience Data System (MGDS). |

