The Washington VAAC reported that on 14 June a possible ash emission from Guagua Pichincha was visible in satellite images drifting NW. Seismicity was elevated. A VAAC report issued about five hours later noted that no further notices of activity had been received.
Source: Washington Volcanic Ash Advisory Center (VAAC)
During 2008-2010 the lava dome was stable, occasional phreatic explosions
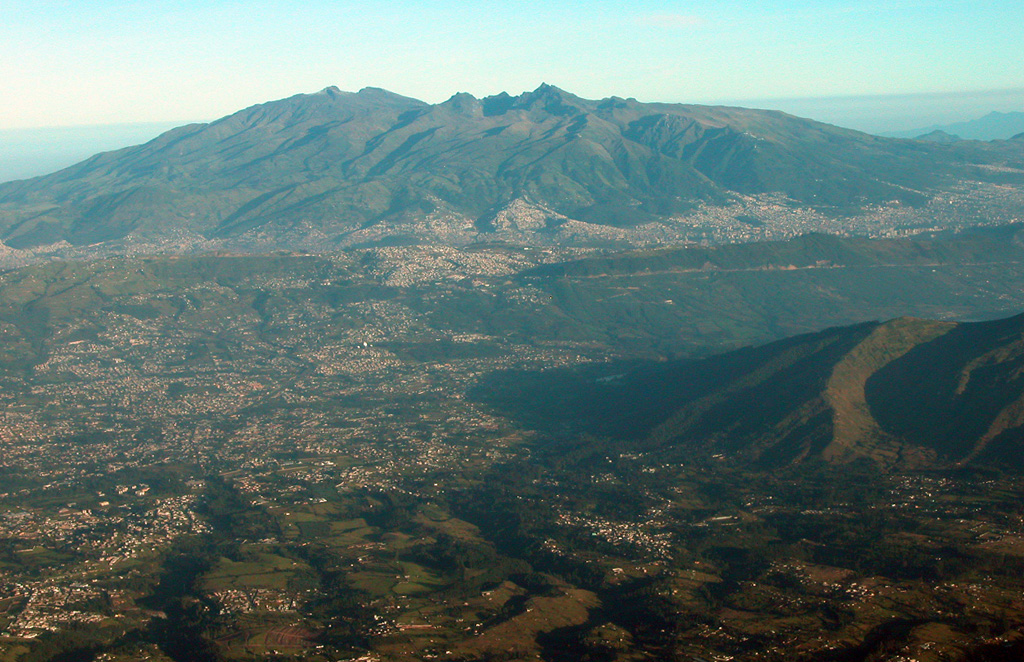
This report mainly summarizes information on Guagua Pichincha conveyed in 2008 to 2010 yearly reports by the IG-EPN (Instituto Geofísico Escuela Politécnica Nacional). In broad terms, and with the exceptions of an anomalously high number of emission and explosion signals in 2009, Guagua Pichincha volcanic activity continued to decline since the eruptions during September 1999 to June 2001. Further, the volcano has cooled and crater morphology, as stated in IG-EPN yearly reports, has remained relatively unchanged since 2002 (Samaniego,P, 2006, and 2007-2010 yearly reports). Nevertheless, it is possible for further emissions and explosions to occur as potential hazards to life and property. Especially since Guagua Pichincha (figures 22 and 23) is 11 km from the capital, Quito, a city with a population of over 2.5 million (as estimated by the Metropolitan District of Quito population projection, Directorate of Territorial Planning and Public Services). Our previous report on the volcano (BGVN 32:12) discussed phreatic explosions that occurred in early 2008. This report includes seismic data plots, locations of events on topographic maps and a multi-year seismic table beginning in the year 2005.
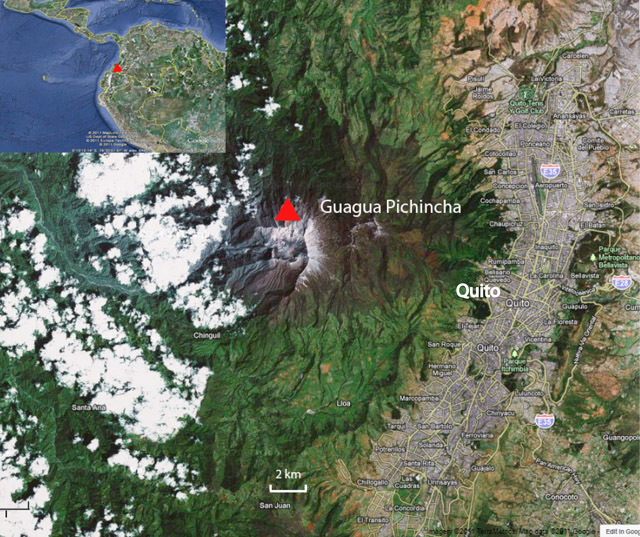 |
Figure 22. Map showing proximity of Quito to Guagua Pichincha. Courtesy of Google Earth. |
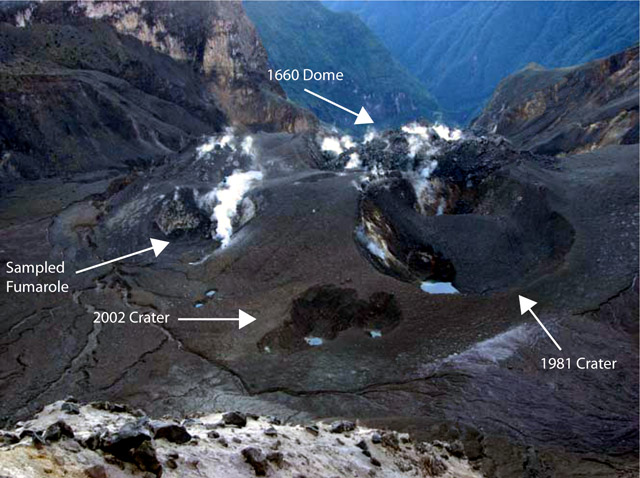 |
Figure 23. Photograph of Guagua Pichincha's crater taken in May 2008, showing the still-active year 1660 dome and adjacent crater floor. The area is heavily pockmarked with explosion craters (labeled). Note sampled fumarole (bottom left). Photo courtesy of J. Bustillos (IG-EPN 2008 annual report). |
During the 2008-2010 reporting interval, the IG yearly reports cited fumarolic emissions, surfurous odors, and noise at various locations within the crater, including the 1660 dome, and the 1981 and 2002 craters. As discussed below, rainfall often correlated with phreatic eruptions during 2008 and 2009.
Seismicity is monitored using five short-period (1 Hz) seismic stations, of which three are single-component stations (GGP, JUA2, YANA) and two are three-components stations (PINE, TERV).
Low seismicity generally prevailed during 2003-2010, with few long-period (LP) and hybrid (hb) earthquake occurrences (figure 24). Compared to 2003 to 2005 the number of volcano-tectonic (VT) earthquakes increased during 2006 to 2010 (figure 24).
 |
Figure 24. Guagua Pichincha volcano seismic event data from 2002 to 2010, shown in the number of events. Above the plot, earthquakes and periods of emission are indicated by arrows. Multiple events that happened closely spaced in time are shown by a single arrow. Data courtesy of IG-EPN (2008-2010 annual reports). |
During the period from 2005 to 2010 (table 11) the annual number of total seismic events generally remained in the range of several hundred to over 1,700. Seismically detected emission signals (phreatic outbursts) were recorded less than 25 times per year. The number of emissions in 2008 and 2009 were the largest in the years in discussion, 20 and 24 events respectively. At most, several explosions (producing non-juvenile ash found in vicinity of the crater) were recognized each year but three years had zero. More details on the 2008, 2009, and 2010 reports follows.
Table 11. Seismic data for Guagua Pichincha from IG-EPN 2005 to 2010 yearly summaries. Note the explosion column, which was often low, under three per year. IG-EPN attributed the emission cases to phreatic eruptions, in the explosion cases they recognized non-juvenile ash at the crater. The value for emissions in 2009 corrects those in the 2009 IG-EPN report. Data courtesy of IG-EPN.
| Year | Volcano-tectonic | Long-period | Hybrid | Rockfalls | Emissions | Explosions | Earthquakes in Quito |
| 2005 | 325 | 39 | 8 | 115 | 13 | 2 | 311 |
| 2006 | 811 | 84 | 28 | 174 | 4 | 3 | 162 |
| 2007 | 1274 | 84 | 30 | 83 | 8 | 0 | 84 |
| 2008 | 1531 | 105 | 190 | 107 | 20 | 3 | 62 |
| 2009 | 553 | 195 | 32 | 26 | 24 | 0 | 137 |
| 2010 | 1113 | 196 | 1 | 38 | 3 | 0 | 95 |
2008 seismicity. The three explosion events in 2008 took place on 27 January (two events) and on 5 May (one event). 2008 seismicity remained at a similar level as in 2007, with increased earthquakes in January and May, 326 and 299, respectively (figure 24). These two months had appreciable numbers of located events compared to other months. The locations of events tended to fall along trends to the WNW and NE. The WNW group is distributed in a line that runs from the N of the caldera to the foothills of Pichincha, following the Rumipamba gorge (figure 25a), which deepens towards the E. Epicenters of the NE group fall in a line on and near the caldera (figure 25a).
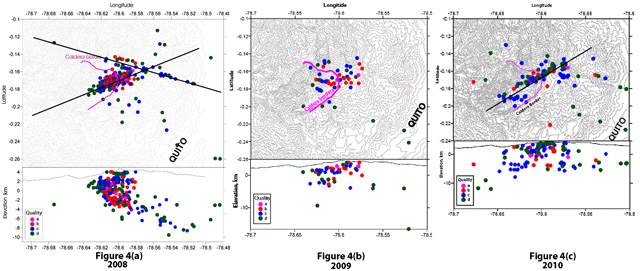 |
Figure 25. Located earthquakes (colored dots) at Guagua Pichincha presented as a series of annual maps: 2008 (4a), 2009 (4b), and 2010 (4c). The colors indicate accuracy and are listed as follows from highest to lowest accuracy: pink, red, blue, green. Courtesy of IG-EPN. |
2009 seismicity. The first half of the year was the most seismically active and ~77% of the total earthquakes occurred then (figure 24). Of the hundreds of events recorded for 2009, only 63 could be located. Their foci occurred below the crater around 7 km depth. Vapor-associated emissions mainly occurred during the first several months of the year (figure 24), coinciding with the rainy season. The highest number of emission events were on 16 February, 7 March, and 11 March.
2010 seismicity. No explosions occurred in 2010. Of the events recorded, 161 were localized near the crater (figure 25c). These recorded events were mainly grouped under the crater and to the NE with a majority of near depths of 7 km. Another group, fewer in number, was located and aligned E of the caldera (figure 25c). IG related emission events to existing heat inside the volcano interacting with groundwater.
Correlation of phreatic explosions and the rainy season. The occurrence of phreatic explosions and emissions appears to be related to the rainy season at the beginning of the year (SEAN 07:06, BGVN 18:02, 24:02, 24:11, 29:06, and 32:12). This behavior was most-recently reported on by the IG in 2008 and 2009. A possible model for the interaction of rain water with the volcanic system can be found in BGVN 24:11.
2008-2010 cooling and morphologic stability. Continued cooling of the dome was indicated by the temperatures recorded in situ from November 2000 to 2005 in the IG 2005 report. It was concluded the dome shows no thermal anomalies. IG 2010 ASTER TIR images are consistent with information from previous years and show continued cooling. In addition to undergoing continual cooling, the crater morphology has remained relatively unchanged since the formation of an additional crater in 2002. The IG concluded that Guagua Pichincha was generally becoming less active over time. However, they noted that it is possible for further emissions and explosions to occur that could possibly threaten Quito.
Reference. Samaniego, P; Robin, C; Monzier, M; Mothes,P; Beate; B; Garcia, 2006, Guagua Pichincha Volcano Holocene and Late Pleistocine Activity, Cities on Volcanoes, Fourth Conference; IAVCEI, Quito Equador, (URL: http://www.igepn.edu.ec/images/collector/collection/biblioteca/guaguapichincha_ field_guide.pdf).
Information Contacts: Instituto Geofísico Escuela Politécnica Nacional (IG-EPN), Apartado 17-01-2759, Quito, Ecuador (URL: http://www.igepn.edu.ec/); Observatorio Vulcanológico Pichincha (OVGGP) (URL: http://www.igepn.edu.ec/index.php/nuestro-blog/item/158).
2016: June
2009: February
2008: January
2006: February
2004: January
| February
2003: April
2002: October
| December
2001: January
| February
| March
| May
| November
2000: November
| December
The Washington VAAC reported that on 14 June a possible ash emission from Guagua Pichincha was visible in satellite images drifting NW. Seismicity was elevated. A VAAC report issued about five hours later noted that no further notices of activity had been received.
Source: Washington Volcanic Ash Advisory Center (VAAC)
The IG reported four moderate phreatic explosions from Guagua Pichincha were detected by the seismic network during 16-17 February, following a few days of slightly increased seismicity and rainfall. IG recommended that visitors stay out of the caldera.
Source: Instituto Geofísico-Escuela Politécnica Nacional (IG-EPN)
IG reported seven moderate phreatic explosions from Guagua Pichincha on 1 February, following a few weeks of slightly increased internal activity and a few days of almost constant precipitation. IG recommended that visitors stay away from inside the caldera.
Source: Instituto Geofísico-Escuela Politécnica Nacional (IG-EPN)
IG reported that seismic activity at Guagua Pichincha during 6-12 February decreased in comparison to the previous week, confirming that a small increase in activity around 5 February was related to brief phreatic activity. No explosions occurred during the report period and low-level volcanic tremor was recorded.
Source: Instituto Geofísico-Escuela Politécnica Nacional (IG-EPN)
On 5 February, beginning around 1300, three small gas emissions occurred at Guagua Pichincha. IG reported that this phreatic activity was associated with accumulated rainfall that was heated by magmatic material from the previous eruptive period, and was not related to renewed volcanic activity. After the emissions, a series of seismic signals associated with rockfalls and long-period earthquakes were recorded. The signals were related to degassing that commonly occurs after emissions. Cloudy conditions prevented observations of the volcano. IG recommended that people should not visit Guagua Pichincha's crater since emissions or explosions can occur at any time.
Source: Instituto Geofísico-Escuela Politécnica Nacional (IG-EPN)
Activity at Guagua Pichincha remained at low levels during 16-22 February, with only gas plumes rising from fumaroles. There was a slight increase in volcano-tectonic earthquakes. During 18-20 February, harmonic tremor was recorded.
Source: Instituto Geofísico-Escuela Politécnica Nacional (IG-EPN)
During the afternoon of 7 January, strong rains occurred at Guagua Pichincha and a series of seismic signals attributed to rockfalls and lahars were recorded. A visit to the area by IG scientists on 13 January confirmed that a lahar traveled down the NNE wall of the volcano's crater. In addition, there were small fractures in the SE sector of the volcano and in the crater. IG noted that this activity does not indicate a change in volcanic activity at Guagua Pichincha.
Source: Instituto Geofísico-Escuela Politécnica Nacional (IG-EPN)
This week Guagua Pichincha was marked by low-to-modest seismicity, which included earthquakes on 30 April and 1 May with magnitudes less than 3. Both had epicenters within an earthquake swarm N of Quito. Episodes of harmonic tremor appeared, most noteworthy on 4 and 5 May with each episode lasting under 40 minutes. Cloud cover obscured the crater area for much of the week (during 30 April and on 2 and 4 May), and civil defense observers monitoring the volcano noted little in the way of sulfurous odors and no noise. Improved visibility on 3 May enabled these observers to see modest fumaroles, with condensate visible at 3 to 100 m heights. This week's observations were similar to those of January, February, and March 2003.
Source: Instituto Geofísico-Escuela Politécnica Nacional (IG-EPN)
During the week Guagua Pichincha continued to display seismic unrest, typically with several earthquakes per day but including 16 long-period earthquakes on 26 April. During 23, 24, 26, and 27 April observers on the mountain typically smelled sulfur, but qualitative assessments of fumarolic output varied. In conditions of poor visibility, observers sometimes heard the sound of gases escaping in the crater. In overview, the volcano's activity has not entirely tapered off.
Sources: Washington Volcanic Ash Advisory Center (VAAC); Instituto Geofísico-Escuela Politécnica Nacional (IG-EPN)
The IG indicated that they detected seismic signals from a very minor Guagua Pichincha eruption on 17 April. The volcanologist on duty saw no visual signs of ash, implying that the seismic signals resulted from a very weak eruption with products confined to the summit crater. The IG also noted seeing similar seismic signals sporadically over the previous few days. The signals were thought to result from out-gassing, a class of behavior that if more energetic could generate larger ash clouds of impact to local residents and aviators. The IG also reported several volcano-tectonic earthquakes, seismic signals of rockfalls, and one long-period earthquake.
Sources: Instituto Geofísico-Escuela Politécnica Nacional (IG-EPN); Washington Volcanic Ash Advisory Center (VAAC)
Based on information from IG, the Washington VAAC reported that an eruption occurred at Guagua Pichincha on 7 December at 2120. The height of the ash cloud produced from the eruption was not reported, and no ash was visible on satellite imagery.
Source: Washington Volcanic Ash Advisory Center (VAAC)
Based on information from IG, the Washington VAAC reported that explosions occurred at Guagua Pichincha on 3 November at 2056 and 2115. They could not determine the heights of the plumes produced from the explosions, or if they contained ash, because ash was already in the atmosphere from a large eruption that day at Reventador, ~100 km E of Guagua Pichincha.
Source: Washington Volcanic Ash Advisory Center (VAAC)
A small increase in the number of phreatic explosions occurred at Guagua Pichincha following the 11 October explosion. The activity increase may have occurred due to heavy rain at the volcano.
Source: El Universo
According to a news article, an explosion occurred at Guagua Pichincha on 11 October following 6 months with no explosions. Since the 11th, long-period and volcano-tectonic earthquakes, and continuous background tremor were recorded until at least the 17th.
Source: El Universo
Tremor was recorded at Guagua Pichincha for ~16 hours after a phreatic eruption on 26 November. Signals from a relatively high number of rockfalls were recorded on seismographs, which is normal after an explosion. Two new craters formed during the explosion N of the 1981 crater. The following day, dark steam was observed rising 5 m above the craters. Volcanic and seismic activity remained at low levels after the 27th, with only low-level fumarolic activity occurring.
Source: Instituto Geofísico-Escuela Politécnica Nacional (IG-EPN)
IG's seismic data showed that an approximately 20-minute-long phreatic explosion began at Guagua Pichincha on 26 November around noon. Cloudy conditions prohibited visual observations, but a cloud composed mainly of gas, with small amounts of ash, may have been produced. The volcanic cloud was not visible in satellite imagery; it is believed to have stayed around summit level. Continuous tremor was recorded through at least the rest of the day. The last explosion at Guagua Pichincha occurred on 25 May 2001.
Sources: Washington Volcanic Ash Advisory Center (VAAC); Instituto Geofísico-Escuela Politécnica Nacional (IG-EPN)
Based on information from the IG, the Washington VAAC reported that on 25 May at 1110 a steam-and-ash emission from Guagua Pichincha's summit rose up to ~8.5 km a.s.l. The cloud was not visible on satellite imagery.
Sources: Washington Volcanic Ash Advisory Center (VAAC); Instituto Geofísico-Escuela Politécnica Nacional (IG-EPN)
Based on information from the IG, the Washington VAAC reported that an ash cloud was observed at 0137 on 31 March. No ash was visible on GOES-8 imagery. The volcano remained at Alert Level Yellow.
Sources: Washington Volcanic Ash Advisory Center (VAAC); Instituto Geofísico-Escuela Politécnica Nacional (IG-EPN)
The IG reported that during the week of 18-24 March a total of 806 long-period earthquakes were registered. However, 460 of those occurred on the 18th along with a moderate ash emission. Long-period event counts were below 20/day as of 21 March. Visual observations made by the Guards of the Refuge revealed that fumarolic activity increased, with higher steam columns on 18, 22, and 23 March, and a stronger sulfur smell until 22 March. No rockfall sounds were heard. The small number of rockfall signals detected as of 26 March suggests that lava dome 9 is stable. The volcano remained at Alert Level Yellow.
Sources: Washington Volcanic Ash Advisory Center (VAAC); Instituto Geofísico-Escuela Politécnica Nacional (IG-EPN)
Based on information from the IG, the Washington VAAC reported that a moderate ash emission at 2145 on 18 March produced an ash cloud that rose to a height of ~5.8 km a.s.l. The ash cloud was not visible on GOES-8 imagery. According to the IG, during the week a large number of earthquakes, especially long-period events, were registered. The detection of a small number of rockfalls confirmed that lava dome 9 continued to slowly grow. The volcano remained at Alert Level Yellow.
Sources: Washington Volcanic Ash Advisory Center (VAAC); Instituto Geofísico-Escuela Politécnica Nacional (IG-EPN)
On 13 February the Civil Defense reported that a crack formed in dome 9 and a small rock collapse occurred on the W side of the dome. On 14 February a rock collapse occurred on the S side of the dome. During a flight over the volcano on 15 February, IG personnel confirmed that dome 9 had grown during the week. The volcano remained at Alert Level Yellow.
Source: Instituto Geofísico-Escuela Politécnica Nacional (IG-EPN)
Lava dome growth continued at dome 9 at a rate similar to that of previous weeks. Rockfalls were observed travelling to the SW towards Cristal River. The volcano remained at Alert Level Yellow.
Source: Instituto Geofísico-Escuela Politécnica Nacional (IG-EPN)
The IG reported on 31 January that seismicity and volcanic activity remained at moderate levels. Continuous dome growth persisted at dome 9 and small morphologic changes were observed at the dome the previous week.
Source: Instituto Geofísico-Escuela Politécnica Nacional (IG-EPN)
The IG reported that a small increase in seismic activity occurred and dome 9 continued gradual growth.
Sources: Washington Volcanic Ash Advisory Center (VAAC); Instituto Geofísico-Escuela Politécnica Nacional (IG-EPN)
Guagua Pichincha has been producing fewer seismic events (~100/day) with the continuing growth of dome #9. During the week of 7-13 January the LP events were of greater magnitude and depth, registering on stations 10 km from the crater. Diego Viracucha of the Instituto Geofisica reported via radio on the morning of 14 January that a new crater appeared to be forming in dome #9. Diego informed two assistants that he was going to move several hundred meters W of seismic station "Pino" to take photos. While attempting that work he apparently slipped and fell 200 m into the caldera. He probably died immediately from head wounds and internal injuries. The site of the accident was 2.5 hours from GGP Refuge and it took all day to recover the body; because of the climatic conditions a helicopter could not be used. Recovery of the body was accomplished by six volcanologists from the IG, the Civil Defense, the Guards of the Refuge, the Red Cross, an elite group of police, various mountaineering groups, and family members. A cousin, Galo Viracucha, was injured during the recovery effort and later died as a result.
Source: Instituto Geofísico-Escuela Politécnica Nacional (IG-EPN)
The IG reported that in comparison to November the number of long-period earthquakes, which has been shown at Guagua Pichincha to reflect the amount of lava dome growth, and the number of rockfalls decreased in December. Activity has remained relatively constant, with a daily average of 514 earthquakes.
Source: Instituto Geofísico-Escuela Politécnica Nacional (IG-EPN)
The Guayaquil MWO reported to the Washington VAAC that an eruption occurred at 0148 on 15 December. No ash plume was visible in GOES-8 imagery and no further eruption details were reported. The IG reported that the high number of earthquakes that occurred during the week indicated that dome 9 continued to slowly grow.
Sources: Washington Volcanic Ash Advisory Center (VAAC); Instituto Geofísico-Escuela Politécnica Nacional (IG-EPN)
Based on seismic measurements, the IG reported that an eruption may have occurred at 0030 on 8 December. Throughout the day seismic activity continued at a decreased rate and no ash was observed. The fact that the Washington VAAC did not detect ash in GOES-8 imagery during cloudless conditions supported the theory that an ash-producing eruption did not occur. The IG stated that the high number of earthquakes indicated that lava dome 9 continued to slowly grow.
Source: Instituto Geofísico-Escuela Politécnica Nacional (IG-EPN)
Volcanic activity at Guagua Pichincha was low during the week and seismicity was relatively stable. There was a slight increase in seismicity on 27 November, but there were no indications of dramatic changes in volcanic activity.
Source: Instituto Geofísico-Escuela Politécnica Nacional (IG-EPN)
Volcanic activity at Guagua Pichincha was low during the week and seismicity was relatively stable. No dramatic changes in the morphology of the lava dome were observed, but the IG suspects that slow and continuous dome growth may be occurring.
Source: Instituto Geofísico-Escuela Politécnica Nacional (IG-EPN)
Volcanic activity at Guagua Pichincha was low during the week and seismicity was relatively stable. No dramatic changes in the morphology of the lava dome were observed.
Source: Instituto Geofísico-Escuela Politécnica Nacional (IG-EPN)
During the week moderate explosive activity produced small ash clouds at Guagua Pichincha. The Washington VAAC reported that one such cloud was visible on GOES-8 imagery at 0956 on 1 November and the IG reported that the ash cloud was near the summit level (~5 km a.s.l.). The IG also reported that seismicity continued after the eruption, suggesting that further explosive activity was possible. Small explosions and seismic activity suggested that dome growth occurred. The volcano is at Alert Level Yellow.
Sources: Washington Volcanic Ash Advisory Center (VAAC); Instituto Geofísico-Escuela Politécnica Nacional (IG-EPN)
Reports are organized chronologically and indexed below by Month/Year (Publication Volume:Number), and include a one-line summary. Click on the index link or scroll down to read the reports.
Small phreatic explosions; felt earthquakes
A small phreatic explosion that probably occurred in mid-August deposited fine tephra as much as 1 km SE of three new vents (3-8 m in diameter) in the summit crater. The new vents formed just E of a lava dome, about [625] m in diameter . . . . Aerial observers reported increased fumarolic activity in the summit crater about 20 August. Plume heights of as much as several hundred meters were reported in mid-August and a group that climbed the volcano 11-13 September observed a 200-300-m-high plume, but vapor emission had declined to only 2-3 times its normal level by early October. Temperatures of summit crater fumaroles in early October were 88-90°C, comparable to those recorded in 1976.
Seismographs at Quito and at Cotopaxi volcano (60 km to the SSE) recorded a series of earthquakes, some of which were large enough to be felt. However, the volcano is in a tectonically active zone and none of these events were large enough to be detected by the WWSSN. Earthquakes on 12 August at 0804 (probably centered near Quito) and 21 August at 0718 (probably centered about 40 km S of the volcano) had intensities of MM III-IV in Quito. Smaller events recorded on 25 August at 0651 and 26 August at 1311, both apparently centered about 40 km S of the volcano, were not felt, but residents of Quito noticed an event on 28 August at 1822 that probably had a nearby epicenter. Seismographs installed on the N, E, and S flanks 25-27 September had recorded no local seismicity (magnitude threshold about 1.5) as of 7 October. Dry-tilt stations were emplaced beginning 28 September at sites 11.25 km NNE, 9 km E, and 7.25 km SSW of the central dome.
A UNDRO volcanological team of John Tomblin, Karl Grönvold, and J.C. Sabroux assessed volcanic hazards in Ecuador 1-12 October. Chemical analyses of gas samples collected by Sabroux at Guagua Pichincha on 5 October will be compared to his analyses of gases collected from the same fumaroles in 1976.
Information Contacts: M. Hall, Instituto Geofísico de la Escuela Politécnica Nacional; J.C. Sabroux, CNRS, Gif-sur-Yvette, France; National Earthquake Information Center, USGS.
Minor ash ejection; local earthquakes
In late August or early September, one or more small phreatic explosions ejected about 5,000 m3 of ash from five new vents, 2-12 m in diameter, on the NE flank of the central lava dome. Ash thicknesses decreased from more than 1 m adjacent to the vents to about 1 cm at 500 m to the E, and traces extended about halfway up the E inner wall of the crater. There was no evidence of any fresh magma in the ash. By early October, vapor emission from the explosion vents and a group of new fumaroles at the base of the S inner wall of the crater had declined to only 2-3 times its normal level.
Seismographs installed on the N, E, and S flanks of the volcano 25-27 September detected no local earthquakes until early October, but recorded several events in most 5-day periods between 1 October and 15 November (figure 1). The number of recorded events peaked at about 2/day in early November and had declined slightly to 4-6/week by early December. Three dry tilt stations were established on the flanks of the volcano in late September and two more were added in mid-November, but no significant change in tilt had been measured as of early December.
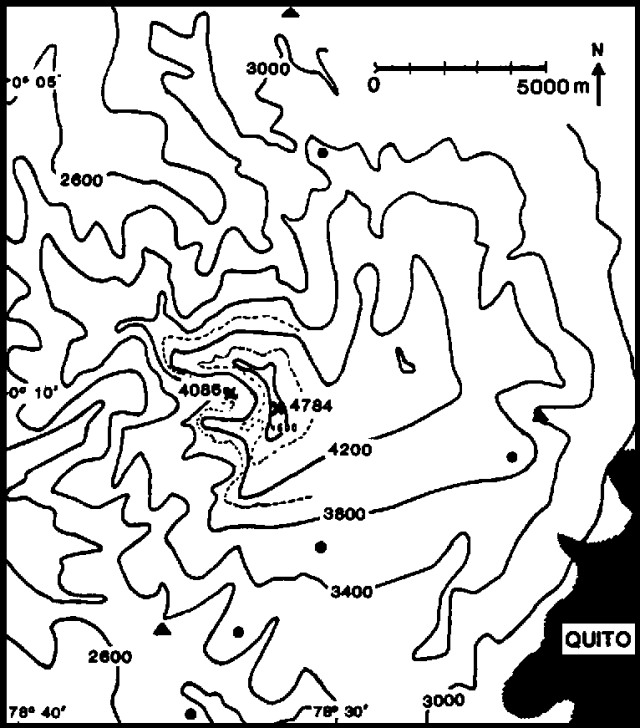 |
Figure 1. Map of Guagua Pichincha. Contour interval is 400 m except in the summit area, where 200-m contours are shown by dashed lines. The positions of dry-tilt stations are shown by solid circles, and seismographs are indicated by solid triangles. The area shaded at lower right is the city of Quito. Courtesy of M. Hall. |
Geologists climbed to the crater rim 3 December and noted that a small amount of ash had been deposited near the explosion vents since the area was last observed from the ground in mid-October. The volume of new ash appeared to be less than the estimated 5,000 m3 ejected in late August or early September. Steam emission had become more voluminous and two new vents had opened since October.
Information Contacts: M. Hall, Instituto Geofísico de la Escuela Politécnica Nacional; J. Tomblin, UNDRO.
Phreatic explosions; new fumaroles; seismicity
"Since the initiation of activity in August 1981 there had been a progressive increase, although irregular, in fumarolic activity within the summit crater. Prior to this, the volcano had apparently been quiet since 1881.
"The major fumarolic activity remained associated with the 625-m-diameter dacitic dome, which covers much of the crater floor. The new vent area, on the NE side of the dome, continued as one of the principal steam vents. Originally consisting of several small vents in line, the NE vents had grown to form one principal crater, approximately 50 m in diameter, plus another crater. Occasional phreatic explosions ejected ash and rock fragments. There was no evidence of new magmatic material in the ejected debris.
"Two older vents on the dome also remained active, producing individually about the same volume of steam as the NE vent. During a 16 May visit considerably more steam was escaping via many small fumaroles along the S talus slope of the dome. Apparently no material was being ejected by the older vents. Two other major fumaroles, at the foot of the S crater wall, also had notable steam emission.
"A 3-station seismograph net, in continuous operation since 25 September, registered a fairly constant level of 4-10 local events per week. Three dry tilt stations were established in late September, and two others in November (figure 2). These stations were re-levelled during November, January and February, but unfortunately have not been visited during the past 4 months. No change in tilt (threshold value about 5 µrad) was observed in the sporadic data."
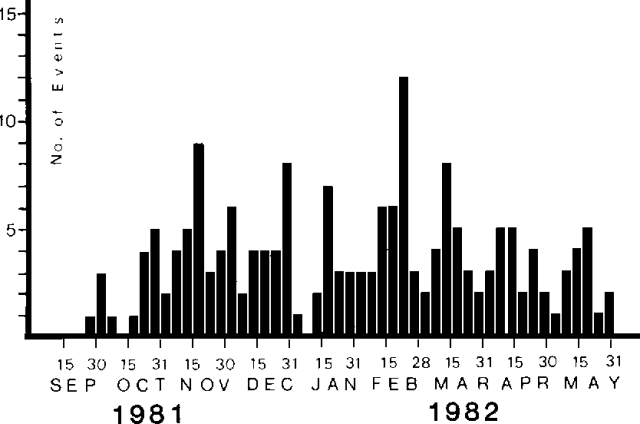 |
Figure 2. Number of volcanic earthquakes recorded 25 September 1981 through 31 May 1982 by a 3-station seismic net at Guagua Pichincha. Courtesy of M. Hall. |
Preliminary analysis of data from the 3-station seismic net shows hypocenters concentrated in two areas, both at roughly 4-5 km depth. Most of the events (maximum magnitude about 1) were centered 5-7 km SE of the summit, but some occurred below the caldera.
A geologist climbed to the summit 10 June and observed phreatic explosion deposits not present during the 16 May visit. The explosion appeared to have been directed toward the N, where ash coated recently stripped tree trunks to a maximum thickness of 5 cm. Ash deposition was followed by ejection of blocks up to 1 m across that produced impact craters as much as 4 m in diameter and 1.5 m deep. A zone of intense cratering extended 150 m from the vent and blocks 20 cm across were found as far as 350 m away. Hall's field work in the caldera 26-27 June revealed no evidence of additional explosions. No fracturing or other indications of uplift were observed on the top of the lava dome. Fumarole vapors had very little odor and were less voluminous than in previous visits. The 26-27 June visit followed three days without precipitation on the normally damp summit, and Hall is investigating the correlation between local rainfall and steam emission.
Further Reference. Salazar Medina, E., 1985, Riesgo volcánico de los volcanes Guagua Pichincha, Cotopaxi, y Tungurahua: Riesgo Volcánico en el Ecuador, INEMIN, Ministerio de Recursos Naturales, Quito, p. 1-24.
Information Contacts: M. Hall, Instituto Geofísico de la Escuela Politécnica Nacional.
Increased seismicity; fumarolic activity slightly stronger
Local seismicity has increased substantially since mid-April, accompanied by minor changes in the summit crater's fumarole field. Seismicity gradually built from background levels of 5-10/month to >200/month by August, and was continuing in early October. August and September events were centered at 4-9 km depth (most 7-9 km) near and N of the S caldera wall. In late September and early October seismicity migrated N toward the modern vent and upward, with some foci as shallow as 1.5 km. All were A-type shocks. Magnitudes of the largest events reached 3-3.5 and a few were felt in . . . Quito . . . . Early October data from tilt stations and EDM lines showed no deformation above noise levels since the last measurements in 1987. Geologists climbed the volcano on 8 October and noted more vigorous activity at existing fumaroles, plus new vents, an expansion in the size of the fumarole field, and recently killed vegetation.
Information Contacts: M. Hall and H. Yépez, Instituto Geofísico de la Escuela Politécnica Nacional; N. Banks and J. Ewert, USGS.
Phreatic explosions and tremor after 10 days of A-type shocks
After 15 months of quiet, phreatic activity began on 16 April at 0221. The activity was confined to the phreatic crater formed in 1981-82, on the NE side of the 600-m-diameter dome that occupies most of the caldera floor. Activity began with spasmodic harmonic tremor of small to intermediate amplitude, accompanied by strong fumarolic emissions generating a vapor column that rose at least 800 m. Several explosions were heard and recorded by seismographs 1.5 km and (very weakly) 9 km from the crater. Seven new fumaroles were observed within the 1981 crater, but by 17 April had joined to form a single fumarole 4 m in diameter. Non-juvenile material, rocks, and mud were thrown outward to 250 m from the vent, forming a layer 4 cm thick. The explosions enlarged the 1981 crater by ~20 m.
Precursory activity began with a M 2.3 earthquake on 5 April and a M 2.2 shock on 13 April. Only a few small events, both A- and B-type, were detected during subsequent days. The tremor had a typical frequency of 1.7 Hz on 15-17 April. Periods of tremor lasted as much as 3 hours, separated by intervals of low-amplitude tremor or quiescence. Intermittent explosions were also recorded, always associated with tremor. Only a few very small B-type events have been recorded since the onset of phreatic activity. Fumarolic waters remained at their normal temperature of 87°C.
Given the shallow character of the activity, geologists believed that it was partly related to the previous week's increased precipitation. Stepped-up monitoring and re-deployment of the Instituto Geofísico's seismic net (dismantled following the 1988 activity) were begun 16-17 April, and tilt stations and EDM lines were being resurveyed. The Instituto's hazard map and previously planned preparedness exercises for a hypothetical eruption of Guagua Pichincha were helping civil defense authorities to prepare for the possibility of increased activity.
Information Contacts: M. Hall, Instituto Geofísico de la Escuela Politécnica Nacional.
Fumaroles described; explosion heard
The central dome of pale gray lava, surrounded by a flat area covered with a fine tephra powder ~10 cm thick, was observed on 26 July (figure 3). An area of fumaroles was observed on the central dome (figure 4, top) where numerous vents, to 30 cm in diameter, were emitting white steam-rich gas with a strong sulfurous smell. Some yellow sulfur deposition was occurring. Another area of fumaroles was observed on the S wall of the crater (figure 4, bottom) where individual vents were smaller than those on the dome, but were reaching higher temperatures. Some vents were emitting hot water, while others had pools of boiling mud. Gases from the S-wall fumaroles were the same as those emitted from the central dome fumaroles. The hottest vent was also the loudest.
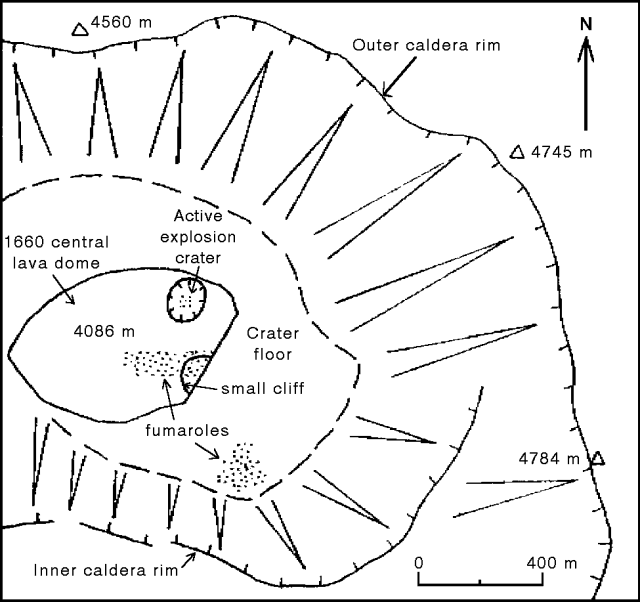 |
Figure 3. Sketch map of Guagua Pichincha's central crater, August 1990, from an INEMIN geological map prepared by Franco Barberi and others. Courtesy of Sean Hodges, University of Oxford. |
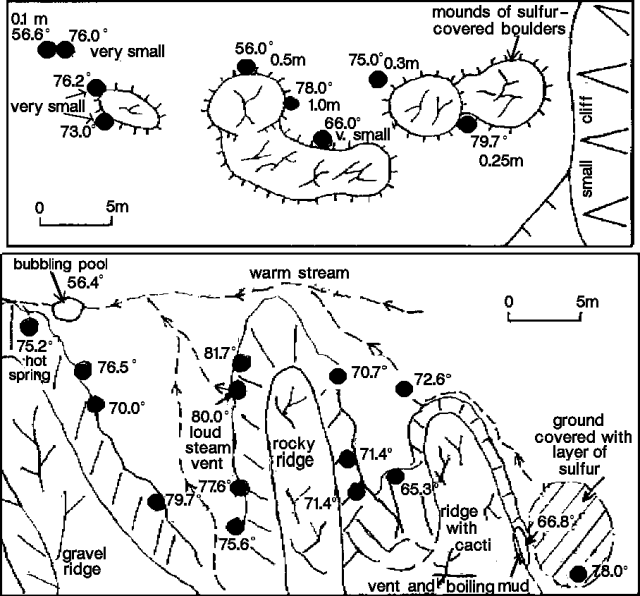 |
Figure 4. Guagua Pichincha's fumarole locations (solid circles) and temperatures, July 1990, on the lava dome (top) and SE crater floor (bottom). See figure 3 for fumarole field locations within the crater. Courtesy of Sean Hodges. |
During the late afternoon of 29 July, geologists heard loud explosions from the direction of Guagua Pichincha while on Imbabura, ~70 km N of the volcano.
Information Contacts: S. Hodges, University of Oxford. The Oxford field team also included J. Bass, S. Crampton, J. Dinares, S. Hart, R. Hartley, C. Mandeville, M. More, K. Ogden, J. Scarrow, and A. Whittingham.
Phreatic explosion kills two scientists
A phreatic explosion at 1146 on 12 March in the young crater of Guagua Pichincha's central dome killed two young volcanologists from the Instituto Geofísico. Ing. Victor Hugo Pérez, 31, and Egdo. Alvaro Sánchez, 25, had gone onto the dome, . . . (figure 3), to document recent activity when the strong blast hurled rocks and ash upon them, killing them instantly. Based on seismicity, a warning of possible activity had been transmitted to them by radio at 1030, but for unknown reasons they were still on the dome when the eruption occurred. Search and rescue operations were initiated late that afternoon and at about 0730 the following morning their bodies were discovered by M. Hall near the dome's crater rim.
Guagua Pichincha had been quiet since phreatic activity April-June 1990. The main fumarolic vents on the S side of the dome and the major steam vents at the foot of the S caldera wall exhibited normal fumarolic behavior. Fumarolic activity in the active crater on the NE flank of the dome has been variable but low.
Evidence of recent phreatic activity that had blasted ash and rocks NE against the inner wall of the caldera was noted during routine fieldwork on 11 March. A guard stationed near the caldera rim confirmed that an explosion had occurred on 9 March, depositing up to 10 cm of non-juvenile ash. The Instituto officially advised Civil Defense early on 12 March that Pichincha had resumed dangerous activity and that tourists and mountaineers should be advised of the danger in entering the caldera.
As in past explosive cycles, phreatic activity seems to be related to the rainy season, which normally begins in March. Activity may have begun earlier this year because of the abnormally high rainfall in February.
Information Contacts: M. Hall, Instituto Geofísico de la Escuela Politécnica Nacional.
Series of phreatic explosions during 1997
During March-October 1997 a series of phreatic explosions took place within Guagua Pichincha's caldera (figure 5). No precursory signals were detected prior to the activity. The intensity of these explosions peaked in May 1997; the last explosive signal was detected on 18 October 1997. This activity resembled phreatic explosions that occurred in 1981, 1990, and 1993.
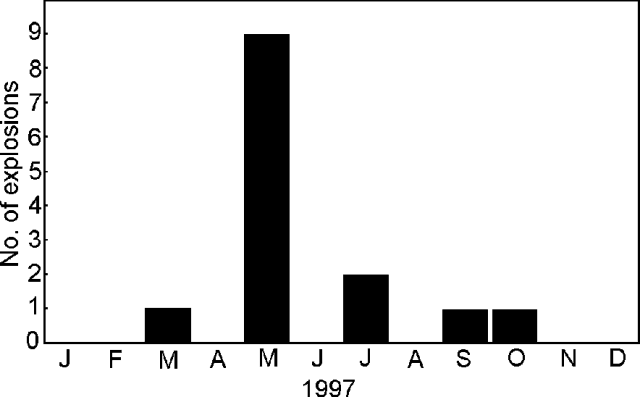 |
Figure 5. Monthly counts of explosion signals at Guagua Pichincha detected by Instituto Geofisico seismic stations during 1997. Courtesy of the Instituto Geofisico. |
Larger explosions on 15, 16, 18, 20, and 22 May, 22 and 23 July, and 18 October were detected by four short-period seismic stations located around the volcano. Tremor signals following these explosions had reduced displacements of 2. The largest explosion occurred on 29 May at 0654; its signal was recorded at eight sites, including seismic stations at the volcanoes Cotopaxi (58 km away), Cotacachi (60 km away), and Cayambe (70 km away). The accompanying tremor signal had a reduced displacement of 8.9 cm2. An A-type fracture event located just outside the E caldera rim at 3 km depth preceded the explosion.
Following the 20 May explosion, volcanologists observed two new, white, 250-m-tall fumarolic plumes rising from the explosion crater. The crater showed evidence of recent collapses on its interior S and SW sides. Fine pulverized rock deposits covered more than 2 km2 in the N part of the caldera bottom. Blocks up to 50 cm across were scattered over the caldera floor as far as 1 km from the crater; impact craters up to 2 m in diameter were formed. No juvenile material was found.
During 1997, the number of events at stations close to the caldera remained at normal values except during September-October, when a large number of events were detected at stations 1.0-1.2 km from the crater. However, at stations over 10 km away, the number of events remained at normal values. Low seismicity preceded phreatic activity in 1990 and 1993. The hypocenter locations of high-frequency events were at depths <5 km beneath the caldera floor (figure 6).
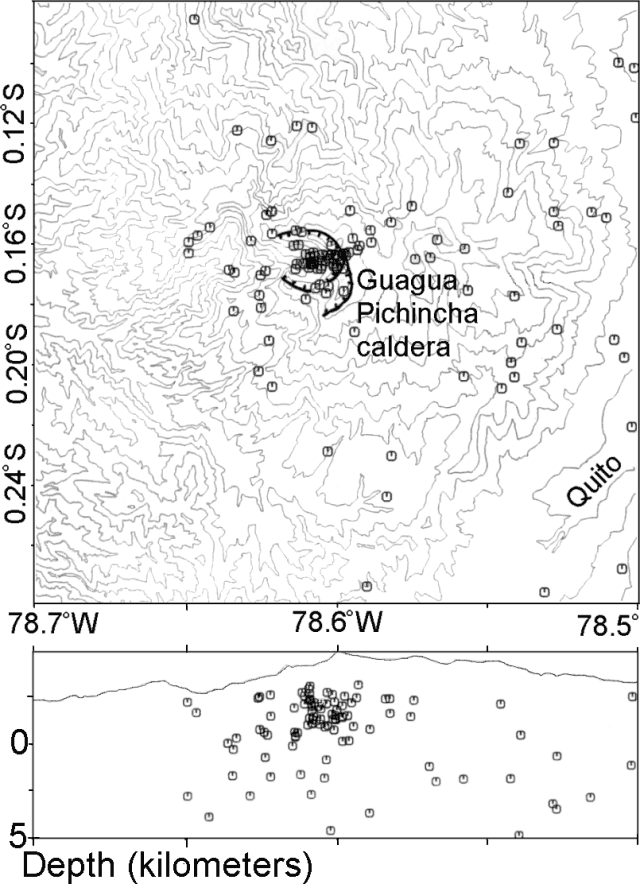 |
Figure 6. Epicenter map (top) and E-W cross-section (bottom) of high-frequency events at Guagua Pichincha during 1997. Courtesy of Instituto Geofisico. |
A swarm of 26 local earthquakes (M <3) lasted less than 1 hour on 16 December 1997. This was the first such swarm detected at Guagua Pichincha since continuous seismic monitoring began in 1981. EDM deformation monitoring of the phreatic crater and outer flanks of the dome revealed no change with regard to the baseline established in 1988.
Thermocouple measurements of fumarole temperatures on the dome showed values of 120-120.7°C, the same as during prior measurements in 1995, but lower than those detected in February 1994 (138-139°C). Prior to 1994, fumarole temperatures were constant at 87°C. Analyses of spring water from the caldera and the surrounding area gave essentially the same results as in 1988.
Information Contacts: Mario Ruiz Romero, Instituto Geofísico de la Escuela Politécnica Nacional.
Phreatic discharges reappear after robust off-flank seismicity
A seismic swarm occurred off Guagua Pichincha's NE flank during May-September 1998. On 4 August during the course of this swarm a M 7.1 earthquake struck near the coast; days later the stratovolcano began a series of modest phreatic eruptions. The eruptions continued through at least early October when they prompted local front-page news stories. As this report went to press in early October, the hazard status was Yellow, the second stage in an alert scheme of White, Yellow, Orange, and Red.
During the seismic swarm, earthquakes were centered in a zone ~15 km NE from Pichincha's summit. The epicentral zone lies on the S fringes of Casitagua, a volcano with no known eruptions in at least the last ~100,000 years.
The May-September swarm had not ended when this report was compiled in early September, and in total produced ~2,500 earthquakes through that time. During successive months of the swarm's progression, earthquakes became more numerous. Scientists located about 10 of the swarm's events of local magnitude 4.0-4.2, and they found that the hypocenters progressed towards the surface, from ~14 km depth during June to ~8 km depth during September. When these hypocenters were plotted on a vertical section oriented SW-NE, no lateral offset was visible, implying that the foci of these larger, located earthquakes rose vertically over time.
An active compressional fault along the Quito's E margin (the Quito fault) dips W beneath the city and underlies both volcanoes at depth. As noted above, the located earthquakes did not appear to follow the W-dipping fault, and epicenters trended oblique to the fault's N-S surface trace as they defined a zone aligned NW-SE. Still, the swarm was interpreted as tectonic, associated with the Quito fault.
The M 7.1 earthquake on 4 August struck ~175 km to Pichincha's SW on Ecuador's coast, a few tens of kilometers NE and inland from the port of Bahìa de Caràquez (0.59°S, 80.39°W). The U.S. Geological Survey made a preliminary assessment of the 4 August earthquake as Ms 7.1. The earthquake occurred at 1359 (1859 GMT); the preliminary depth was given as 33 km.
Phreatic eruptions began at 0156 on 7 August; 10-15 others followed into early September. Seismic signals indicated that in some cases eruptive degassing persisted up to 25 hours, type-A earthquakes occurred, but tremor was rare. The eruptions discharged gas, mud, and lithics, but no juvenile tephra. A veneer of these deposits appeared over the N crater floor when photographed on 15 September (figures 7 and 8). At that time, the crater's post-1660 dome gently steamed. The dome's N surface lay beneath a veneer of material deposited during and after phreatic eruptions on 7 August. The veneer contained mud and lithics but no juvenile tephra; some of this material formed small lahars that traversed around the dome and spilled out of the crater (figures 7 and 8). A visit to a crater overlook on 15 September disclosed that just beyond the rim of the explosion crater's N side, some new fractures arc around its circumference (arrow, figure 8).
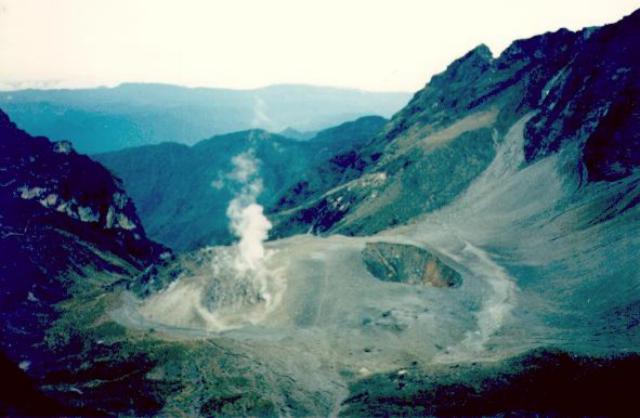 |
Figure 7. Photograph of the Guagua Pichincha crater taken at 0930 on 15 September 1998 looking out the breached W-crater wall (N is to the right). The photo was shot from a terrace inside the 2-km-diameter crater at a point ~ 1.2 km from the dome. The dome, which grew after the 1660 eruption, contains a prominent phreatic explosion crater on its NE slope. This explosion crater formed in 1981 and has since enlarged towards the dome's summit so that at the time of the photo it had a maximum diameter of ~ 150 m. Due to recent phreatic eruptions from this explosion crater, a thin veneer of non-juvenile ash coated the N dome and crater. Some of this ash later eroded and formed a narrow lahar circling around the dome's E margin and escaping the crater's confines at the W-opening breach. Courtesy of Patty Mothes, Escuela Politécnica Nacional. |
 |
Figure 8. Photograph of the Guagua Pichincha crater taken around 0930 on 15 September 1998 looking out the breached W-crater wall (N is to the right); the photo was shot ~1.2 km from the dome. The label indicates the center of the narrow lahar circling clockwise around the dome's E margin and leaving the crater through the W-opening breach. The white arrow at the right side of the figure indicates the location of new fractures arcing around the explosion crater's N side. Courtesy of Patty Mothes, Escuela Politécnica Nacional. |
This phreatic episode lacked non-seismic precursors. EDM on the crater walls, on the SE flank, and on the dome showed relatively little change. SO2 flux, measured with COSPEC, lacked a spike. The crater, however, was judged too dangerous to enter for the purpose of obtaining in-situ gas samples. In 1997, the maximum temperature of gases escaping the dome was ~120°C.
During the first week of September seismicity consisted largely of A-type events, although some long-period events registered and meager tremor was seen. Degassing was too small to produce a conspicuous plume. On 6 September Quito residents felt two earthquakes; they were M 3.5 and 3.8 at ~12 km depth.
Long-term trends in Pichincha's overall seismicity and explosion-type earthquakes were plotted through August 1998 (figure 9); however, the earthquakes comprising the seismic swarm discussed above were omitted. The prominent seismic peak during 1988 coincided with the installation of a new telemetered seismic system just prior to an interval when fumarolic areas expanded, when fumarolic vigor increased, but when no phreatic eruption discharged (SEAN 13:09). Interestingly, the 1988 increases also occurred in conjunction with a seismic swarm, in this case on the volcano's S flank 6-8 km from the summit; associated hypocenters were at 12-16 km depth. Phreatic activity took place in 1981, 1982, and 1985, and then again in 1990, 1993, 1994, 1995, 1997, and 1998 (figure 3 and SEAN 06:09, 06:11, 07:06; BGVN 15:02, 15:03, 15:09, 18:02, and 23:03).
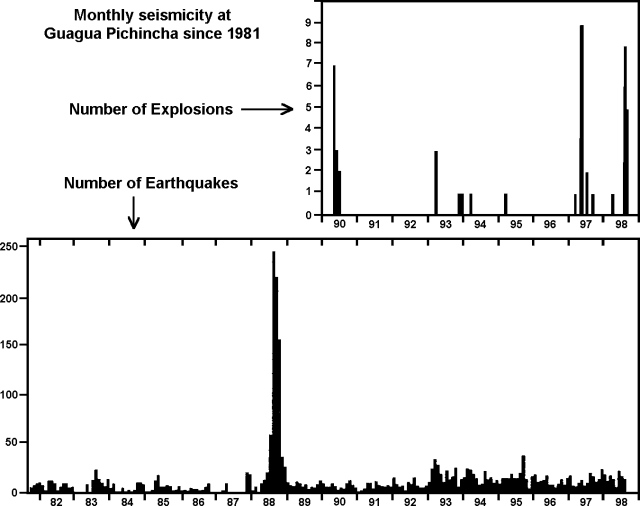 |
Figure 9. Monthly seismicity recorded at Guagua Pichincha from September 1981 through August 1998; however, the earthquakes comprising the August 1998 seismic swarm discussed above were omitted. Monthly explosions detected seismically since January 1990 are shown in the top diagram. Eruptions occurred on the NE side of the lava dome beginning in 1981, 1985, 1990, and several times between 1993 and 1998. The 1988 seismic increases (bottom) failed to lead to an eruption. Courtesy of the Instituto Geofísico. |
Information Contacts: Instituto Geofísico, Escuela Politécnica Nacional, Apartado 2759, Quito, Ecuador; El Comercio newspaper, Quito, Ecuador (URL: http://www.elcomercio.com); El Universo newspaper, Quito, Ecuador (URL: http://www.eluniverso.com); La Hora newspaper, Quito, Ecuador (URL: http://www.lahora.com).
Phreatic discharges and shallow, near-vent seismicity continue
The volcanic crisis near Quito (figure 10) continued with a series of phreatic discharges and an E-dipping zone of earthquakes that rose to within a few kilometers of the surface (figure 2). With potentially dramatic significance to Ecuador's Capital (1995 urban population, 1,270,000 residents; suburban, 258,000 residents), the eruption has spurred a strong educational response in both the regional press and on an official web site. These discourses have repeated noteworthy points: the volcano's last vigorous eruption was in 1660; its recurrence intervals have oscillated between about 400 and 600 years; its last major eruption took place 338 years ago; and its phreatic eruptions have repeated during the past 15 years. Phreatic eruptions began on on 7 August (BGVN 23:08); since then the Instituto Geofísico, Escuela Politécnica Nacional (IG-EPN) has made available daily reports on activity during 30 September to 27 October, which we summarize here.
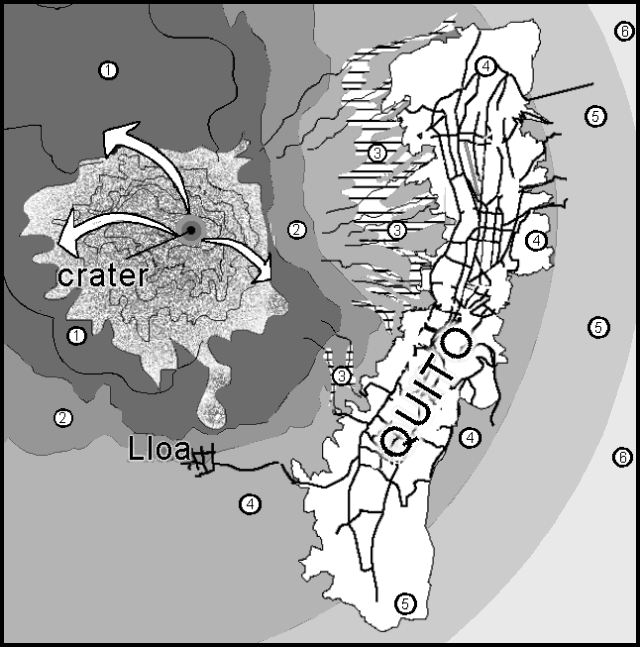 |
Figure 10. Simplified schematic showing Guagua Pichincha, Quito's urban areas (elongate zone with selected roads), and hazard designations associated with the volcano. Revised from a color hazard map on the IG-EPN website and keyed as follows: 1) Maximum danger (including major risks of hot volcanic flows, lahars, and ashfall - requiring total evacuation); 2) Minor danger (minor risk of ash clouds, hot volcanic flows, and lahars - areas immediately abandoned should an eruption be either imminent or large); 3) Lahar risk along drainage areas; and 4-6) graded risk of ashfalls. The bold arrows help identify the location of source vents and portray ejecta trajectories representative of those that might occur during an eruption. For more detail, see Hall and von Hillebrandt (1988). Courtesy of the Instituto Geofisico, Escuela Politécnica Nacional. |
Activity and observations. The epicenters of located earthquakes during April-October 1988 generally clustered around the caldera (figure 11). This was particularly the case for volcano-tectonic (VT) earthquakes, which in cross-section view tended to lie underneath the caldera. The located long-period (LP) events generally propagated from greater depths and in cross-section view defined a broad E-dipping zone. Thus far in the crisis there has been an alternating pattern of seismicity and seismically detected explosions (figure 12). During late September through late October there were often 1-2 daily explosions.
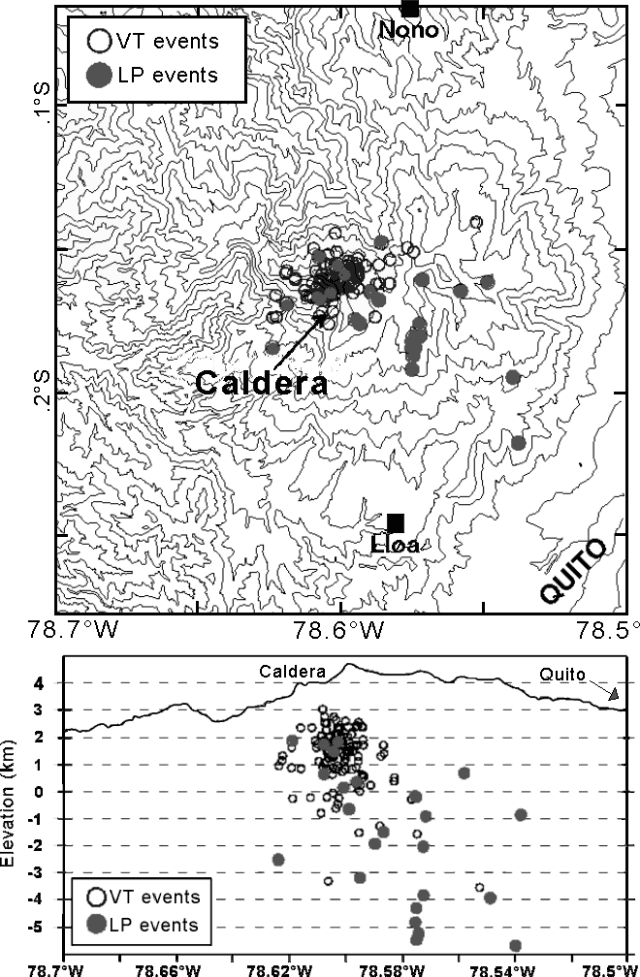 |
Figure 11. (top) Located seismic events at Guagua Pichincha during April-October 1998 were mainly centered around the caldera. The abbreviations VT and LP refer to volcano-tectonic and long-period events. The LP events showed a tendency to lie farther outboard, on the volcano's E slopes. (bottom) A cross section showing hypocenters for the same seismic events, which reveals the E-dipping attitude of located events. Courtesy of the Instituto Geofisico, Escuela Politécnica Nacional. |
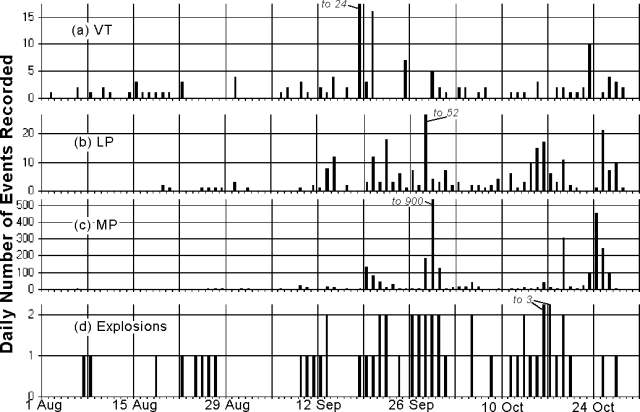 |
Figure 12. Histograms for Guagua Pichincha showing both the daily number of earthquakes, including (a) volcano tectonic (VT), (b) long-period (LP), (c) multiphase (MP), and (d) the daily number of seismically detected explosions. Courtesy of the Instituto Geofisico, Escuela Politécnica Nacional. |
On 3 October observers confirmed the presence of new fumaroles on the dome's W edge; nearby, in the headwaters of the Rio Cristal, they noted a new fumarole field. A phreatic explosion was heard at 0400 on 5 October by residents of Lloa. The explosion was the thirty-first such event in the sequence initiated on 7 August. It ranked among the most energetic seen to this point of the crisis, comparable to those on 8 and 24 August, and 29 September. The 5 October explosion followed 50 minutes of tremor registered at station YANA (7 km NE of the crater; "C" on figure 13). Small seismic events continued until 0800 that day. This explosion left a fresh ash layer in the caldera that revealed a new vent near the older one but above it to the S.
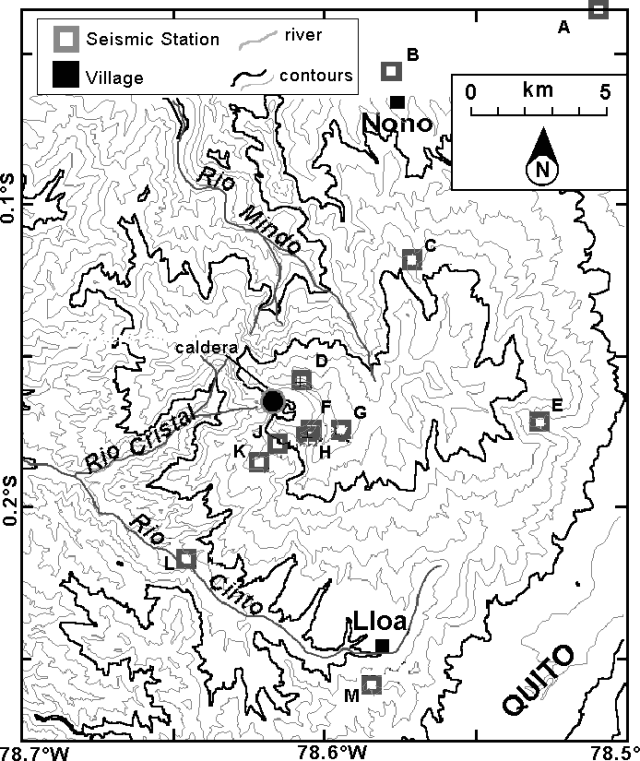 |
Figure 13. Contour map (200-m interval) indicating noteworthy sites surrounding Guagua Pichincha, including the valley embracing Quito and some of the key W-slope rivers that drain the breached caldera and environs. The map indicates settlements of Nono and Lloa (darkened rectangles) and seismic stations installed and maintained by various groups (open rectangles). These stations are designated by the following call letters: A, FARH; B, NONO; C, YANA; D, PINO; E, QWR; F, TERV; G, GGP; H, (uncertain); J, TOAZ; K, PIEZ; L, JORG; and M, MGUL. Courtesy of the Instituto Geofisico, Escuela Politécnica Nacional. |
The seismic swarm NE of the caldera (BGVN 23:08) continued; between June and early October there were 3,200 events; ~10 had a magnitude (MR) over 3.9. On 4 October instruments detected ~30 earthquakes, the strongest MR 3.5. A MR 3.6 earthquake struck this zone on 10 October and was felt locally in the settlements of Pomasqui and San Antonio.
Measured deformation was not detected for the interval 15 September-7 October. Although not plotted, tremor has occurred. For example, at 2214 on 7 October station PINO detected tremor for 19 minutes while station YANA registered it for 7 minutes. On 11 and 12 October tremor followed phreatic explosions and in the former case, prevailed for 20 minutes at stations near the crater.
Mass wasting on the SE flank ~11 km from the caldera (in Quito's San Roque sector) on 9 October covered an old school, part of a church, threatened several smaller structures, and blocked vehicular traffic. Roughly 20 people were evacuated.
On 12 October condensing gases escaping the dome at a fumarole called "La Locomotora" rose 200 m. Around this time the 1981 explosion crater also emitted a moderate flow of gray gases but new fractures or fumaroles were absent.
At 1621 on 14 October a phreatic explosion at the 1981 vent sent fine material over the NE part of the caldera and left a visible coating ~300 m up the caldera walls. The associated grayish-white plume formed a ~3-km-tall column. Clear weather enabled residents of Quito to see the plume. Geophysical instruments detected the event at widely scattered locations. COSPEC registered the first clear SO2 signal, a 300 ppm concentration in the plume. Guards at a local observation post smelled strong sulfur, particularly when gases from La Locomotra fumarole blew past.
An explosion at 0947 on 16 October sent a plume to ~2 km. Again, Quito residents saw the plume, but an explosion the next morning was shrouded from view by weather clouds. The latter explosion was considered moderate; it was associated with ~5 minutes of tremor centered around 1.2-Hz frequency and scientists working nearby (at station PINO) saw a gray-white cloud develop. A 17 October explosion was shrouded in clouds. The phreatic explosions on 14, 15, 16, and 17 October yielded respective reduced seismic displacements of 11, 4.2, 9.8, and 3.2 cm2.
A view into the caldera on the morning of 18 October disclosed relatively passive outgassing from the 1981 and 1988 explosion craters. La Locomotra and other fumaroles on the central dome had clearly increased their output, feeding a plume ~700 m high. Another moderate explosion on 25 October was followed by 3 hours of tremor.
A flight on the morning of 27 October revealed only modest degassing, a 300-m-high plume, and an SO2 concentration below the COSPEC's detection limit. Minard Hall also recognized that the 1981 crater and one formed in September 1998 had coalesced. The wall isolating them had apparently been weakened by repeated phreatic eruptions.
Risk mapping. The highest risk settlements include Lloa (figures 1 and 4) and Mindo. The latter lies on the river of the same name about 22 km NW of the caldera; it lies off of maps in this report but is depicted on the larger hazard map of Hall and von Hillebrandt (1988). One branch of the Mindo river's headwaters begin just N of the breach in the caldera (figure 4). Rivers draining the breached W-flank and nearby NW-flank (e.g. Rio Cristal and Rio Mindo) were assigned a higher category of risk for lahars than any lahar-risk zones on the E flanks (figure 1).
New fieldwork has been aimed at inspecting older lahar deposits in vicinity of the settlements of Mindo and Nono. Nono, on the NNE flank (figures 2 and 4), lies at mouth of a narrow N-S valley that cuts across much of the volcano's E to NNE flanks.
Partnerships. The following describes some of the civic and media efforts to communicate volcanic hazards. On 30 September Ecuador's president requested that a safety committee be formed (Comité Especial de Seguimento, CES). The committee was charged with integrating Civil Defense, the IG-EPN, and the City of Quito. In overcast conditions on 24 August a film crew from TeleAmazonas shot footage of an explosion plume not otherwise visible in Quito. These glimpses, and later examples of widely visible plumes, surely helped residents grasp the immediacy and some of the power of the eruption.
Authorities raised the hazard status to Yellow on 1 October. On 3 October a new video system started to monitor the inner crater. This advance was supported by "Ecuavista" in coordination with "911 of the City of Quito," the phone number for the City's communications base.
A 2 October announcement told of a downtown Quito information center implemented to release daily circulars at bearing official volcanological information. Thanks to a partnership between the information center and IBM of Ecuador, the former gained access to the internet, email, and a modern computing environment The radio station "Zaracay," which can be received widely, including the urban and Mindo areas, was also designated as a conduit for public announcements.
By 7 October the seismic network consisted of 12 stations with real-time data transmission. Collaborating scientific teams and monitoring equipment have come from both the U.S. Geological Survey as well as ORSTOM (the French Scientific Research Institute for Development through cooperation). Contingency plans have surfaced, dealing with the issue of transportation during the higher stages of alert (Orange and Red). Public announcements have broached the need to maintain the integrity of the municipal infrastrucure in the event of an eruption, including crews to clean ash (from roads, power lines, etc.).
Reference. Hall, Minard, and von Hillebrandt M., Christa G., 1988, Mapa de los peligros volcanicos poteciales asociados con el volcan Guagua Pichincha; Republica del Ecuador (1:50,000).
Information Contacts: Instituto Geofísico, Escuela Politécnica Nacional, Apartado 17-01-2759, Quito, Ecuador; El Comercio newspaper, Quito, Ecuador (URL: http://www.elcomercio.com); El Universo newspaper, Quito, Ecuador (URL: http://www.eluniverso.com); La Hora newspaper, Quito, Ecuador (URL: http://www.lahora.com); Volcanic Disaster Assistance Program, U.S. Geological Survey, 5400 MacArthur Blvd., Vancouver, Washington 98661 USA (URL: https://volcanoes.usgs.gov/observatories/cvo/); ORSTOM, A.P. 17-11-6596, Quito, Ecuador (URL: http://www.ird.fr/).
Crisis continues into November; many days with one phreatic explosion
The sequence of phreatic explosions initiated on 7 August (BGVN 23:09) continued from 28 October through 17 November (table 1). A substantial number of days were marked by one phreatic explosion. Visible explosions rose at most a few kilometers above the summit. Many explosions were accompanied by tremor; they were seismically characterized with reduced displacements.
Table 1. Some details of Guagua Pichincha's phreatic explosions, their size (as reduced displacements), and associated tremor, 27 October through 17 November 1998. A "--" signifies the data is either inapplicable or not reported. Extracted from the daily reports posted on the website of IG-EPN.
| Date | Phreatic explosions | Reduced displacement | Post-explosion tremor | Remarks |
| 27-29 Oct 1998 | 0 | -- | -- | -- |
| 30 Oct 1998 | 1 | 3.6 cm2 | 8 hours | -- |
| 31 Oct 1998 | 1 | -- | 30 minutes | -- |
| 31 Oct 1998 | 1 | -- | 20 minutes | -- |
| 01 Nov 1998 | 1 | 5.7 cm2 | -- | -- |
| 01 Nov 1998 | 1 | 10.7 cm2 | 3 hours | -- |
| 02 Nov 1998 | 1 | 12.2 cm2 | -- | -- |
| 03 Nov 1998 | 1 | 7.7 cm2 | -- | Plume rose to 3 km altitude. |
| 04 Nov 1998 | 1 | -- | -- | High amplitude, spasmodic tremor. |
| 04 Nov 1998 | 1 | 14.8 cm2 | 4 hours | -- |
| 05 Nov 1998 | 1 | 6.0 cm2 | 30 minuntes | -- |
| 06 Nov 1998 | 1 | 5.3 cm2 | -- | -- |
| 07 Nov 1998 | 4 | <~3.0 cm2 | -- | -- |
| 08 Nov 1998 | 0 | -- | -- | -- |
| 09 Nov 1998 | 0 | -- | -- | Fumarole "La Locomotora" gave off a 300-m-tall plume. |
| 11 Nov 1998 | 0 | -- | -- | Fumarole "La Locomotora" gave off a 600-m-tall plume. |
| 12 Nov 1998 | 1 | 4.4 cm2 | -- | -- |
| 13 Nov 1998 | 0 | -- | -- | Two-hour interval of tremor. |
| 14 Nov 1998 | 0 | -- | -- | Plume reaching 1 km tall. |
| 15 Nov 1998 | 1 | 5.7 cm2 | 20 minutes | Poor crater visibility; rockfalls and loud fumaroles heard by park rangers. |
| 16 Nov 1998 | 1 | 2.1 cm2 | -- | -- |
| 17 Nov 1998 | 1 | 1.7 cm2 | -- | Spasmodic tremor. |
As illustrated in the previous report (BGVN 23:09), volcano-tectonic, long-period, and multiphase earthquakes all escalated prominently during mid-September. During the current reporting interval, these remained elevated but did not increase, and the numbers of the various events, particularly volcano-tectonic and multiphase earthquakes, may have moderated or diminished slightly.
The number of explosions in a single day reached a new high for this crisis: four occurred on 7 November. The previous one-day record, three, had occurred only on two days in mid-October. Yet, the 7 November blasts were followed by four consecutive days with no explosions and, during 8-20 November no day had more than one explosion. As an indication of the pace of the venting, during 7 August-3 November the daily reports noted 59 explosions.
The highest plume seen during the reporting interval came from an explosion at 0715 on 3 November. It rose to ~3 km above the summit. Clear atmospheric conditions enabled residents to see it from the city of Quito. Although atmospheric conditions frequently blocked visibility, local observers saw fumarolic plumes rising from 100 to 1000 m. Thus, on 28 October a plume rose 100 m; on 9, 11, and 14 November, respectively, plumes rose 300, 600, and 1,000 m high. A plume on 4 November was of ambiguous origin, but it rose 1,000 m.
Information Contacts: Instituto Geofísico, Escuela Politécnica Nacional, Apartado 17-01-2759, Quito, Ecuador; El Comercio newspaper, Quito, Ecuador (URL: http://www.elcomercio.com); El Universo newspaper, Quito, Ecuador (URL: http://www.eluniverso.com); La Hora newspaper, Quito, Ecuador (URL: http://www.lahora.com); Volcanic Disaster Assistance Program, U.S. Geological Survey, 5400 MacArthur Blvd., Vancouver, Washington 98661 USA (URL: https://volcanoes.usgs.gov/observatories/cvo/); ORSTOM, A.P. 17-11-6596, Quito, Ecuador (URL: http://www.ird.fr/).
Phreatic discharges and shallow, near-vent seismicity continue
As late as 16 January, the volcanic crisis near Ecuador's capital, Quito, continued as visually observed activity and seismic indices showed little sign of either halting or escalating. Relevant histograms showing the seismic indices were posted by the Instituto Geofísico, Escuela Politécnica Nacional (IG-EPN) on their website. In addition to photos and regular updates, the site discusses such topics as civil defense and hazard planning. The current eruptive crisis began when a series of modest phreatic eruptions followed the large 4 August earthquake that struck near the coast ~175 km SW (BGVN 23:08 and 23:09). This summary covers the interval 28 October 1998-16 January 1999.
Summit observations on 27 October disclosed fumaroles off-gassing at both the 1981 crater and the adjacent 1998 crater, and steam wafting to 300 m. The last few days of October were marked by comparative quiet, with few phreatic eruptions, and associated tremor under 30 minutes in duration.
On 9 November seismically detected explosions reached a new high of 4/day; the previous maxima occurred when 3/day took place on two days in mid-October. During 22 November through 22 December instruments detected very few explosions. A visit to the crater area on 20 November disclosed abundant fresh debris on the rim, and numerous impact craters scattered about the area. Poor weather prohibited systematic determination of ash plume heights, but on 23 December one plume rising to 3 km altitude was seen from Quito. Explosions then resumed, with three explosions on 10 January. Patterns in the number of daily multiphase, long-period, and volcano-tectonic earthquakes were somewhat similar, with lows in the weeks surrounding 28 November and significant upswings thereafter. Many seismic events were shallow, at depths of several kilometers. Intervals of spasmodic tremor up to two or three hours also occurred during the reporting interval.
Scientists computed reduced displacements of the seismically detected explosions. For the following intervals the maxima can be summarized as follows: November, 14.8 cm2; December, 15 cm2; and 1-16 January, 13.3 cm2. Two so-called "tornillo" (screw-type) seismic events were noted on 3 January. The term arises from the seismic record of these events that looks like the profile of a screw. The broad, higher amplitude portion of the screw occurs early in the arrival sequence; the signal's amplitude decays slowly, finally reaching background at the point of the screw.
On 13 November field workers observed deposits from mud and debris flows that had come down the Cinto and Cristal rivers on 4 November. Triggered by a small rockslide on the SW flank, these flows were also seen by WSW-flank inhabitants who reside in the village of La Playa. The flows could be observed up to 15 km from the crater. The flow material also mixed with thin ash produced during phreatic explosions.
On 19 November a guard at a local refuge reported an absence of activity at both the crater and fumaroles; however, at 1049 that day, the fumarole known as 'La Locomotora,' located on the caldera's S wall, expelled vapor reaching 400 m high. This fumarole remained active throughout the reporting period. Another fumarole, known as Las Alineadas, escaped from the S dome area and was briefly mentioned on several days during mid-December as the source of sulfurous gases and loud noises; on 26 December Alineadas discharged an 800-m-tall vapor plume. On 13, 14, and 16 January crater fumaroles gave off vapor plumes that reached 1 km in altitude.
Press reports. An unusually clear, though undated photo of the two intracaldera craters can be found at the El Comercio website. The same site has over 70 articles (in Spanish) devoted to Guagua; pieces that are direct, practical, informative, and—given the circumstances—surprisingly upbeat. They convey a sense of the human side of a volcanic crisis without undue sensationalism. Topics include: broccoli growth in the volcano's soil, the vulnerability of a local marketplace in the event of an eruption, "Geophysicists—the volcano doctors," "Gasoline: there is a distribution plan," and the merging of art and science in an attempt to glean past eruptive behavior.
One article, titled "Guagua: mud and ash could effect 31,000," discusses the poor state of roofs in 18 separate zones in N upland areas along the E half of Quito's urban margins, an area described as high-risk. An impressive figure illustrates the locations and names of the zones, their populations, and shows how each ranks in terms of relative risk from mud flows and ash fall. Finally, for each of these zones, the figure indicates the average estimated risk of roofs to weight-bearing loads.
Information Contacts: Instituto Geofísico, Escuela Politécnica Nacional, Apartado 17-01-2759, Quito, Ecuador; El Comercio newspaper, Quito, Ecuador (URL: http://www.elcomercio.com); El Universo newspaper, Quito, Ecuador (URL: http://www.eluniverso.com).
Moderate seismicity and phreatic eruptions during January-February
The Instituto Geofísico (IG-EPN) monitors seismic events, crustal deformation, geochemistry, and records visual observations at Guagua Pichincha. This volcano consists of a 2-km-wide caldera, breached to the west, on whose floor lies a dome complex and the present explosion craters. The following report summarizes their daily observations from 1 January to 31 March 1999. During this period, a Yellow alert status persisted.
Bad weather often prevented or hindered visual observations. Guards at the refuge station and visiting scientists frequently reported noises and the strong smell of sulfur from the fumaroles. COSPEC data from 16 January and 13 March showed only background concentrations of SO2 from the fumaroles, following the maximum concentrations yet recorded (170 t/day) on 10 December. Ash-and-steam plumes from dome fumaroles, when visible, ranged from 100 to 800 m in height, while explosion plumes reached 3 km. The 1981 explosion crater had increased in diameter and almost absorbed the September 1998 crater.
People living along the Cristal river (W flank) confirmed the seismic detection of small debris flows and floods that were generated on 7 and 27 January, 2, 16, and 21 February, and 1 March, all related to intense rainfalls; these traveled down the Rio Cristal at least 10-15 km. Estimated volumes are between 0.3 and 1 x 10⁻⁶ m3 with estimated peak discharges of 100-250 m3/s.
Phreatic explosions covered the dome and the interior of the caldera with ash and rocks. A guard at the refuge station and Civil Defense personnel found 2-5 mm of new ash and new impact craters in the Terraza area following the explosions of 21 and 23 January. Analysis of the ash showed no juvenile material, suggesting that magma had not ascended. Ballistically ejected rock fragments up to 30 cm in diameter were found 1-1.5 km S and SE of the dome, the result of phreatic explosions in this time period.
Volcano-tectonic (VT), long-period (LP), and hybrid earthquakes, sometimes in multiples, occurred almost daily throughout January, February, and March. Phreatic explosions were frequent during that period, occurring on average once per day in February and March. Daily LP event counts varied between 1 and 40, but many days had few VT or LP events. Still, 24 VT events occurred on 28 February and 1 March. .High-frequency tremor episodes of a few minutes to as much as four hours (9 February) duration were recorded, but possible associated effects in at the caldera summit could not be confirmed due to bad weather. Some rockfalls in the caldera were heard by the refuge guards while tremor episodes were occurring.
On 9 February and 14 March instruments detected 16 and 70 tectonic earthquakes along the N part of the Quito fault. The largest events had magnitudes of 3.7 and 4.0, respectively. It had been speculated that these events represented sympathetic responses to stresses produced by the volcano's magma chamber. This idea came from an earlier observation of an "on-off scenario" where the presence earthquakes in the N Quito area correlated with little seismicity registering under the caldera, and vice versa.
Reduced displacement measurements (RDs) of phreatic explosions ranged from those too small to measure to several that were 20 cm2 or greater. Some of these larger RDs, such as those on 18 and 28 January, and 13, 19, and 28 February, were the largest since October 1998. The one on 28 February was the largest yet recorded. A summary of seismic events since August 1998 is presented in table 2.
Table 2. Monthly summaries of explosions and seismic events at Guagua Pichincha, August 1998-March 1999. Courtesy IG-EPN.
| Month | Phreatic Explosions | Volcano-tectonic | Long-period | Hybrid |
| Aug 1998 | 8 | 23 | 18 | 29 |
| Sep 1998 | 24 | 73 | 165 | 1,626 |
| Oct 1998 | 25 | 49 | 191 | 1,448 |
| Nov 1998 | 18 | 52 | 234 | 419 |
| Dec 1998 | 7 | 59 | 94 | 166 |
| Jan 1999 | 18 | 41 | 218 | 1,163 |
| Feb 1999 | 28 | 60 | 190 | 2,099 |
| Mar 1999 | 21 | 115 | 73 | 940 |
Information Contacts: Instituto Geofísico, Escuela Politécnica Nacional, Apartado 17-01-2759, Quito, Ecuador.
Summary of activity in April; tremor for extended durations; phreatic explosions
The Instituto Geofísico of Ecuador's Escuela Politécnica Nacional (IG-EPN) records visual observations and monitors seismic events, crustal deformation, and geochemistry at Guagua Pichincha. This volcano consists of a 2-km-wide caldera, breached to the west, on whose floor lies a dome complex and the present explosion craters. The following summarizes their daily observations for April 1999. During this period, a Yellow alert status persisted.
Bad weather often prevented or hindered visual observations. Guards at the refuge station and visiting scientists frequently reported noises and the strong smell of sulfur from the fumaroles. Ash-and-steam plumes from dome fumaroles, when visible, ranged from 100 to 800 m in height, while explosion plumes reached 1 km. On 21 April, a new crater with a diameter of ~8 m was reported east of the 1981 explosion crater.
A summary of monthly events since August 1998 is presented in table 3. Volcano-tectonic (VT), long-period (LP), and hybrid earthquakes, sometimes in multiples, occurred almost daily throughout April with the daily numbers increasing substantially during the latter third of the month. Similarly, two-thirds of the 18 phreatic explosions (PE) occurred during the last week of April. Reduced displacement measurements (RDs) of phreatic explosions ranged from those too small to measure to the largest of 11.7 cm2.
Table 3. Monthly summaries of phreatic explosions and seismic events (volcano-tectonic, long-period, and hybrid) at Guagua Pichincha, August 1998-April 1999. Courtesy IG-EPN.
| Month | Phreatic Explosions | Volcano-tectonic | Long-period | Hybrid |
| Aug 1998 | 8 | 23 | 18 | 29 |
| Sep 1998 | 24 | 73 | 165 | 1,626 |
| Oct 1998 | 25 | 49 | 191 | 1,448 |
| Nov 1998 | 18 | 52 | 234 | 419 |
| Dec 1998 | 7 | 59 | 94 | 166 |
| Jan 1999 | 18 | 41 | 218 | 1,163 |
| Feb 1999 | 28 | 60 | 190 | 2,099 |
| Mar 1999 | 21 | 115 | 73 | 940 |
| Apr 1999 | 17 | 45 | 51 | 369 |
Tremor of 17 hours duration occurred on the 3 April, and the subsequent tremor that started on the 9th continued to be active throughout the remainder of the month with varying amplitude and frequency. As the number of PE and HY events increased during the last week of April , the character of the tremor varied markedly having extended periods of quiescence and then periods of large amplitude at varying frequency. For example, on 26 April the amplitude of the tremor diminished until 1800 hours, but after an explosion that evening, the amplitude increased and tremor persisted for about 2 hours. Then on the 27th, the tremor changed character after a morning explosion and high amplitudes at nearby stations at frequencies between 2.8-3.3 Hz diminished over a period of 6 hours.
Information Contacts: Instituto Geofísico, Escuela Politécnica Nacional, Apartado 17-01-2759, Quito, Ecuador.
Continued frequent steam-and-ash explosions
The "yellow alert" status was uninterrupted as Guagua Pichincha expelled steam and ash throughout June. Explosions occurred on 31 May and on 1, 5, 6, 7, 8, 10, 11, 12, 13, 17, 24, 28, and 30 June. Explosions were more frequent in early-to mid-June, but the 28 June explosion was the largest in three months. A large explosion on 11 June sent a steam-and-ash column to ~5 km that lasted for about 5 minutes before dispersing to the south. Explosions were usually accompanied by long periods of tremor. A sulfur smell persisted throughout June and loud noises were also common. Steam frequently escaped to heights between 15 and 1,200 m from vents known as Alineadas, 1981 Crater, and Locomotora, along with those in the NW area of the summit. Alineadas discharged the highest plumes. Phreatic explosions as well as volcano-tectonic (VT), long-period (LP), and hybrid earthquakes occurred almost daily throughout June at levels similar to the last few months (figures 14 and 15). In addition to activity on the volcano, the seismic swarm N of Quito has altered. This may reflect changes in the regional stress field.
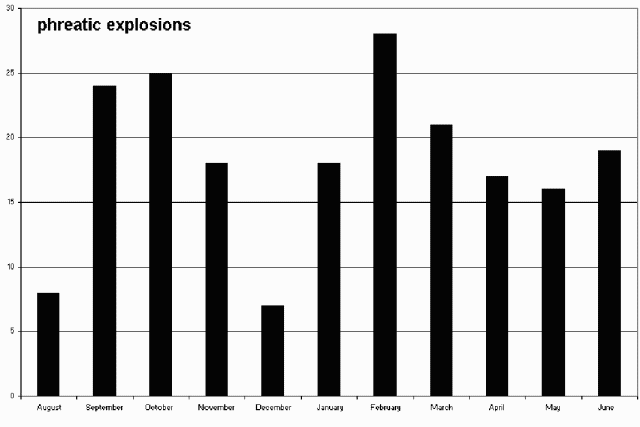 |
Figure 14. Monthly totals at Guagua Pichincha for phreatic explosions from August 1998 through June 1999. Courtesy of Instituto Geofisico. |
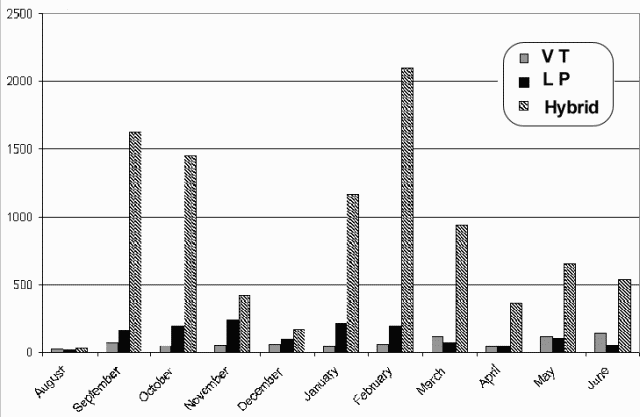 |
Figure 15. Monthly totals at Guagua Pichincha for seismic events (LP, VT, and hybrid) from August 1998 through June 1999. Courtesy of Instituto Geofisico. |
Information Contacts: Instituto Geofísico, Escuela Politécnica Nacional, Apartado 17-01-2759, Quito, Ecuador.
Phreatic explosions, seismic increases, and elevated hazard status
The Instituto de Geofísico reported that during the interval July through August, the 2-km-diameter, horse-shoe-shaped caldera at the summit of Guagua Pichincha continued to emit frequent steam-and-ash eruptions. The caldera contains an active dome, and fumaroles there typically sent visible steam plumes to heights of tens to hundreds of meters, and occasionally to about a kilometer. The SO2 flux on 1 July measured under 10 tons/day.
Near the end of the previous reporting period, on 26 June, a sequence of earthquakes was felt in the volcano's NE sector by residents of the N part of the Capital and in the town of San Antonio de Pichincha. Earthquakes with magnitudes over 3.9 caused alarm and concern in local populations.
On 8 July a park guard observing the crater area reported a new crater located in the NW sector of the 1981 explosion crater. Surrounding the crater for 20 m lay a deposit of reddish- yellow ejecta. The crater's initial diameter was 8 m but the next day it reached ~20 m. A few days later, on 11 July, observers saw into the crater and viewed 3 plumes escaping from new orifices arranged along a line in the NW part of the crater. The daily update on 15 July noted that reduced fumarolic activity enabled observers to see both a recent ash layer extending out to 200 m around the explosion crater and an accumulation of mud agglomerates on a terraced portion of the caldera. Similar observations of new intracrater deposits were also noted on 30 July. The headwaters of the westward-flowing Cristal river, which is monitored by both instruments and observers, acquired a coating of fine ash in early August. On 17 August the ash became mobile and contributed to mud flows of undisclosed size that proceeded down the river.
Daily reports mentioned occasional phreatic events. For example, two phreatic explosions took place on 3 July. The smaller had a reduced displacement (RD) of 5.3 cm2; the larger, 14.1 cm2 and sustained tremor for 40 minutes. The seismic sources for these explosions resided at 1-3 km depth below the caldera's E border. A phreatic explosion on 19 July was relatively small (RD of 4.3 cm2) but it was preceded by an hour of long-period earthquakes located beneath the town of Lloa (~12 km SSE of the caldera); 10 minutes prior to the explosion there were 7 volcano-tectonic earthquakes and one hybrid earthquake. The seismic signal associated with the event saturated the near-source seismic stations for ~40 minutes and tremor continued afterwards. Another small phreatic explosion took place on 26 July (RD, 3.2 cm2) and associated tremor prevailed for 10 hours. A large phreatic explosion on 2 August (RD, 21 cm2) vented at the recently formed intra-caldera crater E of the dome. The explosion sent a column up to ~ 2 km high despite strong winds. It was seen by residents of Quito.
Similar small phreatic explosions took place frequently during the rest of August. For example they occurred on 5 August, 7 August (RD, 2.3 cm2), twice on 10 August (RDs, 1.3 and 1.1 cm2, column reaching 1.5 km), 12 August (RD, 5.2 cm2), twice on 14 August (RDs, < 2 cm2), 16 August (RD, < 1 cm2), 19 August (RD, 3.7 cm2). Other small (and occasionally moderate) phreatic eruptions occurred on 24, 27, 28, and 29 August.
An unusually large phreatic eruption took place at 0807 on 21 August (RD, 21 cm2). The resulting steam plume rose to a height of 6 km and ash fell to the volcano's S. After the main explosion, smaller exhalations yielded a plume to a height of 3 km.
A comparatively large, violent, cinder-bearing emission occurred on 31 August; it rose to 3.5 km and blew W. The associated seismic source was in the W caldera at 1.7 km depth. The emission marked the end of an 8-day interval that included three relatively large expulsions.
During the July-August interval authorities maintained a yellow alert hazard status. Although this report does not otherwise discuss September events, it was learned at press time that on 27 September the hazard status was raised to orange (their second-to-highest rank, table 4). Residents began to evacuate the S-flank town of Lloa and its vicinity. On 28 September the newspaper Diario Hoy reported that from 0345 the previous morning seismicity intensified, reaching 2-3 earthquakes a minute. Press reports suggested that local scientists interpreted this ongoing seismic swarm (several thousand earthquakes) as a manifestation of rising magma. More details will be provided in a subsequent Bulletin.
Table 4. Hazard status at Guagua Pichincha (translated from a more detailed one posted on the Instituto's web site [26 October 1998 revision]). The status during July to late September remained at yellow; on 27 September authorities raised the hazard status to orange and began some evacuations.
| Alert | Level | Observations | Duration | Interpretation |
| White | 0 | Activity at background levels. | Centuries, decades, or years. | Non-eruptive repose. |
| White | 1 | Small increase over background in measured parameters. | Years, months. | Hydrothermal, magmatic, or tectonic disturbance(s) - No eruption imminent. |
| Yellow | 2 | Moderate increase in significant measured parameter(s) (seismic, temperature, phreatic eruptions, gases, deformation, etc.). | Months, weeks. | Possibly indicative of a magmatic intrusion that could lead to an eruption. |
| Yellow | 3 | Upscaling of earlier parameters; exit of gases, observed deformation. | Weeks, days. | Confirmed magmatic intrusion-possible eruption. |
| Orange | 4 | Intensive precursory activity that includes some combination of harmonic tremor, long-period earthquakes, accelerated deformation, dome growth, and explosions. | Days, hours. | Near-surface magma-probable explosive eruption. |
| Red | 5 | Eruption underway. | In progress. | Explosive eruption with the possibility of still more vigorous eruption(s) to follow. |
Information Contacts: Instituto Geofísico, Escuela Politécnica Nacional, Apartado 17-01-2759, Quito, Ecuador; and Diario Hoy ("Hoy Digital,", URL: http://www.hoy.com.ec/).
Magmatic outbursts; unprecedented seismicity; explosions up 2-fold
This report chiefly covers the turbulent period of 1 September through 19 October 1999. Histograms available on the Instituto Geofísico's website for the crisis interval through 31 October illustrated that September and October had a striking abundance of both phreatic explosions and earthquakes. The monthly explosion count for October 1999 (53 phreatic explosions) was almost double any other month during the crisis.
Despite the steep increases in explosions and earthquakes during September and October, non-explosive episodes were common during the reporting interval. They were marked with fumarolic emissions rising from a few meters to a few kilometers above the summit vent.
Microscopic inspection of tephra erupted on 30 August led researchers to conclude that the explosions to that point had continued to eject older, non-juvenile material. But John Ewert of the USGS noted that juvenile pumice of dacitic composition began to appear in deposits starting on 26 September. And, the comparatively large 5 and 7 October eruptions both contained similar juvenile pumice.
The intracrater dome, cold at the start of the crisis, began to grow by lava extrusion around 28 September. The volume of material extruded was small,3. The comparatively large eruptions on 5 and 7 October excavated part of the dome and sent pyroclastic flows 4-5 km down the W-flank into the Rio Cristal. Shortly after both events Ewert shot videos of their still-steaming deposits.
Earthquakes. Compared to the earlier stages of the crisis, the number of multiphase, volcano-tectonic, and long-period earthquakes grew sharply during September and October. For all three types, the highest numbers seen during the entire crisis interval (July 1998-October 1999) took place during October when multiphase earthquakes occurred 15,024 times, volcano-tectonic, 1,701 times, and long-period, 15,075 times. Omitting September 1999 and comparing the October 1999 earthquakes to the previous monthly highs during the crisis, one obtains the following: multiphase earthquakes underwent a 7-fold increase; volcano-tectonic earthquakes, a ~10-fold increase; and long-period earthquakes, an impressive ~70-fold increase. It was not just the numbers of events that rose. Seismic amplitudes at stations 7 to 9 km from the summit increased notably during September and October. Many of the earthquakes had depths between the surface and 6 km.
Eruptions. Table 5 provides an overview of some of the interval's larger outbursts. The one on 3 September yielded a reduced displacement (RD) of over 25 cm2. The event generated a plume to ~5.5 km altitude, which could be seen from Quito and included four distinct explosions (at 0723, 0726, 0743, and 0751). The plume dispersed after 30 minutes. Ash fall concentrated over the N flank. The next day, aerial observers noted that the 1981 crater had merged with another recent one, leaving a larger, roughly E-W trending crater in the vent area.
Table 5. Noteworthy explosions at Guagua Pichincha during 3 September through 19 October 1999. Cases shown are those where reduced displacements were stated in daily reports, with the exception of 7 October, for which the explosion's RD remained undisclosed. Plume heights were frequently undetermined due to restricted visibility (eg. darkness and clouds). Courtesy of the Instituto de Geofísico.
| Date | Reduced displacement (RD, cm2) | Estimated plume altitude (km) and displacement direction |
| 03 Sep 1999 | > 25 | 5.5 km |
| 07 Sep 1999 | > 21, < 5 | -- |
| 08 Sep 1999 | 22, 5 | ~ 2 km W |
| 09 Sep 1999 | 3 | -- |
| 12 Sep 1999 | 6, 18 | 4 km |
| 15 Sep 1999 | 20 | 4 km; W and N |
| 20 Sep 1999 | > 21 | 1.5-2.5 km |
| 22 Sep 1999 | > 21 | 5-6 km |
| 23 Sep 1999 | < 5 | -- |
| 24 Sep 1999 | > 21 | -- |
| 26 Sep 1999 | 21 | -- |
| 02 Oct 1999 | 1.4 | 4 km |
| 04 Oct 1999 | 12 | -- |
| 05 Oct 1999 | 36 | 8 km; E and W |
| 07 Oct 1999 | -- | 16.5 km; E and W |
| 09 Oct 1999 | 2.7 | -- |
| 13 Oct 1999 | 3 | -- |
| 15 Oct 1999 | 8.9 | -- |
| 16 Oct 1999 | 4.2 | -- |
| 18 Oct 1999 | 16 | 10 km |
| 19 Oct 1999 | 8.3 | -- |
The 26 September explosion was described as "important." The loud noise accompanying the early morning outburst (at 0315) awakened residents on the SSW flank in Lloa (see maps in BGVN 23:09). Ash fell over some areas; a lahar moved down the W flank Rio Cristal.
Eruption on 5 October. The explosion with the largest reduced displacement disclosed during the reporting interval (36 cm2) happened on 5 October; it was associated with an ash column to over 8 km altitude. The explosion vented on the caldera's W side; observers on the scene saw airborne material move SW and SE. In addition, the next day it was reported that ash thicknesses of 2 and 3 mm were found in central and N Quito as well as the settlement of Nono. Accumulated ash in other sectors (Mindo, Cumbayá, Tumbaco, Conocoto, El Tingo, Pomasqui, and Guayllabamba) reached only minor thicknesses. On the morning of 6 October, technicians visiting monitoring stations found ash-covered solar panels.
The 6 October issue of the newspaper Diario Hoy reported that the 5 October eruption took place at 1409, and that residents in S Quito heard the explosion. They also said that the resulting plume attained a height of 20 km. Diario Hoy further wrote that one hour after the audible sound, the first ash particles descended on N Quito, which became darkened by an enormous gray cloud. In four hours the cloud covered the city in a thick fog-like mantle; Marshal Sucre airport closed at 1730. The paper noted that Quito citizens would find their normal potable water supply intact. The news report added a comment by the mayor that this behavior could persist for months or even years. Although the news report, and other information around this time described the eruption as phreatic, tephra samples indicated the presence of juvenile pumice (mentioned above), indicating that the eruption was at least partly magmatic.
Observers on a flight at around 0800 on 6 October over the S part of the volcano confirmed extensive coverage of ash, but they saw vigorous, 3-km-tall fumarolic plumes-not ash plumes-being emitted. Ash hanging over Quito at that time was therefore assumed to mainly have resulted from earlier deposited ash remobilized by traffic and wind. The 5 October eruption column was captured on NOAA GOES-8 imagery, which can be viewed as a time-lapse animation, revealing some of the dynamics of the ash column (for URL, see discussion below). Portions of the rising column split into components directed E and W, forming what appeared as a dumbbell-shaped bifurcating plume. A plume on 7 October behaved in much the same way. In both cases, analysts attributed the bifurcation to wind shear.
Eruption on 7 October. Another comparatively large explosion took place the morning of 7 October (figure 16). Hugo Yepes, John Ewert, and Dan Miller of the Instituto and USGS accompanied Ecuador's president and members of the media on a flight just after the explosion. The pilot tried to approach the S flank but a curtain of falling ash prevented the occupants from seeing into the caldera. Ash fell over Quito, the Capital. The U.S. National Oceanographic and Atmospheric Administration (NOAA) reported that the plume rose to 16.5 km altitude.
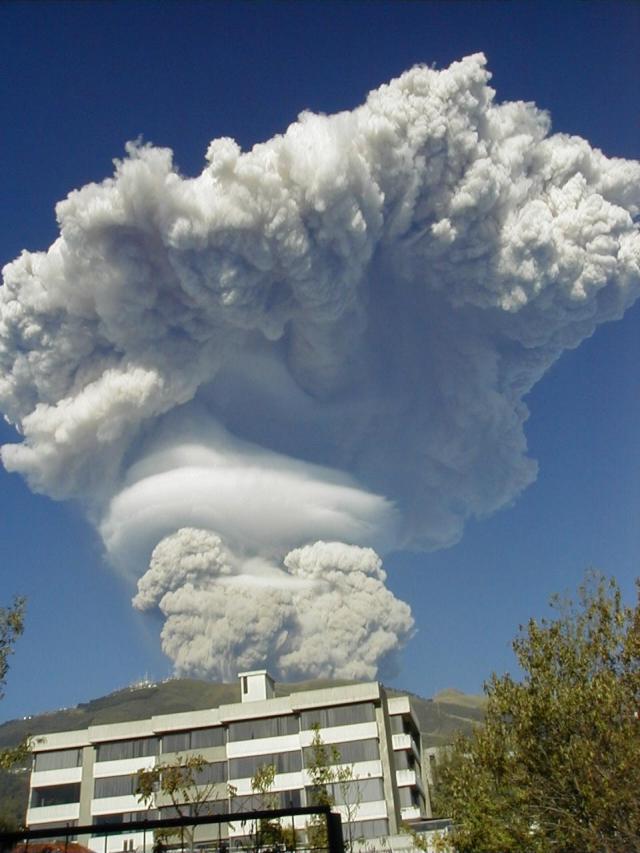 |
Figure 16. Guagua Pichincha's ascending ash plume at 0730 on 7 October 1999 as shot with a digital camera from the uplands of Quito. Pichincha's summit vent was ~ 11 km W, lying well behind the peak in the foreground. Courtesy of Arden and Debra Burgess. |
Regarding the 7 October explosion, the Diario Hoy's headline read "Guagua: A million tons of ash." The article went on to note that the Instituto estimated 1.1 x 10⁶ metric tons of ash lay within 15 km of the summit. Thicknesses of 1-3 mm accumulated in the northern parts of Quito. Ash clean-up proceeded within the city and at the airport. The article went on to caution that in a stronger eruption 5-10 cm of ash might fall on the city.
In similar manner to satellite images of the 5 October plume, those of the 7 October plume showed that it also bifurcated. Figure 17 shows GOES-8 visible imagery available on websites operated by both NOAA and the Cooperative Institute for Meteorological Satellite Studies (CIMSS) at the University of Wisconsin. An initial pre-eruption image was made at 0645 (1145 GMT) (not shown on figure 5); the image a half hour later showed the plume at an early stage. Due to variable wind shear with height, the advecting 7 October plume moved in two directions: the highest portion (~15 km in altitude) drifted W, away from Quito, while a lower portion (~12 km in altitude) drifted E over Quito.
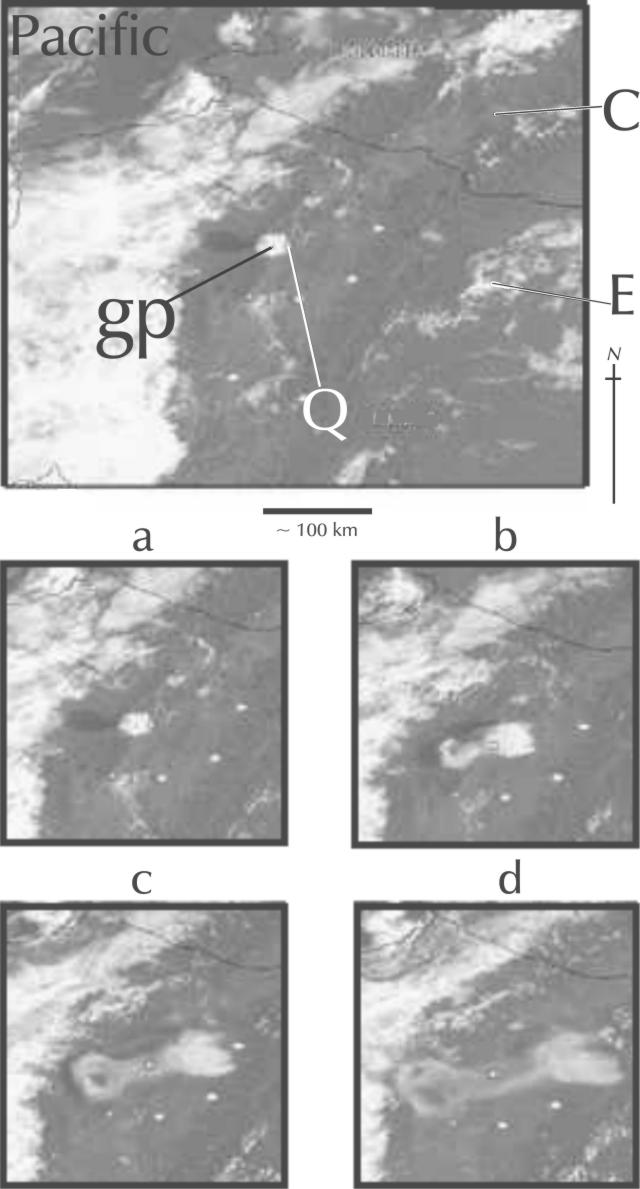 |
Figure 17. GOES-8 satellite images showing the dynamics of Guagua Pichincha's ascending 7 October plume. All images came from visible wavelengths; they are all similarly oriented and at identical scales although the upper image covers a larger area. The upper image shows the location of Guagua Pichincha (gp) and Quito (Q). Clouds on that image lay over parts of the Pacific Ocean and Ecuador (E), but N-central Ecuador and much of Colombia (C) remained unobscured. The first image (a) was taken directly from the larger one; both were captured at 0715 (1215 GMT). In the first image (a) the plume was compact and circular. The image at 0745 (b) shows the plume beginning to split into components directed W towards the Pacific, and E over Quito. The two components may have differed slightly in reflectivity. By 0815 (c), the plume had become decidedly dumb-bell shaped with the area above the volcano becoming relatively diffuse. The plume continued to spread at 0845 (d), where now the W component had also become diffuse. The eastern plume still sustained a relatively dense white color. These and associated images are displayed as time-lapse animations on NOAA and CIMSS websites (see URLS below). Courtesy of NOAA and CIMSS. |
Other processed views and animations of the 7 October plume dynamics were also available on the web. Scott Bachmeier at CIMSS posted an image prepared from GOES infrared (IR) data. He used a difference or "split window" technique that enhances the ash plume. Radiation escaping from a body can be described in terms of emissivity (emissive power). The emissivity of silicate particles within an ash plume varies with wavelength. This image processed the wavelengths 10.7 and 12.0 micrometers, which led to brightness temperature differences of 1-5 Kelvin. The IR difference product shows the ash plume very well initially; but later, the plume became thinner, losing its identity on the IR difference product images.
The eastern portion of the 7 October ash plume was tracked for a longer time on the GOES 6.7 micrometer IR ("water vapor") channel. Due to the generally dry middle and upper troposphere over northern South America that day, the water vapor content in the higher plume created a discernible contrast that drifted eastward across Ecuador toward Colombia and Perú.
John Ewert took videos of the plume's dynamics, as seen from the ground. From that perspective the ascending plume appeared to have a strong rotational component. He also noted that these plumes' behaviors were hard to forecast from available wind data.
Background. On September 27, the Mayor of Quito closed schools and raised the alert from yellow to orange signifying a possible eruption within days (BGVN 24:08). About a week later the character of the alerts was revised to become more local in scope. For example, on the W flank, small settlements incorporating about 60 families along the Rio Cristal were evacuated and the status there stood at the highest level, red. The SSW flank city of Lloa remained at orange alert; and in Quito, it returned to yellow where it remained throughout the reporting period, including during times of ashfall.
During early October, the U.S. State Department issued these statements: "Geological experts conclude that the city of Quito is protected from possible lava flows, avalanches, and lateral explosions by the bulk of Pichincha Mountain, which stands between the city and the volcano crater. Parts of Quito could be affected by secondary mud flows caused by heavy rains that usually accompany an eruption. The entire city could also be affected by slight to significant ash falls and resulting disruptions of water, power, communications, and transportation. According to geological experts, lava flows, ash falls, avalanches, and lateral explosions would almost certainly head W and SW from the volcano, in the direction of three small communities, Lloa, Mindo, and Nono, popular destinations for birdwatchers. Travelers should avoid these towns."
In addition to Guagua Pichincha, a second volcanic crisis has developed at Tungurahua. Volcanological and geophysical colleagues from multiple countries have participated, or continue to collaborate in instrumenting and monitoring these crises. In the midst of these events Ecuador's economy has undergone a serious downturn with the currency recently declining in value by more than 50%.
Information Contacts: Instituto Geofísico (URL: http://www.igepn.edu.ec/); John Ewert, Volcano Disaster Assistance Team (VDAP), United States Geologic Survey (USGS), Cascades Volcano Observatory, 5400 MacArthur Blvd., Vancouver, WA 98661 USA (URL: https://volcanoes.usgs.gov/observatories/cvo/); Diario Hoy ("Hoy Digital,", URL: http://www.hoy.com.ec/); Arden and Debra Burgess, Centro Aereo 1Q1702, P.O. Box 02-5268, Miami, FL 33102-5268 USA; NOAA/NESDIS Operational Significant Event Imagery Support Team, E/SP22, 5200 Auth Road, Camp Springs, MD 20746-4304 USA (URL: https://www.nnvl.noaa.gov/); Scott Bachmeier, Cooperative Institute for Meteorological Satellite Studies (CIMSS), University of Wisconsin, 1225 West Dayton St., Madison, WI 53706 USA (URL: http://cimss.ssec.wisc.edu/).
A growing dome, high seismicity, and wind-assessment challenges
This report covers 20 October through 21 November 1999, an interval when the new, still-emerging dome exceeded half the height of the adjacent 1660 dome, and in addition extruded a 75-m-tall spine. Seismic records through 31 October illustrated that September and October had a striking abundance of both earthquakes and phreatic explosions (figures 18 and 19). In contrast to September and the first two-thirds of October (BGVN 24:09), during this interval explosions were comparatively rare (table 6).
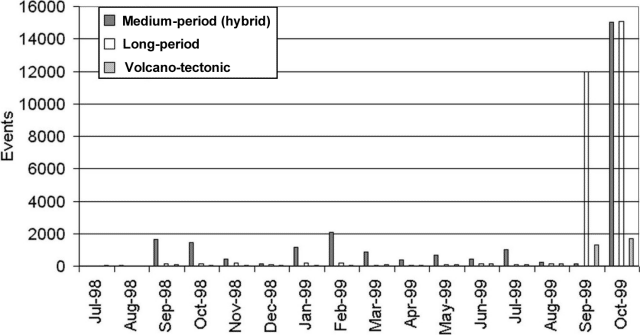 |
Figure 18. The number of monthly earthquakes at Guagua Pichincha during July 1998-October 1999. Earthquakes are reported in three categories (shown left-to-right for each month): medium-period (hybrid), long-period, and volcano-tectonic. For July 1998, registered events in these categories were 0, 8, and 45, respectively. Hybrid earthquakes generally dominated the record until September 1998 when the long-period earthquakes became most common. Hybrid earthquakes, typically found at less than 3 km depth below the caldera, are here defined as having noteworthy spectral energy at both 1.8-2 Hz and 3-6 Hz, with the higher frequency particularly conspicuous in the early arrival portion of the record. Volcano-tectonic earthquakes only appear for September and October 1999 at this scale. Courtesy of the Geophysical Institute. |
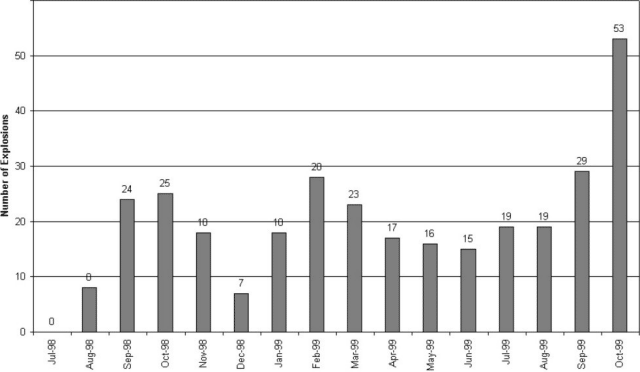 |
Figure 19. The number of monthly explosions at Guagua Pichincha, July 1998-October 1999. Courtesy of the Geophysical Institute. |
Table 6. A summary of 20 October-21 November events at Guagua Pichincha as conveyed in the Geophysical Institute's daily reports. Unless noted otherwise, the stated plume and column heights (e.g. "1.5 km plume") refer to the distance from the plume's base to its top. Courtesy of the Geophysical Institute.
| Date | Explosions | Estimated plume heights and other comments |
| 20 Oct 1999 | 0 | -- |
| 21 Oct 1999 | 0 | An overflight took place and surficial evidence of dome building was noted |
| 22 Oct 1999 | 0 | Strong fumarolic activity seen and heard, steam rising to ~1.5-2 km |
| 23 Oct 1999 | 0 | 2-km steam plume |
| 24 Oct 1999 | 0 | 1.5-km steam plume |
| 25 Oct 1999 | 0 | 1.6-km steam plume |
| 26 Oct 1999 | 0 | 2.5-km steam plume; aerial observers found evidence of continued venting of tephra |
| 27 Oct 1999 | 0 | 1.5-km steam plume |
| 28 Oct 1999 | 0 | Red tephra covering caldera; slight growth and plentiful fractures noted in dome area; COSPEC measurements failed to show important variations (values unreported) |
| 29 Oct 1999 | 0 | 1.2-km high plumes bearing wind-blown ash; low fumarolic activity |
| 30 Oct 1999 | 0 | Ongoing dome growth; limited fumarolic activity |
| 31 Oct 1999 | 0 | Rockfalls in the dome area; limited fumarolic activity |
| 01 Nov 1999 | 0 | Plume to 1.3 km; some plumes appeared tinted blue or red |
| 02 Nov 1999 | 0 | Plume to under 1 km; an infrared camera indicated a source of high heat flux in the dome area. |
| 03 Nov 1999 | 0 | Steam plume to under 1 km; low fumarolic emission rates |
| 04 Nov 1999 | 0 | Reddish gray fumarolic plume to 1.2-1.3 km; rocks sliding off dome's carapace to W |
| 05 Nov 1999 | 0 | -- |
| 06 Nov 1999 | 0 | Cloudy, but an observer heard noises attributed to avalanches |
| 07 Nov 1999 | 0 | New growth recognized on the active dome, which rose ~ 10 m above the middle of the 1660 dome. |
| 08 Nov 1999 | 0 | -- |
| 09 Nov 1999 | 0 | Degassing vapor appeared gray and occasionally earth-toned in color as it rose ~ 800 m. The dome extrusion included a 75-m-tall spine. |
| 10 Nov 1999 | 1 | Small explosion; fumarolic plumes rose to ~1.5 km |
| 11 Nov 1999 | 0 | -- |
| 12 Nov 1999 | -- | Not posted |
| 13 Nov 1999 | -- | The depression hosting the new dome had increased in diameter; materials detached from both the new dome and its spine. |
| 14 Nov 1999 | 0 | Low fumarolic activity |
| 15 Nov 1999 | 0 | Rapid dome growth continued; 2 km tall column incorporating dust from an intracrater landslide |
| 16 Nov 1999 | 0 | -- |
| 17 Nov 1999 | 16 | Explosion signals. The most important explosion signals had reduced displacements of 13 and 26 cm2. The weather was cloudy, with abundant airborne ash; the official press release noted that during the afternoon a light gray ash column attained an altitude of 5 km, but the text stated the column only contained a minor ash component. |
| 18 Nov 1999 | 1 | This eruption took place at 2126 and had a reduced displacement of 18 cm2. The resulting plume rose to an altitude of 9 km. |
| 19 Nov 1999 | 0 | 1.2-km-high fumarolic plume |
| 20 Nov 1999 | 0 | Cloudy |
| 21 Nov 1999 | 0 | Cloudy |
Reports and observations of dome growth were sporadic, interrupted by bad weather and the difficulty of monitoring the intracrater area. On 21 October dome material extruded at a spot W of the 1660 dome. Mid-November reports repeatedly noted rapid dome growth, although this was occasionally offset by intervals with abundant mass-wasting. The daily report on 4 November noted that the cumulative energy from long-period earthquakes was larger than that seen prior to the 5 October eruption. Substantial, though not necessarily larger, outbursts occured after 21 November.
Data from the Geophysical Institute indicated that robust seismicity continued through much of November. There were more total earthquakes in November than in either September or October. The biggest differences occurred in long-period and medium-period (hybrid) earthquakes, both of which rose substantially in November and dominated the number of earthquakes registered in September-October (figure 1). Four November days had long-period earthquake peaks equivalent to or larger than the daily number seen in October. The number of hybrid earthquakes fell in the last week of October, but considerable numbers continued through about 10 November. Volcano-tectonic earthquakes peaked in October. Rockfalls also peaked in October but a second, broader peak occurred into November.
Winds aloft. The morphology of the volcano, its proximity to Quito, and deposits from previous eruptive episodes suggest airborne ash as a key hazard. To forecast when ash will fall in Quito requires knowing the local winds from the altitude of the volcano to the top of the ash column.
According to John Ewert, historical wind data were obtained from reports by the Civil Aviation Agency (Direccion De Aviacion Civil, DAC), which were summarized in Barberi and others (1992). Useful as background for planning purposes, these historical records are less relevant than actual wind velocity data at the time of the eruption. Daily wind directions are reported by NOAA, derived in part from automated routines that track cloud and water vapor drift on Geostationary Operational Environmental Satellite (GOES) images. Such data are fairly accurate for the troposphere, but at least one of the larger eruptions in early October penetrated through the troposphere and entered the stratosphere at ~11 km. But, obtaining stratospheric wind data has proven difficult.
Some relevant wind field observations can come from aviators in aircraft equipped with suitable navigation instruments. Accordingly, scientists suggested this to the Ecuadorian Civil Aviation agency, who requested that pilots in the area call in their GPS-derived cockpit wind measurements. Although this has been helpful for understanding the local tropospheric winds, it still left the higher altitudes winds uncharted.
On their website, the Geophysical Institute has posted wind data derived from atmospheric wind measurements by radiosondes ("weather balloons") launched from the critical region of interest and penetrating well into the stratosphere (to altitudes over ~30 km)-but these were unavailable in early October. At the Instituto's request, the U.S. Office of Federal Disaster Assistance provided funding for a U.S. Air Force meteorological team to travel to Ecuador to work with the Ecuadoran Meteorological Institute (INAMHI) and the Civil Aviation Agency to better define the local wind fields. The Air Force team repeatedly conducted the highly desirable radiosonde measurements. Ewert said the Air Force team returned to the U.S., so he was not sure how long such radiosondes probes would continue.
In early October, Ewert tried to obtain realistic models of plume drift to understand the dispersal of potential large ash columns at Pichincha. He did so using the Volcanic Ash Forecast Transport And Dispersion (VAFTAD) model that was developed by NOAA's Air Resources Laboratory (Heffter and Stunder, 1993) to support the Washington and Anchorage Volcanic Ash Advisory Centers (VAACs). Ewert gained access to the model using the NOAA web site. The site contains VAFTAD model output issued by NOAA in response to individual eruptions.
VAFTAD uses output from the NOAA global meteorological model. Grid dimensions vary with latitude; near the equator the horizontal grid is ~100 km to a side (farther towards the poles at 60 degrees latitude, ~190 km to a side). The concentration grid dimensions are set to half the size of the horizontal grid (i.e. ~50 km to a side near the equator). Given these dimensions, its not surprising that Ewert found VAFTAD only marginally effective for comprehension of ash dispersal in areas immediately adjacent Pichincha (and Tungurahua). What is needed is a more local-scale modeling capability for Pichincha based on an understanding of the local-scale 3-D meteorology. According to atmospheric modeler J. L. Heffter, serious modeling challenges in South America also include the effects of terrain, local air flow patterns, and a broad scarcity of meteorological data. In the absence of such models, Ewert concluded that the local radiosonde data was the best practical solution for gauging the velocity of winds aloft. Atmospheric modeler Barbara Stunder of NOAA also concluded that local radiosonde data extrapolated out a few hours may give a sufficient forecast of transport velocity.
On their Real-time Environmental Applications and Display sYstem (READY) website, NOAA displays regular VAFTAD forecasts for hypothetical eruptions for planning purposes. These include dispersal models for Pichincha, and 10 other recently active volcanoes (Augustine, Colima, Fuego, Kliuchevskoi, Pacaya, Pavlof, Popocatépetl, Shishaldin, Soufriere Hills, and Tungurahua). These models are run automatically once a day and the resulting plume forecasts appear on charts. In addition, from this same website, users can run the VAFTAD model for volcanic eruptions at any location.
As a historical note, during the Cook Inlet eruptions, NOAA's forecast wind field data were accessed using a personal computer to print out projected trajectories. In the case of the 24 February 1990 eruption of Redoubt, which reached ~8.5 km altitude, the actual ground deposit was surprisingly close to the relevant projected trajectories (Murray and others, 1994). Currently, the Canadian Volcanic Ash Advisory Center (VAAC) provides a web-accessible, real-time trajectory modeling routine for selected volcanoes on North America and elsewhere.
References. Barberi, F., Ghigliotti, M., Macedonio, G., Orellana H., Pareschi M.T., and Rosi, M., 1992, Volcanic hazard assessment of Guagua Pichincha (Ecuador) based on past behavior and numerical models: Journal of Volcanology and Geothermal Research, v. 49, no. 1-2, p. 53-68.
Heffter, J.L., and Stunder, B.J.B, 1993, Volcanic Ash Forecast Transport And Dispersion (VAFTAD) model: Weather Forecasting, v. 8, p. 534-541.
Murray, T.L., Bauer, C.I., and Paskievitch, J.F., 1994, Using a personal computer to obtain predicted plume trajectories during the 1989-90 eruption of Redoubt Volcano, Alaska: in USGS Bulletin 2047-Volcanic Ash and Aviation Safety, p. 253-256.
Information Contacts: Geophysical Institute (Instituto Geofísico), Escuela Politécnica Nacional, Apartado 17-01-2759, Quito, Ecuador; John Ewert, Volcano Disaster Assistance Team (VDAP), United States Geologic Survey (USGS), Cascades Volcano Observatory, 5400 MacArthur Blvd., Vancouver, WA 98661 USA (URL: https://volcanoes.usgs.gov/observatories/cvo/); Barbara Stunder, NOAA Air Resources Laboratory (ARL), 3rd Floor, 1315 East-West Highway, Silver Spring, MD 20910 USA (URL: http://www.arl.noaa.gov/); NOAA/NESDIS Operational Significant Event Imagery Support Team, E/SP22, 5200 Auth Road, Camp Springs, MD 20746-4304 USA (URL: https://www.nnvl.noaa.gov/); Montreal Volcanic Ash Advisory Centre, Operations Branch, Canadian Meteorological Centre, 2121 Voie de Service Nord, Route Transcanadienne, Dorval, Québec H9P 1J3, Canada (URL: http://www.cmc.ec.gc.ca/cmc/cmoe/vaac/A-vaac.html).
Dome growth and explosive eruptions; dramatic increase in LP earthquakes
This report covers 22 November through 24 December 1999, an interval when long-period earthquakes increased precipitously. The dome in the caldera's western sector continued to produce explosions, lava extrusions, and rockfalls. November 1999 marked the 32nd month since the unrest began; occasional ashfalls and associated disruptions (minor ashfall, airport closures, hundreds of evacuated refugees) have had a significant impact on Quito residents.
Seismicity. Earthquake hypocenter maps appearing on the Geophysical Institute's website showed the vast majority of earthquakes clustering beneath the crater area; in some cases these clusters also spread W with gradually decreasing density. The website also included a diagrammatic cross section through the crater (figure 20) illustrating the inferred plumbing system, including some typical depths for various kinds of earthquakes. On the inset, the diagram shows an inferred shallow aquifer within the edifice that intersects the active conduit and presumably contributes to the repeated phreatic eruptions.
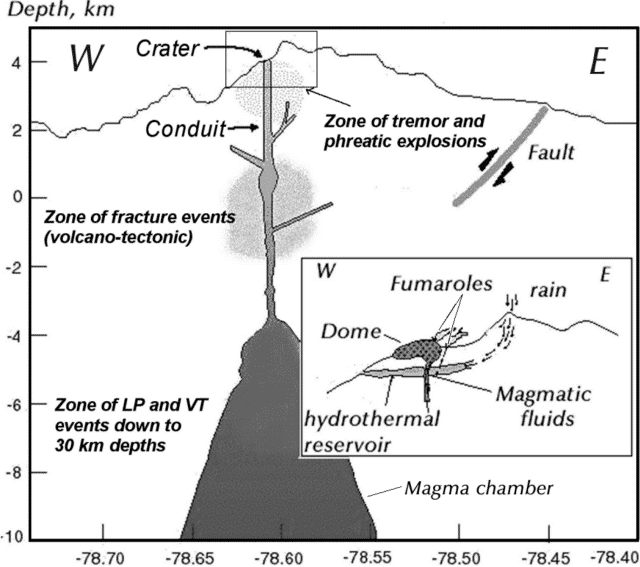 |
Figure 20. A diagrammatic E-W cross-section through the crater at Guagua Pichincha. The cross-section is intended to show the overall internal structure and the zones where the main kinds of earthquakes seen during the crisis have typically originated. The scale across the bottom of the main diagram corresponds to a local coordinate system; the one along the left side of the main diagram indicates depth with respect to sea level (0 km). The inset contains an enlarged view of the crater area. Courtesy of the Geophysical Institute. |
During November 1999 phreatic explosions took place 41 times. Many months during the crisis had fewer than 20 explosions per month, and the November 1999 value was the second highest of the crisis. The highest monthly total occurred during October 1999, a count of 53 explosions.
Seismicity had been escalating rapidly during September-October 1999 (see plot, BGVN 24:10). A precipitous climb in long-period (LP) earthquakes continued during November, reaching dramatic levels (table 7); in September long-period earthquakes occurred ~12,000 times, in October ~15,000 times, and in November ~44,000 times. For another comparison, LP counts earlier in the crisis (July 1998-August 1999) generally remained below 200 earthquakes per month. Thus, compared to this broader interval, the November 1999 count of LP events reflected more than a 200-fold increase. In addition, November's LP earthquakes exceeded the sum for LP events during the previous 16 months.
Table 7. Monthly earthquake counts at Guagua Pichincha representing two key time intervals. The "upper threshold" refers to the highest values registered during the earlier parts of the crisis, July 1998-August 1999. The next three columns indicate the monthly counts during September-November 1999, an interval with the highest numbers of earthquakes yet seen during the current crisis. Courtesy of the Geophysical Institute.
| Earthquake Type | Earlier upper threshold | Sep 1999 | Oct 1999 | Nov 1999 |
| Long-period (LP) | 200 | 11,972 | 15,075 | 43,738 |
| Multi-phase (MP) | 2,099 | 130 | 15,024 | 6,182 |
| Volcano-tectonic (VT) | 160 | 1,331 | 1,701 | 104 |
| Sum (LP + MP) | 12,102 | 30,099 | 49,920 | -- |
A change in the relative numbers of events appears to have occurred beginning in September 1999. From then on, LP events occurred with either similar abundance to MP events, or in some cases LP events became dominant. The total of MP plus LP events (table 2) continued to increase through November 1999.
On the other hand, the escalation in Multiphase (MP) and volcano-tectonic (VT) earthquakes has diminished since the anomalously high values seen in September and October 1999 (table 7, and BGVN 24:10). Compared to earlier in this crisis, MP earthquake counts underwent a sudden peak in October at ~15,000 events; in November there were ~6,000 MP events. VT earthquake counts underwent a less pronounced peak in September and October with ~1,300 and ~1,700 respective events. November VT earthquakes totaled only 104, a value still within the upper end of the monthly counts seen for the bulk of the crisis.
As a result of ongoing dome growth, rockfall-associated seismicity increased. The highest days in September-November had daily LP counts of 250-300 per day. Peaks in dome-growth events approached or exceeded 100 events/day for sustained intervals both during early October and late November 1999.
Daily observations. Tens of daily phreatic explosions were common. Counted seismically, these events appeared so numerous that generally only large ones received much mention in the daily reports (summarized in table 8). On many days visibility into the caldera remained limited because of clouds and fog.
Table 8. Summary of the more important explosions reported at Guagua Pichincha during 22 November-22 December 1999. The explosions discussed here were selected by choosing the Institute's daily reports where the seismically determined parameter of reduced displacement (RD) was reported. Courtesy of the Geophysical Institute.
| Date | Reduced displacement (RD) and related activity and impacts |
| 24 Nov 1999 | Two important explosions, the first of which at 0328 led to ashfall in N Quito visible on clean surfaces such as the exteriors of vehicles. The second explosion took place at 1233 with a RD of 17.7 cm2. The second sent a column to 10 km altitude blowing E (towards Quito). Ash fell (see text). The 1233 explosion vented from the W caldera margin; the associated seismic signal was shallow, 0.9 km. An additional four disturbances occurred between 0840 and 0906 associated with collapse of rocks and consequent emissions in the new dome's W sector; the plumes related to these events rose ~2 km. Still other explosions noted this day had variable RDs: 12.9, 11.8, 2.4, and 1.0 cm2. |
| 25 Nov 1999 | Ash fell on N Quito after explosions at 0528 and 2027 with respective RDs of 15 and 25 cm2. |
| 26 Nov 1999 | An emission with RD of 4.6 cm2 issued an ash-laden column that rose 2 km and dispersed to the SE. |
| 27 Nov 1999 | An emission at 2114 had a RD of 19.6 cm2 and sent an ash column more than 2 km upward; it blew to the W and SW. Heavy cloud cover made it hard to observe the plume, however. Some ash fall was reported in Quito. |
| 29 Nov 1999 | An eruption at 1134 had a RD of 18.9 cm2 and sent an ash column to ~8 km. The next day field crews found block-and-ash flows and mud flows deposited by this eruption on the W flank in the Rio Cristal. |
| 02 Dec 1999 | Two series of explosions took place, the first during 1723-1800 and the second, 2013-2200. An explosion at 2200 had the larger RD, 27.2 cm2. Although clouds obscured the crater, these explosions were thought to have been very destructive to the new dome. |
| 09 Dec 1999 | An eruption with RD of 12 cm2 was termed small; it followed a 10.5-hour interval with 15 eruption signals. |
| 10 Dec 1999 | An explosion with a RD of 26.6 cm2 and subsequent discovery of new pyroclastic flow deposits along the Rio Cristal. Later, at 1713, an explosion with RD of 18 cm2 sent a column to ~7.6 km altitude that was blown to the W and SW. |
| 11 Dec 1999 | Three RDs reported, 15, 16, and 12 cm2, produced by explosions in the early morning hours. Portions of the collapsed dome descended the Rio Cristal and there was some fracturing within the crater's older and newer domes. |
| 14 Dec 1999 | Several small explosions with RDs under 6 cm2. Rockfall seismic signals were common. |
| 15-16 Dec 1999 | Comparatively low-energy explosions with RDs under 4 cm2. |
| 17 Dec 1999 | Three morning explosions after 0730 with successive RDs of 15.5, 23, and 20 cm2. A white mushroom cloud rose to ~8 km altitude above the volcano. Beginning about 1000 a light rain of ash fell on Quito, particularly the north and central parts of the city. The airport shut down in the morning but reopened after 1310. On the W flank mudflows had been spotted carrying blocks up to 3 m in diameter. An additional press release noted a large eruption at 1504 with an RD of 24 cm2 and a resulting column to 8 km above the summit. This was followed by a larger eruption at 1627 with an RD of 28 cm2. By a small margin, this ranked as the largest RD of the reporting interval. After the former eruption close to 14 hours of continuous tremor began. Available wind data around the time of these eruptions suggested that some ash would fall on the Capital, and the next day's report noted light ashfall (thickness unstated but probably under a few millimeters) of fine pumiceous ash in Quito's northern and central zones; on the flanks of the edifice there were tephra clasts of 2-5 cm diameter. |
| 19 Dec 1999 | Minor explosions with RDs under 3 cm2. |
Two explosions on 24 November resulted in significant ashfall on inhabited areas. The latter explosion, around noon, sent a plume to 10 km altitude. Fine ash fell in areas N of Quito, blanketing zones that included the airport, which closed. The ash also affected numerous settlements within a few tens of kilometers N to NE of the summit (including Carcelén, 14.5 km NE; Cotocollao, 9.4 km N; Quito Tenis, 13.5 km NE; and at locations not found on available maps, at la Roldós, La Carolina, Mariscal, and el Ejido). The greatest thicknesses of ash reportedly fell between Jipijapa (unlocated) and la Mariana de Jesús (20.9 km NE).
More events took place the next day, and in the morning ashfalls were reported in Quito's northwestern neighborhoods. The ash lingered in the air well into the next day as a result of disturbances by traffic and cleanup.
An inspection of the W flank on 24 November revealed that during the past week the Cristal river had been inundated by lahars 400 m wide and 10 m deep, although the point of measurement was at an unstated distance from the summit. They were still hot, at least in places, and contained some component of pyroclastic flows bearing carbonized tree-trunks in addition to blocks from the dome. On 30 November observers visiting the Cristal river noted a 1-day-old block-and-ashflow deposit. In the same sector on 8 and 10 December field crews again linked observed zones of burned and singed leaves to probable pyroclastic flows.
On 17 December a white mushroom cloud preceded a dark, ash-bearing one that rose 8-9 km above the volcano. On 18 December, light ash again fell on Quito landing mainly in its central and northern zones. Portions of the cone's flanks received pumice 2-5 cm in diameter. Strong sulfur smells were noted by S-flank residents in Lloa.
An overflight on 21 December enabled the dome height to be estimated at 50-100 m from the base of the caldera. On the dome's W side observers identified a spine, possibly the same one as seen in November. Dark coffee-colored rocks were observed along the E margin of the new dome.
GOES-8 satellite imagery captured plumes on several occasions. For example, it recorded an explosion at about 1140 on 29 November. NOAA analysts estimated the ash plume rose to an altitude of 10-12 km and drifted S toward Tungurahua volcano (which was also producing a faint ash plume). The same ash plume was noted using the "split window" technique, wherein infrared channel 5 (13 µm) is subtracted from infrared channel 4 (11 µm), which often discriminates airborne silicates such as dust and volcanic ash from other features in an image.
During comparatively passive intervals with adequate visibility, daily reports typically described several distinct plumes emitted from the following sources: a) the "aligned" fumaroles (in Spanish, "las alineadas"), b) the fumaroles on the caldera's W border near the head of the Cristal river, c) fumaroles escaping from the 1981 crater, and d) emissions from the top of the new dome. Fumaroles designated as "a" and "b" had plumes that typically reached several hundred meters from base to top; "c" fumaroles typically had plumes that reached tens of meter from base to top.
Radiosondes. According to the Washington Volcanic Ash Advisory Center at NOAA's Satellite Analysis Branch (SAB), during late 1999 and early 2000 authorities in Quito have been launching weather balloons twice a day. The resulting upper atmospheric air movements generally appear on the Geophysical Institute's website. Because these data have been occasionally internally inconsistent in azimuth, they have not yet been incorporated into the modeled data nor the plume trajectory modeling. The SAB has repeatedly seen highly variable winds in the region.
News reports. A brief review of news reports during the past few months revealed numerous stories, some of which were listed on an Ecuadorian Embassy website. ABC News discussed the effects on the explosions of 5-7 October (BGVN 24:09); previously unmentioned in the Bulletin was that the explosion of 5 October caused respiratory problems for many area residents and the death of one man. Four others were injured clearing ash from the roofs of their homes. Quito's Marshal Sucre airport closed for multiple days during the crisis. This not only causes travel problems, but inevitably some commercial aircraft that remain on the ground require cleaning to regain flight worthiness. ABC News also reported that the 24-26 November eruptions that forced one closure of the airport had also caused the Ministry of Education to shut down schools for a few days.
A series of 17-22 November articles in the online Diario Hoy newspaper discussed conditions confronted by 500 refugees from Lloa and neighboring areas living in the largest of several tent cities in a pass above their town. The tent city's amenities included electrical power, water, bathroom facilities, and trash collection; tents came equipped with stoves and beds. The city also provided medical and dental services. Other tent cities provided refuge for ~300 more people. Guards limited access into Lloa, and the town itself was patrolled by the military.
Hoy Digital reported that Quito's mayor, Roque Sevilla, delivered Motorola radios to each one of the leaders of the 35 neighborhoods located on the volcano's slopes as a means of maintaining constant communication with the emergency system locally referred to as "911." The article also mentioned a project developed with the support of the German embassy and the firm Siemens that consists of a system of warning sirens intended to alert citizens of impending danger.
Information Contacts: Geophysical Institute (Instituto Geofísico), Escuela Politécnica Nacional, Apartado 17-01-2759, Quito, Ecuador; Embassy of Ecuador, 2535 15th Street NW, Washington, D.C. 20009 USA (URL: http://www.ecuador.org/); Washington Volcanic Ash Advisory Center, NOAA Satellite Services Division, NESDIS E/SP23, NOAA Science Center, Room 401, 5200 Auth Road, Camp Springs, MD 20746, USA (URL: http://www.ssd.noaa.gov/); ABC News (URL: http://abcnews.go.com/); Diario Hoy, Ecuador (URL: http://www.hoy.com.ec/).
Ongoing dome growth; lahar hazards; 1999 summary
This report covers 25 December 1999 through 15 January 2000. The Geophysical Institute released a summary of activity for 1999 as well as a hazards map of Quito showing the likely areas where lahars might enter the city (figure 21). The lahars are expected to chiefly consist of redistributed tephra originally laid down as airfall ash deposits. The map will enable authorities to better understand the likely areas of impact so that they may create plans for lahar cleanup.
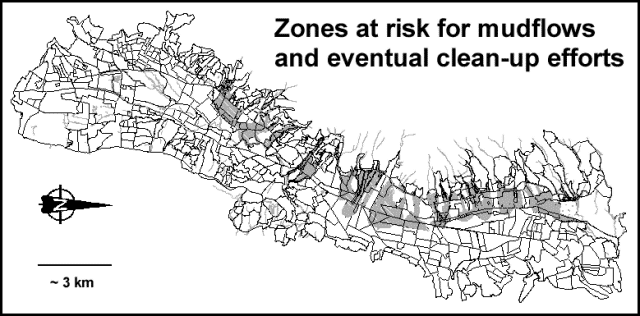 |
Figure 21. A map illustrating a crucial hazard envisioned for Quito-remobilized tephra from Guagua Pichincha eruptions that travel downslope as lahars (shaded areas). Quito, particularly southern Quito, gains protection from a natural barrier formed by the intervening Ungui-El Cinto ridge (which lies along the W margin of the city, i.e. at the top of the figure). The geometry of this barrier accounts for the lack of lahar hazard zones in the southern part of the city. The original map, taken from the Instituto's web site, used color shading and a series of enlarged maps to indicate four levels of hazard (reduced here to one solid gray shading). In addition, streams on the original map appeared in blue and many thus remained distinct from the various hazard designations. Courtesy of the Geophysical Institute. |
Summary of activity during 1999. Activity during 1999 can be divided into two phases: phreatic and magmatic (table 1). The phreatic phase lasted until 23 September. Besides phreatic eruptions it included seismic swarms below the crater and earthquakes felt in Quito. Other differences between the two phases appear on table 9. The largest explosions of the phreatic phase took place on 28 January, 19 and 28 February, 19 May, 28 June, and 24 August. Before July, the phreatic outbursts came from the eastern sector of the 1660 dome; afterwards the sources for the outbursts moved progressively westward, creating new cracks and craters. After August, phreatic explosions gained strength and increased in juvenile ash content, presumably corresponding to the demise of the plug within the conduit.
Table 9. Summary of seismic events during the 1999 phreatic and magmatic phases of activity. Courtesy of the Geophysical Institute.
| Phase | VT | LP | Hybrid | Lloa hybrid | Explosions | Rockfalls | Felt in Quito |
| Phreatic | 1,710 | 1,266 | 45 | 7,524 | 178 | -- | 1,355 |
| Magmatic | 2,520 | 87,055 | 7 | 24,206 | 140 | 3,255 | 132 |
In the magmatic phase eruptions alternately caused growth and destruction of a series of numbered domes (dome 1, dome 2, etc.). The largest explosions during the magmatic phase of 1999 took place on 26 September, 5 October, 26 November, and 3 December.
During October 1999, Guagua Pichincha had the highest number of daily explosions (53) and the first substantial magmatic eruption. Between 2 and 3 October low-level seismicity prevailed, but with increased rockfalls. Slow dome growth and fewer explosions convinced authorities to return to a lower hazard status (to Yellow Alert). Then, on 5 October, came the first substantial eruption to emit juvenile ash-the resulting column rose to 18 km altitude and dispersed NE with some ash landing on Quito and the plume traveling towards Colombia. After a brief hiatus, another eruption occurred on 7 October, this time failing to drop significant ash on Quito.
Seismicity increased after 20 October, peaking during 27 October-8 November at over 3,000 earthquakes a day, in harmony with new dome growth. November surpassed other months in number of earthquakes (43,738).
The destruction of dome 2 occurred on 10 November. A corresponding decrease in seismicity followed, averaging 800 daily earthquakes. Dome 3 was destroyed on 17 November and seismicity afterwards reached 600-700 earthquakes/day. Dome 4 grew next but was subsequently destroyed on 26 November, associated with ashfall on Quito. On 1 December earthquakes reached their peak at 5,000/day. Dome 5 grew next; it was destroyed two days later on 3 December associated with ashfall on Quito. Seismicity next averaged 500 events a day and domes 6 and 7 grew and were destroyed on 10 and 17 December. After the latter event, seismicity dropped considerably, reaching averages of 30 events/day until 31 December. Visual observations, however, disclosed a new batch of magma rising comparatively aseismically, presumably because its conduit offered less resistance to flow. At the time the annual summary was prepared, dome 8 had remained intact for at least a week, possibly surviving into the new year.
Daily reports. Relatively quiet dome growth prevailed during 25 December-15 January, with most of the larger outbursts noted toward the end of this interval. For example, five to six explosions a day took place 11-13 January; their reduced displacements (RD) were under 2 cm2 and the resulting plumes rose up to 2 km above the summit. Fumarolic and less dramatic outbursts generally rose less than ~1.2 km. A helicopter-assisted visit to a geophysical station on the caldera margin revealed that the inclinometer there had suffered the impact of a ~30-cm-diameter incandescent bomb.
Volcano seismicity will be discussed in a future Bulletin report. Two shallow tectonic earthquakes, MR 3.8 and 3.1, took place on 1 and 2 January 2000; both were felt by people in N Quito; the next few days included earthquake swarms in the same region.
During the reporting interval, NOAA aviation notices of plumes were chiefly cautionary rather than announcing any large disturbances. The Embassy of Ecuador is receiving donations for the victims of the country's two volcanic crises, and will continue to do so throughout the emergency. On 1 December, El Commercio newspaper noted an issue not foreseen in the city's emergency plans that came to light after three explosions left a thin layer of airfall ash on the city. The report noted the need to regulate vehicle speeds so as to limit the amount of dust kicked up by passing vehicles.
Information Contacts: Geophysical Institute (Instituto Geofísico), Escuela Politécnica Nacional, Apartado 17-01-2759, Quito, Ecuador; Embassy of Ecuador, 2535 15th Street NW, Washington, D.C. 20009 USA (URL: http://www.ecuador.org/); Washington Volcanic Ash Advisory Center, NOAA Satellite Services Division, NESDIS E/SP23, NOAA Science Center, Room 401, 5200 Auth Road, Camp Springs, MD 20746, USA (URL: http://www.ssd.noaa.gov/); El Commercio newspaper, Quito, Ecuador (URL: http://www.elcomercio.com).
January-February marked by dome growth and small ash emissions
This report covers the interval from 16 January to 28 February 2000 (table 10). This interval was marked by poor visibility and small emissions, some with and some without visible ash. These rose on the order of a few tens of meters to 2 km. Besides small ash emissions, evidence of the ongoing gradual growth of the dome (locally termed "dome 8") was provided by abundant rockfalls in the W crater, sulfurous odors, minor local ashfalls, and infrequent glimpses of extrusions and various changes within the crater. Several intervals of near-quiet also occurred.
Table 10. Seismic observations at Guagua Pichincha, 16 January-28 February 2000. The table shows the daily tally of these categories of earthquakes: long-period (LP), volcano-tectonic (VT), hybrid, rockfall, and emissions. Explosions were only recorded on 20 January (4) and 17 February (1). Dashes indicate a lack of (essentially zero) reported events. Courtesy of the Geophysical Institute.
| Date | LP | VT | Hybrid | Rockfalls | Emissions |
| 16 Jan 2000 | 401 | -- | 10 | 136 | 5 |
| 17 Jan 2000 | 396 | 1 | 10 | 110 | 2 |
| 18 Jan 2000 | 330 | -- | 19 | 104 | 1 |
| 19 Jan 2000 | 65 | 7 | 24 | 6 | 2 |
| 20 Jan 2000 | 35 | 1 | 12 | 101 | 3 |
| 21 Jan 2000 | 108 | 1 | 6 | 79 | 1 |
| 22 Jan 2000 | 107 | 4 | 19 | 83 | -- |
| 23 Jan 2000 | 82 | -- | 2 | 50 | -- |
| 24 Jan 2000 | 50 | 2 | 21 | 40 | 2 |
| 25 Jan 2000 | 161 | 2 | 7 | 89 | 1 |
| 26 Jan 2000 | 202 | 4 | 21 | 86 | 1 |
| 27 Jan 2000 | 271 | 3 | 16 | 98 | -- |
| 28 Jan 2000 | 271 | 3 | 16 | 98 | -- |
| 29 Jan 2000 | 257 | 4 | 10 | 50 | 1 |
| 30 Jan 2000 | 105 | 18 | 11 | 19 | 1 |
| 31 Jan 2000 | 217 | 2 | 14 | 67 | -- |
| 01 Feb 2000 | 107 | -- | -- | 24 | 1 |
| 02 Feb 2000 | 116 | 2 | 7 | 65 | -- |
| 03 Feb 2000 | 147 | 2 | 7 | 69 | -- |
| 04 Feb 2000 | 163 | 1 | 9 | 42 | -- |
| 05 Feb 2000 | 102 | 2 | -- | 21 | -- |
| 06 Feb 2000 | 98 | 2 | 4 | 38 | -- |
| 07 Feb 2000 | 100 | -- | 16 | 15 | -- |
| 08 Feb 2000 | 124 | 1 | 4 | 39 | -- |
| 11 Feb 2000 | -- | -- | -- | -- | 1 |
| 12 Feb 2000 | 133 | -- | -- | 15 | 2 |
| 13 Feb 2000 | 100 | -- | 12 | 63 | 2 |
| 14 Feb 2000 | 147 | 2 | -- | 45 | 8 |
| 15 Feb 2000 | 314 | 8 | 18 | 74 | 2 |
| 16 Feb 2000 | 421 | 1 | 10 | 95 | 2 |
| 17 Feb 2000 | 355 | -- | 4 | 80 | 6 |
| 18 Feb 2000 | 380 | -- | 21 | 97 | 5 |
| 19 Feb 2000 | 210 | 2 | 8 | 73 | 2 |
| 20 Feb 2000 | 80 | 2 | -- | 35 | 3 |
| 21 Feb 2000 | 283 | 2 | -- | 83 | 3 |
| 22 Feb 2000 | 233 | -- | 5 | 79 | 1 |
| 23 Feb 2000 | 253 | 5 | 5 | 80 | 2 |
| 24 Feb 2000 | 267 | 2 | 11 | 60 | 4 |
| 25 Feb 2000 | 276 | 1 | -- | 66 | 1 |
| 26 Feb 2000 | 210 | 5 | 7 | 52 | 4 |
| 27 Feb 2000 | 268 | 2 | 26 | 79 | -- |
| 28 Feb 2000 | 401 | 1 | 98 | 87 | 1 |
The daily reports noted that small emissions occurred on many days in the reporting interval, which is also clear from the seismically based tallies shown on table 3. On the morning 19 January, the atmosphere was clear enough to see incandescent lava glowing through fractures in the dome. Observers noted lulls in fumarolic activity on 19 and 20 January, as well as on 22 and 23 January; in some cases they saw small, blue-tinged (sulfur-bearing) plumes that only rose 20-100 m. On 22 January observers looked into the small inner crater formed in 1999 (termed the "Herradura crater" or the "1999 crater") and noted a recent accumulation of fallen rocks there, including about twelve that stood ~10-12 m above the floor. Although the daily report noted that these rockfalls traveled in the direction of the head of the Río Cristal, their source was not made clear.
Starting at 1521 on 26 January a seismic emission signal with a small-to-moderate reduced displacement persisted for 120 minutes. Ash then fell W of the volcano. This emission followed a high-frequency seismic signal that possibly stemmed from a partial dome collapse. The possibility of a collapse appeared confirmed when observers noted the 26 January collapse of the crater's W zone. The latter event spawned a pyroclastic flow in the Río Cristal; associated deposits there exceeded 10 m in thickness.
In the morning on 1 February police reported the newly ash-covered Herradura crater generated white fumarolic columns that rose between 300 to 500 m. Blue vapors also hung in the air, indicating the presence of sulfur gases. On 2, 3, 12, 20, and on 28 February plumes rose to 1-2 km. In several cases the plumes carried noticeable ash, and a few ash falls were seen near the vent. The 12 February ash plume rose 1.3 km high; the plume's lower margins extended to engulf all sides of the caldera.
Information Contacts: Geophysical Institute (Instituto Geofísico), Escuela Politécnica Nacional, Apartado 17-01-2759, Quito, Ecuador.
Minor ash eruptions; partial collapse of January 2000 dome on 12 July
This report discusses activity at Guagua Pichincha during the months of June and July 2000. A Washington Volcanic Ash Advisory Center (VAAC) advisory was issued at 1337 on 2 June after a minor ash explosion propelled a plume to 7.3 km altitude above the summit. Another small eruption occurred one week later at 0941 on 9 June. Emissions from this second eruption did not rise more than 5 km, but more earthquakes and rockfalls indicated increasing instability of the January 2000 lava dome.
At 0953 on 12 July the dome experienced a partial collapse on its W side. This is the area of the dome closest to the W opening of the horseshoe-shaped caldera. High on the slope of the volcano's W flank, just below the caldera's opening, is the origin of the Cristál river. A long-period (LP) earthquake with a reduced displacement of 14.5 cm2 probably destabilized the dome and caused the partial collapse. Judging by seismic data, the ash plume may have risen ~12 km above the crater, but cloud cover inhibited visual observations. A strong wind blew most ash W, away from the city of Quito, and very fine ash blanketed the caldera. Seismicity remained low after the eruption, but a slight increase in the number of rockfalls indicated that the dome was still unstable.
Two other events occurred during July. An ash plume was also sighted at 0900 on 23 July at an estimated height of 6.1 km moving W. An aviation notice at 0900 on 24 July described ash from six emissions over the course of the previous night that reached 4.8 km altitude, a height comparable to the volcano's summit elevation.
Over 14,530 LP events were registered in the month of March and this number decreased to 6,892 in April; there was a reported average of 271 LP events daily for the year 2000. The number of monthly explosions dropped to almost zero during the period of January to April; this was the first time there have been so few explosions since the month of July 1998. Volcano-tectonic seismicity also dropped dramatically during January-July 2000, averaging approximately the same number of monthly events as seen prior to activity that began in October 1999. The number of rockfall events has remained high since dome growth began in January 2000; thus far in the year 2000 there has been an average of 72 daily rockfalls. Beginning around June 2000 these events have occurred 100-200 times per day. Two main seismic centers have been inferred at Guagua Pichincha from data; one center is less than 1 km below the crater surface and the second ~2-4 km deeper. Continued fumarolic activity has been moderate but variable.
Information Contacts: Instituto Geofísico, Escuela Politécnica Nacional, Apartado 17-01-2759, Quito, Ecuador (URL: http://www.igepn.edu.ec/); Washington Volcanic Ash Advisory Center (VAAC), Satellite Analysis Branch, NOAA/NESDIS E/SP23, NOAA Science Center Room 401, 5200 Auth Road, Camp Springs, MD 20746, USA (URL: http://www.ssd.noaa.gov/); Associated Press.
Year 2000 summary; geophysicist takes fatal fall in January 2001
Although previous reports discussed events through July 2000 (BGVN 25:06; v. 25, no. 3; v. 24, no. 12), a summary for the entire year has become available and in the interest of evenness of coverage will be reviewed here. A second, brief report is also included, covering events through mid-January. This latter report includes a tragic event that took place on 14 January 2001, the death of the energetic Instituto Geofísico volcano seismologist Diego Viracucha (see Obituary).
Activity during the year 2000 was generally more moderate than during 1999. The dome that started to form on 18 December 1999 ("dome 8") maintained a slow rate of growth until 23 July 2000 when it was disrupted by a series of small explosions. This growth brought about clear and continuous changes in dome morphology, abundant long-period (LP) earthquakes (monthly averages of ~8,700), and numerous seismically detected rock falls (monthly averages of ~3,000). The 23 July 2000 explosions were also accompanied by pyroclastic flows that descended the Cristal river but apparently did not make it to the confluence with the Cinto river as they had in 1999. Moreover, the 23 July 2000 explosions also failed to create a massive ash plume with its attendant disruption to local inhabitants.
After the 23 July explosions, the subsequent extrusions creating the next dome ("dome 9") were accompanied by abnormally high seismicity. For example, there were 20,646 LP earthquakes monthly starting in August 2000. Around this time, signals for rockfalls totaled ~5,400 a month. Starting on 18 December dome 9 grew comparatively slowly with few morphological changes, but was again accompanied by high, though more moderate seismicity (until December 2000 signals included 11,498 LP events and 3,475 rockfalls). In early 2001, the volume of dome 9 stood at 3 x 10⁶ m3, only about 14% smaller than its predecessor, dome 8.
The external flanks deformed after July 2000. Specifically, radial deflation on the E flank (Refugio station) reached 60 µrad. This small-to-moderate deflation was the largest yet seen since the onset of the crisis.
In late 2000 and earliest 2001 with the continuing growth of dome 9, Guagua Pichincha had ~100 earthquakes per day, considerably fewer than in some previous months. Still, in the week of 7-13 January, the volcano's LP earthquakes appeared to have greater magnitudes and source depths because they registered significantly at stations located 10 km out from the crater. Tectonic earthquakes 10 km SW of the crater also registered. Field observers on 14 January attempted to correlate these new, stronger LP earthquakes to visible changes or processes. The observers saw a new crater forming within dome 9, but otherwise, they noted few other surface manifestations that could be linked to the LP earthquakes.
Information Contacts: Instituto Geofísico (IG), Escuela Politécnica Nacional, Apartado 17-01-2759, Quito, Ecuador (URL: http://www.igepn.edu.ec/).
Gradual dome growth through March; ash emissions through May 2001
This report covers the interval from mid-January through May 2001. The previous report (BGVN 26:01) noted that a new dome ("dome 9") resulted from lava extrusions subsequent to explosions on 23 July 2000.
The volcano remained at Alert Level Yellow throughout the report period. Activity consisted principally of consistent, gradual growth of dome 9 through 26 March when the small number of rockfall signals suggested that the dome was stable. Seismicity and other volcanic activity has been moderate with small rockfalls occurring during February. The Washington Volcanic Ash Advisory Center (VAAC) reported ash emissions on 18 and 31 March, and again on 25 May; however, none of these were visible on GOES-8 imagery. The ash emission on 25 May rose to ~8.5 km altitude, the highest of those reported. A large number of long-period (LP) earthquakes also occurred during March. More than 806 LP earthquakes were registered during the week of 18-24 March but 460 of these occurred on 18 March in conjunction with the ash emission on that date.
Information Contacts: Instituto Geofísico (IG), Escuela Politécnica Nacional, Apartado 17-01-2759, Quito, Ecuador (URL: http://www.igepn.edu.ec/); Washington Volcanic Ash Advisory Center (VAAC), Satellite Analysis Branch, NOAA/NESDIS E/SP23, NOAA Science Center Room 401, 5200 Auth Road, Camp Springs, MD 20746, USA (URL: http://www.ssd.noaa.gov/).
Phreatic explosions in November 2001 and October-December 2002
This report is a summary of notable activity at Guagua Pichincha since September 2001 (BGVN 26:09). On 26 November 2001, seismic data indicated that an ~ 20-minute-long phreatic explosion began around noon and that continuous tremor was recorded for ~ 16 hours after the eruption. This was the first explosion since 25 May 2001 (BGVN 26:09). Seismic signals from a relatively high number of rockfalls were also recorded. Two new craters were formed N of the 1981 crater by the 26 November 2001 event. Volcanic and seismic activity returned to low levels after 27 November, with only low-level fumarolic activity occurring.
The next event of note occurred on 11 October 2002 following 6 months with no explosions, as reported by the El Universo newspaper. Four phreatic eruptions were presumably triggered by groundwater encountering the magmatic system after several days of heavy rainfall. The eruption sent ballistic blocks to distances of 100-200 m from the vent. Subsequently, long-period and volcano-tectonic earthquakes and continuous background tremor were recorded until 17 October.
The Washington VAAC reported explosions at 2056 and 2115 on 3 November 2002 and at 2120 on 7 December. The Washington VAAC was unable to determine the heights of the plumes produced from the explosions in November, or state if they contained ash, because ash was already in the atmosphere from a large eruption that day at Reventador, ~ 100 km E of Guagua Pichincha.
On 17 April 2003, the Instituto Geofísico (IG) detected seismic signals indicating a possible minor eruption, but there were no visual signs of ash venting. Similar seismic signals in the previous few days were thought to result from outgassing. Several volcano-tectonic earthquakes, one long-period earthquake, and seismic signals of rockfalls were also reported. During the week of 23-29 April 2003, seismic unrest continued. Typically several earthquakes were detected per day, but 16 long-period earthquakes occurred on 26 April. Subsequently, the volcano exhibited low-to-moderate seismicity, including two earthquakes with M < 3 on 30 April and 1 May. Both had epicenters within an earthquake swarm centered N of Quito. Episodes of harmonic tremor appeared, most noteworthy on 4 and 5 May, with each episode lasting over 40 minutes. Cloud cover obscured the crater area for much of the week but improved visibility on 3 May enabled observers to see fumaroles sending condensate up to heights of 100 m.
During the afternoon of 7 January 2004, strong rains occurred and seismic signals attributed to rockfalls and lahars were recorded. A visit to the area by IG scientists on 13 January confirmed that a lahar had traveled down the NNE wall of the volcano's crater. In addition, there were small fractures in the SE sector of the volcano and in the crater but IG noted that this activity did not indicate a change in volcanic activity at Guagua Pichincha.
Information Contacts: Instituto Geofísico (IG), Escuela Politécnica Nacional, Apartado 17-01-2759, Quito, Ecuador (URL: http://www.igepn.edu.ec/); Washington Volcanic Ash Advisory Center (VAAC), Satellite Analysis Branch, NOAA/NESDIS E/SP23, NOAA Science Center Room 401, 5200 Auth Road, Camp Springs, MD 20746, USA (URL: http://www.ssd.noaa.gov/).
Seven moderate phreatic eruptions on 1 February 2008
Following December 2007 seismicity, Guagua Pichincha generated phreatic eruptions multiple times on 1 February 2008. The summit lies only ~ 8 km W of the limits of Ecuador's capital, Quito. Our last report summarized events through January 2004 (BGVN 29:06).
In lead-up to the phreatic eruptions, the Instituto Geofísico Escuela Politécnica Nacional (IG-EPN), reported that an M 4.1 earthquake occurred in the vicinity on 6 December 2007, followed a week later by an increase in fracture earthquakes. These events, continuing through 23 December, were below M 3 and occurred at shallow depths within the volcano. On 24-30 December 2007, IG-EPN indicated that the fumaroles were stable.
IG-EPN reported that a slight increase in activity had been observed over a few weeks at the end of January 2008. This activity culminated on 1 February with seven phreatic explosions of moderate size. IG-EPN went on to say that these phreatic eruptions generally occur during rainy periods, so these explosions are not necessarily indicative of any increase in activity. Since this type of event may occur again, however, IG-EPN recommended that visitors not descend into the caldera. This was mentioned in a 2 February news report in El Pais, which further mentioned that strong rains that had recently fallen in Quito and the crater.
As of 14 February, Ash Advisories cataloged by the Washington VAAC's lacked reports describing the 1 February, or any subsequent, phreatic eruptions.
Information Contacts: Instituto Geofísico Escuela Politécnica Nacional (IG-EPN), Apartado 17-01-2759, Quito, Ecuador (URL: http://www.igepn.edu.ec/).
During 2008-2010 the lava dome was stable, occasional phreatic explosions
This report mainly summarizes information on Guagua Pichincha conveyed in 2008 to 2010 yearly reports by the IG-EPN (Instituto Geofísico Escuela Politécnica Nacional). In broad terms, and with the exceptions of an anomalously high number of emission and explosion signals in 2009, Guagua Pichincha volcanic activity continued to decline since the eruptions during September 1999 to June 2001. Further, the volcano has cooled and crater morphology, as stated in IG-EPN yearly reports, has remained relatively unchanged since 2002 (Samaniego,P, 2006, and 2007-2010 yearly reports). Nevertheless, it is possible for further emissions and explosions to occur as potential hazards to life and property. Especially since Guagua Pichincha (figures 22 and 23) is 11 km from the capital, Quito, a city with a population of over 2.5 million (as estimated by the Metropolitan District of Quito population projection, Directorate of Territorial Planning and Public Services). Our previous report on the volcano (BGVN 32:12) discussed phreatic explosions that occurred in early 2008. This report includes seismic data plots, locations of events on topographic maps and a multi-year seismic table beginning in the year 2005.
|
Figure 22. Map showing proximity of Quito to Guagua Pichincha. Courtesy of Google Earth. |
|
Figure 23. Photograph of Guagua Pichincha's crater taken in May 2008, showing the still-active year 1660 dome and adjacent crater floor. The area is heavily pockmarked with explosion craters (labeled). Note sampled fumarole (bottom left). Photo courtesy of J. Bustillos (IG-EPN 2008 annual report). |
During the 2008-2010 reporting interval, the IG yearly reports cited fumarolic emissions, surfurous odors, and noise at various locations within the crater, including the 1660 dome, and the 1981 and 2002 craters. As discussed below, rainfall often correlated with phreatic eruptions during 2008 and 2009.
Seismicity is monitored using five short-period (1 Hz) seismic stations, of which three are single-component stations (GGP, JUA2, YANA) and two are three-components stations (PINE, TERV).
Low seismicity generally prevailed during 2003-2010, with few long-period (LP) and hybrid (hb) earthquake occurrences (figure 24). Compared to 2003 to 2005 the number of volcano-tectonic (VT) earthquakes increased during 2006 to 2010 (figure 24).
|
Figure 24. Guagua Pichincha volcano seismic event data from 2002 to 2010, shown in the number of events. Above the plot, earthquakes and periods of emission are indicated by arrows. Multiple events that happened closely spaced in time are shown by a single arrow. Data courtesy of IG-EPN (2008-2010 annual reports). |
During the period from 2005 to 2010 (table 11) the annual number of total seismic events generally remained in the range of several hundred to over 1,700. Seismically detected emission signals (phreatic outbursts) were recorded less than 25 times per year. The number of emissions in 2008 and 2009 were the largest in the years in discussion, 20 and 24 events respectively. At most, several explosions (producing non-juvenile ash found in vicinity of the crater) were recognized each year but three years had zero. More details on the 2008, 2009, and 2010 reports follows.
Table 11. Seismic data for Guagua Pichincha from IG-EPN 2005 to 2010 yearly summaries. Note the explosion column, which was often low, under three per year. IG-EPN attributed the emission cases to phreatic eruptions, in the explosion cases they recognized non-juvenile ash at the crater. The value for emissions in 2009 corrects those in the 2009 IG-EPN report. Data courtesy of IG-EPN.
| Year | Volcano-tectonic | Long-period | Hybrid | Rockfalls | Emissions | Explosions | Earthquakes in Quito |
| 2005 | 325 | 39 | 8 | 115 | 13 | 2 | 311 |
| 2006 | 811 | 84 | 28 | 174 | 4 | 3 | 162 |
| 2007 | 1274 | 84 | 30 | 83 | 8 | 0 | 84 |
| 2008 | 1531 | 105 | 190 | 107 | 20 | 3 | 62 |
| 2009 | 553 | 195 | 32 | 26 | 24 | 0 | 137 |
| 2010 | 1113 | 196 | 1 | 38 | 3 | 0 | 95 |
2008 seismicity. The three explosion events in 2008 took place on 27 January (two events) and on 5 May (one event). 2008 seismicity remained at a similar level as in 2007, with increased earthquakes in January and May, 326 and 299, respectively (figure 24). These two months had appreciable numbers of located events compared to other months. The locations of events tended to fall along trends to the WNW and NE. The WNW group is distributed in a line that runs from the N of the caldera to the foothills of Pichincha, following the Rumipamba gorge (figure 25a), which deepens towards the E. Epicenters of the NE group fall in a line on and near the caldera (figure 25a).
|
Figure 25. Located earthquakes (colored dots) at Guagua Pichincha presented as a series of annual maps: 2008 (4a), 2009 (4b), and 2010 (4c). The colors indicate accuracy and are listed as follows from highest to lowest accuracy: pink, red, blue, green. Courtesy of IG-EPN. |
2009 seismicity. The first half of the year was the most seismically active and ~77% of the total earthquakes occurred then (figure 24). Of the hundreds of events recorded for 2009, only 63 could be located. Their foci occurred below the crater around 7 km depth. Vapor-associated emissions mainly occurred during the first several months of the year (figure 24), coinciding with the rainy season. The highest number of emission events were on 16 February, 7 March, and 11 March.
2010 seismicity. No explosions occurred in 2010. Of the events recorded, 161 were localized near the crater (figure 25c). These recorded events were mainly grouped under the crater and to the NE with a majority of near depths of 7 km. Another group, fewer in number, was located and aligned E of the caldera (figure 25c). IG related emission events to existing heat inside the volcano interacting with groundwater.
Correlation of phreatic explosions and the rainy season. The occurrence of phreatic explosions and emissions appears to be related to the rainy season at the beginning of the year (SEAN 07:06, BGVN 18:02, 24:02, 24:11, 29:06, and 32:12). This behavior was most-recently reported on by the IG in 2008 and 2009. A possible model for the interaction of rain water with the volcanic system can be found in BGVN 24:11.
2008-2010 cooling and morphologic stability. Continued cooling of the dome was indicated by the temperatures recorded in situ from November 2000 to 2005 in the IG 2005 report. It was concluded the dome shows no thermal anomalies. IG 2010 ASTER TIR images are consistent with information from previous years and show continued cooling. In addition to undergoing continual cooling, the crater morphology has remained relatively unchanged since the formation of an additional crater in 2002. The IG concluded that Guagua Pichincha was generally becoming less active over time. However, they noted that it is possible for further emissions and explosions to occur that could possibly threaten Quito.
Reference. Samaniego, P; Robin, C; Monzier, M; Mothes,P; Beate; B; Garcia, 2006, Guagua Pichincha Volcano Holocene and Late Pleistocine Activity, Cities on Volcanoes, Fourth Conference; IAVCEI, Quito Equador, (URL: http://www.igepn.edu.ec/images/collector/collection/biblioteca/guaguapichincha_ field_guide.pdf).
Information Contacts: Instituto Geofísico Escuela Politécnica Nacional (IG-EPN), Apartado 17-01-2759, Quito, Ecuador (URL: http://www.igepn.edu.ec/); Observatorio Vulcanológico Pichincha (OVGGP) (URL: http://www.igepn.edu.ec/index.php/nuestro-blog/item/158).
This compilation of synonyms and subsidiary features may not be comprehensive. Features are organized into four major categories: Cones, Craters, Domes, and Thermal Features. Synonyms of features appear indented below the primary name. In some cases additional feature type, elevation, or location details are provided.
Cones |
||||
| Feature Name | Feature Type | Elevation | Latitude | Longitude |
| Rucu Pichincha | Stratovolcano | 4700 m | 0° 9' 32" S | 78° 33' 50" W |
| Toaza | Stratovolcano | |||
Domes |
||||
| Feature Name | Feature Type | Elevation | Latitude | Longitude |
| Cristal | Dome | |||
|
|
||||||||||||||||||||||||
There is data available for 33 confirmed Holocene eruptive periods.
[ 2009 Feb 16 - 2009 Feb 17 ] Uncertain Eruption
| Episode 1 | Eruption Episode | |||||||||||||||||||||||||
|---|---|---|---|---|---|---|---|---|---|---|---|---|---|---|---|---|---|---|---|---|---|---|---|---|---|
| 2009 Feb 16 - 2009 Feb 17 | Evidence from Unknown | ||||||||||||||||||||||||
|
List of 3 Events for Episode 1
| |||||||||||||||||||||||||
[ 2008 Feb 1 - 2008 Feb 1 ] Uncertain Eruption
| Episode 1 | Eruption Episode | |||||||||||||||||||||||||
|---|---|---|---|---|---|---|---|---|---|---|---|---|---|---|---|---|---|---|---|---|---|---|---|---|---|
| 2008 Feb 1 - 2008 Feb 1 | Evidence from Unknown | ||||||||||||||||||||||||
|
List of 3 Events for Episode 1
| |||||||||||||||||||||||||
[ 2003 Apr 17 (in or before) - 2003 Apr 17 ] Uncertain Eruption
| Episode 1 | Eruption Episode | ||||||||||||||||||||
|---|---|---|---|---|---|---|---|---|---|---|---|---|---|---|---|---|---|---|---|---|
| 2003 Apr 17 (in or before) - 2003 Apr 17 | Evidence from Unknown | |||||||||||||||||||
|
List of 2 Events for Episode 1
| ||||||||||||||||||||
2002 Oct 11 - 2002 Dec 7 Confirmed Eruption Max VEI: 1 (?)
| Episode 1 | Eruption Episode | ||||||||||||||||||||||||||||||
|---|---|---|---|---|---|---|---|---|---|---|---|---|---|---|---|---|---|---|---|---|---|---|---|---|---|---|---|---|---|---|
| 2002 Oct 11 - 2002 Dec 7 | Evidence from Observations: Reported | |||||||||||||||||||||||||||||
|
List of 4 Events for Episode 1
| ||||||||||||||||||||||||||||||
2002 Apr 16 ± 15 days - 2002 Apr 16 ± 15 days Confirmed Eruption Max VEI: 1 (?)
| Episode 1 | Eruption Episode | ||||||||||||||||||||
|---|---|---|---|---|---|---|---|---|---|---|---|---|---|---|---|---|---|---|---|---|
| 2002 Apr 16 ± 15 days - 2002 Apr 16 ± 15 days | Evidence from Observations: Reported | |||||||||||||||||||
|
List of 2 Events for Episode 1
| ||||||||||||||||||||
2001 Nov 26 - 2001 Nov 26 Confirmed Eruption Max VEI: 1 (?)
| Episode 1 | Eruption Episode | North of 1981 crater | |||||||||||||||||||||||||||||
|---|---|---|---|---|---|---|---|---|---|---|---|---|---|---|---|---|---|---|---|---|---|---|---|---|---|---|---|---|---|---|
| 2001 Nov 26 - 2001 Nov 26 | Evidence from Observations: Reported | |||||||||||||||||||||||||||||
|
List of 4 Events for Episode 1 at North of 1981 crater
| ||||||||||||||||||||||||||||||
1998 Aug 7 - 2001 May 25 Confirmed Eruption Max VEI: 3
| Episode 1 | Eruption Episode | West and SE of 1981 crater | ||||||||||||||||||||||||||||||||||||||||||||||||||||||||||||||||||||||||||||||||||||
|---|---|---|---|---|---|---|---|---|---|---|---|---|---|---|---|---|---|---|---|---|---|---|---|---|---|---|---|---|---|---|---|---|---|---|---|---|---|---|---|---|---|---|---|---|---|---|---|---|---|---|---|---|---|---|---|---|---|---|---|---|---|---|---|---|---|---|---|---|---|---|---|---|---|---|---|---|---|---|---|---|---|---|---|---|---|
| 1998 Aug 7 - 2001 May 25 | Evidence from Observations: Reported | ||||||||||||||||||||||||||||||||||||||||||||||||||||||||||||||||||||||||||||||||||||
|
List of 15 Events for Episode 1 at West and SE of 1981 crater
| |||||||||||||||||||||||||||||||||||||||||||||||||||||||||||||||||||||||||||||||||||||
1997 Mar 16 ± 15 days - 1997 Oct 18 Confirmed Eruption Max VEI: 1
| Episode 1 | Eruption Episode | 1981 crater | |||||||||||||||||||||||||||||
|---|---|---|---|---|---|---|---|---|---|---|---|---|---|---|---|---|---|---|---|---|---|---|---|---|---|---|---|---|---|---|
| 1997 Mar 16 ± 15 days - 1997 Oct 18 | Evidence from Observations: Reported | |||||||||||||||||||||||||||||
|
List of 4 Events for Episode 1 at 1981 crater
| ||||||||||||||||||||||||||||||
1993 Mar 9 - 1993 Mar 12 Confirmed Eruption Max VEI: 1
| Episode 1 | Eruption Episode | 1981 crater | |||||||||||||||||||||||||||||||||||||||
|---|---|---|---|---|---|---|---|---|---|---|---|---|---|---|---|---|---|---|---|---|---|---|---|---|---|---|---|---|---|---|---|---|---|---|---|---|---|---|---|---|
| 1993 Mar 9 - 1993 Mar 12 | Evidence from Observations: Reported | |||||||||||||||||||||||||||||||||||||||
|
List of 6 Events for Episode 1 at 1981 crater
| ||||||||||||||||||||||||||||||||||||||||
1990 Apr 16 - 1990 May 10 Confirmed Eruption Max VEI: 1
| Episode 1 | Eruption Episode | 1981 crater | |||||||||||||||||||||||||||||||||||||||
|---|---|---|---|---|---|---|---|---|---|---|---|---|---|---|---|---|---|---|---|---|---|---|---|---|---|---|---|---|---|---|---|---|---|---|---|---|---|---|---|---|
| 1990 Apr 16 - 1990 May 10 | Evidence from Observations: Reported | |||||||||||||||||||||||||||||||||||||||
|
List of 6 Events for Episode 1 at 1981 crater
| ||||||||||||||||||||||||||||||||||||||||
1985 May 16 ± 15 days - 1985 Jun 16 ± 15 days Confirmed Eruption Max VEI: 1
| Episode 1 | Eruption Episode | 1981 crater | |||||||||||||||||||
|---|---|---|---|---|---|---|---|---|---|---|---|---|---|---|---|---|---|---|---|---|
| 1985 May 16 ± 15 days - 1985 Jun 16 ± 15 days | Evidence from Observations: Reported | |||||||||||||||||||
|
List of 2 Events for Episode 1 at 1981 crater
| ||||||||||||||||||||
1981 Aug 31 ± 5 days - 1982 Nov 16 (?) ± 15 days Confirmed Eruption Max VEI: 1
| Episode 1 | Eruption Episode | NE side of 1660 lava dome | |||||||||||||||||||||||||||||||||||||||
|---|---|---|---|---|---|---|---|---|---|---|---|---|---|---|---|---|---|---|---|---|---|---|---|---|---|---|---|---|---|---|---|---|---|---|---|---|---|---|---|---|
| 1981 Aug 31 ± 5 days - 1982 Nov 16 (?) ± 15 days | Evidence from Observations: Reported | |||||||||||||||||||||||||||||||||||||||
|
List of 6 Events for Episode 1 at NE side of 1660 lava dome
| ||||||||||||||||||||||||||||||||||||||||
1881 Mar 10 Confirmed Eruption Max VEI: 2
| Episode 1 | Eruption Episode | |||||||||||||||||||||||||
|---|---|---|---|---|---|---|---|---|---|---|---|---|---|---|---|---|---|---|---|---|---|---|---|---|---|
| 1881 Mar 10 - Unknown | Evidence from Observations: Reported | ||||||||||||||||||||||||
|
List of 3 Events for Episode 1
| |||||||||||||||||||||||||
1869 Jul 22 - 1869 Aug 24 Confirmed Eruption Max VEI: 2
| Episode 1 | Eruption Episode | |||||||||||||||||||||||||
|---|---|---|---|---|---|---|---|---|---|---|---|---|---|---|---|---|---|---|---|---|---|---|---|---|---|
| 1869 Jul 22 - 1869 Aug 24 | Evidence from Observations: Reported | ||||||||||||||||||||||||
|
List of 3 Events for Episode 1
| |||||||||||||||||||||||||
1869 Mar Confirmed Eruption Max VEI: 2
| Episode 1 | Eruption Episode | |||||||||||||||||||||||||
|---|---|---|---|---|---|---|---|---|---|---|---|---|---|---|---|---|---|---|---|---|---|---|---|---|---|
| 1869 Mar - Unknown | Evidence from Observations: Reported | ||||||||||||||||||||||||
|
List of 3 Events for Episode 1
| |||||||||||||||||||||||||
1868 Aug Confirmed Eruption Max VEI: 2
| Episode 1 | Eruption Episode | |||||||||||||||||||||||||
|---|---|---|---|---|---|---|---|---|---|---|---|---|---|---|---|---|---|---|---|---|---|---|---|---|---|
| 1868 Aug - Unknown | Evidence from Observations: Reported | ||||||||||||||||||||||||
|
List of 3 Events for Episode 1
| |||||||||||||||||||||||||
1868 Mar 19 - 1868 Mar 22 Confirmed Eruption Max VEI: 2
| Episode 1 | Eruption Episode | |||||||||||||||||||||||||
|---|---|---|---|---|---|---|---|---|---|---|---|---|---|---|---|---|---|---|---|---|---|---|---|---|---|
| 1868 Mar 19 - 1868 Mar 22 | Evidence from Observations: Reported | ||||||||||||||||||||||||
|
List of 3 Events for Episode 1
| |||||||||||||||||||||||||
1831 Confirmed Eruption Max VEI: 3
| Episode 1 | Eruption Episode | |||||||||||||||||||||||||
|---|---|---|---|---|---|---|---|---|---|---|---|---|---|---|---|---|---|---|---|---|---|---|---|---|---|
| 1831 - Unknown | Evidence from Observations: Reported | ||||||||||||||||||||||||
|
List of 3 Events for Episode 1
| |||||||||||||||||||||||||
1830 Confirmed Eruption Max VEI: 2
| Episode 1 | Eruption Episode | |||||||||||||||||||||||||
|---|---|---|---|---|---|---|---|---|---|---|---|---|---|---|---|---|---|---|---|---|---|---|---|---|---|
| 1830 - Unknown | Evidence from Observations: Reported | ||||||||||||||||||||||||
|
List of 3 Events for Episode 1
| |||||||||||||||||||||||||
1660 Oct 27 - 1660 Nov 28 Confirmed Eruption Max VEI: 4
| Episode 1 | Eruption Episode | ||||||||||||||||||||||||||||||||||||||||||||||||||
|---|---|---|---|---|---|---|---|---|---|---|---|---|---|---|---|---|---|---|---|---|---|---|---|---|---|---|---|---|---|---|---|---|---|---|---|---|---|---|---|---|---|---|---|---|---|---|---|---|---|---|
| 1660 Oct 27 - 1660 Nov 28 | Evidence from Observations: Reported | |||||||||||||||||||||||||||||||||||||||||||||||||
|
List of 8 Events for Episode 1
| ||||||||||||||||||||||||||||||||||||||||||||||||||
1582 Jun 5 - 1598 Confirmed Eruption Max VEI: 3
| Episode 1 | Eruption Episode | |||||||||||||||||||||||||||||||||||
|---|---|---|---|---|---|---|---|---|---|---|---|---|---|---|---|---|---|---|---|---|---|---|---|---|---|---|---|---|---|---|---|---|---|---|---|
| 1582 Jun 5 - 1598 | Evidence from Observations: Reported | ||||||||||||||||||||||||||||||||||
|
List of 5 Events for Episode 1
| |||||||||||||||||||||||||||||||||||
[ 1580 ] Uncertain Eruption
| Episode 1 | Eruption Episode | |||||||||||||||||||||||||
|---|---|---|---|---|---|---|---|---|---|---|---|---|---|---|---|---|---|---|---|---|---|---|---|---|---|
| 1580 - Unknown | Evidence from Unknown | ||||||||||||||||||||||||
|
List of 3 Events for Episode 1
| |||||||||||||||||||||||||
[ 1577 ] Uncertain Eruption
| Episode 1 | Eruption Episode | ||||||||||||||||||||
|---|---|---|---|---|---|---|---|---|---|---|---|---|---|---|---|---|---|---|---|---|
| 1577 - Unknown | Evidence from Unknown | |||||||||||||||||||
|
List of 2 Events for Episode 1
| ||||||||||||||||||||
1575 Sep 8 Confirmed Eruption Max VEI: 2
| Episode 1 | Eruption Episode | ||||||||||||||||||||||||||||||
|---|---|---|---|---|---|---|---|---|---|---|---|---|---|---|---|---|---|---|---|---|---|---|---|---|---|---|---|---|---|---|
| 1575 Sep 8 - Unknown | Evidence from Observations: Reported | |||||||||||||||||||||||||||||
|
List of 4 Events for Episode 1
| ||||||||||||||||||||||||||||||
1566 Oct 17 - 1566 Nov 16 Confirmed Eruption Max VEI: 3
| Episode 1 | Eruption Episode | ||||||||||||||||||||||||||||||
|---|---|---|---|---|---|---|---|---|---|---|---|---|---|---|---|---|---|---|---|---|---|---|---|---|---|---|---|---|---|---|
| 1566 Oct 17 - 1566 Nov 16 | Evidence from Observations: Reported | |||||||||||||||||||||||||||||
|
List of 4 Events for Episode 1
| ||||||||||||||||||||||||||||||
[ 1560 ] Uncertain Eruption
| Episode 1 | Eruption Episode | |||||||||||||||||||||||||
|---|---|---|---|---|---|---|---|---|---|---|---|---|---|---|---|---|---|---|---|---|---|---|---|---|---|
| 1560 - Unknown | Evidence from Unknown | ||||||||||||||||||||||||
|
List of 3 Events for Episode 1
| |||||||||||||||||||||||||
[ 1539 ] Uncertain Eruption
| Episode 1 | Eruption Episode | |||||||||||||||||||||||||
|---|---|---|---|---|---|---|---|---|---|---|---|---|---|---|---|---|---|---|---|---|---|---|---|---|---|
| 1539 - Unknown | Evidence from Unknown | ||||||||||||||||||||||||
|
List of 3 Events for Episode 1
| |||||||||||||||||||||||||
[ 1538 ] Uncertain Eruption
| Episode 1 | Eruption Episode | |||||||||||||||||||||||||
|---|---|---|---|---|---|---|---|---|---|---|---|---|---|---|---|---|---|---|---|---|---|---|---|---|---|
| 1538 - Unknown | Evidence from Unknown | ||||||||||||||||||||||||
|
List of 3 Events for Episode 1
| |||||||||||||||||||||||||
[ 1535 ] Uncertain Eruption
| Episode 1 | Eruption Episode | |||||||||||||||||||||||||
|---|---|---|---|---|---|---|---|---|---|---|---|---|---|---|---|---|---|---|---|---|---|---|---|---|---|
| 1535 - Unknown | Evidence from Unknown | ||||||||||||||||||||||||
|
List of 3 Events for Episode 1
| |||||||||||||||||||||||||
[ 1534 ] Uncertain Eruption
| Episode 1 | Eruption Episode | |||||||||||||||||||||||||
|---|---|---|---|---|---|---|---|---|---|---|---|---|---|---|---|---|---|---|---|---|---|---|---|---|---|
| 1534 - Unknown | Evidence from Unknown | ||||||||||||||||||||||||
|
List of 3 Events for Episode 1
| |||||||||||||||||||||||||
[ 1533 ] Uncertain Eruption
| Episode 1 | Eruption Episode | |||||||||||||||||||||||||
|---|---|---|---|---|---|---|---|---|---|---|---|---|---|---|---|---|---|---|---|---|---|---|---|---|---|
| 1533 - Unknown | Evidence from Unknown | ||||||||||||||||||||||||
|
List of 3 Events for Episode 1
| |||||||||||||||||||||||||
0930 ± 100 years Confirmed Eruption Max VEI: 5
| Episode 1 | Eruption Episode | ||||||||||||||||||||||||||||||||||||||||
|---|---|---|---|---|---|---|---|---|---|---|---|---|---|---|---|---|---|---|---|---|---|---|---|---|---|---|---|---|---|---|---|---|---|---|---|---|---|---|---|---|
| 0930 ± 100 years - Unknown | Evidence from Isotopic: 14C (calibrated) | |||||||||||||||||||||||||||||||||||||||
|
List of 6 Events for Episode 1
| ||||||||||||||||||||||||||||||||||||||||
0550 ± 75 years Confirmed Eruption
| Episode 1 | Eruption Episode | |||||||||||||||||||||||||||||||||||
|---|---|---|---|---|---|---|---|---|---|---|---|---|---|---|---|---|---|---|---|---|---|---|---|---|---|---|---|---|---|---|---|---|---|---|---|
| 0550 ± 75 years - Unknown | Evidence from Isotopic: 14C (calibrated) | ||||||||||||||||||||||||||||||||||
|
List of 5 Events for Episode 1
| |||||||||||||||||||||||||||||||||||
0070 ± 75 years Confirmed Eruption Max VEI: 4
| Episode 1 | Eruption Episode | ||||||||||||||||||||||||||||||||||||||||
|---|---|---|---|---|---|---|---|---|---|---|---|---|---|---|---|---|---|---|---|---|---|---|---|---|---|---|---|---|---|---|---|---|---|---|---|---|---|---|---|---|
| 0070 ± 75 years - Unknown | Evidence from Isotopic: 14C (calibrated) | |||||||||||||||||||||||||||||||||||||||
|
List of 6 Events for Episode 1
| ||||||||||||||||||||||||||||||||||||||||
1230 BCE ± 75 years Confirmed Eruption
| Episode 1 | Eruption Episode | ||||||||||||||||||||||||||||||
|---|---|---|---|---|---|---|---|---|---|---|---|---|---|---|---|---|---|---|---|---|---|---|---|---|---|---|---|---|---|---|
| 1230 BCE ± 75 years - Unknown | Evidence from Isotopic: 14C (calibrated) | |||||||||||||||||||||||||||||
|
List of 4 Events for Episode 1
| ||||||||||||||||||||||||||||||
1860 BCE ± 100 years Confirmed Eruption
| Episode 1 | Eruption Episode | ||||||||||||||||||||||||||||||
|---|---|---|---|---|---|---|---|---|---|---|---|---|---|---|---|---|---|---|---|---|---|---|---|---|---|---|---|---|---|---|
| 1860 BCE ± 100 years - Unknown | Evidence from Isotopic: 14C (calibrated) | |||||||||||||||||||||||||||||
|
List of 4 Events for Episode 1
| ||||||||||||||||||||||||||||||
2090 BCE ± 75 years Confirmed Eruption
| Episode 1 | Eruption Episode | ||||||||||||||||||||||||||||||||||||||||
|---|---|---|---|---|---|---|---|---|---|---|---|---|---|---|---|---|---|---|---|---|---|---|---|---|---|---|---|---|---|---|---|---|---|---|---|---|---|---|---|---|
| 2090 BCE ± 75 years - Unknown | Evidence from Isotopic: 14C (calibrated) | |||||||||||||||||||||||||||||||||||||||
|
List of 6 Events for Episode 1
| ||||||||||||||||||||||||||||||||||||||||
3500 BCE (?) Confirmed Eruption
| Episode 1 | Eruption Episode | ||||||||||||||||||||
|---|---|---|---|---|---|---|---|---|---|---|---|---|---|---|---|---|---|---|---|---|
| 3500 BCE (?) - Unknown | Evidence from Isotopic: 14C (uncalibrated) | |||||||||||||||||||
|
List of 2 Events for Episode 1
| ||||||||||||||||||||
4850 BCE ± 1350 years Confirmed Eruption
| Episode 1 | Eruption Episode | ||||||||||||||||||||
|---|---|---|---|---|---|---|---|---|---|---|---|---|---|---|---|---|---|---|---|---|
| 4850 BCE ± 1350 years - Unknown | Evidence from Correlation: Tephrochronology | |||||||||||||||||||
|
List of 2 Events for Episode 1
| ||||||||||||||||||||
6200 BCE (?) Confirmed Eruption
| Episode 1 | Eruption Episode | ||||||||||||||||||||
|---|---|---|---|---|---|---|---|---|---|---|---|---|---|---|---|---|---|---|---|---|
| 6200 BCE (?) - Unknown | Evidence from Isotopic: 14C (uncalibrated) | |||||||||||||||||||
|
List of 2 Events for Episode 1
| ||||||||||||||||||||
6300 BCE (?) Confirmed Eruption
| Episode 1 | Eruption Episode | ||||||||||||||||||||||||||||||
|---|---|---|---|---|---|---|---|---|---|---|---|---|---|---|---|---|---|---|---|---|---|---|---|---|---|---|---|---|---|---|
| 6300 BCE (?) - Unknown | Evidence from Isotopic: 14C (uncalibrated) | |||||||||||||||||||||||||||||
|
List of 4 Events for Episode 1
| ||||||||||||||||||||||||||||||
6400 BCE (?) Confirmed Eruption
| Episode 1 | Eruption Episode | ||||||||||||||||||||||||||||||
|---|---|---|---|---|---|---|---|---|---|---|---|---|---|---|---|---|---|---|---|---|---|---|---|---|---|---|---|---|---|---|
| 6400 BCE (?) - Unknown | Evidence from Isotopic: 14C (uncalibrated) | |||||||||||||||||||||||||||||
|
List of 4 Events for Episode 1
| ||||||||||||||||||||||||||||||
6650 BCE (?) Confirmed Eruption
| Episode 1 | Eruption Episode | |||||||||||||||||||||||||
|---|---|---|---|---|---|---|---|---|---|---|---|---|---|---|---|---|---|---|---|---|---|---|---|---|---|
| 6650 BCE (?) - Unknown | Evidence from Isotopic: 14C (uncalibrated) | ||||||||||||||||||||||||
|
List of 3 Events for Episode 1
| |||||||||||||||||||||||||
7000 BCE (?) Confirmed Eruption
| Episode 1 | Eruption Episode | |||||||||||||||||||||||||
|---|---|---|---|---|---|---|---|---|---|---|---|---|---|---|---|---|---|---|---|---|---|---|---|---|---|
| 7000 BCE (?) - Unknown | Evidence from Isotopic: 14C (uncalibrated) | ||||||||||||||||||||||||
|
List of 3 Events for Episode 1
| |||||||||||||||||||||||||
There is no Deformation History data available for Guagua Pichincha.
There is no Emissions History data available for Guagua Pichincha.
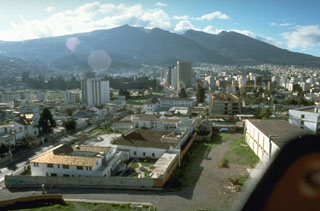 Guagua Pichincha volcano towers over Ecuador's capital city of Quito. The historically active vent of Guagua Pichincha is located within a large, steep-walled caldera that is breached to the west, in a direction opposite the city. This has served to funnel pyroclastic flows and mudflows away from Quito. Most historical eruptions have been relatively minor, although an explosive eruption in 1660 dropped 30 cm of ash on the city.
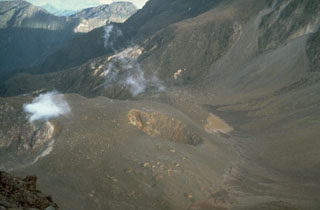 The small crater in the center of the photo was formed during phreatic eruptions in 1981-82 that blasted a hole on the NE side of the lava dome filling the summit caldera of Guagua Pichincha volcano. The first explosions in late August or early September 1981 were followed by others that by May 1982 had merged three small craters into a larger 50-m wide crater. A month later the crater had grown to the 100-m-wide size seen in this 1988 photo. The eruption lasted until late 1982.
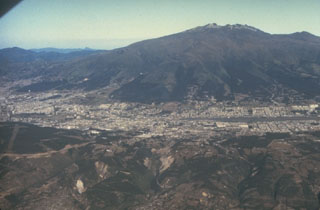 Guagua Pichincha stratovolcano rises immediately to the west of Ecuador's capital city, Quito. A small lava dome is located at the head of a 6-km-wide breached caldera, which is out of view beyond the horizon in this photo. The caldera formed during a late-Pleistocene slope failure about 50,000 years ago. Many minor eruptions have occurred since the Spanish era; the volcano's largest historical eruption in 1660 deposited 30 cm of ash on Quito.
 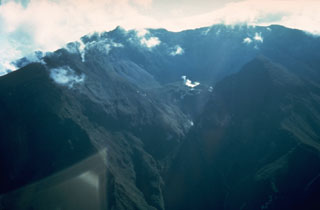 Fumaroles rise above a small crater (right center) at the base of the headwall of the 6-km-wide summit caldera of Guagua Pichincha volcano. The breached caldera seen here from the east was formed about 50,000 years ago. Subsequent late-Pleistocene and Holocene eruptions from the central vent in the breached caldera consisted of explosive activity with pyroclastic flows that accompanied periodic growth and destruction of a lava dome.
 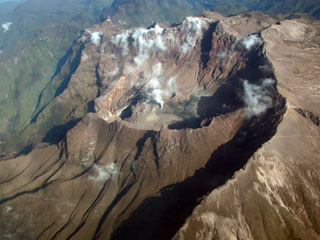 A large breached caldera formed by edifice collapse during the Pleistocene truncates the summit of 4784-m-high Guagua Pichincha volcano, which overlooks Ecuador's capital city, Quito. A lava dome was constructed within the active crater at the head of the collapse scarp.
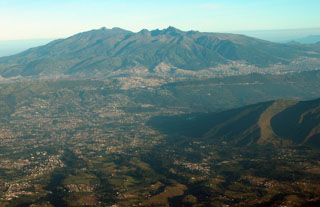 An aerial view from the east shows the Pichincha volcanic complex, one of Ecuador's most active volcanoes, rising immediately above the capital city of Quito. Guagua Pichincha (left) and the sharp-topped Pleistocene Rucu Pichincha stratovolcano (right) form a broad volcanic massif overlooking Ecuador's largest city. The largest historical eruption from Guagua Pichincha took place in 1660 CE, when ash fell over a 1000 km radius, accumulating to 30 cm depth in Quito.
 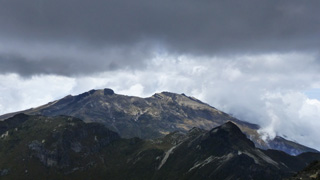 This October 2015 view is from the summit of Rucu Pichincha (“Old Man Pichincha” in the indigenous Quechua language) facing west towards the Guagua Pichincha (“Baby Pichincha”) vent. Eruptions have produced ashfall that has impacted Quito, 14 km W. The recently active vent is situated within a landslide scarp that opens towards the SW, and an older landslide scarp is on the western flank.
The maps shown below have been scanned from the GVP map archives and include the volcano on this page. Clicking on the small images will load the full 300 dpi map. Very small-scale maps (such as world maps) are not included. The maps database originated over 30 years ago, but was only recently updated and connected to our main database. We welcome users to tell us if they see incorrect information or other problems with the maps; please use the Contact GVP link at the bottom of the page to send us email.
There are no samples for Guagua Pichincha in the Smithsonian's NMNH Department of Mineral Sciences Rock and Ore collection.
| Copernicus Browser | The Copernicus Browser replaced the Sentinel Hub Playground browser in 2023, to provide access to Earth observation archives from the Copernicus Data Space Ecosystem, the main distribution platform for data from the EU Copernicus missions. |
| MIROVA | Middle InfraRed Observation of Volcanic Activity (MIROVA) is a near real time volcanic hot-spot detection system based on the analysis of MODIS (Moderate Resolution Imaging Spectroradiometer) data. In particular, MIROVA uses the Middle InfraRed Radiation (MIR), measured over target volcanoes, in order to detect, locate and measure the heat radiation sourced from volcanic activity. |
| MODVOLC Thermal Alerts | Using infrared satellite Moderate Resolution Imaging Spectroradiometer (MODIS) data, scientists at the Hawai'i Institute of Geophysics and Planetology, University of Hawai'i, developed an automated system called MODVOLC to map thermal hot-spots in near real time. For each MODIS image, the algorithm automatically scans each 1 km pixel within it to check for high-temperature hot-spots. When one is found the date, time, location, and intensity are recorded. MODIS looks at every square km of the Earth every 48 hours, once during the day and once during the night, and the presence of two MODIS sensors in space allows at least four hot-spot observations every two days. Each day updated global maps are compiled to display the locations of all hot spots detected in the previous 24 hours. There is a drop-down list with volcano names which allow users to 'zoom-in' and examine the distribution of hot-spots at a variety of spatial scales. |
|
WOVOdat
Single Volcano View Temporal Evolution of Unrest Side by Side Volcanoes |
WOVOdat is a database of volcanic unrest; instrumentally and visually recorded changes in seismicity, ground deformation, gas emission, and other parameters from their normal baselines. It is sponsored by the World Organization of Volcano Observatories (WOVO) and presently hosted at the Earth Observatory of Singapore.
GVMID Data on Volcano Monitoring Infrastructure The Global Volcano Monitoring Infrastructure Database GVMID, is aimed at documenting and improving capabilities of volcano monitoring from the ground and space. GVMID should provide a snapshot and baseline view of the techniques and instrumentation that are in place at various volcanoes, which can be use by volcano observatories as reference to setup new monitoring system or improving networks at a specific volcano. These data will allow identification of what monitoring gaps exist, which can be then targeted by remote sensing infrastructure and future instrument deployments. |
| Volcanic Hazard Maps | The IAVCEI Commission on Volcanic Hazards and Risk has a Volcanic Hazard Maps database designed to serve as a resource for hazard mappers (or other interested parties) to explore how common issues in hazard map development have been addressed at different volcanoes, in different countries, for different hazards, and for different intended audiences. In addition to the comprehensive, searchable Volcanic Hazard Maps Database, this website contains information about diversity of volcanic hazard maps, illustrated using examples from the database. This site is for educational purposes related to volcanic hazard maps. Hazard maps found on this website should not be used for emergency purposes. For the most recent, official hazard map for a particular volcano, please seek out the proper institutional authorities on the matter. |
| IRIS seismic stations/networks | Incorporated Research Institutions for Seismology (IRIS) Data Services map showing the location of seismic stations from all available networks (permanent or temporary) within a radius of 0.18° (about 20 km at mid-latitudes) from the given location of Guagua Pichincha. Users can customize a variety of filters and options in the left panel. Note that if there are no stations are known the map will default to show the entire world with a "No data matched request" error notice. |
| UNAVCO GPS/GNSS stations | Geodetic Data Services map from UNAVCO showing the location of GPS/GNSS stations from all available networks (permanent or temporary) within a radius of 20 km from the given location of Guagua Pichincha. Users can customize the data search based on station or network names, location, and time window. Requires Adobe Flash Player. |
| DECADE Data | The DECADE portal, still in the developmental stage, serves as an example of the proposed interoperability between The Smithsonian Institution's Global Volcanism Program, the Mapping Gas Emissions (MaGa) Database, and the EarthChem Geochemical Portal. The Deep Earth Carbon Degassing (DECADE) initiative seeks to use new and established technologies to determine accurate global fluxes of volcanic CO2 to the atmosphere, but installing CO2 monitoring networks on 20 of the world's 150 most actively degassing volcanoes. The group uses related laboratory-based studies (direct gas sampling and analysis, melt inclusions) to provide new data for direct degassing of deep earth carbon to the atmosphere. |
| Large Eruptions of Guagua Pichincha | Information about large Quaternary eruptions (VEI >= 4) is cataloged in the Large Magnitude Explosive Volcanic Eruptions (LaMEVE) database of the Volcano Global Risk Identification and Analysis Project (VOGRIPA). |
| EarthChem | EarthChem develops and maintains databases, software, and services that support the preservation, discovery, access and analysis of geochemical data, and facilitate their integration with the broad array of other available earth science parameters. EarthChem is operated by a joint team of disciplinary scientists, data scientists, data managers and information technology developers who are part of the NSF-funded data facility Integrated Earth Data Applications (IEDA). IEDA is a collaborative effort of EarthChem and the Marine Geoscience Data System (MGDS). |

