Recently Published Bulletin Reports
Ambrym (Vanuatu) New effusive eruption during January 2024
Popocatepetl (Mexico) Daily gas-and-ash emissions, ashfall, and occasional explosions during August-November 2023
Reventador (Ecuador) Daily explosions, gas-and-ash emissions, and incandescent avalanches during August-November 2023
Erta Ale (Ethiopia) Strong lava lake activity and lava overflows during June-November 2023
Ubinas (Peru) New eruption with explosions and ash plumes during June-December 2023
Kanaga (United States) Small explosion on 18 December 2023
Klyuchevskoy (Russia) New eruption consisting of Strombolian activity, lava flows and fountains, and ash plumes during June-December 2023
Agung (Indonesia) Three eruptive events reported in April, May, and December 2022
Saunders (United Kingdom) Persistent thermal anomalies from the summit crater lava lake during February 2023-January 2024
Tengger Caldera (Indonesia) Minor ash emission in December 2023; persistent weak thermal anomaly in the Bromo crater
Shishaldin (United States) New eruption with significant Strombolian explosions, ash plumes, and ashfall
Ioto (Japan) New eruption with discolored water, ejecta, and floating pumice during October-December 2023
Ambrym (Vanuatu) — February 2024  Cite this Report
Ambrym
Vanuatu
16.25°S, 168.12°E; summit elev. 1334 m
All times are local (unless otherwise noted)
New effusive eruption during January 2024
Ambrym contains a 12-km-wide caldera and is part of the New Hebrides Arc, located in the Vanuatu archipelago. The two currently active craters within the caldera are Benbow and Marum, both of which have produced lava lakes, explosions, lava flows, and gas-and-ash emissions. The previous eruption occurred during late January 2022 and was characterized by ash plumes, sulfur dioxide plumes, and crater incandescence (BGVN 47:05). This report covers a new, short eruption during January 2024, which consisted of a lava effusion and an explosion. Information comes from the Vanuatu Meteorology and Geohazards Department (VMGD) and satellite data.
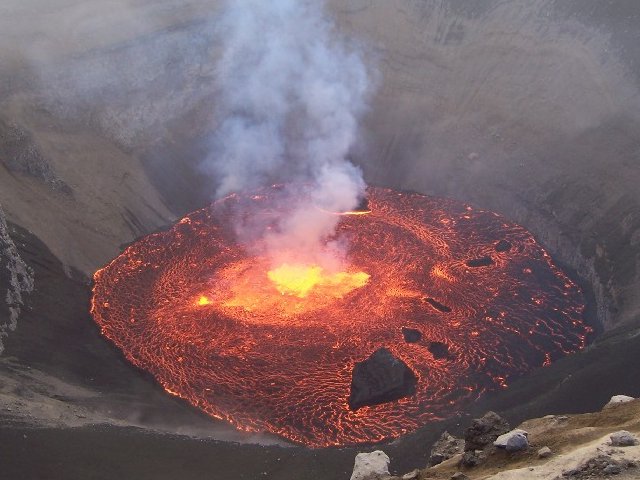
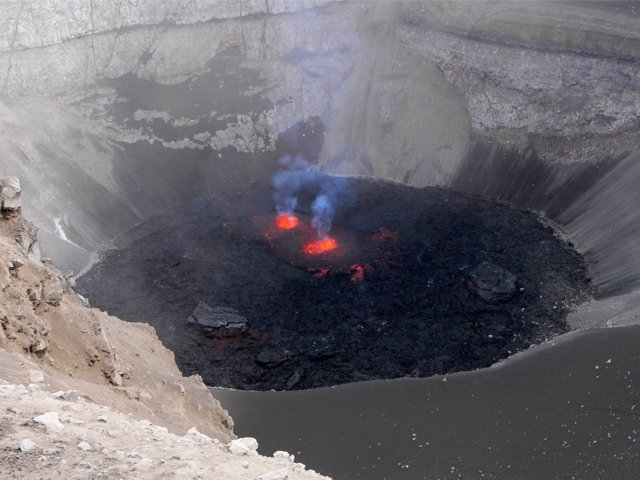
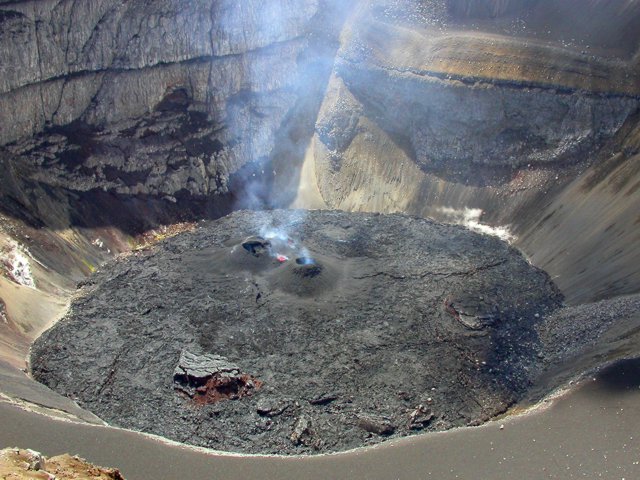
VMGD reported that at 2217 on 13 January an eruption began at Benbow Crater, based on webcam and seismic data. The eruption was characterized by a loud explosion, intense crater incandescence (figure 55), and gas-and-steam emissions. As a result, the Volcano Alert Level (VAL) was raised from 1 to 3 (on a scale of 0-5). A lava flow was reported in Benbow Crater, which lasted for four days. Satellite data showed that 1,116 tons of sulfur dioxide per day (t/d) were emitted on 14 January (figure 56). During the morning of 15 January, ground reports noted loud explosions and minor earthquakes. The sulfur dioxide flux on 15 January was 764 t/d. During 15-17 January activity decreased according to webcam images, seismic data, and field observations. No sulfur dioxide emissions were reported after 15 January. Gas-and-ash emissions also decreased, although they continued to be observed through 31 January, and crater incandescence was less intense (figure 57). The VAL was lowered to 2 on 17 January.
Geologic Background. Ambrym is a large basaltic volcano with a 12-km-wide caldera formed during a major Plinian eruption with dacitic pyroclastic flows about 1,900 years ago. A thick, almost exclusively pyroclastic sequence, initially dacitic then basaltic, overlies lava flows of a pre-caldera shield volcano. Post-caldera eruptions, primarily from Marum and Benbow cones, have partially filled the caldera floor and produced lava flows that ponded on the floor or overflowed through gaps in the caldera rim. Post-caldera eruptions have also formed a series of scoria cones and maars along a fissure system oriented ENE-WSW. Eruptions have been frequently reported since 1774, though mostly limited to extra-caldera eruptions that would have affected local populations. Since 1950 observations of eruptive activity from cones within the caldera or from flank vents have occurred almost yearly.
Information Contacts: Geo-Hazards Division, Vanuatu Meteorology and Geo-Hazards Department (VMGD), Ministry of Climate Change Adaptation, Meteorology, Geo-Hazards, Energy, Environment and Disaster Management, Private Mail Bag 9054, Lini Highway, Port Vila, Vanuatu (URL: http://www.vmgd.gov.vu/, https://www.facebook.com/VanuatuGeohazardsObservatory/); Copernicus Browser, Copernicus Data Space Ecosystem, European Space Agency (URL: https://dataspace.copernicus.eu/browser/).
Popocatepetl (Mexico) — January 2024 Cite this Report
Popocatepetl
Mexico
19.023°N, 98.622°W; summit elev. 5393 m
All times are local (unless otherwise noted)
Daily gas-and-ash emissions, ashfall, and occasional explosions during August-November 2023
Popocatépetl, located 70 km SE of Mexica City, Mexico, contains a 400 x 600 m-wide summit crater. Records of activity date back to the 14th century; three Plinian eruptions, the most recent of which took place about 800 CE, have occurred since the mid-Holocene, accompanied by pyroclastic flows and voluminous lahars that swept basins below the volcano. The current eruption period began in January 2005, characterized by numerous episodes of lava dome growth and destruction within the summit crater. Recent activity has been characterized by daily gas-and-ash emissions, ashfall, and explosions (BGVN 48:09). This report covers similar activity during August through November 2023, according to daily reports from Mexico's Centro Nacional de Prevención de Desastres (CENAPRED) and various satellite data.
Daily gas-and-steam emissions, containing some amount of ash, continued during August through November 2023. CENAPRED reported the number of low-intensity gas-and-ash emissions or “exhalations” and the minutes of tremor, which sometimes included harmonic tremor in their daily reports (figure 220). A total of 21 volcano-tectonic (VT) tremors were detected throughout the reporting period. The average number of exhalations was 117 per day, with a maximum number of 640 on 25 September. Frequent sulfur dioxide plumes that exceeded two Dobson Units (DU) and drifted in multiple directions were visible in satellite data from the TROPOMI instrument on the Sentinel-5P satellite (figure 221).
Activity during August was relatively low and mainly consisted of occasional explosions, ash emissions, and light ashfall. There were 30 explosions (25 minor explosions and four moderate explosions), and nine VT-type events detected. An average number of 60 exhalations occurred each day, which mostly consisted of water vapor, volcanic gases, and a small amount of ash. On 2 August the National Center for Communications and Civil Protection Operations (CENACOM) reported light ashfall in Ocuituco (22 km SW), Yecapixtla (31 km SW), Cuautla (43 km SW), and Villa de Ayala (47 km SW). On 7 August light ashfall was observed in Atlautla (16 km W). A minor explosion at 0305 on 11 August was accompanied by crater incandescence. Explosions at 0618 on 13 August produced a gas-and-ash plume that rose above the summit, and at 0736 another explosion produced a puff of gas-and-ash (figure 222). Two minor explosions were detected at 0223 and 0230 on 16 August that generated eruptive columns with low ash content rising 800 m and 700 m above the crater, respectively. On 24 August an eruptive event lasted 185 minutes and consisted of light ash emissions that did not exceed 300 m above the crater. According to the Washington VAAC, ash plumes identified in daily satellite images rose to 4.6-7.6 km altitude and drifted in multiple directions, the highest of which occurred on 29 August.
There was an average of 156 exhalations each day during September, a monthly total of seven VT-type events, and 29 explosions, 14 of which were minor and nine of which were moderate. A gas-and-ash plume rose to 2 km above the summit and drifted WSW at 1216 on 1 September. CENACOM reported at 1510 observations of ashfall in Ozumba (18 km W), Atlautla, Tepetlixpa (20 km W), and Ecatzingo (15 km SW), as well as in Morelos in Cuernavaca (65 km WSW), Temixco (67 km WSW), Huitzilac (67 km W), Tepoztlán (49 km W), and Jiutepec (59 km SW). The next day, gas-and-ash plumes rose to 2 km above the summit (figure 223). At 1100 ashfall was reported in Amecameca (15 km NW), Ayapango (24 km WNW), Ozumba, Juchitepec, Tenango del Aire (29 km WNW), Atlautla, and Tlalmanalco (27 km NW). A gas-and-ash plume rose to 1 km above the summit and drifted WNW at 1810. During 5-6, 8-9, 12, 14, 19, and 24-25 September ashfall was reported in Amecameca, Atlautla, Ozumba, Tenango del Aire, Tepetlixpa, Juchitepec, Cuernavaca, Ayala, Valle de Chalco (44 km NW), Ixtapaluca (42 km NW), La Paz (50 km NW), Chimalhuacán, Ecatepec, Nezahualcóyotl (60 km NW), Xochimilco (53 km SE), Huayapan, Tetela del Volcano (20 km SW), Yautepec (50 km WSW), Cuautla (43 km SW), Yecapixtla (30 km SW) and possibly Tlaltizapán (65 km SW), Tlaquiltenango, and Tepalcingo. According to the Washington VAAC, ash plumes identified in daily satellite images rose to 5.8-9.1 km altitude and drifted in multiple directions, the highest of which was identified during 1-2 August.
Activity during October and November was relatively low. An average of 179 exhalations consisting of gas-and-steam and ash emissions were reported during October and 73 during November. Only one VT-type event and two explosions were detected during October and four VT-type events and one explosion during November. A satellite image from 0101 on 14 October showed ash fanning out to the NW at 6.7 km altitude and an image from 0717 showed a continuously emitted ash plume drifting WNW and NW at the same altitude. Ash emissions at 1831 on 14 October were ongoing and visible in webcam images slowly drifting W at an altitude of 6.4 km altitude (figure 224). On 24 October a tremor sequence began at 0310 that generated a gas-and-ash plume that rose 800 m above the summit and drifted W. Another tremor sequence occurred during 1305-1900 on 25 October that consisted of continuous ash emissions. Ash plumes identified in daily satellite images rose to 5.5-8.5 km altitude and drifted in different directions during October, according to the Washington VAAC. The highest ash plume was detected on 23 October. During 10-13 November ash plumes rose to 6.7 km altitude and drifted N, NNW, NE, and NW. On 13 November a M 1.5 VT-type event was detected at 0339 and light ashfall was reported in Amecameca, Cocotitlán (34 km NW), and Tenango del Aire, and Ocuituco. On 14 November ash plumes rose to 6 km altitude and drifted N, NE, and SE and light ashfall was reported in Cuernavaca (64 km W). The Washington VAAC reported frequent ash plumes that rose to 5.8-7.9 km altitude and drifted in several directions; the highest ash plume was recorded on 28 November.
Satellite data. MODIS thermal anomaly data provided through MIROVA (Middle InfraRed Observation of Volcanic Activity) showed frequent low-to-moderate thermal anomalies during the reporting period (figure 225). The intensity of the anomalies was lower compared to previous months. According to data from MODVOLC thermal alerts, a total of ten hotspots were detected at the summit crater on 2 August and 2, 4, 9, 19, and 26 September. Thermal activity in the summit crater was visible in infrared satellite data and was sometimes accompanied by ash plumes, as shown on 17 November (figure 226).
Geologic Background. Volcán Popocatépetl, whose name is the Aztec word for smoking mountain, rises 70 km SE of Mexico City to form North America's 2nd-highest volcano. The glacier-clad stratovolcano contains a steep-walled, 400 x 600 m wide crater. The generally symmetrical volcano is modified by the sharp-peaked Ventorrillo on the NW, a remnant of an earlier volcano. At least three previous major cones were destroyed by gravitational failure during the Pleistocene, producing massive debris-avalanche deposits covering broad areas to the south. The modern volcano was constructed south of the late-Pleistocene to Holocene El Fraile cone. Three major Plinian eruptions, the most recent of which took place about 800 CE, have occurred since the mid-Holocene, accompanied by pyroclastic flows and voluminous lahars that swept basins below the volcano. Frequent historical eruptions, first recorded in Aztec codices, have occurred since Pre-Columbian time.
Information Contacts: Centro Nacional de Prevención de Desastres (CENAPRED), Av. Delfín Madrigal No.665. Coyoacan, México D.F. 04360, México (URL: http://www.cenapred.unam.mx/, Daily Report Archive https://www.gob.mx/cenapred/archivo/articulos); Washington Volcanic Ash Advisory Center (VAAC), Satellite Analysis Branch (SAB), NOAA/NESDIS OSPO, NOAA Science Center Room 401, 5200 Auth Rd, Camp Springs, MD 20746, USA (URL: www.ospo.noaa.gov/Products/atmosphere/vaac, archive at: http://www.ssd.noaa.gov/VAAC/archive.html); MIROVA (Middle InfraRed Observation of Volcanic Activity), a collaborative project between the Universities of Turin and Florence (Italy) supported by the Centre for Volcanic Risk of the Italian Civil Protection Department (URL: http://www.mirovaweb.it/); Hawai'i Institute of Geophysics and Planetology (HIGP) - MODVOLC Thermal Alerts System, School of Ocean and Earth Science and Technology (SOEST), Univ. of Hawai'i, 2525 Correa Road, Honolulu, HI 96822, USA (URL: http://modis.higp.hawaii.edu/); NASA Global Sulfur Dioxide Monitoring Page, Atmospheric Chemistry and Dynamics Laboratory, NASA Goddard Space Flight Center (NASA/GSFC), 8800 Greenbelt Road, Goddard, Maryland, USA (URL: https://so2.gsfc.nasa.gov/); Copernicus Browser, Copernicus Data Space Ecosystem, European Space Agency (URL: https://dataspace.copernicus.eu/browser/).
Reventador (Ecuador) — January 2024 Cite this Report
Reventador
Ecuador
0.077°S, 77.656°W; summit elev. 3562 m
All times are local (unless otherwise noted)
Daily explosions, gas-and-ash emissions, and incandescent avalanches during August-November 2023
Volcán El Reventador, located in Ecuador, is a stratovolcano with a 4-km-wide avalanche scarp open to the E that was formed by edifice collapse. The largest recorded eruption took place in 2002 producing a 17-km-high eruption column, pyroclastic flows that traveled as far as 8 km, and lava flows from summit and flank vents. Recorded eruptions date back to the 16th century and have been characterized by explosive events, lava flows, ash plumes, and lahars. Frequent lahars have built deposits on the scarp slope. The current eruption period began in July 2008 and has recently been characterized daily explosions, gas-and-ash emissions, and block avalanches (BGVN 48:08). This report covers similar activity during August through November 2023 using daily reports from Ecuador's Instituto Geofisico (IG-EPN) and satellite data.
During August through November 2023, IG-EPN reported daily explosions, gas-and-ash plumes that rose as high as 1.3 km above the crater, and frequent crater incandescence, often accompanied by incandescent block avalanches that affected one or multiple flanks. More daily explosions were detected during November, with an average total of 46 per day.
Table 19. Monthly summary of explosions and plume heights recorded at Reventador from August through November 2023. Data could not be collected for 29-30 September 2023 and 6-23 October 2023. Data courtesy of IG-EPN (August-November 2023 daily reports).
| Month |
Average number of explosions per day |
Max plume height above the crater rim (km) |
| Aug 2023 |
32 |
1.3 |
| Sep 2023 |
30 |
1 |
| Oct 2023 |
31 |
1.3 |
| Nov 2023 |
46 |
1.2 |
Activity during August consisted of 6-75 daily explosions, nighttime crater incandescence, and incandescent avalanches of material. Frequent seismicity was mainly characterized by long-period (LP) events, harmonic tremor (TRARM), tremor-type (TRE), and volcano tectonic (VT)-type events. Daily gas-and-ash emissions rose 200-1,300 m above the summit and drifted W, SW, NW, NE, N, and E, based on webcam and satellite images. The Washington VAAC also reported occasional ash plumes that rose 400-1,600 m above the crater and drifted NW. Avalanches of incandescent material were reported during 1-2, 6-7, 9-14, 16-17, 18-21, and 26-29 August, which traveled 500-900 m below the crater and affected multiple flanks (figure 180). During 24-25 August incandescent material was ejected 300 m above the crater.
Gas-and-ash emissions and seismicity characterized by LP, VT, TRARM, and TRE-type events continued during September; data were not available for 29-30 September. Daily gas-and-ash emissions rose 200-1,000 m above the crater and generally drifted W, NW, and SW (figure 181). Near-daily explosions ranged from 16-53 per day, often accompanied by incandescent avalanches, which affected one or multiple flanks and traveled 100-800 m below the crater. During 2-3 September incandescent material was ejected 200 m above the crater and was accompanied by blocks rolling down the flanks. During 16-17 September incandescent material was ejected 100-200 m above the crater and avalanches descended 600 m below the crater. During 21-22 and 24-26 September incandescent material was ejected 100-300 m above the crater. According to the Washington VAAC, ash plumes rose 700 m above the crater and drifted SW, W, and NW on 3, 16, and 20 September, respectfully.
During October, daily explosions, gas-and-ash plumes, and crater incandescence continued, with 16-40 explosions recorded each day (figure 182); data was not available for 6-23 October. Seismicity consisted of LP, TRE, and TRARM-type events. Gas-and-ash emissions rose 200-1,000 m above the crater and drifted W, SW, NW, SSW, NNW, and NE. The Washington VAAC reported that ash plumes rose 1-1.3 km above the crater and drifted W, SW, and NW during 1-5 October. During 30 September-1 October incandescent avalanches descended 700 m below the crater. Ejected material rose 200 m above the crater during 2-5 October and was accompanied by avalanches of material that traveled 250-600 m below the crater rim; incandescent avalanches were also reported during 23-29 October.
Daily explosions, LP, TRARM, VT, and TRE-type events, crater incandescence, and avalanches of material continued during November. There were 26-62 daily explosions detected throughout the month. Gas-and-ash emissions rose 300-1,200 m above the crater and drifted in different directions (figure 183). The Washington VAAC reported that ash plumes rose 700-1,620 m above the crater and drifted NW, W, WNW, SW, E, SE, and ESE. Frequent incandescent avalanches descended 500-1,000 m below the crater. Explosions ejected material 100-300 m above the crater during 4-7, 11-12, and 19-23 November.
Satellite data. MIROVA (Middle InfraRed Observation of Volcanic Activity) analysis of MODIS satellite data showed intermittent thermal anomalies of low-to-moderate power (figure 184). Thermal activity mainly consisted of incandescent avalanches descending the flanks due to the frequently detected explosions. The MODVOLC hotspot system identified a total of ten hotspots on 3 August, 7, 18, 12, 22, and 28 September, and 7, 9, and 19 November.
Geologic Background. Volcán El Reventador is the most frequently active of a chain of Ecuadorian volcanoes in the Cordillera Real, well east of the principal volcanic axis. The forested, dominantly andesitic stratovolcano has 4-km-wide avalanche scarp open to the E formed by edifice collapse. A young, unvegetated, cone rises from the amphitheater floor to a height comparable to the rim. It has been the source of numerous lava flows as well as explosive eruptions visible from Quito, about 90 km ESE. Frequent lahars in this region of heavy rainfall have left extensive deposits on the scarp slope. The largest recorded eruption took place in 2002, producing a 17-km-high eruption column, pyroclastic flows that traveled up to 8 km, and lava flows from summit and flank vents.
Information Contacts: Instituto Geofísico, Escuela Politécnica Nacional (IG-EPN), Casilla 17-01-2759, Quito, Ecuador (URL: http://www.igepn.edu.ec/); MIROVA (Middle InfraRed Observation of Volcanic Activity), a collaborative project between the Universities of Turin and Florence (Italy) supported by the Centre for Volcanic Risk of the Italian Civil Protection Department (URL: http://www.mirovaweb.it/); Hawai'i Institute of Geophysics and Planetology (HIGP) - MODVOLC Thermal Alerts System, School of Ocean and Earth Science and Technology (SOEST), Univ. of Hawai'i, 2525 Correa Road, Honolulu, HI 96822, USA (URL: http://modis.higp.hawaii.edu/).
Erta Ale (Ethiopia) — January 2024 Cite this Report
Erta Ale
Ethiopia
13.601°N, 40.666°E; summit elev. 585 m
All times are local (unless otherwise noted)
Strong lava lake activity and lava overflows during June-November 2023
Erta Ale in Ethiopia has a 50-km-wide edifice that rises more than 600 m from below sea level in the Danakil depression. The summit caldera is 0.7 x 1.6 km and contains at least two pit craters (North and South). Another larger 1.8 x 3.1-km-wide depression is located SE of the summit and is bounded by curvilinear fault scarps on the SE side. Lava flows from fissures have traveled into the caldera and locally overflowed the crater rim. The current eruption has been ongoing since 1967, with at least one long-term active lava lake present in the summit caldera. Recent fissure eruptions from 2017 have occurred on the SE flank (BGVN 42:07). Recent activity has been characterized by minor thermal activity at the S crater and an active lava lake at the N crater (BGVN 48:06). This report covers strong lava lake activity primarily at the N pit crater during June through November 2023 using information from satellite infrared data.
Infrared satellite images generally showed an active lava lake as the N pit crater and variable thermal activity at the S pit crater during the reporting period. On 7 June two strong thermal anomalies were detected at the S pit crater and two weaker anomalies were visible at the N pit crater. Those anomalies persisted throughout the month, although the intensity at each declined. On 2 July a possible lava lake was identified at the S pit crater, filling much of the crater. On 7 July both pit craters contained active lava lakes (figure 120). By 12 July the thermal activity decreased; two smaller anomalies were visible through the rest of the month at the S pit crater while the N pit crater showed evidence of cooling.
Renewed lava lake activity was identified at the N pit crater, based on a satellite image from 11 August, with two smaller anomalies visible at the S pit crater. By 16 August the lava lake in the N pit had begun to cool and only a small thermal anomaly was identified. Activity restarted on 21 August, filling much of the E and SE part of the N pit crater. The thermal activity at the N pit crater intensified on 31 August, particularly in the NW part of the crater. On 5 September lava filled much of the N pit crater, overflowing to the W and SW. During at least 10-20 September thermal activity at both craters were relatively low.
According to a satellite image on 25 September, strong thermal activity resumed when lava overflowed the N pit crater to the S, SW, and NE (figure 120). A satellite image taken on 5 October showed lava flows from the N had spilled into the S and begun to cool, accompanied by two weak thermal anomalies at the S pit crater. On 15 October lava flows again traveled SE and appeared to originate from the S pit crater (figure 120). Following these events, smaller thermal anomalies were visible on the SE rim of the N pit crater and within the S pit crater.
Lava was visible in the NW part of the N pit crater according to a satellite image taken on 4 November. By 9 November the intensity had decreased, and the lava appeared to cool through the rest of the month; young lava flows were visible along the W side of the S pit crater on 24 and 29 November. Lava flows occurred at the N pit crater trending NE-SW and along the E side on 29 November (figure 120).
During the reporting period, the MIROVA (Middle InfraRed Observation of Volcanic Activity) thermal detection system recorded consistent activity during the first half of 2023 (figure 121). Beginning in June 2023, thermal activity increased and remained variable in intensity through the end of the year indicating the presence of an active lava lake and lava flows. The MODVOLC thermal detection system registered a total of 63 anomalies during 7, 8, and 23 July, 10 and 18 August, 3, 5, 16, 23, 24, and 25 September, 15 and 20 October, and 21, 24, 26, 28, and 30 November. Some of these stronger thermal anomalies were also detected in Sentinel-2 infrared satellite images that showed an active lava lake at the N pit crater and subsequent lava overflows from both pit craters (figure 120).
Geologic Background. The Erta Ale basaltic shield volcano in Ethiopia has a 50-km-wide edifice that rises more than 600 m from below sea level in the Danakil depression. The volcano includes a 0.7 x 1.6 km summit crater hosting steep-sided pit craters. Another larger 1.8 x 3.1 km wide depression elongated parallel to the trend of the Erta Ale range is located SE of the summit and is bounded by curvilinear fault scarps on the SE side. Basaltic lava flows from these fissures have poured into the caldera and locally overflowed its rim. The summit caldera usually also holds at least one long-term lava lake that has been active since at least 1967, and possibly since 1906. Recent fissure eruptions have occurred on the N flank.
Information Contacts: MIROVA (Middle InfraRed Observation of Volcanic Activity), a collaborative project between the Universities of Turin and Florence (Italy) supported by the Centre for Volcanic Risk of the Italian Civil Protection Department (URL: http://www.mirovaweb.it/); Hawai'i Institute of Geophysics and Planetology (HIGP) - MODVOLC Thermal Alerts System, School of Ocean and Earth Science and Technology (SOEST), Univ. of Hawai'i, 2525 Correa Road, Honolulu, HI 96822, USA (URL: http://modis.higp.hawaii.edu/); Copernicus Browser, Copernicus Data Space Ecosystem, European Space Agency (URL: https://dataspace.copernicus.eu/browser/).
Ubinas
Peru
16.345°S, 70.8972°W; summit elev. 5608 m
All times are local (unless otherwise noted)
New eruption with explosions and ash plumes during June-December 2023
Ubinas, located in Peru, has had 24 eruptions since 1550, which more recently have been characterized by explosions, ash plumes, and lahars (BGVN 45:03). This report covers a new eruption during June through December 2023 based on reports from Instituto Geofisico del Peru (IGP), Instituto Geológico Minero y Metalúrgico (INGEMMET), and satellite data.
IGP reported that seismic unrest began on 17 May, followed by an increase in seismicity during the second half of the month. There were 168 volcano-tectonic (VT) earthquakes detected, which are associated with rock fracturing processes, and 171 long-period (LP) earthquakes recorded during 16-24 May, which are associated with the movement of volcanic fluid.
Seismicity and fumarolic activity at the crater level continued to increase during June. During 1-18 June there was an average of 631 VT-type earthquakes and 829 LP earthquakes recorded. Webcams showed gas-and-steam emissions rising 500 m above the summit and drifting SE. In addition, the maximum value of emitted sulfur dioxide during this period was 337 tons/day. During 19-22 June an average of 315 VT-type events and 281 LP-type events and tremor were reported. On 20 June the Gobierno Regional de Moquegua raised the Volcano Alert Level (VAL) to Yellow (the second level on a four-color scale), based on recommendations from IGP. Webcam images showed ash emissions rising 1 km above the summit and drifting E at 0011 on 22 June, which IGP reported marked the start of a new eruption. Sporadic and diffuse gas-and-ash emissions continued to rise 800-1,500 m above the summit through the rest of the month and drifted mainly E, N, NW, W, SW, and NE. During 23-25 June there was an average of 402 VT-type earthquakes and 865 LP-type events detected. During 26-28 June the earthquakes associated with ash emissions, which have been observed since 22 June, decreased, indicating the end of the phreatic phase of the eruption, according to IGP. A thermal anomaly was detected in the crater for the first time on 26 June and was periodically visible through 4 July (figure 61). During 29-30 June there was an average of 173 VT-type earthquakes and 351 LP-type events recorded, and sulfur dioxide values ranged between 600 t/d and 1,150 t/d. During this same time, seismicity significantly increased, with 173 VT-type earthquakes, 351 LP-type events, and harmonic tremor which signified rising magma. The Gobierno Regional de Moquegua raised the Alert Level to Orange (the third level on a four-color scale) on 30 June based on the recommendation from IGP and INGEMMET.
Activity during July consisted of continued seismicity and gas-and-ash emissions. Gas-and-ash emissions rose as high as 5 km above the summit and drifted as far as 40 km in different directions during 1, 4-6, 16, 20-23, 26, and 29 July, based on webcam and satellite images. During 1-2 July an average of 72 VT-type earthquakes and 114 LP-type events were detected. In addition, during that time, ashfall was reported in Ubinas (6.5 km SSE) and Querapi (4.5 km SE). During 2-3 July INGEMMET reported gas-and-ash plumes rose 400 m above the summit and drifted SW, causing ashfall in downwind areas as far as 5 km. During 3-4 July there was an average of 69 VT-type earthquakes and 96 LP-type events reported. On 4 July starting around 0316 there were 16 seismic signals associated with explosive activity and ash emissions detected (figure 62). According to INGEMMET an explosion ejected ballistics and generated a gas-and-ash plume that rose 5.5 km above the summit and drifted SW and S. Ashfall was recorded in Querapi, Ubinas, Sacohaya (7 km SSE), Anascapa (11 km SE), San Miguel (10 km SE), Tonohaya (7 km SSE), Huatahua, Huarina, Escacha (9 km SE), and Matalaque (17 km SSE), and was most significant within 5 km of the volcano. IGP noted that ash fell within a radius of 20 km and deposits were 1 mm thick in towns in the district of Ubinas.
During 5-9 July an average of 67 VT-type events and 47 LP-type events were reported. A period of continuous gas-and-ash emissions occurred on 5 July, with plumes drifting more than 10 km SE and E. A total of 11 seismic signals associated with explosions also detected on 6, 16, 17, and 22 July. On 6 July explosions recorded at 0747 and 2330 produced gas-and-ash plumes that rose as high as 3.5 km above the summit and drifted as far as 30 km NW, NE, SE, and S. According to the Washington VAAC the explosion at 0747 produced a gas-and-ash plume that rose to 9.1 km altitude and drifted SW, which gradually dissipated, while a lower-altitude plume rose to 7.6 km altitude and drifted NE. Gobierno Regional de Moquegua declared a state of emergency for districts in the Moquegua region, along with Coalaque Chojata, Icuña, Lloque, Matalaque, Ubinas, and Yunga of the General Sánchez Cerro province, to be in effect for 60 days. On 7 July an ash plume rose to 7.3 km altitude and drifted E at 0320. At 0900 and 1520 gas-and-steam plumes with diffuse ash rose to 6.7 km altitude and drifted SE. Small ash emissions were visible in satellite and webcam images at 0920 and 1520 on 8 July and rose as high as 6.4 km altitude and drifted SE. During 10-16 July there was an average of 80 VT-type earthquakes and 93 LP-type events reported. INGEMMET reported that during 9-11 July sulfur dioxide emissions were low and remained around 300 t/d.
During 17-23 July an average of 46 VT-type events and 122 LP-type events were detected. On 20 July at 0530 an explosion generated an ash plume that rose 3-4.5 km above the crater and drifted 65 km toward Arequipa. An explosion on 21 July at 0922 produced a gas-and-ash plume that rose 5 km above the summit (figure 63). Ashfall was reported in Querapi, Ubinas, Tonohaya, Anascapa, Sacohaya, San Miguel, Escacha, Huatagua (14 km SE), Huarina, Escacha (9 km SE), Matalaque, Logén, Santa Lucía de Salinas, and Salinas de Moche. An explosion on 22 July at 1323 generated an ash plume that rose 5.5 km above the summit and drifted NE, E, and SE. During 24-30 July there were five volcanic explosions detected and an average of 60 VT-type events and 117 LP-type events. An explosion on 29 July at 0957 produced an ash plume that rose 2.5 km above the summit and drifted as far as 40 km NE, E, and SE. As a result, significant ashfall was reported in Ubinas and Matalaque.
During August, explosions, gas-and-ash emissions, and seismic earthquakes persisted. During 31 July to 6 August there was an average of 115 VT-type events and 124 LP-type events reported. Gas-and-ash emissions were observed during 1, 6, 10, 13-14, 17-18, 21, and 23 August and they drifted as far as 20 km in different directions; on 14 and 18 August continuous ash emissions extended as far as 40 km S, SE, and NE. An explosion was detected at 2110 on 1 August, which generated a gas-and-ash plume that rose 5.4 km above the summit and drifted SE and E. The explosion ejected blocks and incandescent material as far as 3 km from the crater onto the SW, S, and SE flanks. Ashfall was reported in Ubinas and Chojata (19 km ESE). Gas-and-ash emissions rose as high as 2 km above the summit and drifted in different directions through 5 August, sometimes causing ashfall within a 15-km-radius. An explosion at 0009 on 6 August ejected blocks and produced a gas-and-ash plume that rose 1.4 km above the summit and drifted SE and E, which caused ashfall in Ubinas and Chojata and other areas within a 30-km radius. During 7-13 August there was an average of 102 VT-type events and 60 LP-type events detected. INGEMMET reported that sulfur dioxide emissions were low on 7 August and averaged 400 t/d.
One volcanic explosion that was recorded on 10 August, producing gas-and-ash emissions that rose 2.4 km above the summit and drifted as far as 25 km SE and E. Ashfall was observed in Ubinas, Matalaque, and Chojata. During 10-11 and 13-14 August sulfur dioxide values increased slightly to moderate levels of 2,400-3,700 t/d. The average number of VT-type events was 104 and the number of LP-type events was 71 during 14-21 August. Two explosions were detected at 0141 and 0918 on 21 August, which produced gas-and-ash emissions that rose 3.5 km above the summit and drifted 50 km N, NE, W, and NW (figure 64). The explosion at 0918 generated an ash plume that caused ashfall in different areas of San Juan de Tarucani. During 22-27 August the average number of VT-type events was 229 and the average number of LP-type events was 54. An explosion was reported at 1757 on 25 August, which generated a gas-and-ash plume that rose 4.2 km above the summit and drifted in multiple directions as far as 25 km. During 28 August through 3 September gas-and-ash emissions rose 600 m above the summit and drifted as far as 5 km E and SE. During this time, there was an average of 78 VT-type events and 42 LP-type events.
Gas-and-steam emissions rose 600-2,600 m above the summit and drifted as far as 15 km in multiple directions during September. During 4-10 and 11-17 September there was an average of 183 VT-type events and 27 LP-type events, and 114 VT-type events and 86 LP-type events occurred, respectively. On 14 September an explosion at 1049 generated a gas-and-ash plume that rose 2.6 km above the summit and drifted as far as 15 km E, NE, SE, and S (figure 65). During 14-16 September an average of three hours of seismic tremor related to ash emissions was recorded each day. During 18-24 September the average number of VT-type events was 187 and the average number of LP-type events was 45. During 25 September and 1 October, there was an average number of 129 VT-type events and 52 LP-type events detected.
Relatively low activity was reported during October; during 2-9 October there was an average number of 155 VT-type events and 27 LP-type events recorded. On 1 October at 1656 seismic signals associated with ash emissions were recorded for an hour and thirty minutes; the ash plumes rose as high as 1 km above the summit and drifted more than 10 km E, S, and SW. On 4 October IGP reported that an ash plume drifted more than 15 km SW and S. Sulfur dioxide emissions were 1,250 t/d on that day. On 7 October a gas-and-ash plume rose 1.9 km above the summit and drifted NE, E, and SE. On 4 October the amount of sulfur dioxide emissions was 1,250 t/d. During 10-15 October there was an average number of 225 VT-type events and 34 LP-type events recorded. On 11 October at 1555 a single seismic signal associated with an ash pulse was recorded; the gas-and-ash emissions rose 700 m above the summit and drifted SW and W. There was an average of 204 VT-type events and 25 LP-type events detected during 16-22 October and 175 VT-type events and 17 LP-type events during 23-29 October. On 27 October at 0043 a gas-and-ash emission rose 500 m above the summit and drifted SE and E. A minor thermal anomaly was visible on the crater floor. During 30 October to 5 November there was an average of 95 VT-type events and 24 LP-type events detected.
Activity remained relatively low during November and December and consisted mainly of gas-and-steam emissions and seismicity. Gas-and-steam emissions rose 900-1,100 m above the summit and drifted mainly E, SE, N, and NE. IGP detected an average of 166 VT-type events and 38 LP-type events during 6-15 November, 151 VT-type events and 17 LP-type events during 16-30 November, 143 VT-type events and 23 LP-type events during 1-15 December, and 129 VT-type events and 21 LP-type events during 16-31 December. No explosions or ash emissions were recorded during November. The VAL was lowered to Yellow (the second level on a four-color scale) during the first week of November. According to the Washington VAAC an ash emission was identified in a satellite image at 0040 on 11 December that rose to 5.5 km altitude and drifted NW. Webcam images at 0620 and 1220 showed continuous gas-and-steam emissions possibly containing some ash rising as high as 7 km altitude. Webcam images during 10-31 December showed continuous gas-and-ash emissions that rose as high as 2.5 km above the summit and drifted up to 5 km NW, W, and SW. On 12 December continuous ash emissions drifted more than 10 km N and NW.
Geologic Background. The truncated appearance of Ubinas, Perú's most active volcano, is a result of a 1.4-km-wide crater at the summit. It is the northernmost of three young volcanoes located along a regional structural lineament about 50 km behind the main volcanic front. The growth and destruction of Ubinas I was followed by construction of Ubinas II beginning in the mid-Pleistocene. The upper slopes of the andesitic-to-rhyolitic Ubinas II stratovolcano are composed primarily of andesitic and trachyandesitic lava flows and steepen to nearly 45°. The steep-walled, 150-m-deep summit crater contains an ash cone with a 500-m-wide funnel-shaped vent that is 200 m deep. Debris-avalanche deposits from the collapse of the SE flank about 3,700 years ago extend 10 km from the volcano. Widespread Plinian pumice-fall deposits include one from about 1,000 years ago. Holocene lava flows are visible on the flanks, but activity documented since the 16th century has consisted of intermittent minor-to-moderate explosive eruptions.
Information Contacts: Instituto Geofisico del Peru (IGP), Calle Badajoz N° 169 Urb. Mayorazgo IV Etapa, Ate, Lima 15012, Perú (URL: https://www.gob.pe/igp); Observatorio Volcanologico del INGEMMET (Instituto Geológical Minero y Metalúrgico), Barrio Magisterial Nro. 2 B-16 Umacollo - Yanahuara Arequipa, Peru (URL: http://ovi.ingemmet.gob.pe); Gobierno Regional Moquegua, Sede Principal De Moquegua, R377+5RR, Los Chirimoyos, Moquegua 18001, Peru (URL: https://www.gob.pe/regionmoquegua); Washington Volcanic Ash Advisory Center (VAAC), Satellite Analysis Branch (SAB), NOAA/NESDIS OSPO, NOAA Science Center Room 401, 5200 Auth Rd, Camp Springs, MD 20746, USA (URL: www.ospo.noaa.gov/Products/atmosphere/vaac, archive at: http://www.ssd.noaa.gov/VAAC/archive.html); MIROVA (Middle InfraRed Observation of Volcanic Activity), a collaborative project between the Universities of Turin and Florence (Italy) supported by the Centre for Volcanic Risk of the Italian Civil Protection Department (URL: http://www.mirovaweb.it/); Copernicus Browser, Copernicus Data Space Ecosystem, European Space Agency (URL: https://dataspace.copernicus.eu/browser/).
Kanaga (United States) — January 2024 Cite this Report
Kanaga
United States
51.923°N, 177.168°W; summit elev. 1307 m
All times are local (unless otherwise noted)
Small explosion on 18 December 2023
Kanaga lies within the Kanaton caldera at the northern tip of Kanaga Island. The caldera rim forms a 760-m-high arcuate ridge south and east of Kanaga; a lake occupies part of the SE caldera floor. Most of its previous recorded eruptions are poorly documented, although they date back to 1763. Fumarolic activity at Kanaga occurs in a circular, 200-m-wide, 60-m-deep summit crater and produces vapor plumes sometimes seen on clear days from Adak, 50 km to the east. Its most recent eruption occurred in February 2012, which consisted of numerous small earthquakes, a possible weak ash cloud, and gas-and-steam emissions (BGVN 38:03). This report covers a new eruption during December 2023, based on information from the Alaska Volcano Observatory (AVO).
A small explosion was detected in local infrasound and seismic data at 2231 on 18 December, followed by elevated seismicity. No ash emissions were visible in partly cloudy satellite images. On 19 December the Volcano Alert Level (VAL) was raised to Advisory (the second level on a four-level scale) and the Aviation Color Code (ACC) was raised to Yellow (the second color on a four-color scale). The rate of seismicity significantly declined after the 18th, although it remained elevated through 30 December. Small, daily earthquakes occurred during 19-28 December. Satellite observations following the event showed a debris flow extending 1.5 km down the NW flank. Possible minor gas-and-steam emissions were visible in a webcam image on 20 December. Weakly elevated surface temperatures were identified in satellite data during 23-26 December. A series of cracks extending from the inner crater to the upper SE flank and debris deposits on the upper flanks were observed in satellite images on 27 December. AVO reported that these were likely formed during the 18 December event. Local webcam and seismic data were temporarily offline due to a power failure during 4-28 January.
On 28 January connection to the seismic stations and webcams was restored and webcam images showed gas-and-steam emissions at the summit. Occasional earthquakes were also detected each day. A period of weak seismic tremor was observed on 31 January. During February, the number of earthquakes declined. On 27 February AVO lowered the VAL to Normal (the lowest level on a four-level scale) and the ACC to Green (the lowest color on a four-color scale) due to decreased levels of seismicity and no new surface changes or elevated temperatures based on satellite and webcam data.
Geologic Background. Symmetrical Kanaga stratovolcano is situated within the Kanaton caldera at the northern tip of Kanaga Island. The caldera rim forms a 760-m-high arcuate ridge south and east of Kanaga; a lake occupies part of the SE caldera floor. The volume of subaerial dacitic tuff is smaller than would typically be associated with caldera collapse, and deposits of a massive submarine debris avalanche associated with edifice collapse extend nearly 30 km to the NNW. Several fresh lava flows from historical or late prehistorical time descend the flanks of Kanaga, in some cases to the sea. Historical eruptions, most of which are poorly documented, have been recorded since 1763. Kanaga is also noted petrologically for ultramafic inclusions within an outcrop of alkaline basalt SW of the volcano. Fumarolic activity occurs in a circular, 200-m-wide, 60-m-deep summit crater and produces vapor plumes sometimes seen on clear days from Adak, 50 km to the east.
Information Contacts: Alaska Volcano Observatory (AVO), a cooperative program of a) U.S. Geological Survey, 4200 University Drive, Anchorage, AK 99508-4667 USA (URL: https://avo.alaska.edu/), b) Geophysical Institute, University of Alaska, PO Box 757320, Fairbanks, AK 99775-7320, USA, and c) Alaska Division of Geological & Geophysical Surveys, 794 University Ave., Suite 200, Fairbanks, AK 99709, USA (URL: http://dggs.alaska.gov/).
Klyuchevskoy (Russia) — January 2024 Cite this Report
Klyuchevskoy
Russia
56.056°N, 160.642°E; summit elev. 4754 m
All times are local (unless otherwise noted)
New eruption consisting of Strombolian activity, lava flows and fountains, and ash plumes during June-December 2023
Klyuchevskoy, located on the Kamchatka Peninsula, has produced frequent moderate-volume explosive and effusive eruptions and more than 100 flank eruptions have occurred during the past 3,000 years. Eruptions recorded since the late 17th century have resulted in frequent changes to the morphology of the 700-m-wide summit crater. Eruptions over the past 400 years have primarily originated from the summit crater, although numerous major explosive and effusive eruptions have also occurred from flank craters. The previous eruption ended in November 2022 and consisted of Strombolian activity (BGVN 47:12). This report covers a new eruption during June through December 2023, characterized by Strombolian explosions, lava flows, and ash plumes. Information primarily comes from weekly and daily reports from the Kamchatkan Volcanic Eruption Response Team (KVERT) and various satellite data.
KVERT reported that a Strombolian eruption began at 2323 on 22 June. A thermal anomaly was visible in satellite data starting on 22 June (figure 75). As a result, the Aviation Color Code (ACC) was raised to Yellow (the second lowest level on a four-color scale). During 4-6 and 13 July small ash clouds were occasionally observed over the crater. On 19 July a new lava flow began to effuse along the Apakhonchich drainage on the SE flank, which continued through 19 August. Lava fountaining was reported on 21 July in addition to the active lava flow, which continued through 23 August and during 27-30 August. During 22-23 and 27-30 August the lava flow was active along the Apakhonchich drainage on the SE flank.
Similar activity was observed during September. Lava fountaining resumed on 2 September and continued through 31 October. In addition, on 2 September a lava flow began to effuse along the Kozyrevsky drainage on the SW flank. During 3-5 September resuspended ash plumes rose to 3-3.5 km altitude and extended as far as 170 km E by 1940 on 4 September. The ACC was raised to Orange (the third level on a four-color scale) at 1240 on 4 September. The ACC was briefly lowered back to Yellow at 1954 that same day before returning to Orange during 1532-1808 on 5 September due to resuspended ash plumes that rose to 3 km altitude and drifted 120 km E at 1500. KVERT reported that Strombolian activity continued, feeding the lava flows advancing down the Apakhonchichsky and Kozyrevsky drainages through most of the month. During 25 September through 16 October the lava flow was only active in the Apakhonchichisky drainage (figure 76). During 9-12 September resuspended ash plumes rose to 1.5-4 km altitude and extended 550 km E and SE. On 22 September resuspended ash plumes rose to 2-2.5 km altitude and drifted 50-90 km E, which prompted KVERT to raise the ACC to Orange; the ACC was lowered back to Yellow on 24 September. On 29 September phreatic explosions generated ash plumes that rose to 5.2-5.3 km altitude.
Activity during October continued with lava fountains, lava flows, and ash plumes. Strombolian activity with lava fountains continued at the crater and active lava flows alternately descended the Apakhonchichisky and Kozyrevsky drainages on the SE and S flanks (figure 77). During 11-12 October gas-and-steam plumes containing some ash rose to 5.5-6 km altitude and extended as far as 65 km NE and SE. The ACC was raised to Orange on 11 October. According to observers at the Kamchatka Volcanological Station, lava effusion was almost continuous, and incandescent material was ejected as high as 300 m above the crater rim. On 13 October at 1420 an ash plume rose to 5-5.5 km altitude and drifted 90-100 km SE. During 14-16 October gas-and-steam plumes containing some ash rose to 4-6 km altitude and drifted 40-145 km ESE and E. On 16 October lava on the SE flank melted the snow and ice, causing phreatic explosions and large collapses of material from the margins of the flow. At 1500 an ash plume rose to 6.5-7 km altitude and drifted 70 km ENE. On 17 October an ash plume was reported extending 360 km NE. Gray-red ashfall was observed in Klyuchi at 0700; this ash was resuspended from older material.
During 22-31 October phreatic explosions generated ash plumes mainly containing ash from collapses of previously deposited pyroclastic material that rose to 7 km altitude and extended as far as 280 km NE, E, SW, and S on 23 and 29 October the ash plumes rose to 8 km altitude. Ash plumes during 27-29 October rose to 8 km altitude and drifted as far as 300 km SE, ESE, and E. Lava fountains rose up to 500 m above the crater during 27-31 October. Scientists from the Kamchatka Volcanological Station visited the volcano on 28 October and reported that the cinder cone at the summit had grown. They also observed advancing lava on the E flank that extended about 2 km from the summit to 2,700 m elevation, incandescent ejecta 500 m above the crater, and avalanches in the Apakhonchichsky drainage. On 31 October activity intensified, and lava flows were reported moving in the Kretovsky, Kozyrevsky, and Apakhonchichisky drainages on the NW, SW, and SE flanks. At 0930 an ash plume rose to 7 km altitude and at first drifted 169 km SW and then 646 km SE. KVERT reported ash plumes rose to 14 km altitude and extended as far as 1,500 km SSE. The ACC was raised to Red (the highest level on a four-color scale). During 31 October to 1 November ash plumes rose as high as 14 km altitude and drifted as far as 2,255 km ESE.
Activity on 1 November intensified. The lava fountains rose as high as 1 km above the summit (figure 78) and fed the lava flows that were active on the Kretovsky, Kozyrevsky, and Apakhonchichsky drainages on the NW, SW, and SE flanks. Ash plumes rose to 10-14 km altitude and drifted as far as 1,500 km SSE (figure 79). According to the Kamchatka Volcanological Station, observers reported pyroclastic flows descending the flanks. Lahars descended the Studenoy River, blocking the Kozyrevsky-Petropavlovsk federal highway and descended the Krutenkaya River, blocking the road E of Klyuchi. According to news articles the ash plumes caused some flight cancellations and disruptions in the Aleutians, British Columbia (Canada), and along flight paths connecting the Unites States to Japan and South Korea. Ash plumes containing old ash from collapses in the Apakhonchichsky drainage due to phreatic explosions rose to 9.5-9.8 km altitude and drifted 192 km SW at 1400 and to 8.7 km altitude and drifted 192 km SW at 1710 on 1 November.
On 2 November ash plumes rose to 6-14 km altitude; the ash plume that rose to 14 km altitude decreased to 6.5 km altitude and drifted NNE by 2000 and continued to drift more than 3,000 km ESE and E. The ACC was lowered to Orange. On 3 November ash plumes rose to 5-8.2 km altitude and drifted 72-538 km ENE, NNE, and ESE; at 0850 an ash plume rose to 6-6.5 km altitude and drifted more than 3,000 km ESE throughout the day. During 4-6 and 8-10 November resuspended ash plumes associated with collapses of old pyroclastic material from the sides of the Apakhonchichsky drainage due to phreatic explosions rose to 4.5-5.5 km altitude and extended 114-258 km NE, ENE, and E. KVERT reported that the eruption stopped on 5 November and the lava flows had begun to cool. Resuspended ash plumes rose to 5-6 km altitude and drifted 60 km E at 0820 on 13 November and to 5 km and 4.5 km altitude at 1110 and 1430 and drifted 140 km E and 150 km ESE, respectively. On 15 November the ACC was lowered to Green.
Activity was relatively low during most of December. On 27 December Strombolian activity resumed based on a thermal anomaly visible in satellite data. On 30 December an ash plume rose to 6 km altitude and extended 195 km NW. The ACC was raised to Orange. On 31 December video and satellite data showed explosions that generated ash plumes that rose to 5-6.5 km altitude and drifted 50-230 km WNW and NW. Though a thermal anomaly persisted through 1 January 2024, no explosions were detected, so the ACC was lowered to Yellow.
Satellite data. Thermal activity was strong throughout the reporting period due to frequent lava fountaining and lava flows. MODIS thermal anomaly data provided through MIROVA (Middle InfraRed Observation of Volcanic Activity) showed strong activity during the entire reporting period, resulting from lava fountaining and lava flows (figure 80). According to data from MODVOLC thermal alerts, a total of 336 hotspots were detected in June (3), July (30), August (11), September (52), October (217), and November (23). Thermal activity was also visible in infrared satellite images, often showing a strong thermal anomaly at the summit crater and a lava flow affecting primarily the SE and SW flanks (figure 81).
Geologic Background. Klyuchevskoy is the highest and most active volcano on the Kamchatka Peninsula. Since its origin about 6,000 years ago, this symmetrical, basaltic stratovolcano has produced frequent moderate-volume explosive and effusive eruptions without major periods of inactivity. It rises above a saddle NE of Kamen volcano and lies SE of the broad Ushkovsky massif. More than 100 flank eruptions have occurred during approximately the past 3,000 years, with most lateral craters and cones occurring along radial fissures between the unconfined NE-to-SE flanks of the conical volcano between 500 and 3,600 m elevation. Eruptions recorded since the late 17th century have resulted in frequent changes to the morphology of the 700-m-wide summit crater. These eruptions over the past 400 years have originated primarily from the summit crater, but have also included numerous major explosive and effusive eruptions from flank craters.
Information Contacts: Kamchatka Volcanic Eruptions Response Team (KVERT), Far Eastern Branch, Russian Academy of Sciences, 9 Piip Blvd., Petropavlovsk-Kamchatsky, 683006, Russia (URL: http://www.kscnet.ru/ivs/kvert/); Kamchatka Volcanological Station, Kamchatka Branch of Geophysical Survey, (KB GS RAS), Klyuchi, Kamchatka Krai, Russia (URL: http://volkstat.ru/); MIROVA (Middle InfraRed Observation of Volcanic Activity), a collaborative project between the Universities of Turin and Florence (Italy) supported by the Centre for Volcanic Risk of the Italian Civil Protection Department (URL: http://www.mirovaweb.it/); Hawai'i Institute of Geophysics and Planetology (HIGP) - MODVOLC Thermal Alerts System, School of Ocean and Earth Science and Technology (SOEST), Univ. of Hawai'i, 2525 Correa Road, Honolulu, HI 96822, USA (URL: http://modis.higp.hawaii.edu/); Copernicus Browser, Copernicus Data Space Ecosystem, European Space Agency (URL: https://dataspace.copernicus.eu/browser/).
Agung (Indonesia) — January 2024 Cite this Report
Agung
Indonesia
8.343°S, 115.508°E; summit elev. 2997 m
All times are local (unless otherwise noted)
Three eruptive events reported in April, May, and December 2022
Mount Agung, located on the E end of the island of Bali, Indonesia, rises above the SE rim of the Batur caldera. The summit area extends 1.5 km E-W, with the highest point on the W and a steep-walled 800-m-wide crater on the E. Recorded eruptions date back to the early 19th century. A large and deadly explosive and effusive eruption occurred during 1963-64, which was characterized by voluminous ashfall, pyroclastic flows, and lahars that caused extensive damage and many fatalities. More recent activity was documented during November 2017-June 2019 that consisted of multiple explosions, significant ash plumes, lava flows at the summit crater, and incandescent ejecta. This report covers activity reported during April-May 2022 and December 2022 based on data from the Darwin Volcanic Ash Advisory Center (VAAC).
Activity during 2022 was relatively low and mainly consisted of a few ash plumes during April-May and December. An ash plume on 3 April rising to 3.7 km altitude (700 m above the summit) and drifting N was reported in a Darwin VAAC notice based on a ground report, with ash seen in HIMAWARI-8 visible imagery. Another ash plume was reported at 1120 on 27 May that rose to 5.5 km altitude (2.5 m above the summit); the plume was not visible in satellite or webcam images due to weather clouds. An eruption was reported based on seismic data at 0840 on 13 December, with an estimated plume altitude of 3.7 km; however, no ash was seen using satellite imagery in clear conditions before weather clouds obscured the summit.
Geologic Background. Symmetrical Agung stratovolcano, Bali's highest and most sacred mountain, towers over the eastern end of the island. The volcano, whose name means "Paramount," rises above the SE rim of the Batur caldera, and the northern and southern flanks extend to the coast. The summit area extends 1.5 km E-W, with the high point on the W and a steep-walled 800-m-wide crater on the E. The Pawon cone is located low on the SE flank. Only a few eruptions dating back to the early 19th century have been recorded in historical time. The 1963-64 eruption, one of the largest in the 20th century, produced voluminous ashfall along with devastating pyroclastic flows and lahars that caused extensive damage and many fatalities.
Information Contacts: Darwin Volcanic Ash Advisory Centre (VAAC), Bureau of Meteorology, Northern Territory Regional Office, PO Box 40050, Casuarina, NT 0811, Australia (URL: http://www.bom.gov.au/info/vaac/).
Saunders (United Kingdom) — February 2024 Cite this Report
Saunders
United Kingdom
57.8°S, 26.483°W; summit elev. 843 m
All times are local (unless otherwise noted)
Persistent thermal anomalies from the summit crater lava lake during February 2023-January 2024
Saunders is one of eleven islands that comprise the South Sandwich Islands in the South Atlantic. The active Mount Michael volcano has been in almost continuous eruption since November 2014 (BGVN 48:02). Recent activity has resulted in intermittent thermal anomalies and gas-and-steam emissions (BGVN 47:03, 48:02). Visits are infrequent due to its remote location, and cloud cover often prevents satellite observations. Satellite thermal imagery and visual observation of incandescence during a research expedition in 2019 (BGVN 28:02 and 44:08) and a finding confirmed by a National Geographic Society research team that summited Michael in November 2022 reported the presence of a lava lake.
Although nearly constant cloud cover during February 2023 through January 2024 greatly limited satellite observations, thermal anomalies from the lava lake in the summit crater were detected on clear days, especially around 20-23 August 2023. Anomalies similar to previous years (eg. BGVN 48:02) were seen in both MIROVA (Middle InfraRed Observation of Volcanic Activity) data from MODIS instruments and in Sentinel 2 infrared imagery. The only notable sulfur dioxide plume detected near Saunders was on 25 September 2023, with the TROPOMI instrument aboard the Sentinel-5P satellite.
Geologic Background. Saunders Island consists of a large central volcanic edifice intersected by two seamount chains, as shown by bathymetric mapping (Leat et al., 2013). The young Mount Michael stratovolcano dominates the glacier-covered island, while two submarine plateaus, Harpers Bank and Saunders Bank, extend north. The symmetrical Michael has a 500-m-wide summit crater and a remnant of a somma rim to the SE. Tephra layers visible in ice cliffs surrounding the island are evidence of recent eruptions. Ash clouds were reported from the summit crater in 1819, and an effusive eruption was inferred to have occurred from a N-flank fissure around the end of the 19th century and beginning of the 20th century. A low ice-free lava platform, Blackstone Plain, is located on the north coast, surrounding a group of former sea stacks. A cluster of cones on the SE flank, the Ashen Hills, appear to have been modified since 1820 (LeMasurier and Thomson, 1990). Analysis of satellite imagery available since 1989 (Gray et al., 2019; MODVOLC) suggests frequent eruptive activity (when weather conditions allow), volcanic clouds, steam plumes, and thermal anomalies indicative of a persistent, or at least frequently active, lava lake in the summit crater. Due to this observational bias, there has been a presumption when defining eruptive periods that activity has been ongoing unless there is no evidence for at least 10 months.
Information Contacts: MIROVA (Middle InfraRed Observation of Volcanic Activity), a collaborative project between the Universities of Turin and Florence (Italy) supported by the Centre for Volcanic Risk of the Italian Civil Protection Department (URL: http://www.mirovaweb.it/); NASA Global Sulfur Dioxide Monitoring Page, Atmospheric Chemistry and Dynamics Laboratory, NASA Goddard Space Flight Center (NASA/GSFC), 8800 Greenbelt Road, Goddard MD 20771, USA (URL: https://so2.gsfc.nasa.gov/); Copernicus Browser (URL: https://dataspace.copernicus.eu/browser).
Tengger Caldera (Indonesia) — February 2024 Cite this Report
Tengger Caldera
Indonesia
7.942°S, 112.95°E; summit elev. 2329 m
All times are local (unless otherwise noted)
Minor ash emission in December 2023; persistent weak thermal anomaly in the Bromo crater
Tengger Caldera, located at the N end of a volcanic massif in Indonesia’s East Java, consists of five overlapping stratovolcanoes. The youngest and only active cone in the 16-km-wide caldera is Bromo, which typically produces gas-and-steam plumes, occasional ash plumes and explosions, and weak thermal signals (BGVN 44:05, 47:01). This report covers activity during January 2022-December 2023, consisting of mostly white gas-and-steam emissions and persistent weak thermal anomalies. Information was provided by the Pusat Vulkanologi dan Mitigasi Bencana Geologi (PVMBG, also known as Indonesian Center for Volcanology and Geological Hazard Mitigation, CVGHM) and satellite imagery. The Alert Level remained at 2 (on a scale of 1-4), and visitors were warned to stay at least 1 km from the crater.
Activity was generally low during the reporting period, similar to that in 2021. According to almost daily images from MAGMA Indonesia (a platform developed by PVMBG), white emissions and plumes rose from 50 to 900 m above the main crater during this period (figure 24). During several days in March and June 2022, white plumes reached heights of 1-1.2 km above the crater.
After an increase in activity at 2114 on 3 February 2023, a PVMBG team that was sent to observe white emissions rising as high as 300 m during 9-12 February and heard rumbling noises. A sulfur dioxide odor was also strong near the crater and measurements indicated that levels were above the healthy (non-hazardous) threshold of 5 parts per million; differential optical absorption spectroscopy (DOAS) measurements indicated an average flux of 190 metric tons per day on 11 February. Incandescence originating from a large fumarole in the NNW part of the crater was visible at night. The team observed that vegetation on the E caldera wall was yellow and withered. The seismic network recorded continuous tremor and deep and shallow volcanic earthquakes.
According to a PVMBG press release, activity increased on 13 December 2023 with white, gray, and brown emissions rising as high as 900 m above Bromo’s crater rim and drifting in multiple directions (figure 25). The report noted that tremor was continuous and was accompanied in December by three volcanic earthquakes. Deformation data indicated inflation in December. There was no observable difference in the persistent thermal anomaly in the crater between 11 and 16 December 2023.
All clear views of the Bromo crater throughout this time, using Sentinel-2 infrared satellite images, showed a weak persistent thermal anomaly; none of the anomalies were strong enough to cause MODVOLC Thermal Alerts. A fire in the SE part of the caldera in early September 2023 resulted in a brief period of strong thermal anomalies.
Geologic Background. The 16-km-wide Tengger caldera is located at the northern end of a volcanic massif extending from Semeru volcano. The massive volcanic complex dates back to about 820,000 years ago and consists of five overlapping stratovolcanoes, each truncated by a caldera. Lava domes, pyroclastic cones, and a maar occupy the flanks of the massif. The Ngadisari caldera at the NE end of the complex formed about 150,000 years ago and is now drained through the Sapikerep valley. The most recent of the calderas is the 9 x 10 km wide Sandsea caldera at the SW end of the complex, which formed incrementally during the late Pleistocene and early Holocene. An overlapping cluster of post-caldera cones was constructed on the floor of the Sandsea caldera within the past several thousand years. The youngest of these is Bromo, one of Java's most active and most frequently visited volcanoes.
Information Contacts: Pusat Vulkanologi dan Mitigasi Bencana Geologi (PVMBG, also known as Indonesian Center for Volcanology and Geological Hazard Mitigation, CVGHM), Jalan Diponegoro 57, Bandung 40122, Indonesia (URL: http://www.vsi.esdm.go.id/); MAGMA Indonesia, Kementerian Energi dan Sumber Daya Mineral (URL: https://magma.esdm.go.id/v1); Copernicus Browser, Copernicus Data Space Ecosystem, European Space Agency (URL: https://dataspace.copernicus.eu/browser/); Hawai'i Institute of Geophysics and Planetology (HIGP) - MODVOLC Thermal Alerts System, School of Ocean and Earth Science and Technology (SOEST), Univ. of Hawai'i, 2525 Correa Road, Honolulu, HI 96822, USA (URL: http://modis.higp.hawaii.edu/).
Shishaldin (United States) — December 2023 Cite this Report
Shishaldin
United States
54.756°N, 163.97°W; summit elev. 2857 m
All times are local (unless otherwise noted)
New eruption with significant Strombolian explosions, ash plumes, and ashfall
Shishaldin is located on the eastern half of Unimak Island, one of the Aleutian Islands. Frequent explosive activity, primarily consisting of Strombolian ash eruptions from the small summit crater, but sometimes producing lava flows, has been recorded since the 18th century. The previous eruption ended in May 2020 and was characterized by intermittent thermal activity, increased seismicity and surface temperatures, ash plumes, and ash deposits (BGVN 45:06). This report covers a new eruption during July through November 2023, which consisted of significant explosions, ash plumes, ashfall, and lava fountaining. Information comes from daily, weekly, and special reports from the Alaska Volcano Observatory (AVO) and various satellite data. AVO monitors the volcano using local seismic and infrasound sensors, satellite data, web cameras, and remote infrasound and lightning networks.
AVO reported that intermittent tremor and low-frequency earthquakes had gradually become more regular and consistent during 10-13 July. Strongly elevated surface temperatures at the summit were identified in satellite images during 10-13 July. On 11 July AVO raised the Aviation Color Code (ACC) to Yellow (the second color on a four-color scale) and Volcano Alert Level (VAL) to Advisory (the second level on a four-level scale) at 1439. Later in the day on 11 July summit crater incandescence was observed in webcam images. Observations of the summit suggested that lava was likely present at the crater, which prompted AVO to raise the ACC to Orange (the second highest color on a four-color scale) and the VAL to Watch (the second highest level on a four-level scale). The US Coast Guard conducted an overflight on 12 July and confirmed that lava was erupting from the summit. That same day, sulfur dioxide emissions were detected in satellite images.
A significant explosion began at 0109 on 14 July that produced an ash plume that rose to 9-12 km altitude and drifted S over the Pacific Ocean (figure 43). Webcam images and photos taken around 0700 from a ship SW off Unimak Island showed small lahar deposits, which were the result of the interaction of hot pyroclastic material and snow and ice on the flanks. There was also ashfall on the SW and N flanks. A smaller explosion at 0710 generated an ash plume that rose to 4.5 km altitude. Webcam images and pilot reports showed continued low-level ash emissions during the morning, rising to less than 4.6 km altitude; those emissions included a small ash plume near the summit around 1030 resulting from a small explosion.
Seismic tremor amplitude began increasing at around 1700 on 15 July; strongly elevated surface temperatures were also reported. An ash plume rose to 4.6 km altitude and drifted SSE at 2100, based on a satellite image. A continuous ash plume during 2150 through 2330 rose to 5 km altitude and extended 125 km S. At 2357 AVO raised the ACC to Red (the highest color on a four-color scale) and the VAL to Warning (the highest level on a four-level scale), noting that seismicity remained elevated for more than six hours and explosion signals were frequently detected by regional infrasound (pressure sensor) networks. Explosions generated an ash plume that rose to 4.9 km altitude and drifted as far as 500 km SE. Activity throughout the night declined and by 0735 the ACC was lowered to Orange and the VAL to Watch. High-resolution satellite images taken on 16 July showed pyroclastic deposits extending as far as 3 km from the vent; these deposits generated lahars that extended further down the drainages on the flanks. Ash deposits were mainly observed on the SSE flank and extended to the shore of Unimak Island. During 16-17 July lava continued to erupt at the summit, which caused strongly elevated surface temperatures that were visible in satellite imagery.
Lava effusion increased at 0100 on 18 July, as noted in elevated surface temperatures identified in satellite data, increasing seismic tremor, and activity detected on regional infrasound arrays. A significant ash plume at 0700 rose to 7 km altitude and continued until 0830, eventually reaching 9.1 km altitude and drifting SSE (figure 44). As a result, the ACC was raised to Red and the VAL to Warning. By 0930 the main plume detached, but residual low-level ash emissions continued for several hours, remaining below 3 km altitude and drifting S. The eruption gradually declined and by 1208 the ACC was lowered to Orange and the VAL was lowered to Watch. High-resolution satellite images showed ash deposits on the SW flank and pyroclastic deposits on the N, E, and S flanks, extending as far as 3 km from the vent; lahars triggered by the eruption extended farther down the flanks (figure 45). Lava continued to erupt from the summit crater on 19 July.
Elevated surface temperatures were detected in satellite images during 19-25 July, despite occasional weather cloud cover, which was consistent with increased lava effusion. During 22-23 July satellite observations acquired after the eruption from 18 July showed pyroclastic flow and lahar deposits extending as far as 3 km down the N, NW, and NE flanks and as far as 1.5 km down the S and SE flanks. Ash deposits covered the SW and NE flanks. No lava flows were observed outside the crater. On 22 July a sulfur dioxide plume was detected in satellite data midday that had an estimated mass of 10 kt. In a special notice issued at 1653 on 22 July AVO noted that eruptive activity had intensified over the previous six hours, which was characterized by an hours-long steady increase in seismic tremor, intermittent infrasound signals consistent with small explosions, and an increase in surface temperatures that were visible in satellite data. Pilots first reported low-level ash plumes at around 1900. At 2320 an ash plume had risen to 9 km altitude based on additional pilot reports and satellite images. The ACC was increased to Red and the VAL to Warning at 2343. Satellite images indicated growth of a significantly higher ash plume that rose to 11 km altitude continued until 0030 and drifted NE. During the early morning hours of 23 July ash plumes had declined to 4.6 k altitude. Seismic tremor peaked at 0030 on 23 July and began to rapidly decline at 0109; active ash emissions were no longer visible in satellite data by 0130. The ACC was lowered to Orange and the VAL to Watch at 0418; bursts of increased seismicity were recorded throughout the morning, but seismicity generally remained at low levels. Elevated surface temperatures were visible in satellite data until about 0600. On 24 July pilots reported seeing vigorous gas-and-steam plumes rising to about 3 km altitude; the plumes may have contained minor amounts of ash.
During 24-25 July low level seismicity and volcanic tremor were detected at low levels following the previous explosion on 23 July. Strongly elevated surface temperatures were observed at the summit crater in satellite data. Around 2200 on 25 July seismicity began to increase, followed by infrasound signals of explosions after 0200 on 26 July. An ash plume rose to 3 km altitude at 0500 and drifted ENE, along with an associated sulfur dioxide plume that drifted NE and had an estimated mass of 22 kt. Diffuse ash emissions were visible in satellite data and rose to 6.1-7.6 km altitude and extended 125 km from the volcano starting around 1130. These ash events were preceded by about seven hours of seismic tremor, infrasound detections of explosions, and five hours of increased surface temperatures visible in satellite data. Activity began to decline around 1327, which included low-frequency earthquakes and decreased volcanic tremor, and infrasound data no longer detected significant explosions. Surface temperatures remained elevated through the end of the month.
Seismicity, volcanic tremor, and ash emissions remained at low levels during early August. Satellite images on 1 August showed that some slumping had occurred on the E crater wall due to the recent explosive activity. Elevated surface temperatures continued, which was consistent with cooling lava. On 2 August small explosive events were detected, consistent with low-level Strombolian activity. Some episodes of volcanic tremor were reported, which reflected low-level ash emissions. Those ash emissions rose to less than 3 km altitude and drifted as far as 92.6 km N. Pilots that were located N of the volcano observed an ash plume that rose to 2.7 km altitude. Seismicity began to increase in intensity around 0900 on 3 August. Seismicity continued to increase throughout the day and through the night with strongly elevated surface temperatures, which suggested that lava was active at the surface.
An ash cloud that rose to 7.6-7.9 km altitude and drifted 60-75 km NE was visible in a satellite image at 0520 on 4 August. Pilots saw and reported the plume at 0836 (figure 46). By 0900 the plume had risen to 9.1 km altitude and extended over 100 km NE. AVO raised the ACC to Red and the VAL to Warning as a result. Seismic tremor levels peaked at 1400 and then sharply declined at 1500 to slightly elevated levels; the plume was sustained during the period of high tremor and drifted N and NE. The ACC was lowered to Orange and the VAL to Watch at 2055. During 5-14 August seismicity remained low and surface temperatures were elevated based on satellite data due to cooling lava. On 9 August a small lava flow was observed that extended from the crater rim to the upper NE flank. It had advanced to 55 m in length and appeared in satellite imagery on 11 August. Occasional gas-and-steam plumes were noted in webcam images. At 1827 AVO noted that seismic tremor had steadily increased during the afternoon and erupting lava was visible at the summit in satellite images.
Strong explosion signals were detected at 0200 on 15 August. An ash cloud that was visible in satellite data extended 100 km NE and may have risen as high as 11 km altitude around 0240. By 0335 satellite images showed the ash cloud rising to 7.6 km altitude and drifting NE. Significant seismicity and explosions were detected by the local AVO seismic and infrasound networks, and volcanic lightning was detected by the World Wide Lightning Location Network (WWLLN). A sulfur dioxide plume associated with the eruption drifted over the S Bering Sea and parts of Alaska and western Canada. Seismicity was significantly elevated during the eruption but had declined by 1322. A pilot reported that ash emissions continued, rising as high as 4.9 km altitude. Elevated surface temperatures detected in satellite data were caused by hot, eruptive material (pyroclastic debris and lava) that accumulated around the summit. Eruptive activity declined by 16 August and the associated sulfur dioxide plume had mostly dissipated; remnants continued to be identified in satellite images at least through 18 August. Surface temperatures remained elevated based on satellite images, indicating hot material on the upper parts of the volcano. Small explosions were detected in infrasound data on the morning of 19 August and were consistent with pilot reports of small, short-lived ash plumes that rose to about 4.3 km altitude. Low-level explosive activity was reported during 20-24 August, according to seismic and infrasound data, and weather clouds sometimes prevented views. Elevated surface temperatures were observed in satellite images, which indicated continued hot material on the upper parts of the volcano.
Seismic tremor began to increase at around 0300 on 25 August and was followed by elevated surface temperatures identified in satellite images, consistent with erupting lava. Small explosions were recorded in infrasound data. The ACC was raised to Red and the VAL to Warning at 1204 after a pilot reported an ash plume that rose to 9.1 km altitude. Seismicity peaked at 1630 and began to rapidly decline at around 1730. Ash plumes rose as high as 10 km altitude and drifted as far as 400 km NE. By 2020 the ash plumes had declined to 6.4 km altitude and continued to drift NE. Ash emissions were visible in satellite data until 0000 on 26 August and seismicity was at low levels. AVO lowered the ACC to Orange and the VAL to Watch at 0030. Minor explosive activity within the summit crater was detected during 26-28 August and strongly elevated surface temperatures were still visible in satellite imagery through the rest of the month. An AVO field crew working on Unimak Island observed a mass flow that descended the upper flanks beginning around 1720 on 27 August. The flow produced a short-lived ash cloud that rose to 4.5 km altitude and rapidly dissipated. The mass flow was likely caused by the collapse of spatter that accumulated on the summit crater rim.
Similar variable explosive activity was reported in September, although weather observations sometimes prevented observations. A moderate resolution satellite image from the afternoon of 1 September showed gas-and-steam emissions filling the summit crater and obscuring views of the vent. In addition, hot deposits from the previous 25-26 August explosive event were visible on the NE flank near the summit, based on a 1 September satellite image. On 2 and 4 September seismic and infrasound data showed signals of small, repetitive explosions. Variable gas-and-steam emissions from the summit were visible but there was no evidence of ash. Possible summit crater incandescence was visible in nighttime webcam images during 3-4 September.
Seismicity began to gradually increase at around 0300 on 5 September and activity escalated at around 0830. A pilot reported an ash plume that rose to 7.6 km altitude at 0842 and continued to rise as high as possibly 9.7 km altitude and drifted SSE based on satellite images (figure 47). The ACC was raised to Red and the VAL to Warning at 0900. In addition to strong tremor and sustained explosions, the eruption produced volcanic lightning that was detected by the WWLLN. Around 1100 seismicity decreased and satellite data confirmed that the altitude of the ash emissions had declined to 7.6 km altitude. By 1200 the lower-altitude portion of the ash plume had drifted 125 km E. Significant ash emissions ended by 1330 based on webcam images. The ACC was lowered to Orange and the VAL to Watch at 1440. Satellite images showed extensive pyroclastic debris flows on most of the flanks that extended 1.2-3.3 km from the crater rim.
During 6-13 September elevated surface temperatures continued to be observed in satellite data, seismicity remained elevated with weak but steady tremor, and small, low-frequency earthquakes and small explosions were reported, except on 12 September. On 6 September a low-level ash plume rose to 1.5-1.8 km altitude and drifted SSE. Occasional small and diffuse gas-and-steam emissions at the summit were visible in webcam images. Around 1800 on 13 September seismic tremor amplitudes began to increase, and small explosions were detected in seismic and infrasound data. Incandescent lava at the summit was seen in a webcam image taken at 0134 on 14 September during a period of elevated tremor. No ash emissions were reported during the period of elevated seismicity. Lava fountaining began around 0200, based on webcam images. Satellite-based radar observations showed that the lava fountaining activity led to the growth of a cone in the summit crater, which refilled most of the crater. By 0730 seismicity significantly declined and remained at low levels.
Seismic tremor began to increase around 0900 on 15 September and rapidly intensified. An explosive eruption began at around 1710, which prompted AVO to raise the ACC to Red and the VAL to Warning. Within about 30 minutes ash plumes drifted E below a weather cloud at 8.2 km altitude. The National Weather Service estimated that an ash-rich plume rose as high as 12.8 km altitude and produced volcanic lightning. The upper part of the ash plume detached from the vent around 1830 and drifted E, and was observed over the Gulf of Alaska. Around the same time, seismicity dramatically decreased. Trace ashfall was reported in the community of False Pass (38 km ENE) between 1800-2030 and also in King Cove and nearby marine waters. Activity declined at around 1830 although seismicity remained elevated, ash emissions, and ashfall continued until 2100. Lightning was again detected beginning around 1930, which suggested that ash emissions continued. Ongoing explosions were detected in infrasound data, at a lower level than during the most energetic phase of this event. Lightning was last detected at 2048. By 2124 the intensity of the eruption had decreased, and ash emissions were likely rising to less than 6.7 km altitude. Seismicity returned to pre-eruption levels. On 16 September the ACC was lowered to Orange and the VAL to Watch at 1244; the sulfur dioxide plume that was emitted from the previous eruption event was still visible over the northern Pacific Ocean. Elevated surface temperatures, gas-and-steam emissions from the vent, and new, small lahars were reported on the upper flanks based on satellite and webcam images. Minor deposits were reported on the flanks which were likely the result of collapse of previously accumulated lava near the summit crater.
Elevated seismicity with tremor, small earthquakes, and elevated surface temperatures were detected during 17-23 September. Minor gas-and-steam emissions were visible in webcam images. On 20 September small volcanic debris flows were reported on the upper flanks. On 21 September a small ash deposit was observed on the upper flanks extending to the NE based on webcam images. Seismic tremor increased significantly during 22-23 September. Regional infrasound sensors suggested that low-level eruptive activity was occurring within the summit crater by around 1800 on 23 September. Even though seismicity was at high levels, strongly elevated surface temperatures indicating lava at the surface were absent and no ash emissions were detected; weather clouds at 0.6-4.6 km altitude obscured views. At 0025 on 24 September AVO noted that seismicity continued at high levels and nearly continuous small infrasound signals began, likely from low-level eruptive activity. Strongly elevated surface temperatures were identified in satellite images by 0900 and persisted throughout the day; the higher temperatures along with infrasound and seismic data were consistent with lava erupting at the summit. Around 1700 similarly elevated surface temperatures were detected from the summit in satellite data, which suggested that more vigorous lava fountaining had started. Starting around 1800 low-level ash emissions rose to altitudes less than 4.6 km altitude and quickly dissipated.
Beginning at midnight on 25 September, a series of seismic signals consistent with volcanic flows were recorded on the N side of the volcano. A change in seismicity and infrasound signals occurred around 0535 and at 0540 a significant ash cloud formed and quickly reached 14 km altitude and drifted E along the Alaska Peninsula. The cloud generated at least 150 lightning strokes with thunder that could be heard by people in False Pass. Seismicity rapidly declined to near background levels around 0600. AVO increased the ACC to Red and the VAL to Warning at 0602. The ash cloud detached from the volcano at around 0700, rose to 11.6 km altitude, and drifted ESE. Trace to minor amounts of ashfall were reported by the communities of False Pass, King Cove, Cold Bay, and Sand Point around 0700. Ash emissions continued at lower altitudes of 6-7.6 km altitude at 0820. Small explosions at the vent area continued to be detected in infrasound data and likely represented low-level eruptive activity near the vent. Due to the significant decrease in seismicity and ash emissions the ACC was lowered to Orange and the VAL to Watch at 1234. Radar data showed significant collapses of the crater that occurred on 25 September. Satellite data also showed significant hot, degassing pyroclastic and lahar deposits on all flanks, including more extensive flows on the ENE and WSW sections below two new collapse scarps. Following the significant activity during 24-25 September, only low-level activity was observed. Seismicity decreased notably near the end of the strong activity on 25 September and continued to decrease through the end of the month, though tremor and small earthquakes were still reported. No explosive activity was detected in infrasound data through 2 October. Gas-and-steam emissions rose to 3.7 km altitude, as reported by pilots and seen in satellite images. Satellite data from 26 September showed that significant collapses had occurred at the summit crater and hot, steaming deposits from pyroclastic flows and lahars were present on all the flanks, particularly to the ENE and WSW. A small ash cloud was visible in webcam images on 27 September, likely from a collapse at the summit cone. High elevated surface temperatures were observed in satellite imagery during 27-28 September, which were likely the result of hot deposits on the flanks erupted on 25 September. Minor steaming at the summit crater and from an area on the upper flanks was visible in webcam images on 28 September.
During October, explosion events continued between periods of low activity. Seismicity significantly increased starting at around 2100 on 2 October; around the same time satellite images showed an increase in surface temperatures consistent with lava fountaining. Small, hot avalanches of rock and lava descended an unspecified flank. In addition, a distinct increase in infrasound, seismicity, and lightning detections was followed by an ash plume that rose to 12.2 km altitude and drifted S and E at 0520 on 3 October, based on satellite images. Nighttime webcam images showed incandescence due to lava fountaining at the summit and pyroclastic flows descending the NE flank. AVO reported that a notable explosive eruption started at 0547 and lasted until 0900 on 3 October, which prompted a rise in the ACC to Red and the VAL to Warning. Subsequent ash plumes rose to 6-7.6 km altitude by 0931. At 1036 the ACC was lowered back to Orange and the VAL to Watch since both seismic and infrasound data quieted substantially and were slightly above background levels. Gas-and-steam emissions were observed at the summit, based on webcam images. Trace amounts of ashfall were observed in Cold Bay. Resuspended ash was present at several kilometers altitude near the volcano. During the afternoon, low-level ash plumes were visible at the flanks, which appeared to be largely generated by rock avalanches off the summit crater following the explosive activity. These ash plumes rose to 3 km altitude and drifted W. Trace amounts of ashfall were reported by observers in Cold Bay and Unalaska and flights to these communities were disrupted by the ash cloud. Satellite images taken after the eruption showed evidence of pyroclastic flows and lahar deposits in drainages 2 km down the SW flank and about 3.2 km down the NE flank, and continued erosion of the crater rim. Small explosion craters at the end of the pyroclastic flows on the NE flank were noted for the first time, which may have resulted from gas-and-steam explosions when hot deposits interact with underlying ice.
During 4 October seismicity, including frequent small earthquakes, remained elevated, but was gradually declining. Ash plumes were produced for over eight hours until around 1400 that rose to below 3.7 km altitude. These ash plumes were primarily generated off the sides of the volcano where hot rock avalanches from the crater rim had entered drainages to the SW and NE. Two explosion craters were observed at the base of the NE deposits about 3.2 km from the crater rim. Webcam images showed the explosion craters were a source of persistent ash emissions; occasional collapse events also generated ash. Seismicity remained elevated with sulfur dioxide emissions that had a daily average of more than 1,000 tons per day, and frequent small earthquakes through the end of the month. Frequent elevated surface temperatures were identified in satellite images and gas-and-steam plumes were observed in webcam images, although weather conditions occasionally prevented clear views of the summit. Emissions were robust during 14-16 October and were likely generated by the interaction of hot material and snow and ice. During the afternoon of 21 October a strong gas-and-steam plume rose to 3-4.6 km altitude and extended 40 km WSW, based on satellite images and reports from pilots. On 31 October the ACC was lowered to Yellow and the VAL was lowered to Advisory.
Activity in November was characterized by elevated seismicity with ongoing seismic tremor and small, low-frequency earthquakes, elevated surface temperatures, and gas-and-steam emissions. There was an increase in seismic and infrasound tremor amplitudes starting at 1940 on 2 November. As a result, the ACC was again raised to Orange and the VAL was increased to Watch, although ash was not identified in satellite data. An ash cloud rose to 6.1 km altitude and drifted W according to satellite data at 2000. By 0831 on 3 November ash emissions were no longer visible in satellite images. On 6 and 9 November air pressure sensors detected signals consistent with small explosions. Small explosions were detected in infrasound data consistent with weak Strombolian activity on 19 and 21 November. Seismicity started to decrease on 21 November. On 25 November gas-and-steam emissions were emitted from the vent as well as from a scarp on the NE side of the volcano near the summit. A gas-and-steam plume extended about 50 km SSE and was observed in satellite and webcam images on 26 November. On 28 November small explosions were observed in seismic and local infrasound data and gas-and-steam emissions were visible from the summit and from the upper NE collapse scarp based on webcam images. Possible small explosions were observed in infrasound data on 30 November. Weakly elevated surface temperatures and a persistent gas-and-steam plume from the summit and collapse scarps on the upper flanks. A passing aircraft reported the gas-and-steam plume rose to 3-3.4 km altitude on 30 November, but no significant ash emissions were detected.
Satellite data. MODIS thermal anomaly data provided through MIROVA (Middle InfraRed Observation of Volcanic Activity) showed a strong pulse of thermal activity beginning in July 2023 that continued through November 2023 (figure 48). This strong activity was due to Strombolian explosions and lava fountaining events at the summit crater. According to data from MODVOLC thermal alerts, a total of 101 hotspots were detected near the summit crater in July (11-14, 16-19, 23-24 and 26), August (4, 25-26, and 29), September (5, 12, and 17), and October (3, 4, and 8). Infrared satellite data showed large lava flows descending primarily the northern and SE flanks during the reporting period (figure 49). Sulfur dioxide plumes often exceeded two Dobson Units (DUs) and drifted in different directions throughout the reporting period, based on satellite data from the TROPOMI instrument on the Sentinel-5P satellite (figure 50).
Geologic Background. The symmetrical glacier-covered Shishaldin in the Aleutian Islands is the westernmost of three large stratovolcanoes in the eastern half of Unimak Island. The Aleuts named the volcano Sisquk, meaning "mountain which points the way when I am lost." Constructed atop an older glacially dissected edifice, it is largely basaltic in composition. Remnants of an older edifice are exposed on the W and NE sides at 1,500-1,800 m elevation. There are over two dozen pyroclastic cones on its NW flank, which is covered by massive aa lava flows. Frequent explosive activity, primarily consisting of Strombolian ash eruptions from the small summit crater, but sometimes producing lava flows, has been recorded since the 18th century. A steam plume often rises from the summit crater.
Information Contacts: Alaska Volcano Observatory (AVO), a cooperative program of a) U.S. Geological Survey, 4200 University Drive, Anchorage, AK 99508-4667 USA (URL: https://avo.alaska.edu/), b) Geophysical Institute, University of Alaska, PO Box 757320, Fairbanks, AK 99775-7320, USA, and c) Alaska Division of Geological & Geophysical Surveys, 794 University Ave., Suite 200, Fairbanks, AK 99709, USA (URL: http://dggs.alaska.gov/); MIROVA (Middle InfraRed Observation of Volcanic Activity), a collaborative project between the Universities of Turin and Florence (Italy) supported by the Centre for Volcanic Risk of the Italian Civil Protection Department (URL: http://www.mirovaweb.it/); Hawai'i Institute of Geophysics and Planetology (HIGP) - MODVOLC Thermal Alerts System, School of Ocean and Earth Science and Technology (SOEST), Univ. of Hawai'i, 2525 Correa Road, Honolulu, HI 96822, USA (URL: http://modis.higp.hawaii.edu/); NASA Global Sulfur Dioxide Monitoring Page, Atmospheric Chemistry and Dynamics Laboratory, NASA Goddard Space Flight Center (NASA/GSFC), 8800 Greenbelt Road, Goddard, Maryland, USA (URL: https://so2.gsfc.nasa.gov/); Copernicus Browser, Copernicus Data Space Ecosystem, European Space Agency (URL: https://dataspace.copernicus.eu/browser/).
Ioto
Japan
24.751°N, 141.289°E; summit elev. 169 m
All times are local (unless otherwise noted)
New eruption with discolored water, ejecta, and floating pumice during October-December 2023
Ioto (Iwo-jima), located about 1,200 km S of Tokyo, lies within a 9-km-wide submarine caldera along the Izu-Bonin-Mariana volcanic arc. Previous eruptions date back to 1889 and have consisted of dominantly phreatic explosions, pumice deposits during 2001, and discolored water. A submarine eruption during July through December 2022 was characterized by discolored water, pumice deposits, and gas emissions (BGVN 48:01). This report covers a new eruption during October through December 2023, which consisted of explosions, black ejecta, discolored water, and floating pumice, based on information from the Japan Meteorological Association (JMA), the Japan Coast Guard (JCG), and satellite data.
JMA reported that an eruption had been occurring offshore of Okinahama on the SE side of the island since 21 October, which was characterized by volcanic tremor, according to the Japan Maritime Self-Defense Force (JMSDF) Iwo Jima Air Base (figure 22). According to an 18 October satellite image a plume of discolored water at the site of this new eruption extended NE (figure 23). During an overflight conducted on 30 October, a vent was identified about 1 km off the coast of Okinahama. Observers recorded explosions every few minutes that ejected dark material about 20 m above the ocean and as high as 150 m. Ejecta from the vent formed a black-colored island about 100 m in diameter, according to observations conducted from the air by the Earthquake Research Institute of the University of Tokyo in cooperation with the Mainichi newspaper (figure 24). Occasionally, large boulders measuring more than several meters in size were also ejected. Observations from the Advanced Land Observing Satellite Daichi-2 and Sentinel-2 satellite images also confirmed the formation of this island (figure 23). Brown discolored water and floating pumice were present surrounding the island.
The eruption continued during November. During an overflight on 3 November observers photographed the island and noted that material was ejected 169 m high, according to a news source. Explosions gradually became shorter, and, by the 3rd, they occurred every few seconds; dark and incandescent material were ejected about 800 m above the vent. On 4 November eruptions were accompanied by explosive sounds. Floating, brown-colored pumice was present in the water surrounding the island. There was a brief increase in the number of volcanic earthquakes during 8-14 November and 24-25 November. The eruption temporarily paused during 9-11 November and by 12 November eruptions resumed to the W of the island. On 10 November dark brown-to-dark yellow-green discolored water and a small amount of black floating material was observed (figure 25). A small eruption was reported on 18 November off the NE coast of the island, accompanied by white gas-and-steam plumes (figure 23). Another pause was recorded during 17-19 November, which then resumed on 20 November and continued erupting intermittently. According to a field survey conducted by the National Institute for Disaster Prevention Science and Technology on 19 November, a 30-m diameter crater was visible on the NE coast where landslides, hot water, and gray volcanic ash containing clay have occurred and been distributed previously. Erupted blocks about 10 cm in diameter were distributed about 90-120 m from the crater. JCG made observations during an overflight on 23 November and reported a phreatomagmatic eruption. Explosions at the main vent generated dark gas-and-ash plumes that rose to 200 m altitude and ejected large blocks that landed on the island and in the ocean (figure 26). Discolored water also surrounded the island. The size of the new island had grown to 450 m N-S x 200 m E-W by 23 November, according to JCG.
The eruption continued through 11 December, followed by a brief pause in activity, which then resumed on 31 December, according to JMA. Intermittent explosions produced 100-m-high black plumes at intervals of several minutes to 30 minutes during 1-10 December. Overflights were conducted on 4 and 15 December and reported that the water surrounding the new island was discolored to dark brown-to-dark yellow-green (figure 27). No floating material was reported during this time. In comparison to the observations made on 23 November, the new land had extended N and part of it had eroded away. In addition, analysis by the Geospatial Information Authority of Japan using SAR data from Daichi-2 also confirmed that the area of the new island continued to decrease between 4 and 15 December. Ejected material combined with wave erosion transformed the island into a “J” shape, 500-m-long and with the curved part about 200 m offshore of Ioto. The island was covered with brown ash and blocks, and the surrounding water was discolored to greenish-brown and contained an area of floating pumice. JCG reported from an overflight on 4 December that volcanic ash-like material found around the S vent on the NE part of the island was newly deposited since 10 November (figure 28). By 15 December the N part of the “J” shaped island had separated and migrated N, connecting to the Okinahama coast and the curved part of the “J” had eroded into two smaller islands (figure 27).
References. Ukawa, M., Fujita, E., Kobayashi, T., 2002, Recent volcanic activity of Iwo Jima and the 2001 eruption, Monthly Chikyu, Extra No. 39, 157-164.
Geologic Background. Ioto, in the Volcano Islands of Japan, lies within a 9-km-wide submarine caldera. The volcano is also known as Ogasawara-Iojima to distinguish it from several other "Sulfur Island" volcanoes in Japan. The triangular, low-elevation, 8-km-long island narrows toward its SW tip and has produced trachyandesitic and trachytic rocks that are more alkalic than those of other volcanoes in this arc. The island has undergone uplift for at least the past 700 years, accompanying resurgent doming of the caldera; a shoreline landed upon by Captain Cook's surveying crew in 1779 is now 40 m above sea level. The Motoyama plateau on the NE half of the island consists of submarine tuffs overlain by coral deposits and forms the island's high point. Many fumaroles are oriented along a NE-SW zone cutting through Motoyama. Numerous recorded phreatic eruptions, many from vents on the W and NW sides of the island, have accompanied the uplift.
Information Contacts: Japan Meteorological Agency (JMA), 1-3-4 Otemachi, Chiyoda-ku, Tokyo 100-8122, Japan (URL: http://www.jma.go.jp/jma/indexe.html); Japan Coast Guard (JCG) Volcano Database, Hydrographic and Oceanographic Department, 3-1-1, Kasumigaseki, Chiyoda-ku, Tokyo 100-8932, Japan (URL: https://www1.kaiho.mlit.go.jp/GIJUTSUKOKUSAI/kaiikiDB/kaiyo22-2.htm); Copernicus Browser, Copernicus Data Space Ecosystem, European Space Agency (URL: https://dataspace.copernicus.eu/browser/); Asahi, 5-3-2, Tsukiji, Chuo Ward, Tokyo, 104-8011, Japan (URL: https://www.asahi.com/ajw/articles/15048458).
Search Bulletin Archive by Publication Date
Select a month and year from the drop-downs and click "Show Issue" to have that issue displayed in this tab.
The default month and year is the latest issue available.
Bulletin of the Global Volcanism Network - Volume 31, Number 01 (January 2006)
Ambae (Vanuatu)
Crater-lake photos and satellite temperatures data show ongoing activity
Augustine (United States)
January 2006 eruptions; pyroclastic flows, ash plumes, and aviation hazards
Barren Island (India)
November 2005-January 2006 ash emissions, lava flows, and pyroclastics
Cleveland (United States)
6 February 2006 eruption on remote, non-instrumented island
Galeras (Colombia)
Eruption begins on 24 November 2005 sending ash plumes into air
Karthala (Union of the Comoros)
Looking at the 2005 eruption's precursors, deposits, and human impact
Lamongan (Indonesia)
Above-background seismicity during 5-6 January 2005
Lopevi (Vanuatu)
Correction to previously published MODIS hotspot data
Nyamulagira (DR Congo)
To the N, swarms of long-period, along-rift earthquakes
Nyiragongo (DR Congo)
Continuous ash plumes and active lava lake
Santa Ana (El Salvador)
Post-eruption lahars but seismicity and SO2 fluxes both often low
Tanaga (United States)
Weak, moderate depth seismicity
Ambae
Vanuatu
15.389°S, 167.835°E; summit elev. 1496 m
All times are local (unless otherwise noted)
Crater-lake photos and satellite temperatures data show ongoing activity
As previously reported, a new eruption at Aoba began 27 November 2005 in one of the crater lakes (Lake Voui). The eruption formed a cinder cone in the lake (figures 23 and 24) that contained a crater with a small hot lake (BGVN 30:11 and 30:12).
On 31 January a high, dark ash plume caused ashfall in the S part of the island. Small eruptions continued in February.
Alain Bernard recently processed a 26 January 2006 nighttime ASTER (Advanced Spaceborne Thermal Emission and Reflection Radiometer) image. Figure 25 shows the ASTER product called AST_04 (TIR?thermal infrared radiometer, 8.12-11.65 ?m wavelengths?band 10) unprocessed image of Aoba with Lakes Voui and Lakua. The TIR bands, with a spatial resolution of 90 m, give the ability to detect small thermal anomalies (a few degrees C), perform thermal mapping, and monitor temporal variations in the lake surface temperature. As shown in figure 26, Lake Voui's temperature in early January 2006 dropped by ~ 10°C to a mean of 25.4°C (down from 35.7°C one month earlier). Temperature differences between Voui and Lakua dropped to 4.3°C, reaching almost to the background levels observed in July 2005 (see plot "Temperature data from Lake Voui at Aoba, October 1998-December 2005 . . ."; BGVN 30:11). There is still a strong thermal anomaly of 46.1°C inside the new island (figure 13).
As of 11 February 2006 at 1011 hours (10 February 2006 at 2311 UTC), Alain Bernard reported that Lakes Voui and Lakua temperatures were, respectively, 27.2°C and 23.2°C (delta T = 4°C). The maximum temperature for the mud pool was ~ 57°C.
Geologic Background. The island of Ambae, also known as Aoba, is a massive 2,500 km3 basaltic shield that is the most voluminous volcano of the New Hebrides archipelago. A pronounced NE-SW-trending rift zone with numerous scoria cones gives the 16 x 38 km island an elongated form. A broad pyroclastic cone containing three crater lakes (Manaro Ngoru, Voui, and Manaro Lakua) is located at the summit within the youngest of at least two nested calderas, the largest of which is 6 km in diameter. That large central edifice is also called Manaro Voui or Lombenben volcano. Post-caldera explosive eruptions formed the summit craters about 360 years ago. A tuff cone was constructed within Lake Voui (or Vui) about 60 years later. The latest known flank eruption, about 300 years ago, destroyed the population of the Nduindui area near the western coast.
Information Contacts: Alain Bernard, IAVCEI Commission on Volcanic Lakes, Université Libre de Bruxelles (ULB), CP160/02, avenue F.D. Roosevelt 50, Brussels, Belgium (URL: http://www.ulb.ac.be/sciences/cvl/aoba/Ambae1.html, http://www.ulb.ac.be/sciences/cvl/multispectral/multispectral2.htm); Esline Garaebiti, Department of Geology, Mines, and Water Resources (DGMWR), Port-Vila, Vanuatu.
Augustine (United States) — January 2006 Cite this Report
Augustine
United States
59.3626°N, 153.435°W; summit elev. 1218 m
All times are local (unless otherwise noted)
January 2006 eruptions; pyroclastic flows, ash plumes, and aviation hazards
Following a period of increased seismicity at Augustine that began in May 2005, discrete seismic events on 9 and 11 December may have perturbed the hydrothermal system, initiating small steam explosions. On 12 December, a plume extended 75 km SE of the volcano, and its S and E flanks were dusted with ash (likely non-juvenile). Additional steam explosions took place later in the month, and the smell of sulfur was reported by residents in villages on the E side of Cook Inlet. The first major eruptions at Augustine occurred on 11 January 2006, when two discrete explosions produced an ash cloud that reached 9 km altitude (BGVN 30:12) and the Concern Color Code was raised to Red. Further eruptions occurred on 13, 14, and 17 January. After the eruption at 0758 on 17 January, seismicity diminished significantly and AVO lowered the color code from Red to Orange late on 18 January.
By the morning of 19 January seismicity remained fixed at lower levels; it decreased further on 20 January but was still above background. Periods of quiescence and low seismicity in the intervals between eruptive events are not unusual at Augustine, having occurred during the 1976 and 1986 eruptive episodes. During 23-26 January, satellite observations indicated the persistence of faint thermal anomalies and steaming continued at the summit.
Occasional intervals of increased seismicity were observed for the next few days. On 27 January 2006 an explosive eruption began at about 2000 and lasted for 9 minutes. AVO raised the color code from Orange to Red. According to the National Weather Service (NWS), an ash cloud reached a maximum altitude of around 9 km and drifted SE. Augustine erupted again at 2337 on 27 January 2006. This event lasted 1 minute and no ash was detected above 3 km. A third eruption occurred at 0204 on 28 January 2006 and lasted 2 minutes. Ash drifted SE at an altitude of about 8 km according to NWS. A fourth eruption occurred at 0742 on 28 January and lasted 3 minutes; the ash cloud drifted SE at a maximum altitude of 7.5 km.
Another explosive event began at 1430 on 28 January. Seismic activity continued and continuous ash emission was observed in AVO web camera images. NWS reported ash to 9 km altitude travelling SSW. Following this explosion, Augustine was in a state of continuous eruption accompanied by persistent ash emission until around 3 February.
Overflight observations on 29 January suggested that pyroclastic flows were being produced. NWS radar indicated that ash clouds from events at 1117 on 29 January, and 0325 and 0621 on 30 January, rose to 7.5 km altitude. Other than during these three events an ash-rich plume rose to about 4 km altitude. On 30 January, Alaska Airlines canceled all flights into and out of Anchorage because of the potential danger of ash. Flights resumed on 31 January.
On 1 February AVO lowered the Concern Color Code from Red to Orange. Although seismic data indicated sustained eruptive activity, ash clouds to altitudes greater than 4.5 km altitude had not been observed on NWS radar since 0621 on 30 January. Low-level explosions, pyroclastic flows, and production of ash continued (figure 26).
By 3 February seismic data indicated that low-level explosions, block-and-ash-flows, and sustained production of ash were continuing intermittently and had changed little in character or intensity since 1 February. Seismicity dropped significantly on the evening of 3 February. Observers on an overflight on 3 February saw a steam-rich, ash-poor plume emerge from the cloud tops and reach no higher than 2 km altitude. NWS reported no ash in satellite or radar data.
Observations by AVO scientists during visits on 8 February, as well as satellite and seismic data and other remote observations, indicated that a lava dome was present at the summit. Streams of gas, ash, and incandescent blocks were observed descending the upper NE flank on the evening of 7 February and early on the 8th, indicating that small-volume collapses of the lava dome were occurring and that the dome was actively growing. Seismicity remained at low levels, though still above background. Low-level ash plumes and occasional pyroclastic flows on the flanks continued. A persistent thermal signal was observed in satellite data. Incandescence was visible from Homer.
On 11 February, seismic data indicated that the new lava dome at Augustine's summit continued to grow. Seismic stations on the flanks of the volcano recorded rockfalls and pyroclastic flows associated with small-volume collapses of the lava dome. A plume composed of gas, steam, and small amounts of ash continued to be emitted from the summit, and low-level, dilute ash clouds were likely present in the vicinity of the volcano.
Just before midnight on 12-13 February a low-light camera operated by the University of Alaska Fairbanks captured a small hot avalanche down the north flank of the volcano. The event was also recorded on AVO's pressure sensor on Augustine Island. A light dusting of new ash on the E flank of the volcano may have been related to this avalanche event. Satellite data on 13 February showed a persistent thermal anomaly at the volcano's summit. Together, these data suggested that the lava dome continued to grow and underwent occasional, minor collapse events.
On 16 February, clear satellite views showed a strong thermal anomaly in the summit crater area. Seismometers continued to record rockfalls and small pyroclastic-flow signals indicative of occasional, minor collapses of the lava dome. Over 10-16 February, the number of these events declined steadily, suggesting that the rate of lava effusion was slowing. An observation flight on 16 February obtained good views of the summit: a new, steaming, blocky lava dome occupied the summit crater. The dome filled much of the crater and extended as a rubbly tongue 500-800 m down the upper N flank. Dark aprons of collapse debris, including large steaming blocks, extend downslope to the N. The rim of the summit crater was largely snow-free and mantled by thick, coarse, pyroclastic deposits, likely from the explosive events in January. The dome resulted from the largely non-explosive extrusion of degassed lava following the cessation of explosive activity on January 30.
By the end of this report period (22 February) unrest was continuing. Seismicity remained above background levels. Rockfalls and avalanches from the lava dome continued but appeared to be declining in frequency. Satellite images continued to show a persistent thermal anomaly. A plume composed of variable amounts of gas, steam, and small amounts of ash likely continued intermittently from Augustine's summit. Dome building eruptive activity may continue intermittently over the next several months.
Aviation hazard. Tina Neal (USGS-AVO) provided some thought-provoking insights into Augustine's aviation-ash issues. The following quote with minor modification is information she sent in a 14 February email message to the Volcanicclouds listserve, some follow up messages, and a review.
"Volcanologists often rely upon pilot observations to provide the all-important visual confirmation and description of distant volcanic events. What we need to remember, however, is that it is quite difficult to get more than snippets of information in a PIREP [aviation pilot report]: Pilots and controllers are often extremely busy and controllers cannot ask more than very basic follow up questions. Air traffic communication protocols put a premium on succinct transmissions. I was lucky enough recently to hear this play out in real time during an Augustine eruption when I happened to be visiting the Anchorage Air Traffic Control facility and was allowed to plug in to monitor the sector around Augustine. While we should continue to encourage full and detailed PIREPs following the VAR [Volcanic Activity Report] format, we should not be terribly surprised when the return is not very complete. Similarly, follow up communications directly with the pilot, possible in some cases, are difficult and not the highest priority of Observatory staff.
"Thus far for the Augustine eruption, we do have documentation of impacts from the ash clouds and the distal fine ash and SO2 cloud from explosive events, largely taken from PIREPS passed to AVO by the FAA and the National Weather Service. In addition to these instances below, flight routes were moved in anticipation of possible ash cloud motion following several explosions, and flight cancellations did occur.
"[1.] On 14 January a jet aircraft about [80 km E] of Yakutat at FL310 [9.4 km altitude, at 59 deg. 30.65 min. N, 139 deg. 8.89 min. W; ~800 km from Augustine] skimmed through the top of the 'brown' cloud for about 10 minutes and reported smelling a 'dirty, musty odor.' The pilot climbed to FL330 and deviated to the NE around the cloud. [The plane was out of service for two days.] Borescope inspection upon landing showed no damage and no ash accumulation.[Later anaysis suggested the ash cloud encountered may have been a combination of 5 separate drifting ash clouds from 5 separate discrete events during 13-14 January.] "[2.] On the same day, another jet near the same location saw a brown haze layer about 2000 feet [610 m] thick and made a climbing turn to avoid it.
"[3. On] 31 January [there were reports of a] light sulfur smell from several aircraft over Anchorage.
"[4.] AVO received the followings email account about a possible encounter between a Cessna Cherokee and a distant ash cloud from Augustine on 30 January (we have yet to follow up for any further information and verification).
"I am traveling in the Bristol Bay Area and was in Togiak last night. Last night I started coughing and sneezing and on the flight to Dillingham this morning the pilot and I noticed volcanic ash in the air from ground level and according to the pilot up to 7,000 feet [2.1 km altitude]. The ash is very fine but is sticking to the wind screen of the aircraft. Along with the ash my eyes were stinging and I noticed a little burning in my nose. As we approached the Dillingham area and got out of the mountains the air quickly cleared. At this time it seems to only be in the mountains and according to the pilots in different places all the way to King Salmon. I do not know if you have received these reports yet."
In addition, Volcaniclouds discussions included this message from Ken Dean (Geophysical Institute-AVO). It provided some further discussion and references on past eruption-cloud behavior from Mt. Cleveland (1,250 km SW of Augustine).
". . . there was an incident on 22 February 2001 attributed to a volcanic cloud from the eruption of Cleveland Volcano on 19 Feb. 2001. A PIREP from a B747 near San Francisco [California] reported a strong (sulfur) smell and particles in the cabin. At first we thought this was an erroneous report since it was so far from the eruption and satellite date did not show anything in the region of the aircraft. However, when we ran the Puff dispersion model using re-analysis data, the simulated volcanic cloud encountered the aircraft at the time of the PIREP. This was a match in space, time and altitude. Note: Puff runs using predicted data were somewhat ambiguous regarding this encounter but the re-analysis data were much more definitive."
References. Dean, K.G., Dehn, J., Papp, K.R., Smith, S., Izbekov, P., Peterson, R., Kearney, C., and Steffke, A., 2004, Integrated satellite observations of the 2001 eruption of Mt. Cleveland: Alaska, J. Vol. Geophys. Res., v. 135, p. 63, doi10.1016/j.jvolgeores.2003.12.013.
Simpson, J.J., Hufford, G.L., Pieri, D., Servranckx, R., Berg, J.S., and Bauer, C., 2002, The February 2001 Eruption of Mount Cleveland, Alaska: Case Study of an Aviation Hazard: Weather and Forecasting, v. 17, p. 691-704.
Geologic Background. Augustine volcano, rising above Kamishak Bay in the southern Cook Inlet about 290 km SW of Anchorage, is the most active volcano of the eastern Aleutian arc. It consists of a complex of overlapping summit lava domes surrounded by an apron of volcaniclastic debris that descends to the sea on all sides. Few lava flows are exposed; the flanks consist mainly of debris-avalanche and pyroclastic-flow deposits formed by repeated collapse and regrowth of the summit. The latest episode of edifice collapse occurred during Augustine's large 1883 eruption; subsequent dome growth has restored the edifice to a height comparable to that prior to 1883. The oldest dated volcanic rocks on Augustine are more than 40,000 years old. At least 11 large debris avalanches have reached the sea during the past 1,800-2,000 years, and five major pumiceous tephras have been erupted during this interval. Recorded eruptions have typically consisted of explosive activity with emplacement of pumiceous pyroclastic-flow deposits followed by lava dome extrusion with associated block-and-ash flows.
Information Contacts: Anchorage VAAC, Alaska Aviation Weather Unit, National Weather Service, 6930 Sand Lake Road, Anchorage, AK 99502, USA (URL: http://aawu.arh.noaa.gov/vaac.php); Alaska Volcano Observatory (AVO), a cooperative program of the U.S. Geological Survey, 4200 University Drive, Anchorage, AK 99508-4667, USA (URL: http://www.avo.alaska.edu/), Geophysical Institute, University of Alaska, PO Box 757320, Fairbanks, AK 99775-7320, USA, and Alaska Division of Geological & Geophysical Surveys, 794 University Ave., Suite 200, Fairbanks, AK 99709, USA; Jesse Allen, NASA Earth Observatory; Tina Neal, U.S. Geological Survey-Alaska Volcano Observatory; Ken Dean and Pavel E. Izbekov, Geophysical Institute, University of Alaska.
Barren Island (India) — January 2006 Cite this Report
Barren Island
India
12.278°N, 93.858°E; summit elev. 354 m
All times are local (unless otherwise noted)
November 2005-January 2006 ash emissions, lava flows, and pyroclastics
Activity continued at Barren Island since the volcano's latest eruption that began 28 May 2005 (BGVN 30:05, 30:07, and 30:09). The MODVOLC Alerts Team web site has shown that the MODIS (moderate resolution imaging spectroradiometer) satellite recorded nearly daily thermal anomalies from 26 May 2005 (two days earlier than observed by other means). The thermal anomalies continued through 21 January 2006. In contrast, no thermal anomalies were recorded by satellites in the year prior to 26 May 2005.
D. Chandrasekharam of the Indian Institute of Technology and members of the Indian Coast Guard observed that since 4 November the volcano emitted large volumes of gas and ash emissions, and lava flows had reached the sea. Chandrasekharam stated that the early 2006 activity was more intense than when the eruption began in May 2005. The recent activity was preceded by about ten moderate earthquakes in the region, including M 4.8 and 4.5 events on 3 November.
During 12-15 November 2005, ash plumes emitted from Barren Island were visible on satellite imagery drifting predominantly SSW, but they were no longer visible on 16 November. Ash plumes were visible on satellite imagery on 19 and 20 December at a maximum height of ~ 3.7 km, and during 21-23 December at a maximum height of 4.6 km. Satellite imagery showed a thin ash plume from Barren Island extending WNW during 5-7 January 2006.
Two earthquakes occurred in January 2006. On the 6th, an M 5.4 event struck 137 km E of Barren Island, and on the 21st, an M 5.6 event struck 104 km NNW of the island.
To monitor the ongoing volcanism, a team from the Geological Survey of India, including M.M. Mukherjee, P.C. Bandopadhyay, Tapan Pal, and Sri Prasun Ghosh, approached aboard the Indian Coast Guard Ship C.S. GANGA DEVI during 12-13 January 2006. The party sailed to within 0.8 km of Barren Island and studied the nature of the eruption from shipboard. The eruption resembled fireworks projecting different colors over the crater and on the slope of the cone. Dense clusters of incandescent pyroclasts of various sizes ejected forcefully from the crater mouth "with ballistic trajectories." Apart from eruption from the main crater, a "glow of fire" from the N flank of the cone and thin layers of red hot materials on W slope were observed. The Darwin VAAC reported that ash plumes from Barren Island during 26-27 January rose to ~ 3 km.
Geologic Background. Barren Island, a possession of India in the Andaman Sea about 135 km NE of Port Blair in the Andaman Islands, is the only historically active volcano along the N-S volcanic arc extending between Sumatra and Burma (Myanmar). It is the emergent summit of a volcano that rises from a depth of about 2250 m. The small, uninhabited 3-km-wide island contains a roughly 2-km-wide caldera with walls 250-350 m high. The caldera, which is open to the sea on the west, was created during a major explosive eruption in the late Pleistocene that produced pyroclastic-flow and -surge deposits. Historical eruptions have changed the morphology of the pyroclastic cone in the center of the caldera, and lava flows that fill much of the caldera floor have reached the sea along the western coast.
Information Contacts: D. Chandrasekharam, Indian Institute of Technology, Department of Earth Sciences, Bombay 400076, India (URL: http://www.geos.iitb.ac.in/index.php/dc); Dhanapati Haldar, Presidency College, Kolkata, 4/3K/2 Ho-Chi-Min Sarani, Shakuntala Park, Biren Roy Road (West), Kolkata-700 061, India; Geological Survey of India, 27 Jawaharlal Nehru road, Kolkata 700 016, India (URL: https://www.gsi.gov.in/); Indian Coast Guard, National Stadium Complex, New Delhi 110 001, India (URL: http://indiancoastguard.nic.in/indiancoastguard/); Darwin Volcanic Ash Advisory Center (URL: http://www.bom.gov.au/info/vaac/); MODVOLC Alerts Team, Hawaii Institute of Geophysics and Planetology (HIGP), University of Hawaii at Manoa, 1680 East-West Road, Post 602, Honolulu, HI 96822, USA (URL: http://modis.higp.hawaii.edu/).
Cleveland (United States) — January 2006 Cite this Report
Cleveland
United States
52.825°N, 169.944°W; summit elev. 1730 m
All times are local (unless otherwise noted)
6 February 2006 eruption on remote, non-instrumented island
According to the Alaska Volcano Observatory (AVO), Mount Cleveland, a volcano on an uninhabited island in the central Aleutian chain, erupted at 0757 on 6 February 2006, sending a cloud of ash to 6.7 km (22,000 ft) altitude. Officials at AVO issued a Code Red warning for the volcano because the ash cloud was near a level where it could interfere with jet traffic, said Chris Waythomas, a U.S. Geological Survey geologist. There were no reports of falling ash. The nearest community is Nikolski, a tiny Aleut village of 31 people 73 km E of the volcano.
Cleveland's last major eruptive period was in March 2001 when three explosions occurred and the volcano produced significant ash plumes (BGVN 26:04). Discussion of that episode was renewed briefly at the end of the Augustine report in this issue (BGVN 31:01). That discussion (and cited references) noted that the ash cloud from a Cleveland eruption on 19 February 2001 had a modeled path that carried the cloud S, passing over Northern California. Two days after the eruption, aviators flying near San Francisco, California, smelled sulfurous gases, presumably from the Cleveland eruption. There were also minor ash emissions from July to October 2005 (BGVN 30:09).
AVO downgraded the level of concern color code for Cleveland from Red to Orange on 7 February 2006 at 1655 hours. No new ash emissions or thermal anomalies have been detected in clear to partly cloudy satellite views from the morning of 8 February. AVO noted that Cleveland does not have a real-time seismic network and therefore it is unable to monitor seismic changes.
Geologic Background. The symmetrical Mount Cleveland stratovolcano is situated at the western end of the uninhabited Chuginadak Island. It lies SE across Carlisle Pass strait from Carlisle volcano and NE across Chuginadak Pass strait from Herbert volcano. Joined to the rest of Chuginadak Island by a low isthmus, The native name, Chuginadak, refers to the Aleut goddess of fire, who was thought to reside on the volcano. Numerous large lava flows descend the steep-sided flanks. It is possible that some 18th-to-19th century eruptions attributed to Carlisle should be ascribed to Cleveland (Miller et al., 1998). In 1944 it produced the only known fatality from an Aleutian eruption.
Information Contacts: Alaska Volcano Observatory (AVO), a cooperative program of the U.S. Geological Survey, 4200 University Drive, Anchorage, AK 99508-4667, USA (URL: http://www.avo.alaska.edu/), Geophysical Institute, University of Alaska, PO Box 757320, Fairbanks, AK 99775-7320, USA, and Alaska Division of Geological & Geophysical Surveys, 794 University Ave., Suite 200, Fairbanks, AK 99709, USA; Washington Volcanic Ash Advisory Center (VAAC), Satellite Analysis Branch (SAB), NOAA/NESDIS E/SP23, NOAA Science Center Room 401, 5200 Auth Road, Camp Springs, MD 20746, USA (URL: http://www.ospo.noaa.gov/Products/atmosphere/vaac/).
Galeras (Colombia) — January 2006 Cite this Report
Galeras
Colombia
1.22°N, 77.37°W; summit elev. 4276 m
All times are local (unless otherwise noted)
Eruption begins on 24 November 2005 sending ash plumes into air
Galeras was last reported on in BGVN 30:09, covering the period from July 2004 to mid-October 2005. During July through October 2004, eruptions generated ash and gas plumes that caused ashfall in surrounding areas. On 21 November 2004 Galeras erupted explosively. During January - September 2005, low-level relatively shallow seismicity and small gas-and-ash emissions continued. Occasional steam plumes were visible from Pasto in October 2005. Seismicity fluctuated and some instrumentally measured deformation continued.
During the first week of November 2005, low-level seismicity included several tornillo earthquakes (long-period seismic events related to pressurized fluid flow at shallow depth). Small amounts of deformation were recorded at the volcano. During 9-14 November, a large number of tornillo earthquakes were reported by Instituto Colombiano de Geología y Minería (INGEOMINAS). The earthquakes were similar to those that occurred before eruptions in 1992-93. Activity during October suggested that the volume of magma beneath the volcano was greater than that inferred to have been present during the 1992-93 eruptions. Due to increased activity, the Alert Level was raised to 2 (probable eruption in days or weeks) on 14 November.
According to news reports, on 14 November local authorities recommended an evacuation of as many as 9,000 people living in towns near the volcano, including Pasto (to the E), La Florida (to the N), and Nariño (to the N). Heightened seismicity continued during 16-22 November. According to news articles, only ~ 1,000 residents had actually left as of 18 November.
On 24 November at 0246 seismic signals indicated the beginning of an eruption. Ash fell in the towns of Fontibon, San Cayetano, Postobon, and in north Pasto. Around this time, INGEOMINAS raised the Alert Level to 1 (eruption imminent or occurring). The Washington VAAC observed a small puff of ash NE of the volcano at ~ 4.6 km altitude. Activity decreased by the next day, so the Alert Level was reduced to 2. Thousands of people had been evacuated during the week prior to the eruption.
Due to a decrease in activity, on 28 November INGEOMINAS reduced the Alert Level to 3. Low levels of seismicity and deformation were continuing. Although poor weather conditions obscured the volcano most of the time, steam and gas emissions were photographed on 2 December coming from several locations on the active cone, including the main crater. The plume rose 1 km above the summit on 3 December.
Through 12 December, seismicity indicated fluids moving within the volcano, small changes in deformation occurred, and gas rose to a height of ~ 500 m. Based on information from the US Geological Survey, the Washington VAAC reported that a pilot observed an ash plume from Galeras on 23 December at an altitude of ~ 7.3 km and drifting W.
During 23 December to 2 January 2006 there were emissions of gas and small amounts of ash. On 23 December four ash plumes rose to ~ 3 km altitude and drifted to Consacá. A cluster of 33 volcano-tectonic earthquakes, reaching a maximum M 1.2, occurred beneath the volcano's crater during 29-30 December. The SO2 flux varied between 300 and 1,500 metric tons per day (t/d).
Gas emissions with small amounts of ash, and heightened seismicity, continued through 9 January. The SO2 flux at the volcano varied between 490 and 1,500 t/d. A lava dome was visible in the main crater during an overflight on 13 January. Around this time, there was an increase in the amount of seismicity and deformation. The Washington VAAC reported that a pilot observed an ash plume on 23 December at an altitude of ~ 7.3 km and drifting W.
During 23 January to 6 February, the lava dome in the main crater continued to grow; seismicity associated with the movement of fluids continued, with an average of 200 small earthquakes per day, and slight deformation was recorded. SO2 flux of about 300 t/d was measured. Strong degassing occurred in several sectors of the active cone and around the lava dome. Steam rose to 900 m above the volcano. During a field visit on 8 February, scientists found pyroclastic-flow deposits high on the SE flank.
The rate of seismicity the week of 13-20 February averaged 190 small earthquakes per day, while the SO2 flux was about 200 metric tons per day. Steam rose to ~ 1.1 km above the volcano on 19 February and incandescence was visible at parts of the lava dome. The volume of the dome in the main crater was approximately 1.5 times larger than when it was first observed on 13 January. Seismicity increased to an average of 280 small earthquakes per day during 20-27 February. SO2 flux also rose, to about 600 t/d. On 26 February a cluster of earthquakes included an M 4.8 volcano-tectonic earthquake followed by 35 smaller earthquakes. Slight deformation was recorded at the volcano. Steam and gas rose to ~ 700 m above the volcano. Galeras remained at Alert Level 3 through February 2006.
Geologic Background. Galeras, a stratovolcano with a large breached caldera located immediately west of the city of Pasto, is one of Colombia's most frequently active volcanoes. The dominantly andesitic complex has been active for more than 1 million years, and two major caldera collapse eruptions took place during the late Pleistocene. Long-term extensive hydrothermal alteration has contributed to large-scale edifice collapse on at least three occasions, producing debris avalanches that swept to the west and left a large open caldera inside which the modern cone has been constructed. Major explosive eruptions since the mid-Holocene have produced widespread tephra deposits and pyroclastic flows that swept all but the southern flanks. A central cone slightly lower than the caldera rim has been the site of numerous small-to-moderate eruptions since the time of the Spanish conquistadors.
Information Contacts: Diego Gomez Martinez, Observatorio Vulcanológico y Sismológico de Pasto (OVSP), INGEOMINAS, Carrera 31, 1807 Parque Infantil, PO Box 1795, Pasto, Colombia (URL: https://www2.sgc.gov.co/volcanes/index.html; Washington Volcanic Ash Advisory Center (VAAC), Satellite Analysis Branch (SAB), NOAA/NESDIS E/SP23, NOAA Science Center Room 401, 5200 Auth Road, Camp Springs, MD 20746, USA (URL: http://www.ospo.noaa.gov/Products/atmosphere/vaac/); El Pais (URL: http://elpais-cali.terra.com.co/paisonline/).
Karthala (Union of the Comoros) — January 2006 Cite this Report
Karthala
Union of the Comoros
11.7658°S, 43.3639°E; summit elev. 2350 m
All times are local (unless otherwise noted)
Looking at the 2005 eruption's precursors, deposits, and human impact
After the 11 July 1991 phreatic eruption, 14 years of quiescence at Karthala was disrupted in 2005 by two strong explosive events. These events, occurring on 16 April 2005 (BGVN 30:04) and 24 November 2005 (BGVN 30:11), resulted in deposits of fine ash scattered over a large part of the island. This report presents some further observations and analyses of the November event by scientists from the Comoros and Reunion.
Seismic precursors. The seismicity on figure 16 delineates four periods during 2005: (1) From the beginning of the year until the 16 April explosive event, an interval characterized by significant seismicity. (2) From the 16 April event until just prior to the 25-26 August seismic crisis, an interval with relatively low seismicity (only 102 events recorded in 116 days). (3) An interval from 26 August to 23 November that began during the 25-26 August seismic crisis when 190 events occurred. Moderate seismicity following the seismic crisis ramped up after 27 October until the 24 November eruption. This period was characterized by a total of 1,063 seismic events, an average of 12 earthquakes per day. (4) From the 24 November eruption until the end of the year, an interval of relatively low seismicity similar to the second period. The 24 November earthquake swarm began at 1902, dropped significantly at 1950, and restarted at 2021 with sustained tremor.
The investigators noted that the seismic crisis of 25-26 August 2005 marked the beginning of the new eruptive cycle. It preceded the November 2005 eruption, but was much more subdued than the build up before the eruptions in April 2005 and July 1991 (BGVN 16:06 and 16:08). Earthquakes were located by KVO using Sismalp (the French Alps Seismic Network). Uniquely, for the November 2005 seismic crisis, the hypocenters were 500-1,000 m shallower than those of April 2005. This could be attributed to shallower magma storage for the last eruption.
Activity during 24 November-5 December 2005. The beginning of the 24 November eruption was visible from Moroni (the capital city of the Comoro Islands) with lightning, rumblings, and a large dark plume at the summit. Ash first fell on the E coast of the island around 2300 on 24 November and the tremor intensity significantly dropped. On the W part of the island, ash started to fall on 25 November at 0500 with very strong intensity. Evacuation became very difficult, schools remained closed, and some people used masks to breathe. Ashfall was so intense that the authorities required the inhabitants to remain in their homes. The United Nations Office for the Coordination of Humanitarian Affairs (OCHA) reported that, according to the local authorities, ~ 2,000 people fled from their villages in the region of Bambao in the central part of the island, and sought refuge in less exposed areas, such as Mitsamiouli, Mboudé, and Oichili.
At 0700 on 25 November the sky was darkened by ash (figures 17 and 18). Part of the population fled towards the N of the island. It was only around 0900 that the sky partially cleared; however, ash continued to fall with decreasing intensity during the day. Ash deposits covered three-quarters of the island. The international airport located in the N part of the island remained free of ash deposits. The Toulouse Volcanic Ash Advisory Center issued an advisory to limit risks for air traffic; however, the eruption did not halt airport operations. Satellite imagery on 25 November revealed an ash cloud reaching ~ 11.6 km altitude.
During 25 November, about 30 seismic events were recorded by KVO, causing concern about the possibility of a crack or fissure opening on Karthala's flank, as occurred in April 1977 (SEAN 02:03). During the night, red glow at the summit was clearly visible from the coast.
On 26 November, a field excursion found a lava lake in the Chahalé crater (figure 19). Prior to the eruption that crater's floor had been covered by a water lake some tens of meters deep. In contrast to the crusted-over lava lake of April 2005 (BGVN 30:04), in November it was almost entirely liquid, with a very large fountain in its center. By 30 November the lava lake had solidified over ~ 80 % of its surface (figure 20). On 5 December it was almost entirely solid, with only two small spatter cones active (figure 21).
Eruptive products. The landscape at the summit illustrated the style and intensity of the eruption. Measurements of ash deposit thickness were difficult to make. Along the coast ash deposits were between a few millimeters and a few tens of millimeters thick. On the W side of the caldera, ~ 1.5 km from the crater, 70 cm of ash deposits were measured at the same location where 40 cm of ash had fallen in April 2005, an increase of 30 cm in thickness. Closer to the crater, the thicknesses were not measured because they were greater than 1.5 m.
Field work revealed that on the edge of the caldera, ballistic blocks had fallen from the phreatomagmatic phase at the beginning of the eruption. Closer to the central crater the density of volcanic debris increased strongly. In an area covered by several tens of centimeters of ash, blocks impacted the ground leaving an amazing number of craters on the surface (figure 22). Distinctive tephra deposits, presumably related to lava fountains were identifiable everywhere around the central crater (figure 23). These juvenile deposits spread 500 m N from the central crater, whereas they extended only 100 m or less to the S. Products of this magmatic phase were clearly erupted or carried by wind to the N, and they must have ascended higher than 300 m, the depth of the Chahalé pit crater. On 8 December 2005 at about 1000 (15 days after the eruption), both seismic and explosive activity stopped.
Human impact. This eruption was more explosive and longer than the two preceding eruptions in spite of weaker seismicity, and a significant quantity of ash fell in water cisterns. According to OCHA, there were about 118,000 people living in 75 villages that were affected by the cistern contamination. Wind continued to raise large quantities of ash that again fell on the dwellings and into cisterns. In contrast to the April 2005 eruption, no coastal residents reported smelling sulfurous odors. After the end of the eruption, few long period earthquakes were recorded.
Geologic Background. The southernmost and largest of the two shield volcanoes forming Grand Comore Island (also known as Ngazidja Island), Karthala has two overlapping 3-4 km summit calderas generated by repeated collapse. Elongated rift zones extend NNW and SE from the summit of the basaltic shield, which has an asymmetrical profile that is steeper to the S. The lower SE rift zone forms the Massif du Badjini, a peninsula at the SE tip of the island. More than twenty eruptions have been recorded since the 19th century from the summit caldera and vents on the N and S flanks, producing many lava flows that reached the sea on both sides of the island. An 1860 CE lava flow from the summit caldera traveled ~13 km to the NW, reaching the W coast to the N of the capital city of Moroni.
Information Contacts: Nicolas Villeneuve, Centre de Recherches d'études Géographiques de l'Université de La Réunion (CREGUR), Université de La Réunion, BP 7151, 15 Avenue, René Cassin, 97715 Saint-Denis, Réunion, France; Anthony Finizola and Patrick Bachèlery, Laboratoire des Sciences de la Terre de l'Universite de la Reunion (LSTUR), Université de La Réunion, BP 7151, 15 Avenue, René Cassin, 97715 Saint-Denis, Réunion, France; Francois Sauvestre and Hamid Soulé, Centre National de Documentation et de Recherche Scientifique (CNDRS), Place France, BP 169, Moroni, République Fédérale Islamique des Comores (URL: http://volcano.ipgp.jussieu.fr/karthala/stationkar.html); Karthala Volcano Observatory (KVO), Centre National de Documentation et de la Recherche Scientifique des Comores, BP 169, Moroni, République Fédérale Islamique des Comores.
Lamongan (Indonesia) — January 2006 Cite this Report
Lamongan
Indonesia
7.981°S, 113.341°E; summit elev. 1641 m
All times are local (unless otherwise noted)
Above-background seismicity during 5-6 January 2005
Elevated seismicity occurred at Lamongan on 5-6 January 2005. From 1200 to 0700 on 5 January, 22 events occurred with Modified Mercali Intensity (MMI) of 1. At each of three times (0331, 0447, and 0524) observers noted an event of MMI 3. During this period, instruments detected continuous tremor with an amplitude of 3 to 15 mm. On 5 January there were 282 local tectonic earthquakes and 53 volcanic A-type earthquakes. The volcano alert level was raised to 2.
On 6 January 2005, 107 volcanic A-type earthquakes were recorded. Local tectonic earthquakes over the two day period occurred 159 times, of which 10 of them were events had Modified Mercali Intensity (MMI) of 1-3.
Geologic Background. Lamongan, a small stratovolcano located between the massive Tengger and Iyang-Argapura volcanic complexes, is surrounded by numerous maars and cinder cones. The currently active cone has been constructed 650 m SW of Gunung Tarub, the volcano's high point. As many as 27 maars with diameters from 150 to 700 m, some containing crater lakes, surround the volcano, along with about 60 cinder cones and spatter cones. Lake-filled maars, including Ranu Pakis, Ranu Klakah, and Ranu Bedali, are located on the E and W flanks; dry maars are predominately located on the N flanks. None of the maars has erupted during historical time, although several of the youthful maars cut drainage channels from Gunung Tarub. The volcano was very active from the time of its first historical eruption in 1799 through the end of the 19th century, producing frequent explosive eruptions and lava flows from vents on the western side ranging from the summit to about 450 m elevation.
Information Contacts: Darwin Volcanic Ash Advisory Centre (VAAC), Bureau of Meteorology, Northern Territory Regional Office, PO Box 40050, Casuarina, NT 0811, Australia (URL: http://www.bom.gov.au/info/vaac/).
Lopevi
Vanuatu
16.507°S, 168.346°E; summit elev. 1413 m
All times are local (unless otherwise noted)
Correction to previously published MODIS hotspot data
An error occurred in the March 2005 issue of BGVN (30:03). The table [now deleted online] had listed MODVOLC thermal anomalies, but it mistakenly included those for both Lopevi and Ambrym. The corrected table for Lopevi thermal anomalies only is provided here (table 1).
Table 1. MODVOLC thermal anomalies as observed from the MODIS satellite for Lopevi volcano for the period July 2003 to March 2005. The fourth column shows radiance in watts per square meter, per steradian, per micron (W m-2 sr-1 µm-1) in MODIS band 21 (central wavelength of 3.959 µm). Courtesy of the Hawai'i Institute of Geophysics and Planetology.
| Date |
Time (UTC) |
Sensor |
Spectral radiance |
| 28 Sep 2004 |
1410 |
Aqua |
0.937 |
| 28 Sep 2004 |
1410 |
Aqua |
1.052 |
| 30 Jan 2005 |
1130 |
Terra |
0.710 |
| 05 Feb 2005 |
1355 |
Aqua |
0.983 |
| 05 Feb 2005 |
1355 |
Aqua |
1.426 |
Geologic Background. The small 7-km-wide conical island of Lopevi, known locally as Vanei Vollohulu, is one of Vanuatu's most active volcanoes. A small summit crater containing a cinder cone is breached to the NW and tops an older cone that is rimmed by the remnant of a larger crater. The basaltic-to-andesitic volcano has been active during historical time at both summit and flank vents, primarily along a NW-SE-trending fissure that cuts across the island, producing moderate explosive eruptions and lava flows that reached the coast. Historical eruptions at the 1413-m-high volcano date back to the mid-19th century. The island was evacuated following major eruptions in 1939 and 1960. The latter eruption, from a NW-flank fissure vent, produced a pyroclastic flow that swept to the sea and a lava flow that formed a new peninsula on the western coast.
Information Contacts: MODVOLC Alerts Team, Hawai'i Institute of Geophysics and Planetology (HIGP), University of Hawaii and Manoa, 168 East-West Road, Post 602, Honolulu, HI 96822, USA (URL: http://modis.higp.hawaii.edu/).
Nyamulagira (DR Congo) — January 2006 Cite this Report
Nyamulagira
DR Congo
1.408°S, 29.2°E; summit elev. 3058 m
All times are local (unless otherwise noted)
To the N, swarms of long-period, along-rift earthquakes
Nyamuragira last erupted during May 2004; weak but steady ash emissions continued until 1 June 2004, when satellite imagery indicated that the eruption had ceased (BGVN 29:05). The volcano, whose name is sometimes written as Nyamlagira and Nyamulagira, was the scene of several seismic swarms in middle and late 2005.
On 6 July 2005, the Goma Volcano Observatory (GVO) reported that a significant seismic crisis had occurred at Nyamuragira in late June 2005. The crisis consisted of swarms of mainly long-period earthquakes, which increased in number daily and peaked on 26 and 27 June. Most of the events occurred within a 10 km radius around Nyamuragira's summit caldera and were aligned roughly N-S. The depths of the earthquakes ranged from 0 to 30 km, with two main areas of concentration; one between 15 and 25 km deep, and the other between 0 and 4 km. Based on precursory activity before previous historical eruptions at Nyamuragira, GVO reported that a new eruption might occur in the next 2-4 months. They stressed that an eruption would not threaten the city of Goma or other inhabited areas.
Beginning on 23 October 2005, GVO again recorded heightened seismic activity along the East African Rift and around the Virunga volcanoes when a swarm of long-period earthquakes occurred N of Nyamuragira. More than 140 events were recorded at a station 19 km E of the volcano. On 27 October at 1500, another swarm of long-period earthquakes began beneath the same area. More than 300 events were recorded until at least 28 October. At 2010 on that day, a M 4.5 tectonic earthquake occurred N of Lake Tanganika, followed by several aftershocks. The Alert Level for the nearby city of Goma remained at Yellow.
Geologic Background. Africa's most active volcano, Nyamulagira (also known as Nyamuragira), is a massive high-potassium basaltic shield about 25 km N of Lake Kivu and 13 km NNW of the steep-sided Nyiragongo volcano. The summit is truncated by a small 2 x 2.3 km caldera that has walls up to about 100 m high. Documented eruptions have occurred within the summit caldera, as well as from the numerous flank fissures and cinder cones. A lava lake in the summit crater, active since at least 1921, drained in 1938, at the time of a major flank eruption. Recent lava flows extend down the flanks more than 30 km from the summit as far as Lake Kivu; extensive lava flows from this volcano have covered 1,500 km2 of the western branch of the East African Rift.
Information Contacts: Baluku Bajope and Kasereka Mahinda, Observatoire Volcanologique de Goma, Departement de Geophysique, Centre de Recherche en Sciences Naturelles, Lwiro, D.S. Bukavu, DR Congo; Toulouse Volcanic Ash Advisory Center (VAAC), Météo-France, 42 Avenue Gaspard Coriolis, F-31057 Toulouse cedex, France (URL: http://www.meteo.fr/vaac/); TOMS Volcanic Emissions Group, NASA Goddard Space Flight Center, Code 613.3, Greenbelt, MD 20771, USA (URL: https://so2.gsfc.nasa.gov/).
Nyiragongo (DR Congo) — January 2006 Cite this Report
Nyiragongo
DR Congo
1.52°S, 29.25°E; summit elev. 3470 m
All times are local (unless otherwise noted)
Continuous ash plumes and active lava lake
During May and June 2004, eruptions of Nyiragongo produced ash plumes that rose to a maximum of 6 km altitude (BGVN 29:06). According to the Toulouse VAAC, eruptions continued through July, producing plumes to a maximum of 5.5 km altitude. On 7 and 28 September 2004, short-lived plumes that may have contained ash were visible on satellite imagery. The Alert Level for the nearby city of Goma remained at Yellow.
An eruption on 3 November 2004 produced a thin W-drifting plume to 3.6-4.9 km altitude that was visible on satellite imagery. On 22 November a narrow SW-drifting plume was discerned on satellite imagery at 5 km altitude. A narrow plume was seen again on satellite imagery on 23 November at 1130, although no ash was identifiable.
The Goma Volcano Observatory (GVO) reported that during 10-17 November 2004 continuous volcanic tremor was recorded at all seismic stations around Nyiragongo. Visual observation on 12 and 13 November revealed that the lava lake surface had widened considerably, with strong lava fountains. Numerous Pele's hair and scoriae were seen on the cone's S, W, and N sides. A gas plume and incandescence were visible above the volcano. All fractures that opened during the 2002 eruption on the S flank had widened slightly and showed minor temperature increases.
During 18-29 November 2004, continuous banded tremor at high amplitudes occurred beneath the volcano, but the amplitudes seemed to be lower than during 9-18 November. Visual observations on 25-26 November revealed a slight decrease in the level of the lava lake, although strong lava fountains and a high flux of lava and gases continued. Pele's hair, scoriae, a gas plume, and incandescence were still present. Measurements of the fractures on the slopes showed that they remained stable.
The Toulouse VAAC reported faint SO2 plumes from Nyiragongo visible on satellite imagery on 8 and 10 December. During 29 November to 12 December, volcanic activity remained at relatively high levels. Nearly continuous high-amplitude tremor was recorded at all seismic stations on the volcano. Observations of the crater area on 9 and 10 December revealed that the level of the lava lake remained stable compared to previous visits and that strong lava fountaining was present. Pele's hair and scoriae fell in the area around the volcano, gas plumes rose above the volcano, and strong incandescence was visible at night.
In May 2005 a visiting group from Société de Volcanologie Genève (SVG) estimated that the lava lake was approximately 200 x 150 m across. They observed lava fountaining in the lake to tens of meters high (figure 33).
On 7 September 2005, high-resolution satellite imagery showed a thin plume emitted from Nyiragongo. The plume was not confirmed by other data. Another thin plume visible on satellite imagery on 10 October; it was not confirmed by SO2 data.
As of 28 October 2005 Nyiragongo remained very active, but stable, with a large active lava lake in the crater. A gas plume was emitted and incandescence was visible at night from several tens of kilometers away. On 7 and 13 November thin plumes from Nyiragongo that may have contained some ash were observed on satellite imagery.
In January 2006 a group from Stromboli Online undertook an expedition to Nyiragongo and photographed the lava lake (figure 34).
Geologic Background. The Nyiragongo stratovolcano contained a lava lake in its deep summit crater that was active for half a century before draining catastrophically through its outer flanks in 1977. The steep slopes contrast to the low profile of its neighboring shield volcano, Nyamuragira. Benches in the steep-walled, 1.2-km-wide summit crater mark levels of former lava lakes, which have been observed since the late-19th century. Two older stratovolcanoes, Baruta and Shaheru, are partially overlapped by Nyiragongo on the north and south. About 100 cones are located primarily along radial fissures south of Shaheru, east of the summit, and along a NE-SW zone extending as far as Lake Kivu. Many cones are buried by voluminous lava flows that extend long distances down the flanks, which is characterized by the eruption of foiditic rocks. The extremely fluid 1977 lava flows caused many fatalities, as did lava flows that inundated portions of the major city of Goma in January 2002.
Information Contacts: Baluku Bajope and Kasereka Mahinda, Observatoire Volcanologique de Goma, Departement de Geophysique, Centre de Recherche en Sciences Naturelles, Lwiro, D.S. Bukavu, DR Congo; J?rg Alean, Roberto Carniel, and Marco Fulle, Stromboli Online, Rheinstrasse 6, CH-8193 Eglisau, Switzerland (URL: http://www.swisseduc.ch/stromboli/); Pierre Vetsch and Marc Caillet, Société de Volcanologie Genève (SVG), PO Box 6423, CH-1211 Geneva 6, Switzerland (URL: http://www.volcan.ch/); Toulouse Volcanic Ash Advisory Center (VAAC), Météo-France, 42 Avenue Gaspard Coriolis, F-31057 Toulouse cedex, France (URL: http://www.meteo.fr/vaac/).
Santa Ana (El Salvador) — January 2006 Cite this Report
Santa Ana
El Salvador
13.853°N, 89.63°W; summit elev. 2381 m
All times are local (unless otherwise noted)
Post-eruption lahars but seismicity and SO2 fluxes both often low
Previous comments regarding terminal phases of the 1 October 2005 eruption (BGVN 30:09) included: . "Following the eruption of 1 October, small explosions, degassing, and low-to-moderate seismicity occurred at Santa Ana during 5-11 October . . .. During an aerial inspection of the volcano on 11 October, no changes were observed at the crater."
Carlos Pullinger (Servicio Nacional de Estudios Territoriales, SNET) later noted that "The 1 October eruption only lasted about 1 hour. After that we had some small activity, probably associated [with] degassing on Sunday evening [2 October] and at about the same time the continuous rains produced the first of a series of lahars that affected the communities close to the shore of Coatepeque lake. During the rest of the week it was very difficult to know what was going on because of continuous rains and cloudy conditions."
Pullinger further noted that some eye witnesses said that they had observed a column on 2 October. SNET registered strong and continuous tremor during approximately 1900-2400 (local time) on 2 October. Much of this activity coincided with rain-induced lahars. Over 300 mm of rain fell on the volcano that day. Using both witness reports and seismicity, SNET inferred that on 2 October the volcano possibly generated strong degassing or even geyser-type activity. However, there was no confirmation of ashfall deposits from these or other post-1 October events.The same type of seismicity continued intermittently until 5 October, but with much less intensity than on 2 October. SNET could not tell if there was any volcanic activity related to these events, or if it was mainly lahars. After the 5th continuous tremor was not recorded.
Post-eruption behavior. SNET reported that, in general, following Santa Ana's 1 October 2005 eruption, seismicity was relatively stable and there were generally low-level gas emissions (figure 4).
Storms on 12 October 2005 caused lahars that traveled E towards Lake Coatepeque (see ASTER image of the region in BGVN 30:09). On 22 October, a lahar was reactivated in the Potrero Arriba area, NE of the volcano. During 22-25 October, the volcano was subjected to increased tremor and a slight increase in seismicity associated with gas emissions. On 28 October volcanic activity appeared to increase slightly and sulfur-dioxide emission rates during 28 and 29 October averaged 257 metric tons per day. The Alert Level within a 5-km radius around the volcano's central crater was at Red, the highest level.
During the month of November 2005 seismicity, volcanic activity, and gas emissions all remained for the most part at relatively low levels. There were slight increases on 13, 17, and 26 November; but the 17 November increase was attributed to noise from strong winds. On 26 November only slight changes were noted in the color of the lagoon in the crater's interior, but gas emissions rose to ~ 300 m above the volcano. Small earthquakes occurred during November 2005, inferred to be associated with the fracturing of rocks and gas pulses. Sulfur-dioxide emissions were low during the first part of November, with 100 to 200 metric tons recorded daily, and during the latter part of November, with between 100 and ~ 1,500 metric tons recorded daily.
During December 2005, seismicity was above background levels. Observations of Santa Ana's crater on 28 December revealed that there were continuous emissions of steam and gas from the lagoon and fumaroles located within the crater (figure 5). Gas rose 200-500 m above the crater and drifted SW (figure 6). Small earthquakes occurred, but gas emissions rose to over ~ 2,500 tons per day (figure 4). The Alert Level remained at Red, the highest level, within a 5-km radius around the volcano's summit crater.
From 30 December 2005 to early January 2006, seismic and steam emissions were moderate at Santa Ana. Seismicity was slightly above normal levels with small earthquakes occurring, which were interpreted as being associated with gas pulses. Low-level emissions of steam and gas from the lagoon and fumaroles within the crater remained the same as in December 2005. Gas rose 200-500 m above the crater and drifted SW. The sulfur-dioxide flux ranged between 180 and 1,476 metric tons per day. The Alert Level remained at Red, the highest level, within a 5-km radius around the volcano's summit crater.
Background. Santa Ana, El Salvador's highest volcano, is a massive, 2,381-m-high andesitic-to-basaltic stratovolcano that rises immediately W of Coatepeque caldera. Collapse of the volcano during the late Pleistocene produced a voluminous debris avalanche that swept into the Pacific Ocean, forming the Acajutla Peninsula. Reconstruction of the volcano subsequently filled most of the collapse scarp. The broad summit of the volcano is cut by several crescentic craters, and a series of parasitic vents and cones have formed along a 20-km-long fissure system that extends from near the town of Chalchuapa NNW of the volcano to the San Marcelino and Cerro la Olla cinder cones on the SE flank. Historical activity, largely consisting of small-to-moderate explosive eruptions from both summit and flank vents, has been documented since the 16th century. The San Marcelino cinder cone on the SE flank produced a lava flow in 1722 that traveled 13 km to the E.
Geologic Background. Santa Ana (also known as Ilamatepec), is a massive, dominantly andesitic-to-trachyandesitic stratovolcano in El Salvador immediately W of Coatepeque Caldera. Collapse during the late Pleistocene produced a voluminous debris avalanche that swept into the Pacific Ocean, forming the Acajutla Peninsula. Reconstruction of the volcano subsequently filled most of the collapse scarp. The broad summit is cut by several crescentic craters, and a series of vents and cones have formed along a 20-km-long fissure system that extends from near the town of Chalchuapa NNW of the volcano to the San Marcelino and Cerro la Olla cinder cones on the SE flank. Small to moderate explosive eruptions from both summit and flank vents have been documented since the 16th century. The San Marcelino cinder cone on the SE flank produced a lava flow in 1722 that traveled 13 km E.
Information Contacts: Servicio Nacional de Estudios Territoriales (SNET), Alameda Roosevelt y 55 Avenida Norte, Edificio Torre El Salvador, Quinta Planta, San Salvador, El Salvador (URL: http://www.snet.gob.sv/)
Tanaga (United States) — January 2006 Cite this Report
Tanaga
United States
51.885°N, 178.146°W; summit elev. 1806 m
All times are local (unless otherwise noted)
Weak, moderate depth seismicity
The Alaska Volcano Observatory (AVO) detected an increase in seismic activity beneath Tanaga beginning on 1 October 2005, with 15-68 earthquakes occurring daily. Previously, less than one earthquake had occurred per month since the seismic network was installed in 2003. The earthquakes were centered roughly 2 km NE of the summit at depths of 10-20 km below sea level. The largest event was M 1.7, with most earthquakes at M 0.5-1.5. Tanaga was at Concern Color Code Green on 5 October.
During 5-7 October, there was a marked increase in the rate of seismicity. The located earthquakes ranged in magnitude from 0.5 to 1.9 and ranged in depth from 6 to 12 km beneath the summit. In response, AVO raised the Concern Color Code to Yellow on 7 October. AVO reported that while the seismic activity represented a significant increase in rate, the size, depth, and character of the events were not indicative of imminent eruptive activity.
Elevated seismic activity below the young vents continued through 28 October 2005, although the rate of small earthquakes decreased slightly from the previous week. The activity that began on 1 October was at the highest level recorded since the seismic network was installed in 2003, so the Concern Color Code remained at Yellow. An unusual seismic signal on 17 October that persisted for several minutes may have been a landslide or small phreatic explosion, but satellite images detected no airborne ash. Beginning on 24 October, AVO observed weak, nearly continuous volcanic tremor in the vicinity of Takawangha volcano of the Tanaga volcano cluster. This was the first recorded tremor of this type. The daily number of small earthquakes continued to diminish from its peak in early October, but stayed above background levels.
AVO reported on 25 November 2005 that for several weeks seismicity beneath young volcanic vents on Tanaga Island decreased significantly from levels recorded in early October. Satellite images showed no anomalous temperatures or evidence of ash emissions. AVO reported that, based on the decrease in earthquake counts and frequency of tremor episodes, the likelihood of an eruption had diminished. Therefore, AVO downgraded the Concern Color Code to Green. According to AVO, the most recent eruptive activity at Tanaga was a lava flow observed in 1914.
Geologic Background. Tanaga volcano, the second largest volcanic center of the central Aleutians, is the central and highest of three youthful stratovolcanoes oriented along a roughly E-W line at the NW tip of Tanaga Island. Ridges to the east and south represent the rim of an arcuate caldera formed by collapse of an edifice during the Pleistocene. Most Holocene eruptions originated from Tanaga volcano itself, which consists of two large cones, the western of which is the highest, constructed within a caldera whose 400-m-high rim is prominent to the SE. At the westernmost end of the complex is conical Sajaka, a double cone that may be the youngest of the three volcanoes. Sajaka One volcano collapsed during the late Holocene, producing a debris avalanche that swept into the sea, after which the Sajaka Two cone was constructed within the collapse scarp.
Information Contacts: Alaska Volcano Observatory (AVO), a cooperative program of the U.S. Geological Survey, 4200 University Drive, Anchorage, AK 99508-4667, USA (URL: http://www.avo.alaska.edu/), Geophysical Institute, University of Alaska, PO Box 757320, Fairbanks, AK 99775-7320, USA, and Alaska Division of Geological & Geophysical Surveys, 794 University Ave., Suite 200, Fairbanks, AK 99709, USA.