Recently Published Bulletin Reports
Agung (Indonesia) Three eruptive events reported in April, May, and December 2022
Tengger Caldera (Indonesia) Minor ash emission in December 2023; persistent weak thermal anomaly in the Bromo crater
Saunders (United Kingdom) Persistent thermal anomalies from the summit crater lava lake during February 2023-January 2024
Shishaldin (United States) New eruption with significant Strombolian explosions, ash plumes, and ashfall
Ioto (Japan) New eruption with discolored water, ejecta, and floating pumice during October-December 2023
Purace (Colombia) Gas-and-ash emission on 16 November 2023
Etna (Italy) Strombolian explosions, lava fountains, and lava flows during July-August 2023
Suwanosejima (Japan) Eruption plumes, crater incandescence, and occasional explosions during July-October 2023
Aira (Japan) Explosions, ash plumes, ash fall, and crater incandescence during July-October 2023
Nishinoshima (Japan) Gray emissions during October 2023
Kilauea (United States) Strong lava fountains, lava flows, and spatter at Halema’uma’u during January-September 2023
Tinakula (Solomon Islands) Continued lava flows and thermal activity during June through November 2023
Agung (Indonesia) — January 2024  Cite this Report
Agung
Indonesia
8.343°S, 115.508°E; summit elev. 2997 m
All times are local (unless otherwise noted)
Three eruptive events reported in April, May, and December 2022
Mount Agung, located on the E end of the island of Bali, Indonesia, rises above the SE rim of the Batur caldera. The summit area extends 1.5 km E-W, with the highest point on the W and a steep-walled 800-m-wide crater on the E. Recorded eruptions date back to the early 19th century. A large and deadly explosive and effusive eruption occurred during 1963-64, which was characterized by voluminous ashfall, pyroclastic flows, and lahars that caused extensive damage and many fatalities. More recent activity was documented during November 2017-June 2019 that consisted of multiple explosions, significant ash plumes, lava flows at the summit crater, and incandescent ejecta. This report covers activity reported during April-May 2022 and December 2022 based on data from the Darwin Volcanic Ash Advisory Center (VAAC).
Activity during 2022 was relatively low and mainly consisted of a few ash plumes during April-May and December. An ash plume on 3 April rising to 3.7 km altitude (700 m above the summit) and drifting N was reported in a Darwin VAAC notice based on a ground report, with ash seen in HIMAWARI-8 visible imagery. Another ash plume was reported at 1120 on 27 May that rose to 5.5 km altitude (2.5 m above the summit); the plume was not visible in satellite or webcam images due to weather clouds. An eruption was reported based on seismic data at 0840 on 13 December, with an estimated plume altitude of 3.7 km; however, no ash was seen using satellite imagery in clear conditions before weather clouds obscured the summit.
Geologic Background. Symmetrical Agung stratovolcano, Bali's highest and most sacred mountain, towers over the eastern end of the island. The volcano, whose name means "Paramount," rises above the SE rim of the Batur caldera, and the northern and southern flanks extend to the coast. The summit area extends 1.5 km E-W, with the high point on the W and a steep-walled 800-m-wide crater on the E. The Pawon cone is located low on the SE flank. Only a few eruptions dating back to the early 19th century have been recorded in historical time. The 1963-64 eruption, one of the largest in the 20th century, produced voluminous ashfall along with devastating pyroclastic flows and lahars that caused extensive damage and many fatalities.
Information Contacts: Darwin Volcanic Ash Advisory Centre (VAAC), Bureau of Meteorology, Northern Territory Regional Office, PO Box 40050, Casuarina, NT 0811, Australia (URL: http://www.bom.gov.au/info/vaac/).
Tengger Caldera (Indonesia) — February 2024 Cite this Report
Tengger Caldera
Indonesia
7.942°S, 112.95°E; summit elev. 2329 m
All times are local (unless otherwise noted)
Minor ash emission in December 2023; persistent weak thermal anomaly in the Bromo crater
Tengger Caldera, located at the N end of a volcanic massif in Indonesia’s East Java, consists of five overlapping stratovolcanoes. The youngest and only active cone in the 16-km-wide caldera is Bromo, which typically produces gas-and-steam plumes, occasional ash plumes and explosions, and weak thermal signals (BGVN 44:05, 47:01). This report covers activity during January 2022-December 2023, consisting of mostly white gas-and-steam emissions and persistent weak thermal anomalies. Information was provided by the Pusat Vulkanologi dan Mitigasi Bencana Geologi (PVMBG, also known as Indonesian Center for Volcanology and Geological Hazard Mitigation, CVGHM) and satellite imagery. The Alert Level remained at 2 (on a scale of 1-4), and visitors were warned to stay at least 1 km from the crater.
Activity was generally low during the reporting period, similar to that in 2021. According to almost daily images from MAGMA Indonesia (a platform developed by PVMBG), white emissions and plumes rose from 50 to 900 m above the main crater during this period (figure 24). During several days in March and June 2022, white plumes reached heights of 1-1.2 km above the crater.
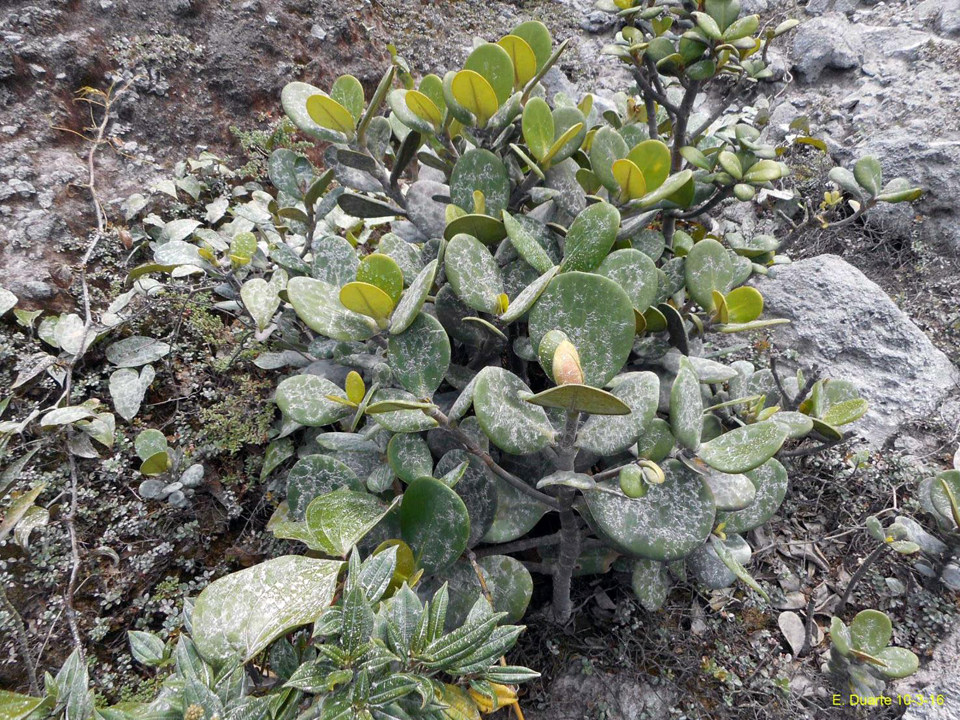
After an increase in activity at 2114 on 3 February 2023, a PVMBG team that was sent to observe white emissions rising as high as 300 m during 9-12 February and heard rumbling noises. A sulfur dioxide odor was also strong near the crater and measurements indicated that levels were above the healthy (non-hazardous) threshold of 5 parts per million; differential optical absorption spectroscopy (DOAS) measurements indicated an average flux of 190 metric tons per day on 11 February. Incandescence originating from a large fumarole in the NNW part of the crater was visible at night. The team observed that vegetation on the E caldera wall was yellow and withered. The seismic network recorded continuous tremor and deep and shallow volcanic earthquakes.
According to a PVMBG press release, activity increased on 13 December 2023 with white, gray, and brown emissions rising as high as 900 m above Bromo’s crater rim and drifting in multiple directions (figure 25). The report noted that tremor was continuous and was accompanied in December by three volcanic earthquakes. Deformation data indicated inflation in December. There was no observable difference in the persistent thermal anomaly in the crater between 11 and 16 December 2023.
All clear views of the Bromo crater throughout this time, using Sentinel-2 infrared satellite images, showed a weak persistent thermal anomaly; none of the anomalies were strong enough to cause MODVOLC Thermal Alerts. A fire in the SE part of the caldera in early September 2023 resulted in a brief period of strong thermal anomalies.
Geologic Background. The 16-km-wide Tengger caldera is located at the northern end of a volcanic massif extending from Semeru volcano. The massive volcanic complex dates back to about 820,000 years ago and consists of five overlapping stratovolcanoes, each truncated by a caldera. Lava domes, pyroclastic cones, and a maar occupy the flanks of the massif. The Ngadisari caldera at the NE end of the complex formed about 150,000 years ago and is now drained through the Sapikerep valley. The most recent of the calderas is the 9 x 10 km wide Sandsea caldera at the SW end of the complex, which formed incrementally during the late Pleistocene and early Holocene. An overlapping cluster of post-caldera cones was constructed on the floor of the Sandsea caldera within the past several thousand years. The youngest of these is Bromo, one of Java's most active and most frequently visited volcanoes.
Information Contacts: Pusat Vulkanologi dan Mitigasi Bencana Geologi (PVMBG, also known as Indonesian Center for Volcanology and Geological Hazard Mitigation, CVGHM), Jalan Diponegoro 57, Bandung 40122, Indonesia (URL: http://www.vsi.esdm.go.id/); MAGMA Indonesia, Kementerian Energi dan Sumber Daya Mineral (URL: https://magma.esdm.go.id/v1); Copernicus Browser, Copernicus Data Space Ecosystem, European Space Agency (URL: https://dataspace.copernicus.eu/browser/); Hawai'i Institute of Geophysics and Planetology (HIGP) - MODVOLC Thermal Alerts System, School of Ocean and Earth Science and Technology (SOEST), Univ. of Hawai'i, 2525 Correa Road, Honolulu, HI 96822, USA (URL: http://modis.higp.hawaii.edu/).
Saunders (United Kingdom) — February 2024 Cite this Report
Saunders
United Kingdom
57.8°S, 26.483°W; summit elev. 843 m
All times are local (unless otherwise noted)
Persistent thermal anomalies from the summit crater lava lake during February 2023-January 2024
Saunders is one of eleven islands that comprise the South Sandwich Islands in the South Atlantic. The active Mount Michael volcano has been in almost continuous eruption since November 2014 (BGVN 48:02). Recent activity has resulted in intermittent thermal anomalies and gas-and-steam emissions (BGVN 47:03, 48:02). Visits are infrequent due to its remote location, and cloud cover often prevents satellite observations. Satellite thermal imagery and visual observation of incandescence during a research expedition in 2019 (BGVN 28:02 and 44:08) and a finding confirmed by a National Geographic Society research team that summited Michael in November 2022 reported the presence of a lava lake.
Although nearly constant cloud cover during February 2023 through January 2024 greatly limited satellite observations, thermal anomalies from the lava lake in the summit crater were detected on clear days, especially around 20-23 August 2023. Anomalies similar to previous years (eg. BGVN 48:02) were seen in both MIROVA (Middle InfraRed Observation of Volcanic Activity) data from MODIS instruments and in Sentinel 2 infrared imagery. The only notable sulfur dioxide plume detected near Saunders was on 25 September 2023, with the TROPOMI instrument aboard the Sentinel-5P satellite.
Geologic Background. Saunders Island consists of a large central volcanic edifice intersected by two seamount chains, as shown by bathymetric mapping (Leat et al., 2013). The young Mount Michael stratovolcano dominates the glacier-covered island, while two submarine plateaus, Harpers Bank and Saunders Bank, extend north. The symmetrical Michael has a 500-m-wide summit crater and a remnant of a somma rim to the SE. Tephra layers visible in ice cliffs surrounding the island are evidence of recent eruptions. Ash clouds were reported from the summit crater in 1819, and an effusive eruption was inferred to have occurred from a N-flank fissure around the end of the 19th century and beginning of the 20th century. A low ice-free lava platform, Blackstone Plain, is located on the north coast, surrounding a group of former sea stacks. A cluster of cones on the SE flank, the Ashen Hills, appear to have been modified since 1820 (LeMasurier and Thomson, 1990). Analysis of satellite imagery available since 1989 (Gray et al., 2019; MODVOLC) suggests frequent eruptive activity (when weather conditions allow), volcanic clouds, steam plumes, and thermal anomalies indicative of a persistent, or at least frequently active, lava lake in the summit crater. Due to this observational bias, there has been a presumption when defining eruptive periods that activity has been ongoing unless there is no evidence for at least 10 months.
Information Contacts: MIROVA (Middle InfraRed Observation of Volcanic Activity), a collaborative project between the Universities of Turin and Florence (Italy) supported by the Centre for Volcanic Risk of the Italian Civil Protection Department (URL: http://www.mirovaweb.it/); NASA Global Sulfur Dioxide Monitoring Page, Atmospheric Chemistry and Dynamics Laboratory, NASA Goddard Space Flight Center (NASA/GSFC), 8800 Greenbelt Road, Goddard MD 20771, USA (URL: https://so2.gsfc.nasa.gov/); Copernicus Browser (URL: https://dataspace.copernicus.eu/browser).
Shishaldin (United States) — December 2023 Cite this Report
Shishaldin
United States
54.756°N, 163.97°W; summit elev. 2857 m
All times are local (unless otherwise noted)
New eruption with significant Strombolian explosions, ash plumes, and ashfall
Shishaldin is located on the eastern half of Unimak Island, one of the Aleutian Islands. Frequent explosive activity, primarily consisting of Strombolian ash eruptions from the small summit crater, but sometimes producing lava flows, has been recorded since the 18th century. The previous eruption ended in May 2020 and was characterized by intermittent thermal activity, increased seismicity and surface temperatures, ash plumes, and ash deposits (BGVN 45:06). This report covers a new eruption during July through November 2023, which consisted of significant explosions, ash plumes, ashfall, and lava fountaining. Information comes from daily, weekly, and special reports from the Alaska Volcano Observatory (AVO) and various satellite data. AVO monitors the volcano using local seismic and infrasound sensors, satellite data, web cameras, and remote infrasound and lightning networks.
AVO reported that intermittent tremor and low-frequency earthquakes had gradually become more regular and consistent during 10-13 July. Strongly elevated surface temperatures at the summit were identified in satellite images during 10-13 July. On 11 July AVO raised the Aviation Color Code (ACC) to Yellow (the second color on a four-color scale) and Volcano Alert Level (VAL) to Advisory (the second level on a four-level scale) at 1439. Later in the day on 11 July summit crater incandescence was observed in webcam images. Observations of the summit suggested that lava was likely present at the crater, which prompted AVO to raise the ACC to Orange (the second highest color on a four-color scale) and the VAL to Watch (the second highest level on a four-level scale). The US Coast Guard conducted an overflight on 12 July and confirmed that lava was erupting from the summit. That same day, sulfur dioxide emissions were detected in satellite images.
A significant explosion began at 0109 on 14 July that produced an ash plume that rose to 9-12 km altitude and drifted S over the Pacific Ocean (figure 43). Webcam images and photos taken around 0700 from a ship SW off Unimak Island showed small lahar deposits, which were the result of the interaction of hot pyroclastic material and snow and ice on the flanks. There was also ashfall on the SW and N flanks. A smaller explosion at 0710 generated an ash plume that rose to 4.5 km altitude. Webcam images and pilot reports showed continued low-level ash emissions during the morning, rising to less than 4.6 km altitude; those emissions included a small ash plume near the summit around 1030 resulting from a small explosion.
Seismic tremor amplitude began increasing at around 1700 on 15 July; strongly elevated surface temperatures were also reported. An ash plume rose to 4.6 km altitude and drifted SSE at 2100, based on a satellite image. A continuous ash plume during 2150 through 2330 rose to 5 km altitude and extended 125 km S. At 2357 AVO raised the ACC to Red (the highest color on a four-color scale) and the VAL to Warning (the highest level on a four-level scale), noting that seismicity remained elevated for more than six hours and explosion signals were frequently detected by regional infrasound (pressure sensor) networks. Explosions generated an ash plume that rose to 4.9 km altitude and drifted as far as 500 km SE. Activity throughout the night declined and by 0735 the ACC was lowered to Orange and the VAL to Watch. High-resolution satellite images taken on 16 July showed pyroclastic deposits extending as far as 3 km from the vent; these deposits generated lahars that extended further down the drainages on the flanks. Ash deposits were mainly observed on the SSE flank and extended to the shore of Unimak Island. During 16-17 July lava continued to erupt at the summit, which caused strongly elevated surface temperatures that were visible in satellite imagery.
Lava effusion increased at 0100 on 18 July, as noted in elevated surface temperatures identified in satellite data, increasing seismic tremor, and activity detected on regional infrasound arrays. A significant ash plume at 0700 rose to 7 km altitude and continued until 0830, eventually reaching 9.1 km altitude and drifting SSE (figure 44). As a result, the ACC was raised to Red and the VAL to Warning. By 0930 the main plume detached, but residual low-level ash emissions continued for several hours, remaining below 3 km altitude and drifting S. The eruption gradually declined and by 1208 the ACC was lowered to Orange and the VAL was lowered to Watch. High-resolution satellite images showed ash deposits on the SW flank and pyroclastic deposits on the N, E, and S flanks, extending as far as 3 km from the vent; lahars triggered by the eruption extended farther down the flanks (figure 45). Lava continued to erupt from the summit crater on 19 July.
Elevated surface temperatures were detected in satellite images during 19-25 July, despite occasional weather cloud cover, which was consistent with increased lava effusion. During 22-23 July satellite observations acquired after the eruption from 18 July showed pyroclastic flow and lahar deposits extending as far as 3 km down the N, NW, and NE flanks and as far as 1.5 km down the S and SE flanks. Ash deposits covered the SW and NE flanks. No lava flows were observed outside the crater. On 22 July a sulfur dioxide plume was detected in satellite data midday that had an estimated mass of 10 kt. In a special notice issued at 1653 on 22 July AVO noted that eruptive activity had intensified over the previous six hours, which was characterized by an hours-long steady increase in seismic tremor, intermittent infrasound signals consistent with small explosions, and an increase in surface temperatures that were visible in satellite data. Pilots first reported low-level ash plumes at around 1900. At 2320 an ash plume had risen to 9 km altitude based on additional pilot reports and satellite images. The ACC was increased to Red and the VAL to Warning at 2343. Satellite images indicated growth of a significantly higher ash plume that rose to 11 km altitude continued until 0030 and drifted NE. During the early morning hours of 23 July ash plumes had declined to 4.6 k altitude. Seismic tremor peaked at 0030 on 23 July and began to rapidly decline at 0109; active ash emissions were no longer visible in satellite data by 0130. The ACC was lowered to Orange and the VAL to Watch at 0418; bursts of increased seismicity were recorded throughout the morning, but seismicity generally remained at low levels. Elevated surface temperatures were visible in satellite data until about 0600. On 24 July pilots reported seeing vigorous gas-and-steam plumes rising to about 3 km altitude; the plumes may have contained minor amounts of ash.
During 24-25 July low level seismicity and volcanic tremor were detected at low levels following the previous explosion on 23 July. Strongly elevated surface temperatures were observed at the summit crater in satellite data. Around 2200 on 25 July seismicity began to increase, followed by infrasound signals of explosions after 0200 on 26 July. An ash plume rose to 3 km altitude at 0500 and drifted ENE, along with an associated sulfur dioxide plume that drifted NE and had an estimated mass of 22 kt. Diffuse ash emissions were visible in satellite data and rose to 6.1-7.6 km altitude and extended 125 km from the volcano starting around 1130. These ash events were preceded by about seven hours of seismic tremor, infrasound detections of explosions, and five hours of increased surface temperatures visible in satellite data. Activity began to decline around 1327, which included low-frequency earthquakes and decreased volcanic tremor, and infrasound data no longer detected significant explosions. Surface temperatures remained elevated through the end of the month.
Seismicity, volcanic tremor, and ash emissions remained at low levels during early August. Satellite images on 1 August showed that some slumping had occurred on the E crater wall due to the recent explosive activity. Elevated surface temperatures continued, which was consistent with cooling lava. On 2 August small explosive events were detected, consistent with low-level Strombolian activity. Some episodes of volcanic tremor were reported, which reflected low-level ash emissions. Those ash emissions rose to less than 3 km altitude and drifted as far as 92.6 km N. Pilots that were located N of the volcano observed an ash plume that rose to 2.7 km altitude. Seismicity began to increase in intensity around 0900 on 3 August. Seismicity continued to increase throughout the day and through the night with strongly elevated surface temperatures, which suggested that lava was active at the surface.
An ash cloud that rose to 7.6-7.9 km altitude and drifted 60-75 km NE was visible in a satellite image at 0520 on 4 August. Pilots saw and reported the plume at 0836 (figure 46). By 0900 the plume had risen to 9.1 km altitude and extended over 100 km NE. AVO raised the ACC to Red and the VAL to Warning as a result. Seismic tremor levels peaked at 1400 and then sharply declined at 1500 to slightly elevated levels; the plume was sustained during the period of high tremor and drifted N and NE. The ACC was lowered to Orange and the VAL to Watch at 2055. During 5-14 August seismicity remained low and surface temperatures were elevated based on satellite data due to cooling lava. On 9 August a small lava flow was observed that extended from the crater rim to the upper NE flank. It had advanced to 55 m in length and appeared in satellite imagery on 11 August. Occasional gas-and-steam plumes were noted in webcam images. At 1827 AVO noted that seismic tremor had steadily increased during the afternoon and erupting lava was visible at the summit in satellite images.
Strong explosion signals were detected at 0200 on 15 August. An ash cloud that was visible in satellite data extended 100 km NE and may have risen as high as 11 km altitude around 0240. By 0335 satellite images showed the ash cloud rising to 7.6 km altitude and drifting NE. Significant seismicity and explosions were detected by the local AVO seismic and infrasound networks, and volcanic lightning was detected by the World Wide Lightning Location Network (WWLLN). A sulfur dioxide plume associated with the eruption drifted over the S Bering Sea and parts of Alaska and western Canada. Seismicity was significantly elevated during the eruption but had declined by 1322. A pilot reported that ash emissions continued, rising as high as 4.9 km altitude. Elevated surface temperatures detected in satellite data were caused by hot, eruptive material (pyroclastic debris and lava) that accumulated around the summit. Eruptive activity declined by 16 August and the associated sulfur dioxide plume had mostly dissipated; remnants continued to be identified in satellite images at least through 18 August. Surface temperatures remained elevated based on satellite images, indicating hot material on the upper parts of the volcano. Small explosions were detected in infrasound data on the morning of 19 August and were consistent with pilot reports of small, short-lived ash plumes that rose to about 4.3 km altitude. Low-level explosive activity was reported during 20-24 August, according to seismic and infrasound data, and weather clouds sometimes prevented views. Elevated surface temperatures were observed in satellite images, which indicated continued hot material on the upper parts of the volcano.
Seismic tremor began to increase at around 0300 on 25 August and was followed by elevated surface temperatures identified in satellite images, consistent with erupting lava. Small explosions were recorded in infrasound data. The ACC was raised to Red and the VAL to Warning at 1204 after a pilot reported an ash plume that rose to 9.1 km altitude. Seismicity peaked at 1630 and began to rapidly decline at around 1730. Ash plumes rose as high as 10 km altitude and drifted as far as 400 km NE. By 2020 the ash plumes had declined to 6.4 km altitude and continued to drift NE. Ash emissions were visible in satellite data until 0000 on 26 August and seismicity was at low levels. AVO lowered the ACC to Orange and the VAL to Watch at 0030. Minor explosive activity within the summit crater was detected during 26-28 August and strongly elevated surface temperatures were still visible in satellite imagery through the rest of the month. An AVO field crew working on Unimak Island observed a mass flow that descended the upper flanks beginning around 1720 on 27 August. The flow produced a short-lived ash cloud that rose to 4.5 km altitude and rapidly dissipated. The mass flow was likely caused by the collapse of spatter that accumulated on the summit crater rim.
Similar variable explosive activity was reported in September, although weather observations sometimes prevented observations. A moderate resolution satellite image from the afternoon of 1 September showed gas-and-steam emissions filling the summit crater and obscuring views of the vent. In addition, hot deposits from the previous 25-26 August explosive event were visible on the NE flank near the summit, based on a 1 September satellite image. On 2 and 4 September seismic and infrasound data showed signals of small, repetitive explosions. Variable gas-and-steam emissions from the summit were visible but there was no evidence of ash. Possible summit crater incandescence was visible in nighttime webcam images during 3-4 September.
Seismicity began to gradually increase at around 0300 on 5 September and activity escalated at around 0830. A pilot reported an ash plume that rose to 7.6 km altitude at 0842 and continued to rise as high as possibly 9.7 km altitude and drifted SSE based on satellite images (figure 47). The ACC was raised to Red and the VAL to Warning at 0900. In addition to strong tremor and sustained explosions, the eruption produced volcanic lightning that was detected by the WWLLN. Around 1100 seismicity decreased and satellite data confirmed that the altitude of the ash emissions had declined to 7.6 km altitude. By 1200 the lower-altitude portion of the ash plume had drifted 125 km E. Significant ash emissions ended by 1330 based on webcam images. The ACC was lowered to Orange and the VAL to Watch at 1440. Satellite images showed extensive pyroclastic debris flows on most of the flanks that extended 1.2-3.3 km from the crater rim.
During 6-13 September elevated surface temperatures continued to be observed in satellite data, seismicity remained elevated with weak but steady tremor, and small, low-frequency earthquakes and small explosions were reported, except on 12 September. On 6 September a low-level ash plume rose to 1.5-1.8 km altitude and drifted SSE. Occasional small and diffuse gas-and-steam emissions at the summit were visible in webcam images. Around 1800 on 13 September seismic tremor amplitudes began to increase, and small explosions were detected in seismic and infrasound data. Incandescent lava at the summit was seen in a webcam image taken at 0134 on 14 September during a period of elevated tremor. No ash emissions were reported during the period of elevated seismicity. Lava fountaining began around 0200, based on webcam images. Satellite-based radar observations showed that the lava fountaining activity led to the growth of a cone in the summit crater, which refilled most of the crater. By 0730 seismicity significantly declined and remained at low levels.
Seismic tremor began to increase around 0900 on 15 September and rapidly intensified. An explosive eruption began at around 1710, which prompted AVO to raise the ACC to Red and the VAL to Warning. Within about 30 minutes ash plumes drifted E below a weather cloud at 8.2 km altitude. The National Weather Service estimated that an ash-rich plume rose as high as 12.8 km altitude and produced volcanic lightning. The upper part of the ash plume detached from the vent around 1830 and drifted E, and was observed over the Gulf of Alaska. Around the same time, seismicity dramatically decreased. Trace ashfall was reported in the community of False Pass (38 km ENE) between 1800-2030 and also in King Cove and nearby marine waters. Activity declined at around 1830 although seismicity remained elevated, ash emissions, and ashfall continued until 2100. Lightning was again detected beginning around 1930, which suggested that ash emissions continued. Ongoing explosions were detected in infrasound data, at a lower level than during the most energetic phase of this event. Lightning was last detected at 2048. By 2124 the intensity of the eruption had decreased, and ash emissions were likely rising to less than 6.7 km altitude. Seismicity returned to pre-eruption levels. On 16 September the ACC was lowered to Orange and the VAL to Watch at 1244; the sulfur dioxide plume that was emitted from the previous eruption event was still visible over the northern Pacific Ocean. Elevated surface temperatures, gas-and-steam emissions from the vent, and new, small lahars were reported on the upper flanks based on satellite and webcam images. Minor deposits were reported on the flanks which were likely the result of collapse of previously accumulated lava near the summit crater.
Elevated seismicity with tremor, small earthquakes, and elevated surface temperatures were detected during 17-23 September. Minor gas-and-steam emissions were visible in webcam images. On 20 September small volcanic debris flows were reported on the upper flanks. On 21 September a small ash deposit was observed on the upper flanks extending to the NE based on webcam images. Seismic tremor increased significantly during 22-23 September. Regional infrasound sensors suggested that low-level eruptive activity was occurring within the summit crater by around 1800 on 23 September. Even though seismicity was at high levels, strongly elevated surface temperatures indicating lava at the surface were absent and no ash emissions were detected; weather clouds at 0.6-4.6 km altitude obscured views. At 0025 on 24 September AVO noted that seismicity continued at high levels and nearly continuous small infrasound signals began, likely from low-level eruptive activity. Strongly elevated surface temperatures were identified in satellite images by 0900 and persisted throughout the day; the higher temperatures along with infrasound and seismic data were consistent with lava erupting at the summit. Around 1700 similarly elevated surface temperatures were detected from the summit in satellite data, which suggested that more vigorous lava fountaining had started. Starting around 1800 low-level ash emissions rose to altitudes less than 4.6 km altitude and quickly dissipated.
Beginning at midnight on 25 September, a series of seismic signals consistent with volcanic flows were recorded on the N side of the volcano. A change in seismicity and infrasound signals occurred around 0535 and at 0540 a significant ash cloud formed and quickly reached 14 km altitude and drifted E along the Alaska Peninsula. The cloud generated at least 150 lightning strokes with thunder that could be heard by people in False Pass. Seismicity rapidly declined to near background levels around 0600. AVO increased the ACC to Red and the VAL to Warning at 0602. The ash cloud detached from the volcano at around 0700, rose to 11.6 km altitude, and drifted ESE. Trace to minor amounts of ashfall were reported by the communities of False Pass, King Cove, Cold Bay, and Sand Point around 0700. Ash emissions continued at lower altitudes of 6-7.6 km altitude at 0820. Small explosions at the vent area continued to be detected in infrasound data and likely represented low-level eruptive activity near the vent. Due to the significant decrease in seismicity and ash emissions the ACC was lowered to Orange and the VAL to Watch at 1234. Radar data showed significant collapses of the crater that occurred on 25 September. Satellite data also showed significant hot, degassing pyroclastic and lahar deposits on all flanks, including more extensive flows on the ENE and WSW sections below two new collapse scarps. Following the significant activity during 24-25 September, only low-level activity was observed. Seismicity decreased notably near the end of the strong activity on 25 September and continued to decrease through the end of the month, though tremor and small earthquakes were still reported. No explosive activity was detected in infrasound data through 2 October. Gas-and-steam emissions rose to 3.7 km altitude, as reported by pilots and seen in satellite images. Satellite data from 26 September showed that significant collapses had occurred at the summit crater and hot, steaming deposits from pyroclastic flows and lahars were present on all the flanks, particularly to the ENE and WSW. A small ash cloud was visible in webcam images on 27 September, likely from a collapse at the summit cone. High elevated surface temperatures were observed in satellite imagery during 27-28 September, which were likely the result of hot deposits on the flanks erupted on 25 September. Minor steaming at the summit crater and from an area on the upper flanks was visible in webcam images on 28 September.
During October, explosion events continued between periods of low activity. Seismicity significantly increased starting at around 2100 on 2 October; around the same time satellite images showed an increase in surface temperatures consistent with lava fountaining. Small, hot avalanches of rock and lava descended an unspecified flank. In addition, a distinct increase in infrasound, seismicity, and lightning detections was followed by an ash plume that rose to 12.2 km altitude and drifted S and E at 0520 on 3 October, based on satellite images. Nighttime webcam images showed incandescence due to lava fountaining at the summit and pyroclastic flows descending the NE flank. AVO reported that a notable explosive eruption started at 0547 and lasted until 0900 on 3 October, which prompted a rise in the ACC to Red and the VAL to Warning. Subsequent ash plumes rose to 6-7.6 km altitude by 0931. At 1036 the ACC was lowered back to Orange and the VAL to Watch since both seismic and infrasound data quieted substantially and were slightly above background levels. Gas-and-steam emissions were observed at the summit, based on webcam images. Trace amounts of ashfall were observed in Cold Bay. Resuspended ash was present at several kilometers altitude near the volcano. During the afternoon, low-level ash plumes were visible at the flanks, which appeared to be largely generated by rock avalanches off the summit crater following the explosive activity. These ash plumes rose to 3 km altitude and drifted W. Trace amounts of ashfall were reported by observers in Cold Bay and Unalaska and flights to these communities were disrupted by the ash cloud. Satellite images taken after the eruption showed evidence of pyroclastic flows and lahar deposits in drainages 2 km down the SW flank and about 3.2 km down the NE flank, and continued erosion of the crater rim. Small explosion craters at the end of the pyroclastic flows on the NE flank were noted for the first time, which may have resulted from gas-and-steam explosions when hot deposits interact with underlying ice.
During 4 October seismicity, including frequent small earthquakes, remained elevated, but was gradually declining. Ash plumes were produced for over eight hours until around 1400 that rose to below 3.7 km altitude. These ash plumes were primarily generated off the sides of the volcano where hot rock avalanches from the crater rim had entered drainages to the SW and NE. Two explosion craters were observed at the base of the NE deposits about 3.2 km from the crater rim. Webcam images showed the explosion craters were a source of persistent ash emissions; occasional collapse events also generated ash. Seismicity remained elevated with sulfur dioxide emissions that had a daily average of more than 1,000 tons per day, and frequent small earthquakes through the end of the month. Frequent elevated surface temperatures were identified in satellite images and gas-and-steam plumes were observed in webcam images, although weather conditions occasionally prevented clear views of the summit. Emissions were robust during 14-16 October and were likely generated by the interaction of hot material and snow and ice. During the afternoon of 21 October a strong gas-and-steam plume rose to 3-4.6 km altitude and extended 40 km WSW, based on satellite images and reports from pilots. On 31 October the ACC was lowered to Yellow and the VAL was lowered to Advisory.
Activity in November was characterized by elevated seismicity with ongoing seismic tremor and small, low-frequency earthquakes, elevated surface temperatures, and gas-and-steam emissions. There was an increase in seismic and infrasound tremor amplitudes starting at 1940 on 2 November. As a result, the ACC was again raised to Orange and the VAL was increased to Watch, although ash was not identified in satellite data. An ash cloud rose to 6.1 km altitude and drifted W according to satellite data at 2000. By 0831 on 3 November ash emissions were no longer visible in satellite images. On 6 and 9 November air pressure sensors detected signals consistent with small explosions. Small explosions were detected in infrasound data consistent with weak Strombolian activity on 19 and 21 November. Seismicity started to decrease on 21 November. On 25 November gas-and-steam emissions were emitted from the vent as well as from a scarp on the NE side of the volcano near the summit. A gas-and-steam plume extended about 50 km SSE and was observed in satellite and webcam images on 26 November. On 28 November small explosions were observed in seismic and local infrasound data and gas-and-steam emissions were visible from the summit and from the upper NE collapse scarp based on webcam images. Possible small explosions were observed in infrasound data on 30 November. Weakly elevated surface temperatures and a persistent gas-and-steam plume from the summit and collapse scarps on the upper flanks. A passing aircraft reported the gas-and-steam plume rose to 3-3.4 km altitude on 30 November, but no significant ash emissions were detected.
Satellite data. MODIS thermal anomaly data provided through MIROVA (Middle InfraRed Observation of Volcanic Activity) showed a strong pulse of thermal activity beginning in July 2023 that continued through November 2023 (figure 48). This strong activity was due to Strombolian explosions and lava fountaining events at the summit crater. According to data from MODVOLC thermal alerts, a total of 101 hotspots were detected near the summit crater in July (11-14, 16-19, 23-24 and 26), August (4, 25-26, and 29), September (5, 12, and 17), and October (3, 4, and 8). Infrared satellite data showed large lava flows descending primarily the northern and SE flanks during the reporting period (figure 49). Sulfur dioxide plumes often exceeded two Dobson Units (DUs) and drifted in different directions throughout the reporting period, based on satellite data from the TROPOMI instrument on the Sentinel-5P satellite (figure 50).
Geologic Background. The symmetrical glacier-covered Shishaldin in the Aleutian Islands is the westernmost of three large stratovolcanoes in the eastern half of Unimak Island. The Aleuts named the volcano Sisquk, meaning "mountain which points the way when I am lost." Constructed atop an older glacially dissected edifice, it is largely basaltic in composition. Remnants of an older edifice are exposed on the W and NE sides at 1,500-1,800 m elevation. There are over two dozen pyroclastic cones on its NW flank, which is covered by massive aa lava flows. Frequent explosive activity, primarily consisting of Strombolian ash eruptions from the small summit crater, but sometimes producing lava flows, has been recorded since the 18th century. A steam plume often rises from the summit crater.
Information Contacts: Alaska Volcano Observatory (AVO), a cooperative program of a) U.S. Geological Survey, 4200 University Drive, Anchorage, AK 99508-4667 USA (URL: https://avo.alaska.edu/), b) Geophysical Institute, University of Alaska, PO Box 757320, Fairbanks, AK 99775-7320, USA, and c) Alaska Division of Geological & Geophysical Surveys, 794 University Ave., Suite 200, Fairbanks, AK 99709, USA (URL: http://dggs.alaska.gov/); MIROVA (Middle InfraRed Observation of Volcanic Activity), a collaborative project between the Universities of Turin and Florence (Italy) supported by the Centre for Volcanic Risk of the Italian Civil Protection Department (URL: http://www.mirovaweb.it/); Hawai'i Institute of Geophysics and Planetology (HIGP) - MODVOLC Thermal Alerts System, School of Ocean and Earth Science and Technology (SOEST), Univ. of Hawai'i, 2525 Correa Road, Honolulu, HI 96822, USA (URL: http://modis.higp.hawaii.edu/); NASA Global Sulfur Dioxide Monitoring Page, Atmospheric Chemistry and Dynamics Laboratory, NASA Goddard Space Flight Center (NASA/GSFC), 8800 Greenbelt Road, Goddard, Maryland, USA (URL: https://so2.gsfc.nasa.gov/); Copernicus Browser, Copernicus Data Space Ecosystem, European Space Agency (URL: https://dataspace.copernicus.eu/browser/).
Ioto
Japan
24.751°N, 141.289°E; summit elev. 169 m
All times are local (unless otherwise noted)
New eruption with discolored water, ejecta, and floating pumice during October-December 2023
Ioto (Iwo-jima), located about 1,200 km S of Tokyo, lies within a 9-km-wide submarine caldera along the Izu-Bonin-Mariana volcanic arc. Previous eruptions date back to 1889 and have consisted of dominantly phreatic explosions, pumice deposits during 2001, and discolored water. A submarine eruption during July through December 2022 was characterized by discolored water, pumice deposits, and gas emissions (BGVN 48:01). This report covers a new eruption during October through December 2023, which consisted of explosions, black ejecta, discolored water, and floating pumice, based on information from the Japan Meteorological Association (JMA), the Japan Coast Guard (JCG), and satellite data.
JMA reported that an eruption had been occurring offshore of Okinahama on the SE side of the island since 21 October, which was characterized by volcanic tremor, according to the Japan Maritime Self-Defense Force (JMSDF) Iwo Jima Air Base (figure 22). According to an 18 October satellite image a plume of discolored water at the site of this new eruption extended NE (figure 23). During an overflight conducted on 30 October, a vent was identified about 1 km off the coast of Okinahama. Observers recorded explosions every few minutes that ejected dark material about 20 m above the ocean and as high as 150 m. Ejecta from the vent formed a black-colored island about 100 m in diameter, according to observations conducted from the air by the Earthquake Research Institute of the University of Tokyo in cooperation with the Mainichi newspaper (figure 24). Occasionally, large boulders measuring more than several meters in size were also ejected. Observations from the Advanced Land Observing Satellite Daichi-2 and Sentinel-2 satellite images also confirmed the formation of this island (figure 23). Brown discolored water and floating pumice were present surrounding the island.
The eruption continued during November. During an overflight on 3 November observers photographed the island and noted that material was ejected 169 m high, according to a news source. Explosions gradually became shorter, and, by the 3rd, they occurred every few seconds; dark and incandescent material were ejected about 800 m above the vent. On 4 November eruptions were accompanied by explosive sounds. Floating, brown-colored pumice was present in the water surrounding the island. There was a brief increase in the number of volcanic earthquakes during 8-14 November and 24-25 November. The eruption temporarily paused during 9-11 November and by 12 November eruptions resumed to the W of the island. On 10 November dark brown-to-dark yellow-green discolored water and a small amount of black floating material was observed (figure 25). A small eruption was reported on 18 November off the NE coast of the island, accompanied by white gas-and-steam plumes (figure 23). Another pause was recorded during 17-19 November, which then resumed on 20 November and continued erupting intermittently. According to a field survey conducted by the National Institute for Disaster Prevention Science and Technology on 19 November, a 30-m diameter crater was visible on the NE coast where landslides, hot water, and gray volcanic ash containing clay have occurred and been distributed previously. Erupted blocks about 10 cm in diameter were distributed about 90-120 m from the crater. JCG made observations during an overflight on 23 November and reported a phreatomagmatic eruption. Explosions at the main vent generated dark gas-and-ash plumes that rose to 200 m altitude and ejected large blocks that landed on the island and in the ocean (figure 26). Discolored water also surrounded the island. The size of the new island had grown to 450 m N-S x 200 m E-W by 23 November, according to JCG.
The eruption continued through 11 December, followed by a brief pause in activity, which then resumed on 31 December, according to JMA. Intermittent explosions produced 100-m-high black plumes at intervals of several minutes to 30 minutes during 1-10 December. Overflights were conducted on 4 and 15 December and reported that the water surrounding the new island was discolored to dark brown-to-dark yellow-green (figure 27). No floating material was reported during this time. In comparison to the observations made on 23 November, the new land had extended N and part of it had eroded away. In addition, analysis by the Geospatial Information Authority of Japan using SAR data from Daichi-2 also confirmed that the area of the new island continued to decrease between 4 and 15 December. Ejected material combined with wave erosion transformed the island into a “J” shape, 500-m-long and with the curved part about 200 m offshore of Ioto. The island was covered with brown ash and blocks, and the surrounding water was discolored to greenish-brown and contained an area of floating pumice. JCG reported from an overflight on 4 December that volcanic ash-like material found around the S vent on the NE part of the island was newly deposited since 10 November (figure 28). By 15 December the N part of the “J” shaped island had separated and migrated N, connecting to the Okinahama coast and the curved part of the “J” had eroded into two smaller islands (figure 27).
References. Ukawa, M., Fujita, E., Kobayashi, T., 2002, Recent volcanic activity of Iwo Jima and the 2001 eruption, Monthly Chikyu, Extra No. 39, 157-164.
Geologic Background. Ioto, in the Volcano Islands of Japan, lies within a 9-km-wide submarine caldera. The volcano is also known as Ogasawara-Iojima to distinguish it from several other "Sulfur Island" volcanoes in Japan. The triangular, low-elevation, 8-km-long island narrows toward its SW tip and has produced trachyandesitic and trachytic rocks that are more alkalic than those of other volcanoes in this arc. The island has undergone uplift for at least the past 700 years, accompanying resurgent doming of the caldera; a shoreline landed upon by Captain Cook's surveying crew in 1779 is now 40 m above sea level. The Motoyama plateau on the NE half of the island consists of submarine tuffs overlain by coral deposits and forms the island's high point. Many fumaroles are oriented along a NE-SW zone cutting through Motoyama. Numerous recorded phreatic eruptions, many from vents on the W and NW sides of the island, have accompanied the uplift.
Information Contacts: Japan Meteorological Agency (JMA), 1-3-4 Otemachi, Chiyoda-ku, Tokyo 100-8122, Japan (URL: http://www.jma.go.jp/jma/indexe.html); Japan Coast Guard (JCG) Volcano Database, Hydrographic and Oceanographic Department, 3-1-1, Kasumigaseki, Chiyoda-ku, Tokyo 100-8932, Japan (URL: https://www1.kaiho.mlit.go.jp/GIJUTSUKOKUSAI/kaiikiDB/kaiyo22-2.htm); Copernicus Browser, Copernicus Data Space Ecosystem, European Space Agency (URL: https://dataspace.copernicus.eu/browser/); Asahi, 5-3-2, Tsukiji, Chuo Ward, Tokyo, 104-8011, Japan (URL: https://www.asahi.com/ajw/articles/15048458).
Purace (Colombia) — December 2023 Cite this Report
Purace
Colombia
2.3095°N, 76.3948°W; summit elev. 4650 m
All times are local (unless otherwise noted)
Gas-and-ash emission on 16 November 2023
Puracé, located in Colombia, is a stratovolcano that contains a 500-m-wide summit crater. It is part of the Los Coconucos volcanic chain that is a NW-SE trending group of seven cones and craters. The most recent eruption occurred during March 2022 that was characterized by frequent seismicity and gas-and-steam emissions (BGVN 47:06). This report covers a brief eruption during November 2023 based on monthly reports from the Popayán Observatory, part of the Servicio Geologico Colombiano (SGC).
Activity during November 2022 through November 2023 primarily consisted of seismicity: VT-type events, LP-type events, HB-type events, and TR-type events (table 4). Maximum sulfur dioxide values were measured weekly and ranged from 259-5,854 tons per day (t/d) during November 2022 through April 2023. White gas-and-steam emissions were also occasionally reported.
SGC issued a report on 25 October that noted a significant increase in the number of earthquakes associated with rock fracturing. These earthquakes were located SE of the crater between Puracé and Piocollo at depths of 1-4 km. There were no reported variations in sulfur dioxide values, but SGC noted high carbon dioxide values, compared to those recorded in the first half of 2023.
SGC reported that at 1929 on 16 November the seismic network detected a signal that was possibly associated with a gas-and-ash emission, though it was not confirmed in webcam images due to limited visibility. On 17 November an observer confirmed ash deposits on the N flank. Webcam images showed an increase in degassing both inside the crater and from the NW flank, rising 700 m above the crater.
Table 4. Seismicity at Puracé during November 2022-November 2023. Volcano-tectonic (VT), long-period (LP), hybrid (HB), and tremor (TR) events are reported each month. Courtesy of SGC.
| Month |
Volcano-tectonic |
Long-period |
Hybrid |
Tremor |
| Nov 2022 |
429 |
2,023 |
5 |
831 |
| Dec 2022 |
423 |
1,390 |
9 |
834 |
| Jan 2023 |
719 |
1,622 |
0 |
957 |
| Feb 2023 |
598 |
1,701 |
2 |
1,124 |
| Mar 2023 |
331 |
2,408 |
147 |
607 |
| Apr 2023 |
614 |
4,427 |
33 |
148 |
| May 2023 |
620 |
3,717 |
170 |
109 |
| Jun 2023 |
467 |
3,293 |
86 |
148 |
| Jul 2023 |
1,116 |
5,809 |
183 |
542 |
| Aug 2023 |
692 |
2,927 |
94 |
321 |
| Sep 2023 |
887 |
1,505 |
82 |
848 |
| Oct 2023 |
2,373 |
2,949 |
135 |
692 |
| Nov 2023 |
1,212 |
2,302 |
69 |
293 |
Geologic Background. Puracé is an active andesitic volcano with a 600-m-diameter summit crater at the NW end of the Los Coconucos Volcanic Chain. This volcanic complex includes nine composite and five monogenetic volcanoes, extending from the Puracé crater more than 6 km SE to the summit of Pan de Azúcar stratovolcano. The dacitic massif which the complex is built on extends about 13 km NW-SE and 10 km NE-SW. Frequent small to moderate explosive eruptions reported since 1816 CE have modified the morphology of the summit crater, with the largest eruptions in 1849, 1869, and 1885.
Information Contacts: Servicio Geologico Colombiano (SGC), Diagonal 53 No. 34-53 - Bogotá D.C., Colombia (URL: https://www.sgc.gov.co/volcanes).
Etna
Italy
37.748°N, 14.999°E; summit elev. 3357 m
All times are local (unless otherwise noted)
Strombolian explosions, lava fountains, and lava flows during July-August 2023
Etna, located on the Italian island of Sicily, has had documented eruptions dating back to 1500 BCE. Activity typically originates from multiple cones at the summit, where several craters have formed and evolved. The currently active craters are Northeast Crater (NEC), Voragine (VOR), and Bocca Nuova (BN), and the Southeast Crater (SEC); VOR and BN were previously referred to as the “Central Crater”. The original Southeast crater formed in 1978, and a second eruptive site that opened on its SE flank in 2011 was named the New Southeast Crater (NSEC). Another eruptive site between the SEC and NSEC developed during early 2017 and was referred to as the "cono della sella" (saddle cone). The current eruption period began in November 2022 and has been characterized by intermittent Strombolian activity, lava flows, and ash plumes (BGVN 48:08). This report updates activity during July through October 2023, which includes primarily gas-and-steam emissions; during July and August Strombolian explosions, lava fountains, and lava flows were reported, based on weekly and special reports by the Osservatorio Etneo (OE), part of the Catania Branch of Italy's Istituo Nazionale di Geofisica e Vulcanologica (INGV) and satellite data.
Variable fumarolic degassing was reported at all summit craters (BN, VOR, NEC, and SEC) throughout the entire reporting period (table 15). The MIROVA (Middle InfraRed Observation of Volcanic Activity) volcano hotspot detection system based on the analysis of MODIS data showed frequent low-to-moderate power thermal anomalies during the reporting period (figure 399). During mid-August there was a pulse in activity that showed an increase in the power of the anomalies due to Strombolian activity, lava fountains, and lava flows. Infrared satellite imagery captured strong thermal anomalies at the central and southeast summit crater areas (figure 400). Accompanying thermal activity were occasional sulfur dioxide plumes that exceeded 2 Dobson Units (DUs) recorded by the TROPOMI instrument on the Sentinel-5P satellite (figure 401).
Table 15. Summary of activity at the four primary crater areas at the summit of Etna during July-October 2023. Information is from INGV weekly reports.
| Month |
Bocca Nuova (BN) |
Voragine (VOR) |
Northeast Crater (NEC) |
Southeast Crater (SEC) |
| Jul 2023 |
Continuous degassing. |
No observations. |
Weak gas emissions. |
Continuous degassing. Sporadic and weak-to-moderate ash emissions. Strombolian explosions. |
| Aug 2023 |
Continuous degassing. |
No observations. |
No observations. |
Continuous degassing. Occasional ash emissions. Strombolian activity, lava fountaining, and lava flows. |
| Sep 2023 |
Variable degassing. Crater incandescence. |
Weak fumarolic activity. |
Weak fumarolic activity. |
Variable degassing. |
| Oct 2023 |
Continuous degassing. |
Weak fumarolic activity. |
Weak fumarolic activity. |
Continuous degassing. |
Activity during July and August was relatively low and mainly consisted of degassing at the summit craters, particularly at SEC and BN. Cloudy weather prevented clear views of the summit during early July. During the night of 2 July some crater incandescence was visible at SEC. Explosive activity resumed at SEC during 9-10 July, which was characterized by sporadic and weak ash emissions that rapidly dispersed in the summit area (figure 402). INGV reported moderate Strombolian activity began at 2034 on 14 July and was confined to the inside of the crater and fed by a vent located in the E part of SEC. An ash emission was detected at 2037. A new vent opened on 15 July in the SE part of BN and began to produce continuous gas-and-steam emissions. During an inspection carried out on 28 July pulsating degassing, along with audible booms, were reported at two active vents in BN. Vigorous gas-and-steam emissions intermittently generated rings. On rare occasions, fine, reddish ash was emitted from BN1 and resuspended by the gas-and-steam emissions.
Around 2000 on 13 August INGV reported a sudden increase in volcanic tremor amplitude. Significant infrasonic activity coincided with the tremor increase. Incandescent flashes were visible through the cloud cover in webcam images of SEC (figure 403). Strombolian activity at SEC began to gradually intensify starting at 2040 as seismicity continued to increase. The Aviation Color Code (ACC) was raised to Yellow (the second lowest-level on a four-color scale) at 2126 and then to Orange (the second highest-level on a four-color scale) at 2129 due to above-background activity. The activity rapidly transitioned from Strombolian activity to lava fountains around 2333 that rose 300-400 m above the crater (figure 403). Activity was initially focused on the E vent of the crater, but then the vent located above the S flank of the cone also became active. A lava flow from this vent traveled SW into the drainage created on 10 February 2022, overlapping with previous flows from 10 and 21 February 2022 and 21 May 2023, moving between Monte Barbagallo and Monte Frumento Supino (figure 404). The lava flow was 350 m long, oriented NNE-SSW, and descended to an elevation of 2.8 km. Flows covered an area of 300,000 m2 and had an estimated volume of 900,000 m3. The ACC was raised to Red at 2241 based on strong explosive activity and ashfall in Rifugio Sapienza-Piano Vetore at 1.7 km elevation on the S flank. INGV reported that pyroclastic flows accompanied this activity.
Activity peaked between 0240 and 0330 on 14 August, when roughly 5-6 vents erupted lava fountains from the E to SW flank of SEC. The easternmost vents produced lava fountains that ejected material strongly to the E, which caused heavy fallout of incandescent pyroclastic material on the underlying flank, triggering small pyroclastic flows. This event was also accompanied by lightning both in the ash column and in the ash clouds that were generated by the pyroclastic flows. A fracture characterized by a series of collapse craters (pit craters) opened on the upper SW flank of SEC. An ash cloud rose a few kilometers above the crater and drifted S, causing ash and lapilli falls in Rifugio Sapienza and expanding toward Nicolosi, Mascalucia, Catania, and up to Syracuse. Ashfall resulted in operational problems at the Catania airport (50 km S), which lasted from 0238 until 2000. By 0420 the volcanic tremor amplitude values declined to background levels. After 0500 activity sharply decreased, although the ash cloud remained for several hours and drifted S. By late morning, activity had completely stopped. The ACC was lowered to Orange as volcanic ash was confined to the summit area. Sporadic, minor ash emissions continued throughout the day. At 1415 the ACC was lowered to Yellow and then to Green at 1417.
During the night of 14-15 August only occasional flashes were observed, which were more intense during avalanches of material inside the eruptive vents. Small explosions were detected at SEC at 2346 on 14 August and at 0900 on 26 August that each produced ash clouds which rapidly dispersed into the atmosphere (figure 405). According to a webcam image, an explosive event detected at 2344 at SEC generated a modest ash cloud that was rapidly dispersed by winds. The ACC was raised to Yellow at 2355 on 14 August due to increasing unrest and was lowered to Green at 0954 on 15 August.
Activity during September and October was relatively low and mainly characterized by variable degassing from BN and SEC. Intense, continuous, and pulsating degassing was accompanied by roaring sounds and flashes of incandescence at BN both from BN1 and the new pit crater that formed during late July (figure 406). The degassing from the new pit crater sometimes emitted vapor rings. Cloudy weather during 6-8 September prevented observations of the summit craters .
Geologic Background. Mount Etna, towering above Catania on the island of Sicily, has one of the world's longest documented records of volcanism, dating back to 1500 BCE. Historical lava flows of basaltic composition cover much of the surface of this massive volcano, whose edifice is the highest and most voluminous in Italy. The Mongibello stratovolcano, truncated by several small calderas, was constructed during the late Pleistocene and Holocene over an older shield volcano. The most prominent morphological feature of Etna is the Valle del Bove, a 5 x 10 km caldera open to the east. Two styles of eruptive activity typically occur, sometimes simultaneously. Persistent explosive eruptions, sometimes with minor lava emissions, take place from one or more summit craters. Flank vents, typically with higher effusion rates, are less frequently active and originate from fissures that open progressively downward from near the summit (usually accompanied by Strombolian eruptions at the upper end). Cinder cones are commonly constructed over the vents of lower-flank lava flows. Lava flows extend to the foot of the volcano on all sides and have reached the sea over a broad area on the SE flank.
Information Contacts: Sezione di Catania - Osservatorio Etneo, Istituto Nazionale di Geofisica e Vulcanologia (INGV), Sezione di Catania, Piazza Roma 2, 95123 Catania, Italy (URL: http://www.ct.ingv.it/it/); MIROVA (Middle InfraRed Observation of Volcanic Activity), a collaborative project between the Universities of Turin and Florence (Italy) supported by the Centre for Volcanic Risk of the Italian Civil Protection Department (URL: http://www.mirovaweb.it/); NASA Global Sulfur Dioxide Monitoring Page, Atmospheric Chemistry and Dynamics Laboratory, NASA Goddard Space Flight Center (NASA/GSFC), 8800 Greenbelt Road, Goddard MD 20771, USA (URL: https://so2.gsfc.nasa.gov/); Copernicus Browser, Copernicus Data Space Ecosystem, European Space Agency (URL: https://dataspace.copernicus.eu/browser/).
Suwanosejima (Japan) — December 2023 Cite this Report
Suwanosejima
Japan
29.638°N, 129.714°E; summit elev. 796 m
All times are local (unless otherwise noted)
Eruption plumes, crater incandescence, and occasional explosions during July-October 2023
Suwanosejima is an 8-km-long island that consists of a stratovolcano and two active summit craters, located in the northern Ryukyu Islands, Japan. Volcanism over the past century has been characterized by Strombolian explosions, ash plumes, and ashfall. The current eruption began in October 2004 and has more recently consisted of frequent eruption plumes, explosions, and incandescent ejecta (BGVN 48:07). This report covers similar activity of ash plumes, explosions, and crater incandescence during July through October 2023 using monthly reports from the Japan Meteorological Agency (JMA) and satellite data.
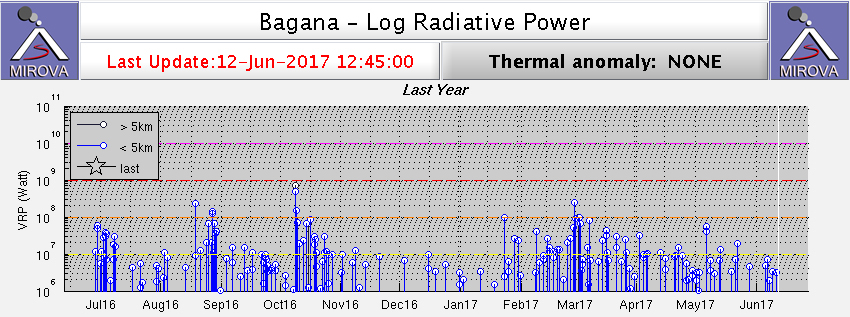
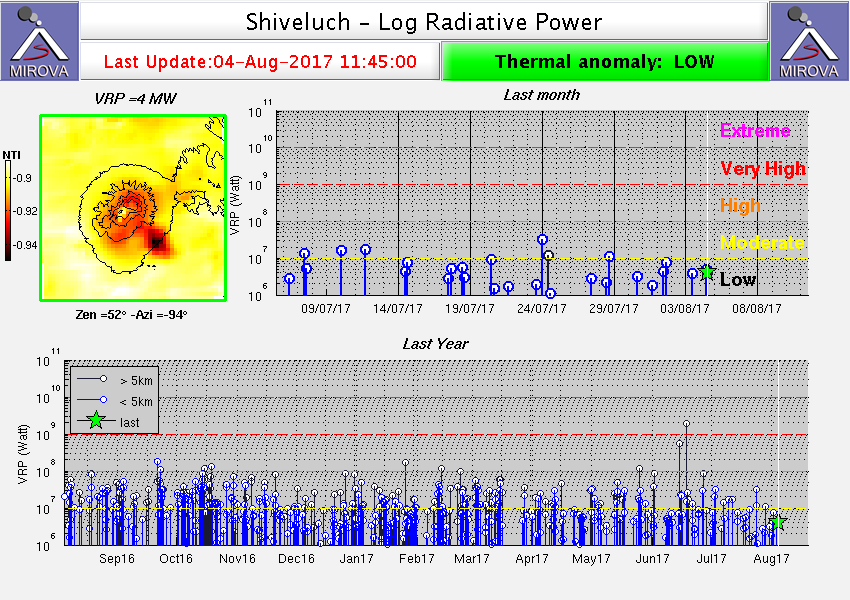
Thermal activity during the reporting period was relatively low; only one low-power thermal anomaly was detected during mid-July and one during early August, based on a MIROVA (Middle InfraRed Observation of Volcanic Activity) Log Radiative Power graph of the MODIS thermal anomaly data. On two clear weather days, a thermal anomaly was visible in infrared satellite images (figure 81).
Low-level activity was reported at the Otake crater during July and no explosions were detected. Eruption plumes rose as high as 1.8 km above the crater. On 13 July an ash plume rose 1.7 km above the crater rim, based on a webcam image. During the night of the 28th crater incandescence was visible in a webcam image. An eruptive event reported on 31 July produced an eruption plume that rose 2.1 km above the crater. Seismicity consisted of 11 volcanic earthquakes on the W flank, the number of which had decreased compared to June (28) and 68 volcanic earthquakes near the Otake crater, which had decreased from 722 in the previous month. According to observations conducted by the University of Tokyo Graduate School of Science, Kyoto University Disaster Prevention Research Institute, Toshima Village, and JMA, the amount of sulfur dioxide emissions released during the month was 400-800 tons per day (t/d).
Eruptive activity in the Otake crater continued during August and no explosions were reported. An eruptive event produced a plume that rose 1 km above the crater at 1447 on 12 August. Subsequent eruptive events were recorded at 0911 on 16 August, at 1303 on 20 August, and at 0317 on 21 August, which produced ash plumes that rose 1-1.1 km above the crater and drifted SE, SW, and W. On 22 August an ash plume was captured in a webcam image rising 1.4 km above the crater (figure 82). Multiple eruptive events were detected on 25 August at 0544, 0742, 0824, 1424, and 1704, which generated ash plumes that rose 1.1-1.2 km above the crater and drifted NE, W, and SW. On 28 August a small amount of ashfall was observed as far as 1.5 km from the crater. There were 17 volcanic earthquakes recorded on the W flank of the volcano and 79 recorded at the Otake crater during the month. The amount of sulfur dioxide emissions released during the month was 400-800 t/d.
Activity continued at the Otake crater during September. Occasionally, nighttime crater incandescence was observed in webcam images and ashfall was reported. An eruptive event at 1949 on 4 September produced an ash plume that rose 1 km above the crater and drifted SW. On 9 September several eruption events were detected at 0221, 0301, and 0333, which produced ash plumes that rose 1.1-1.4 km above the crater rim and drifted W; continuous ash emissions during 0404-0740 rose to a maximum height of 2 km above the crater rim (figure 83). More eruptive events were reported at 1437 on 10 September, at 0319 on 11 September, and at 0511 and 1228 on 15 September, which generated ash plumes that rose 1-1.8 km above the crater. During 25, 27, and 30 September, ash plumes rose as high as 1.3 km above the crater rim. JMA reported that large blocks were ejected as far as 300 m from the center of the crater. There were 18 volcanic earthquakes detected beneath the W flank and 82 volcanic earthquakes detected near the Otake crater. The amount of sulfur dioxide released during the month ranged from 600 to 1,600 t/d.
Activity during early-to-mid-October consisted of occasional explosions, a total number of 13, and ash plumes that rose as high as 1.9 km above the Otake crater rim on 29 October (figure 84). These explosions are the first to have occurred since June 2023. Continuous ash emissions were reported during 0510-0555 on 1 October. Explosions were recorded at 0304, 2141, and 2359 on 2 October, at 0112 on 3 October, and at 1326 on 6 October, which produced ash plumes that rose as high as 1 km above the crater rim and drifted SW and W. An explosion was noted at 0428 on 3 October, but emission details were unknown. A total of eight explosions were recorded by the seismic network at 1522 on 14 October, at 0337, 0433, 0555, 1008, and 1539 on 15 October, and at 0454 and 0517 on 16 October. Ash plumes from these explosions rose as high as 900 m above the crater and drifted SE. Eruptive events during 25-27 and 29-30 October generated plumes that rose as high as 1.9 km above the crater and drifted SE, S, and SW. Ash was deposited in Toshima village (3.5 km SSW). Eruptive activity occasionally ejected large volcanic blocks as far as 600 m from the crater. Nighttime crater incandescence was visible in webcams. Intermittent ashfall was reported as far as 1.5 km from the crater. There were 43 volcanic earthquakes detected on the W flank during the month, and 184 volcanic earthquakes detected near the Otake crater. The amount of sulfur dioxide emitted ranged between 400 and 900 t/d.
Geologic Background. The 8-km-long island of Suwanosejima in the northern Ryukyu Islands consists of an andesitic stratovolcano with two active summit craters. The summit is truncated by a large breached crater extending to the sea on the E flank that was formed by edifice collapse. One of Japan's most frequently active volcanoes, it was in a state of intermittent Strombolian activity from Otake, the NE summit crater, between 1949 and 1996, after which periods of inactivity lengthened. The largest recorded eruption took place in 1813-14, when thick scoria deposits covered residential areas, and the SW crater produced two lava flows that reached the western coast. At the end of the eruption the summit of Otake collapsed, forming a large debris avalanche and creating an open collapse scarp extending to the eastern coast. The island remained uninhabited for about 70 years after the 1813-1814 eruption. Lava flows reached the eastern coast of the island in 1884. Only about 50 people live on the island.
Information Contacts: Japan Meteorological Agency (JMA), 1-3-4 Otemachi, Chiyoda-ku, Tokyo 100-8122, Japan (URL: http://www.jma.go.jp/jma/indexe.html); MIROVA (Middle InfraRed Observation of Volcanic Activity), a collaborative project between the Universities of Turin and Florence (Italy) supported by the Centre for Volcanic Risk of the Italian Civil Protection Department (URL: http://www.mirovaweb.it/); Hawai'i Institute of Geophysics and Planetology (HIGP) - MODVOLC Thermal Alerts System, School of Ocean and Earth Science and Technology (SOEST), Univ. of Hawai'i, 2525 Correa Road, Honolulu, HI 96822, USA (URL: http://modis.higp.hawaii.edu/); Copernicus Browser, Copernicus Data Space Ecosystem, European Space Agency (URL: https://dataspace.copernicus.eu/browser/).
Aira
Japan
31.5772°N, 130.6589°E; summit elev. 1117 m
All times are local (unless otherwise noted)
Explosions, ash plumes, ash fall, and crater incandescence during July-October 2023
Aira caldera, located in the northern half of Kagoshima Bay, Japan, contains the post-caldera Sakurajima volcano. Eruptions typically originate from the Minamidake crater, and since the 8th century, ash deposits have been recorded in the city of Kagoshima (10 km W), one of Kyushu’s largest cities. The Minamidake summit cone and crater has had persistent activity since 1955; the Showa crater on the E flank has also been intermittently active since 2006. The current eruption period began during March 2017 and has recently been characterized by intermittent explosions, eruption plumes, and ashfall (BGVN 48:07). This report updates activity during July through October 2023 and describes explosive events, ash plumes, nighttime crater incandescence, and ashfall, according to monthly activity reports from the Japan Meteorological Agency (JMA) and satellite data.
Thermal activity remained at low levels during this reporting period, according to the MIROVA (Middle InfraRed Observation of Volcanic Activity) system (figure 149). There was a slight increase in the number of anomalies during September through October. Occasional thermal anomalies were visible in infrared satellite images mainly at the Minamidake crater (Vent A is located to the left and Vent B is located to the right) (figure 150).
Table 30. Number of monthly explosive events, days of ashfall, area of ash covered, and sulfur dioxide emissions from Sakurajima’s Minamidake crater at Aira during July-October 2023. Note that smaller ash events are not listed. Ashfall days were measured at Kagoshima Local Meteorological Observatory and ashfall amounts represent material covering all the Kagoshima Prefecture. Data courtesy of JMA monthly reports.
| Month |
Explosive events |
Days of ashfall |
Ashfall amount (g/m2) |
SO2 emissions (tons/day) |
| Jul 2023 |
3 |
0 |
0 |
1,600-3,200 |
| Aug 2023 |
3 |
10 |
7 |
1,800-3,300 |
| Sep 2023 |
3 |
7 |
3 |
1,600-2,300 |
| Oct 2023 |
33 |
8 |
61 |
2,200-4,200 |
JMA reported that during July, there were eight eruptions, three of which were explosion events in the Showa crater. Large blocks were ejected as far as 600 m from the Showa crater. Very small eruptions were occasionally reported at the Minamidake crater. Nighttime incandescence was observed in both the Showa and Minamidake crater. Explosions were reported on 16 July at 2314 and on 17 July at 1224 and at 1232 (figure 151). Resulting eruption plumes rose 700-2,500 m above the crater and drifted N. On 23 July the number of volcanic earthquakes on the SW flank of the volcano increased. A strong Mw 3.1 volcanic earthquake was detected at 1054 on 26 July. The number of earthquakes recorded throughout the month was 545, which markedly increased from 73 in June. No ashfall was observed at the Kagoshima Regional Meteorological Observatory during July. According to a field survey conducted during the month, the daily amount of sulfur dioxide emissions was 1,600-3,200 tons per day (t/d).
There were three eruptions reported at the Minamidake crater during August, each of which were explosive. The explosions occurred on 9 August at 0345, on 13 August at 2205, and on 31 August at 0640, which generated ash plumes that rose 800-2,000 m above the crater and drifted W. There were two eruptions detected at Showa crater; on 4 August at 2150 ejecta traveled 800 m from the Showa crater and associated eruption plumes rose 2.3 km above the crater. The explosion at 2205 on 13 August generated an ash plume that rose 2 km above the crater and was accompanied by large blocks that were ejected 600 m from the Minamidake crater (figure 152). Nighttime crater incandescence was visible in a high-sensitivity surveillance camera at both craters. Seismicity consisted of 163 volcanic earthquakes, 84 of which were detected on the SW flank. According to the Kagoshima Regional Meteorological Observatory there was a total of 7 g/m2 of ashfall over the course of 10 days during the month. According to a field survey, the daily amount of sulfur dioxide emitted was 1,800-3,300 t/d.
During September, four eruptions were reported, three of which were explosion events. These events occurred at 1512 on 9 September, at 0018 on 11 September, and at 2211 on 13 September. Resulting ash plumes generally rose 800-1,100 m above the crater. An explosion produced an ash plume at 2211 on 13 September that rose as high as 1.7 km above the crater. Large volcanic blocks were ejected 600 m from the Minamidake crater. Smaller eruptions were occasionally observed at the Showa crater. Nighttime crater incandescence was visible at the Minamidake crater. Seismicity was characterized by 68 volcanic earthquakes, 28 of which were detected beneath the SW flank. According to the Kagoshima Regional Meteorological Observatory there was a total of 3 g/m2 of ashfall over the course of seven days during the month. A field survey reported that the daily amount of sulfur dioxide emitted was 1,600-2,300 t/d.
Eruptive activity during October consisted of 69 eruptions, 33 of which were described as explosive. These explosions occurred during 4 and 11-21 October and generated ash plumes that rose 500-3,600 m above the crater and drifted S, E, SE, and N. On 19 October at 1648 an explosion generated an ash plume that rose 3.6 km above the crater (figure 153). No eruptions were reported in the Showa crater; white gas-and-steam emissions rose 100 m above the crater from a vent on the N flank. Nighttime incandescence was observed at the Minamidake crater. On 24 October an eruption was reported from 0346 through 0430, which included an ash plume that rose 3.4 km above the crater. Ejected blocks traveled 1.2 km from the Minamidake crater. Following this eruption, small amounts of ashfall were observed from Arimura (4.5 km SE) and a varying amount in Kurokami (4 km E) (figure 154). The number of recorded volcanic earthquakes during the month was 190, of which 14 were located beneath the SW flank. Approximately 61 g/m2 of ashfall was reported over eight days of the month. According to a field survey, the daily amount of sulfur dioxide emitted was 2,200-4,200 t/d.
Geologic Background. The Aira caldera in the northern half of Kagoshima Bay contains the post-caldera Sakurajima volcano, one of Japan's most active. Eruption of the voluminous Ito pyroclastic flow accompanied formation of the 17 x 23 km caldera about 22,000 years ago. The smaller Wakamiko caldera was formed during the early Holocene in the NE corner of the caldera, along with several post-caldera cones. The construction of Sakurajima began about 13,000 years ago on the southern rim and built an island that was joined to the Osumi Peninsula during the major explosive and effusive eruption of 1914. Activity at the Kitadake summit cone ended about 4,850 years ago, after which eruptions took place at Minamidake. Frequent eruptions since the 8th century have deposited ash on the city of Kagoshima, located across Kagoshima Bay only 8 km from the summit. The largest recorded eruption took place during 1471-76.
Information Contacts: Japan Meteorological Agency (JMA), 1-3-4 Otemachi, Chiyoda-ku, Tokyo 100-8122, Japan (URL: http://www.jma.go.jp/jma/indexe.html); MIROVA (Middle InfraRed Observation of Volcanic Activity), a collaborative project between the Universities of Turin and Florence (Italy) supported by the Centre for Volcanic Risk of the Italian Civil Protection Department (URL: http://www.mirovaweb.it/); Copernicus Browser, Copernicus Data Space Ecosystem, European Space Agency (URL: https://dataspace.copernicus.eu/browser/).
Nishinoshima (Japan) — November 2023 Cite this Report
Nishinoshima
Japan
27.247°N, 140.874°E; summit elev. 100 m
All times are local (unless otherwise noted)
Gray emissions during October 2023
Nishinoshima is a small island in the Ogasawara Arc, about 1,000 km S of Tokyo, Japan. It contains prominent submarine peaks to the S, W, and NE. Recorded eruptions date back to 1973, with the current eruption period beginning in October 2022. Eruption plumes and fumarolic activity characterize recent activity (BGVN 48:10). This report covers the end of the eruption for September through October 2023, based on information from monthly reports of the Japan Meteorological Agency (JMA) monthly reports, and satellite data.
No eruptive activity was reported during September 2023, although JMA noted that the surface temperature was slightly elevated compared to the surrounding area since early March 2023. The Japan Coast Guard (JCG) conducted an overflight on 20 September and reported white gas-and-steam plumes rising 3 km above the central crater of the pyroclastic cone, as well as multiple white gas-and-steam emissions emanating from the N, E, and S flanks of the crater to the coastline. In addition, dark reddish brown-to-green discolored water was distributed around almost the entire circumference of the island.
Similar low-level activity was reported during October. Multiple white gas-and-steam emissions rose from the N, E, and S flanks of the central crater of the pyroclastic cone and along the coastline; these emissions were more intense compared to the previous overflight observations. Dark reddish brown-to-green discolored water remained visible around the circumference of the island. On 4 October aerial observations by JCG showed a small eruption consisting of continuous gas-and-steam emissions emanating from the central crater, with gray emissions rising to 1.5 km altitude (figure 129). According to observations from the marine weather observation vessel Keifu Maru on 26 October, white gas-and-steam emissions persisted from the center of the pyroclastic cone, as well as from the NW, SW, and SE coasts of the island for about five minutes. Slightly discolored water was visible up to about 1 km.
Frequent low-to-moderate power thermal anomalies were recorded in the MIROVA graph (Middle InfraRed Observation of Volcanic Activity) during September (figure 130). Occasional anomalies were detected during October, and fewer during November through December. A thermal anomaly was visible in the crater using infrared satellite imagery on 6, 8, 11, 16, 18, 21, and 23 September and 8, 13, 21, 26, and 28 October (figure 131).
Geologic Background. The small island of Nishinoshima was enlarged when several new islands coalesced during an eruption in 1973-74. Multiple eruptions that began in 2013 completely covered the previous exposed surface and continued to enlarge the island. The island is the summit of a massive submarine volcano that has prominent peaks to the S, W, and NE. The summit of the southern cone rises to within 214 m of the ocean surface 9 km SSE.
Information Contacts: Japan Meteorological Agency (JMA), 1-3-4 Otemachi, Chiyoda-ku, Tokyo 100-8122, Japan (URL: http://www.jma.go.jp/jma/indexe.html); MIROVA (Middle InfraRed Observation of Volcanic Activity), a collaborative project between the Universities of Turin and Florence (Italy) supported by the Centre for Volcanic Risk of the Italian Civil Protection Department (URL: http://www.mirovaweb.it/); Copernicus Browser, Copernicus Data Space Ecosystem, European Space Agency (URL: https://dataspace.copernicus.eu/browser/).
Kilauea (United States) — October 2023 Cite this Report
Kilauea
United States
19.421°N, 155.287°W; summit elev. 1222 m
All times are local (unless otherwise noted)
Strong lava fountains, lava flows, and spatter at Halema’uma’u during January-September 2023
Kīlauea is on the island of Hawai’i and overlaps the E flank of the Mauna Loa volcano. Its East Rift Zone (ERZ) has been intermittently active for at least 2,000 years. An extended eruption period began in January 1983 and was characterized by open lava lakes and lava flows from the summit caldera and the East Rift Zone. During May 2018 magma migrated into the Lower East Rift Zone (LERZ) and opened 24 fissures along a 6-km-long NE-trending fracture zone that produced lava flows traveling in multiple directions. As lava emerged from the fissures, the lava lake at Halema'uma'u drained and explosions sent ash plumes to several kilometers altitude (BGVN 43:10).
The current eruption period started during September 2021 and has been characterized by low-level lava effusions in the active Halema’uma’u lava lake (BGVN 48:01). This report covers three notable eruption periods during February, June, and September 2023 consisting of lava fountaining, lava flows, and spatter during January through September 2023 using information from daily reports, volcanic activity notices, and abundant photo, map, and video data from the US Geological Survey's (USGS) Hawaiian Volcano Observatory (HVO).
Activity during January 2023. Small earthquake swarms were recorded on 2 January 2023; increased seismicity and changes in the pattern of deformation were noted on the morning of 5 January. At around 1500 both the rate of deformation and seismicity drastically increased, which suggested magma movement toward the surface. HVO raised the Volcano Alert Level (VAL) to Watch (the second highest level on a four-level scale) and the Aviation Color Code (ACC) to Orange (the second highest color on a four-color scale) at 1520.
Multiple lava fountains and lava effusions from vents in the central eastern portion of the Halema’uma’u crater began on 5 January around 0434; activity was confined to the eastern half of the crater and within the basin of the western half of the crater, which was the focus of the eruption in 2021-2022 (figure 525). Incandescence was visible in webcam images at 1634 on 5 January, prompting HVO to raise the VAL to Warning (the highest level on a four-level scale) and the ACC to Red (the highest color on a four-color scale). Lava fountains initially rose as high as 50 m above the vent at the onset of the eruption (figure 526) but then declined to a more consistent 5-6 m height in the proceeding days. By 1930 that same day, lava had covered most of the crater floor (an area of about 1,200,000 m2) and the lava lake had a depth of 10 m. A higher-elevation island that formed during the initial phase of the December 2020 eruption remained exposed, appearing darker in images, along with a ring of older lava around the lava lake that was active prior to December 2022. Overnight during 5-6 January the lava fountains continued to rise 5 m high, and the lava effusion rate had slowed.
On 6 January at 0815 HVO lowered the VAL to Watch and the ACC to Orange due to the declining effusion rates. Sulfur dioxide emission rates ranged from 3,000-12,500 tonnes per day (t/d), the highest value of which was recorded on 6 January. Lava continued to erupt from the vents during 6-8 January, although the footprint of the active area had shrunk; a similar progression has been commonly observed during the early stages of recent eruptions at Halema’uma’u. On 9 January HVO reported one dominant lava fountain rising 6-7 m high in the E half of the crater. Lava flows built up the margins of the lake, causing the lake to be perched. On 10 January the eastern lava lake had an area of approximately 120,000 m2 that increased to 250,000 m2 by 17 January. During 13-31 January several small overflows occurred along the margins of the E lake. A smaller area of lava was active within the basin in the W half of the crater that had been the focus of activity during 2021-2022. On 19 January just after 0200 a small ooze-out was observed on the crater’s W edge.
Activity during February 2023. Activity continued in the E part of Halema’uma’u crater, as well as in a smaller basin in the W part of the 2021-2022 lava lake (figure 527). The E lava lake contained a single lava fountain and frequent overflows. HVO reported that during the morning of 1 February the large E lava lake began to cool and crust over in the center of the lake; two smaller areas of lava were observed on the N and S sides by the afternoon. The dominant lava fountain located in the S part of the lava lake paused for roughly 45 minutes at 2315 and resumed by midnight, rising 1-2 m. At 0100 on 2 February lava from the S part was effusing across the entire E lava lake area, covering the crusted over portion in the center of the lake and continuing across the majority of the previously measured 250,000 m2 by 0400. A small lava pond near the E lake produced an overflow around 0716 on 2 February. On 3 February some lava crust began to form against the N and E levees, which defined the 250,000 m2 eastern lava lake. The small S lava fountain remained active, rising 1-6 m high during 3-9 February; around 0400 on 5 February occasional bursts doubled the height of the lava fountain.
A large breakout occurred overnight during 2100 on 4 February to 0900 on 5 February on the N part of the crater floor, equal to or slightly larger in size than the E lava lake. A second, smaller lava fountain appeared in the same area of the E lava lake between 0300 and 0700 on 5 February and was temporarily active. This large breakout continued until 7 February. A small, brief breakout was reported in the S of the E lava lake around midnight on 7 February. In the W lake, as well as the smaller lava pond in the central portion of the crater floor, contained several overflows during 7-10 February and intermittent fountaining. Activity at the S small lava pond and the small S lava fountain within the E lake declined during 9-10 February. The lava pond in the central portion of the crater floor had nearly continuous, expansive flows during 10-13 February; channels from the small central lava pond seemed to flow into the larger E lake. During 13-18 February a small lava fountain was observed in the small lava pond in the central portion of the crater floor. Continuous overflows persisted during this time.
Activity in the eastern and central lakes began to decline in the late afternoon of 17 February. By 18 February HVO reported that the lava effusions had significantly declined, and that the eastern and central lakes were no longer erupting. The W lake in the basin remained active but at a greatly reduced level that continued to decline. HVO reported that this decrease in activity is attributed to notable deflationary tilt that began early on the morning of 17 February and lasted until early 19 February. By 19 February the W lake was mostly crusted over although some weak lava flows remained, which continued through 28 February. The sulfur dioxide emission rates ranged 250-2,800 t/d, the highest value of which was recorded on 6 February.
Activity during March 2023. The summit eruption at Halema’uma’u crater continued at greatly reduced levels compared to the previous two months. The E and central vents stopped effusing lava, and the W lava lake remained active with weak lava flows; the lake was mostly crusted over, although slowly circulating lava intermittently overturned the crust. By 6 March the lava lake in the W basin had stopped because the entire surface was crusted over. The only apparent surface eruptive activity during 5-6 March was minor ooze-outs of lava onto the crater floor, which had stopped by 7 March. Several hornitos on the crater floor still glowed through 12 March according to overnight webcam images, but they did not erupt any lava. A small ooze-out of lava was observed just after 1830 in the W lava lake on 8 March, which diminished overnight. The sulfur dioxide emission rate ranged from 155-321 t/d on 21 March. The VAL was lowered to Advisory, and the ACC was lowered to Yellow (the second lowest on a four-color scale) on 23 March due to a pause in the eruption since 7 March.
Activity during April-May 2023. The eruption at Halema’uma’u crater was paused; no lava effusions were visible on the crater floor. Sulfur dioxide emission rates ranged from 75-185 t/d, the highest of which was measured on 22 April. During May and June summit seismicity was elevated compared to seismicity that preceded the activity during January.
Activity during June 2023. Earthquake activity and changes in the patterns of ground deformation beneath the summit began during the evening of 6 June. The data indicated magma movement toward the surface, prompting HVO to raise the VAL to Watch and the ACC to Orange. At about 0444 on 7 June incandescence in Halema’uma’u crater was visible in webcam images, indicating that a new eruption had begun. HVO raised the VAL to Warning and the ACC to Red (the highest color on a four-color scale). Lava flowed from fissures that had opened on the crater floor. Multiple minor lava fountains were active in the central E portion of the Halema’uma’u crater, and one vent opened on the W wall of the caldera (figure 528). The eruptive vent on the SW wall of the crater continued to effuse into the lava lake in the far SW part of the crater (figure 529). The largest lava fountain consistently rose 15 m high; during the early phase of the eruption, fountain bursts rose as high as 60 m. Lava flows inundated much of the crater floor and added about 6 m depth of new lava within a few hours, covering approximately 10,000 m2. By 0800 on 7 June lava filled the crater floor to a depth of about 10 m. During 0800-0900 the sulfur dioxide emission rate was about 65,000 t/d. Residents of Pahala (30 km downwind of the summit) reported minor deposits of fine, gritty ash and Pele’s hair. A small spatter cone had formed at the vent on the SW wall by midday, and lava from the cone was flowing into the active lava lake. Fountain heights had decreased from the onset of the eruption and were 4-9 m high by 1600, with occasional higher bursts. Inflation switched to deflation and summit earthquake activity greatly diminished shortly after the eruption onset.
At 0837 on 8 June HVO lowered the VAL to Watch and the ACC to Orange because the initial high effusion rates had declined, and no infrastructure was threatened. The surface of the lava lake had dropped by about 2 m, likely due to gas loss by the morning of 8 June. The drop left a wall of cooled lava around the margins of the crater floor. Lava fountain heights decreased during 8-9 June but continued to rise to 10 m high. Active lava and vents covered much of the W half of Halema’uma’u crater in a broad, horseshoe-shape around a central, uplifted area (figure 530). The preliminary average effusion rate for the first 24 hours of the eruption was about 150 cubic meters per second, though the estimate did not account for vesiculated lava and variations in crater floor topography. The effusion rate during the very earliest phases of the eruption appeared significantly higher than the previous three summit eruptions based on the rapid coverage of the entire crater floor. An active lava lake, also referred to as the “western lava lake” was centered within the uplifted area and was fed by a vent in the NE corner. Two small active lava lakes were located just SE from the W lava lake and in the E portion of the crater floor.
During 8-9 June the lava in the central lava lake had a thickness of approximately 1.5 m, based on measurements from a laser rangefinder. During 9-12 June the height of the lava fountains decreased to 9 m high. HVO reported that the previously active lava lake in the E part of the crater appeared stagnant during 10-11 June. The surface of the W lake rose approximately 1 m overnight during 11-12 June, likely due to the construction of a levee around it. Only a few small fountains were active during 12-13 June; the extent of the active lava had retreated so that all activity was concentrated in the SW and central parts of Halema’uma’u crater. Intermittent spattering from the vent on the SW wall was visible in overnight webcam images during 13-18 June. On the morning of 14 June a weak lava effusion originated from near the western eruptive vent, but by 15 June there were no signs of continued activity. HVO reported that other eruptive vents in the SW lava lake had stopped during this time, following several days of waning activity; lava filled the lake by about 0.5 m. Lava circulation continued in the central lake and no active lava was reported in the northern or eastern parts of the crater. Around 0800 on 15 June the top of the SW wall spatter cone collapsed, which was followed by renewed and constant spattering from the top vent and a change in activity from the base vent; several new lava flows effused from the top of the cone, as well as from the pre-existing tube-fed flow from its base. Accumulation of lava on the floor resulted in a drop of the central basin relative to the crater floor, allowing several overflows from the SW lava lake to cascade into the basin during the night of 15 June into the morning of 16 June.
Renewed lava fountaining was reported at the eruptive vent on the SW side of the crater during 16-19 June, which effused lava into the far SW part of the crater. This activity was described as vigorous during midday on 16 June; a group of observatory geologists estimated that the lava was consistently ejected at least 10 m high, with some spatter ejected even higher and farther. Deposits from the fountain further heightened and widened the spatter cone built around the original eruptive vent in the lower section of the crater wall. Multiple lava flows from the base of the cone were fed into the SW lava lake and onto the southwestern-most block from the 2018 collapse within Halema’uma’u on 17 June (figure 531); by 18 June they focused into a single flow feeding into the SW lava lake. On the morning of 19 June a second lava flow from the base of the eruptive cone advanced into the SW lava lake.
Around 1600 on 19 June there was a rapid decline in lava fountaining and effusion at the eruptive vent on the SW side of the crater; vent activity had been vigorous up to that point (figure 532). Circulation in the lava lake also slowed, and the lava lake surface dropped by several meters. Overnight webcam images showed some previously eruptive lava still flowing onto the crater floor, which continued until those flows began to cool. By 21 June no lava was erupting in Halema’uma’u crater. Overnight webcam images during 29-30 June showed some incandescence from previously erupted lava flows as they continued to cool. Seismicity in the crater declined to low levels. Sulfur dioxide emission rates ranged 160-21,000 t/d throughout the month, the highest measurement of which was recorded on 8 June. On 30 June the VAL was lowered to Advisory (the second level on a four-level scale) and the ACC was lowered to Yellow. Gradual inflation was detected at summit tiltmeters during 19-30 June.
Activity during July-August 2023. During July, the eruption paused; no lava was erupting in Halema’uma’u crater. Nighttime webcam images showed some incandescence from previously erupted lava as it continued to cool on the crater floor. During the week of 14 August HVO reported that the rate in seismicity increased, with 467 earthquakes of Mw 3.2 and smaller occurring. Sulfur dioxide emission rates remained low, ranging from 75-86 t/d, the highest of which was recorded on 10 and 15 August. On 15 August beginning at 0730 and lasting for several hours, a swarm of approximately 50 earthquakes were detected at a depth of 2-3 km below the surface and about 2 km long directly S of Halema’uma’u crater. HVO reported that this was likely due to magma movement in the S caldera region. During 0130-0500 and 1700-2100 on 21 August two small earthquake swarms of approximately 20 and 25 earthquakes, respectively, occurred at the same location and at similar depths. Another swarm of 50 earthquakes were recorded during 0430-0830 on 23 August. Elevated seismicity continued in the S area through the end of the month.
Activity during September 2023. Elevated seismicity persisted in the S summit with occasional small, brief seismic swarms. Sulfur dioxide measurements were relatively low and were 70 t/d on 8 September. About 150 earthquakes occurred during 9-10 September, and tiltmeter and Global Positioning System (GPS) data showed inflation in the S portion of the crater.
At 0252 on 10 September HVO raised the VAL to Watch and the ACC to Orange due to increased earthquake activity and changes in ground deformation that indicated magma moving toward the surface. At 1515 the summit eruption resumed in the E part of the caldera based on field reports and webcam images. Fissures opened on the crater floor and produced multiple minor lava fountains and flows (figure 533). The VAL and ACC were raised to Warning and Red, respectively. Gas-and-steam plumes rose from the fissures and drifted downwind. A line of eruptive vents stretched approximately 1.4 km from the E part of the crater into the E wall of the down dropped block by 1900. The lava fountains at the onset of the eruption had an estimated 50 m height, which later rose 20-25 m high. Lava erupted from fissures on the down dropped block and expanded W toward Halema’uma’u crater. Data from a laser rangefinder recorded about 2.5 m thick of new lava added to the W part of the crater. Sulfur dioxide emissions were elevated in the eruptive area during 1600-1500 on 10 September, measuring at least 100,000 t/d.
At 0810 on 11 September HVO lowered the VAL and ACC back to Watch and Orange due to the style of eruption and the fissure location had stabilized. The initial extremely high effusion rates had declined (but remained at high levels) and no infrastructure was threatened. An eruption plume, mainly comprised of sulfur dioxide and particulates, rose as high as 3 km altitude. Several lava fountains were active on the W side of the down dropped block during 11-15 September, while the easternmost vents on the down dropped block and the westernmost vents in the crater became inactive on 11 September (figure 534). The remaining vents spanned approximately 750 m and trended roughly E-W. The fed channelized lava effusions flowed N and W into Halema’uma’u. The E rim of the crater was buried by new lava flows; pahoehoe lava flows covered most of the crater floor except areas of higher elevation in the SW part of the crater. The W part of the crater filled about 5 m since the start of the eruption, according to data from a laser rangefinder during 11-12 September. Lava fountaining continued, rising as high as 15 m by the morning of 12 September. During the morning of 13 September active lava flows were moving on the N and E parts of the crater. The area N of the eruptive vents that had active lava on its surface became perched and was about 3 m higher than the surrounding ground surface. By the morning of 14 September active lava was flowing on the W part of the down dropped block and the NE parts of the crater. The distances of the active flows progressively decreased. Spatter had accumulated on the S (downwind) side of the vents, forming ramparts about 20 m high.
Vigorous spattering was restricted to the westernmost large spatter cone with fountains rising 10-15 m high. Minor spattering occurred within the cone to the E of the main cone, but HVO noted that the fountains remained mostly below the rim of the cone. Lava continued to effuse from these cones and likely from several others as well, traveled N and W, confined to the W part of the down-dropped block and the NE parts of Halema’uma’u. Numerous ooze-outs of lava were visible over other parts of the crater floor at night. Laser range-finder measurements taken of the W part of the crater during 14-15 September showed that lava filled the crater by 10 m since the start of the eruption. Sulfur dioxide emissions remained elevated after the onset of the eruption, ranging 20,000-190,000 t/d during the eruption activity, the highest of which occurred on 10 September.
Field crews observed the eruptive activity on 15 September; they reported a notable decrease or stop in activity at several vents. Webcam images showed little to no fountaining since 0700 on 16 September, though intermittent spattering continued from the westernmost large cone throughout the night of 15-16 September. Thermal images showed that lava continued to flow onto the crater floor. On 16 September HVO reported that the eruption stopped around 1200 and that there was no observable activity anywhere overnight or on the morning of 17 September. HVO field crews reported that active lava was no longer flowing onto Halema’uma’u crater floor and was restricted to a ponded area N of the vents on the down dropped block. They reported that spattering stopped around 1115 on 16 September. Nighttime webcam images showed some incandescence on the crater floor as lava continued to cool. Field observations supported by geophysical data showed that eruptive tremor in the summit region decreased over 15-16 September and returned to pre-eruption levels by 1700 on 16 September. Sulfur dioxide emissions were measured at a rate of 800 t/d on 16 September while the eruption was waning, and 200 t/d on 17 September, which were markedly lower compared to measurements taken the previous week of 20,000-190,000 t/d.
Geologic Background. Kilauea overlaps the E flank of the massive Mauna Loa shield volcano in the island of Hawaii. Eruptions are prominent in Polynesian legends; written documentation since 1820 records frequent summit and flank lava flow eruptions interspersed with periods of long-term lava lake activity at Halemaumau crater in the summit caldera until 1924. The 3 x 5 km caldera was formed in several stages about 1,500 years ago and during the 18th century; eruptions have also originated from the lengthy East and Southwest rift zones, which extend to the ocean in both directions. About 90% of the surface of the basaltic shield volcano is formed of lava flows less than about 1,100 years old; 70% of the surface is younger than 600 years. The long-term eruption from the East rift zone between 1983 and 2018 produced lava flows covering more than 100 km2, destroyed hundreds of houses, and added new coastline.
Information Contacts: Hawaiian Volcano Observatory (HVO), U.S. Geological Survey, PO Box 51, Hawai'i National Park, HI 96718, USA (URL: http://hvo.wr.usgs.gov/).
Tinakula (Solomon Islands) — December 2023 Cite this Report
Tinakula
Solomon Islands
10.386°S, 165.804°E; summit elev. 796 m
All times are local (unless otherwise noted)
Continued lava flows and thermal activity during June through November 2023
Tinakula is a remote 3.5 km-wide island in the Solomon Islands, located 640 km ESE of the capital, Honiara. The current eruption period began in December 2018 and has more recently been characterized by intermittent lava flows and thermal activity (BGVN 48:06). This report covers similar activity during June through November 2023 using satellite data.
During clear weather days (20 July, 23 September, 23 October, and 12 November), infrared satellite imagery showed lava flows that mainly affected the W side of the island and were sometimes accompanied by gas-and-steam emissions (figure 54). The flow appeared more intense during July and September compared to October and November. According to the MODVOLC thermal alerts, there were a total of eight anomalies detected on 19 and 21 July, 28 and 30 October, and 16 November. Infrared MODIS satellite data processed by MIROVA (Middle InfraRed Observation of Volcanic Activity) detected a small cluster of thermal activity occurring during late July, followed by two anomalies during August, two during September, five during October, and five during November (figure 55).
Geologic Background. The small 3.5-km-wide island of Tinakula is the exposed summit of a massive stratovolcano at the NW end of the Santa Cruz islands. It has a breached summit crater that extends from the summit to below sea level. Landslides enlarged this scarp in 1965, creating an embayment on the NW coast. The Mendana cone is located on the SE side. The dominantly andesitic volcano has frequently been observed in eruption since the era of Spanish exploration began in 1595. In about 1840, an explosive eruption apparently produced pyroclastic flows that swept all sides of the island, killing its inhabitants. Recorded eruptions have frequently originated from a cone constructed within the large breached crater. These have left the upper flanks and the steep apron of lava flows and volcaniclastic debris within the breach unvegetated.
Information Contacts: MIROVA (Middle InfraRed Observation of Volcanic Activity), a collaborative project between the Universities of Turin and Florence (Italy) supported by the Centre for Volcanic Risk of the Italian Civil Protection Department (URL: http://www.mirovaweb.it/); Hawai'i Institute of Geophysics and Planetology (HIGP) - MODVOLC Thermal Alerts System, School of Ocean and Earth Science and Technology (SOEST), Univ. of Hawai'i, 2525 Correa Road, Honolulu, HI 96822, USA (URL: http://modis.higp.hawaii.edu/); Copernicus Browser, Copernicus Data Space Ecosystem, European Space Agency (URL: https://dataspace.copernicus.eu/browser/).
Search Bulletin Archive by Publication Date
Select a month and year from the drop-downs and click "Show Issue" to have that issue displayed in this tab.
The default month and year is the latest issue available.
Bulletin of the Global Volcanism Network - Volume 42, Number 08 (August 2017)
Bagana (Papua New Guinea)
Frequent ash plumes and thermal anomalies from July 2016 through mid-June 2017
Bulusan (Philippines)
Weak phreatic explosions on 2 March and 5 June 2017
Colima (Mexico)
Multiple flows from the lava dome during October-December 2016; frequent explosions and ash emissions until 7 March 2017
Ebeko (Russia)
New eruption with ash explosions began on 20 October 2016; ongoing through May 2017
Karymsky (Russia)
Persistent ash plumes and thermal anomalies January 2015-March 2016; short-lived explosions with ash, 5-8 October 2016
Kilauea (United States)
New flow from Pu'u 'O'o reaches the sea on 26 July; Kamokuna delta collapses on 31 December 2016
Rincon de la Vieja (Costa Rica)
Phreatic explosions disperse material up to 2 km from the active crater in March 2016 and June 2017
Sangay (Ecuador)
Intermittent ash emissions and thermal anomalies, January 2015-July 2017
Sheveluch (Russia)
Ash explosions, pyroclastic flows, and lava dome growth continues through July 2017
Tungurahua (Ecuador)
Eruptive episode during April-May 2015, persistent ash emissions and many lahars
Bagana (Papua New Guinea) — August 2017 Cite this Report
Bagana
Papua New Guinea
6.137°S, 155.196°E; summit elev. 1855 m
All times are local (unless otherwise noted)
Frequent ash plumes and thermal anomalies from July 2016 through mid-June 2017
Eruptive activity has been ongoing at Bagana since February 2000, and frequently active for over 150 years. Due to the remote location of this volcano, the most reliable observations of activity come from the identification of ash plumes in satellite imagery by the Darwin Volcanic Ash Advisory Centre (VAAC) and thermal anomalies from satellite infrared sensors.
Since July 2016 (BGVN 41:07), the Darwin VAAC issued aviation warnings of ash plumes almost every week through mid-June 2017. The plumes typically rose to between 1.8 and 3.4 km; the most commonly reported altitude of the plume was about 2.1 km. The plumes drifted in multiple directions depending on the local wind patterns. Drift directions were not always reported, but a few reached 110-120 km, and one was observed as far as 160 km away on 7 September 2016.
MODIS data processed by the MIROVA algorithm (figure 20) reinforce the Darwin VAAC reports of a nearly continuous eruption since July 2016 through mid-June 2017. Frequent MODVOLC thermal alerts, also based on MODIS satellite-based data, corroborate the MIROVA analysis.
Geologic Background. Bagana volcano, in a remote portion of central Bougainville Island, is frequently active. This massive symmetrical cone was largely constructed by an accumulation of viscous andesitic lava flows. The entire edifice could have been constructed in about 300 years at its present rate of lava production. Eruptive activity is characterized by non-explosive effusion of viscous lava that maintains a small lava dome in the summit crater, although occasional explosive activity produces pyroclastic flows. Lava flows with tongue-shaped lobes up to 50 m thick and prominent levees descend the flanks on all sides.
Information Contacts: Darwin Volcanic Ash Advisory Centre (VAAC), Bureau of Meteorology, Northern Territory Regional Office, PO Box 40050, Casuarina, NT 0811, Australia (URL: http://www.bom.gov.au/info/vaac/); MIROVA (Middle InfraRed Observation of Volcanic Activity), a collaborative project between the Universities of Turin and Florence (Italy) supported by the Centre for Volcanic Risk of the Italian Civil Protection Department (URL: http://www.mirovaweb.it/); Hawai'i Institute of Geophysics and Planetology (HIGP), MODVOLC Thermal Alerts System, School of Ocean and Earth Science and Technology (SOEST), Univ. of Hawai'i, 2525 Correa Road, Honolulu, HI 96822, USA (URL: http://modis.higp.hawaii.edu/).
Bulusan (Philippines) — August 2017 Cite this Report
Bulusan
Philippines
12.769°N, 124.056°E; summit elev. 1535 m
All times are local (unless otherwise noted)
Weak phreatic explosions on 2 March and 5 June 2017
Activity at Bulusan typically has included phreatic explosions from the summit crater and flank vents, ash-and-steam plumes, and minor ashfall in nearby villages (BGVN 41:03, 42:02). The danger zone was expanded in October 2016 when a fissure extended 2 km down the upper S flank that was the source of multiple phreatic explosions (figure 10, and see BGVN 42:02). During the first eight months of 2017, eruptive activity included similar episodes on 2 March and 5 June. Information was provided by the Philippine Institute of Volcanology and Seismology (PHIVOLCS). Throughout the reporting period of 1 January-8 September 2017 the Alert Level remained at 1, indicating a low level of volcanic unrest and a 4-km-radius Permanent Danger Zone (PDZ).
According to PHIVOLCS, a weak phreatic eruption occurred at 1357 on 2 March 2017. The event was recorded by the seismic network as an explosion-type earthquake followed by short-duration tremor that lasted approximately 26 minutes. Visual observations were obscured by weather clouds, although a small steam plume rising from the SE vent was recorded by a webcam.
On 5 June 2017 another weak phreatic eruption was recorded at 1029 by the seismic network for 12 minutes. The eruption again could not be visually observed due to dense weather clouds covering the summit. Minor ashfall, a sulfuric odor, and a rumbling sound were reported in the barangays (neighborhoods) of Monbon and Cogon, while sulfuric odor was noted in the barangay of Bolos. These three neighborhoods are within the municipality of Irosin, about 8 km SSW of the volcano.
According to a news account (Manila Bulletin), precise leveling data obtained during 29 January to 3 February 2017 indicated deflationary changes since October 2016. PHIVOLCS reported that precise leveling data obtained during 14-23 June 2017 indicated inflation since February 2017. According to PHIVOLCS, continuous GPS measurements have indicated an inflationary trend since July 2016.
Sulfur dioxide emissions on 31 July and 20 August, reported by PHIVOLCS, averaged 82 tonnes/day, which according to a news account (Manila Bulletin) was the same as measured on 29 April 2017. The seismic monitoring network recorded three volcanic earthquakes on 7-8 September. Weak steam plumes from the active vents rose to 50 meters and drifted SW.
Geologic Background. Luzon's southernmost volcano, Bulusan, was constructed along the rim of the 11-km-diameter dacitic-to-rhyolitic Irosin caldera, which was formed about 36,000 years ago. It lies at the SE end of the Bicol volcanic arc occupying the peninsula of the same name that forms the elongated SE tip of Luzon. A broad, flat moat is located below the topographically prominent SW rim of Irosin caldera; the NE rim is buried by the andesitic complex. Bulusan is flanked by several other large intracaldera lava domes and cones, including the prominent Mount Jormajan lava dome on the SW flank and Sharp Peak to the NE. The summit is unvegetated and contains a 300-m-wide, 50-m-deep crater. Three small craters are located on the SE flank. Many moderate explosive eruptions have been recorded since the mid-19th century.
Information Contacts: Philippine Institute of Volcanology and Seismology (PHIVOLCS), Department of Science and Technology, University of the Philippines Campus, Diliman, Quezon City, Philippines (URL: http://www.phivolcs.dost.gov.ph/); Manila Bulletin (URL: http://mb.com.ph/); Philippine Star (URL: http://www.philstar.com/).
Colima
Mexico
19.514°N, 103.62°W; summit elev. 3850 m
All times are local (unless otherwise noted)
Multiple flows from the lava dome during October-December 2016; frequent explosions and ash emissions until 7 March 2017
Frequent historical eruptions at México's Volcán de Colima (Volcán Fuego) date back to the 16th century and include vulcanian and phreatic explosions, lava flows, large debris avalanches, and pyroclastic flows. The latest eruptive episode began in January 2013. Extensive activity in 2015 included near-constant ash plumes with extensive ashfall, lava flows, and pyroclastic flows (BGVN 41:01). The eruption continued throughout 2016 until the last ash-bearing explosion was reported on 7 March 2017. This report covers the activity through June 2017. Most of the information for this report was gathered from the Unidad Estatal de Protección Civil de Colima (UEPCC), the Centro Universitario de Estudios e Investigaciones de Vulcanologia, Universidad de Colima (CUEIV-UdC), and the Washington Volcanic Ash Advisory Center (VAAC).
Colima was very active from January through April 2016 with hundreds of ash emissions, and a slow-growing lava dome that was first observed on 19 February. Activity decreased during May-September, although multiple explosions with ash plumes still took place most weeks during the period. On 30 September, the lava dome overflowed the crater rim, and sent a slow-moving lava flow and incandescent material down the SW flank. The lava flow continued to grow, reaching over 2 km in length by the end of October. A second lava flow appeared in mid-November, and advanced 1.7 km by early December. Strong ash-bearing explosions during December 2016-January 2017 sent plumes to heights of 4-6 km above the crater. Activity decreased during the second half of February; the last ash-bearing explosion was reported on 7 March 2017. Decreasing seismicity and minor landslides were reported through June 2017 with no further eruptive activity.
Incandescent activity during explosions in January 2016 sent glowing blocks down the flanks of Colima along with spectacular lightning in the ash plumes (figure 119). Ash emissions continued at Colima at a very high rate of multiple daily events, similar to December 2015 (figure 120). The Washington VAAC issued multiple advisories nearly every day during the month with information based on satellite imagery, wind data, webcam images, and notices from the México City Meteorological Watch Office (MWO). The ash plumes rose to altitudes of 4.3-6.7 km and most commonly drifted N or E. They generally drifted a few tens of kilometers before dissipating, but a few were still visible as far as 200 km from the summit.
Multiple daily ash advisories from the Washington VAAC continued during 1-9 February. They resumed on 14 February, and were intermittent for the rest of the month with similar altitudes and drift directions as those observed during January, but at a slightly lower frequency, decreasing towards the end of the month. On 19 February, CUEIV-UdC researcher Nick Varley observed a lava dome emerging from the floor of the crater (figure 121) during a helicopter overflight. It was estimated to be 25-30 m in diameter and 10 m high inside the almost 300-m-diameter, 50-m-deep summit crater. By 29 February, the dome had increased in size (figure 122), and fumarolic activity had also increased on the SE side of the summit crater.
Ash plume heights during March 2016 were slightly lower than during February (4.0-6.1 km altitude). Most of the plumes continued to drift NE or SE, and most dissipated within 50 km. During the first week of April, scientists observed fresh ashfall covering the dome at the center of the crater, which had not changed significantly since the previous overflight at the end of February. Persistent ash plumes continued throughout April with a three-minute-long ash emission recorded on 28 April by Colima's webcam.
The frequency of ash emissions decreased during May 2016 and further still during June 2016, when advisories from the Washington VAAC only appeared during five days of the month (1, 4, 13, 23, 30); the plume heights remained similar to previous months, except for a 16 May plume observed moving ENE at 7.6 km. After a two week pause, ash emissions resumed on 17 July with plume heights ranging from 4.3 to 7.3 km altitude through the end of the month. During the second half of August and for part of September, intermittent plumes did not exceed 6.1 km altitude, and dissipated within a few tens of kilometers of the summit.
The Unidad Estatal de Protección Civil de Colima reported that on 26 September seismicity at Colima increased, and incandescence appeared at the crater. On 27 September, small landslides originating from the growing lava dome traveled 100 m down the S flank. By the evening of 30 September, the webcam showed intense activity and crater incandescence as lava spilled over the crater rim and flowed down the SW flank (figure 123). An intense thermal anomaly was visible in short-wave infrared satellite images. An ash plume detected on 1 October in satellite images drifted almost 40 km S and SW; the webcam recorded explosions and pyroclastic flows down the flanks. The OMI instrument on the Aura satellite also recorded significant SO2 plumes drifting W and SW from Colima on 30 September and 1 October (figure 124).
According to news articles (Noticieros Televisa), during 29 September-1 October gas-and-ash plumes rose 4 km and caused ashfall in nearby areas, including La Becererra, La Yerbabuena, San Antonio, and El Jabali in the municipality of Comala (26 km SW), Montitlán in the municipality of Cuauhtémoc (34 km NW), and Juan Barragan in Tonila, Jalisco (14 km SE). On 1 October the Colima State government stated that the communities of La Yerbabuena (80 people) and La Becerrera (230 people) were preemptively evacuated, and an exclusion zone was extended to 12 km on the SW side. A news article noted that Juan Barragan was also evacuated.
The lava flow continued down the flank with incandescent rockfalls (figure 125) and occasional pyroclastic flows; by 4 October it had reached the base of the cone. The volume of the lava dome was estimated to have exceeded 1.2 million cubic meters (figure 126). By 8 October 2016, the lava flow was about 2,000 m long and 270 m wide at its front at the base of the cone. The Washington VAAC reported a strong hotspot consistent with the lava flow in satellite imagery on 9 October. On 13 October, they noted an ash plume that had drifted over 200 km W from the summit. Strong, multi-pixel, daily thermal alerts were issued from MODVOLC during 1-14 October. On 21 October, UEPCC reported that lava continued to flow down the S flank. It was 2.3 km long, 320 m wide, and had an estimated volume of 21 million m3.
Multiple ash plumes rose to altitudes of 5.5-8.2 km and drifted 25-40 km S, SW, and W during 2-4 October. Ashfall was reported in areas on the S and SW flanks. Ash explosions were also frequent throughout the rest of October, with plumes rising to altitudes of 4.3-7 km on many days (figure 127), until they ceased on 4 November for several weeks.
Effusive activity increased again at the very end of October 2016 with the growth of a new lava dome inside the summit crater. By 17 November, a new lava flow was also visible on the S flank (figure 128); it was reported to be about 500 m long by 20 November. After intermittent MODVOLC thermal alerts during late October and early November, they intensified with daily multi-pixel alerts between 15 November and 1 December.
During 26-28 November 2016, a brief episode of ash emissions sent plumes to 4.9-5.5 km altitude that drifted W, N, and NE as far as 75 km before dissipating. Observations of Colima made on 5 December by UEPCC during a helicopter overflight indicated that the lava flow on the S flank was slowing its advance, and had reached about 1,700 m in length (figure 129).
A new series of strong explosions with abundant ash emissions began on 7 December that continued through the end of the month. Multiple daily ash emissions appeared in both the webcam and satellite imagery. The plume on 8 December rose to 7.3 km and extended about 185 km NE of the summit near Lago de Chapala before dissipating. Incandescence during the explosions was visible at night, and glowing blocks were common on the upper flanks.
Ash clouds from multiple emissions were observed drifting W to WSW on 14 December at altitudes from 6.1 to 7.9 km (about 4 km above the summit). These plumes were visible 370 km WSW of the summit the next day. Plumes rose as high as 9.1 km altitude on 15 December, and spread N and NW. A series of strong, multiple daily explosions during 16-18 December included some of the strongest explosions since July 2015 (figure 130). Many of the multiple daily explosions during 19-31 December had plumes rising over 7 km in altitude and drifting over 100 km from the summit before dissipating. MODVOLC thermal alerts appeared on 13 days during December 2016.
Frequent strong explosive activity continued during January 2017. For the first three weeks of the month, the multiple daily plumes rose to altitudes of 4.6-7.6 km, drifting in multiple directions, some as far as 135 km. The UEPCC reported that at 0027 on 18 January a moderate-to-large explosion ejected incandescent material as far as 2 km onto the W, SW, SE, and N flanks. Based on webcam and satellite images, the México City MWO, and pilot observations, the Washington VAAC reported that during 18-24 January ash plumes rose to altitudes of 4.1-6.7 km and drifted in multiple directions. On 19 January, strong explosions were recorded by the webcam and noted by the Jalisco Civil Protection Agency (figure 131); they also reported ashfall in Comala and Cuauhtémoc. A strong thermal anomaly was identified in satellite images. Remnant ash clouds from the explosions were centered about 350 km SE on 20 January. A large ash plume rose to an altitude of 10.7 km on 23 January and drifted NE; several plumes that rose to over 7 km altitude were reported through the end of January. MODVOLC thermal alerts were issued on 11 days during January, but no further alerts appeared through June 2017.
The CUEIV-UdC reported that a large explosion at 1732 on 3 February 2017 generated an ash plume that rose 6 km above the crater rim and drifted SSW (figure 132). The Washington VAAC reported the plume at 7.6 km altitude (3.7 km above the crater) shortly before midnight on 4 February. The CUEIV-UdC also noted that a small pyroclastic flow traveled down the E flank. Their report stated that the internal crater was about 250 m in diameter and 50-60 m deep; previous lava domes had been destroyed in late September and mid-November 2016.
A brief period of low-intensity explosions during 10-16 February 2017 generated ash plumes reported by the Washington VAAC at 4-5.2 km altitude. There were no further aviation alerts issued during February. According to CUEIV-UdC, a few low-intensity explosions occurred during 3-16 March. The ash plume on 7 March rose about 2 km above the crater and drifted SW. During an overflight in the middle of March, researchers from CUEIV-UdC noted degassing from small explosion craters on the floor of the main crater; there was no evidence of effusive activity or growth of a new dome. After the middle of March, seismicity steadily decreased; CUEIV-UdC reported landslides every week through June, but no additional ash emissions were reported.
The MIROVA radiative power plot of the MODIS thermal anomaly data clearly shows the thermal activity at Colima during September 2016-February 2017 (figure 133).
Geologic Background. The Colima complex is the most prominent volcanic center of the western Mexican Volcanic Belt. It consists of two southward-younging volcanoes, Nevado de Colima (the high point of the complex) on the north and the historically active Volcán de Colima at the south. A group of late-Pleistocene cinder cones is located on the floor of the Colima graben west and east of the complex. Volcán de Colima (also known as Volcán Fuego) is a youthful stratovolcano constructed within a 5-km-wide scarp, breached to the south, that has been the source of large debris avalanches. Major slope failures have occurred repeatedly from both the Nevado and Colima cones, producing thick debris-avalanche deposits on three sides of the complex. Frequent recorded eruptions date back to the 16th century. Occasional major explosive eruptions have destroyed the summit (most recently in 1913) and left a deep, steep-sided crater that was slowly refilled and then overtopped by lava dome growth.
Information Contacts: Unidad Estatal de Protección Civil de Colima (UEPCC), Roberto Esperón 1170 Col. de los Trabajadores, C.P. 28020 (URL: http://www.proteccioncivil.col.gob.mx/); Centro Universitario de Estudios e Investigaciones de Vulcanologia (CUEIV-UdC), Universidad de Colima, Colima, Col. 28045, México; Centro Universitario de Estudios Vulcanologicos y Facultad de Ciencias de la Universidad de Colima, Avenida Universidad 333, Colima, Col., 28045 México (URL: http://portal.ucol.mx/cueiv/); Washington Volcanic Ash Advisory Center (VAAC), Satellite Analysis Branch (SAB), NOAA/NESDIS OSPO, NOAA Science Center Room 401, 5200 Auth Rd, Camp Springs, MD 20746, USA (URL: http://www.ospo.noaa.gov/Products/atmosphere/vaac/, archive at: http://www.ssd.noaa.gov/VAAC/archive.html); Hawai'i Institute of Geophysics and Planetology (HIGP), MODVOLC Thermal Alerts System, School of Ocean and Earth Science and Technology (SOEST), Univ. of Hawai'i, 2525 Correa Road, Honolulu, HI 96822, USA (URL: http://modis.higp.hawaii.edu/); MIROVA (Middle InfraRed Observation of Volcanic Activity), a collaborative project between the Universities of Turin and Florence (Italy) supported by the Centre for Volcanic Risk of the Italian Civil Protection Department (URL: http://www.mirovaweb.it/); NASA Goddard Space Flight Center (NASA/GSFC), Global Sulfur Dioxide Monitoring Page, Atmospheric Chemistry and Dynamics Laboratory, 8800 Greenbelt Road, Goddard, Maryland, USA (URL: https://so2.gsfc.nasa.gov/); Webcams de México (URL: http://www.webcamsdemexico.com/); Tom Pfeiffer, Volcano Discovery (URL: http://www.volcanodiscovery.com/); SkyAlert, Twitter (@SkyAlertMx) (URL: https://twitter.com/SkyAlertMx/status/705188862318882816); Sergio Tapiro, Twitter (@tapirofoto); Noticieros Televisa (URL: http://noticeros.televisa.com).
Ebeko
Russia
50.686°N, 156.014°E; summit elev. 1103 m
All times are local (unless otherwise noted)
New eruption with ash explosions began on 20 October 2016; ongoing through May 2017
Following explosions that produced ash plumes in early July 2010 (BGVN 36:07), no additional activity was noted from Ebeko by the Kamchatkan Volcanic Eruption Response Team (KVERT) until October 2016. This rather remote volcano on the N end of Paramushir Island in the Kuril Islands (figure 6) contains many craters, lakes, and thermal features (figure 7). Ash plumes were observed on 20 October 2016 and continued to be detected intermittently through 19 April 2017 (table 4).
Table 4. Summary of activity at Ebeko volcano from mid-October 2016 to mid-April 2017. ACC is Aviation Color Code. Data courtesy of KVERT.
| Date |
Plume Altitude |
Plume Distance |
Plume Direction |
Other Observations |
| 20 Oct 2016 |
1.5 km; 1.3-1.4 km |
15 km; 10 km |
ENE; NE |
ACC raised to Yellow. |
| 24 Oct 2016 |
-- |
-- |
-- |
ACC lowered to Green. |
| 08-09 Dec 2016 |
1.5 km |
6 km |
N |
ACC raised to Yellow. |
| 09-10 Dec 2016 |
1.8-1.9 km |
4-5 km |
NW |
Minor amounts of ash from two vents, in Sredniy Crater (middle) and Severny Crater (northern). |
| 17, 20 Dec 2016 |
1.5 km |
8 km |
N, NE |
-- |
| 24-27 Dec 2016 |
2-2.5 km |
-- |
-- |
Ash plumes; ACC raised to Orange on 27 Dec. |
| 30 Dec 2016-06 Jan 2017 |
-- |
-- |
-- |
Gas and steam plumes, minor ash. |
| 12 Jan 2017 |
-- |
-- |
-- |
ACC lowered to Yellow. |
| 19 Jan 2017 |
2 km |
3 km |
SW |
ACC raised to Orange. |
| 20 Jan-03 Feb 2017 |
-- |
-- |
-- |
Minor ashfall in Severo-Kurilsk on 30 Jan. |
| 10 Feb 2017 |
-- |
-- |
-- |
Activity declined; ACC lowered to Yellow. |
| 27 Feb 2017 |
2 km |
6 km |
N |
ACC raised to Orange. |
| 24, 26, 27 Feb 2017; 02 Mar 2017 |
up to 2.5 km |
-- |
-- |
Explosions. |
| 03-10 Mar 2017 |
1.6 km |
-- |
-- |
15 explosions. |
| 20-22 Mar 2017 |
1.7-1.8 km |
-- |
-- |
Several explosions; minor ashfall in Severo-Kurilsk on 21 Mar. |
| 24-31 Mar 2017 |
1.5-3.4 km |
-- |
-- |
Several daily explosions; minor ashfall in Severo-Kurilsk on 26 Mar. |
| 04-06 Apr 2017 |
4 km |
-- |
-- |
Several explosions; minor ashfall in Severo-Kurilsk on 6 Apr. |
| 07-14 Apr 2017 |
2.6 km |
-- |
-- |
Several explosions; minor ashfall in Severo-Kurilsk on 12 Apr. |
| 14, 16, 19 Apr 2017 |
3.2 km |
-- |
-- |
Several explosions; minor ashfall in Severo-Kurilsk on 18 Apr; ACC remained at Orange. |
According to observers about 7 km E in the city of Severo-Kurilsk, a gas-and-steam plume containing a small amount of ash rose from Ebeko on 20 October 2016 (figure 8), marking the start of its most recent eruption. The Aviation Color Code (ACC) was raised from Green to Yellow. Later that day observers noted gas, steam, and ash plumes rising from the volcano. Ground-based and satellite observations during 21-23 October indicated quiet conditions; consequently, the ACC was lowered to Green on 24 October.
On 8-9 December 2016 the ACC was again raised to Yellow when a gas and steam plume containing a small amount of ash was observed. Ash rose from both Sredniy Crater (middle) and Severny Crater (northern) during 9-10 December (figure 9). Further ash plumes were seen during 17-27 December the ACC was raised to Orange. Minor ash was reported during 30 December 2016-6 January 2017, along with gas and steam plumes. An ash plume rose up to 2 km altitude on 19 January (figure 10), and ash fell in Severo-Kurilsk on 30 January. More frequent explosions took place between 24 February and 19 April 2017 (table 4). Simultaneous explosions from two craters was observed on 15 April (figure 11).
Satellite thermal data from MODVOLC showed no thermal alerts for at least the last 10 years, and MIROVA only identified two low-power anomalies in the past year, one in late February 2017 and the other in late March 2017.
Reference: Rychagov S.N., Belousov V.I., Kotenko ?.A., and Kotenko L.V., 2010, Gas-hydrothermal system of the geothermal deposit, Proceedings World Geothermal Congress 2010 Bali, Indonesia, 25-29 April 2010, 4 p.
Geologic Background. The flat-topped summit of the central cone of Ebeko volcano, one of the most active in the Kuril Islands, occupies the northern end of Paramushir Island. Three summit craters located along a SSW-NNE line form Ebeko volcano proper, at the northern end of a complex of five volcanic cones. Blocky lava flows extend west from Ebeko and SE from the neighboring Nezametnyi cone. The eastern part of the southern crater contains strong solfataras and a large boiling spring. The central crater is filled by a lake about 20 m deep whose shores are lined with steaming solfataras; the northern crater lies across a narrow, low barrier from the central crater and contains a small, cold crescentic lake. Historical activity, recorded since the late-18th century, has been restricted to small-to-moderate explosive eruptions from the summit craters. Intense fumarolic activity occurs in the summit craters, on the outer flanks of the cone, and in lateral explosion craters.
Information Contacts: Kamchatka Volcanic Eruptions Response Team (KVERT), Far Eastern Branch, Russian Academy of Sciences, 9 Piip Blvd., Petropavlovsk-Kamchatsky, 683006, Russia (URL: http://www.kscnet.ru/ivs/kvert/); Institute of Volcanology and Seismology, Far Eastern Branch, Russian Academy of Sciences (IVS FEB RAS), 9 Piip Blvd., Petropavlovsk-Kamchatsky 683006, Russia (URL: http://www.kscnet.ru/ivs/eng/); Hawai'i Institute of Geophysics and Planetology (HIGP) - MODVOLC Thermal Alerts System, School of Ocean and Earth Science and Technology (SOEST), Univ. of Hawai'i, 2525 Correa Road, Honolulu, HI 96822, USA (URL: http://modis.higp.hawaii.edu/); MIROVA (Middle InfraRed Observation of Volcanic Activity), a collaborative project between the Universities of Turin and Florence (Italy) supported by the Centre for Volcanic Risk of the Italian Civil Protection Department (URL: http://www.mirovaweb.it/).
Karymsky
Russia
54.049°N, 159.443°E; summit elev. 1513 m
All times are local (unless otherwise noted)
Persistent ash plumes and thermal anomalies January 2015-March 2016; short-lived explosions with ash, 5-8 October 2016
Karymsky volcano on Russia's Kamchatka Peninsula has a lengthy eruptive history based on both radiocarbon data (back to about 6600 BCE) and historical observations (back to 1771). Much of the volcanic cone is surrounded by lava flows less than 200 years old. The most recent activity, consisting of frequent ash explosions and a few lava flows deposited on the flanks, has been ongoing for several decades. The most recent previous report described numerous ash explosions, persistent thermal anomalies, and moderate seismic activity through 2014 (BGVN 40:09). This report covers similar activity from January 2015 through May 2017. Information was compiled from the Kamchatka Volcanic Eruptions Response Team (KVERT), the Tokyo Volcanic Ash Advisory Center (VAAC), and several sources of satellite data.
Ash-bearing explosions and thermal anomalies characterized activity throughout 2015, beginning with an explosion on 19 January. Ash plumes were common through early March 2016, after which only steam-and-gas emissions and occasional thermal anomalies were noted, although fresh ash deposits were observed near the volcano in the second half of March. A brief episode of explosive activity during 5-8 October 2016 produced low-level ash plumes that drifted for hundreds of kilometers. No additional activity was reported through May 2017.
Activity during 2015. An explosive event at Karymsky on 19 January 2015 signaled a return to activity after a few months of quiet. The ash plume from the explosion extended 50 km SE, and the NASA Earth Observatory captured a satellite image showing trace ash deposits from the event trending SE across the snow-covered landscape (figure 34). Ashfall deposits were seen on 1 March (10-15 km E and SE) and 7 March.
Throughout the year, KVERT reported multiple thermal anomalies and ash plumes each month (table 8). The Tokyo VAAC issued 192 aviation alerts during the year, and the MODVOLC system reported eight thermal alerts in January, one in July, and two in August. Ash plume altitudes ranged from 2.1 to 7 km. Continuous ash emissions were noted during 16 and 29-30 July. The ash plume observed in satellite data on 17 July was 8 km long and 5 km wide. Volcanologists observed multiple explosions during 21-22 July, and helicopter pilots in the area reported explosions on 28 July that then lasted for several days (figure 35). Large plumes were also noted during December; on 22 December one was 8 km long and 6 km wide, and on 25 December one was 56 km long and 6 km wide. The highest altitude plumes were reported at 7 km drifting N on 16 and 20 November 2015 by the Tokyo VAAC. Ash plumes drifted in various directions, and were observed as far as 250 km before dissipating.
Table 8. Summary by month of ash plumes and thermal anomalies reported for Karymsky during 2015. Details include dates of thermal anomalies and ash plumes, maximum plume altitude in kilometers, distance in kilometers of ash plume drift, and direction of drift. Multiple thermal anomalies on a given date are shown in parentheses- 23(4)-after the date. 'Date: 7/8' means time zone boundaries presented different reported days for Kamchatka time (KST) and Universal Time (UTC). Sources are KVERT and Tokyo VAAC for ash plume data; KVERT and MODVOLC for thermal data.
| Month |
Thermal Anomalies (KVERT) |
Thermal Anomalies (MODVOLC) |
Ash Plumes |
Plume Altitude (km) |
Plume Distance (km) |
Plume Directions |
| Jan 2015 |
11, 18-31 |
19, 22(2), 23(4), 26 |
19-23, 27, 31 |
2.5-5 |
65-160 |
ESE, E, N |
| Feb 2015 |
6, 21, 24 |
-- |
23, 27 |
2.7 |
254, 215 |
ENE |
| Mar 2015 |
7, 24-26, 29 |
-- |
22, 24-26, 27, 29-30 |
2.1 |
154, 150 |
E, NE, SW |
| Apr 2015 |
9, 16-17, 23 |
-- |
3, 23, 27 |
2.7-3.0 |
85, 35, 140 |
SE, SE, NE |
| May 2015 |
4-6, 15-16, 30 |
-- |
16/17, 23 |
-- |
27, 45 |
W, SE |
| Jun 2015 |
6, 8-10 |
-- |
8-10 |
4.3 |
50 |
SE, E |
| Jul 2015 |
6, 13-14, 16, 17, 25, 27-30 |
13 |
1, 9, 13, 17, 21-22, 25, 27-30 |
2-5.1 |
50-115 |
SW, S, E, NW, SE |
| Aug 2015 |
2, 6, 15, 18-21, 24-25 |
19, 24 |
2, 6, 8, 9, 12, 15, 16, 18, 21, 24, 25 |
4.3-5.8 |
25-54 |
N, W, SW, SE |
| Sep 2015 |
2, 10, 14-18, 24 |
-- |
8, 10, 20 |
4.3-4.6 |
10 |
SE, NE |
| Oct 2015 |
4, 8, 11, 20, 22-24, 28 |
-- |
3-5, 8, 17-20, 22 |
2.1-4.6 |
50, 100 |
SE, E |
| Nov 2015 |
20, 27 |
-- |
1/2, 4, 7/8, 10-12, 15-18, 20-21, 30 |
2.5-7.0 |
40-160 |
NE, SE, E, ESE |
| Dec 2015 |
3, 6-7, 14, 23-25, 27-28, 31 |
-- |
11, 19, 22, 25, 28 |
3.7-5.5 |
145 |
E, NE, NW, W, ENE |
Activity during January 2016-April 2017. Activity was variable at Karymsky during 2016 (table 9). The Tokyo VAAC issued 132 aviation notices. Ash plumes and thermal anomalies were most frequent during January and February, with over twenty instances of each during February. The plume heights during February exceeded 6 km altitude four times, with the highest plume of the year on 20 February at 7.6 km altitude. Near-continuous ash emissions during the last week of February resulted in satellite observations of ash deposits around the volcano at the end of the month and during the first few days of March (figure 36). Activity decreased significantly during March, although KVERT noted fresh ash deposits again during 18-25 March. Except for thermal anomalies noted on 1 and 6 April, only steam-and-gas emissions were reported; KVERT lowered the Aviation Alert Level from Orange to Yellow (on a four-color scale) at the end of the month. From May to July, KVERT reported a thermal anomaly once each month. Steam-and-gas emissions were the only activity reported in August, and on 2 September, they lowered the Alert Level from Yellow to Green.
Table 9. Summary by month of ash plumes and thermal anomalies reported for Karymsky during 2016. Details include dates of thermal anomalies and ash plumes, maximum plume altitude in kilometers, distance in kilometers of ash plume drift, and direction of drift. Sources are KVERT and Tokyo VAAC for ash plume data; KVERT and MODVOLC for thermal data.
| Month |
Thermal Anomalies (KVERT) |
Thermal Anomalies (MODVOLC) |
Ash Plumes |
Plume Altitude (km) |
Plume Distance (km) |
Plume Directions |
| Jan 2016 |
1, 3-4, 6-7, 11-15, 18-19, 21, 23, 26, 31 |
-- |
3, 5-7, 9, 10, 12-15, 17, 21, 24, 26-28, 31 |
3.9-7.6 |
160-270 |
E, NW, SE |
| Feb 2016 |
1-19, 22, 26-29 |
5 |
1-21, 26 |
3.4-7.6 |
125-270 |
E, SE, W |
| Mar 2016 |
1-4 |
-- |
1 |
5.2 |
-- |
NE |
| Apr 2016 |
1, 6 |
-- |
-- |
-- |
-- |
-- |
| May 2016 |
26 |
-- |
-- |
-- |
-- |
-- |
| Jun 2016 |
25 |
-- |
-- |
-- |
-- |
-- |
| Jul 2016 |
4 |
-- |
-- |
-- |
-- |
-- |
| Aug 2016 |
-- |
-- |
-- |
-- |
-- |
-- |
| Sep 2016 |
-- |
-- |
-- |
-- |
-- |
-- |
| Oct 2016 |
7, 12, 17 |
-- |
5-8 |
2.4 |
390 |
E, SE |
| Nov 2016 |
3 |
-- |
-- |
-- |
-- |
-- |
| Dec 2016 |
-- |
-- |
-- |
-- |
-- |
-- |
After six months of quiet, the Tokyo VAAC reported an ash plume on 5 (UTC)/6 (KST) October at 2.4 km altitude extending SE. Aviation alerts were issued through 8 October 2016. Although residing at a fairly low altitude (2.4 km), the plume observed in satellite imagery during 7-8 October was visible in satellite imagery drifting 390 km E and SE before dissipating. KVERT briefly raised the Alert Level to Yellow and then to Orange on 7 and 8 October, and then back to Yellow on 19 October. Three weak thermal anomalies appeared in October and one in November; KVERT lowered the Alert Level to Green on 25 November. Karymsky remained at Alert Level Green through May 2017 with no further reports issued from KVERT or the Tokyo VAAC.
Geologic Background. Karymsky, the most active volcano of Kamchatka's eastern volcanic zone, is a symmetrical stratovolcano constructed within a 5-km-wide caldera that formed during the early Holocene. The caldera cuts the south side of the Pleistocene Dvor volcano and is located outside the north margin of the large mid-Pleistocene Polovinka caldera, which contains the smaller Akademia Nauk and Odnoboky calderas. Most seismicity preceding Karymsky eruptions originated beneath Akademia Nauk caldera, located immediately south. The caldera enclosing Karymsky formed about 7600-7700 radiocarbon years ago; construction of the stratovolcano began about 2000 years later. The latest eruptive period began about 500 years ago, following a 2300-year quiescence. Much of the cone is mantled by lava flows less than 200 years old. Historical eruptions have been vulcanian or vulcanian-strombolian with moderate explosive activity and occasional lava flows from the summit crater.
Information Contacts: Kamchatka Volcanic Eruptions Response Team (KVERT), Far Eastern Branch, Russian Academy of Sciences, 9 Piip Blvd., Petropavlovsk-Kamchatsky, 683006, Russia (URL: http://www.kscnet.ru/ivs/kvert/); Institute of Volcanology and Seismology, Far Eastern Branch, Russian Academy of Sciences, (IVS FEB RAS), 9 Piip Blvd., Petropavlovsk-Kamchatsky 683006, Russia (URL: http://www.kscnet.ru/ivs/eng/); Tokyo Volcanic Ash Advisory Center (VAAC), 1-3-4 Otemachi, Chiyoda-ku, Tokyo, Japan (URL: http://ds.data.jma.go.jp/svd/vaac/data/); Hawai'i Institute of Geophysics and Planetology (HIGP), MODVOLC Thermal Alerts System, School of Ocean and Earth Science and Technology (SOEST), Univ. of Hawai'i, 2525 Correa Road, Honolulu, HI 96822, USA (URL: http://modis.higp.hawaii.edu/); NASA Earth Observatory, EOS Project Science Office, NASA Goddard Space Flight Center, Goddard, Maryland, USA (URL: http://earthobservatory.nasa.gov/).
Kilauea (United States) — August 2017 Cite this Report
Kilauea
United States
19.421°N, 155.287°W; summit elev. 1222 m
All times are local (unless otherwise noted)
New flow from Pu'u 'O'o reaches the sea on 26 July; Kamokuna delta collapses on 31 December 2016
Hawaii's Kīlauea volcano continues the long-term eruptive activity that began in 1983 with lava flows from the East Rift Zone (ERZ) and a convecting lava lake inside Halema'uma'u crater. The US Geological Survey's (USGS) Hawaiian Volcano Observatory (HVO) has been monitoring and researching the volcano for over a century since its founding in 1912. HVO provided quarterly reports of activity for July-December 2016, which are summarized below.
Summary of July-December 2016 activity. Activity at Kīlauea during the second half of 2016 was consistent with long-term trends of summit inflation punctuated by DI (Deflation-Inflation) events and a slowly rising average lava lake level inside Halema?uma?u crater. Two explosive events prompted by rockfalls into the lake sent spatter high enough to reach the Halema?uma?u rim; a small overflow at the crater occurred in October, the first since April-May 2015.
Pu'u 'O'o activity continued with little change except for the steady advance of the episode 61g lava flow towards the coast. The pahoehoe front reached the Emergency Access Road near the coast on 25 July and cascaded slowly over the seacliff into the ocean on 26 July just after midnight. It was the first time since August 2013 that lava from Pu'u 'O'o entered the sea. A growing lava delta of about 10 hectares (25 acres) at the Kamokuna entry was the focus of attention by visitors until most of it collapsed into the sea on 31 December 2016.
Activity at Halema'uma'u. Eruptive activity at Halema'uma'u crater was typical during July-December 2016, with a slightly elevated lake level for the last quarter of the year. The lava lake circulation pattern continued in the usual N-S direction, with occasional shifts due to short-lived spattering in areas other than the normal Southeast sink. The lake level rose and fell in concert with the regular summit DI events. On 7 September, the lake level rose to the level of the old rim prior to the April/May 2015 crater overflow, 8 m below the current rim (figure 267).
The lowest lake level of the period was 55 m below the floor of Halema'uma'u on 6 October; the lake reached its highest level when it overflowed the rim on 15 October. This was the highest lake level since the overflows in late April to early May 2015, and it covered a small area of about 5,000 m² of the Halema'uma'u crater floor. The latest overflows consisted of two small lobes that spilled onto the crater floor on the SE and NW sides of the lake (figure 268).
The lava lake surface or spatter from the lake was visible intermittently from the Jaggar Overlook on the NW rim of the caldera. During a few of the deflation phases of the DI events, newly exposed juvenile veneer on the crater walls detached and collapsed into the lake. Many of these collapses were too small to notice on the webcams or produce seismic events, but several events were noteworthy.
On 6 August there was a large collapse at the base of the Halema'uma'u crater wall (above the Southeast sink). The collapse produced a large explosive event, along with a composite seismic event, and vigorous spattering. The main explosive deposit blanketed the rim just east of the closed overlook, with tephra forming a continuous layer up to 20 cm thick. Bombs were deposited over an area 220 m wide (along the rim) and up to 90 m beyond the crater rim, with sparse lapilli thrown across the parking lot. HVO monitoring equipment and some of the remaining wooden fencing for the overlook were burned.
A second explosive event occurred on 19 September, also triggered by a collapse of the crater wall above the Southeast sink. Bombs and smaller scoria reached the Halema'uma'u crater rim and ash was deposited across the parking area and road. Large events also occurred on 4 October around 1100, and again at around noon. The first triggered a composite seismic event and spattering when veneer on the E wall fell into the lake, and the other triggered brief spattering when a large sheet of veneer fell from the SW wall. On 19 and 20 October, explosive events were triggered by rockfalls below the overlook (figure 269). The first, at 0745, deposited spatter and ribbon bombs up to 30 cm long on the rim of Halema'uma'u, and produced muted composite seismicity. The 20 October event occurred at 1225, producing a tephra deposit that extended across the road past the parking lot, and generated weak composite seismicity.
At 1159 on 28 November, another slice of crater wall below the HMcam (one of two Halema'uma'u webcams) fell and triggered an explosive event that again threw tephra onto the rim. The tephra deposit was sparse and confined to a narrow area 90-100 m wide along the rim between the two webcams on the SE rim. While most of the spatter bombs were less than 30 cm in size, the largest was about 160 cm long. The clasts were relatively fluidal in texture and most splatted upon impact (figure 269). The power and Ethernet cables for one of the webcams were damaged during this event. A similar event occurred on 2 December at 0658, when a large slab from the overlook crater wall directly below one of the webcams collapsed. This also triggered a small explosive event which bombarded the rim with spatter near the two cameras, and produced rare ribbon bombs close to a meter long. Another large veneer collapse occurred on 13 December at about 1355, when a slab fell from the N wall into the lake and triggered spattering.
Activity at Pu'u 'O'o and the East Rift Zone. There were few notable changes at Pu'u 'O'o cone from July through December. Very slight uplift was observed during 2-4 July that may have corresponded to inflationary tilt. The forked lava stream in the vent on the NE spillway was visible on a 15 July overflight. Subsequent overflights found the streams progressively more crusted over, and no lava was visible in the vent on the 19 August overflight. The W pit had a large collapse of its NE rim that was noticed on 1 September. A few meters had shaved off the rim of the pit, making a pile of rubble on the pit floor.
One of the two vents on the NE spillway re-opened at some point during the day on 2 November. Fieldwork on 3 November showed that the W-pit lava pond was 52 m across and 22 m below the pit rim, at an elevation of 848 m. The pond level was at 847 m when seen again on 29 November, with weak spattering at a few places around the pond perimeter.
The new flow (episode 61g), which began from the NE flank of Pu'u 'O'o cone on 24 May 2016, had reached the top of Pulama pali (cliff) on 28 June 2016 (BGVN 41:08, figure 263). It reached the base of the pali on the last day of June, and began to advance quickly across the coastal plain (figure 270). It was initially quite narrow, about 100 m across, possibly because of the flow high advance rate and confining topography in the area, according to HVO. The flow had slowed by 5 July; it was half way across the coastal plain, with the leading tip about 1.7 km from both the base of the pali and the ocean, and 1.6 km from the closest portion of the FEMA evacuation road that runs along the coast.
The flow front continued to advance slowly over the next few weeks and eventually stalled in mid-July. The stalled front was soon overtaken, however, by breakouts that had been steadily advancing downslope behind the front. These breakouts formed a new front that continued to advance rapidly at up to 170 m/day. By 24 July, the flow front had reached to within about 260 m of the FEMA emergency access road. The next day (25 July) at 1520 HST, the 61g flow crossed the FEMA road (figure 271), and at 0112 HST on 26 July lava spilled over the sea cliff and into the water, marking the start of the rapid growth of the Kamokuna ocean entry.
The flow field continued to widen over the next few months, as scattered breakouts crept down the flow (figure 272). One of these breakouts formed a second ocean entry point several hundred meters to the W of the initial entry. Other, smaller breakouts reached the ocean along the stretch of land between the two main entry points, forming short-lived entries (figure 273). Persistent breakouts near the base of the Pulama pali began to build a ramp, making the pali less steep.
Numerous small delta collapses on both the E and W deltas were reported during August and September, but the deltas overall continued to grow. By the end of September the E delta was about 5.2 hectares (12.9 acres), and had developed several large coast-parallel cracks that suggested it was becoming unstable (figure 274). Activity at the W delta was always subordinate to that at the E delta and was abandoned in late September, having reached about 2.6 ha in size.
The only surface activity not on the lower half of the flow field (from the top of the pali to the coast) during July-September was a large breakout from the episode 61g vent on the east flank of Pu'u 'O'o cone that started 29 August. The breakout was active for only a few days and died during the first week of September. On 27 September a skylight abruptly opened a few hundred meters inland from the ocean entry, producing a strong glow at night. Very little surface activity was present on the coastal plain near the Kamokuna ocean entry during October-December. A small breakout started about a kilometer upslope from the park rope line on 24 November, and remained active until the evening of 28 November.
However, breakouts did continue near the Pulama pali during October-December, further building up the intermediate-sloped ramp at the base of the pali (figure 275). The first of these started on 1 October and continued until at least 23 October, having extended a short distance beyond the base of the pali. A breakout started near the bottom of the steepest part of the pali during 22-23 November, producing short-lived channelized flows. The breakout remained active until at least 30 November, but was apparently inactive by 6 December.
At the episode 61g vent near Pu'u 'O'o cone, a new breakout started between 0830 and 0840 on 21 November 2016. The ground surface over and just upslope from the vent was fractured and uplifted 3-4 m. The breakout consisted of two branches, one of which generally headed S and was short lived, stagnating during the day of 26 November. The other flowed NE and surrounded the nearby Pu?u Halulu cone before turning to the SE. The flow front of this second branch was about 2 km from the vent when mapped on 17 December (figure 276), but continued to advance through the end of the year. In addition to the 21 November breakout, other short-lived breakouts from the episode 61g vent were active during 1-3 December, 11-12 December, and 25-28 December.
During an overflight on 3 November, HVO found that the W delta, which became inactive in late September, was approximately 2 ha after losing about 0.6 ha to wave erosion. The E delta at the Kamokuna ocean entry remained very active through December, reaching a relatively stable size of around 10 ha, kept in check by frequent small collapses. Large cracks on the delta parallel to the old sea cliff were apparent, and the delta on the seaward side of the cracks appeared to be tilted, indicating instability. The delta was about 9 ha in size in late December.
During mid-afternoon on 31 December 2016, the E delta began to collapse in pieces. Over the course of a few hours, most of the delta had disappeared into the water, leaving about 1 ha as narrow remnant ledges at the base of the sea cliff (figures 277 and 278). In addition to the delta collapse, roughly 1.6 ha of the older, post-1986 sea cliff also fell into the ocean, likely due to undercutting promoted by the delta collapse. This portion of the old sea cliff was partially above the E edge of the delta, but most of it was adjacent to the delta to the east (figure 278), and included part of the National Park viewing area. The sea cliff collapses produced thick, dusty plumes and large waves that splashed back onto the sea cliff, in some instances. In the days that followed, a few more small slices of unstable sea cliff collapsed into the water. The total area that collapsed, including the delta and the older sea cliff, was approximately 10 ha.
Thermal anomaly data. Satellite-based thermal anomaly data from the MODIS instrument generates a strong continuous signal from Kīlauea that closely follows the distribution of the active lava flows. As the episode 61g flow emerged from Pu'u 'O'o and headed SE, the thermal signature was strong between Pu'u 'O'o and the Pulama pali during the last week of June as recorded by the University of Hawaii's MODVOLC thermal alert system. By mid-August, a few weeks after the flow had reached the sea, the thermal activity extended from the pali to the Kamokuna ocean entry site (figure 279).
New breakouts from the Pulama pali area were recorded as thermal alerts during the second week of November along with the evidence for continued thermal alerts from the Kamokuna delta at the shoreline. At the vent area of episode 61g, near Pu'u 'O'o cone, new breakouts flowed NE of the cone and were captured as thermal alerts during early December (figure 280).
Geologic Background. Kilauea overlaps the E flank of the massive Mauna Loa shield volcano in the island of Hawaii. Eruptions are prominent in Polynesian legends; written documentation since 1820 records frequent summit and flank lava flow eruptions interspersed with periods of long-term lava lake activity at Halemaumau crater in the summit caldera until 1924. The 3 x 5 km caldera was formed in several stages about 1,500 years ago and during the 18th century; eruptions have also originated from the lengthy East and Southwest rift zones, which extend to the ocean in both directions. About 90% of the surface of the basaltic shield volcano is formed of lava flows less than about 1,100 years old; 70% of the surface is younger than 600 years. The long-term eruption from the East rift zone between 1983 and 2018 produced lava flows covering more than 100 km2, destroyed hundreds of houses, and added new coastline.
Information Contacts: Hawaiian Volcano Observatory (HVO), U.S. Geological Survey, PO Box 51, Hawai'i National Park, HI 96718, USA (URL: https://volcanoes.usgs.gov/observatories/hvo/); NASA Earth Observatory, EOS Project Science Office, NASA Goddard Space Flight Center, Goddard, Maryland, USA (URL: http://earthobservatory.nasa.gov/); Hawai'i Institute of Geophysics and Planetology (HIGP), MODVOLC Thermal Alerts System, School of Ocean and Earth Science and Technology (SOEST), Univ. of Hawai'i, 2525 Correa Road, Honolulu, HI 96822, USA (URL: http://modis.higp.hawaii.edu/); Tom Pfeiffer, Volcano Discovery (URL: http://www.volcanodiscovery.com/).
Rincon de la Vieja (Costa Rica) — August 2017 Cite this Report
Rincon de la Vieja
Costa Rica
10.8314°N, 85.3364°W; summit elev. 1729 m
All times are local (unless otherwise noted)
Phreatic explosions disperse material up to 2 km from the active crater in March 2016 and June 2017
The active crater at Costa Rica's Rincón de la Vieja, which contains a 500-m-wide acid lake, has been the site of numerous historic eruptions at this large volcanic complex. Intermittent phreatic explosions since 2011 have dispersed volcanic debris from the crater lake within a few kilometers of the crater rim and into the surrounding streams a number of times. The most recent previous activity included explosions in September and October 2014, and phreatic eruptions on June, August and October 2015 (BGVN 41:01); this report discusses activity during 2016 and through July 2017. Information comes from the Observatorio Vulcanológico Sismológica de Costa Rica-Universidad Nacional (OVSICORI-UNA) and the Observatorio Sismológico y Vulcanológico de Arenal-Miravalles (OSIVAM-ICE). The OVISAM-ICE reports are published through the Red Sismológica Nacional (RSN), the National Seismological Network. Ejected material is described in the original reports in various ways that appear to be interchangeable rather than signifying actual content differences, so those distinctions are not reflected below unless ash was specified.
The first evidence of a new episode of phreatic explosions was noted during a site visit on 15 February 2016. Numerous explosions during March spread material as far as 2 km from the crater rim. After an explosion on 1 May 2016 there were no further reports until 23 May 2017, when a series of intermittent explosions again ejected material onto the N and NW flanks and sent plumes of steam-and-gas as high as 2 km above the crater rim. The last reported explosion was on 5 July 2017.
Activity decreased at the end of 2015 after the phreatic explosions of 16-21 October. The number of seismic events increased again during February and March 2016. OVSICORI-UNA scientists observed the first evidence of a new episode of phreatic explosions during a field visit on 15 February 2016 when they noted deposits about 20 m from the crater rim. By the end of March, the RSN had reported 25 explosions. Three of the largest explosions occurred on 9 February, 9 March, and 18 March. They were characterized by episodes of tremor in pulses that usually lasted about five minutes prior to the phreatic explosion, and then changed to continuous tremor for several hours afterwards.
OSIVAM-ICE scientists reported photographic evidence of deposits from a 2 March explosion that covered a wide area on the N flank of the active crater (figure 22). They visited on 3 March 2016 and noted fresh deposits from the phreatic explosions about 200 m W of the crater rim (figure 23). They also witnessed three explosions during the afternoon, the longest lasting for 65 seconds.
Scientists from OVSICORI-UNA conducted additional site visits during 8 and 10-11 March 2016. On 8 March fresh ash was found about 120 m from the crater rim (figure 24), and a temperature of 55°C was measured remotely for the convection cell in the lake. Based on photographs taken by nearby residents, OVSICORI-UNA scientists estimated that the ash and steam plumes produced by the 9 and 10 March explosions rose 700 and 850 m, respectively, above the crater. Local residents reported to The Tico Times that ash fell on the roofs of their homes within an area up to 6 km around the volcano after the explosion on 9 March, mostly in communities N of the crater (Upala and Buenos Aires).
The character of the deposits changed between February and March 2016, according to a report by OVSICORI scientists. The samples collected in February were rich in elemental sulfur, abundant in the crater lake and in the near-surface sediments. Studies of the March samples showed the presence of clasts of altered rocks, hydrothermal minerals, and elemental sulfur as well as 3-10% fresh glass.
During their summit visit on 10 and 11 March 2016, OVSICORI scientists noted a coating of white sediment, up to 5 mm thick in some places, covering the ground and the vegetation in a 400m-wide area to the SSW of the active crater (figure 25). Deposits extended as far as 2 km away, and coated the flanks of both the active crater and the nearby Von Seeback crater (figure 26).
A 15 March explosion generated a 700-m-high plume of water vapor and gas, according to an announcement from OVSICORI-UNA. They also reported an explosion on 1 May 2016 detected for 11 minutes by the seismic network. No further reports were made until May 2017.
A small lahar traveled down the N flank of the crater after an explosion on 23 May 2017. Explosions on 11 and 12 June were recorded seismically, but cloudy weather obscured visual observations. The Washington VAAC, however, noted a hotspot in the infrared satellite data on 11 June 2017 about 30 minutes before the explosion was reported. A diffuse steam plume was observed from Dos Rios de Upala rising about 50 m above the summit on 15 June, and a small phreatic explosion was recorded on 18 June 2017. A larger explosion on 23 June sent a plume 1-2 km above the summit, and ejected material to the W and NW onto the upper N flank toward the Von Seebach crater 2 km to the W. Small phreatic explosions on 5 July ejected material that did not rise above the crater rim.
Geologic Background. Rincón de la Vieja is a volcanic complex in the Guanacaste Range of NW Costa Rica. Sometimes referred to as the Rincon de la Vieja-Santa María Volcanic Complex, it consists of a slightly arcuate 20-km-long ridge of 12 craters and pyroclastic cones constructed within the 15-km-wide early Pleistocene Guachipelín caldera, whose rim is exposed on the south side. Sometimes known as the "Colossus of Guanacaste," it has an estimated volume of 130 km3 and contains at least nine major eruptive centers. The Santa María cone, the highest peak of the complex, is located on the E side of the ridge and has a lake within the 400-m-diameter crater. A Plinian eruption producing the 0.25 km3 Río Blanca tephra about 3,500 years ago was the last major magmatic eruption. All subsequent eruptions, including numerous reported eruptions possibly dating back to the 16th century, have been from the active crater, near the center of the complex, with an acidic 300-m-diameter lake.
Information Contacts: Observatorio Vulcanológico Sismológica de Costa Rica-Universidad Nacional (OVSICORI-UNA), Apartado 86-3000, Heredia, Costa Rica (URL: http://www.ovsicori.una.ac.cr/); Observatorio Sismológico y Vulcanológico Arenal-Miravalles del Instituto Costarricense de Electricidad (OSIVAM-ICE), Sección de Sismología, Vulcanología y Exploración Geofísica, Escuela Centroamericana de Geología, Apdo. 214-2060, San Pedro, Costa Rica (URL: http://rsn.ucr.ac.cr/); The Tico Times (URL: http://www.ticotimes.net/2016/03/10/costa-rica-rincon-de-la-vieja-volcano-vapor-ash-explosions).
Sangay
Ecuador
2.005°S, 78.341°W; summit elev. 5286 m
All times are local (unless otherwise noted)
Intermittent ash emissions and thermal anomalies, January 2015-July 2017
Ecuador's Sangay, isolated on the east side of the Andean crest, has exhibited frequent eruptive activity over the last 400 years. Its remoteness has made ground observations difficult until recent times, and thus most information has come from aviation reports from the Washington Volcanic Ash Advisory Center (VAAC) and MODIS (Moderate Resolution Imaging Spectroradiometer) satellite-based data. Thermal anomaly information is reported by the University of Hawaii's MODVOLC system and the Italian MIROVA Volcano HotSpot Detection System. Ecuador's Instituto Geofísico (IG) issues periodic Special Reports of activity. This report summarizes the intermittent nature of the eruptions from 2011-2013, and covers renewed activity during January 2015 through July 2017.
Summary of activity during 2011-2013. Activity during 2011 (figure 17) began with a continuation of the intermittent ash emissions and thermal anomalies that persisted throughout 2010 (BGVN 36:01). Ash plumes during January and February 2011 were reported at typical altitudes between 6 and 8 km; thermal alerts appeared once each during January and March. No activity was reported after 2 March until a new series of thermal alerts began more than 3 months later on 6 June 2011; they were intermittent from then through 19 September 2012, with reports occurring during 1-4 days of all but three months. Ash emissions were also intermittent during this time, with VAAC reports issued during eight of the months from 2 August 2011-28 July 2012 for plumes reported at altitudes of 6-8 km. They also generally occurred during 1-4 days of the month. A four-month break in activity followed until ash plumes were reported on 25 January 2013; they were intermittent until 24 May 2013. MODVOLC thermal anomalies were also reported during this time, on 2 February, 25 March, and 3-4 May.
Summary of activity during January 2015-July 2017. After 19 months of quiet from June 2013 through December 2014, an ash plume reported on 19 January 2015 marked the beginning of a new eruptive episode that included ash plumes, lava flows, and block avalanches between 19 January and 7 April 2015. The next reported activity included both ash emissions and thermal anomalies observed almost a year later on 25 March 2016, although IG had reported increases in seismicity during the previous two weeks. Ash emissions and thermal anomalies were intermittent through 16 July 2016. There was a single thermal anomaly seen in MIROVA data on about 10 October and a brief ash emission occurred during 16-17 November 2016, after which Sangay was quiet until a new episode started on 20 July 2017 that was ongoing into August.
Activity during January-April 2015. After a 19-month period of no reported activity (since May 2013), ash emissions were again seen beginning on 18 January 2015 when an ash plume rose to 6.4 km altitude and drifted SW. Additional plumes on 25 January and 4 February rose to 7.3 km and 6.7 km, respectively, and drifted less than 20 km SW (figure 18). Ash plumes primarily observed by pilots between 27 February and 16 March were generally not visible in satellite images due to weather clouds. During this episode, MODVOLC thermal alerts were reported on 26 January; 7, 21, 23 and 27 February; 2,4,18, and 27 March; and 1, 3, and 7 April.
In a March 2015 report, IG noted that new lava flows and block-avalanche deposits had been emplaced during January and February 2015. The lava flows descended the SE flank about 900 m (figure 19). Two areas of deposits from block avalanches and ashfall extended 2.5 km ESE from the lava front, and 1.5 km down the S flank. According to IG, there were 21 thermal anomalies identified in MIROVA during 31 January-25 February 2015.
Activity during March-November 2016. IG reported an increase in seismicity on 5 March 2016, after ten months of no reported activity. An explosion signal was followed by harmonic tremor on 9 March, and IG noted that both a thermal anomaly and an emission drifting S were identified in NOAA satellite images. They inferred that increased seismic "explosion" signals on 14 March were indicative of ash-and-gas emissions, although weather clouds prohibited visual confirmation. Ash emissions rising to 6.1 km altitude were first reported by the Guayaquil MWO on 25 March 2016; they noted two more emissions on 27 and 28 March rising to similar altitudes (7.6 and 6.4 km, respectively), but cloudy weather prevented satellite confirmation. Plumes reported on nine days during April rose to similar altitudes (ranging from 5.5-7 km) and extended 18-30 km N or NW from the summit. A series of daily emissions occurred from 30 April-7 May. The emissions included a plume on 2 May that extended 120 km NW, and one on 6 May that rose to 8.2 km altitude and extended approximately 55 km SW before dissipating. Ash-bearing plumes were reported on 10 more days during the rest of May.
Although no more ash plumes were reported until 16 July 2016, MODVOLC thermal alerts were persistent every month beginning on 25 March and lasting through 5 July (see figure 17 above). The MIROVA data for this period also clearly show persistent thermal anomalies (figure 20). A short-lived eruption event during 16-17 November 2016 consisted of an ash emission that rose to 6.1 km altitude and drifted as far as 290 km SE.
Activity beginning July 2017. A new eruptive episode began on 20 July 2017, after eight months without major surface activity. Low-energy ash emissions rising to 3 km above the crater, incandescent block avalanches on the ESE flank (figure 21), and a possible new lava flow were reported by IG. The Washington VAAC reported an ash emission on 20 July rising to 8.2 km altitude and drifting about 80 km W. A plume was reported on 1 August by the Guyaquil MWO but obscured by clouds in satellite images, and a plume on 2 August was seen in webcam images (figure 22).
Geologic Background. The isolated Sangay volcano, located east of the Andean crest, is the southernmost of Ecuador's volcanoes and its most active. The steep-sided, glacier-covered, dominantly andesitic volcano grew within the open calderas of two previous edifices which were destroyed by collapse to the east, producing large debris avalanches that reached the Amazonian lowlands. The modern edifice dates back to at least 14,000 years ago. It towers above the tropical jungle on the east side; on the other sides flat plains of ash have been eroded by heavy rains into steep-walled canyons up to 600 m deep. The earliest report of an eruption was in 1628. Almost continuous eruptions were reported from 1728 until 1916, and again from 1934 to the present. The almost constant activity has caused frequent changes to the morphology of the summit crater complex.
Information Contacts: Instituto Geofísico (IG), Escuela Politécnica Nacional, Casilla 17-01-2759, Quito, Ecuador (URL: http://www.igepn.edu.ec/); Washington Volcanic Ash Advisory Center (VAAC), Satellite Analysis Branch (SAB), NOAA/NESDIS OSPO, NOAA Science Center Room 401, 5200 Auth Rd, Camp Springs, MD 20746, USA (URL: http://www.ospo.noaa.gov/Products/atmosphere/vaac/, archive at: http://www.ssd.noaa.gov/VAAC/archive.html); Hawai'i Institute of Geophysics and Planetology (HIGP), MODVOLC Thermal Alerts System, School of Ocean and Earth Science and Technology (SOEST), Univ. of Hawai'i, 2525 Correa Road, Honolulu, HI 96822, USA (URL: http://modis.higp.hawaii.edu/); MIROVA (Middle InfraRed Observation of Volcanic Activity), a collaborative project between the Universities of Turin and Florence (Italy) supported by the Centre for Volcanic Risk of the Italian Civil Protection Department (URL: http://www.mirovaweb.it/).
Sheveluch (Russia) — August 2017 Cite this Report
Sheveluch
Russia
56.653°N, 161.36°E; summit elev. 3283 m
All times are local (unless otherwise noted)
Ash explosions, pyroclastic flows, and lava dome growth continues through July 2017
An eruption at Sheveluch has been ongoing since 1999, and recent activity there was previously described through February 2016 (BGVN 42:03). During March 2016-July 2017, the same type of activity prevailed as before, consisting of lava dome growth, explosions, and pyroclastic flows. The following data comes from Kamchatka Volcanic Eruption Response Team (KVERT) reports. During this period the Aviation Color Code (ACC) remained at Orange (the second highest level on a four-color scale), except for a brief period on 10 December 2016 and brief periods during May-July 2017 when it was Red (highest level).
Activity during March 2016-April 2017. According to KVERT, ongoing activity during March 2016-April 2017 consisted of lava-dome extrusion onto the N flank accompanied by strong fumarolic activity, dome incandescence, ash explosions, and hot avalanches. Satellite images detected an intense daily thermal anomaly over the dome.
On 18 September 2016, a moderate explosion caused dome collapse and 10-km-long pyroclastic flows. Pyroclastic-flow deposits were noted in the Baydarnaya (also spelled Baidarnaya) River valley to the SSW and in the central part of the S flank.
Ash plumes generated by explosions and re-suspended ash usually occurred several times per month, and generally reached altitudes of 4.5-7 km. On 10 December 2016, explosions generated ash plumes observed in satellite images that rose to altitudes of 10-11 km and drifted 910 km NNE. The ACC was raised to Red. By the following day, no further ash emissions were observed, and the ACC was lowered back to Orange. However, explosions continued in December that sent ash plumes as high as 7 km altitude (figure 42). Typical activity continued through the first few months of 2017, including ash explosions sending plumes to as high as 5-6 km altitude (figure 43) that remained visible in satellite imagery 100 km downwind.
Activity during May-July 2017. Beginning In May 2017, explosive activity appeared to intensify. Strong explosions on 12 May 2017 generated ash plumes identified in satellite images that rose to altitudes of 9-10 km, spread 70 km wide, and drifted 115 km NW. The ACC was raised to Red. Pyroclastic flows descended the flanks and produced ash plumes that rose 3.5-4 km and drifted NE. A few hours later, satellite images showed a thermal anomaly but no ash emissions, and the ACC was lowered back to Orange.
According to KVERT, after a series of explosions during 13-14 May (figure 44), powerful explosions on 16 May generated ash plumes that rose 8-11 km in altitude, prompting an increase of the ACC to Red. Pyroclastic flows descended the S flank, producing ash plumes that rose 3.5-4 km in altitude (figure 43) and drifted NE; within a few hours, satellite images did not show any ash emissions; the ACC was lowered to Orange.
Additional explosions occurred 18 May. During 23-25 May 2017 powerful explosions generated ash plumes that rose to an altitude of 8 km and drifted 715 km in different directions. On 25 May, at 0830, explosions generated ash plumes that rose to an altitude of 9-10 km and drifted 16 km NE. The ACC was raised briefly to Red. Within the next 90 minutes, the ash plume was identified in satellite images drifting 82 km ENE. Strong steam-and-gas emissions rose from the lava dome. The ACC was lowered back to Orange.
KVERT reported that during the last week of May and first half of June, powerful explosions generated ash plumes that rose 8 km in altitude and drifted 550-1,554 km in various directions. Pyroclastic flows traveled 10 km. Ashfall was reported in Klyuchi Village (50 km SW) on 8 June.
On 15 June, at 0425, powerful explosions generated ash plumes that rose as high as 12 km altitude (figure 45). The ACC was raised to Red, and then back down to Orange by the end of the day. Ash plumes drifted 1,000 km NE and SW during 15-16 June. Ash fell in Klyuchi (50 km SW), Maiskoe, Kozyrevsk (115 km SW), and Atlasovo (160 km SW).
According to KVERT, explosions on 17, 18, and 27 June generated ash plumes that rose as high as 7-10 km altitude and drifted as far as 1,500 km. Explosions on 2 July sent ash plumes to 10-11 km; one plume drifted 1,050 km SW and another drifted 350 km NE. On 23 July, strong explosions generated ash plumes that sailed up to 11-12 km and drifted 1,400 km E. Explosive activity the next day lasted about 8 hours and generated ash plumes that rose 11.5-12 km in altitude and drifted almost 700 km NE and 1,400 km E. Strong pyroclastic flows were also noted. The ACC was raised to Red. Later that day, only steam-and-gas emissions with a small amount of ash was observed, and the ACC was lowered to Orange.
Thermal anomalies. Thermal anomalies based on MODIS satellite instruments analyzed using the MODVOLC algorithm were frequent during the current reporting period. From 1 March to 31 August 2016 thermal anomalies were detected 11-20 days each month. The number of days each month with anomalies was lower during 1 September 2016 to 30 July 2017 (except for October with 13 days), ranging from 3 days in April and May 2017 to 10 days in March. Only one hotspot was recorded in July 2017. The MIROVA system detected numerous hotspots every month during August 2016-July 2017, most of which were about 5 km or less from the summit with very low power signatures.
Geologic Background. The high, isolated massif of Sheveluch volcano (also spelled Shiveluch) rises above the lowlands NNE of the Kliuchevskaya volcano group. The 1,300 km3 andesitic volcano is one of Kamchatka's largest and most active volcanic structures, with at least 60 large eruptions during the Holocene. The summit of roughly 65,000-year-old Stary Shiveluch is truncated by a broad 9-km-wide late-Pleistocene caldera breached to the south. Many lava domes occur on its outer flanks. The Molodoy Shiveluch lava dome complex was constructed during the Holocene within the large open caldera; Holocene lava dome extrusion also took place on the flanks of Stary Shiveluch. Widespread tephra layers from these eruptions have provided valuable time markers for dating volcanic events in Kamchatka. Frequent collapses of dome complexes, most recently in 1964, have produced debris avalanches whose deposits cover much of the floor of the breached caldera.
Information Contacts: Kamchatka Volcanic Eruptions Response Team (KVERT), Far East Division, Russian Academy of Sciences, 9 Piip Blvd., Petropavlovsk-Kamchatsky, 683006, Russia (URL: http://www.kscnet.ru/ivs/kvert/); Institute of Volcanology and Seismology, Far Eastern Branch, Russian Academy of Sciences (IVS FEB RAS), 9 Piip Blvd., Petropavlovsk-Kamchatsky 683006, Russia (URL: http://www.kscnet.ru/ivs/eng/); Hawai'i Institute of Geophysics and Planetology (HIGP) - MODVOLC Thermal Alerts System, School of Ocean and Earth Science and Technology (SOEST), Univ. of Hawai'i, 2525 Correa Road, Honolulu, HI 96822, USA (URL: http://modis.higp.hawaii.edu/); MIROVA (Middle InfraRed Observation of Volcanic Activity), a collaborative project between the Universities of Turin and Florence (Italy) supported by the Centre for Volcanic Risk of the Italian Civil Protection Department (URL: http://www.mirovaweb.it/).
Tungurahua (Ecuador) — August 2017 Cite this Report
Tungurahua
Ecuador
1.467°S, 78.442°W; summit elev. 5023 m
All times are local (unless otherwise noted)
Eruptive episode during April-May 2015, persistent ash emissions and many lahars
Abundant ash emissions, Strombolian activity, pyroclastic flows, lahars, and a few lava flows have all been documented at Tungurahua, which lies in the center of Ecuador. Historical observations are recorded back to 1557, and radiocarbon dates are as old as 7750 BCE. Prior to renewed activity in 1999, the last major eruption had occurred during 1916-1918. Since 1999, there have been numerous eruptive episodes, but only a few with breaks in activity longer than three months. Eight distinct episodes of activity occurred from November 2011 through December 2014 that included 10-km-high ash plumes, Strombolian activity, pyroclastic flows, lahars and a lava flow (BGVN 42:05).
Another eruptive episode during April and May 2015 is described below based on information provided by the Observatorio del Volcán Tungurahua (OVT) of the Instituto Geofísico (IG-EPN) of Ecuador, and aviation alerts from the Washington Volcanic Ash Advisory Center (VAAC). Seismic activity increased after a few months of quiet in late February 2015. A new eruptive episode began on 6 April with tremors and ash emissions, which persisted for the next two weeks. Activity tapered off at the end of April. Intermittent ash emissions and ashfall were observed during May. Rainfall led to numerous lahars every month from January through June, many in drainages on the W flank; some were large enough to disrupt travel on local roads.
Activity during January-March 2015. Tungurahua remained quiet during January 2015, although weather conditions prevented visual monitoring for much of the month. Intermittent gas emissions reached 300 m above the crater a few times. Several hundred millimeters of rain during the second week led to numerous lahars on 9 January that descended the Ulba, Vazcún, Juive, Hacienda, Achupashal, Pingullo, Chontapamba, Romero and Rea quebradas (ravines). Most of the lahars consisted of only muddy water, but three carried debris up to 30 cm in diameter in flows several feet wide, moving material at several cubic meters per second (Palmahurco (Juive), Achupashal, and Rea quebradas). During the last week of January, incandescence was noted at the crater on clear nights.
A lahar on 1 February 2015 in the Yuibug sector, reported by an observer in Bilbao, briefly closed the Penipe-Baños road. Clearer weather at the summit in early February revealed weak gas emissions rising to 500 m above the summit crater. IG reported a gradual increase in seismicity beginning on 16 February 2015. They noted an increase in the number of long-period (LP) earthquakes associated with fluid movement near the summit. They also recorded constant inflation since the beginning of January, with an increase in the rate of inflation of the N flank during February. A small explosion was reported on 18 February, but no other surface changes were observed. The Washington VAAC issued a report of a small burst of possible ash and gas seen by the volcano observatory (OVT) mid-day on 24 February at 5.2 km altitude drifting slowly W.
Observatorio del Volcan Tungurahua (OVT) personnel noted steam and gas emissions during 3-5 March 2015 rising 200-500 m above the crater, but no ash was reported. Rainfall led to a lahar on 23 March that carried 30-cm-diameter blocks down the Quebrada de Juive. Seismic activity fluctuated throughout March. After several months of inflation, a sudden change to deflational deformation began on 26 March, as recorded at the RETU station near the summit crater.
Activity during April-June 2015. Moderate amplitude tremors began during the early morning of 6 April 2015; nearby residents reported noises from the volcano starting around 0730 local time, and minor ashfall was reported in Chacauco, Manzano, and Punzupal Alto. Residents of Palitahua reported a gray ash plume drifting W up to 2 km above the crater (figure 81). The seismic events recorded during the following days were all located at depths of 1-6 km, directly under the crater. Ashfall was reported from 6 to 9 April SW and W of the volcano, primarily in the Choglontus sector. On 8 April, ashfall was reported in Manzano, Choglontus, Bilbao, Chacauco, Pillate, and Quero, with accumulation rates of 135-200 grams per square meter per day (g/m2/day). Ashfall increased in Choglontus, reaching 1000 g/m2 during 8 and 9 April. Inflation was again observed at the RETU station beginning on 5 April.
The webcam revealed continuous emissions of ash beginning on 6 April 2015. A plume was reported at 6.1 km altitude moving W until the following day. On 8 April OVT reported dense ash emissions to 5.9 km altitude, drifting NW. Weather clouds prevented observation in satellite imagery during these days. Local aircraft indicated ash present at 6.7 km altitude on 9 April in spite of extensive weather clouds. A swarm of "drumbeat" LP earthquakes on 10-11 April was followed by moderate ash emissions on 12 April. On 11 April, IG reported an ash cloud moving W and NW from the summit at 5.5 km altitude. An emission on 14 April with moderate amounts of ash rose 500 m above the summit and drifted WSW (figure 82).
An explosion on 15 April generated an ash plume that reached 3 km above the summit crater (figure 83). Later in the day ash emissions rose to 2 km above the crater and drifted W. The Washington VAAC reported a continuous ash plume visible in satellite imagery on 15 April moving W from the summit at 6.1 km altitude (1 km above the summit). Although the plume appeared to be almost 100 km long, ashfall reports were limited to areas within 15 km of the summit. Collected ash was mainly composed of dense lithic fragments, euhedral crystals, and oxidized particles, and was not considered juvenile material (from fresh magma). Additional ashfall was reported up through 17 April in Palictahua, El Guanto, El Mirador, El Santuario, Mapayacu, Puela, Chontapamba, and Sabañag.
Ash emissions continued at a lower level of frequency and energy after 17 April 2015 (figure 84), and seismic activity notably decreased. There were minor emissions coincident with seismic tremors that produced gray to black fine-grained ashfall mainly to the W of the volcano in Bilbao and Chontapamba through 27 April. Deformation changed from inflation to deflation beginning on 21 April, but after five days, switched back to inflation on 26 April. Plumes with moderate ash content were observed rising to 1 or 2 km above the summit on clear days. An emission on 28 April contained modest amounts of ash and drifted NW.
Intense rains occurred on 25 and 26 April 2015 that were large enough to generate significant lahars. On 25 April, lahars were reported in the Chontapamba and Romero ravines moving blocks up to 1 m in diameter. Muddy water was observed in the Achupashal ravine. On 26 April, lahars were reported in the Juive, Mapayacu, Romero, and Chontapamba drainages. Lahars caused a high-frequency seismic signal from the Pondoa ravine during the late morning. The flow rates doubled in Vazcún and Puela ravines, which filled with muddy water. A large lahar was also reported in the Quebrada del Pingullo, and debris was reported in the Clementina, Juive Chico, and La Pampa creeks (figure 85).
During the first week of May 2015, constant steam emissions rose 1 km above the summit crater. The vapor was characterized by very low amounts of ash. On 4 May, ashfall was reported in the Bilbao sector, but not corroborated from other areas. Steam with low to moderate ash content continued through 12 May, with plumes rising 1 km above the summit, mostly drifting W and SW. As a result, ash falls were reported in Manzano, Choglontús, Yuibug and Bilbao. On 10 and 11 May, intense and prolonged rains led to significant lahars in Q. Romero, Ingapirca, Chontapamba, Achupashal, and Ulba, and smaller lahars in several other ravines. Small mudflows and lahars also occurred in the ravines on the W flank on 12, 14, and 15 May. Cloudy weather mostly prevented views of the summit, but continuous steam emissions were observed when it cleared. Fine-grained gray ashfall was reported in Choglontus on 15 and 20 May.
Minor emissions of steam with no ash to 500 m above the crater, drifting mostly W, persisted throughout June. Intermittent rains resulted in minor lahars and mudflows that caused little damage. Lahars descended ravines on the W flank on 16 and 17 June. The summit was cloudy and rainy for much of the month, and seismic activity remained low.
Geologic Background. Tungurahua, a steep-sided andesitic-dacitic stratovolcano that towers more than 3 km above its northern base, is one of Ecuador's most active volcanoes. Three major edifices have been sequentially constructed since the mid-Pleistocene over a basement of metamorphic rocks. Tungurahua II was built within the past 14,000 years following the collapse of the initial edifice. Tungurahua II collapsed about 3,000 years ago and produced a large debris-avalanche deposit to the west. The modern glacier-capped stratovolcano (Tungurahua III) was constructed within the landslide scarp. Historical eruptions have all originated from the summit crater, accompanied by strong explosions and sometimes by pyroclastic flows and lava flows that reached populated areas at the volcano's base. Prior to a long-term eruption beginning in 1999 that caused the temporary evacuation of the city of Baños at the foot of the volcano, the last major eruption had occurred from 1916 to 1918, although minor activity continued until 1925.
Information Contacts: Instituto Geofísico (IG), Escuela Politécnica Nacional, Casilla 17-01-2759, Quito, Ecuador (URL: http://www.igepn.edu.ec/); Washington Volcanic Ash Advisory Center (VAAC), Satellite Analysis Branch (SAB), NOAA/NESDIS OSPO, NOAA Science Center Room 401, 5200 Auth Rd, Camp Springs, MD 20746, USA (URL: http://www.ospo.noaa.gov/Products/atmosphere/vaac/, archive at: http://www.ssd.noaa.gov/VAAC/archive.html).