Recently Published Bulletin Reports
Manam (Papua New Guinea) Few ash plumes during November-December 2022
Krakatau (Indonesia) Strombolian activity and ash plumes during November 2022-April 2023
Stromboli (Italy) Strombolian explosions and lava flows continue during January-April 2023
Nishinoshima (Japan) Small ash plumes and fumarolic activity during November 2022 through April 2023
Karangetang (Indonesia) Lava flows, incandescent avalanches, and ash plumes during January-June 2023
Ahyi (United States) Intermittent hydroacoustic signals and discolored plumes during November 2022-June 2023
Kadovar (Papua New Guinea) An ash plume and weak thermal anomaly during May 2023
San Miguel (El Salvador) Small gas-and-ash explosions during March and May 2023
Semisopochnoi (United States) Occasional explosions, ash deposits, and gas-and-steam plumes during December 2022-May 2023
Ebeko (Russia) Continued explosions, ash plumes, and ashfall during October 2022-May 2023
Home Reef (Tonga) Discolored plumes continued during November 2022-April 2023
Ambae (Vanuatu) New lava flow, ash plumes, and sulfur dioxide plumes during February-May 2023
Manam (Papua New Guinea) — July 2023  Cite this Report
Manam
Papua New Guinea
4.08°S, 145.037°E; summit elev. 1807 m
All times are local (unless otherwise noted)
Few ash plumes during November-December 2022
Manam is a 10-km-wide island that consists of two active summit craters: the Main summit crater and the South summit crater and is located 13 km off the northern coast of mainland Papua New Guinea. Frequent mild-to-moderate eruptions have been recorded since 1616. The current eruption period began during June 2014 and has more recently been characterized by intermittent ash plumes and thermal activity (BGVN 47:11). This report updates activity that occurred from November 2022 through May 2023 based on information from the Darwin Volcanic Ash Advisory Center (VAAC) and various satellite data.
Ash plumes were reported during November and December 2022 by the Darwin VAAC. On 7 November an ash plume rose to 2.1 km altitude and drifted NE based on satellite images and weather models. On 14 November an ash plume rose to 2.1 km altitude and drifted W based on RVO webcam images. On 20 November ash plumes rose to 1.8 km altitude and drifted NW. On 26 December an ash plume rose to 3 km altitude and drifted S and SSE.
Intermittent sulfur dioxide plumes were detected using the TROPOMI instrument on the Sentinel-5P satellite, some of which exceeded at least two Dobson Units (DU) and drifted in different directions (figure 93). Occasional low-to-moderate power thermal anomalies were recorded by the MIROVA (Middle InfraRed Observation of Volcanic Activity) system; less than five anomalies were recorded each month during November 2022 through May 2023 (figure 94). Two thermal hotspots were detected by the MODVOLC thermal alerts system on 10 December 2022. On clear weather days, thermal activity was also captured in infrared satellite imagery in both the Main and South summit craters, accompanied by gas-and-steam emissions (figure 95).
Geologic Background. The 10-km-wide island of Manam, lying 13 km off the northern coast of mainland Papua New Guinea, is one of the country's most active volcanoes. Four large radial valleys extend from the unvegetated summit of the conical basaltic-andesitic stratovolcano to its lower flanks. These valleys channel lava flows and pyroclastic avalanches that have sometimes reached the coast. Five small satellitic centers are located near the island's shoreline on the northern, southern, and western sides. Two summit craters are present; both are active, although most observed eruptions have originated from the southern crater, concentrating eruptive products during much of the past century into the SE valley. Frequent eruptions, typically of mild-to-moderate scale, have been recorded since 1616. Occasional larger eruptions have produced pyroclastic flows and lava flows that reached flat-lying coastal areas and entered the sea, sometimes impacting populated areas.
Information Contacts: Rabaul Volcano Observatory (RVO), Geohazards Management Division, Department of Mineral Policy and Geohazards Management (DMPGM), PO Box 3386, Kokopo, East New Britain Province, Papua New Guinea; Darwin Volcanic Ash Advisory Centre (VAAC), Bureau of Meteorology, Northern Territory Regional Office, PO Box 40050, Casuarina, NT 0811, Australia (URL: http://www.bom.gov.au/info/vaac/); MIROVA (Middle InfraRed Observation of Volcanic Activity), a collaborative project between the Universities of Turin and Florence (Italy) supported by the Centre for Volcanic Risk of the Italian Civil Protection Department (URL: http://www.mirovaweb.it/); Hawai'i Institute of Geophysics and Planetology (HIGP) - MODVOLC Thermal Alerts System, School of Ocean and Earth Science and Technology (SOEST), Univ. of Hawai'i, 2525 Correa Road, Honolulu, HI 96822, USA (URL: http://modis.higp.hawaii.edu/); NASA Global Sulfur Dioxide Monitoring Page, Atmospheric Chemistry and Dynamics Laboratory, NASA Goddard Space Flight Center (NASA/GSFC), 8800 Greenbelt Road, Goddard, Maryland, USA (URL: https://so2.gsfc.nasa.gov/); Copernicus Browser, Copernicus Data Space Ecosystem, European Space Agency (URL: https://dataspace.copernicus.eu/browser/).
Krakatau (Indonesia) — July 2023 Cite this Report
Krakatau
Indonesia
6.1009°S, 105.4233°E; summit elev. 285 m
All times are local (unless otherwise noted)
Strombolian activity and ash plumes during November 2022-April 2023
Krakatau is located in the Sunda Strait between Java and Sumatra, Indonesia. Caldera collapse during the catastrophic 1883 eruption destroyed Danan and Perbuwatan cones and left only a remnant of Rakata. The post-collapse cone of Anak Krakatau (Child of Krakatau) was constructed within the 1883 caldera at a point between the former Danan and Perbuwatan cones; it has been the site of frequent eruptions since 1927. The current eruption period began in May 2021 and has recently consisted of explosions, ash plumes, and thermal activity (BGVN 47:11). This report covers activity during November 2022 through April 2023 based on information provided by the Indonesian Center for Volcanology and Geological Hazard Mitigation, referred to as Pusat Vulkanologi dan Mitigasi Bencana Geologi (PVMBG), MAGMA Indonesia, the Darwin Volcanic Ash Advisory Center (VAAC), and several sources of satellite data.
Activity was relatively low during November and December 2022. Daily white gas-and-steam plumes rose 25-100 m above the summit and drifted in different directions. Gray ash plumes rose 200 m above the summit and drifted NE at 1047 and at 2343 on 11 November. On 14 November at 0933 ash plumes rose 300 m above the summit and drifted E. An ash plume was reported at 0935 on 15 December that rose 100 m above the summit and drifted NE. An eruptive event at 1031 later that day generated an ash plume that rose 700 m above the summit and drifted NE. A gray ash plume at 1910 rose 100 m above the summit and drifted E. Incandescent material was ejected above the vent based on an image taken at 1936.
During January 2023 daily white gas-and-steam plumes rose 25-300 m above the summit and drifted in multiple directions. Gray-to-brown ash plumes were reported at 1638 on 3 January, at 1410 and 1509 on 4 January, and at 0013 on 5 January that rose 100-750 m above the summit and drifted NE and E; the gray-to-black ash plume at 1509 on 4 January rose as high as 3 km above the summit and drifted E. Gray ash plumes were recorded at 1754, 2241, and 2325 on 11 January and at 0046 on 12 January and rose 200-300 m above the summit and drifted NE. Toward the end of January, PVMBG reported that activity had intensified; Strombolian activity was visible in webcam images taken at 0041, 0043, and 0450 on 23 January. Multiple gray ash plumes throughout the day rose 200-500 m above the summit and drifted E and SE (figure 135). Webcam images showed progressively intensifying Strombolian activity at 1919, 1958, and 2113 on 24 January; a gray ash plume at 1957 rose 300 m above the summit and drifted E (figure 135). Eruptive events at 0231 and 2256 on 25 January and at 0003 on 26 January ejected incandescent material from the vent, based on webcam images. Gray ash plumes observed during 26-27 January rose 300-500 m above the summit and drifted NE, E, and SE.
Low levels of activity were reported during February and March. Daily white gas-and-steam plumes rose 25-300 m above the summit and drifted in different directions. The Darwin VAAC reported that continuous ash emissions rose to 1.5-1.8 km altitude and drifted W and NW during 1240-1300 on 10 March, based on satellite images, weather models, and PVMBG webcams. White-and-gray ash plumes rose 500 m and 300 m above the summit and drifted SW at 1446 and 1846 on 18 March, respectively. An eruptive event was recorded at 2143, though it was not visible due to darkness. Multiple ash plumes were reported during 27-29 March that rose as high as 2.5 km above the summit and drifted NE, W, and SW (figure 136). Webcam images captured incandescent ejecta above the vent at 0415 and around the summit area at 2003 on 28 March and at 0047 above the vent on 29 March.
Daily white gas-and-steam plumes rose 25-300 m above the summit and drifted in multiple directions during April and May. White-and-gray and black plumes rose 50-300 m above the summit on 2 and 9 April. On 11 May at 1241 a gray ash plume rose 1-3 km above the summit and drifted SW. On 12 May at 0920 a gray ash plume rose 2.5 km above the summit and drifted SW and at 2320 an ash plume rose 1.5 km above the summit and drifted SW. An accompanying webcam image showed incandescent ejecta. On 13 May at 0710 a gray ash plume rose 2 km above the summit and drifted SW (figure 137).
The MIROVA (Middle InfraRed Observation of Volcanic Activity) graph of MODIS thermal anomaly data showed intermittent low-to-moderate power thermal anomalies during November 2022 through April 2023 (figure 138). Some of this thermal activity was also visible in infrared satellite imagery at the crater, accompanied by gas-and-steam and ash plumes that drifted in different directions (figure 139).
Geologic Background. The renowned Krakatau (frequently mis-named as Krakatoa) volcano lies in the Sunda Strait between Java and Sumatra. Collapse of an older edifice, perhaps in 416 or 535 CE, formed a 7-km-wide caldera. Remnants of that volcano are preserved in Verlaten and Lang Islands; subsequently the Rakata, Danan, and Perbuwatan cones were formed, coalescing to create the pre-1883 Krakatau Island. Caldera collapse during the catastrophic 1883 eruption destroyed Danan and Perbuwatan, and left only a remnant of Rakata. This eruption caused more than 36,000 fatalities, most as a result of tsunamis that swept the adjacent coastlines of Sumatra and Java. Pyroclastic surges traveled 40 km across the Sunda Strait and reached the Sumatra coast. After a quiescence of less than a half century, the post-collapse cone of Anak Krakatau (Child of Krakatau) was constructed within the 1883 caldera at a point between the former Danan and Perbuwatan cones. Anak Krakatau has been the site of frequent eruptions since 1927.
Information Contacts: Pusat Vulkanologi dan Mitigasi Bencana Geologi (PVMBG, also known as Indonesian Center for Volcanology and Geological Hazard Mitigation, CVGHM), Jalan Diponegoro 57, Bandung 40122, Indonesia (URL: http://www.vsi.esdm.go.id/); MAGMA Indonesia, Kementerian Energi dan Sumber Daya Mineral (URL: https://magma.esdm.go.id/v1); Darwin Volcanic Ash Advisory Centre (VAAC), Bureau of Meteorology, Northern Territory Regional Office, PO Box 40050, Casuarina, NT 0811, Australia (URL: http://www.bom.gov.au/info/vaac/); MIROVA (Middle InfraRed Observation of Volcanic Activity), a collaborative project between the Universities of Turin and Florence (Italy) supported by the Centre for Volcanic Risk of the Italian Civil Protection Department (URL: http://www.mirovaweb.it/); Copernicus Browser, Copernicus Data Space Ecosystem, European Space Agency (URL: https://dataspace.copernicus.eu/browser/).
Stromboli
Italy
38.789°N, 15.213°E; summit elev. 924 m
All times are local (unless otherwise noted)
Strombolian explosions and lava flows continue during January-April 2023
Stromboli, located in Italy, has exhibited nearly constant lava fountains for the past 2,000 years; recorded eruptions date back to 350 BCE. Eruptive activity occurs at the summit from multiple vents, which include a north crater area (N area) and a central-southern crater (CS area) on a terrace known as the ‘terrazza craterica’ at the head of the Sciara del Fuoco, a large scarp that runs from the summit down the NW side of the volcano-island. Activity typically consists of Strombolian explosions, incandescent ejecta, lava flows, and pyroclastic flows. Thermal and visual monitoring cameras are located on the nearby Pizzo Sopra La Fossa, above the terrazza craterica, and at multiple flank locations. The current eruption period has been ongoing since 1934 and recent activity has consisted of frequent Strombolian explosions and lava flows (BGVN 48:02). This report updates activity during January through April 2023 primarily characterized by Strombolian explosions and lava flows based on reports from Italy's Istituto Nazionale di Geofisica e Vulcanologia (INGV) and various satellite data.
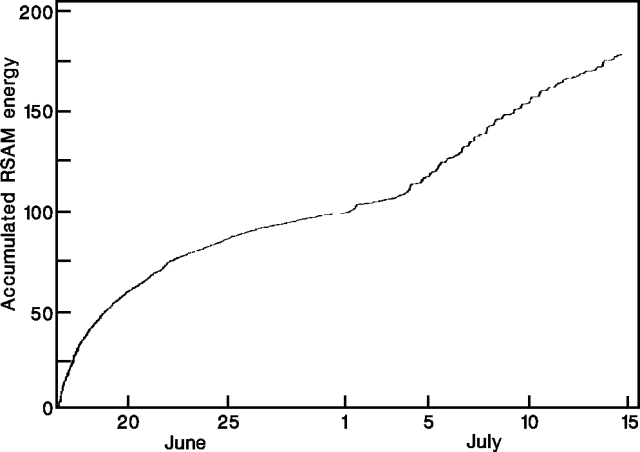
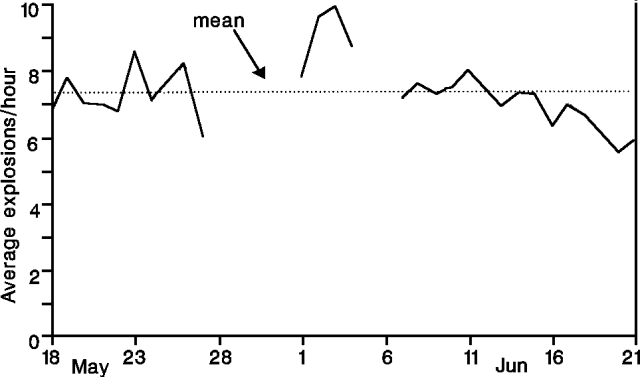
Frequent explosive activity continued throughout the reporting period, generally in the low-to-medium range, based on the number of hourly explosions in the summit crater (figure 253, table 16). Intermittent thermal activity was recorded by the MIROVA (Middle InfraRed Observation of Volcanic Activity) analysis of MODIS satellite data (figure 254). According to data collected by the MODVOLC thermal algorithm, a total of 9 thermal alerts were detected: one on 2 January 2023, one on 1 February, five on 24 March, and two on 26 March. The stronger pulses of thermal activity likely reflected lava flow events. Infrared satellite imagery captured relatively strong thermal hotspots at the two active summit craters on clear weather days, showing an especially strong event on 8 March (figure 255).
Table 16. Summary of type, frequency, and intensity of explosive activity at Stromboli by month during January-April 2023; information from webcam observations. Courtesy of INGV weekly reports.
| Month |
Explosive Activity |
| Jan 2023 |
Typical Strombolian activity with spattering and lava overflows in the N crater area. Explosions were reported from 4 vents in the N area and 1-2 vents in the CS area. The average hourly frequency of explosions was low-to-medium (1-12 events/hour). The intensity of the explosions varied from low (less than 80 m high) to medium (less than 150 m high) in the N crater area and up to high (greater than 150 m high) in the CS crater area. |
| Feb 2023 |
Typical Strombolian activity with spattering in the N crater area. Explosions were reported from 2-3 vents in the N area and 1-4 vents in the CS area. The average hourly frequency of explosions was low-to-medium (1-14 events/hour). The intensity of the explosions varied from low (less than 80 m high) to medium (less than 150 m high) in the N crater area and up to high (greater than 150 m high) in the CS crater area. |
| Mar 2023 |
Typical Strombolian activity with spattering and lava overflows in the N crater area. Explosions were reported from 2-3 vents in the N area and 2-4 vents in the CS area. The average hourly frequency of explosions was low-to-medium (1-18 events/hour). The intensity of the explosions varied from low (less than 80 m high) to medium (less than 150 m high) in the N crater area and up to high (greater than 150 m high) in the CS crater area. |
| Apr 2023 |
Typical Strombolian activity. Explosions were reported from 2 vents in the N area and 2-3 vents in the CS area. The average hourly frequency of explosions was low-to-high (1-16 events/hour). The intensity of the explosions varied from low (less than 80 m high) to medium (less than 150 m high) in both the N and CS crater areas. |
Activity during January-February 2023. Strombolian explosions were reported in the N crater area, as well as lava effusion. Explosive activity in the N crater area ejected coarse material (bombs and lapilli). Intense spattering was observed in both the N1 and N2 craters. In the CS crater area, explosions generally ejected fine material (ash), sometimes to heights greater than 250 m. The intensity of the explosions was characterized as low-to-medium in the N crater and medium-to-high in the CS crater. After intense spattering activity from the N crater area, a lava overflow began at 2136 on 2 January that flowed part way down the Sciara del Fuoco, possibly moving down the drainage that formed in October, out of view from webcams. The flow remained active for a couple of hours before stopping and beginning to cool. A second lava flow was reported at 0224 on 4 January that similarly remained active for a few hours before stopping and cooling. Intense spattering was observed on 11 and 13 January from the N1 crater. After intense spattering activity at the N2 crater at 1052 on 17 January another lava flow started to flow into the upper part of the Sciara del Fuoco (figure 256), dividing into two: one that traveled in the direction of the drainage formed in October, and the other one moving parallel to the point of emission. By the afternoon, the rate of the flow began to decrease, and at 1900 it started to cool. A lava flow was reported at 1519 on 24 January following intense spattering in the N2 area, which began to flow into the upper part of the Sciara del Fuoco. By the morning of 25 January, the lava flow had begun to cool. During 27 January the frequency of eruption in the CS crater area increased to 6-7 events/hour compared to the typical 1-7 events/hour; the following two days showed a decrease in frequency to less than 1 event/hour. Starting at 1007 on 30 January a high-energy explosive sequence was produced by vents in the CS crater area. The sequence began with an initial energetic pulse that lasted 45 seconds, ejecting predominantly coarse products 300 m above the crater that fell in an ESE direction. Subsequent and less intense explosions ejected material 100 m above the crater. The total duration of this event lasted approximately two minutes. During 31 January through 6, 13, and 24 February spattering activity was particularly intense for short periods in the N2 crater.
An explosive sequence was reported on 16 February that was characterized by a major explosion in the CS crater area (figure 257). The sequence began at 1817 near the S2 crater that ejected material radially. A few seconds later, lava fountains were observed in the central part of the crater. Three explosions of medium intensity (material was ejected less than 150 m high) were recorded at the S2 crater. The first part of this sequence lasted approximately one minute, according to INGV, and material rose 300 m above the crater and then was deposited along the Sciara del Fuoco. The second phase began at 1818 at the S1 crater; it lasted seven seconds and material was ejected 150 m above the crater. Another event 20 seconds later lasted 12 seconds, also ejecting material 150 m above the crater. The sequence ended with at least three explosions of mostly fine material from the S1 crater. The total duration of this sequence was about two minutes.
Short, intense spattering activity was noted above the N1 crater on 27 and 28 February. A lava overflow was first reported at 0657 from the N2 crater on 27 February that flowed into the October 2022 drainage. By 1900 the flow had stopped. A second lava overflow also in the N crater area occurred at 2149, which overlapped the first flow and then stopped by 0150 on 28 February. Material detached from both the lava overflows rolled down the Sciara del Fuoco, some of which was visible in webcam images.
Activity during March-April 2023. Strombolian activity continued with spattering activity and lava overflows in the N crater area during March. Explosive activity at the N crater area varied from low (less than 80 m high) to medium (less than 150 m high) and ejected coarse material, such as bombs and lapilli. Spattering was observed above the N1 crater, while explosive activity at the CS crater area varied from medium to high (greater than 150 m high) and ejected coarse material. Intense spattering activity was observed for short periods on 6 March above the N1 crater. At approximately 0610 a lava overflow was reported around the N2 crater on 8 March, which then flowed into the October 2022 drainage. By 1700 the flow started to cool. A second overflow began at 1712 on 9 March and overlapped the previous flow. It had stopped by 2100. Material from both flows was deposited along the Sciara del Fuoco, though much of the activity was not visible in webcam images. On 11 March a lava overflow was observed at 0215 that overlapped the two previous flows in the October 2022 drainage. By late afternoon on 12 March, it had stopped.
During a field excursion on 16 March, scientists noted that a vent in the central crater area was degassing. Another vent showed occasional Strombolian activity that emitted ash and lapilli. During 1200-1430 low-to-medium intense activity was reported; the N1 crater emitted ash emissions and the N2 crater emitted both ash and coarse material. Some explosions also occurred in the CS crater area that ejected coarse material. The C crater in the CS crater area occasionally showed gas jetting and low intensity explosions on 17 and 22 March; no activity was observed at the S1 crater. Intense, longer periods of spattering were reported in the N1 crater on 19, 24, and 25 March. Around 2242 on 23 March a lava overflow began from the N1 crater that, after about an hour, began moving down the October 2022 drainage and flow along the Sciara del Fuoco (figure 258). Between 0200 and 0400 on 26 March the flow rate increased, which generated avalanches of material from collapses at the advancing flow front. By early afternoon, the flow began to cool. On 25 March at 1548 an explosive sequence began from one of the vents at S2 in the CS crater area (figure 258). Fine ash mixed with coarse material was ejected 300 m above the crater rim and drifted SSE. Some modest explosions around Vent C were detected at 1549 on 25 March, which included an explosion at 1551 that ejected coarse material. The entire explosive sequence lasted approximately three minutes.
During April explosions persisted in both the N and CS crater areas. Fine material was ejected less than 80 m above the N crater rim until 6 April, followed by ejection of coarser material. Fine material was also ejected less than 80 m above the CS crater rim. The C and S2 crater did not show significant eruptive activity. On 7 April an explosive sequence was detected in the CS crater area at 1203 (figure 259). The first explosion lasted approximately 18 seconds and ejected material 400 m above the crater rim, depositing pyroclastic material in the upper part of the Sciara del Fuoco. At 1204 a second, less intense explosion lasted approximately four seconds and deposited pyroclastic products outside the crater area and near Pizzo Sopra La Fossa. A third explosion at 1205 was mainly composed of ash that rose about 150 m above the crater and lasted roughly 20 seconds. A fourth explosion occurred at 1205 about 28 seconds after the third explosion and ejected a mixture of coarse and fine material about 200 m above the crater; the explosion lasted roughly seven seconds. Overall, the entire explosive sequence lasted about two minutes and 20 seconds. After the explosive sequence on 7 April, explosions in both the N and CS crater areas ejected material as high as 150 m above the crater.
On 21 April research scientists from INGV made field observations in the summit area of Stromboli, and some lapilli samples were collected. In the N crater area near the N1 crater, a small cone was observed with at least two active vents, one of which was characterized by Strombolian explosions. The other vent produced explosions that ejected ash and chunks of cooled lava. At the N2 crater at least one vent was active and frequently emitted ash. In the CS crater area, a small cone contained 2-3 degassing vents and a smaller, possible fissure area also showed signs of degassing close to the Pizzo Sopra La Fossa. In the S part of the crater, three vents were active: a small hornito was characterized by modest and rare explosions, a vent that intermittently produced weak Strombolian explosions, and a vent at the end of the terrace that produced frequent ash emissions. Near the S1 crater there was a hornito that generally emitted weak gas-and-steam emissions, sometimes associated with “gas rings”. On 22 April another field inspection was carried out that reported two large sliding surfaces on the Sciara del Fuoco that showed where blocks frequently descended toward the sea. A thermal anomaly was detected at 0150 on 29 April.
Geologic Background. Spectacular incandescent nighttime explosions at Stromboli have long attracted visitors to the "Lighthouse of the Mediterranean" in the NE Aeolian Islands. This volcano has lent its name to the frequent mild explosive activity that has characterized its eruptions throughout much of historical time. The small island is the emergent summit of a volcano that grew in two main eruptive cycles, the last of which formed the western portion of the island. The Neostromboli eruptive period took place between about 13,000 and 5,000 years ago. The active summit vents are located at the head of the Sciara del Fuoco, a prominent scarp that formed about 5,000 years ago due to a series of slope failures which extends to below sea level. The modern volcano has been constructed within this scarp, which funnels pyroclastic ejecta and lava flows to the NW. Essentially continuous mild Strombolian explosions, sometimes accompanied by lava flows, have been recorded for more than a millennium.
Information Contacts: Istituto Nazionale di Geofisica e Vulcanologia (INGV), Sezione di Catania, Piazza Roma 2, 95123 Catania, Italy, (URL: http://www.ct.ingv.it/en/); MIROVA (Middle InfraRed Observation of Volcanic Activity), a collaborative project between the Universities of Turin and Florence (Italy) supported by the Centre for Volcanic Risk of the Italian Civil Protection Department (URL: http://www.mirovaweb.it/); Hawai'i Institute of Geophysics and Planetology (HIGP) - MODVOLC Thermal Alerts System, School of Ocean and Earth Science and Technology (SOEST), Univ. of Hawai'i, 2525 Correa Road, Honolulu, HI 96822, USA (URL: http://modis.higp.hawaii.edu/); Copernicus Browser, Copernicus Data Space Ecosystem, European Space Agency (URL: https://dataspace.copernicus.eu/browser/).
Nishinoshima (Japan) — July 2023 Cite this Report
Nishinoshima
Japan
27.247°N, 140.874°E; summit elev. 100 m
All times are local (unless otherwise noted)
Small ash plumes and fumarolic activity during November 2022 through April 2023
Nishinoshima is a small island located about 1,000 km S of Tokyo in the Ogasawara Arc in Japan. The island is the summit of a massive submarine volcano that has prominent peaks to the S, W, and NE. Eruptions date back to 1973; the most recent eruption period began in October 2022 and was characterized by ash plumes and fumarolic activity (BGVN 47:12). This report describes ash plumes and fumarolic activity during November 2022 through April 2023 based on monthly reports from the Japan Meteorological Agency (JMA) monthly reports and satellite data.
The most recent eruptive activity prior to the reporting internal occurred on 12 October 2022, when an ash plume rose 3.5 km above the crater rim. An aerial observation conducted by the Japan Coast Guard (JCG) on 25 November reported that white fumaroles rose approximately 200 m above the central crater of a pyroclastic cone (figure 119), and multiple plumes were observed on the ESE flank of the cone. Discolored water ranging from reddish-brown to brown and yellowish-green were visible around the perimeter of the island (figure 119). No significant activity was reported in December.
During an overflight conducted by JCG on 25 January 2023 intermittent activity and small, blackish-gray plumes rose 900 m above the central part of the crater were observed (figure 120). The fumarolic zone of the E flank and base of the cone had expanded and emissions had intensified. Dark brown discolored water was visible around the perimeter of the island.
No significant activity was reported during February through March. Ash plumes at 1050 and 1420 on 11 April rose 1.9 km above the crater rim and drifted NW and N. These were the first ash plumes observed since 12 October 2022. On 14 April JCG carried out an overflight and reported that no further eruptive activity was visible, although white gas-and-steam plumes were visible from the central crater and rose 900 m high (figure 121). Brownish and yellow-green discolored water surrounded the island.
Intermittent low-to-moderate power thermal anomalies were recorded in the MIROVA graph (Middle InfraRed Observation of Volcanic Activity) during November 2022 through April 2023 (figure 123). A cluster of six to eight anomalies were detected during November while a smaller number were detected during the following months: two to three during December, one during mid-January 2023, one during February, five during March, and two during April. Thermal activity was also reflected in infrared satellite data at the summit crater, accompanied by occasional gas-and-steam plumes (figure 124).
Geologic Background. The small island of Nishinoshima was enlarged when several new islands coalesced during an eruption in 1973-74. Multiple eruptions that began in 2013 completely covered the previous exposed surface and continued to enlarge the island. The island is the summit of a massive submarine volcano that has prominent peaks to the S, W, and NE. The summit of the southern cone rises to within 214 m of the ocean surface 9 km SSE.
Information Contacts: Japan Meteorological Agency (JMA), 1-3-4 Otemachi, Chiyoda-ku, Tokyo 100-8122, Japan (URL: http://www.jma.go.jp/jma/indexe.html); MIROVA (Middle InfraRed Observation of Volcanic Activity), a collaborative project between the Universities of Turin and Florence (Italy) supported by the Centre for Volcanic Risk of the Italian Civil Protection Department (URL: http://www.mirovaweb.it/); Copernicus Browser, Copernicus Data Space Ecosystem, European Space Agency (URL: https://dataspace.copernicus.eu/browser/).
Karangetang (Indonesia) — July 2023 Cite this Report
Karangetang
Indonesia
2.781°N, 125.407°E; summit elev. 1797 m
All times are local (unless otherwise noted)
Lava flows, incandescent avalanches, and ash plumes during January-June 2023
Karangetang (also known as Api Siau), at the northern end of the island of Siau, Indonesia, contains five summit craters along a N-S line. More than 40 eruptions have been recorded since 1675; recent eruptions have included frequent explosive activity, sometimes accompanied by pyroclastic flows and lahars. Lava dome growth has occurred in the summit craters and collapses of lava flow fronts have produced pyroclastic flows. The two active summit craters are Kawah Dua (the N crater) and Kawah Utama (the S crater, also referred to as the “Main Crater”). The most recent eruption began in late November 2018 and has more recently consisted of weak thermal activity and gas-and-steam emissions (BGVN 48:01). This report updates activity characterized by lava flows, incandescent avalanches, and ash plumes during January through June 2023 using reports from Pusat Vulkanologi dan Mitigasi Bencana Geologi (PVMBG, also known as CVGHM, or the Center of Volcanology and Geological Hazard Mitigation), MAGMA Indonesia, the Darwin VAAC (Volcano Ash Advisory Center), and satellite data.
Activity during January was relatively low and mainly consisted of white gas-and-steam emissions that rose 25-150 m above Main Crater (S crater) and drifted in different directions. Incandescence was visible from the lava dome in Kawah Dua (the N crater). Weather conditions often prevented clear views of the summit. On 18 January the number of seismic signals that indicated avalanches of material began to increase. In addition, there were a total of 71 earthquakes detected during the month.
Activity continued to increase during the first week of February. Material from Main Crater traveled as far as 800 m down the Batuawang (S) and Batang (W) drainages and as far as 1 km W down the Beha (W) drainage on 4 February. On 6 February 43 earthquake events were recorded, and on 7 February, 62 events were recorded. White gas-and-steam emissions rose 25-250 m above both summit craters throughout the month. PVMBG reported an eruption began during the evening of 8 February around 1700. Photos showed incandescent material at Main Crater. Incandescent material had also descended the flank in at least two unconfirmed directions as far as 2 km from Main Crater, accompanied by ash plumes (figure 60). As a result, PVMBG increased the Volcano Alert Level (VAL) to 3 (the second highest level on a 1-4 scale).
Occasional nighttime webcam images showed three main incandescent lava flows of differing lengths traveling down the S, SW, and W flanks (figure 61). Incandescent rocks were visible on the upper flanks, possibly from ejected or collapsed material from the crater, and incandescence was the most intense at the summit. Based on analyses of satellite imagery and weather models, the Darwin VAAC reported that daily ash plumes during 16-20 February rose to 2.1-3 km altitude and drifted NNE, E, and SE. BNPB reported on 16 February that as many as 77 people were evacuated and relocated to the East Siau Museum. A webcam image taken at 2156 on 17 February possibly showed incandescent material descending the SE flank. Ash plumes rose to 2.1 km altitude and drifted SE during 22-23 February, according to the Darwin VAAC.
Incandescent avalanches of material and summit incandescence at Main Crater continued during March. White gas-and-steam emissions during March generally rose 25-150 m above the summit crater; on 31 March gas-and-steam emissions rose 200-400 m high. An ash plume rose to 2.4 km altitude and drifted S at 1710 on 9 March and a large thermal anomaly was visible in images taken at 0550 and 0930 on 10 March. Incandescent material was visible at the summit and on the flanks based on webcam images taken at 0007 and 2345 on 16 March, at 1828 on 17 March, at 1940 on 18 March, at 2311 on 19 March, and at 2351 on 20 March. Incandescence was most intense on 18 and 20 March and webcam images showed possible Strombolian explosions (figure 62). An ash plume rose to 2.4 km altitude and drifted SW on 18 March, accompanied by a thermal anomaly.
Summit crater incandescence at Main Crater and on the flanks persisted during April. Incandescent material at the S crater and on the flanks was reported at 0016 on 1 April. The lava flows had stopped by 1 April according to PVMBG, although incandescence was still visible up to 10 m high. Seismic signals indicating effusion decreased and by 6 April they were no longer detected. Incandescence was visible from both summit craters. On 26 April the VAL was lowered to 2 (the second lowest level on a 1-4 scale). White gas-and-steam emissions rose 25-200 m above the summit crater.
During May white gas-and-steam emissions generally rose 50-250 m above the summit, though it was often cloudy, which prevented clear views; on 21 May gas-and-steam emissions rose 50-400 m high. Nighttime N summit crater incandescence rose 10-25 m above the lava dome, and less intense incandescence was noted above Main Crater, which reached about 10 m above the dome. Sounds of falling rocks at Main Crater were heard on 15 May and the seismic network recorded 32 rockfall events in the crater on 17 May. Avalanches traveled as far as 1.5 km down the SW and S flanks, accompanied by rumbling sounds on 18 May. Incandescent material descending the flanks was captured in a webcam image at 2025 on 19 May (figure 63) and on 29 May; summit crater incandescence was observed in webcam images at 2332 on 26 May and at 2304 on 29 May. On 19 May the VAL was again raised to 3.
Occasional Main Crater incandescence was reported during June, as well as incandescent material on the flanks. White gas-and-steam emissions rose 10-200 m above the summit crater. Ash plumes rose to 2.1 km altitude and drifted SE and E during 2-4 June, according to the Darwin VAAC. Material on the flanks of Main Crater were observed at 2225 on 7 June, at 2051 on 9 June, at 0007 on 17 June, and at 0440 on 18 June. Webcam images taken on 21, 25, and 27 June showed incandescence at Main Crater and from material on the flanks.
MIROVA (Middle InfraRed Observation of Volcanic Activity) analysis of MODIS satellite data showed strong thermal activity during mid-February through March and mid-May through June, which represented incandescent avalanches and lava flows (figure 64). During April through mid-May the power of the anomalies decreased but frequent anomalies were still detected. Brief gaps in activity occurred during late March through early April and during mid-June. Infrared satellite images showed strong lava flows mainly affecting the SW and S flanks, accompanied by gas-and-steam emissions (figure 65). According to data recorded by the MODVOLC thermal algorithm, there were a total of 79 thermal hotspots detected: 28 during February, 24 during March, one during April, five during May, and 21 during June.
Geologic Background. Karangetang (Api Siau) volcano lies at the northern end of the island of Siau, about 125 km NNE of the NE-most point of Sulawesi. The stratovolcano contains five summit craters along a N-S line. It is one of Indonesia's most active volcanoes, with more than 40 eruptions recorded since 1675 and many additional small eruptions that were not documented (Neumann van Padang, 1951). Twentieth-century eruptions have included frequent explosive activity sometimes accompanied by pyroclastic flows and lahars. Lava dome growth has occurred in the summit craters; collapse of lava flow fronts have produced pyroclastic flows.
Information Contacts: Pusat Vulkanologi dan Mitigasi Bencana Geologi (PVMBG, also known as Indonesian Center for Volcanology and Geological Hazard Mitigation, CVGHM), Jalan Diponegoro 57, Bandung 40122, Indonesia (URL: http://www.vsi.esdm.go.id/); MAGMA Indonesia, Kementerian Energi dan Sumber Daya Mineral (URL: https://magma.esdm.go.id/v1); Badan Nasional Penanggulangan Bencana (BNPB), National Disaster Management Agency, Graha BNPB - Jl. Scout Kav.38, East Jakarta 13120, Indonesia (URL: http://www.bnpb.go.id/); Darwin Volcanic Ash Advisory Centre (VAAC), Bureau of Meteorology, Northern Territory Regional Office, PO Box 40050, Casuarina, NT 0811, Australia (URL: http://www.bom.gov.au/info/vaac/); MIROVA (Middle InfraRed Observation of Volcanic Activity), a collaborative project between the Universities of Turin and Florence (Italy) supported by the Centre for Volcanic Risk of the Italian Civil Protection Department (URL: http://www.mirovaweb.it/); Hawai'i Institute of Geophysics and Planetology (HIGP) - MODVOLC Thermal Alerts System, School of Ocean and Earth Science and Technology (SOEST), Univ. of Hawai'i, 2525 Correa Road, Honolulu, HI 96822, USA (URL: http://modis.higp.hawaii.edu/); Copernicus Browser, Copernicus Data Space Ecosystem, European Space Agency (URL: https://dataspace.copernicus.eu/browser/); IDN Times, Jl. Jend. Gatot Subroto Kav. 27 3rd Floor Kuningan, Jakarta, Indonesia 12950, Status of Karangetang Volcano in Sitaro Islands Increases (URL: https://sulsel.idntimes.com/news/indonesia/savi/status-gunung-api-karangetang-di-kepulauan-sitaro-meningkat?page=all).
Ahyi (United States) — July 2023 Cite this Report
Ahyi
United States
20.42°N, 145.03°E; summit elev. -75 m
All times are local (unless otherwise noted)
Intermittent hydroacoustic signals and discolored plumes during November 2022-June 2023
Ahyi seamount is a large, conical submarine volcano that rises to within 75 m of the ocean surface about 18 km SE of the island of Farallon de Pajaros in the Northern Marianas. The remote location of the seamount has made eruptions difficult to document, but seismic stations installed in the region confirmed an eruption in the vicinity in 2001. No new activity was detected until April-May 2014 when an eruption was detected by NOAA (National Oceanic and Atmospheric Administration) divers, hydroacoustic sensors, and seismic stations (BGVN 42:04). New activity was first detected on 15 November by hydroacoustic sensors that were consistent with submarine volcanic activity. This report covers activity during November 2022 through June 2023 based on daily and weekly reports from the US Geological Survey.
Starting in mid-October, hydroacoustic sensors at Wake Island (2.2 km E) recorded signals consistent with submarine volcanic activity, according to a report from the USGS issued on 15 November 2022. A combined analysis of the hydroacoustic signals and seismic stations located at Guam and Chichijima Island, Japan, suggested that the source of this activity was at or near the Ahyi seamount. After a re-analysis of a satellite image of the area that was captured on 6 November, USGS confirmed that there was no evidence of discoloration at the ocean surface. Few hydroacoustic and seismic signals continued through November, including on 18 November, which USGS suggested signified a decline or pause in unrest. A VONA (Volcano Observatory Notice for Aviation) reported that a discolored water plume was persistently visible in satellite data starting on 18 November (figure 6). Though clouds often obscured clear views of the volcano, another discolored water plume was captured in a satellite image on 26 November. The Aviation Color Code (ACC) was raised to Yellow (the second lowest level on a four-color scale) and the Volcano Alert Level (VAL) was raised to Advisory (the second lowest level on a four-level scale) on 29 November.
During December, occasional detections were recorded on the Wake Island hydrophone sensors and discolored water over the seamount remained visible. During 2-7, 10-12, and 16-31 December possible explosion signals were detected. A small area of discolored water was observed in high-resolution Sentinel-2 satellite images during 1-6 December (figure 7). High-resolution satellite images recorded discolored water plumes on 13 December that originated from the summit region; no observations indicated that activity breached the ocean surface. A possible underwater plume was visible in satellite images on 18 December, and during 19-20 December a definite but diffuse underwater plume located SSE from the main vent was reported. An underwater plume was visible in a satellite image taken on 26 December (figure 7).
Hydrophone sensors continued to detect signals consistent with possible explosions during 1-8 January 2023. USGS reported that the number of detections decreased during 4-5 January. The hydrophone sensors experienced a data outage that started at 0118 on 8 January and continued through 10 January, though according to USGS, possible explosions were recorded prior to the data outage and likely continued during the outage. A discolored water plume originating from the summit region was detected in a partly cloudy satellite image on 8 January. On 11-12 and 15-17 January possible explosion signals were recorded again. One small signal was detected during 22-23 January and several signals were recorded on 25 and 31 January. During 27-31 January a plume of discolored water was observed above the seamount in satellite imagery (figure 8).
Low levels of activity continued during February and March, based on data from pressure sensors on Wake Island. During 1 and 4-6 February activity was reported, and a submarine plume was observed on 4 February (figure 8). Possible explosion signals were detected during 7-8, 10, 13-14, and 24 February. During 1-2 and 3-5 March a plume of discolored water was observed in satellite imagery (figure 8). Almost continuous hydroacoustic signals were detected in remote pressure sensor data on Wake Island 2,270 km E from the volcano during 7-13 March. During 12-13 March water discoloration around the seamount was observed in satellite imagery, despite cloudy weather. By 14 March discolored water extended about 35 km, but no direction was noted. USGS reported that the continuous hydroacoustic signals detected during 13-14 March stopped abruptly on 14 March and no new detections were observed. Three 30 second hydroacoustic detections were reported during 17-19 March, but no activity was visible due to cloudy weather. A data outage was reported during 21-22 March, making pressure sensor data unavailable; a discolored water plume was, however, visible in satellite data. A possible underwater explosion signal was detected by pressure sensors at Wake Island on 26, 29, and 31 March, though the cause and origin of these events were unclear.
Similar low activity continued during April, May, and June. Several signals were detected during 1-3 April in pressure sensors at Wake Island. USGS suggested that these may be related to underwater explosions or earthquakes at the volcano, but no underwater plumes were visible in clear satellite images. The pressure sensors had data outages during 12-13 April and no data were recorded; no underwater plumes were visible in satellite images, although cloudy weather obscured most clear views. Eruptive activity was reported starting at 2210 on 21 May. On 22 May a discolored water plume that extended 4 km was visible in satellite images, though no direction was recorded. During 23-24 May some signals were detected by the underwater pressure sensors. Possible hydroacoustic signals were detected during 2-3 and 6-8 June. Multiple hydroacoustic signals were detected during 9-11 and 16-17 June, although no activity was visible in satellite images. One hydroacoustic signal was detected during 23-24 June, but there was some uncertainty about its association with volcanic activity. A single possible hydroacoustic signal was detected during 30 June to 1 July.
Geologic Background. Ahyi seamount is a large conical submarine volcano that rises to within 75 m of the ocean surface ~18 km SE of the island of Farallon de Pajaros in the northern Marianas. Water discoloration has been observed there, and in 1979 the crew of a fishing boat felt shocks over the summit area, followed by upwelling of sulfur-bearing water. On 24-25 April 2001 an explosive eruption was detected seismically by a station on Rangiroa Atoll, Tuamotu Archipelago. The event was well constrained (+/- 15 km) at a location near the southern base of Ahyi. An eruption in April-May 2014 was detected by NOAA divers, hydroacoustic sensors, and seismic stations.
Information Contacts: US Geological Survey, Volcano Hazards Program (USGS-VHP), 12201 Sunrise Valley Drive, Reston, VA, USA, https://volcanoes.usgs.gov/index.html; Copernicus Browser, Copernicus Data Space Ecosystem, European Space Agency (URL: https://dataspace.copernicus.eu/browser/).
Kadovar (Papua New Guinea) — June 2023 Cite this Report
Kadovar
Papua New Guinea
3.608°S, 144.588°E; summit elev. 365 m
All times are local (unless otherwise noted)
An ash plume and weak thermal anomaly during May 2023
Kadovar is a 2-km-wide island that is the emergent summit of a Bismarck Sea stratovolcano. It lies off the coast of New Guinea, about 25 km N of the mouth of the Sepik River. Prior to an eruption that began in 2018, a lava dome formed the high point of the volcano, filling an arcuate landslide scarp open to the S. Submarine debris-avalanche deposits occur to the S of the island. The current eruption began in January 2018 and has comprised lava effusion from vents at the summit and at the E coast; more recent activity has consisted of ash plumes, weak thermal activity, and gas-and-steam plumes (BGVN 48:02). This report covers activity during February through May 2023 using information from the Darwin Volcanic Ash Advisory Center (VAAC) and satellite data.
Activity during the reporting period was relatively low and mainly consisted of white gas-and-steam plumes that were visible in natural color satellite images on clear weather days (figure 67). According to a Darwin VAAC report, at 2040 on 6 May an ash plume rose to 4.6 km altitude and drifted W; by 2300 the plume had dissipated. MODIS satellite instruments using the MODVOLC thermal algorithm detected a single thermal hotspot on the SE side of the island on 7 May. Weak thermal activity was also detected in a satellite image on the E side of the island on 14 May, accompanied by a white gas-and-steam plume that drifted SE (figure 68).
Geologic Background. The 2-km-wide island of Kadovar is the emergent summit of a Bismarck Sea stratovolcano of Holocene age. It is part of the Schouten Islands, and lies off the coast of New Guinea, about 25 km N of the mouth of the Sepik River. Prior to an eruption that began in 2018, a lava dome formed the high point of the andesitic volcano, filling an arcuate landslide scarp open to the south; submarine debris-avalanche deposits occur in that direction. Thick lava flows with columnar jointing forms low cliffs along the coast. The youthful island lacks fringing or offshore reefs. A period of heightened thermal phenomena took place in 1976. An eruption began in January 2018 that included lava effusion from vents at the summit and at the E coast.
Information Contacts: Darwin Volcanic Ash Advisory Centre (VAAC), Bureau of Meteorology, Northern Territory Regional Office, PO Box 40050, Casuarina, NT 0811, Australia (URL: http://www.bom.gov.au/info/vaac/); Hawai'i Institute of Geophysics and Planetology (HIGP) - MODVOLC Thermal Alerts System, School of Ocean and Earth Science and Technology (SOEST), Univ. of Hawai'i, 2525 Correa Road, Honolulu, HI 96822, USA (URL: http://modis.higp.hawaii.edu/); Copernicus Browser, Copernicus Data Space Ecosystem, European Space Agency (URL: https://dataspace.copernicus.eu/browser/).
San Miguel (El Salvador) — June 2023 Cite this Report
San Miguel
El Salvador
13.434°N, 88.269°W; summit elev. 2130 m
All times are local (unless otherwise noted)
Small gas-and-ash explosions during March and May 2023
San Miguel in El Salvador is a broad, deep crater complex that has been frequently modified by eruptions recorded since the early 16th century and consists of the summit known locally as Chaparrastique. Flank eruptions have produced lava flows that extended to the N, NE, and SE during the 17-19th centuries. The most recent activity has consisted of minor ash eruptions from the summit crater. The current eruption period began in November 2022 and has been characterized by frequent phreatic explosions, gas-and-ash emissions, and sulfur dioxide plumes (BGVN 47:12). This report describes small gas-and-ash explosions during December 2022 through May 2023 based on special reports from the Ministero de Medio Ambiente y Recursos Naturales (MARN).
Activity has been relatively low since the last recorded explosions on 29 November 2022. Seismicity recorded by the San Miguel Volcano Station (VSM) located on the N flank at 1.7 km elevation had decreased by 7 December. Sulfur dioxide gas measurements taken with DOAS (Differential Optical Absorption Spectroscopy) mobile equipment were below typical previously recorded values: 300 tons per day (t/d). During December, small explosions were recorded by the seismic network and manifested as gas-and-steam emissions.
Gas-and-ash explosions in the crater occurred during January 2023, which were recorded by the seismic network. Sulfur dioxide values remained low, between 300-400 t/d through 10 March. At 0817 on 14 January a gas-and-ash emission was visible in webcam images, rising just above the crater rim. Some mornings during February, small gas-and-steam plumes were visible in the crater. On 7 March at 2252 MARN noted an increase in degassing from the central crater; gas emissions were constantly observed through the early morning hours on 8 March. During the early morning of 8 March through the afternoon on 9 March, 12 emissions were registered, some accompanied by ash. The last gas-and-ash emission was recorded at 1210 on 9 March; very fine ashfall was reported in El Tránsito (10 km S), La Morita (6 km W), and La Piedrita (3 km W). The smell of sulfur was reported in Piedra Azul (5 km SW). On 16 March MARN reported that gas-and-steam emissions decreased.
Low degassing and very low seismicity were reported during April; no explosions have been detected between 9 March and 27 May. The sulfur dioxide emissions remained between 350-400 t/d; during 13-20 April sulfur dioxide values fluctuated between 30-300 t/d. Activity remained low through most of May; on 23 May seismicity increased. An explosion was detected at 1647 on 27 May generated a gas-and-ash plume that rose 700 m high (figure 32); a decrease in seismicity and gas emissions followed. The DOAS station installed on the W flank recorded sulfur dioxide values that reached 400 t/d on 27 May; subsequent measurements showed a decrease to 268 t/d on 28 May and 100 t/d on 29 May.
Geologic Background. The symmetrical cone of San Miguel, one of the most active volcanoes in El Salvador, rises from near sea level to form one of the country's most prominent landmarks. A broad, deep, crater complex that has been frequently modified by eruptions recorded since the early 16th century caps the truncated unvegetated summit, also known locally as Chaparrastique. Flanks eruptions of the basaltic-andesitic volcano have produced many lava flows, including several during the 17th-19th centuries that extended to the N, NE, and SE. The SE-flank flows are the largest and form broad, sparsely vegetated lava fields crossed by highways and a railroad skirting the base of the volcano. Flank vent locations have migrated higher on the edifice during historical time, and the most recent activity has consisted of minor ash eruptions from the summit crater.
Information Contacts: Ministero de Medio Ambiente y Recursos Naturales (MARN), Km. 5½ Carretera a Nueva San Salvador, Avenida las Mercedes, San Salvador, El Salvador (URL: http://www.snet.gob.sv/ver/vulcanologia).
Semisopochnoi (United States) — June 2023 Cite this Report
Semisopochnoi
United States
51.93°N, 179.58°E; summit elev. 1221 m
All times are local (unless otherwise noted)
Occasional explosions, ash deposits, and gas-and-steam plumes during December 2022-May 2023
Semisopochnoi is located in the western Aleutians, is 20-km-wide at sea level, and contains an 8-km-wide caldera. The three-peaked Mount Young (formerly Cerberus) was constructed within the caldera during the Holocene. Each of these peaks contains a summit crater; the lava flows on the N flank appear younger than those on the S side. The current eruption period began in early February 2021 and has more recently consisted of intermittent explosions and ash emissions (BGVN 47:12). This report updates activity during December 2022 through May 2023 using daily, weekly, and special reports from the Alaska Volcano Observatory (AVO). AVO monitors the volcano using local seismic and infrasound sensors, satellite data, web cameras, and remote infrasound and lightning networks.
Activity during most of December 2022 was relatively quiet; according to AVO no eruptive or explosive activity was observed since 7 November 2022. Intermittent tremor and occasional small earthquakes were observed in geophysical data. Continuous gas-and-steam emissions were observed from the N crater of Mount Young in webcam images on clear weather days (figure 25). On 24 December, there was a slight increase in earthquake activity and several small possible explosion signals were detected in infrasound data. Eruptive activity resumed on 27 December at the N crater of Mount Young; AVO issued a Volcano Activity Notice (VAN) that reported minor ash deposits on the flanks of Mount Young that extended as far as 1 km from the vent, according to webcam images taken during 27-28 December (figure 26). No ash plumes were observed in webcam or satellite imagery, but a persistent gas-and-steam plume that might have contained some ash rose to 1.5 km altitude. As a result, AVO raised the Aviation Color Code (ACC) to Orange (the second highest level on a four-color scale) and the Volcano Alert Level (VAL) to Watch (the second highest level on a four-level scale). Possible explosions were detected during 21 December 2022 through 1 January 2023 and seismic tremor was recorded during 30-31 December.
During January 2023 eruptive activity continued at the active N crater of Mount Young. Minor ash deposits were observed on the flanks, extending about 2 km SSW, based on webcam images from 1 and 3 January. A possible explosion occurred during 1-2 January based on elevated seismicity recorded on local seismometers and an infrasound signal recorded minutes later by an array at Adak. Though no ash plumes were observed in webcam or satellite imagery, a persistent gas-and-steam plume rose to 1.5 km altitude that might have carried minor traces of ash. Ash deposits were accompanied by periods of elevated seismicity and infrasound signals from the local geophysical network, which AVO reported were likely due to weak explosive activity. Low-level explosive activity was also detected during 2-3 January, with minor gas-and-steam emissions and a new ash deposit that was visible in webcam images. Low-level explosive activity was detected in geophysical data during 4-5 January, with elevated seismicity and infrasound signals observed on local stations. Volcanic tremor was detected during 7-9 January and very weak explosive activity was detected in seismic and infrasound data on 9 January. Weak seismic and infrasound signals were recorded on 17 January, which indicated minor explosive activity, but no ash emissions were observed in clear webcam images; a gas-and-steam plume continued to rise to 1.5 km altitude. During 29-30 January, ash deposits near the summit were observed on fresh snow, according to webcam images.
The active N cone at Mount Young continued to produce a gas-and-steam plume during February, but no ash emissions or explosive events were detected. Seismicity remained elevated with faint tremor during early February. Gas-and-steam emissions from the N crater were observed in clear webcam images on 11-13 and 16 February; no explosive activity was detected in seismic, infrasound, or satellite data. Seismicity has also decreased, with no significant seismic tremor observed since 25 January. Therefore, the ACC was lowered to Yellow (the second lowest level on a four-color scale) and the VAL was lowered to Advisory (the second lowest level on a four-color scale) on 22 February.
Gas-and-steam emissions persisted during March from the N cone of Mount Young, based on clear webcam images. A few brief episodes of weak tremor were detected in seismic data, although seismicity decreased over the month. A gas-and-steam plume detected in satellite data extended 150 km on 18 March. Low-level ash emissions from the N cone at Mount Young were observed in several webcam images during 18-19 March, in addition to small explosions and volcanic tremor. The ACC was raised to Orange and the VAL increased to Watch on 19 March. A small explosion was detected in seismic and infrasound data on 21 March.
Low-level unrest continued during April, although cloudy weather often obscured views of the summit; periods of seismic tremor and local earthquakes were recorded. During 3-4 April a gas-and-steam plume was visible traveling more than 200 km overnight; no ash was evident in the plume, according to AVO. A gas-and-steam plume was observed during 4-6 April that extended 400 km but did not seem to contain ash. Small explosions were detected in seismic and infrasound data on 5 April. Occasional clear webcam images showed continuing gas-and-steam emissions rose from Mount Young, but no ash deposits were observed on the snow. On 19 April small explosions and tremor were detected in seismic and infrasound data. A period of seismic tremor was detected during 22-25 April, with possible weak explosions on 25 April. Ash deposits were visible near the crater rim, but it was unclear if these deposits were recent or due to older deposits.
Occasional small earthquakes were recorded during May, but there were no signs of explosive activity seen in geophysical data. Gas-and-steam emissions continued from the N crater of Mount Young, based on webcam images, and seismicity remained slightly elevated. A new, light ash deposit was visible during the morning of 5 May on fresh snow on the NW flank of Mount Young. During 10 May periods of volcanic tremor were observed. The ACC was lowered to Yellow and the VAL to Advisory on 17 May due to no additional evidence of activity.
Geologic Background. Semisopochnoi, the largest subaerial volcano of the western Aleutians, is 20 km wide at sea level and contains an 8-km-wide caldera. It formed as a result of collapse of a low-angle, dominantly basaltic volcano following the eruption of a large volume of dacitic pumice. The high point of the island is Anvil Peak, a double-peaked late-Pleistocene cone that forms much of the island's northern part. The three-peaked Mount Cerberus (renamed Mount Young in 2023) was constructed within the caldera during the Holocene. Each of the peaks contains a summit crater; lava flows on the N flank appear younger than those on the south side. Other post-caldera volcanoes include the symmetrical Sugarloaf Peak SSE of the caldera and Lakeshore Cone, a small cinder cone at the edge of Fenner Lake in the NE part of the caldera. Most documented eruptions have originated from Young, although Coats (1950) considered that both Sugarloaf and Lakeshore Cone could have been recently active.
Information Contacts: Alaska Volcano Observatory (AVO), a cooperative program of a) U.S. Geological Survey, 4200 University Drive, Anchorage, AK 99508-4667 USA (URL: https://avo.alaska.edu/), b) Geophysical Institute, University of Alaska, PO Box 757320, Fairbanks, AK 99775-7320, USA, and c) Alaska Division of Geological & Geophysical Surveys, 794 University Ave., Suite 200, Fairbanks, AK 99709, USA (URL: http://dggs.alaska.gov/).
Ebeko
Russia
50.686°N, 156.014°E; summit elev. 1103 m
All times are local (unless otherwise noted)
Continued explosions, ash plumes, and ashfall during October 2022-May 2023
Ebeko, located on the N end of Paramushir Island in the Kuril Islands, consists of three summit craters along a SSW-NNE line at the northern end of a complex of five volcanic cones. Eruptions date back to the late 18th century and have been characterized as small-to-moderate explosions from the summit crater, accompanied by intense fumarolic activity. The current eruption period began in June 2022 and has recently consisted of frequent explosions, ash plumes, and thermal activity (BGVN 47:10). This report covers similar activity during October 2022 through May 2023, based on information from the Kamchatka Volcanic Eruptions Response Team (KVERT) and satellite data.
Activity during October consisted of explosive activity, ash plumes, and occasional thermal anomalies. Visual data by volcanologists from Severo-Kurilsk showed explosions producing ash clouds up to 2.1-3 km altitude which drifted E, N, NE, and SE during 1-8, 10, 16, and 18 October. KVERT issued several Volcano Observatory Notices for Aviation (VONA) on 7, 13-15, and 27 October 2022, stating that explosions generated ash plumes that rose to 2.3-4 km altitude and drifted 5 km E, NE, and SE. Ashfall was reported in Severo-Kurilsk (Paramushir Island, about 7 km E) on 7 and 13 October. Satellite data showed a thermal anomaly over the volcano on 15-16 October. Visual data showed ash plumes rising to 2.5-3.6 km altitude on 22, 25-29, and 31 October and moving NE due to constant explosions.
Similar activity continued during November, with explosions, ash plumes, and ashfall occurring. KVERT issued VONAs on 1-2, 4, 6-7, 9, 13, and 16 November that reported explosions and resulting ash plumes that rose to 1.7-3.6 km altitude and drifted 3-5 km SE, ESE, E, and NE. On 1 November ash plumes extended as far as 110 km SE. On 5, 8, 12, and 24-25 November explosions and ash plumes rose to 2-3.1 km altitude and drifted N and E. Ashfall was observed in Severo-Kurilsk on 7 and 16 November. A thermal anomaly was visible during 1-4, 16, and 20 November. Explosions during 26 November rose as high as 2.7 km altitude and drifted NE (figure 45).
Explosions and ash plumes continued to occur in December. During 1-2 and 4 December volcanologists from Severo-Kurilsk observed explosions that sent ash to 1.9-2.5 km altitude and drifted NE and SE (figure 46). VONAs were issued on 5, 9, and 16 December reporting that explosions generated ash plumes rising to 1.9 km, 2.6 km, and 2.4 km altitude and drifted 5 km SE, E, and NE, respectively. A thermal anomaly was visible in satellite imagery on 16 December. On 18 and 27-28 December explosions produced ash plumes that rose to 2.5 km altitude and drifted NE and SE. On 31 December an ash plume rose to 2 km altitude and drifted NE.
Explosions continued during January 2023, based on visual observations by volcanologists from Severo-Kurilsk. During 1-7 January explosions generated ash plumes that rose to 4 km altitude and drifted NE, E, W, and SE. According to VONAs issued by KVERT on 2, 4, 10, and 23 January, explosions produced ash plumes that rose to 2-4 km altitude and drifted 5 km N, NE, E, and ENE; the ash plume that rose to 4 km altitude occurred on 10 January (figure 47). Satellite data showed a thermal anomaly during 3-4, 10, 13, 16, 21, 22, and 31 January. KVERT reported that an ash cloud on 4 January moved 12 km NE. On 6 and 9-11 January explosions sent ash plumes to 4.5 km altitude and drifted W and ESE. On 13 January an ash plume rose to 3 km altitude and drifted SE. During 20-24 January ash plumes from explosions rose to 3.7 km altitude and drifted SE, N, and NE. On 21 January the ash plume drifted as far as 40 km NE. During 28-29 and 31 January and 1 February ash plumes rose to 4 km altitude and drifted NE.
During February, explosions, ash plumes, and ashfall were reported. During 1, 4-5 and 7-8 February explosions generated ash plumes that rose to 4.5 km altitude and drifted E and NE; ashfall was observed on 5 and 8 February. On 6 February an explosion produced an ash plume that rose to 3 km altitude and drifted 7 km E, causing ashfall in Severo-Kurilsk. A thermal anomaly was visible in satellite data on 8, 9, 13, and 21 February. Explosions on 9 and 12-13 February produced ash plumes that rose to 4 km altitude and drifted E and NE; the ash cloud on 12 February extended as far as 45 km E. On 22 February explosions sent ash to 3 km altitude that drifted E. During 24 and 26-27 February ash plumes rose to 4 km altitude and drifted E. On 28 February an explosion sent ash to 2.5-3 km altitude and drifted 5 km E; ashfall was observed in Severo-Kurilsk.
Activity continued during March; visual observations showed that explosions generated ash plumes that rose to 3.6 km altitude on 3, 5-7, and 9-12 March and drifted E, NE, and NW. Thermal anomalies were visible on 10, 13, and 29-30 March in satellite imagery. On 18, 21-23, 26, and 29-30 March explosions produced ash plumes that rose to 2.8 km altitude and drifted NE and E; the ash plumes during 22-23 March extended up to 76 km E. A VONA issued on 21 March reported an explosion that produced an ash plume that rose to 2.8 km altitude and drifted 5 km E. Another VONA issued on 23 March reported that satellite data showed an ash plume rising to 3 km altitude and drifted 14 km E.
Explosions during April continued to generate ash plumes. On 1 and 4 April an ash plume rose to 2.8-3.5 km altitude and drifted SE and NE. A thermal anomaly was visible in satellite imagery during 1-6 April. Satellite data showed ash plumes and clouds rising to 2-3 km altitude and drifting up to 12 km SW and E on 3 and 6 April (figure 48). KVERT issued VONAs on 3, 5, 14, 16 April describing explosions that produced ash plumes rising to 3 km, 3.5 km, 3.5 km, and 3 km altitude and drifting 5 km S, 5 km NE and SE, 72 km NNE, and 5 km NE, respectively. According to satellite data, the resulting ash cloud from the explosion on 14 April was 25 x 7 km in size and drifted 72-104 km NNE during 14-15 April. According to visual data by volcanologists from Severo-Kurilsk explosions sent ash up to 3.5 km altitude that drifted NE and E during 15-16, 22, 25-26, and 29 April.
The explosive eruption continued during May. Explosions during 3-4, 6-7, and 9-10 May generated ash plumes that rose to 4 km altitude and drifted SW and E. Satellite data showed a thermal anomaly on 3, 9, 13-14, and 24 May. During 12-16, 23-25, and 27-28 May ash plumes rose to 3.5 km altitude and drifted in different directions due to explosions. Two VONA notices were issued on 16 and 25 May, describing explosions that generated ash plumes rising to 3 km and 3.5 km altitude, respectively and extending 5 km E. The ash cloud on 25 May drifted 75 km SE.
Thermal activity in the summit crater, occasionally accompanied by ash plumes and ash deposits on the SE and E flanks due to frequent explosions, were visible in infrared and true color satellite images (figure 49).
Geologic Background. The flat-topped summit of the central cone of Ebeko volcano, one of the most active in the Kuril Islands, occupies the northern end of Paramushir Island. Three summit craters located along a SSW-NNE line form Ebeko volcano proper, at the northern end of a complex of five volcanic cones. Blocky lava flows extend west from Ebeko and SE from the neighboring Nezametnyi cone. The eastern part of the southern crater contains strong solfataras and a large boiling spring. The central crater is filled by a lake about 20 m deep whose shores are lined with steaming solfataras; the northern crater lies across a narrow, low barrier from the central crater and contains a small, cold crescentic lake. Historical activity, recorded since the late-18th century, has been restricted to small-to-moderate explosive eruptions from the summit craters. Intense fumarolic activity occurs in the summit craters, on the outer flanks of the cone, and in lateral explosion craters.
Information Contacts: Kamchatka Volcanic Eruptions Response Team (KVERT), Far Eastern Branch, Russian Academy of Sciences, 9 Piip Blvd., Petropavlovsk-Kamchatsky, 683006, Russia (URL: http://www.kscnet.ru/ivs/kvert/); MIROVA (Middle InfraRed Observation of Volcanic Activity), a collaborative project between the Universities of Turin and Florence (Italy) supported by the Centre for Volcanic Risk of the Italian Civil Protection Department (URL: http://www.mirovaweb.it/); Copernicus Browser, Copernicus Data Space Ecosystem, European Space Agency (URL: https://dataspace.copernicus.eu/browser/).
Home Reef
Tonga
18.992°S, 174.775°W; summit elev. -10 m
All times are local (unless otherwise noted)
Discolored plumes continued during November 2022-April 2023
Home Reef is a submarine volcano located in the central Tonga islands between Lateiki (Metis Shoal) and Late Island. The first recorded eruption occurred in the mid-19th century, when an ephemeral island formed. An eruption in 1984 produced a 12-km-high eruption plume, a large volume of floating pumice, and an ephemeral island 500 x 1,500 m wide, with cliffs 30-50 m high that enclosed a water-filled crater. Another island-forming eruption in 2006 produced widespread pumice rafts that drifted as far as Australia; by 2008 the island had eroded below sea level. The previous eruption occurred during October 2022 and was characterized by a new island-forming eruption, lava effusion, ash plumes, discolored water, and gas-and-steam plumes (BGVN 47:11). This report covers discolored water plumes during November 2022 through April 2023 using satellite data.
Discolored plumes continued during the reporting period and were observed in true color satellite images on clear weather days. Satellite images show light green-yellow discolored water extending W on 8 and 28 November 2022 (figure 31), and SW on 18 November. Light green-yellow plumes extended W on 3 December, S on 13 December, SW on 18 December, and W and S on 23 December (figure 31). On 12 January 2023 discolored green-yellow plumes extended to the NE, E, SE, and N. The plume moved SE on 17 January and NW on 22 January. Faint discolored water in February was visible moving NE on 1 February. A discolored plume extended NW on 8 and 28 March and NW on 13 March (figure 31). During April, clear weather showed green-blue discolored plumes moving S on 2 April, W on 7 April, and NE and S on 12 April. A strong green-yellow discolored plume extended E and NE on 22 April for several kilometers (figure 31).
Geologic Background. Home Reef, a submarine volcano midway between Metis Shoal and Late Island in the central Tonga islands, was first reported active in the mid-19th century, when an ephemeral island formed. An eruption in 1984 produced a 12-km-high eruption plume, large amounts of floating pumice, and an ephemeral 500 x 1,500 m island, with cliffs 30-50 m high that enclosed a water-filled crater. In 2006 an island-forming eruption produced widespread dacitic pumice rafts that drifted as far as Australia. Another island was built during a September-October 2022 eruption.
Information Contacts: Copernicus Browser, Copernicus Data Space Ecosystem, European Space Agency (URL: https://dataspace.copernicus.eu/browser/).
Ambae
Vanuatu
15.389°S, 167.835°E; summit elev. 1496 m
All times are local (unless otherwise noted)
New lava flow, ash plumes, and sulfur dioxide plumes during February-May 2023
Ambae, also known as Aoba, is a large basaltic shield volcano in Vanuatu. A broad pyroclastic cone containing three crater lakes (Manaro Ngoru, Voui, and Manaro Lakua) is located at the summit within the youngest of at least two nested calderas. Periodic phreatic and pyroclastic explosions have been reported since the 16th century. A large eruption more than 400 years ago resulted in a volcanic cone within the summit crater that is now filled by Lake Voui; the similarly sized Lake Manaro fills the western third of the caldera. The previous eruption ended in August 2022 that was characterized by gas-and-steam and ash emissions and explosions of wet tephra (BGVN 47:10). This report covers a new eruption during February through May 2023 that consisted of a new lava flow, ash plumes, and sulfur dioxide emissions, using information from the Vanuatu Meteorology and Geo-Hazards Department (VMGD) and satellite data.
During the reporting period, the Alert Level remained at a 2 (on a scale of 0-5), which has been in place since December 2021. Activity during October 2022 through March 2023 remained relatively low and mostly consisted of gas-and-steam emissions in Lake Voui. VMGD reported that at 1300 on 15 November a satellite image captured a strong amount of sulfur dioxide rising above the volcano (figure 99), and that seismicity slightly increased. The southern and northern part of the island reported a strong sulfur dioxide smell and heard explosions. On 20 February 2023 a gas-and-ash plume rose 1.3 km above the summit and drifted SSW, according to a webcam image (figure 100). Gas-and-steam and possibly ash emissions continued on 23 February and volcanic earthquakes were recorded by the seismic network.
During April, volcanic earthquakes and gas-and-steam and ash emissions were reported from the cone in Lake Voui. VMGD reported that activity increased during 5-7 April; high gas-and-steam and ash plumes were visible, accompanied by nighttime incandescence. According to a Wellington VAAC report, a low-level ash plume rose as high as 2.5 km above the summit and drifted W and SW on 5 April, based on satellite imagery. Reports in Saratamata stated that a dark ash plume drifted to the WSW, but no loud explosion was heard. Webcam images from 2100 showed incandescence above the crater and reflected in the clouds. According to an aerial survey, field observations, and satellite data, water was no longer present in the lake. A lava flow was reported effusing from the vent and traveling N into the dry Lake Voui, which lasted three days. The next morning at 0745 on 6 April a gas-and-steam and ash plume rose 5.4 km above the summit and drifted ESE, based on information from VMGD (figure 101). The Wellington VAAC also reported that light ashfall was observed on the island. Intermittent gas-and-steam and ash emissions were visible on 7 April, some of which rose to an estimated 3 km above the summit and drifted E. Webcam images during 0107-0730 on 7 April showed continuing ash emissions. A gas-and-steam and ash plume rose 695 m above the summit crater at 0730 on 19 April and drifted ESE, based on a webcam image (figure 102).
According to visual and infrared satellite data, water was visible in Lake Voui as late as 24 March 2023 (figure 103). The vent in the caldera showed a gas-and-steam plume drifted SE. On 3 April thermal activity was first detected, accompanied by a gas-and-ash plume that drifted W (figure 103). The lava flow moved N within the dry lake and was shown cooling by 8 April. By 23 April much of the water in the lake had returned. Occasional sulfur dioxide plumes were detected by the TROPOMI instrument on the Sentinel-5P satellite that exceeded 2 Dobson Units (DU) and drifted in different directions (figure 104).
Geologic Background. The island of Ambae, also known as Aoba, is a massive 2,500 km3 basaltic shield that is the most voluminous volcano of the New Hebrides archipelago. A pronounced NE-SW-trending rift zone with numerous scoria cones gives the 16 x 38 km island an elongated form. A broad pyroclastic cone containing three crater lakes (Manaro Ngoru, Voui, and Manaro Lakua) is located at the summit within the youngest of at least two nested calderas, the largest of which is 6 km in diameter. That large central edifice is also called Manaro Voui or Lombenben volcano. Post-caldera explosive eruptions formed the summit craters about 360 years ago. A tuff cone was constructed within Lake Voui (or Vui) about 60 years later. The latest known flank eruption, about 300 years ago, destroyed the population of the Nduindui area near the western coast.
Information Contacts: Geo-Hazards Division, Vanuatu Meteorology and Geo-Hazards Department (VMGD), Ministry of Climate Change Adaptation, Meteorology, Geo-Hazards, Energy, Environment and Disaster Management, Private Mail Bag 9054, Lini Highway, Port Vila, Vanuatu (URL: http://www.vmgd.gov.vu/, https://www.facebook.com/VanuatuGeohazardsObservatory/); Wellington Volcanic Ash Advisory Centre (VAAC), Meteorological Service of New Zealand Ltd (MetService), PO Box 722, Wellington, New Zealand (URL: http://www.metservice.com/vaac/, http://www.ssd.noaa.gov/VAAC/OTH/NZ/messages.html); MIROVA (Middle InfraRed Observation of Volcanic Activity), a collaborative project between the Universities of Turin and Florence (Italy) supported by the Centre for Volcanic Risk of the Italian Civil Protection Department (URL: http://www.mirovaweb.it/); Global Sulfur Dioxide Monitoring Page, Atmospheric Chemistry and Dynamics Laboratory, NASA Goddard Space Flight Center (NASA/GSFC), 8800 Greenbelt Road, Goddard, Maryland, USA (URL: https://so2.gsfc.nasa.gov/); Copernicus Browser, Copernicus Data Space Ecosystem, European Space Agency (URL: https://dataspace.copernicus.eu/browser/).
Search Bulletin Archive by Publication Date
Select a month and year from the drop-downs and click "Show Issue" to have that issue displayed in this tab.
The default month and year is the latest issue available.
Bulletin of the Global Volcanism Network - Volume 16, Number 06 (June 1991)
Managing Editor: Lindsay McClelland
Aira (Japan)
Explosions remain frequent; tephra from one explosion damages houses and cars
Ambrym (Vanuatu)
Ash plume extends 50 km
Arenal (Costa Rica)
Frequent explosions; new lava flow
Colima (Mexico)
Avalanching from summit dome; flank lava flow continues to advance; April tephra fall mapped
Galeras (Colombia)
Frequent tephra emissions; more long-period seismicity; small summit inflation
Gede-Pangrango (Indonesia)
Seismicity declines without eruption after April/May swarm
Iliboleng (Indonesia)
Vapor and ash emission
Irazu (Costa Rica)
Tectonic earthquake swarm; new fumaroles but temperatures remain <100°C
Karthala (Comoros)
Seismic swarm precedes phreatic explosion; press reports of ash/lava eruption incorrect
Kilauea (United States)
E rift lava continues to enter the ocean
Klyuchevskoy (Russia)
Small plume seen from satellite image
Langila (Papua New Guinea)
Frequent Vulcanian explosions
Lewotobi (Indonesia)
Strombolian activity; ash to 300 m height; several hundred explosion earthquakes weekly
Lokon-Empung (Indonesia)
Explosions eject small ash columns
Manam (Papua New Guinea)
Occasional ash emissions
Merapi (Indonesia)
Gas plumes and seismicity
Northern EPR at 9.8°N (Undersea Features)
Post-1989 lava flows and high turbidity seen from submersible; frequent microseismicity
Ontakesan (Japan)
Seismicity declines slightly; steam plumes
Pinatubo (Philippines)
Continued ash emission with pulses to 15 km; typhoons trigger large lahars, leaving thousands homeless
Poas (Costa Rica)
Continued gas emission; harmonic tremor
Rabaul (Papua New Guinea)
Seismicity remains low; no significant deformation
Ruiz, Nevado del (Colombia)
Ash emission and low seismicity; increased SO2 flux
Slamet (Indonesia)
Plume emission follows harmonic tremor episodes
Soputan (Indonesia)
Ash and vapor ejected but glow ends in late May; 50 m of new lava on crater floor
Stromboli (Italy)
Explosions eject glowing fragments and gas columns
Unzendake (Japan)
Continued lava dome growth; debris flows to 7.5 km destroy houses; evacuations prevent more casualties
Aira
Japan
31.5772°N, 130.6589°E; summit elev. 1117 m
All times are local (unless otherwise noted)
Explosions remain frequent; tephra from one explosion damages houses and cars
Frequent explosive activity . . . continued through mid-July. Explosions . . . occurred 31 times in June . . . and 15 times by 24 July, bringing the year's total to 168. An explosion at 2345 on 29 June ejected blocks and lapilli that damaged house roofs and two car windshields, the second episode of explosion-related damage in 1991. The ash cloud rose to a maximum height of 3,200 m (on 27 June), and a monthly total of 20 g/m2 of ash was deposited 10 km W of the crater (compared to 209 g/m2 in May). Volcanic earthquake swarms, similar to previous months, were recorded on 7, 16, 24, and 28 June.
Geologic Background. The Aira caldera in the northern half of Kagoshima Bay contains the post-caldera Sakurajima volcano, one of Japan's most active. Eruption of the voluminous Ito pyroclastic flow accompanied formation of the 17 x 23 km caldera about 22,000 years ago. The smaller Wakamiko caldera was formed during the early Holocene in the NE corner of the caldera, along with several post-caldera cones. The construction of Sakurajima began about 13,000 years ago on the southern rim and built an island that was joined to the Osumi Peninsula during the major explosive and effusive eruption of 1914. Activity at the Kitadake summit cone ended about 4,850 years ago, after which eruptions took place at Minamidake. Frequent eruptions since the 8th century have deposited ash on the city of Kagoshima, located across Kagoshima Bay only 8 km from the summit. The largest recorded eruption took place during 1471-76.
Information Contacts: JMA.
Ambrym
Vanuatu
16.25°S, 168.12°E; summit elev. 1334 m
All times are local (unless otherwise noted)
Ash plume extends 50 km
The control tower at Bauerfield airport (serving Port Vila, ~150 km SSE of Ambrym), reported a 2-km-high ash cloud stretching ~50 km from Marum Crater on 10 June.
Geologic Background. Ambrym, a large basaltic volcano with a 12-km-wide caldera, is one of the most active volcanoes of the New Hebrides Arc. A thick, almost exclusively pyroclastic sequence, initially dacitic then basaltic, overlies lava flows of a pre-caldera shield volcano. The caldera was formed during a major Plinian eruption with dacitic pyroclastic flows about 1,900 years ago. Post-caldera eruptions, primarily from Marum and Benbow cones, have partially filled the caldera floor and produced lava flows that ponded on the floor or overflowed through gaps in the caldera rim. Post-caldera eruptions have also formed a series of scoria cones and maars along a fissure system oriented ENE-WSW. Eruptions have apparently occurred almost yearly during historical time from cones within the caldera or from flank vents. However, from 1850 to 1950, reporting was mostly limited to extra-caldera eruptions that would have affected local populations.
Information Contacts: C. Mortimer, Dept of Geology, Mines, and Rural Water Supply, Vanuatu.
Arenal
Costa Rica
10.463°N, 84.703°W; summit elev. 1670 m
All times are local (unless otherwise noted)
Frequent explosions; new lava flow
Gas and vapor emission increased in June, as Strombolian activity decreased moderately from May. Seismometers recorded up to 65 explosions/day (on 22 June) and medium- and high-frequency tremor (>4 Hz) was recorded up to 24 hours/day (Univ Nacional network). Seismicity decreased from a daily average of 20 earthquakes in May, to 15 in June (Red Sismológica Nacional). Two lobes of lava continued down the S and SW flanks [but see July observations below], reaching and partially burning some of the upper forest. No serious mudflows had yet occurred, midway through the rainy season.
The following is from W. Melson, V. Barboza, and E. Fernández. "We monitored the activity of Arenal 24 hours/day, 7-17 July 1991. About 40 pyroclastic eruptions/day were heard, and their acoustic and seismic signals recorded at the Arenal Observatory lodge. This is the highest eruption frequency we have observed since 1-23 October 1989. The flows that advanced down the S slope during January-May 1991 have ceased moving, and a new flow sequence has begun spilling over the westernmost crater and moving down the WSW slope. Over 17 cm of rain and constant clouds prevented observations of the summit during most of this time."
Geologic Background. Conical Volcán Arenal is the youngest stratovolcano in Costa Rica and one of its most active. The 1670-m-high andesitic volcano towers above the eastern shores of Lake Arenal, which has been enlarged by a hydroelectric project. Arenal lies along a volcanic chain that has migrated to the NW from the late-Pleistocene Los Perdidos lava domes through the Pleistocene-to-Holocene Chato volcano, which contains a 500-m-wide, lake-filled summit crater. The earliest known eruptions of Arenal took place about 7000 years ago, and it was active concurrently with Cerro Chato until the activity of Chato ended about 3500 years ago. Growth of Arenal has been characterized by periodic major explosive eruptions at several-hundred-year intervals and periods of lava effusion that armor the cone. An eruptive period that began with a major explosive eruption in 1968 ended in December 2010; continuous explosive activity accompanied by slow lava effusion and the occasional emission of pyroclastic flows characterized the eruption from vents at the summit and on the upper western flank.
Information Contacts: J. Barquero, E. Fernández, V. Barboza, R. Van der Laat, and E. Malavassi, OVSICORI; R. Barquero, Guillermo Alvarado, Mario Fernández, Hector Flores, and Sergio Paniagua, ICE; W. Melson, SI.
Colima
Mexico
19.514°N, 103.62°W; summit elev. 3850 m
All times are local (unless otherwise noted)
Avalanching from summit dome; flank lava flow continues to advance; April tephra fall mapped
CICT personnel visited the N and W flanks of the upper cone (El Playón and Soma areas) on 15 June, to observe morphological changes on the N and NW sides of the summit lava dome, and check reports of incandescence seen 8 June from nearby Nevado de Colima. Despite rainy weather, it was evident that a landslide 200-300 m long had occurred from the N side of the dome. A high-frequency seismic signal, interpreted as continuous avalanches, began at 1306 on 15 June and continued for about 30 minutes on RESCO stations EZV7 (at Volcancito, ~1 km NE of the summit) and EZV4 (on the NW flank). At 1440, RESCO seismometers recorded a large avalanche that lasted about 20 minutes, and was similar to the seismicity associated with the partial dome collapse on 16 April. The geologists saw a large fumarole and big reddish and yellow-brown dust clouds at 1450, while small gray plumes emerged from the dome; similar activity had been observed by a CICT team on 16 April. Morphologic changes were evident to the SSW side of the dome, probably from the partial collapse on 15 June, and the dome had decreased in height. The lava flow, about 20 m thick, continued to advance (down the El Cordobán canyon), reaching 3 km length and 2,500 m altitude (figure 14). Weather had prevented aerial monitoring of the lava flow.
Mapping of 16-19 April airfall ash distribution showed that tephra volume was limited (figure 15). Unusual winds during the eruption carried ash to the SE. Small block-and-ash flows had been emplaced along the El Cordobán and Montegrande canyons; ashfall and block-and-ash flow deposits in the El Cordobán canyon area had been [significantly eroded] by the season's first rains.
During the last two weeks in June, seismicity remained relatively constant, with no additional large avalanche episodes detected. There was no strong seismic evidence of impending changes in the eruption, but geologists recommended increased monitoring, including COSPEC analysis, to allow more complete evaluation of the activity.
Geologic Background. The Colima complex is the most prominent volcanic center of the western Mexican Volcanic Belt. It consists of two southward-younging volcanoes, Nevado de Colima (the high point of the complex) on the north and the historically active Volcán de Colima at the south. A group of late-Pleistocene cinder cones is located on the floor of the Colima graben west and east of the complex. Volcán de Colima (also known as Volcán Fuego) is a youthful stratovolcano constructed within a 5-km-wide scarp, breached to the south, that has been the source of large debris avalanches. Major slope failures have occurred repeatedly from both the Nevado and Colima cones, producing thick debris-avalanche deposits on three sides of the complex. Frequent recorded eruptions date back to the 16th century. Occasional major explosive eruptions have destroyed the summit (most recently in 1913) and left a deep, steep-sided crater that was slowly refilled and then overtopped by lava dome growth.
Information Contacts: Francisco Núñez-Cornú, Julián Flores, F. Alejandro Nava, R. Saucedo, C. Valencia, Ariel Ramírez-Vázquez, G.A. Reyes-Dávila, R. García, and J. Hernández, CICT, Univ de; Z. Jiménez, S. de la Cruz-Reyna, and I. Yokoyama, UNAM; P. Lesage (France); D. Córdoba, UCM, Spain.
Galeras
Colombia
1.22°N, 77.37°W; summit elev. 4276 m
All times are local (unless otherwise noted)
Frequent tephra emissions; more long-period seismicity; small summit inflation
Frequent ash and lapilli emissions continued in June, as indicated by seismic signals and confirmed by periodic observations during clear weather (2, 17, 18, and 20 June). Gas plumes rose to 800-1,700 m height (1 and 17 June) during periodic pulses of activity. Significant increases in the incandescent area were noted near the crater floor and on the W wall. The SO2 flux fluctuated between low and moderate values.
Fewer low-frequency events but more long-period events were recorded in June than in May. The majority of high-frequency events were centered 6 km E of the crater at 0.9-2.3 km depths. Some tremor episodes and long-period events were associated with ash emissions and increases in plume height. Deformation measurements continued to show low levels of inflation (20 µrad in June) at the "Crater" tiltmeter, . . . .
Geologic Background. Galeras, a stratovolcano with a large breached caldera located immediately west of the city of Pasto, is one of Colombia's most frequently active volcanoes. The dominantly andesitic complex has been active for more than 1 million years, and two major caldera collapse eruptions took place during the late Pleistocene. Long-term extensive hydrothermal alteration has contributed to large-scale edifice collapse on at least three occasions, producing debris avalanches that swept to the west and left a large open caldera inside which the modern cone has been constructed. Major explosive eruptions since the mid-Holocene have produced widespread tephra deposits and pyroclastic flows that swept all but the southern flanks. A central cone slightly lower than the caldera rim has been the site of numerous small-to-moderate eruptions since the time of the Spanish conquistadors.
Information Contacts: INGEOMINAS-OVP.
Gede-Pangrango (Indonesia) — June 1991 Cite this Report
Gede-Pangrango
Indonesia
6.786°S, 106.983°E; summit elev. 3026 m
All times are local (unless otherwise noted)
Seismicity declines without eruption after April/May swarm
High seismicity associated with the 29 April-1 May swarm activity has continuously declined since late May (figure 1). An average of one volcanic earthquake/day was recorded in June, compared to 43/day in April and 5/day in May. No surface activity was observed.
Geologic Background. The two peaks of the Gede-Pangrango volcanic complex overlook the major cities of Cianjur, Sukabumi, and Bogor, situated to the E, S, and NW, respectively. The summit of Gunung Pangrango, constructed over the NE rim of a 3 x 5 km caldera, forms the high point. Many lava flows are visible on the flanks of the younger Gunung Gede to the SE of Pangrango. The steep-walled summit crater has migrated about 1 km NNW over time. Two large debris-avalanche deposits are present on its flanks, one of which underlies the city of Cianjur. Activity recorded since the 16th century has typically consisted of small short explosive eruptions.
Information Contacts: W. Modjo, VSI.
Iliboleng (Indonesia) — June 1991 Cite this Report
Iliboleng
Indonesia
8.342°S, 123.258°E; summit elev. 1659 m
All times are local (unless otherwise noted)
Vapor and ash emission
Vapor and ash were continuously emitted to 100-850 m height, beginning 8 May and continuing through June. Shallow volcanic earthquakes were recorded 15-25 times/week (figure 2), but no explosion earthquakes were recorded. Tectonic earthquakes averaged 14-24/week.
Geologic Background. Iliboleng stratovolcano was constructed at the SE end of Adonara Island across a narrow strait from Lomblen Island. The volcano is capped by multiple, partially overlapping summit craters. Lava flows modify its profile, and a cone low on the SE flank, Balile, has also produced lava flows. Historical eruptions, first recorded in 1885, have consisted of moderate explosive activity, with lava flows accompanying only the 1888 eruption.
Information Contacts: W. Modjo, VSI.
Irazu
Costa Rica
9.979°N, 83.852°W; summit elev. 3436 m
All times are local (unless otherwise noted)
Tectonic earthquake swarm; new fumaroles but temperatures remain <100°C
A swarm of tectonic earthquakes, centered near the summit at 0-8 km depth, began in late May (16:05) and continued through June. The swarm followed aftershocks of the 22 April earthquake (16:05), and has been interpreted as representing reactivation of a fault zone. A similar earthquake swarm in January (16:1-2) was interpreted as fault reactivation caused by an [M 5.7] earthquake on 22 December [50 km WSW] of Irazú.
During the second week of June, a group of new fumaroles formed in the NE, N, NW, and S parts of the crater. Temperatures of up to 94°C were measured during fieldwork the next week, similar to NW-flank fumarole temperatures (80-90°C) since 1965. Temperatures and activity at other fumaroles remained unchanged. The seasonal crater lake, which began to fill the last week of June, remained at ambient temperature except around fumaroles, where the water was 30-48°C and had a pH of 5.9 (similar to pH measurements in 1986 and 1987). Small landslides occurred down the E, NE, and SW crater walls. Deformation measurements indicated no significant changes.
Several small tremor episodes (durations <=60 seconds) and low-frequency events were recorded during June. Univ Nacional scientists suggested that the tremor could be related to shallow hydrothermal activity and degassing beneath the crater.
Geologic Background. The massive Irazú volcano in Costa Rica, immediately E of the capital city of San José, covers an area of 500 km2 and is vegetated to within a few hundred meters of its broad summit crater complex. At least 10 satellitic cones are located on its S flank. No lava effusion is known since the eruption of the Cervantes lava flows from S-flank vents about 14,000 years ago, and all known Holocene eruptions have been explosive. The focus of eruptions at the summit crater complex has migrated to the W towards the main crater, which contains a small lake. The first well-documented eruption occurred in 1723, and frequent explosive eruptions have occurred since. Ashfall from the last major eruption during 1963-65 caused significant disruption to San José and surrounding areas. Phreatic activity reported in 1994 may have been a landslide event from the fumarolic area on the NW summit (Fallas et al., 2018).
Information Contacts: J. Barquero, E. Fernández, V. Barboza, R. Van der Laat, and E. Malavassi, OVSICORI; R. Barquero, Guillermo Alvarado, Mario Fernández, Hector Flores, and Sergio Paniagua, ICE.
Karthala
Comoros
11.75°S, 43.38°E; summit elev. 2361 m
All times are local (unless otherwise noted)
Seismic swarm precedes phreatic explosion; press reports of ash/lava eruption incorrect
Widely distributed news reports of ash and lava emission during the evening of 2 July proved incorrect. As of mid-July, the only documented eruptive activity had been a phreatic explosion on the 11th. According to the press, some villages around the base of the volcano were evacuated, but many fewer residents fled than the tens of thousands initially reported [see 16:8]. The eruption followed three months of increasing seismicity monitored by a joint group from the Centre National de Documentation et de Recherche Scientifique des Comores (CNDRS), the Univ de la Réunion, and the IPGP. The following is from their report. [See 16:8 for additional details].
An average of 3-5 seismic events/month were recorded from the start of monitoring in June 1988 until April 1991. "At the beginning of April, a slight increase in seismicity was noticed, with events mainly centered under the summit caldera from 0-2 km below sea level [see also 16:8]. The rate of seismicity progressively increased from an average of 5-10 events/day in May to 20/day in June, reaching 40/day by the end of June. The earthquakes occurred along a roughly N-S axis below the summit caldera at 0-1 km below sea level. Deformation measurements, using a 10-station dry-tilt network in the summit caldera, indicated inflation of ~ 20 µrads.
"At 1645 on 30 June a seismic crisis began with events centered below the S part of the caldera and the volcano's S flank. During the night of 30 June, many shocks were felt by residents of the SW part of the island. Seismic activity continued 1-2 July, with both short- and long-period events occurring at average rates of 60-100/hour. Some of the short-period events reached M 2.5-3. One M 3.1 earthquake (at 0708 on 2 July) was felt in the SE part of the island (in the Foumbouni area; figure 1). This intense seismic activity has caused many people living in the SW to move to Moroni, the capital and island's largest city.
"The seismic crisis continued until 10 July, with the number of earthquakes reaching 250/hour. After several hours of relative calm, a phreatic eruption occurred at 0330 on 11 July [but see 16:8], after which the number of earthquakes returned to ~100/hour. During overflights of Choungou Chahalé Crater (summit area), it was observed that the rim of the S half of the summit caldera was covered by ash and blocks of old material. The crater was filled with gas that stagnated in its bottom. A sound like a lava fountain [but see 16:8] was audible, but no lava fountain was visible. The same day, seismometers recorded ~40-60 earthquakes/hour, most of M <2. Some of M >3 were felt by the population."
Reference. Strong, D.F., and Jacquot, C., 1970, The Karthala Caldera, Grande Comore: BV, v. 34, p. 663-680.
Geologic Background. The southernmost and largest of the two shield volcanoes forming Grand Comore Island (also known as Ngazidja Island), Karthala contains a 3 x 4 km summit caldera generated by repeated collapse. Elongated rift zones extend to the NNW and SE from the summit of the Hawaiian-style basaltic shield, which has an asymmetrical profile that is steeper to the S. The lower SE rift zone forms the Massif du Badjini, a peninsula at the SE tip of the island. Historical eruptions have modified the morphology of the compound, irregular summit caldera. More than twenty eruptions have been recorded since the 19th century from the summit caldera and vents on the N and S flanks. Many lava flows have reached the sea on both sides of the island. An 1860 lava flow from the summit caldera traveled ~13 km to the NW, reaching the W coast to the N of the capital city of Moroni.
Information Contacts: P. Bachélery, Univ de la Réunion; J-L. Klein, CNDRS, RFI des Comores; J-L. Cheminée, IPGP; UPI; AP; Reuters.
Kilauea (United States) — June 1991 Cite this Report
Kilauea
United States
19.421°N, 155.287°W; summit elev. 1222 m
All times are local (unless otherwise noted)
E rift lava continues to enter the ocean
Lava . . . continued to flow into the ocean at two main entries through June. The W branch fed two active sites (at the Poupou entry). At the E Poupou site, lava continued to build the E edge of the lower bench, although its W edge had been eroded by waves. "Firehose"-like outflow of lava from truncated tubes occurred periodically at the E Poupou site, as on 7 June when the activity fed a tube in the surf zone. Frequent underwater explosions occurred along the tube, sometimes sending spatter several meters into the air. Firehose activity typically ended with the construction of a new lower lava bench. At the W Poupou site, parts of the 3-m-high littoral cone and the underlying sea cliff were eroding. A fissure developed just inland of the littoral cone in late May and additional large fissures appeared within a few meters of the sea cliff on 25 June.
Lava broke out from the main tube in mid-May and formed a new (E branch) tube, reaching the sea (at the Paradise entry) late in the month. Lava initially entered the ocean along a front 300-400 m wide, but within a few days the entry narrowed to <20 m across. The resulting bench sloped steeply and smoothly into the ocean, with none of the step-like changes in relief evident at the Poupou entry. Lava continued to pour into the ocean from the bench until the last week in June, when a large flow broke out and moved W across the beach behind the bench. The new entry was <500 m E of a 1988-89 bench where major collapses occurred after it extended no more than 45 m into the ocean. Only one significant collapse episode, which removed ~15 m of the new bench, had been noted at Paradise as of early July.
No changes were observed near the source (Kupaianaha) vent. Lava in a tube near the vent was flowing at ~0.9 m/s . . . on 20 June. A small lava lake persisted in the older Pu`u `O`o vent . . . . Overflows from the lava lake covered the crater floor, ~80 m below the rim. Some spattering was observed, concentrated in the S part of the lake.
Geologic Background. Kilauea overlaps the E flank of the massive Mauna Loa shield volcano in the island of Hawaii. Eruptions are prominent in Polynesian legends; written documentation since 1820 records frequent summit and flank lava flow eruptions interspersed with periods of long-term lava lake activity at Halemaumau crater in the summit caldera until 1924. The 3 x 5 km caldera was formed in several stages about 1,500 years ago and during the 18th century; eruptions have also originated from the lengthy East and Southwest rift zones, which extend to the ocean in both directions. About 90% of the surface of the basaltic shield volcano is formed of lava flows less than about 1,100 years old; 70% of the surface is younger than 600 years. The long-term eruption from the East rift zone between 1983 and 2018 produced lava flows covering more than 100 km2, destroyed hundreds of houses, and added new coastline.
Information Contacts: T. Moulds, HVO.
Klyuchevskoy (Russia) — June 1991 Cite this Report
Klyuchevskoy
Russia
56.056°N, 160.642°E; summit elev. 4754 m
All times are local (unless otherwise noted)
Small plume seen from satellite image
The NOAA 10 polar-orbiting weather satellite showed a plume ~20 km long, extending S from the summit then turning SW, on 24 June at 1024.
Geologic Background. Klyuchevskoy (also spelled Kliuchevskoi) is Kamchatka's highest and most active volcano. Since its origin about 6000 years ago, the beautifully symmetrical, 4835-m-high basaltic stratovolcano has produced frequent moderate-volume explosive and effusive eruptions without major periods of inactivity. It rises above a saddle NE of sharp-peaked Kamen volcano and lies SE of the broad Ushkovsky massif. More than 100 flank eruptions have occurred during the past roughly 3000 years, with most lateral craters and cones occurring along radial fissures between the unconfined NE-to-SE flanks of the conical volcano between 500 m and 3600 m elevation. The morphology of the 700-m-wide summit crater has been frequently modified by historical eruptions, which have been recorded since the late-17th century. Historical eruptions have originated primarily from the summit crater, but have also included numerous major explosive and effusive eruptions from flank craters.
Information Contacts: W. Gould, NOAA/NESDIS.
Langila (Papua New Guinea) — June 1991 Cite this Report
Langila
Papua New Guinea
5.525°S, 148.42°E; summit elev. 1330 m
All times are local (unless otherwise noted)
Frequent Vulcanian explosions
"Crater 3 . . . produced 1 to >40 Vulcanian explosions/day in June. The explosions produced dark grey vapour and ash clouds or columns, resulting in light ashfalls over the NW flank of the volcano and to coastal villages (10-15 km distant). Villagers were also shaken by the airwaves of the strongest explosions. Night activity consisted of weak red glow, with the largest explosions producing a short-term brighter glow between 5 and 16 June.
"Crater 2 released weak to moderate white vapour emissions plus occasional grey ash and blue vapours. The crater produced one loud Vulcanian explosion on 28 June, accompanied by an ashfall. A steady weak night glow was visible over the crater for much the same period as at Crater 3 (3-17 June). After a 10-day absence, night glow reappeared at Crater 2 on 28 June, following its throat-clearing Vulcanian explosion. Two days later, night glow also returned to Crater 3.
"The daily number of Vulcanian explosions from Crater 3 reached its maximum level of >30 between the 15th and 19th, coinciding with the absence of night glow at both craters (figure 3). A seismograph 9 km away (CGA), which previously recorded ~10% of the explosion earthquakes detected by the summit station (LAN), started to record an increasing proportion of these events (to >50%)."
Geologic Background. Langila, one of the most active volcanoes of New Britain, consists of a group of four small overlapping composite basaltic-andesitic cones on the lower E flank of the extinct Talawe volcano in the Cape Gloucester area of NW New Britain. A rectangular, 2.5-km-long crater is breached widely to the SE; Langila was constructed NE of the breached crater of Talawe. An extensive lava field reaches the coast on the N and NE sides of Langila. Frequent mild-to-moderate explosive eruptions, sometimes accompanied by lava flows, have been recorded since the 19th century from three active craters at the summit. The youngest and smallest crater (no. 3 crater) was formed in 1960 and has a diameter of 150 m.
Information Contacts: P. de Saint-Ours, RVO.
Lewotobi (Indonesia) — June 1991 Cite this Report
Lewotobi
Indonesia
8.542°S, 122.775°E; summit elev. 1703 m
All times are local (unless otherwise noted)
Strombolian activity; ash to 300 m height; several hundred explosion earthquakes weekly
Explosions at the summit crater on 28 May at 1615, 1840, and 1911 produced ash clouds to 300 m, accompanied by thunder-like sounds heard 4 km SW of the crater (at Pos Observatory). Since then, activity has been dominated by gas emissions and explosion earthquakes (figure 1). Explosions emitted ash (12-19 times/week) to 100-300 m high. On 8 and 13 June, lapilli and bombs ejected by Strombolian activity covered the area surrounding the crater. Glow and lava fountaining then steadily diminished through the end of June. Explosion earthquakes were recorded 200-405 times/week, compared to 0-4 deep and shallow volcanic earthquakes, and 5-7 tectonic earthquakes/week. No tremor episodes were recorded.
Geologic Background. The Lewotobi edifice in eastern Flores Island is composed of the two adjacent Lewotobi Laki-laki and Lewotobi Perempuan stratovolcanoes (the "husband and wife"). Their summits are less than 2 km apart along a NW-SE line. The conical Laki-laki to the NW has been frequently active during the 19th and 20th centuries, while the taller and broader Perempuan has had observed eruptions in 1921 and 1935. Small lava domes have grown during the 20th century in both of the summit craters, which are open to the north. A prominent cone, Iliwokar, occurs on the E flank of Perampuan.
Information Contacts: W. Modjo, VSI.
Lokon-Empung (Indonesia) — June 1991 Cite this Report
Lokon-Empung
Indonesia
1.358°N, 124.792°E; summit elev. 1580 m
All times are local (unless otherwise noted)
Explosions eject small ash columns
Ash explosions occurred at 1537 on 27 May and 1000 on 28 May, producing columns 250 m high. Continued ash explosions were observed at a rate of 7-16/week, with column heights of 200-400 m. Seismic activity was characterized by explosion earthquakes, averaging 30-50 recorded events/week. Shallow and deep volcanic earthquakes were less frequent (2-8 and 3-9 events/week, respectively). Tectonic earthquakes ranged from 18 to 101 weekly.
Geologic Background. The Lokong-Empung volcanic complex, rising above the plain of Tondano in North Sulawesi, includes four peaks and an active crater. Lokon, the highest peak, has a flat craterless top. The morphologically younger Empung cone 2 km NE has a 400-m-wide, 150-m-deep crater that erupted last in the 18th century. A ridge extending 3 km WNW from Lokon includes the Tatawiran and Tetempangan peaks. All eruptions since 1829 have originated from Tompaluan, a 150 x 250 m crater in the saddle between Lokon and Empung. These eruptions have primarily produced small-to-moderate ash plumes that sometimes damaged croplands and houses, but lava-dome growth and pyroclastic flows have also occurred.
Information Contacts: W. Modjo, VSI.
Manam (Papua New Guinea) — June 1991 Cite this Report
Manam
Papua New Guinea
4.08°S, 145.037°E; summit elev. 1807 m
All times are local (unless otherwise noted)
Occasional ash emissions
"Both craters released weak emissions of white vapour. However, some greyish, ash-laden clouds were also occasionally emitted. Between 5 and 9 June, deep roaring sounds were heard from Southern Crater and plumes of ash occasionally rose to 150-700 m above the crater rims. Similar activity recurred between 25 and 29 June. Although no night glow was observed, the seismicity was at a moderately high level and radial tilt measurements fluctuated by 3 µrad."
Geologic Background. The 10-km-wide island of Manam, lying 13 km off the northern coast of mainland Papua New Guinea, is one of the country's most active volcanoes. Four large radial valleys extend from the unvegetated summit of the conical basaltic-andesitic stratovolcano to its lower flanks. These valleys channel lava flows and pyroclastic avalanches that have sometimes reached the coast. Five small satellitic centers are located near the island's shoreline on the northern, southern, and western sides. Two summit craters are present; both are active, although most observed eruptions have originated from the southern crater, concentrating eruptive products during much of the past century into the SE valley. Frequent eruptions, typically of mild-to-moderate scale, have been recorded since 1616. Occasional larger eruptions have produced pyroclastic flows and lava flows that reached flat-lying coastal areas and entered the sea, sometimes impacting populated areas.
Information Contacts: P. de Saint-Ours, RVO.
Merapi
Indonesia
7.54°S, 110.446°E; summit elev. 2910 m
All times are local (unless otherwise noted)
Gas plumes and seismicity
Diffuse to dense gas plumes rose 475 m in June, with SO2 fluxes averaging 80 t/d. The weekly number of volcanic earthquakes fluctuated, briefly rising to 33 during the third week in June, of which 28 were recorded on the 22nd. Three volcanic earthquakes were recorded below the crater at 3.0-3.5 km depth. An average of two multiphase events and 10-12 tectonic earthquakes were recorded weekly.
Geologic Background. Merapi, one of Indonesia's most active volcanoes, lies in one of the world's most densely populated areas and dominates the landscape immediately north of the major city of Yogyakarta. It is the youngest and southernmost of a volcanic chain extending NNW to Ungaran volcano. Growth of Old Merapi during the Pleistocene ended with major edifice collapse perhaps about 2,000 years ago, leaving a large arcuate scarp cutting the eroded older Batulawang volcano. Subsequent growth of the steep-sided Young Merapi edifice, its upper part unvegetated due to frequent activity, began SW of the earlier collapse scarp. Pyroclastic flows and lahars accompanying growth and collapse of the steep-sided active summit lava dome have devastated cultivated lands on the western-to-southern flanks and caused many fatalities.
Information Contacts: W. Modjo, VSI.
Northern EPR at 9.8°N (Undersea Features) — June 1991 Cite this Report
Northern EPR at 9.8°N
Undersea Features
9.83°N, 104.3°W; summit elev. -2500 m
All times are local (unless otherwise noted)
Post-1989 lava flows and high turbidity seen from submersible; frequent microseismicity
Evidence for a recent, possibly ongoing eruption on the axis of the East Pacific Rise was found between 31 March and 24 April during a series of 25 Adventure Program Alvin dives (led by Rachel Haymon and Dan Fornari). The following phenomena suggested eruptive activity:
1. Bottom waters were extremely murky. A high density of suspended particulate matter plus white biogenic particles swept from the bottom by strong hydrothermal flow created a turbid zone to 50 m above the sea floor.
2. Total flux of hydrothermal fluid over the area was very high and temperatures reached 403°C.
3. Animal communities documented by an ARGO survey in November-December 1989 (Haymon and others, 1991) had been buried by fresh lava flows, and the scorched soft tissues of partially buried biota had not yet attracted crabs and other bottom scavengers.
4. At one vent, temperature increased from 389 to 403°C and fluid composition changed during a two-week period.
5. Fresh, sulfate-bearing chimneys at the collapsed margin of the axial summit caldera were draped with new flows. At sites of black smoker chimneys seen from ARGO, [hydrothermal fluids or black smoke] poured directly from piles of collapse rubble.
6. At a number of sites, high-temperature fluids vented directly from the basaltic sea floor, probably because there had been insufficient time for chimneys to form.
7. Vent animal communities were absent (presumably had not yet developed) at many sites where H2S-rich effluents were sampled. Instead, basalts near the vents were extensively coated with unusual white bacterial mats, not seen during the 1989 survey, that appear different from those previously described at other sea-floor hot springs.
After a seismically detected eruption of the submarine volcano Kick-'em-Jenny (N of Grenada, West Indies) in December 1988, observations from a submersible in mid-April 1989 revealed bacterial mats at the eruption site, associated with upwelling hydrothermal fluid and an apparently anoxic environment. The mats were breaking up by the next dive in mid-May, and normal sea life was returning.
In mid-May, ocean bottom seismographs, deployed from the RV Thomas Washington to monitor the volcanic activity, detected frequent microseismicity. Of the seven instruments deployed (at 5-km spacing), five returned usable data, and two (on-axis at 9.808°N, 104.286°W, off-axis at 9.816°N, 104.243°W) were examined in detail. A total of 151 local events were recorded in 68 hours (figure 1). The data suggested swarm-like behavior, although the time series was too short to reveal a well-defined pattern. Time intervals between P, S, and interface waves indicated that the majority of events were at distances of 0.5-2 km. Many of the events recorded strongly on-axis were detected poorly if at all by the off-axis instrument; the best-recorded phases off-axis were often the water waves. Seismologists noted that these observations suggest that seismicity was centered near the ridge axis and was probably very shallow (0.5-2 km depth), since events at the depth of the instrument spacing (5 km) would be roughly equidistant from the two stations. It seemed likely that at least 10 km of the ridge axis was generating microseismicity.
Currently funded programs that will visit the site include: 1-2 dives by Nautile in October 1991 (D. Desbruyeres, CNEXO, Brest); Alvin dives in November-December 1991 (L. Mullineaux and C. van Dover, Woods Hole Oceanographic Institution), January 1992 (R. Haymon, Univ of California at Santa Barbara and R. Lutz, Rutgers), and April 1992 (J. Childress, UCSB). Ocean Drilling Program leg 142 will begin efforts to drill the ridge axis in late January 1992 (R. Batiza, Univ of Hawaii). A special session on studies at 9-10°N will be held at the fall 1991 American Geophysical Union meeting.
Reference. Haymon, R., Fornari, D., Edwards, M., Carbotte, S., Wright, D., and Macdonald, K.C., Hydrothermal vent distribution along the East Pacific Rise crest (9°9'-54'N) and its relationship to magmatic and tectonic processes on fast-spreading mid-ocean ridges: Earth and Planetary Science Letters, v. 104, p. 513-534.
Geologic Background. Evidence for a very recent, possibly ongoing, eruption was detected during a series of dives in the submersible Alvin in 1991 on the East Pacific Rise at about 9°50'N. Hot-vent animal communities that had been documented during November-December 1989 had been buried by fresh basaltic lava flows, and the scorched soft tissues of partially buried biota had not yet attracted bottom scavengers. Fresh black smoker chimneys and new lava flows were present. This site is south of the Clipperton Fracture Zone at a depth of about 2,500 m, and about 1,000 km SW of Acapulco, México; the south end of the Lamont Seamount chain is about 10 km NW. It coincided with a location where fresh lava flows previously estimated as less than roughly 50 years in age had been found. Later dating of very short half-life radionuclides from dredged samples confirmed the young age of the eruption and indicated that another eruptive event had taken place in late 1991 and early 1992. An eruption in 2005-2006 produced lava flows that entrapped previously emplaced seismometers.
Information Contacts: R. Haymon, Univ of California, Santa Barbara; J. Hildebrand, S. Webb, and L. Dohrman, Scripps Inst of Oceanography; T. Stroh, RIDGE, Univ of Washington.
Ontakesan
Japan
35.893°N, 137.48°E; summit elev. 3067 m
All times are local (unless otherwise noted)
Seismicity declines slightly; steam plumes
Seismicity has remained at high levels since April, with nine tremor episodes and 234 small earthquakes recorded in June (figure 9), down from 28 and 313, respectively, in May. Similar seismicity +continued as of 18 July. White steam plumes . . . rose to 200 m height.
Geologic Background. The massive Ontakesan stratovolcano, the second highest volcano in Japan, lies at the southern end of the Northern Japan Alps. Ascending this volcano is one of the major objects of religious pilgrimage in central Japan. It is constructed within a largely buried 4 x 5 km caldera and occupies the southern end of the Norikura volcanic zone, which extends northward to Yakedake volcano. The older volcanic complex consisted of at least four major stratovolcanoes constructed from about 680,000 to about 420,000 years ago, after which Ontakesan was inactive for more than 300,000 years. The broad, elongated summit of the younger edifice is cut by a series of small explosion craters along a NNE-trending line. Several phreatic eruptions post-date the roughly 7300-year-old Akahoya tephra from Kikai caldera. The first historical eruption took place in 1979 from fissures near the summit. A non-eruptive landslide in 1984 produced a debris avalanche and lahar that swept down valleys south and east of the volcano. Very minor phreatic activity caused a dusting of ash near the summit in 1991 and 2007. A significant phreatic explosion in September 2014, when a large number of hikers were at or near the summit, resulted in many fatalities.
Information Contacts: JMA.
Pinatubo (Philippines) — June 1991 Cite this Report
Pinatubo
Philippines
15.13°N, 120.35°E; summit elev. 1486 m
All times are local (unless otherwise noted)
Continued ash emission with pulses to 15 km; typhoons trigger large lahars, leaving thousands homeless
As of 26 July, the volcano was still emitting ash continuously to 3-6 km height, with occasional pulses to 15-16 km. Typhoon rains triggered large debris flows down rivers on all sides of the volcano, inundating many of the towns in figure 11. Preliminary estimates of the eruption's size suggest that it is larger than those of Mt. St. Helens (1980) and El Chichón (1982), the largest eruptions of the last decade, but smaller than those of Cerro Azul/Quizapú (1932), Katmai/Novarupta (1912) and Santa María (1902), the largest of the century.
Paroxysmal activity, products and deposits. Damage from the eruption made evaluation of its products slow and difficult. The following preliminary information has been compiled over several weeks from our correspondents' visual observations, fieldwork, and airphoto/satellite image interpretation. Data on the paroxysmal phase supplement the report in 16:5.
Infrared video taken from the Clark Air Base control tower on 14 June suggests that the summit began to fail at 2320 as a fissure propagated tangentially across the summit. An explosion and apparent lateral blast, at 0555 the next day, removed the summit and produced a 25-km ash column. This event marked the onset of strong sustained activity that lasted until early 16 June.
The eruption's most violent explosive phase began at 1342 on 15 June and continued for more than 15 hours at full strength, with 30-40-km columns feeding a massive cloud. Intense seismicity began at 1440 and was felt continuously (at Mt. Arayat ~40 km E) by 1700. This seismicity lasted until about 0000 on 16 June, and was probably associated with the explosions or collapse that formed a nearly circular caldera, 2 km in diameter. The caldera was offset slightly N of the former summit, and the new summit was 145 m lower than before the eruption. The caldera wall ranged in height from 150-200 m at the highest point to 0 m on the E side. In the caldera's NE corner, a cone-shaped feature, ~75 m in diameter and 10 m high, was observed on satellite images. By 20 June, this feature was no longer visible, and the floor of the caldera appeared deeply ash-covered and relatively smooth. A conical depression developed in the SE corner of the caldera, reaching 800 m in diameter by 8 July and continuing to grow. No dome had been identified as of 26 July. No vegetation remained within 1-2 km of the caldera and trees 6-7 km away were defoliated.
Tephra fell primarily to the SE, S, and SW, but airfall distribution was complicated by the typhoon's winds. Pumice to roughly 7 cm fell 25 km E (at Clark Air Base) and particles to roughly 1.5 cm fell 33 km SSW (at Olongapo). Within 3 km of the caldera rim, ash thicknesses averaged 1-2 m. Eruption volume estimates and detailed isopach information were not available as of 26 July. The pumices are porphyritic biotite-hornblende quartz latite, and preliminary analyses indicate 66% SiO2, and 1.6% K2O.
The quoted material below is from Pinatubo Volcano Observatory reports.
"Pyroclastic flows reached radial distances of 12-18 km from the vent (figure 11) and were accompanied by ash clouds whose deposits ranged in thickness from a few to tens of centimeters. Thick pyroclastic-flow deposits (locally in excess of 200 m) occur in main valleys at distances of 5-15 km from the caldera, and have caused surface-drainage diversions that may have severe consequences as the monsoon and typhoon season gets into full swing. Blockage of the Sacobia River on the NE flank has raised the level of that drainage about 12 m above the level of the Abacan River capture point, potentially tripling the source drainage area for the modified Abacan River.
"Such factors as high velocity, high mobility, and low density allowed pyroclastic flows to drain off proximal slopes, which are covered by only a thin, discontinuous veneer. The flows removed vegetation and, in many places, soil and colluvium. Rugged highlands to the NE and SE, which are incised by narrow, steep canyons that head on high ridges separated from Pinatubo, have pyroclastic-flow fills several meters to perhaps 20 m thick locally. These deposits have been eroded extensively and occur as small patches in relatively protected areas along the canyons. Their distribution in such isolated valleys attests further to the great mobility of the pyroclastic flows. Pyroclastic-flow deposits downstream from the major fills were apparently formed by relatively dense flows, because vegetation along the margins of many was only slightly scorched. Conspicuous features include secondary explosion craters, fumaroles, breakaway scarps, and small ponds in blocked tributaries." Satellite data indicated that several lakes, up to 4 km x 350 m, were formed about 7 km W and NW of the caldera. Pyroclastic flows down the Sacobia River valley reached 3 km NW of housing on Clark Air Base, but did not reach the base itself. Numerous houses were swept away or buried by pyroclastic flows, 2-3 km SW of the caldera.
Activity, 16 June-mid July. Following the paroxysmal explosions on 14-16 June, tephra emission decreased and seismicity dropped dramatically (figure 12). With the strongest activity apparently ended, the radius of the official danger zone was reduced to 20 km on 17 June. Ash was emitted continuously to 3-6 km height, with periods of more intense explosions to 10 km height typically lasting several hours but separated by 5-7 hours. On 28 June, explosions were observed pulsating every 5 minutes from different points on the crater floor. Explosions were most frequently observed in the S and SE parts of the caldera.
Periods of sustained high-amplitude tremor and large long-period earthquakes (15-20/hour), represented as spikes on Realtime Seismic Amplitude Measurement (RSAM) plots, often coincided with higher ash ejection. A rough 7-hour periodicity was recognized for these spikes beginning about 7 July (figure 13). Ash emission during inter-eruptive periods (between spikes) gradually decreased and the repose period increased, before the pattern finally became irregular around noon on 11 July. This episode was accompanied by a coincident increase in seismic energy release (figure 14).
Earthquakes were occasionally felt as far away as Manila. The largest of these (M 5.9) was at 1250 on 3 July, and was centered 6 km NE of the volcano at 6 km depth (in a previously near-aseismic location). Most earthquakes, however, were centered beneath the volcano, at depths ranging from 0 to >20 km, whereas focal depths before the cataclysmic activity did not exceed 8 km depth (figure 15).
Rains triggered debris flows, ranging from landslides to hyperconcentrated flows, on all flanks of the volcano. Several of these flows were recorded seismically (figure13). On 23 June, at 2240-2330, a "hot" lahar was observed NW of the volcano on the Balintawak River near Poonbato. Hyperconcentrated flows were reported on the nearby Maronut River the next day, and to the SE (on the Pasig, Porac, and Gumain Rivers) on 30 June. Houses in Porac and Floridablanca (SE of Pinatubo) were buried up to roof level with volcanic debris. A lahar occurred on the Balintawak River the night of 30 June-1 July.
Large explosive episodes ejected ash clouds to 16 km height on 2 July, and explosive activity again intensified slightly on 7 July, ejecting ash clouds to 14-15 km height. Intense activity continued the next day and weather satellites observed clouds 14 km high at 0230-0250, >15 km high at 0700, 16 km high at 0800-0900, and about 15 km high at 1604. Eruption cloud heights of 15 and 16 km were measured on 7 and 8 July, respectively. Small, low-energy pyroclastic flows were observed billowing from within the caldera and travelling only a few hundred meters from the rim. Ash emission between explosive episodes was very low. SO2 fluxes, determined by COSPEC, were 5,190 t/d on 5 July, and 1,243 t/d on 9 July. Clear weather enabled the installation of several telemetered rain gauges. Observers reported hundreds of small ash avalanches off steep ridges into valleys. Periodic ash emissions to 15 km continued on the 17th, when the prevailing wind carried ash SE to Manila, closing the airport for two days.
Debris-flow activity, 7-10 July. Information about W-flank lahars in the next two sections is abstracted from a report by Kelvin Rodolfo.
In response to a 9 July warning of possible heavy rains, geologists were stationed at two W-flank sites to monitor rivers and warn downstream residents if lahars were detected. The next morning, an intense cloudburst in the headwaters of the Bucao River triggered a minor, dilute lahar. One team (10 km E of Botolan on the N bank of the Bucao River) heard a strong noise of rushing water and rolling boulders for 15 minutes before the head of the flow came into view at 0557. Approximately 25% of the channel was occupied by the flow. Velocities averaged 3.5 m/s (12.6 km/hour). Numerous boulders to 1.5 m were intermittently rolled and pushed by the flow at rates comparable to its velocity.
From a hazards perspective, geologists noted that the flow's most significant characteristic was its capacity to erode laterally. Along a straight stretch of channel, cutting rates from 1.6 to 6 minutes per meter of horizontal bank erosion were documented. Lateral erosion was by undercutting and slumping of blocks 1-6 m long, 1.5 m thick, and 0.3 to 1 m wide (average width, 0.5 m) that were continuously incorporated into the flow. Bank erosion rates were faster along an outer bend, ranging between 0.2 and 1.2 min/m, and averaging 0.9 min/m over 2 hours of observation and measurement. The lahar deposits behaved like quicksand, especially those with a high content of fine ash, and crossing them before they had some time to drain caused people and animals to sink knee-deep. Mayor Doble of Botolan reported that some trapped animals had died from starvation.
Mountain slopes partially cleansed of ash by runoff from moderate rain were green, as were portions of grasslands on the plains that escaped total burial. Farmers were impressed by the health of surviving plants.
East of the volcano, the press reported that lahars travelling down the Chico River (NE flank) deposited knee-deep mud in several villages on 10 July. At a village near Porac, flows broke through sandbags for the second time in 13 days, causing people to flee. The next day, debris flows traveled down the Pasig, Porac, and Gumain Rivers on the SE flank, causing extensive erosion in small tributaries.
A lahar observed on the Marimla River (ENE flank) on 15 July, was up to 50 m wide, 4 m deep, and highly erosive. Post-15 June wingwall and channelization efforts proved ineffective as the lahar breached the N levee downstream on the Bamban River (NE flank) in 3 places.
Typhoon-related debris-flow activity, 20-26 July. The first typhoon after the paroxysmal eruption passed N of Luzon 18-19 July. At 0900 on 18 July, in response to weather forecasts, geologists recommended that Lahar Alert 2 be issued for the W flank's Zambales region. Teams were sent to the Bucao and Santo Tomas rivers. A minor dilute lahar occurred from 2300 until 0630 the following morning, but was hardly noticeable at Botolan, and caused no damage.
After the typhoon, the threat of lahars persisted, with continued scattered thunderstorms around Pinatubo. Large lahars along various rivers E of Pinatubo buried sections of some towns (such as Guagua). W of Pinatubo, monitoring stations were established on the Bucao River east of Botolan, and at the junction of the Marella and Santo Tomas Rivers (threatening San Marcelino and nearby towns). Small, dilute lahars were observed on two evenings, but none was large enough either to escape its channels or to reach the sea.
Geologists cited three reasons for expecting strong rainfall to trigger serious flooding in all of coastal Zambales province. First, ash deposited on the steeper mountain slopes has been washed into creeks and rivers by the first rains, seriously reducing capacities of the drainages to hold water. Second, to clear the national highway, much of its ash cover was dumped by the roadside, choking many ditches. Third, during typhoons, large waves or tidal surges will effectively raise sea level, making it harder for rivers to enter the sea.
Installation of a USGS computer that receives telemetered rainfall data from instruments on Pinatubo's W flank will help warn people in Botolan, San Marcelino, and other towns threatened by lahars. Watchers at stations on the Bucao and Santo Tomas Rivers are equipped with two-way radios with which to contact threatened towns.
On the E side of the volcano, the press reported that large lahars on 20 July (related to typhoon Amy) destroyed more than 400 houses in Floridablanca, and buried more than 130 houses in Concepcion, forcing the evacuation of at least 1,200 people. This event brought the total number of houses damaged during the eruption to more than 80,000. Two days later, heavy rains from typhoon Brendan caused additional large lahars travelling 10 m/s at the slope breaks and 3 m/s at distal locations. Lahars to 3 m deep caused the evacuation of parts of 13 towns in Zambales (W flank), Tarlac, and Pampanga (E flank) provinces, with 2,000 initially fleeing from Santa Rita (just S of Concepcion) where 4,000 more were left stranded, unable to leave until the following morning. Evacuees from Pampanga province numbered about 10,000. Channel infilling and dike ruptures resulted in lahars up to 4 km wide on the Bamban River E of Concepcion, with similar activity along the O'Donnell, Abacan, Pasig, Porac, and Santo Tomas Rivers.
By 23 July, more than 60,000 people had fled their homes, with at least five killed during the previous two days. Mudflows, 5 m high, traveled through Concepcion at 8-11 m/s, sweeping several people away. Further lahars buried 11 villages near Sexmoan and damaged fish ponds, buried almost half of Santa Rita, and had completely silted up the Abacan River at the town of Mexico.
Debris flows continued to form on 25-26 July, with the onset of typhoon Caitlin. About 10,000 people evacuated Mexico and 308 houses were buried in 1.2 m of mud from flows down the Abacan River. A 30-m section was removed from the Mexico-Concepcion road. Swelling of the Santa Rita River caused 300 to flee Olongapo when houses were flooded waist deep. Flooding also occurred in Manila.
The press reported that by the 26th, 1.2 million people had either lost their homes or their livelihoods, 100,000 houses had been crushed or buried, and about 90,000 people remained in evacuation camps. Casualty reports ranged from 323 (with 40 missing), to more than 435.
Medical impact. The following is from Peter Baxter. The paroxysmal phase of the eruption caused the collapse of numerous buildings, and in some towns W of the volcano, destruction was complete. An estimated 250,000 people were evacuated, many moving to temporary camps. Efforts have been made to determine the medical hazards presented by the eruption, by characterizing ash composition and leachates, and measuring exposure to humans. Epidemiology teams from the U.S. Centers for Disease Control collected information on health and medical conditions at hospitals and evacuation camps, establishing programs to monitor food/water contamination and changing ash compositions. Preliminary information showed that ashfall was not yet a serious health problem. Heavy rains that coincided with the paroxysmal activity alleviated some ash problems by washing the suspended material out of the air. There had been no outbreaks of respiratory ailments, and surface water contamination was not a major problem since residents generally drink ground water. Concern was expressed that malaria, endemic on the W side of the volcano, might increase. There was additional concern for the mental health of people who have been forced to relocate several times and are now threatened by large mudflows.
Geologic Background. Prior to 1991 Pinatubo volcano was a relatively unknown, heavily forested lava dome complex located 100 km NW of Manila with no records of historical eruptions. The 1991 eruption, one of the world's largest of the 20th century, ejected massive amounts of tephra and produced voluminous pyroclastic flows, forming a small, 2.5-km-wide summit caldera whose floor is now covered by a lake. Caldera formation lowered the height of the summit by more than 300 m. Although the eruption caused hundreds of fatalities and major damage with severe social and economic impact, successful monitoring efforts greatly reduced the number of fatalities. Widespread lahars that redistributed products of the 1991 eruption have continued to cause severe disruption. Previous major eruptive periods, interrupted by lengthy quiescent periods, have produced pyroclastic flows and lahars that were even more extensive than in 1991.
Information Contacts: PVO, PHIVOLCS-USGS, Clark Air Base, Philippines; Kelvin Rodolfo, Univ of Illinois; Peter Baxter, Dept of Community Medicine, Fenner's, England; John Ewert, Edward Wolfe, and Richard Hoblitt, CVO; T. Casadevall, USGS Denver; Ellen Limburg-Santistevan, USGS Reston; Harvey Miller, Pearl Harbor CINCPACFLT, HI, USA; SAB; Manila Far East Broadcasting Company; AP; Reuters; UPI.
Poas
Costa Rica
10.2°N, 84.233°W; summit elev. 2697 m
All times are local (unless otherwise noted)
Continued gas emission; harmonic tremor
Gas emission continued from crater fumaroles (60-95°C) in June. The crater lake temperature was 73°C, similar to December-February values, while lake depth increased to 3 m, coinciding with heavy rainfall. Medium-frequency (2.5 Hz) harmonic tremor was recorded 6-17 June, occurring up to 24 hours/day (figure 38). Seismicity was dominantly low-frequency.
Geologic Background. The broad vegetated edifice of Poás, one of the most active volcanoes of Costa Rica, contains three craters along a N-S line. The frequently visited multi-hued summit crater lakes of the basaltic-to-dacitic volcano are easily accessible by vehicle from the nearby capital city of San José. A N-S-trending fissure cutting the complex stratovolcano extends to the lower N flank, where it has produced the Congo stratovolcano and several lake-filled maars. The southernmost of the two summit crater lakes, Botos, last erupted about 7,500 years ago. The more prominent geothermally heated northern lake, Laguna Caliente, is one of the world's most acidic natural lakes, with a pH of near zero. It has been the site of frequent phreatic and phreatomagmatic eruptions since an eruption was reported in 1828. Eruptions often include geyser-like ejections of crater-lake water.
Information Contacts: J. Barquero, E. Fernández, V. Barboza, R. Van der Laat, and E. Malavassi, OVSICORI; R. Barquero, G. Alvarado, M. Fernández, H. Flores, and S. Paniagua, ICE.
Rabaul (Papua New Guinea) — June 1991 Cite this Report
Rabaul
Papua New Guinea
4.2459°S, 152.1937°E; summit elev. 688 m
All times are local (unless otherwise noted)
Seismicity remains low; no significant deformation
". . . In June . . . the seismicity remained at a very low level with only 99 events recorded, all ML <1. Only four events could be plotted and were distributed on the N and W sides of the caldera seismic zone. Levelling, tilt, and EDM measurements showed no significant change."
Geologic Background. The low-lying Rabaul caldera on the tip of the Gazelle Peninsula at the NE end of New Britain forms a broad sheltered harbor utilized by what was the island's largest city prior to a major eruption in 1994. The outer flanks of the asymmetrical shield volcano are formed by thick pyroclastic-flow deposits. The 8 x 14 km caldera is widely breached on the east, where its floor is flooded by Blanche Bay and was formed about 1,400 years ago. An earlier caldera-forming eruption about 7,100 years ago is thought to have originated from Tavui caldera, offshore to the north. Three small stratovolcanoes lie outside the N and NE caldera rims. Post-caldera eruptions built basaltic-to-dacitic pyroclastic cones on the caldera floor near the NE and W caldera walls. Several of these, including Vulcan cone, which was formed during a large eruption in 1878, have produced major explosive activity during historical time. A powerful explosive eruption in 1994 occurred simultaneously from Vulcan and Tavurvur volcanoes and forced the temporary abandonment of Rabaul city.
Information Contacts: P. de Saint-Ours, RVO.
Nevado del Ruiz (Colombia) — June 1991 Cite this Report
Nevado del Ruiz
Colombia
4.892°N, 75.324°W; summit elev. 5279 m
All times are local (unless otherwise noted)
Ash emission and low seismicity; increased SO2 flux
Activity was generally at low levels in June, although there were one large ash emission and a high-frequency seismic swarm. The ash emission was associated with low to moderate levels of tremor, and deposited material on Manizales (30 km WNW). One earthquake, located 2.5 km S of the summit crater, was felt during the swarm. The monthly average SO2 flux, measured by COSPEC, was 2,275 t/d, compared to 930 t/d in May and ~2,740 t/d in April. Deformation measurements did not show significant changes.
Geologic Background. Nevado del Ruiz is a broad, glacier-covered volcano in central Colombia that covers more than 200 km2. Three major edifices, composed of andesitic and dacitic lavas and andesitic pyroclastics, have been constructed since the beginning of the Pleistocene. The modern cone consists of a broad cluster of lava domes built within the caldera of an older edifice. The 1-km-wide, 240-m-deep Arenas crater occupies the summit. The prominent La Olleta pyroclastic cone located on the SW flank may also have been active in historical time. Steep headwalls of massive landslides cut the flanks. Melting of its summit icecap during historical eruptions, which date back to the 16th century, has resulted in devastating lahars, including one in 1985 that was South America's deadliest eruption.
Information Contacts: C. Carvajal, INGEOMINAS, Manizales.
Slamet
Indonesia
7.242°S, 109.208°E; summit elev. 3428 m
All times are local (unless otherwise noted)
Plume emission follows harmonic tremor episodes
Harmonic tremor episodes (average frequency 2.5 Hz) began at 1730 on 24 June and were continuing as of early July. A dense 200-m-high plume was observed on 28 June. COSPEC measurements, started on 29 June, yielded SO2 fluxes of 66-87 t/d, compared to 30 t/d in 1988.
Geologic Background. Slamet, Java's second highest volcano at 3428 m and one of its most active, has a cluster of about three dozen cinder cones on its lower SE-NE flanks and a single cinder cone on the western flank. It is composed of two overlapping edifices, an older basaltic-andesite to andesitic volcano on the west and a younger basaltic to basaltic-andesite one on the east. Gunung Malang II cinder cone on the upper E flank on the younger edifice fed a lava flow that extends 6 km E. Four craters occur at the summit of Gunung Slamet, with activity migrating to the SW over time. Historical eruptions, recorded since the 18th century, have originated from a 150-m-deep, 450-m-wide, steep-walled crater at the western part of the summit and have consisted of explosive eruptions generally lasting a few days to a few weeks.
Information Contacts: W. Modjo, VSI.
Soputan
Indonesia
1.112°N, 124.737°E; summit elev. 1785 m
All times are local (unless otherwise noted)
Ash and vapor ejected but glow ends in late May; 50 m of new lava on crater floor
Emissions of moderate to weak white-gray ash and vapor rose 100-300 m in June, but the weak red glow visible over the crater since 22 May, vanished on 29 May. During fieldwork on 18 June, the crater floor (50 m in diameter) was covered by ~50 m of lava (approximate volume 2.4 x 10⁶ m3). Seismographs recorded 101 tectonic and 97 explosion earthquakes weekly, but no volcanic earthquakes were detected. An M 5.6 earthquake occurred on 20 June at 1319 in the Sulawesi Sea ~200 km NW of the volcano at 1.15°N, 122°E. The shock was felt (MM III) near Soputan.
Geologic Background. The Soputan stratovolcano on the southern rim of the Quaternary Tondano caldera on the northern arm of Sulawesi Island is one of Sulawesi's most active volcanoes. The youthful, largely unvegetated volcano is the only active cone in the Sempu-Soputan volcanic complex, which includes the Soputan caldera, Rindengan, and Manimporok (3.5 km ESE). Kawah Masem maar was formed in the W part of the caldera and contains a crater lake; sulfur has been extracted from fumarolic areas in the maar since 1938. Recent eruptions have originated at both the summit crater and Aeseput, a prominent NE-flank vent that formed in 1906 and was the source of intermittent major lava flows until 1924.
Information Contacts: W. Modjo, VSI.
Stromboli
Italy
38.789°N, 15.213°E; summit elev. 924 m
All times are local (unless otherwise noted)
Explosions eject glowing fragments and gas columns
The number of recorded explosion shocks remained elevated through late June (figure 15), with mean rates relatively stable near the long-term "normal value" of 6/hour. Average tremor amplitude declined slightly at the beginning of June while the number of saturating earthquakes rose sharply (figure 16). Volcano guides reported that the activity was concentrated at Crater 3, where explosions ejected glowing fragments and white gas columns that rose 100-200 m in late June. Explosions were rare from other craters, but tephra built small cones in Crater 2. White gas emission was continuous.
Geologic Background. Spectacular incandescent nighttime explosions at Stromboli have long attracted visitors to the "Lighthouse of the Mediterranean" in the NE Aeolian Islands. This volcano has lent its name to the frequent mild explosive activity that has characterized its eruptions throughout much of historical time. The small island is the emergent summit of a volcano that grew in two main eruptive cycles, the last of which formed the western portion of the island. The Neostromboli eruptive period took place between about 13,000 and 5,000 years ago. The active summit vents are located at the head of the Sciara del Fuoco, a prominent scarp that formed about 5,000 years ago due to a series of slope failures which extends to below sea level. The modern volcano has been constructed within this scarp, which funnels pyroclastic ejecta and lava flows to the NW. Essentially continuous mild Strombolian explosions, sometimes accompanied by lava flows, have been recorded for more than a millennium.
Information Contacts: M. Riuscetti, Univ di Udine.
Unzendake
Japan
32.761°N, 130.299°E; summit elev. 1483 m
All times are local (unless otherwise noted)
Continued lava dome growth; debris flows to 7.5 km destroy houses; evacuations prevent more casualties
Lava extrusion from Jigoku-ato crater began on 20 May. As growth of the dome continued, its E side, advancing down the steep upper flank, became structurally unstable, and collapse episodes triggered pyroclastic flows that traveled E down the Mizunashi River beginning 24 May. Pyroclastic flows were frequent in June, and continued as of mid-July (table 7). A large pyroclastic flow on 3 June traveled 4.6 km, reaching Kita-Kamikoba (a district of Shimabara), where 41 people were killed, and many houses destroyed. On 8 June, a pyroclastic flow advanced 5.5 km (the largest as of 24 July; figure 23), reaching the coast highway (57) and destroying additional houses. Evacuations prevented any injuries. An explosion from the crater at 2359 on 11 June ejected pumice, up to 10 cm in diameter, that fell 10 km NE. Ashfall was reported 250 km NE (at Matsuyama, Shikoku Is.). No further explosions had occurred by 24 July.
Table 7. Volcanic activity at Unzen along with injuries and major damage, and actions taken by the Coordinating Committee for the Prediction of Volcanic Eruptions, November 1990-24 July 1991. Courtesy of D. Shimozuru.
| Date |
Volcanic Activity and Action by Committee |
| 17 Nov 1990 |
Minor phreatic eruption; Official statement issued. |
| early Dec 1990 |
Surface activity declines. |
| 12 Dec 1990 |
Official statement issued, warning of future activity based on seismicity. |
| 13 May 1991 |
Shallow earthquakes begin beneath crater. |
| 17 May 1991 |
Official statement issued, warning of the appearance of lava. |
| 20 May 1991 |
Lava appears in crater. |
| 24 May 1991 |
First minor pyroclastic flow observed. |
| 26 May 1991 |
Official statement issued, warning of debris flows and pyroclastic flows. One person injured by pyroclastic flow. |
| 31 May 1991 |
Committee meeting held evaluating activity; setup of advanced HQ at Shimabara Volcano Obs. proposed to deal with rapid changes in activity. |
| 03 Jun 1991 |
Pyroclastic flow kills 41 people, injures 11 people, and destroys 49 houses. |
| 08 Jun 1991 |
Pyroclastic flow destroys 70 houses. |
| 11 Jun 1991 |
Official statement issued from Shimabara. Block fall damages 11 houses and 53 cars. |
| mid-Jun 1991 |
Continuous ash emission. |
| 19 Jun 1991 |
Increase in pyroclastic-flow rate for 2 hours. |
| 30 Jun 1991 |
Heavy rainfall caused large debris flow, destroying 87 houses and injuring one person. |
| 01-24 Jul 1991 |
Dome growth, partial collapse, and pyroclastic flows continued. Flows became smaller and less frequent. Continuous ash emission from crater since 13 July. |
The pyroclastic-flow rate increased briefly on 19 June (between 1400 and 1600) with some of the larger flows traveling 2 km E. Larger pyroclastic flows were reported by the press on 26 and 27 June (~2.5 and 3.5 km in length, respectively). Ash elutriated from pyroclastic flows fell to the NE in June and July. By the end of June, the crater dome was about 150 x 250 m and 80 m thick, and pyroclastic flows were recorded seismically 10-20 times daily (figure 24).
On 30 June, heavy rainfall caused a large debris flow down the Mizunashi River, injuring one person, and destroying 87 houses [a total of 202 were damaged] near the coast (7.5 km E). The area affected by the flow was entirely within the evacuation zone designated in early June (a 5 x 5 km zone E of the summit, including parts of Shimabara and Fukae), with a pre-evacuation population of 12,395.
The dome continued to grow E, reaching 150 x 530 m and 80 m thick by 21 July. The eruption rate calculated from dome and pyroclastic deposit volumes was 0.3 x 10⁶ m3/day in June and July, although the rate of dome growth was higher in July. Continuous ash emission to 1,000 m height began 13 July, echoing a similar period in mid-June.
By mid-July, the month's longest pyroclastic flows had advanced
Summit seismicity was at lower levels in June and July than in May, with 230 earthquakes recorded in June, compared to 1959 in May. The monthly number of tremor episodes increased dramatically in June, apparently associated with small dome collapses.
An earthquake swarm, from 23 June to early July, was centered 18 km SW of the summit, at 10 km depth (figure 25). Nine of the earthquakes were felt. However, seismicity near the volcano and to its W (in Tachibana Bay) was lower in June and July than in previous months.
Geologic Background. The massive Unzendake volcanic complex comprises much of the Shimabara Peninsula east of the city of Nagasaki. An E-W graben, 30-40 km long, extends across the peninsula. Three large stratovolcanoes with complex structures, Kinugasa on the north, Fugen-dake at the east-center, and Kusenbu on the south, form topographic highs on the broad peninsula. Fugendake and Mayuyama volcanoes in the east-central portion of the andesitic-to-dacitic volcanic complex have been active during the Holocene. The Mayuyama lava dome complex, located along the eastern coast west of Shimabara City, formed about 4000 years ago and was the source of a devastating 1792 CE debris avalanche and tsunami. Historical eruptive activity has been restricted to the summit and flanks of Fugendake. The latest activity during 1990-95 formed a lava dome at the summit, accompanied by pyroclastic flows that caused fatalities and damaged populated areas near Shimabara City.
Information Contacts: JMA; S. Nakada, Kyushu Univ; Kyodo News Service, Tokyo.