Recently Published Bulletin Reports
Erebus (Antarctica) Lava lake remains active; most thermal alerts recorded since 2019
Rincon de la Vieja (Costa Rica) Frequent phreatic explosions during July-December 2023
Bezymianny (Russia) Explosion on 18 October 2023 sends ash plume 8 km high; lava flows and incandescent avalanches
Kilauea (United States) Low-level lava effusions in the lava lake at Halema’uma’u during July-December 2022
Nyamulagira (DR Congo) Lava flows and thermal activity during May-October 2023
Bagana (Papua New Guinea) Explosions, ash plumes, ashfall, and lava flows during April-September 2023
Mayon (Philippines) Lava flows, pyroclastic flows, ash emissions, and seismicity during April-September 2023
Nishinoshima (Japan) Eruption plumes and gas-and-steam plumes during May-August 2023
Krakatau (Indonesia) White gas-and-steam plumes and occasional ash plumes during May-August 2023
Villarrica (Chile) Strombolian activity, gas-and-ash emissions, and crater incandescence during April-September 2023
Merapi (Indonesia) Frequent incandescent avalanches during April-September 2023
Ebeko (Russia) Moderate explosive activity with ash plumes continued during June-November 2023
Erebus (Antarctica) — January 2024  Cite this Report
Erebus
Antarctica
77.53°S, 167.17°E; summit elev. 3794 m
All times are local (unless otherwise noted)
Lava lake remains active; most thermal alerts recorded since 2019
The lava lake in the summit crater of Erebus has been active since at least 1972. Located in Antarctica overlooking the McMurdo Station on Ross Island, it is the southernmost active volcano on the planet. Because of the remote location, activity is primarily monitored by satellites. This report covers activity during 2023.
The number of thermal alerts recorded by the Hawai'i Institute of Geophysics and Planetology’s MODVOLC Thermal Alerts System increased considerably in 2023 compared to the years 2020-2022 (table 9). In contrast to previous years, the MODIS instruments aboard the Aqua and Terra satellites captured data from Erebus every month during 2023. Consistent with previous years, the lowest number of anomalous pixels were recorded in January, November, and December.
Table 9. Number of monthly MODIS-MODVOLC thermal alert pixels recorded at Erebus during 2017-2023. See BGVN 42:06 for data from 2000 through 2016. The table was compiled using data provided by the HIGP – MODVOLC Thermal Alerts System.
| Year |
Jan |
Feb |
Mar |
Apr |
May |
Jun |
Jul |
Aug |
Sep |
Oct |
Nov |
Dec |
SUM |
| 2017 |
0 |
21 |
9 |
0 |
0 |
1 |
11 |
61 |
76 |
52 |
0 |
3 |
234 |
| 2018 |
0 |
21 |
58 |
182 |
55 |
17 |
137 |
172 |
103 |
29 |
0 |
0 |
774 |
| 2019 |
2 |
21 |
162 |
151 |
55 |
56 |
75 |
53 |
29 |
19 |
1 |
0 |
624 |
| 2020 |
0 |
2 |
16 |
18 |
4 |
4 |
1 |
3 |
18 |
3 |
1 |
6 |
76 |
| 2021 |
0 |
9 |
1 |
0 |
2 |
56 |
46 |
47 |
35 |
52 |
5 |
3 |
256 |
| 2022 |
1 |
13 |
55 |
22 |
15 |
32 |
39 |
19 |
31 |
11 |
0 |
0 |
238 |
| 2023 |
2 |
33 |
49 |
82 |
41 |
32 |
70 |
64 |
42 |
17 |
5 |
11 |
448 |
Sentinel-2 infrared images showed one or two prominent heat sources within the summit crater, accompanied by adjacent smaller sources, similar to recent years (see BGVN 46:01, 47:02, and 48:01). A unique image was obtained on 25 November 2023 by the OLI-2 (Operational Land Imager-2) on Landsat 9, showing the upper part of the volcano surrounded by clouds (figure 32).
Geologic Background. Mount Erebus, the world's southernmost historically active volcano, overlooks the McMurdo research station on Ross Island. It is the largest of three major volcanoes forming the crudely triangular Ross Island. The summit of the dominantly phonolitic volcano has been modified by one or two generations of caldera formation. A summit plateau at about 3,200 m elevation marks the rim of the youngest caldera, which formed during the late-Pleistocene and within which the modern cone was constructed. An elliptical 500 x 600 m wide, 110-m-deep crater truncates the summit and contains an active lava lake within a 250-m-wide, 100-m-deep inner crater; other lava lakes are sometimes present. The glacier-covered volcano was erupting when first sighted by Captain James Ross in 1841. Continuous lava-lake activity with minor explosions, punctuated by occasional larger Strombolian explosions that eject bombs onto the crater rim, has been documented since 1972, but has probably been occurring for much of the volcano's recent history.
Information Contacts: Hawai'i Institute of Geophysics and Planetology (HIGP) - MODVOLC Thermal Alerts System, School of Ocean and Earth Science and Technology (SOEST), Univ. of Hawai'i, 2525 Correa Road, Honolulu, HI 96822, USA (URL: http://modis.higp.hawaii.edu/); Copernicus Browser, Copernicus Data Space Ecosystem, European Space Agency (URL: https://dataspace.copernicus.eu/browser/); NASA Earth Observatory, EOS Project Science Office, NASA Goddard Space Flight Center, Goddard, Maryland, USA (URL: https://earthobservatory.nasa.gov/images/152134/erebus-breaks-through).
Rincon de la Vieja (Costa Rica) — January 2024 Cite this Report
Rincon de la Vieja
Costa Rica
10.83°N, 85.324°W; summit elev. 1916 m
All times are local (unless otherwise noted)
Frequent phreatic explosions during July-December 2023
Rincón de la Vieja is a volcanic complex in Costa Rica with a hot convecting acid lake that exhibits frequent weak phreatic explosions, gas-and-steam emissions, and occasional elevated sulfur dioxide levels (BGVN 45:10, 46:03, 46:11). The current eruption period began June 2021. This report covers activity during July-December 2023 and is based on weekly bulletins and occasional daily reports from the Observatorio Vulcanologico Sismologica de Costa Rica-Universidad Nacional (OVSICORI-UNA).
Numerous weak phreatic explosions continued during July-December 2023, along with gas-and-steam emissions and plumes that rose as high as 3 km above the crater rim. Many weekly OVSICORI-UNA bulletins included the previous week's number of explosions and emissions (table 9). For many explosions, the time of explosion was given (table 10). Frequent seismic activity (long-period earthquakes, volcano-tectonic earthquakes, and tremor) accompanied the phreatic activity.
Table 9. Number of reported weekly phreatic explosions and gas-and-steam emissions at Rincón de la Vieja, July-December 2023. Counts are reported for the week before the Weekly Bulletin date; not all reports included these data. Courtesy of OVSICORI-UNA.
| OVSICORI Weekly Bulletin |
Number of explosions |
Number of emissions |
| 28 Jul 2023 |
6 |
14 |
| 4 Aug 2023 |
10 |
12 |
| 1 Sep 2023 |
13 |
11 |
| 22 Sep 2023 |
12 |
13 |
| 29 Sep 2023 |
6 |
11 |
| 6 Oct 2023 |
12 |
5 |
| 13 Oct 2023 |
7 |
9 |
| 20 Oct 2023 |
1 |
15 |
| 27 Oct 2023 |
3 |
23 |
| 3 Nov 2023 |
3 |
10 |
| 17 Nov 2023 |
0 |
Some |
| 24 Nov 2023 |
0 |
14 |
| 8 Dec 2023 |
4 |
16 |
| 22 Dec 2023 |
8 |
18 |
Table 10. Summary of activity at Rincón de la Vieja during July-December 2023. Weak phreatic explosions and gas emissions are noted where the time of explosion was indicated in the weekly or daily bulletins. Height of plumes or emissions are distance above the crater rim. Courtesy of OVSICORI-UNA.
| Date |
Time |
Description of Activity |
| 1 Jul 2023 |
0156 |
Explosion. |
| 2 Jul 2023 |
0305 |
Explosion. |
| 4 Jul 2023 |
0229, 0635 |
Event at 0635 produced a gas-and-steam plume that rose 700 m and drifted W; seen by residents in Liberia (21 km SW). |
| 9 Jul 2023 |
1843 |
Explosion. |
| 21 Jul 2023 |
0705 |
Explosion. |
| 26 Jul 2023 |
1807 |
Explosion. |
| 28 Jul 2023 |
0802 |
Explosion generated a gas-and-steam plume that rose 500 m. |
| 30 Jul 2023 |
1250 |
Explosion. |
| 31 Jul 2023 |
2136 |
Explosion. |
| 11 Aug 2023 |
0828 |
Explosion. |
| 18 Aug 2023 |
1304 |
Explosion. |
| 21 Aug 2023 |
1224 |
Explosion generated gas-and-steam plumes rose 500-600 m. |
| 22 Aug 2023 |
0749 |
Explosion generated gas-and-steam plumes rose 500-600 m. |
| 24 Aug 2023 |
1900 |
Explosion. |
| 25 Aug 2023 |
0828 |
Event produced a steam-and-gas plume that rose 3 km and drifted NW. |
| 27-28 Aug 2023 |
0813 |
Four small events; the event at 0813 on 28 August lasted two minutes and generated a steam-and-gas plume that rose 2.5 km. |
| 1 Sep 2023 |
1526 |
Explosion generated plume that rose 2 km and ejected material onto the flanks. |
| 2-3 Sep 2023 |
- |
Small explosions detected in infrasound data. |
| 4 Sep 2023 |
1251 |
Gas-and-steam plume rose 1 km and drifted W. |
| 7 Nov 2023 |
1113 |
Explosion. |
| 8 Nov 2023 |
0722 |
Explosion. |
| 12 Nov 2023 |
0136 |
Small gas emissions. |
| 14 Nov 2023 |
0415 |
Small gas emissions. |
According to OVSICORI-UNA, during July-October the average weekly sulfur dioxide (SO2) flux ranged from 68 to 240 tonnes/day. However, in mid-November the flux increased to as high as 334 tonnes/day, the highest value measured in recent years. The high SO2 flux in mid-November was also detected by the TROPOMI instrument on the Sentinel-5P satellite (figure 43).
Geologic Background. Rincón de la Vieja, the largest volcano in NW Costa Rica, is a remote volcanic complex in the Guanacaste Range. The volcano consists of an elongated, arcuate NW-SE-trending ridge constructed within the 15-km-wide early Pleistocene Guachipelín caldera, whose rim is exposed on the south side. Sometimes known as the "Colossus of Guanacaste," it has an estimated volume of 130 km3 and contains at least nine major eruptive centers. Activity has migrated to the SE, where the youngest-looking craters are located. The twin cone of Santa María volcano, the highest peak of the complex, is located at the eastern end of a smaller, 5-km-wide caldera and has a 500-m-wide crater. A Plinian eruption producing the 0.25 km3 Río Blanca tephra about 3,500 years ago was the last major magmatic eruption. All subsequent eruptions, including numerous historical eruptions possibly dating back to the 16th century, have been from the prominent active crater containing a 500-m-wide acid lake located ENE of Von Seebach crater.
Information Contacts: Observatorio Vulcanológico Sismológica de Costa Rica-Universidad Nacional (OVSICORI-UNA), Apartado 86-3000, Heredia, Costa Rica (URL: http://www.ovsicori.una.ac.cr/); NASA Global Sulfur Dioxide Monitoring Page, Atmospheric Chemistry and Dynamics Laboratory, NASA Goddard Space Flight Center (NASA/GSFC), 8800 Greenbelt Road, Goddard MD 20771, USA (URL: https://so2.gsfc.nasa.gov/).
Bezymianny (Russia) — November 2023 Cite this Report
Bezymianny
Russia
55.972°N, 160.595°E; summit elev. 2882 m
All times are local (unless otherwise noted)
Explosion on 18 October 2023 sends ash plume 8 km high; lava flows and incandescent avalanches
Bezymianny, located on Russia’s Kamchatka Peninsula, has had eruptions since 1955 characterized by dome growth, explosions, pyroclastic flows, ash plumes, and ashfall. Activity during November 2022-April 2023 included gas-and-steam emissions, lava dome collapses generating avalanches, and persistent thermal activity. Similar eruptive activity continued from May through October 2023, described here based on information from weekly and daily reports of the Kamchatka Volcano Eruptions Response Team (KVERT), notices from Tokyo VAAC (Volcanic Ash Advisory Center), and from satellite data.
Overall activity decreased after the strong period of activity in late March through April 2023, which included ash explosions during 29 March and 7-8 April 2023 that sent plumes as high as 10-12 km altitude, along with dome growth and lava flows (BGVN 48:05). This reduced activity can be seen in the MIROVA thermal detection system graph (figure 56), which was consistent with data from the MODVOLC thermal detection system and with Sentinel-2 satellite images that showed persistent hotspots in the summit crater when conditions allowed observations. A renewed period of strong activity began in mid-October 2023.
Activity increased significantly on 17 October 2023 when large collapses began during 0700-0830 on the E flanks of the lava dome and continued to after 0930 the next day (figure 57). Ash plumes rose to an altitude of 4.5-5 km, extending 220 km NNE by 18 October. A large explosion at 1630 on 18 October produced an ash plume that rose to an altitude of 11 km (8 km above the summit) and drifted NNE and then NW, extending 900 km NW within two days at an altitude of 8 km. Minor ashfall was noted in Kozyrevsk (45 km WNW). At 0820 on 20 October an ash plume was identified in satellite images drifting 100 km ENE at altitudes of 4-4.5 km.
Lava flows and hot avalanches from the dome down the SE flank continued over the next few days, including 23 October when clear conditions allowed good observations (figures 58 and 59). A large thermal anomaly was observed over the volcano through 24 October, and in the summit crater on 30 October (figure 60). Strong fumarolic activity continued, with numerous avalanches and occasional incandescence. By the last week of October, volcanic activity had decreased to a level consistent with that earlier in the reporting period.
Aviation warnings were frequently updated during 17-20 October. KVERT issued a Volcano Observatory Notice for Aviation (VONA) on 17 October at 1419 and 1727 (0219 and 0527 UTC) raising the Aviation Color Code (ACC) from Yellow to Orange (second highest level). The next day, KVERT issued a VONA at 1705 (0505 UTC) raising the ACC to Red (highest level) but lowered it back to Orange at 2117 (0917 UTC). After another decrease to Yellow and back to Orange, the ACC was reduced to Yellow on 20 October at 1204 (0004 UTC). In addition, the Tokyo VAAC issued a series of Volcanic Ash Advisories beginning on 16 October and continuing through 30 October.
Geologic Background. The modern Bezymianny, much smaller than its massive neighbors Kamen and Kliuchevskoi on the Kamchatka Peninsula, was formed about 4,700 years ago over a late-Pleistocene lava-dome complex and an edifice built about 11,000-7,000 years ago. Three periods of intensified activity have occurred during the past 3,000 years. The latest period, which was preceded by a 1,000-year quiescence, began with the dramatic 1955-56 eruption. This eruption, similar to that of St. Helens in 1980, produced a large open crater that was formed by collapse of the summit and an associated lateral blast. Subsequent episodic but ongoing lava-dome growth, accompanied by intermittent explosive activity and pyroclastic flows, has largely filled the 1956 crater.
Information Contacts: Kamchatka Volcanic Eruptions Response Team (KVERT), Far Eastern Branch, Russian Academy of Sciences, 9 Piip Blvd., Petropavlovsk-Kamchatsky, 683006, Russia (URL: http://www.kscnet.ru/ivs/kvert/); Kamchatka Volcanological Station, Kamchatka Branch of Geophysical Survey, (KB GS RAS), Klyuchi, Kamchatka Krai, Russia (URL: http://volkstat.ru/); Tokyo Volcanic Ash Advisory Center (VAAC), 1-3-4 Otemachi, Chiyoda-ku, Tokyo 100-8122, Japan (URL: http://ds.data.jma.go.jp/svd/vaac/data/); Hawai'i Institute of Geophysics and Planetology (HIGP) - MODVOLC Thermal Alerts System, School of Ocean and Earth Science and Technology (SOEST), Univ. of Hawai'i, 2525 Correa Road, Honolulu, HI 96822, USA (URL: http://modis.higp.hawaii.edu/); MIROVA (Middle InfraRed Observation of Volcanic Activity), a collaborative project between the Universities of Turin and Florence (Italy) supported by the Centre for Volcanic Risk of the Italian Civil Protection Department (URL: http://www.mirovaweb.it/); Copernicus Browser, Copernicus Data Space Ecosystem, European Space Agency (URL: https://dataspace.copernicus.eu/browser/).chr
Kilauea (United States) — January 2023 Cite this Report
Kilauea
United States
19.421°N, 155.287°W; summit elev. 1222 m
All times are local (unless otherwise noted)
Low-level lava effusions in the lava lake at Halema’uma’u during July-December 2022
Kīlauea is the southeastern-most volcano in Hawaii and overlaps the E flank of the Mauna Loa volcano. Its East Rift Zone (ERZ) has been intermittently active for at least 2,000 years. An extended eruption period began in January 1983 and was characterized by open lava lakes and lava flows from the summit caldera and the East Rift Zone. During May 2018 magma migrated into the Lower East Rift Zone (LERZ) and opened 24 fissures along a 6-km-long NE-trending fracture zone that produced lava flows traveling in multiple directions. As lava emerged from the fissures, the lava lake at Halema'uma'u drained and explosions sent ash plumes to several kilometers altitude (BGVN 43:10).
The current eruption period started during September 2021 and has recently been characterized by lava effusions, spatter, and sulfur dioxide emissions in the active Halema’uma’u lava lake (BGVN 47:08). Lava effusions, some spatter, and sulfur dioxide emissions have continued during this reporting period of July through December 2022 using daily reports, volcanic activity notices, and abundant photo, map, and video data from the US Geological Survey's (USGS) Hawaiian Volcano Observatory (HVO).
Summary of activity during July-December 2022. Low-level effusions have continued at the western vent of the Halema’uma’u crater during July through early December 2022. Occasional weak ooze-outs (also called lava break outs) would occur along the margins of the crater floor. The overall level of the active lava lake throughout the reporting period gradually increased due to infilling, however it stagnated in mid-September (table 13). During September through November, activity began to decline, though lava effusions persisted at the western vent. By 9 December, the active part of the lava lake had completely crusted over, and incandescence was no longer visible.
Table 13. Summary of measurements taken during overflights at Kīlauea that show a gradual increase in the active lava lake level and the volume of lava effused since 29 September 2021. Lower activity was reported during September-October. Data collected during July-December 2022. Courtesy of HVO.
| Date: |
Level of the active lava lake (m): |
Cumulative volume of lava effused (million cubic meters): |
| 7 Jul 2022 |
130 |
95 |
| 19 Jul 2022 |
133 |
98 |
| 4 Aug 2022 |
136 |
102 |
| 16 Aug 2022 |
137 |
104 |
| 12 Sep 2022 |
143 |
111 |
| 5 Oct 2022 |
143 |
111 |
| 28 Oct 2022 |
143 |
111 |
Activity during July 2022. Lava effusions were reported from the western vent in the Halema’uma’u crater, along with occasional weak ooze-outs along the margins of the crater floor. The height of the lava lake was variable due to deflation-inflation tilt events; for example, the lake level dropped approximately 3-4 m during a summit deflation-inflation event reported on 1 July. Webcam images taken during the night of 6-12 July showed intermittent low-level spattering at the western vent that rose less than 10 m above the vent (figure 519). Measurements made during an overflight on 7 July indicated that the crater floor was infilled about 130 m and that 95 million cubic meters of lava had been effused since 29 September 2021. A single, relatively small lava ooze-out was active to the S of the lava lake. Around midnight on 8 July there were two brief periods of lava overflow onto the lake margins. On 9 July lava ooze-outs were reported near the SE and NE edges of the crater floor and during 10-11 July they occurred near the E, NE, and NW edges. On 16 July crater incandescence was reported, though the ooze-outs and spattering were not visible. On 18 July overnight webcam images showed incandescence in the western vent complex and two ooze-outs were reported around 0000 and 0200 on 19 July. By 0900 there were active ooze-outs along the SW edge of the crater floor. Measurements made from an overflight on 19 July indicated that the crater floor was infilled about 133 m and 98 million cubic meters of lava had erupted since 29 September 2021 (figure 520). On 20 July around 1600 active ooze-outs were visible along the N edge of the crater, which continued through the next day. Extensive ooze-outs occurred along the W margin during 24 July until 1900; on 26 July minor ooze-outs were noted along the N margin. Minor spattering was visible on 29 July along the E margin of the lake. The sulfur dioxide emission rates ranged 650-2,800 tons per day (t/d), the higher of which was measured on 8 July (figure 519).
Activity during August 2022. The eruption continued in the Halema’uma’u crater at the western vent. According to HVO the lava in the active lake remained at the level of the bounding levees. Occasional minor ooze-outs were observed along the margins of the crater floor. Strong nighttime crater incandescence was visible after midnight on 6 August over the western vent cone. During 6-7 August scattered small lava lobes were active along the crater floor and incandescence persisted above the western vent through 9 August. During 7-9 August HVO reported a single lava effusion source was active along the NW margin of the crater floor. Measurements from an overflight on 4 August indicated that the crater floor was infilled about 136 m total and that 102 million cubic meters of lava had been erupted since the start of the eruption. Lava breakouts were reported along the N, NE, E, S, and W margins of the crater during 10-16 August. Another overflight survey conducted on 16 August indicated that the crater floor infilled about 137 m and 104 million cubic meters of lava had been erupted since September 2021. Measured sulfur dioxide emissions rates ranged 1,150-2,450 t/d, the higher of which occurred on 8 August.
Activity during September 2022. During September, lava effusion continued from the western vent into the active lava lake and onto the crater floor. Intermittent minor ooze-outs were reported through the month. A small ooze-out was visible on the W crater floor margin at 0220 on 2 September, which showed decreasing surface activity throughout the day, but remained active through 3 September. On 3 September around 1900 a lava outbreak occurred along the NW margin of the crater floor but had stopped by the evening of 4 September. Field crews monitoring the summit lava lake on 9 September observed spattering on the NE margin of the lake that rose no higher than 10 m, before falling back onto the lava lake crust (figure 521). Overflight measurements on 12 September indicated that the crater floor was infilled a total of 143 m and 111 million cubic meters of lava had been erupted since September 2021. Extensive breakouts in the W and N part of the crater floor were reported at 1600 on 20 September and continued into 26 September. The active part of the lava lake dropped by 10 m while other parts of the crater floor dropped by several meters. Summit tiltmeters recorded a summit seismic swarm of more than 80 earthquakes during 1500-1800 on 21 September, which occurred about 1.5 km below Halema’uma’u; a majority of these were less than Mw 2. By 22 September the active part of the lava lake was infilled about 2 m. On 23 September the western vent areas exhibited several small spatter cones with incandescent openings, along with weak, sporadic spattering (figure 522). The sulfur dioxide emission rate ranged from 930 t/d to 2,000 t/d, the higher of which was measured on 6 September.
Activity during October 2022. Activity during October declined slightly compared to previous months, though lava effusions persisted from the western vent into the active lava lake and onto the crater floor during October (figure 523). Slight variations in the lava lake were noted throughout the month. HVO reported that around 0600 on 3 October the level of the lava lake has lowered slightly. Overflight measurements taken on 5 October indicated that the crater floor was infilled a total of about 143 m and that 111 million cubic meters of lava had been effused since September 2021. During 6-7 October the lake gradually rose 0.5 m. Sulfur dioxide measurements made on 22 October had an emission rate of 700 t/d. Another overflight taken on 28 October showed that there was little to no change in the elevation of the crater floor: the crater floor was infilled a total of 143 m and 111 million cubic meters of lava had erupted since the start of the eruption.
Activity during November 2022. Activity remained low during November, though HVO reported that lava from the western vent continued to effuse into the active lava lake and onto the crater floor throughout the month. The rate of sulfur dioxide emissions during November ranged from 300-600 t/d, the higher amount of which occurred on 9 November.
Activity during December 2022. Similar low activity was reported during December, with lava effusing from the western vent into the active lava lake and onto the crater floor. During 4-5 December the active part of the lava lake was slightly variable in elevation and fluctuated within 1 m. On 9 December HVO reported that lava was no longer erupting from the western vent in the Halema’uma’u crater and that sulfur dioxide emissions had returned to near pre-eruption background levels; during 10-11 December, the lava lake had completely crusted over, and no incandescence was visible (figure 524). Time lapse camera images covering the 4-10 December showed that the crater floor showed weak deflation and no inflation. Some passive events of crustal overturning were reported during 14-15 December, which brought fresh incandescent lava to the lake surface. The sulfur dioxide emission rate was approximately 200 t/d on 14 December. A smaller overturn event on 17 December and another that occurred around 0000 and into the morning of 20 December were also detected. A small seismic swarm was later detected on 30 December.
Geologic Background. Kilauea overlaps the E flank of the massive Mauna Loa shield volcano in the island of Hawaii. Eruptions are prominent in Polynesian legends; written documentation since 1820 records frequent summit and flank lava flow eruptions interspersed with periods of long-term lava lake activity at Halemaumau crater in the summit caldera until 1924. The 3 x 5 km caldera was formed in several stages about 1,500 years ago and during the 18th century; eruptions have also originated from the lengthy East and Southwest rift zones, which extend to the ocean in both directions. About 90% of the surface of the basaltic shield volcano is formed of lava flows less than about 1,100 years old; 70% of the surface is younger than 600 years. The long-term eruption from the East rift zone between 1983 and 2018 produced lava flows covering more than 100 km2, destroyed hundreds of houses, and added new coastline.
Information Contacts: Hawaiian Volcano Observatory (HVO), U.S. Geological Survey, PO Box 51, Hawai'i National Park, HI 96718, USA (URL: http://hvo.wr.usgs.gov/).
Nyamulagira (DR Congo) — November 2023 Cite this Report
Nyamulagira
DR Congo
1.408°S, 29.2°E; summit elev. 3058 m
All times are local (unless otherwise noted)
Lava flows and thermal activity during May-October 2023
Nyamulagira (also known as Nyamuragira) is a shield volcano in the Democratic Republic of Congo with the summit truncated by a small 2 x 2.3 km caldera with walls up to about 100 m high. Documented eruptions have occurred within the summit caldera, as well as from numerous flank fissures and cinder cones. The current eruption period began in April 2018 and has more recently been characterized by summit crater lava flows and thermal activity (BGVN 48:05). This report describes lava flows and variable thermal activity during May through October 2023, based on information from the Observatoire Volcanologique de Goma (OVG) and various satellite data.
Lava lake activity continued during May. The MIROVA (Middle InfraRed Observation of Volcanic Activity) system recorded moderate-to-strong thermal activity throughout the reporting period; activity was more intense during May and October and relatively weaker from June through September (figure 95). The MODVOLC thermal algorithm, detected a total of 209 thermal alerts. There were 143 hotspots detected during May, eight during June, nine during September, and 49 during October. This activity was also reflected in infrared satellite images, where a lava flow was visible in the NW part of the crater on 7 May and strong activity was seen in the center of the crater on 4 October (figure 96). Another infrared satellite image taken on 12 May showed still active lava flows along the NW margin of the crater. According to OVG lava effusions were active during 7-29 May and moved to the N and NW parts of the crater beginning on 9 May. Strong summit crater incandescence was visible from Goma (27 km S) during the nights of 17, 19, and 20 May (figure 97). On 17 May there was an increase in eruptive activity, which peaked at 0100 on 20 May. Notable sulfur dioxide plumes drifted NW and W during 19-20 May (figure 98). Drone footage acquired in partnership with the USGS (United States Geological Survey) on 20 May captured images of narrow lava flows that traveled about 100 m down the W flank (figure 99). Data from the Rumangabo seismic station indicated a decreasing trend in activity during 17-21 May. Although weather clouds prevented clear views of the summit, a strong thermal signature on the NW flank was visible in an infrared satellite image on 22 May, based on an infrared satellite image. On 28 May the lava flows on the upper W flank began to cool and solidify. By 29 May seismicity returned to levels similar to those recorded before the 17 May increase. Lava effusion continued but was confined to the summit crater; periodic crater incandescence was observed.
Low-level activity was noted during June through October. On 1 June OVG reported that seismicity remained at lower levels and that crater incandescence had been absent for three days, though infrared satellite imagery showed continued lava effusion in the summit crater. The lava flows on the flanks covered an estimated 0.6 km2. Satellite imagery continued to show thermal activity confined to the lava lake through October (figure 96), although no lava flows or significant sulfur dioxide emissions were reported.
Geologic Background. Africa's most active volcano, Nyamulagira (also known as Nyamuragira), is a massive high-potassium basaltic shield about 25 km N of Lake Kivu and 13 km NNW of the steep-sided Nyiragongo volcano. The summit is truncated by a small 2 x 2.3 km caldera that has walls up to about 100 m high. Documented eruptions have occurred within the summit caldera, as well as from the numerous flank fissures and cinder cones. A lava lake in the summit crater, active since at least 1921, drained in 1938, at the time of a major flank eruption. Recent lava flows extend down the flanks more than 30 km from the summit as far as Lake Kivu; extensive lava flows from this volcano have covered 1,500 km2 of the western branch of the East African Rift.
Information Contacts: Observatoire Volcanologique de Goma (OVG), Departement de Geophysique, Centre de Recherche en Sciences Naturelles, Lwiro, D.S. Bukavu, DR Congo; Hawai'i Institute of Geophysics and Planetology (HIGP) - MODVOLC Thermal Alerts System, School of Ocean and Earth Science and Technology (SOEST), Univ. of Hawai'i, 2525 Correa Road, Honolulu, HI 96822, USA (URL: http://modis.higp.hawaii.edu/); MIROVA (Middle InfraRed Observation of Volcanic Activity), a collaborative project between the Universities of Turin and Florence (Italy) supported by the Centre for Volcanic Risk of the Italian Civil Protection Department (URL: http://www.mirovaweb.it/); NASA Global Sulfur Dioxide Monitoring Page, Atmospheric Chemistry and Dynamics Laboratory, NASA Goddard Space Flight Center (NASA/GSFC), 8800 Greenbelt Road, Goddard, Maryland, USA (URL: https://so2.gsfc.nasa.gov/); Copernicus Browser, Copernicus Data Space Ecosystem, European Space Agency (URL: https://dataspace.copernicus.eu/browser/); Charles Balagizi, Goma Volcano Observatory, Departement de Geophysique, Centre de Recherche en Sciences Naturelles, Lwiro, D.S. Bukavu, DR Congo.
Bagana (Papua New Guinea) — October 2023 Cite this Report
Bagana
Papua New Guinea
6.137°S, 155.196°E; summit elev. 1855 m
All times are local (unless otherwise noted)
Explosions, ash plumes, ashfall, and lava flows during April-September 2023
The remote volcano of Bagana is located in central Bougainville Island, Papua New Guinea. Recorded eruptions date back to 1842 and activity has consisted of effusive activity that has built a small lava dome in the summit crater and occasional explosions that produced pyroclastic flows. The most recent eruption has been ongoing since February 2000 and has produced occasional explosions, ash plumes, and lava flows. More recently, activity has been characterized by ongoing effusive activity and ash emissions (BGVN 48:04). This report updates activity from April through September 2023 that has consisted of explosions, ash plumes, ashfall, and lava flows, using information from the Darwin Volcanic Ash Advisory Center (VAAC) and satellite data.
An explosive eruption was reported on 7 July that generated a large gas-and-ash plume to high altitudes and caused significant ashfall in local communities; the eruption plume had reached upper tropospheric (16-18 km altitude) altitudes by 2200, according to satellite images. Sulfur dioxide plumes were detected in satellite images on 8 July and indicated that the plume was likely a mixture of gas, ice, and ash. A report issued by the Autonomous Bougainville Government (ABG) (Torokina District, Education Section) on 10 July noted that significant ash began falling during 2000-2100 on 7 July and covered most areas in the Vuakovi, Gotana (9 km SW), Koromaketo, Laruma (25 km W) and Atsilima (27 km NW) villages. Pyroclastic flows also occurred, according to ground-based reports; small deposits confined to one drainage were inspected by RVO during an overflight on 17 July and were confirmed to be from the 7 July event. Ashfall continued until 10 July and covered vegetation, which destroyed bushes and gardens and contaminated rivers and streams.
RVO reported another eruption on 14 July. The Darwin VAAC stated that an explosive event started around 0830 on 15 July and produced an ash plume that rose to 16.5 km altitude by 1000 and drifted N, according to satellite images. The plume continued to drift N and remained visible through 1900, and by 2150 it had dissipated.
Ashfall likely from both the 7 and 15 July events impacted about 8,111 people in Torokina (20 km SW), including Tsito/Vuakovi, Gotana, Koromaketo, Kenaia, Longkogari, Kenbaki, Piva (13 km SW), and Atsinima, and in the Tsitovi district, according to ABG. Significant ashfall was also reported in Ruruvu (22 km N) in the Wakunai District of Central Bougainville, though the thickness of these deposits could not be confirmed. An evacuation was called for the villages in Wakunai, where heavy ashfall had contaminated water sources; the communities of Ruruvu, Togarau, Kakarapaia, Karauturi, Atao, and Kuritaturi were asked to evacuate to a disaster center at the Wakunai District Station, and communities in Torokina were asked to evacuate to the Piva District station. According to a news article, more than 7,000 people needed temporary accommodations, with about 1,000 people in evacuation shelters. Ashfall had deposited over a broad area, contaminating water supplies, affecting crops, and collapsing some roofs and houses in rural areas. Schools were temporarily shut down. Intermittent ash emissions continued through the end of July and drifted NNW, NW, and SW. Fine ashfall was reported on the coast of Torokina, and ash plumes also drifted toward Laruma and Atsilima.
A small explosive eruption occurred at 2130 on 28 July that ejected material from the crater vents, according to reports from Torokina, in addition to a lava flow that contained two lobes. A second explosion was detected at 2157. Incandescence from the lava flow was visible from Piva as it descended the W flank around 2000 on 29 July (figure 47). The Darwin VAAC reported that a strong thermal anomaly was visible in satellite images during 30-31 July and that ash emissions rose to 2.4 km altitude and drifted WSW on 30 July. A ground report from RVO described localized emissions at 0900 on 31 July.
The Darwin VAAC reported that ash plumes were identified in satellite imagery at 0800 and 1220 on 12 August and rose to 2.1 km and 3 km altitude and drifted NW and W, respectively. A news report stated that aid was sent to more than 6,300 people that were adversely affected by the eruption. Photos taken during 17-19 August showed ash emissions rising no higher than 1 km above the summit and drifting SE. A small explosion generated an ash plume during the morning of 19 August. Deposits from small pyroclastic flows were also captured in the photos. Satellite images captured lava flows and pyroclastic flow deposits. Two temporary seismic stations were installed near Bagana on 17 August at distances of 7 km WSW (Vakovi station) and 11 km SW (Kepox station). The Kepox station immediately started to record continuous, low-frequency background seismicity.
Satellite data. Little to no thermal activity was detected during April through mid-July 2023; only one anomaly was recorded during early April and one during early June, according to MIROVA (Middle InfraRed Observation of Volcanic Activity) data (figure 48). Thermal activity increased in both power and frequency during mid-July through September, although there were still some short gaps in detected activity. MODVOLC also detected increased thermal activity during August; thermal hotspots were detected a total of five times on 19, 20, and 27 August. Weak thermal anomalies were also captured in infrared satellite images on clear weather days throughout the reporting period on 7, 12, and 17 April, 27 May, 1, 6, 16, and 31 July, and 19 September (figure 48); a strong thermal anomaly was visible on 31 July. Distinct sulfur dioxide plumes that drifted generally NW were intermittently captured by the TROPOMI instrument on the Sentinel-5P satellite and sometimes exceeded two Dobson Units (DUs) (figure 49).
Geologic Background. Bagana volcano, in a remote portion of central Bougainville Island, is frequently active. This massive symmetrical cone was largely constructed by an accumulation of viscous andesitic lava flows. The entire edifice could have been constructed in about 300 years at its present rate of lava production. Eruptive activity is characterized by non-explosive effusion of viscous lava that maintains a small lava dome in the summit crater, although occasional explosive activity produces pyroclastic flows. Lava flows with tongue-shaped lobes up to 50 m thick and prominent levees descend the flanks on all sides.
Information Contacts: Rabaul Volcano Observatory (RVO), Geohazards Management Division, Department of Mineral Policy and Geohazards Management (DMPGM), PO Box 3386, Kokopo, East New Britain Province, Papua New Guinea; Darwin Volcanic Ash Advisory Centre (VAAC), Bureau of Meteorology, Northern Territory Regional Office, PO Box 40050, Casuarina, NT 0811, Australia (URL: http://www.bom.gov.au/info/vaac/); MIROVA (Middle InfraRed Observation of Volcanic Activity), a collaborative project between the Universities of Turin and Florence (Italy) supported by the Centre for Volcanic Risk of the Italian Civil Protection Department (URL: http://www.mirovaweb.it/); Hawai'i Institute of Geophysics and Planetology (HIGP) - MODVOLC Thermal Alerts System, School of Ocean and Earth Science and Technology (SOEST), Univ. of Hawai'i, 2525 Correa Road, Honolulu, HI 96822, USA (URL: http://modis.higp.hawaii.edu/); NASA Global Sulfur Dioxide Monitoring Page, Atmospheric Chemistry and Dynamics Laboratory, NASA Goddard Space Flight Center (NASA/GSFC), 8800 Greenbelt Road, Goddard, Maryland, USA (URL: https://so2.gsfc.nasa.gov/); Copernicus Browser, Copernicus Data Space Ecosystem, European Space Agency (URL: https://dataspace.copernicus.eu/browser/); Autonomous Bougainville Government, P.O Box 322, Buka, AROB, PNG (URL: https://abg.gov.pg/); Andrew Tupper (Twitter: @andrewcraigtupp); Simon Carn, Geological and Mining Engineering and Sciences, Michigan Technological University, 1400 Townsend Drive, Houghton, MI 49931, USA (URL: http://www.volcarno.com/, Twitter: @simoncarn); Radio NZ (URL: https://www.rnz.co.nz/news/pacific/494464/more-than-7-000-people-in-bougainville-need-temporary-accommodation-after-eruption); USAID, 1300 Pennsylvania Ave, NW, Washington DC 20004, USA (URL: https://www.usaid.gov/pacific-islands/press-releases/aug-08-2023-united-states-provides-immediate-emergency-assistance-support-communities-affected-mount-bagana-volcanic-eruptions).
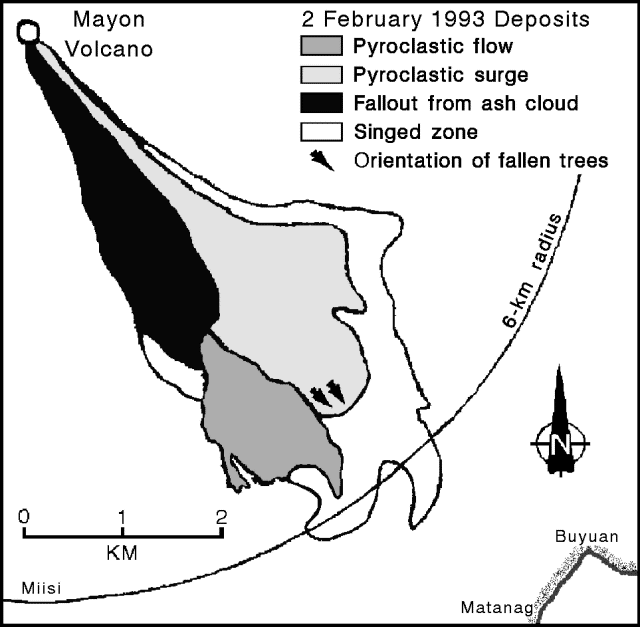
Mayon (Philippines) — October 2023 Cite this Report
Mayon
Philippines
13.257°N, 123.685°E; summit elev. 2462 m
All times are local (unless otherwise noted)
Lava flows, pyroclastic flows, ash emissions, and seismicity during April-September 2023
Mayon is located in the Philippines and has steep upper slopes capped by a small summit crater. Historical eruptions date back to 1616 CE that have been characterized by Strombolian eruptions, lava flows, pyroclastic flows, and mudflows. Eruptions mostly originated from a central conduit. Pyroclastic flows and mudflows have commonly descended many of the approximately 40 drainages that surround the volcano. The most recent eruption occurred during June through October 2022 and consisted of lava dome growth and gas-and-steam emissions (BGVN 47:12). A new eruption was reported during late April 2023 and has included lava flows, pyroclastic density currents, ash emissions, and seismicity. This report covers activity during April through September 2023 based on daily bulletins from the Philippine Institute of Volcanology and Seismology (PHIVOLCS).
During April through September 2023, PHIVOLCS reported near-daily rockfall events, frequent volcanic earthquakes, and sulfur dioxide measurements. Gas-and-steam emissions rose 100-900 m above the crater and drifted in different directions. Nighttime crater incandescence was often visible during clear weather and was accompanied by incandescent avalanches of material. Activity notably increased during June when lava flows were reported on the S, SE, and E flanks (figure 52). The MIROVA graph (Middle InfraRed Observation of Volcanic Activity) showed strong thermal activity coincident with these lava flows, which remained active through September (figure 53). According to the MODVOLC thermal algorithm, a total of 110 thermal alerts were detected during the reporting period: 17 during June, 40 during July, 27 during August, and 26 during September. During early June, pyroclastic density currents (PDCs) started to occur more frequently.
Low activity was reported during much of April and May; gas-and-steam emissions rose 100-900 m above the crater and generally drifted in different directions. A total of 52 rockfall events and 18 volcanic earthquakes were detected during April and 147 rockfall events and 13 volcanic events during May. Sulfur dioxide flux measurements ranged between 400-576 tons per day (t/d) during April, the latter of which was measured on 29 April and between 162-343 t/d during May, the latter of which was measured on 13 May.
Activity during June increased, characterized by lava flows, pyroclastic density currents (PDCs), crater incandescence and incandescent rockfall events, gas-and-steam emissions, and continued seismicity. Weather clouds often prevented clear views of the summit, but during clear days, moderate gas-and-steam emissions rose 100-2,500 m above the crater and drifted in multiple directions. A total of 6,237 rockfall events and 288 volcanic earthquakes were detected. The rockfall events often deposited material on the S and SE flanks within 700-1,500 m of the summit crater and ash from the events drifted SW, S, SE, NE, and E. Sulfur dioxide emissions ranged between 149-1,205 t/d, the latter of which was measured on 10 June. Short-term observations from EDM and electronic tiltmeter monitoring indicated that the upper slopes were inflating since February 2023. Longer-term ground deformation parameters based on EDM, precise leveling, continuous GPS, and electronic tilt monitoring indicated that the volcano remained inflated, especially on the NW and SE flanks. At 1000 on 5 June the Volcano Alert Level (VAL) was raised to 2 (on a 0-5 scale). PHIVOLCS noted that although low-level volcanic earthquakes, ground deformation, and volcanic gas emissions indicated unrest, the steep increase in rockfall frequency may indicate increased dome activity.
A total of 151 dome-collapse PDCs occurred during 8-9 and 11-30 June, traveled 500-2,000 m, and deposited material on the S flank within 2 km of the summit crater. During 8-9 June the VAL was raised to 3. At approximately 1947 on 11 June lava flow activity was reported; two lobes traveled within 500 m from the crater and deposited material on the S (Mi-isi), SE (Bonga), and E (Basud) flanks. Weak seismicity accompanied the lava flow and slight inflation on the upper flanks. This lava flow remained active through 30 June, moving down the S and SE flank as far as 2.5 km and 1.8 km, respectively and depositing material up to 3.3 km from the crater. During 15-16 June traces of ashfall from the PDCs were reported in Sitio Buga, Nabonton, City of Ligao and Purok, and San Francisco, Municipality of Guinobatan. During 28-29 June there were two PDCs generated by the collapse of the lava flow front, which generated a light-brown ash plume 1 km high. Satellite monitors detected significant concentrations of sulfur dioxide beginning on 29 June. On 30 June PDCs primarily affected the Basud Gully on the E flank, the largest of which occurred at 1301 and lasted eight minutes, based on the seismic record. Four PDCs generated between 1800 and 2000 that lasted approximately four minutes each traveled 3-4 km on the E flank and generated an ash plume that rose 1 km above the crater and drifted N and NW. Ashfall was recorded in Tabaco City.
Similar strong activity continued during July; slow lava effusion remained active on the S and SE flanks and traveled as far as 2.8 km and 2.8 km, respectively and material was deposited as far as 4 km from the crater. There was a total of 6,983 rockfall events and 189 PDCs that affected the S, SE, and E flanks. The volcano network detected a total of 2,124 volcanic earthquakes. Continuous gas-and-steam emissions rose 200-2,000 m above the crater and drifted in multiple directions. Sulfur dioxide emissions averaged 792-4,113 t/d, the latter of which was measured on 28 July. During 2-4 July three PDCs were generated from the collapse of the lava flow and resulting light brown plumes rose 200-300 m above the crater. Continuous tremor pulses were reported beginning at 1547 on 3 July through 7 July at 1200, at 2300 on 8 July and going through 0300 on 10 July, and at 2300 on 16 July, as recorded by the seismic network. During 6-9 July there were 10 lava flow-collapse-related PDCs that generated light brown plumes 300-500 m above the crater. During 10-11 July light ashfall was reported in some areas of Mabinit, Legazpi City, Budiao and Salvacion, Daraga, and Camalig, Albay. By 18 July the lava flow advanced 600 m on the E flank as well.
During 1733 on 18 July and 0434 on 19 July PHIVOLCS reported 30 “ashing” events, which are degassing events accompanied by audible thunder-like sounds and entrained ash at the crater, which produced short, dark plumes that drifted SW. These events each lasted 20-40 seconds, and plume heights ranged from 150-300 m above the crater, as recorded by seismic, infrasound, visual, and thermal monitors. Three more ashing events occurred during 19-20 July. Short-term observations from electronic tilt and GPS monitoring indicate deflation on the E lower flanks in early July and inflation on the NW middle flanks during the third week of July. Longer-term ground deformation parameters from EDM, precise leveling, continuous GPS, and electronic tilt monitoring indicated that the volcano was still generally inflated relative to baseline levels. A short-lived lava pulse lasted 28 seconds at 1956 on 21 July, which was accompanied by seismic and infrasound signals. By 22 July, the only lava flow that remained active was on the SE flank, and continued to extend 3.4 km, while those on the S and E flanks weakened markedly. One ashing event was detected during 30-31 July, whereas there were 57 detected during 31 July-1 August; according to PHIVOLCS beginning at approximately 1800 on 31 July eruptive activity was dominated by phases of intermittent ashing, as well as increased in the apparent rates of lava effusion from the summit crater. The ashing phases consisted of discrete events recorded as low-frequency volcanic earthquakes (LFVQ) typically 30 seconds in duration, based on seismic and infrasound signals. Gray ash plume rose 100 m above the crater and generally drifted NE. Shortly after these ashing events began, new lava began to effuse rapidly from the crater, feeding the established flowed on the SE, E, and E flanks and generating frequent rockfall events.
Intensified unrest persisted during August. There was a total of 4,141 rockfall events, 2,881 volcanic earthquakes, which included volcanic tremor events, 32 ashing events, and 101 PDCs detected throughout the month. On clear weather days, gas-and-steam emissions rose 300-1,500 m above the crater and drifted in different directions (figure 54). Sulfur dioxide emissions averaged 735-4,756 t/d, the higher value of which was measured on 16 August. During 1-2 August the rate of lava effusion decreased, but continued to feed the flows on the SE, S, and E flanks, maintaining their advances to 3.4 km, 2.8 km, and 1.1 km from the crater, respectively (figure 55). Rockfall and PDCs generated by collapses at the lava flow margins and from the summit dome deposited material within 4 km of the crater. During 3-4 August there were 10 tremor events detected that lasted 1-4 minutes. Short-lived lava pulse lasted 35 seconds and was accompanied by seismic and infrasound signals at 0442 on 6 August. Seven collapses were recorded at the front of the lava flow during 12-14 August.
During September, similar activity of slow lava effusion, PDCs, gas-and-steam emissions, and seismicity continued. There was a total of 4,452 rockfall events, 329 volcanic earthquakes, which included volcanic tremor events, two ashing events, and 85 PDCs recorded throughout the month. On clear weather days, gas-and-steam emissions rose 100-1,500 m above the crater and drifted in multiple directions. Sulfur dioxide emissions averaged 609-2,252 t/d, the higher average of which was measured on 6 September. Slow lava effusion continued advancing on the SE, S, and E flanks, maintaining lengths of 3.4 km, 2.8 km, and 1.1 km, respectively. Rockfall and PDC events generated by collapses along the lava flow margins and at the summit dome deposited material within 4 km of the crater.
Geologic Background. Symmetrical Mayon, which rises above the Albay Gulf NW of Legazpi City, is the most active volcano of the Philippines. The steep upper slopes are capped by a small summit crater. Recorded eruptions since 1616 CE range from Strombolian to basaltic Plinian, with cyclical activity beginning with basaltic eruptions, followed by longer periods of andesitic lava flows. Eruptions occur predominately from the central conduit and have also produced lava flows that travel far down the flanks. Pyroclastic density currents and mudflows have commonly swept down many of the approximately 40 ravines that radiate from the summit and have often damaged populated lowland areas. A violent eruption in 1814 killed more than 1,200 people and devastated several towns.
Information Contacts: Philippine Institute of Volcanology and Seismology (PHIVOLCS), Department of Science and Technology, University of the Philippines Campus, Diliman, Quezon City, Philippines (URL: http://www.phivolcs.dost.gov.ph/); MIROVA (Middle InfraRed Observation of Volcanic Activity), a collaborative project between the Universities of Turin and Florence (Italy) supported by the Centre for Volcanic Risk of the Italian Civil Protection Department (URL: http://www.mirovaweb.it/); Hawai'i Institute of Geophysics and Planetology (HIGP) - MODVOLC Thermal Alerts System, School of Ocean and Earth Science and Technology (SOEST), Univ. of Hawai'i, 2525 Correa Road, Honolulu, HI 96822, USA (URL: http://modis.higp.hawaii.edu/); Copernicus Browser, Copernicus Data Space Ecosystem, European Space Agency (URL: https://dataspace.copernicus.eu/browser/); William Rogers, Legazpi City, Albay Province, Philippines.
Nishinoshima (Japan) — October 2023 Cite this Report
Nishinoshima
Japan
27.247°N, 140.874°E; summit elev. 100 m
All times are local (unless otherwise noted)
Eruption plumes and gas-and-steam plumes during May-August 2023
Nishinoshima, located about 1,000 km S of Tokyo, is a small island in the Ogasawara Arc in Japan. The island is the summit of a massive submarine volcano that has prominent submarine peaks to the S, W, and NE. Eruptions date back to 1973 and the current eruption period began in October 2022. Recent activity has consisted of small ash plumes and fumarolic activity (BGVN 48:07). This report covers activity during May through August 2023, using information from monthly reports of the Japan Meteorological Agency (JMA) monthly reports and satellite data.
Activity during May through June was relatively low. The Japan Coast Guard (JCG) did overflights on 14 and 22 June and reported white gas-and-steam emissions rising 600 m and 1,200 m from the central crater of the pyroclastic cone, respectively (figure 125). In addition, multiple white gas-and-steam emissions rose from the inner rim of the W side of the crater and from the SE flank of the pyroclastic cone. Discolored brown-to-green water was observed around almost the entire perimeter of the island; on 22 June light green discolored water was observed off the S coast of the island.
Observations from the Himawari meteorological satellite confirmed an eruption on 9 and 10 July. An eruption plume rose 1.6 km above the crater and drifted N around 1300 on 9 July. Satellite images acquired at 1420 and 2020 on 9 July and at 0220 on 10 July showed continuing emissions that rose 1.3-1.6 km above the crater and drifted NE and N. The Tokyo VAAC reported that an ash plume seen by a pilot and identified in a satellite image at 0630 on 21 July rose to 3 km altitude and drifted S.
Aerial observations conducted by JCG on 8 August showed a white-and-gray plume rising from the central crater of the pyroclastic cone, and multiple white gas-and-steam emissions were rising from the inner edge of the western crater and along the NW-SE flanks of the island (figure 126). Brown-to-green discolored water was also noted around the perimeter of the island.
Intermittent low-to-moderate power thermal anomalies were recorded in the MIROVA graph (Middle InfraRed Observation of Volcanic Activity), showing an increase in both frequency and power beginning in July (figure 127). This increase in activity coincides with eruptive activity on 9 and 10 July, characterized by eruption plumes. According to the MODVOLC thermal alert algorithm, one thermal hotspot was recorded on 20 July. Weak thermal anomalies were also detected in infrared satellite imagery, accompanied by strong gas-and-steam plumes (figure 128).
Geologic Background. The small island of Nishinoshima was enlarged when several new islands coalesced during an eruption in 1973-74. Multiple eruptions that began in 2013 completely covered the previous exposed surface and continued to enlarge the island. The island is the summit of a massive submarine volcano that has prominent peaks to the S, W, and NE. The summit of the southern cone rises to within 214 m of the ocean surface 9 km SSE.
Information Contacts: Japan Meteorological Agency (JMA), 1-3-4 Otemachi, Chiyoda-ku, Tokyo 100-8122, Japan (URL: http://www.jma.go.jp/jma/indexe.html); Tokyo Volcanic Ash Advisory Center (VAAC), 1-3-4 Otemachi, Chiyoda-ku, Tokyo 100-8122, Japan (URL: http://ds.data.jma.go.jp/svd/vaac/data/); MIROVA (Middle InfraRed Observation of Volcanic Activity), a collaborative project between the Universities of Turin and Florence (Italy) supported by the Centre for Volcanic Risk of the Italian Civil Protection Department (URL: http://www.mirovaweb.it/); Copernicus Browser, Copernicus Data Space Ecosystem, European Space Agency (URL: https://dataspace.copernicus.eu/browser/).
Krakatau (Indonesia) — October 2023 Cite this Report
Krakatau
Indonesia
6.1009°S, 105.4233°E; summit elev. 285 m
All times are local (unless otherwise noted)
White gas-and-steam plumes and occasional ash plumes during May-August 2023
Krakatau is located in the Sunda Strait between Java and Sumatra, Indonesia. Caldera collapse during the catastrophic 1883 eruption destroyed Danan and Perbuwatan cones and left only a remnant of Rakata. The post-collapse cone of Anak Krakatau (Child of Krakatau) was constructed within the 1883 caldera at a point between the former Danan and Perbuwatan cones; it has been the site of frequent eruptions since 1927. The current eruption period began in May 2021 and has recently consisted of Strombolian eruptions and ash plumes (BGVN 48:07). This report describes lower levels of activity consisting of ash and white gas-and-steam plumes during May through August 2023, based on information provided by the Indonesian Center for Volcanology and Geological Hazard Mitigation, referred to as Pusat Vulkanologi dan Mitigasi Bencana Geologi (PVMBG), MAGMA Indonesia, and satellite data.
Activity was relatively low during May and June. Daily white gas-and-steam emissions rose 25-200 m above the crater and drifted in different directions. Five ash plumes were detected at 0519 on 10 May, 1241 on 11 May, 0920 on 12 May, 2320 on 12 May, and at 0710 on 13 May, and rose 1-2.5 km above the crater and drifted SW. A webcam image taken on 12 May showed ejection of incandescent material above the vent. A total of nine ash plumes were detected during 6-11 June: at 1434 and 00220 on 6 and 7 June the ash plumes rose 500 m above the crater and drifted NW, at 1537 on 8 June the ash plume rose 1 km above the crater and drifted SW, at 0746 and at 0846 on 9 June the ash plumes rose 800 m and 3 km above the crater and drifted SW, respectively, at 0423, 1431, and 1750 on 10 June the ash plumes rose 2 km, 1.5 km, and 3.5 km above the crater and drifted NW, respectively, and at 0030 on 11 June an ash plume rose 2 km above the crater and drifted NW. Webcam images taken on 10 and 11 June at 0455 and 0102, respectively, showed incandescent material ejected above the vent. On 19 June an ash plume at 0822 rose 1.5 km above the crater and drifted SE.
Similar low activity of white gas-and-steam emissions and few ash plumes were reported during July and August. Daily white gas-and-steam emissions rose 25-300 m above the crater and drifted in multiple directions. Three ash plumes were reported at 0843, 0851, and 0852 on 20 July that rose 500-2,000 m above the crater and drifted NW.
The MIROVA (Middle InfraRed Observation of Volcanic Activity) graph of MODIS thermal anomaly data showed intermittent low-to-moderate power thermal anomalies during May through August 2023 (figure 140). Although activity was often obscured by weather clouds, a thermal anomaly was visible in an infrared satellite image of the crater on 12 May, accompanied by an eruption plume that drifted SW (figure 141).
Geologic Background. The renowned Krakatau (frequently mis-named as Krakatoa) volcano lies in the Sunda Strait between Java and Sumatra. Collapse of an older edifice, perhaps in 416 or 535 CE, formed a 7-km-wide caldera. Remnants of that volcano are preserved in Verlaten and Lang Islands; subsequently the Rakata, Danan, and Perbuwatan cones were formed, coalescing to create the pre-1883 Krakatau Island. Caldera collapse during the catastrophic 1883 eruption destroyed Danan and Perbuwatan, and left only a remnant of Rakata. This eruption caused more than 36,000 fatalities, most as a result of tsunamis that swept the adjacent coastlines of Sumatra and Java. Pyroclastic surges traveled 40 km across the Sunda Strait and reached the Sumatra coast. After a quiescence of less than a half century, the post-collapse cone of Anak Krakatau (Child of Krakatau) was constructed within the 1883 caldera at a point between the former Danan and Perbuwatan cones. Anak Krakatau has been the site of frequent eruptions since 1927.
Information Contacts: Pusat Vulkanologi dan Mitigasi Bencana Geologi (PVMBG, also known as Indonesian Center for Volcanology and Geological Hazard Mitigation, CVGHM), Jalan Diponegoro 57, Bandung 40122, Indonesia (URL: http://www.vsi.esdm.go.id/); MAGMA Indonesia, Kementerian Energi dan Sumber Daya Mineral (URL: https://magma.esdm.go.id/v1); MIROVA (Middle InfraRed Observation of Volcanic Activity), a collaborative project between the Universities of Turin and Florence (Italy) supported by the Centre for Volcanic Risk of the Italian Civil Protection Department (URL: http://www.mirovaweb.it/); Copernicus Browser, Copernicus Data Space Ecosystem, European Space Agency (URL: https://dataspace.copernicus.eu/browser/).
Villarrica (Chile) — October 2023 Cite this Report
Villarrica
Chile
39.42°S, 71.93°W; summit elev. 2847 m
All times are local (unless otherwise noted)
Strombolian activity, gas-and-ash emissions, and crater incandescence during April-September 2023
Villarrica, in central Chile, consists of a 2-km-wide caldera that formed about 3,500 years ago and is located at the base of the presently active cone at the NW margin of a 6-km-wide caldera. Historical eruptions eruptions date back to 1558 and have been characterized by mild-to-moderate explosive activity with occasional lava effusions. The current eruption period began in December 2014 and has recently consisted of nighttime crater incandescence, ash emissions, and seismicity (BGVN 48:04). This report covers activity during April through September 2023 and describes occasional Strombolian activity, gas-and-ash emissions, and nighttime crater incandescence. Information for this report primarily comes from the Southern Andes Volcano Observatory (Observatorio Volcanológico de Los Andes del Sur, OVDAS), part of Chile's National Service of Geology and Mining (Servicio Nacional de Geología y Minería, SERNAGEOMIN) and satellite data.
Seismicity during April consisted of long period (LP) events and tremor (TRE); a total of 9,413 LP-type events and 759 TR-type events were detected throughout the month. Nighttime crater incandescence persisted and was visible in the degassing column. Sulfur dioxide data was obtained using Differential Absorption Optical Spectroscopy Equipment (DOAS) that showed an average value of 1,450 ± 198 tons per day (t/d) during 1-15 April and 1,129 ± 201 t/d during 16-30 April, with a maximum daily value of 2,784 t/d on 9 April. Gas-and-steam emissions of variable intensities rose above the active crater as high as 1.3 km above the crater on 13 April. Strombolian explosions were not observed and there was a slight decrease in the lava lake level.
There were 14,123 LP-type events and 727 TR-type events detected during May. According to sulfur dioxide measurements taken with DOAS equipment, the active crater emitted an average value of 1,826 ± 482 t/d during 1-15 May and 912 ± 41 t/d during 16-30 May, with a daily maximum value of 5,155 t/d on 13 May. Surveillance cameras showed continuous white gas-and-steam emissions that rose as high as 430 m above the crater on 27 May. Nighttime incandescence illuminated the gas column less than 300 m above the crater rim was and no pyroclastic emissions were reported. A landslide was identified on 13 May on the E flank of the volcano 50 m from the crater rim and extending 300 m away; SERNAGEOMIN noted that this event may have occurred on 12 May. During the morning of 27 and 28 May minor Strombolian explosions characterized by incandescent ejecta were recorded at the crater rim; the last reported Strombolian explosions had occurred at the end of March.
Seismic activity during June consisted of five volcano-tectonic (VT)-type events, 21,606 LP-type events, and 2,085 TR-type events. The average value of sulfur dioxide flux obtained by DOAS equipment was 1,420 ± 217 t/d during 1-15 June and 2,562 ± 804 t/d, with a maximum daily value of 4,810 t/d on 17 June. White gas-and-steam emissions rose less than 480 m above the crater; frequent nighttime crater incandescence was reflected in the degassing plume. On 12 June an emission rose 100 m above the crater and drifted NNW. On 15 June one or several emissions resulted in ashfall to the NE as far as 5.5 km from the crater, based on a Skysat satellite image. Several Strombolian explosions occurred within the crater; activity on 15 June was higher energy and ejected blocks 200-300 m on the NE slope. Surveillance cameras showed white gas-and-steam emissions rising 480 m above the crater on 16 June. On 19 and 24 June low-intensity Strombolian activity was observed, ejecting material as far as 200 m from the center of the crater to the E.
During July, seismicity included 29,319 LP-type events, 3,736 TR-type events, and two VT-type events. DOAS equipment recorded two days of sulfur dioxide emissions of 4,220 t/d and 1,009 t/d on 1 and 13 July, respectively. Constant nighttime incandescence was also recorded and was particularly noticeable when accompanied by eruptive columns on 12 and 16 July. Minor explosive events were detected in the crater. According to Skysat satellite images taken on 12, 13, and 16 July, ashfall deposits were identified 155 m S of the crater. According to POVI, incandescence was visible from two vents on the crater floor around 0336 on 12 July. Gas-and-ash emissions rose as high as 1.2 km above the crater on 13 July and drifted E and NW. A series of gas-and-steam pulses containing some ash deposited material on the upper E flank around 1551 on 13 July. During 16-31 July, average sulfur dioxide emissions of 1,679 ± 406 t/d were recorded, with a maximum daily value of 2,343 t/d on 28 July. Fine ash emissions were also reported on 16, 17, and 23 July.
Seismicity persisted during August, characterized by 27,011 LP-type events, 3,323 TR-type events, and three VT-type events. The average value of sulfur dioxide measurements taken during 1-15 August was 1,642 ± 270 t/d and 2,207 ± 4,549 t/d during 16-31 August, with a maximum daily value of 3,294 t/d on 27 August. Nighttime crater incandescence remained visible in degassing columns. White gas-and-steam emissions rose 480 m above the crater on 6 August. According to a Skysat satellite image from 6 August, ash accumulation was observed proximal to the crater and was mainly distributed toward the E slope. White gas-and-steam emissions rose 320 m above the crater on 26 August. Nighttime incandescence and Strombolian activity that generated ash emissions were reported on 27 August.
Seismicity during September was characterized by five VT-type events, 12,057 LP-type events, and 2,058 TR-type events. Nighttime incandescence persisted. On 2 September an ash emission rose 180 m above the crater and drifted SE at 1643 (figure 125) and a white gas-and-steam plume rose 320 m above the crater. According to the Buenos Aires VAAC, periods of continuous gas-and-ash emissions were visible in webcam images from 1830 on 2 September to 0110 on 3 September. Strombolian activity was observed on 2 September and during the early morning of 3 September, the latter event of which generated an ash emission that rose 60 m above the crater and drifted 100 m from the center of the crater to the NE and SW. Ashfall was reported to the SE and S as far as 750 m from the crater. The lava lake was active during 3-4 September and lava fountaining was visible for the first time since 26 March 2023, according to POVI. Fountains captured in webcam images at 2133 on 3 September and at 0054 on 4 September rose as high as 60 m above the crater rim and ejected material onto the upper W flank. Sulfur dioxide flux of 1,730 t/d and 1,281 t/d was measured on 3 and 4 September, respectively, according to data obtained by DOAS equipment.
Strong Strombolian activity and larger gas-and-ash plumes were reported during 18-20 September. On 18 September activity was also associated with energetic LP-type events and notable sulfur dioxide fluxes (as high as 4,277 t/d). On 19 September Strombolian activity and incandescence were observed. On 20 September at 0914 ash emissions rose 50 m above the crater and drifted SSE, accompanied by Strombolian activity that ejected material less than 100 m SSE, causing fall deposits on that respective flank. SERNAGEOMIN reported that a Planet Scope satellite image taken on 20 September showed the lava lake in the crater, measuring 32 m x 35 m and an area of 0.001 km2. Several ash emissions were recorded at 0841, 0910, 1251, 1306, 1312, 1315, and 1324 on 23 September and rose less than 150 m above the crater. The sulfur dioxide flux value was 698 t/d on 23 September and 1,097 t/d on 24 September. On 24 September the Volcanic Alert Level (VAL) was raised to Orange (the third level on a four-color scale). SENAPRED maintained the Alert Level at Yellow (the middle level on a three-color scale) for the communities of Villarrica, Pucón (16 km N), Curarrehue, and Panguipulli.
During 24-25 September there was an increase in seismic energy (observed at TR-events) and acoustic signals, characterized by 1 VT-type event, 213 LP-type events, and 124 TR-type events. Mainly white gas-and-steam emissions, in addition to occasional fine ash emissions were recorded. During the early morning of 25 September Strombolian explosions were reported and ejected material 250 m in all directions, though dominantly toward the NW. On 25 September the average value of sulfur dioxide flux was 760 t/d. Seismicity during 25-30 September consisted of five VT-type events, 1,937 LP-type events, and 456 TR-type events.
During 25-29 September moderate Strombolian activity was observed and ejected material as far as the crater rim. In addition, ash pulses lasting roughly 50 minutes were observed around 0700 and dispersed ENE. During 26-27 September a TR episode lasted 6.5 hours and was accompanied by discrete acoustic signals. Satellite images from 26 September showed a spatter cone on the crater floor with one vent that measured 10 x 14 m and a smaller vent about 35 m NE of the cone. SERNAGEOMIN reported an abundant number of bomb-sized blocks up to 150 m from the crater, as well as impact marks on the snow, which indicated explosive activity. A low-altitude ash emission was observed drifting NW around 1140 on 28 September, based on webcam images. Between 0620 and 0850 on 29 September an ash emission rose 60 m above the crater and drifted NW. During an overflight taken around 1000 on 29 September scientists observed molten material in the vent, a large accumulation of pyroclasts inside the crater, and energetic degassing, some of which contained a small amount of ash. Block-sized pyroclasts were deposited on the internal walls and near the crater, and a distal ash deposit was also visible. The average sulfur dioxide flux measured on 28 September was 344 t/d. Satellite images taken on 29 September ashfall was deposited roughly 3 km WNW from the crater and nighttime crater incandescence remained visible. The average sulfur dioxide flux value from 29 September was 199 t/d. On 30 September at 0740 a pulsating ash emission rose 1.1 km above the crater and drifted NNW (figure 126). Deposits on the S flank extended as far as 4.5 km from the crater rim, based on satellite images from 30 September.
Infrared MODIS satellite data processed by MIROVA (Middle InfraRed Observation of Volcanic Activity) showed intermittent thermal activity during April through September, with slightly stronger activity detected during late September (figure 127). Small clusters of thermal activity were detected during mid-June, early July, early August, and late September. According to the MODVOLC thermal alert system, a total of four thermal hotspots were detected on 7 July and 3 and 23 September. This activity was also intermittently captured in infrared satellite imagery on clear weather days (figure 128).
Geologic Background. The glacier-covered Villarrica stratovolcano, in the northern Lakes District of central Chile, is ~15 km south of the city of Pucon. A 2-km-wide caldera that formed about 3,500 years ago is located at the base of the presently active, dominantly basaltic to basaltic andesite cone at the NW margin of a 6-km-wide Pleistocene caldera. More than 30 scoria cones and fissure vents are present on the flanks. Plinian eruptions and pyroclastic flows that have extended up to 20 km from the volcano were produced during the Holocene. Lava flows up to 18 km long have issued from summit and flank vents. Eruptions documented since 1558 CE have consisted largely of mild-to-moderate explosive activity with occasional lava effusion. Glaciers cover 40 km2 of the volcano, and lahars have damaged towns on its flanks.
Information Contacts: Servicio Nacional de Geología y Minería (SERNAGEOMIN), Observatorio Volcanológico de Los Andes del Sur (OVDAS), Avda Sta María No. 0104, Santiago, Chile (URL: http://www.sernageomin.cl/); Proyecto Observación Villarrica Internet (POVI) (URL: http://www.povi.cl/); Sistema y Servicio Nacional de Prevención y Repuesta Ante Desastres (SENAPRED), Av. Beauchef 1671, Santiago, Chile (URL: https://web.senapred.cl/); Buenos Aires Volcanic Ash Advisory Center (VAAC), Servicio Meteorológico Nacional-Fuerza Aérea Argentina, 25 de mayo 658, Buenos Aires, Argentina (URL: http://www.smn.gov.ar/vaac/buenosaires/inicio.php); MIROVA (Middle InfraRed Observation of Volcanic Activity), a collaborative project between the Universities of Turin and Florence (Italy) supported by the Centre for Volcanic Risk of the Italian Civil Protection Department (URL: http://www.mirovaweb.it/); Hawai'i Institute of Geophysics and Planetology (HIGP) - MODVOLC Thermal Alerts System, School of Ocean and Earth Science and Technology (SOEST), Univ. of Hawai'i, 2525 Correa Road, Honolulu, HI 96822, USA (URL: http://modis.higp.hawaii.edu/); Copernicus Browser, Copernicus Data Space Ecosystem, European Space Agency (URL: https://dataspace.copernicus.eu/browser/).
Merapi (Indonesia) — October 2023 Cite this Report
Merapi
Indonesia
7.54°S, 110.446°E; summit elev. 2910 m
All times are local (unless otherwise noted)
Frequent incandescent avalanches during April-September 2023
Merapi, located just north of the major city of Yogyakarta in central Java, Indonesia, has had activity within the last 20 years characterized by pyroclastic flows and lahars accompanying growth and collapse of the steep-sided active summit lava dome. The current eruption period began in late December 2020 and has more recently consisted of ash plumes, intermittent incandescent avalanches of material, and pyroclastic flows (BGVN 48:04). This report covers activity during April through September 2023, based on information from Balai Penyelidikan dan Pengembangan Teknologi Kebencanaan Geologi (BPPTKG), the Center for Research and Development of Geological Disaster Technology, a branch of PVMBG which specifically monitors Merapi. Additional information comes from the Pusat Vulkanologi dan Mitigasi Bencana Geologi (PVMBG, also known as Indonesian Center for Volcanology and Geological Hazard Mitigation, CVGHM), MAGMA Indonesia, the Darwin Volcanic Ash Advisory Centre (VAAC), and various satellite data.
Activity during April through September 2023 primarily consisted of incandescent avalanches of material that mainly affected the SW and W flanks and traveled as far as 2.3 km from the summit (table 25) and white gas-and-steam emissions that rose 10-1,000 m above the crater.
Table 25. Monthly summary of avalanches and avalanche distances recorded at Merapi during April through September 2023. The number of reported avalanches does not include instances where possible avalanches were heard but could not be visually confirmed as a result of inclement weather. Data courtesy of BPPTKG (April-September 2023 daily reports).
| Month |
Average number of avalanches per day |
Distance avalanches traveled (m) |
| Apr 2023 |
19 |
1,200-2,000 |
| May 2023 |
22 |
500-2,000 |
| Jun 2023 |
18 |
1,200-2,000 |
| Jul 2023 |
30 |
300-2,000 |
| Aug 2023 |
25 |
400-2,300 |
| Sep 2023 |
23 |
600-2,000 |
BPPTKG reported that during April and May white gas-and-steam emissions rose 10-750 m above the crater, incandescent avalanches descended 500-2,000 m on the SW and W flanks (figure 135). Cloudy weather often prevented clear views of the summit, and sometimes avalanches could not be confirmed. According to a webcam image, a pyroclastic flow was visible on 17 April at 0531. During the week of 28 April and 4 May a pyroclastic flow was reported on the SW flank, traveling up to 2.5 km. According to a drone overflight taken on 17 May the SW lava dome volume was an estimated 2,372,800 cubic meters and the dome in the main crater was an estimated 2,337,300 cubic meters.
During June and July similar activity persisted with white gas-and-steam emissions rising 10-350 m above the crater and frequent incandescent avalanches that traveled 300-2,000 m down the SW, W, and S flanks (figure 136). Based on an analysis of aerial photos taken on 24 June the volume of the SW lava dome was approximately 2.5 million cubic meters. A pyroclastic flow was observed on 5 July that traveled 2.7 km on the SW flank. According to the Darwin VAAC multiple minor ash plumes were identified in satellite images on 19 July that rose to 3.7 km altitude and drifted S and SW. During 22, 25, and 26 July a total of 17 avalanches descended as far as 1.8 km on the S flank.
Frequent white gas-and-steam emissions continued during August and September, rising 10-450 m above the crater. Incandescent avalanches mainly affected the SW and W flanks and traveled 400-2,300 m from the vent (figure 137). An aerial survey conducted on 10 August was analyzed and reported that estimates of the SW dome volume was 2,764,300 cubic meters and the dome in the main crater was 2,369,800 cubic meters.
Frequent and moderate-power thermal activity continued throughout the reporting period, according to a MIROVA (Middle InfraRed Observation of Volcanic Activity) analysis of MODIS satellite data (figure 138). There was an increase in the number of detected anomalies during mid-May. The MODVOLC thermal algorithm recorded a total of 47 thermal hotspots: six during April, nine during May, eight during June, 15 during July, four during August, and five during September. Some of this activity was captured in infrared satellite imagery on clear weather days, sometimes accompanied by incandescent material on the SW flank (figure 139).
Geologic Background. Merapi, one of Indonesia's most active volcanoes, lies in one of the world's most densely populated areas and dominates the landscape immediately north of the major city of Yogyakarta. It is the youngest and southernmost of a volcanic chain extending NNW to Ungaran volcano. Growth of Old Merapi during the Pleistocene ended with major edifice collapse perhaps about 2,000 years ago, leaving a large arcuate scarp cutting the eroded older Batulawang volcano. Subsequent growth of the steep-sided Young Merapi edifice, its upper part unvegetated due to frequent activity, began SW of the earlier collapse scarp. Pyroclastic flows and lahars accompanying growth and collapse of the steep-sided active summit lava dome have devastated cultivated lands on the western-to-southern flanks and caused many fatalities.
Information Contacts: Balai Penyelidikan dan Pengembangan Teknologi Kebencanaan Geologi (BPPTKG), Center for Research and Development of Geological Disaster Technology (URL: http://merapi.bgl.esdm.go.id/, Twitter: @BPPTKG); MAGMA Indonesia, Kementerian Energi dan Sumber Daya Mineral (URL: https://magma.esdm.go.id/v1); Pusat Vulkanologi dan Mitigasi Bencana Geologi (PVMBG, also known as Indonesian Center for Volcanology and Geological Hazard Mitigation, CVGHM), Jalan Diponegoro 57, Bandung 40122, Indonesia (URL: http://www.vsi.esdm.go.id/); Darwin Volcanic Ash Advisory Centre (VAAC), Bureau of Meteorology, Northern Territory Regional Office, PO Box 40050, Casuarina, NT 0811, Australia (URL: http://www.bom.gov.au/info/vaac/); MIROVA (Middle InfraRed Observation of Volcanic Activity), a collaborative project between the Universities of Turin and Florence (Italy) supported by the Centre for Volcanic Risk of the Italian Civil Protection Department (URL: http://www.mirovaweb.it/); Hawai'i Institute of Geophysics and Planetology (HIGP) - MODVOLC Thermal Alerts System, School of Ocean and Earth Science and Technology (SOEST), Univ. of Hawai'i, 2525 Correa Road, Honolulu, HI 96822, USA (URL: http://modis.higp.hawaii.edu/); Copernicus Browser, Copernicus Data Space Ecosystem, European Space Agency (URL: https://dataspace.copernicus.eu/browser/); Øystein Lund Andersen (URL: https://www.oysteinlundandersen.com/, https://twitter.com/oysteinvolcano).
Ebeko
Russia
50.686°N, 156.014°E; summit elev. 1103 m
All times are local (unless otherwise noted)
Moderate explosive activity with ash plumes continued during June-November 2023
Ebeko, located on the N end of Paramushir Island in Russia’s Kuril Islands just S of the Kamchatka Peninsula, consists of three summit craters along a SSW-NNE line at the northern end of a complex of five volcanic cones. Observed eruptions date back to the late 18th century and have been characterized as small-to-moderate explosions from the summit crater, accompanied by intense fumarolic activity. The current eruptive period began in June 2022, consisting of frequent explosions, ash plumes, and thermal activity (BGVN 47:10, 48:06). This report covers similar activity during June-November 2023, based on information from the Kamchatka Volcanic Eruptions Response Team (KVERT) and satellite data.
Moderate explosive activity continued during June-November 2023 (figures 50 and 51). According to visual data from Severo-Kurilsk, explosions sent ash 2-3.5 km above the summit (3-4.5 km altitude) during most days during June through mid-September. Activity after mid-September was slightly weaker, with ash usually reaching less than 2 km above the summit. According to KVERT the volcano in October and November was, with a few exceptions, either quiet or obscured by clouds that prevented satellite observations. KVERT issued Volcano Observatory Notices for Aviation (VONA) on 8 and 12 June, 13 and 22 July, 3 and 21 August, and 31 October warning of potential aviation hazards from ash plumes drifting 3-15 km from the volcano. Based on satellite data, KVERT reported a persistent thermal anomaly whenever weather clouds permitted viewing.
Geologic Background. The flat-topped summit of the central cone of Ebeko volcano, one of the most active in the Kuril Islands, occupies the northern end of Paramushir Island. Three summit craters located along a SSW-NNE line form Ebeko volcano proper, at the northern end of a complex of five volcanic cones. Blocky lava flows extend west from Ebeko and SE from the neighboring Nezametnyi cone. The eastern part of the southern crater contains strong solfataras and a large boiling spring. The central crater is filled by a lake about 20 m deep whose shores are lined with steaming solfataras; the northern crater lies across a narrow, low barrier from the central crater and contains a small, cold crescentic lake. Historical activity, recorded since the late-18th century, has been restricted to small-to-moderate explosive eruptions from the summit craters. Intense fumarolic activity occurs in the summit craters, on the outer flanks of the cone, and in lateral explosion craters.
Information Contacts: Kamchatka Volcanic Eruptions Response Team (KVERT), Far Eastern Branch, Russian Academy of Sciences, 9 Piip Blvd., Petropavlovsk-Kamchatsky, 683006, Russia (URL: http://www.kscnet.ru/ivs/kvert/).
Search Bulletin Archive by Publication Date
Select a month and year from the drop-downs and click "Show Issue" to have that issue displayed in this tab.
The default month and year is the latest issue available.
Bulletin of the Global Volcanism Network - Volume 18, Number 02 (February 1993)
Managing Editor: Edward Venzke
Aira (Japan)
Explosions continue; three earthquake swarms
Arenal (Costa Rica)
Gas emission, explosions, lava flows continue; tremor activity increases
Asosan (Japan)
Scoria eruption; seismicity declines
Chichon, El (Mexico)
Fumarolic activity continues; lake chemistry unchanged
Etna (Italy)
Lava flows continue; volume estimates reported
Galeras (Colombia)
Low seismicity and SO2 levels; episodes of long-period tremor
Guagua Pichincha (Ecuador)
Phreatic explosion kills two scientists
Hudson, Cerro (Chile)
Increased gas emission and mudflows
Irazu (Costa Rica)
Decreased fumarolic activity continues
Kilauea (United States)
Episode 53 begins; lava flows from tube breakout reach Kamoamoa delta
Langila (Papua New Guinea)
Small Vulcanian eruptions
Manam (Papua New Guinea)
Weak emissions; discontinuous low-amplitude tremor
Mayon (Philippines)
Eruption continues; pyroclastic flows; lava extrusion
Obituary Notices (Unknown)
Deaths of two volcanologists (Victor Pérez and Alvaro Sánchez) at Guagua Pichincha
Pinatubo (Philippines)
Seismic activity continues
Poas (Costa Rica)
Fumarolic activity continues
Popocatepetl (Mexico)
Increased fumarolic activity; seismicity remains low
Rabaul (Papua New Guinea)
Seismicity remains low; no significant deformation
Rincon de la Vieja (Costa Rica)
Gas plumes rise to 500 m; lake level drops
Ruapehu (New Zealand)
Little change in crater lake; episodes of tremor
Spurr (United States)
Low seismic activity; level of concern reduced from Yellow to Green
Stromboli (Italy)
Seismicity and tremor resume after 10 February explosions
Ulawun (Papua New Guinea)
Activity continues to decline; glow observed in crater
Unzendake (Japan)
Dome complex continues to grow; large pyroclastic flow
Aira
Japan
31.5772°N, 130.6589°E; summit elev. 1117 m
All times are local (unless otherwise noted)
Explosions continue; three earthquake swarms
Explosions . . . continued at a rate similar to that recorded in January. Two of the 15 explosions recorded in February produced observable incandescent columns rising 100 m above the crater. An explosion at 1822 on 3 February produced the highest ash plume of the month, 2,000 m. Seismicity remained normal. Three swarms of B-type earthquakes were recorded: on 9 February (duration 5 hours), 10 February (5 hours), and 25 February (10 hours).
Geologic Background. The Aira caldera in the northern half of Kagoshima Bay contains the post-caldera Sakurajima volcano, one of Japan's most active. Eruption of the voluminous Ito pyroclastic flow accompanied formation of the 17 x 23 km caldera about 22,000 years ago. The smaller Wakamiko caldera was formed during the early Holocene in the NE corner of the caldera, along with several post-caldera cones. The construction of Sakurajima began about 13,000 years ago on the southern rim and built an island that was joined to the Osumi Peninsula during the major explosive and effusive eruption of 1914. Activity at the Kitadake summit cone ended about 4,850 years ago, after which eruptions took place at Minamidake. Frequent eruptions since the 8th century have deposited ash on the city of Kagoshima, located across Kagoshima Bay only 8 km from the summit. The largest recorded eruption took place during 1471-76.
Information Contacts: JMA.
Arenal (Costa Rica) — February 1993 Cite this Report
Arenal
Costa Rica
10.463°N, 84.703°W; summit elev. 1670 m
All times are local (unless otherwise noted)
Gas emission, explosions, lava flows continue; tremor activity increases
Gas emission, explosions, and lava flows continued from Crater C. Strombolian activity was similar to last month, with relatively quiet explosions of moderate size that produced columns, with minor ash content, to 500-1,000 m above Crater C. Ash fell 1.8 km W of the active crater down to 735 m elevation. Sudden small-moderate degassing events, separated by a few to tens of minutes, were accompanied by frequent loud sounds. A pyroclastic flow in mid-February moved down the S flank to 850 m elevation.
The lava flow that began to descend in December 1992 remained active after dividing into two lobes at 1,100 m elevation. The W lobe, with an approximate thickness of 18 m, descended to 800 m elevation in February. During the same period, the SE lobe descended from a flat area just above 800 m down to 700 m elevation.
Tremor activity recorded at Fortuna station, 3.5 km E of the active crater, has increased since the end of January. The increase is thought to be associated with the rise of new magma to the surface. The number of seismic events (average of 36/day; figure 52), was similar to last month and in the normal range. However, there was an increase in the number of seismic events after each tremor episode.
Sulfur and chlorine gas emissions from fumaroles on the rim of Crater C continued to produce acid rain that has damaged vegetation on the NE, E, and SE flanks. Fumarolic activity continued from Crater D.
Geologic Background. Conical Volcán Arenal is the youngest stratovolcano in Costa Rica and one of its most active. The 1670-m-high andesitic volcano towers above the eastern shores of Lake Arenal, which has been enlarged by a hydroelectric project. Arenal lies along a volcanic chain that has migrated to the NW from the late-Pleistocene Los Perdidos lava domes through the Pleistocene-to-Holocene Chato volcano, which contains a 500-m-wide, lake-filled summit crater. The earliest known eruptions of Arenal took place about 7000 years ago, and it was active concurrently with Cerro Chato until the activity of Chato ended about 3500 years ago. Growth of Arenal has been characterized by periodic major explosive eruptions at several-hundred-year intervals and periods of lava effusion that armor the cone. An eruptive period that began with a major explosive eruption in 1968 ended in December 2010; continuous explosive activity accompanied by slow lava effusion and the occasional emission of pyroclastic flows characterized the eruption from vents at the summit and on the upper western flank.
Information Contacts: G. Soto and R. Barquero, ICE; E. Fernández and J. Barquero, OVSICORI.
Asosan
Japan
32.8849°N, 131.085°E; summit elev. 1592 m
All times are local (unless otherwise noted)
Scoria eruption; seismicity declines
The eruptive phase... continued through February at Crater 1. At noon on 20 February, vent 922 ejected scoriae to 100 m above the vent, the first eruption observed during daily visits to the crater rim since 22 January. The ejecta, consisting of blocks up to 50 cm across, fell within the 400-m-wide, 150-m-deep crater. Incandescent fountaining, also to a height of 100 m, was observed that night. Inclement weather prevented visual observations in the following days and the ending date for the eruption is not known.
The amplitude of the continuous tremor, which increased in late December, persisted at an elevated level until 10 February, when it rapidly declined (figure 24). The decline was not accompanied by any observed change in surface phenomena. At 0600 on 20 February, the tremor amplitude increased. Tremor amplitude remained high during and after the eruption, abruptly returning to background level at 1215 on 25 February after a small block ejection. An area within 1 km of the crater has been closed since 18 January.
Ash was observed in the steam plume on 1-5, 12-13, 18-20, and 23-25 February. The plume rose to heights of 500 m, increasing briefly to 1,000 m n 19-20 February (figure 24).
Geologic Background. The 24-km-wide Asosan caldera was formed during four major explosive eruptions from 300,000 to 90,000 years ago. These produced voluminous pyroclastic flows that covered much of Kyushu. The last of these, the Aso-4 eruption, produced more than 600 km3 of airfall tephra and pyroclastic-flow deposits. A group of 17 central cones was constructed in the middle of the caldera, one of which, Nakadake, is one of Japan's most active volcanoes. It was the location of Japan's first documented historical eruption in 553 CE. The Nakadake complex has remained active throughout the Holocene. Several other cones have been active during the Holocene, including the Kometsuka scoria cone as recently as about 210 CE. Historical eruptions have largely consisted of basaltic to basaltic andesite ash emission with periodic strombolian and phreatomagmatic activity. The summit crater of Nakadake is accessible by toll road and cable car, and is one of Kyushu's most popular tourist destinations.
Information Contacts: JMA.
El Chichon (Mexico) — February 1993 Cite this Report
El Chichon
Mexico
17.3602°N, 93.2297°W; summit elev. 1150 m
All times are local (unless otherwise noted)
Fumarolic activity continues; lake chemistry unchanged
Fieldwork on 11-18 January revealed continued fumarolic activity around the crater lake and crater walls as observed in June 1992 (17:06). The boiling mud and water ponds remained active. Geyser-like fumaroles emitted a gas phase only, and extensive mud cracks indicated an 85 cm drop in the level of the crater lake. The changes were probably due to the decrease in rainfall during December and January.
The drop in lake level prevented temperature and pH measurements at the same sites sampled last June. Two new sites were chosen. Site 1, which better reflected the ambient conditions of the lake because of the absence of nearby fumaroles or boiling zones, had a temperature of 30.7°C and a pH of 2.3. The temperature at site 2 was 66.6°C and its pH was 1.7. Analysis of a water sample taken at site 1 indicated that the lake has remained chemically stable since 1992 except for minor boron variations.
On 13 January, two apparent phreatic explosions similar to one reported last year were heard and felt on the crater rim. A small rockfall avalanche on the SE inner wall of the crater followed the first explosion.
Geologic Background. El Chichón is a small trachyandesitic tuff cone and lava dome complex in an isolated part of the Chiapas region in SE México. Prior to 1982, this relatively unknown volcano was heavily forested and of no greater height than adjacent non-volcanic peaks. The largest dome, the former summit of the volcano, was constructed within a 1.6 x 2 km summit crater created about 220,000 years ago. Two other large craters are located on the SW and SE flanks; a lava dome fills the SW crater, and an older dome is located on the NW flank. More than ten large explosive eruptions have occurred since the mid-Holocene. The powerful 1982 explosive eruptions of high-sulfur, anhydrite-bearing magma destroyed the summit lava dome and were accompanied by pyroclastic flows and surges that devastated an area extending about 8 km around the volcano. The eruptions created a new 1-km-wide, 300-m-deep crater that now contains an acidic crater lake.
Information Contacts: José Luis Macías, Michael F. Sheridan, and Carmelo Ferlito, SUNY, Buffalo, NY; Juan Manuel Espíndola, Servando De la Cruz-Reyna, and M. Aurora Armienta, Instituto de Geofísica, UNAM.
Etna
Italy
37.748°N, 14.999°E; summit elev. 3357 m
All times are local (unless otherwise noted)
Lava flows continue; volume estimates reported
The following information, based on the report of the IIV, covers the period December 1992 through February 1993.
The eruption ... continued as lava gently flowed from the vent on the W wall of Valle del Bove, significantly expanding the flow field formed after the flow diversion of May 1992 (17:05). Lava moved to Piano del Trifoglietto through a forked lava tube, emptying through several ephemeral vents located mainly on the N and S sides of the flow field (figure 58). In the first half of December, lava escaped mainly through the S vents. Many small flows gradually covered Poggio Canfareddi Hill, previously isolated by flows moving E toward Mt. Zoccolaro. In the second half of December, activity shifted to the N vents, expanding the flow field over a flat area that had not been covered by lava from the current eruption. Using data from a GPS survey done in January, the total volume of lava erupted through 1992 was estimated to be 198 ± 40 x 106 m3. The lava covers an estimated 6.7 x 10⁶ m2 and the mean rate of lava production is 6m3/s.
By January 1993, lava flows from the S vents advanced to the Poggio Canfareddi area and a complex network of minor flows reached the foot of Mt. Zoccolaro at 1,530-m elevation. Lava continued to flow from the N vents, expanding the field 400 m to the N. On 27-29 January, a fast-moving lobe of lava flowed to the NE, reaching 1,500 m elevation, 4 km distant from the eruptive fissure.
Effusive activity declined in February, ceased at the S vents by 8 February. Flow from the N vents was less than in previous months and shifted to vents on the northern-most side of the flow field. The new flows did not expand the flow field.
The seismic network recorded five swarms of long-period events. Fourteen events with M >1 occurred on 1 December, 14 events on 23 December, five events on 25 December, 51 events on 30 December-2 January, and 26 events on 3 February. No event exceeded M 3. The swarms were located in a small focal volume between the summit craters and Pizzi Deneri (~2 km NE) at depths asl. Volcano-tectonic seismicity during the period remained low (only three events) comparable to that observed throughout 1992.
The 9-station bore-hole tiltmeter network recorded no significant deformation except for a sharp event 18-19 December. Steady degassing from the Etna summit craters was observed and a weak ash emission occurred on the morning of 3 December from the Bocca Nuovo vent. Minor landslides repeatedly affected the E inner wall of the NE crater until January. The crater floor had sunk by early morning on 3 February.
The following report from geologists at the IIV and the Univ di Catania with seismic information from G. Luongo, updates and complements the official IIV report above.
A lava flow, at least a few hundred meters wide, has formed on the NE side of the lava field that has been building since 27 May 1992 (figure 58). The flow, in the vicinity of Monti Centenari (2 km NE of the active fissure), is completely independent from the old field and is moving E in the middle of Valle del Bove. The lava of this flow is visible from between 2,205 and 1,700 m through a series of skylights on the main tube. Lava is surfacing through 4-5 ephemeral vents at ~1,500 m elevation; the vents active in the past on the N, S, and central parts of the old lava field have closed. On the morning of 12 March, the most advanced flows had reached 1,425 m elevation and were moving over lava of previous eruptions. By 1300 on 14 March, the lava front was at 1,400 m elevation, ~ 5 m wide, 1 m high, and moving at an estimated 1 m/h.
The estimated volume of lava produced after 458 days of activity is 295 x 106 m3. This estimate was calculated using the same method as previous estimates reported in the Bulletin, but is ~ 50% higher than the GPS value reported above. No significant changes in degassing of the summit craters were noticed. Northeast crater is still obstructed, with very active fumaroles along the inside walls. COSPEC measurements of SO2 flux remained normal (5-6 x 10³ t/d), except in early March when measured values were 12.5 x 10³ t/d.
Between 12 February and 15 March, 169 events of M 1.2-2.9 were recorded, mainly in the summit crater area. The majority of events appeared to be related to active degassing at the surface, with characteristic frequencies of 1-6 Hz. Volcanic tremor was completely absent.
Geologic Background. Mount Etna, towering above Catania on the island of Sicily, has one of the world's longest documented records of volcanism, dating back to 1500 BCE. Historical lava flows of basaltic composition cover much of the surface of this massive volcano, whose edifice is the highest and most voluminous in Italy. The Mongibello stratovolcano, truncated by several small calderas, was constructed during the late Pleistocene and Holocene over an older shield volcano. The most prominent morphological feature of Etna is the Valle del Bove, a 5 x 10 km caldera open to the east. Two styles of eruptive activity typically occur, sometimes simultaneously. Persistent explosive eruptions, sometimes with minor lava emissions, take place from one or more summit craters. Flank vents, typically with higher effusion rates, are less frequently active and originate from fissures that open progressively downward from near the summit (usually accompanied by Strombolian eruptions at the upper end). Cinder cones are commonly constructed over the vents of lower-flank lava flows. Lava flows extend to the foot of the volcano on all sides and have reached the sea over a broad area on the SE flank.
Information Contacts: IIV. The last three paragraphs are fromR. Romano, T. Caltabiano, M. Grasso, and M. Porto, IIV; P. Carveni and C. Monaco, Univ di Catania; G. Luongo, OV.
Galeras (Colombia) — February 1993 Cite this Report
Galeras
Colombia
1.22°N, 77.37°W; summit elev. 4276 m
All times are local (unless otherwise noted)
Low seismicity and SO2 levels; episodes of long-period tremor
Seismic activity at Galeras continued in February at the low levels that followed the 14 January eruption. The majority of earthquakes were located slightly to the W of the caldera at depths <1.5 km. COSPEC measurements of SO2 remained low and the [Crater Station] electronic tiltmeter showed no significant changes. Continuous gas emissions came from the main crater and fumaroles located to the W and SW. No seismicity could be correlated with periodic reports of roaring noises or explosions from the active crater.
Beginning on 13 February, long-period, "screw-type" seismic events referred to as tornillos were detected, their occurrence increasing towards the end of the month. As of 12 March, twenty-six of these events had been recorded. During the last days of February the tornillos changed character. Though still remaining low-frequency and long-duration, the signature varied or the dominant frequency increased. Some of the tornillos were located near the surface towards the W flank of the volcano.
Geologic Background. Galeras, a stratovolcano with a large breached caldera located immediately west of the city of Pasto, is one of Colombia's most frequently active volcanoes. The dominantly andesitic complex has been active for more than 1 million years, and two major caldera collapse eruptions took place during the late Pleistocene. Long-term extensive hydrothermal alteration has contributed to large-scale edifice collapse on at least three occasions, producing debris avalanches that swept to the west and left a large open caldera inside which the modern cone has been constructed. Major explosive eruptions since the mid-Holocene have produced widespread tephra deposits and pyroclastic flows that swept all but the southern flanks. A central cone slightly lower than the caldera rim has been the site of numerous small-to-moderate eruptions since the time of the Spanish conquistadors.
Information Contacts: M. Calvache, INGEOMINAS, Pasto.
Guagua Pichincha (Ecuador) — February 1993 Cite this Report
Guagua Pichincha
Ecuador
0.171°S, 78.598°W; summit elev. 4784 m
All times are local (unless otherwise noted)
Phreatic explosion kills two scientists
A phreatic explosion at 1146 on 12 March in the young crater of Guagua Pichincha's central dome killed two young volcanologists from the Instituto Geofísico. Ing. Victor Hugo Pérez, 31, and Egdo. Alvaro Sánchez, 25, had gone onto the dome, . . . (figure 3), to document recent activity when the strong blast hurled rocks and ash upon them, killing them instantly. Based on seismicity, a warning of possible activity had been transmitted to them by radio at 1030, but for unknown reasons they were still on the dome when the eruption occurred. Search and rescue operations were initiated late that afternoon and at about 0730 the following morning their bodies were discovered by M. Hall near the dome's crater rim.
Guagua Pichincha had been quiet since phreatic activity April-June 1990. The main fumarolic vents on the S side of the dome and the major steam vents at the foot of the S caldera wall exhibited normal fumarolic behavior. Fumarolic activity in the active crater on the NE flank of the dome has been variable but low.
Evidence of recent phreatic activity that had blasted ash and rocks NE against the inner wall of the caldera was noted during routine fieldwork on 11 March. A guard stationed near the caldera rim confirmed that an explosion had occurred on 9 March, depositing up to 10 cm of non-juvenile ash. The Instituto officially advised Civil Defense early on 12 March that Pichincha had resumed dangerous activity and that tourists and mountaineers should be advised of the danger in entering the caldera.
As in past explosive cycles, phreatic activity seems to be related to the rainy season, which normally begins in March. Activity may have begun earlier this year because of the abnormally high rainfall in February.
Geologic Background. Guagua Pichincha and the older Pleistocene Rucu Pichincha stratovolcanoes form a broad volcanic massif that rises immediately W of Ecuador's capital city, Quito. A lava dome grew at the head of a 6-km-wide scarp formed during a late-Pleistocene slope failure ~50,000 years ago. Subsequent late-Pleistocene and Holocene eruptions from the central vent consisted of explosive activity with pyroclastic flows accompanied by periodic growth and destruction of the lava dome. Many minor eruptions have been recorded since the mid-1500's; the largest took place in 1660, when ash fell over a 1,000 km radius and accumulated to 30 cm depth in Quito. Pyroclastic flows and surges also occurred, primarily to then W, and affected agricultural activity.
Information Contacts: M. Hall, Instituto Geofísico de la Escuela Politécnica Nacional.
Cerro Hudson (Chile) — February 1993 Cite this Report
Cerro Hudson
Chile
45.9°S, 72.97°W; summit elev. 1905 m
All times are local (unless otherwise noted)
Increased gas emission and mudflows
The following, from Peter Ippach and Rolf Kilian, describes observations during a caldera crossing and overflight between 11 February and 5 March. These are the first reported caldera observations since January 1992 (16:12). One of the largest eruptions of the 20th century began on 8 August 1991 from a fissure cutting the caldera rim (16:7-12, and 17:3). The paroxysmal phase began on 12 August, producing eruption columns up to 16-18 km for 3 days, resulting in ashfall in the Falkland Islands, 1,000 km away. Pyroclastic flows were mostly restricted to the caldera floor, and a lava flow traveled 4 km down the WNW flank.
The basaltic eruption phase of 8-9 August 1991 (16:8) took place on the W caldera rim under 20-30 m of ice, forming an elliptical N 25°W-trending fissure vent about 2.5 km long, 300 m wide, and 200 m deep. A lava flow from the eruption extended 3.5 km WNW along the Huemules glacier from the N flank of the fissure vent (see map in 16:7); it had a maximum thickness of 8 m. Lava debris flows and aa-like flows were observed on the N flank extending up to 2.5 km from the source. Lava- and spatter-flows traveled down the slope of the inner W caldera rim, one traveling 800-1,000 m before going into a 300 m-deep depression on the ice-covered caldera surface. The proximal fallout layer is about 1-5 m thick with individual pumice clasts up to 40 cm in diameter. Constant fumarolic activity was observed, and there was an intense sulfur smell.
Since the andesitic Plinian eruption of 12-15 August 1991 (16:7), gas emission has apparently increased in a 10 km2 area surrounding the vents. Gas columns from different locations were rising to 500 m altitude. A young phreatic eruption had produced a fan of reworked pyroclastic material 10 km to the E. Mudflow production has intensified as a result of strong geothermal activity increasing glacial melting. Volcaniclastic material was flowing in erosional channels SE of the caldera and following the Huemules glacier WNW. The increased mud- and mass-flow production in the Huemules valley is similar to the April 1973 volcaniclastic flow that followed the 1971 eruption. This implies a continuing risk for the valley, which is inhabited during the summer.
Crater-like depressions in a 5 km2 area in the SW part of the caldera probably indicated two eruption centers from the August 1991 eruption. The depressions contained lakes 650 m and 800 m in diameter, surrounded by an intensively cracked glacier. Pyroclastic material was reworked and redeposited in the lower NW part of the caldera during the austral summer of 1991/92, leaving deposits up to 50 m thick. These deposits were then covered by snow during the winter of 1992. Geothermal activity was not present in the NE part of the caldera.
Pyroclastic material on the SE-directed fan from the August 1991 eruption, between the Ibáñez and Murta rivers, was also extensively reworked during the 1991/92 summer. After a rainy summer, reworking and deposition had stopped by March 1993, with a great reduction in ash transport by the rivers. However, on the W side of the volcano, irregular meltwater flows from the Huemules glacier carried a large amount of pyroclastic material down the Huemules river.
Geologic Background. The ice-filled, 10-km-wide caldera of Cerro Hudson volcano was not recognized until its first 20th-century eruption in 1971. It is the southernmost volcano in the Chilean Andes, related to subduction of the Nazca plate beneath the South American plate. The massive volcano covers an area of 300 km2. The compound caldera is drained through a breach on its NW rim, which has been the source of mudflows down the Río de Los Huemeles. Two cinder cones occur N of the volcano and others occupy the SW and SE flanks. This volcano has been the source of several major Holocene explosive eruptions. An eruption about 6,700 years ago was one of the largest known in the southern Andes during the Holocene; another eruption about 3,600 years ago also produced more than 10 km3 of tephra. An eruption in 1991 formed a new 800-m-wide crater in the SW portion of the caldera.
Information Contacts: P. Ippach, GEOMAR; R. Kilian, Universität Tübingen, Germany.
Irazu (Costa Rica) — February 1993 Cite this Report
Irazu
Costa Rica
9.979°N, 83.852°W; summit elev. 3436 m
All times are local (unless otherwise noted)
Decreased fumarolic activity continues
Fumarolic activity in the main crater continued at a decreased level. The surface of the yellow-green crater lake rose about 12 cm from 1 December to January, but then dropped 40 cm by 15 February. Lake temperature ranged from 17.4 to 24.5°C. Areas along the edge of the lake with bubbles and gas emissions decreased in number and intensity, and had temperatures less than 92°C. The pH of the water has continued to rise since the low measurement of 5.7 on 15 February. The "steaming ground" on the debris fan N of the lake had fewer active fumaroles, and a maximum temperature of 87.9°C. There were no changes in the temperature or pH of the hot springs around the volcano.
Geologic Background. The massive Irazú volcano in Costa Rica, immediately E of the capital city of San José, covers an area of 500 km2 and is vegetated to within a few hundred meters of its broad summit crater complex. At least 10 satellitic cones are located on its S flank. No lava effusion is known since the eruption of the Cervantes lava flows from S-flank vents about 14,000 years ago, and all known Holocene eruptions have been explosive. The focus of eruptions at the summit crater complex has migrated to the W towards the main crater, which contains a small lake. The first well-documented eruption occurred in 1723, and frequent explosive eruptions have occurred since. Ashfall from the last major eruption during 1963-65 caused significant disruption to San José and surrounding areas. Phreatic activity reported in 1994 may have been a landslide event from the fumarolic area on the NW summit (Fallas et al., 2018).
Information Contacts: G. Soto and R. Barquero, ICE.
Kilauea (United States) — February 1993 Cite this Report
Kilauea
United States
19.421°N, 155.287°W; summit elev. 1222 m
All times are local (unless otherwise noted)
Episode 53 begins; lava flows from tube breakout reach Kamoamoa delta
"An upper east rift intrusive swarm began at 2325 on 7 February. More than 5,000 microshocks were counted in the first 48 hours of the swarm; these continued, in smaller numbers, until 18 February, when counts gradually decreased to normal. Several hundred events were processed, most located near Makaopuhi Crater, ~15 km SE of the summit and 6.4 km SW of Pu'u ' O'o. High-amplitude tremor beneath the summit accompanied the swarm. The count of shallow, short-period events beneath the summit was low, while that of shallow, long-period events was slightly above average until 22 February, peaking at >100 events on 19 February. The Uwekahuna water-tube tiltmeter at the summit of Kīlauea recorded ~15 µrad of deflation during the swarm. The tilt then reversed, recovering all of the deflation associated with the swarm by 23 February. The summit then slowly deflated again, with an E tilt of ~4 µrad recorded 23 February-1 March.
"On 8 February the magma supply to the E-51 vent was interrupted. Eruption tremor amplitudes, which had been ~2x background, rapidly diminished to background by 0400. As the E-51 tube system drained at the coast, sea water entered the tube, resulting in increased explosive activity starting at 0430 that continued intermittently for 3 hours. All flows stagnated by 9 February, but skylights remained incandescent for several days.
"The floor of Pu`u `O`o crater (35 m below the rim) collapsed on 8 February. After the collapse, the bottom of the crater consisted of talus slopes, with the lowest point >85 m below the crater rim. The lava pond reappeared on 10 February, and flows began to resurface the crater floor.
Episode 53 (E-53). "Eruption tremor remained at background levels until a gradual increase in amplitude on 16 February. On the same day, the lava pond in Pu`u `O`o rose dramatically and slow-moving lava was visible through the upper skylights of the E-51 tube. Two days later, sluggish pahoehoe flows broke out of the tube at 640 m elevation. More flows broke out at lower elevations, and by 20 February, channelized flows reached the top of Pulama pali. At 1450, lava fountains up to 4 m high were observed on the S flank of Pu`u `O`o, marking the beginning of E-53. The following day, the E-53 vent was ejecting spatter 15 m into the air and had formed a 30 m wide cone, with walls as high as 14 m. Flows from the vent area fanned out, filling the old E-52 collapsed pond and heading S towards the E-51 tube system.
"On 22 February, E-53 flows entered the E-51 tube through a skylight at 715 m elevation. The increase in magma in the tube led to an increase in activity. From 0000 to 0500, the eruption tremor amplitude increased noticeably to ~3-4x background. Amplitudes were sustained at 2-3x background for the remainder of the week. Large channelized flows advanced down the pali, fed by both the E-51 and E-53 vents. These flows merged with breakouts between 150 and 120 m elevation, reaching 60 m on 26 February. By 1 March, lava flows from the two vents were within 200 m of the ocean on the Kamoamoa delta, and within 40 m of Chain of Craters Road (figure 88).
"On 26 February, the crater floor in Pu`u `O`o was 59 m below the spillway rim. The last 2 weeks in February, lava in the pond fluctuated between this level and ~77 m below the rim."
Geologic Background. Kilauea overlaps the E flank of the massive Mauna Loa shield volcano in the island of Hawaii. Eruptions are prominent in Polynesian legends; written documentation since 1820 records frequent summit and flank lava flow eruptions interspersed with periods of long-term lava lake activity at Halemaumau crater in the summit caldera until 1924. The 3 x 5 km caldera was formed in several stages about 1,500 years ago and during the 18th century; eruptions have also originated from the lengthy East and Southwest rift zones, which extend to the ocean in both directions. About 90% of the surface of the basaltic shield volcano is formed of lava flows less than about 1,100 years old; 70% of the surface is younger than 600 years. The long-term eruption from the East rift zone between 1983 and 2018 produced lava flows covering more than 100 km2, destroyed hundreds of houses, and added new coastline.
Information Contacts: T. Mattox and P. Okubo, HVO.
Langila (Papua New Guinea) — February 1993 Cite this Report
Langila
Papua New Guinea
5.525°S, 148.42°E; summit elev. 1330 m
All times are local (unless otherwise noted)
Small Vulcanian eruptions
"Langila was more active in February than it had been since February-March 1992, with strong, sub-continuous Vulcanian activity from Crater 2, and a few days of eruptive activity at Crater 3.
"Although the volcano was covered in atmospheric clouds for the first week of the month, strong explosion and rumbling sounds from 5 February onward suggested renewed activity. When visible (after the 8th), Crater 2 displayed a dark column of ash-laden vapour that was forcefully released, convoluting and rising ~1 km above the crater. At night on 12 February, incandescent ejecta were visible in the Vulcanian eruption cloud, with ballistic trajectories rising up to 500 m above the crater. The strength of the eruption seemed to decrease after the 12th, with only night glow or mild incandescent projections 15-18 February. During the remainder of the month, Crater 2 released a steady white-gray plume of ash-laden vapour.
"Activity at Crater 3 was mild for the first half of the month, with moderate or weak emission of thin white vapour. Discrete Vulcanian explosions resumed on 12 February. By the 15th, the plume was forcefully rising several hundred meters above the crater. The plume was accompanied by strong explosion sounds and incandescent projections of increasing strength 15-18 February (maximum 400 m above crater). This activity decreased by the next day, with mainly weak white or blue vapour, and only occasional ash-laden emissions on 21-22 and 28 February.
"The seasonal NW wind carried fine ash over villages 8-18 km to the SE. Field inspection showed ~1 mm of ash accumulation in that area."
Geologic Background. Langila, one of the most active volcanoes of New Britain, consists of a group of four small overlapping composite basaltic-andesitic cones on the lower E flank of the extinct Talawe volcano in the Cape Gloucester area of NW New Britain. A rectangular, 2.5-km-long crater is breached widely to the SE; Langila was constructed NE of the breached crater of Talawe. An extensive lava field reaches the coast on the N and NE sides of Langila. Frequent mild-to-moderate explosive eruptions, sometimes accompanied by lava flows, have been recorded since the 19th century from three active craters at the summit. The youngest and smallest crater (no. 3 crater) was formed in 1960 and has a diameter of 150 m.
Information Contacts: R. Stewart, P. de Saint-Ours, and C. McKee, RVO.
Manam (Papua New Guinea) — February 1993 Cite this Report
Manam
Papua New Guinea
4.08°S, 145.037°E; summit elev. 1807 m
All times are local (unless otherwise noted)
Weak emissions; discontinuous low-amplitude tremor
"Low-level activity continued at Manam's S crater. Emissions consisted of weak white vapour, with occasional light ash content. A weak, fluctuating glow was seen above the crater whenever atmospheric conditions allowed. The main crater released only whisps of white vapour. Seismicity throughout the month consisted of discontinuous low-amplitude tremor and low-frequency events of small amplitude. Tiltmeter measurements showed no trends."
Geologic Background. The 10-km-wide island of Manam, lying 13 km off the northern coast of mainland Papua New Guinea, is one of the country's most active volcanoes. Four large radial valleys extend from the unvegetated summit of the conical basaltic-andesitic stratovolcano to its lower flanks. These valleys channel lava flows and pyroclastic avalanches that have sometimes reached the coast. Five small satellitic centers are located near the island's shoreline on the northern, southern, and western sides. Two summit craters are present; both are active, although most observed eruptions have originated from the southern crater, concentrating eruptive products during much of the past century into the SE valley. Frequent eruptions, typically of mild-to-moderate scale, have been recorded since 1616. Occasional larger eruptions have produced pyroclastic flows and lava flows that reached flat-lying coastal areas and entered the sea, sometimes impacting populated areas.
Information Contacts: R. Stewart, P. de Saint-Ours, and C. McKee, RVO.
Mayon (Philippines) — February 1993 Cite this Report
Mayon
Philippines
13.257°N, 123.685°E; summit elev. 2462 m
All times are local (unless otherwise noted)
Eruption continues; pyroclastic flows; lava extrusion
Eruptive activity ... continued following the 2 February eruption that killed at least 70 people (18:1). The pyroclastic flow associated with that event traveled 6 km SSE down the Bonga Gully and covered approximately 4 km2 (figure 5). The total volume of the flow, roughly 1-2 x 10⁶ m3, is much less than that of the 1984 pyroclastic flows (30 x 106 m3). As much as half of the volume of the 2 February flow may have been pre-1993 rock that was scoured from the gully as the flow descended. Calculations based on eyewitness accounts suggest an early speed for the flow of >120 km/hour. Up to 5 mm of ash fell 9 km SW of the volcano.
Between 2 February and 19 March, activity consisted principally of slow lava extrusion, occasional ash puffs (100-500 m high), explosions (figure 6), and small pyroclastic flows generated by the collapse of lava deposits on the steep-sloped summit (table 2). Triggered by explosions or gravity, the collapses resulted in incandescent blocks rolling down the Bonga Gully. When a larger block (103-105 m3) spalled or slumped from the front of the slowly advancing lava flow, it formed a small collapse-type pyroclastic flow that traveled as far as 4 km. Ash columns from the pyroclastic flows rose as high as 1 km above the crater unless strong winds sheared them off at a lower elevation. Such flows occurred on 12-13 February, 28 February-3 March, 10 March, and 15-17 March. On 15 March the number of explosion-type seismic signals increased and a new lava flow was observed at the summit.
Table 2. Significant events at Mayon, 6 February-19 March 1993. Courtesy of PHIVOLCS.
| Date |
Time |
Event |
| 06 Feb 1993 |
0425 |
Collapse-type pyroclastic flow travels 3 km. |
| 10-11 Feb 1993 |
-- |
Intermittent lava extrusion and formation of 200-m-long lava deposit. |
| 12 Feb 1993 |
1126 |
Explosion generates a 1.5-km-high ash column. Collapse-type pyroclastic flow travels 3 km. |
| 12 Feb 1993 |
1230 |
Explosion generates 3-km-high ash column. Collapse-type pyroclastic flow travels 3 km. |
| 12 Feb 1993 |
1509 |
Ash ejection to 1 km. |
| 12 Feb 1993 |
1512 |
Ash ejection 1.5 km high; cauliflower-shaped cloud. |
| 12 Feb 1993 |
2100 |
Intermittent lava extrusion. |
| 13 Feb 1993 |
0445 |
Explosion generates a cauliflower-shaped cloud 1 km high. Collapse-type pyroclastic flow travels 3.5 km. |
| 17-28 Feb 1993 |
-- |
Intermittent, slow lava extrusion; formation of 200-m-long lava flow. |
| 01 Mar 1993 |
0659 |
Collapse-type pyroclastic flow travels 2.5 km. |
| 03 Mar 1993 |
1530 |
Explosion-generated 1-km-high ash column. Collapse-type pyroclastic flow travels 4 km. |
| 10 Mar 1993 |
0344 |
Collapse-type pyroclastic flow travels 1.5 km. |
| 15 Mar 1993 |
0140 |
Start of lava extrusion. |
| 15 Mar 1993 |
2130 |
Collapse-type pyroclastic flow travels 1.5 km. |
| 15 Mar 1993 |
2258 |
Collapse-type pyroclastic flow travels 1.5 km. |
| 15 Mar 1993 |
2332 |
Collapse-type pyroclastic flow travels 2 km. |
| 16 Mar 1993 |
2303 |
Collapse-type pyroclastic flow travels 4 km. |
| 17-19 Mar 1993 |
-- |
Significant increase in the rate of lava extrusion at the summit. Collapse of lava becomes more frequent and produces numerous small collapse-type pyroclastic flows that travel 2-3 km. |
COSPEC measurements of SO2 began on 3 February (figure 7). Temporary decreases to 200-400 t/d on 12-13 February and 28 February were followed by small collapse-type pyroclastic flows. Most measurements after 7 March were ground-based instead of air-based. The ground-based measurements may not record all the SO2 that air-based measurements record because no available roads allow complete, rapid circumnavigation of Mayon. On 10 March, however, the two techniques were cross-checked and their values agreed.
During the last half of February, moderate to heavy rains on the SE flank remobilized the new pyroclastic deposits and generated small lahars. All lahars remained essentially confined to the channels.
There were numerous reports of a 2-3 m drop of the water table in the vicinity of Mayon in late 1992 and January 1993 as evidenced by water wells drying or decreasing production. Local observers also stated that similar drops occurred before the 1968, 1978, and 1984 eruptions, but that those drops were not as pronounced as the current one. A climber observed an increase in rockfalls and deepening of the Bonga Gully 6 days before the 2 February eruption but did not report his observations until after the eruption. Just prior to the 1984 eruption of Mayon he had reported a bulging of the normally concave crater floor into a convex dome. A PHIVOLCS observer reported that the temperature of a crater fumarole increased from 97°C in May 1991 to 150°C in July 1992.
Stephen O'Meara observed Mayon from 27 February to 7 March and reported the following.
Three N-S-trending vents or fissures in the summit crater were visible from the ruins near the village of Cagsaua (10 km SE of the summit) on 27 and 28 February. The N vent (also the highest) was the most active. At times the vents were clearly visible; at other times the entire throat of the summit crater was filled with a large, white, cauliflower-shaped cloud that did not rise above the crater. The steam cloud appeared to contain ash on 28 February.
Winds on the morning of 1 March blew the steam plume to Legazpi City, 14 km SE of the summit. It contained a dark gray tinge and smelled of sulfur. At 0700 a slow, silent pyroclastic flow traveled down the Bonga Gully. Simultaneously, a smaller flow moved S down the Miisi Gully. The gray cloud from the Bonga flow appeared to be composed of many segments produced by frequent bursts, but this may have been an illusion caused by strong winds. Ash fell on the S flank of the volcano.
At Arimbay (approximately 2.5 km N of Legazpi City), the smell of sulfur was noticed about 5 minutes prior to the arrival of a lahar at 1530 on 3 March. The knee-deep lahar was warm but not boiling. Approximately 1.5 m of mud, stones, and boulders deposited by previous lahars blocked traffic on the Legazpi-Tabaco road in Arimbay. Also on 3 March, a pyroclastic flow, larger and darker than the one seen on 1 March, "casually" rolled down the Bonga Gully.
On 4 March a reddish brown ash cloud traveled down the Bonga Gully, but did not develop into a strong pyroclastic flow. The cloud remained confined to the upper half of the gully. At 0100 on 5 March a faint crater glow was noticed with just a "spark" coming from the N vent. One small gray ash puff occurred between 0530 and 0730 and was confined to the crater. A reddish-brown ash puff seen in the afternoon also remained in the crater. Crater glow was observed before sunrise on 6 March and a reddish-brown ash puff similar to that observed on 5 March occurred in the early morning. At approximately 0800 on 7 March a larger, darker, gray ash eruption lasted 5 minutes. Nothing traveled down the Bonga, but a tiny pyroclastic flow may have traveled S down the Miisi Gully.
Geologic Background. Symmetrical Mayon, which rises above the Albay Gulf NW of Legazpi City, is the most active volcano of the Philippines. The steep upper slopes are capped by a small summit crater. Recorded eruptions since 1616 CE range from Strombolian to basaltic Plinian, with cyclical activity beginning with basaltic eruptions, followed by longer periods of andesitic lava flows. Eruptions occur predominately from the central conduit and have also produced lava flows that travel far down the flanks. Pyroclastic density currents and mudflows have commonly swept down many of the approximately 40 ravines that radiate from the summit and have often damaged populated lowland areas. A violent eruption in 1814 killed more than 1,200 people and devastated several towns.
Information Contacts: PHIVOLCS; S. O'Meara, Sky & Telescope, Belmont, MA; Chris Newhall, USGS.
Obituary Notices (Unknown) — February 1993 Cite this Report
Obituary Notices
Unknown
Unknown, Unknown; summit elev. m
All times are local (unless otherwise noted)
Deaths of two volcanologists (Victor Pérez and Alvaro Sánchez) at Guagua Pichincha
We are saddened to report the deaths of two volcanologists from the Instituto Geofísico, Escuela Politécnica Nacional, Ecuador, during the 12 March 1993 eruption of Guagua Pichincha.
Ing. Victor H. Pérez, age 31, graduated from the Escuela Pécnica Nacional in 1986, and had done his thesis on the volcanic geology of the area between Cotopaxi and Antisana volcanoes. He joined the Instituto in early 1992, and had worked in volcano monitoring, volcano mapping, and neotectonics.
Egdo. Alvaro Sánchez, age 25, was an outstanding geology student and mountaineer who was responsible for the daily processing of seismic data at the Institute.
Geologic Background. Obituary notices for volcanologists are sometimes written when scientists are killed during an eruption or have had a special relationship with the Global Volcanism Program.
Information Contacts:
Pinatubo (Philippines) — February 1993 Cite this Report
Pinatubo
Philippines
15.13°N, 120.35°E; summit elev. 1486 m
All times are local (unless otherwise noted)
Seismic activity continues
Volcanic activity continues at Pinatubo. The following summarizes activity recorded in two 24-hour periods.
For the 24-hour period starting at 0600 on 02 March, a seismometer located 9 km SE of the crater recorded 17 high-frequency volcanic earthquakes. During the same period, a seismometer on the N rim recorded 18 high-frequency and 1 low-frequency volcanic earthquakes. The seismometer on the rim continued to record the small-amplitude low-frequency harmonic tremor that began 23 February. The tremor is similar to the tremor episodes associated with the volcano's dome building activity in July 1992, and indicates vertical movement of magma. During a 24-hour period beginning at 0600 on 19 March, 16 high-frequency and 2 low-frequency events were detected by the seismometer 9 km distant, while 12 high-frequency events and no low-frequency harmonic tremor were recorded. Weak to moderate emissions of white steam reaching heights 200-500 m above the caldera rim were observed from Clark Air Base on the morning of 19 March.
Steve O'Meara observed the caldera during an overflight on 8 March (figure 29). "The SW caldera floor was covered with a kidney-bean-shaped green lake, of which a portion is stained grayish black. The discoloration might have been from recent ash deposits or from runoff entering the lake from the caldera walls (though there does not appear to be any rivulets associated with that particular section of the lake). A striking black river with golden edges cuts through the talus SE of the dome. The N caldera floor was covered with what appeared to be a fresh layer of gray ash covering the talus, which was dappled with explosion pits. A steaming, black dome complex with at least three major lobes rose above the central floor. The dome's active portion had a tall spine. Several steaming cinder cones and remnant explosion pits were visible, and one of the pits contained a green pond. The smell of sulfur gases was intense above the cinder cones."
Pinatubo erupted violently in June 1991, killing more than 700 people. The Philippine Institute of Volcanology and Seismology is maintaining Alert Level 3 at Pinatubo, warning that an explosive eruption is possible. Recommendations to avoid the 10-km radius "danger zone" around the volcano remain in effect.
Geologic Background. Prior to 1991 Pinatubo volcano was a relatively unknown, heavily forested lava dome complex located 100 km NW of Manila with no records of historical eruptions. The 1991 eruption, one of the world's largest of the 20th century, ejected massive amounts of tephra and produced voluminous pyroclastic flows, forming a small, 2.5-km-wide summit caldera whose floor is now covered by a lake. Caldera formation lowered the height of the summit by more than 300 m. Although the eruption caused hundreds of fatalities and major damage with severe social and economic impact, successful monitoring efforts greatly reduced the number of fatalities. Widespread lahars that redistributed products of the 1991 eruption have continued to cause severe disruption. Previous major eruptive periods, interrupted by lengthy quiescent periods, have produced pyroclastic flows and lahars that were even more extensive than in 1991.
Information Contacts: PHIVOLCS; Stephen O'Meara, Sky & Telescope, MA.
Poas (Costa Rica) — February 1993 Cite this Report
Poas
Costa Rica
10.2°N, 84.233°W; summit elev. 2697 m
All times are local (unless otherwise noted)
Fumarolic activity continues
Fumarolic activity continued in the N part of the crater lake with gas columns that rose 500 m. The most active fumaroles inside the crater were generally located on terraces near the N side of the lake and produced sounds like an airplane. There were six fewer hot mud and sulfur springs in the thermal area on the SE side of the lake. Phreatic eruptions from areas SE and N of the lake ejected material to 1 m height. Dome fumarole temperatures in February were 80-89°C. A fumarole on the N side of the lake had a temperature of 90°C, and the gas condensate had a pH of 1.7. The turquoise-green lake was more yellow near the shore because of sulfur deposition. Lake temperature was 70-75°C, and the pH ranged from near zero to 1.1 in February. The lake surface has decreased 50 cm since January.
Geologic Background. The broad vegetated edifice of Poás, one of the most active volcanoes of Costa Rica, contains three craters along a N-S line. The frequently visited multi-hued summit crater lakes of the basaltic-to-dacitic volcano are easily accessible by vehicle from the nearby capital city of San José. A N-S-trending fissure cutting the complex stratovolcano extends to the lower N flank, where it has produced the Congo stratovolcano and several lake-filled maars. The southernmost of the two summit crater lakes, Botos, last erupted about 7,500 years ago. The more prominent geothermally heated northern lake, Laguna Caliente, is one of the world's most acidic natural lakes, with a pH of near zero. It has been the site of frequent phreatic and phreatomagmatic eruptions since an eruption was reported in 1828. Eruptions often include geyser-like ejections of crater-lake water.
Information Contacts: G. Soto and R. Barquero, ICE; E. Fernández and J. Barquero, OVSICORI.
Popocatepetl (Mexico) — February 1993 Cite this Report
Popocatepetl
Mexico
19.023°N, 98.622°W; summit elev. 5393 m
All times are local (unless otherwise noted)
Increased fumarolic activity; seismicity remains low
Increased fumarolic activity was observed from 4,500 m elevation during routine deformation studies on 25 February. A dilute white column, roughly the diameter of the summit crater, could be seen gently rising from the crater. The column was deflected by the wind immediately above the crater, even at low wind levels, and occasionally descended the flanks of the volcano, mainly to the NE. Snow on the NE crater rim was somewhat darkened, probably due to a wetting effect of the plume. The plume appeared to be mostly water vapor, with an occasional smell of sulfur. Tourists that have climbed to the summit reported that the crater is filled with a fog-like cloud, and there is a very strong smell of sulfur. The telemetered seismic station located at Tlamacas (4,000 m elevation on the NW flank) has recorded only normal background levels of seismicity, similar to those observed during the past three years. Based on current information, geologists believe that the increased fumarolic activity may be related to increased rainfall feeding the hydrothermal system. Installation of a third telemetered seismic station will be completed in the next few months. No change in fumarole activity was observed during fieldwork on 11 March, and seismic activity was low and within background levels.
Geologic Background. Volcán Popocatépetl, whose name is the Aztec word for smoking mountain, rises 70 km SE of Mexico City to form North America's 2nd-highest volcano. The glacier-clad stratovolcano contains a steep-walled, 400 x 600 m wide crater. The generally symmetrical volcano is modified by the sharp-peaked Ventorrillo on the NW, a remnant of an earlier volcano. At least three previous major cones were destroyed by gravitational failure during the Pleistocene, producing massive debris-avalanche deposits covering broad areas to the south. The modern volcano was constructed south of the late-Pleistocene to Holocene El Fraile cone. Three major Plinian eruptions, the most recent of which took place about 800 CE, have occurred since the mid-Holocene, accompanied by pyroclastic flows and voluminous lahars that swept basins below the volcano. Frequent historical eruptions, first recorded in Aztec codices, have occurred since Pre-Columbian time.
Information Contacts: S. De la Cruz-Reyna and H. Nolasco, Instituto de Geofísica, UNAM, Ciudad Universitaria, Delegación de Coyoacán; E. Ramos, CENAPRED.
Rabaul (Papua New Guinea) — February 1993 Cite this Report
Rabaul
Papua New Guinea
4.2459°S, 152.1937°E; summit elev. 688 m
All times are local (unless otherwise noted)
Seismicity remains low; no significant deformation
"Seismic activity remained low in February; 256 caldera earthquakes were recorded . . . . Only four of February's earthquakes were located. They occurred in the W (2), SW, and SE parts of the caldera seismic zone. Routine monthly leveling in the caldera showed no significant changes compared to January."
Geologic Background. The low-lying Rabaul caldera on the tip of the Gazelle Peninsula at the NE end of New Britain forms a broad sheltered harbor utilized by what was the island's largest city prior to a major eruption in 1994. The outer flanks of the asymmetrical shield volcano are formed by thick pyroclastic-flow deposits. The 8 x 14 km caldera is widely breached on the east, where its floor is flooded by Blanche Bay and was formed about 1,400 years ago. An earlier caldera-forming eruption about 7,100 years ago is thought to have originated from Tavui caldera, offshore to the north. Three small stratovolcanoes lie outside the N and NE caldera rims. Post-caldera eruptions built basaltic-to-dacitic pyroclastic cones on the caldera floor near the NE and W caldera walls. Several of these, including Vulcan cone, which was formed during a large eruption in 1878, have produced major explosive activity during historical time. A powerful explosive eruption in 1994 occurred simultaneously from Vulcan and Tavurvur volcanoes and forced the temporary abandonment of Rabaul city.
Information Contacts: R. Stewart, P. de Saint-Ours, and C. McKee, RVO.
Rincon de la Vieja (Costa Rica) — February 1993 Cite this Report
Rincon de la Vieja
Costa Rica
10.83°N, 85.324°W; summit elev. 1916 m
All times are local (unless otherwise noted)
Gas plumes rise to 500 m; lake level drops
Fumarolic activity continued from the E wall of the active crater, with gas plumes rising 500 m. A strong smell of sulfur near the crater caused eye and skin irritation. Gas vents in the SE and SW parts of the crater had disappeared. Small collapses had occurred along the E and NE crater walls.
The level of the crater lake has dropped 1 m since last year. The light-gray colored lake had a temperature of 35°C in February and a pH of 1.6. The number of floating sulfur patches has decreased, and only one small bubbling area remains, producing very small intermittent bubbles.
Geologic Background. Rincón de la Vieja, the largest volcano in NW Costa Rica, is a remote volcanic complex in the Guanacaste Range. The volcano consists of an elongated, arcuate NW-SE-trending ridge constructed within the 15-km-wide early Pleistocene Guachipelín caldera, whose rim is exposed on the south side. Sometimes known as the "Colossus of Guanacaste," it has an estimated volume of 130 km3 and contains at least nine major eruptive centers. Activity has migrated to the SE, where the youngest-looking craters are located. The twin cone of Santa María volcano, the highest peak of the complex, is located at the eastern end of a smaller, 5-km-wide caldera and has a 500-m-wide crater. A Plinian eruption producing the 0.25 km3 Río Blanca tephra about 3,500 years ago was the last major magmatic eruption. All subsequent eruptions, including numerous historical eruptions possibly dating back to the 16th century, have been from the prominent active crater containing a 500-m-wide acid lake located ENE of Von Seebach crater.
Information Contacts: E. Fernández and J. Barquero, OVSICORI.
Ruapehu (New Zealand) — February 1993 Cite this Report
Ruapehu
New Zealand
39.28°S, 175.57°E; summit elev. 2797 m
All times are local (unless otherwise noted)
Little change in crater lake; episodes of tremor
Fieldwork on 17 February revealed little change compared to previous visits. The lake was pale gray-green with a large area of brownish discoloration over the N vent area, where several convection cells were apparent. Blue-green meltwater around the N and W margins increased in area during the day. There was no shoreline evidence of recent surging. Following a decline in January, the lake temperature had increased from 21°C (measured on 12 January) to 24°C. Over the same period the lake outflow decreased from 100 l/s to 90 l/s. The Mg/Cl ratio in the lake water has remained essentially constant since December (table 3), after reaching a low of 0.042 in September.
Table 3. Temperature, outflow measurements, and water analyses from the crater lake of Ruapehu, 21 December 1992 to 10 December 1993. Discharge is in liters/second (l/s). Discharge of "0" indicates a lake level below overflow stage. A dash (--) signifies no measurement. (The low Mg and Cl values on 11 January were due to excessive meltwater dilution. Analyses done by M.E. Crump). Courtesy of IGNS.
| Date |
Outlet (°C) |
Logger Point (°C) |
Discharge (l/s) |
Mg (ppm) |
Cl (ppm) |
Mg/Cl |
| 21 Dec 1992 |
-- |
-- |
-- |
311 |
6731 |
0.046 |
| 11 Jan 1993 |
-- |
-- |
-- |
273 |
5947 |
0.046 |
| 17 Feb 1993 |
-- |
-- |
-- |
299 |
6674 |
0.045 |
| 03 Jun 1993 |
14.0 |
16.5 |
less than 1 |
282 |
6403 |
0.044 |
| 18 Jun 1993 |
10.9 |
13.0 |
30 |
273 |
6194 |
0.044 |
| 03 Jul 1993 |
11.2 |
12.5 |
-- |
277 |
6267 |
0.044 |
| 06 Aug 1993 |
19.6 |
-- |
85 |
277 |
6404 |
0.043 |
| 21 Sep 1993 |
35.5 |
-- |
25 |
283 |
6753 |
0.042 |
| 29 Sep 1993 |
38.2 |
-- |
0 |
282 |
6883 |
0.041 |
| 09 Oct 1993 |
35.5 |
-- |
0 |
294 |
7016 |
0.042 |
| 04 Nov 1993 |
37.2 |
39.0 |
0 |
296 |
7233 |
0.041 |
| 10 Dec 1993 |
26.0 |
-- |
0 |
293 |
7175 |
0.041 |
EDM measurements revealed no long-term movements of volcanic significance. A key benchmark, buried by snow since July, was exhumed. Its burial prevented detection of any short-term inflationary changes.
The crater was revisited 28 February-2 March to install telemetry equipment. The lake initially appeared unchanged from 17 February, but by 2 March it was a uniform gray. Outflow was estimated to be 140 l/s. Lake temperatures of 28-29°C measured near the telemetry equipment were similar to the 29.2°C telemetered via ARGOS on 4 March.
Seismicity was generally low with some volcanic earthquakes recorded. Strong tremor was recorded 9-10 January and moderate tremor on 25-28 February.
Geologic Background. Ruapehu, one of New Zealand's most active volcanoes, is a complex stratovolcano constructed during at least four cone-building episodes dating back to about 200,000 years ago. The dominantly andesitic 110 km3 volcanic massif is elongated in a NNE-SSW direction and surrounded by another 100 km3 ring plain of volcaniclastic debris, including the NW-flank Murimoto debris-avalanche deposit. A series of subplinian eruptions took place between about 22,600 and 10,000 years ago, but pyroclastic flows have been infrequent. The broad summait area and flank contain at least six vents active during the Holocene. Frequent mild-to-moderate explosive eruptions have been recorded from the Te Wai a-Moe (Crater Lake) vent, and tephra characteristics suggest that the crater lake may have formed as recently as 3,000 years ago. Lahars resulting from phreatic eruptions at the summit crater lake are a hazard to a ski area on the upper flanks and lower river valleys.
Information Contacts: P. Otway, IGNS Wairakei.
Spurr (United States) — February 1993 Cite this Report
Spurr
United States
61.299°N, 152.251°W; summit elev. 3374 m
All times are local (unless otherwise noted)
Low seismic activity; level of concern reduced from Yellow to Green
Because of continued low seismicity, on 5 March 1993 the Alaska Volcano Observatory downgraded its Level of Concern Color Code for Spurr from Yellow to Green. Seismicity has remained low since December 1992, longer than the quiet period between the 27 June and 18 August 1992 eruptions. Between 12 February and 12 March 1993 two or fewer events/day were recorded. Measurements on 18 February of CO2 (400 tons/day) and SO2 (none detected) were similar to those made in early January. Visual inspection of Crater Peak between 12 and 19 February showed no significant morphological changes to the crater area, although one large slab of glacial ice is detaching from the outer NE flank. It may produce a significant seismic signal if it fails suddenly.
Spurr was last at color code green from 8 July to 18 August 1992. Green indicates that the "volcano is in its normal 'dormant' state." The observatory did warn that "the possibility for steam and ash explosions still exists. Should such explosions occur, they are unlikely to pose a hazard to high-flying aircraft or to communities downwind."
Geologic Background. Mount Spurr is the closest volcano to Anchorage, Alaska (130 km W) and just NE of Chakachamna Lake. The summit is a large lava dome at the center of a roughly 5-km-wide amphitheater open to the south formed by a late-Pleistocene or early Holocene debris avalanche and associated pyroclastic flows that destroyed an older edifice. The debris avalanche traveled more than 25 km SE, and the resulting deposit contains blocks as large as 100 m in diameter. Several ice-carved post-collapse cones or lava domes are present. The youngest vent, Crater Peak, formed at the southern end of the amphitheater and has been the source of about 40 identified Holocene tephra layers. Eruptions from Crater Peak in 1953 and 1992 deposited ash in Anchorage.
Information Contacts: AVO.
Stromboli (Italy) — February 1993 Cite this Report
Stromboli
Italy
38.789°N, 15.213°E; summit elev. 924 m
All times are local (unless otherwise noted)
Seismicity and tremor resume after 10 February explosions
Seismicity between 1 November 1992 and 28 February 1993 was stable except for two episodes of heightened activity (figure 28). High tremor energy and >25 explosion-earthquakes/hour were recorded on 6 December. On 10 February, three strong explosions occurred followed by a sudden decrease of tremor to about one-sixth the energy and one-third the number of events. In the week preceding the 10 February explosions, a large number of strong shocks occurred, with a maximum of 76 on 7 February. After a few days of low seismicity following the explosions, tremor amplitude and the number of events gradually increased, reaching an isolated maximum on 22 February.
Geologic Background. Spectacular incandescent nighttime explosions at Stromboli have long attracted visitors to the "Lighthouse of the Mediterranean" in the NE Aeolian Islands. This volcano has lent its name to the frequent mild explosive activity that has characterized its eruptions throughout much of historical time. The small island is the emergent summit of a volcano that grew in two main eruptive cycles, the last of which formed the western portion of the island. The Neostromboli eruptive period took place between about 13,000 and 5,000 years ago. The active summit vents are located at the head of the Sciara del Fuoco, a prominent scarp that formed about 5,000 years ago due to a series of slope failures which extends to below sea level. The modern volcano has been constructed within this scarp, which funnels pyroclastic ejecta and lava flows to the NW. Essentially continuous mild Strombolian explosions, sometimes accompanied by lava flows, have been recorded for more than a millennium.
Information Contacts: M. Riuscetti, Univ di Udine.
Ulawun (Papua New Guinea) — February 1993 Cite this Report
Ulawun
Papua New Guinea
5.05°S, 151.33°E; summit elev. 2334 m
All times are local (unless otherwise noted)
Activity continues to decline; glow observed in crater
"Activity . . . continued to decline following the brief phreatic or phreatomagmatic activity in mid-January (BGVN 18:01). However, activity is still above normal levels. Emissions throughout the month consisted of white vapour, in weak to moderate volumes. Blue vapour was seen occasionally. A steady weak night glow was seen 14-18 February. There were also unconfirmed reports of glow at other times during February.
"Seismic activity consisted of low-level, sub-continuous tremor with almost no discrete B-type events. The CVO's RSAM (Real-time Seismic Amplitude Measurement) system was deployed at the end of January to monitor tremor levels. From 29 January until 6 February the tremor level declined markedly. The system was inoperative until 17 February, when the tremor level was about the same as on the 6th. Helicorder readings indicated that tremor level was fairly constant from the 6th until the end of the month. This level of tremor is lower, by a factor of 2-3, than that seen during the peak of activity in mid-January and is comparable to the levels seen in early January.
"An aerial inspection on 18 February gave a reasonably clear view of the base of the crater. The source of the glow, on the E side of the crater, could not be seen directly. Only the glow's reflection on the walls of a vent at the crater base was seen. It was not possible to say whether this has changed since the last observation in January, but no other features in the crater have changed.
"EDM and dry-tilt surveys were carried out from 16-19 February. The EDM surveys showed little change since the last survey in September 1992, although there was some evidence of inflation at two stations high on the flanks. Dry-tilt results from two stations (S. Ridge and NW Valley, respectively 3 and 6.2 km from the summit) showed radial inflation of 25 and 17 µrads since September. Changes at three other stations were not conclusive."
Geologic Background. The symmetrical basaltic-to-andesitic Ulawun stratovolcano is the highest volcano of the Bismarck arc, and one of Papua New Guinea's most frequently active. The volcano, also known as the Father, rises above the N coast of the island of New Britain across a low saddle NE of Bamus volcano, the South Son. The upper 1,000 m is unvegetated. A prominent E-W escarpment on the south may be the result of large-scale slumping. Satellitic cones occupy the NW and E flanks. A steep-walled valley cuts the NW side, and a flank lava-flow complex lies to the south of this valley. Historical eruptions date back to the beginning of the 18th century. Twentieth-century eruptions were mildly explosive until 1967, but after 1970 several larger eruptions produced lava flows and basaltic pyroclastic flows, greatly modifying the summit crater.
Information Contacts: R. Stewart, P. de Saint-Ours, and C. McKee, RVO.
Unzendake (Japan) — February 1993 Cite this Report
Unzendake
Japan
32.761°N, 130.299°E; summit elev. 1483 m
All times are local (unless otherwise noted)
Dome complex continues to grow; large pyroclastic flow
Dome 10 . . . grew at a faster rate (1-2 x 10⁵ m3/day) than the dome complex grew during November-January. This rate, nearly equal to the magma supply rate, is less than half of the maximum value recorded at Unzen of ~ 5 x 10⁵ m3/day. The dome is significantly less silicic, 63.5 wt.% SiO2, than the earlier domes, which had 65 wt.% SiO2. It eventually covered the gas-emitting sites and most of the remaining surfaces of domes 1 and 3 in the topographically lower area to the N. Because dome 10 grew on the nearly flat surface of the older domes (figure 49), collapses seldom occurred, and the observed frequency of pyroclastic flows and the monthly total of seismically recorded pyroclastic flows remained low (figure 50). Relatively large collapses, though still less than 5 x 10⁵ m3 in volume, started just after the dome began overflowing the top. During February, pyroclastic flows traveled ~ 2 km to the E, NE, and SE.
A pyroclastic flow at 1642 on 9 March descended between two wings of dome 4 (figure 48). Part of the flow traveled 3.5 km E into the Mizunashi Valley. The other part traveled NE through the Oshiga Valley with an overflow out of the valley to the N. The remainder moved to the SE, eventually rejoining the Mizunashi Valley flow. It was the longest flow since 20 December and the first flow to pass through the Oshiga Valley since 15 September 1991, that flow being the largest of the current eruption. The seismic duration of the 9 March flow, 190 seconds, was the longest since 15 January. The flow remained in the evacuated area and caused no damage although a section of highway, 6 km E of the volcano, was temporarily closed. The ash cloud from the flow rose 1.5 km above the summit, the highest since April 1992. Ash fell heavily on the E foot of the volcano in Shimbara and Fukae. Kumamoto, 40 km E, received a small ashfall. Additional pyroclastic flows occurred 12 March.
The steam plume, occasionally mixed with ash, continued to rise a few hundred meters above the dome complex. The height has gradually declined since the summer of 1991 (figure 51). Mid-February work by the Tokyo Institute of Technology indicated that the SO2 flux from the dome complex remained at the low level measured at the end of 1992 (during endogenous growth) and the temperature of gases in the crater was as high as 800°C.
The number of small earthquakes beneath the dome complex declined rapidly in early February and has remained low (figure 50). The monthly total of recorded earthquakes dropped from more than 3,000 to 542. Seismicity around the volcano remained low.
Geologic Background. The massive Unzendake volcanic complex comprises much of the Shimabara Peninsula east of the city of Nagasaki. An E-W graben, 30-40 km long, extends across the peninsula. Three large stratovolcanoes with complex structures, Kinugasa on the north, Fugen-dake at the east-center, and Kusenbu on the south, form topographic highs on the broad peninsula. Fugendake and Mayuyama volcanoes in the east-central portion of the andesitic-to-dacitic volcanic complex have been active during the Holocene. The Mayuyama lava dome complex, located along the eastern coast west of Shimabara City, formed about 4000 years ago and was the source of a devastating 1792 CE debris avalanche and tsunami. Historical eruptive activity has been restricted to the summit and flanks of Fugendake. The latest activity during 1990-95 formed a lava dome at the summit, accompanied by pyroclastic flows that caused fatalities and damaged populated areas near Shimabara City.
Information Contacts: JMA; S. Nakada, Kyushu Univ.