Recently Published Bulletin Reports
Erebus (Antarctica) Lava lake remains active; most thermal alerts recorded since 2019
Rincon de la Vieja (Costa Rica) Frequent phreatic explosions during July-December 2023
Bezymianny (Russia) Explosion on 18 October 2023 sends ash plume 8 km high; lava flows and incandescent avalanches
Kilauea (United States) Low-level lava effusions in the lava lake at Halema’uma’u during July-December 2022
Nyamulagira (DR Congo) Lava flows and thermal activity during May-October 2023
Bagana (Papua New Guinea) Explosions, ash plumes, ashfall, and lava flows during April-September 2023
Mayon (Philippines) Lava flows, pyroclastic flows, ash emissions, and seismicity during April-September 2023
Nishinoshima (Japan) Eruption plumes and gas-and-steam plumes during May-August 2023
Krakatau (Indonesia) White gas-and-steam plumes and occasional ash plumes during May-August 2023
Villarrica (Chile) Strombolian activity, gas-and-ash emissions, and crater incandescence during April-September 2023
Merapi (Indonesia) Frequent incandescent avalanches during April-September 2023
Ebeko (Russia) Moderate explosive activity with ash plumes continued during June-November 2023
Erebus (Antarctica) — January 2024  Cite this Report
Erebus
Antarctica
77.53°S, 167.17°E; summit elev. 3794 m
All times are local (unless otherwise noted)
Lava lake remains active; most thermal alerts recorded since 2019
The lava lake in the summit crater of Erebus has been active since at least 1972. Located in Antarctica overlooking the McMurdo Station on Ross Island, it is the southernmost active volcano on the planet. Because of the remote location, activity is primarily monitored by satellites. This report covers activity during 2023.
The number of thermal alerts recorded by the Hawai'i Institute of Geophysics and Planetology’s MODVOLC Thermal Alerts System increased considerably in 2023 compared to the years 2020-2022 (table 9). In contrast to previous years, the MODIS instruments aboard the Aqua and Terra satellites captured data from Erebus every month during 2023. Consistent with previous years, the lowest number of anomalous pixels were recorded in January, November, and December.
Table 9. Number of monthly MODIS-MODVOLC thermal alert pixels recorded at Erebus during 2017-2023. See BGVN 42:06 for data from 2000 through 2016. The table was compiled using data provided by the HIGP – MODVOLC Thermal Alerts System.
| Year |
Jan |
Feb |
Mar |
Apr |
May |
Jun |
Jul |
Aug |
Sep |
Oct |
Nov |
Dec |
SUM |
| 2017 |
0 |
21 |
9 |
0 |
0 |
1 |
11 |
61 |
76 |
52 |
0 |
3 |
234 |
| 2018 |
0 |
21 |
58 |
182 |
55 |
17 |
137 |
172 |
103 |
29 |
0 |
0 |
774 |
| 2019 |
2 |
21 |
162 |
151 |
55 |
56 |
75 |
53 |
29 |
19 |
1 |
0 |
624 |
| 2020 |
0 |
2 |
16 |
18 |
4 |
4 |
1 |
3 |
18 |
3 |
1 |
6 |
76 |
| 2021 |
0 |
9 |
1 |
0 |
2 |
56 |
46 |
47 |
35 |
52 |
5 |
3 |
256 |
| 2022 |
1 |
13 |
55 |
22 |
15 |
32 |
39 |
19 |
31 |
11 |
0 |
0 |
238 |
| 2023 |
2 |
33 |
49 |
82 |
41 |
32 |
70 |
64 |
42 |
17 |
5 |
11 |
448 |
Sentinel-2 infrared images showed one or two prominent heat sources within the summit crater, accompanied by adjacent smaller sources, similar to recent years (see BGVN 46:01, 47:02, and 48:01). A unique image was obtained on 25 November 2023 by the OLI-2 (Operational Land Imager-2) on Landsat 9, showing the upper part of the volcano surrounded by clouds (figure 32).
Geologic Background. Mount Erebus, the world's southernmost historically active volcano, overlooks the McMurdo research station on Ross Island. It is the largest of three major volcanoes forming the crudely triangular Ross Island. The summit of the dominantly phonolitic volcano has been modified by one or two generations of caldera formation. A summit plateau at about 3,200 m elevation marks the rim of the youngest caldera, which formed during the late-Pleistocene and within which the modern cone was constructed. An elliptical 500 x 600 m wide, 110-m-deep crater truncates the summit and contains an active lava lake within a 250-m-wide, 100-m-deep inner crater; other lava lakes are sometimes present. The glacier-covered volcano was erupting when first sighted by Captain James Ross in 1841. Continuous lava-lake activity with minor explosions, punctuated by occasional larger Strombolian explosions that eject bombs onto the crater rim, has been documented since 1972, but has probably been occurring for much of the volcano's recent history.
Information Contacts: Hawai'i Institute of Geophysics and Planetology (HIGP) - MODVOLC Thermal Alerts System, School of Ocean and Earth Science and Technology (SOEST), Univ. of Hawai'i, 2525 Correa Road, Honolulu, HI 96822, USA (URL: http://modis.higp.hawaii.edu/); Copernicus Browser, Copernicus Data Space Ecosystem, European Space Agency (URL: https://dataspace.copernicus.eu/browser/); NASA Earth Observatory, EOS Project Science Office, NASA Goddard Space Flight Center, Goddard, Maryland, USA (URL: https://earthobservatory.nasa.gov/images/152134/erebus-breaks-through).
Rincon de la Vieja (Costa Rica) — January 2024 Cite this Report
Rincon de la Vieja
Costa Rica
10.83°N, 85.324°W; summit elev. 1916 m
All times are local (unless otherwise noted)
Frequent phreatic explosions during July-December 2023
Rincón de la Vieja is a volcanic complex in Costa Rica with a hot convecting acid lake that exhibits frequent weak phreatic explosions, gas-and-steam emissions, and occasional elevated sulfur dioxide levels (BGVN 45:10, 46:03, 46:11). The current eruption period began June 2021. This report covers activity during July-December 2023 and is based on weekly bulletins and occasional daily reports from the Observatorio Vulcanologico Sismologica de Costa Rica-Universidad Nacional (OVSICORI-UNA).
Numerous weak phreatic explosions continued during July-December 2023, along with gas-and-steam emissions and plumes that rose as high as 3 km above the crater rim. Many weekly OVSICORI-UNA bulletins included the previous week's number of explosions and emissions (table 9). For many explosions, the time of explosion was given (table 10). Frequent seismic activity (long-period earthquakes, volcano-tectonic earthquakes, and tremor) accompanied the phreatic activity.
Table 9. Number of reported weekly phreatic explosions and gas-and-steam emissions at Rincón de la Vieja, July-December 2023. Counts are reported for the week before the Weekly Bulletin date; not all reports included these data. Courtesy of OVSICORI-UNA.
| OVSICORI Weekly Bulletin |
Number of explosions |
Number of emissions |
| 28 Jul 2023 |
6 |
14 |
| 4 Aug 2023 |
10 |
12 |
| 1 Sep 2023 |
13 |
11 |
| 22 Sep 2023 |
12 |
13 |
| 29 Sep 2023 |
6 |
11 |
| 6 Oct 2023 |
12 |
5 |
| 13 Oct 2023 |
7 |
9 |
| 20 Oct 2023 |
1 |
15 |
| 27 Oct 2023 |
3 |
23 |
| 3 Nov 2023 |
3 |
10 |
| 17 Nov 2023 |
0 |
Some |
| 24 Nov 2023 |
0 |
14 |
| 8 Dec 2023 |
4 |
16 |
| 22 Dec 2023 |
8 |
18 |
Table 10. Summary of activity at Rincón de la Vieja during July-December 2023. Weak phreatic explosions and gas emissions are noted where the time of explosion was indicated in the weekly or daily bulletins. Height of plumes or emissions are distance above the crater rim. Courtesy of OVSICORI-UNA.
| Date |
Time |
Description of Activity |
| 1 Jul 2023 |
0156 |
Explosion. |
| 2 Jul 2023 |
0305 |
Explosion. |
| 4 Jul 2023 |
0229, 0635 |
Event at 0635 produced a gas-and-steam plume that rose 700 m and drifted W; seen by residents in Liberia (21 km SW). |
| 9 Jul 2023 |
1843 |
Explosion. |
| 21 Jul 2023 |
0705 |
Explosion. |
| 26 Jul 2023 |
1807 |
Explosion. |
| 28 Jul 2023 |
0802 |
Explosion generated a gas-and-steam plume that rose 500 m. |
| 30 Jul 2023 |
1250 |
Explosion. |
| 31 Jul 2023 |
2136 |
Explosion. |
| 11 Aug 2023 |
0828 |
Explosion. |
| 18 Aug 2023 |
1304 |
Explosion. |
| 21 Aug 2023 |
1224 |
Explosion generated gas-and-steam plumes rose 500-600 m. |
| 22 Aug 2023 |
0749 |
Explosion generated gas-and-steam plumes rose 500-600 m. |
| 24 Aug 2023 |
1900 |
Explosion. |
| 25 Aug 2023 |
0828 |
Event produced a steam-and-gas plume that rose 3 km and drifted NW. |
| 27-28 Aug 2023 |
0813 |
Four small events; the event at 0813 on 28 August lasted two minutes and generated a steam-and-gas plume that rose 2.5 km. |
| 1 Sep 2023 |
1526 |
Explosion generated plume that rose 2 km and ejected material onto the flanks. |
| 2-3 Sep 2023 |
- |
Small explosions detected in infrasound data. |
| 4 Sep 2023 |
1251 |
Gas-and-steam plume rose 1 km and drifted W. |
| 7 Nov 2023 |
1113 |
Explosion. |
| 8 Nov 2023 |
0722 |
Explosion. |
| 12 Nov 2023 |
0136 |
Small gas emissions. |
| 14 Nov 2023 |
0415 |
Small gas emissions. |
According to OVSICORI-UNA, during July-October the average weekly sulfur dioxide (SO2) flux ranged from 68 to 240 tonnes/day. However, in mid-November the flux increased to as high as 334 tonnes/day, the highest value measured in recent years. The high SO2 flux in mid-November was also detected by the TROPOMI instrument on the Sentinel-5P satellite (figure 43).
Geologic Background. Rincón de la Vieja, the largest volcano in NW Costa Rica, is a remote volcanic complex in the Guanacaste Range. The volcano consists of an elongated, arcuate NW-SE-trending ridge constructed within the 15-km-wide early Pleistocene Guachipelín caldera, whose rim is exposed on the south side. Sometimes known as the "Colossus of Guanacaste," it has an estimated volume of 130 km3 and contains at least nine major eruptive centers. Activity has migrated to the SE, where the youngest-looking craters are located. The twin cone of Santa María volcano, the highest peak of the complex, is located at the eastern end of a smaller, 5-km-wide caldera and has a 500-m-wide crater. A Plinian eruption producing the 0.25 km3 Río Blanca tephra about 3,500 years ago was the last major magmatic eruption. All subsequent eruptions, including numerous historical eruptions possibly dating back to the 16th century, have been from the prominent active crater containing a 500-m-wide acid lake located ENE of Von Seebach crater.
Information Contacts: Observatorio Vulcanológico Sismológica de Costa Rica-Universidad Nacional (OVSICORI-UNA), Apartado 86-3000, Heredia, Costa Rica (URL: http://www.ovsicori.una.ac.cr/); NASA Global Sulfur Dioxide Monitoring Page, Atmospheric Chemistry and Dynamics Laboratory, NASA Goddard Space Flight Center (NASA/GSFC), 8800 Greenbelt Road, Goddard MD 20771, USA (URL: https://so2.gsfc.nasa.gov/).
Bezymianny (Russia) — November 2023 Cite this Report
Bezymianny
Russia
55.972°N, 160.595°E; summit elev. 2882 m
All times are local (unless otherwise noted)
Explosion on 18 October 2023 sends ash plume 8 km high; lava flows and incandescent avalanches
Bezymianny, located on Russia’s Kamchatka Peninsula, has had eruptions since 1955 characterized by dome growth, explosions, pyroclastic flows, ash plumes, and ashfall. Activity during November 2022-April 2023 included gas-and-steam emissions, lava dome collapses generating avalanches, and persistent thermal activity. Similar eruptive activity continued from May through October 2023, described here based on information from weekly and daily reports of the Kamchatka Volcano Eruptions Response Team (KVERT), notices from Tokyo VAAC (Volcanic Ash Advisory Center), and from satellite data.
Overall activity decreased after the strong period of activity in late March through April 2023, which included ash explosions during 29 March and 7-8 April 2023 that sent plumes as high as 10-12 km altitude, along with dome growth and lava flows (BGVN 48:05). This reduced activity can be seen in the MIROVA thermal detection system graph (figure 56), which was consistent with data from the MODVOLC thermal detection system and with Sentinel-2 satellite images that showed persistent hotspots in the summit crater when conditions allowed observations. A renewed period of strong activity began in mid-October 2023.
Activity increased significantly on 17 October 2023 when large collapses began during 0700-0830 on the E flanks of the lava dome and continued to after 0930 the next day (figure 57). Ash plumes rose to an altitude of 4.5-5 km, extending 220 km NNE by 18 October. A large explosion at 1630 on 18 October produced an ash plume that rose to an altitude of 11 km (8 km above the summit) and drifted NNE and then NW, extending 900 km NW within two days at an altitude of 8 km. Minor ashfall was noted in Kozyrevsk (45 km WNW). At 0820 on 20 October an ash plume was identified in satellite images drifting 100 km ENE at altitudes of 4-4.5 km.
Lava flows and hot avalanches from the dome down the SE flank continued over the next few days, including 23 October when clear conditions allowed good observations (figures 58 and 59). A large thermal anomaly was observed over the volcano through 24 October, and in the summit crater on 30 October (figure 60). Strong fumarolic activity continued, with numerous avalanches and occasional incandescence. By the last week of October, volcanic activity had decreased to a level consistent with that earlier in the reporting period.
Aviation warnings were frequently updated during 17-20 October. KVERT issued a Volcano Observatory Notice for Aviation (VONA) on 17 October at 1419 and 1727 (0219 and 0527 UTC) raising the Aviation Color Code (ACC) from Yellow to Orange (second highest level). The next day, KVERT issued a VONA at 1705 (0505 UTC) raising the ACC to Red (highest level) but lowered it back to Orange at 2117 (0917 UTC). After another decrease to Yellow and back to Orange, the ACC was reduced to Yellow on 20 October at 1204 (0004 UTC). In addition, the Tokyo VAAC issued a series of Volcanic Ash Advisories beginning on 16 October and continuing through 30 October.
Geologic Background. The modern Bezymianny, much smaller than its massive neighbors Kamen and Kliuchevskoi on the Kamchatka Peninsula, was formed about 4,700 years ago over a late-Pleistocene lava-dome complex and an edifice built about 11,000-7,000 years ago. Three periods of intensified activity have occurred during the past 3,000 years. The latest period, which was preceded by a 1,000-year quiescence, began with the dramatic 1955-56 eruption. This eruption, similar to that of St. Helens in 1980, produced a large open crater that was formed by collapse of the summit and an associated lateral blast. Subsequent episodic but ongoing lava-dome growth, accompanied by intermittent explosive activity and pyroclastic flows, has largely filled the 1956 crater.
Information Contacts: Kamchatka Volcanic Eruptions Response Team (KVERT), Far Eastern Branch, Russian Academy of Sciences, 9 Piip Blvd., Petropavlovsk-Kamchatsky, 683006, Russia (URL: http://www.kscnet.ru/ivs/kvert/); Kamchatka Volcanological Station, Kamchatka Branch of Geophysical Survey, (KB GS RAS), Klyuchi, Kamchatka Krai, Russia (URL: http://volkstat.ru/); Tokyo Volcanic Ash Advisory Center (VAAC), 1-3-4 Otemachi, Chiyoda-ku, Tokyo 100-8122, Japan (URL: http://ds.data.jma.go.jp/svd/vaac/data/); Hawai'i Institute of Geophysics and Planetology (HIGP) - MODVOLC Thermal Alerts System, School of Ocean and Earth Science and Technology (SOEST), Univ. of Hawai'i, 2525 Correa Road, Honolulu, HI 96822, USA (URL: http://modis.higp.hawaii.edu/); MIROVA (Middle InfraRed Observation of Volcanic Activity), a collaborative project between the Universities of Turin and Florence (Italy) supported by the Centre for Volcanic Risk of the Italian Civil Protection Department (URL: http://www.mirovaweb.it/); Copernicus Browser, Copernicus Data Space Ecosystem, European Space Agency (URL: https://dataspace.copernicus.eu/browser/).chr
Kilauea (United States) — January 2023 Cite this Report
Kilauea
United States
19.421°N, 155.287°W; summit elev. 1222 m
All times are local (unless otherwise noted)
Low-level lava effusions in the lava lake at Halema’uma’u during July-December 2022
Kīlauea is the southeastern-most volcano in Hawaii and overlaps the E flank of the Mauna Loa volcano. Its East Rift Zone (ERZ) has been intermittently active for at least 2,000 years. An extended eruption period began in January 1983 and was characterized by open lava lakes and lava flows from the summit caldera and the East Rift Zone. During May 2018 magma migrated into the Lower East Rift Zone (LERZ) and opened 24 fissures along a 6-km-long NE-trending fracture zone that produced lava flows traveling in multiple directions. As lava emerged from the fissures, the lava lake at Halema'uma'u drained and explosions sent ash plumes to several kilometers altitude (BGVN 43:10).
The current eruption period started during September 2021 and has recently been characterized by lava effusions, spatter, and sulfur dioxide emissions in the active Halema’uma’u lava lake (BGVN 47:08). Lava effusions, some spatter, and sulfur dioxide emissions have continued during this reporting period of July through December 2022 using daily reports, volcanic activity notices, and abundant photo, map, and video data from the US Geological Survey's (USGS) Hawaiian Volcano Observatory (HVO).
Summary of activity during July-December 2022. Low-level effusions have continued at the western vent of the Halema’uma’u crater during July through early December 2022. Occasional weak ooze-outs (also called lava break outs) would occur along the margins of the crater floor. The overall level of the active lava lake throughout the reporting period gradually increased due to infilling, however it stagnated in mid-September (table 13). During September through November, activity began to decline, though lava effusions persisted at the western vent. By 9 December, the active part of the lava lake had completely crusted over, and incandescence was no longer visible.
Table 13. Summary of measurements taken during overflights at Kīlauea that show a gradual increase in the active lava lake level and the volume of lava effused since 29 September 2021. Lower activity was reported during September-October. Data collected during July-December 2022. Courtesy of HVO.
| Date: |
Level of the active lava lake (m): |
Cumulative volume of lava effused (million cubic meters): |
| 7 Jul 2022 |
130 |
95 |
| 19 Jul 2022 |
133 |
98 |
| 4 Aug 2022 |
136 |
102 |
| 16 Aug 2022 |
137 |
104 |
| 12 Sep 2022 |
143 |
111 |
| 5 Oct 2022 |
143 |
111 |
| 28 Oct 2022 |
143 |
111 |
Activity during July 2022. Lava effusions were reported from the western vent in the Halema’uma’u crater, along with occasional weak ooze-outs along the margins of the crater floor. The height of the lava lake was variable due to deflation-inflation tilt events; for example, the lake level dropped approximately 3-4 m during a summit deflation-inflation event reported on 1 July. Webcam images taken during the night of 6-12 July showed intermittent low-level spattering at the western vent that rose less than 10 m above the vent (figure 519). Measurements made during an overflight on 7 July indicated that the crater floor was infilled about 130 m and that 95 million cubic meters of lava had been effused since 29 September 2021. A single, relatively small lava ooze-out was active to the S of the lava lake. Around midnight on 8 July there were two brief periods of lava overflow onto the lake margins. On 9 July lava ooze-outs were reported near the SE and NE edges of the crater floor and during 10-11 July they occurred near the E, NE, and NW edges. On 16 July crater incandescence was reported, though the ooze-outs and spattering were not visible. On 18 July overnight webcam images showed incandescence in the western vent complex and two ooze-outs were reported around 0000 and 0200 on 19 July. By 0900 there were active ooze-outs along the SW edge of the crater floor. Measurements made from an overflight on 19 July indicated that the crater floor was infilled about 133 m and 98 million cubic meters of lava had erupted since 29 September 2021 (figure 520). On 20 July around 1600 active ooze-outs were visible along the N edge of the crater, which continued through the next day. Extensive ooze-outs occurred along the W margin during 24 July until 1900; on 26 July minor ooze-outs were noted along the N margin. Minor spattering was visible on 29 July along the E margin of the lake. The sulfur dioxide emission rates ranged 650-2,800 tons per day (t/d), the higher of which was measured on 8 July (figure 519).
Activity during August 2022. The eruption continued in the Halema’uma’u crater at the western vent. According to HVO the lava in the active lake remained at the level of the bounding levees. Occasional minor ooze-outs were observed along the margins of the crater floor. Strong nighttime crater incandescence was visible after midnight on 6 August over the western vent cone. During 6-7 August scattered small lava lobes were active along the crater floor and incandescence persisted above the western vent through 9 August. During 7-9 August HVO reported a single lava effusion source was active along the NW margin of the crater floor. Measurements from an overflight on 4 August indicated that the crater floor was infilled about 136 m total and that 102 million cubic meters of lava had been erupted since the start of the eruption. Lava breakouts were reported along the N, NE, E, S, and W margins of the crater during 10-16 August. Another overflight survey conducted on 16 August indicated that the crater floor infilled about 137 m and 104 million cubic meters of lava had been erupted since September 2021. Measured sulfur dioxide emissions rates ranged 1,150-2,450 t/d, the higher of which occurred on 8 August.
Activity during September 2022. During September, lava effusion continued from the western vent into the active lava lake and onto the crater floor. Intermittent minor ooze-outs were reported through the month. A small ooze-out was visible on the W crater floor margin at 0220 on 2 September, which showed decreasing surface activity throughout the day, but remained active through 3 September. On 3 September around 1900 a lava outbreak occurred along the NW margin of the crater floor but had stopped by the evening of 4 September. Field crews monitoring the summit lava lake on 9 September observed spattering on the NE margin of the lake that rose no higher than 10 m, before falling back onto the lava lake crust (figure 521). Overflight measurements on 12 September indicated that the crater floor was infilled a total of 143 m and 111 million cubic meters of lava had been erupted since September 2021. Extensive breakouts in the W and N part of the crater floor were reported at 1600 on 20 September and continued into 26 September. The active part of the lava lake dropped by 10 m while other parts of the crater floor dropped by several meters. Summit tiltmeters recorded a summit seismic swarm of more than 80 earthquakes during 1500-1800 on 21 September, which occurred about 1.5 km below Halema’uma’u; a majority of these were less than Mw 2. By 22 September the active part of the lava lake was infilled about 2 m. On 23 September the western vent areas exhibited several small spatter cones with incandescent openings, along with weak, sporadic spattering (figure 522). The sulfur dioxide emission rate ranged from 930 t/d to 2,000 t/d, the higher of which was measured on 6 September.
Activity during October 2022. Activity during October declined slightly compared to previous months, though lava effusions persisted from the western vent into the active lava lake and onto the crater floor during October (figure 523). Slight variations in the lava lake were noted throughout the month. HVO reported that around 0600 on 3 October the level of the lava lake has lowered slightly. Overflight measurements taken on 5 October indicated that the crater floor was infilled a total of about 143 m and that 111 million cubic meters of lava had been effused since September 2021. During 6-7 October the lake gradually rose 0.5 m. Sulfur dioxide measurements made on 22 October had an emission rate of 700 t/d. Another overflight taken on 28 October showed that there was little to no change in the elevation of the crater floor: the crater floor was infilled a total of 143 m and 111 million cubic meters of lava had erupted since the start of the eruption.
Activity during November 2022. Activity remained low during November, though HVO reported that lava from the western vent continued to effuse into the active lava lake and onto the crater floor throughout the month. The rate of sulfur dioxide emissions during November ranged from 300-600 t/d, the higher amount of which occurred on 9 November.
Activity during December 2022. Similar low activity was reported during December, with lava effusing from the western vent into the active lava lake and onto the crater floor. During 4-5 December the active part of the lava lake was slightly variable in elevation and fluctuated within 1 m. On 9 December HVO reported that lava was no longer erupting from the western vent in the Halema’uma’u crater and that sulfur dioxide emissions had returned to near pre-eruption background levels; during 10-11 December, the lava lake had completely crusted over, and no incandescence was visible (figure 524). Time lapse camera images covering the 4-10 December showed that the crater floor showed weak deflation and no inflation. Some passive events of crustal overturning were reported during 14-15 December, which brought fresh incandescent lava to the lake surface. The sulfur dioxide emission rate was approximately 200 t/d on 14 December. A smaller overturn event on 17 December and another that occurred around 0000 and into the morning of 20 December were also detected. A small seismic swarm was later detected on 30 December.
Geologic Background. Kilauea overlaps the E flank of the massive Mauna Loa shield volcano in the island of Hawaii. Eruptions are prominent in Polynesian legends; written documentation since 1820 records frequent summit and flank lava flow eruptions interspersed with periods of long-term lava lake activity at Halemaumau crater in the summit caldera until 1924. The 3 x 5 km caldera was formed in several stages about 1,500 years ago and during the 18th century; eruptions have also originated from the lengthy East and Southwest rift zones, which extend to the ocean in both directions. About 90% of the surface of the basaltic shield volcano is formed of lava flows less than about 1,100 years old; 70% of the surface is younger than 600 years. The long-term eruption from the East rift zone between 1983 and 2018 produced lava flows covering more than 100 km2, destroyed hundreds of houses, and added new coastline.
Information Contacts: Hawaiian Volcano Observatory (HVO), U.S. Geological Survey, PO Box 51, Hawai'i National Park, HI 96718, USA (URL: http://hvo.wr.usgs.gov/).
Nyamulagira (DR Congo) — November 2023 Cite this Report
Nyamulagira
DR Congo
1.408°S, 29.2°E; summit elev. 3058 m
All times are local (unless otherwise noted)
Lava flows and thermal activity during May-October 2023
Nyamulagira (also known as Nyamuragira) is a shield volcano in the Democratic Republic of Congo with the summit truncated by a small 2 x 2.3 km caldera with walls up to about 100 m high. Documented eruptions have occurred within the summit caldera, as well as from numerous flank fissures and cinder cones. The current eruption period began in April 2018 and has more recently been characterized by summit crater lava flows and thermal activity (BGVN 48:05). This report describes lava flows and variable thermal activity during May through October 2023, based on information from the Observatoire Volcanologique de Goma (OVG) and various satellite data.
Lava lake activity continued during May. The MIROVA (Middle InfraRed Observation of Volcanic Activity) system recorded moderate-to-strong thermal activity throughout the reporting period; activity was more intense during May and October and relatively weaker from June through September (figure 95). The MODVOLC thermal algorithm, detected a total of 209 thermal alerts. There were 143 hotspots detected during May, eight during June, nine during September, and 49 during October. This activity was also reflected in infrared satellite images, where a lava flow was visible in the NW part of the crater on 7 May and strong activity was seen in the center of the crater on 4 October (figure 96). Another infrared satellite image taken on 12 May showed still active lava flows along the NW margin of the crater. According to OVG lava effusions were active during 7-29 May and moved to the N and NW parts of the crater beginning on 9 May. Strong summit crater incandescence was visible from Goma (27 km S) during the nights of 17, 19, and 20 May (figure 97). On 17 May there was an increase in eruptive activity, which peaked at 0100 on 20 May. Notable sulfur dioxide plumes drifted NW and W during 19-20 May (figure 98). Drone footage acquired in partnership with the USGS (United States Geological Survey) on 20 May captured images of narrow lava flows that traveled about 100 m down the W flank (figure 99). Data from the Rumangabo seismic station indicated a decreasing trend in activity during 17-21 May. Although weather clouds prevented clear views of the summit, a strong thermal signature on the NW flank was visible in an infrared satellite image on 22 May, based on an infrared satellite image. On 28 May the lava flows on the upper W flank began to cool and solidify. By 29 May seismicity returned to levels similar to those recorded before the 17 May increase. Lava effusion continued but was confined to the summit crater; periodic crater incandescence was observed.
Low-level activity was noted during June through October. On 1 June OVG reported that seismicity remained at lower levels and that crater incandescence had been absent for three days, though infrared satellite imagery showed continued lava effusion in the summit crater. The lava flows on the flanks covered an estimated 0.6 km2. Satellite imagery continued to show thermal activity confined to the lava lake through October (figure 96), although no lava flows or significant sulfur dioxide emissions were reported.
Geologic Background. Africa's most active volcano, Nyamulagira (also known as Nyamuragira), is a massive high-potassium basaltic shield about 25 km N of Lake Kivu and 13 km NNW of the steep-sided Nyiragongo volcano. The summit is truncated by a small 2 x 2.3 km caldera that has walls up to about 100 m high. Documented eruptions have occurred within the summit caldera, as well as from the numerous flank fissures and cinder cones. A lava lake in the summit crater, active since at least 1921, drained in 1938, at the time of a major flank eruption. Recent lava flows extend down the flanks more than 30 km from the summit as far as Lake Kivu; extensive lava flows from this volcano have covered 1,500 km2 of the western branch of the East African Rift.
Information Contacts: Observatoire Volcanologique de Goma (OVG), Departement de Geophysique, Centre de Recherche en Sciences Naturelles, Lwiro, D.S. Bukavu, DR Congo; Hawai'i Institute of Geophysics and Planetology (HIGP) - MODVOLC Thermal Alerts System, School of Ocean and Earth Science and Technology (SOEST), Univ. of Hawai'i, 2525 Correa Road, Honolulu, HI 96822, USA (URL: http://modis.higp.hawaii.edu/); MIROVA (Middle InfraRed Observation of Volcanic Activity), a collaborative project between the Universities of Turin and Florence (Italy) supported by the Centre for Volcanic Risk of the Italian Civil Protection Department (URL: http://www.mirovaweb.it/); NASA Global Sulfur Dioxide Monitoring Page, Atmospheric Chemistry and Dynamics Laboratory, NASA Goddard Space Flight Center (NASA/GSFC), 8800 Greenbelt Road, Goddard, Maryland, USA (URL: https://so2.gsfc.nasa.gov/); Copernicus Browser, Copernicus Data Space Ecosystem, European Space Agency (URL: https://dataspace.copernicus.eu/browser/); Charles Balagizi, Goma Volcano Observatory, Departement de Geophysique, Centre de Recherche en Sciences Naturelles, Lwiro, D.S. Bukavu, DR Congo.
Bagana (Papua New Guinea) — October 2023 Cite this Report
Bagana
Papua New Guinea
6.137°S, 155.196°E; summit elev. 1855 m
All times are local (unless otherwise noted)
Explosions, ash plumes, ashfall, and lava flows during April-September 2023
The remote volcano of Bagana is located in central Bougainville Island, Papua New Guinea. Recorded eruptions date back to 1842 and activity has consisted of effusive activity that has built a small lava dome in the summit crater and occasional explosions that produced pyroclastic flows. The most recent eruption has been ongoing since February 2000 and has produced occasional explosions, ash plumes, and lava flows. More recently, activity has been characterized by ongoing effusive activity and ash emissions (BGVN 48:04). This report updates activity from April through September 2023 that has consisted of explosions, ash plumes, ashfall, and lava flows, using information from the Darwin Volcanic Ash Advisory Center (VAAC) and satellite data.
An explosive eruption was reported on 7 July that generated a large gas-and-ash plume to high altitudes and caused significant ashfall in local communities; the eruption plume had reached upper tropospheric (16-18 km altitude) altitudes by 2200, according to satellite images. Sulfur dioxide plumes were detected in satellite images on 8 July and indicated that the plume was likely a mixture of gas, ice, and ash. A report issued by the Autonomous Bougainville Government (ABG) (Torokina District, Education Section) on 10 July noted that significant ash began falling during 2000-2100 on 7 July and covered most areas in the Vuakovi, Gotana (9 km SW), Koromaketo, Laruma (25 km W) and Atsilima (27 km NW) villages. Pyroclastic flows also occurred, according to ground-based reports; small deposits confined to one drainage were inspected by RVO during an overflight on 17 July and were confirmed to be from the 7 July event. Ashfall continued until 10 July and covered vegetation, which destroyed bushes and gardens and contaminated rivers and streams.
RVO reported another eruption on 14 July. The Darwin VAAC stated that an explosive event started around 0830 on 15 July and produced an ash plume that rose to 16.5 km altitude by 1000 and drifted N, according to satellite images. The plume continued to drift N and remained visible through 1900, and by 2150 it had dissipated.
Ashfall likely from both the 7 and 15 July events impacted about 8,111 people in Torokina (20 km SW), including Tsito/Vuakovi, Gotana, Koromaketo, Kenaia, Longkogari, Kenbaki, Piva (13 km SW), and Atsinima, and in the Tsitovi district, according to ABG. Significant ashfall was also reported in Ruruvu (22 km N) in the Wakunai District of Central Bougainville, though the thickness of these deposits could not be confirmed. An evacuation was called for the villages in Wakunai, where heavy ashfall had contaminated water sources; the communities of Ruruvu, Togarau, Kakarapaia, Karauturi, Atao, and Kuritaturi were asked to evacuate to a disaster center at the Wakunai District Station, and communities in Torokina were asked to evacuate to the Piva District station. According to a news article, more than 7,000 people needed temporary accommodations, with about 1,000 people in evacuation shelters. Ashfall had deposited over a broad area, contaminating water supplies, affecting crops, and collapsing some roofs and houses in rural areas. Schools were temporarily shut down. Intermittent ash emissions continued through the end of July and drifted NNW, NW, and SW. Fine ashfall was reported on the coast of Torokina, and ash plumes also drifted toward Laruma and Atsilima.
A small explosive eruption occurred at 2130 on 28 July that ejected material from the crater vents, according to reports from Torokina, in addition to a lava flow that contained two lobes. A second explosion was detected at 2157. Incandescence from the lava flow was visible from Piva as it descended the W flank around 2000 on 29 July (figure 47). The Darwin VAAC reported that a strong thermal anomaly was visible in satellite images during 30-31 July and that ash emissions rose to 2.4 km altitude and drifted WSW on 30 July. A ground report from RVO described localized emissions at 0900 on 31 July.
The Darwin VAAC reported that ash plumes were identified in satellite imagery at 0800 and 1220 on 12 August and rose to 2.1 km and 3 km altitude and drifted NW and W, respectively. A news report stated that aid was sent to more than 6,300 people that were adversely affected by the eruption. Photos taken during 17-19 August showed ash emissions rising no higher than 1 km above the summit and drifting SE. A small explosion generated an ash plume during the morning of 19 August. Deposits from small pyroclastic flows were also captured in the photos. Satellite images captured lava flows and pyroclastic flow deposits. Two temporary seismic stations were installed near Bagana on 17 August at distances of 7 km WSW (Vakovi station) and 11 km SW (Kepox station). The Kepox station immediately started to record continuous, low-frequency background seismicity.
Satellite data. Little to no thermal activity was detected during April through mid-July 2023; only one anomaly was recorded during early April and one during early June, according to MIROVA (Middle InfraRed Observation of Volcanic Activity) data (figure 48). Thermal activity increased in both power and frequency during mid-July through September, although there were still some short gaps in detected activity. MODVOLC also detected increased thermal activity during August; thermal hotspots were detected a total of five times on 19, 20, and 27 August. Weak thermal anomalies were also captured in infrared satellite images on clear weather days throughout the reporting period on 7, 12, and 17 April, 27 May, 1, 6, 16, and 31 July, and 19 September (figure 48); a strong thermal anomaly was visible on 31 July. Distinct sulfur dioxide plumes that drifted generally NW were intermittently captured by the TROPOMI instrument on the Sentinel-5P satellite and sometimes exceeded two Dobson Units (DUs) (figure 49).
Geologic Background. Bagana volcano, in a remote portion of central Bougainville Island, is frequently active. This massive symmetrical cone was largely constructed by an accumulation of viscous andesitic lava flows. The entire edifice could have been constructed in about 300 years at its present rate of lava production. Eruptive activity is characterized by non-explosive effusion of viscous lava that maintains a small lava dome in the summit crater, although occasional explosive activity produces pyroclastic flows. Lava flows with tongue-shaped lobes up to 50 m thick and prominent levees descend the flanks on all sides.
Information Contacts: Rabaul Volcano Observatory (RVO), Geohazards Management Division, Department of Mineral Policy and Geohazards Management (DMPGM), PO Box 3386, Kokopo, East New Britain Province, Papua New Guinea; Darwin Volcanic Ash Advisory Centre (VAAC), Bureau of Meteorology, Northern Territory Regional Office, PO Box 40050, Casuarina, NT 0811, Australia (URL: http://www.bom.gov.au/info/vaac/); MIROVA (Middle InfraRed Observation of Volcanic Activity), a collaborative project between the Universities of Turin and Florence (Italy) supported by the Centre for Volcanic Risk of the Italian Civil Protection Department (URL: http://www.mirovaweb.it/); Hawai'i Institute of Geophysics and Planetology (HIGP) - MODVOLC Thermal Alerts System, School of Ocean and Earth Science and Technology (SOEST), Univ. of Hawai'i, 2525 Correa Road, Honolulu, HI 96822, USA (URL: http://modis.higp.hawaii.edu/); NASA Global Sulfur Dioxide Monitoring Page, Atmospheric Chemistry and Dynamics Laboratory, NASA Goddard Space Flight Center (NASA/GSFC), 8800 Greenbelt Road, Goddard, Maryland, USA (URL: https://so2.gsfc.nasa.gov/); Copernicus Browser, Copernicus Data Space Ecosystem, European Space Agency (URL: https://dataspace.copernicus.eu/browser/); Autonomous Bougainville Government, P.O Box 322, Buka, AROB, PNG (URL: https://abg.gov.pg/); Andrew Tupper (Twitter: @andrewcraigtupp); Simon Carn, Geological and Mining Engineering and Sciences, Michigan Technological University, 1400 Townsend Drive, Houghton, MI 49931, USA (URL: http://www.volcarno.com/, Twitter: @simoncarn); Radio NZ (URL: https://www.rnz.co.nz/news/pacific/494464/more-than-7-000-people-in-bougainville-need-temporary-accommodation-after-eruption); USAID, 1300 Pennsylvania Ave, NW, Washington DC 20004, USA (URL: https://www.usaid.gov/pacific-islands/press-releases/aug-08-2023-united-states-provides-immediate-emergency-assistance-support-communities-affected-mount-bagana-volcanic-eruptions).
Mayon (Philippines) — October 2023 Cite this Report
Mayon
Philippines
13.257°N, 123.685°E; summit elev. 2462 m
All times are local (unless otherwise noted)
Lava flows, pyroclastic flows, ash emissions, and seismicity during April-September 2023
Mayon is located in the Philippines and has steep upper slopes capped by a small summit crater. Historical eruptions date back to 1616 CE that have been characterized by Strombolian eruptions, lava flows, pyroclastic flows, and mudflows. Eruptions mostly originated from a central conduit. Pyroclastic flows and mudflows have commonly descended many of the approximately 40 drainages that surround the volcano. The most recent eruption occurred during June through October 2022 and consisted of lava dome growth and gas-and-steam emissions (BGVN 47:12). A new eruption was reported during late April 2023 and has included lava flows, pyroclastic density currents, ash emissions, and seismicity. This report covers activity during April through September 2023 based on daily bulletins from the Philippine Institute of Volcanology and Seismology (PHIVOLCS).
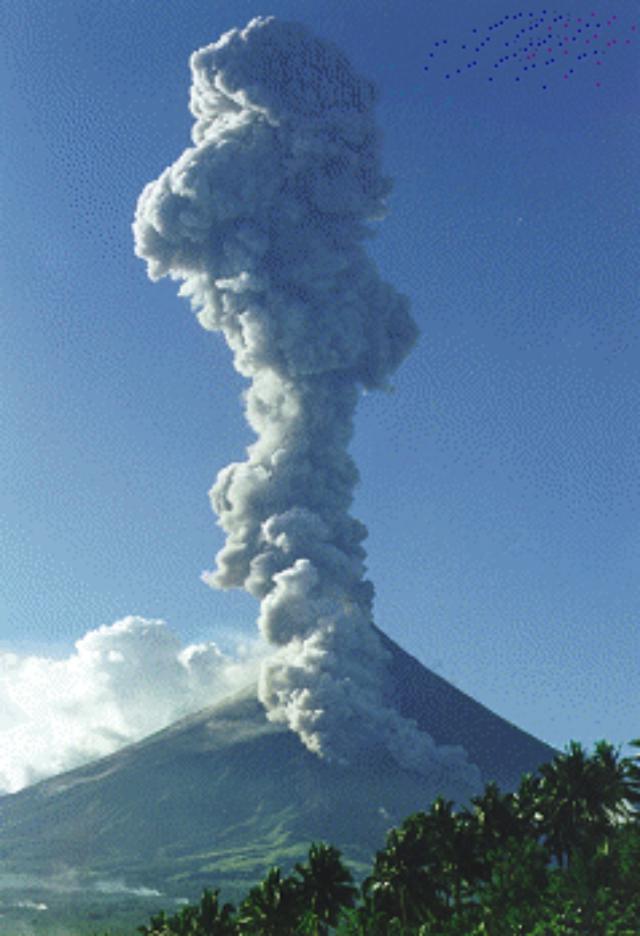
During April through September 2023, PHIVOLCS reported near-daily rockfall events, frequent volcanic earthquakes, and sulfur dioxide measurements. Gas-and-steam emissions rose 100-900 m above the crater and drifted in different directions. Nighttime crater incandescence was often visible during clear weather and was accompanied by incandescent avalanches of material. Activity notably increased during June when lava flows were reported on the S, SE, and E flanks (figure 52). The MIROVA graph (Middle InfraRed Observation of Volcanic Activity) showed strong thermal activity coincident with these lava flows, which remained active through September (figure 53). According to the MODVOLC thermal algorithm, a total of 110 thermal alerts were detected during the reporting period: 17 during June, 40 during July, 27 during August, and 26 during September. During early June, pyroclastic density currents (PDCs) started to occur more frequently.
Low activity was reported during much of April and May; gas-and-steam emissions rose 100-900 m above the crater and generally drifted in different directions. A total of 52 rockfall events and 18 volcanic earthquakes were detected during April and 147 rockfall events and 13 volcanic events during May. Sulfur dioxide flux measurements ranged between 400-576 tons per day (t/d) during April, the latter of which was measured on 29 April and between 162-343 t/d during May, the latter of which was measured on 13 May.
Activity during June increased, characterized by lava flows, pyroclastic density currents (PDCs), crater incandescence and incandescent rockfall events, gas-and-steam emissions, and continued seismicity. Weather clouds often prevented clear views of the summit, but during clear days, moderate gas-and-steam emissions rose 100-2,500 m above the crater and drifted in multiple directions. A total of 6,237 rockfall events and 288 volcanic earthquakes were detected. The rockfall events often deposited material on the S and SE flanks within 700-1,500 m of the summit crater and ash from the events drifted SW, S, SE, NE, and E. Sulfur dioxide emissions ranged between 149-1,205 t/d, the latter of which was measured on 10 June. Short-term observations from EDM and electronic tiltmeter monitoring indicated that the upper slopes were inflating since February 2023. Longer-term ground deformation parameters based on EDM, precise leveling, continuous GPS, and electronic tilt monitoring indicated that the volcano remained inflated, especially on the NW and SE flanks. At 1000 on 5 June the Volcano Alert Level (VAL) was raised to 2 (on a 0-5 scale). PHIVOLCS noted that although low-level volcanic earthquakes, ground deformation, and volcanic gas emissions indicated unrest, the steep increase in rockfall frequency may indicate increased dome activity.
A total of 151 dome-collapse PDCs occurred during 8-9 and 11-30 June, traveled 500-2,000 m, and deposited material on the S flank within 2 km of the summit crater. During 8-9 June the VAL was raised to 3. At approximately 1947 on 11 June lava flow activity was reported; two lobes traveled within 500 m from the crater and deposited material on the S (Mi-isi), SE (Bonga), and E (Basud) flanks. Weak seismicity accompanied the lava flow and slight inflation on the upper flanks. This lava flow remained active through 30 June, moving down the S and SE flank as far as 2.5 km and 1.8 km, respectively and depositing material up to 3.3 km from the crater. During 15-16 June traces of ashfall from the PDCs were reported in Sitio Buga, Nabonton, City of Ligao and Purok, and San Francisco, Municipality of Guinobatan. During 28-29 June there were two PDCs generated by the collapse of the lava flow front, which generated a light-brown ash plume 1 km high. Satellite monitors detected significant concentrations of sulfur dioxide beginning on 29 June. On 30 June PDCs primarily affected the Basud Gully on the E flank, the largest of which occurred at 1301 and lasted eight minutes, based on the seismic record. Four PDCs generated between 1800 and 2000 that lasted approximately four minutes each traveled 3-4 km on the E flank and generated an ash plume that rose 1 km above the crater and drifted N and NW. Ashfall was recorded in Tabaco City.
Similar strong activity continued during July; slow lava effusion remained active on the S and SE flanks and traveled as far as 2.8 km and 2.8 km, respectively and material was deposited as far as 4 km from the crater. There was a total of 6,983 rockfall events and 189 PDCs that affected the S, SE, and E flanks. The volcano network detected a total of 2,124 volcanic earthquakes. Continuous gas-and-steam emissions rose 200-2,000 m above the crater and drifted in multiple directions. Sulfur dioxide emissions averaged 792-4,113 t/d, the latter of which was measured on 28 July. During 2-4 July three PDCs were generated from the collapse of the lava flow and resulting light brown plumes rose 200-300 m above the crater. Continuous tremor pulses were reported beginning at 1547 on 3 July through 7 July at 1200, at 2300 on 8 July and going through 0300 on 10 July, and at 2300 on 16 July, as recorded by the seismic network. During 6-9 July there were 10 lava flow-collapse-related PDCs that generated light brown plumes 300-500 m above the crater. During 10-11 July light ashfall was reported in some areas of Mabinit, Legazpi City, Budiao and Salvacion, Daraga, and Camalig, Albay. By 18 July the lava flow advanced 600 m on the E flank as well.
During 1733 on 18 July and 0434 on 19 July PHIVOLCS reported 30 “ashing” events, which are degassing events accompanied by audible thunder-like sounds and entrained ash at the crater, which produced short, dark plumes that drifted SW. These events each lasted 20-40 seconds, and plume heights ranged from 150-300 m above the crater, as recorded by seismic, infrasound, visual, and thermal monitors. Three more ashing events occurred during 19-20 July. Short-term observations from electronic tilt and GPS monitoring indicate deflation on the E lower flanks in early July and inflation on the NW middle flanks during the third week of July. Longer-term ground deformation parameters from EDM, precise leveling, continuous GPS, and electronic tilt monitoring indicated that the volcano was still generally inflated relative to baseline levels. A short-lived lava pulse lasted 28 seconds at 1956 on 21 July, which was accompanied by seismic and infrasound signals. By 22 July, the only lava flow that remained active was on the SE flank, and continued to extend 3.4 km, while those on the S and E flanks weakened markedly. One ashing event was detected during 30-31 July, whereas there were 57 detected during 31 July-1 August; according to PHIVOLCS beginning at approximately 1800 on 31 July eruptive activity was dominated by phases of intermittent ashing, as well as increased in the apparent rates of lava effusion from the summit crater. The ashing phases consisted of discrete events recorded as low-frequency volcanic earthquakes (LFVQ) typically 30 seconds in duration, based on seismic and infrasound signals. Gray ash plume rose 100 m above the crater and generally drifted NE. Shortly after these ashing events began, new lava began to effuse rapidly from the crater, feeding the established flowed on the SE, E, and E flanks and generating frequent rockfall events.
Intensified unrest persisted during August. There was a total of 4,141 rockfall events, 2,881 volcanic earthquakes, which included volcanic tremor events, 32 ashing events, and 101 PDCs detected throughout the month. On clear weather days, gas-and-steam emissions rose 300-1,500 m above the crater and drifted in different directions (figure 54). Sulfur dioxide emissions averaged 735-4,756 t/d, the higher value of which was measured on 16 August. During 1-2 August the rate of lava effusion decreased, but continued to feed the flows on the SE, S, and E flanks, maintaining their advances to 3.4 km, 2.8 km, and 1.1 km from the crater, respectively (figure 55). Rockfall and PDCs generated by collapses at the lava flow margins and from the summit dome deposited material within 4 km of the crater. During 3-4 August there were 10 tremor events detected that lasted 1-4 minutes. Short-lived lava pulse lasted 35 seconds and was accompanied by seismic and infrasound signals at 0442 on 6 August. Seven collapses were recorded at the front of the lava flow during 12-14 August.
During September, similar activity of slow lava effusion, PDCs, gas-and-steam emissions, and seismicity continued. There was a total of 4,452 rockfall events, 329 volcanic earthquakes, which included volcanic tremor events, two ashing events, and 85 PDCs recorded throughout the month. On clear weather days, gas-and-steam emissions rose 100-1,500 m above the crater and drifted in multiple directions. Sulfur dioxide emissions averaged 609-2,252 t/d, the higher average of which was measured on 6 September. Slow lava effusion continued advancing on the SE, S, and E flanks, maintaining lengths of 3.4 km, 2.8 km, and 1.1 km, respectively. Rockfall and PDC events generated by collapses along the lava flow margins and at the summit dome deposited material within 4 km of the crater.
Geologic Background. Symmetrical Mayon, which rises above the Albay Gulf NW of Legazpi City, is the most active volcano of the Philippines. The steep upper slopes are capped by a small summit crater. Recorded eruptions since 1616 CE range from Strombolian to basaltic Plinian, with cyclical activity beginning with basaltic eruptions, followed by longer periods of andesitic lava flows. Eruptions occur predominately from the central conduit and have also produced lava flows that travel far down the flanks. Pyroclastic density currents and mudflows have commonly swept down many of the approximately 40 ravines that radiate from the summit and have often damaged populated lowland areas. A violent eruption in 1814 killed more than 1,200 people and devastated several towns.
Information Contacts: Philippine Institute of Volcanology and Seismology (PHIVOLCS), Department of Science and Technology, University of the Philippines Campus, Diliman, Quezon City, Philippines (URL: http://www.phivolcs.dost.gov.ph/); MIROVA (Middle InfraRed Observation of Volcanic Activity), a collaborative project between the Universities of Turin and Florence (Italy) supported by the Centre for Volcanic Risk of the Italian Civil Protection Department (URL: http://www.mirovaweb.it/); Hawai'i Institute of Geophysics and Planetology (HIGP) - MODVOLC Thermal Alerts System, School of Ocean and Earth Science and Technology (SOEST), Univ. of Hawai'i, 2525 Correa Road, Honolulu, HI 96822, USA (URL: http://modis.higp.hawaii.edu/); Copernicus Browser, Copernicus Data Space Ecosystem, European Space Agency (URL: https://dataspace.copernicus.eu/browser/); William Rogers, Legazpi City, Albay Province, Philippines.
Nishinoshima (Japan) — October 2023 Cite this Report
Nishinoshima
Japan
27.247°N, 140.874°E; summit elev. 100 m
All times are local (unless otherwise noted)
Eruption plumes and gas-and-steam plumes during May-August 2023
Nishinoshima, located about 1,000 km S of Tokyo, is a small island in the Ogasawara Arc in Japan. The island is the summit of a massive submarine volcano that has prominent submarine peaks to the S, W, and NE. Eruptions date back to 1973 and the current eruption period began in October 2022. Recent activity has consisted of small ash plumes and fumarolic activity (BGVN 48:07). This report covers activity during May through August 2023, using information from monthly reports of the Japan Meteorological Agency (JMA) monthly reports and satellite data.
Activity during May through June was relatively low. The Japan Coast Guard (JCG) did overflights on 14 and 22 June and reported white gas-and-steam emissions rising 600 m and 1,200 m from the central crater of the pyroclastic cone, respectively (figure 125). In addition, multiple white gas-and-steam emissions rose from the inner rim of the W side of the crater and from the SE flank of the pyroclastic cone. Discolored brown-to-green water was observed around almost the entire perimeter of the island; on 22 June light green discolored water was observed off the S coast of the island.
Observations from the Himawari meteorological satellite confirmed an eruption on 9 and 10 July. An eruption plume rose 1.6 km above the crater and drifted N around 1300 on 9 July. Satellite images acquired at 1420 and 2020 on 9 July and at 0220 on 10 July showed continuing emissions that rose 1.3-1.6 km above the crater and drifted NE and N. The Tokyo VAAC reported that an ash plume seen by a pilot and identified in a satellite image at 0630 on 21 July rose to 3 km altitude and drifted S.
Aerial observations conducted by JCG on 8 August showed a white-and-gray plume rising from the central crater of the pyroclastic cone, and multiple white gas-and-steam emissions were rising from the inner edge of the western crater and along the NW-SE flanks of the island (figure 126). Brown-to-green discolored water was also noted around the perimeter of the island.
Intermittent low-to-moderate power thermal anomalies were recorded in the MIROVA graph (Middle InfraRed Observation of Volcanic Activity), showing an increase in both frequency and power beginning in July (figure 127). This increase in activity coincides with eruptive activity on 9 and 10 July, characterized by eruption plumes. According to the MODVOLC thermal alert algorithm, one thermal hotspot was recorded on 20 July. Weak thermal anomalies were also detected in infrared satellite imagery, accompanied by strong gas-and-steam plumes (figure 128).
Geologic Background. The small island of Nishinoshima was enlarged when several new islands coalesced during an eruption in 1973-74. Multiple eruptions that began in 2013 completely covered the previous exposed surface and continued to enlarge the island. The island is the summit of a massive submarine volcano that has prominent peaks to the S, W, and NE. The summit of the southern cone rises to within 214 m of the ocean surface 9 km SSE.
Information Contacts: Japan Meteorological Agency (JMA), 1-3-4 Otemachi, Chiyoda-ku, Tokyo 100-8122, Japan (URL: http://www.jma.go.jp/jma/indexe.html); Tokyo Volcanic Ash Advisory Center (VAAC), 1-3-4 Otemachi, Chiyoda-ku, Tokyo 100-8122, Japan (URL: http://ds.data.jma.go.jp/svd/vaac/data/); MIROVA (Middle InfraRed Observation of Volcanic Activity), a collaborative project between the Universities of Turin and Florence (Italy) supported by the Centre for Volcanic Risk of the Italian Civil Protection Department (URL: http://www.mirovaweb.it/); Copernicus Browser, Copernicus Data Space Ecosystem, European Space Agency (URL: https://dataspace.copernicus.eu/browser/).
Krakatau (Indonesia) — October 2023 Cite this Report
Krakatau
Indonesia
6.1009°S, 105.4233°E; summit elev. 285 m
All times are local (unless otherwise noted)
White gas-and-steam plumes and occasional ash plumes during May-August 2023
Krakatau is located in the Sunda Strait between Java and Sumatra, Indonesia. Caldera collapse during the catastrophic 1883 eruption destroyed Danan and Perbuwatan cones and left only a remnant of Rakata. The post-collapse cone of Anak Krakatau (Child of Krakatau) was constructed within the 1883 caldera at a point between the former Danan and Perbuwatan cones; it has been the site of frequent eruptions since 1927. The current eruption period began in May 2021 and has recently consisted of Strombolian eruptions and ash plumes (BGVN 48:07). This report describes lower levels of activity consisting of ash and white gas-and-steam plumes during May through August 2023, based on information provided by the Indonesian Center for Volcanology and Geological Hazard Mitigation, referred to as Pusat Vulkanologi dan Mitigasi Bencana Geologi (PVMBG), MAGMA Indonesia, and satellite data.
Activity was relatively low during May and June. Daily white gas-and-steam emissions rose 25-200 m above the crater and drifted in different directions. Five ash plumes were detected at 0519 on 10 May, 1241 on 11 May, 0920 on 12 May, 2320 on 12 May, and at 0710 on 13 May, and rose 1-2.5 km above the crater and drifted SW. A webcam image taken on 12 May showed ejection of incandescent material above the vent. A total of nine ash plumes were detected during 6-11 June: at 1434 and 00220 on 6 and 7 June the ash plumes rose 500 m above the crater and drifted NW, at 1537 on 8 June the ash plume rose 1 km above the crater and drifted SW, at 0746 and at 0846 on 9 June the ash plumes rose 800 m and 3 km above the crater and drifted SW, respectively, at 0423, 1431, and 1750 on 10 June the ash plumes rose 2 km, 1.5 km, and 3.5 km above the crater and drifted NW, respectively, and at 0030 on 11 June an ash plume rose 2 km above the crater and drifted NW. Webcam images taken on 10 and 11 June at 0455 and 0102, respectively, showed incandescent material ejected above the vent. On 19 June an ash plume at 0822 rose 1.5 km above the crater and drifted SE.
Similar low activity of white gas-and-steam emissions and few ash plumes were reported during July and August. Daily white gas-and-steam emissions rose 25-300 m above the crater and drifted in multiple directions. Three ash plumes were reported at 0843, 0851, and 0852 on 20 July that rose 500-2,000 m above the crater and drifted NW.
The MIROVA (Middle InfraRed Observation of Volcanic Activity) graph of MODIS thermal anomaly data showed intermittent low-to-moderate power thermal anomalies during May through August 2023 (figure 140). Although activity was often obscured by weather clouds, a thermal anomaly was visible in an infrared satellite image of the crater on 12 May, accompanied by an eruption plume that drifted SW (figure 141).
Geologic Background. The renowned Krakatau (frequently mis-named as Krakatoa) volcano lies in the Sunda Strait between Java and Sumatra. Collapse of an older edifice, perhaps in 416 or 535 CE, formed a 7-km-wide caldera. Remnants of that volcano are preserved in Verlaten and Lang Islands; subsequently the Rakata, Danan, and Perbuwatan cones were formed, coalescing to create the pre-1883 Krakatau Island. Caldera collapse during the catastrophic 1883 eruption destroyed Danan and Perbuwatan, and left only a remnant of Rakata. This eruption caused more than 36,000 fatalities, most as a result of tsunamis that swept the adjacent coastlines of Sumatra and Java. Pyroclastic surges traveled 40 km across the Sunda Strait and reached the Sumatra coast. After a quiescence of less than a half century, the post-collapse cone of Anak Krakatau (Child of Krakatau) was constructed within the 1883 caldera at a point between the former Danan and Perbuwatan cones. Anak Krakatau has been the site of frequent eruptions since 1927.
Information Contacts: Pusat Vulkanologi dan Mitigasi Bencana Geologi (PVMBG, also known as Indonesian Center for Volcanology and Geological Hazard Mitigation, CVGHM), Jalan Diponegoro 57, Bandung 40122, Indonesia (URL: http://www.vsi.esdm.go.id/); MAGMA Indonesia, Kementerian Energi dan Sumber Daya Mineral (URL: https://magma.esdm.go.id/v1); MIROVA (Middle InfraRed Observation of Volcanic Activity), a collaborative project between the Universities of Turin and Florence (Italy) supported by the Centre for Volcanic Risk of the Italian Civil Protection Department (URL: http://www.mirovaweb.it/); Copernicus Browser, Copernicus Data Space Ecosystem, European Space Agency (URL: https://dataspace.copernicus.eu/browser/).
Villarrica (Chile) — October 2023 Cite this Report
Villarrica
Chile
39.42°S, 71.93°W; summit elev. 2847 m
All times are local (unless otherwise noted)
Strombolian activity, gas-and-ash emissions, and crater incandescence during April-September 2023
Villarrica, in central Chile, consists of a 2-km-wide caldera that formed about 3,500 years ago and is located at the base of the presently active cone at the NW margin of a 6-km-wide caldera. Historical eruptions eruptions date back to 1558 and have been characterized by mild-to-moderate explosive activity with occasional lava effusions. The current eruption period began in December 2014 and has recently consisted of nighttime crater incandescence, ash emissions, and seismicity (BGVN 48:04). This report covers activity during April through September 2023 and describes occasional Strombolian activity, gas-and-ash emissions, and nighttime crater incandescence. Information for this report primarily comes from the Southern Andes Volcano Observatory (Observatorio Volcanológico de Los Andes del Sur, OVDAS), part of Chile's National Service of Geology and Mining (Servicio Nacional de Geología y Minería, SERNAGEOMIN) and satellite data.
Seismicity during April consisted of long period (LP) events and tremor (TRE); a total of 9,413 LP-type events and 759 TR-type events were detected throughout the month. Nighttime crater incandescence persisted and was visible in the degassing column. Sulfur dioxide data was obtained using Differential Absorption Optical Spectroscopy Equipment (DOAS) that showed an average value of 1,450 ± 198 tons per day (t/d) during 1-15 April and 1,129 ± 201 t/d during 16-30 April, with a maximum daily value of 2,784 t/d on 9 April. Gas-and-steam emissions of variable intensities rose above the active crater as high as 1.3 km above the crater on 13 April. Strombolian explosions were not observed and there was a slight decrease in the lava lake level.
There were 14,123 LP-type events and 727 TR-type events detected during May. According to sulfur dioxide measurements taken with DOAS equipment, the active crater emitted an average value of 1,826 ± 482 t/d during 1-15 May and 912 ± 41 t/d during 16-30 May, with a daily maximum value of 5,155 t/d on 13 May. Surveillance cameras showed continuous white gas-and-steam emissions that rose as high as 430 m above the crater on 27 May. Nighttime incandescence illuminated the gas column less than 300 m above the crater rim was and no pyroclastic emissions were reported. A landslide was identified on 13 May on the E flank of the volcano 50 m from the crater rim and extending 300 m away; SERNAGEOMIN noted that this event may have occurred on 12 May. During the morning of 27 and 28 May minor Strombolian explosions characterized by incandescent ejecta were recorded at the crater rim; the last reported Strombolian explosions had occurred at the end of March.
Seismic activity during June consisted of five volcano-tectonic (VT)-type events, 21,606 LP-type events, and 2,085 TR-type events. The average value of sulfur dioxide flux obtained by DOAS equipment was 1,420 ± 217 t/d during 1-15 June and 2,562 ± 804 t/d, with a maximum daily value of 4,810 t/d on 17 June. White gas-and-steam emissions rose less than 480 m above the crater; frequent nighttime crater incandescence was reflected in the degassing plume. On 12 June an emission rose 100 m above the crater and drifted NNW. On 15 June one or several emissions resulted in ashfall to the NE as far as 5.5 km from the crater, based on a Skysat satellite image. Several Strombolian explosions occurred within the crater; activity on 15 June was higher energy and ejected blocks 200-300 m on the NE slope. Surveillance cameras showed white gas-and-steam emissions rising 480 m above the crater on 16 June. On 19 and 24 June low-intensity Strombolian activity was observed, ejecting material as far as 200 m from the center of the crater to the E.
During July, seismicity included 29,319 LP-type events, 3,736 TR-type events, and two VT-type events. DOAS equipment recorded two days of sulfur dioxide emissions of 4,220 t/d and 1,009 t/d on 1 and 13 July, respectively. Constant nighttime incandescence was also recorded and was particularly noticeable when accompanied by eruptive columns on 12 and 16 July. Minor explosive events were detected in the crater. According to Skysat satellite images taken on 12, 13, and 16 July, ashfall deposits were identified 155 m S of the crater. According to POVI, incandescence was visible from two vents on the crater floor around 0336 on 12 July. Gas-and-ash emissions rose as high as 1.2 km above the crater on 13 July and drifted E and NW. A series of gas-and-steam pulses containing some ash deposited material on the upper E flank around 1551 on 13 July. During 16-31 July, average sulfur dioxide emissions of 1,679 ± 406 t/d were recorded, with a maximum daily value of 2,343 t/d on 28 July. Fine ash emissions were also reported on 16, 17, and 23 July.
Seismicity persisted during August, characterized by 27,011 LP-type events, 3,323 TR-type events, and three VT-type events. The average value of sulfur dioxide measurements taken during 1-15 August was 1,642 ± 270 t/d and 2,207 ± 4,549 t/d during 16-31 August, with a maximum daily value of 3,294 t/d on 27 August. Nighttime crater incandescence remained visible in degassing columns. White gas-and-steam emissions rose 480 m above the crater on 6 August. According to a Skysat satellite image from 6 August, ash accumulation was observed proximal to the crater and was mainly distributed toward the E slope. White gas-and-steam emissions rose 320 m above the crater on 26 August. Nighttime incandescence and Strombolian activity that generated ash emissions were reported on 27 August.
Seismicity during September was characterized by five VT-type events, 12,057 LP-type events, and 2,058 TR-type events. Nighttime incandescence persisted. On 2 September an ash emission rose 180 m above the crater and drifted SE at 1643 (figure 125) and a white gas-and-steam plume rose 320 m above the crater. According to the Buenos Aires VAAC, periods of continuous gas-and-ash emissions were visible in webcam images from 1830 on 2 September to 0110 on 3 September. Strombolian activity was observed on 2 September and during the early morning of 3 September, the latter event of which generated an ash emission that rose 60 m above the crater and drifted 100 m from the center of the crater to the NE and SW. Ashfall was reported to the SE and S as far as 750 m from the crater. The lava lake was active during 3-4 September and lava fountaining was visible for the first time since 26 March 2023, according to POVI. Fountains captured in webcam images at 2133 on 3 September and at 0054 on 4 September rose as high as 60 m above the crater rim and ejected material onto the upper W flank. Sulfur dioxide flux of 1,730 t/d and 1,281 t/d was measured on 3 and 4 September, respectively, according to data obtained by DOAS equipment.
Strong Strombolian activity and larger gas-and-ash plumes were reported during 18-20 September. On 18 September activity was also associated with energetic LP-type events and notable sulfur dioxide fluxes (as high as 4,277 t/d). On 19 September Strombolian activity and incandescence were observed. On 20 September at 0914 ash emissions rose 50 m above the crater and drifted SSE, accompanied by Strombolian activity that ejected material less than 100 m SSE, causing fall deposits on that respective flank. SERNAGEOMIN reported that a Planet Scope satellite image taken on 20 September showed the lava lake in the crater, measuring 32 m x 35 m and an area of 0.001 km2. Several ash emissions were recorded at 0841, 0910, 1251, 1306, 1312, 1315, and 1324 on 23 September and rose less than 150 m above the crater. The sulfur dioxide flux value was 698 t/d on 23 September and 1,097 t/d on 24 September. On 24 September the Volcanic Alert Level (VAL) was raised to Orange (the third level on a four-color scale). SENAPRED maintained the Alert Level at Yellow (the middle level on a three-color scale) for the communities of Villarrica, Pucón (16 km N), Curarrehue, and Panguipulli.
During 24-25 September there was an increase in seismic energy (observed at TR-events) and acoustic signals, characterized by 1 VT-type event, 213 LP-type events, and 124 TR-type events. Mainly white gas-and-steam emissions, in addition to occasional fine ash emissions were recorded. During the early morning of 25 September Strombolian explosions were reported and ejected material 250 m in all directions, though dominantly toward the NW. On 25 September the average value of sulfur dioxide flux was 760 t/d. Seismicity during 25-30 September consisted of five VT-type events, 1,937 LP-type events, and 456 TR-type events.
During 25-29 September moderate Strombolian activity was observed and ejected material as far as the crater rim. In addition, ash pulses lasting roughly 50 minutes were observed around 0700 and dispersed ENE. During 26-27 September a TR episode lasted 6.5 hours and was accompanied by discrete acoustic signals. Satellite images from 26 September showed a spatter cone on the crater floor with one vent that measured 10 x 14 m and a smaller vent about 35 m NE of the cone. SERNAGEOMIN reported an abundant number of bomb-sized blocks up to 150 m from the crater, as well as impact marks on the snow, which indicated explosive activity. A low-altitude ash emission was observed drifting NW around 1140 on 28 September, based on webcam images. Between 0620 and 0850 on 29 September an ash emission rose 60 m above the crater and drifted NW. During an overflight taken around 1000 on 29 September scientists observed molten material in the vent, a large accumulation of pyroclasts inside the crater, and energetic degassing, some of which contained a small amount of ash. Block-sized pyroclasts were deposited on the internal walls and near the crater, and a distal ash deposit was also visible. The average sulfur dioxide flux measured on 28 September was 344 t/d. Satellite images taken on 29 September ashfall was deposited roughly 3 km WNW from the crater and nighttime crater incandescence remained visible. The average sulfur dioxide flux value from 29 September was 199 t/d. On 30 September at 0740 a pulsating ash emission rose 1.1 km above the crater and drifted NNW (figure 126). Deposits on the S flank extended as far as 4.5 km from the crater rim, based on satellite images from 30 September.
Infrared MODIS satellite data processed by MIROVA (Middle InfraRed Observation of Volcanic Activity) showed intermittent thermal activity during April through September, with slightly stronger activity detected during late September (figure 127). Small clusters of thermal activity were detected during mid-June, early July, early August, and late September. According to the MODVOLC thermal alert system, a total of four thermal hotspots were detected on 7 July and 3 and 23 September. This activity was also intermittently captured in infrared satellite imagery on clear weather days (figure 128).
Geologic Background. The glacier-covered Villarrica stratovolcano, in the northern Lakes District of central Chile, is ~15 km south of the city of Pucon. A 2-km-wide caldera that formed about 3,500 years ago is located at the base of the presently active, dominantly basaltic to basaltic andesite cone at the NW margin of a 6-km-wide Pleistocene caldera. More than 30 scoria cones and fissure vents are present on the flanks. Plinian eruptions and pyroclastic flows that have extended up to 20 km from the volcano were produced during the Holocene. Lava flows up to 18 km long have issued from summit and flank vents. Eruptions documented since 1558 CE have consisted largely of mild-to-moderate explosive activity with occasional lava effusion. Glaciers cover 40 km2 of the volcano, and lahars have damaged towns on its flanks.
Information Contacts: Servicio Nacional de Geología y Minería (SERNAGEOMIN), Observatorio Volcanológico de Los Andes del Sur (OVDAS), Avda Sta María No. 0104, Santiago, Chile (URL: http://www.sernageomin.cl/); Proyecto Observación Villarrica Internet (POVI) (URL: http://www.povi.cl/); Sistema y Servicio Nacional de Prevención y Repuesta Ante Desastres (SENAPRED), Av. Beauchef 1671, Santiago, Chile (URL: https://web.senapred.cl/); Buenos Aires Volcanic Ash Advisory Center (VAAC), Servicio Meteorológico Nacional-Fuerza Aérea Argentina, 25 de mayo 658, Buenos Aires, Argentina (URL: http://www.smn.gov.ar/vaac/buenosaires/inicio.php); MIROVA (Middle InfraRed Observation of Volcanic Activity), a collaborative project between the Universities of Turin and Florence (Italy) supported by the Centre for Volcanic Risk of the Italian Civil Protection Department (URL: http://www.mirovaweb.it/); Hawai'i Institute of Geophysics and Planetology (HIGP) - MODVOLC Thermal Alerts System, School of Ocean and Earth Science and Technology (SOEST), Univ. of Hawai'i, 2525 Correa Road, Honolulu, HI 96822, USA (URL: http://modis.higp.hawaii.edu/); Copernicus Browser, Copernicus Data Space Ecosystem, European Space Agency (URL: https://dataspace.copernicus.eu/browser/).
Merapi (Indonesia) — October 2023 Cite this Report
Merapi
Indonesia
7.54°S, 110.446°E; summit elev. 2910 m
All times are local (unless otherwise noted)
Frequent incandescent avalanches during April-September 2023
Merapi, located just north of the major city of Yogyakarta in central Java, Indonesia, has had activity within the last 20 years characterized by pyroclastic flows and lahars accompanying growth and collapse of the steep-sided active summit lava dome. The current eruption period began in late December 2020 and has more recently consisted of ash plumes, intermittent incandescent avalanches of material, and pyroclastic flows (BGVN 48:04). This report covers activity during April through September 2023, based on information from Balai Penyelidikan dan Pengembangan Teknologi Kebencanaan Geologi (BPPTKG), the Center for Research and Development of Geological Disaster Technology, a branch of PVMBG which specifically monitors Merapi. Additional information comes from the Pusat Vulkanologi dan Mitigasi Bencana Geologi (PVMBG, also known as Indonesian Center for Volcanology and Geological Hazard Mitigation, CVGHM), MAGMA Indonesia, the Darwin Volcanic Ash Advisory Centre (VAAC), and various satellite data.
Activity during April through September 2023 primarily consisted of incandescent avalanches of material that mainly affected the SW and W flanks and traveled as far as 2.3 km from the summit (table 25) and white gas-and-steam emissions that rose 10-1,000 m above the crater.
Table 25. Monthly summary of avalanches and avalanche distances recorded at Merapi during April through September 2023. The number of reported avalanches does not include instances where possible avalanches were heard but could not be visually confirmed as a result of inclement weather. Data courtesy of BPPTKG (April-September 2023 daily reports).
| Month |
Average number of avalanches per day |
Distance avalanches traveled (m) |
| Apr 2023 |
19 |
1,200-2,000 |
| May 2023 |
22 |
500-2,000 |
| Jun 2023 |
18 |
1,200-2,000 |
| Jul 2023 |
30 |
300-2,000 |
| Aug 2023 |
25 |
400-2,300 |
| Sep 2023 |
23 |
600-2,000 |
BPPTKG reported that during April and May white gas-and-steam emissions rose 10-750 m above the crater, incandescent avalanches descended 500-2,000 m on the SW and W flanks (figure 135). Cloudy weather often prevented clear views of the summit, and sometimes avalanches could not be confirmed. According to a webcam image, a pyroclastic flow was visible on 17 April at 0531. During the week of 28 April and 4 May a pyroclastic flow was reported on the SW flank, traveling up to 2.5 km. According to a drone overflight taken on 17 May the SW lava dome volume was an estimated 2,372,800 cubic meters and the dome in the main crater was an estimated 2,337,300 cubic meters.
During June and July similar activity persisted with white gas-and-steam emissions rising 10-350 m above the crater and frequent incandescent avalanches that traveled 300-2,000 m down the SW, W, and S flanks (figure 136). Based on an analysis of aerial photos taken on 24 June the volume of the SW lava dome was approximately 2.5 million cubic meters. A pyroclastic flow was observed on 5 July that traveled 2.7 km on the SW flank. According to the Darwin VAAC multiple minor ash plumes were identified in satellite images on 19 July that rose to 3.7 km altitude and drifted S and SW. During 22, 25, and 26 July a total of 17 avalanches descended as far as 1.8 km on the S flank.
Frequent white gas-and-steam emissions continued during August and September, rising 10-450 m above the crater. Incandescent avalanches mainly affected the SW and W flanks and traveled 400-2,300 m from the vent (figure 137). An aerial survey conducted on 10 August was analyzed and reported that estimates of the SW dome volume was 2,764,300 cubic meters and the dome in the main crater was 2,369,800 cubic meters.
Frequent and moderate-power thermal activity continued throughout the reporting period, according to a MIROVA (Middle InfraRed Observation of Volcanic Activity) analysis of MODIS satellite data (figure 138). There was an increase in the number of detected anomalies during mid-May. The MODVOLC thermal algorithm recorded a total of 47 thermal hotspots: six during April, nine during May, eight during June, 15 during July, four during August, and five during September. Some of this activity was captured in infrared satellite imagery on clear weather days, sometimes accompanied by incandescent material on the SW flank (figure 139).
Geologic Background. Merapi, one of Indonesia's most active volcanoes, lies in one of the world's most densely populated areas and dominates the landscape immediately north of the major city of Yogyakarta. It is the youngest and southernmost of a volcanic chain extending NNW to Ungaran volcano. Growth of Old Merapi during the Pleistocene ended with major edifice collapse perhaps about 2,000 years ago, leaving a large arcuate scarp cutting the eroded older Batulawang volcano. Subsequent growth of the steep-sided Young Merapi edifice, its upper part unvegetated due to frequent activity, began SW of the earlier collapse scarp. Pyroclastic flows and lahars accompanying growth and collapse of the steep-sided active summit lava dome have devastated cultivated lands on the western-to-southern flanks and caused many fatalities.
Information Contacts: Balai Penyelidikan dan Pengembangan Teknologi Kebencanaan Geologi (BPPTKG), Center for Research and Development of Geological Disaster Technology (URL: http://merapi.bgl.esdm.go.id/, Twitter: @BPPTKG); MAGMA Indonesia, Kementerian Energi dan Sumber Daya Mineral (URL: https://magma.esdm.go.id/v1); Pusat Vulkanologi dan Mitigasi Bencana Geologi (PVMBG, also known as Indonesian Center for Volcanology and Geological Hazard Mitigation, CVGHM), Jalan Diponegoro 57, Bandung 40122, Indonesia (URL: http://www.vsi.esdm.go.id/); Darwin Volcanic Ash Advisory Centre (VAAC), Bureau of Meteorology, Northern Territory Regional Office, PO Box 40050, Casuarina, NT 0811, Australia (URL: http://www.bom.gov.au/info/vaac/); MIROVA (Middle InfraRed Observation of Volcanic Activity), a collaborative project between the Universities of Turin and Florence (Italy) supported by the Centre for Volcanic Risk of the Italian Civil Protection Department (URL: http://www.mirovaweb.it/); Hawai'i Institute of Geophysics and Planetology (HIGP) - MODVOLC Thermal Alerts System, School of Ocean and Earth Science and Technology (SOEST), Univ. of Hawai'i, 2525 Correa Road, Honolulu, HI 96822, USA (URL: http://modis.higp.hawaii.edu/); Copernicus Browser, Copernicus Data Space Ecosystem, European Space Agency (URL: https://dataspace.copernicus.eu/browser/); Øystein Lund Andersen (URL: https://www.oysteinlundandersen.com/, https://twitter.com/oysteinvolcano).
Ebeko
Russia
50.686°N, 156.014°E; summit elev. 1103 m
All times are local (unless otherwise noted)
Moderate explosive activity with ash plumes continued during June-November 2023
Ebeko, located on the N end of Paramushir Island in Russia’s Kuril Islands just S of the Kamchatka Peninsula, consists of three summit craters along a SSW-NNE line at the northern end of a complex of five volcanic cones. Observed eruptions date back to the late 18th century and have been characterized as small-to-moderate explosions from the summit crater, accompanied by intense fumarolic activity. The current eruptive period began in June 2022, consisting of frequent explosions, ash plumes, and thermal activity (BGVN 47:10, 48:06). This report covers similar activity during June-November 2023, based on information from the Kamchatka Volcanic Eruptions Response Team (KVERT) and satellite data.
Moderate explosive activity continued during June-November 2023 (figures 50 and 51). According to visual data from Severo-Kurilsk, explosions sent ash 2-3.5 km above the summit (3-4.5 km altitude) during most days during June through mid-September. Activity after mid-September was slightly weaker, with ash usually reaching less than 2 km above the summit. According to KVERT the volcano in October and November was, with a few exceptions, either quiet or obscured by clouds that prevented satellite observations. KVERT issued Volcano Observatory Notices for Aviation (VONA) on 8 and 12 June, 13 and 22 July, 3 and 21 August, and 31 October warning of potential aviation hazards from ash plumes drifting 3-15 km from the volcano. Based on satellite data, KVERT reported a persistent thermal anomaly whenever weather clouds permitted viewing.
Geologic Background. The flat-topped summit of the central cone of Ebeko volcano, one of the most active in the Kuril Islands, occupies the northern end of Paramushir Island. Three summit craters located along a SSW-NNE line form Ebeko volcano proper, at the northern end of a complex of five volcanic cones. Blocky lava flows extend west from Ebeko and SE from the neighboring Nezametnyi cone. The eastern part of the southern crater contains strong solfataras and a large boiling spring. The central crater is filled by a lake about 20 m deep whose shores are lined with steaming solfataras; the northern crater lies across a narrow, low barrier from the central crater and contains a small, cold crescentic lake. Historical activity, recorded since the late-18th century, has been restricted to small-to-moderate explosive eruptions from the summit craters. Intense fumarolic activity occurs in the summit craters, on the outer flanks of the cone, and in lateral explosion craters.
Information Contacts: Kamchatka Volcanic Eruptions Response Team (KVERT), Far Eastern Branch, Russian Academy of Sciences, 9 Piip Blvd., Petropavlovsk-Kamchatsky, 683006, Russia (URL: http://www.kscnet.ru/ivs/kvert/).
Search Bulletin Archive by Publication Date
Select a month and year from the drop-downs and click "Show Issue" to have that issue displayed in this tab.
The default month and year is the latest issue available.
Bulletin of the Global Volcanism Network - Volume 24, Number 06 (June 1999)
Managing Editor: Richard Wunderman
Arenal (Costa Rica)
Comparatively weak explosive activity during past 1.5 years
Batur (Indonesia)
New eruption beginning in March; frequent explosions
Colima (Mexico)
Diminished activity during much of June; a large explosion on 17 July
Etna (Italy)
Lava-flow temperature measurements
Guagua Pichincha (Ecuador)
Continued frequent steam-and-ash explosions
Irazu (Costa Rica)
Occasional earthquakes and 5-70 microseisms a month during last 1.5 years
Langila (Papua New Guinea)
Mild emissions with rare ash-bearing outbursts
Lengai, Ol Doinyo (Tanzania)
Ongoing intracrater activity; fresh extra-crater lava flows; wet vs. dry carbonatites
Long Valley (United States)
Continued dome inflation and persistent earthquake swarms through 1998
Manam (Papua New Guinea)
Ashfalls and infrequent explosions
Mayon (Philippines)
Explosion on 22 June sends a plume to ~10-12 km altitude
Momotombo (Nicaragua)
Fumarole temperatures remain high in April 1999
Monowai (New Zealand)
Strong acoustic crisis recorded during 5-10 June
Negro, Cerro (Nicaragua)
New map of changes to crater after 1992 and 1995 eruptions
Poas (Costa Rica)
Strong drop in tremor duration and mid-frequency earthquakes in early 1998
Popocatepetl (Mexico)
Small exhalations, minor fumarolic activity, and variable seismicity
Rabaul (Papua New Guinea)
The active intracaldera cone (Tavurvur) continues mild emissions through June
Rincon de la Vieja (Costa Rica)
1.5-year record of seismicity and eruptions through May 1999
Stromboli (Italy)
Vents in summit craters still active; variable seismicity
Turrialba (Costa Rica)
A 4-fold increase in microseisms during December-April 1999
Whakaari/White Island (New Zealand)
Visit on 30 June reveals decreased activity
Arenal
Costa Rica
10.463°N, 84.703°W; summit elev. 1670 m
All times are local (unless otherwise noted)
Comparatively weak explosive activity during past 1.5 years
In November 1998-May 1999, Arenal's explosive activity continued, although at a reduced pace compared with past years. Crater C continued to emit gases, lava flows, and sporadic Strombolian eruptions. Fumarolic activity persisted at Crater D.
Geologic Background. Conical Volcán Arenal is the youngest stratovolcano in Costa Rica and one of its most active. The 1670-m-high andesitic volcano towers above the eastern shores of Lake Arenal, which has been enlarged by a hydroelectric project. Arenal lies along a volcanic chain that has migrated to the NW from the late-Pleistocene Los Perdidos lava domes through the Pleistocene-to-Holocene Chato volcano, which contains a 500-m-wide, lake-filled summit crater. The earliest known eruptions of Arenal took place about 7000 years ago, and it was active concurrently with Cerro Chato until the activity of Chato ended about 3500 years ago. Growth of Arenal has been characterized by periodic major explosive eruptions at several-hundred-year intervals and periods of lava effusion that armor the cone. An eruptive period that began with a major explosive eruption in 1968 ended in December 2010; continuous explosive activity accompanied by slow lava effusion and the occasional emission of pyroclastic flows characterized the eruption from vents at the summit and on the upper western flank.
Information Contacts: E. Fernandez, V. Barboza, E. Duarte, R. Saenz, E. Malavassi, M. Martinez, and R. Van der Laat, T. Marino, and E. Hernandez, Observatorio Vulcanologico y Sismologico de Costa Rica, Universidad Nacional (OVSICORI-UNA), Apartado 86-3000, Heredia, Costa Rica; Wendy Perez Fernandez, Seccion de Seismologia, Vulcanologia y Exploracion Geofisica, Escuela Centroamericana de Geologia, Universidad de Costa Rica, POB 35-2060, San José, Costa Rica.
Batur
Indonesia
8.2403°S, 115.3775°E; summit elev. 1711 m
All times are local (unless otherwise noted)
New eruption beginning in March; frequent explosions
During the week of 9-15 March, white ash plumes rose 10-100 m above the crater. Booming noises were heard six times, and volcanic earthquakes increased drastically compared to the previous week (table 1). It was later determined that an ash eruption had begun on 15 March, sending bluish-white plumes 10-50 m high. On 17 March, two relatively recent craters merged when a connecting ridge collapsed as a result of earthquakes and small eruptions.
Table 1. Weekly seismicity recorded at Batur, March-July 1999. Types of events include volcanic A-type, volcanic B-type, tectonic, explosion earthquakes, and ash emissions (small explosion earthquakes). No data were available for the period 30 March-19 April. Maximum explosion amplitudes were reported as 2-26 mm during May; more typical, smaller amplitudes were 1.5-24 mm during May-July. Courtesy of VSI.
| Date |
A-type |
B-type |
Tectonic |
Explosion |
Emission |
| 02-08 Mar 1999 |
2 |
0 |
1 |
0 |
2 |
| 09-15 Mar 1999 |
106 |
241 |
1 |
0 |
26 |
| 16-22 Mar 1999 |
0 |
14 |
1 |
270 |
5 |
| 23-29 Mar 1999 |
-- |
-- |
1 |
299 |
-- |
| 30 Mar-05 Apr 1999 |
-- |
-- |
-- |
-- |
-- |
| 06-12 Apr 1999 |
-- |
-- |
-- |
-- |
-- |
| 13-19 Apr 1999 |
-- |
-- |
-- |
-- |
-- |
| 20-26 Apr 1999 |
1 |
2 |
2 |
79 |
35 |
| 27 Apr-03 May 1999 |
0 |
0 |
0 |
42 |
21 |
| 04-10 May 1999 |
0 |
0 |
0 |
26 |
39 |
| 11-17 May 1999 |
8 |
3 |
6 |
68 |
21 |
| 18-24 May 1999 |
0 |
0 |
3 |
337 |
47 |
| 25-31 May 1999 |
1 |
6 |
0 |
112 |
31 |
| 01-07 Jun 1999 |
3 |
4 |
1 |
6 |
19 |
| 08-14 Jun 1999 |
12 |
5 |
4 |
0 |
52 |
| 15-21 Jun 1999 |
4 |
6 |
4 |
85 |
48 |
| 22-28 Jun 1999 |
5 |
13 |
1 |
141 |
31 |
| 29 Jun-05 Jul 1999 |
10 |
10 |
2 |
171 |
50 |
| 06-12 Jul 1999 |
1 |
6 |
1 |
122 |
32 |
| 13-19 Jul 1999 |
0 |
0 |
1 |
206 |
14 |
Volcanic activity was dominated by emission events (small explosions) during the week of 23-29 March; the eruption plume was white-blue in color, rising 10-100 m above crater rim. Booming noises were heard three times on 22 March, but no glow was observed. Reports are not available for most of April, but during late April through the middle of May the seismic record was dominated by explosion events. Ash plumes, described as "white" or "white-bluish" were observed rising 50-100 m above the crater. Neither explosion sounds nor glow was observed.
Six explosions on 17 May ejected materials that fell around the crater. Another explosion on 25 May was accompanied by incandescent ejections that fell around the crater. Explosion sounds were heard on 17 occasions during the week of 25-31 May. "White ash emissions" rose only to 25 m during 1-14 June, but varied between 10 and 100 m the rest of the month. Similar activity continued through mid-July, and a variable rumbling noise was heard the week of 13-19 July.
Geologic Background. The historically active Batur is located at the center of two concentric calderas NW of Agung volcano. The outer 10 x 13.5 km caldera was formed during eruption of the Bali (or Ubud) Ignimbrite about 29,300 years ago and now contains a caldera lake on its SE side, opposite the Gunung Abang cone, the topographic high of the complex. The inner 6.4 x 9.4 km caldera was formed about 20,150 years ago during eruption of the Gunungkawi Ignimbrite. The SE wall of the inner caldera lies beneath Lake Batur; Batur cone has been constructed within the inner caldera to a height above the outer caldera rim. The Batur stratovolcano has produced vents over much of the inner caldera, but a NE-SW fissure system has localized the Batur I, II, and III craters along the summit ridge. Recorded eruptions have been characterized by mild-to-moderate explosive activity sometimes accompanied by lava emission. Basaltic lava flows from both summit and flank vents have reached the caldera floor and the shores of Lake Batur in historical time.
Information Contacts: Volcanological Survey of Indonesia (VSI), Jalan Diponegoro No. 57, Bandung 40122, Indonesia (URL: http://www.vsi.esdm.go.id/).
Colima
Mexico
19.514°N, 103.62°W; summit elev. 3850 m
All times are local (unless otherwise noted)
Diminished activity during much of June; a large explosion on 17 July
Details about another large explosion on 17 July that sent a plume to over 10 km altitude will be reported in a future issue. Prior to that, during the month of June, degassing and explosions continued. The highest level of activity in 13 days was recorded on 1 June, but by 4 June activity had dropped to the lowest level in a month and it remained low through the end of June. Accordingly, during June explosions and degassing events became less frequent, shorter in duration, and of lower intensity. On 5 July one of two explosions sent an ash column to ~2,500 m and produced ashfall 10-20 km W of the summit.
A 3 June aerial inspection verified that no new summit crater has been formed, but did record a recent increase in the size of the crater formed during the 10 February and 10 May explosions. The crater diameter is now 180-200 m, with the deepest sector measuring 70 m.
Early in June authorities continued the evacuation of La Yerbabuena, in the state of Colima, and Juan Barragán, Los Machos, El Borbollón, and Durazno, in the state of Jalisco. The Observatory recommended controlled access to areas within 8.5 km of the summit and alert to persons within 11.5 km. People in other high-risk areas were told to be prepared to evacuate. By 10 June, however, reduced activity enabled authorities to relax restrictions. They trimmed the evacuated zone to within 6.5 km of the summit and maintained immediate response capacity to 8.5 km (including the villages of La Yerbabuena, Juan Barragán, El Agostadero, Los Machos, Borbollón, and El Durazno). Radio alert was maintained to a 11.5 km radius of the summit (encompassing the settlements of Causentla, Cofradía de Tonila, Atenguillo, Saucillo, El Fresnal, El Embudo). Authorities allowed residents to return to evacuated communities in both Colima and Jalisco. On 2 July, due to recent rain and the potential for lahars, authorities recommended avoiding the bed of the Cordobán river.
Geologic Background. The Colima complex is the most prominent volcanic center of the western Mexican Volcanic Belt. It consists of two southward-younging volcanoes, Nevado de Colima (the high point of the complex) on the north and the historically active Volcán de Colima at the south. A group of late-Pleistocene cinder cones is located on the floor of the Colima graben west and east of the complex. Volcán de Colima (also known as Volcán Fuego) is a youthful stratovolcano constructed within a 5-km-wide scarp, breached to the south, that has been the source of large debris avalanches. Major slope failures have occurred repeatedly from both the Nevado and Colima cones, producing thick debris-avalanche deposits on three sides of the complex. Frequent recorded eruptions date back to the 16th century. Occasional major explosive eruptions have destroyed the summit (most recently in 1913) and left a deep, steep-sided crater that was slowly refilled and then overtopped by lava dome growth.
Information Contacts: Colima Volcano Observatory, University of Colima, Ave. 25 de Julio 965, Colima 28045 México (URL: https://portal.ucol.mx/cueiv/).
Etna
Italy
37.748°N, 14.999°E; summit elev. 3357 m
All times are local (unless otherwise noted)
Lava-flow temperature measurements
During the winter of 1998-99, Southeast Crater underwent a series of short eruptions. On 4 February 1999 a similar outbreak led to fracturing of the SE cone with subsequent lava flows to the NNE and SSE (observation by Giuseppe Scarpinati). The SE flow developed a lava field between 2,900 and 2,800 m elevation on the rim of the Valle del Bove (BGVN 24:05), with numerous branches that nearly reached its bottom at about 2,000 m elevation. This mild effusive activity was characterized by very small and slow degassed lava flows coming from ephemeral vents through the superficially congealed crust of the field.
Temperature measurements were carried out on lavas from several of these effusive vents during the first days of April. Special thanks are due to Antonio and Orazio Nicoloso and the Etnean Guides for assistance in the field. Consumable "Temtip" Pt / Pt-10%Rh thermocouples were used following a procedure described in Archambault and Tanguy (1976). The maximum lava temperature recorded at depths of 40-60 cm within the fluid lava was 1,085 ± 5°C (figure 78), slightly higher than that measured during the last two major flank eruptions of 1983 and 1991-93 (1,070-1,080°C). As already shown in Archambault and Tanguy (1976), such small lava flows showed a strong thermal gradients, so that measurements made at 5-15 cm depth give results 10-15°C lower than the true internal temperature (figure 79). This means that devices reaching only the superficial parts of the flows are unsuitable for such temperature measurements.
Although relatively low for a trachybasalt (or basaltic hawaiite) lava, the temperature of 1,085°C is consistent with their high crystal content of ~40% phenocrysts. As usual in recent Etna lavas, these phenocrysts consist of plagioclase, clinopyroxene, olivine and titanomagnetite lying in a glassy alkaline groundmass.
Reference. Archambault, C., and Tanguy, J.C., 1976, Comparative temperature measurements on Mount Etna lavas: Journal of Volcanology and Geothermal Research, 1, 113-125.
Geologic Background. Mount Etna, towering above Catania on the island of Sicily, has one of the world's longest documented records of volcanism, dating back to 1500 BCE. Historical lava flows of basaltic composition cover much of the surface of this massive volcano, whose edifice is the highest and most voluminous in Italy. The Mongibello stratovolcano, truncated by several small calderas, was constructed during the late Pleistocene and Holocene over an older shield volcano. The most prominent morphological feature of Etna is the Valle del Bove, a 5 x 10 km caldera open to the east. Two styles of eruptive activity typically occur, sometimes simultaneously. Persistent explosive eruptions, sometimes with minor lava emissions, take place from one or more summit craters. Flank vents, typically with higher effusion rates, are less frequently active and originate from fissures that open progressively downward from near the summit (usually accompanied by Strombolian eruptions at the upper end). Cinder cones are commonly constructed over the vents of lower-flank lava flows. Lava flows extend to the foot of the volcano on all sides and have reached the sea over a broad area on the SE flank.
Information Contacts: Roberto Clocchiatti, Lab. Pierre Sue, CEA Saclay, France; Charles Rivière, CGE, France; Santo La Delfa, Giuseppe Patanè, and Jean-Claude Tanguy, University of Catania, Italy.
Guagua Pichincha (Ecuador) — June 1999 Cite this Report
Guagua Pichincha
Ecuador
0.171°S, 78.598°W; summit elev. 4784 m
All times are local (unless otherwise noted)
Continued frequent steam-and-ash explosions
The "yellow alert" status was uninterrupted as Guagua Pichincha expelled steam and ash throughout June. Explosions occurred on 31 May and on 1, 5, 6, 7, 8, 10, 11, 12, 13, 17, 24, 28, and 30 June. Explosions were more frequent in early-to mid-June, but the 28 June explosion was the largest in three months. A large explosion on 11 June sent a steam-and-ash column to ~5 km that lasted for about 5 minutes before dispersing to the south. Explosions were usually accompanied by long periods of tremor. A sulfur smell persisted throughout June and loud noises were also common. Steam frequently escaped to heights between 15 and 1,200 m from vents known as Alineadas, 1981 Crater, and Locomotora, along with those in the NW area of the summit. Alineadas discharged the highest plumes. Phreatic explosions as well as volcano-tectonic (VT), long-period (LP), and hybrid earthquakes occurred almost daily throughout June at levels similar to the last few months (figures 14 and 15). In addition to activity on the volcano, the seismic swarm N of Quito has altered. This may reflect changes in the regional stress field.
Geologic Background. Guagua Pichincha and the older Pleistocene Rucu Pichincha stratovolcanoes form a broad volcanic massif that rises immediately W of Ecuador's capital city, Quito. A lava dome grew at the head of a 6-km-wide scarp formed during a late-Pleistocene slope failure ~50,000 years ago. Subsequent late-Pleistocene and Holocene eruptions from the central vent consisted of explosive activity with pyroclastic flows accompanied by periodic growth and destruction of the lava dome. Many minor eruptions have been recorded since the mid-1500's; the largest took place in 1660, when ash fell over a 1,000 km radius and accumulated to 30 cm depth in Quito. Pyroclastic flows and surges also occurred, primarily to then W, and affected agricultural activity.
Information Contacts: Instituto Geofísico, Escuela Politécnica Nacional, Apartado 17-01-2759, Quito, Ecuador.
Irazu
Costa Rica
9.979°N, 83.852°W; summit elev. 3436 m
All times are local (unless otherwise noted)
Occasional earthquakes and 5-70 microseisms a month during last 1.5 years
In late 1998 and early 1999, seismographic station IRZ2 continued to register a few microseisms and occasional earthquakes (figure 13). During February and March, the color of the lake was clear yellow; in May, green. As is typical, the lake contained zones of constant bubbling. Weak fumarolic activity continued on the NE flank.
Geologic Background. The massive Irazú volcano in Costa Rica, immediately E of the capital city of San José, covers an area of 500 km2 and is vegetated to within a few hundred meters of its broad summit crater complex. At least 10 satellitic cones are located on its S flank. No lava effusion is known since the eruption of the Cervantes lava flows from S-flank vents about 14,000 years ago, and all known Holocene eruptions have been explosive. The focus of eruptions at the summit crater complex has migrated to the W towards the main crater, which contains a small lake. The first well-documented eruption occurred in 1723, and frequent explosive eruptions have occurred since. Ashfall from the last major eruption during 1963-65 caused significant disruption to San José and surrounding areas. Phreatic activity reported in 1994 may have been a landslide event from the fumarolic area on the NW summit (Fallas et al., 2018).
Information Contacts: E. Fernandez, V. Barboza, E. Duarte, R. Saenz, E. Malavassi, M. Martinez, and R. Van der Laat, T. Marino, and E. Hernandez, Observatorio Vulcanologico y Sismologico de Costa Rica, Universidad Nacional (OVSICORI-UNA), Apartado 86-3000, Heredia, Costa Rica; Wendy Perez Fernandez, Seccion de Seismologia, Vulcanologia y Exploracion Geofisica, Escuela Centroamericana de Geologia, Universidad de Costa Rica, POB 35-2060, San Jose, Costa Rica.
Langila (Papua New Guinea) — June 1999 Cite this Report
Langila
Papua New Guinea
5.525°S, 148.42°E; summit elev. 1330 m
All times are local (unless otherwise noted)
Mild emissions with rare ash-bearing outbursts
Crater 2 exhibited mild, continuous volcanic activity during May and very low activity during June. The May activity primarily consisted of the escape of moderately thick gray to brown ash clouds. Weak rumbling and roaring noises occasionally accompanied the emissions and fairly significant ash columns were forcefully ejected to 2 km height on 4, 9, 11, and 30 May. The ash clouds drifted NW, resulting in downwind ashfall. The June activity was summarized as the escape of mostly small to moderate amounts of vapor. Occasional ash-bearing (gray-brown) ash clouds were seen. In both months, there was no visible night glow, Crater 3 remained quiet and only occasionally released thin white vapor. The seismograph remained inoperative.
Geologic Background. Langila, one of the most active volcanoes of New Britain, consists of a group of four small overlapping composite basaltic-andesitic cones on the lower E flank of the extinct Talawe volcano in the Cape Gloucester area of NW New Britain. A rectangular, 2.5-km-long crater is breached widely to the SE; Langila was constructed NE of the breached crater of Talawe. An extensive lava field reaches the coast on the N and NE sides of Langila. Frequent mild-to-moderate explosive eruptions, sometimes accompanied by lava flows, have been recorded since the 19th century from three active craters at the summit. The youngest and smallest crater (no. 3 crater) was formed in 1960 and has a diameter of 150 m.
Information Contacts: Ben Talai, Rabaul Volcano Observatory (RVO), P.O. Box 386, Rabaul, Papua New Guinea.
Ol Doinyo Lengai (Tanzania) — June 1999 Cite this Report
Ol Doinyo Lengai
Tanzania
2.764°S, 35.914°E; summit elev. 2962 m
All times are local (unless otherwise noted)
Ongoing intracrater activity; fresh extra-crater lava flows; wet vs. dry carbonatites
Eruptions from the summit crater continued at a steady state. The activity level was low, but new observations during the rainy season conflicted with previous assumptions of color and age relationships among the natrocarbonatite flows. On 3 April two fresh flows, each having volumes of ~30 m3, had apparently issued from two separate hornitos in the summit crater. The pahoehoe flows were extruded over older lavas saturated with water from recent rainfall and earlier that day had generated a prominent steam plume many hundreds of meters high and visible from Engare Sero, 10 km N of the volcano. Large areas of the highest part of the N crater floor remained unusually hot (>150°C) throughout the day and sounds of sloshing magma suggest that substantial collapse of this region might be imminent. Small amounts of lapilli surrounding a hornito indicated a recent small scale (~10 m) lava fountain.
Cross-sections cut through the strongly porphyritic ~0.5 m flows (gregoryite and neyereite) revealed compact non-vesicular interiors and a near-glassy crystal-supported matrix. During a rain squall individual rain drops were observed whitening the flow surface (perhaps 50-150°C) in seconds. The margins of the recent flows also had turned white during cooling (figure 60). Clearly the timing between eruption and direct precipitation can change the age/color relationship previously established for Lengai, and is unreliable during the rainy season, an important consideration for photo-reconnaissance interpretations.
Intense fumarole activity from at least five of the larger hornitos, and from crater-rim fissures and cooling cracks on the lava flows, continued throughout 3-4 April (figure 61). Hornitos produced continuous steam and/or H2S gas, although one emanated blue and then black smoke. Another large hornito produced substantial heat haze but no visible gas. Fumaroles from cooling cracks in the fresh lava were associated with delicate salt deposits (figure 62).
At the time of the visit lava that flowed over the crater rim in the N and E (see BGVN 24:02) extended many hundreds of meters down the flanks of the volcano. The state of weathering of these flows suggested they were 1-2 weeks old, consistent with reports that glowing lava could be observed on the flanks of the volcano from Engare Sero at night during this period. Lava was also close to the NW rim of the crater. During this rainy season (as in the last one) vigorous flowing streams of water delivered both volcanic solutes (soda-rich) and volcanic detritus directly to Lake Natron, which was wet from shore to shore.
Geologic Background. The symmetrical Ol Doinyo Lengai is the only volcano known to have erupted carbonatite tephras and lavas in historical time. The prominent stratovolcano, known to the Maasai as "The Mountain of God," rises abruptly above the broad plain south of Lake Natron in the Gregory Rift Valley. The cone-building stage ended about 15,000 years ago and was followed by periodic ejection of natrocarbonatitic and nephelinite tephra during the Holocene. Historical eruptions have consisted of smaller tephra ejections and emission of numerous natrocarbonatitic lava flows on the floor of the summit crater and occasionally down the upper flanks. The depth and morphology of the northern crater have changed dramatically during the course of historical eruptions, ranging from steep crater walls about 200 m deep in the mid-20th century to shallow platforms mostly filling the crater. Long-term lava effusion in the summit crater beginning in 1983 had by the turn of the century mostly filled the northern crater; by late 1998 lava had begun overflowing the crater rim.
Information Contacts: Matthew J. Genge, Department of Mineralogy, The Natural History Museum, Cromwell Road, London SW7 5BD, United Kingdom; Matt Balme and Adrian P. Jones, Department of Geological Sciences, University College, London, United Kingdom.
Long Valley (United States) — June 1999 Cite this Report
Long Valley
United States
37.7°N, 118.87°W; summit elev. 3390 m
All times are local (unless otherwise noted)
Continued dome inflation and persistent earthquake swarms through 1998
The following summarizes activity at Long Valley during the second half of 1997 and all of 1998 (Hill, 1998). A summary of activity during 1996 and the first half of 1997 can be found in BGVN 22:11 and 22:12.
Summary of activity during July-December, 1997.After nearly a year of relative seismic quiescence within the caldera, earthquake swarm activity returned in early July. The deeper focus (>10 km) , long-period (LP) earthquakes centered beneath the SW flank of Mammoth Mountain and the Devil's Postpile area, which had increased in early 1997, continued at an elevated rate through the end of the year. Altogether over 200 of these events were detected during 1997, all M <2.0 (figure 21). This exceeded the total number of deep LP events detected from their onset in 1989 through 1996. Earthquake activity in the shallow crust beneath Mammoth Mountain (depths <10 km) at the SW margin of the caldera remained low throughout 1997.
The gradual increase in the inflation rate of the resurgent dome begun in late May 1997 marked the onset of an episode of unrest in the caldera that intensified at an accelerating rate through the summer and fall, culminating in a series of strong earthquake swarms from mid-November through early January 1998. The extension rate of an 8-km baseline spanning the resurgent dome peaked at over 20 cm/year during the second week of November. Following a strong earthquake swarm on 22 November that included three M >4.5 earthquakes, the deformation pattern briefly changed to one dominated by right-oblique slip along the WNW-striking "S-moat fault zone." In early December and through the rest of 1997, the deformation resumed the earlier pattern of dome inflation with a relatively steady 12-15 cm/year extension rate. By the end of 1997, the 8-km baseline was 7 cm longer than in late May.
The earthquake activity associated with the swarms begun in early July developed over a broad 15-km zone spanning the S-moat and southern margin of the resurgent dome. Typically, several areas within this zone were active simultaneously. This swarm activity, which included more than 12,000 M >1.2 and 120 M >3.0 earthquakes over a 7-month period through mid-January 1998, had a cumulative seismic moment of 3.3 x 1024 dyne-cm, equivalent to a single earthquake of M 5.4. The peak in seismicity from mid-November through early January included eight M >4.0 earthquakes. Focal mechanism data for the larger earthquakes indicated a dominantly right-lateral slip along a WNW-trending fault zone within the S-moat, although broadband seismograms admit the possibility of a dilatational component (volume increase) in the source mechanism for some of the M >4 earthquakes. The great majority of earthquakes had the broadband character of brittle, double-couple events (tectonic or volcano-tectonic earthquakes). A few shallow (<3 km) events beneath the southern half of the resurgent dome had energy concentrated in the 1-3 Hz band typical of shallow LP earthquakes. Whether the unusual appearance of the seismograms can be attributed to the earthquake source or wave propagation effects remains to be determined.
Monitoring of the gases around Mammoth Mountain showed two noteworthy changes in 1997, both more likely related to the increased deep LP earthquake activity beneath the SW flank of the mountain than to the much stronger activity within the caldera. The helium isotope ratio, 3He/4He, in samples collected in May and October from the MMF fumarole on the NE flank of Mammoth Mountain showed an increase with respect to the gradually declining values measured in late 1995 through early 1997. Continuous CO2 monitors in tree-kill areas on opposite sides of Mammoth Mountain detected an abrupt increase in CO2 soil-gas concentrations beginning in late September and ending in early December before significant snow accumulations.
The episode of persistent unrest during the second half of 1997 is the third most energetic activity in the caldera since the intense earthquake swarms of May 1980 (which included four M 6 earthquakes) and January 1983 (which included two M 5.3 earthquakes). The strongest seismic activity in the 1980 and 1983 episodes occurred within the first few days of the swarm sequences. The 1997 activity level accelerated gradually over a 4-month period prior to the strongest seismicity, which then spread out over nearly an additional 3 months. This activity provided the first test of the color-code notification system for ranking activity levels within the caldera. "Condition Green" (no immediate risk) remained throughout the year but the activity peaks on 22 and 30 November came close to meeting the guidelines for "Condition Yellow" (watch).
Summary of activity during 1998. Three events dominated activity during 1998. First, a decline in the acceleration of the resurgent dome uplift and the persistent earthquake swarm activity in the S-moat, which began in June-July 1997 and peaked in November-December 1998. Second and third, M 5.1 earthquakes on 8 June and 14 July 1998, centered W of the Hilton Creek fault and 2-4 km S of the caldera, together with their aftershock sequences.
In the S-moat of the caldera, the final phase of the strong earthquake swarms that dominated activity through the second half of 1997 extended into January 1998. An earthquake (M 4.8) on 31 December marked a shift in the center of the most intense activity from beneath the western part to the eastern-central section. A strong swarm burst occurred during 1-5 January in which >2,000 earthquakes were detected and located, including more than a dozen with M >3. On 6 January, a M 4.1 earthquake was the last of nine earthquakes with magnitudes of 4.0-4.9 in the S-moat since 13 November 1997.
Activity in the S-moat area declined to background levels by midsummer, interrupted by occasional M >3 earthquakes and brief swarms, particularly in February and March. The latter period included several days with 80-180 small swarm events. A M 3.2 earthquake occurred on 13 February, and swarm events on 2, 6-7, and 15-16 March included earthquakes of M >2.5. The last six months of 1998 included five M >3.0 caldera earthquakes. The two largest, on 14 July and 7 December, had magnitudes of 3.7 (the 14 July event occurred 2 hours after the M 5.1 earthquake).
Geodimeter measurements confirmed that the inflation rate of the resurgent dome gradually slowed from a peak of 30 cm/year in November 1997 to ~15 cm/year in early 1998 and by mid-May had dropped to 1-2 cm/year, a rate that persisted through the end of 1998.
Long-period earthquake activity 10-25 km beneath Devil's Postpile and the SW flank of Mammoth Mountain continued through 1998 (figure 22). Some 140 of the LP events were detected in 1998, just over half the 1997 number (250 events). That rate is still higher than any time since the mid-1989 onset of LP activity; during 1989-96 a total of only 165 LP events were detected. In 1998, many of the LP earthquakes were preceded by several tens of seconds of a tremor-like signal with a dominant frequency around 1 Hz. This was a change from the character of the LP activity in earlier years, when the tremor-like signals were generally of shorter duration and the dominant frequency was 2-3 Hz.
An event of M 1.8 at a depth of 12 km on 11 November was the largest LP event recorded since the initial activity in 1989; it was followed by a week of ~25 smaller events. Occasional LP earthquakes continued to occur through 1998 at depths between 15 and 30 km centered beneath an area roughly 7 km W of Mono Craters. One of the largest in this area, M ~2.4, occurred at a depth of 24 km on 26 September.
Over the summer months, field studies around the flanks of Mammoth Mountain suggested that the CO2 flux rate had been slowly decreasing over the past 3 years. Airborne measurements in September and November detected a CO2 plume downwind, consistent with the multiple sources around the flanks of the mountain.
The first of the two M 5.1 earthquakes occurred on 8 June just 1.5 km S of the caldera at a depth of 6.7 km. The second occurred on 14 July and was centered 3 km to the SSE at 6.2 km depth. Both earthquakes were located within the footwall of the E-dipping Hilton Creek fault; neither appeared to have involved slip on the fault itself. Both earthquakes were followed by rich aftershock sequences that tailed off though the end of the year and, together, included nine earthquakes with magnitudes between 4.0 and 4.5. The aftershock epicenters defined a nearly orthogonal pattern in map view. Those of the 8 June event were confined to a WNW lineation through the mainshock epicenter, whereas those of the 14 July event were confined to a more diffuse SSW lineation through the mainshock epicenter. Both lineations cut across the Hilton Creek fault and intersect just E of the 8 June epicenter.
Earthquake activity elsewhere in the region showed no significant variation from background activity over the past several years.
References. Hill, David P., 1997, Long Valley Caldera monitoring report (July-December 1997): U.S. Geological Survey, Volcano Hazards Program.
Hill, David P., 1998, Long Valley Caldera monitoring report (October- December 1998): U.S. Geological Survey, Volcano Hazards Program.
Geologic Background. The large 17 x 32 km Long Valley caldera east of the central Sierra Nevada Range formed as a result of the voluminous Bishop Tuff eruption about 760,000 years ago. Resurgent doming in the central part of the caldera occurred shortly afterwards, followed by rhyolitic eruptions from the caldera moat and the eruption of rhyodacite from outer ring fracture vents, ending about 50,000 years ago. During early resurgent doming the caldera was filled with a large lake that left strandlines on the caldera walls and the resurgent dome island; the lake eventually drained through the Owens River Gorge. The caldera remains thermally active, with many hot springs and fumaroles, and has had significant deformation, seismicity, and other unrest in recent years. The late-Pleistocene to Holocene Inyo Craters cut the NW topographic rim of the caldera, and along with Mammoth Mountain on the SW topographic rim, are west of the structural caldera and are chemically and tectonically distinct from the Long Valley magmatic system.
Information Contacts: David Hill, U.S. Geological Survey, MS 977, 345 Middlefield Rd., Menlo Park, CA 94025 USA (URL: https://volcanoes.usgs.gov/observatories/calvo/).
Manam (Papua New Guinea) — June 1999 Cite this Report
Manam
Papua New Guinea
4.08°S, 145.037°E; summit elev. 1807 m
All times are local (unless otherwise noted)
Ashfalls and infrequent explosions
Mild to weak eruptive activity from Main Crater continued in May and June. During May there were small to moderate pale gray ash emissions. Ash clouds then rose 500-600 m above the summit before being blown NW with resulting light ashfall on 1, 22, 26-27, and 31 May. A slight wind change on 15 and 25 May caused the ash clouds to drift SW and the ashfall to move downwind. There were no noises or night glow observed in May. A weak, steady glow was visible between 2 and 5 May.
Although Southern Crater was generally quiet with only thin white emissions, a small explosion took place on 10 June. A weak discharge of lava fragments accompanied loud noises that lasted only a short time. Later, on 26 June, Main Crater vented gray-brown ash clouds resulting in ash fall over some parts of the island.
During May-June, seismicity remained low. Evidence for deformation was absent at the water-tube tiltmeter located at Tabele Observatory, 4 km from the summit on the SW flank.
Inhabitants of the 10-km-wide island of Manam reside on one of Papua New Guinea's most active volcanoes. Four large radial valleys extend from the unvegetated summit of the conical stratovolcano to its lower flanks. These "avalanche valleys," regularly spaced 90 degrees apart, channel lava flows and pyroclastic avalanches that have sometimes reached the coast. Five satellitic centers are located near the island's shoreline. Two summit craters are present and both are active, although most historical eruptions have originated from the southern crater and drained into the SE avalanche valley. Frequent historical eruptions have been recorded since 1616.
More recent activity began in December 1956 and lasted through January 1966. Lava flows and a nuee ardente from the South Crater occurred in June and December 1974, and intermittent moderate explosive activity has continued into 1993, with peaks of activity in 1982 and 1984.
Geologic Background. The 10-km-wide island of Manam, lying 13 km off the northern coast of mainland Papua New Guinea, is one of the country's most active volcanoes. Four large radial valleys extend from the unvegetated summit of the conical basaltic-andesitic stratovolcano to its lower flanks. These valleys channel lava flows and pyroclastic avalanches that have sometimes reached the coast. Five small satellitic centers are located near the island's shoreline on the northern, southern, and western sides. Two summit craters are present; both are active, although most observed eruptions have originated from the southern crater, concentrating eruptive products during much of the past century into the SE valley. Frequent eruptions, typically of mild-to-moderate scale, have been recorded since 1616. Occasional larger eruptions have produced pyroclastic flows and lava flows that reached flat-lying coastal areas and entered the sea, sometimes impacting populated areas.
Information Contacts: Ben Talai, Rabaul Volcano Observatory (RVO), P.O. Box 386, Rabaul, Papua New Guinea.
Mayon
Philippines
13.257°N, 123.685°E; summit elev. 2462 m
All times are local (unless otherwise noted)
Explosion on 22 June sends a plume to ~10-12 km altitude
At 1658 on 22 June Mayon emitted an ash column that rose 7-10 km above the vent (figure 8). The emission was recorded by the seismic network of the Philippines Institute of Volcanology and Seismology (PHIVOLCS) as an explosion that lasted for 10 minutes. No volcanic earthquakes nor other visible signs of abnormal activity were observed before the explosion. During May, however, low-frequency volcanic earthquakes had been recorded intermittently, accompanied by faint crater glow.
The explosion represented an isolated event as activity immediately declined to typical incidents of weak steaming without measurable seismicity. Faint glow was seen the next day at the summit crater. An aerial survey noted a new explosion pit at the summit; the small diameter pit was later described as a deep hole lined with sulfur deposits (figure 9). The presence of sulfur suggested that lava had not yet ascended to the surface.
Beginning at 0700 on 25 June there was a slight increase in seismicity and SO2 emission. The COSPEC measured an SO2 flux of 4,800 tons/day, compared with 4,200 tons/day the previous day. SO2 fluxes normally average 500 tons/day. A short interval of high-frequency tremor was also recorded.
Tremor, light steaming, low-frequency volcanic earthquakes, and elevated SO2 fluxes continued for several days. Also, deformation surveys conducted with laser-ranging EDM equipment indicated sustained inflation on the SE slope.
PHIVOLCS maintained an alert status of "Level 1," advising the public not to venture within 6 km of the summit area (figure 10). In particular, residents were advised to avoid the Bonga pyroclastic fan, an area on the SE side of the volcano that contains a deep canyon and lies directly below the crater rim notch. This fan was the site of most of the fatalities in the 1993 eruption and is considered the area most vulnerable to future pyroclastic flows.
Reference. Philippine Institute of Volcanology and Seismology (PHIVOLCS), 1999, 1999 Mayon permanent danger & high susceptibility areas (map), URL: http://www.philonline.com/~seismo/Volcanoes/Mayon/MayonHazMaps.htm.
Geologic Background. Symmetrical Mayon, which rises above the Albay Gulf NW of Legazpi City, is the most active volcano of the Philippines. The steep upper slopes are capped by a small summit crater. Recorded eruptions since 1616 CE range from Strombolian to basaltic Plinian, with cyclical activity beginning with basaltic eruptions, followed by longer periods of andesitic lava flows. Eruptions occur predominately from the central conduit and have also produced lava flows that travel far down the flanks. Pyroclastic density currents and mudflows have commonly swept down many of the approximately 40 ravines that radiate from the summit and have often damaged populated lowland areas. A violent eruption in 1814 killed more than 1,200 people and devastated several towns.
Information Contacts: Raymundo S. Punongbayan and Ronnie Torres, Philippine Institute of Volcanology and Seismology (PHIVOLCS), C.P. Garcia St. Diliman, Quezon City Philippines (URL: http://www.phivolcs.dost.gov.ph/).
Momotombo (Nicaragua) — June 1999 Cite this Report
Momotombo
Nicaragua
12.423°N, 86.539°W; summit elev. 1270 m
All times are local (unless otherwise noted)
Fumarole temperatures remain high in April 1999
Fumarole temperatures have been rising on Momotombo since 1996. An April 1996 summit visit reported that temperatures were unchanged over the past year (BGVN 21:04), but by November of that year the temperatures had begun to fluctuate (BGVN 21:11). Fumarole temperatures in November 1996 registered between 130 and 677°C, higher than those recorded in October but lower than those in April. The flux was attributed to seasonal change; an intense rainy season and associated erosion accounted for the October lows. Temperatures had increased again by July 1997 to 232-773°C (BGVN 22:07).
In October 1997 higher than normal fumarole temperatures were attributed to arid conditions. During a 1 September visit to the summit area, fumarole temperatures were measured at their usual points and found escalated. The maximum temperature was 740°C. Because the temperature increase coincided with a dry spell, the heightened fumarolic activity was not deemed alarming.
Elevated temperatures were also reported in March 1998 (BGVN 23:03). Measurements during a 28 February visit revealed higher-than-normal fumarolic temperatures in the summit area. The high temperatures were again associated with a recent period of aridity, during which time fumarolic activity increased. Temperatures ranged from 318 to 748°C.
On 24 April 1999 the summit area was visited and temperatures again found inflated in the five areas of fumarolic activity. The maximum temperatures were, in the south area of the crater, 725°C and, in the north, 550°C. Significant changes in the crater morphology were noted and attributed to the strong erosion induced by Hurricane Mitch in October 1998.
Geologic Background. Momotombo is a young stratovolcano that rises prominently above the NW shore of Lake Managua, forming one of Nicaragua's most familiar landmarks. Momotombo began growing about 4500 years ago at the SE end of the Marrabios Range and consists of a somma from an older edifice that is surmounted by a symmetrical younger cone with a 150 x 250 m wide summit crater. Young lava flows extend down the NW flank into the 4-km-wide Monte Galán caldera. The youthful cone of Momotombito forms an island offshore in Lake Managua. Momotombo has a long record of Strombolian eruptions, punctuated by occasional stronger explosive activity. The latest eruption, in 1905, produced a lava flow that traveled from the summit to the lower NE base. A small black plume was seen above the crater after a 10 April 1996 earthquake, but later observations noted no significant changes in the crater. A major geothermal field is located on the south flank.
Information Contacts: Alain Creusot, Instituto Nicaraguense de Energía, Managua, Nicaragua.
Monowai (New Zealand) — June 1999 Cite this Report
Monowai
New Zealand
25.887°S, 177.188°W; summit elev. -132 m
All times are local (unless otherwise noted)
Strong acoustic crisis recorded during 5-10 June
The French Polynesian Seismic Network recorded a strong acoustic crisis originating from Kermadec, very near Monowai Seamount, during 5-10 June. The acoustic crisis started at 0300 on 6 June (1500 on 5 June GMT) and ended at 0100 on 11 June (1300 on 10 June GMT) with no precursory activity (figure 7). Two distinct episodes were separated by a 4-hour period of inactivity. The network recorded more than 394 strong acoustic T-waves; the strongest took place at 1115 on 6 June (2315 on 5 June GMT). The first signal received on 6 June began with an impulse and lasted more than 12 minutes. Many of them had explosive characteristics, short and strong. The activity stopped with a small explosive T-wave. No tremor was recorded.
Monowai Seamount lies midway between the Kermadec and Tonga Islands, ~1,400 km NE of New Zealand. The adjacent trench is much shallower (~4 km) compared with the Tonga and Kermadec trenches (9-11 km deep). There was a T-wave swarm in November 1995 (BGVN 20:11/12). Other noteworthy recent activity at Monowai included a possible eruption in 1944, and about seven documented eruptions during 1977-90 (BGVN 16:03).
Geologic Background. Monowai, also known as Orion seamount, is a basaltic stratovolcano that rises from a depth of about 1,500 to within 100 m of the ocean surface about halfway between the Kermadec and Tonga island groups, at the southern end of the Tonga Ridge. Small cones occur on the N and W flanks, and an 8.5 x 11 km submarine caldera with a depth of more than 1,500 m lies to the NNE. Numerous eruptions have been identified using submarine acoustic signals since it was first recognized as a volcano in 1977. A shoal that had been reported in 1944 may have been a pumice raft or water disturbance due to degassing. Surface observations have included water discoloration, vigorous gas bubbling, and areas of upwelling water, sometimes accompanied by rumbling noises. It was named for one of the New Zealand Navy bathymetric survey ships that documented its morphology.
Information Contacts: Olivier Hyvernaud, Laboratoire de Géophysique, BP 640 Pamatai, Tahiti, French Polynesia.
Cerro Negro (Nicaragua) — June 1999 Cite this Report
Cerro Negro
Nicaragua
12.506°N, 86.702°W; summit elev. 728 m
All times are local (unless otherwise noted)
New map of changes to crater after 1992 and 1995 eruptions
A team from Southwest Research Institute and Arizona State University visited Cerro Negro during 24 February-2 March. Their objectives were to map geomorphologic changes to the cone resulting from the 1995 eruption, estimate the respirable fraction of ash suspended above the 1992 and 1995 tephra blankets, and perform stratigraphic studies of tephra deposits.
A topographic map was prepared from 8,700 GPS measurements collected on and around the cinder cone (figures 12 and 13). Precision of individual measurements was within 1 cm and the survey had gross precision within 0.5 m.
The cinder cone's morphology was changed significantly by the 1992 and 1995 eruptions. During the 1992 eruption the crater widened and now has an average diameter of 340 m. It was widest, 418 m, along its NE-SW axis because of a broad shoulder of tephra deposited on the SW side of the cone (during the 1992 and 1995 eruptions prevailing wind directions were from the NE). The diameter of the base of the cone was 945 m, measured between Cerro La Mula Ridge to the N of the cone and the Cristo Rey vent on the S. Data derived from air photos taken in 1986 revealed that this basal diameter had not changed substantially since then despite the 1992 and 1995 eruptions. The high point on Cerro Negro was measured at 728 m elevation, giving the cone a height of 258 m when measured relative to a topographic break in slope at the cone base, just west of Cristo Rey vent.
A small pyroclastic cone within the 1992 crater was created during the 1995 eruption. This new cone had a rim diameter of 124-130 m. Its crater depth was 94 m from the W rim (corresponding to the high point on Cerro Negro) and 44 m from the low point on the E side. Lava flows, emitted from at least two boccas on the 1992 crater floor during the 1995 activity, breached the N side of the 1992 cone. Because of this breach the low point on the 1992 crater rim was 9 m below the average rim elevation of 625 m.
No substantial degassing or other signs of volcanic unrest were observed during the seven days that the team was on-site and the area seemed unchanged since the cessation of the 1995 eruption. No thermal activity was observed on the 1995 lava flows, even on flow levees thicker than 3 m. These lava flows appeared to have cooled substantially as a result of the more than 3 m rainfall the region received during Hurricane Mitch in the Fall of 1998. Two fumarole areas were active; one fumarole area on the E of the crater has likely persisted since before the 1992 eruption. These fumaroles were easily accessible due to the breaching of the N crater rim by the 1992 lava flows. A new fumarole area had been established high on the W rim of the 1995 pyroclastic cone, just below the high point on Cerro Negro. Sulfur, anhydrite, and halite were deposited in these areas. Low-temperature fumaroles (<100°C) were found along arcuate fractures that paralleled the 1992 cone rim. These fractures were most prominent on the S side of the cone where they were faulted with 0.1-1.0 m displacements, down toward the outer cone flank and up toward the crater, because of slumping on the outer flank. They were radial on the SW of the cone, where the outer cone slope was buttressed by 1992 and 1995 tephra accumulations. Similar fractures and small faults also occurred on the NW rim and around the 1995 pyroclastic cone. Low-temperature fumaroles were also found on the southernmost 1995 bocca and a small mound within the 1992 crater. Fumaroles and steaming ground persisted on Cerro La Mula Ridge.
Crater fumarole measurements. The temperature of crater fumaroles has been measured during visits by Alain Creusot since 1995 (BGVN 21:11, 21:12, and 23:03). From November 1995, when a significant eruption took place, to October 1996, fumarole temperatures were as high as 700°C. On 27 November 1996, a visit to the crater found that fumarole temperatures had generally decreased by 80-100°C and the maximum temperature was only 630°C. On 23 December 1996 the maximum fumarole temperature was only 606°C. An additional decrease of fumarole temperatures was noted on a 5 September 1997 visit; the maximum temperature measured was only 405°C (previously unreported). The highest temperature found on 14 February 1998 was 340°C.
References. Hill and others, 1998, Eruptions of Cerro Negro volcano, Nicaragua, and risk assessment for future eruptions, Geological Society of America, Bulletin, v. 110, p. 1231-1241.
Connor and others, 1996, Soil 222Rn pulse during the initial phase of the June-August 1995 eruption of Cerro Negro, Nicaragua, Journal of Volcanology and Geothermal Research, vol. 73, p.119-127.
Geologic Background. Nicaragua's youngest volcano, Cerro Negro, was created following an eruption that began in April 1850 about 2 km NW of the summit of Las Pilas volcano. It is the largest, southernmost, and most recent of a group of four youthful cinder cones constructed along a NNW-SSE-trending line in the central Marrabios Range. Strombolian-to-subplinian eruptions at intervals of a few years to several decades have constructed a roughly 250-m-high basaltic cone and an associated lava field constrained by topography to extend primarily NE and SW. Cone and crater morphology have varied significantly during its short eruptive history. Although it lies in a relatively unpopulated area, occasional heavy ashfalls have damaged crops and buildings.
Information Contacts: Chuck Connor, Peter La Femina, Brittain Hill, James Weldy, Center for Nuclear Waste Regulatory Analyses, Southwest Research Institute, 6220 Culebra Rd, San Antonio, TX, 78238-5166; Kurt Roggensack and Berry Cameron, Department of Geological Sciences, Arizona State University, Tempe, AZ; Alain Creusot, Instituto Nicaraguense de Energía, Managua, Nicaragua.
Poas
Costa Rica
10.2°N, 84.233°W; summit elev. 2697 m
All times are local (unless otherwise noted)
Strong drop in tremor duration and mid-frequency earthquakes in early 1998
Seismicity registered at station POA2, located 2.8 km SW of the active crater, has declined since early 1998 (figures 71 and 72). Since then, gas columns continued to reach altitudes between 500 and 600 m above the floor of the crater as they had during the interval of greater seismicity. The pyroclastic cone remained the focus of fumarolic activity. The crater's W, E, and SE walls continued to slip into the lake. The lake maintained a constant bubbling on its S and SE edges. The active lake's color varied considerably; for example, at various times during April 1999, the ~32°C lake water appeared green, turquoise, or light blue. In November 1998, the lake appeared greenish turquoise and had a temperature of 29°C.
Geologic Background. The broad vegetated edifice of Poás, one of the most active volcanoes of Costa Rica, contains three craters along a N-S line. The frequently visited multi-hued summit crater lakes of the basaltic-to-dacitic volcano are easily accessible by vehicle from the nearby capital city of San José. A N-S-trending fissure cutting the complex stratovolcano extends to the lower N flank, where it has produced the Congo stratovolcano and several lake-filled maars. The southernmost of the two summit crater lakes, Botos, last erupted about 7,500 years ago. The more prominent geothermally heated northern lake, Laguna Caliente, is one of the world's most acidic natural lakes, with a pH of near zero. It has been the site of frequent phreatic and phreatomagmatic eruptions since an eruption was reported in 1828. Eruptions often include geyser-like ejections of crater-lake water.
Information Contacts: E. Fernandez, V. Barboza, E. Duarte, R. Saenz, E. Malavassi, M. Martinez, and R. Van der Laat, T. Marino, and E. Hernandez, Observatorio Vulcanologico y Sismologico de Costa Rica, Universidad Nacional (OVSICORI-UNA), Apartado 86-3000, Heredia, Costa Rica; Wendy Perez Fernandez, Seccion de Seismologia, Vulcanologia y Exploracion Geofisica, Escuela Centroamericana de Geologia, Universidad de Costa Rica, POB 35-2060, San Jose, Costa Rica.
Popocatepetl (Mexico) — June 1999 Cite this Report
Popocatepetl
Mexico
19.023°N, 98.622°W; summit elev. 5393 m
All times are local (unless otherwise noted)
Small exhalations, minor fumarolic activity, and variable seismicity
The low level of activity displayed in May continued, with small exhalations and minor fumarolic emissions until 12 June. However, seismic activity increased on 12 June and continued for the next 10 or 11 days. At 1209 and 1600 on 12 June, two M 2.2 volcano-tectonic events occurred under the crater and SW of the volcano. At 1542 on 15 June, a large earthquake (M 6.7) centered between the states of Puebla and Oaxaca did not affect the volcano. Bad weather had obstructed visibility earlier, but that afternoon observers saw small fumarolic emissions of steam and gas.
Seismicity increased on 16 June as several volcano-tectonic events were recorded in the morning, most with magnitudes between 2.5 and 3 and two larger ones with M >3. These events were located 4-7 km below the summit crater. The last event occurred at 0206 on 17 June. This seismicity did not produce any important external manifestations except a small exhalation on the morning of 17 June accompanied by a light ash puff blown to the W.
On 21 June two earthquakes in Guerrero did not effect the volcano. No other events were reported for the month and by 30 June the radius of restricted access was reduced to 5 km from the 7 km previously recommended.
Geologic Background. Volcán Popocatépetl, whose name is the Aztec word for smoking mountain, rises 70 km SE of Mexico City to form North America's 2nd-highest volcano. The glacier-clad stratovolcano contains a steep-walled, 400 x 600 m wide crater. The generally symmetrical volcano is modified by the sharp-peaked Ventorrillo on the NW, a remnant of an earlier volcano. At least three previous major cones were destroyed by gravitational failure during the Pleistocene, producing massive debris-avalanche deposits covering broad areas to the south. The modern volcano was constructed south of the late-Pleistocene to Holocene El Fraile cone. Three major Plinian eruptions, the most recent of which took place about 800 CE, have occurred since the mid-Holocene, accompanied by pyroclastic flows and voluminous lahars that swept basins below the volcano. Frequent historical eruptions, first recorded in Aztec codices, have occurred since Pre-Columbian time.
Information Contacts: Servando De la Cruz-Reyna1,2, Roberto Quaas1,2; Carlos Valdés G.2, and Alicia Martinez Bringas1. 1-Centro Nacional de Prevencion de Desastres (CENAPRED), Delfin Madrigal 665, Col. Pedregal de Santo Domingo, Coyoacán, 04360, México D.F. (URL: https://www.gob.mx/cenapred/); 2-Instituto de Geofisica, UNAM, Coyoacán 04510, México D.F., México.
Rabaul (Papua New Guinea) — June 1999 Cite this Report
Rabaul
Papua New Guinea
4.2459°S, 152.1937°E; summit elev. 688 m
All times are local (unless otherwise noted)
The active intracaldera cone (Tavurvur) continues mild emissions through June
The mild Vulcanian activity continuing since November 1998 continued through June 1999. With time, the eruption's from Rabaul's Tavurvur cone appeared to be progressively waning in intensity. Still, during May and June several moderate explosions occurred.
Some May and June explosions sent ash clouds 1 km above the summit. The ash clouds drifted NW, some resulted in light ashfall over Rabaul Town. The mild ash-bearing outbursts in June occurred with very long intervals (sometimes 24 hours) between them. Notable outbursts took place on 9 days during the month (3, 5, 6, 9, 13, 15, 16, 17, 19, 23 and 25 June); although many only lasted 2-10 minutes, the last one of the set prevailed for 25 minutes. Typical plumes rose to 500 m high; SE winds typically blew these plumes and fine ash fell, including some on Rabaul Town.
In accord with these visual observations, both deformation and caldera seismicity remained low. Although during May, April, and March there had been 150, 142, and 120 low-frequency earthquakes, respectively, during June there occurred only 38 such earthquakes. The two located earthquakes appeared to the NE of the main ring fault. Anomalously, during the past 2 years there has been an absence of recorded high-frequency earthquakes on the ring fault. Instead, located earthquakes have consistently struck NE of the ring-fault system.
On the 16th a regional earthquake directly E of Wide Bay triggered a 31-cm tsunami. Since then, more than 20 regional events have occurred within a 20 km radius of the initial quake.
Geologic Background. The low-lying Rabaul caldera on the tip of the Gazelle Peninsula at the NE end of New Britain forms a broad sheltered harbor utilized by what was the island's largest city prior to a major eruption in 1994. The outer flanks of the asymmetrical shield volcano are formed by thick pyroclastic-flow deposits. The 8 x 14 km caldera is widely breached on the east, where its floor is flooded by Blanche Bay and was formed about 1,400 years ago. An earlier caldera-forming eruption about 7,100 years ago is thought to have originated from Tavui caldera, offshore to the north. Three small stratovolcanoes lie outside the N and NE caldera rims. Post-caldera eruptions built basaltic-to-dacitic pyroclastic cones on the caldera floor near the NE and W caldera walls. Several of these, including Vulcan cone, which was formed during a large eruption in 1878, have produced major explosive activity during historical time. A powerful explosive eruption in 1994 occurred simultaneously from Vulcan and Tavurvur volcanoes and forced the temporary abandonment of Rabaul city.
Information Contacts: Ben Talai, Rabaul Volcano Observatory (RVO), P.O. Box 386, Rabaul, Papua New Guinea.
Rincon de la Vieja (Costa Rica) — June 1999 Cite this Report
Rincon de la Vieja
Costa Rica
10.83°N, 85.324°W; summit elev. 1916 m
All times are local (unless otherwise noted)
1.5-year record of seismicity and eruptions through May 1999
Seismicity during 17 months through April 1999 (figure 14) showed pronounced peaks at over 100 events/month in one parameter, microseisms, during September- October 1998. Otherwise, relative quiet prevailed; microseisms, high-frequency, and low-frequency events all generally took place fewer than 20 times/month. Tremor was nearly absent during roughly half the months of 1998 and in 1999 during January, February, and April. Months with 2-10 hours of tremor included February, August, September 1998 and March and May 1999.
In March, fumarolic activity continued on the NE, S, and SW walls of the main crater. The lake had a gray color and contained suspended particles of sulfur. The temperature of the lake was 35.5°C.
During May, the main crater's N-flank fumarolic activity fluctuated in temperature between 68°C and 92°C. The lake in the crater was light blue with particles of sulfur, and a temperature of 37°C. On the S and N walls, there were columns of gases that irritated eyes and skin.
Geologic Background. Rincón de la Vieja, the largest volcano in NW Costa Rica, is a remote volcanic complex in the Guanacaste Range. The volcano consists of an elongated, arcuate NW-SE-trending ridge constructed within the 15-km-wide early Pleistocene Guachipelín caldera, whose rim is exposed on the south side. Sometimes known as the "Colossus of Guanacaste," it has an estimated volume of 130 km3 and contains at least nine major eruptive centers. Activity has migrated to the SE, where the youngest-looking craters are located. The twin cone of Santa María volcano, the highest peak of the complex, is located at the eastern end of a smaller, 5-km-wide caldera and has a 500-m-wide crater. A Plinian eruption producing the 0.25 km3 Río Blanca tephra about 3,500 years ago was the last major magmatic eruption. All subsequent eruptions, including numerous historical eruptions possibly dating back to the 16th century, have been from the prominent active crater containing a 500-m-wide acid lake located ENE of Von Seebach crater.
Information Contacts: E. Fernandez, V. Barboza, E. Duarte, R. Sáenz, E. Malavassi, M. Martinez, and R. Van der Laat, T. Marino, and E. Hernandez, Observatorio Vulcanológico y Sismológico de Costa Rica, Universidad Nacional (OVSICORI-UNA), Apartado 86-3000, Heredia, Costa Rica; Wendy Perez Fernandez, Seccion de Seismologia, Vulcanologia y Exploracion Geofisica, Escuela Centroamericana de Geologia, Universidad de Costa Rica, POB 35-2060, San José, Costa Rica.
Stromboli
Italy
38.789°N, 15.213°E; summit elev. 924 m
All times are local (unless otherwise noted)
Vents in summit craters still active; variable seismicity
After the strong summit explosions of 23 August and 8 September 1998 (BGVN 23:10), at least two others followed during 1998: the first at 1805 on 24 November, the second at 0245 on 28 December. Both were reported by Pierre Cottens from the village of Stromboli, with pyroclasts clearly seen from the village, reaching estimated heights of at least 700 m over the craters in November and 500 m in December, but with little ashfall over the village. Technical problems kept the seismic station maintained by the University of Udine out of service through the end of January 1999.
Seismicity during February-June 1999. The seismic station was restored on 1 February 1999, and in the first part of the month the daily number of events declined from 130 to 50-80/day (figure 58). Saturating events showed a similar trend. The second half of February was characterized by an increasing number of events, reaching a maximum of 275 events on 2 March. During this period the tremor intensity showed fluctuations around an average of 3.6 V s, with an isolated peak on 23 February.
During 12-20 March there was a general decrease in activity, with a minimum number of 52 seismic events recorded on 16 March, and a minimum tremor intensity of 1.8 V s on 15 March. The gain in activity was observed first in the tremor intensity, with a local maximum of 4.7 V s on 29 March, then in the number of events, which reached a high of 208 events on 30 March.
A sharp decline was observed on 7 April both in the tremor intensity (from 3.0 to 1.2) and in the number of events (from 180 to 76). Saturating events also stopped, after an average of five saturated events during the three preceding days. Seismic activity increased slightly during the following two days, and on 9 April Cottens reported two strong blasts at about 0300, separated by a few minutes. Bad weather did not allow observation of the summit area, but the noise was similar to that produced by the strong eruptions of 1998. The seismic station recorded an event with greater than usual energy, which may have been from one of the explosions. Another decrease of activity was observed the day after the explosion, with the number of daily events falling to 83 and the tremor intensity to 1.9. The following days were characterized by a slow increase in seismicity, but activity remained low to moderate for the rest of the month.
After another gap in the seismic acquisition, the activity was still low after mid-May 1999, with <100 events/day between 20-24 May. The last week of May showed a rise in the number of events, with a maximum of 183 events on 26 May. A relatively high number of saturating events was also observed, starting on 23 May and peaking on 27 May (21 saturating events) and 30 May (23 saturating events). Another minimum in the number of events (66), number of saturating events (0) and tremor intensity (1.6) was recorded on 5-6 June 1999. During several days on the island in the second half of June, seismic activity remained at low to moderate levels, with a short duration increase in the tremor intensity on 21-22 June.
Observations during 17-20 June 1999. Observations during 17-20 June allowed mapping of the crater terrace (figure 59). Observations were made over two 3-4 hour periods: 2109-0100 (18-19 June), and 2030-2320 (19 June).
Crater 1 contained four active vents (figure 59). During the first observation period, the vicinity of Vent 1/2 was the source of persistent widespread glow; but no ejecta was observed. Vent 1/1, however, was the source of glow and near-persistent low-energy activity, characterized by repeated phases of ejecta emission separated by periods of little or no emissions. Each phase consisted of numerous pulses of ejecta. During each pulse a few (typically 1-10) bombs were ejected <10 m above the crater rim, with pulses every few seconds. Around 11 periods of this persistent, pulsing emission were observed. Each period lasted 2-29 minutes and was separated by intervals of 3-28 minutes with occasional bomb emissions. This pattern at Vent 1/1 was broken by 16 high-energy events during which explosions sent ejecta ~100 m high.
Vent 1/3 produced high-energy events only, with 18 observed during the first period. High energy events from vents 1/1, 1/3, and 1/4 were synchronized. It was difficult to distinguish eruptions from 1/4 and 1/1 from the viewing angle, so eruptions from these two vents may have been occasionally assigned to the wrong vent; the eruption counts for 1/1 and 1/4 together were therefore combined. Vents 1/3, 1/1, and/or 1/4 erupted together on 11 occasions. On these occasions ejection from each vent was either synchronous or closely linked. During such synchronized events there appeared to be no set order in terms of which of the three vents started erupting and which followed. Vents 1/1 (and/or 1/4) and 1/3 erupted on their own on 5 and 7 occasions, respectively.
As in the first observation period, glow persisted above Vent 1/2 throughout the second period. Unlike the previous evening, however, ejecta was observed from Vent 1/2, where activity followed the style observed at Vent 1/1 during the previous evening. Around eight periods of low-energy but persistent pulsing activity were observed. These lasted 3-33 minutes and were separated by 2-23-minute-long periods of apparently no emission. This pattern of activity from Vent 1/2 was interrupted by five high-energy events lasting 4-6 seconds.
Vent 1/1 issued regular gas puffs (typically one puff every 1-2 seconds), but the frequency of ejecta emission had declined, with the periods of persistent, pulsing activity observed the previous evening replaced by discrete emissions. Ejections were observed from 1/1 on nine occasions, where only one event was of the high-energy type, and the remainder were short (<40-second-long) periods during which 1-10 bombs were ejected <10 m above the rim in pulses. As in the previous period, Vent 1/3 was characterized by high-energy events only. Seven occurred during the second period, of which three were synchronous with high energy events from 1/2 or 1/1.
Although no activity or glow was observed from Crater 2, a hornito (figure 59) had grown in the vicinity of the low cone observed during May 1997 (BGVN 22:05). The area surrounding Crater 2 no longer seemed to be marked by a crater-like feature. The subsidence bowl observed SE of Crater 2 in May 1997 had developed into a deep, funnel-shaped pit, which was the source of faint glow. On a previous map (BGVN 22:05), the vent numbering indicated that this area was part of Crater 2; this interpretation is questionable and this feature could be considered a crater by itself now. On figure 59 we denote this vent as 3/3 (therefore part of Crater 3) in order to allow for easy comparison with older maps of the crater terrace (e.g., BGVN 22:03).
Crater 3 was the location of two additional active vents (figure 59). Glow was observed from vent 3/1 only after an eruption at 2317 on 18 June. Eruptions from Crater 3 were high-energy only, and typically larger (in terms of volume and height, attaining heights of 150 ± 50 m) and longer (lasting 8-23 seconds) than those from Crater 1. Nine and eleven eruptions, respectively, occurred from Crater 3 during the two observation periods.
During our descent in the early hours of 19 June there was a rock fall/slide at about 0200 lasting 1-2 minutes. Boulders from the cliffs on the N edge of the Rina Grande rolled and bounced down the Rina Grande. Owing to the steepness of this flank, once in motion the rocks probably did not stop until they reached the sea in the direction of Forgia Vecchia, crossing the route that descends the Rina Grande ash slope within seconds. Such events pose a very serious hazard to anyone using this route, especially at night.
Geologic Background. Spectacular incandescent nighttime explosions at Stromboli have long attracted visitors to the "Lighthouse of the Mediterranean" in the NE Aeolian Islands. This volcano has lent its name to the frequent mild explosive activity that has characterized its eruptions throughout much of historical time. The small island is the emergent summit of a volcano that grew in two main eruptive cycles, the last of which formed the western portion of the island. The Neostromboli eruptive period took place between about 13,000 and 5,000 years ago. The active summit vents are located at the head of the Sciara del Fuoco, a prominent scarp that formed about 5,000 years ago due to a series of slope failures which extends to below sea level. The modern volcano has been constructed within this scarp, which funnels pyroclastic ejecta and lava flows to the NW. Essentially continuous mild Strombolian explosions, sometimes accompanied by lava flows, have been recorded for more than a millennium.
Information Contacts: Andy Harris and Dawn Pirie, Department of Earth Sciences, The Open University, Milton Keynes, MK7 6AA, United Kingdom; Sarah Sherman, 41-485D Kalanianaole Hwy., Waimanolo, HI 96795 USA; Roberto Carniel, Dipartimento di Georisorse e Territorio, Università di Udine, Via Cotonificio, 114, I-33100 Udine (URL: http://www.swisseduc.ch/stromboli/).
Turrialba (Costa Rica) — June 1999 Cite this Report
Turrialba
Costa Rica
10.025°N, 83.767°W; summit elev. 3340 m
All times are local (unless otherwise noted)
A 4-fold increase in microseisms during December-April 1999
During the 17 months ending in May 1999, microseisms varied from ~30 to ~180 a month (figure 5). A 4-fold progressive increase began after December 1998.
In March 1999, the main crater's fumaroles were visible on the NE, N, NW, E and SW walls. Escaping gases appeared constant and had a temperature of 89°C. During March, the seismographic station VTU, located 0.5 km NE of the active crater registered a total of 252 earthquakes. Of those 81 had high frequency, with S-P duration of less than 1.5 seconds and frequencies greater than 3.0 Hz. The 166 microseisms registered had amplitudes under 10 mm, short durations, and frequencies between 2.1 and 3.0 Hz. An earthquake registered at 1846 on 7 March, with a Richter magnitude of 2.3, a depth of 7 km, and an epicenter 4 km NE of the main crater.
During April, the station VTU registered 287 earthquakes. Of those, 105 were of high frequency (with S-P of less than 1.5 seconds and frequencies above 3.0 Hz), and 4 were of low frequency. The 178 microseisms registered were of short duration; their dominant frequencies were between 2.1 and 3.0 Hz.
During May, a total of 309 events were recorded, of which 120 were type AB with S-P less than 1.5 seconds and frequencies less than 3.0 Hz. There were 3 low-frequency events. The 186 microseisms registered had amplitudes under 10 mm.
Geologic Background. Turrialba, the easternmost of Costa Rica's Holocene volcanoes, is a large vegetated basaltic-to-dacitic stratovolcano located across a broad saddle NE of Irazú volcano overlooking the city of Cartago. The massive edifice covers an area of 500 km2. Three well-defined craters occur at the upper SW end of a broad 800 x 2200 m summit depression that is breached to the NE. Most activity originated from the summit vent complex, but two pyroclastic cones are located on the SW flank. Five major explosive eruptions have occurred during the past 3500 years. A series of explosive eruptions during the 19th century were sometimes accompanied by pyroclastic flows. Fumarolic activity continues at the central and SW summit craters.
Information Contacts: E. Fernandez, V. Barboza, E. Duarte, R. Saenz, E. Malavassi, M. Martinez, and R. Van der Laat, T. Marino, and E. Hernandez, Observatorio Vulcanologico y Sismologico de Costa Rica, Universidad Nacional (OVSICORI-UNA), Apartado 86-3000, Heredia, Costa Rica; Wendy Perez Fernandez, Seccion de Seismologia, Vulcanologia y Exploracion Geofisica, Escuela Centroamericana de Geologia, Universidad de Costa Rica, POB 35-2060, San Jose, Costa Rica.
Whakaari/White Island (New Zealand) — June 1999 Cite this Report
Whakaari/White Island
New Zealand
37.52°S, 177.18°E; summit elev. 294 m
All times are local (unless otherwise noted)
Visit on 30 June reveals decreased activity
White Island was visited on 30 June by IGNS scientists who reported that no significant eruptive activity had occurred since the explosive activity in April (BGVN 24:04). PeeJay vent was inactive and the only significant emissions of steam and gas came from the vent that formed in early May (at a spot E of PeeJay vent).
As the group arrived on 30 June a weak white steam-and-gas plume was rising 500-700 m above the volcano and moving ENE (figure 43). The plume was being fed by emissions from within the 1978/90 Crater Complex; the new vent E of PeeJay was the plume's strongest contributing source. Most of the gas and steam emitted (at high velocity) from this vent was from an inclined orifice near the S side of the vent. Other prominent sources included fumaroles near the lakeshore and in the valley wall W of the lake. PeeJay vent was inactive and had been filled by sediment that formed a flat floor about 3 m below the vent's rim. Activity had stopped in late May or early June.
The light-green colored lake within Metra Crater had enlarged and flooded into the NNE embayments of this crater. There was no evidence of further explosive activity from Metra Crater. No strong ebullition or convection was observed in the lake.
Geologic Background. The uninhabited Whakaari/White Island is the 2 x 2.4 km emergent summit of a 16 x 18 km submarine volcano in the Bay of Plenty about 50 km offshore of North Island. The island consists of two overlapping andesitic-to-dacitic stratovolcanoes. The SE side of the crater is open at sea level, with the recent activity centered about 1 km from the shore close to the rear crater wall. Volckner Rocks, sea stacks that are remnants of a lava dome, lie 5 km NW. Descriptions of volcanism since 1826 have included intermittent moderate phreatic, phreatomagmatic, and Strombolian eruptions; activity there also forms a prominent part of Maori legends. The formation of many new vents during the 19th and 20th centuries caused rapid changes in crater floor topography. Collapse of the crater wall in 1914 produced a debris avalanche that buried buildings and workers at a sulfur-mining project. Explosive activity in December 2019 took place while tourists were present, resulting in many fatalities. The official government name Whakaari/White Island is a combination of the full Maori name of Te Puia o Whakaari ("The Dramatic Volcano") and White Island (referencing the constant steam plume) given by Captain James Cook in 1769.
Information Contacts: Brad Scott, Wairakei Research Centre, Institute of Geological and Nuclear Sciences (IGNS) Limited, Private Bag 2000, Wairakei, New Zealand (URL: http://www.gns.cri.nz/).