Recently Published Bulletin Reports
Manam (Papua New Guinea) Few ash plumes during November-December 2022
Krakatau (Indonesia) Strombolian activity and ash plumes during November 2022-April 2023
Stromboli (Italy) Strombolian explosions and lava flows continue during January-April 2023
Nishinoshima (Japan) Small ash plumes and fumarolic activity during November 2022 through April 2023
Karangetang (Indonesia) Lava flows, incandescent avalanches, and ash plumes during January-June 2023
Ahyi (United States) Intermittent hydroacoustic signals and discolored plumes during November 2022-June 2023
Kadovar (Papua New Guinea) An ash plume and weak thermal anomaly during May 2023
San Miguel (El Salvador) Small gas-and-ash explosions during March and May 2023
Semisopochnoi (United States) Occasional explosions, ash deposits, and gas-and-steam plumes during December 2022-May 2023
Ebeko (Russia) Continued explosions, ash plumes, and ashfall during October 2022-May 2023
Home Reef (Tonga) Discolored plumes continued during November 2022-April 2023
Ambae (Vanuatu) New lava flow, ash plumes, and sulfur dioxide plumes during February-May 2023
Manam (Papua New Guinea) — July 2023  Cite this Report
Manam
Papua New Guinea
4.08°S, 145.037°E; summit elev. 1807 m
All times are local (unless otherwise noted)
Few ash plumes during November-December 2022
Manam is a 10-km-wide island that consists of two active summit craters: the Main summit crater and the South summit crater and is located 13 km off the northern coast of mainland Papua New Guinea. Frequent mild-to-moderate eruptions have been recorded since 1616. The current eruption period began during June 2014 and has more recently been characterized by intermittent ash plumes and thermal activity (BGVN 47:11). This report updates activity that occurred from November 2022 through May 2023 based on information from the Darwin Volcanic Ash Advisory Center (VAAC) and various satellite data.
Ash plumes were reported during November and December 2022 by the Darwin VAAC. On 7 November an ash plume rose to 2.1 km altitude and drifted NE based on satellite images and weather models. On 14 November an ash plume rose to 2.1 km altitude and drifted W based on RVO webcam images. On 20 November ash plumes rose to 1.8 km altitude and drifted NW. On 26 December an ash plume rose to 3 km altitude and drifted S and SSE.
Intermittent sulfur dioxide plumes were detected using the TROPOMI instrument on the Sentinel-5P satellite, some of which exceeded at least two Dobson Units (DU) and drifted in different directions (figure 93). Occasional low-to-moderate power thermal anomalies were recorded by the MIROVA (Middle InfraRed Observation of Volcanic Activity) system; less than five anomalies were recorded each month during November 2022 through May 2023 (figure 94). Two thermal hotspots were detected by the MODVOLC thermal alerts system on 10 December 2022. On clear weather days, thermal activity was also captured in infrared satellite imagery in both the Main and South summit craters, accompanied by gas-and-steam emissions (figure 95).
Geologic Background. The 10-km-wide island of Manam, lying 13 km off the northern coast of mainland Papua New Guinea, is one of the country's most active volcanoes. Four large radial valleys extend from the unvegetated summit of the conical basaltic-andesitic stratovolcano to its lower flanks. These valleys channel lava flows and pyroclastic avalanches that have sometimes reached the coast. Five small satellitic centers are located near the island's shoreline on the northern, southern, and western sides. Two summit craters are present; both are active, although most observed eruptions have originated from the southern crater, concentrating eruptive products during much of the past century into the SE valley. Frequent eruptions, typically of mild-to-moderate scale, have been recorded since 1616. Occasional larger eruptions have produced pyroclastic flows and lava flows that reached flat-lying coastal areas and entered the sea, sometimes impacting populated areas.
Information Contacts: Rabaul Volcano Observatory (RVO), Geohazards Management Division, Department of Mineral Policy and Geohazards Management (DMPGM), PO Box 3386, Kokopo, East New Britain Province, Papua New Guinea; Darwin Volcanic Ash Advisory Centre (VAAC), Bureau of Meteorology, Northern Territory Regional Office, PO Box 40050, Casuarina, NT 0811, Australia (URL: http://www.bom.gov.au/info/vaac/); MIROVA (Middle InfraRed Observation of Volcanic Activity), a collaborative project between the Universities of Turin and Florence (Italy) supported by the Centre for Volcanic Risk of the Italian Civil Protection Department (URL: http://www.mirovaweb.it/); Hawai'i Institute of Geophysics and Planetology (HIGP) - MODVOLC Thermal Alerts System, School of Ocean and Earth Science and Technology (SOEST), Univ. of Hawai'i, 2525 Correa Road, Honolulu, HI 96822, USA (URL: http://modis.higp.hawaii.edu/); NASA Global Sulfur Dioxide Monitoring Page, Atmospheric Chemistry and Dynamics Laboratory, NASA Goddard Space Flight Center (NASA/GSFC), 8800 Greenbelt Road, Goddard, Maryland, USA (URL: https://so2.gsfc.nasa.gov/); Copernicus Browser, Copernicus Data Space Ecosystem, European Space Agency (URL: https://dataspace.copernicus.eu/browser/).
Krakatau (Indonesia) — July 2023 Cite this Report
Krakatau
Indonesia
6.1009°S, 105.4233°E; summit elev. 285 m
All times are local (unless otherwise noted)
Strombolian activity and ash plumes during November 2022-April 2023
Krakatau is located in the Sunda Strait between Java and Sumatra, Indonesia. Caldera collapse during the catastrophic 1883 eruption destroyed Danan and Perbuwatan cones and left only a remnant of Rakata. The post-collapse cone of Anak Krakatau (Child of Krakatau) was constructed within the 1883 caldera at a point between the former Danan and Perbuwatan cones; it has been the site of frequent eruptions since 1927. The current eruption period began in May 2021 and has recently consisted of explosions, ash plumes, and thermal activity (BGVN 47:11). This report covers activity during November 2022 through April 2023 based on information provided by the Indonesian Center for Volcanology and Geological Hazard Mitigation, referred to as Pusat Vulkanologi dan Mitigasi Bencana Geologi (PVMBG), MAGMA Indonesia, the Darwin Volcanic Ash Advisory Center (VAAC), and several sources of satellite data.
Activity was relatively low during November and December 2022. Daily white gas-and-steam plumes rose 25-100 m above the summit and drifted in different directions. Gray ash plumes rose 200 m above the summit and drifted NE at 1047 and at 2343 on 11 November. On 14 November at 0933 ash plumes rose 300 m above the summit and drifted E. An ash plume was reported at 0935 on 15 December that rose 100 m above the summit and drifted NE. An eruptive event at 1031 later that day generated an ash plume that rose 700 m above the summit and drifted NE. A gray ash plume at 1910 rose 100 m above the summit and drifted E. Incandescent material was ejected above the vent based on an image taken at 1936.
During January 2023 daily white gas-and-steam plumes rose 25-300 m above the summit and drifted in multiple directions. Gray-to-brown ash plumes were reported at 1638 on 3 January, at 1410 and 1509 on 4 January, and at 0013 on 5 January that rose 100-750 m above the summit and drifted NE and E; the gray-to-black ash plume at 1509 on 4 January rose as high as 3 km above the summit and drifted E. Gray ash plumes were recorded at 1754, 2241, and 2325 on 11 January and at 0046 on 12 January and rose 200-300 m above the summit and drifted NE. Toward the end of January, PVMBG reported that activity had intensified; Strombolian activity was visible in webcam images taken at 0041, 0043, and 0450 on 23 January. Multiple gray ash plumes throughout the day rose 200-500 m above the summit and drifted E and SE (figure 135). Webcam images showed progressively intensifying Strombolian activity at 1919, 1958, and 2113 on 24 January; a gray ash plume at 1957 rose 300 m above the summit and drifted E (figure 135). Eruptive events at 0231 and 2256 on 25 January and at 0003 on 26 January ejected incandescent material from the vent, based on webcam images. Gray ash plumes observed during 26-27 January rose 300-500 m above the summit and drifted NE, E, and SE.
Low levels of activity were reported during February and March. Daily white gas-and-steam plumes rose 25-300 m above the summit and drifted in different directions. The Darwin VAAC reported that continuous ash emissions rose to 1.5-1.8 km altitude and drifted W and NW during 1240-1300 on 10 March, based on satellite images, weather models, and PVMBG webcams. White-and-gray ash plumes rose 500 m and 300 m above the summit and drifted SW at 1446 and 1846 on 18 March, respectively. An eruptive event was recorded at 2143, though it was not visible due to darkness. Multiple ash plumes were reported during 27-29 March that rose as high as 2.5 km above the summit and drifted NE, W, and SW (figure 136). Webcam images captured incandescent ejecta above the vent at 0415 and around the summit area at 2003 on 28 March and at 0047 above the vent on 29 March.
Daily white gas-and-steam plumes rose 25-300 m above the summit and drifted in multiple directions during April and May. White-and-gray and black plumes rose 50-300 m above the summit on 2 and 9 April. On 11 May at 1241 a gray ash plume rose 1-3 km above the summit and drifted SW. On 12 May at 0920 a gray ash plume rose 2.5 km above the summit and drifted SW and at 2320 an ash plume rose 1.5 km above the summit and drifted SW. An accompanying webcam image showed incandescent ejecta. On 13 May at 0710 a gray ash plume rose 2 km above the summit and drifted SW (figure 137).
The MIROVA (Middle InfraRed Observation of Volcanic Activity) graph of MODIS thermal anomaly data showed intermittent low-to-moderate power thermal anomalies during November 2022 through April 2023 (figure 138). Some of this thermal activity was also visible in infrared satellite imagery at the crater, accompanied by gas-and-steam and ash plumes that drifted in different directions (figure 139).
Geologic Background. The renowned Krakatau (frequently mis-named as Krakatoa) volcano lies in the Sunda Strait between Java and Sumatra. Collapse of an older edifice, perhaps in 416 or 535 CE, formed a 7-km-wide caldera. Remnants of that volcano are preserved in Verlaten and Lang Islands; subsequently the Rakata, Danan, and Perbuwatan cones were formed, coalescing to create the pre-1883 Krakatau Island. Caldera collapse during the catastrophic 1883 eruption destroyed Danan and Perbuwatan, and left only a remnant of Rakata. This eruption caused more than 36,000 fatalities, most as a result of tsunamis that swept the adjacent coastlines of Sumatra and Java. Pyroclastic surges traveled 40 km across the Sunda Strait and reached the Sumatra coast. After a quiescence of less than a half century, the post-collapse cone of Anak Krakatau (Child of Krakatau) was constructed within the 1883 caldera at a point between the former Danan and Perbuwatan cones. Anak Krakatau has been the site of frequent eruptions since 1927.
Information Contacts: Pusat Vulkanologi dan Mitigasi Bencana Geologi (PVMBG, also known as Indonesian Center for Volcanology and Geological Hazard Mitigation, CVGHM), Jalan Diponegoro 57, Bandung 40122, Indonesia (URL: http://www.vsi.esdm.go.id/); MAGMA Indonesia, Kementerian Energi dan Sumber Daya Mineral (URL: https://magma.esdm.go.id/v1); Darwin Volcanic Ash Advisory Centre (VAAC), Bureau of Meteorology, Northern Territory Regional Office, PO Box 40050, Casuarina, NT 0811, Australia (URL: http://www.bom.gov.au/info/vaac/); MIROVA (Middle InfraRed Observation of Volcanic Activity), a collaborative project between the Universities of Turin and Florence (Italy) supported by the Centre for Volcanic Risk of the Italian Civil Protection Department (URL: http://www.mirovaweb.it/); Copernicus Browser, Copernicus Data Space Ecosystem, European Space Agency (URL: https://dataspace.copernicus.eu/browser/).
Stromboli
Italy
38.789°N, 15.213°E; summit elev. 924 m
All times are local (unless otherwise noted)
Strombolian explosions and lava flows continue during January-April 2023
Stromboli, located in Italy, has exhibited nearly constant lava fountains for the past 2,000 years; recorded eruptions date back to 350 BCE. Eruptive activity occurs at the summit from multiple vents, which include a north crater area (N area) and a central-southern crater (CS area) on a terrace known as the ‘terrazza craterica’ at the head of the Sciara del Fuoco, a large scarp that runs from the summit down the NW side of the volcano-island. Activity typically consists of Strombolian explosions, incandescent ejecta, lava flows, and pyroclastic flows. Thermal and visual monitoring cameras are located on the nearby Pizzo Sopra La Fossa, above the terrazza craterica, and at multiple flank locations. The current eruption period has been ongoing since 1934 and recent activity has consisted of frequent Strombolian explosions and lava flows (BGVN 48:02). This report updates activity during January through April 2023 primarily characterized by Strombolian explosions and lava flows based on reports from Italy's Istituto Nazionale di Geofisica e Vulcanologia (INGV) and various satellite data.
Frequent explosive activity continued throughout the reporting period, generally in the low-to-medium range, based on the number of hourly explosions in the summit crater (figure 253, table 16). Intermittent thermal activity was recorded by the MIROVA (Middle InfraRed Observation of Volcanic Activity) analysis of MODIS satellite data (figure 254). According to data collected by the MODVOLC thermal algorithm, a total of 9 thermal alerts were detected: one on 2 January 2023, one on 1 February, five on 24 March, and two on 26 March. The stronger pulses of thermal activity likely reflected lava flow events. Infrared satellite imagery captured relatively strong thermal hotspots at the two active summit craters on clear weather days, showing an especially strong event on 8 March (figure 255).
Table 16. Summary of type, frequency, and intensity of explosive activity at Stromboli by month during January-April 2023; information from webcam observations. Courtesy of INGV weekly reports.
| Month |
Explosive Activity |
| Jan 2023 |
Typical Strombolian activity with spattering and lava overflows in the N crater area. Explosions were reported from 4 vents in the N area and 1-2 vents in the CS area. The average hourly frequency of explosions was low-to-medium (1-12 events/hour). The intensity of the explosions varied from low (less than 80 m high) to medium (less than 150 m high) in the N crater area and up to high (greater than 150 m high) in the CS crater area. |
| Feb 2023 |
Typical Strombolian activity with spattering in the N crater area. Explosions were reported from 2-3 vents in the N area and 1-4 vents in the CS area. The average hourly frequency of explosions was low-to-medium (1-14 events/hour). The intensity of the explosions varied from low (less than 80 m high) to medium (less than 150 m high) in the N crater area and up to high (greater than 150 m high) in the CS crater area. |
| Mar 2023 |
Typical Strombolian activity with spattering and lava overflows in the N crater area. Explosions were reported from 2-3 vents in the N area and 2-4 vents in the CS area. The average hourly frequency of explosions was low-to-medium (1-18 events/hour). The intensity of the explosions varied from low (less than 80 m high) to medium (less than 150 m high) in the N crater area and up to high (greater than 150 m high) in the CS crater area. |
| Apr 2023 |
Typical Strombolian activity. Explosions were reported from 2 vents in the N area and 2-3 vents in the CS area. The average hourly frequency of explosions was low-to-high (1-16 events/hour). The intensity of the explosions varied from low (less than 80 m high) to medium (less than 150 m high) in both the N and CS crater areas. |
Activity during January-February 2023. Strombolian explosions were reported in the N crater area, as well as lava effusion. Explosive activity in the N crater area ejected coarse material (bombs and lapilli). Intense spattering was observed in both the N1 and N2 craters. In the CS crater area, explosions generally ejected fine material (ash), sometimes to heights greater than 250 m. The intensity of the explosions was characterized as low-to-medium in the N crater and medium-to-high in the CS crater. After intense spattering activity from the N crater area, a lava overflow began at 2136 on 2 January that flowed part way down the Sciara del Fuoco, possibly moving down the drainage that formed in October, out of view from webcams. The flow remained active for a couple of hours before stopping and beginning to cool. A second lava flow was reported at 0224 on 4 January that similarly remained active for a few hours before stopping and cooling. Intense spattering was observed on 11 and 13 January from the N1 crater. After intense spattering activity at the N2 crater at 1052 on 17 January another lava flow started to flow into the upper part of the Sciara del Fuoco (figure 256), dividing into two: one that traveled in the direction of the drainage formed in October, and the other one moving parallel to the point of emission. By the afternoon, the rate of the flow began to decrease, and at 1900 it started to cool. A lava flow was reported at 1519 on 24 January following intense spattering in the N2 area, which began to flow into the upper part of the Sciara del Fuoco. By the morning of 25 January, the lava flow had begun to cool. During 27 January the frequency of eruption in the CS crater area increased to 6-7 events/hour compared to the typical 1-7 events/hour; the following two days showed a decrease in frequency to less than 1 event/hour. Starting at 1007 on 30 January a high-energy explosive sequence was produced by vents in the CS crater area. The sequence began with an initial energetic pulse that lasted 45 seconds, ejecting predominantly coarse products 300 m above the crater that fell in an ESE direction. Subsequent and less intense explosions ejected material 100 m above the crater. The total duration of this event lasted approximately two minutes. During 31 January through 6, 13, and 24 February spattering activity was particularly intense for short periods in the N2 crater.
An explosive sequence was reported on 16 February that was characterized by a major explosion in the CS crater area (figure 257). The sequence began at 1817 near the S2 crater that ejected material radially. A few seconds later, lava fountains were observed in the central part of the crater. Three explosions of medium intensity (material was ejected less than 150 m high) were recorded at the S2 crater. The first part of this sequence lasted approximately one minute, according to INGV, and material rose 300 m above the crater and then was deposited along the Sciara del Fuoco. The second phase began at 1818 at the S1 crater; it lasted seven seconds and material was ejected 150 m above the crater. Another event 20 seconds later lasted 12 seconds, also ejecting material 150 m above the crater. The sequence ended with at least three explosions of mostly fine material from the S1 crater. The total duration of this sequence was about two minutes.
Short, intense spattering activity was noted above the N1 crater on 27 and 28 February. A lava overflow was first reported at 0657 from the N2 crater on 27 February that flowed into the October 2022 drainage. By 1900 the flow had stopped. A second lava overflow also in the N crater area occurred at 2149, which overlapped the first flow and then stopped by 0150 on 28 February. Material detached from both the lava overflows rolled down the Sciara del Fuoco, some of which was visible in webcam images.
Activity during March-April 2023. Strombolian activity continued with spattering activity and lava overflows in the N crater area during March. Explosive activity at the N crater area varied from low (less than 80 m high) to medium (less than 150 m high) and ejected coarse material, such as bombs and lapilli. Spattering was observed above the N1 crater, while explosive activity at the CS crater area varied from medium to high (greater than 150 m high) and ejected coarse material. Intense spattering activity was observed for short periods on 6 March above the N1 crater. At approximately 0610 a lava overflow was reported around the N2 crater on 8 March, which then flowed into the October 2022 drainage. By 1700 the flow started to cool. A second overflow began at 1712 on 9 March and overlapped the previous flow. It had stopped by 2100. Material from both flows was deposited along the Sciara del Fuoco, though much of the activity was not visible in webcam images. On 11 March a lava overflow was observed at 0215 that overlapped the two previous flows in the October 2022 drainage. By late afternoon on 12 March, it had stopped.
During a field excursion on 16 March, scientists noted that a vent in the central crater area was degassing. Another vent showed occasional Strombolian activity that emitted ash and lapilli. During 1200-1430 low-to-medium intense activity was reported; the N1 crater emitted ash emissions and the N2 crater emitted both ash and coarse material. Some explosions also occurred in the CS crater area that ejected coarse material. The C crater in the CS crater area occasionally showed gas jetting and low intensity explosions on 17 and 22 March; no activity was observed at the S1 crater. Intense, longer periods of spattering were reported in the N1 crater on 19, 24, and 25 March. Around 2242 on 23 March a lava overflow began from the N1 crater that, after about an hour, began moving down the October 2022 drainage and flow along the Sciara del Fuoco (figure 258). Between 0200 and 0400 on 26 March the flow rate increased, which generated avalanches of material from collapses at the advancing flow front. By early afternoon, the flow began to cool. On 25 March at 1548 an explosive sequence began from one of the vents at S2 in the CS crater area (figure 258). Fine ash mixed with coarse material was ejected 300 m above the crater rim and drifted SSE. Some modest explosions around Vent C were detected at 1549 on 25 March, which included an explosion at 1551 that ejected coarse material. The entire explosive sequence lasted approximately three minutes.
During April explosions persisted in both the N and CS crater areas. Fine material was ejected less than 80 m above the N crater rim until 6 April, followed by ejection of coarser material. Fine material was also ejected less than 80 m above the CS crater rim. The C and S2 crater did not show significant eruptive activity. On 7 April an explosive sequence was detected in the CS crater area at 1203 (figure 259). The first explosion lasted approximately 18 seconds and ejected material 400 m above the crater rim, depositing pyroclastic material in the upper part of the Sciara del Fuoco. At 1204 a second, less intense explosion lasted approximately four seconds and deposited pyroclastic products outside the crater area and near Pizzo Sopra La Fossa. A third explosion at 1205 was mainly composed of ash that rose about 150 m above the crater and lasted roughly 20 seconds. A fourth explosion occurred at 1205 about 28 seconds after the third explosion and ejected a mixture of coarse and fine material about 200 m above the crater; the explosion lasted roughly seven seconds. Overall, the entire explosive sequence lasted about two minutes and 20 seconds. After the explosive sequence on 7 April, explosions in both the N and CS crater areas ejected material as high as 150 m above the crater.
On 21 April research scientists from INGV made field observations in the summit area of Stromboli, and some lapilli samples were collected. In the N crater area near the N1 crater, a small cone was observed with at least two active vents, one of which was characterized by Strombolian explosions. The other vent produced explosions that ejected ash and chunks of cooled lava. At the N2 crater at least one vent was active and frequently emitted ash. In the CS crater area, a small cone contained 2-3 degassing vents and a smaller, possible fissure area also showed signs of degassing close to the Pizzo Sopra La Fossa. In the S part of the crater, three vents were active: a small hornito was characterized by modest and rare explosions, a vent that intermittently produced weak Strombolian explosions, and a vent at the end of the terrace that produced frequent ash emissions. Near the S1 crater there was a hornito that generally emitted weak gas-and-steam emissions, sometimes associated with “gas rings”. On 22 April another field inspection was carried out that reported two large sliding surfaces on the Sciara del Fuoco that showed where blocks frequently descended toward the sea. A thermal anomaly was detected at 0150 on 29 April.
Geologic Background. Spectacular incandescent nighttime explosions at Stromboli have long attracted visitors to the "Lighthouse of the Mediterranean" in the NE Aeolian Islands. This volcano has lent its name to the frequent mild explosive activity that has characterized its eruptions throughout much of historical time. The small island is the emergent summit of a volcano that grew in two main eruptive cycles, the last of which formed the western portion of the island. The Neostromboli eruptive period took place between about 13,000 and 5,000 years ago. The active summit vents are located at the head of the Sciara del Fuoco, a prominent scarp that formed about 5,000 years ago due to a series of slope failures which extends to below sea level. The modern volcano has been constructed within this scarp, which funnels pyroclastic ejecta and lava flows to the NW. Essentially continuous mild Strombolian explosions, sometimes accompanied by lava flows, have been recorded for more than a millennium.
Information Contacts: Istituto Nazionale di Geofisica e Vulcanologia (INGV), Sezione di Catania, Piazza Roma 2, 95123 Catania, Italy, (URL: http://www.ct.ingv.it/en/); MIROVA (Middle InfraRed Observation of Volcanic Activity), a collaborative project between the Universities of Turin and Florence (Italy) supported by the Centre for Volcanic Risk of the Italian Civil Protection Department (URL: http://www.mirovaweb.it/); Hawai'i Institute of Geophysics and Planetology (HIGP) - MODVOLC Thermal Alerts System, School of Ocean and Earth Science and Technology (SOEST), Univ. of Hawai'i, 2525 Correa Road, Honolulu, HI 96822, USA (URL: http://modis.higp.hawaii.edu/); Copernicus Browser, Copernicus Data Space Ecosystem, European Space Agency (URL: https://dataspace.copernicus.eu/browser/).
Nishinoshima (Japan) — July 2023 Cite this Report
Nishinoshima
Japan
27.247°N, 140.874°E; summit elev. 100 m
All times are local (unless otherwise noted)
Small ash plumes and fumarolic activity during November 2022 through April 2023
Nishinoshima is a small island located about 1,000 km S of Tokyo in the Ogasawara Arc in Japan. The island is the summit of a massive submarine volcano that has prominent peaks to the S, W, and NE. Eruptions date back to 1973; the most recent eruption period began in October 2022 and was characterized by ash plumes and fumarolic activity (BGVN 47:12). This report describes ash plumes and fumarolic activity during November 2022 through April 2023 based on monthly reports from the Japan Meteorological Agency (JMA) monthly reports and satellite data.
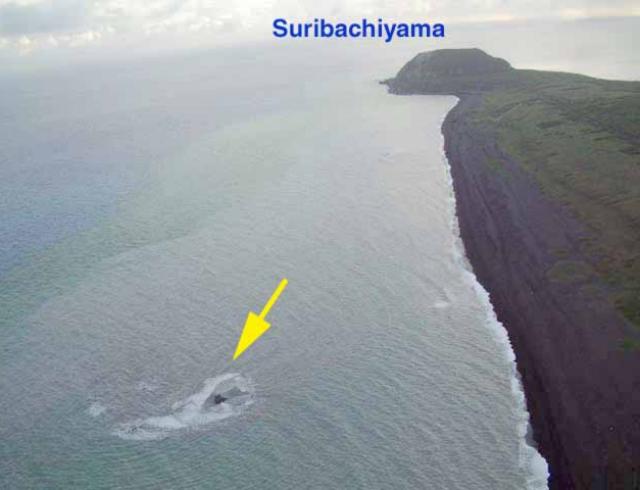
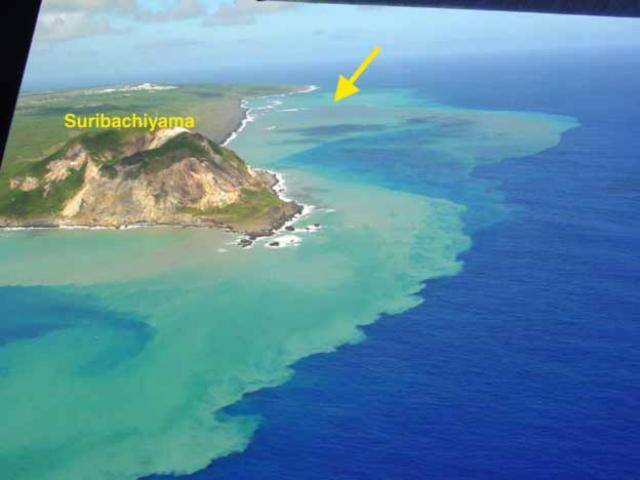
The most recent eruptive activity prior to the reporting internal occurred on 12 October 2022, when an ash plume rose 3.5 km above the crater rim. An aerial observation conducted by the Japan Coast Guard (JCG) on 25 November reported that white fumaroles rose approximately 200 m above the central crater of a pyroclastic cone (figure 119), and multiple plumes were observed on the ESE flank of the cone. Discolored water ranging from reddish-brown to brown and yellowish-green were visible around the perimeter of the island (figure 119). No significant activity was reported in December.
During an overflight conducted by JCG on 25 January 2023 intermittent activity and small, blackish-gray plumes rose 900 m above the central part of the crater were observed (figure 120). The fumarolic zone of the E flank and base of the cone had expanded and emissions had intensified. Dark brown discolored water was visible around the perimeter of the island.
No significant activity was reported during February through March. Ash plumes at 1050 and 1420 on 11 April rose 1.9 km above the crater rim and drifted NW and N. These were the first ash plumes observed since 12 October 2022. On 14 April JCG carried out an overflight and reported that no further eruptive activity was visible, although white gas-and-steam plumes were visible from the central crater and rose 900 m high (figure 121). Brownish and yellow-green discolored water surrounded the island.
Intermittent low-to-moderate power thermal anomalies were recorded in the MIROVA graph (Middle InfraRed Observation of Volcanic Activity) during November 2022 through April 2023 (figure 123). A cluster of six to eight anomalies were detected during November while a smaller number were detected during the following months: two to three during December, one during mid-January 2023, one during February, five during March, and two during April. Thermal activity was also reflected in infrared satellite data at the summit crater, accompanied by occasional gas-and-steam plumes (figure 124).
Geologic Background. The small island of Nishinoshima was enlarged when several new islands coalesced during an eruption in 1973-74. Multiple eruptions that began in 2013 completely covered the previous exposed surface and continued to enlarge the island. The island is the summit of a massive submarine volcano that has prominent peaks to the S, W, and NE. The summit of the southern cone rises to within 214 m of the ocean surface 9 km SSE.
Information Contacts: Japan Meteorological Agency (JMA), 1-3-4 Otemachi, Chiyoda-ku, Tokyo 100-8122, Japan (URL: http://www.jma.go.jp/jma/indexe.html); MIROVA (Middle InfraRed Observation of Volcanic Activity), a collaborative project between the Universities of Turin and Florence (Italy) supported by the Centre for Volcanic Risk of the Italian Civil Protection Department (URL: http://www.mirovaweb.it/); Copernicus Browser, Copernicus Data Space Ecosystem, European Space Agency (URL: https://dataspace.copernicus.eu/browser/).
Karangetang (Indonesia) — July 2023 Cite this Report
Karangetang
Indonesia
2.781°N, 125.407°E; summit elev. 1797 m
All times are local (unless otherwise noted)
Lava flows, incandescent avalanches, and ash plumes during January-June 2023
Karangetang (also known as Api Siau), at the northern end of the island of Siau, Indonesia, contains five summit craters along a N-S line. More than 40 eruptions have been recorded since 1675; recent eruptions have included frequent explosive activity, sometimes accompanied by pyroclastic flows and lahars. Lava dome growth has occurred in the summit craters and collapses of lava flow fronts have produced pyroclastic flows. The two active summit craters are Kawah Dua (the N crater) and Kawah Utama (the S crater, also referred to as the “Main Crater”). The most recent eruption began in late November 2018 and has more recently consisted of weak thermal activity and gas-and-steam emissions (BGVN 48:01). This report updates activity characterized by lava flows, incandescent avalanches, and ash plumes during January through June 2023 using reports from Pusat Vulkanologi dan Mitigasi Bencana Geologi (PVMBG, also known as CVGHM, or the Center of Volcanology and Geological Hazard Mitigation), MAGMA Indonesia, the Darwin VAAC (Volcano Ash Advisory Center), and satellite data.
Activity during January was relatively low and mainly consisted of white gas-and-steam emissions that rose 25-150 m above Main Crater (S crater) and drifted in different directions. Incandescence was visible from the lava dome in Kawah Dua (the N crater). Weather conditions often prevented clear views of the summit. On 18 January the number of seismic signals that indicated avalanches of material began to increase. In addition, there were a total of 71 earthquakes detected during the month.
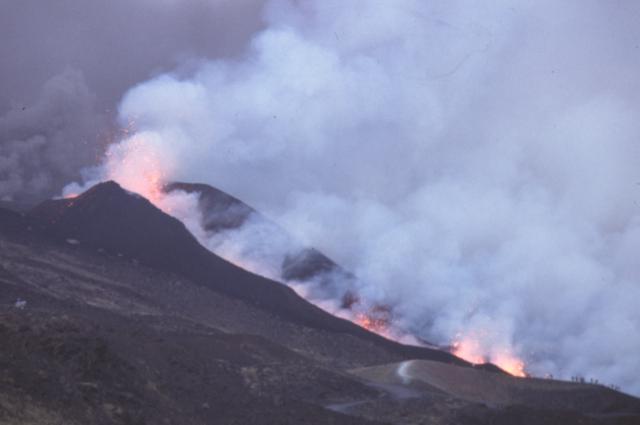
Activity continued to increase during the first week of February. Material from Main Crater traveled as far as 800 m down the Batuawang (S) and Batang (W) drainages and as far as 1 km W down the Beha (W) drainage on 4 February. On 6 February 43 earthquake events were recorded, and on 7 February, 62 events were recorded. White gas-and-steam emissions rose 25-250 m above both summit craters throughout the month. PVMBG reported an eruption began during the evening of 8 February around 1700. Photos showed incandescent material at Main Crater. Incandescent material had also descended the flank in at least two unconfirmed directions as far as 2 km from Main Crater, accompanied by ash plumes (figure 60). As a result, PVMBG increased the Volcano Alert Level (VAL) to 3 (the second highest level on a 1-4 scale).
Occasional nighttime webcam images showed three main incandescent lava flows of differing lengths traveling down the S, SW, and W flanks (figure 61). Incandescent rocks were visible on the upper flanks, possibly from ejected or collapsed material from the crater, and incandescence was the most intense at the summit. Based on analyses of satellite imagery and weather models, the Darwin VAAC reported that daily ash plumes during 16-20 February rose to 2.1-3 km altitude and drifted NNE, E, and SE. BNPB reported on 16 February that as many as 77 people were evacuated and relocated to the East Siau Museum. A webcam image taken at 2156 on 17 February possibly showed incandescent material descending the SE flank. Ash plumes rose to 2.1 km altitude and drifted SE during 22-23 February, according to the Darwin VAAC.
Incandescent avalanches of material and summit incandescence at Main Crater continued during March. White gas-and-steam emissions during March generally rose 25-150 m above the summit crater; on 31 March gas-and-steam emissions rose 200-400 m high. An ash plume rose to 2.4 km altitude and drifted S at 1710 on 9 March and a large thermal anomaly was visible in images taken at 0550 and 0930 on 10 March. Incandescent material was visible at the summit and on the flanks based on webcam images taken at 0007 and 2345 on 16 March, at 1828 on 17 March, at 1940 on 18 March, at 2311 on 19 March, and at 2351 on 20 March. Incandescence was most intense on 18 and 20 March and webcam images showed possible Strombolian explosions (figure 62). An ash plume rose to 2.4 km altitude and drifted SW on 18 March, accompanied by a thermal anomaly.
Summit crater incandescence at Main Crater and on the flanks persisted during April. Incandescent material at the S crater and on the flanks was reported at 0016 on 1 April. The lava flows had stopped by 1 April according to PVMBG, although incandescence was still visible up to 10 m high. Seismic signals indicating effusion decreased and by 6 April they were no longer detected. Incandescence was visible from both summit craters. On 26 April the VAL was lowered to 2 (the second lowest level on a 1-4 scale). White gas-and-steam emissions rose 25-200 m above the summit crater.
During May white gas-and-steam emissions generally rose 50-250 m above the summit, though it was often cloudy, which prevented clear views; on 21 May gas-and-steam emissions rose 50-400 m high. Nighttime N summit crater incandescence rose 10-25 m above the lava dome, and less intense incandescence was noted above Main Crater, which reached about 10 m above the dome. Sounds of falling rocks at Main Crater were heard on 15 May and the seismic network recorded 32 rockfall events in the crater on 17 May. Avalanches traveled as far as 1.5 km down the SW and S flanks, accompanied by rumbling sounds on 18 May. Incandescent material descending the flanks was captured in a webcam image at 2025 on 19 May (figure 63) and on 29 May; summit crater incandescence was observed in webcam images at 2332 on 26 May and at 2304 on 29 May. On 19 May the VAL was again raised to 3.
Occasional Main Crater incandescence was reported during June, as well as incandescent material on the flanks. White gas-and-steam emissions rose 10-200 m above the summit crater. Ash plumes rose to 2.1 km altitude and drifted SE and E during 2-4 June, according to the Darwin VAAC. Material on the flanks of Main Crater were observed at 2225 on 7 June, at 2051 on 9 June, at 0007 on 17 June, and at 0440 on 18 June. Webcam images taken on 21, 25, and 27 June showed incandescence at Main Crater and from material on the flanks.
MIROVA (Middle InfraRed Observation of Volcanic Activity) analysis of MODIS satellite data showed strong thermal activity during mid-February through March and mid-May through June, which represented incandescent avalanches and lava flows (figure 64). During April through mid-May the power of the anomalies decreased but frequent anomalies were still detected. Brief gaps in activity occurred during late March through early April and during mid-June. Infrared satellite images showed strong lava flows mainly affecting the SW and S flanks, accompanied by gas-and-steam emissions (figure 65). According to data recorded by the MODVOLC thermal algorithm, there were a total of 79 thermal hotspots detected: 28 during February, 24 during March, one during April, five during May, and 21 during June.
Geologic Background. Karangetang (Api Siau) volcano lies at the northern end of the island of Siau, about 125 km NNE of the NE-most point of Sulawesi. The stratovolcano contains five summit craters along a N-S line. It is one of Indonesia's most active volcanoes, with more than 40 eruptions recorded since 1675 and many additional small eruptions that were not documented (Neumann van Padang, 1951). Twentieth-century eruptions have included frequent explosive activity sometimes accompanied by pyroclastic flows and lahars. Lava dome growth has occurred in the summit craters; collapse of lava flow fronts have produced pyroclastic flows.
Information Contacts: Pusat Vulkanologi dan Mitigasi Bencana Geologi (PVMBG, also known as Indonesian Center for Volcanology and Geological Hazard Mitigation, CVGHM), Jalan Diponegoro 57, Bandung 40122, Indonesia (URL: http://www.vsi.esdm.go.id/); MAGMA Indonesia, Kementerian Energi dan Sumber Daya Mineral (URL: https://magma.esdm.go.id/v1); Badan Nasional Penanggulangan Bencana (BNPB), National Disaster Management Agency, Graha BNPB - Jl. Scout Kav.38, East Jakarta 13120, Indonesia (URL: http://www.bnpb.go.id/); Darwin Volcanic Ash Advisory Centre (VAAC), Bureau of Meteorology, Northern Territory Regional Office, PO Box 40050, Casuarina, NT 0811, Australia (URL: http://www.bom.gov.au/info/vaac/); MIROVA (Middle InfraRed Observation of Volcanic Activity), a collaborative project between the Universities of Turin and Florence (Italy) supported by the Centre for Volcanic Risk of the Italian Civil Protection Department (URL: http://www.mirovaweb.it/); Hawai'i Institute of Geophysics and Planetology (HIGP) - MODVOLC Thermal Alerts System, School of Ocean and Earth Science and Technology (SOEST), Univ. of Hawai'i, 2525 Correa Road, Honolulu, HI 96822, USA (URL: http://modis.higp.hawaii.edu/); Copernicus Browser, Copernicus Data Space Ecosystem, European Space Agency (URL: https://dataspace.copernicus.eu/browser/); IDN Times, Jl. Jend. Gatot Subroto Kav. 27 3rd Floor Kuningan, Jakarta, Indonesia 12950, Status of Karangetang Volcano in Sitaro Islands Increases (URL: https://sulsel.idntimes.com/news/indonesia/savi/status-gunung-api-karangetang-di-kepulauan-sitaro-meningkat?page=all).
Ahyi (United States) — July 2023 Cite this Report
Ahyi
United States
20.42°N, 145.03°E; summit elev. -75 m
All times are local (unless otherwise noted)
Intermittent hydroacoustic signals and discolored plumes during November 2022-June 2023
Ahyi seamount is a large, conical submarine volcano that rises to within 75 m of the ocean surface about 18 km SE of the island of Farallon de Pajaros in the Northern Marianas. The remote location of the seamount has made eruptions difficult to document, but seismic stations installed in the region confirmed an eruption in the vicinity in 2001. No new activity was detected until April-May 2014 when an eruption was detected by NOAA (National Oceanic and Atmospheric Administration) divers, hydroacoustic sensors, and seismic stations (BGVN 42:04). New activity was first detected on 15 November by hydroacoustic sensors that were consistent with submarine volcanic activity. This report covers activity during November 2022 through June 2023 based on daily and weekly reports from the US Geological Survey.
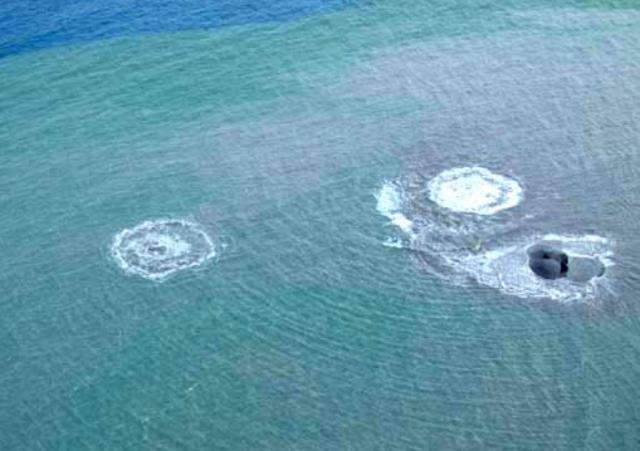
Starting in mid-October, hydroacoustic sensors at Wake Island (2.2 km E) recorded signals consistent with submarine volcanic activity, according to a report from the USGS issued on 15 November 2022. A combined analysis of the hydroacoustic signals and seismic stations located at Guam and Chichijima Island, Japan, suggested that the source of this activity was at or near the Ahyi seamount. After a re-analysis of a satellite image of the area that was captured on 6 November, USGS confirmed that there was no evidence of discoloration at the ocean surface. Few hydroacoustic and seismic signals continued through November, including on 18 November, which USGS suggested signified a decline or pause in unrest. A VONA (Volcano Observatory Notice for Aviation) reported that a discolored water plume was persistently visible in satellite data starting on 18 November (figure 6). Though clouds often obscured clear views of the volcano, another discolored water plume was captured in a satellite image on 26 November. The Aviation Color Code (ACC) was raised to Yellow (the second lowest level on a four-color scale) and the Volcano Alert Level (VAL) was raised to Advisory (the second lowest level on a four-level scale) on 29 November.
During December, occasional detections were recorded on the Wake Island hydrophone sensors and discolored water over the seamount remained visible. During 2-7, 10-12, and 16-31 December possible explosion signals were detected. A small area of discolored water was observed in high-resolution Sentinel-2 satellite images during 1-6 December (figure 7). High-resolution satellite images recorded discolored water plumes on 13 December that originated from the summit region; no observations indicated that activity breached the ocean surface. A possible underwater plume was visible in satellite images on 18 December, and during 19-20 December a definite but diffuse underwater plume located SSE from the main vent was reported. An underwater plume was visible in a satellite image taken on 26 December (figure 7).
Hydrophone sensors continued to detect signals consistent with possible explosions during 1-8 January 2023. USGS reported that the number of detections decreased during 4-5 January. The hydrophone sensors experienced a data outage that started at 0118 on 8 January and continued through 10 January, though according to USGS, possible explosions were recorded prior to the data outage and likely continued during the outage. A discolored water plume originating from the summit region was detected in a partly cloudy satellite image on 8 January. On 11-12 and 15-17 January possible explosion signals were recorded again. One small signal was detected during 22-23 January and several signals were recorded on 25 and 31 January. During 27-31 January a plume of discolored water was observed above the seamount in satellite imagery (figure 8).
Low levels of activity continued during February and March, based on data from pressure sensors on Wake Island. During 1 and 4-6 February activity was reported, and a submarine plume was observed on 4 February (figure 8). Possible explosion signals were detected during 7-8, 10, 13-14, and 24 February. During 1-2 and 3-5 March a plume of discolored water was observed in satellite imagery (figure 8). Almost continuous hydroacoustic signals were detected in remote pressure sensor data on Wake Island 2,270 km E from the volcano during 7-13 March. During 12-13 March water discoloration around the seamount was observed in satellite imagery, despite cloudy weather. By 14 March discolored water extended about 35 km, but no direction was noted. USGS reported that the continuous hydroacoustic signals detected during 13-14 March stopped abruptly on 14 March and no new detections were observed. Three 30 second hydroacoustic detections were reported during 17-19 March, but no activity was visible due to cloudy weather. A data outage was reported during 21-22 March, making pressure sensor data unavailable; a discolored water plume was, however, visible in satellite data. A possible underwater explosion signal was detected by pressure sensors at Wake Island on 26, 29, and 31 March, though the cause and origin of these events were unclear.
Similar low activity continued during April, May, and June. Several signals were detected during 1-3 April in pressure sensors at Wake Island. USGS suggested that these may be related to underwater explosions or earthquakes at the volcano, but no underwater plumes were visible in clear satellite images. The pressure sensors had data outages during 12-13 April and no data were recorded; no underwater plumes were visible in satellite images, although cloudy weather obscured most clear views. Eruptive activity was reported starting at 2210 on 21 May. On 22 May a discolored water plume that extended 4 km was visible in satellite images, though no direction was recorded. During 23-24 May some signals were detected by the underwater pressure sensors. Possible hydroacoustic signals were detected during 2-3 and 6-8 June. Multiple hydroacoustic signals were detected during 9-11 and 16-17 June, although no activity was visible in satellite images. One hydroacoustic signal was detected during 23-24 June, but there was some uncertainty about its association with volcanic activity. A single possible hydroacoustic signal was detected during 30 June to 1 July.
Geologic Background. Ahyi seamount is a large conical submarine volcano that rises to within 75 m of the ocean surface ~18 km SE of the island of Farallon de Pajaros in the northern Marianas. Water discoloration has been observed there, and in 1979 the crew of a fishing boat felt shocks over the summit area, followed by upwelling of sulfur-bearing water. On 24-25 April 2001 an explosive eruption was detected seismically by a station on Rangiroa Atoll, Tuamotu Archipelago. The event was well constrained (+/- 15 km) at a location near the southern base of Ahyi. An eruption in April-May 2014 was detected by NOAA divers, hydroacoustic sensors, and seismic stations.
Information Contacts: US Geological Survey, Volcano Hazards Program (USGS-VHP), 12201 Sunrise Valley Drive, Reston, VA, USA, https://volcanoes.usgs.gov/index.html; Copernicus Browser, Copernicus Data Space Ecosystem, European Space Agency (URL: https://dataspace.copernicus.eu/browser/).
Kadovar (Papua New Guinea) — June 2023 Cite this Report
Kadovar
Papua New Guinea
3.608°S, 144.588°E; summit elev. 365 m
All times are local (unless otherwise noted)
An ash plume and weak thermal anomaly during May 2023
Kadovar is a 2-km-wide island that is the emergent summit of a Bismarck Sea stratovolcano. It lies off the coast of New Guinea, about 25 km N of the mouth of the Sepik River. Prior to an eruption that began in 2018, a lava dome formed the high point of the volcano, filling an arcuate landslide scarp open to the S. Submarine debris-avalanche deposits occur to the S of the island. The current eruption began in January 2018 and has comprised lava effusion from vents at the summit and at the E coast; more recent activity has consisted of ash plumes, weak thermal activity, and gas-and-steam plumes (BGVN 48:02). This report covers activity during February through May 2023 using information from the Darwin Volcanic Ash Advisory Center (VAAC) and satellite data.
Activity during the reporting period was relatively low and mainly consisted of white gas-and-steam plumes that were visible in natural color satellite images on clear weather days (figure 67). According to a Darwin VAAC report, at 2040 on 6 May an ash plume rose to 4.6 km altitude and drifted W; by 2300 the plume had dissipated. MODIS satellite instruments using the MODVOLC thermal algorithm detected a single thermal hotspot on the SE side of the island on 7 May. Weak thermal activity was also detected in a satellite image on the E side of the island on 14 May, accompanied by a white gas-and-steam plume that drifted SE (figure 68).
Geologic Background. The 2-km-wide island of Kadovar is the emergent summit of a Bismarck Sea stratovolcano of Holocene age. It is part of the Schouten Islands, and lies off the coast of New Guinea, about 25 km N of the mouth of the Sepik River. Prior to an eruption that began in 2018, a lava dome formed the high point of the andesitic volcano, filling an arcuate landslide scarp open to the south; submarine debris-avalanche deposits occur in that direction. Thick lava flows with columnar jointing forms low cliffs along the coast. The youthful island lacks fringing or offshore reefs. A period of heightened thermal phenomena took place in 1976. An eruption began in January 2018 that included lava effusion from vents at the summit and at the E coast.
Information Contacts: Darwin Volcanic Ash Advisory Centre (VAAC), Bureau of Meteorology, Northern Territory Regional Office, PO Box 40050, Casuarina, NT 0811, Australia (URL: http://www.bom.gov.au/info/vaac/); Hawai'i Institute of Geophysics and Planetology (HIGP) - MODVOLC Thermal Alerts System, School of Ocean and Earth Science and Technology (SOEST), Univ. of Hawai'i, 2525 Correa Road, Honolulu, HI 96822, USA (URL: http://modis.higp.hawaii.edu/); Copernicus Browser, Copernicus Data Space Ecosystem, European Space Agency (URL: https://dataspace.copernicus.eu/browser/).
San Miguel (El Salvador) — June 2023 Cite this Report
San Miguel
El Salvador
13.434°N, 88.269°W; summit elev. 2130 m
All times are local (unless otherwise noted)
Small gas-and-ash explosions during March and May 2023
San Miguel in El Salvador is a broad, deep crater complex that has been frequently modified by eruptions recorded since the early 16th century and consists of the summit known locally as Chaparrastique. Flank eruptions have produced lava flows that extended to the N, NE, and SE during the 17-19th centuries. The most recent activity has consisted of minor ash eruptions from the summit crater. The current eruption period began in November 2022 and has been characterized by frequent phreatic explosions, gas-and-ash emissions, and sulfur dioxide plumes (BGVN 47:12). This report describes small gas-and-ash explosions during December 2022 through May 2023 based on special reports from the Ministero de Medio Ambiente y Recursos Naturales (MARN).
Activity has been relatively low since the last recorded explosions on 29 November 2022. Seismicity recorded by the San Miguel Volcano Station (VSM) located on the N flank at 1.7 km elevation had decreased by 7 December. Sulfur dioxide gas measurements taken with DOAS (Differential Optical Absorption Spectroscopy) mobile equipment were below typical previously recorded values: 300 tons per day (t/d). During December, small explosions were recorded by the seismic network and manifested as gas-and-steam emissions.
Gas-and-ash explosions in the crater occurred during January 2023, which were recorded by the seismic network. Sulfur dioxide values remained low, between 300-400 t/d through 10 March. At 0817 on 14 January a gas-and-ash emission was visible in webcam images, rising just above the crater rim. Some mornings during February, small gas-and-steam plumes were visible in the crater. On 7 March at 2252 MARN noted an increase in degassing from the central crater; gas emissions were constantly observed through the early morning hours on 8 March. During the early morning of 8 March through the afternoon on 9 March, 12 emissions were registered, some accompanied by ash. The last gas-and-ash emission was recorded at 1210 on 9 March; very fine ashfall was reported in El Tránsito (10 km S), La Morita (6 km W), and La Piedrita (3 km W). The smell of sulfur was reported in Piedra Azul (5 km SW). On 16 March MARN reported that gas-and-steam emissions decreased.
Low degassing and very low seismicity were reported during April; no explosions have been detected between 9 March and 27 May. The sulfur dioxide emissions remained between 350-400 t/d; during 13-20 April sulfur dioxide values fluctuated between 30-300 t/d. Activity remained low through most of May; on 23 May seismicity increased. An explosion was detected at 1647 on 27 May generated a gas-and-ash plume that rose 700 m high (figure 32); a decrease in seismicity and gas emissions followed. The DOAS station installed on the W flank recorded sulfur dioxide values that reached 400 t/d on 27 May; subsequent measurements showed a decrease to 268 t/d on 28 May and 100 t/d on 29 May.
Geologic Background. The symmetrical cone of San Miguel, one of the most active volcanoes in El Salvador, rises from near sea level to form one of the country's most prominent landmarks. A broad, deep, crater complex that has been frequently modified by eruptions recorded since the early 16th century caps the truncated unvegetated summit, also known locally as Chaparrastique. Flanks eruptions of the basaltic-andesitic volcano have produced many lava flows, including several during the 17th-19th centuries that extended to the N, NE, and SE. The SE-flank flows are the largest and form broad, sparsely vegetated lava fields crossed by highways and a railroad skirting the base of the volcano. Flank vent locations have migrated higher on the edifice during historical time, and the most recent activity has consisted of minor ash eruptions from the summit crater.
Information Contacts: Ministero de Medio Ambiente y Recursos Naturales (MARN), Km. 5½ Carretera a Nueva San Salvador, Avenida las Mercedes, San Salvador, El Salvador (URL: http://www.snet.gob.sv/ver/vulcanologia).
Semisopochnoi (United States) — June 2023 Cite this Report
Semisopochnoi
United States
51.93°N, 179.58°E; summit elev. 1221 m
All times are local (unless otherwise noted)
Occasional explosions, ash deposits, and gas-and-steam plumes during December 2022-May 2023
Semisopochnoi is located in the western Aleutians, is 20-km-wide at sea level, and contains an 8-km-wide caldera. The three-peaked Mount Young (formerly Cerberus) was constructed within the caldera during the Holocene. Each of these peaks contains a summit crater; the lava flows on the N flank appear younger than those on the S side. The current eruption period began in early February 2021 and has more recently consisted of intermittent explosions and ash emissions (BGVN 47:12). This report updates activity during December 2022 through May 2023 using daily, weekly, and special reports from the Alaska Volcano Observatory (AVO). AVO monitors the volcano using local seismic and infrasound sensors, satellite data, web cameras, and remote infrasound and lightning networks.
Activity during most of December 2022 was relatively quiet; according to AVO no eruptive or explosive activity was observed since 7 November 2022. Intermittent tremor and occasional small earthquakes were observed in geophysical data. Continuous gas-and-steam emissions were observed from the N crater of Mount Young in webcam images on clear weather days (figure 25). On 24 December, there was a slight increase in earthquake activity and several small possible explosion signals were detected in infrasound data. Eruptive activity resumed on 27 December at the N crater of Mount Young; AVO issued a Volcano Activity Notice (VAN) that reported minor ash deposits on the flanks of Mount Young that extended as far as 1 km from the vent, according to webcam images taken during 27-28 December (figure 26). No ash plumes were observed in webcam or satellite imagery, but a persistent gas-and-steam plume that might have contained some ash rose to 1.5 km altitude. As a result, AVO raised the Aviation Color Code (ACC) to Orange (the second highest level on a four-color scale) and the Volcano Alert Level (VAL) to Watch (the second highest level on a four-level scale). Possible explosions were detected during 21 December 2022 through 1 January 2023 and seismic tremor was recorded during 30-31 December.
During January 2023 eruptive activity continued at the active N crater of Mount Young. Minor ash deposits were observed on the flanks, extending about 2 km SSW, based on webcam images from 1 and 3 January. A possible explosion occurred during 1-2 January based on elevated seismicity recorded on local seismometers and an infrasound signal recorded minutes later by an array at Adak. Though no ash plumes were observed in webcam or satellite imagery, a persistent gas-and-steam plume rose to 1.5 km altitude that might have carried minor traces of ash. Ash deposits were accompanied by periods of elevated seismicity and infrasound signals from the local geophysical network, which AVO reported were likely due to weak explosive activity. Low-level explosive activity was also detected during 2-3 January, with minor gas-and-steam emissions and a new ash deposit that was visible in webcam images. Low-level explosive activity was detected in geophysical data during 4-5 January, with elevated seismicity and infrasound signals observed on local stations. Volcanic tremor was detected during 7-9 January and very weak explosive activity was detected in seismic and infrasound data on 9 January. Weak seismic and infrasound signals were recorded on 17 January, which indicated minor explosive activity, but no ash emissions were observed in clear webcam images; a gas-and-steam plume continued to rise to 1.5 km altitude. During 29-30 January, ash deposits near the summit were observed on fresh snow, according to webcam images.
The active N cone at Mount Young continued to produce a gas-and-steam plume during February, but no ash emissions or explosive events were detected. Seismicity remained elevated with faint tremor during early February. Gas-and-steam emissions from the N crater were observed in clear webcam images on 11-13 and 16 February; no explosive activity was detected in seismic, infrasound, or satellite data. Seismicity has also decreased, with no significant seismic tremor observed since 25 January. Therefore, the ACC was lowered to Yellow (the second lowest level on a four-color scale) and the VAL was lowered to Advisory (the second lowest level on a four-color scale) on 22 February.
Gas-and-steam emissions persisted during March from the N cone of Mount Young, based on clear webcam images. A few brief episodes of weak tremor were detected in seismic data, although seismicity decreased over the month. A gas-and-steam plume detected in satellite data extended 150 km on 18 March. Low-level ash emissions from the N cone at Mount Young were observed in several webcam images during 18-19 March, in addition to small explosions and volcanic tremor. The ACC was raised to Orange and the VAL increased to Watch on 19 March. A small explosion was detected in seismic and infrasound data on 21 March.
Low-level unrest continued during April, although cloudy weather often obscured views of the summit; periods of seismic tremor and local earthquakes were recorded. During 3-4 April a gas-and-steam plume was visible traveling more than 200 km overnight; no ash was evident in the plume, according to AVO. A gas-and-steam plume was observed during 4-6 April that extended 400 km but did not seem to contain ash. Small explosions were detected in seismic and infrasound data on 5 April. Occasional clear webcam images showed continuing gas-and-steam emissions rose from Mount Young, but no ash deposits were observed on the snow. On 19 April small explosions and tremor were detected in seismic and infrasound data. A period of seismic tremor was detected during 22-25 April, with possible weak explosions on 25 April. Ash deposits were visible near the crater rim, but it was unclear if these deposits were recent or due to older deposits.
Occasional small earthquakes were recorded during May, but there were no signs of explosive activity seen in geophysical data. Gas-and-steam emissions continued from the N crater of Mount Young, based on webcam images, and seismicity remained slightly elevated. A new, light ash deposit was visible during the morning of 5 May on fresh snow on the NW flank of Mount Young. During 10 May periods of volcanic tremor were observed. The ACC was lowered to Yellow and the VAL to Advisory on 17 May due to no additional evidence of activity.
Geologic Background. Semisopochnoi, the largest subaerial volcano of the western Aleutians, is 20 km wide at sea level and contains an 8-km-wide caldera. It formed as a result of collapse of a low-angle, dominantly basaltic volcano following the eruption of a large volume of dacitic pumice. The high point of the island is Anvil Peak, a double-peaked late-Pleistocene cone that forms much of the island's northern part. The three-peaked Mount Cerberus (renamed Mount Young in 2023) was constructed within the caldera during the Holocene. Each of the peaks contains a summit crater; lava flows on the N flank appear younger than those on the south side. Other post-caldera volcanoes include the symmetrical Sugarloaf Peak SSE of the caldera and Lakeshore Cone, a small cinder cone at the edge of Fenner Lake in the NE part of the caldera. Most documented eruptions have originated from Young, although Coats (1950) considered that both Sugarloaf and Lakeshore Cone could have been recently active.
Information Contacts: Alaska Volcano Observatory (AVO), a cooperative program of a) U.S. Geological Survey, 4200 University Drive, Anchorage, AK 99508-4667 USA (URL: https://avo.alaska.edu/), b) Geophysical Institute, University of Alaska, PO Box 757320, Fairbanks, AK 99775-7320, USA, and c) Alaska Division of Geological & Geophysical Surveys, 794 University Ave., Suite 200, Fairbanks, AK 99709, USA (URL: http://dggs.alaska.gov/).
Ebeko
Russia
50.686°N, 156.014°E; summit elev. 1103 m
All times are local (unless otherwise noted)
Continued explosions, ash plumes, and ashfall during October 2022-May 2023
Ebeko, located on the N end of Paramushir Island in the Kuril Islands, consists of three summit craters along a SSW-NNE line at the northern end of a complex of five volcanic cones. Eruptions date back to the late 18th century and have been characterized as small-to-moderate explosions from the summit crater, accompanied by intense fumarolic activity. The current eruption period began in June 2022 and has recently consisted of frequent explosions, ash plumes, and thermal activity (BGVN 47:10). This report covers similar activity during October 2022 through May 2023, based on information from the Kamchatka Volcanic Eruptions Response Team (KVERT) and satellite data.
Activity during October consisted of explosive activity, ash plumes, and occasional thermal anomalies. Visual data by volcanologists from Severo-Kurilsk showed explosions producing ash clouds up to 2.1-3 km altitude which drifted E, N, NE, and SE during 1-8, 10, 16, and 18 October. KVERT issued several Volcano Observatory Notices for Aviation (VONA) on 7, 13-15, and 27 October 2022, stating that explosions generated ash plumes that rose to 2.3-4 km altitude and drifted 5 km E, NE, and SE. Ashfall was reported in Severo-Kurilsk (Paramushir Island, about 7 km E) on 7 and 13 October. Satellite data showed a thermal anomaly over the volcano on 15-16 October. Visual data showed ash plumes rising to 2.5-3.6 km altitude on 22, 25-29, and 31 October and moving NE due to constant explosions.
Similar activity continued during November, with explosions, ash plumes, and ashfall occurring. KVERT issued VONAs on 1-2, 4, 6-7, 9, 13, and 16 November that reported explosions and resulting ash plumes that rose to 1.7-3.6 km altitude and drifted 3-5 km SE, ESE, E, and NE. On 1 November ash plumes extended as far as 110 km SE. On 5, 8, 12, and 24-25 November explosions and ash plumes rose to 2-3.1 km altitude and drifted N and E. Ashfall was observed in Severo-Kurilsk on 7 and 16 November. A thermal anomaly was visible during 1-4, 16, and 20 November. Explosions during 26 November rose as high as 2.7 km altitude and drifted NE (figure 45).
Explosions and ash plumes continued to occur in December. During 1-2 and 4 December volcanologists from Severo-Kurilsk observed explosions that sent ash to 1.9-2.5 km altitude and drifted NE and SE (figure 46). VONAs were issued on 5, 9, and 16 December reporting that explosions generated ash plumes rising to 1.9 km, 2.6 km, and 2.4 km altitude and drifted 5 km SE, E, and NE, respectively. A thermal anomaly was visible in satellite imagery on 16 December. On 18 and 27-28 December explosions produced ash plumes that rose to 2.5 km altitude and drifted NE and SE. On 31 December an ash plume rose to 2 km altitude and drifted NE.
Explosions continued during January 2023, based on visual observations by volcanologists from Severo-Kurilsk. During 1-7 January explosions generated ash plumes that rose to 4 km altitude and drifted NE, E, W, and SE. According to VONAs issued by KVERT on 2, 4, 10, and 23 January, explosions produced ash plumes that rose to 2-4 km altitude and drifted 5 km N, NE, E, and ENE; the ash plume that rose to 4 km altitude occurred on 10 January (figure 47). Satellite data showed a thermal anomaly during 3-4, 10, 13, 16, 21, 22, and 31 January. KVERT reported that an ash cloud on 4 January moved 12 km NE. On 6 and 9-11 January explosions sent ash plumes to 4.5 km altitude and drifted W and ESE. On 13 January an ash plume rose to 3 km altitude and drifted SE. During 20-24 January ash plumes from explosions rose to 3.7 km altitude and drifted SE, N, and NE. On 21 January the ash plume drifted as far as 40 km NE. During 28-29 and 31 January and 1 February ash plumes rose to 4 km altitude and drifted NE.
During February, explosions, ash plumes, and ashfall were reported. During 1, 4-5 and 7-8 February explosions generated ash plumes that rose to 4.5 km altitude and drifted E and NE; ashfall was observed on 5 and 8 February. On 6 February an explosion produced an ash plume that rose to 3 km altitude and drifted 7 km E, causing ashfall in Severo-Kurilsk. A thermal anomaly was visible in satellite data on 8, 9, 13, and 21 February. Explosions on 9 and 12-13 February produced ash plumes that rose to 4 km altitude and drifted E and NE; the ash cloud on 12 February extended as far as 45 km E. On 22 February explosions sent ash to 3 km altitude that drifted E. During 24 and 26-27 February ash plumes rose to 4 km altitude and drifted E. On 28 February an explosion sent ash to 2.5-3 km altitude and drifted 5 km E; ashfall was observed in Severo-Kurilsk.
Activity continued during March; visual observations showed that explosions generated ash plumes that rose to 3.6 km altitude on 3, 5-7, and 9-12 March and drifted E, NE, and NW. Thermal anomalies were visible on 10, 13, and 29-30 March in satellite imagery. On 18, 21-23, 26, and 29-30 March explosions produced ash plumes that rose to 2.8 km altitude and drifted NE and E; the ash plumes during 22-23 March extended up to 76 km E. A VONA issued on 21 March reported an explosion that produced an ash plume that rose to 2.8 km altitude and drifted 5 km E. Another VONA issued on 23 March reported that satellite data showed an ash plume rising to 3 km altitude and drifted 14 km E.
Explosions during April continued to generate ash plumes. On 1 and 4 April an ash plume rose to 2.8-3.5 km altitude and drifted SE and NE. A thermal anomaly was visible in satellite imagery during 1-6 April. Satellite data showed ash plumes and clouds rising to 2-3 km altitude and drifting up to 12 km SW and E on 3 and 6 April (figure 48). KVERT issued VONAs on 3, 5, 14, 16 April describing explosions that produced ash plumes rising to 3 km, 3.5 km, 3.5 km, and 3 km altitude and drifting 5 km S, 5 km NE and SE, 72 km NNE, and 5 km NE, respectively. According to satellite data, the resulting ash cloud from the explosion on 14 April was 25 x 7 km in size and drifted 72-104 km NNE during 14-15 April. According to visual data by volcanologists from Severo-Kurilsk explosions sent ash up to 3.5 km altitude that drifted NE and E during 15-16, 22, 25-26, and 29 April.
The explosive eruption continued during May. Explosions during 3-4, 6-7, and 9-10 May generated ash plumes that rose to 4 km altitude and drifted SW and E. Satellite data showed a thermal anomaly on 3, 9, 13-14, and 24 May. During 12-16, 23-25, and 27-28 May ash plumes rose to 3.5 km altitude and drifted in different directions due to explosions. Two VONA notices were issued on 16 and 25 May, describing explosions that generated ash plumes rising to 3 km and 3.5 km altitude, respectively and extending 5 km E. The ash cloud on 25 May drifted 75 km SE.
Thermal activity in the summit crater, occasionally accompanied by ash plumes and ash deposits on the SE and E flanks due to frequent explosions, were visible in infrared and true color satellite images (figure 49).
Geologic Background. The flat-topped summit of the central cone of Ebeko volcano, one of the most active in the Kuril Islands, occupies the northern end of Paramushir Island. Three summit craters located along a SSW-NNE line form Ebeko volcano proper, at the northern end of a complex of five volcanic cones. Blocky lava flows extend west from Ebeko and SE from the neighboring Nezametnyi cone. The eastern part of the southern crater contains strong solfataras and a large boiling spring. The central crater is filled by a lake about 20 m deep whose shores are lined with steaming solfataras; the northern crater lies across a narrow, low barrier from the central crater and contains a small, cold crescentic lake. Historical activity, recorded since the late-18th century, has been restricted to small-to-moderate explosive eruptions from the summit craters. Intense fumarolic activity occurs in the summit craters, on the outer flanks of the cone, and in lateral explosion craters.
Information Contacts: Kamchatka Volcanic Eruptions Response Team (KVERT), Far Eastern Branch, Russian Academy of Sciences, 9 Piip Blvd., Petropavlovsk-Kamchatsky, 683006, Russia (URL: http://www.kscnet.ru/ivs/kvert/); MIROVA (Middle InfraRed Observation of Volcanic Activity), a collaborative project between the Universities of Turin and Florence (Italy) supported by the Centre for Volcanic Risk of the Italian Civil Protection Department (URL: http://www.mirovaweb.it/); Copernicus Browser, Copernicus Data Space Ecosystem, European Space Agency (URL: https://dataspace.copernicus.eu/browser/).
Home Reef
Tonga
18.992°S, 174.775°W; summit elev. -10 m
All times are local (unless otherwise noted)
Discolored plumes continued during November 2022-April 2023
Home Reef is a submarine volcano located in the central Tonga islands between Lateiki (Metis Shoal) and Late Island. The first recorded eruption occurred in the mid-19th century, when an ephemeral island formed. An eruption in 1984 produced a 12-km-high eruption plume, a large volume of floating pumice, and an ephemeral island 500 x 1,500 m wide, with cliffs 30-50 m high that enclosed a water-filled crater. Another island-forming eruption in 2006 produced widespread pumice rafts that drifted as far as Australia; by 2008 the island had eroded below sea level. The previous eruption occurred during October 2022 and was characterized by a new island-forming eruption, lava effusion, ash plumes, discolored water, and gas-and-steam plumes (BGVN 47:11). This report covers discolored water plumes during November 2022 through April 2023 using satellite data.
Discolored plumes continued during the reporting period and were observed in true color satellite images on clear weather days. Satellite images show light green-yellow discolored water extending W on 8 and 28 November 2022 (figure 31), and SW on 18 November. Light green-yellow plumes extended W on 3 December, S on 13 December, SW on 18 December, and W and S on 23 December (figure 31). On 12 January 2023 discolored green-yellow plumes extended to the NE, E, SE, and N. The plume moved SE on 17 January and NW on 22 January. Faint discolored water in February was visible moving NE on 1 February. A discolored plume extended NW on 8 and 28 March and NW on 13 March (figure 31). During April, clear weather showed green-blue discolored plumes moving S on 2 April, W on 7 April, and NE and S on 12 April. A strong green-yellow discolored plume extended E and NE on 22 April for several kilometers (figure 31).
Geologic Background. Home Reef, a submarine volcano midway between Metis Shoal and Late Island in the central Tonga islands, was first reported active in the mid-19th century, when an ephemeral island formed. An eruption in 1984 produced a 12-km-high eruption plume, large amounts of floating pumice, and an ephemeral 500 x 1,500 m island, with cliffs 30-50 m high that enclosed a water-filled crater. In 2006 an island-forming eruption produced widespread dacitic pumice rafts that drifted as far as Australia. Another island was built during a September-October 2022 eruption.
Information Contacts: Copernicus Browser, Copernicus Data Space Ecosystem, European Space Agency (URL: https://dataspace.copernicus.eu/browser/).
Ambae
Vanuatu
15.389°S, 167.835°E; summit elev. 1496 m
All times are local (unless otherwise noted)
New lava flow, ash plumes, and sulfur dioxide plumes during February-May 2023
Ambae, also known as Aoba, is a large basaltic shield volcano in Vanuatu. A broad pyroclastic cone containing three crater lakes (Manaro Ngoru, Voui, and Manaro Lakua) is located at the summit within the youngest of at least two nested calderas. Periodic phreatic and pyroclastic explosions have been reported since the 16th century. A large eruption more than 400 years ago resulted in a volcanic cone within the summit crater that is now filled by Lake Voui; the similarly sized Lake Manaro fills the western third of the caldera. The previous eruption ended in August 2022 that was characterized by gas-and-steam and ash emissions and explosions of wet tephra (BGVN 47:10). This report covers a new eruption during February through May 2023 that consisted of a new lava flow, ash plumes, and sulfur dioxide emissions, using information from the Vanuatu Meteorology and Geo-Hazards Department (VMGD) and satellite data.
During the reporting period, the Alert Level remained at a 2 (on a scale of 0-5), which has been in place since December 2021. Activity during October 2022 through March 2023 remained relatively low and mostly consisted of gas-and-steam emissions in Lake Voui. VMGD reported that at 1300 on 15 November a satellite image captured a strong amount of sulfur dioxide rising above the volcano (figure 99), and that seismicity slightly increased. The southern and northern part of the island reported a strong sulfur dioxide smell and heard explosions. On 20 February 2023 a gas-and-ash plume rose 1.3 km above the summit and drifted SSW, according to a webcam image (figure 100). Gas-and-steam and possibly ash emissions continued on 23 February and volcanic earthquakes were recorded by the seismic network.
During April, volcanic earthquakes and gas-and-steam and ash emissions were reported from the cone in Lake Voui. VMGD reported that activity increased during 5-7 April; high gas-and-steam and ash plumes were visible, accompanied by nighttime incandescence. According to a Wellington VAAC report, a low-level ash plume rose as high as 2.5 km above the summit and drifted W and SW on 5 April, based on satellite imagery. Reports in Saratamata stated that a dark ash plume drifted to the WSW, but no loud explosion was heard. Webcam images from 2100 showed incandescence above the crater and reflected in the clouds. According to an aerial survey, field observations, and satellite data, water was no longer present in the lake. A lava flow was reported effusing from the vent and traveling N into the dry Lake Voui, which lasted three days. The next morning at 0745 on 6 April a gas-and-steam and ash plume rose 5.4 km above the summit and drifted ESE, based on information from VMGD (figure 101). The Wellington VAAC also reported that light ashfall was observed on the island. Intermittent gas-and-steam and ash emissions were visible on 7 April, some of which rose to an estimated 3 km above the summit and drifted E. Webcam images during 0107-0730 on 7 April showed continuing ash emissions. A gas-and-steam and ash plume rose 695 m above the summit crater at 0730 on 19 April and drifted ESE, based on a webcam image (figure 102).
According to visual and infrared satellite data, water was visible in Lake Voui as late as 24 March 2023 (figure 103). The vent in the caldera showed a gas-and-steam plume drifted SE. On 3 April thermal activity was first detected, accompanied by a gas-and-ash plume that drifted W (figure 103). The lava flow moved N within the dry lake and was shown cooling by 8 April. By 23 April much of the water in the lake had returned. Occasional sulfur dioxide plumes were detected by the TROPOMI instrument on the Sentinel-5P satellite that exceeded 2 Dobson Units (DU) and drifted in different directions (figure 104).
Geologic Background. The island of Ambae, also known as Aoba, is a massive 2,500 km3 basaltic shield that is the most voluminous volcano of the New Hebrides archipelago. A pronounced NE-SW-trending rift zone with numerous scoria cones gives the 16 x 38 km island an elongated form. A broad pyroclastic cone containing three crater lakes (Manaro Ngoru, Voui, and Manaro Lakua) is located at the summit within the youngest of at least two nested calderas, the largest of which is 6 km in diameter. That large central edifice is also called Manaro Voui or Lombenben volcano. Post-caldera explosive eruptions formed the summit craters about 360 years ago. A tuff cone was constructed within Lake Voui (or Vui) about 60 years later. The latest known flank eruption, about 300 years ago, destroyed the population of the Nduindui area near the western coast.
Information Contacts: Geo-Hazards Division, Vanuatu Meteorology and Geo-Hazards Department (VMGD), Ministry of Climate Change Adaptation, Meteorology, Geo-Hazards, Energy, Environment and Disaster Management, Private Mail Bag 9054, Lini Highway, Port Vila, Vanuatu (URL: http://www.vmgd.gov.vu/, https://www.facebook.com/VanuatuGeohazardsObservatory/); Wellington Volcanic Ash Advisory Centre (VAAC), Meteorological Service of New Zealand Ltd (MetService), PO Box 722, Wellington, New Zealand (URL: http://www.metservice.com/vaac/, http://www.ssd.noaa.gov/VAAC/OTH/NZ/messages.html); MIROVA (Middle InfraRed Observation of Volcanic Activity), a collaborative project between the Universities of Turin and Florence (Italy) supported by the Centre for Volcanic Risk of the Italian Civil Protection Department (URL: http://www.mirovaweb.it/); Global Sulfur Dioxide Monitoring Page, Atmospheric Chemistry and Dynamics Laboratory, NASA Goddard Space Flight Center (NASA/GSFC), 8800 Greenbelt Road, Goddard, Maryland, USA (URL: https://so2.gsfc.nasa.gov/); Copernicus Browser, Copernicus Data Space Ecosystem, European Space Agency (URL: https://dataspace.copernicus.eu/browser/).
Search Bulletin Archive by Publication Date
Select a month and year from the drop-downs and click "Show Issue" to have that issue displayed in this tab.
The default month and year is the latest issue available.
Bulletin of the Global Volcanism Network - Volume 26, Number 09 (September 2001)
Managing Editor: Richard Wunderman
Batur (Indonesia)
White, thin plume to 10 m above crater rim during March and April 2001
Etna (Italy)
Strong June eruptions, a M 3.9 earthquake, copious July-August flank lavas, and a new cone
Fujisan (Japan)
April-May 2001 earthquakes located at 15 km depth NE of the summit
Guagua Pichincha (Ecuador)
Gradual dome growth through March; ash emissions through May 2001
Ijen (Indonesia)
Heightened seismicity through at least September 2001, white-gray plume to ~100 m
Inielika (Indonesia)
Small February-March 2001 ash plumes and generally low seismicity
Ioto (Japan)
In September, a submarine eruption; in October, a phreatic eruption pierces beach
Kama'ehuakanaloa (United States)
Earthquake swarm during 10-13 September 2001
Kie Besi (Indonesia)
Brush fire leads to a falsely alleged 16-17 August 2001 eruption report
Kilauea (United States)
Branching lava flows, ocean entries, and elevated seismicity into September 2001
Krakatau (Indonesia)
Increase in seismicity during July through August 2001; ash and bomb ejection
West Valley Segment (Canada)
T-wave swarm devoid of tremor during 6-27 September 2001
Whakaari/White Island (New Zealand)
In early 2001, 145°C degassing and an ash plume to ~2 km height
Batur (Indonesia) — September 2001 Cite this Report
Batur
Indonesia
8.2403°S, 115.3775°E; summit elev. 1711 m
All times are local (unless otherwise noted)
White, thin plume to 10 m above crater rim during March and April 2001
During March and April 2001, a thin-white plume was observed reaching up to 10 m above the crater rim at Batur. During January through April 2001 unspecified categories of monthly earthquakes numbered 6, 10, 20, and 6, respectively; their depths were 2-5 km. Some further details on specific types of March-April earthquakes appear in table 2. Based on these data, the Volcanological Survey of Indonesia (VSI) lowered the Alert Level from 2 to 1 (on a scale of 1-4) in early May. No further activity has been reported as of September 2001.
Table 2. Seismic activity registered at Batur during March and April 2001. Courtesy of VSI.
| Date |
Deep volcanic (A-type) |
Shallow volcanic (B-type) |
Small explosion |
Tectonic |
| 06 Mar-12 Mar 2001 |
-- |
3 |
5 |
14 |
| 12 Mar-18 Mar 2001 |
4 |
3 |
3 |
2 |
| 19 Mar-23 Mar 2001 |
-- |
1 |
-- |
10 |
| 27 Mar-01 Apr 2001 |
-- |
-- |
8 |
7 |
| 02 Apr-09 Apr 2001 |
1 |
2 |
5 |
10 |
| 09 Apr-15 Apr 2001 |
2 |
-- |
2 |
17 |
| 16 Apr-23 Apr 2001 |
-- |
1 |
2 |
10 |
Geologic Background. The historically active Batur is located at the center of two concentric calderas NW of Agung volcano. The outer 10 x 13.5 km caldera was formed during eruption of the Bali (or Ubud) Ignimbrite about 29,300 years ago and now contains a caldera lake on its SE side, opposite the Gunung Abang cone, the topographic high of the complex. The inner 6.4 x 9.4 km caldera was formed about 20,150 years ago during eruption of the Gunungkawi Ignimbrite. The SE wall of the inner caldera lies beneath Lake Batur; Batur cone has been constructed within the inner caldera to a height above the outer caldera rim. The Batur stratovolcano has produced vents over much of the inner caldera, but a NE-SW fissure system has localized the Batur I, II, and III craters along the summit ridge. Recorded eruptions have been characterized by mild-to-moderate explosive activity sometimes accompanied by lava emission. Basaltic lava flows from both summit and flank vents have reached the caldera floor and the shores of Lake Batur in historical time.
Information Contacts: Dali Ahmad, Volcanological Survey of Indonesia (VSI), Jalan Diponegoro No. 57, Bandung 40122, Indonesia (URL: http://www.vsi.esdm.go.id/).
Etna
Italy
37.748°N, 14.999°E; summit elev. 3357 m
All times are local (unless otherwise noted)
Strong June eruptions, a M 3.9 earthquake, copious July-August flank lavas, and a new cone
Although Etna's early June 2001 eruptions were unusually vigorous (BGVN 26:08), still more energetic behavior followed. An earthquake swarm took place in mid-July, and large SSE-flank eruptions vented lavas in late July and early August on a scale not seen since 1983.
This report covers mid-June through early August 2001. During this interval, the highest cited lava fountains reached heights of ~ 0.7 km; ash plumes rose 3 km; lava flows stretched ~ 6 km from their source vents (largely, though not exclusively traveling due S); and people constructed earthen berms to constrain lava flows. Etna repeatedly made international news during this period. Outstanding photographs appeared widely; some may be seen on the website of Tom Pfeiffer, who graciously provided several for this report.
The text of this report came from two key sources: 1) reports by Sistema Poseidon covered the interval from 11 June-8 July; 2) a report by Jean-Claude Tanguy, Roberto Clocchiatti, Santo La Delfa, and Giuseppe Patanè for 17 July-early August. The latter group acknowledged the valuable insights from Giovanni Frazzetta of Sistema Poseidon and from local guides, particularly Alfio Mazzaglia, Antonio and Orazio Nicoloso, Alfio Carbonaro, and Giuseppe Mazzaglia. The group also received valuable contributions from Charles Rivière and Giuseppe Scarpinati.
Activity during 11 June-8 July. In the weeks of middle to late June the N-flank of the secondary vent at Southeast Crater (SEC) was very active. There were four eruptive events there during 11-17 June. Between these episodes volcanism was limited to degassing at all of the summit vents and lava outpourings from the SEC N-flank vent. Lava flows reached a length of just over 2 km, descending to elevations of 2,600 m or lower. Some lava fountains were accompanied by brown ash emissions for periods of 10 minutes to several hours. Each fountaining episode commenced with 5-11 hours of buildup, followed by more intense events lasting ~1 hour. Observers in a helicopter on 17 June saw a widening of the interior of Bocca Nuova (BN), primarily in the W sector extending ~20 m back from the former crater rim.
During 18-24 June SEC's N-flank vent produced three vigorous eruptive episodes. The first episode began about 1700 on 19 June and increased gradually in intensity. At 2040 the lava fountains reached ~ 700 m high; these diminished at about 2110, and after 2130 the episode ended.
A second N-flank SEC episode began at about 1700 on 22 June. At 1730 lava fountaining reached a height of ~ 200 m accompanied by brown ash, possibly indicating that the vent had widened. At about 1750, the lava fountain at the secondary vent produced jets up to 10-20 m and lava spattering from the N base, which ultimately widened the lava field. During this time the lava fountain from SEC increased to 300-400 m high. The associated reddish ash plume rose 1-2 km above SEC. At 1800 on 22 June lava fountaining became almost continuous, but without a continuous ash column. At 1810 the ash plume rose to over 3 km, with the quantity of ash in the plume increasing gradually; lava emissions from the secondary vent increased simultaneously. The event diminished rapidly after 1835.
The third episode began on 24 June with a small lava emission at the base of SEC. Unlike the preceding two episodes, this one began with consistent ash emissions from Northeast Crater (NEC), beginning about 1654 on 24 June with pressurized pulses that formed a plume ~1 km high at about 1700. Ash emissions continued for the next few hours and at 1815 Strombolian eruptions began again at SEC. At 1930 explosive activity began at the secondary vent on the N flank of SEC. At 2000 the explosive activity spread to the whole fissure. Lava emissions increased rapidly, and at 2015 lava fountains reached 200 m high. Lava flows at 2045 reached a length of ~ 2-3 km. The episode peaked at about 2030, diminished visibly at 2115, and had ended completely by about 2250.
SEC generated its tenth eruptive episode of the month on 27 June. The strongest part of that event took place during 2120-2200, with Strombolian activity becoming more intense and lava fountains at the summit reaching 400-500 m high. This event ended about 2300. Another event at SEC took place on 29 June, with flashes coming from the NE flank. At NEC, mixed ash and gas emissions continued. A continuous plume was produced over the summit of the volcano, variable according to the wind intensity and extending for a few hundred meters.
During 2-8 July, explosive Strombolian episodes continued at SEC. The periods between events were calm. An eruptive episode on 4 July began with slow lava emission from the N-flank secondary vent, followed by increased Strombolian activity at the summit. Explosions were discontinuous but violent, with fragments of incandescent magma ejected 150-200 m above the crater rim. The secondary N-flank vent produced less explosive activity. The intensity peaked at about 2100 when lava emerging from the summit vent of SEC reached a height of 50-60 m, and explosions sent ejecta to a height of ~400 m. At this time, a lava flow reached a length of ~2 km to the E, heading toward the Valle del Bove. Beginning at 2150 on 4 July, the Strombolian explosions became progressively less frequent although at that time the lava flow was being vigorously fed.
A few days later, tall ash plumes appeared. Activity began on 6 July with the reactivation of the then slow-moving lava flow emerging from SEC's N-flank secondary vent. At about 0600 copious degassing was seen at the SEC, accompanied by sporadic Strombolian explosions. At 0745 an ash-rich eruptive cloud containing lapilli rose 500-600 m. The plume blew E and SE and continued to ascend to 1.5-2.0 km above the crater area. One of the larger outbursts during the reporting interval, the eruption produced widespread ashfalls in the areas of Milo and Zafferana Etnea to Aci Castello and the northern limits of Catania. At about 1000 the explosions became progressively less frequent and strong. The lava flow continued to be well-fed and reached a maximum length of more than 2.5 km. The lava front reached nearly to the base of the W face of the Valle del Bove, not far from Monti Centenari. From 1050 on, the explosive phase diminished, although the lava flow was well-fed until about 0700 on 7 July.
Early on 13 July the 14th SEC event was accompanied by an impressive earthquake swarm, which included a M 3.9 shock felt to the SE, particularly in the coastal town of Acireale. More than 2,000 shocks were recorded during the following two days. Meanwhile, fissures appeared and gradually enlarged on the upper S flank along the 1989-91 fracture zone, a place where unusual fumarolic activity had previously been observed.
Activity during July-August 2001: S-flank fissures. On 17 July another strong eruption from the SEC was followed by lava venting from a fissure near 3,000 m elevation. This spot lay just below the "Sudestino," a small parasitic vent that had appeared last year at the S base of the SE cone, and where incandescence had persisted at a depth of a few tens of centimeters. Weak explosive activity quickly formed small hornitos, and lava flows proceeded SE towards the Valle del Bove depression. In the afternoon of the same day new vents appeared between 2,800 and 2,700 m elevation, along a trend oriented SSW. These vents emitted lava fragments and moderate lava flows that began to invade the area of the upper cable-way station at 2,500 m elevation.
On 18 July at 0120 another new vent opened to the S at 2,100 m elevation. This vent appeared just beside the Sapienza refuge and the lower cable-way station, ~ 200 m upslope from the famous Mt. Silvestri (cinder cones born in 1892 and subsequently visited by millions of tourists). This vent produced a low lava fountain. A sluggish lava flow gradually grew and traveled W of Mt. Silvestri, threatening a restaurant and cutting the SP 92 road. This became the main lava flow that headed S in the direction of Nicolosi, a village 10 km away at 700 m elevation.
On 19 July at about 1800 an explosive vent appeared near 2,600 m elevation above the Montagnola (a large cinder cone born in 1763, which still dominates the landscape and towers over the Sapienza tourist complex). The Montagnola vent area sometimes contains a small ephemeral crater lake that is variously called "Cono del Lago," "Cratere del Lago," and "Montagnola 2" (M2). M2 is ~3 km S of SEC. On 19 July the M2 vent released dense clouds of fine ash that disturbed people on Etna's E and S sides.
On 20 July the fracture zone extended northward, cutting across and beyond the SEC summit. Where it descended the other side of the mountain, it formed a strange, curved fissure that opened at 2,650 m elevation, forming a vent. The fissure followed the northern base of the Valle del Leone depression. This vent emitted a moderate lava flow and built a small hornito.
The climax of the eruption was reached on 21-23 July when phreatomagmatic activity from the M2 vent fed an impressive and continuous ash plume (figure 86). The plume interrupted air traffic at Catania airport and caused disruptions as far away as Syracuse, 100 km S of Etna. By this time the main lava flow from the 2,100-m vent (figures 87 and 88) had reached 1,030 m elevation, ~ 6 km from its source and 4 km from Nicolosi. However, no concern was raised for the little town as the lava fronts had practically stopped advancing on the gentle slope and the effusion rate remained moderate (5-10 m3/s).
The Sapienza complex at 1,900 m elevation was more seriously threatened by lava flows. Some of these flows had originated at the 2,700 m vents, and later from effusive vents at the lower base of M2 (near 2,580 m elevation on 26 and 31 July). Earthen barriers protected the buildings; however, the complex was left in a vulnerable hollow between the new lava flows on the E and the 1983 flows on the W.
The highly explosive M2 vent at 2,600 m elevation created a big show beginning with black ash mixed with a few incandescent materials forming jets with the elongate shapes of Cypress trees (figure 89). On 25 July the activity turned magmatic, quickly building a scoria cone ~ 97 m high (based on post-eruption range-finder and altimeter measurements that yielded summit and lower SW base elevations of 2,674 ± 3 m at 2,577 ± 5 m, respectively).
A second climax was reached on 28 July when powerful explosions hurled car-sized lava lumps in a radius of over 500 m. These seriously damaged the upper cable-way station and rattled windows all around the volcano (figure 90).
The eruption's waning stages began 1 August. Ash became more and more abundant from the M2 vent, but was driven by considerably decreased pressure. Effusive activity had practically stopped at the 2,580-m-elevation vents. On 2 August both explosive and effusive activity ceased at the 3,000-m-elevation hornitos, and activity began to decrease along the 2,700-m-elevation fissure, except for the lava flow, which remained well fed and headed SW. At the M2 vent ash emissions practically ceased on 6 August and at the 2,100 m vents the last lava flow was observed on 8 August.
This eruption appeared quite unusual in a number of ways. The flank fissure always remained active throughout its entire length, from 2,100 m to 3,000 m elevation and above (small lava flows were seen several times on the NE side of the SEC at 3,100 m elevation, for example, on 24 August. The explosivity of the M2 vent was exceptionally high for Etna. The lavas emitted in the upper region are almost aphyric, whereas products from the M2 and 2,100 m vents are rich in large phenocrysts, including amphibole, and contain numerous inclusions from the sedimentary basement (sandstones). Although further detailed study is needed, this fact led several scientists to suggest that the 2,600-2,100 m part of the fissure represents a separate eruption triggered by upslope activity.
Geologic Background. Mount Etna, towering above Catania on the island of Sicily, has one of the world's longest documented records of volcanism, dating back to 1500 BCE. Historical lava flows of basaltic composition cover much of the surface of this massive volcano, whose edifice is the highest and most voluminous in Italy. The Mongibello stratovolcano, truncated by several small calderas, was constructed during the late Pleistocene and Holocene over an older shield volcano. The most prominent morphological feature of Etna is the Valle del Bove, a 5 x 10 km caldera open to the east. Two styles of eruptive activity typically occur, sometimes simultaneously. Persistent explosive eruptions, sometimes with minor lava emissions, take place from one or more summit craters. Flank vents, typically with higher effusion rates, are less frequently active and originate from fissures that open progressively downward from near the summit (usually accompanied by Strombolian eruptions at the upper end). Cinder cones are commonly constructed over the vents of lower-flank lava flows. Lava flows extend to the foot of the volcano on all sides and have reached the sea over a broad area on the SE flank.
Information Contacts: Sistema Poseidon, a cooperative project supported by both the Italian and the Sicilian regional governments, and operated by several scientific institutions (URL: http://www.ct.ingv.it/en/chi-siamo/la-sezione.html); Jean-Claude Tanguy, University of Paris 6 and IPGP, 94107 St. Maur des Fossés Cedex, France; Roberto Clocchiatti, CNRS and CEN Saclay, 91191 Gif sur Yvette Cedex, France; Santo La Delfa and Giuseppe Patanè, University of Catania, 55 Corso Italia, 95129 Catania, Italy; Tom Pfeiffer, Department of Earth Sciences, University of Aarhus, C.F. Møllers Allé 120, DK-8000 Aarhus C, Denmark (URL: http://geo.au.dk/).
Fujisan (Japan) — September 2001 Cite this Report
Fujisan
Japan
35.361°N, 138.728°E; summit elev. 3776 m
All times are local (unless otherwise noted)
April-May 2001 earthquakes located at 15 km depth NE of the summit
Earthquakes increased at Fuji during April-May 2001. According to the Japan Meteorological Agency 67 earthquakes were detected on 30 April. This was the highest daily number since the 53 that occurred on 18 December 2000, even though seismic activity had been relatively low since the beginning of the year. During the week of 3-9 May 2001 the number of weekly earthquakes was as high as 130. Since September 2000 most of the earthquakes were of low magnitude and low frequency. Their hypocenters were NE of the summit at ~15 km depth. The monitoring system of National Research Institute for Earth Science and Disaster Prevention had not detected any other anomalous signs.
Geologic Background. The conical form of Fujisan, Japan's highest and most noted volcano, belies its complex origin. The modern postglacial stratovolcano is constructed above a group of overlapping volcanoes, remnants of which form irregularities on Fuji's profile. Growth of the Younger Fuji volcano began with a period of voluminous lava flows from 11,000 to 8000 years before present (BP), accounting for four-fifths of the volume of the Younger Fuji volcano. Minor explosive eruptions dominated activity from 8000 to 4500 BP, with another period of major lava flows occurring from 4500 to 3000 BP. Subsequently, intermittent major explosive eruptions occurred, with subordinate lava flows and small pyroclastic flows. Summit eruptions dominated from 3000 to 2000 BP, after which flank vents were active. The extensive basaltic lava flows from the summit and some of the more than 100 flank cones and vents blocked drainages against the Tertiary Misaka Mountains on the north side of the volcano, forming the Fuji Five Lakes, popular resort destinations. The last confirmed eruption of this dominantly basaltic volcano in 1707 was Fuji's largest during historical time. It deposited ash on Edo (Tokyo) and formed a large new crater on the east flank.
Information Contacts: National Research Institute for Earth Science and Disaster Prevention, 3-1 Tennodai, Tsukuba-shi, Ibaraki-ken, 305, Japan (URL: http://www.bosai.go.jp/); Setsuya Nakada, Hidefumi Watanabe, and Shin-ichi Sakai, Volcano Research Center, Earthquake Research Institute, University of Tokyo, Yayoi 1-1-1, Bunkyo-ku, Tokyo 113-0032, Japan (URL: http://www.eri.u-tokyo.ac.jp/VRC/index_E.html); Japan Meteorological Agency, Volcanological Division, 1-3-4 Ote-machi, Chiyoda-ku, Tokyo 100, Japan (URL: http://www.jma.go.jp/).
Guagua Pichincha (Ecuador) — September 2001 Cite this Report
Guagua Pichincha
Ecuador
0.171°S, 78.598°W; summit elev. 4784 m
All times are local (unless otherwise noted)
Gradual dome growth through March; ash emissions through May 2001
This report covers the interval from mid-January through May 2001. The previous report (BGVN 26:01) noted that a new dome ("dome 9") resulted from lava extrusions subsequent to explosions on 23 July 2000.
The volcano remained at Alert Level Yellow throughout the report period. Activity consisted principally of consistent, gradual growth of dome 9 through 26 March when the small number of rockfall signals suggested that the dome was stable. Seismicity and other volcanic activity has been moderate with small rockfalls occurring during February. The Washington Volcanic Ash Advisory Center (VAAC) reported ash emissions on 18 and 31 March, and again on 25 May; however, none of these were visible on GOES-8 imagery. The ash emission on 25 May rose to ~8.5 km altitude, the highest of those reported. A large number of long-period (LP) earthquakes also occurred during March. More than 806 LP earthquakes were registered during the week of 18-24 March but 460 of these occurred on 18 March in conjunction with the ash emission on that date.
Geologic Background. Guagua Pichincha and the older Pleistocene Rucu Pichincha stratovolcanoes form a broad volcanic massif that rises immediately W of Ecuador's capital city, Quito. A lava dome grew at the head of a 6-km-wide scarp formed during a late-Pleistocene slope failure ~50,000 years ago. Subsequent late-Pleistocene and Holocene eruptions from the central vent consisted of explosive activity with pyroclastic flows accompanied by periodic growth and destruction of the lava dome. Many minor eruptions have been recorded since the mid-1500's; the largest took place in 1660, when ash fell over a 1,000 km radius and accumulated to 30 cm depth in Quito. Pyroclastic flows and surges also occurred, primarily to then W, and affected agricultural activity.
Information Contacts: Instituto Geofísico (IG), Escuela Politécnica Nacional, Apartado 17-01-2759, Quito, Ecuador (URL: http://www.igepn.edu.ec/); Washington Volcanic Ash Advisory Center (VAAC), Satellite Analysis Branch, NOAA/NESDIS E/SP23, NOAA Science Center Room 401, 5200 Auth Road, Camp Springs, MD 20746, USA (URL: http://www.ssd.noaa.gov/).
Ijen (Indonesia) — September 2001 Cite this Report
Ijen
Indonesia
8.058°S, 114.242°E; summit elev. 2769 m
All times are local (unless otherwise noted)
Heightened seismicity through at least September 2001, white-gray plume to ~100 m
As summarized in table 1, beginning in February and lasting through at least September 2001, Ijen displayed heightened seismicity including tremor, shallow volcanic (B-type) earthquakes, and explosion earthquakes. Deep volcanic (A-type) earthquakes also occurred on a few occasions. The Alert Level remained at 2 (on a scale of 1-4) during most of the report period. Our last report (BGVN 25:10) covered activity through October 2000.
Table 1. Summary of seismicity at Ijen, 30 January-30 September 2001. Measurements in millimeters (mm) indicate amplitudes. Courtesy of the Volcanological Survey of Indonesia (VSI).
| Date |
Deep volcanic (A-type) |
Shallow volcanic (B-type) |
Small explosion |
Tectonic |
Tremor |
| 30 Jan-05 Feb 2001 |
-- |
75 |
2 |
6 |
2 (4 mm) |
| 06 Feb-11 Feb 2001 |
-- |
36 |
2 |
6 |
-- |
| 13 Feb-19 Feb 2001 |
1 |
30 |
3 |
4 |
-- |
| 20 Feb-26 Feb 2001 |
-- |
42 |
-- |
5 |
-- |
| 27 Feb-05 Mar 2001 |
42 (4 mm) |
-- |
-- |
5 |
-- |
| 06 Mar-12 Mar 2001 |
-- |
17 |
-- |
-- |
-- |
| 12 Mar-18 Mar 2001 |
-- |
27 |
3 |
1 |
-- |
| 19 Mar-23 Mar 2001 |
-- |
12 |
4 |
-- |
-- |
| 27 Mar-01 Apr 2001 |
-- |
47 |
1 |
7 |
-- |
| 02 Apr-08 Apr 2001 |
-- |
13 |
1 |
-- |
2 |
| 09 Apr-15 Apr 2001 |
-- |
9 |
-- |
10 |
-- |
| 16 Apr-23 Apr 2001 |
1 |
10 |
-- |
2 |
-- |
| 23 Apr-29 Apr 2001 |
-- |
9 |
1 |
7 |
-- |
| 30 Apr-06 May 2001 |
-- |
4 |
-- |
6 |
-- |
| 07 May-13 May 2001 |
-- |
11 |
-- |
3 |
-- |
| 14 May-20 May 2001 |
-- |
3 |
-- |
-- |
-- |
| 28 May-03 Jun 2001 |
-- |
9 |
2 |
9 |
discontinuous (0.5-3 mm) |
| 02 Jul-08 Jul 2001 |
-- |
9 |
2 |
9 |
discontinuous (0.5-3 mm) |
| 09 Jul-15 Jul 2001 |
1 |
31 |
2 |
7 |
discontinuous (0.5-3 mm) |
| 13 Aug-26 Aug 2001 |
-- |
42 |
1 |
6 |
continuous |
| 27 Aug-02 Sep 2001 |
-- |
16 |
1 |
1 |
continuous |
| 03 Sep-09 Sep 2001 |
-- |
1 |
5 |
5 |
discontinuous |
| 10 Sep-16 Sep 2001 |
-- |
14 |
-- |
4 |
continuous |
| 17 Sep-23 Sep 2001 |
-- |
13 |
-- |
1 |
continuous (0.5-3 mm) |
| 24 Sep-30 Sep 2001 |
-- |
14 |
-- |
4 |
continuous (0.5-3 mm) |
During May, a thin-white plume reached to ~50 m above the summit. The Darwin VAAC reported that at 0120 on 15 July sulfur fumes entered the cabin of an aircraft flying from Singapore to Denpasar. At the time, the aircraft was flying at an altitude of ~2.4 km about 15 km SE of Ijen, the suspected source of the sulfur gas. During mid-August, the crater began to produce a white-grey plume. By the end of September, the plume reached up to ~100 m above the summit.
Geologic Background. The Ijen volcano complex at the eastern end of Java consists of a group of small stratovolcanoes constructed within the 20-km-wide Ijen (Kendeng) caldera. The north caldera wall forms a prominent arcuate ridge, but elsewhere the rim was buried by post-caldera volcanoes, including Gunung Merapi, which forms the high point of the complex. Immediately west of the Gunung Merapi stratovolcano is the historically active Kawah Ijen crater, which contains a nearly 1-km-wide, turquoise-colored, acid lake. Kawah Ijen is the site of a labor-intensive mining operation in which baskets of sulfur are hand-carried from the crater floor. Many other post-caldera cones and craters are located within the caldera or along its rim. The largest concentration of cones forms an E-W zone across the southern side of the caldera. Coffee plantations cover much of the caldera floor; nearby waterfalls and hot springs are tourist destinations.
Information Contacts: Dali Ahmad, Volcanological Survey of Indonesia (VSI), Jalan Diponegoro No. 57, Bandung 40122, Indonesia (URL: http://www.vsi.esdm.go.id/).
Inielika (Indonesia) — September 2001 Cite this Report
Inielika
Indonesia
8.73°S, 120.98°E; summit elev. 1559 m
All times are local (unless otherwise noted)
Small February-March 2001 ash plumes and generally low seismicity
Since the decline in eruptive activity that occurred during 23 January-5 February 2001 (BGVN 26:01), variable seismicity has prevailed. Ash plumes were observed in February and March reaching 10-500 m above the volcano. The Volcanological Survey of Indonesia (VSI) reported varying amounts of seismicity (table 1). VSI has not reported new eruptive activity at Inielika since May 2001.
Table 1. Seismic activity detected at Inielika during February through May 2001. Courtesy of VSI.
| Date |
Deep volcanic (A-type) |
Shallow volcanic (B-type) |
Tectonic |
| 06 Feb-11 Feb 2001 |
23 |
7 |
10 |
| 20 Feb-26 Feb 2001 |
34 |
15 |
32 |
| 27 Feb-05 Mar 2001 |
57 |
19 |
51 |
| 06 Mar-12 Mar 2001 |
30 |
6 |
18 |
| 12 Mar-18 Mar 2001 |
4 |
1 |
13 |
| 19 Mar-23 Mar 2001 |
3 |
-- |
9 |
| 27 Mar-01 Apr 2001 |
6 |
-- |
-- |
| 02 Apr-08 Apr 2001 |
4 |
-- |
11 |
| 09 Apr-15 Apr 2001 |
7 |
4 |
6 |
| 16 Apr-23 Apr 2001 |
5 |
10 |
11 |
| 25 Apr-01 May 2001 |
5 |
10 |
11 |
Geologic Background. Inielika is a broad, low volcano in central Flores Island that was constructed within the Lobobutu caldera. The complex summit contains ten craters, some of which are lake filled, in a 5 km2 area north of the city of Bajawa. The largest of these, Wolo Runu and Wolo Lega North, are 750 m wide. A phreatic explosion in 1905 formed a new crater, and was the volcano's only eruption during the 20th century. Another eruption took place about a century later, in 2001. A chain of Pleistocene cinder cones, the Bajawa cinder cone complex, extends southward to Inierie.
Information Contacts: Dali Ahmad, Volcanological Survey of Indonesia (VSI), Jalan Diponegoro No. 57, Bandung 40122, Indonesia (URL: http://www.vsi.esdm.go.id/).
Ioto
Japan
24.751°N, 141.289°E; summit elev. 169 m
All times are local (unless otherwise noted)
In September, a submarine eruption; in October, a phreatic eruption pierces beach
A submarine eruption at Iwo-jima, off of the island's SE coast, on 21 September was the first reported volcanic activity since November 1982 when an earthquake swarm and weak steam explosions occurred at Asodai Crater (SEAN 08:04). Approximately 1 month after the submarine eruption on the SE side of the island, a small phreatic eruption occurred at Idogahama, a beach on the NW coast of the island.
At 1015 on 21 September a submarine eruption began off of the SE coast of Iwo-jima, an island inhabited by U.S. and Japanese military personnel approximately 1,250 km S of Tokyo. The Japan Maritime Self Defense Force stationed on Iwo-jima observed the eruption, which was preceded by isolated and continuous tremor beginning on 20 September at 2000. Visible evidence of the eruption consisted of seawater gushing several meters above sea level near the island's SE coast. In addition, the eruption was accompanied by an area of discolored seawater extending 300-400 m in length. During 1000-1100 approximately 30 earthquakes occurred in the active area; the typical rate is one or two earthquakes per hour.
The climax of the eruption occurred during 1300-1500. At about 1300 water gushed ~40 m above sea level and accompanying steam rose to 100-300 m. During 1515-1715, Japan Meteorological Agency (JMA) personnel observed seawater rising intermittently in two small dark-gray colored areas 50 m apart and 150-200 m from the island's SE coast (Okinahama beach). The two areas were surrounded by zones of bubbling, white-colored water. The water outside the bubbling zone was emerald green in color. A plume of water rose every few to ten minutes in the western-most area. Measurements with an infrared thermometer revealed that the temperatures in these two areas were 33-34°C and 50°C, while the surrounding water was at 27°C. An approximately 8-km-long and 500-m-wide area of discolored water stretched away from the two areas. By 1500 the number of earthquakes decreased from 30 per hour to about ten. During 1600-1700 three eruption sites were visible; at one a pyroclastic cone was slightly above the sea surface (figures 1 and 2).
JMA reported that the day after the eruption, 22 September, volcanic and seismic activity returned to usual levels, with no water plumes observed and 0-4 earthquakes per hour. In addition, the isolated and continuous tremor events that were recorded during the night of 20 September to the morning of 22 September temporarily ceased. After 21 September areas of discolored water were still visible (figure 3). Until about 28 September many earthquakes and tremor were detected. Results are pending from the analysis of floating pumice that was collected along Iwo-jima's coast after the eruption. Until at least 10 October areas of discolored water were occasionally seen; these were smaller than when the submarine eruption began on 21 September.
After 21 September there was no volcanic activity at Iwo-jima until 19 October. On the morning of 19 October a small phreatic eruption was observed at Idogahama, a beach on the NW coast of the island. The last reported volcanic activity at Idogahama occurred in March 1982 and consisted of a small phreatic eruptions (SEAN 07:09). The Japan Maritime Self Defense Force observed a grayish-white colored plume rising to 200-300 m above the beach surface for 2-3 minutes starting at about 0725. Another similarly sized plume was observed for 10 minutes starting at 0806. JMA, with support from the Japan Maritime Self Defense Force and the Japan Air Self Defense Force, observed the eruption from a helicopter soon after it began.
JMA personnel observed the eruption during 1602-1715 and measured the temperature of the eruption site with an infrared camera. They estimated that the main crater formed during the eruption was about 10 m long and 2-3 m deep. Inside the crater, every 10 minutes intermittent gushing of black water and entrained debris was observed (figure 4). An accompanying white steam plume reached a maximum height of 600 m above the beach during the observations. The temperature inside the crater was 56°C.
Geologic Background. Ioto, in the Volcano Islands of Japan, lies within a 9-km-wide submarine caldera. The volcano is also known as Ogasawara-Iojima to distinguish it from several other "Sulfur Island" volcanoes in Japan. The triangular, low-elevation, 8-km-long island narrows toward its SW tip and has produced trachyandesitic and trachytic rocks that are more alkalic than those of other volcanoes in this arc. The island has undergone uplift for at least the past 700 years, accompanying resurgent doming of the caldera; a shoreline landed upon by Captain Cook's surveying crew in 1779 is now 40 m above sea level. The Motoyama plateau on the NE half of the island consists of submarine tuffs overlain by coral deposits and forms the island's high point. Many fumaroles are oriented along a NE-SW zone cutting through Motoyama. Numerous recorded phreatic eruptions, many from vents on the W and NW sides of the island, have accompanied the uplift.
Information Contacts: Setsuya Nakada, Volcano Research Center, Earthquake Research Institute, University of Tokyo, Yayoi 1-1-1, Bunkyo-ku, Tokyo 113-0032, Japan (URL: http://www.eri.u-tokyo.ac.jp/VRC/index_E.html); Mr. Odai, Mr. Nakahori, and Tomoyuki Kanno, Volcanological Division, Seismological and Volcanological Department, Japan Meteorological Agency (JMA), 1-3-4 Ote-machi, Chiyoda-ku, Tokyo 100 Japan (URL: http://www.jma.go.jp/).
Kama'ehuakanaloa (United States) — September 2001 Cite this Report
Kama'ehuakanaloa
United States
18.92°N, 155.27°W; summit elev. -975 m
All times are local (unless otherwise noted)
Earthquake swarm during 10-13 September 2001
On the afternoon of 10 September 2001 an earthquake swarm began at Lōʻihi. The swarm began with a M 5 earthquake and was followed by M 3.5-4.9 earthquakes until the morning of 11 September. This was the most severe swarm at Lōʻihi since July 1996, when the summit collapsed. Two earthquakes that occurred on 13 September may have also been part of the swarm. The two later earthquakes occurred at 0311 and 0839 and had magnitudes of 4.9 and 4.4, respectively. Most of the earthquakes from 10-13 September were ~12 km deep and located slightly S of Lōʻihi's summit.
Background. Lōʻihi seamount, the youngest volcano of the Hawaiian chain, lies about 35 km off the SE coast of the island of Hawaii. Lōʻihi (which is the Hawaiian word for "long") has an elongated morphology dominated by two curving rift zones extending north and south of the summit. The summit region contains a caldera about 3 x 4 km wide and is dotted with numerous lava cones, the highest of which is about 975 m below the sea surface. Deep and shallow seismicity indicate a magmatic plumbing system distinct from that of Kīlauea volcano. Abundant fresh, sediment-free lavas attest to the youthful age of the volcano. During 1996, a new pit crater was formed at the summit of the volcano and lava flows were erupted.
The summit platform includes two well-defined pit craters, sediment-free glassy lava, and low-temperature hydrothermal venting. An arcuate chain of small cones on the W edge of the summit extends N and S of the pit craters and merges into the crests of Lōʻihi's prominent N and S rift zones (Fornari and others, 1988). Continued volcanism is expected to eventually build a new island at Lōʻihi; time estimates for the summit to reach the surface range from roughly 10,000 to 100,000 years.
Geologic Background. The Kama’ehuakanaloa seamount, previously known as Loihi, lies about 35 km off the SE coast of the island of Hawaii. This youngest volcano of the Hawaiian chain has an elongated morphology dominated by two curving rift zones extending north and south of the summit. The summit region contains a caldera about 3 x 4 km and exhibits numerous lava cones, the highest of which is about 975 m below the ocean surface. The summit platform also includes two well-defined pit craters, sediment-free glassy lava, and low-temperature hydrothermal venting. An arcuate chain of small cones on the western edge of the summit extends north and south of the pit craters and merges into the crests prominent rift zones. Seismicity indicates a magmatic system distinct from that of Kilauea. During 1996 a new pit crater formed at the summit, and lava flows were erupted. Continued volcanism is expected to eventually build a new island; time estimates for the summit to reach the ocean surface range from roughly 10,000 to 100,000 years.
Information Contacts: Hawaiian Volcano Observatory (HVO), U.S. Geological Survey, PO Box 51, Hawaii National Park, HI 96718, USA (URL: https://volcanoes.usgs.gov/observatories/hvo/).
Kie Besi (Indonesia) — September 2001 Cite this Report
Kie Besi
Indonesia
0.32°N, 127.4°E; summit elev. 1357 m
All times are local (unless otherwise noted)
Brush fire leads to a falsely alleged 16-17 August 2001 eruption report
Makian was falsely alleged to have begun erupting at 1930 on 16 August 2001. The same Jakarta news article also reported that the volcano continued to spew lava on 17 August forcing residents to evacuate. The article also noted that hot ash and debris were ejected to a height of 20 m and dark clouds rose 75 m.
The Volcanological Survey of Indonesia (VSI) later indicated that the report was false. An observer had mistakenly interpreted the glow from a brush fire as volcanic activity. VSI has not reported any recent volcanic activity at Makian.
Geologic Background. Kie Besi volcano, forming the 10-km-wide Makian island off the west coast of Halmahera, has been the source of infrequent, but strong eruptions that have devastated villages on the island. The large 1.5-km-wide summit crater, containing a small lake on the NE side, gives the peak a flat-topped profile. Two prominent valleys extend to the coast from the summit crater on the north and east sides. Four cones are found on the western flanks. Eruption have been recorded since about 1550; major eruptions in 1646, 1760-61, 1861-62, 1890, and 1988 caused extensive damage and many fatalities.
Information Contacts: Dali Ahmad, Volcanological Survey of Indonesia (VSI), Jalan Diponegoro No. 57, Bandung 40122, Indonesia (URL: http://www.vsi.esdm.go.id/).; Darwin VAAC, Bureau of Meteorology, Northern Territory Regional Office, PO Box 40050, Casuarina, Northern Territory 0811, Australia; Meteorological and Geophysical Agency of Indonesia (Badan Meteorologi dan Geofisika, BMG), Jalan Angkasa I/2 Kemayoran, Jakarta Pusat 10720, Indonesia (URL: http://www.bmg.go.id/), Société Volcanologique Européenne.
Kilauea (United States) — September 2001 Cite this Report
Kilauea
United States
19.421°N, 155.287°W; summit elev. 1222 m
All times are local (unless otherwise noted)
Branching lava flows, ocean entries, and elevated seismicity into September 2001
Throughout this reporting interval, December 2000-September 2001, volcanic tremor near Pu`u `O`o and in Kīlauea's caldera remained low to moderate. Tiltmeters in the summit area and along the E rift zone showed no deformation. Branching lava flows, occasional sea entries of lava, and several seismic events took place. Small-to-moderate steam plumes originating at the ocean entries were visible on 10 December, on 5, 7, 26, and 30 May, and on 13 June. On 14 August a large steam plume was visible. Sulfur dioxide output from the Pu`u `O`o area was high on 15 May.
Lava flows. Beginning on 17 December 2000, lava moved down the Pulama Pali slope and across the coastal flat, along E, W, and middle branches, through a combination of tubes and surface flows (figure 151).
Lava frequently broke out of the tube system beginning in January and February 2001. One breakout on 23 February along the E side of the flow field at the private access road to the Royal Gardens subdivision was quite substantial; a house in Royal Gardens was destroyed and an abandoned car was half-submerged in lava in front of it.
By mid-March the leading edge of the 1.5-m-wide flow front was within about 300 m of the coastline, headed for the sea E of Kupapa'u Point. During the end of March, activity was robust near the truncated road that formerly accessed Royal Gardens. In that area, surface flows occurred at dozens of points and rapidly inflated. Ground observers reported hearing methane explosions from burning vegetation along the base of the Pulama Pali slope.
During early April 2001, surface activity was confined to a small sluggish flow in the E branch of the flow field; most of the lava was encased in tubes and thus not flowing on the surface. At midday on 29 April, a tongue of lava began to pour into a crack paralleling the shoreline that separated a narrow sea cliff from stable ground inland. Eventually the lava wedged the crack open so much that the unstable block of land fell into the water, generating an explosion that tossed rocks onto dry land.
On 13 May, the active flow was 300-500 m from the nearest house in the Royal Gardens subdivision, but the homes were protected from the lava by a barrier of aa deposited in 1983. On 3 September, a lava flow, ~3.6-5.5 m wide, crossed the viewing-access road W of Kalapana, isolating the viewing area. The road, which was opened on 17 August, was closed on 30 August after about 10,000 visitors had used it over the previous two weeks. The flow across the access road stopped on 5 September, and road crews prepared to reopen it.
Ocean entry. Lava entered the sea on several occasions during this report period. The W arm of the coastal flow reached the sea in late December 2000 then quickly stagnated, remaining barely active as late as September 2001. During 21-29 January 2001 lava entered the sea just W of Kamokuna, and during 25-29 April lava entered the sea a few hundred meters NE of Kupapa`u Point, developing a large bench at the E Kupapa`u entry site.
On the afternoon of 13 May observers found three ocean-entry benches along the SE corner of the active flow field, NE of Kupaupau Point and 120-790 m outside the national park. The benches increased in area and width eastward, from 10 m wide near the boundary to nearly 60 m wide at the eastern bench. The eastern bench was 2 hectares in area, was the most active, and nearly coalesced with the middle bench. Sand beaches 10-15 m wide filled the gaps between the benches. Vigorous venting of lava into the sea occurred at the SE corner of the active flow field during the evening of 13 May.
Lava entered the ocean on several other occasions, including 20 and 31 May, and 2 and 18 June, mostly through the E Kupapa`u entry (figure 152). By 22 May, only the ocean entry at the SE corner of the flow field was active, indicating that lava was still coursing through the system but was confined to tubes for at least most of the way from Pu`u `O`o to the sea. Ocean entry at E Kupapa`u was fairly vigorous during the evening of 14 August, with a large steam plume, an open lava river pouring into the sea, and numerous mild-to-moderate steam explosions.
Geophysical activity. During 1500-2400 on 6 January 2001, deflation events occurred at Kīlauea's summit and at Pu`u `O`o, amounting to ~1.7 µrad and ~2.8 µrad, respectively. The intensity of volcanic tremor increased beneath Kīlauea's caldera around the same time, though the tremor remained low-to-moderate in strength.
At about 0625 on 7 January, the tiltmeter near the observatory began to show very rapid inflation, jumping up to ~1.4 µrad in 32 minutes and eventually peaking at ~2.6 µrad by 1323. The sharpest inflation was accompanied by nearly 30 minutes of increased tremor beneath Kīlauea's caldera-even above that caused by the deflation event the previous day. By 8 January tilt and seismicity at the summit and Pu`u `O`o appeared to have returned to background levels. On the morning of 11 January, a burst of strong tremor in the caldera lasted about 30 minutes.
A small (~0.4 µrad) deflation occurred shortly before 1230 on 10 February. A weak swarm of shallow earthquakes within the caldera on 18-19 February ended by 20 February. On 20 February at 1317 a M 3.7 earthquake in the summit area was centered ~5 km SE of Halemaumau at a very shallow depth.
A swarm of earthquakes on the NE flank of Mauna Kea occurred during 22-24 February. The earthquakes in the swarm were all about M 3 and came from depths of 2-12 km. During early to mid-March, small low-frequency earthquakes took place below the caldera.
On 7 April tiltmeters recorded a summit deflation up to ~3 µrad. The deflation ended in early afternoon, but the heightened tremor below the caldera continued. The tilt record at Pu`u `O`o cone suggested that it began to deflate on the morning of 6 April at about 0600, stabilized in the afternoon, and started to inflate the morning of 7 April shortly after 0400. This inflation may have eventually led to later eruptive activity on the crater floor.
By 8 April the tiltmeter had recovered ~1.4 µrad and was increasing. Tremor below Kīlauea's caldera was nearly at background levels. Starting at about 0200 on the morning of 8 April, the summit began to inflate. By about 0300, the amplitude of tremor and the rate of long-period earthquakes began to decline to nearly background levels. Summit tilt leveled out at about 1000, regaining 2.5 µrad of the 3 µrad lost during the deflation that occurred on 7 April.
A slight deformation of the summit occurred during 23-25 April. In the afternoon of 25 April, a M 4.4 earthquake occurred near the observatory that produced a few small aftershocks during the following week. A swarm of long-period (LP) earthquakes that began beneath Kīlauea's caldera on 18 April had nearly ended by 2 May.
Volcanic tremor was higher than normal during 12 and 13 May and small earthquakes were recorded in the caldera. During mid-May, earthquake activity and volcanic tremor near Pu`u `O`o and in Kīlauea's caldera were at moderate levels with periods of rather strong ground motion.
On the afternoon of 20 May the largest tilt event to occur at Kīlauea in more than 4 years took place. Beginning at 0500 the summit began to slowly deflate (~2 µrad) until about 1630 when it very abruptly began to inflate (~10 µrad). It peaked at 1735 and began to deflate at 1750. The tiltmeter on the cone of Pu`u `O`o, and another one nearby, both recorded sharp inflation starting at about 1650, approximately 20 minutes later than the start of tilt at Kīlauea's summit.
At about 1920, a lava pond was observed to be forming in the crater of Pu`u `O`o. The surface lava flows showed no boost from the inflation. Instead, observations on 21 May revealed that the pond had drained.
No earthquakes were felt during the tilt event and no lava erupted in the caldera. The event was accompanied by strong tremor, which ended a prolonged period of small earthquakes in the caldera that had lasted, with a 9-hour break on the night of 18 May, for several days. Small earthquakes of the LP type, suggestive of magma movement, began again in the caldera and gradually increased from 21 to 22 May to a reasonable swarm. The tilt event ended on 22 May, as Kīlauea lost most of the positive tilt it had acquired.
Summit tilt started to rise on the afternoon of 22 May at a moderately rapid pace but slowed the morning of 23 May. Pu`u `O`o cone showed some inflation.
On 3 June a pause in volcanic activity may have begun at about 0900 with slow deflation (~2.6 µrad) occurring at the tiltmeter closest to HVO. It ended around 2400 and at 0125 rapid inflation (~2.7 µrad) began with most of the inflation occurring in about 55 minutes. Slow deflation (0.9 µrad) occurred at Pu`u `O`o during 1015-2200 on 3 June, with slow inflation occurring to at least 4 June. Background volcanic tremor at the summit gradually increased starting in mid-morning on 3 June, after deflation had begun. There was no significant change in the tremor at Pu`u `O`o.
Generally weak, steady tremor and related long-period earthquakes continued beneath Kīlauea's caldera throughout June. There was a slight increase in long-period caldera earthquakes for several hours on 18 June. Tremor remained weak to moderate near Pu`u `O`o and seismicity was at normal levels elsewhere. On 26 June from about noon until the evening a small amount of deflation occurred at the summit and ~0.5 µrad at Pu`u `O`o cone.
An earthquake with a preliminary magnitude of 3.5 rattled through the lower E rift zone of Kīlauea the evening of 16 July at about 1803. Located about halfway between Pahoa and Kapho, the earthquake was shallow (about 1.5 km deep) and felt locally by many residents. A swarm of earthquakes began on 21 July and ended by 25 July. Weak tremor began on 30 July near Pu`u `O`o.
Tremor near Pu`u `O`o was weak- to-moderate during August. During the afternoon of 15 August the intensity of volcanic tremor increased abruptly at both Kīlauea's summit and Pu`u `O`o but remained only moderate to low.
On 25 August a small but sharp inflation of Kīlauea's summit took place in the morning, amounting to slightly more than 1 µrad. The inflation began a little after 1000 and followed several hours of slow deflation. The inflation was mostly completed by noon, having recovered most of the tilt lost during the deflation. Pu`u `O`o cone underwent a very sharp inflation ~1 hour before the summit began to inflate and, just as at the summit, the inflation of the cone followed several hours of slow deflation. No upswing in seismicity accompanied the ground tilts. Small sharp earthquakes from beneath the summit continued but remained infrequent. As of early September, Kīlauea's summit was deflating very slowly.
Lava flow . A summary of statistics of the Pu`u `O`o- Kupaianaha eruption is provided in table 5. Since the start of the eruption in 1983, lava has covered 104 km2, which is just over 7% of Kīlauea's land surface. Some areas mantled repeatedly and are now buried beneath more than 30 m of basalt. Kīlauea's surface is comparatively young: ~70% is paved with flows younger than 600 years; 90% is younger than 1,100 years.
Table 5. Summary of statistics for the Pu`u `O`o-Kupaianaha eruption as of the end of the year 2000. Courtesy of HVO.
| Description |
Statistics |
| Area covered by lava flows during January 1983-31 December 2000 |
104 km2 (40 square miles) |
| Net area of new land created along the coastal margin during November 1986-31 December 2000 |
207 hectares (510 acres) |
| Net area of new land created along the coastal margin during 2000 only |
~7.5 hectares (18.5 acres) |
| Volume of lava erupted during 1983-2001 |
2 km3 (0.5 cubic miles) |
| Structures destroyed during 1983-1991 |
184 |
| Structures destroyed during 2000 |
3 (all in Royal Gardens) |
An eruption during the 14th century was fed from a vent just E of the summit area and probably continued discharging for about 50 years. Flows from this eruption covered a very large area N of the E rift zone, about 430 km2 (30 percent of Kīlauea's land surface). The 2-year-long Mauna Ulu eruptions (1969-71 and 1972-74) covered about 50 km2 and 44 km2, respectively.
Geologic Background. Kilauea overlaps the E flank of the massive Mauna Loa shield volcano in the island of Hawaii. Eruptions are prominent in Polynesian legends; written documentation since 1820 records frequent summit and flank lava flow eruptions interspersed with periods of long-term lava lake activity at Halemaumau crater in the summit caldera until 1924. The 3 x 5 km caldera was formed in several stages about 1,500 years ago and during the 18th century; eruptions have also originated from the lengthy East and Southwest rift zones, which extend to the ocean in both directions. About 90% of the surface of the basaltic shield volcano is formed of lava flows less than about 1,100 years old; 70% of the surface is younger than 600 years. The long-term eruption from the East rift zone between 1983 and 2018 produced lava flows covering more than 100 km2, destroyed hundreds of houses, and added new coastline.
Information Contacts: Hawaiian Volcano Observatory (HVO), U.S. Geological Survey, PO Box 51, Hawaii National Park, HI 96718, USA (URL: https://volcanoes.usgs.gov/observatories/hvo/).
Krakatau (Indonesia) — September 2001 Cite this Report
Krakatau
Indonesia
6.1009°S, 105.4233°E; summit elev. 285 m
All times are local (unless otherwise noted)
Increase in seismicity during July through August 2001; ash and bomb ejection
Eruptive activity at Krakatau through late October 2000 was described in BGVN 26:01. The Volcanological Survey of Indonesia (VSI) did not report any further activity until mid-March 2001, when the number of shallow volcanic (B-type) earthquakes rose to 79 from 25 the previous week. The number of shallow volcanic earthquakes decreased again in late March to 34. In early April, seismic activity at Krakatau increased again. The seismographs detected 7 deep volcanic (A-type) earthquakes, 54 shallow volcanic earthquakes, and 7 tectonic events.
Local tour operators reported a significant increase in seismic activity at Krakatau beginning during July 2001 and continuing through August. During 9-15 July there were 728 shallow volcanic earthquakes registered. [On 21 July an explosion occurred accompanied by a booming sound. The explosion was recorded by an infrasonic microphone sensor installed at the Pasuaran post observatory.] At the beginning of August the volcano emitted ash to 500 m and ejected ballistics onto the flanks of the main cone.
John Seach visited on 12 August and found that the volcano was not erupting then, but was steaming vigorously on the N side of the summit crater. Pulses of steam every minute reached 20 m above the summit. Lava bombs, 0.5 m in diameter, littered the old crater rim (840 m SE of the of the summit at 167 m elevation) at a density of 1 /m2. The bombs left 1.5-m-diameter impact craters up to 1.5 m in diameter at distances of 1.3 km SE of the summit. The fresh impact craters were caused by both lithic and lava bombs. Observers on a boat 1.5 km W of the volcano noticed a strong sulfur smell. The top 150 m of the active cone was steaming from multiple locations. On the NW side, 60 m below the summit, a fumarole emitted blue gas.
During 3-9 September the number of explosion and volcanic earthquakes increased, but the number of small explosion earthquakes sharply decreased 12-18 September. Krakatau remained at Alert Level 2 (on a scale of 1-4).
Geologic Background. The renowned Krakatau (frequently mis-named as Krakatoa) volcano lies in the Sunda Strait between Java and Sumatra. Collapse of an older edifice, perhaps in 416 or 535 CE, formed a 7-km-wide caldera. Remnants of that volcano are preserved in Verlaten and Lang Islands; subsequently the Rakata, Danan, and Perbuwatan cones were formed, coalescing to create the pre-1883 Krakatau Island. Caldera collapse during the catastrophic 1883 eruption destroyed Danan and Perbuwatan, and left only a remnant of Rakata. This eruption caused more than 36,000 fatalities, most as a result of tsunamis that swept the adjacent coastlines of Sumatra and Java. Pyroclastic surges traveled 40 km across the Sunda Strait and reached the Sumatra coast. After a quiescence of less than a half century, the post-collapse cone of Anak Krakatau (Child of Krakatau) was constructed within the 1883 caldera at a point between the former Danan and Perbuwatan cones. Anak Krakatau has been the site of frequent eruptions since 1927.
Information Contacts: Dali Ahmad, Volcanological Survey of Indonesia (VSI), Jalan Diponegoro No. 57, Bandung 40122, Indonesia (URL: http://www.vsi.esdm.go.id/); Darwin Volcanic Ash Advisory Centre (VAAC), Bureau of Meteorology, Northern Territory Regional Office, PO Box 40050, Casuarina, NT 0811, Australia (URL: http://www.bom.gov.au/info/vaac/); John Seach, P.O. Box 16, Chatsworth Island, NSW 2469, Australia.
West Valley Segment (Canada) — September 2001 Cite this Report
West Valley Segment
Canada
48.78°N, 128.64°W; summit elev. -2550 m
All times are local (unless otherwise noted)
T-wave swarm devoid of tremor during 6-27 September 2001
At approximately 2030 on 6 September 2001 a large seismic swarm was detected at the N end of the Juan de Fuca Ridge (figure 1). Just N of this point the ridge becomes truncated by the Sovanco Fracture Zone. The seismicity had some of the primary characteristics of magmatic activity, including vigorous swarms of small earthquakes, but did not include any detectable continuous tremor. After the initial event, activity increased and epicenters propagated southward to within 5 km of known hydrothermal vents and drill holes (figure 2). By 27 September, after nearly 14,000 detected earthquakes, seismic activity had slowed to near-background levels (figure 3). During 4-7 October, the Canadian RV Tully visited the site for water column sampling.
The land seismic network operated by the Pacific Geoscience Center of the Geological Survey of Canada recorded and produced moment tensor solutions for several of the larger events, indicating a mixture of normal and strike-slip motion. Strike-slip events are oriented parallel to Juan de Fuca orientation (15°) and are likely associated with the ridge system. The complex interplay between the Nootka fault and the Juan de Fuca volcanic system results in a diffuse triple junction with correspondingly complex stress fields. Further detailed examination of the joint data sets will be required to unravel the total picture. A description of the site can be found in Davis and Villinger (1992).
The general location of the swarm (48.78°N, 128.64°W) was on the eastern edge of a large sedimented feature called Middle Valley. The Juan de Fuca Ridge is located just N of the Gorda Ridge, along the boundary between the Juan de Fuca and Pacific plates. A seismic swarm along the Jackson Segment of the Gorda Ridge (figure 8) occurred in early April 2001 (BGVN 26:08). The seismic activity was detected by NOAA's Pacific Marine Environmental Laboratory (PMEL) T-phase Monitoring System. They access the U.S. Navy's SOund SUrveillance System (SOSUS) to monitor ocean acoustics.
Reference. Davis, E.E., and Villinger, H., 1992, Proceedings of the Ocean Drilling Program, Initial Reports, v. 139, p. 9-41.
Geologic Background. The West Valley Segment is the northern-most part of the Juan de Fuca Ridge, intersecting the Sovanco Fracture Zone and offset from the Endeavour Segment to the south.
Information Contacts: Chris Fox and Robert Dziak, Vents Acoustics Program, NOAA Pacific Marine Environmental Laboratory (PMEL), 2115 SE Osu Drive, Newport, OR 97365 USA (URL: https://www.pmel.noaa.gov/eoi/); Garry Rogers, Geological Survey of Canada, GSC Pacific - Sidney Subdivision, Pacific Geoscience Centre, P.O. Box 6000, 9860 West Saanich Road, Sidney, BC V8L 4B2, Canada (URL: http://www.earthquakescanada.nrcan.gc.ca/); InterRidge Office, Ocean Research Institute, University of Tokyo, 1-15-1 Minamidai, Nakano-ku, Tokyo 164-8639, Japan (URL: http://www.interridge.org/).
Whakaari/White Island (New Zealand) — September 2001 Cite this Report
Whakaari/White Island
New Zealand
37.52°S, 177.18°E; summit elev. 294 m
All times are local (unless otherwise noted)
In early 2001, 145°C degassing and an ash plume to ~2 km height
This report describes venting of ash and gas that continued at White Island during November 2000 through May 2001. As previously reported, on 27 July 2000, strong seismicity accompanied a short-lived magmatic eruption and produced a new explosion crater. Following the event, the two active vents at White Island emitted an ash plume. The ash content of the plume declined significantly during late August-early September 2000 (BGVN 25:08).
On 9 November 2000 scientists visiting White Island found weak-to-moderate fumarole activity, with the two active vents producing a white steam-and-gas plume. By 16 November, a small new vent SE of the active MH was also steaming. Around that time, the noise from the MH vent was so loud that it could be heard from the beach in still conditions. By mid-December, the steam-and-gas plume rose to an altitude of ~1,250 m, and occasional bursts of low-level tremor occurred. The level of gas emission seemed to have stabilized after the increase that occurred during the previous month.
On 3 January 2001 a volcanologist visiting the site reported that the lake within the 78/90 Crater Complex had enlarged and had a yellowish-brown discoloration with surface slicks and noticeable areas of convection. Fumaroles appeared to be more extensive within the complex. A strong haze of sulphur dioxide gas was evident within the crater. By mid-January the water level near the vents had risen.
Based on reports from White Island tour operators, the Institute of Geological and Nuclear Sciences (IGNS) stated that on 19 February minor ash eruptions resumed. A light gray plume of fine ash rose ~2 km above the MH vent and drifted towards the mainland. Fine ash was deposited on and near White Island, but only an acid aerosol cloud reached the mainland near the town of Matata (~55 km SW).
During mid-March the steam-and-gas plume was not nearly as noisy as it had been, but it was still very hot, as indicated by the transparency of the bottom of the plume as it exited from the vent. The IGNS received reports from the public of an unusually large gas plume extending over White Island. This large plume, however, was attributed to still wind conditions and cooler air temperatures.
On 19 April a team from IGNS visited White Island and found no significant change from previous visits. The lake was still a yellow/green color, but was somewhat cooler at 28°C. The MH vent was still emitting a considerable volume of steam, but was not as noisy as it had previously been. Steam emerged from the vent at a temperature of 145°C, and reached a height of about 20 m before condensing. No ash was produced.
Heavy rain affected the area around the vents during May 2001 and changed the lake color to gray, but the volcanic activity was essentially unchanged. On 28 May, air waves were recorded by the seismometer, indicating a small surface explosion. Fumaroles continued to be active and produced a high level of water vapor in the crater area.
By July the gas pressure at White Island had decreased. A few isolated, small, low-frequency events were recorded in August. Weak volcanic tremor was recorded in September, but no changes occurred at the surface.
Geologic Background. The uninhabited Whakaari/White Island is the 2 x 2.4 km emergent summit of a 16 x 18 km submarine volcano in the Bay of Plenty about 50 km offshore of North Island. The island consists of two overlapping andesitic-to-dacitic stratovolcanoes. The SE side of the crater is open at sea level, with the recent activity centered about 1 km from the shore close to the rear crater wall. Volckner Rocks, sea stacks that are remnants of a lava dome, lie 5 km NW. Descriptions of volcanism since 1826 have included intermittent moderate phreatic, phreatomagmatic, and Strombolian eruptions; activity there also forms a prominent part of Maori legends. The formation of many new vents during the 19th and 20th centuries caused rapid changes in crater floor topography. Collapse of the crater wall in 1914 produced a debris avalanche that buried buildings and workers at a sulfur-mining project. Explosive activity in December 2019 took place while tourists were present, resulting in many fatalities. The official government name Whakaari/White Island is a combination of the full Maori name of Te Puia o Whakaari ("The Dramatic Volcano") and White Island (referencing the constant steam plume) given by Captain James Cook in 1769.
Information Contacts: Brad Scott and Tony Hurst, Wairakei Research Center, Institute of Geological and Nuclear Sciences (IGNS), Private Bag 2000, Wairakei, New Zealand (URL: http://www.gns.cri.nz/).