Recently Published Bulletin Reports
Erebus (Antarctica) Lava lake remains active; most thermal alerts recorded since 2019
Rincon de la Vieja (Costa Rica) Frequent phreatic explosions during July-December 2023
Bezymianny (Russia) Explosion on 18 October 2023 sends ash plume 8 km high; lava flows and incandescent avalanches
Kilauea (United States) Low-level lava effusions in the lava lake at Halema’uma’u during July-December 2022
Nyamulagira (DR Congo) Lava flows and thermal activity during May-October 2023
Bagana (Papua New Guinea) Explosions, ash plumes, ashfall, and lava flows during April-September 2023
Mayon (Philippines) Lava flows, pyroclastic flows, ash emissions, and seismicity during April-September 2023
Nishinoshima (Japan) Eruption plumes and gas-and-steam plumes during May-August 2023
Krakatau (Indonesia) White gas-and-steam plumes and occasional ash plumes during May-August 2023
Villarrica (Chile) Strombolian activity, gas-and-ash emissions, and crater incandescence during April-September 2023
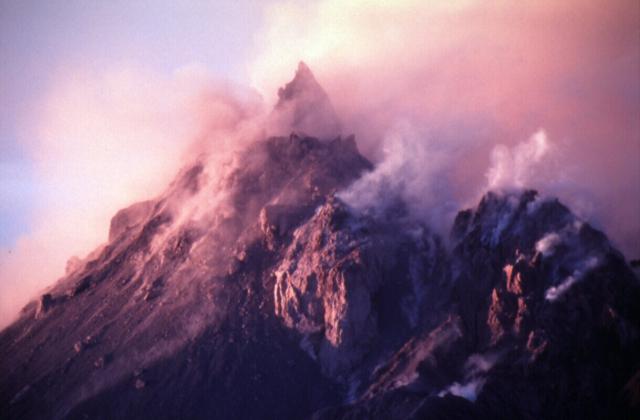
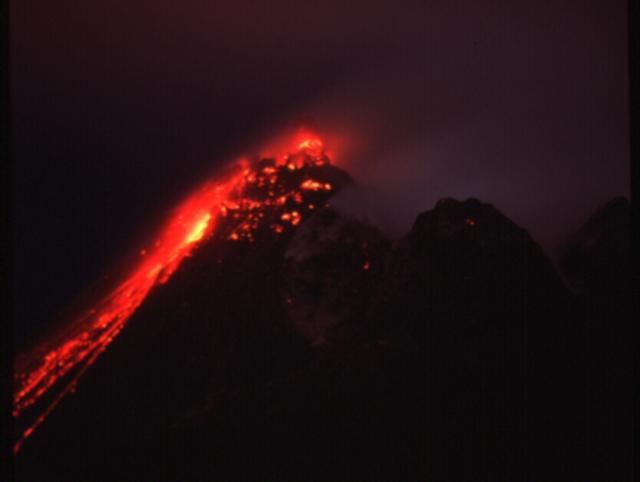
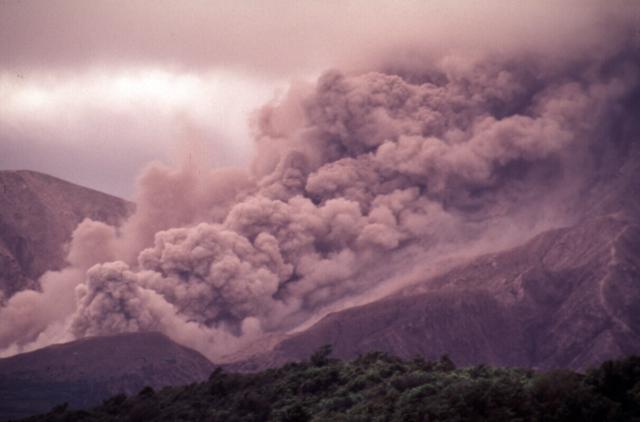
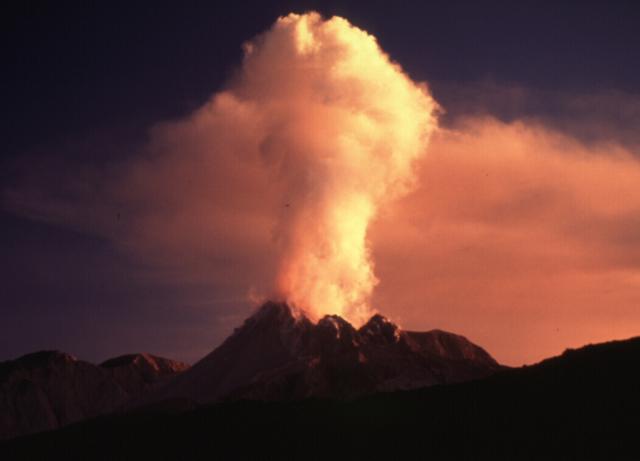
Merapi (Indonesia) Frequent incandescent avalanches during April-September 2023
Ebeko (Russia) Moderate explosive activity with ash plumes continued during June-November 2023
Erebus (Antarctica) — January 2024  Cite this Report
Erebus
Antarctica
77.53°S, 167.17°E; summit elev. 3794 m
All times are local (unless otherwise noted)
Lava lake remains active; most thermal alerts recorded since 2019
The lava lake in the summit crater of Erebus has been active since at least 1972. Located in Antarctica overlooking the McMurdo Station on Ross Island, it is the southernmost active volcano on the planet. Because of the remote location, activity is primarily monitored by satellites. This report covers activity during 2023.
The number of thermal alerts recorded by the Hawai'i Institute of Geophysics and Planetology’s MODVOLC Thermal Alerts System increased considerably in 2023 compared to the years 2020-2022 (table 9). In contrast to previous years, the MODIS instruments aboard the Aqua and Terra satellites captured data from Erebus every month during 2023. Consistent with previous years, the lowest number of anomalous pixels were recorded in January, November, and December.
Table 9. Number of monthly MODIS-MODVOLC thermal alert pixels recorded at Erebus during 2017-2023. See BGVN 42:06 for data from 2000 through 2016. The table was compiled using data provided by the HIGP – MODVOLC Thermal Alerts System.
| Year |
Jan |
Feb |
Mar |
Apr |
May |
Jun |
Jul |
Aug |
Sep |
Oct |
Nov |
Dec |
SUM |
| 2017 |
0 |
21 |
9 |
0 |
0 |
1 |
11 |
61 |
76 |
52 |
0 |
3 |
234 |
| 2018 |
0 |
21 |
58 |
182 |
55 |
17 |
137 |
172 |
103 |
29 |
0 |
0 |
774 |
| 2019 |
2 |
21 |
162 |
151 |
55 |
56 |
75 |
53 |
29 |
19 |
1 |
0 |
624 |
| 2020 |
0 |
2 |
16 |
18 |
4 |
4 |
1 |
3 |
18 |
3 |
1 |
6 |
76 |
| 2021 |
0 |
9 |
1 |
0 |
2 |
56 |
46 |
47 |
35 |
52 |
5 |
3 |
256 |
| 2022 |
1 |
13 |
55 |
22 |
15 |
32 |
39 |
19 |
31 |
11 |
0 |
0 |
238 |
| 2023 |
2 |
33 |
49 |
82 |
41 |
32 |
70 |
64 |
42 |
17 |
5 |
11 |
448 |
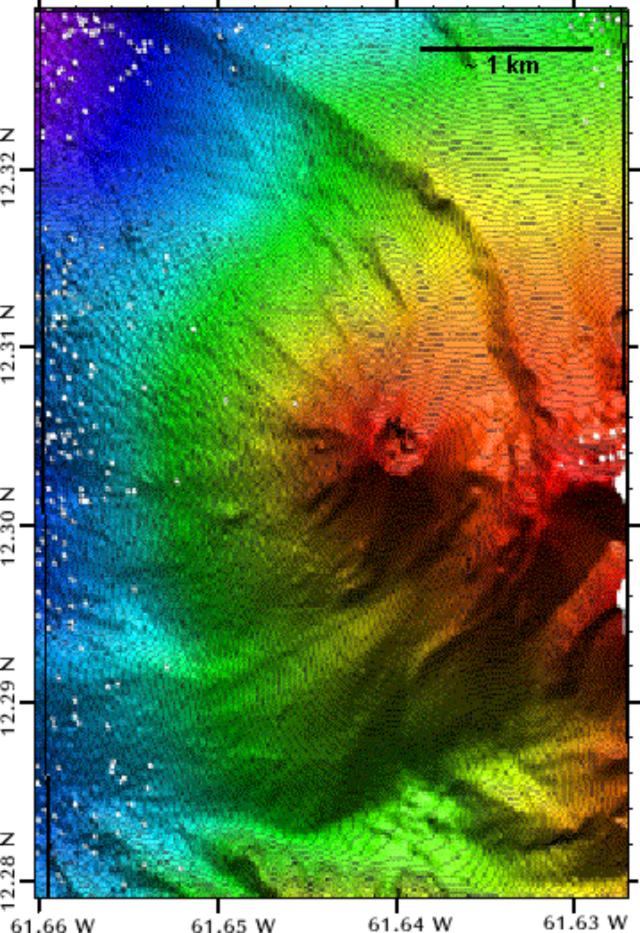
Sentinel-2 infrared images showed one or two prominent heat sources within the summit crater, accompanied by adjacent smaller sources, similar to recent years (see BGVN 46:01, 47:02, and 48:01). A unique image was obtained on 25 November 2023 by the OLI-2 (Operational Land Imager-2) on Landsat 9, showing the upper part of the volcano surrounded by clouds (figure 32).
Geologic Background. Mount Erebus, the world's southernmost historically active volcano, overlooks the McMurdo research station on Ross Island. It is the largest of three major volcanoes forming the crudely triangular Ross Island. The summit of the dominantly phonolitic volcano has been modified by one or two generations of caldera formation. A summit plateau at about 3,200 m elevation marks the rim of the youngest caldera, which formed during the late-Pleistocene and within which the modern cone was constructed. An elliptical 500 x 600 m wide, 110-m-deep crater truncates the summit and contains an active lava lake within a 250-m-wide, 100-m-deep inner crater; other lava lakes are sometimes present. The glacier-covered volcano was erupting when first sighted by Captain James Ross in 1841. Continuous lava-lake activity with minor explosions, punctuated by occasional larger Strombolian explosions that eject bombs onto the crater rim, has been documented since 1972, but has probably been occurring for much of the volcano's recent history.
Information Contacts: Hawai'i Institute of Geophysics and Planetology (HIGP) - MODVOLC Thermal Alerts System, School of Ocean and Earth Science and Technology (SOEST), Univ. of Hawai'i, 2525 Correa Road, Honolulu, HI 96822, USA (URL: http://modis.higp.hawaii.edu/); Copernicus Browser, Copernicus Data Space Ecosystem, European Space Agency (URL: https://dataspace.copernicus.eu/browser/); NASA Earth Observatory, EOS Project Science Office, NASA Goddard Space Flight Center, Goddard, Maryland, USA (URL: https://earthobservatory.nasa.gov/images/152134/erebus-breaks-through).
Rincon de la Vieja (Costa Rica) — January 2024 Cite this Report
Rincon de la Vieja
Costa Rica
10.83°N, 85.324°W; summit elev. 1916 m
All times are local (unless otherwise noted)
Frequent phreatic explosions during July-December 2023
Rincón de la Vieja is a volcanic complex in Costa Rica with a hot convecting acid lake that exhibits frequent weak phreatic explosions, gas-and-steam emissions, and occasional elevated sulfur dioxide levels (BGVN 45:10, 46:03, 46:11). The current eruption period began June 2021. This report covers activity during July-December 2023 and is based on weekly bulletins and occasional daily reports from the Observatorio Vulcanologico Sismologica de Costa Rica-Universidad Nacional (OVSICORI-UNA).
Numerous weak phreatic explosions continued during July-December 2023, along with gas-and-steam emissions and plumes that rose as high as 3 km above the crater rim. Many weekly OVSICORI-UNA bulletins included the previous week's number of explosions and emissions (table 9). For many explosions, the time of explosion was given (table 10). Frequent seismic activity (long-period earthquakes, volcano-tectonic earthquakes, and tremor) accompanied the phreatic activity.
Table 9. Number of reported weekly phreatic explosions and gas-and-steam emissions at Rincón de la Vieja, July-December 2023. Counts are reported for the week before the Weekly Bulletin date; not all reports included these data. Courtesy of OVSICORI-UNA.
| OVSICORI Weekly Bulletin |
Number of explosions |
Number of emissions |
| 28 Jul 2023 |
6 |
14 |
| 4 Aug 2023 |
10 |
12 |
| 1 Sep 2023 |
13 |
11 |
| 22 Sep 2023 |
12 |
13 |
| 29 Sep 2023 |
6 |
11 |
| 6 Oct 2023 |
12 |
5 |
| 13 Oct 2023 |
7 |
9 |
| 20 Oct 2023 |
1 |
15 |
| 27 Oct 2023 |
3 |
23 |
| 3 Nov 2023 |
3 |
10 |
| 17 Nov 2023 |
0 |
Some |
| 24 Nov 2023 |
0 |
14 |
| 8 Dec 2023 |
4 |
16 |
| 22 Dec 2023 |
8 |
18 |
Table 10. Summary of activity at Rincón de la Vieja during July-December 2023. Weak phreatic explosions and gas emissions are noted where the time of explosion was indicated in the weekly or daily bulletins. Height of plumes or emissions are distance above the crater rim. Courtesy of OVSICORI-UNA.
| Date |
Time |
Description of Activity |
| 1 Jul 2023 |
0156 |
Explosion. |
| 2 Jul 2023 |
0305 |
Explosion. |
| 4 Jul 2023 |
0229, 0635 |
Event at 0635 produced a gas-and-steam plume that rose 700 m and drifted W; seen by residents in Liberia (21 km SW). |
| 9 Jul 2023 |
1843 |
Explosion. |
| 21 Jul 2023 |
0705 |
Explosion. |
| 26 Jul 2023 |
1807 |
Explosion. |
| 28 Jul 2023 |
0802 |
Explosion generated a gas-and-steam plume that rose 500 m. |
| 30 Jul 2023 |
1250 |
Explosion. |
| 31 Jul 2023 |
2136 |
Explosion. |
| 11 Aug 2023 |
0828 |
Explosion. |
| 18 Aug 2023 |
1304 |
Explosion. |
| 21 Aug 2023 |
1224 |
Explosion generated gas-and-steam plumes rose 500-600 m. |
| 22 Aug 2023 |
0749 |
Explosion generated gas-and-steam plumes rose 500-600 m. |
| 24 Aug 2023 |
1900 |
Explosion. |
| 25 Aug 2023 |
0828 |
Event produced a steam-and-gas plume that rose 3 km and drifted NW. |
| 27-28 Aug 2023 |
0813 |
Four small events; the event at 0813 on 28 August lasted two minutes and generated a steam-and-gas plume that rose 2.5 km. |
| 1 Sep 2023 |
1526 |
Explosion generated plume that rose 2 km and ejected material onto the flanks. |
| 2-3 Sep 2023 |
- |
Small explosions detected in infrasound data. |
| 4 Sep 2023 |
1251 |
Gas-and-steam plume rose 1 km and drifted W. |
| 7 Nov 2023 |
1113 |
Explosion. |
| 8 Nov 2023 |
0722 |
Explosion. |
| 12 Nov 2023 |
0136 |
Small gas emissions. |
| 14 Nov 2023 |
0415 |
Small gas emissions. |
According to OVSICORI-UNA, during July-October the average weekly sulfur dioxide (SO2) flux ranged from 68 to 240 tonnes/day. However, in mid-November the flux increased to as high as 334 tonnes/day, the highest value measured in recent years. The high SO2 flux in mid-November was also detected by the TROPOMI instrument on the Sentinel-5P satellite (figure 43).
Geologic Background. Rincón de la Vieja, the largest volcano in NW Costa Rica, is a remote volcanic complex in the Guanacaste Range. The volcano consists of an elongated, arcuate NW-SE-trending ridge constructed within the 15-km-wide early Pleistocene Guachipelín caldera, whose rim is exposed on the south side. Sometimes known as the "Colossus of Guanacaste," it has an estimated volume of 130 km3 and contains at least nine major eruptive centers. Activity has migrated to the SE, where the youngest-looking craters are located. The twin cone of Santa María volcano, the highest peak of the complex, is located at the eastern end of a smaller, 5-km-wide caldera and has a 500-m-wide crater. A Plinian eruption producing the 0.25 km3 Río Blanca tephra about 3,500 years ago was the last major magmatic eruption. All subsequent eruptions, including numerous historical eruptions possibly dating back to the 16th century, have been from the prominent active crater containing a 500-m-wide acid lake located ENE of Von Seebach crater.
Information Contacts: Observatorio Vulcanológico Sismológica de Costa Rica-Universidad Nacional (OVSICORI-UNA), Apartado 86-3000, Heredia, Costa Rica (URL: http://www.ovsicori.una.ac.cr/); NASA Global Sulfur Dioxide Monitoring Page, Atmospheric Chemistry and Dynamics Laboratory, NASA Goddard Space Flight Center (NASA/GSFC), 8800 Greenbelt Road, Goddard MD 20771, USA (URL: https://so2.gsfc.nasa.gov/).
Bezymianny (Russia) — November 2023 Cite this Report
Bezymianny
Russia
55.972°N, 160.595°E; summit elev. 2882 m
All times are local (unless otherwise noted)
Explosion on 18 October 2023 sends ash plume 8 km high; lava flows and incandescent avalanches
Bezymianny, located on Russia’s Kamchatka Peninsula, has had eruptions since 1955 characterized by dome growth, explosions, pyroclastic flows, ash plumes, and ashfall. Activity during November 2022-April 2023 included gas-and-steam emissions, lava dome collapses generating avalanches, and persistent thermal activity. Similar eruptive activity continued from May through October 2023, described here based on information from weekly and daily reports of the Kamchatka Volcano Eruptions Response Team (KVERT), notices from Tokyo VAAC (Volcanic Ash Advisory Center), and from satellite data.
Overall activity decreased after the strong period of activity in late March through April 2023, which included ash explosions during 29 March and 7-8 April 2023 that sent plumes as high as 10-12 km altitude, along with dome growth and lava flows (BGVN 48:05). This reduced activity can be seen in the MIROVA thermal detection system graph (figure 56), which was consistent with data from the MODVOLC thermal detection system and with Sentinel-2 satellite images that showed persistent hotspots in the summit crater when conditions allowed observations. A renewed period of strong activity began in mid-October 2023.
Activity increased significantly on 17 October 2023 when large collapses began during 0700-0830 on the E flanks of the lava dome and continued to after 0930 the next day (figure 57). Ash plumes rose to an altitude of 4.5-5 km, extending 220 km NNE by 18 October. A large explosion at 1630 on 18 October produced an ash plume that rose to an altitude of 11 km (8 km above the summit) and drifted NNE and then NW, extending 900 km NW within two days at an altitude of 8 km. Minor ashfall was noted in Kozyrevsk (45 km WNW). At 0820 on 20 October an ash plume was identified in satellite images drifting 100 km ENE at altitudes of 4-4.5 km.
Lava flows and hot avalanches from the dome down the SE flank continued over the next few days, including 23 October when clear conditions allowed good observations (figures 58 and 59). A large thermal anomaly was observed over the volcano through 24 October, and in the summit crater on 30 October (figure 60). Strong fumarolic activity continued, with numerous avalanches and occasional incandescence. By the last week of October, volcanic activity had decreased to a level consistent with that earlier in the reporting period.
Aviation warnings were frequently updated during 17-20 October. KVERT issued a Volcano Observatory Notice for Aviation (VONA) on 17 October at 1419 and 1727 (0219 and 0527 UTC) raising the Aviation Color Code (ACC) from Yellow to Orange (second highest level). The next day, KVERT issued a VONA at 1705 (0505 UTC) raising the ACC to Red (highest level) but lowered it back to Orange at 2117 (0917 UTC). After another decrease to Yellow and back to Orange, the ACC was reduced to Yellow on 20 October at 1204 (0004 UTC). In addition, the Tokyo VAAC issued a series of Volcanic Ash Advisories beginning on 16 October and continuing through 30 October.
Geologic Background. The modern Bezymianny, much smaller than its massive neighbors Kamen and Kliuchevskoi on the Kamchatka Peninsula, was formed about 4,700 years ago over a late-Pleistocene lava-dome complex and an edifice built about 11,000-7,000 years ago. Three periods of intensified activity have occurred during the past 3,000 years. The latest period, which was preceded by a 1,000-year quiescence, began with the dramatic 1955-56 eruption. This eruption, similar to that of St. Helens in 1980, produced a large open crater that was formed by collapse of the summit and an associated lateral blast. Subsequent episodic but ongoing lava-dome growth, accompanied by intermittent explosive activity and pyroclastic flows, has largely filled the 1956 crater.
Information Contacts: Kamchatka Volcanic Eruptions Response Team (KVERT), Far Eastern Branch, Russian Academy of Sciences, 9 Piip Blvd., Petropavlovsk-Kamchatsky, 683006, Russia (URL: http://www.kscnet.ru/ivs/kvert/); Kamchatka Volcanological Station, Kamchatka Branch of Geophysical Survey, (KB GS RAS), Klyuchi, Kamchatka Krai, Russia (URL: http://volkstat.ru/); Tokyo Volcanic Ash Advisory Center (VAAC), 1-3-4 Otemachi, Chiyoda-ku, Tokyo 100-8122, Japan (URL: http://ds.data.jma.go.jp/svd/vaac/data/); Hawai'i Institute of Geophysics and Planetology (HIGP) - MODVOLC Thermal Alerts System, School of Ocean and Earth Science and Technology (SOEST), Univ. of Hawai'i, 2525 Correa Road, Honolulu, HI 96822, USA (URL: http://modis.higp.hawaii.edu/); MIROVA (Middle InfraRed Observation of Volcanic Activity), a collaborative project between the Universities of Turin and Florence (Italy) supported by the Centre for Volcanic Risk of the Italian Civil Protection Department (URL: http://www.mirovaweb.it/); Copernicus Browser, Copernicus Data Space Ecosystem, European Space Agency (URL: https://dataspace.copernicus.eu/browser/).chr
Kilauea (United States) — January 2023 Cite this Report
Kilauea
United States
19.421°N, 155.287°W; summit elev. 1222 m
All times are local (unless otherwise noted)
Low-level lava effusions in the lava lake at Halema’uma’u during July-December 2022
Kīlauea is the southeastern-most volcano in Hawaii and overlaps the E flank of the Mauna Loa volcano. Its East Rift Zone (ERZ) has been intermittently active for at least 2,000 years. An extended eruption period began in January 1983 and was characterized by open lava lakes and lava flows from the summit caldera and the East Rift Zone. During May 2018 magma migrated into the Lower East Rift Zone (LERZ) and opened 24 fissures along a 6-km-long NE-trending fracture zone that produced lava flows traveling in multiple directions. As lava emerged from the fissures, the lava lake at Halema'uma'u drained and explosions sent ash plumes to several kilometers altitude (BGVN 43:10).
The current eruption period started during September 2021 and has recently been characterized by lava effusions, spatter, and sulfur dioxide emissions in the active Halema’uma’u lava lake (BGVN 47:08). Lava effusions, some spatter, and sulfur dioxide emissions have continued during this reporting period of July through December 2022 using daily reports, volcanic activity notices, and abundant photo, map, and video data from the US Geological Survey's (USGS) Hawaiian Volcano Observatory (HVO).
Summary of activity during July-December 2022. Low-level effusions have continued at the western vent of the Halema’uma’u crater during July through early December 2022. Occasional weak ooze-outs (also called lava break outs) would occur along the margins of the crater floor. The overall level of the active lava lake throughout the reporting period gradually increased due to infilling, however it stagnated in mid-September (table 13). During September through November, activity began to decline, though lava effusions persisted at the western vent. By 9 December, the active part of the lava lake had completely crusted over, and incandescence was no longer visible.
Table 13. Summary of measurements taken during overflights at Kīlauea that show a gradual increase in the active lava lake level and the volume of lava effused since 29 September 2021. Lower activity was reported during September-October. Data collected during July-December 2022. Courtesy of HVO.
| Date: |
Level of the active lava lake (m): |
Cumulative volume of lava effused (million cubic meters): |
| 7 Jul 2022 |
130 |
95 |
| 19 Jul 2022 |
133 |
98 |
| 4 Aug 2022 |
136 |
102 |
| 16 Aug 2022 |
137 |
104 |
| 12 Sep 2022 |
143 |
111 |
| 5 Oct 2022 |
143 |
111 |
| 28 Oct 2022 |
143 |
111 |
Activity during July 2022. Lava effusions were reported from the western vent in the Halema’uma’u crater, along with occasional weak ooze-outs along the margins of the crater floor. The height of the lava lake was variable due to deflation-inflation tilt events; for example, the lake level dropped approximately 3-4 m during a summit deflation-inflation event reported on 1 July. Webcam images taken during the night of 6-12 July showed intermittent low-level spattering at the western vent that rose less than 10 m above the vent (figure 519). Measurements made during an overflight on 7 July indicated that the crater floor was infilled about 130 m and that 95 million cubic meters of lava had been effused since 29 September 2021. A single, relatively small lava ooze-out was active to the S of the lava lake. Around midnight on 8 July there were two brief periods of lava overflow onto the lake margins. On 9 July lava ooze-outs were reported near the SE and NE edges of the crater floor and during 10-11 July they occurred near the E, NE, and NW edges. On 16 July crater incandescence was reported, though the ooze-outs and spattering were not visible. On 18 July overnight webcam images showed incandescence in the western vent complex and two ooze-outs were reported around 0000 and 0200 on 19 July. By 0900 there were active ooze-outs along the SW edge of the crater floor. Measurements made from an overflight on 19 July indicated that the crater floor was infilled about 133 m and 98 million cubic meters of lava had erupted since 29 September 2021 (figure 520). On 20 July around 1600 active ooze-outs were visible along the N edge of the crater, which continued through the next day. Extensive ooze-outs occurred along the W margin during 24 July until 1900; on 26 July minor ooze-outs were noted along the N margin. Minor spattering was visible on 29 July along the E margin of the lake. The sulfur dioxide emission rates ranged 650-2,800 tons per day (t/d), the higher of which was measured on 8 July (figure 519).
Activity during August 2022. The eruption continued in the Halema’uma’u crater at the western vent. According to HVO the lava in the active lake remained at the level of the bounding levees. Occasional minor ooze-outs were observed along the margins of the crater floor. Strong nighttime crater incandescence was visible after midnight on 6 August over the western vent cone. During 6-7 August scattered small lava lobes were active along the crater floor and incandescence persisted above the western vent through 9 August. During 7-9 August HVO reported a single lava effusion source was active along the NW margin of the crater floor. Measurements from an overflight on 4 August indicated that the crater floor was infilled about 136 m total and that 102 million cubic meters of lava had been erupted since the start of the eruption. Lava breakouts were reported along the N, NE, E, S, and W margins of the crater during 10-16 August. Another overflight survey conducted on 16 August indicated that the crater floor infilled about 137 m and 104 million cubic meters of lava had been erupted since September 2021. Measured sulfur dioxide emissions rates ranged 1,150-2,450 t/d, the higher of which occurred on 8 August.
Activity during September 2022. During September, lava effusion continued from the western vent into the active lava lake and onto the crater floor. Intermittent minor ooze-outs were reported through the month. A small ooze-out was visible on the W crater floor margin at 0220 on 2 September, which showed decreasing surface activity throughout the day, but remained active through 3 September. On 3 September around 1900 a lava outbreak occurred along the NW margin of the crater floor but had stopped by the evening of 4 September. Field crews monitoring the summit lava lake on 9 September observed spattering on the NE margin of the lake that rose no higher than 10 m, before falling back onto the lava lake crust (figure 521). Overflight measurements on 12 September indicated that the crater floor was infilled a total of 143 m and 111 million cubic meters of lava had been erupted since September 2021. Extensive breakouts in the W and N part of the crater floor were reported at 1600 on 20 September and continued into 26 September. The active part of the lava lake dropped by 10 m while other parts of the crater floor dropped by several meters. Summit tiltmeters recorded a summit seismic swarm of more than 80 earthquakes during 1500-1800 on 21 September, which occurred about 1.5 km below Halema’uma’u; a majority of these were less than Mw 2. By 22 September the active part of the lava lake was infilled about 2 m. On 23 September the western vent areas exhibited several small spatter cones with incandescent openings, along with weak, sporadic spattering (figure 522). The sulfur dioxide emission rate ranged from 930 t/d to 2,000 t/d, the higher of which was measured on 6 September.
Activity during October 2022. Activity during October declined slightly compared to previous months, though lava effusions persisted from the western vent into the active lava lake and onto the crater floor during October (figure 523). Slight variations in the lava lake were noted throughout the month. HVO reported that around 0600 on 3 October the level of the lava lake has lowered slightly. Overflight measurements taken on 5 October indicated that the crater floor was infilled a total of about 143 m and that 111 million cubic meters of lava had been effused since September 2021. During 6-7 October the lake gradually rose 0.5 m. Sulfur dioxide measurements made on 22 October had an emission rate of 700 t/d. Another overflight taken on 28 October showed that there was little to no change in the elevation of the crater floor: the crater floor was infilled a total of 143 m and 111 million cubic meters of lava had erupted since the start of the eruption.
Activity during November 2022. Activity remained low during November, though HVO reported that lava from the western vent continued to effuse into the active lava lake and onto the crater floor throughout the month. The rate of sulfur dioxide emissions during November ranged from 300-600 t/d, the higher amount of which occurred on 9 November.
Activity during December 2022. Similar low activity was reported during December, with lava effusing from the western vent into the active lava lake and onto the crater floor. During 4-5 December the active part of the lava lake was slightly variable in elevation and fluctuated within 1 m. On 9 December HVO reported that lava was no longer erupting from the western vent in the Halema’uma’u crater and that sulfur dioxide emissions had returned to near pre-eruption background levels; during 10-11 December, the lava lake had completely crusted over, and no incandescence was visible (figure 524). Time lapse camera images covering the 4-10 December showed that the crater floor showed weak deflation and no inflation. Some passive events of crustal overturning were reported during 14-15 December, which brought fresh incandescent lava to the lake surface. The sulfur dioxide emission rate was approximately 200 t/d on 14 December. A smaller overturn event on 17 December and another that occurred around 0000 and into the morning of 20 December were also detected. A small seismic swarm was later detected on 30 December.
Geologic Background. Kilauea overlaps the E flank of the massive Mauna Loa shield volcano in the island of Hawaii. Eruptions are prominent in Polynesian legends; written documentation since 1820 records frequent summit and flank lava flow eruptions interspersed with periods of long-term lava lake activity at Halemaumau crater in the summit caldera until 1924. The 3 x 5 km caldera was formed in several stages about 1,500 years ago and during the 18th century; eruptions have also originated from the lengthy East and Southwest rift zones, which extend to the ocean in both directions. About 90% of the surface of the basaltic shield volcano is formed of lava flows less than about 1,100 years old; 70% of the surface is younger than 600 years. The long-term eruption from the East rift zone between 1983 and 2018 produced lava flows covering more than 100 km2, destroyed hundreds of houses, and added new coastline.
Information Contacts: Hawaiian Volcano Observatory (HVO), U.S. Geological Survey, PO Box 51, Hawai'i National Park, HI 96718, USA (URL: http://hvo.wr.usgs.gov/).
Nyamulagira (DR Congo) — November 2023 Cite this Report
Nyamulagira
DR Congo
1.408°S, 29.2°E; summit elev. 3058 m
All times are local (unless otherwise noted)
Lava flows and thermal activity during May-October 2023
Nyamulagira (also known as Nyamuragira) is a shield volcano in the Democratic Republic of Congo with the summit truncated by a small 2 x 2.3 km caldera with walls up to about 100 m high. Documented eruptions have occurred within the summit caldera, as well as from numerous flank fissures and cinder cones. The current eruption period began in April 2018 and has more recently been characterized by summit crater lava flows and thermal activity (BGVN 48:05). This report describes lava flows and variable thermal activity during May through October 2023, based on information from the Observatoire Volcanologique de Goma (OVG) and various satellite data.
Lava lake activity continued during May. The MIROVA (Middle InfraRed Observation of Volcanic Activity) system recorded moderate-to-strong thermal activity throughout the reporting period; activity was more intense during May and October and relatively weaker from June through September (figure 95). The MODVOLC thermal algorithm, detected a total of 209 thermal alerts. There were 143 hotspots detected during May, eight during June, nine during September, and 49 during October. This activity was also reflected in infrared satellite images, where a lava flow was visible in the NW part of the crater on 7 May and strong activity was seen in the center of the crater on 4 October (figure 96). Another infrared satellite image taken on 12 May showed still active lava flows along the NW margin of the crater. According to OVG lava effusions were active during 7-29 May and moved to the N and NW parts of the crater beginning on 9 May. Strong summit crater incandescence was visible from Goma (27 km S) during the nights of 17, 19, and 20 May (figure 97). On 17 May there was an increase in eruptive activity, which peaked at 0100 on 20 May. Notable sulfur dioxide plumes drifted NW and W during 19-20 May (figure 98). Drone footage acquired in partnership with the USGS (United States Geological Survey) on 20 May captured images of narrow lava flows that traveled about 100 m down the W flank (figure 99). Data from the Rumangabo seismic station indicated a decreasing trend in activity during 17-21 May. Although weather clouds prevented clear views of the summit, a strong thermal signature on the NW flank was visible in an infrared satellite image on 22 May, based on an infrared satellite image. On 28 May the lava flows on the upper W flank began to cool and solidify. By 29 May seismicity returned to levels similar to those recorded before the 17 May increase. Lava effusion continued but was confined to the summit crater; periodic crater incandescence was observed.
Low-level activity was noted during June through October. On 1 June OVG reported that seismicity remained at lower levels and that crater incandescence had been absent for three days, though infrared satellite imagery showed continued lava effusion in the summit crater. The lava flows on the flanks covered an estimated 0.6 km2. Satellite imagery continued to show thermal activity confined to the lava lake through October (figure 96), although no lava flows or significant sulfur dioxide emissions were reported.
Geologic Background. Africa's most active volcano, Nyamulagira (also known as Nyamuragira), is a massive high-potassium basaltic shield about 25 km N of Lake Kivu and 13 km NNW of the steep-sided Nyiragongo volcano. The summit is truncated by a small 2 x 2.3 km caldera that has walls up to about 100 m high. Documented eruptions have occurred within the summit caldera, as well as from the numerous flank fissures and cinder cones. A lava lake in the summit crater, active since at least 1921, drained in 1938, at the time of a major flank eruption. Recent lava flows extend down the flanks more than 30 km from the summit as far as Lake Kivu; extensive lava flows from this volcano have covered 1,500 km2 of the western branch of the East African Rift.
Information Contacts: Observatoire Volcanologique de Goma (OVG), Departement de Geophysique, Centre de Recherche en Sciences Naturelles, Lwiro, D.S. Bukavu, DR Congo; Hawai'i Institute of Geophysics and Planetology (HIGP) - MODVOLC Thermal Alerts System, School of Ocean and Earth Science and Technology (SOEST), Univ. of Hawai'i, 2525 Correa Road, Honolulu, HI 96822, USA (URL: http://modis.higp.hawaii.edu/); MIROVA (Middle InfraRed Observation of Volcanic Activity), a collaborative project between the Universities of Turin and Florence (Italy) supported by the Centre for Volcanic Risk of the Italian Civil Protection Department (URL: http://www.mirovaweb.it/); NASA Global Sulfur Dioxide Monitoring Page, Atmospheric Chemistry and Dynamics Laboratory, NASA Goddard Space Flight Center (NASA/GSFC), 8800 Greenbelt Road, Goddard, Maryland, USA (URL: https://so2.gsfc.nasa.gov/); Copernicus Browser, Copernicus Data Space Ecosystem, European Space Agency (URL: https://dataspace.copernicus.eu/browser/); Charles Balagizi, Goma Volcano Observatory, Departement de Geophysique, Centre de Recherche en Sciences Naturelles, Lwiro, D.S. Bukavu, DR Congo.
Bagana (Papua New Guinea) — October 2023 Cite this Report
Bagana
Papua New Guinea
6.137°S, 155.196°E; summit elev. 1855 m
All times are local (unless otherwise noted)
Explosions, ash plumes, ashfall, and lava flows during April-September 2023
The remote volcano of Bagana is located in central Bougainville Island, Papua New Guinea. Recorded eruptions date back to 1842 and activity has consisted of effusive activity that has built a small lava dome in the summit crater and occasional explosions that produced pyroclastic flows. The most recent eruption has been ongoing since February 2000 and has produced occasional explosions, ash plumes, and lava flows. More recently, activity has been characterized by ongoing effusive activity and ash emissions (BGVN 48:04). This report updates activity from April through September 2023 that has consisted of explosions, ash plumes, ashfall, and lava flows, using information from the Darwin Volcanic Ash Advisory Center (VAAC) and satellite data.
An explosive eruption was reported on 7 July that generated a large gas-and-ash plume to high altitudes and caused significant ashfall in local communities; the eruption plume had reached upper tropospheric (16-18 km altitude) altitudes by 2200, according to satellite images. Sulfur dioxide plumes were detected in satellite images on 8 July and indicated that the plume was likely a mixture of gas, ice, and ash. A report issued by the Autonomous Bougainville Government (ABG) (Torokina District, Education Section) on 10 July noted that significant ash began falling during 2000-2100 on 7 July and covered most areas in the Vuakovi, Gotana (9 km SW), Koromaketo, Laruma (25 km W) and Atsilima (27 km NW) villages. Pyroclastic flows also occurred, according to ground-based reports; small deposits confined to one drainage were inspected by RVO during an overflight on 17 July and were confirmed to be from the 7 July event. Ashfall continued until 10 July and covered vegetation, which destroyed bushes and gardens and contaminated rivers and streams.
RVO reported another eruption on 14 July. The Darwin VAAC stated that an explosive event started around 0830 on 15 July and produced an ash plume that rose to 16.5 km altitude by 1000 and drifted N, according to satellite images. The plume continued to drift N and remained visible through 1900, and by 2150 it had dissipated.
Ashfall likely from both the 7 and 15 July events impacted about 8,111 people in Torokina (20 km SW), including Tsito/Vuakovi, Gotana, Koromaketo, Kenaia, Longkogari, Kenbaki, Piva (13 km SW), and Atsinima, and in the Tsitovi district, according to ABG. Significant ashfall was also reported in Ruruvu (22 km N) in the Wakunai District of Central Bougainville, though the thickness of these deposits could not be confirmed. An evacuation was called for the villages in Wakunai, where heavy ashfall had contaminated water sources; the communities of Ruruvu, Togarau, Kakarapaia, Karauturi, Atao, and Kuritaturi were asked to evacuate to a disaster center at the Wakunai District Station, and communities in Torokina were asked to evacuate to the Piva District station. According to a news article, more than 7,000 people needed temporary accommodations, with about 1,000 people in evacuation shelters. Ashfall had deposited over a broad area, contaminating water supplies, affecting crops, and collapsing some roofs and houses in rural areas. Schools were temporarily shut down. Intermittent ash emissions continued through the end of July and drifted NNW, NW, and SW. Fine ashfall was reported on the coast of Torokina, and ash plumes also drifted toward Laruma and Atsilima.
A small explosive eruption occurred at 2130 on 28 July that ejected material from the crater vents, according to reports from Torokina, in addition to a lava flow that contained two lobes. A second explosion was detected at 2157. Incandescence from the lava flow was visible from Piva as it descended the W flank around 2000 on 29 July (figure 47). The Darwin VAAC reported that a strong thermal anomaly was visible in satellite images during 30-31 July and that ash emissions rose to 2.4 km altitude and drifted WSW on 30 July. A ground report from RVO described localized emissions at 0900 on 31 July.
The Darwin VAAC reported that ash plumes were identified in satellite imagery at 0800 and 1220 on 12 August and rose to 2.1 km and 3 km altitude and drifted NW and W, respectively. A news report stated that aid was sent to more than 6,300 people that were adversely affected by the eruption. Photos taken during 17-19 August showed ash emissions rising no higher than 1 km above the summit and drifting SE. A small explosion generated an ash plume during the morning of 19 August. Deposits from small pyroclastic flows were also captured in the photos. Satellite images captured lava flows and pyroclastic flow deposits. Two temporary seismic stations were installed near Bagana on 17 August at distances of 7 km WSW (Vakovi station) and 11 km SW (Kepox station). The Kepox station immediately started to record continuous, low-frequency background seismicity.
Satellite data. Little to no thermal activity was detected during April through mid-July 2023; only one anomaly was recorded during early April and one during early June, according to MIROVA (Middle InfraRed Observation of Volcanic Activity) data (figure 48). Thermal activity increased in both power and frequency during mid-July through September, although there were still some short gaps in detected activity. MODVOLC also detected increased thermal activity during August; thermal hotspots were detected a total of five times on 19, 20, and 27 August. Weak thermal anomalies were also captured in infrared satellite images on clear weather days throughout the reporting period on 7, 12, and 17 April, 27 May, 1, 6, 16, and 31 July, and 19 September (figure 48); a strong thermal anomaly was visible on 31 July. Distinct sulfur dioxide plumes that drifted generally NW were intermittently captured by the TROPOMI instrument on the Sentinel-5P satellite and sometimes exceeded two Dobson Units (DUs) (figure 49).
Geologic Background. Bagana volcano, in a remote portion of central Bougainville Island, is frequently active. This massive symmetrical cone was largely constructed by an accumulation of viscous andesitic lava flows. The entire edifice could have been constructed in about 300 years at its present rate of lava production. Eruptive activity is characterized by non-explosive effusion of viscous lava that maintains a small lava dome in the summit crater, although occasional explosive activity produces pyroclastic flows. Lava flows with tongue-shaped lobes up to 50 m thick and prominent levees descend the flanks on all sides.
Information Contacts: Rabaul Volcano Observatory (RVO), Geohazards Management Division, Department of Mineral Policy and Geohazards Management (DMPGM), PO Box 3386, Kokopo, East New Britain Province, Papua New Guinea; Darwin Volcanic Ash Advisory Centre (VAAC), Bureau of Meteorology, Northern Territory Regional Office, PO Box 40050, Casuarina, NT 0811, Australia (URL: http://www.bom.gov.au/info/vaac/); MIROVA (Middle InfraRed Observation of Volcanic Activity), a collaborative project between the Universities of Turin and Florence (Italy) supported by the Centre for Volcanic Risk of the Italian Civil Protection Department (URL: http://www.mirovaweb.it/); Hawai'i Institute of Geophysics and Planetology (HIGP) - MODVOLC Thermal Alerts System, School of Ocean and Earth Science and Technology (SOEST), Univ. of Hawai'i, 2525 Correa Road, Honolulu, HI 96822, USA (URL: http://modis.higp.hawaii.edu/); NASA Global Sulfur Dioxide Monitoring Page, Atmospheric Chemistry and Dynamics Laboratory, NASA Goddard Space Flight Center (NASA/GSFC), 8800 Greenbelt Road, Goddard, Maryland, USA (URL: https://so2.gsfc.nasa.gov/); Copernicus Browser, Copernicus Data Space Ecosystem, European Space Agency (URL: https://dataspace.copernicus.eu/browser/); Autonomous Bougainville Government, P.O Box 322, Buka, AROB, PNG (URL: https://abg.gov.pg/); Andrew Tupper (Twitter: @andrewcraigtupp); Simon Carn, Geological and Mining Engineering and Sciences, Michigan Technological University, 1400 Townsend Drive, Houghton, MI 49931, USA (URL: http://www.volcarno.com/, Twitter: @simoncarn); Radio NZ (URL: https://www.rnz.co.nz/news/pacific/494464/more-than-7-000-people-in-bougainville-need-temporary-accommodation-after-eruption); USAID, 1300 Pennsylvania Ave, NW, Washington DC 20004, USA (URL: https://www.usaid.gov/pacific-islands/press-releases/aug-08-2023-united-states-provides-immediate-emergency-assistance-support-communities-affected-mount-bagana-volcanic-eruptions).
Mayon (Philippines) — October 2023 Cite this Report
Mayon
Philippines
13.257°N, 123.685°E; summit elev. 2462 m
All times are local (unless otherwise noted)
Lava flows, pyroclastic flows, ash emissions, and seismicity during April-September 2023
Mayon is located in the Philippines and has steep upper slopes capped by a small summit crater. Historical eruptions date back to 1616 CE that have been characterized by Strombolian eruptions, lava flows, pyroclastic flows, and mudflows. Eruptions mostly originated from a central conduit. Pyroclastic flows and mudflows have commonly descended many of the approximately 40 drainages that surround the volcano. The most recent eruption occurred during June through October 2022 and consisted of lava dome growth and gas-and-steam emissions (BGVN 47:12). A new eruption was reported during late April 2023 and has included lava flows, pyroclastic density currents, ash emissions, and seismicity. This report covers activity during April through September 2023 based on daily bulletins from the Philippine Institute of Volcanology and Seismology (PHIVOLCS).
During April through September 2023, PHIVOLCS reported near-daily rockfall events, frequent volcanic earthquakes, and sulfur dioxide measurements. Gas-and-steam emissions rose 100-900 m above the crater and drifted in different directions. Nighttime crater incandescence was often visible during clear weather and was accompanied by incandescent avalanches of material. Activity notably increased during June when lava flows were reported on the S, SE, and E flanks (figure 52). The MIROVA graph (Middle InfraRed Observation of Volcanic Activity) showed strong thermal activity coincident with these lava flows, which remained active through September (figure 53). According to the MODVOLC thermal algorithm, a total of 110 thermal alerts were detected during the reporting period: 17 during June, 40 during July, 27 during August, and 26 during September. During early June, pyroclastic density currents (PDCs) started to occur more frequently.
Low activity was reported during much of April and May; gas-and-steam emissions rose 100-900 m above the crater and generally drifted in different directions. A total of 52 rockfall events and 18 volcanic earthquakes were detected during April and 147 rockfall events and 13 volcanic events during May. Sulfur dioxide flux measurements ranged between 400-576 tons per day (t/d) during April, the latter of which was measured on 29 April and between 162-343 t/d during May, the latter of which was measured on 13 May.
Activity during June increased, characterized by lava flows, pyroclastic density currents (PDCs), crater incandescence and incandescent rockfall events, gas-and-steam emissions, and continued seismicity. Weather clouds often prevented clear views of the summit, but during clear days, moderate gas-and-steam emissions rose 100-2,500 m above the crater and drifted in multiple directions. A total of 6,237 rockfall events and 288 volcanic earthquakes were detected. The rockfall events often deposited material on the S and SE flanks within 700-1,500 m of the summit crater and ash from the events drifted SW, S, SE, NE, and E. Sulfur dioxide emissions ranged between 149-1,205 t/d, the latter of which was measured on 10 June. Short-term observations from EDM and electronic tiltmeter monitoring indicated that the upper slopes were inflating since February 2023. Longer-term ground deformation parameters based on EDM, precise leveling, continuous GPS, and electronic tilt monitoring indicated that the volcano remained inflated, especially on the NW and SE flanks. At 1000 on 5 June the Volcano Alert Level (VAL) was raised to 2 (on a 0-5 scale). PHIVOLCS noted that although low-level volcanic earthquakes, ground deformation, and volcanic gas emissions indicated unrest, the steep increase in rockfall frequency may indicate increased dome activity.
A total of 151 dome-collapse PDCs occurred during 8-9 and 11-30 June, traveled 500-2,000 m, and deposited material on the S flank within 2 km of the summit crater. During 8-9 June the VAL was raised to 3. At approximately 1947 on 11 June lava flow activity was reported; two lobes traveled within 500 m from the crater and deposited material on the S (Mi-isi), SE (Bonga), and E (Basud) flanks. Weak seismicity accompanied the lava flow and slight inflation on the upper flanks. This lava flow remained active through 30 June, moving down the S and SE flank as far as 2.5 km and 1.8 km, respectively and depositing material up to 3.3 km from the crater. During 15-16 June traces of ashfall from the PDCs were reported in Sitio Buga, Nabonton, City of Ligao and Purok, and San Francisco, Municipality of Guinobatan. During 28-29 June there were two PDCs generated by the collapse of the lava flow front, which generated a light-brown ash plume 1 km high. Satellite monitors detected significant concentrations of sulfur dioxide beginning on 29 June. On 30 June PDCs primarily affected the Basud Gully on the E flank, the largest of which occurred at 1301 and lasted eight minutes, based on the seismic record. Four PDCs generated between 1800 and 2000 that lasted approximately four minutes each traveled 3-4 km on the E flank and generated an ash plume that rose 1 km above the crater and drifted N and NW. Ashfall was recorded in Tabaco City.
Similar strong activity continued during July; slow lava effusion remained active on the S and SE flanks and traveled as far as 2.8 km and 2.8 km, respectively and material was deposited as far as 4 km from the crater. There was a total of 6,983 rockfall events and 189 PDCs that affected the S, SE, and E flanks. The volcano network detected a total of 2,124 volcanic earthquakes. Continuous gas-and-steam emissions rose 200-2,000 m above the crater and drifted in multiple directions. Sulfur dioxide emissions averaged 792-4,113 t/d, the latter of which was measured on 28 July. During 2-4 July three PDCs were generated from the collapse of the lava flow and resulting light brown plumes rose 200-300 m above the crater. Continuous tremor pulses were reported beginning at 1547 on 3 July through 7 July at 1200, at 2300 on 8 July and going through 0300 on 10 July, and at 2300 on 16 July, as recorded by the seismic network. During 6-9 July there were 10 lava flow-collapse-related PDCs that generated light brown plumes 300-500 m above the crater. During 10-11 July light ashfall was reported in some areas of Mabinit, Legazpi City, Budiao and Salvacion, Daraga, and Camalig, Albay. By 18 July the lava flow advanced 600 m on the E flank as well.
During 1733 on 18 July and 0434 on 19 July PHIVOLCS reported 30 “ashing” events, which are degassing events accompanied by audible thunder-like sounds and entrained ash at the crater, which produced short, dark plumes that drifted SW. These events each lasted 20-40 seconds, and plume heights ranged from 150-300 m above the crater, as recorded by seismic, infrasound, visual, and thermal monitors. Three more ashing events occurred during 19-20 July. Short-term observations from electronic tilt and GPS monitoring indicate deflation on the E lower flanks in early July and inflation on the NW middle flanks during the third week of July. Longer-term ground deformation parameters from EDM, precise leveling, continuous GPS, and electronic tilt monitoring indicated that the volcano was still generally inflated relative to baseline levels. A short-lived lava pulse lasted 28 seconds at 1956 on 21 July, which was accompanied by seismic and infrasound signals. By 22 July, the only lava flow that remained active was on the SE flank, and continued to extend 3.4 km, while those on the S and E flanks weakened markedly. One ashing event was detected during 30-31 July, whereas there were 57 detected during 31 July-1 August; according to PHIVOLCS beginning at approximately 1800 on 31 July eruptive activity was dominated by phases of intermittent ashing, as well as increased in the apparent rates of lava effusion from the summit crater. The ashing phases consisted of discrete events recorded as low-frequency volcanic earthquakes (LFVQ) typically 30 seconds in duration, based on seismic and infrasound signals. Gray ash plume rose 100 m above the crater and generally drifted NE. Shortly after these ashing events began, new lava began to effuse rapidly from the crater, feeding the established flowed on the SE, E, and E flanks and generating frequent rockfall events.
Intensified unrest persisted during August. There was a total of 4,141 rockfall events, 2,881 volcanic earthquakes, which included volcanic tremor events, 32 ashing events, and 101 PDCs detected throughout the month. On clear weather days, gas-and-steam emissions rose 300-1,500 m above the crater and drifted in different directions (figure 54). Sulfur dioxide emissions averaged 735-4,756 t/d, the higher value of which was measured on 16 August. During 1-2 August the rate of lava effusion decreased, but continued to feed the flows on the SE, S, and E flanks, maintaining their advances to 3.4 km, 2.8 km, and 1.1 km from the crater, respectively (figure 55). Rockfall and PDCs generated by collapses at the lava flow margins and from the summit dome deposited material within 4 km of the crater. During 3-4 August there were 10 tremor events detected that lasted 1-4 minutes. Short-lived lava pulse lasted 35 seconds and was accompanied by seismic and infrasound signals at 0442 on 6 August. Seven collapses were recorded at the front of the lava flow during 12-14 August.
During September, similar activity of slow lava effusion, PDCs, gas-and-steam emissions, and seismicity continued. There was a total of 4,452 rockfall events, 329 volcanic earthquakes, which included volcanic tremor events, two ashing events, and 85 PDCs recorded throughout the month. On clear weather days, gas-and-steam emissions rose 100-1,500 m above the crater and drifted in multiple directions. Sulfur dioxide emissions averaged 609-2,252 t/d, the higher average of which was measured on 6 September. Slow lava effusion continued advancing on the SE, S, and E flanks, maintaining lengths of 3.4 km, 2.8 km, and 1.1 km, respectively. Rockfall and PDC events generated by collapses along the lava flow margins and at the summit dome deposited material within 4 km of the crater.
Geologic Background. Symmetrical Mayon, which rises above the Albay Gulf NW of Legazpi City, is the most active volcano of the Philippines. The steep upper slopes are capped by a small summit crater. Recorded eruptions since 1616 CE range from Strombolian to basaltic Plinian, with cyclical activity beginning with basaltic eruptions, followed by longer periods of andesitic lava flows. Eruptions occur predominately from the central conduit and have also produced lava flows that travel far down the flanks. Pyroclastic density currents and mudflows have commonly swept down many of the approximately 40 ravines that radiate from the summit and have often damaged populated lowland areas. A violent eruption in 1814 killed more than 1,200 people and devastated several towns.
Information Contacts: Philippine Institute of Volcanology and Seismology (PHIVOLCS), Department of Science and Technology, University of the Philippines Campus, Diliman, Quezon City, Philippines (URL: http://www.phivolcs.dost.gov.ph/); MIROVA (Middle InfraRed Observation of Volcanic Activity), a collaborative project between the Universities of Turin and Florence (Italy) supported by the Centre for Volcanic Risk of the Italian Civil Protection Department (URL: http://www.mirovaweb.it/); Hawai'i Institute of Geophysics and Planetology (HIGP) - MODVOLC Thermal Alerts System, School of Ocean and Earth Science and Technology (SOEST), Univ. of Hawai'i, 2525 Correa Road, Honolulu, HI 96822, USA (URL: http://modis.higp.hawaii.edu/); Copernicus Browser, Copernicus Data Space Ecosystem, European Space Agency (URL: https://dataspace.copernicus.eu/browser/); William Rogers, Legazpi City, Albay Province, Philippines.
Nishinoshima (Japan) — October 2023 Cite this Report
Nishinoshima
Japan
27.247°N, 140.874°E; summit elev. 100 m
All times are local (unless otherwise noted)
Eruption plumes and gas-and-steam plumes during May-August 2023
Nishinoshima, located about 1,000 km S of Tokyo, is a small island in the Ogasawara Arc in Japan. The island is the summit of a massive submarine volcano that has prominent submarine peaks to the S, W, and NE. Eruptions date back to 1973 and the current eruption period began in October 2022. Recent activity has consisted of small ash plumes and fumarolic activity (BGVN 48:07). This report covers activity during May through August 2023, using information from monthly reports of the Japan Meteorological Agency (JMA) monthly reports and satellite data.
Activity during May through June was relatively low. The Japan Coast Guard (JCG) did overflights on 14 and 22 June and reported white gas-and-steam emissions rising 600 m and 1,200 m from the central crater of the pyroclastic cone, respectively (figure 125). In addition, multiple white gas-and-steam emissions rose from the inner rim of the W side of the crater and from the SE flank of the pyroclastic cone. Discolored brown-to-green water was observed around almost the entire perimeter of the island; on 22 June light green discolored water was observed off the S coast of the island.
Observations from the Himawari meteorological satellite confirmed an eruption on 9 and 10 July. An eruption plume rose 1.6 km above the crater and drifted N around 1300 on 9 July. Satellite images acquired at 1420 and 2020 on 9 July and at 0220 on 10 July showed continuing emissions that rose 1.3-1.6 km above the crater and drifted NE and N. The Tokyo VAAC reported that an ash plume seen by a pilot and identified in a satellite image at 0630 on 21 July rose to 3 km altitude and drifted S.
Aerial observations conducted by JCG on 8 August showed a white-and-gray plume rising from the central crater of the pyroclastic cone, and multiple white gas-and-steam emissions were rising from the inner edge of the western crater and along the NW-SE flanks of the island (figure 126). Brown-to-green discolored water was also noted around the perimeter of the island.
Intermittent low-to-moderate power thermal anomalies were recorded in the MIROVA graph (Middle InfraRed Observation of Volcanic Activity), showing an increase in both frequency and power beginning in July (figure 127). This increase in activity coincides with eruptive activity on 9 and 10 July, characterized by eruption plumes. According to the MODVOLC thermal alert algorithm, one thermal hotspot was recorded on 20 July. Weak thermal anomalies were also detected in infrared satellite imagery, accompanied by strong gas-and-steam plumes (figure 128).
Geologic Background. The small island of Nishinoshima was enlarged when several new islands coalesced during an eruption in 1973-74. Multiple eruptions that began in 2013 completely covered the previous exposed surface and continued to enlarge the island. The island is the summit of a massive submarine volcano that has prominent peaks to the S, W, and NE. The summit of the southern cone rises to within 214 m of the ocean surface 9 km SSE.
Information Contacts: Japan Meteorological Agency (JMA), 1-3-4 Otemachi, Chiyoda-ku, Tokyo 100-8122, Japan (URL: http://www.jma.go.jp/jma/indexe.html); Tokyo Volcanic Ash Advisory Center (VAAC), 1-3-4 Otemachi, Chiyoda-ku, Tokyo 100-8122, Japan (URL: http://ds.data.jma.go.jp/svd/vaac/data/); MIROVA (Middle InfraRed Observation of Volcanic Activity), a collaborative project between the Universities of Turin and Florence (Italy) supported by the Centre for Volcanic Risk of the Italian Civil Protection Department (URL: http://www.mirovaweb.it/); Copernicus Browser, Copernicus Data Space Ecosystem, European Space Agency (URL: https://dataspace.copernicus.eu/browser/).
Krakatau (Indonesia) — October 2023 Cite this Report
Krakatau
Indonesia
6.1009°S, 105.4233°E; summit elev. 285 m
All times are local (unless otherwise noted)
White gas-and-steam plumes and occasional ash plumes during May-August 2023
Krakatau is located in the Sunda Strait between Java and Sumatra, Indonesia. Caldera collapse during the catastrophic 1883 eruption destroyed Danan and Perbuwatan cones and left only a remnant of Rakata. The post-collapse cone of Anak Krakatau (Child of Krakatau) was constructed within the 1883 caldera at a point between the former Danan and Perbuwatan cones; it has been the site of frequent eruptions since 1927. The current eruption period began in May 2021 and has recently consisted of Strombolian eruptions and ash plumes (BGVN 48:07). This report describes lower levels of activity consisting of ash and white gas-and-steam plumes during May through August 2023, based on information provided by the Indonesian Center for Volcanology and Geological Hazard Mitigation, referred to as Pusat Vulkanologi dan Mitigasi Bencana Geologi (PVMBG), MAGMA Indonesia, and satellite data.
Activity was relatively low during May and June. Daily white gas-and-steam emissions rose 25-200 m above the crater and drifted in different directions. Five ash plumes were detected at 0519 on 10 May, 1241 on 11 May, 0920 on 12 May, 2320 on 12 May, and at 0710 on 13 May, and rose 1-2.5 km above the crater and drifted SW. A webcam image taken on 12 May showed ejection of incandescent material above the vent. A total of nine ash plumes were detected during 6-11 June: at 1434 and 00220 on 6 and 7 June the ash plumes rose 500 m above the crater and drifted NW, at 1537 on 8 June the ash plume rose 1 km above the crater and drifted SW, at 0746 and at 0846 on 9 June the ash plumes rose 800 m and 3 km above the crater and drifted SW, respectively, at 0423, 1431, and 1750 on 10 June the ash plumes rose 2 km, 1.5 km, and 3.5 km above the crater and drifted NW, respectively, and at 0030 on 11 June an ash plume rose 2 km above the crater and drifted NW. Webcam images taken on 10 and 11 June at 0455 and 0102, respectively, showed incandescent material ejected above the vent. On 19 June an ash plume at 0822 rose 1.5 km above the crater and drifted SE.
Similar low activity of white gas-and-steam emissions and few ash plumes were reported during July and August. Daily white gas-and-steam emissions rose 25-300 m above the crater and drifted in multiple directions. Three ash plumes were reported at 0843, 0851, and 0852 on 20 July that rose 500-2,000 m above the crater and drifted NW.
The MIROVA (Middle InfraRed Observation of Volcanic Activity) graph of MODIS thermal anomaly data showed intermittent low-to-moderate power thermal anomalies during May through August 2023 (figure 140). Although activity was often obscured by weather clouds, a thermal anomaly was visible in an infrared satellite image of the crater on 12 May, accompanied by an eruption plume that drifted SW (figure 141).
Geologic Background. The renowned Krakatau (frequently mis-named as Krakatoa) volcano lies in the Sunda Strait between Java and Sumatra. Collapse of an older edifice, perhaps in 416 or 535 CE, formed a 7-km-wide caldera. Remnants of that volcano are preserved in Verlaten and Lang Islands; subsequently the Rakata, Danan, and Perbuwatan cones were formed, coalescing to create the pre-1883 Krakatau Island. Caldera collapse during the catastrophic 1883 eruption destroyed Danan and Perbuwatan, and left only a remnant of Rakata. This eruption caused more than 36,000 fatalities, most as a result of tsunamis that swept the adjacent coastlines of Sumatra and Java. Pyroclastic surges traveled 40 km across the Sunda Strait and reached the Sumatra coast. After a quiescence of less than a half century, the post-collapse cone of Anak Krakatau (Child of Krakatau) was constructed within the 1883 caldera at a point between the former Danan and Perbuwatan cones. Anak Krakatau has been the site of frequent eruptions since 1927.
Information Contacts: Pusat Vulkanologi dan Mitigasi Bencana Geologi (PVMBG, also known as Indonesian Center for Volcanology and Geological Hazard Mitigation, CVGHM), Jalan Diponegoro 57, Bandung 40122, Indonesia (URL: http://www.vsi.esdm.go.id/); MAGMA Indonesia, Kementerian Energi dan Sumber Daya Mineral (URL: https://magma.esdm.go.id/v1); MIROVA (Middle InfraRed Observation of Volcanic Activity), a collaborative project between the Universities of Turin and Florence (Italy) supported by the Centre for Volcanic Risk of the Italian Civil Protection Department (URL: http://www.mirovaweb.it/); Copernicus Browser, Copernicus Data Space Ecosystem, European Space Agency (URL: https://dataspace.copernicus.eu/browser/).
Villarrica (Chile) — October 2023 Cite this Report
Villarrica
Chile
39.42°S, 71.93°W; summit elev. 2847 m
All times are local (unless otherwise noted)
Strombolian activity, gas-and-ash emissions, and crater incandescence during April-September 2023
Villarrica, in central Chile, consists of a 2-km-wide caldera that formed about 3,500 years ago and is located at the base of the presently active cone at the NW margin of a 6-km-wide caldera. Historical eruptions eruptions date back to 1558 and have been characterized by mild-to-moderate explosive activity with occasional lava effusions. The current eruption period began in December 2014 and has recently consisted of nighttime crater incandescence, ash emissions, and seismicity (BGVN 48:04). This report covers activity during April through September 2023 and describes occasional Strombolian activity, gas-and-ash emissions, and nighttime crater incandescence. Information for this report primarily comes from the Southern Andes Volcano Observatory (Observatorio Volcanológico de Los Andes del Sur, OVDAS), part of Chile's National Service of Geology and Mining (Servicio Nacional de Geología y Minería, SERNAGEOMIN) and satellite data.
Seismicity during April consisted of long period (LP) events and tremor (TRE); a total of 9,413 LP-type events and 759 TR-type events were detected throughout the month. Nighttime crater incandescence persisted and was visible in the degassing column. Sulfur dioxide data was obtained using Differential Absorption Optical Spectroscopy Equipment (DOAS) that showed an average value of 1,450 ± 198 tons per day (t/d) during 1-15 April and 1,129 ± 201 t/d during 16-30 April, with a maximum daily value of 2,784 t/d on 9 April. Gas-and-steam emissions of variable intensities rose above the active crater as high as 1.3 km above the crater on 13 April. Strombolian explosions were not observed and there was a slight decrease in the lava lake level.
There were 14,123 LP-type events and 727 TR-type events detected during May. According to sulfur dioxide measurements taken with DOAS equipment, the active crater emitted an average value of 1,826 ± 482 t/d during 1-15 May and 912 ± 41 t/d during 16-30 May, with a daily maximum value of 5,155 t/d on 13 May. Surveillance cameras showed continuous white gas-and-steam emissions that rose as high as 430 m above the crater on 27 May. Nighttime incandescence illuminated the gas column less than 300 m above the crater rim was and no pyroclastic emissions were reported. A landslide was identified on 13 May on the E flank of the volcano 50 m from the crater rim and extending 300 m away; SERNAGEOMIN noted that this event may have occurred on 12 May. During the morning of 27 and 28 May minor Strombolian explosions characterized by incandescent ejecta were recorded at the crater rim; the last reported Strombolian explosions had occurred at the end of March.
Seismic activity during June consisted of five volcano-tectonic (VT)-type events, 21,606 LP-type events, and 2,085 TR-type events. The average value of sulfur dioxide flux obtained by DOAS equipment was 1,420 ± 217 t/d during 1-15 June and 2,562 ± 804 t/d, with a maximum daily value of 4,810 t/d on 17 June. White gas-and-steam emissions rose less than 480 m above the crater; frequent nighttime crater incandescence was reflected in the degassing plume. On 12 June an emission rose 100 m above the crater and drifted NNW. On 15 June one or several emissions resulted in ashfall to the NE as far as 5.5 km from the crater, based on a Skysat satellite image. Several Strombolian explosions occurred within the crater; activity on 15 June was higher energy and ejected blocks 200-300 m on the NE slope. Surveillance cameras showed white gas-and-steam emissions rising 480 m above the crater on 16 June. On 19 and 24 June low-intensity Strombolian activity was observed, ejecting material as far as 200 m from the center of the crater to the E.
During July, seismicity included 29,319 LP-type events, 3,736 TR-type events, and two VT-type events. DOAS equipment recorded two days of sulfur dioxide emissions of 4,220 t/d and 1,009 t/d on 1 and 13 July, respectively. Constant nighttime incandescence was also recorded and was particularly noticeable when accompanied by eruptive columns on 12 and 16 July. Minor explosive events were detected in the crater. According to Skysat satellite images taken on 12, 13, and 16 July, ashfall deposits were identified 155 m S of the crater. According to POVI, incandescence was visible from two vents on the crater floor around 0336 on 12 July. Gas-and-ash emissions rose as high as 1.2 km above the crater on 13 July and drifted E and NW. A series of gas-and-steam pulses containing some ash deposited material on the upper E flank around 1551 on 13 July. During 16-31 July, average sulfur dioxide emissions of 1,679 ± 406 t/d were recorded, with a maximum daily value of 2,343 t/d on 28 July. Fine ash emissions were also reported on 16, 17, and 23 July.
Seismicity persisted during August, characterized by 27,011 LP-type events, 3,323 TR-type events, and three VT-type events. The average value of sulfur dioxide measurements taken during 1-15 August was 1,642 ± 270 t/d and 2,207 ± 4,549 t/d during 16-31 August, with a maximum daily value of 3,294 t/d on 27 August. Nighttime crater incandescence remained visible in degassing columns. White gas-and-steam emissions rose 480 m above the crater on 6 August. According to a Skysat satellite image from 6 August, ash accumulation was observed proximal to the crater and was mainly distributed toward the E slope. White gas-and-steam emissions rose 320 m above the crater on 26 August. Nighttime incandescence and Strombolian activity that generated ash emissions were reported on 27 August.
Seismicity during September was characterized by five VT-type events, 12,057 LP-type events, and 2,058 TR-type events. Nighttime incandescence persisted. On 2 September an ash emission rose 180 m above the crater and drifted SE at 1643 (figure 125) and a white gas-and-steam plume rose 320 m above the crater. According to the Buenos Aires VAAC, periods of continuous gas-and-ash emissions were visible in webcam images from 1830 on 2 September to 0110 on 3 September. Strombolian activity was observed on 2 September and during the early morning of 3 September, the latter event of which generated an ash emission that rose 60 m above the crater and drifted 100 m from the center of the crater to the NE and SW. Ashfall was reported to the SE and S as far as 750 m from the crater. The lava lake was active during 3-4 September and lava fountaining was visible for the first time since 26 March 2023, according to POVI. Fountains captured in webcam images at 2133 on 3 September and at 0054 on 4 September rose as high as 60 m above the crater rim and ejected material onto the upper W flank. Sulfur dioxide flux of 1,730 t/d and 1,281 t/d was measured on 3 and 4 September, respectively, according to data obtained by DOAS equipment.
Strong Strombolian activity and larger gas-and-ash plumes were reported during 18-20 September. On 18 September activity was also associated with energetic LP-type events and notable sulfur dioxide fluxes (as high as 4,277 t/d). On 19 September Strombolian activity and incandescence were observed. On 20 September at 0914 ash emissions rose 50 m above the crater and drifted SSE, accompanied by Strombolian activity that ejected material less than 100 m SSE, causing fall deposits on that respective flank. SERNAGEOMIN reported that a Planet Scope satellite image taken on 20 September showed the lava lake in the crater, measuring 32 m x 35 m and an area of 0.001 km2. Several ash emissions were recorded at 0841, 0910, 1251, 1306, 1312, 1315, and 1324 on 23 September and rose less than 150 m above the crater. The sulfur dioxide flux value was 698 t/d on 23 September and 1,097 t/d on 24 September. On 24 September the Volcanic Alert Level (VAL) was raised to Orange (the third level on a four-color scale). SENAPRED maintained the Alert Level at Yellow (the middle level on a three-color scale) for the communities of Villarrica, Pucón (16 km N), Curarrehue, and Panguipulli.
During 24-25 September there was an increase in seismic energy (observed at TR-events) and acoustic signals, characterized by 1 VT-type event, 213 LP-type events, and 124 TR-type events. Mainly white gas-and-steam emissions, in addition to occasional fine ash emissions were recorded. During the early morning of 25 September Strombolian explosions were reported and ejected material 250 m in all directions, though dominantly toward the NW. On 25 September the average value of sulfur dioxide flux was 760 t/d. Seismicity during 25-30 September consisted of five VT-type events, 1,937 LP-type events, and 456 TR-type events.
During 25-29 September moderate Strombolian activity was observed and ejected material as far as the crater rim. In addition, ash pulses lasting roughly 50 minutes were observed around 0700 and dispersed ENE. During 26-27 September a TR episode lasted 6.5 hours and was accompanied by discrete acoustic signals. Satellite images from 26 September showed a spatter cone on the crater floor with one vent that measured 10 x 14 m and a smaller vent about 35 m NE of the cone. SERNAGEOMIN reported an abundant number of bomb-sized blocks up to 150 m from the crater, as well as impact marks on the snow, which indicated explosive activity. A low-altitude ash emission was observed drifting NW around 1140 on 28 September, based on webcam images. Between 0620 and 0850 on 29 September an ash emission rose 60 m above the crater and drifted NW. During an overflight taken around 1000 on 29 September scientists observed molten material in the vent, a large accumulation of pyroclasts inside the crater, and energetic degassing, some of which contained a small amount of ash. Block-sized pyroclasts were deposited on the internal walls and near the crater, and a distal ash deposit was also visible. The average sulfur dioxide flux measured on 28 September was 344 t/d. Satellite images taken on 29 September ashfall was deposited roughly 3 km WNW from the crater and nighttime crater incandescence remained visible. The average sulfur dioxide flux value from 29 September was 199 t/d. On 30 September at 0740 a pulsating ash emission rose 1.1 km above the crater and drifted NNW (figure 126). Deposits on the S flank extended as far as 4.5 km from the crater rim, based on satellite images from 30 September.
Infrared MODIS satellite data processed by MIROVA (Middle InfraRed Observation of Volcanic Activity) showed intermittent thermal activity during April through September, with slightly stronger activity detected during late September (figure 127). Small clusters of thermal activity were detected during mid-June, early July, early August, and late September. According to the MODVOLC thermal alert system, a total of four thermal hotspots were detected on 7 July and 3 and 23 September. This activity was also intermittently captured in infrared satellite imagery on clear weather days (figure 128).
Geologic Background. The glacier-covered Villarrica stratovolcano, in the northern Lakes District of central Chile, is ~15 km south of the city of Pucon. A 2-km-wide caldera that formed about 3,500 years ago is located at the base of the presently active, dominantly basaltic to basaltic andesite cone at the NW margin of a 6-km-wide Pleistocene caldera. More than 30 scoria cones and fissure vents are present on the flanks. Plinian eruptions and pyroclastic flows that have extended up to 20 km from the volcano were produced during the Holocene. Lava flows up to 18 km long have issued from summit and flank vents. Eruptions documented since 1558 CE have consisted largely of mild-to-moderate explosive activity with occasional lava effusion. Glaciers cover 40 km2 of the volcano, and lahars have damaged towns on its flanks.
Information Contacts: Servicio Nacional de Geología y Minería (SERNAGEOMIN), Observatorio Volcanológico de Los Andes del Sur (OVDAS), Avda Sta María No. 0104, Santiago, Chile (URL: http://www.sernageomin.cl/); Proyecto Observación Villarrica Internet (POVI) (URL: http://www.povi.cl/); Sistema y Servicio Nacional de Prevención y Repuesta Ante Desastres (SENAPRED), Av. Beauchef 1671, Santiago, Chile (URL: https://web.senapred.cl/); Buenos Aires Volcanic Ash Advisory Center (VAAC), Servicio Meteorológico Nacional-Fuerza Aérea Argentina, 25 de mayo 658, Buenos Aires, Argentina (URL: http://www.smn.gov.ar/vaac/buenosaires/inicio.php); MIROVA (Middle InfraRed Observation of Volcanic Activity), a collaborative project between the Universities of Turin and Florence (Italy) supported by the Centre for Volcanic Risk of the Italian Civil Protection Department (URL: http://www.mirovaweb.it/); Hawai'i Institute of Geophysics and Planetology (HIGP) - MODVOLC Thermal Alerts System, School of Ocean and Earth Science and Technology (SOEST), Univ. of Hawai'i, 2525 Correa Road, Honolulu, HI 96822, USA (URL: http://modis.higp.hawaii.edu/); Copernicus Browser, Copernicus Data Space Ecosystem, European Space Agency (URL: https://dataspace.copernicus.eu/browser/).
Merapi (Indonesia) — October 2023 Cite this Report
Merapi
Indonesia
7.54°S, 110.446°E; summit elev. 2910 m
All times are local (unless otherwise noted)
Frequent incandescent avalanches during April-September 2023
Merapi, located just north of the major city of Yogyakarta in central Java, Indonesia, has had activity within the last 20 years characterized by pyroclastic flows and lahars accompanying growth and collapse of the steep-sided active summit lava dome. The current eruption period began in late December 2020 and has more recently consisted of ash plumes, intermittent incandescent avalanches of material, and pyroclastic flows (BGVN 48:04). This report covers activity during April through September 2023, based on information from Balai Penyelidikan dan Pengembangan Teknologi Kebencanaan Geologi (BPPTKG), the Center for Research and Development of Geological Disaster Technology, a branch of PVMBG which specifically monitors Merapi. Additional information comes from the Pusat Vulkanologi dan Mitigasi Bencana Geologi (PVMBG, also known as Indonesian Center for Volcanology and Geological Hazard Mitigation, CVGHM), MAGMA Indonesia, the Darwin Volcanic Ash Advisory Centre (VAAC), and various satellite data.
Activity during April through September 2023 primarily consisted of incandescent avalanches of material that mainly affected the SW and W flanks and traveled as far as 2.3 km from the summit (table 25) and white gas-and-steam emissions that rose 10-1,000 m above the crater.
Table 25. Monthly summary of avalanches and avalanche distances recorded at Merapi during April through September 2023. The number of reported avalanches does not include instances where possible avalanches were heard but could not be visually confirmed as a result of inclement weather. Data courtesy of BPPTKG (April-September 2023 daily reports).
| Month |
Average number of avalanches per day |
Distance avalanches traveled (m) |
| Apr 2023 |
19 |
1,200-2,000 |
| May 2023 |
22 |
500-2,000 |
| Jun 2023 |
18 |
1,200-2,000 |
| Jul 2023 |
30 |
300-2,000 |
| Aug 2023 |
25 |
400-2,300 |
| Sep 2023 |
23 |
600-2,000 |
BPPTKG reported that during April and May white gas-and-steam emissions rose 10-750 m above the crater, incandescent avalanches descended 500-2,000 m on the SW and W flanks (figure 135). Cloudy weather often prevented clear views of the summit, and sometimes avalanches could not be confirmed. According to a webcam image, a pyroclastic flow was visible on 17 April at 0531. During the week of 28 April and 4 May a pyroclastic flow was reported on the SW flank, traveling up to 2.5 km. According to a drone overflight taken on 17 May the SW lava dome volume was an estimated 2,372,800 cubic meters and the dome in the main crater was an estimated 2,337,300 cubic meters.
During June and July similar activity persisted with white gas-and-steam emissions rising 10-350 m above the crater and frequent incandescent avalanches that traveled 300-2,000 m down the SW, W, and S flanks (figure 136). Based on an analysis of aerial photos taken on 24 June the volume of the SW lava dome was approximately 2.5 million cubic meters. A pyroclastic flow was observed on 5 July that traveled 2.7 km on the SW flank. According to the Darwin VAAC multiple minor ash plumes were identified in satellite images on 19 July that rose to 3.7 km altitude and drifted S and SW. During 22, 25, and 26 July a total of 17 avalanches descended as far as 1.8 km on the S flank.
Frequent white gas-and-steam emissions continued during August and September, rising 10-450 m above the crater. Incandescent avalanches mainly affected the SW and W flanks and traveled 400-2,300 m from the vent (figure 137). An aerial survey conducted on 10 August was analyzed and reported that estimates of the SW dome volume was 2,764,300 cubic meters and the dome in the main crater was 2,369,800 cubic meters.
Frequent and moderate-power thermal activity continued throughout the reporting period, according to a MIROVA (Middle InfraRed Observation of Volcanic Activity) analysis of MODIS satellite data (figure 138). There was an increase in the number of detected anomalies during mid-May. The MODVOLC thermal algorithm recorded a total of 47 thermal hotspots: six during April, nine during May, eight during June, 15 during July, four during August, and five during September. Some of this activity was captured in infrared satellite imagery on clear weather days, sometimes accompanied by incandescent material on the SW flank (figure 139).
Geologic Background. Merapi, one of Indonesia's most active volcanoes, lies in one of the world's most densely populated areas and dominates the landscape immediately north of the major city of Yogyakarta. It is the youngest and southernmost of a volcanic chain extending NNW to Ungaran volcano. Growth of Old Merapi during the Pleistocene ended with major edifice collapse perhaps about 2,000 years ago, leaving a large arcuate scarp cutting the eroded older Batulawang volcano. Subsequent growth of the steep-sided Young Merapi edifice, its upper part unvegetated due to frequent activity, began SW of the earlier collapse scarp. Pyroclastic flows and lahars accompanying growth and collapse of the steep-sided active summit lava dome have devastated cultivated lands on the western-to-southern flanks and caused many fatalities.
Information Contacts: Balai Penyelidikan dan Pengembangan Teknologi Kebencanaan Geologi (BPPTKG), Center for Research and Development of Geological Disaster Technology (URL: http://merapi.bgl.esdm.go.id/, Twitter: @BPPTKG); MAGMA Indonesia, Kementerian Energi dan Sumber Daya Mineral (URL: https://magma.esdm.go.id/v1); Pusat Vulkanologi dan Mitigasi Bencana Geologi (PVMBG, also known as Indonesian Center for Volcanology and Geological Hazard Mitigation, CVGHM), Jalan Diponegoro 57, Bandung 40122, Indonesia (URL: http://www.vsi.esdm.go.id/); Darwin Volcanic Ash Advisory Centre (VAAC), Bureau of Meteorology, Northern Territory Regional Office, PO Box 40050, Casuarina, NT 0811, Australia (URL: http://www.bom.gov.au/info/vaac/); MIROVA (Middle InfraRed Observation of Volcanic Activity), a collaborative project between the Universities of Turin and Florence (Italy) supported by the Centre for Volcanic Risk of the Italian Civil Protection Department (URL: http://www.mirovaweb.it/); Hawai'i Institute of Geophysics and Planetology (HIGP) - MODVOLC Thermal Alerts System, School of Ocean and Earth Science and Technology (SOEST), Univ. of Hawai'i, 2525 Correa Road, Honolulu, HI 96822, USA (URL: http://modis.higp.hawaii.edu/); Copernicus Browser, Copernicus Data Space Ecosystem, European Space Agency (URL: https://dataspace.copernicus.eu/browser/); Øystein Lund Andersen (URL: https://www.oysteinlundandersen.com/, https://twitter.com/oysteinvolcano).
Ebeko
Russia
50.686°N, 156.014°E; summit elev. 1103 m
All times are local (unless otherwise noted)
Moderate explosive activity with ash plumes continued during June-November 2023
Ebeko, located on the N end of Paramushir Island in Russia’s Kuril Islands just S of the Kamchatka Peninsula, consists of three summit craters along a SSW-NNE line at the northern end of a complex of five volcanic cones. Observed eruptions date back to the late 18th century and have been characterized as small-to-moderate explosions from the summit crater, accompanied by intense fumarolic activity. The current eruptive period began in June 2022, consisting of frequent explosions, ash plumes, and thermal activity (BGVN 47:10, 48:06). This report covers similar activity during June-November 2023, based on information from the Kamchatka Volcanic Eruptions Response Team (KVERT) and satellite data.
Moderate explosive activity continued during June-November 2023 (figures 50 and 51). According to visual data from Severo-Kurilsk, explosions sent ash 2-3.5 km above the summit (3-4.5 km altitude) during most days during June through mid-September. Activity after mid-September was slightly weaker, with ash usually reaching less than 2 km above the summit. According to KVERT the volcano in October and November was, with a few exceptions, either quiet or obscured by clouds that prevented satellite observations. KVERT issued Volcano Observatory Notices for Aviation (VONA) on 8 and 12 June, 13 and 22 July, 3 and 21 August, and 31 October warning of potential aviation hazards from ash plumes drifting 3-15 km from the volcano. Based on satellite data, KVERT reported a persistent thermal anomaly whenever weather clouds permitted viewing.
Geologic Background. The flat-topped summit of the central cone of Ebeko volcano, one of the most active in the Kuril Islands, occupies the northern end of Paramushir Island. Three summit craters located along a SSW-NNE line form Ebeko volcano proper, at the northern end of a complex of five volcanic cones. Blocky lava flows extend west from Ebeko and SE from the neighboring Nezametnyi cone. The eastern part of the southern crater contains strong solfataras and a large boiling spring. The central crater is filled by a lake about 20 m deep whose shores are lined with steaming solfataras; the northern crater lies across a narrow, low barrier from the central crater and contains a small, cold crescentic lake. Historical activity, recorded since the late-18th century, has been restricted to small-to-moderate explosive eruptions from the summit craters. Intense fumarolic activity occurs in the summit craters, on the outer flanks of the cone, and in lateral explosion craters.
Information Contacts: Kamchatka Volcanic Eruptions Response Team (KVERT), Far Eastern Branch, Russian Academy of Sciences, 9 Piip Blvd., Petropavlovsk-Kamchatsky, 683006, Russia (URL: http://www.kscnet.ru/ivs/kvert/).
Search Bulletin Archive by Publication Date
Select a month and year from the drop-downs and click "Show Issue" to have that issue displayed in this tab.
The default month and year is the latest issue available.
Bulletin of the Global Volcanism Network - Volume 27, Number 06 (June 2002)
Managing Editor: Richard Wunderman
Asamayama (Japan)
Periods of heightened seismicity during September 2000 and June 2002
Chiliques (Chile)
Signs of awakening despite recent dormancy
Colima (Mexico)
Perilous summit visits during 2001 and 2002
Great Sitkin (United States)
Abnormal tremor and earthquake swarms in May 2002
Karymsky (Russia)
Explosions eject ash to 3 km above summit during April and July 2002
Kick 'em Jenny (Grenada)
Bathymetry indicates circular summit crater with dome missing
Klyuchevskoy (Russia)
Increased seismicity prompts KVERT to raise hazard status to Yellow
Merapi (Indonesia)
Pyroclastic flows and lava avalanches occur during February-June 2002
Popocatepetl (Mexico)
Dome extrusions continue, accompanied by minor explosions
Semeru (Indonesia)
Seismicity increases beginning in March 2002; Alert Level increased to 2
Soufriere Hills (United Kingdom)
During 19-29 February large spines and plumes occurred at tidal maxima
Talang (Indonesia)
Small explosion earthquakes dominate through June 2002
Three Sisters (United States)
Studies suggest magma slowly accumulating at depth
Villarrica (Chile)
General decrease in activity during February-May 2002
Asamayama
Japan
36.406°N, 138.523°E; summit elev. 2568 m
All times are local (unless otherwise noted)
Periods of heightened seismicity during September 2000 and June 2002
Asama has a history of periodic heightened seismicity; the last reported seismicity increase occurred in September 1996 (BGVN 21:11). A previously unreported seismic increase began on 18 September 2000. During 18-24 September the Japan Meteorological Agency (JMA) recorded 138, 431, 310, 243, 96, 33, and 14 earthquakes per day, respectively.
During 22-23 June 2002 another period of heightened seismicity occurred at Asama that was similar to the September 2000 activity (figure 15). The earthquakes began at 0100 on 22 June and at 0900 JMA issued a Volcanic Advisory stating that 210 volcanic tremor events had occurred during 0100-0800. The report also stated that the temperature of the crater floor had increased since May 2002; on 19 June the floor was at 180°C. Prior to the heightened seismicity, on 2 and 4 June plumes rose 700 and 1,000 m above Asama's summit, respectively.
The Asama Volcano Observatory (ERI, University of Tokyo) reported that the number of B-type earthquakes peaked around 0300 on 22 June, with more than 30 earthquakes recorded per hour at a station located on the middle of Asama's eastern slope. Several A-type earthquakes, with a maximum magnitude of 2.1, occurred during 0300-0700. The B- and A-type earthquakes occurred 1.5 and 3.5 km beneath the volcano, respectively.
The restricted area surrounding Asama's summit was increased from 2 km to a 4-km radius on 22 June. After the 22nd, seismicity gradually decreased and JMA reported that by the afternoon of 24 June neither volcanic tremor nor notable changes in ground deformation had been recorded.
Geologic Background. Asamayama, Honshu's most active volcano, overlooks the resort town of Karuizawa, 140 km NW of Tokyo. The volcano is located at the junction of the Izu-Marianas and NE Japan volcanic arcs. The modern Maekake cone forms the summit and is situated east of the remnant of an older andesitic volcano, Kurofuyama, which was destroyed by a late-Pleistocene landslide about 20,000 years before present (BP). Growth of a dacitic shield volcano was accompanied by pumiceous pyroclastic flows, the largest of which occurred about 14,000-11,000 BP, and by growth of the Ko-Asamayama lava dome on the east flank. Maekake, capped by the Kamayama pyroclastic cone that forms the present summit, is probably only a few thousand years old and has observed activity dating back at least to the 11th century CE. Maekake has had several major Plinian eruptions, the last two of which occurred in 1108 (Asamayama's largest Holocene eruption) and 1783 CE.
Information Contacts: Tsuneomi Kagiyama, Earthquake Research Institute, University of Tokyo; Yukio Hayakawa, Gunma University, Japan (URL: http://www.hayakawayukio.jp/).
Chiliques
Chile
23.58°S, 67.7°W; summit elev. 5778 m
All times are local (unless otherwise noted)
Signs of awakening despite recent dormancy
On 12 April 2002, NASA's Jet Propulsion Laboratory reported that new images taken by the Advanced Spaceborne Thermal Emission and Reflection Radiometer (Aster) on NASA's Terra satellite showed signs of activity at Chiliques. This volcano was previously considered to be dormant; however, on 6 January, a nighttime thermal infrared image from Aster showed a hot spot in the summit crater, as well as several others along the upper flanks, indicating new volcanic activity (figure 1). Examination of an earlier nighttime thermal infrared image from 24 May 2000 showed no such hot spots.
General Reference. de Silva, S.L., and Francis, P.W., 1991, Volcanoes of the Central Andes: Berlin: Springer-Verlag, 216 p.
Geologic Background. Volcán Chiliques is a structurally simple stratovolcano located immediately south of Laguna Lejía. The summit contains a 500-m-wide crater. Several youthful lava flows, some of which are considered to be of possible Holocene age (de Silva, 2007 pers. comm.), descend its flanks. The largest of these extends 5 km NW. Older lava flows reach up to 10 km from the summit on the N flank. This volcano had previously been considered to be dormant; however, in 2002 a NASA nighttime thermal infrared satellite image from the Advanced Spaceborne Thermal Emission and Reflection Radiometer (ASTER) showed low-level hot spots in the summit crater and upper flanks.
Information Contacts: Michael Abrams, Jet Propulsion Laboratory, California Institute of Technology, National Aeronautics and Space Administration, Pasadena, CA 91109 (URL: http://www.jpl.nasa.gov/).
Colima
Mexico
19.514°N, 103.62°W; summit elev. 3850 m
All times are local (unless otherwise noted)
Perilous summit visits during 2001 and 2002
The following report documents several climbs to the summit of Volcán de Colima, carried out in order to accurately measure the size of the growing lava dome, measure fumarole temperatures, and sample gases when possible. Strict safety precautions were followed and climbs were only undertaken during periods of low seismicity. Time is local (calibrated to RESCO seismographic clock). Coordinates and most calculations were obtained by GPS navigator (accuracies of 3-6 m indicated by the instrument) and GARMIN software.
Between 19 August 2001 and 29 June 2002, Nick Varley, Juan Carlos Gavilanes-Ruiz, Mitchell Ventura-Fishgold, Philippa Swannell, and Ruri Ursúa-Calvario performed four ascents to the growing dome, obtaining fresh lava samples, as well as ballistic-projectile samples ejected by the pre-extrusion explosion that occurred on 22 February 2001 (table 12). The lava sample of 18 February 2002 was obtained by Carlos Navarro-Ochoa (a block from a rockfall at the active lava front).
Table 12. The authors took fresh lava samples at Colima at these specified dates and locations. Latitude and longitude are given in degrees, minutes, and decimal minutes. Courtesy Universidad de Colima and Instituto de Geofísica.
| Date |
Sample |
Sampling site |
Coordinates |
| 22 Feb 2001 |
1 |
El Playon, 1.72 km to the NE of the crater (ballistic projectile). |
19°31.607'N, 103°36.645'W |
| 19 Aug 2001 |
2 |
Growing dome (1 meter from a glowing fumarole at 808°C). |
19°30.773'N, 103°37.013'W |
| 26 Nov 2001 |
3 |
Growing dome (andesitic spine). |
19°30.747'N, 103°36.983'W |
| 18 Feb 2002 |
A |
W face, ~1.2 km below the lava flow's active front. |
[location unknown?] |
| 22 Feb 2002 |
4 |
Growing dome (see figure 57). |
19°30.788'N, 103°37.021'W |
| 29 Jun 2002 |
5 |
Growing dome SE part. |
19°30.755'N, 103°36.904'W |
During each ascent GPS and geometric measurements were taken in order to calculate the volume of the dome and the current rate of extrusion. Figures 53 and 54 show the preliminary calculations of these variations. The samples collected during the ascents were analyzed by Juan Carlos Mora-Chaparro.
Ascent to the crater, 19 August 2001. On this occasion Varley and Gavilanes descended into the crater and circumnavigated the dome discovered on 26 May 2001. The volume of the dome had increased by ~77% since then, and a new lobe had appeared. The GPS tracks recorded around the dome revealed a maximum distance of 103 m in its N-S axis, and a maximum of 122 m in the E-W axis. A zone of incandescent fumaroles (with temperatures up to 877°C) was found on the NE slope of the dome and on the adjacent crater floor (figure 55). This high-temperature zone was located in the same position as the high-temperature group of fumaroles that existed above the previous dome and was monitored between 1995 and 1998. This suggests that the location of the main conduit has not changed since then. During the nearly 4-hour-long stay (0950-1400) on the crater rim and inside the crater, only two small rockfalls were heard.
Samples of high-temperature fumarolic gases were taken during this ascent. Unlike previous samples from Colima, they were relatively uncontaminated by atmospheric air. The results of the analyses are shown in table 13. The temperature ranges recorded in the N crater-floor field and in the N and NE crater-rim field are shown in table 14.
Table 13. Volume of gases of high-temperature fumarolic gas collected on 19 August 2001 at Colima. R/Ra represents the isotopic ratio of helium normalized to the atmospheric ratio. (Gas volumes are in mol%). Courtesy Universidad de Colima and Instituto de Geofísica.
| H2O |
H2 |
CO2 |
CO |
Stot |
HCl |
HF |
N2 |
CH4 |
He |
R/Ra |
He/Ne |
| 95.22 |
0.75 |
0.99 |
0.006 |
2.04 |
0.42 |
0.010 |
0.39 |
0 |
0.0001 |
6.2 |
48 |
Table 14. Temperature ranges of fumarole fields at Colima during 19 August 2001-26 November 2002. Courtesy Universidad de Colima and Instituto de Geofísica.
| Date |
Fumarole field |
Temperature range |
| 19 Aug 2001 |
N and NE rim |
122-330°C |
| 26 Nov 2001 |
N and NE rim |
100-295°C |
| 22 Feb 2002 |
N and NE rim |
128-221°C |
| 29 Jun 2002 |
N and NE rim |
162-272°C |
| 19 Aug 2001 |
NE crater-floor |
590-877°C |
| 26 Nov 2002 |
South side of the dome |
80-140°C |
Ascent to the crater and to the base of the active dome, 26 Nov 2001. During this excursion Varley and Ventura descended into the crater and measured temperatures of the new fumarole field on the S border of the growing dome (figure 56). Meanwhile, Gavilanes and Ursúa measured the fields located on the N and NE borders of the main crater and performed GPS measurements. Gas condensates were sampled from the NE fumarole field. Rock samples were taken from the andesitic spine (figure 57) first observed almost one month previously by personnel of Proteccion Civil of the State of Jalisco. The spine was located in the same area where the maximum temperatures were found on 19 August 2001. The mean frequency of rockfalls from the active dome caused by the lava effusion was once every 5 minutes, with larger events occurring approximately once every 30 minutes. Ranges of fumarole temperatures measured on the S side of the dome and in the NE field are shown in table 14.
Ascent to the dome, 22 Feb 2002. During this ascent several light ashfall-producing, small explosive events were observed (figure 58). One event expelled several bombs (up to 20 cm in diameter) to a height of ~20 m above the dome. The explosions appeared to originate from the central to W side of the dome. Small rockfalls were occurring approximately once every 15 to 20 minutes on the E side of the dome. Due to the potential of rockfalls, a temperature was only obtained from the fumarole field to the N. There had been an increase in the size of this field, which was located outside of the crater, high on the N flank. The temperature range is shown in table 14.
Ascent to the lava flow's front, 7 June 2002. On this ascent Varley and Gavilanes, climbing the S flank of the volcano, reached a point (19°30.218N, 103°37.392W) located at the same elevation (3,090 m) and approximately 75 m to the E of the front of the active lava flow emplaced on the upper part of the Cordobán Central ravine. The maximum length of the Cordobán Central 2002 lava flow was estimated to be 1,290 m on 7 June 2002. During this 6-hour-long ascent, the average frequency of rockfalls originating from both the lava flow front and the active dome was on the order of one rockfall every 10 minutes. No pyroclastic flows were observed.
Ascent to El Volcancito. On 11 June 2001 Juan Carlos Gavilanes and Alejandro Elizalde ascended to the dome formed in 1869-1872 called El Volcancito in order to repair the meteorological station (19°30.996 N, 103°36.511 W). El Volcancito is located on Colima's E summit (1,010 m horizontal distance, and N62°E of the center of the active dome of Volcán de Colima at 19°30.746 N, 103°37.020 W). Only one rockfall was observed on the E face while the team was 1,750 m from the dome, during the period from 1200-1545. In comparison to the 22 February 2001 observations performed from the same distance, no substantial changes in the size of the dome were apparent from El Volcancito (figure 59).
Ascent to the dome, 29 June 2002. Varley and Gavilanes remained on the N (figure 60), NE, and E borders of the active dome during 1147-1540. On the NE and N borders they measured angular heights and distances between the crater's lip and the upper part of the new dome borders. Only a small volume of lava blocks was observed to have fallen outside of the crater rim on the N border, extending only 4 m. No rockfalls were observed. The team tried to reach the center of the dome, but the complicated array of big scoriaceous and fragile new lava blocks, with abundant 3-to 7-m-deep void spaces between them (figure 61), impeded movement. They measured temperatures at the N fumarole field (table 14) and obtained a condensate gas sample. They also saw and/or heard several short-lived and high-pressure emissions of volcanic gas (table 15).
Table 15. High-pressure emissions of volcanic gas at Colima on 29 June 2002. Courtesy Universidad de Colima and Instituto de Geofísica.
| Date |
Time |
Observations |
| 29 June 2002 |
1252 |
Observed and heard at 40 m (white/bluish gas discharges ~30 m high) |
| 29 June 2002 |
1420 |
Observed and heard at 50 m (white/bluish gas discharges ~30 m high) |
| 29 June 2002 |
1520 |
Heard at 250 m |
| 29 June 2002 |
1603 |
Heard at 250 m |
| 29 June 2002 |
1857 |
Heard at 1,800 m |
Petrographical and chemical analyses were conducted on recent rock samples from Volcán de Colima at the Instituto de Geofísica, UNAM. The results were compared with similar analyses reported by Mora et al. (2002) from the 1998, 1999, and 2001 samples (table 16).
Table 16. Chemical composition of Colima lava. Numbers in parentheses correspond to the sample numbers in table 12. Fe2O3t = Fe total (except 1913). References: 1Mora et al. (2002), 2Luhr and Carmichael (1982). New data courtesy Universidad de Colima and Instituto de Geofísica.
| Sample/wt. % |
1818 |
1818 |
18182 |
19132 |
19981 |
19981 |
19991 |
19991 |
20001 |
2001 (1) |
2001 (2) |
2001 (3) |
2002 (A) |
2002 (4) |
2002 (5) |
| SiO2 |
58.71 |
57.70 |
58.52 |
57.57 |
60.44 |
61.00 |
60.59 |
59.83 |
60.77 |
59.53 |
59.81 |
59.60 |
60.67 |
59.10 |
59.70 |
| TiO2 |
0.66 |
0.79 |
0.83 |
0.79 |
0.62 |
0.55 |
0.64 |
0.63 |
0.61 |
0.63 |
0.64 |
0.64 |
0.61 |
0.64 |
0.64 |
| Al2O3 |
17.88 |
17.71 |
17.53 |
17.42 |
18.10 |
18.06 |
18.29 |
18.83 |
18.08 |
16.84 |
17.14 |
16.90 |
17.23 |
17.01 |
17.32 |
| Fe2O3t |
6.25 |
6.78 |
6.89 |
2.64 |
5.28 |
4.91 |
5.09 |
5.99 |
5.85 |
6.14 |
6.08 |
6.31 |
5.83 |
6.20 |
6.07 |
| FeO |
-- |
-- |
-- |
3.74 |
-- |
-- |
-- |
-- |
-- |
-- |
-- |
-- |
-- |
-- |
-- |
| MnO |
0.11 |
0.12 |
0.12 |
0.12 |
0.10 |
0.09 |
0.08 |
0.11 |
0.11 |
0.11 |
0.11 |
0.11 |
0.11 |
0.11 |
0.11 |
| MgO |
3.82 |
4.26 |
3.77 |
4.14 |
3.22 |
3.42 |
3.07 |
3.70 |
2.54 |
4.13 |
3.96 |
4.60 |
2.91 |
4.35 |
3.99 |
| CaO |
6.54 |
6.96 |
7.11 |
7.02 |
6.04 |
5.88 |
6.56 |
6.33 |
6.16 |
6.18 |
6.23 |
6.22 |
5.76 |
6.26 |
6.13 |
| Na2O |
4.50 |
4.49 |
4.46 |
4.40 |
4.69 |
4.56 |
4.53 |
4.68 |
4.47 |
4.53 |
4.56 |
4.43 |
4.72 |
4.51 |
4.59 |
| K2O |
1.22 |
1.32 |
1.23 |
1.16 |
1.35 |
1.37 |
1.12 |
1.31 |
1.28 |
1.30 |
1.27 |
1.29 |
1.36 |
1.29 |
1.38 |
| P2O5 |
0.19 |
0.24 |
0.20 |
0.19 |
0.13 |
0.12 |
0.18 |
0.20 |
0.13 |
0.20 |
0.20 |
0.19 |
0.23 |
0.19 |
0.19 |
| LOI |
0.19 |
-0.03 |
-- |
0.49 |
0.34 |
0.36 |
0.12 |
0.16 |
0.41 |
-0.25 |
-0.24 |
-0.12 |
-0.04 |
0.04 |
0.02 |
| Total |
100.07 |
100.34 |
101.66 |
99.68 |
100.31 |
100.32 |
100.27 |
100.77 |
100.91 |
99.34 |
99.76 |
100.17 |
99.39 |
99.70 |
100.14 |
Chemical analyses indicated that the new rocks registered a slight decrease in SiO2 and Al2O3 contents, and a slight increase in MgO with respect to the 1998 samples. Trace elements registered a decrease of Ba, and increases of Cu, Cr, and Ni (table 16).
Chemical analyses of rocks from 1818 to 2002 eruptions (Luhr, J.F. and Carmichael, I.S.E., 1982; Mora et al. 2002), show maximum variations of ~4 wt.% SiO2 (57 to 61 wt.%), and ~1.6 wt.% MgO (3.0 to 4.6 wt.%). The most mafic compositions were recorded in the products of the largest explosive eruptions (1818 and 1913). Notable disequilibrium textures observed in phenocrysts, as well as the shift to less evolved compositions in the new dome (2002 samples) with respect to the 1998 eruptive products may indicate an input of magma from a deeper chamber or an injection of new magma into the more shallow magma chamber. Therefore, we think that these detailed petrographic and chemical studies of the more recent eruptive products may provide valuable information for the monitoring of this volcano.
References. Luhr, J.F., and Carmichael, I.S.E., 1982, The Colima Volcanic Complex, Mexico: Part III, Ash and scoria-fall deposits from the upper slopes of Volcán Colima: Contrib. Mineral. Petrol., v. 80, p. 262-275.
Mora, J.C., Macías, J.L., Saucedo, R., Orlando A., Manetti, P., and Vaselli, O., 2002, Petrology of the 1998-2000 products of Volcán de Colima, Mexico: Accepted in the Special Issue of the Journal of Volcanology and Geothermal Research "Volcán de Colima, México, and its Activity in 1997-2000" (in press).
Geologic Background. The Colima complex is the most prominent volcanic center of the western Mexican Volcanic Belt. It consists of two southward-younging volcanoes, Nevado de Colima (the high point of the complex) on the north and the historically active Volcán de Colima at the south. A group of late-Pleistocene cinder cones is located on the floor of the Colima graben west and east of the complex. Volcán de Colima (also known as Volcán Fuego) is a youthful stratovolcano constructed within a 5-km-wide scarp, breached to the south, that has been the source of large debris avalanches. Major slope failures have occurred repeatedly from both the Nevado and Colima cones, producing thick debris-avalanche deposits on three sides of the complex. Frequent recorded eruptions date back to the 16th century. Occasional major explosive eruptions have destroyed the summit (most recently in 1913) and left a deep, steep-sided crater that was slowly refilled and then overtopped by lava dome growth.
Information Contacts: N. Varley, J. C. Gavilanes-Ruiz, Facultad de Ciencias and Centro Universitario de Investigaciones en Ciencias del Ambiente, Universidad de Colima; J.C. Mora, J.L. Macias, R. Castro, R. Arias, Instituto de Geofísica, UNAM.
Great Sitkin (United States) — June 2002 Cite this Report
Great Sitkin
United States
52.076°N, 176.13°W; summit elev. 1740 m
All times are local (unless otherwise noted)
Abnormal tremor and earthquake swarms in May 2002
On 27 and 28 May the Alaska Volcano Observatory (AVO) detected anomalous seismicity at Great Sitkin, a volcano located 1,895 km SW of Anchorage, Alaska. On 27 May two periods of seismic tremor lasted for 20 and 55 minutes and on 28 May earthquake swarms began at 0306 and 1228. The earthquake swarms each began with a relatively large event (ML 2.2 and ML 4.3) followed by tens to hundreds of smaller aftershocks, most located 5-6 km SE of the crater at depths of 0-5 km. Both the tremor and earthquake swarms represent significant changes from background seismicity at Great Sitkin. However, aftershocks declined significantly overnight, and seismicity returned to background levels with a lack of recorded tremor since 27 May. Satellite imagery showed no signs of surface volcanic activity, and no reports of anomalous activity were received by AVO.
Geologic Background. The Great Sitkin volcano forms much of the northern side of Great Sitkin Island. A younger volcano capped by a small, 0.8 x 1.2 km ice-filled summit caldera was constructed within a large late-Pleistocene or early Holocene scarp formed by massive edifice failure that truncated an older edifice and produced a submarine debris avalanche. Deposits from this and an even older debris avalanche from a source to the south cover a broad area of the ocean floor north of the volcano. The summit lies along the eastern rim of the younger collapse scarp. Deposits from an earlier caldera-forming eruption of unknown age cover the flanks of the island to a depth up to 6 m. The small younger caldera was partially filled by lava domes emplaced in 1945 and 1974, and five small older flank lava domes, two of which lie on the coastline, were constructed along northwest- and NNW-trending lines. Hot springs, mud pots, and fumaroles occur near the head of Big Fox Creek, south of the volcano. Eruptions have been recorded since the late-19th century.
Information Contacts: Tom Murray and John Eichelberger, Alaska Volcano Observatory (AVO) (URL: http://www.avo.alaska.edu/).
Karymsky
Russia
54.049°N, 159.443°E; summit elev. 1513 m
All times are local (unless otherwise noted)
Explosions eject ash to 3 km above summit during April and July 2002
Seismicity at Karymsky was above background during late March through at least mid-July 2002. Local shallow events occurred at the same rate previously reported in BGVN 27:03 (~10 events per hour). The rate increased briefly during mid-May to ~10-15 events per hour. The character of the seismicity indicated that weak gas-and-ash explosions and avalanches possibly occurred. Thermal anomalies and occasional plumes were visible on satellite imagery throughout the report period (table 2).
Table 2. Thermal anomalies and plumes visible on AVHRR satellite imagery at Karymsky during 30 March-9 July 2002. No airborne ash was detected in any image. Courtesy KVERT.
| Date |
Time (local) |
Size (pixels) |
Max. band-3 temperature |
Background temperature |
Visible plume |
| 30 Mar 2002 |
-- |
-- |
13°C |
-15 to -20°C |
-- |
| 31 Mar 2002 |
-- |
-- |
-- |
-- |
Faint thermal anomaly visible through cloud cover. |
| 09 Apr 2002 |
-- |
4 |
29°C |
0°C |
-- |
| 12 Apr-19 Apr 2002 |
-- |
2-5 |
-- |
-- |
-- |
| 17 Apr 2002 |
1807 |
2 |
29°C |
-3°C |
Faint aerosol/steam plume trended SE. |
| 20 Apr 2002 |
-- |
3 |
23°C |
-5 to -20°C |
-- |
| 22 Apr 2002 |
-- |
5 |
30°C |
3°C |
-- |
| 26 Apr-03 May 2002 |
-- |
1-6 |
42°C |
0- ~10°C |
Possible faint aerosol/steam plume trended SE, visible at 1704 on 28 April. |
| 03 May 2002 |
-- |
3-4 |
13.4°C |
-8°C |
-- |
| 04 May 2002 |
-- |
3-4 |
40°C |
-1°C |
Small aerosol/steam plume visible trended S at 1800. |
| 09 May 2002 |
1740 |
2 |
37.5°C |
4°C |
Faint ash-and-gas plume visible extended 20 km to the SE. |
| 10 May-17 May 2002 |
-- |
2-4 |
~50°C |
2-7°C |
-- |
| 10 May 2002 |
0727 |
-- |
-- |
-- |
Ash-and-steam plume visible trended 50 km to the S. |
| 13 May 2002 |
1744 |
-- |
-- |
-- |
Faint steam/aerosol plume extended ~60 km to the SE. |
| 20 May 2002 |
-- |
1 |
16°C |
-2°C |
Faint plume extended 30 km to the SE at 0647. |
| 22 May 2002 |
-- |
2 |
~49°C |
7°C |
-- |
| 24 May 2002 |
0651 |
3 |
16.4°C |
-2°C |
-- |
| 01 Jun 2002 |
-- |
1 |
11°C |
0°C |
-- |
| 02 Jun 2002 |
-- |
3 |
49°C |
6°C |
-- |
| 09 Jun 2002 |
0708 |
2-4 |
43.5°C |
-1.5°C |
-- |
| 15 Jun 2002 |
-- |
3 |
~49°C |
17°C |
Karymsky lake visible on image at temperature of 33.6°C, six pixels square, warmest to the W. |
| 20 Jun 2002 |
-- |
3 |
38°C |
17°C |
-- |
| 23, 25, 27 Jun 2002 |
-- |
1-3 |
10 - ~49°C |
1 - 18°C |
Steam/gas plume extended 35 km to the W on 25 June. |
| 29 Jun-30 Jun 2002 |
-- |
1-4 |
15 - ~49°C |
-4 - 25°C |
-- |
| 01 Jul-02 Jul 2002 |
-- |
-- |
-- |
-- |
Small steam plume extended ~50 km to the NE on 1 July. |
| 06, 08-09 Jul 2002 |
-- |
1-3 |
~25 - 31°C |
5 - 11.5°C |
-- |
According to a pilot's report, at 1115 on 15 April an explosion ejected ash to a height of 3.0 km above the volcano. MODIS imagery on 17 April revealed at least five traces of ashfall extending to ~25 km in various directions.
During a helicopter flight on 28 April, observers reported an ash explosion to 500 m above the crater. Ash deposits were visible on the W (most intense) and E flanks of the volcano. A new ~100-m-high cone was visible on 28 April inside the active crater.
On 10 May the new cone was visible along with a lava flow 1.3 km down the S-SW slope of the volcano (figure 9). It reached ~300 m wide. The flow was unusual because it had an andesitic composition, rather than the typical basaltic composition that was common in lava flows down the SW flank during 1996-2000. Seismic data on 29 June indicated a possible ash-and-gas explosion to a height of ~4.0 km at 1631. On 9 July at 1032, a helicopter pilot reported a plume to a height of 3.0 km. The Concern Color Code remained at Yellow throughout the report period.
Geologic Background. Karymsky, the most active volcano of Kamchatka's eastern volcanic zone, is a symmetrical stratovolcano constructed within a 5-km-wide caldera that formed during the early Holocene. The caldera cuts the south side of the Pleistocene Dvor volcano and is located outside the north margin of the large mid-Pleistocene Polovinka caldera, which contains the smaller Akademia Nauk and Odnoboky calderas. Most seismicity preceding Karymsky eruptions originated beneath Akademia Nauk caldera, located immediately south. The caldera enclosing Karymsky formed about 7600-7700 radiocarbon years ago; construction of the stratovolcano began about 2000 years later. The latest eruptive period began about 500 years ago, following a 2300-year quiescence. Much of the cone is mantled by lava flows less than 200 years old. Historical eruptions have been vulcanian or vulcanian-strombolian with moderate explosive activity and occasional lava flows from the summit crater.
Information Contacts: Olga Chubarova, Kamchatka Volcanic Eruptions Response Team (KVERT), Institute of Volcanic Geology and Geochemistry, Piip Ave. 9, Petropavlovsk-Kamchatsky, 683006, Russia; Tokyo Volcanic Ash Advisory Center (VAAC),Tokyo, Japan (URL: http://www.ospo.noaa.gov/Products/atmosphere/vaac/).
Kick 'em Jenny (Grenada) — June 2002 Cite this Report
Kick 'em Jenny
Grenada
12.3°N, 61.64°W; summit elev. -185 m
All times are local (unless otherwise noted)
Bathymetry indicates circular summit crater with dome missing
Submarine volcanic eruptions occurred at Kick-'em-Jenny during 4-6 December 2001 (BGVN 26:11). Following the 6 December seismicity, no further volcanic or seismic activity were recorded. On 8 December the Alert Level was reduced from Orange to Yellow.
On 12 March 2002, the NOAA Research Vessel Ronald H. Brown conducted extensive mapping of Kick-'em Jenny using the SeaBeam® sonar mapping system (SeaBeam® is a registered trademark of L-3 Communications SeaBeam Instruments). The resulting bathymetric map (figure 3) shows several interesting features.
The volcano's crater is clearly visible (immediately right of center on the image) on top of a symmetrical cone of about 1 km diameter. The crater is nearly perfectly circular with a diameter of ~330 m and a maximum depth of ~80 m. The crater center is located precisely at 12.3004° N, 61.6378° W. The dome, first noticed in 1978 when it almost filled the crater, has now disappeared except for a few remnants on the crater floor. The sonar image shows a breach of the crater to the NE. A prominent escarpment arcs around the E side of the cone and extends at least a few kilometers to the NE and S of the volcano. A series of ridges, principally in the cone's N to W sectors, trend radial or sub-radial to the cone's crater.
The topographic image furnished a bases for some new studies. Temperature-depth profiles were obtained within the crater and on the flanks, water samples were collected at a range of depths, and rock samples were collected from the summit region.
The Seismic Research Unit of the University of the West Indies reported that complete analysis of the results will take some time but preliminary analysis of the bathymetry confirms that the depth to the summit of the volcano has increased since the last detailed survey in 1989. Depth to the highest point on the crater rim is now ~183 m. The difference between this depth and the depths of ~160 m measured from 1978 to 1989 is probably accounted for by the fact that the dome that filled the crater beginning in 1977 has now completely disappeared.
Geologic Background. Kick 'em Jenny, an active submarine volcano 8 km off the N shore of Grenada, rises 1,300 m from the sea floor. Recent bathymetric surveys have shown evidence for a major arcuate collapse structure, which was the source of a submarine debris avalanche that traveled more than 15 km W. Bathymetry also revealed another submarine cone to the SE, Kick 'em Jack, and submarine lava domes to its S. These and subaerial tuff rings and lava flows at Ile de Caille and other nearby islands may represent a single large volcanic complex. Numerous eruptions have occurred since 1939, mostly documented by acoustic signals. Prior to the 1939 eruption, when an eruption cloud rose 275 m above the ocean and was witnessed by a large number of people in northern Grenada, there had been no written mention of the volcano. Eruptions have involved both explosive activity and the quiet extrusion of lava flows and lava domes in the summit crater; deep rumbling noises have sometimes been heard onshore. Recent eruptions have modified the morphology of the summit crater.
Information Contacts: John Shepard, Richie Robertson, Jan Lindsay, and Joan Latchman, Seismic Research Unit, University of the West Indies, St. Augustine, Trinidad, W.I. (URL: http://www.uwiseismic.com/).
Klyuchevskoy (Russia) — June 2002 Cite this Report
Klyuchevskoy
Russia
56.056°N, 160.642°E; summit elev. 4754 m
All times are local (unless otherwise noted)
Increased seismicity prompts KVERT to raise hazard status to Yellow
During mid-September 2001 through at least mid-June 2002 activity at Kliuchevskoi was characterized by brief periods of increased seismicity and minor surface activity. Earthquakes up to M 3 occurred (table 3) along with weak spasmodic tremor with a maximum amplitude up to 1.5 x 10⁻⁶ m/s (table 4). Gas-and-steam plumes often accompanied the increased seismicity and were visible reaching up to 2.0 km above the crater (table 5).
Table 3. Seismicity at Kliuchevskoi during mid-September 2001 through mid-June 2002. Courtesy KVERT.
| Date |
Event |
Magnitude |
| 13 Sep 2001 |
Two earthquakes |
M ~2 and ~1.7 |
| 01 Oct-02 Oct 2001 |
Eleven earthquakes |
five M ~2, six ~1.7 |
| 18 Oct 2001 |
Series of large earthquakes within the edifice |
-- |
| 26 Oct-09 Nov 2001 |
Series of earthquakes within the edifice and ~30 km depth |
-- |
| 13 Nov 2001 |
Swarm of shallow earthquakes |
~M 3 |
| 13 Nov-15 Nov 2001 |
150+ earthquakes |
M 1.7 |
| 07 Apr 2002 |
Series of shallow earthquakes began |
M 2.3 |
| 24 May-31 May 2002 |
Weak earthquakes at a depth of ~30 km |
-- |
| 31 May-07 Jun 2002 |
~20 earthquakes/day at a depth of ~30 km |
M 2.3 |
| 11 Jun 2002 |
~30 min series of shallow earthquakes |
M 2.8 |
| 07 Jun-14 Jun 2002 |
22-48 earthquakes/day at a depth of ~30 km |
-- |
Table 4. Tremor recorded at Kliuchevskoi during mid-September through mid-June 2002. Courtesy KVERT.
| Date |
Event |
Magnitude/amplitude (µm/s) |
| 20 Sep 2001 |
Volcanic tremor |
0.15 |
| 21 Sep-22 Sep 2001 |
Volcanic tremor |
0.23-0.21 |
| 23 Sep 2001 |
Volcanic tremor |
0.28 |
| 24 Sep 2001 |
Volcanic tremor |
0.4 |
| 25 Sep-26 Sep 2001 |
Volcanic tremor |
0.23-0.27 |
| 27 Sep-29 Sep 2001 |
Weak, continuous volcanic tremor |
0.22-0.32 |
| 01 Oct 2001 |
Intermittent weak spasmodic volcanic tremor |
0.19 |
| 02 Oct-04 Oct 2001 |
Intermittent weak spasmodic volcanic tremor |
0.30 |
| 05 Oct 2001 |
Continuous, spasmodic tremor |
0.30 |
| 06 Oct 2001 |
Continuous, spasmodic tremor |
0.18 |
| 09 Oct 2001 |
Continuous, spasmodic tremor |
0.26 |
| 10 Oct 2001 |
Continuous, spasmodic tremor |
0.51 |
| 11 Oct 2001 |
Continuous, spasmodic tremor |
0.47 |
| 12 Oct 2001 |
Continuous, spasmodic tremor |
0.51 |
| 13 Oct 2001 |
Continuous, spasmodic tremor |
0.54 |
| 14 Oct 2001 |
Volcanic tremor |
0.13 |
| 15 Oct-17 Oct 2001 |
Volcanic tremor |
0.15-0.17 |
| Nov 2001 |
Episodes of weak volcanic tremor |
-- |
| Apr-May 2002 |
Weak volcanic tremor |
-- |
| 30 May 2002 |
Volcanic tremor |
1.5 |
Table 5. Plumes visible at Kliuchevskoi during 13 September 2001 to 20 June 2002. Plumes were visible from Klyuchi town unless noted otherwise. Heights are above the crater. Courtesy KVERT.
| Date |
Time |
Plume details |
| 13, 17, 19-20 Sep 2001 |
-- |
Gas-and-steam plumes rose 50-100 m. |
| 19 Sep 2001 |
-- |
Gas-and-steam plume rose 1.0 km and extended 20 km to the S. |
| 23 Sep 2001 |
-- |
Gas-and-steam plume rose 100 m. |
| 24 Sep 2001 |
1828 |
Possible gas-and-steam plume observed in satellite image. |
| 01 Oct 2001 |
0810 |
Gas-and-steam plume up to 1.0 km extending 30 km to the NW. |
| 01 Oct 2001 |
1150 |
Gas-and-steam plume up to 2.0 km extending 15 km to the NW. |
| 01 Oct 2001 |
1400 |
Gas-and-steam plume up to 1.5-2.0 km extending 10 km to the W. |
| 01 Oct 2001 |
1730 |
Gas-and-steam plume up to 800 m extending 5 km to the S visible from Kozyurevsk. |
| 02 Oct 2001 |
~0830 |
Gas-and-steam plume up to 300 m extending 3 km to the S visible from Kozyurevsk and Klyuchi. |
| 05 Oct 2001 |
0850 |
Gas-and-steam plume rose 300 m and extended 3 km to the S visible from Kozyurevsk. |
| 05 Oct 2001 |
1200 |
Gas-and-steam plume rose 100 m. |
| 10 Oct 2001 |
0815 |
Gas-and-steam plume rose 500 m and extended 5 km to the S. |
| 12, 14, 16, 27-29 Oct 2001 |
-- |
Gas-and-steam plumes rose 50-100 m. |
| 30 Oct 2001 |
-- |
Gas-and-steam plume rose 700 m and extended 5 km to the SE. |
| 31 Oct 2001 |
-- |
Gas-and-steam plume rose 50-100 m and extended 5 km to the SE. |
| 01 Nov 2001 |
-- |
Gas-and-steam plume rose 50-100 m. |
| 02 Nov 2001 |
-- |
Gas-and-steam plume rose 50-200 m and extended 3 km to the SE. |
| 06 Nov 2001 |
-- |
Gas-and-steam plume rose 50-200 m and extended 20 km to the NE. |
| 08 Nov 2001 |
-- |
Gas-and-steam plume rose 50-200 m. |
| 09 Nov 2001 |
-- |
Gas-and-steam plume rose 600 m. |
| 11-13, 18 Nov 2001 |
-- |
Gas-and-steam plume rose 50-100 m. |
| 19 Nov 2001 |
-- |
Gas-and-steam plume rose 700 m and extended 10 km to the SE. |
| 21 Nov 2001 |
-- |
Gas-and-steam plume rose 500 m and extended to the SW. |
| 09 Apr 2002 |
2038 |
Explosion sent a gas-and-steam plume with possible ash to 1.0 km. |
| 06, 09-10 Apr; 24, 27 May 2002 |
-- |
Gas-and-steam plume rose 100 m. |
| 31 May; 1-3, 6, 9 15-16, 20 Jun 2002 |
-- |
Gas-and-steam plume rose 100-300 m. |
On 13 November a swarm of shallow M 3 earthquakes caused the Kamchatkan Volcanic Eruption Response Team (KVERT) to increase the Alert Level from Green to Yellow. According to a pilot's report, at 1315 on 19 November powerful fumarolic activity was observed. Seismicity decreased during the following days and on 23 November KVERT decreased the Color Code to Green. Seismicity remained at or near background levels with only slight increases in activity until 31 May when a series of earthquakes (up to M 2.3) was recorded in the volcano's edifice. As a result, the Color Code was increased to Yellow.
During 31 May-7 June ~20 earthquakes occurred daily at a depth of ~30 km (table 3). Overflight observations on 9 June indicated fresh ash on the volcano's slopes. The deposits were not accompanied by visually or seismically detected explosions. At the end of the report period, seismicity was slightly above background with a small gas-and-steam plume visible from nearby villages.
Geologic Background. Klyuchevskoy is the highest and most active volcano on the Kamchatka Peninsula. Since its origin about 6,000 years ago, this symmetrical, basaltic stratovolcano has produced frequent moderate-volume explosive and effusive eruptions without major periods of inactivity. It rises above a saddle NE of Kamen volcano and lies SE of the broad Ushkovsky massif. More than 100 flank eruptions have occurred during approximately the past 3,000 years, with most lateral craters and cones occurring along radial fissures between the unconfined NE-to-SE flanks of the conical volcano between 500 and 3,600 m elevation. Eruptions recorded since the late 17th century have resulted in frequent changes to the morphology of the 700-m-wide summit crater. These eruptions over the past 400 years have originated primarily from the summit crater, but have also included numerous major explosive and effusive eruptions from flank craters.
Information Contacts: Olga Chubarova, Kamchatka Volcanic Eruptions Response Team (KVERT), Institute of Volcanic Geology and Geochemistry, Piip Ave. 9, Petropavlovsk-Kamchatsky, 683006, Russia; Tom Miller, Alaska Volcano Observatory (AVO), a cooperative program of a) U.S. Geological Survey, 4200 University Drive, Anchorage, AK 99508-4667, USA (URL: http://www.avo.alaska.edu/), b) Geophysical Institute, University of Alaska, PO Box 757320, Fairbanks, AK 99775-7320, USA, and c) Alaska Division of Geological and Geophysical Surveys, 794 University Ave., Suite 200, Fairbanks, AK 99709, USA.
Merapi
Indonesia
7.54°S, 110.446°E; summit elev. 2910 m
All times are local (unless otherwise noted)
Pyroclastic flows and lava avalanches occur during February-June 2002
From 25 February through 16 June 2002 a generally white, variably dense, low-pressure plume rose 150-820 m above the summit of Merapi. Seismicity was dominated by avalanche earthquakes (table 14). During the week of 25-31 March, one shallow volcanic earthquake was reported. The Volcanological Survey of Indonesia (VSI) reported that Merapi emitted varying amounts of SO2 (table 15).
Table 14. Seismicity (low-frequency, avalanche, and multiphase) and crater characteristics at Merapi during 25 February-16 June 2002. Magnetic field strength was measured at Pusang-Lempong and is reported in nanoteslas (nT). "--" indicates that the information was not reported. Courtesy VSI.
| Date |
Low-frequency events |
Avalanche events |
Multiphase events |
Magnetic field strength |
Gendol crater |
Woro crater |
| 25 Feb-03 Mar 2002 |
-- |
-- |
-- |
-- |
-- |
571°C |
| 04 Mar-10 Mar 2002 |
-- |
666 |
-- |
-- |
-- |
-- |
| 11 Mar-17 Mar 2002 |
5 |
652 |
-- |
-- |
-- |
-- |
| 18 Mar-24 Mar 2002 |
1 |
609 |
-- |
-- |
-- |
-- |
| 25 Mar-31 Mar 2002 |
60 |
575 |
-- |
-- |
-- |
-- |
| 01 Apr-07 Apr 2002 |
135 |
539 |
1 |
-- |
-- |
-- |
| 15 Apr-21 Apr 2002 |
46 |
364 |
-- |
3.09 nT |
-- |
-- |
| 22 Apr-28 Apr 2002 |
19 |
367 |
1 |
0.32 nT |
-- |
-- |
| 29 Apr-05 May 2002 |
9 |
383 |
13 |
-3.22 nT |
737-742°C |
421-434°C |
| 06 May-12 May 2002 |
13 |
353 |
-- |
4.64 nT |
737-746°C |
398-431°C |
| 13 May-19 May 2002 |
2 |
345 |
2 |
8.28 nT |
734-748°C |
406-430°C |
| 20 May-26 May 2002 |
-- |
308 |
15 |
-1.02 nT |
734-749°C |
421-431°C |
| 27 May-02 Jun 2002 |
8 |
310 |
6 |
-1.47 nT |
620-750°C |
354-430°C |
| 03 Jun-09 Jun 2002 |
9 |
268 |
6 |
-1.65 nT |
741-756°C |
423-435°C |
| 10 Jun-16 Jun 2002 |
-- |
281 |
5 |
1.65 nT |
736-755°C |
423-434°C |
Table 15. COSPEC-measured SO2 gas emission at Merapi during 3 March-16 June 2002. "--" indicates that the information was not reported. Courtesy VSI.
| Date |
Average SO2 emission (ton/day) |
Range (ton/day) |
Max. avg. (ton/day) |
| 03 Mar-10 Mar 2002 |
156 |
96-254 |
196 |
| 11 Mar-17 Mar 2002 |
131 |
87-173 |
138 |
| 18 Mar-24 Mar 2002 |
146 |
103-206 |
-- |
| 25 Mar-31 Mar 2002 |
133 |
74-172 |
136 |
| 01 Apr-07 Apr 2002 |
107 |
73-145 |
108 |
| 15 Apr-21 Apr 2002 |
124 |
105-167 |
-- |
| 22 Apr-28 Apr 2002 |
155 |
97-219 |
182 |
| 29 Apr-05 May 2002 |
156 |
109-245 |
173 |
| 06 May-12 May 2002 |
166 |
123-210 |
169 |
| 13 May-19 May 2002 |
90 |
43-182 |
145 |
| 20 May-26 May 2002 |
140 |
64-206 |
160 |
| 27 May-02 Jun 2002 |
131 |
62-216 |
167 |
| 03 Jun-09 Jun 2002 |
141 |
85-196 |
167 |
| 10 Jun-16 Ju 2002 |
125 |
42-218 |
161 |
In total, 69-108 lava avalanches per week were observed during mid-February through late March. The avalanches generally traveled 2.5-2.75 km towards the upstream ends of the Senowo, Sat, and Lamat rivers, and partly to the Bebeng river. During 25 February-3 March, a total of four minor pyroclastic flows traveled to the upstream part of the Bebeng river to a maximum distance of 1.0 km (3 on 25 February and 1 on 3 March). Field observations of the summit on 28 February revealed very thin solfatara sublimation at Gendol and Woro craters. Temperatures at the craters were 354-755°C (table 14). No further pyroclastic flows occurred until 29 and 30 March, when 7 and 2 flows, respectively, traveled 1.8 km down to the upstream ends of the Sat and Senowo rivers. Low-frequency (LF) earthquakes, which had been recorded during the previous few weeks, increased (table 14), and high-intensity rain fell but did not trigger lahars.
Table 15 shows Merapi's SO2 fluxes. The molar concentrations of volcanic gases from Gendol crater on 28 February were as follows: 0.21% H2, 0.02% (O2 + Ar), 0.54% N2, 3.87% CO2, 0.01% CO, 1.00% H2S, 5.49% HCl, 88.86% H2O. One pyroclastic flow was reported during 25-31 March.
During early April, two minor pyroclastic flows traveled 1.3 km toward the Sat river. Activity at Merapi increased significantly; LF earthquakes reached 135 events within the week. The most intense rain was ~65 mm/hour near the Babadan post observatory on 4 April, but it did not trigger lahars. On 14 April, two minor pyroclastic flows reached 1.8 km maximum distance. Seismicity began to decrease but was still higher than normal. Deformation data from Reflector 4 at the Babadan post observatory indicated 7 mm of deflation, and the lava dome morphology did not change.
No further pyroclastic flows were reported through at least mid-June. Seismicity and general activity at Merapi was reportedly decreasing. Merapi remained at Alert Level 2 throughout the report period.
Geologic Background. Merapi, one of Indonesia's most active volcanoes, lies in one of the world's most densely populated areas and dominates the landscape immediately north of the major city of Yogyakarta. It is the youngest and southernmost of a volcanic chain extending NNW to Ungaran volcano. Growth of Old Merapi during the Pleistocene ended with major edifice collapse perhaps about 2,000 years ago, leaving a large arcuate scarp cutting the eroded older Batulawang volcano. Subsequent growth of the steep-sided Young Merapi edifice, its upper part unvegetated due to frequent activity, began SW of the earlier collapse scarp. Pyroclastic flows and lahars accompanying growth and collapse of the steep-sided active summit lava dome have devastated cultivated lands on the western-to-southern flanks and caused many fatalities.
Information Contacts: Volcanological Survey of Indonesia (VSI), Jalan Diponegoro No. 57, Bandung 40122, Indonesia (URL: http://www.vsi.esdm.go.id/).
Popocatepetl (Mexico) — June 2002 Cite this Report
Popocatepetl
Mexico
19.023°N, 98.622°W; summit elev. 5393 m
All times are local (unless otherwise noted)
Dome extrusions continue, accompanied by minor explosions
During March through at least late June 2002, volcanic activity at Popocatépetl consisted of small-to-moderate, but at times explosive, eruptions of steam, gas, and generally minor amounts of ash, along with episodes of harmonic tremor. Ash clouds rose up to ~2 km above the summit. Because of the remote location and high elevation of the summit, the dome growth within the crater was often hard to constrain, although seismicity and occasional flights over the summit did shed light on the situation. The following report is compiled from updates from the Centro Nacional de Prevencion de Desastres (CENAPRED) and from reports issued by the Washington Volcanic Ash Advisory Center (VAAC).
March began with activity at low and steady levels with up to 18 small steam-and-gas emissions per day and occasional episodes of harmonic tremor. The amount of ash emitted was generally minor. Occasional M 3 volcano-tectonic (VT) events were recorded. Low fumarolic activity began on 4 March and was frequently visible throughout the report period. Overflight observations on 7 March confirmed the presence of a lava dome in the crater (figure 44). A gas-and-steam plume reached ~2 km above the crater on 9 March. According to CENAPRED, the activity implied the possibility of low-level explosive activity in the coming days or weeks.
Activity increased during 26-27 March when 42 gas and steam emissions reached 200-500 m above the crater, accompanied by small amounts of ash and low-amplitude harmonic tremor. The Washington VAAC issued a volcanic ash warning based upon seismic observations that indicated a possible ash-bearing eruption, but no ash was visible in satellite images. Activity decreased to levels similar to earlier in the month and continued at those levels through early April.
At 0438 on 8 April, observers recorded a moderate eruption with explosive characteristics accompanied by some visible incandescence. An accompanying ash cloud moved E towards the coastline and diffused within 24 hours. After a M 2.3 VT earthquake was recorded at 0545 on 8 April, activity returned to steady levels.
Activity remained low through mid-April, with the exception of a brief period around 11 April when observers detected a slight increase in low-amplitude tremor and fumarolic activity. An increased number of small-to-moderate exhalations per day (up to 52) accompanied by episodes of low-level harmonic and high-frequency tremor, and weak VT earthquakes characterized increased activity that began in late April and lasted through early May. According to CENAPRED, this activity was most likely related to motion of small amounts of magma towards the surface and growth of the lava dome within the crater.
An air photo taken on 29 April (figure 45) by the Department of Federal Roads showed a small dome ~170 m in diameter. On 1 May CENAPRED reported an ash plume moving W at 1.0 km above the summit. No ash was visible on satellite imagery.
Activity increased slightly during mid-May with 33 small-to-moderate exhalations and 1 hour of low-amplitude tremor on 10 May. At 0609 on 12 May, a small explosive eruption occurred, ejecting incandescent fragments on the N flank up to 500 m from the crater. During the next few days, CENAPRED reported increased numbers of exhalations per day (up to 124 on 14 May) of steam, gas, and sometimes small amounts of ash. It was later determined from overflight observations that this explosive activity destroyed part of the growing dome.
This period of increased activity decreased beginning around 17 May. During the rest of May, activity was again characterized by numerous (up to 66) small-to-moderate gas-and-steam exhalations accompanied by small amounts of ash and periods of harmonic tremor. Fumarolic activity continued at the surface. A pilot reported an ash cloud in the region on 21 May.
Activity declined to steady, low levels through June with the average number of exhalations per day dropping to less than 10, occasional isolated harmonic tremor episodes of ~15 minutes duration, and as many as five VT earthquakes per day (M 2.5).
On 17 June at 1136 an ash plume extended up to 2 km above the summit and drifted to the WSW. Shortly thereafter, CENAPRED recorded high-frequency tremor for almost 8 hours and four VT events (M 2.0-2.2). The resulting ash cloud moved across Mexico to the SW. During the following days the volcano quieted but continued to emit gas, steam, and ash in small quantities with episodes of harmonic tremor lasting less than an hour. On 27 and 29 June ash plumes reaching up to 2 km above the summit were accompanied by periods of harmonic tremor lasting up to 2 hours. The Alert Level remained at Yellow throughout the report period.
Geologic Background. Volcán Popocatépetl, whose name is the Aztec word for smoking mountain, rises 70 km SE of Mexico City to form North America's 2nd-highest volcano. The glacier-clad stratovolcano contains a steep-walled, 400 x 600 m wide crater. The generally symmetrical volcano is modified by the sharp-peaked Ventorrillo on the NW, a remnant of an earlier volcano. At least three previous major cones were destroyed by gravitational failure during the Pleistocene, producing massive debris-avalanche deposits covering broad areas to the south. The modern volcano was constructed south of the late-Pleistocene to Holocene El Fraile cone. Three major Plinian eruptions, the most recent of which took place about 800 CE, have occurred since the mid-Holocene, accompanied by pyroclastic flows and voluminous lahars that swept basins below the volcano. Frequent historical eruptions, first recorded in Aztec codices, have occurred since Pre-Columbian time.
Information Contacts: Centro Nacional de Prevencion de Desastres (CENAPRED), Delfin Madrigal 665, Col. Pedregal de Santo Domingo, Coyoacán, 04360, México D.F. (URL: https://www.gob.mx/cenapred/); Washington Volcanic Ash Advisory Center (VAAC), Satellite Analysis Branch (SAB), NOAA/NESDIS E/SP23, NOAA Science Center Room 401, 5200 Auth Road, Camp Springs, MD 20746, USA (URL: http://www.ssd.noaa.gov/).
Semeru
Indonesia
8.108°S, 112.922°E; summit elev. 3657 m
All times are local (unless otherwise noted)
Seismicity increases beginning in March 2002; Alert Level increased to 2
Since mid-July 2001, Semeru was at Alert Level 1 (on a scale of 1-4). On 8 March 2002 two pyroclastic flows traveled 2.5 km downslope to the Besuk Kembar river. The same day, tectonic and volcanic earthquakes increased, prompting the Volcanological Survey of Indonesia (VSI) to raise the Alert Level to 2. Tectonic and volcanic earthquakes continued, along with explosions, avalanches, pyroclastic flows, and tremor (table 7). Plumes, sometimes containing ash, were visible reaching up to 500 m above the summit (table 8).
Table 7. Seismicity registered at Semeru during 3 March-16 June 2002. "--" indicates that information was not reported. Courtesy VSI.
| Date |
Deep volcanic |
Shallow volcanic |
Explosion |
Avalanche |
Local tectonic |
Pyroclastic flow |
Tremor |
Far tremor |
| 03 Mar-10 Mar 2002 |
8 |
1 |
479 |
22 |
2 |
2 |
-- |
-- |
| 11 Mar-17 Mar 2002 |
1 |
2 |
444 |
21 |
-- |
-- |
3 |
-- |
| 18 Mar-24 Mar 2002 |
2 |
-- |
514 |
10 |
1 |
-- |
-- |
-- |
| 25 Mar-31 Mar 2002 |
9 |
6 |
302 |
171 |
1 |
-- |
2 |
-- |
| 01 Apr-07 Apr 2002 |
26 |
2 |
415 |
278 |
-- |
-- |
-- |
-- |
| 08 Apr-14 Apr 2002 |
9 |
-- |
509 |
141 |
3 |
-- |
1 |
-- |
| 15 Apr-21 Apr 2002 |
16 |
4 |
791 |
194 |
-- |
-- |
-- |
-- |
| 22 Apr-28 Apr 2002 |
6 |
0 |
585 |
64 |
3 |
0 |
5 |
14 |
| 29 Apr-05 May 2002 |
0 |
0 |
664 |
52 |
0 |
0 |
3 |
14 |
| 06 May-12 May 2002 |
5 |
0 |
783 |
62 |
0 |
0 |
0 |
15 |
| 13 May-19 May 2002 |
1 |
0 |
575 |
146 |
0 |
0 |
0 |
13 |
| 20 May-26 May 2002 |
-- |
-- |
-- |
-- |
-- |
-- |
-- |
-- |
| 27 May-02 Jun 2002 |
2 |
1 |
556 |
90 |
1 |
-- |
2 |
-- |
| 03 Jun-09 Jun 2002 |
2 |
-- |
556 |
45 |
-- |
-- |
1 |
-- |
| 10 Jun-16 Jun 2002 |
2 |
-- |
637 |
31 |
-- |
-- |
-- |
-- |
Table 8. Plumes observed at Semeru during 8 March-16 June 2002. Courtesy VSI.
| Date |
Plume Type |
Plume height (above the summit) |
| 08 Mar 2002 |
White-gray |
400 m |
| 12, 14, and 17 Mar 2002 |
White-gray |
300-400 m |
| 19-23 Mar 2002 |
White-gray |
~300-500 m |
| 25-31 Mar 2002 |
White-gray |
300-500 m |
| 15-21 Apr 2002 |
White-gray, medium pressure |
400 m |
| 22 Apr-26 May 2002 |
White-gray, medium pressure |
400 m |
| 10-16 Jun 2002 |
White-gray ash |
200-400 m |
On 31 March two tremor earthquakes occurred with amplitudes of ~3-17 mm. During mid-April, a tremor earthquake occurred with an amplitude of 0.2 mm. Lava avalanches continued to travel up to 750 m down to Besuk Kembar. Seismic signals thought to indicate local floods registered 15-21 April. Incandescence was observed up to 25 m above the crater rim during 1820-2025 on 18 April. During that time, seismicity was dominated by low-frequency earthquakes, with amplitudes of 2-3 mm. During 27 May-2 June ash explosions produced white-gray plumes that reached ~200-400 m above the summit, while lava avalanches traveled ~100 m away. Semeru remained at Alert Level 2 through at least 16 June 2002.
Geologic Background. Semeru, the highest volcano on Java, and one of its most active, lies at the southern end of a volcanic massif extending north to the Tengger caldera. The steep-sided volcano, also referred to as Mahameru (Great Mountain), rises above coastal plains to the south. Gunung Semeru was constructed south of the overlapping Ajek-ajek and Jambangan calderas. A line of lake-filled maars was constructed along a N-S trend cutting through the summit, and cinder cones and lava domes occupy the eastern and NE flanks. Summit topography is complicated by the shifting of craters from NW to SE. Frequent 19th and 20th century eruptions were dominated by small-to-moderate explosions from the summit crater, with occasional lava flows and larger explosive eruptions accompanied by pyroclastic flows that have reached the lower flanks of the volcano.
Information Contacts: Volcanological Survey of Indonesia (VSI), Jalan Diponegoro No. 57, Bandung 40122, Indonesia (URL: http://www.vsi.esdm.go.id/).
Soufriere Hills (United Kingdom) — June 2002 Cite this Report
Soufriere Hills
United Kingdom
16.72°N, 62.18°W; summit elev. 915 m
All times are local (unless otherwise noted)
During 19-29 February large spines and plumes occurred at tidal maxima
Stephen O'Meara and four Volcano Watch International (VWI) team members (Robert Benward, Tippy D'Auria, Scott Ireland, and Larry Mitchell) visually monitored Soufrière Hills for 10 days beginning on 19 February 2002. The observations took place on Jack Boy Hill, a spot at ~180 m elevation 6 km N of the volcano. In addition, for 3 hours on the night of 25 February, the group joined Montserrat Volcano Observatory (MVO) scientists Peter Dunkley and Richard Herd on the runway at Bramble Airport. Except for a storm on 20 February, the weather facilitated exceptionally clear views of the dome during both day and night. The team employed a variety of telescopes and other optical equipment and had an interest in astronomy as well as the volcano (O'Meara, 2002).
Benward brought along a homemade night-vision scope (near-infrared image intensifier) that captured images of the dome, even through local atmospheric conditions where visible light was weakened or scattered. The intensifier was coupled to camera lenses. It could be used visually or attached to a video camera (figure 47). The camera's phosphor viewing screen yielded green-colored images of the hot portions of the dome.
One purpose of the VWI team's visit to Montserrat was to chronicle changes in the volcano's visible behavior with approach to the time of the full Moon and its perigee (when the Moon is closest to the Earth). The idea was that the tidal influence associated with the full Moon and its perigee might lead to enhanced activity. With approach of the full Moon, there did seem to be a rise in visible indicators, particularly plume height, a strong pulse of extruded spines, and less-substantial increases in the numbers of rockfalls and pyroclastic flows.
As background on tidal forces, the paths of both the Moon around the Earth, and Earth around the Sun are elliptical throughout the lunar cycle (29.53 days) and solar cycle (the year), meaning that the separations and resulting gravitational forces vary with time. The Earth-Moon separations change by ~50,000 km; when they are smallest (perigee) and largest (apogee) the respective tidal forces are higher or lower than usual. In addition, the gravitational attractions of Moon and Sun on the Earth may act along a common line or at changing angles relative to each other. Particularly large tides affect the Earth's crust and oceans when the Sun and the Moon are lined up with the Earth; this occurs at the new and full phases of the Moon. These orientations lead to what are called spring tides (a name not associated with the season of Spring, but which implies a "welling up"). The amount of tidal enhancement is roughly the same whether the Sun and Moon are lined up on opposite sides of the Earth (full Moon) or on the same side of the Earth (new Moon). In contrast, when the Moon is at first quarter or last quarter (meaning that it is located at right angles to the Earth-Sun line), the Sun and Moon produce tidal bulges called neap tides. These are generally weaker than the above-described spring tides.
A two-month record of seismicity and tides at the volcanically active Axial seamount on the Juan de Fuca ridge during 1994 found both bi-weekly and diurnal patterns in earthquakes and volcanic tremor (Tolstoy and others, 2002). The authors concluded that microearthquakes took place at tidal minima.
Montserrat, Moon, and magma. The full Moon occurred at 0518 on 27 February; perigee, ~11 hours later, at 1630. The team's 10-day stay was too short to see more than a partial lunar cycle, but soon after full Moon and perigee, the numbers for the observed visible indicators appeared to drop considerably.
After an initial study of dome activity on 19 February and a storm on 20 February, the group began taking regular visible observations on 21 February. At that time, activity appeared to be on the increase and a high-level of activity was sustained throughout the observation period. According to MVO: "The level of volcanism at Soufrière Hills during 22 February-1 March was higher than it had been in previous weeks." The growing dome was quite active, displaying near continuous rockfall and small pyroclastic flows, most of which traveled E to the Tar River Valley, though some activity was directed to the S and W. During the 10-day observation interval, the dome also rapidly extruded very large spines.
By midnight on 27 February the team had recorded and tabulated 440 observations of notable rockfalls and pyroclastic flows. On the whole during this interval, the number of these events per hour stood well below 10, typically ranging from ~4 to ~8. One low, late on 23 February, only reached 1 event per hour. The average number of these events per hour reached a low of ~5 during 21-23 February rising to ~8 on 27 February. The highest hourly total recorded during the observing period occurred on 27 February with 13 of these events during 0000-0100 and 10 during 1120-1320. These times fall on either side of the full Moon; the second total lies at the midpoint between the full Moon and lunar perigee.
Visible activity decreased sharply on 28 February. The team, which departed on 3 March, made sporadic observations until 1 March. Their observations on and after 28 February suggested dome activity had remained substantially lower than during 21-27 February.
During their interval of observation the team found a direct correlation between the number of large visible events and the size of the dome's emerging and collapsing spines. The mass of each spine also increased during the observation period; the largest spine was observed on 26 February, the day before the full Moon and perigee.
Each of the spines collapsed in less than a day, only to regrow rapidly. The largest (shown on figures 48-53) reached 90 m tall; it enabled the summit to attain 1,080-m elevation, the highest the summit has been during the entire eruption to date (according to the MVO weekly update). It grew rapidly; specifically, it was not present from 1830 to 2100 on the evening of 25 February, but was fully grown by 0600 the following morning. When seen at 0330 on 26 February the new spine appeared as an incandescent obelisk about one-fifth its maximum size. The majority of this massive spine then grew to its record height in 3 hours.
Figure 54 is one of several plots constructed to illustrate the results. It was made by omitting the smaller events, which the team judged from small to medium using a qualitative visual scale that ran from S1 to S3 and continued upwards from M1 to M3 (where event sizes are abbreviated as S for "small" and M for "medium" and termed as S-class or M-class, respectively). Thus, the largest events seen were M3 (i.e., they saw no events in these time periods that they classified as "large"). On their scale, events of size S3 and M1 were judged to be of very similar magnitude. Figure 54 shows the increase in larger event size seen during 21-26 February, culminating in the highest numbers late on 26 February to early on 27 February.
Figure 54 shows six high tides that occurred at times when observations were conducted (on 21, 22, 24, 26 and 27 February). Five of the six of these tides coincided with observation intervals with the day's highest number of the largest events (the M-class events).
Plume height. As shown on figure 55, an increase in plume height took place around the time of first quarter Moon followed by a decrease, then a gradual rise in plume height, until it reached a maximum at the time of perigee on 27 February. Although atmospheric conditions could clearly affect the extent and height of a plume, the team found the pattern of the plotted data compelling. The plot may disclose tidal effects.
References. O'Meara, S., 2002, Firelight nights: Stargazing from the Caribbean's Emerald Isle; A group of American amateur astronomers helps residents of Montserrat and its neighboring island explore the universe: Sky & Telescope, August 2002, p. 79-83.
Tolstoy, M., Vernon, F.L., Orcutt, J.A., and Wyatt, F.K., 2002, Breathing of the seafloor, tidal correlations of seismicity at Axial Volcano: Geological Society of America (GSA), Geology, v. 30, no. 6, p. 503-506.
Geologic Background. The complex, dominantly andesitic Soufrière Hills volcano occupies the southern half of the island of Montserrat. The summit area consists primarily of a series of lava domes emplaced along an ESE-trending zone. The volcano is flanked by Pleistocene complexes to the north and south. English's Crater, a 1-km-wide crater breached widely to the east by edifice collapse, was formed about 2000 years ago as a result of the youngest of several collapse events producing submarine debris-avalanche deposits. Block-and-ash flow and surge deposits associated with dome growth predominate in flank deposits, including those from an eruption that likely preceded the 1632 CE settlement of the island, allowing cultivation on recently devegetated land to near the summit. Non-eruptive seismic swarms occurred at 30-year intervals in the 20th century, but no historical eruptions were recorded until 1995. Long-term small-to-moderate ash eruptions beginning in that year were later accompanied by lava-dome growth and pyroclastic flows that forced evacuation of the southern half of the island and ultimately destroyed the capital city of Plymouth, causing major social and economic disruption.
Information Contacts: Steve and Donna O'Meara, Robert Benward, Tippy D'Auria, Scott Ireland, and Larry Mitchell, Volcano Watch International, PO Box 218, Volcano, Hawaii 96785.
Talang
Indonesia
0.979°S, 100.681°E; summit elev. 2575 m
All times are local (unless otherwise noted)
Small explosion earthquakes dominate through June 2002
During 11 March-16 June 2002 at Talang, seismicity was dominated by small explosion earthquakes (table 4). A thin white plume reached 50-100 m above the summit and sometimes drifted E. Hotspring temperatures were 42-64°C. As of 13 May, the Volcanological Survey of Indonesia (VSI) reported that no seismic data were available because of a broken seismograph. During April and early May seismicity had been decreasing. Talang remained at Alert Level 2 (on a scale of 1-4) throughout the report period.
Table 4. Earthquakes at Talang during 11 March-12 May 2002. The seismograph was broken as of 13 May, so no seismicity data was available through at least 16 June. Courtesy VSI.
| Date |
Deep volcanic (A-type) |
Shallow volcanic (B-type) |
Small explosion |
Tectonic |
| 11 Mar-17 Mar 2002 |
1 |
17 |
61 |
14 |
| 18 Mar-24 Mar 2002 |
2 |
-- |
120 |
9 |
| 25 Mar-31 Mar 2002 |
2 |
-- |
120 |
13 |
| 01 Apr-07 Apr 2002 |
2 |
-- |
63 |
5 |
| 08 Apr-14 Apr 2002 |
1 |
-- |
23 |
12 |
| 15 Apr-21 Apr 2002 |
3 |
-- |
-- |
6 |
| 22 Apr-28 Apr 2002 |
6 |
-- |
-- |
7 |
| 29 Apr-05 May 2002 |
4 |
-- |
-- |
14 |
| 06 May-12 May 2002 |
3 |
-- |
-- |
3 |
Geologic Background. Talang, which forms a twin volcano with the extinct Pasar Arbaa volcano, lies ESE of the major city of Padang and rises NW of Dibawah Lake. Talang has two crater lakes on its flanks; the largest of these is 1 x 2 km wide Danau Talang. The summit exhibits fumarolic activity, but which lacks a crater. Historical eruptions have mostly involved small-to-moderate explosive activity first documented in the 19th century that originated from a series of small craters in a valley on the upper NE flank.
Information Contacts: Volcanological Survey of Indonesia (VSI), Jalan Diponegoro No. 57, Bandung 40122, Indonesia (URL: http://www.vsi.esdm.go.id/).
Three Sisters (United States) — June 2002 Cite this Report
Three Sisters
United States
44.133°N, 121.767°W; summit elev. 3159 m
All times are local (unless otherwise noted)
Studies suggest magma slowly accumulating at depth
Uplift (up to ~10 cm) occurred during 1996-2000 over a broad region centered 5 km W of South Sister in the Three Sisters region (BGVN 26:05). At the time scientists did not know exactly when the uplift had occurred, whether it would continue, or its specific cause. Although most of these questions remain, some new data are available.
On 18 March 2002 scientists from the USGS Cascades Volcano Observatory and Central Washington University reported that they, in cooperation with staff from the U.S. Forest Service's (USFS) Willamette and Deschutes National Forests, confirmed that slow uplift of the area was continuing at approximately the same rate as previously reported (i.e., a maximum rate of ~2.5 cm/year).
About a month later NASA's Jet Propulsion Laboratory (JPL) released a simulated natural-color image from the Aster high-resolution imaging instrument on the satellite Terra. Aster uses 14 spectral bands, at wavelengths from visible to thermal-infrared, and it has a spatial resolution of 15-90 m. By draping the Aster data over digital topography from the U.S. Geological Survey's National Elevation Dataset, they created a new perspective view of the Three Sisters and adjacent Cascade volcanoes (figure 2). The image was timely because of concerns about continued uplift in the area. BGVN 26:05 included a radar interferogram showing ground uplift pattern during 1996-2000, movement centered ~ 5 km W of South Sister.
Analyses of spring water samples collected during late summer 2001 were similar to those from earlier surveys but isotopic studies of carbon and helium in the most recent samples, which were not done previously, suggested a magmatic source. Taken together, the ground deformation, seismic, spring water chemistry, and gas emission results suggest that uplift was caused by slow accumulation of magma at a depth of 6-7 km beneath the surface. If magma intrusion were to continue, it could eventually lead to a volcanic eruption; however, an eruption is unlikely without months to years of precursory activity. In addition to continued or accelerating uplift, precursors to an eruption would include earthquakes, typically swarms of small events generated by fracturing of rock as magma moves upward, and large emissions of volcanic gases, such as carbon dioxide, which is released from the magma.
The Pacific Northwest Seismograph Network (PNSN) has reported three earthquakes in the Three Sisters region since January 2001. On 21 August 2001 a M 1.9 earthquake occurred at a depth of 4.9 km; on 5 November 2001 a M 1 earthquake occurred at a depth of 1 km; and on 18 January 2002 an M 2.4 earthquake occurred at a depth of 3.0 km. The recent earthquakes are consistent with background seismicity at Three Sisters. As of mid-July 2002, the number of earthquakes and gas emissions remained at low-t-obackground levels while steady uplift continued.
General Reference. Scott, W.E., 1987, Holocene rhyodacite eruptions on the flanks of South Sister volcano, Oregon: Geol Soc Amer Spec Pap, v. 212, p. 35-53.
Geologic Background. The north-south-trending Three Sisters volcano group dominates the landscape of the Central Oregon Cascades. All Three Sisters stratovolcanoes ceased activity during the late Pleistocene, but basaltic-to-rhyolitic flank vents erupted during the Holocene, producing both blocky lava flows north of North Sister and rhyolitic lava domes and flows south of South Sister volcano. Glaciers have deeply eroded the Pleistocene andesitic-dacitic North Sister stratovolcano, exposing the volcano's central plug. Construction of the main edifice ceased at about 55,000 yrs ago, but north-flank vents produced blocky lava flows in the McKenzie Pass area as recently as about 1600 years ago. Middle Sister volcano is located only 2 km to the SW and was active largely contemporaneously with South Sister until about 14,000 years ago. South Sister is the highest of the Three Sisters. It was constructed beginning about 50,000 years ago and was capped by a symmetrical summit cinder cone formed about 22,000 years ago. The late Pleistocene or early Holocene Cayuse Crater on the SW flank of Broken Top volcano and other flank vents such as Le Conte Crater on the SW flank of South Sister mark mafic vents that have erupted at considerable distances from South Sister itself, and a chain of dike-fed rhyolitic lava domes and flows at Rock Mesa and Devils Chain south of South Sister erupted about 2000 years ago.
Information Contacts: Cascades Volcano Observatory (CVO), U.S. Geological Survey (USGS), Building 10, Suite 100, 1300 SE Cardinal Court, Vancouver, WA 98683 (URL: https://volcanoes.usgs.gov/observatories/cvo/); Volcano Hazards Team, USGS, 345 Middlefield Road, Menlo Park, CA 94025-3591 USA (URL: http://volcanoes.usgs.gov/); Pacific Northwest Seismograph Network (PNSN), University of Washington Geophysics Program, Box 351650, Seattle, WA 98195-1650 USA (URL: http://www.geophys.washington.edu/SEIS/PNSN/); Jet Propulsion Laboratory, California Institute of Technology, National Aeronautics and Space Administration, Pasadena, CA 91109 (URL: http://www.jpl.nasa.gov/).
Villarrica
Chile
39.42°S, 71.93°W; summit elev. 2847 m
All times are local (unless otherwise noted)
General decrease in activity during February-May 2002
Our last report described activity at Villarrica during January 2001 (BGVN 27:02) through January 2002, when incandescent lava was observed in the crater and ballistics were ejected ~80-150 m. At that time explosions generally occurred every ~1-10 minutes and degassing sounds were occasionally heard.
During February through at least May 2002, sporadic observations showed a general decrease in activity. Degassing noises were sometimes heard; however, no incandescence or ballistics were reported. A crater visit on 9 April revealed that no incandescence or explosive noises occurred. The surface of the lava lake, last seen on 19 January, remained low (~200 m below the crater rim). On 10 April, explosions occurred every ~10-13 minutes.
Geologic Background. The glacier-covered Villarrica stratovolcano, in the northern Lakes District of central Chile, is ~15 km south of the city of Pucon. A 2-km-wide caldera that formed about 3,500 years ago is located at the base of the presently active, dominantly basaltic to basaltic andesite cone at the NW margin of a 6-km-wide Pleistocene caldera. More than 30 scoria cones and fissure vents are present on the flanks. Plinian eruptions and pyroclastic flows that have extended up to 20 km from the volcano were produced during the Holocene. Lava flows up to 18 km long have issued from summit and flank vents. Eruptions documented since 1558 CE have consisted largely of mild-to-moderate explosive activity with occasional lava effusion. Glaciers cover 40 km2 of the volcano, and lahars have damaged towns on its flanks.
Information Contacts: Proyecto de Observacion Villarrica (POVI), Wiesenstrasse 8, 86438 Kissing, Germany (URL: http://www.povi.cl/).