Recently Published Bulletin Reports
Erebus (Antarctica) Lava lake remains active; most thermal alerts recorded since 2019
Rincon de la Vieja (Costa Rica) Frequent phreatic explosions during July-December 2023
Bezymianny (Russia) Explosion on 18 October 2023 sends ash plume 8 km high; lava flows and incandescent avalanches
Kilauea (United States) Low-level lava effusions in the lava lake at Halema’uma’u during July-December 2022
Nyamulagira (DR Congo) Lava flows and thermal activity during May-October 2023
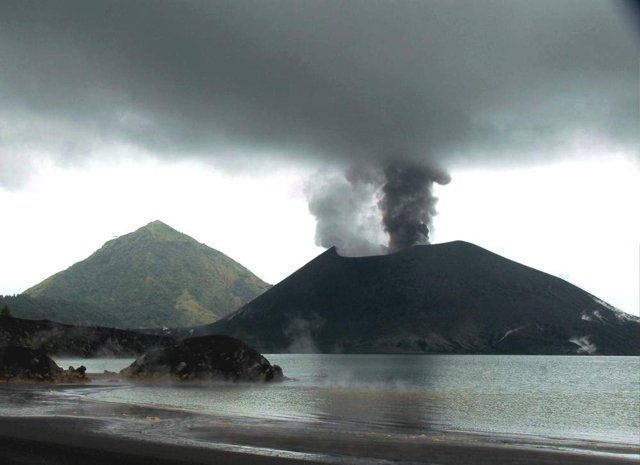
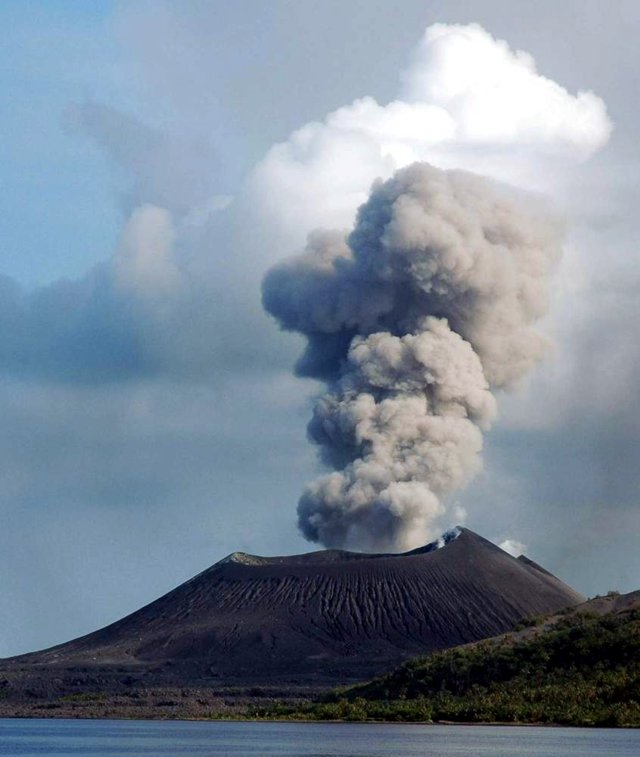
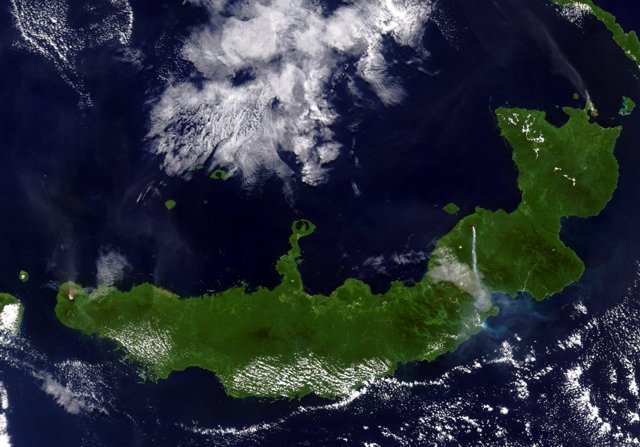
Bagana (Papua New Guinea) Explosions, ash plumes, ashfall, and lava flows during April-September 2023
Mayon (Philippines) Lava flows, pyroclastic flows, ash emissions, and seismicity during April-September 2023
Nishinoshima (Japan) Eruption plumes and gas-and-steam plumes during May-August 2023
Krakatau (Indonesia) White gas-and-steam plumes and occasional ash plumes during May-August 2023
Villarrica (Chile) Strombolian activity, gas-and-ash emissions, and crater incandescence during April-September 2023
Merapi (Indonesia) Frequent incandescent avalanches during April-September 2023
Ebeko (Russia) Moderate explosive activity with ash plumes continued during June-November 2023
Erebus (Antarctica) — January 2024  Cite this Report
Erebus
Antarctica
77.53°S, 167.17°E; summit elev. 3794 m
All times are local (unless otherwise noted)
Lava lake remains active; most thermal alerts recorded since 2019
The lava lake in the summit crater of Erebus has been active since at least 1972. Located in Antarctica overlooking the McMurdo Station on Ross Island, it is the southernmost active volcano on the planet. Because of the remote location, activity is primarily monitored by satellites. This report covers activity during 2023.
The number of thermal alerts recorded by the Hawai'i Institute of Geophysics and Planetology’s MODVOLC Thermal Alerts System increased considerably in 2023 compared to the years 2020-2022 (table 9). In contrast to previous years, the MODIS instruments aboard the Aqua and Terra satellites captured data from Erebus every month during 2023. Consistent with previous years, the lowest number of anomalous pixels were recorded in January, November, and December.
Table 9. Number of monthly MODIS-MODVOLC thermal alert pixels recorded at Erebus during 2017-2023. See BGVN 42:06 for data from 2000 through 2016. The table was compiled using data provided by the HIGP – MODVOLC Thermal Alerts System.
| Year |
Jan |
Feb |
Mar |
Apr |
May |
Jun |
Jul |
Aug |
Sep |
Oct |
Nov |
Dec |
SUM |
| 2017 |
0 |
21 |
9 |
0 |
0 |
1 |
11 |
61 |
76 |
52 |
0 |
3 |
234 |
| 2018 |
0 |
21 |
58 |
182 |
55 |
17 |
137 |
172 |
103 |
29 |
0 |
0 |
774 |
| 2019 |
2 |
21 |
162 |
151 |
55 |
56 |
75 |
53 |
29 |
19 |
1 |
0 |
624 |
| 2020 |
0 |
2 |
16 |
18 |
4 |
4 |
1 |
3 |
18 |
3 |
1 |
6 |
76 |
| 2021 |
0 |
9 |
1 |
0 |
2 |
56 |
46 |
47 |
35 |
52 |
5 |
3 |
256 |
| 2022 |
1 |
13 |
55 |
22 |
15 |
32 |
39 |
19 |
31 |
11 |
0 |
0 |
238 |
| 2023 |
2 |
33 |
49 |
82 |
41 |
32 |
70 |
64 |
42 |
17 |
5 |
11 |
448 |
Sentinel-2 infrared images showed one or two prominent heat sources within the summit crater, accompanied by adjacent smaller sources, similar to recent years (see BGVN 46:01, 47:02, and 48:01). A unique image was obtained on 25 November 2023 by the OLI-2 (Operational Land Imager-2) on Landsat 9, showing the upper part of the volcano surrounded by clouds (figure 32).
Geologic Background. Mount Erebus, the world's southernmost historically active volcano, overlooks the McMurdo research station on Ross Island. It is the largest of three major volcanoes forming the crudely triangular Ross Island. The summit of the dominantly phonolitic volcano has been modified by one or two generations of caldera formation. A summit plateau at about 3,200 m elevation marks the rim of the youngest caldera, which formed during the late-Pleistocene and within which the modern cone was constructed. An elliptical 500 x 600 m wide, 110-m-deep crater truncates the summit and contains an active lava lake within a 250-m-wide, 100-m-deep inner crater; other lava lakes are sometimes present. The glacier-covered volcano was erupting when first sighted by Captain James Ross in 1841. Continuous lava-lake activity with minor explosions, punctuated by occasional larger Strombolian explosions that eject bombs onto the crater rim, has been documented since 1972, but has probably been occurring for much of the volcano's recent history.
Information Contacts: Hawai'i Institute of Geophysics and Planetology (HIGP) - MODVOLC Thermal Alerts System, School of Ocean and Earth Science and Technology (SOEST), Univ. of Hawai'i, 2525 Correa Road, Honolulu, HI 96822, USA (URL: http://modis.higp.hawaii.edu/); Copernicus Browser, Copernicus Data Space Ecosystem, European Space Agency (URL: https://dataspace.copernicus.eu/browser/); NASA Earth Observatory, EOS Project Science Office, NASA Goddard Space Flight Center, Goddard, Maryland, USA (URL: https://earthobservatory.nasa.gov/images/152134/erebus-breaks-through).
Rincon de la Vieja (Costa Rica) — January 2024 Cite this Report
Rincon de la Vieja
Costa Rica
10.83°N, 85.324°W; summit elev. 1916 m
All times are local (unless otherwise noted)
Frequent phreatic explosions during July-December 2023
Rincón de la Vieja is a volcanic complex in Costa Rica with a hot convecting acid lake that exhibits frequent weak phreatic explosions, gas-and-steam emissions, and occasional elevated sulfur dioxide levels (BGVN 45:10, 46:03, 46:11). The current eruption period began June 2021. This report covers activity during July-December 2023 and is based on weekly bulletins and occasional daily reports from the Observatorio Vulcanologico Sismologica de Costa Rica-Universidad Nacional (OVSICORI-UNA).
Numerous weak phreatic explosions continued during July-December 2023, along with gas-and-steam emissions and plumes that rose as high as 3 km above the crater rim. Many weekly OVSICORI-UNA bulletins included the previous week's number of explosions and emissions (table 9). For many explosions, the time of explosion was given (table 10). Frequent seismic activity (long-period earthquakes, volcano-tectonic earthquakes, and tremor) accompanied the phreatic activity.
Table 9. Number of reported weekly phreatic explosions and gas-and-steam emissions at Rincón de la Vieja, July-December 2023. Counts are reported for the week before the Weekly Bulletin date; not all reports included these data. Courtesy of OVSICORI-UNA.
| OVSICORI Weekly Bulletin |
Number of explosions |
Number of emissions |
| 28 Jul 2023 |
6 |
14 |
| 4 Aug 2023 |
10 |
12 |
| 1 Sep 2023 |
13 |
11 |
| 22 Sep 2023 |
12 |
13 |
| 29 Sep 2023 |
6 |
11 |
| 6 Oct 2023 |
12 |
5 |
| 13 Oct 2023 |
7 |
9 |
| 20 Oct 2023 |
1 |
15 |
| 27 Oct 2023 |
3 |
23 |
| 3 Nov 2023 |
3 |
10 |
| 17 Nov 2023 |
0 |
Some |
| 24 Nov 2023 |
0 |
14 |
| 8 Dec 2023 |
4 |
16 |
| 22 Dec 2023 |
8 |
18 |
Table 10. Summary of activity at Rincón de la Vieja during July-December 2023. Weak phreatic explosions and gas emissions are noted where the time of explosion was indicated in the weekly or daily bulletins. Height of plumes or emissions are distance above the crater rim. Courtesy of OVSICORI-UNA.
| Date |
Time |
Description of Activity |
| 1 Jul 2023 |
0156 |
Explosion. |
| 2 Jul 2023 |
0305 |
Explosion. |
| 4 Jul 2023 |
0229, 0635 |
Event at 0635 produced a gas-and-steam plume that rose 700 m and drifted W; seen by residents in Liberia (21 km SW). |
| 9 Jul 2023 |
1843 |
Explosion. |
| 21 Jul 2023 |
0705 |
Explosion. |
| 26 Jul 2023 |
1807 |
Explosion. |
| 28 Jul 2023 |
0802 |
Explosion generated a gas-and-steam plume that rose 500 m. |
| 30 Jul 2023 |
1250 |
Explosion. |
| 31 Jul 2023 |
2136 |
Explosion. |
| 11 Aug 2023 |
0828 |
Explosion. |
| 18 Aug 2023 |
1304 |
Explosion. |
| 21 Aug 2023 |
1224 |
Explosion generated gas-and-steam plumes rose 500-600 m. |
| 22 Aug 2023 |
0749 |
Explosion generated gas-and-steam plumes rose 500-600 m. |
| 24 Aug 2023 |
1900 |
Explosion. |
| 25 Aug 2023 |
0828 |
Event produced a steam-and-gas plume that rose 3 km and drifted NW. |
| 27-28 Aug 2023 |
0813 |
Four small events; the event at 0813 on 28 August lasted two minutes and generated a steam-and-gas plume that rose 2.5 km. |
| 1 Sep 2023 |
1526 |
Explosion generated plume that rose 2 km and ejected material onto the flanks. |
| 2-3 Sep 2023 |
- |
Small explosions detected in infrasound data. |
| 4 Sep 2023 |
1251 |
Gas-and-steam plume rose 1 km and drifted W. |
| 7 Nov 2023 |
1113 |
Explosion. |
| 8 Nov 2023 |
0722 |
Explosion. |
| 12 Nov 2023 |
0136 |
Small gas emissions. |
| 14 Nov 2023 |
0415 |
Small gas emissions. |
According to OVSICORI-UNA, during July-October the average weekly sulfur dioxide (SO2) flux ranged from 68 to 240 tonnes/day. However, in mid-November the flux increased to as high as 334 tonnes/day, the highest value measured in recent years. The high SO2 flux in mid-November was also detected by the TROPOMI instrument on the Sentinel-5P satellite (figure 43).
Geologic Background. Rincón de la Vieja, the largest volcano in NW Costa Rica, is a remote volcanic complex in the Guanacaste Range. The volcano consists of an elongated, arcuate NW-SE-trending ridge constructed within the 15-km-wide early Pleistocene Guachipelín caldera, whose rim is exposed on the south side. Sometimes known as the "Colossus of Guanacaste," it has an estimated volume of 130 km3 and contains at least nine major eruptive centers. Activity has migrated to the SE, where the youngest-looking craters are located. The twin cone of Santa María volcano, the highest peak of the complex, is located at the eastern end of a smaller, 5-km-wide caldera and has a 500-m-wide crater. A Plinian eruption producing the 0.25 km3 Río Blanca tephra about 3,500 years ago was the last major magmatic eruption. All subsequent eruptions, including numerous historical eruptions possibly dating back to the 16th century, have been from the prominent active crater containing a 500-m-wide acid lake located ENE of Von Seebach crater.
Information Contacts: Observatorio Vulcanológico Sismológica de Costa Rica-Universidad Nacional (OVSICORI-UNA), Apartado 86-3000, Heredia, Costa Rica (URL: http://www.ovsicori.una.ac.cr/); NASA Global Sulfur Dioxide Monitoring Page, Atmospheric Chemistry and Dynamics Laboratory, NASA Goddard Space Flight Center (NASA/GSFC), 8800 Greenbelt Road, Goddard MD 20771, USA (URL: https://so2.gsfc.nasa.gov/).
Bezymianny (Russia) — November 2023 Cite this Report
Bezymianny
Russia
55.972°N, 160.595°E; summit elev. 2882 m
All times are local (unless otherwise noted)
Explosion on 18 October 2023 sends ash plume 8 km high; lava flows and incandescent avalanches
Bezymianny, located on Russia’s Kamchatka Peninsula, has had eruptions since 1955 characterized by dome growth, explosions, pyroclastic flows, ash plumes, and ashfall. Activity during November 2022-April 2023 included gas-and-steam emissions, lava dome collapses generating avalanches, and persistent thermal activity. Similar eruptive activity continued from May through October 2023, described here based on information from weekly and daily reports of the Kamchatka Volcano Eruptions Response Team (KVERT), notices from Tokyo VAAC (Volcanic Ash Advisory Center), and from satellite data.
Overall activity decreased after the strong period of activity in late March through April 2023, which included ash explosions during 29 March and 7-8 April 2023 that sent plumes as high as 10-12 km altitude, along with dome growth and lava flows (BGVN 48:05). This reduced activity can be seen in the MIROVA thermal detection system graph (figure 56), which was consistent with data from the MODVOLC thermal detection system and with Sentinel-2 satellite images that showed persistent hotspots in the summit crater when conditions allowed observations. A renewed period of strong activity began in mid-October 2023.
Activity increased significantly on 17 October 2023 when large collapses began during 0700-0830 on the E flanks of the lava dome and continued to after 0930 the next day (figure 57). Ash plumes rose to an altitude of 4.5-5 km, extending 220 km NNE by 18 October. A large explosion at 1630 on 18 October produced an ash plume that rose to an altitude of 11 km (8 km above the summit) and drifted NNE and then NW, extending 900 km NW within two days at an altitude of 8 km. Minor ashfall was noted in Kozyrevsk (45 km WNW). At 0820 on 20 October an ash plume was identified in satellite images drifting 100 km ENE at altitudes of 4-4.5 km.
Lava flows and hot avalanches from the dome down the SE flank continued over the next few days, including 23 October when clear conditions allowed good observations (figures 58 and 59). A large thermal anomaly was observed over the volcano through 24 October, and in the summit crater on 30 October (figure 60). Strong fumarolic activity continued, with numerous avalanches and occasional incandescence. By the last week of October, volcanic activity had decreased to a level consistent with that earlier in the reporting period.
Aviation warnings were frequently updated during 17-20 October. KVERT issued a Volcano Observatory Notice for Aviation (VONA) on 17 October at 1419 and 1727 (0219 and 0527 UTC) raising the Aviation Color Code (ACC) from Yellow to Orange (second highest level). The next day, KVERT issued a VONA at 1705 (0505 UTC) raising the ACC to Red (highest level) but lowered it back to Orange at 2117 (0917 UTC). After another decrease to Yellow and back to Orange, the ACC was reduced to Yellow on 20 October at 1204 (0004 UTC). In addition, the Tokyo VAAC issued a series of Volcanic Ash Advisories beginning on 16 October and continuing through 30 October.
Geologic Background. The modern Bezymianny, much smaller than its massive neighbors Kamen and Kliuchevskoi on the Kamchatka Peninsula, was formed about 4,700 years ago over a late-Pleistocene lava-dome complex and an edifice built about 11,000-7,000 years ago. Three periods of intensified activity have occurred during the past 3,000 years. The latest period, which was preceded by a 1,000-year quiescence, began with the dramatic 1955-56 eruption. This eruption, similar to that of St. Helens in 1980, produced a large open crater that was formed by collapse of the summit and an associated lateral blast. Subsequent episodic but ongoing lava-dome growth, accompanied by intermittent explosive activity and pyroclastic flows, has largely filled the 1956 crater.
Information Contacts: Kamchatka Volcanic Eruptions Response Team (KVERT), Far Eastern Branch, Russian Academy of Sciences, 9 Piip Blvd., Petropavlovsk-Kamchatsky, 683006, Russia (URL: http://www.kscnet.ru/ivs/kvert/); Kamchatka Volcanological Station, Kamchatka Branch of Geophysical Survey, (KB GS RAS), Klyuchi, Kamchatka Krai, Russia (URL: http://volkstat.ru/); Tokyo Volcanic Ash Advisory Center (VAAC), 1-3-4 Otemachi, Chiyoda-ku, Tokyo 100-8122, Japan (URL: http://ds.data.jma.go.jp/svd/vaac/data/); Hawai'i Institute of Geophysics and Planetology (HIGP) - MODVOLC Thermal Alerts System, School of Ocean and Earth Science and Technology (SOEST), Univ. of Hawai'i, 2525 Correa Road, Honolulu, HI 96822, USA (URL: http://modis.higp.hawaii.edu/); MIROVA (Middle InfraRed Observation of Volcanic Activity), a collaborative project between the Universities of Turin and Florence (Italy) supported by the Centre for Volcanic Risk of the Italian Civil Protection Department (URL: http://www.mirovaweb.it/); Copernicus Browser, Copernicus Data Space Ecosystem, European Space Agency (URL: https://dataspace.copernicus.eu/browser/).chr
Kilauea (United States) — January 2023 Cite this Report
Kilauea
United States
19.421°N, 155.287°W; summit elev. 1222 m
All times are local (unless otherwise noted)
Low-level lava effusions in the lava lake at Halema’uma’u during July-December 2022
Kīlauea is the southeastern-most volcano in Hawaii and overlaps the E flank of the Mauna Loa volcano. Its East Rift Zone (ERZ) has been intermittently active for at least 2,000 years. An extended eruption period began in January 1983 and was characterized by open lava lakes and lava flows from the summit caldera and the East Rift Zone. During May 2018 magma migrated into the Lower East Rift Zone (LERZ) and opened 24 fissures along a 6-km-long NE-trending fracture zone that produced lava flows traveling in multiple directions. As lava emerged from the fissures, the lava lake at Halema'uma'u drained and explosions sent ash plumes to several kilometers altitude (BGVN 43:10).
The current eruption period started during September 2021 and has recently been characterized by lava effusions, spatter, and sulfur dioxide emissions in the active Halema’uma’u lava lake (BGVN 47:08). Lava effusions, some spatter, and sulfur dioxide emissions have continued during this reporting period of July through December 2022 using daily reports, volcanic activity notices, and abundant photo, map, and video data from the US Geological Survey's (USGS) Hawaiian Volcano Observatory (HVO).
Summary of activity during July-December 2022. Low-level effusions have continued at the western vent of the Halema’uma’u crater during July through early December 2022. Occasional weak ooze-outs (also called lava break outs) would occur along the margins of the crater floor. The overall level of the active lava lake throughout the reporting period gradually increased due to infilling, however it stagnated in mid-September (table 13). During September through November, activity began to decline, though lava effusions persisted at the western vent. By 9 December, the active part of the lava lake had completely crusted over, and incandescence was no longer visible.
Table 13. Summary of measurements taken during overflights at Kīlauea that show a gradual increase in the active lava lake level and the volume of lava effused since 29 September 2021. Lower activity was reported during September-October. Data collected during July-December 2022. Courtesy of HVO.
| Date: |
Level of the active lava lake (m): |
Cumulative volume of lava effused (million cubic meters): |
| 7 Jul 2022 |
130 |
95 |
| 19 Jul 2022 |
133 |
98 |
| 4 Aug 2022 |
136 |
102 |
| 16 Aug 2022 |
137 |
104 |
| 12 Sep 2022 |
143 |
111 |
| 5 Oct 2022 |
143 |
111 |
| 28 Oct 2022 |
143 |
111 |
Activity during July 2022. Lava effusions were reported from the western vent in the Halema’uma’u crater, along with occasional weak ooze-outs along the margins of the crater floor. The height of the lava lake was variable due to deflation-inflation tilt events; for example, the lake level dropped approximately 3-4 m during a summit deflation-inflation event reported on 1 July. Webcam images taken during the night of 6-12 July showed intermittent low-level spattering at the western vent that rose less than 10 m above the vent (figure 519). Measurements made during an overflight on 7 July indicated that the crater floor was infilled about 130 m and that 95 million cubic meters of lava had been effused since 29 September 2021. A single, relatively small lava ooze-out was active to the S of the lava lake. Around midnight on 8 July there were two brief periods of lava overflow onto the lake margins. On 9 July lava ooze-outs were reported near the SE and NE edges of the crater floor and during 10-11 July they occurred near the E, NE, and NW edges. On 16 July crater incandescence was reported, though the ooze-outs and spattering were not visible. On 18 July overnight webcam images showed incandescence in the western vent complex and two ooze-outs were reported around 0000 and 0200 on 19 July. By 0900 there were active ooze-outs along the SW edge of the crater floor. Measurements made from an overflight on 19 July indicated that the crater floor was infilled about 133 m and 98 million cubic meters of lava had erupted since 29 September 2021 (figure 520). On 20 July around 1600 active ooze-outs were visible along the N edge of the crater, which continued through the next day. Extensive ooze-outs occurred along the W margin during 24 July until 1900; on 26 July minor ooze-outs were noted along the N margin. Minor spattering was visible on 29 July along the E margin of the lake. The sulfur dioxide emission rates ranged 650-2,800 tons per day (t/d), the higher of which was measured on 8 July (figure 519).
Activity during August 2022. The eruption continued in the Halema’uma’u crater at the western vent. According to HVO the lava in the active lake remained at the level of the bounding levees. Occasional minor ooze-outs were observed along the margins of the crater floor. Strong nighttime crater incandescence was visible after midnight on 6 August over the western vent cone. During 6-7 August scattered small lava lobes were active along the crater floor and incandescence persisted above the western vent through 9 August. During 7-9 August HVO reported a single lava effusion source was active along the NW margin of the crater floor. Measurements from an overflight on 4 August indicated that the crater floor was infilled about 136 m total and that 102 million cubic meters of lava had been erupted since the start of the eruption. Lava breakouts were reported along the N, NE, E, S, and W margins of the crater during 10-16 August. Another overflight survey conducted on 16 August indicated that the crater floor infilled about 137 m and 104 million cubic meters of lava had been erupted since September 2021. Measured sulfur dioxide emissions rates ranged 1,150-2,450 t/d, the higher of which occurred on 8 August.
Activity during September 2022. During September, lava effusion continued from the western vent into the active lava lake and onto the crater floor. Intermittent minor ooze-outs were reported through the month. A small ooze-out was visible on the W crater floor margin at 0220 on 2 September, which showed decreasing surface activity throughout the day, but remained active through 3 September. On 3 September around 1900 a lava outbreak occurred along the NW margin of the crater floor but had stopped by the evening of 4 September. Field crews monitoring the summit lava lake on 9 September observed spattering on the NE margin of the lake that rose no higher than 10 m, before falling back onto the lava lake crust (figure 521). Overflight measurements on 12 September indicated that the crater floor was infilled a total of 143 m and 111 million cubic meters of lava had been erupted since September 2021. Extensive breakouts in the W and N part of the crater floor were reported at 1600 on 20 September and continued into 26 September. The active part of the lava lake dropped by 10 m while other parts of the crater floor dropped by several meters. Summit tiltmeters recorded a summit seismic swarm of more than 80 earthquakes during 1500-1800 on 21 September, which occurred about 1.5 km below Halema’uma’u; a majority of these were less than Mw 2. By 22 September the active part of the lava lake was infilled about 2 m. On 23 September the western vent areas exhibited several small spatter cones with incandescent openings, along with weak, sporadic spattering (figure 522). The sulfur dioxide emission rate ranged from 930 t/d to 2,000 t/d, the higher of which was measured on 6 September.
Activity during October 2022. Activity during October declined slightly compared to previous months, though lava effusions persisted from the western vent into the active lava lake and onto the crater floor during October (figure 523). Slight variations in the lava lake were noted throughout the month. HVO reported that around 0600 on 3 October the level of the lava lake has lowered slightly. Overflight measurements taken on 5 October indicated that the crater floor was infilled a total of about 143 m and that 111 million cubic meters of lava had been effused since September 2021. During 6-7 October the lake gradually rose 0.5 m. Sulfur dioxide measurements made on 22 October had an emission rate of 700 t/d. Another overflight taken on 28 October showed that there was little to no change in the elevation of the crater floor: the crater floor was infilled a total of 143 m and 111 million cubic meters of lava had erupted since the start of the eruption.
Activity during November 2022. Activity remained low during November, though HVO reported that lava from the western vent continued to effuse into the active lava lake and onto the crater floor throughout the month. The rate of sulfur dioxide emissions during November ranged from 300-600 t/d, the higher amount of which occurred on 9 November.
Activity during December 2022. Similar low activity was reported during December, with lava effusing from the western vent into the active lava lake and onto the crater floor. During 4-5 December the active part of the lava lake was slightly variable in elevation and fluctuated within 1 m. On 9 December HVO reported that lava was no longer erupting from the western vent in the Halema’uma’u crater and that sulfur dioxide emissions had returned to near pre-eruption background levels; during 10-11 December, the lava lake had completely crusted over, and no incandescence was visible (figure 524). Time lapse camera images covering the 4-10 December showed that the crater floor showed weak deflation and no inflation. Some passive events of crustal overturning were reported during 14-15 December, which brought fresh incandescent lava to the lake surface. The sulfur dioxide emission rate was approximately 200 t/d on 14 December. A smaller overturn event on 17 December and another that occurred around 0000 and into the morning of 20 December were also detected. A small seismic swarm was later detected on 30 December.
Geologic Background. Kilauea overlaps the E flank of the massive Mauna Loa shield volcano in the island of Hawaii. Eruptions are prominent in Polynesian legends; written documentation since 1820 records frequent summit and flank lava flow eruptions interspersed with periods of long-term lava lake activity at Halemaumau crater in the summit caldera until 1924. The 3 x 5 km caldera was formed in several stages about 1,500 years ago and during the 18th century; eruptions have also originated from the lengthy East and Southwest rift zones, which extend to the ocean in both directions. About 90% of the surface of the basaltic shield volcano is formed of lava flows less than about 1,100 years old; 70% of the surface is younger than 600 years. The long-term eruption from the East rift zone between 1983 and 2018 produced lava flows covering more than 100 km2, destroyed hundreds of houses, and added new coastline.
Information Contacts: Hawaiian Volcano Observatory (HVO), U.S. Geological Survey, PO Box 51, Hawai'i National Park, HI 96718, USA (URL: http://hvo.wr.usgs.gov/).
Nyamulagira (DR Congo) — November 2023 Cite this Report
Nyamulagira
DR Congo
1.408°S, 29.2°E; summit elev. 3058 m
All times are local (unless otherwise noted)
Lava flows and thermal activity during May-October 2023
Nyamulagira (also known as Nyamuragira) is a shield volcano in the Democratic Republic of Congo with the summit truncated by a small 2 x 2.3 km caldera with walls up to about 100 m high. Documented eruptions have occurred within the summit caldera, as well as from numerous flank fissures and cinder cones. The current eruption period began in April 2018 and has more recently been characterized by summit crater lava flows and thermal activity (BGVN 48:05). This report describes lava flows and variable thermal activity during May through October 2023, based on information from the Observatoire Volcanologique de Goma (OVG) and various satellite data.
Lava lake activity continued during May. The MIROVA (Middle InfraRed Observation of Volcanic Activity) system recorded moderate-to-strong thermal activity throughout the reporting period; activity was more intense during May and October and relatively weaker from June through September (figure 95). The MODVOLC thermal algorithm, detected a total of 209 thermal alerts. There were 143 hotspots detected during May, eight during June, nine during September, and 49 during October. This activity was also reflected in infrared satellite images, where a lava flow was visible in the NW part of the crater on 7 May and strong activity was seen in the center of the crater on 4 October (figure 96). Another infrared satellite image taken on 12 May showed still active lava flows along the NW margin of the crater. According to OVG lava effusions were active during 7-29 May and moved to the N and NW parts of the crater beginning on 9 May. Strong summit crater incandescence was visible from Goma (27 km S) during the nights of 17, 19, and 20 May (figure 97). On 17 May there was an increase in eruptive activity, which peaked at 0100 on 20 May. Notable sulfur dioxide plumes drifted NW and W during 19-20 May (figure 98). Drone footage acquired in partnership with the USGS (United States Geological Survey) on 20 May captured images of narrow lava flows that traveled about 100 m down the W flank (figure 99). Data from the Rumangabo seismic station indicated a decreasing trend in activity during 17-21 May. Although weather clouds prevented clear views of the summit, a strong thermal signature on the NW flank was visible in an infrared satellite image on 22 May, based on an infrared satellite image. On 28 May the lava flows on the upper W flank began to cool and solidify. By 29 May seismicity returned to levels similar to those recorded before the 17 May increase. Lava effusion continued but was confined to the summit crater; periodic crater incandescence was observed.
Low-level activity was noted during June through October. On 1 June OVG reported that seismicity remained at lower levels and that crater incandescence had been absent for three days, though infrared satellite imagery showed continued lava effusion in the summit crater. The lava flows on the flanks covered an estimated 0.6 km2. Satellite imagery continued to show thermal activity confined to the lava lake through October (figure 96), although no lava flows or significant sulfur dioxide emissions were reported.
Geologic Background. Africa's most active volcano, Nyamulagira (also known as Nyamuragira), is a massive high-potassium basaltic shield about 25 km N of Lake Kivu and 13 km NNW of the steep-sided Nyiragongo volcano. The summit is truncated by a small 2 x 2.3 km caldera that has walls up to about 100 m high. Documented eruptions have occurred within the summit caldera, as well as from the numerous flank fissures and cinder cones. A lava lake in the summit crater, active since at least 1921, drained in 1938, at the time of a major flank eruption. Recent lava flows extend down the flanks more than 30 km from the summit as far as Lake Kivu; extensive lava flows from this volcano have covered 1,500 km2 of the western branch of the East African Rift.
Information Contacts: Observatoire Volcanologique de Goma (OVG), Departement de Geophysique, Centre de Recherche en Sciences Naturelles, Lwiro, D.S. Bukavu, DR Congo; Hawai'i Institute of Geophysics and Planetology (HIGP) - MODVOLC Thermal Alerts System, School of Ocean and Earth Science and Technology (SOEST), Univ. of Hawai'i, 2525 Correa Road, Honolulu, HI 96822, USA (URL: http://modis.higp.hawaii.edu/); MIROVA (Middle InfraRed Observation of Volcanic Activity), a collaborative project between the Universities of Turin and Florence (Italy) supported by the Centre for Volcanic Risk of the Italian Civil Protection Department (URL: http://www.mirovaweb.it/); NASA Global Sulfur Dioxide Monitoring Page, Atmospheric Chemistry and Dynamics Laboratory, NASA Goddard Space Flight Center (NASA/GSFC), 8800 Greenbelt Road, Goddard, Maryland, USA (URL: https://so2.gsfc.nasa.gov/); Copernicus Browser, Copernicus Data Space Ecosystem, European Space Agency (URL: https://dataspace.copernicus.eu/browser/); Charles Balagizi, Goma Volcano Observatory, Departement de Geophysique, Centre de Recherche en Sciences Naturelles, Lwiro, D.S. Bukavu, DR Congo.
Bagana (Papua New Guinea) — October 2023 Cite this Report
Bagana
Papua New Guinea
6.137°S, 155.196°E; summit elev. 1855 m
All times are local (unless otherwise noted)
Explosions, ash plumes, ashfall, and lava flows during April-September 2023
The remote volcano of Bagana is located in central Bougainville Island, Papua New Guinea. Recorded eruptions date back to 1842 and activity has consisted of effusive activity that has built a small lava dome in the summit crater and occasional explosions that produced pyroclastic flows. The most recent eruption has been ongoing since February 2000 and has produced occasional explosions, ash plumes, and lava flows. More recently, activity has been characterized by ongoing effusive activity and ash emissions (BGVN 48:04). This report updates activity from April through September 2023 that has consisted of explosions, ash plumes, ashfall, and lava flows, using information from the Darwin Volcanic Ash Advisory Center (VAAC) and satellite data.
An explosive eruption was reported on 7 July that generated a large gas-and-ash plume to high altitudes and caused significant ashfall in local communities; the eruption plume had reached upper tropospheric (16-18 km altitude) altitudes by 2200, according to satellite images. Sulfur dioxide plumes were detected in satellite images on 8 July and indicated that the plume was likely a mixture of gas, ice, and ash. A report issued by the Autonomous Bougainville Government (ABG) (Torokina District, Education Section) on 10 July noted that significant ash began falling during 2000-2100 on 7 July and covered most areas in the Vuakovi, Gotana (9 km SW), Koromaketo, Laruma (25 km W) and Atsilima (27 km NW) villages. Pyroclastic flows also occurred, according to ground-based reports; small deposits confined to one drainage were inspected by RVO during an overflight on 17 July and were confirmed to be from the 7 July event. Ashfall continued until 10 July and covered vegetation, which destroyed bushes and gardens and contaminated rivers and streams.
RVO reported another eruption on 14 July. The Darwin VAAC stated that an explosive event started around 0830 on 15 July and produced an ash plume that rose to 16.5 km altitude by 1000 and drifted N, according to satellite images. The plume continued to drift N and remained visible through 1900, and by 2150 it had dissipated.
Ashfall likely from both the 7 and 15 July events impacted about 8,111 people in Torokina (20 km SW), including Tsito/Vuakovi, Gotana, Koromaketo, Kenaia, Longkogari, Kenbaki, Piva (13 km SW), and Atsinima, and in the Tsitovi district, according to ABG. Significant ashfall was also reported in Ruruvu (22 km N) in the Wakunai District of Central Bougainville, though the thickness of these deposits could not be confirmed. An evacuation was called for the villages in Wakunai, where heavy ashfall had contaminated water sources; the communities of Ruruvu, Togarau, Kakarapaia, Karauturi, Atao, and Kuritaturi were asked to evacuate to a disaster center at the Wakunai District Station, and communities in Torokina were asked to evacuate to the Piva District station. According to a news article, more than 7,000 people needed temporary accommodations, with about 1,000 people in evacuation shelters. Ashfall had deposited over a broad area, contaminating water supplies, affecting crops, and collapsing some roofs and houses in rural areas. Schools were temporarily shut down. Intermittent ash emissions continued through the end of July and drifted NNW, NW, and SW. Fine ashfall was reported on the coast of Torokina, and ash plumes also drifted toward Laruma and Atsilima.
A small explosive eruption occurred at 2130 on 28 July that ejected material from the crater vents, according to reports from Torokina, in addition to a lava flow that contained two lobes. A second explosion was detected at 2157. Incandescence from the lava flow was visible from Piva as it descended the W flank around 2000 on 29 July (figure 47). The Darwin VAAC reported that a strong thermal anomaly was visible in satellite images during 30-31 July and that ash emissions rose to 2.4 km altitude and drifted WSW on 30 July. A ground report from RVO described localized emissions at 0900 on 31 July.
The Darwin VAAC reported that ash plumes were identified in satellite imagery at 0800 and 1220 on 12 August and rose to 2.1 km and 3 km altitude and drifted NW and W, respectively. A news report stated that aid was sent to more than 6,300 people that were adversely affected by the eruption. Photos taken during 17-19 August showed ash emissions rising no higher than 1 km above the summit and drifting SE. A small explosion generated an ash plume during the morning of 19 August. Deposits from small pyroclastic flows were also captured in the photos. Satellite images captured lava flows and pyroclastic flow deposits. Two temporary seismic stations were installed near Bagana on 17 August at distances of 7 km WSW (Vakovi station) and 11 km SW (Kepox station). The Kepox station immediately started to record continuous, low-frequency background seismicity.
Satellite data. Little to no thermal activity was detected during April through mid-July 2023; only one anomaly was recorded during early April and one during early June, according to MIROVA (Middle InfraRed Observation of Volcanic Activity) data (figure 48). Thermal activity increased in both power and frequency during mid-July through September, although there were still some short gaps in detected activity. MODVOLC also detected increased thermal activity during August; thermal hotspots were detected a total of five times on 19, 20, and 27 August. Weak thermal anomalies were also captured in infrared satellite images on clear weather days throughout the reporting period on 7, 12, and 17 April, 27 May, 1, 6, 16, and 31 July, and 19 September (figure 48); a strong thermal anomaly was visible on 31 July. Distinct sulfur dioxide plumes that drifted generally NW were intermittently captured by the TROPOMI instrument on the Sentinel-5P satellite and sometimes exceeded two Dobson Units (DUs) (figure 49).
Geologic Background. Bagana volcano, in a remote portion of central Bougainville Island, is frequently active. This massive symmetrical cone was largely constructed by an accumulation of viscous andesitic lava flows. The entire edifice could have been constructed in about 300 years at its present rate of lava production. Eruptive activity is characterized by non-explosive effusion of viscous lava that maintains a small lava dome in the summit crater, although occasional explosive activity produces pyroclastic flows. Lava flows with tongue-shaped lobes up to 50 m thick and prominent levees descend the flanks on all sides.
Information Contacts: Rabaul Volcano Observatory (RVO), Geohazards Management Division, Department of Mineral Policy and Geohazards Management (DMPGM), PO Box 3386, Kokopo, East New Britain Province, Papua New Guinea; Darwin Volcanic Ash Advisory Centre (VAAC), Bureau of Meteorology, Northern Territory Regional Office, PO Box 40050, Casuarina, NT 0811, Australia (URL: http://www.bom.gov.au/info/vaac/); MIROVA (Middle InfraRed Observation of Volcanic Activity), a collaborative project between the Universities of Turin and Florence (Italy) supported by the Centre for Volcanic Risk of the Italian Civil Protection Department (URL: http://www.mirovaweb.it/); Hawai'i Institute of Geophysics and Planetology (HIGP) - MODVOLC Thermal Alerts System, School of Ocean and Earth Science and Technology (SOEST), Univ. of Hawai'i, 2525 Correa Road, Honolulu, HI 96822, USA (URL: http://modis.higp.hawaii.edu/); NASA Global Sulfur Dioxide Monitoring Page, Atmospheric Chemistry and Dynamics Laboratory, NASA Goddard Space Flight Center (NASA/GSFC), 8800 Greenbelt Road, Goddard, Maryland, USA (URL: https://so2.gsfc.nasa.gov/); Copernicus Browser, Copernicus Data Space Ecosystem, European Space Agency (URL: https://dataspace.copernicus.eu/browser/); Autonomous Bougainville Government, P.O Box 322, Buka, AROB, PNG (URL: https://abg.gov.pg/); Andrew Tupper (Twitter: @andrewcraigtupp); Simon Carn, Geological and Mining Engineering and Sciences, Michigan Technological University, 1400 Townsend Drive, Houghton, MI 49931, USA (URL: http://www.volcarno.com/, Twitter: @simoncarn); Radio NZ (URL: https://www.rnz.co.nz/news/pacific/494464/more-than-7-000-people-in-bougainville-need-temporary-accommodation-after-eruption); USAID, 1300 Pennsylvania Ave, NW, Washington DC 20004, USA (URL: https://www.usaid.gov/pacific-islands/press-releases/aug-08-2023-united-states-provides-immediate-emergency-assistance-support-communities-affected-mount-bagana-volcanic-eruptions).
Mayon (Philippines) — October 2023 Cite this Report
Mayon
Philippines
13.257°N, 123.685°E; summit elev. 2462 m
All times are local (unless otherwise noted)
Lava flows, pyroclastic flows, ash emissions, and seismicity during April-September 2023
Mayon is located in the Philippines and has steep upper slopes capped by a small summit crater. Historical eruptions date back to 1616 CE that have been characterized by Strombolian eruptions, lava flows, pyroclastic flows, and mudflows. Eruptions mostly originated from a central conduit. Pyroclastic flows and mudflows have commonly descended many of the approximately 40 drainages that surround the volcano. The most recent eruption occurred during June through October 2022 and consisted of lava dome growth and gas-and-steam emissions (BGVN 47:12). A new eruption was reported during late April 2023 and has included lava flows, pyroclastic density currents, ash emissions, and seismicity. This report covers activity during April through September 2023 based on daily bulletins from the Philippine Institute of Volcanology and Seismology (PHIVOLCS).
During April through September 2023, PHIVOLCS reported near-daily rockfall events, frequent volcanic earthquakes, and sulfur dioxide measurements. Gas-and-steam emissions rose 100-900 m above the crater and drifted in different directions. Nighttime crater incandescence was often visible during clear weather and was accompanied by incandescent avalanches of material. Activity notably increased during June when lava flows were reported on the S, SE, and E flanks (figure 52). The MIROVA graph (Middle InfraRed Observation of Volcanic Activity) showed strong thermal activity coincident with these lava flows, which remained active through September (figure 53). According to the MODVOLC thermal algorithm, a total of 110 thermal alerts were detected during the reporting period: 17 during June, 40 during July, 27 during August, and 26 during September. During early June, pyroclastic density currents (PDCs) started to occur more frequently.
Low activity was reported during much of April and May; gas-and-steam emissions rose 100-900 m above the crater and generally drifted in different directions. A total of 52 rockfall events and 18 volcanic earthquakes were detected during April and 147 rockfall events and 13 volcanic events during May. Sulfur dioxide flux measurements ranged between 400-576 tons per day (t/d) during April, the latter of which was measured on 29 April and between 162-343 t/d during May, the latter of which was measured on 13 May.
Activity during June increased, characterized by lava flows, pyroclastic density currents (PDCs), crater incandescence and incandescent rockfall events, gas-and-steam emissions, and continued seismicity. Weather clouds often prevented clear views of the summit, but during clear days, moderate gas-and-steam emissions rose 100-2,500 m above the crater and drifted in multiple directions. A total of 6,237 rockfall events and 288 volcanic earthquakes were detected. The rockfall events often deposited material on the S and SE flanks within 700-1,500 m of the summit crater and ash from the events drifted SW, S, SE, NE, and E. Sulfur dioxide emissions ranged between 149-1,205 t/d, the latter of which was measured on 10 June. Short-term observations from EDM and electronic tiltmeter monitoring indicated that the upper slopes were inflating since February 2023. Longer-term ground deformation parameters based on EDM, precise leveling, continuous GPS, and electronic tilt monitoring indicated that the volcano remained inflated, especially on the NW and SE flanks. At 1000 on 5 June the Volcano Alert Level (VAL) was raised to 2 (on a 0-5 scale). PHIVOLCS noted that although low-level volcanic earthquakes, ground deformation, and volcanic gas emissions indicated unrest, the steep increase in rockfall frequency may indicate increased dome activity.
A total of 151 dome-collapse PDCs occurred during 8-9 and 11-30 June, traveled 500-2,000 m, and deposited material on the S flank within 2 km of the summit crater. During 8-9 June the VAL was raised to 3. At approximately 1947 on 11 June lava flow activity was reported; two lobes traveled within 500 m from the crater and deposited material on the S (Mi-isi), SE (Bonga), and E (Basud) flanks. Weak seismicity accompanied the lava flow and slight inflation on the upper flanks. This lava flow remained active through 30 June, moving down the S and SE flank as far as 2.5 km and 1.8 km, respectively and depositing material up to 3.3 km from the crater. During 15-16 June traces of ashfall from the PDCs were reported in Sitio Buga, Nabonton, City of Ligao and Purok, and San Francisco, Municipality of Guinobatan. During 28-29 June there were two PDCs generated by the collapse of the lava flow front, which generated a light-brown ash plume 1 km high. Satellite monitors detected significant concentrations of sulfur dioxide beginning on 29 June. On 30 June PDCs primarily affected the Basud Gully on the E flank, the largest of which occurred at 1301 and lasted eight minutes, based on the seismic record. Four PDCs generated between 1800 and 2000 that lasted approximately four minutes each traveled 3-4 km on the E flank and generated an ash plume that rose 1 km above the crater and drifted N and NW. Ashfall was recorded in Tabaco City.
Similar strong activity continued during July; slow lava effusion remained active on the S and SE flanks and traveled as far as 2.8 km and 2.8 km, respectively and material was deposited as far as 4 km from the crater. There was a total of 6,983 rockfall events and 189 PDCs that affected the S, SE, and E flanks. The volcano network detected a total of 2,124 volcanic earthquakes. Continuous gas-and-steam emissions rose 200-2,000 m above the crater and drifted in multiple directions. Sulfur dioxide emissions averaged 792-4,113 t/d, the latter of which was measured on 28 July. During 2-4 July three PDCs were generated from the collapse of the lava flow and resulting light brown plumes rose 200-300 m above the crater. Continuous tremor pulses were reported beginning at 1547 on 3 July through 7 July at 1200, at 2300 on 8 July and going through 0300 on 10 July, and at 2300 on 16 July, as recorded by the seismic network. During 6-9 July there were 10 lava flow-collapse-related PDCs that generated light brown plumes 300-500 m above the crater. During 10-11 July light ashfall was reported in some areas of Mabinit, Legazpi City, Budiao and Salvacion, Daraga, and Camalig, Albay. By 18 July the lava flow advanced 600 m on the E flank as well.
During 1733 on 18 July and 0434 on 19 July PHIVOLCS reported 30 “ashing” events, which are degassing events accompanied by audible thunder-like sounds and entrained ash at the crater, which produced short, dark plumes that drifted SW. These events each lasted 20-40 seconds, and plume heights ranged from 150-300 m above the crater, as recorded by seismic, infrasound, visual, and thermal monitors. Three more ashing events occurred during 19-20 July. Short-term observations from electronic tilt and GPS monitoring indicate deflation on the E lower flanks in early July and inflation on the NW middle flanks during the third week of July. Longer-term ground deformation parameters from EDM, precise leveling, continuous GPS, and electronic tilt monitoring indicated that the volcano was still generally inflated relative to baseline levels. A short-lived lava pulse lasted 28 seconds at 1956 on 21 July, which was accompanied by seismic and infrasound signals. By 22 July, the only lava flow that remained active was on the SE flank, and continued to extend 3.4 km, while those on the S and E flanks weakened markedly. One ashing event was detected during 30-31 July, whereas there were 57 detected during 31 July-1 August; according to PHIVOLCS beginning at approximately 1800 on 31 July eruptive activity was dominated by phases of intermittent ashing, as well as increased in the apparent rates of lava effusion from the summit crater. The ashing phases consisted of discrete events recorded as low-frequency volcanic earthquakes (LFVQ) typically 30 seconds in duration, based on seismic and infrasound signals. Gray ash plume rose 100 m above the crater and generally drifted NE. Shortly after these ashing events began, new lava began to effuse rapidly from the crater, feeding the established flowed on the SE, E, and E flanks and generating frequent rockfall events.
Intensified unrest persisted during August. There was a total of 4,141 rockfall events, 2,881 volcanic earthquakes, which included volcanic tremor events, 32 ashing events, and 101 PDCs detected throughout the month. On clear weather days, gas-and-steam emissions rose 300-1,500 m above the crater and drifted in different directions (figure 54). Sulfur dioxide emissions averaged 735-4,756 t/d, the higher value of which was measured on 16 August. During 1-2 August the rate of lava effusion decreased, but continued to feed the flows on the SE, S, and E flanks, maintaining their advances to 3.4 km, 2.8 km, and 1.1 km from the crater, respectively (figure 55). Rockfall and PDCs generated by collapses at the lava flow margins and from the summit dome deposited material within 4 km of the crater. During 3-4 August there were 10 tremor events detected that lasted 1-4 minutes. Short-lived lava pulse lasted 35 seconds and was accompanied by seismic and infrasound signals at 0442 on 6 August. Seven collapses were recorded at the front of the lava flow during 12-14 August.
During September, similar activity of slow lava effusion, PDCs, gas-and-steam emissions, and seismicity continued. There was a total of 4,452 rockfall events, 329 volcanic earthquakes, which included volcanic tremor events, two ashing events, and 85 PDCs recorded throughout the month. On clear weather days, gas-and-steam emissions rose 100-1,500 m above the crater and drifted in multiple directions. Sulfur dioxide emissions averaged 609-2,252 t/d, the higher average of which was measured on 6 September. Slow lava effusion continued advancing on the SE, S, and E flanks, maintaining lengths of 3.4 km, 2.8 km, and 1.1 km, respectively. Rockfall and PDC events generated by collapses along the lava flow margins and at the summit dome deposited material within 4 km of the crater.
Geologic Background. Symmetrical Mayon, which rises above the Albay Gulf NW of Legazpi City, is the most active volcano of the Philippines. The steep upper slopes are capped by a small summit crater. Recorded eruptions since 1616 CE range from Strombolian to basaltic Plinian, with cyclical activity beginning with basaltic eruptions, followed by longer periods of andesitic lava flows. Eruptions occur predominately from the central conduit and have also produced lava flows that travel far down the flanks. Pyroclastic density currents and mudflows have commonly swept down many of the approximately 40 ravines that radiate from the summit and have often damaged populated lowland areas. A violent eruption in 1814 killed more than 1,200 people and devastated several towns.
Information Contacts: Philippine Institute of Volcanology and Seismology (PHIVOLCS), Department of Science and Technology, University of the Philippines Campus, Diliman, Quezon City, Philippines (URL: http://www.phivolcs.dost.gov.ph/); MIROVA (Middle InfraRed Observation of Volcanic Activity), a collaborative project between the Universities of Turin and Florence (Italy) supported by the Centre for Volcanic Risk of the Italian Civil Protection Department (URL: http://www.mirovaweb.it/); Hawai'i Institute of Geophysics and Planetology (HIGP) - MODVOLC Thermal Alerts System, School of Ocean and Earth Science and Technology (SOEST), Univ. of Hawai'i, 2525 Correa Road, Honolulu, HI 96822, USA (URL: http://modis.higp.hawaii.edu/); Copernicus Browser, Copernicus Data Space Ecosystem, European Space Agency (URL: https://dataspace.copernicus.eu/browser/); William Rogers, Legazpi City, Albay Province, Philippines.
Nishinoshima (Japan) — October 2023 Cite this Report
Nishinoshima
Japan
27.247°N, 140.874°E; summit elev. 100 m
All times are local (unless otherwise noted)
Eruption plumes and gas-and-steam plumes during May-August 2023
Nishinoshima, located about 1,000 km S of Tokyo, is a small island in the Ogasawara Arc in Japan. The island is the summit of a massive submarine volcano that has prominent submarine peaks to the S, W, and NE. Eruptions date back to 1973 and the current eruption period began in October 2022. Recent activity has consisted of small ash plumes and fumarolic activity (BGVN 48:07). This report covers activity during May through August 2023, using information from monthly reports of the Japan Meteorological Agency (JMA) monthly reports and satellite data.
Activity during May through June was relatively low. The Japan Coast Guard (JCG) did overflights on 14 and 22 June and reported white gas-and-steam emissions rising 600 m and 1,200 m from the central crater of the pyroclastic cone, respectively (figure 125). In addition, multiple white gas-and-steam emissions rose from the inner rim of the W side of the crater and from the SE flank of the pyroclastic cone. Discolored brown-to-green water was observed around almost the entire perimeter of the island; on 22 June light green discolored water was observed off the S coast of the island.
Observations from the Himawari meteorological satellite confirmed an eruption on 9 and 10 July. An eruption plume rose 1.6 km above the crater and drifted N around 1300 on 9 July. Satellite images acquired at 1420 and 2020 on 9 July and at 0220 on 10 July showed continuing emissions that rose 1.3-1.6 km above the crater and drifted NE and N. The Tokyo VAAC reported that an ash plume seen by a pilot and identified in a satellite image at 0630 on 21 July rose to 3 km altitude and drifted S.
Aerial observations conducted by JCG on 8 August showed a white-and-gray plume rising from the central crater of the pyroclastic cone, and multiple white gas-and-steam emissions were rising from the inner edge of the western crater and along the NW-SE flanks of the island (figure 126). Brown-to-green discolored water was also noted around the perimeter of the island.
Intermittent low-to-moderate power thermal anomalies were recorded in the MIROVA graph (Middle InfraRed Observation of Volcanic Activity), showing an increase in both frequency and power beginning in July (figure 127). This increase in activity coincides with eruptive activity on 9 and 10 July, characterized by eruption plumes. According to the MODVOLC thermal alert algorithm, one thermal hotspot was recorded on 20 July. Weak thermal anomalies were also detected in infrared satellite imagery, accompanied by strong gas-and-steam plumes (figure 128).
Geologic Background. The small island of Nishinoshima was enlarged when several new islands coalesced during an eruption in 1973-74. Multiple eruptions that began in 2013 completely covered the previous exposed surface and continued to enlarge the island. The island is the summit of a massive submarine volcano that has prominent peaks to the S, W, and NE. The summit of the southern cone rises to within 214 m of the ocean surface 9 km SSE.
Information Contacts: Japan Meteorological Agency (JMA), 1-3-4 Otemachi, Chiyoda-ku, Tokyo 100-8122, Japan (URL: http://www.jma.go.jp/jma/indexe.html); Tokyo Volcanic Ash Advisory Center (VAAC), 1-3-4 Otemachi, Chiyoda-ku, Tokyo 100-8122, Japan (URL: http://ds.data.jma.go.jp/svd/vaac/data/); MIROVA (Middle InfraRed Observation of Volcanic Activity), a collaborative project between the Universities of Turin and Florence (Italy) supported by the Centre for Volcanic Risk of the Italian Civil Protection Department (URL: http://www.mirovaweb.it/); Copernicus Browser, Copernicus Data Space Ecosystem, European Space Agency (URL: https://dataspace.copernicus.eu/browser/).
Krakatau (Indonesia) — October 2023 Cite this Report
Krakatau
Indonesia
6.1009°S, 105.4233°E; summit elev. 285 m
All times are local (unless otherwise noted)
White gas-and-steam plumes and occasional ash plumes during May-August 2023
Krakatau is located in the Sunda Strait between Java and Sumatra, Indonesia. Caldera collapse during the catastrophic 1883 eruption destroyed Danan and Perbuwatan cones and left only a remnant of Rakata. The post-collapse cone of Anak Krakatau (Child of Krakatau) was constructed within the 1883 caldera at a point between the former Danan and Perbuwatan cones; it has been the site of frequent eruptions since 1927. The current eruption period began in May 2021 and has recently consisted of Strombolian eruptions and ash plumes (BGVN 48:07). This report describes lower levels of activity consisting of ash and white gas-and-steam plumes during May through August 2023, based on information provided by the Indonesian Center for Volcanology and Geological Hazard Mitigation, referred to as Pusat Vulkanologi dan Mitigasi Bencana Geologi (PVMBG), MAGMA Indonesia, and satellite data.
Activity was relatively low during May and June. Daily white gas-and-steam emissions rose 25-200 m above the crater and drifted in different directions. Five ash plumes were detected at 0519 on 10 May, 1241 on 11 May, 0920 on 12 May, 2320 on 12 May, and at 0710 on 13 May, and rose 1-2.5 km above the crater and drifted SW. A webcam image taken on 12 May showed ejection of incandescent material above the vent. A total of nine ash plumes were detected during 6-11 June: at 1434 and 00220 on 6 and 7 June the ash plumes rose 500 m above the crater and drifted NW, at 1537 on 8 June the ash plume rose 1 km above the crater and drifted SW, at 0746 and at 0846 on 9 June the ash plumes rose 800 m and 3 km above the crater and drifted SW, respectively, at 0423, 1431, and 1750 on 10 June the ash plumes rose 2 km, 1.5 km, and 3.5 km above the crater and drifted NW, respectively, and at 0030 on 11 June an ash plume rose 2 km above the crater and drifted NW. Webcam images taken on 10 and 11 June at 0455 and 0102, respectively, showed incandescent material ejected above the vent. On 19 June an ash plume at 0822 rose 1.5 km above the crater and drifted SE.
Similar low activity of white gas-and-steam emissions and few ash plumes were reported during July and August. Daily white gas-and-steam emissions rose 25-300 m above the crater and drifted in multiple directions. Three ash plumes were reported at 0843, 0851, and 0852 on 20 July that rose 500-2,000 m above the crater and drifted NW.
The MIROVA (Middle InfraRed Observation of Volcanic Activity) graph of MODIS thermal anomaly data showed intermittent low-to-moderate power thermal anomalies during May through August 2023 (figure 140). Although activity was often obscured by weather clouds, a thermal anomaly was visible in an infrared satellite image of the crater on 12 May, accompanied by an eruption plume that drifted SW (figure 141).
Geologic Background. The renowned Krakatau (frequently mis-named as Krakatoa) volcano lies in the Sunda Strait between Java and Sumatra. Collapse of an older edifice, perhaps in 416 or 535 CE, formed a 7-km-wide caldera. Remnants of that volcano are preserved in Verlaten and Lang Islands; subsequently the Rakata, Danan, and Perbuwatan cones were formed, coalescing to create the pre-1883 Krakatau Island. Caldera collapse during the catastrophic 1883 eruption destroyed Danan and Perbuwatan, and left only a remnant of Rakata. This eruption caused more than 36,000 fatalities, most as a result of tsunamis that swept the adjacent coastlines of Sumatra and Java. Pyroclastic surges traveled 40 km across the Sunda Strait and reached the Sumatra coast. After a quiescence of less than a half century, the post-collapse cone of Anak Krakatau (Child of Krakatau) was constructed within the 1883 caldera at a point between the former Danan and Perbuwatan cones. Anak Krakatau has been the site of frequent eruptions since 1927.
Information Contacts: Pusat Vulkanologi dan Mitigasi Bencana Geologi (PVMBG, also known as Indonesian Center for Volcanology and Geological Hazard Mitigation, CVGHM), Jalan Diponegoro 57, Bandung 40122, Indonesia (URL: http://www.vsi.esdm.go.id/); MAGMA Indonesia, Kementerian Energi dan Sumber Daya Mineral (URL: https://magma.esdm.go.id/v1); MIROVA (Middle InfraRed Observation of Volcanic Activity), a collaborative project between the Universities of Turin and Florence (Italy) supported by the Centre for Volcanic Risk of the Italian Civil Protection Department (URL: http://www.mirovaweb.it/); Copernicus Browser, Copernicus Data Space Ecosystem, European Space Agency (URL: https://dataspace.copernicus.eu/browser/).
Villarrica (Chile) — October 2023 Cite this Report
Villarrica
Chile
39.42°S, 71.93°W; summit elev. 2847 m
All times are local (unless otherwise noted)
Strombolian activity, gas-and-ash emissions, and crater incandescence during April-September 2023
Villarrica, in central Chile, consists of a 2-km-wide caldera that formed about 3,500 years ago and is located at the base of the presently active cone at the NW margin of a 6-km-wide caldera. Historical eruptions eruptions date back to 1558 and have been characterized by mild-to-moderate explosive activity with occasional lava effusions. The current eruption period began in December 2014 and has recently consisted of nighttime crater incandescence, ash emissions, and seismicity (BGVN 48:04). This report covers activity during April through September 2023 and describes occasional Strombolian activity, gas-and-ash emissions, and nighttime crater incandescence. Information for this report primarily comes from the Southern Andes Volcano Observatory (Observatorio Volcanológico de Los Andes del Sur, OVDAS), part of Chile's National Service of Geology and Mining (Servicio Nacional de Geología y Minería, SERNAGEOMIN) and satellite data.
Seismicity during April consisted of long period (LP) events and tremor (TRE); a total of 9,413 LP-type events and 759 TR-type events were detected throughout the month. Nighttime crater incandescence persisted and was visible in the degassing column. Sulfur dioxide data was obtained using Differential Absorption Optical Spectroscopy Equipment (DOAS) that showed an average value of 1,450 ± 198 tons per day (t/d) during 1-15 April and 1,129 ± 201 t/d during 16-30 April, with a maximum daily value of 2,784 t/d on 9 April. Gas-and-steam emissions of variable intensities rose above the active crater as high as 1.3 km above the crater on 13 April. Strombolian explosions were not observed and there was a slight decrease in the lava lake level.
There were 14,123 LP-type events and 727 TR-type events detected during May. According to sulfur dioxide measurements taken with DOAS equipment, the active crater emitted an average value of 1,826 ± 482 t/d during 1-15 May and 912 ± 41 t/d during 16-30 May, with a daily maximum value of 5,155 t/d on 13 May. Surveillance cameras showed continuous white gas-and-steam emissions that rose as high as 430 m above the crater on 27 May. Nighttime incandescence illuminated the gas column less than 300 m above the crater rim was and no pyroclastic emissions were reported. A landslide was identified on 13 May on the E flank of the volcano 50 m from the crater rim and extending 300 m away; SERNAGEOMIN noted that this event may have occurred on 12 May. During the morning of 27 and 28 May minor Strombolian explosions characterized by incandescent ejecta were recorded at the crater rim; the last reported Strombolian explosions had occurred at the end of March.
Seismic activity during June consisted of five volcano-tectonic (VT)-type events, 21,606 LP-type events, and 2,085 TR-type events. The average value of sulfur dioxide flux obtained by DOAS equipment was 1,420 ± 217 t/d during 1-15 June and 2,562 ± 804 t/d, with a maximum daily value of 4,810 t/d on 17 June. White gas-and-steam emissions rose less than 480 m above the crater; frequent nighttime crater incandescence was reflected in the degassing plume. On 12 June an emission rose 100 m above the crater and drifted NNW. On 15 June one or several emissions resulted in ashfall to the NE as far as 5.5 km from the crater, based on a Skysat satellite image. Several Strombolian explosions occurred within the crater; activity on 15 June was higher energy and ejected blocks 200-300 m on the NE slope. Surveillance cameras showed white gas-and-steam emissions rising 480 m above the crater on 16 June. On 19 and 24 June low-intensity Strombolian activity was observed, ejecting material as far as 200 m from the center of the crater to the E.
During July, seismicity included 29,319 LP-type events, 3,736 TR-type events, and two VT-type events. DOAS equipment recorded two days of sulfur dioxide emissions of 4,220 t/d and 1,009 t/d on 1 and 13 July, respectively. Constant nighttime incandescence was also recorded and was particularly noticeable when accompanied by eruptive columns on 12 and 16 July. Minor explosive events were detected in the crater. According to Skysat satellite images taken on 12, 13, and 16 July, ashfall deposits were identified 155 m S of the crater. According to POVI, incandescence was visible from two vents on the crater floor around 0336 on 12 July. Gas-and-ash emissions rose as high as 1.2 km above the crater on 13 July and drifted E and NW. A series of gas-and-steam pulses containing some ash deposited material on the upper E flank around 1551 on 13 July. During 16-31 July, average sulfur dioxide emissions of 1,679 ± 406 t/d were recorded, with a maximum daily value of 2,343 t/d on 28 July. Fine ash emissions were also reported on 16, 17, and 23 July.
Seismicity persisted during August, characterized by 27,011 LP-type events, 3,323 TR-type events, and three VT-type events. The average value of sulfur dioxide measurements taken during 1-15 August was 1,642 ± 270 t/d and 2,207 ± 4,549 t/d during 16-31 August, with a maximum daily value of 3,294 t/d on 27 August. Nighttime crater incandescence remained visible in degassing columns. White gas-and-steam emissions rose 480 m above the crater on 6 August. According to a Skysat satellite image from 6 August, ash accumulation was observed proximal to the crater and was mainly distributed toward the E slope. White gas-and-steam emissions rose 320 m above the crater on 26 August. Nighttime incandescence and Strombolian activity that generated ash emissions were reported on 27 August.
Seismicity during September was characterized by five VT-type events, 12,057 LP-type events, and 2,058 TR-type events. Nighttime incandescence persisted. On 2 September an ash emission rose 180 m above the crater and drifted SE at 1643 (figure 125) and a white gas-and-steam plume rose 320 m above the crater. According to the Buenos Aires VAAC, periods of continuous gas-and-ash emissions were visible in webcam images from 1830 on 2 September to 0110 on 3 September. Strombolian activity was observed on 2 September and during the early morning of 3 September, the latter event of which generated an ash emission that rose 60 m above the crater and drifted 100 m from the center of the crater to the NE and SW. Ashfall was reported to the SE and S as far as 750 m from the crater. The lava lake was active during 3-4 September and lava fountaining was visible for the first time since 26 March 2023, according to POVI. Fountains captured in webcam images at 2133 on 3 September and at 0054 on 4 September rose as high as 60 m above the crater rim and ejected material onto the upper W flank. Sulfur dioxide flux of 1,730 t/d and 1,281 t/d was measured on 3 and 4 September, respectively, according to data obtained by DOAS equipment.
Strong Strombolian activity and larger gas-and-ash plumes were reported during 18-20 September. On 18 September activity was also associated with energetic LP-type events and notable sulfur dioxide fluxes (as high as 4,277 t/d). On 19 September Strombolian activity and incandescence were observed. On 20 September at 0914 ash emissions rose 50 m above the crater and drifted SSE, accompanied by Strombolian activity that ejected material less than 100 m SSE, causing fall deposits on that respective flank. SERNAGEOMIN reported that a Planet Scope satellite image taken on 20 September showed the lava lake in the crater, measuring 32 m x 35 m and an area of 0.001 km2. Several ash emissions were recorded at 0841, 0910, 1251, 1306, 1312, 1315, and 1324 on 23 September and rose less than 150 m above the crater. The sulfur dioxide flux value was 698 t/d on 23 September and 1,097 t/d on 24 September. On 24 September the Volcanic Alert Level (VAL) was raised to Orange (the third level on a four-color scale). SENAPRED maintained the Alert Level at Yellow (the middle level on a three-color scale) for the communities of Villarrica, Pucón (16 km N), Curarrehue, and Panguipulli.
During 24-25 September there was an increase in seismic energy (observed at TR-events) and acoustic signals, characterized by 1 VT-type event, 213 LP-type events, and 124 TR-type events. Mainly white gas-and-steam emissions, in addition to occasional fine ash emissions were recorded. During the early morning of 25 September Strombolian explosions were reported and ejected material 250 m in all directions, though dominantly toward the NW. On 25 September the average value of sulfur dioxide flux was 760 t/d. Seismicity during 25-30 September consisted of five VT-type events, 1,937 LP-type events, and 456 TR-type events.
During 25-29 September moderate Strombolian activity was observed and ejected material as far as the crater rim. In addition, ash pulses lasting roughly 50 minutes were observed around 0700 and dispersed ENE. During 26-27 September a TR episode lasted 6.5 hours and was accompanied by discrete acoustic signals. Satellite images from 26 September showed a spatter cone on the crater floor with one vent that measured 10 x 14 m and a smaller vent about 35 m NE of the cone. SERNAGEOMIN reported an abundant number of bomb-sized blocks up to 150 m from the crater, as well as impact marks on the snow, which indicated explosive activity. A low-altitude ash emission was observed drifting NW around 1140 on 28 September, based on webcam images. Between 0620 and 0850 on 29 September an ash emission rose 60 m above the crater and drifted NW. During an overflight taken around 1000 on 29 September scientists observed molten material in the vent, a large accumulation of pyroclasts inside the crater, and energetic degassing, some of which contained a small amount of ash. Block-sized pyroclasts were deposited on the internal walls and near the crater, and a distal ash deposit was also visible. The average sulfur dioxide flux measured on 28 September was 344 t/d. Satellite images taken on 29 September ashfall was deposited roughly 3 km WNW from the crater and nighttime crater incandescence remained visible. The average sulfur dioxide flux value from 29 September was 199 t/d. On 30 September at 0740 a pulsating ash emission rose 1.1 km above the crater and drifted NNW (figure 126). Deposits on the S flank extended as far as 4.5 km from the crater rim, based on satellite images from 30 September.
Infrared MODIS satellite data processed by MIROVA (Middle InfraRed Observation of Volcanic Activity) showed intermittent thermal activity during April through September, with slightly stronger activity detected during late September (figure 127). Small clusters of thermal activity were detected during mid-June, early July, early August, and late September. According to the MODVOLC thermal alert system, a total of four thermal hotspots were detected on 7 July and 3 and 23 September. This activity was also intermittently captured in infrared satellite imagery on clear weather days (figure 128).
Geologic Background. The glacier-covered Villarrica stratovolcano, in the northern Lakes District of central Chile, is ~15 km south of the city of Pucon. A 2-km-wide caldera that formed about 3,500 years ago is located at the base of the presently active, dominantly basaltic to basaltic andesite cone at the NW margin of a 6-km-wide Pleistocene caldera. More than 30 scoria cones and fissure vents are present on the flanks. Plinian eruptions and pyroclastic flows that have extended up to 20 km from the volcano were produced during the Holocene. Lava flows up to 18 km long have issued from summit and flank vents. Eruptions documented since 1558 CE have consisted largely of mild-to-moderate explosive activity with occasional lava effusion. Glaciers cover 40 km2 of the volcano, and lahars have damaged towns on its flanks.
Information Contacts: Servicio Nacional de Geología y Minería (SERNAGEOMIN), Observatorio Volcanológico de Los Andes del Sur (OVDAS), Avda Sta María No. 0104, Santiago, Chile (URL: http://www.sernageomin.cl/); Proyecto Observación Villarrica Internet (POVI) (URL: http://www.povi.cl/); Sistema y Servicio Nacional de Prevención y Repuesta Ante Desastres (SENAPRED), Av. Beauchef 1671, Santiago, Chile (URL: https://web.senapred.cl/); Buenos Aires Volcanic Ash Advisory Center (VAAC), Servicio Meteorológico Nacional-Fuerza Aérea Argentina, 25 de mayo 658, Buenos Aires, Argentina (URL: http://www.smn.gov.ar/vaac/buenosaires/inicio.php); MIROVA (Middle InfraRed Observation of Volcanic Activity), a collaborative project between the Universities of Turin and Florence (Italy) supported by the Centre for Volcanic Risk of the Italian Civil Protection Department (URL: http://www.mirovaweb.it/); Hawai'i Institute of Geophysics and Planetology (HIGP) - MODVOLC Thermal Alerts System, School of Ocean and Earth Science and Technology (SOEST), Univ. of Hawai'i, 2525 Correa Road, Honolulu, HI 96822, USA (URL: http://modis.higp.hawaii.edu/); Copernicus Browser, Copernicus Data Space Ecosystem, European Space Agency (URL: https://dataspace.copernicus.eu/browser/).
Merapi (Indonesia) — October 2023 Cite this Report
Merapi
Indonesia
7.54°S, 110.446°E; summit elev. 2910 m
All times are local (unless otherwise noted)
Frequent incandescent avalanches during April-September 2023
Merapi, located just north of the major city of Yogyakarta in central Java, Indonesia, has had activity within the last 20 years characterized by pyroclastic flows and lahars accompanying growth and collapse of the steep-sided active summit lava dome. The current eruption period began in late December 2020 and has more recently consisted of ash plumes, intermittent incandescent avalanches of material, and pyroclastic flows (BGVN 48:04). This report covers activity during April through September 2023, based on information from Balai Penyelidikan dan Pengembangan Teknologi Kebencanaan Geologi (BPPTKG), the Center for Research and Development of Geological Disaster Technology, a branch of PVMBG which specifically monitors Merapi. Additional information comes from the Pusat Vulkanologi dan Mitigasi Bencana Geologi (PVMBG, also known as Indonesian Center for Volcanology and Geological Hazard Mitigation, CVGHM), MAGMA Indonesia, the Darwin Volcanic Ash Advisory Centre (VAAC), and various satellite data.
Activity during April through September 2023 primarily consisted of incandescent avalanches of material that mainly affected the SW and W flanks and traveled as far as 2.3 km from the summit (table 25) and white gas-and-steam emissions that rose 10-1,000 m above the crater.
Table 25. Monthly summary of avalanches and avalanche distances recorded at Merapi during April through September 2023. The number of reported avalanches does not include instances where possible avalanches were heard but could not be visually confirmed as a result of inclement weather. Data courtesy of BPPTKG (April-September 2023 daily reports).
| Month |
Average number of avalanches per day |
Distance avalanches traveled (m) |
| Apr 2023 |
19 |
1,200-2,000 |
| May 2023 |
22 |
500-2,000 |
| Jun 2023 |
18 |
1,200-2,000 |
| Jul 2023 |
30 |
300-2,000 |
| Aug 2023 |
25 |
400-2,300 |
| Sep 2023 |
23 |
600-2,000 |
BPPTKG reported that during April and May white gas-and-steam emissions rose 10-750 m above the crater, incandescent avalanches descended 500-2,000 m on the SW and W flanks (figure 135). Cloudy weather often prevented clear views of the summit, and sometimes avalanches could not be confirmed. According to a webcam image, a pyroclastic flow was visible on 17 April at 0531. During the week of 28 April and 4 May a pyroclastic flow was reported on the SW flank, traveling up to 2.5 km. According to a drone overflight taken on 17 May the SW lava dome volume was an estimated 2,372,800 cubic meters and the dome in the main crater was an estimated 2,337,300 cubic meters.
During June and July similar activity persisted with white gas-and-steam emissions rising 10-350 m above the crater and frequent incandescent avalanches that traveled 300-2,000 m down the SW, W, and S flanks (figure 136). Based on an analysis of aerial photos taken on 24 June the volume of the SW lava dome was approximately 2.5 million cubic meters. A pyroclastic flow was observed on 5 July that traveled 2.7 km on the SW flank. According to the Darwin VAAC multiple minor ash plumes were identified in satellite images on 19 July that rose to 3.7 km altitude and drifted S and SW. During 22, 25, and 26 July a total of 17 avalanches descended as far as 1.8 km on the S flank.
Frequent white gas-and-steam emissions continued during August and September, rising 10-450 m above the crater. Incandescent avalanches mainly affected the SW and W flanks and traveled 400-2,300 m from the vent (figure 137). An aerial survey conducted on 10 August was analyzed and reported that estimates of the SW dome volume was 2,764,300 cubic meters and the dome in the main crater was 2,369,800 cubic meters.
Frequent and moderate-power thermal activity continued throughout the reporting period, according to a MIROVA (Middle InfraRed Observation of Volcanic Activity) analysis of MODIS satellite data (figure 138). There was an increase in the number of detected anomalies during mid-May. The MODVOLC thermal algorithm recorded a total of 47 thermal hotspots: six during April, nine during May, eight during June, 15 during July, four during August, and five during September. Some of this activity was captured in infrared satellite imagery on clear weather days, sometimes accompanied by incandescent material on the SW flank (figure 139).
Geologic Background. Merapi, one of Indonesia's most active volcanoes, lies in one of the world's most densely populated areas and dominates the landscape immediately north of the major city of Yogyakarta. It is the youngest and southernmost of a volcanic chain extending NNW to Ungaran volcano. Growth of Old Merapi during the Pleistocene ended with major edifice collapse perhaps about 2,000 years ago, leaving a large arcuate scarp cutting the eroded older Batulawang volcano. Subsequent growth of the steep-sided Young Merapi edifice, its upper part unvegetated due to frequent activity, began SW of the earlier collapse scarp. Pyroclastic flows and lahars accompanying growth and collapse of the steep-sided active summit lava dome have devastated cultivated lands on the western-to-southern flanks and caused many fatalities.
Information Contacts: Balai Penyelidikan dan Pengembangan Teknologi Kebencanaan Geologi (BPPTKG), Center for Research and Development of Geological Disaster Technology (URL: http://merapi.bgl.esdm.go.id/, Twitter: @BPPTKG); MAGMA Indonesia, Kementerian Energi dan Sumber Daya Mineral (URL: https://magma.esdm.go.id/v1); Pusat Vulkanologi dan Mitigasi Bencana Geologi (PVMBG, also known as Indonesian Center for Volcanology and Geological Hazard Mitigation, CVGHM), Jalan Diponegoro 57, Bandung 40122, Indonesia (URL: http://www.vsi.esdm.go.id/); Darwin Volcanic Ash Advisory Centre (VAAC), Bureau of Meteorology, Northern Territory Regional Office, PO Box 40050, Casuarina, NT 0811, Australia (URL: http://www.bom.gov.au/info/vaac/); MIROVA (Middle InfraRed Observation of Volcanic Activity), a collaborative project between the Universities of Turin and Florence (Italy) supported by the Centre for Volcanic Risk of the Italian Civil Protection Department (URL: http://www.mirovaweb.it/); Hawai'i Institute of Geophysics and Planetology (HIGP) - MODVOLC Thermal Alerts System, School of Ocean and Earth Science and Technology (SOEST), Univ. of Hawai'i, 2525 Correa Road, Honolulu, HI 96822, USA (URL: http://modis.higp.hawaii.edu/); Copernicus Browser, Copernicus Data Space Ecosystem, European Space Agency (URL: https://dataspace.copernicus.eu/browser/); Øystein Lund Andersen (URL: https://www.oysteinlundandersen.com/, https://twitter.com/oysteinvolcano).
Ebeko
Russia
50.686°N, 156.014°E; summit elev. 1103 m
All times are local (unless otherwise noted)
Moderate explosive activity with ash plumes continued during June-November 2023
Ebeko, located on the N end of Paramushir Island in Russia’s Kuril Islands just S of the Kamchatka Peninsula, consists of three summit craters along a SSW-NNE line at the northern end of a complex of five volcanic cones. Observed eruptions date back to the late 18th century and have been characterized as small-to-moderate explosions from the summit crater, accompanied by intense fumarolic activity. The current eruptive period began in June 2022, consisting of frequent explosions, ash plumes, and thermal activity (BGVN 47:10, 48:06). This report covers similar activity during June-November 2023, based on information from the Kamchatka Volcanic Eruptions Response Team (KVERT) and satellite data.
Moderate explosive activity continued during June-November 2023 (figures 50 and 51). According to visual data from Severo-Kurilsk, explosions sent ash 2-3.5 km above the summit (3-4.5 km altitude) during most days during June through mid-September. Activity after mid-September was slightly weaker, with ash usually reaching less than 2 km above the summit. According to KVERT the volcano in October and November was, with a few exceptions, either quiet or obscured by clouds that prevented satellite observations. KVERT issued Volcano Observatory Notices for Aviation (VONA) on 8 and 12 June, 13 and 22 July, 3 and 21 August, and 31 October warning of potential aviation hazards from ash plumes drifting 3-15 km from the volcano. Based on satellite data, KVERT reported a persistent thermal anomaly whenever weather clouds permitted viewing.
Geologic Background. The flat-topped summit of the central cone of Ebeko volcano, one of the most active in the Kuril Islands, occupies the northern end of Paramushir Island. Three summit craters located along a SSW-NNE line form Ebeko volcano proper, at the northern end of a complex of five volcanic cones. Blocky lava flows extend west from Ebeko and SE from the neighboring Nezametnyi cone. The eastern part of the southern crater contains strong solfataras and a large boiling spring. The central crater is filled by a lake about 20 m deep whose shores are lined with steaming solfataras; the northern crater lies across a narrow, low barrier from the central crater and contains a small, cold crescentic lake. Historical activity, recorded since the late-18th century, has been restricted to small-to-moderate explosive eruptions from the summit craters. Intense fumarolic activity occurs in the summit craters, on the outer flanks of the cone, and in lateral explosion craters.
Information Contacts: Kamchatka Volcanic Eruptions Response Team (KVERT), Far Eastern Branch, Russian Academy of Sciences, 9 Piip Blvd., Petropavlovsk-Kamchatsky, 683006, Russia (URL: http://www.kscnet.ru/ivs/kvert/).
Search Bulletin Archive by Publication Date
Select a month and year from the drop-downs and click "Show Issue" to have that issue displayed in this tab.
The default month and year is the latest issue available.
Bulletin of the Global Volcanism Network - Volume 30, Number 07 (July 2005)
Managing Editor: Edward Venzke
Anatahan (United States)
Continuous activity and extensive ash plumes through July
Barren Island (India)
Eruption continues; ash plumes seen in July and August
Concepcion (Nicaragua)
Eruption on 28 July 2005 deposits ash in nearby towns
Erta Ale (Ethiopia)
Additional observations of the shrinking lava lake in January 2004
Kikai (Japan)
Small eruptions during March-September 2004 produce ash plumes
Miyakejima (Japan)
SO2 flux continues gradual decline; minor eruptions in November-December 2004
Monowai (New Zealand)
Activity revealed by T phase swarms in 2004 and 2005
Rabaul (Papua New Guinea)
Continuing low-level eruptions and ash emissions
Suwanosejima (Japan)
Eruptions during April 2004-July 2005 send plumes to varying heights
Ulawun (Papua New Guinea)
Frequent ash/steam plumes during March-August 2005
Witori (Papua New Guinea)
Low-level vapor emissions and seismicity through August 2005
Anatahan (United States) — July 2005 Cite this Report
Anatahan
United States
16.35°N, 145.67°E; summit elev. 790 m
All times are local (unless otherwise noted)
Continuous activity and extensive ash plumes through July
Anatahan's third historical eruption began on 5 January 2005 (BGVN 29:12 and 30:02). On 5-6 April 2005, an eruption cloud rose to 15.2 km altitude, the highest yet seen at the volcano (BGVN 30:04). That eruption, estimated to have expelled 50 million cubic meters of ash, caused the temporary closure of Anderson Air Force Base on Guam. An eruption that began on 5 May and produced an extensive ash and steam plume was briefly described in BGVN 30:04, but further details follow. Plumes were frequently visible in satellite imagery; a summary of satellite observations is presented for 16 June-20 July 2005 (table 4).
Table 4. Daily summaries of Anatahan plumes seen in satellite imagery, 16 June-20 July 2005. Satellite abbreviations: DMSP: Defense Meteorological Satellite Program; Feng Yun: "Wind and Cloud"-Peoples Republic of China Earth Observing System meteorological satellite; GOES: Geostationary Operational Environmental Satellites; HIMAWARI: "Sunflower"-Japanese geostationary meteorological satellites; MTSAT: Japanese Meteorological Agency and Japanese Ministry of Transportation satellite; NASA: National Aeronautics and Space Administration; NOAA: National Oceanic and Atmospheric Administration. Courtesy of U.S. Air Force Weather Agency Satellite Applications Branch (Charles Holiday, Jenifer E. Piatt, Mickael A. Archuletta, Brent A. Persinger).
| Date |
Times (UTC) and Satellites |
Activity Summary |
| 16 Jun 2005 |
0340: NASA Aqua Modis (500 m res.); 0700: GOES-9 Visual |
3-km-high ash/steam moving W-WSW at 19-28 km/hour out to 370 km; 3 km high thin ash/vog out to 1,500 km to W-WNW. |
| 17 Jun 2005 |
0125: NASA Terra Modis (500 m res.); 0448: DMSP F-13 Visual |
3-km-high ash/steam moving W-WSW at 28-37 km/hour out to 185 km; 3 km high thin ash/vog out to 1,500 km to WNW. |
| 18 Jun 2005 |
0030: NASA Terra Modis (1 km res.); 0703: GOES-9 Visual; 1041: DMSP F116 Night Visual |
3-km-high dense ash/steam plume out to 314 km; volcanic haze out to 1,780 km W and 760 km NW. |
| 19 Jun 2005 |
0646: NOAA-12 Visual (0.6 km); 0700: Feng Yun-2 (2.8 km); 0725: GOES-9 Visual; 0819: DMSP F-13 Visual (0.6 km); 0819: DMSP F-13 IR (2.8 km); 1034: DMSP F-16 Night Visual |
Brief eruption at 0525Z, ash 15 km high moving E; cloud dissipated by 1400Z after migrating 400 km SE; 3-km-high ash/steam out to 250 km W; 2.4-km-high thin ash/vog out to 1,900 km WNW and 860 km NW. |
| 20 Jun 2005 |
0700: GOES-9 Visual; 1016: DMSP F-13 Night Visual (2.8 km) |
3-km-high eruption cloud moving 28-37 km/hour W; moderately dense ash/steam plume extends 695 km WNW; thin ash/vog out to 1,500 km NW. |
| 21 Jun 2005 |
0100: NASA Terra Modis (250 m res.); 0700: GOES-9 Visual |
3-km-high eruption moving W at 37 km/hour extending 460 km W; 3-km-high ash/vog extending out to 1,570 km W, then shifting N and NE toward Volcano Islands. |
| 22 Jun 2005 |
0305: NASA Aqua Modis (250 m res.); 0700: DMSP F-12 Visual (0.55 km); 0700: GOES-9 Visual |
1.5-km-high eruptions moving W at 28 km/hour; ash/steam extending 280 km until obscured by clouds; thin ash/steam out to 1,940 km W. |
| 23 Jun 2005 |
0030: NASA Terra Modis (500 m res.); 0702: Enhanced GOES 9 Visual; 0826: Enhanced DMSP F-12 Visual |
Ash/steam plume out to 740 km; two SW/NE swaths of vog out 1,760 km N, 1,800 km NE, and 1,950 km W. |
| 24 Jun 2005 |
0130: NASA Terra Modis (500 m res.); 0647: DMSP F-12 Visual; 0725: Enhanced GOES-9 Visual |
3.5-km-high dense, continuous ash/steam plume extending over 695 km W; large area of vog extending over 1,760 km W, 1,440 km N, and over 1,430 km E. |
| 25 Jun 2005 |
0215: NASA Terra Modis (500m res.); 0525: NOAA-16 Visual; 0725: Enhanced GOES-9 Visual; 0841: DMSP F-13 Visual |
3.5-km-high ash/steam plume out to 850 km; vog plume 2,000 km W, then 1,700 km N, then 1,940 km E. |
| 27 Jun 2005 |
0025: NASA Terra Modis (500 m res.); 0600: GOES-9 Visual; 0744: NOAA-15 Visual (0.9 km) |
3.7-km-high ash/steam plume 130 km W; 3-km-high thin ash/vog 1,480 km W, then 740 km N. |
| 28 Jun 2005 |
0405: NASA Aqua Modis (500 m res.); 0410: NASA Aqua Modis (2 km res.); 0717: DMSP F-12 Visual (1.8 km) |
Moderately thick ash/steam plume 3 km high extends 150 km W moving at 27-37 km/hour; thin ash/vog extends 1,900 km W, then turns N moving over Ryukyu Islands. |
| 29 Jun 2005 |
0450: NASA Aqua Modis; 0700: GOES-9 Visual |
3-km-high moderately thick ash/steam plume reached between 420 and 600 km W moving 37 km/hour; thin ash/vog extends over 1,800 km W, then veers N over Ryukyu Islands. |
| 30 Jun 2005 |
0700: GOES-9 Visual; 0911: DMSP F-13 Visual (1.0 nm); 1425: GOES-9 Split Window IR |
3-km-high ash/steam plume extended 210 km W moving W about 27 km/hour; thin 3-km-high ash/vog extends over 2,400 km W, then veers N, reaching E Taiwan and East China Sea. |
| 01 Jul 2005 |
0135: NASA Terra Modis; 0637: Enhanced DMSP F-12 Visual; 0637: Enhanced HIMAWARI; 0711: Enhanced GOES-9 Visual; 2214: DMSP F-16 Visual |
3-km-high ash/steam plume extending over 740 km W; area of vog extending about 2,300 km NW and over 1,480 km NNE; as vog area moves farther W begins to intermix with smoke from fires in China. |
| 02 Jul 2005 |
0030: NASA Terra Modis; 0345: NASA Aqua Modis; 0638: Enhanced NASA Visual; 1049: Enhanced GOES-9 Split-Window IR |
4.6-km-high dense ash/steam plume extending about 460 km W; area of vog extends farther W to approximately 2,200 km; as the area of vog get closer to China, it becomes intermixed with smoke from the fires in mainland China and begins to move E to a point about 1,800 km N of Anatahan before it is no longer detectable on imagery. |
| 03 Jul 2005 |
0800: Feng Yun-2 Visual; 0823: DMSP F-13 Visual; 1201: GOES-12 Split Window IR |
5.5-km-high fairly dense ash/steam plume extending NW about 190 km; ash erupted earlier today reached initial level of 12.2 km SE of summit; area of ash/vog and haze extending W about 1,000 km. |
| 04 Jul 2005 |
0330: NASA Aqua Modis; 0638: MTSAT Visual; 0716: NOAA-12 Visual; 0800: Feng Yun-2 Visual; 0809: DMSP F-13 Visual |
Fairly dense ash/steam plume 4.3-6.1 km high extending W approximately 390 km; area of ash/vog and haze extending to W about 2,200 km out into the Philippine Sea. |
| 05 Jul 2005 |
0110: NASA Terra Modis; 0415: NASA Aqua Modis; 0456: Feng Yun-2 Visual; 0504: NOAA-16 Visual; 0854: DMSP F-14 Visual; 1801: GOES-9 Split Window IR |
7.6-km-high fairly dense ash/steam plume extending W about 570 km; area of ash/vog and haze extending about 2,460 km W and into the Philippine Sea. |
| 06 Jul 2005 |
0320: NASA Aqua Modis; 0706: DMSP F-12 Vis (1.0 nm); 0706: DMSP F-12 Vis (0.3 nm); 0840: DMSP F-14 Vis (0.3 nm) |
4.3-km-high fairly dense ash/steam plume extending W about 1,100 km; 3.0-km-high thin ash/vog area out to about 1,900 km; in 0840Z satellite, eruption plume rises to about 12.2 km. |
| 07 Jul 2005 |
0100: NASA Terra Modis; 0700: GOES-9 Visual |
4.3-km-high ash/steam plume W to 1,060 km; 3-km-high thin ash/vog area W to about 1,940 km, then NNE about 1,200 km. |
| 08 Jul 2005 |
0305: NASA Aqua Modis (500 m res.); 0445: NASA Aqua Modis (2 km res.); 0700: GOES-9 Visual; 0811: DMSP F-14 Visual (0.6 km) |
3.7-km-high ash/steam plume W to 1,160 km; 3-km-high thin ash/vog area W to 2,400 km, with lobes to N. |
| 09 Jul 2005 |
0050: NASA Terra Modis Image; 0350: NASA Aqua Modis; 0638: MTSAT Visual; 0834: DMSP F-13 Visual; 2300: GOES-9 Split-Window |
3-km-high very distinct ash/steam plume extending W about 630 km; large area of vog extending W to over 2,500 km, out to the coast of the Philippines and Taiwan; at 2300 another eruption extending to 9.8 km high and ~70 km S of summit. |
| 10 Jul 2005 |
0130: NASA Terra Modis; 0638: Enhanced MISAT Visual; 0800: Feng Yun-2 Visual; 0825: DMSP F-13 Visual |
Very distinct ash/steam plume 5.5-6.1 km high extending ~790 km WSW; large area of vog extending to over 2,600 km W to the coast of Philippines and Taiwan and another area of vog being caught up in the flow ~1,600 km NW of the volcano; between 10 Jul 2005 at 2200Z and 11 Jul 2005 at 1200Z, Kadena AB (RODN) surface reports indicated haze and 6-11 km visibilities. |
| 11 Jul 2005 |
0035: NASA Terra Modis (500 m res.); 0700: GOES-9 Visual; 0810: DMSP F-13 Visual (0.6 km) |
Beginning at 0700Z, 7.6-km-high plume measured 46 km NNE, and an ash/steam plume to 6.1 km measured 600 km W; beyond that point, thin ash/VOG, estimated below 4.6 km, extended 1,900 km W and veered N toward the Ryukyu Is; current eruptions (at 1500Z) are to 4.6 km moving W at 19-28 km/hour. |
| 12 Jul 2005 |
0420: NASA Aqua Modis (500 m res.); 0700: GOES-9 Visual; 0757: DMSP F-13 Visual (0.6 km); 2322: DMSP F-15 Visual (0.6 km) |
Eruption plumes are to 6.1 km, and light winds moving thick ash/steam out to 90 km W, and thinner ash/steam extended 140 km NE; area of thin ash/vog stretched W to coast of the Philippines, while vog continued to reduce visibilities over the Ryukyu Is.; Kadena AB surface observations indicated haze and 8-10 km visibilities between 0300Z and 1500Z; eruption to 11 km occurred at around 2300Z, and an ash cloud moved at 65-74 km/hour W. |
| 13 Jul 2005 |
0020: NASA Terra Modis (500 m res.); 0056: NOAA-17 Visual (0.9 km); 0700: GOES-9 Visual |
At 0020 ash cloud seen about 74 km W; at about 0700 radar estimated another plume to 9.4 km, which remained stationary near the summit; at the same time, ash/steam to 6.1 km extended 185 km; thin ash/vog continued to the Philippines; vog over the Ryukyu Is. |
| 14 Jul 2005 |
0001: DMSP F-13 Visual; 0638: Enhanced MTSAT Visual |
Typhoon Haitang, sitting to NNW of Anatahan, caused extensive cloud cover; at ~930 km to W is area of vog that extends to the Philippine coastal region; faint plume extending to the N ~80 km; large area of vog SW of Typhoon Haitang and extending W. |
| 15 Jul 2005 |
0638: Enhanced MTSAT Visual |
Extensive cloud cover over Anatahan making detection of any ash/steam very difficult; area of vog located along the E coast of central Philippines area extending E ~960 km. |
| 16 Jul 2005 |
0638: Enhanced MTSAT Visual |
Convective activity persistent over the volcano, making ash/steam detection impossible; Super Typhoon Haitang is disrupting any remaining areas of VOG in the W Pacific. |
| 18 Jul 2005 |
2206: DMSP F-16 Visual (0.9 km) |
6.7-km-high ash/steam plume extending 210 km NW. |
| 19 Jul 2005 |
2228: DMSP F-15 Visual (0.6 km) |
Due to cloud cover, ash/steam not visible on satellite data since around 0000; current eruptions assumed to be 3-6.7 km high moving N at a maximum speed of 20 km/hour. |
| 20 Jul 2005 |
No visible ash in imagery |
Due to cloud cover, ash/steam not visible on satellite data since about 0200; eruption plumes are assumed to 3 km high moving NW at 19-28 km/hour; an eruption to 15.5 km was detected by 2215, and ash moved SE at 29-37 km/hour; due to extensive cloud cover over the area, no ash was visible via satellite at any time during the past 12 hours; this is the 12th eruption with ash to 9.1 km and/or above since the beginning of June; as of 1000, ash was no longer visible in radar and eruption plumes were estimated to 9.1 km moving NE at 37-56 km/hour. |
Observations during early May 2005. Activity surged to a moderately high level on 5 May, when an extensive ash-and-steam plume to 4.5 km altitude was visible in all directions. Ash extended 770 km N, 130 km S to northern Saipan, and 110 km W. Vog extended in a broad swath from 3,000 km W, over the Philippine Islands, to 1,000 km N of Anatahan. By 9 May harmonic tremor amplitude had decreased to near background levels, with a corresponding drop in eruptive activity. As of 10 May the Air Force Weather Agency (AFWA) reported ash rising to about 3 km altitude and extending 400 km W, with an area of vog less than half that noted on 5 May.
Anatahan began erupting suddenly from its E crater at about 1700 on 10 May. Within hours of the eruption's onset, a towering column of volcanic ash and gas rose to more than 10 km altitude, and the prevailing wind blew the ash W. An immediate concern was the potential for the tiny abrasive ash fragments to damage aircraft passing nearby and downwind from the volcano. The Washington Volcanic Ash Advisory Center issued an advisory that volcanic ash was present at 11 km altitude moving S at 65 km/hour and at 4.6 km altitude moving W at 20-30 km/hour.
The single seismic station on the island maintained by the Emergency Management Office of the Commonwealth of the Northern Mariana Islands (EMO/CNMI) was not working at the time, but a broadband seismic instrument installed 6.5 km W of Anatahan's crater on 6 May by scientists from Washington University in St. Louis recorded significant earthquake activity in the hours before the eruption began; the instrument was one of many installed to conduct a seismic experiment along the Mariana Trench. A preliminary review of the data shows there was a rapid increase in the number of small-magnitude earthquakes (probably less than M 2) to more than 100 per hour beneath the volcano within a few hours of the eruption onset.
A smaller but nearly continuous eruption column rose from the E crater of Anatahan for several days following 10 May. The resulting eruption clouds were generally below about 6 km altitude. On 11 May AFWA reported thick ash rising to 4.2 km altitude and moving WNW. The ash extended in a triangular shape from the summit 444 km to the WSW through 510 km to the NW. A layer of diffuse ash at 3 km altitude extended beyond the dense ash for another 1,000 km. A broad swath of vog extended over 2,200 km W nearly to the Philippines and over 1,400 km NNW of Anatahan. Although the ash plume diminished over the next few days, it remained significant, rising to 2.4 km altitude and extending 370 km WNW on 13 May. Personnel from EMO/CNMI and the U.S. Geological Survey (USGS) who were repairing and installing equipment on 14 May reported hearing a continuous roaring sound from 2-3 km W of the active vent. They also saw ash and steam rising by pure convection, not explosively, to 3 km altitude.
Observations during later May and June 2005. Following nearly continuous eruption from January through April 2005, on 23-24 May typhoon Chan-hom shifted the prevailing E winds to the S, blowing the eruption column toward Saipan and Guam. Light ashfall resulted in flight cancellations at the Saipan and Guam international airports. Residents of Saipan reported a rotten-egg smell associated with the ashfall. The ongoing explosive activity excavated a deep crater within Anatahan's E crater. Scientists estimated the inner crater was nearly at sea level by about 20 May; before the eruption, the floor of E crater was 68 m above sea level.
The spiny surface of a lava flow was first observed in the inner crater on 4 June. The flow appeared to form a mound-shaped lava dome, but its volume is unknown. New fault scarps and slump features were seen within the E crater, as well as additional faulting W of the E crater. A gradual increase in the number of long-period (LP) earthquakes and tremor began at Anatahan on 5 June. Both LP and tremor events peaked during 2230-0030 on 6 June. During the peak in activity, more than 350 LP events occurred. Tremor amplitudes briefly reached a new high for the current eruptive activity, and an ash column reached ~ 7.9 km altitude. On 6 June, tremor amplitudes returned to low levels. During the rest of the week of 1-7 June, ash plumes reached a maximum altitude of 4.3 km. On 5 June the EMO/CNMI seismic station was repaired and ash samples were collected from the site. Through 12 June, the seismic records showed only continuous ground shaking to varying degrees. The most intense periods of tremor lasted 3 to 10 hours and occurred about every 24-36 hours.
On 12 June, three LP earthquakes were recorded, the largest about M 2. Other earthquakes followed in the late afternoon and early evening of 13 June. During 17-26 June 2005, seismicity was at the highest level since the eruption on 6 April, with real-time seismic amplitude (RSAM) values at ANA2 consistently near 625.
Since 18 May, Anatahan has sent ash and steam continuously to 2.4 km altitude or higher, with seven eruptive pulses to 7.6 km altitude or higher. On 11 June, a 10 minute-long eruptive pulse sent ash and steam to 14 km altitude. On June 19, a 2.6 minute-long eruptive pulse sent a cloud of steam and ash to 15.2 km altitude; the cloud moved E and dissipated after about 7 hours. On 6 July, very high levels of tremor for about 30 minutes accompanied an eruptive pulse to 12.2 km altitude.
On 11 June beginning at 1622 three explosions produced a dense ash cloud that rose to an altitude of ~ 13.7 km. On 12 June, seismicity was at moderately high levels, with periods of strong tremor and frequent small LP earthquakes. Satellite imagery showed an ash cloud at an altitude of ~ 3 km.
Two strong explosions on 14 June removed much of the small new dome in the inner crater. Just before noon on 14 June, earthquakes began to occur at intervals of 1-2 minutes. For the next two days, episodes of intense tremor and earthquakes lasting about 1.5 hours occurred about every 12 hours, accompanying strong ash emissions from the E crater, with eruption columns higher than 2 km altitude. Quiet intervals in which the eruption column contained little ash were accompanied by continuous weak tremor.
On 19 June at 1525 a brief eruption produced a steam-and-ash cloud that reached an altitude of ~ 15.2 km (figure 18). Guam Meteorological Weather Office radar showed that the cloud drifted E. No seismic signal was clearly associated with the eruption. Two days before the eruption, the amplitude of continuous tremor was relatively high. During the days before and after the eruption, ash reached 3-4.6 km and drifted W.
During 22-27 June AFWA observed, on satellite imagery, a moderately dense cloud of ash and steam that rose to a maximum altitude of ~ 3 km, and drifted W. Additional thin ash and vog were visible to the W and NNW of the island. On 26 June AFWA identified, on satellite imagery, a dense cloud of ash and steam rising to ~ 3.7 km, moving towards the W, and vog to the W, N and NE of the island (figure 19). No particular seismic signal was associated with the eruptions. By 28 June the seismicity level dropped by about 80% from the continuously high levels of the last week.
On 3 July at 1646 an eruption produced a SSE-drifting plume to an altitude of ~ 12.2 km, according to Guam Meteorological Office radar. Vog briefly drifted S over the islands of Saipan and Tinian. During 29 June to 5 July, steam-and-ash emissions continued to rise to low altitudes. During 6-11 July, eruptive activity continued, with steam-and-ash plumes rising to a maximum altitude of 6.1 km. On 6 July beginning at 1730 tremor at the volcano increased, and an eruption produced an ash plume to an altitude of ~ 12.2 km. During 8-11 July, a thin layer of vog extended over much of the Philippine Sea (figure 20).
As of 1 August 2005, Anatahan was presumed to be in a state of constant eruption. For the first half of 1 August, volcanic tremor levels as recorded at Anatahan's E seismic station (ANA2) were between 40 and 60 % of the peak levels observed during 17-26 June. At 0800, the National Weather Service at Tiyan, Guam, issued a volcanic ash advisory for Saipan and Tinian. A strong sulfur odor from the emitted volcanic gases was reported by numerous residents, and ash was observed on the tips of aircraft at Saipan International Airport. Traces of ash were also apparent on solar panels powering equipment run by the EMO/CNMI on Saipan. According to the Air Force Weather Agency, continued cloud cover caused by a tropical storm inhibited ash detection on METSAT imagery. As of 1252 on 1 August, the ash plume was presumed to be at an altitude of 4.6 km, moving toward the S at 18-27 km/hour.
Geologic Background. The elongate, 9-km-long island of Anatahan in the central Mariana Islands consists of a large stratovolcano with a 2.3 x 5 km compound summit caldera. The larger western portion of the caldera is 2.3 x 3 km wide, and its western rim forms the island's high point. Ponded lava flows overlain by pyroclastic deposits fill the floor of the western caldera, whose SW side is cut by a fresh-looking smaller crater. The 2-km-wide eastern portion of the caldera contained a steep-walled inner crater whose floor prior to the 2003 eruption was only 68 m above sea level. A submarine cone, named NE Anatahan, rises to within 460 m of the sea surface on the NE flank, and numerous other submarine vents are found on the NE-to-SE flanks. Sparseness of vegetation on the most recent lava flows had indicated that they were of Holocene age, but the first historical eruption did not occur until May 2003, when a large explosive eruption took place forming a new crater inside the eastern caldera.
Information Contacts: Juan Takai Camacho and Ramon Chong, Emergency Management Office of the Commonwealth of the Northern Mariana Islands (EMO/CNMI), PO Box 100007, Saipan, MP 96950, USA (URL: http://www.cnmihsem.gov.mp/); Hawaiian Volcano Observatory (HVO), U.S. Geological Survey, PO Box 51, Hawaii Volcanoes National Park, HI 96718, USA (URL: https://volcanoes.usgs.gov/observatories/hvo/); Charles Holliday and Jenifer E. Piatt, U.S. Air Force Weather Agency (AFWA)/XOGM, Offutt Air Force Base, NE 68113, USA; Randy White and Frank Trusdell, U.S. Geological Survey, 345 Middlefield Road, Menlo Park, CA 94025-3591, USA (URL: https://volcanoes.usgs.gov/nmi/activity/).
Barren Island (India) — July 2005 Cite this Report
Barren Island
India
12.278°N, 93.858°E; summit elev. 354 m
All times are local (unless otherwise noted)
Eruption continues; ash plumes seen in July and August
Heavy monsoon rains that fell soon after the beginning of the eruption on 28 May made observations and fieldwork difficult, and the eruption appeared to have ended by 6 July (BGVN 30:05). Based on information from the Indian Coast Guard, Dhanapati Haldar noted that as of 6 June the mode of eruption was Strombolian, the same as that observed during 1994-95, with fire fountains rising ~ 100 m, a dark plume rising 1 km, and lava piling up on the W face of the main cone.
On 13 June an Indian Navy ship transported Geological Survey of India scientists Sumit Kr. Mitra, P.C. Bandopadhyay, Sanjeev Raghav, and Tapan Pal to the island. Prior to the visit the volcano was spewing a gray ash plume charged with water vapor from both the main crater and a subsidiary vent on the SW slope. Around 13 June activity at the subsidiary vent decreased considerably and lava debris formed a mound of loose hot fragments. Forceful ejection of bombs and lapilli continued from the main crater. The proximal accumulations of pyroclasts displayed some incandescence. Red-hot lava fragments were forcefully ejecting from the main crater to heights of more than 100 m, accompanied by loud explosions. Strombolian fire fountains every 15-30 seconds created an eruption column and mushroom-shaped plume that blew to the N. Hand specimen study revealed both jet-black and brownish black basaltic fragments. Both types contained large phenocrysts of plagioclase and pyroxene in a finer black groundmass with a porphyritic texture.
A story in the BBC News-World Edition of 11 July about the volcano becoming a tourist attraction served by charter boats included a statement that lava was flowing into the sea. However, the observation was not dated or attributed to a specific source.
According to a pilot's report described in a Volcanic Ash Advisory, ash was visible near Barren Island on 18 July at 0211 at an altitude of ~ 6.1 km. Ash was observed on satellite imagery at 0755 that day below 4.6 km altitude. MODIS imagery from the NASA Terra satellite at 0930 (0400 UTC) showed a distinct brown plume extending around 4.6 km NNE. A plume was again reported by a pilot on 18 August at an altitude of ~ 3 km, although ash was not visible on satellite imagery.
Geologic Background. Barren Island, a possession of India in the Andaman Sea about 135 km NE of Port Blair in the Andaman Islands, is the only historically active volcano along the N-S volcanic arc extending between Sumatra and Burma (Myanmar). It is the emergent summit of a volcano that rises from a depth of about 2250 m. The small, uninhabited 3-km-wide island contains a roughly 2-km-wide caldera with walls 250-350 m high. The caldera, which is open to the sea on the west, was created during a major explosive eruption in the late Pleistocene that produced pyroclastic-flow and -surge deposits. Historical eruptions have changed the morphology of the pyroclastic cone in the center of the caldera, and lava flows that fill much of the caldera floor have reached the sea along the western coast.
Information Contacts: Geological Survey of India, 27 Jawaharlal Nehru road, Kolkata 700016, India (URL: http://www.gsi.gov.in/); Dhanapati Haldar, Presidency College, Kolkata, India; Jenifer E. Piatt, U.S. Air Force Weather Agency (AFWA), Satellite Applications Branch, Offutt Air Force Base, Nebraska 68113, USA (URL: http://www.557weatherwing.af.mil/); Darwin Volcanic Ash Advisory Centre (VAAC), Bureau of Meteorology, Northern Territory Regional Office, PO Box 40050, Casuarina, Northern Territory 0811, Australia (URL: http://www.bom.gov.au/info/vaac/); BBC News World Edition, Room 7540, BBC Television Centre, Wood Lane, London W12 7RJ, United Kingdom (URL: http://news.bbc.co.uk/).
Concepcion (Nicaragua) — July 2005 Cite this Report
Concepcion
Nicaragua
11.538°N, 85.622°W; summit elev. 1700 m
All times are local (unless otherwise noted)
Eruption on 28 July 2005 deposits ash in nearby towns
According to the Instituto Nicaraguense de Estudios Territoriales (INETER) an eruption occurred at dawn on 28 July 2005 from Concepción, which lies on the island of Ometepe in W-central Lake Nicaragua (figure 3). Concepción is frequently active at low levels and INETER reports suggested these new events as late as 31 July were not considered major behavioral anomalies indicative of an energetic reactivation of the volcano. A colored diagrammatic map that for the case of larger eruptions included hazard zones, refuges, and escape routes for three contingencies; it appeared in the press several days before the July eruption. Many of the scenarios indicated movement of people to the SE side of the island. The map noted that Concepción has 26 craters, and eruptions could occur from other than the central vent.
The 28 July eruption cloud deposited ash in the island town of Moyagalpa (~ 9 km W of the summit) and in lesser quantities on the mainland settlements W of the volcano, at San Jorge, Buenos Aires, Potosí, Belén, and in the vicinity of Rivas. Residents also smelled volcanic gases.
INETER recorded seismic tremor at a station N of the volcano, but no large earthquakes occurred. By the afternoon of 28 July ashfall had reduced considerably, or completely ceased, but gas emission continued. No thermal anomalies were observed on satellite imagery. During the night and the following day residents on Ometepe island's W side reported continued presence of ash and gas.
On the morning of 29 July, geodetic measurements determined that significant deformation had occurred, presumably related to magma injected. The seismic station to the N recorded constant tremor; during 0500-0800, a series of volcanic earthquakes may have been associated with small explosions in the crater. At 1025 the seismic station recorded a moderate explosion in the crater.
On 30 July the N seismic station registered tremor, which continued with variations. Significant earthquakes remained absent. On 31 July after 0300 tremor amplitude rose and it remained elevated for an undisclosed amount of time. However, episodes of ashfall diminished or ceased.
Geologic Background. Volcán Concepción is one of Nicaragua's highest and most active volcanoes. The symmetrical basaltic-to-dacitic stratovolcano forms the NW half of the dumbbell-shaped island of Ometepe in Lake Nicaragua and is connected to neighboring Madera volcano by a narrow isthmus. A steep-walled summit crater is 250 m deep and has a higher western rim. N-S-trending fractures on the flanks have produced chains of spatter cones, cinder cones, lava domes, and maars located on the NW, NE, SE, and southern sides extending in some cases down to Lake Nicaragua. Concepción was constructed above a basement of lake sediments, and the modern cone grew above a largely buried caldera, a small remnant of which forms a break in slope about halfway up the N flank. Frequent explosive eruptions during the past half century have increased the height of the summit significantly above that shown on current topographic maps and have kept the upper part of the volcano unvegetated.
Information Contacts: Instituto Nicaraguense de Estudios Territoriales (INETER), Volcanology Department, Apartado 2110, Managua, Nicaragua (URL: http://www.ineter.gob.ni//vol/concepcion/concepcion.html).
Erta Ale
Ethiopia
13.601°N, 40.666°E; summit elev. 585 m
All times are local (unless otherwise noted)
Additional observations of the shrinking lava lake in January 2004
The most recent reported observations of Erta Ale made during 22-23 January 2005 (BGVN 30:01) described hornitos on a chilled lava lake surface. The following report is courtesy of Tony Waltham, who recently authored an article discussing the Afar Triangle (Waltham, 2005). These observations from January 2004 further illustrate the shrinking of the lava lake previously noted by a February 2004 expedition (BGVN 29:02).
A group of English geologists who visited on 15-16 January 2004 observed an active lava lake estimated at about 25 m across almost in the center of the lower lava floor within the S crater (figure 16) with a turbulent lava surface ~ 3 m below its rim. Crusting was minimal, and there was no development of substantial lava rafts. Modest fountaining occurred mainly over the zone of rising lava under the southern margin, and none was observed to rise more than 3 m to rim level. A hornito just a few meters high was active on the SE side (figure 17), a few meters from the lake, and night viewing revealed incandescence from a few other fissures across the old lava floor. Minimal fumarolic activity within the crater generated some periods of thin blue haze, though there were major emissions of sulphurous fumes from many fumaroles and fissures around the remains of the old northern crater.
Reference. Waltham, T., 2005, Extension tectonics in the Afar Triangle: Geology Today, v. 21, no. 3, p. 101-107.
Geologic Background. The Erta Ale basaltic shield volcano in Ethiopia has a 50-km-wide edifice that rises more than 600 m from below sea level in the Danakil depression. The volcano includes a 0.7 x 1.6 km summit crater hosting steep-sided pit craters. Another larger 1.8 x 3.1 km wide depression elongated parallel to the trend of the Erta Ale range is located SE of the summit and is bounded by curvilinear fault scarps on the SE side. Basaltic lava flows from these fissures have poured into the caldera and locally overflowed its rim. The summit caldera usually also holds at least one long-term lava lake that has been active since at least 1967, and possibly since 1906. Recent fissure eruptions have occurred on the N flank.
Information Contacts: Tony Waltham, 11 Selby Road, Nottingham NG2 7BP, United Kingdom.
Kikai
Japan
30.793°N, 130.305°E; summit elev. 704 m
All times are local (unless otherwise noted)
Small eruptions during March-September 2004 produce ash plumes
An eruption in 2002 began on 11 May when discolored plumes were noted (BGVN 28:04). Anomalous seismicity began on 14 May 2002, when about 900 events were recorded (table 1). The number of events dropped to very low levels the next day, but then gradually increased to a peak of 967 on the 28th and almost that many on the 29th. During June 2002, seismicity was high on the 2nd (650 events), 3rd (> 300 events), and 8th (~ 240 events). There were also 117 tremor events during the month, 73 of them on the 15th. Plumes and ashfall were reported through 5 June (BGVN 28:04).
Table 1. Summary of seismicity and plume observations at Kikai, May 2002-January 2005. All reported plumes were described as either white (W), light white (LW), grayish white (GW), or gray (G). Data courtesy of JMA.
| Month |
Volcanic Earthquakes |
Max. plume height (km) (date) |
Plume Color (number of days, date) |
| May 2002 |
6,012 |
-- |
-- |
| Jun 2002 |
1,415 |
-- |
-- |
| Jul 2002 |
198 |
-- |
-- |
| Aug 2002 |
141 |
-- |
-- |
| Sep 2002 |
110 |
-- |
-- |
| Oct 2002 |
144 |
-- |
-- |
| Nov 2002 |
83 |
0.6 (16) |
W (11 days) |
| Dec 2002 |
102 |
-- |
-- |
| Jan 2003 |
138 |
0.6 (2, 15) |
W (30 days) |
| Feb 2003 |
182 |
0.6 (11, 20) |
W (24 days) |
| Mar 2003 |
224 |
0.7 (4) |
W (25 days) |
| Apr 2003 |
221 |
0.8 (27) |
W (21 days) |
| May 2003 |
363 |
0.6 (22, 23, 26) |
W (19 days) |
| Jun 2003 |
366 |
1.0 (7) |
W and LW (13 days), GW (7th and 8th) |
| Jul 2003 |
94 |
0.8 (26) |
W (11 days), GW and G (17th, 26th) |
| Aug 2003 |
166 |
0.8 (23) |
W, LW (18 days), GW (12th, 16th) |
| Sep 2003 |
320 |
0.8 (1, 5, 19) |
W (25 days), GW (19th, 22nd) |
| Oct 2003 |
166 |
0.6 (10, 19) |
W (23 days) |
| Nov 2003 |
191 |
-- |
-- |
| Dec 2003 |
186 |
0.6 (1) |
W (29 days) |
| Jan 2004 |
157 (1-24 Jan) |
0.6 (18, 29, 31) |
W (26 days) |
| Feb 2004 |
40 (26-29 Feb) |
0.6 (18) |
W (25 days) |
| Mar 2004 |
110 (none 22-25 Mar) |
0.7 (29) |
W, LW (24 days), GW (5th, 24th, 25th) |
| Apr 2004 |
199 (1-26 Apr) |
0.8 (6) |
W, LW (27 days) |
| May 2004 |
164 (15-31 May) |
0.7 (26) |
W (20 days) |
| Jun 2004 |
250 |
0.7 (30) |
W (13 days) |
| Jul 2004 |
249 |
0.8 (3) |
W (14 days) |
| Aug 2004 |
219 |
0.8 (4, 24) |
W (21 days), GW (13th) |
| Sep 2004 |
157 |
0.7 (25) |
W (19 days), GW (25th) |
| Oct 2004 |
137 |
0.8 (11) |
W (25 days) |
| Nov 2004 |
173 |
0.6 (5, 7, 13, 25) |
W (28 days) |
| Dec 2004 |
205 |
0.7 (6) |
W (30 days) |
| Jan 2005 |
144 |
0.6 (14, 23) |
W (29 days) |
Activity for the following year consisted of low-level seismicity of less than 200 events per month, and frequent, almost daily, white plumes. Eruptive activity began again on 7-8 June 2003 when 800-1,000 m ash plumes were recorded. Although plumes were not reported, eruptions also occurred during 10-12 June. Additional eruptions were noted by JMA during 7, 14-17, 26, 27, and 30 July, and 12, 13, and 15-18 August 2003. All of the June-August eruptions caused ashfall. The last grayish white eruption plumes in 2003 were seen on 19 and 22 September.
From March to September 2004, Tokyo Volcanic Ash Advisory Center (VAAC) reports indicated a number of small eruptions at Kikai. Three plumes in March 2004 reportedly rose to 1.5 km altitude, but no ash was visible in satellite imagery (table 2). JMA also reported eruptions on those days, but only indicated plumes 700 m high.
Table 2. Date and time of eruptions from Kikai, the direction and altitude of observed plumes, and whether ash was seen on satellite image. Based on information from the Tokyo VAAC.
| Date |
Time |
Plume Altitude (km) |
Direction |
Ash visible on satellite imagery |
| 05 Mar 2004 |
0922 |
1.5 |
N |
No |
| 24 Mar 2004 |
1755 |
1.5 |
S |
No |
| 25 Mar 2004 |
0715 |
1.5 |
NW |
No |
| 01 Jun 2004 |
1330 |
-- |
W |
Yes |
| 13 Aug 2004 |
1105 |
1.2 |
NW |
-- |
| 25 Sep 2004 |
0937 |
1.5 |
W |
-- |
Another plume on 1 June did have ash visible to satellites. This eruption was not included in the JMA observations. Plumes were seen again on 13 August and 25 September, again with JMA only reporting 700-800 m plumes compared to 1.2 and 1.5 km plumes, respectively, in the VAAC advisory. No seismicity was detected during 25 September-5 October 2004, the period following the eruption of a grayish-white plume to 700 m. Data from JMA through January 2005 indicate continuing volcanic earthquakes (less than 10/day in December) and almost daily white plumes as high as 700 m, but generally 400 m or below.
Geologic Background. Multiple eruption centers have exhibited recent activity at Kikai, a mostly submerged, 19-km-wide caldera near the northern end of the Ryukyu Islands south of Kyushu. It was the source of one of the world's largest Holocene eruptions about 6,300 years ago when rhyolitic pyroclastic flows traveled across the sea for a total distance of 100 km to southern Kyushu, and ashfall reached the northern Japanese island of Hokkaido. The eruption devastated southern and central Kyushu, which remained uninhabited for several centuries. Post-caldera eruptions formed Iodake (or Iwo-dake) lava dome and Inamuradake scoria cone, as well as submarine lava domes. Recorded eruptions have occurred at or near Satsuma-Iojima (also known as Tokara-Iojima), a small 3 x 6 km island forming part of the NW caldera rim. Showa-Iojima lava dome (also known as Iojima-Shinto), a small island 2 km E of Satsuma-Iojima, was formed during submarine eruptions in 1934 and 1935. Mild-to-moderate explosive eruptions have occurred during the past few decades from Iodake, a rhyolitic lava dome at the eastern end of Satsuma-Iojima.
Information Contacts: Japan Meteorological Agency (JMA), Volcanological Division 1-3-4 Ote-machi, Chiyoda-ku, Tokyo 100, Japan (URL: http://www.jma.go.jp/); Tokyo Volcanic Ash Advisory Center, Japan Meteorological Agency (JMA), 1-3-4 Ote-machi, Chiyoda-ku, Tokyo 100, Japan (URL: https://ds.data.jma.go.jp/svd/vaac/data/).
Miyakejima
Japan
34.094°N, 139.526°E; summit elev. 775 m
All times are local (unless otherwise noted)
SO2 flux continues gradual decline; minor eruptions in November-December 2004
Seismicity and regular gas-and-steam plumes related to the eruption during the summer of 2000 continued through August 2003 (BGVN 28:10). From August 2003 through August 2005 gas emissions continued; SO2 flux remained relatively high and nearly constant (4,000-9,000 tons per day) since October 2002 (figure 21). Eruptions were absent in 2003. Seismicity increased again in May 2003 to more than 700 events/month (table 4), compared to less than 450 the previous four months, a level higher than any recorded since August 2000 (BGVN 28:10).
Table 4. Summary of seismicity and plume observations at Miyake-jima, May 2003-January 2005. All reported plumes originated from the summit crater, and were described as white (W) or gray (G). Data courtesy of JMA.
| Month |
Volcanic earthquakes |
Max. Plume Height (km) (date) |
Plume Color (number of days, date) |
| May 2003 |
713 |
1.0 (3, 22) |
W (22 days) |
| Jun 2003 |
811 |
0.9 (5) |
W (17 days) |
| Jul 2003 |
762 |
0.8 (3) |
W (13 days) |
| Aug 2003 |
562 |
1.0 (30) |
W (7 days) |
| Sep 2003 |
551 |
0.9 (15) |
W (17 days) |
| Oct 2003 |
649 |
1.0 (16, 27) |
W (17 days) |
| Nov 2003 |
971 |
1.0 (14) |
W (18 days) |
| Dec 2003 |
1,449 |
1.2 (4) |
W (28 days) |
| Jan 2004 |
1,353 |
1.2 (28) |
W (27 days) |
| Feb 2004 |
516 |
1.0 (16) |
W (26 days) |
| Mar 2004 |
3,810 (590 on 7th) |
1.0 (3) |
W (25 days) |
| Apr 2004 |
317 |
1.0 (16) |
W (24 days) |
| May 2004 |
1,014 |
0.6 (21, 28) |
W (13 days) |
| Jun 2004 |
1,134 (tremor amp. increased to 4 µm/s) |
0.8 (30) |
W (13 days) |
| Jul 2004 |
1,025 |
1.0 (26) |
W (16 days) |
| Aug 2004 |
643 |
1.2 (9) |
W (11 days) |
| Sep 2004 |
468 |
1.0 (13) |
W (14 days) |
| Oct 2004 |
776 |
1.0 (31) |
W (21 days) |
| Nov 2004 |
1,015 |
1.0 (29) |
W (25 days), G (1 day, 30th) |
| Dec 2004 |
1,634 |
1.5 (25) |
W (28 days), G (1 day, 2nd) |
| Jan 2005 |
416 (tremor amp. drops below 1 µm/s) |
1.0 (14, 22) |
W (28 days) |
The number of monthly events remained above 500 through February 2004, with counts of 1,449 in December 2003 and 1,353 in January 2004. Seismicity increased significantly during 5-15 March 2004, with more than 400 daily events recorded during 6-10 March (a high of 590 events on the 7th), before gradually declining, but resulting in a monthly total of 3,810. No unusual activity or eruptions accompanied the elevated seismicity. Although seismicity dropped in April 2004, more than 1,000 monthly seismic events were recorded during May-July 2004.
Seismicity was high again in November (1,015 events) and December (1,634 events) 2004, but the December seismicity was primarily due to over 700 events during 2-3 December. The amplitude of the continuous tremor also increased from below 1 ?m/s to around 4 ?m/s in June 2004. Amplitudes remained elevated, though variable, through December 2004.
On 30 November 2004 a minor ash eruption occurred after a 2-year lull. A minor eruption is defined as a small explosion with minor ash emission and plume height of less than 1 km. The Japanese Meteorological Agency (JMA) noted another gray plume on 2 December, and the Geological Survey of Japan (GSJ) listed minor eruptions on 2, 7-8, and 9 December 2004.
As of April 2005, the SO2 flux was about 2,000-5,000 tons/day. The danger of destructive eruptions was considered to be small, and some residents of the island (~ 3,800 people), who had been evacuated since September 2000 were returning home as of May 2005. However, the GSJ noted minor eruptions again on 12 April and 18 May 2005.
Geologic Background. The circular, 8-km-wide island of Miyakejima forms a low-angle stratovolcano that rises about 1,100 m from the sea floor in the northern Izu Islands about 200 km SSW of Tokyo. The basaltic volcano is truncated by small summit calderas, one of which, 3.5 km wide, was formed during a major eruption about 2,500 years ago. Numerous craters and vents, including maars near the coast and radially oriented fissure vents, are present on the flanks. Frequent eruptions have been recorded since 1085 CE at vents ranging from the summit to below sea level, causing much damage on this small populated island. After a three-century-long hiatus ending in 1469 CE, activity has been dominated by flank fissure eruptions sometimes accompanied by minor summit eruptions. A 1.6-km-wide summit crater was slowly formed by subsidence during an eruption in 2000.
Information Contacts: Japan Meteorological Agency (JMA), Volcanological Division, 1-3-4 Ote-machi, Chiyoda-ku, Tokyo 100, Japan (URL: http://www.jma.go.jp/); A. Tomiya, Geological Survey of Japan (AIST), 1-1 Higashi, 1-Chome Tsukuba, Ibaraki 305-856, Japan (URL: https://staff.aist.go.jp/a.tomiya/miyakeE.html); Kazahaya Kohei, Geological Survey of Japan (URL: https://staff.aist.go.jp/kazahaya-k/miyakegas/COSPEC.html); Earthquake Research Institute (ERI), University of Tokyo,Yayoi 1-1-1, Bunkyo-ku, Tokyo, 113-0032, Japan.
Monowai (New Zealand) — July 2005 Cite this Report
Monowai
New Zealand
25.887°S, 177.188°W; summit elev. -132 m
All times are local (unless otherwise noted)
Activity revealed by T phase swarms in 2004 and 2005
Monowai is a frequently active submarine volcano; during April-November 2003, eleven earthquake and T phase swarms from Monowai were recorded by the Polynesian seismic network (Réseau Sismique Polynésien, RSP) operated by the Laboratoire de Geophysique (LDG) (BGVN 28:11). Approximately 260 T phases in 2004 and 365 in January-August 2005 were detected and analyzed by LDG.
In 2004, four short swarms, of 2-3 days duration and 50-80 T phases per swarm (figure 16), occurred on 18-19 February, 31 March-2 April, 27-29 June, and 14 August. Between August 2004 and March 2005, no T phases from Monowai were recorded, indicating a period of quiescence at the volcano. In 2005, T phase swarms from Monowai were recorded on 2-3 March, 16-21 April, and 25-26 May.
As of early August 2005, volcanic activity, as indicated by T phases recorded by RSP, resumed, though numerous events have not yet been analyzed.
Geologic Background. Monowai, also known as Orion seamount, is a basaltic stratovolcano that rises from a depth of about 1,500 to within 100 m of the ocean surface about halfway between the Kermadec and Tonga island groups, at the southern end of the Tonga Ridge. Small cones occur on the N and W flanks, and an 8.5 x 11 km submarine caldera with a depth of more than 1,500 m lies to the NNE. Numerous eruptions have been identified using submarine acoustic signals since it was first recognized as a volcano in 1977. A shoal that had been reported in 1944 may have been a pumice raft or water disturbance due to degassing. Surface observations have included water discoloration, vigorous gas bubbling, and areas of upwelling water, sometimes accompanied by rumbling noises. It was named for one of the New Zealand Navy bathymetric survey ships that documented its morphology.
Information Contacts: Dominique Reymond and Olivier Hyvernaud, Laboratoire de Geophysique, CEA/DASE/LDG Tahiti, PO Box 640, Papeete, French Polynesia.
Rabaul (Papua New Guinea) — July 2005 Cite this Report
Rabaul
Papua New Guinea
4.2459°S, 152.1937°E; summit elev. 688 m
All times are local (unless otherwise noted)
Continuing low-level eruptions and ash emissions
As of July 2004 Tavurvur was releasing white vapor in variable amounts, seismicity was at a low level, and ground deformation continued as slow uplift (BGVN 29:07). Eruptive activity had stopped months earlier, in February 2004 (BGVN 29:04).
On 25 January 2005 ash rose to ~ 500 m above the summit and drifted E. Another ash emission on 31 January reached ~ 1 km above the summit but was not visible on satellite imagery. During 1-21 February, frequent eruptions of ash clouds rose a few hundred meters, drifted SE, and deposited ash mainly offshore. However, ashfall was reported in the town of Tokua during 18-21 February. Incandescent lava fragments were visible on several evenings. Between 200 and 350 daily earthquakes were associated with the eruptions. The number of seismic events leveled off around 20 February to between 150 and 200 per day. During 22-24 February ash fell offshore, but there were also reports of fine ash reaching Tokua airport.
Low-level eruptions continued during the first two weeks of March. During 22-28 March, eruptions continued every 10-20 minutes. Ash clouds rose several hundred meters above the summit, and moderate ash fell in Rabaul Town during 25-28 March. There were 100-200 daily earthquakes associated with the eruptions. No changes were recorded in ground deformation.
During April, May, and most of June 2005, low-level eruptive activity consisted of occasional emission of diffuse pale gray to gray ash clouds, which rose a few hundred meters above the summit. On 1-5, 17-22, and 25-30 April the ash clouds were blown NNW; on 6-16 and 23-24 April they drifted ESE. Fine ashfall occurred over Rabaul Town and villages downwind. Occasional roaring noises were heard throughout April. The daily average number of low-frequency seismic events increased from about 40 during the first half of the April to about 100 in the second half. One high-frequency event, on 26 April, was located NE of the caldera. Ground deformation indicated an inflationary trend. The real-time GPS site on Matupit Island, in the center of the caldera, has shown an inflationary trend since January 2005.
Photographs taken by visitors to Rabaul in late May to early June documented activity from two separate vents at Tavurvur. On 25 May there were two distinct plumes, one a very dark, coherent, ash column and the other a more diffuse white or light gray emission; the plumes appeared to mix a short distance above the volcano (figure 40). A single larger gray plume was seen on 5 June (figure 41). On 27 June the Darwin VAAC received a pilot report of an ash plume 37 km to the NW of the volcano. A pilot observed an ash plume from Rabaul on 28 July at a height of 3 km, but ash was not visible on satellite data.
On 9 August, a low-level ash plume at an altitude of 1.5 km was visible on a satellite image of Rabaul. As of mid-August Tavurvur continued to erupt with discrete ash emissions, although their frequency had declined and most were less vigorous. Some of the of ash-laden clouds were also lighter in color, suggesting less ash content. Ash plumes rose between 800 and 1,500 m and drifted N and NW, occasionally depositing ash on the E part of Rabaul Town and in areas farther downwind. Roaring and rumbling noises accompanied the activity. Projections of incandescent lava fragments were visible at night but were less conspicuous compared to the previous week. Seismicity was at a moderate to high level with most earthquakes associated with ash emissions and explosions. However, small low-frequency earthquakes not associated with ash emissions were also recorded. No high-frequency earthquakes were recorded. Ground deformation measurements from GPS and tide gauge instruments fluctuated, but the general trend showed a slow rate of uplift. As a safety precaution, people continue to be discouraged from venturing within 1 km of the erupting vent.
Geologic Background. The low-lying Rabaul caldera on the tip of the Gazelle Peninsula at the NE end of New Britain forms a broad sheltered harbor utilized by what was the island's largest city prior to a major eruption in 1994. The outer flanks of the asymmetrical shield volcano are formed by thick pyroclastic-flow deposits. The 8 x 14 km caldera is widely breached on the east, where its floor is flooded by Blanche Bay and was formed about 1,400 years ago. An earlier caldera-forming eruption about 7,100 years ago is thought to have originated from Tavui caldera, offshore to the north. Three small stratovolcanoes lie outside the N and NE caldera rims. Post-caldera eruptions built basaltic-to-dacitic pyroclastic cones on the caldera floor near the NE and W caldera walls. Several of these, including Vulcan cone, which was formed during a large eruption in 1878, have produced major explosive activity during historical time. A powerful explosive eruption in 1994 occurred simultaneously from Vulcan and Tavurvur volcanoes and forced the temporary abandonment of Rabaul city.
Information Contacts: Ima Itikarai and Herman Patia, Rabaul Volcano Observatory (RVO), P. O. Box 386, Rabaul, Papua New Guinea; Darwin Volcanic Ash Advisory Center, Bureau of Meteorology, Northern Territory Regional Office, PO Box 40050, Casuarina, Northern Territory 0811, Australia; Roy E. Price, Geology Department, University of South Florida, 4202 East Fowler Ave., Tampa, FL 33620, USA.
Suwanosejima (Japan) — July 2005 Cite this Report
Suwanosejima
Japan
29.638°N, 129.714°E; summit elev. 796 m
All times are local (unless otherwise noted)
Eruptions during April 2004-July 2005 send plumes to varying heights
Several small eruptions during December 2003 and January 2004 at Suwanose-jima produced ash plumes to unknown heights (BGVN 29:03). Little activity was observed during the first four months of 2004. From the end of April 2004 to the end of July 2005, numerous eruptions and explosions produced plumes reported by the Tokyo Volcanic Ash Advisory Center (VAAC), including some observed by pilots (table 3).
Table 3. Summary of activity at Suwanose-jima from April 2004 to July 2005 based on information from the Tokyo VAAC. "--" indicates data not reported or unknown.
| Date |
Time Period |
Plume Altitude (km) |
Drift Direction |
Activity |
| 28 Apr 2004 |
-- |
3 |
SE |
Ash emission |
| 01 May 2004 |
0906 |
-- |
-- |
Explosion |
| 07 Jun 2004 |
-- |
2 |
E |
Gas plume |
| 08 Jun 2004 |
-- |
2 |
E |
Gas and ash |
| 09 Jun 2004 |
1003 |
1.8 |
E |
Ash plume |
| 09 Jun 2004 |
1300 |
-- |
-- |
Ash plume |
| 30 Jun-05 Jul 2004 |
various |
max 1.9 |
-- |
Several explosions |
| 30 Nov 2004 |
1607 |
1.2 |
-- |
Eruption |
| 20 Dec 2004 |
-- |
1.8 |
SE |
Eruption |
| 21 Dec 2004 |
-- |
-- |
SE |
Eruption |
| 22 Dec 2004 |
-- |
-- |
-- |
Ash plume |
| 24 Dec 2004 |
-- |
-- |
-- |
Ash plume |
| 25 Dec 2004 |
-- |
-- |
-- |
Ash plume |
| 27 Dec 2004 |
-- |
-- |
-- |
Ash plume |
| 29 Dec 2004 |
-- |
1.2 |
-- |
Ash plume |
| 01 Jan 2005 |
-- |
-- |
-- |
Eruption |
| 04 Jan 2005 |
-- |
-- |
-- |
Eruption |
| 06 Mar 2005 |
-- |
1.5 |
-- |
Ash emission |
| 08 Mar 2005 |
-- |
1.2 |
-- |
Ash emission |
| 09 Mar 2005 |
-- |
1.8 |
-- |
Ash plume |
| 26 Apr 2005 |
-- |
1.2 |
E |
Eruption |
| 26 May-31 May 2005 |
various |
max 2.1 |
-- |
Several ash explosions |
| 01 Jun-06 Jun 2005 |
various |
Several ash explosions |
1.8 |
-- |
| 06 Jul 2005 |
various |
-- |
-- |
Several ash explosions |
| 27 Jul 2005 |
-- |
0.8 |
-- |
Eruption with ash |
| 28 Jul 2005 |
-- |
2.4 |
-- |
Ash plume |
Geologic Background. The 8-km-long island of Suwanosejima in the northern Ryukyu Islands consists of an andesitic stratovolcano with two active summit craters. The summit is truncated by a large breached crater extending to the sea on the E flank that was formed by edifice collapse. One of Japan's most frequently active volcanoes, it was in a state of intermittent Strombolian activity from Otake, the NE summit crater, between 1949 and 1996, after which periods of inactivity lengthened. The largest recorded eruption took place in 1813-14, when thick scoria deposits covered residential areas, and the SW crater produced two lava flows that reached the western coast. At the end of the eruption the summit of Otake collapsed, forming a large debris avalanche and creating an open collapse scarp extending to the eastern coast. The island remained uninhabited for about 70 years after the 1813-1814 eruption. Lava flows reached the eastern coast of the island in 1884. Only about 50 people live on the island.
Information Contacts: Tokyo Volcanic Ash Advisory Center, Japan Meteorological Agency (JMA), 1-3-4 Ote-machi, Chiyoda-ku, Tokyo 100, Japan (URL: https://ds.data.jma.go.jp/svd/vaac/data/).
Ulawun (Papua New Guinea) — July 2005 Cite this Report
Ulawun
Papua New Guinea
5.05°S, 151.33°E; summit elev. 2334 m
All times are local (unless otherwise noted)
Frequent ash/steam plumes during March-August 2005
Long steam plumes during 22-23 August 2004 (BGVN 29:07) were observed on satellite imagery. Additional plumes were seen earlier that month, prompting the Darwin Volcanic Ash Advisory Center to issue advisories on four days.
Ulawun remained quiet from August 2004 until March 2005. During March 2005, weak to moderate volumes of thick white vapor were released from the main crater. On 27 and 28 March light gray emissions were observed, and small continuous volcanic tremor was recorded for six hours. The N vent remained quiet. Seismic activity continued at low levels with low-frequency earthquakes recorded. A tiltmeter was installed on 15 March but no significant movements were detected.
During April-July 2005 white vapor from the main vent was common, and plumes were frequently visible on satellite imagery. On 6 April, a thin plume was visible extending ~ 55 km to the SW. On 19 May a small plume to an unknown height extended W. Plumes to unknown altitudes were again released on 3 and 6 June. Plumes rising to 3 km altitude were seen on satellite imagery on 6 and 21 June. The 21 June plume contained ash, and initially extended W and WSW; imagery about six hours later showed the plume blowing NW. A short plume was visible at ~ 3 km altitude during 22-27 June, and on 27 June a pilot reported that the plume extended 37 km. During 30 June to 1 July, thin ash plumes were visible on satellite imagery, but heights were not given. No noise, night-time glow, or emissions were reported during this time. Small low-frequency earthquakes were recorded. Volcanic tremor was registered on 16-17 June.
On 9 August a plume drifting to the S was visible on satellite imagery (figure 10). During the rest of August, the summit crater released thick white vapor. Seismicity was characterized by small low-frequency earthquakes. One high-frequency earthquake and small periodic volcanic tremors were recorded.
Geologic Background. The symmetrical basaltic-to-andesitic Ulawun stratovolcano is the highest volcano of the Bismarck arc, and one of Papua New Guinea's most frequently active. The volcano, also known as the Father, rises above the N coast of the island of New Britain across a low saddle NE of Bamus volcano, the South Son. The upper 1,000 m is unvegetated. A prominent E-W escarpment on the south may be the result of large-scale slumping. Satellitic cones occupy the NW and E flanks. A steep-walled valley cuts the NW side, and a flank lava-flow complex lies to the south of this valley. Historical eruptions date back to the beginning of the 18th century. Twentieth-century eruptions were mildly explosive until 1967, but after 1970 several larger eruptions produced lava flows and basaltic pyroclastic flows, greatly modifying the summit crater.
Information Contacts: Ima Itikarai, Rabaul Volcano Observatory (RVO), P. O. Box 386, Rabaul, Papua New Guinea; David Innes, Air Niugini, PO Box 7186, Boroko, Port Moresby, National Capital District, Papua New Guinea (URL: http://www.airniugini.com.pg/); Darwin Volcanic Ash Advisory Centre (VAAC), Commonwealth Bureau of Meteorology, Northern Territory Regional Office, PO Box 40050, Casuarina, NT 0811, Australia (URL: http://www.bom.gov.au/info/vaac/).
Witori (Papua New Guinea) — July 2005 Cite this Report
Witori
Papua New Guinea
5.5745°S, 150.5161°E; summit elev. 724 m
All times are local (unless otherwise noted)
Low-level vapor emissions and seismicity through August 2005
Pago has remained quiet during April-August 2005, with no reports of volcanism since the end of the most recent eruption in early 2003 (BGVN 28:03 and 28:09). Reports since that time have described low-level emissions and seismicity (BGVN 28:12, 29:02, 29:04, 29:07).
In April the upper vents and the summit crater released small amounts of white vapor and occasional thin white vapor was reported from the lower vents. Seismic activity was low; the daily number of low-frequency earthquakes ranged from zero to a few. In June weak emissions of thin white vapor continued to be released from the upper vents but no emissions were noted from the lower vents. Seismicity in June remained low, with no more than 8 small, high-frequency earthquakes recorded per day. Similar activity continued through August. Visual observations on 27 and 28 August revealed emissions of very small volumes of thin white vapor being released from the upper vents of the fissure system. No emissions originated from the lower or main summit vents. Seismic activity was low throughout the month, and some small high-frequency earthquakes were recorded. The greatest number of high-frequency events recorded on any given day was 7 on 25 August. No noises were heard and no glow was observed during the reporting period.
Geologic Background. The active Pago cone has grown within the Witori caldera (5.5 x 7.5 km) on the northern coast of central New Britain contains the active Pago cone. The gently sloping outer caldera flanks consist primarily of dacitic pyroclastic-flow and airfall deposits produced during a series of five major explosive eruptions from about 5,600 to 1,200 years ago, many of which may have been associated with caldera formation. Pago cone may have formed less than 350 years ago; it has grown to a height above the caldera rim, and a series of ten dacitic lava flows from it covers much of the caldera floor. The youngest of these was erupted during 2002-2003 from vents extending from the summit nearly to the NW caldera wall. The Buru caldera cuts the SW flank.
Information Contacts: Ima Itikarai and Herman Patia, Rabaul Volcano Observatory (RVO), P. O. Box 386, Rabaul, Papua New Guinea.