Recently Published Bulletin Reports
Erebus (Antarctica) Lava lake remains active; most thermal alerts recorded since 2019
Rincon de la Vieja (Costa Rica) Frequent phreatic explosions during July-December 2023
Bezymianny (Russia) Explosion on 18 October 2023 sends ash plume 8 km high; lava flows and incandescent avalanches
Kilauea (United States) Low-level lava effusions in the lava lake at Halema’uma’u during July-December 2022
Nyamulagira (DR Congo) Lava flows and thermal activity during May-October 2023
Bagana (Papua New Guinea) Explosions, ash plumes, ashfall, and lava flows during April-September 2023
Mayon (Philippines) Lava flows, pyroclastic flows, ash emissions, and seismicity during April-September 2023
Nishinoshima (Japan) Eruption plumes and gas-and-steam plumes during May-August 2023
Krakatau (Indonesia) White gas-and-steam plumes and occasional ash plumes during May-August 2023
Villarrica (Chile) Strombolian activity, gas-and-ash emissions, and crater incandescence during April-September 2023
Merapi (Indonesia) Frequent incandescent avalanches during April-September 2023
Ebeko (Russia) Moderate explosive activity with ash plumes continued during June-November 2023
Erebus (Antarctica) — January 2024  Cite this Report
Erebus
Antarctica
77.53°S, 167.17°E; summit elev. 3794 m
All times are local (unless otherwise noted)
Lava lake remains active; most thermal alerts recorded since 2019
The lava lake in the summit crater of Erebus has been active since at least 1972. Located in Antarctica overlooking the McMurdo Station on Ross Island, it is the southernmost active volcano on the planet. Because of the remote location, activity is primarily monitored by satellites. This report covers activity during 2023.
The number of thermal alerts recorded by the Hawai'i Institute of Geophysics and Planetology’s MODVOLC Thermal Alerts System increased considerably in 2023 compared to the years 2020-2022 (table 9). In contrast to previous years, the MODIS instruments aboard the Aqua and Terra satellites captured data from Erebus every month during 2023. Consistent with previous years, the lowest number of anomalous pixels were recorded in January, November, and December.
Table 9. Number of monthly MODIS-MODVOLC thermal alert pixels recorded at Erebus during 2017-2023. See BGVN 42:06 for data from 2000 through 2016. The table was compiled using data provided by the HIGP – MODVOLC Thermal Alerts System.
| Year |
Jan |
Feb |
Mar |
Apr |
May |
Jun |
Jul |
Aug |
Sep |
Oct |
Nov |
Dec |
SUM |
| 2017 |
0 |
21 |
9 |
0 |
0 |
1 |
11 |
61 |
76 |
52 |
0 |
3 |
234 |
| 2018 |
0 |
21 |
58 |
182 |
55 |
17 |
137 |
172 |
103 |
29 |
0 |
0 |
774 |
| 2019 |
2 |
21 |
162 |
151 |
55 |
56 |
75 |
53 |
29 |
19 |
1 |
0 |
624 |
| 2020 |
0 |
2 |
16 |
18 |
4 |
4 |
1 |
3 |
18 |
3 |
1 |
6 |
76 |
| 2021 |
0 |
9 |
1 |
0 |
2 |
56 |
46 |
47 |
35 |
52 |
5 |
3 |
256 |
| 2022 |
1 |
13 |
55 |
22 |
15 |
32 |
39 |
19 |
31 |
11 |
0 |
0 |
238 |
| 2023 |
2 |
33 |
49 |
82 |
41 |
32 |
70 |
64 |
42 |
17 |
5 |
11 |
448 |
Sentinel-2 infrared images showed one or two prominent heat sources within the summit crater, accompanied by adjacent smaller sources, similar to recent years (see BGVN 46:01, 47:02, and 48:01). A unique image was obtained on 25 November 2023 by the OLI-2 (Operational Land Imager-2) on Landsat 9, showing the upper part of the volcano surrounded by clouds (figure 32).
Geologic Background. Mount Erebus, the world's southernmost historically active volcano, overlooks the McMurdo research station on Ross Island. It is the largest of three major volcanoes forming the crudely triangular Ross Island. The summit of the dominantly phonolitic volcano has been modified by one or two generations of caldera formation. A summit plateau at about 3,200 m elevation marks the rim of the youngest caldera, which formed during the late-Pleistocene and within which the modern cone was constructed. An elliptical 500 x 600 m wide, 110-m-deep crater truncates the summit and contains an active lava lake within a 250-m-wide, 100-m-deep inner crater; other lava lakes are sometimes present. The glacier-covered volcano was erupting when first sighted by Captain James Ross in 1841. Continuous lava-lake activity with minor explosions, punctuated by occasional larger Strombolian explosions that eject bombs onto the crater rim, has been documented since 1972, but has probably been occurring for much of the volcano's recent history.
Information Contacts: Hawai'i Institute of Geophysics and Planetology (HIGP) - MODVOLC Thermal Alerts System, School of Ocean and Earth Science and Technology (SOEST), Univ. of Hawai'i, 2525 Correa Road, Honolulu, HI 96822, USA (URL: http://modis.higp.hawaii.edu/); Copernicus Browser, Copernicus Data Space Ecosystem, European Space Agency (URL: https://dataspace.copernicus.eu/browser/); NASA Earth Observatory, EOS Project Science Office, NASA Goddard Space Flight Center, Goddard, Maryland, USA (URL: https://earthobservatory.nasa.gov/images/152134/erebus-breaks-through).
Rincon de la Vieja (Costa Rica) — January 2024 Cite this Report
Rincon de la Vieja
Costa Rica
10.83°N, 85.324°W; summit elev. 1916 m
All times are local (unless otherwise noted)
Frequent phreatic explosions during July-December 2023
Rincón de la Vieja is a volcanic complex in Costa Rica with a hot convecting acid lake that exhibits frequent weak phreatic explosions, gas-and-steam emissions, and occasional elevated sulfur dioxide levels (BGVN 45:10, 46:03, 46:11). The current eruption period began June 2021. This report covers activity during July-December 2023 and is based on weekly bulletins and occasional daily reports from the Observatorio Vulcanologico Sismologica de Costa Rica-Universidad Nacional (OVSICORI-UNA).
Numerous weak phreatic explosions continued during July-December 2023, along with gas-and-steam emissions and plumes that rose as high as 3 km above the crater rim. Many weekly OVSICORI-UNA bulletins included the previous week's number of explosions and emissions (table 9). For many explosions, the time of explosion was given (table 10). Frequent seismic activity (long-period earthquakes, volcano-tectonic earthquakes, and tremor) accompanied the phreatic activity.
Table 9. Number of reported weekly phreatic explosions and gas-and-steam emissions at Rincón de la Vieja, July-December 2023. Counts are reported for the week before the Weekly Bulletin date; not all reports included these data. Courtesy of OVSICORI-UNA.
| OVSICORI Weekly Bulletin |
Number of explosions |
Number of emissions |
| 28 Jul 2023 |
6 |
14 |
| 4 Aug 2023 |
10 |
12 |
| 1 Sep 2023 |
13 |
11 |
| 22 Sep 2023 |
12 |
13 |
| 29 Sep 2023 |
6 |
11 |
| 6 Oct 2023 |
12 |
5 |
| 13 Oct 2023 |
7 |
9 |
| 20 Oct 2023 |
1 |
15 |
| 27 Oct 2023 |
3 |
23 |
| 3 Nov 2023 |
3 |
10 |
| 17 Nov 2023 |
0 |
Some |
| 24 Nov 2023 |
0 |
14 |
| 8 Dec 2023 |
4 |
16 |
| 22 Dec 2023 |
8 |
18 |
Table 10. Summary of activity at Rincón de la Vieja during July-December 2023. Weak phreatic explosions and gas emissions are noted where the time of explosion was indicated in the weekly or daily bulletins. Height of plumes or emissions are distance above the crater rim. Courtesy of OVSICORI-UNA.
| Date |
Time |
Description of Activity |
| 1 Jul 2023 |
0156 |
Explosion. |
| 2 Jul 2023 |
0305 |
Explosion. |
| 4 Jul 2023 |
0229, 0635 |
Event at 0635 produced a gas-and-steam plume that rose 700 m and drifted W; seen by residents in Liberia (21 km SW). |
| 9 Jul 2023 |
1843 |
Explosion. |
| 21 Jul 2023 |
0705 |
Explosion. |
| 26 Jul 2023 |
1807 |
Explosion. |
| 28 Jul 2023 |
0802 |
Explosion generated a gas-and-steam plume that rose 500 m. |
| 30 Jul 2023 |
1250 |
Explosion. |
| 31 Jul 2023 |
2136 |
Explosion. |
| 11 Aug 2023 |
0828 |
Explosion. |
| 18 Aug 2023 |
1304 |
Explosion. |
| 21 Aug 2023 |
1224 |
Explosion generated gas-and-steam plumes rose 500-600 m. |
| 22 Aug 2023 |
0749 |
Explosion generated gas-and-steam plumes rose 500-600 m. |
| 24 Aug 2023 |
1900 |
Explosion. |
| 25 Aug 2023 |
0828 |
Event produced a steam-and-gas plume that rose 3 km and drifted NW. |
| 27-28 Aug 2023 |
0813 |
Four small events; the event at 0813 on 28 August lasted two minutes and generated a steam-and-gas plume that rose 2.5 km. |
| 1 Sep 2023 |
1526 |
Explosion generated plume that rose 2 km and ejected material onto the flanks. |
| 2-3 Sep 2023 |
- |
Small explosions detected in infrasound data. |
| 4 Sep 2023 |
1251 |
Gas-and-steam plume rose 1 km and drifted W. |
| 7 Nov 2023 |
1113 |
Explosion. |
| 8 Nov 2023 |
0722 |
Explosion. |
| 12 Nov 2023 |
0136 |
Small gas emissions. |
| 14 Nov 2023 |
0415 |
Small gas emissions. |
According to OVSICORI-UNA, during July-October the average weekly sulfur dioxide (SO2) flux ranged from 68 to 240 tonnes/day. However, in mid-November the flux increased to as high as 334 tonnes/day, the highest value measured in recent years. The high SO2 flux in mid-November was also detected by the TROPOMI instrument on the Sentinel-5P satellite (figure 43).
Geologic Background. Rincón de la Vieja, the largest volcano in NW Costa Rica, is a remote volcanic complex in the Guanacaste Range. The volcano consists of an elongated, arcuate NW-SE-trending ridge constructed within the 15-km-wide early Pleistocene Guachipelín caldera, whose rim is exposed on the south side. Sometimes known as the "Colossus of Guanacaste," it has an estimated volume of 130 km3 and contains at least nine major eruptive centers. Activity has migrated to the SE, where the youngest-looking craters are located. The twin cone of Santa María volcano, the highest peak of the complex, is located at the eastern end of a smaller, 5-km-wide caldera and has a 500-m-wide crater. A Plinian eruption producing the 0.25 km3 Río Blanca tephra about 3,500 years ago was the last major magmatic eruption. All subsequent eruptions, including numerous historical eruptions possibly dating back to the 16th century, have been from the prominent active crater containing a 500-m-wide acid lake located ENE of Von Seebach crater.
Information Contacts: Observatorio Vulcanológico Sismológica de Costa Rica-Universidad Nacional (OVSICORI-UNA), Apartado 86-3000, Heredia, Costa Rica (URL: http://www.ovsicori.una.ac.cr/); NASA Global Sulfur Dioxide Monitoring Page, Atmospheric Chemistry and Dynamics Laboratory, NASA Goddard Space Flight Center (NASA/GSFC), 8800 Greenbelt Road, Goddard MD 20771, USA (URL: https://so2.gsfc.nasa.gov/).
Bezymianny (Russia) — November 2023 Cite this Report
Bezymianny
Russia
55.972°N, 160.595°E; summit elev. 2882 m
All times are local (unless otherwise noted)
Explosion on 18 October 2023 sends ash plume 8 km high; lava flows and incandescent avalanches
Bezymianny, located on Russia’s Kamchatka Peninsula, has had eruptions since 1955 characterized by dome growth, explosions, pyroclastic flows, ash plumes, and ashfall. Activity during November 2022-April 2023 included gas-and-steam emissions, lava dome collapses generating avalanches, and persistent thermal activity. Similar eruptive activity continued from May through October 2023, described here based on information from weekly and daily reports of the Kamchatka Volcano Eruptions Response Team (KVERT), notices from Tokyo VAAC (Volcanic Ash Advisory Center), and from satellite data.
Overall activity decreased after the strong period of activity in late March through April 2023, which included ash explosions during 29 March and 7-8 April 2023 that sent plumes as high as 10-12 km altitude, along with dome growth and lava flows (BGVN 48:05). This reduced activity can be seen in the MIROVA thermal detection system graph (figure 56), which was consistent with data from the MODVOLC thermal detection system and with Sentinel-2 satellite images that showed persistent hotspots in the summit crater when conditions allowed observations. A renewed period of strong activity began in mid-October 2023.
Activity increased significantly on 17 October 2023 when large collapses began during 0700-0830 on the E flanks of the lava dome and continued to after 0930 the next day (figure 57). Ash plumes rose to an altitude of 4.5-5 km, extending 220 km NNE by 18 October. A large explosion at 1630 on 18 October produced an ash plume that rose to an altitude of 11 km (8 km above the summit) and drifted NNE and then NW, extending 900 km NW within two days at an altitude of 8 km. Minor ashfall was noted in Kozyrevsk (45 km WNW). At 0820 on 20 October an ash plume was identified in satellite images drifting 100 km ENE at altitudes of 4-4.5 km.
Lava flows and hot avalanches from the dome down the SE flank continued over the next few days, including 23 October when clear conditions allowed good observations (figures 58 and 59). A large thermal anomaly was observed over the volcano through 24 October, and in the summit crater on 30 October (figure 60). Strong fumarolic activity continued, with numerous avalanches and occasional incandescence. By the last week of October, volcanic activity had decreased to a level consistent with that earlier in the reporting period.
Aviation warnings were frequently updated during 17-20 October. KVERT issued a Volcano Observatory Notice for Aviation (VONA) on 17 October at 1419 and 1727 (0219 and 0527 UTC) raising the Aviation Color Code (ACC) from Yellow to Orange (second highest level). The next day, KVERT issued a VONA at 1705 (0505 UTC) raising the ACC to Red (highest level) but lowered it back to Orange at 2117 (0917 UTC). After another decrease to Yellow and back to Orange, the ACC was reduced to Yellow on 20 October at 1204 (0004 UTC). In addition, the Tokyo VAAC issued a series of Volcanic Ash Advisories beginning on 16 October and continuing through 30 October.
Geologic Background. The modern Bezymianny, much smaller than its massive neighbors Kamen and Kliuchevskoi on the Kamchatka Peninsula, was formed about 4,700 years ago over a late-Pleistocene lava-dome complex and an edifice built about 11,000-7,000 years ago. Three periods of intensified activity have occurred during the past 3,000 years. The latest period, which was preceded by a 1,000-year quiescence, began with the dramatic 1955-56 eruption. This eruption, similar to that of St. Helens in 1980, produced a large open crater that was formed by collapse of the summit and an associated lateral blast. Subsequent episodic but ongoing lava-dome growth, accompanied by intermittent explosive activity and pyroclastic flows, has largely filled the 1956 crater.
Information Contacts: Kamchatka Volcanic Eruptions Response Team (KVERT), Far Eastern Branch, Russian Academy of Sciences, 9 Piip Blvd., Petropavlovsk-Kamchatsky, 683006, Russia (URL: http://www.kscnet.ru/ivs/kvert/); Kamchatka Volcanological Station, Kamchatka Branch of Geophysical Survey, (KB GS RAS), Klyuchi, Kamchatka Krai, Russia (URL: http://volkstat.ru/); Tokyo Volcanic Ash Advisory Center (VAAC), 1-3-4 Otemachi, Chiyoda-ku, Tokyo 100-8122, Japan (URL: http://ds.data.jma.go.jp/svd/vaac/data/); Hawai'i Institute of Geophysics and Planetology (HIGP) - MODVOLC Thermal Alerts System, School of Ocean and Earth Science and Technology (SOEST), Univ. of Hawai'i, 2525 Correa Road, Honolulu, HI 96822, USA (URL: http://modis.higp.hawaii.edu/); MIROVA (Middle InfraRed Observation of Volcanic Activity), a collaborative project between the Universities of Turin and Florence (Italy) supported by the Centre for Volcanic Risk of the Italian Civil Protection Department (URL: http://www.mirovaweb.it/); Copernicus Browser, Copernicus Data Space Ecosystem, European Space Agency (URL: https://dataspace.copernicus.eu/browser/).chr
Kilauea (United States) — January 2023 Cite this Report
Kilauea
United States
19.421°N, 155.287°W; summit elev. 1222 m
All times are local (unless otherwise noted)
Low-level lava effusions in the lava lake at Halema’uma’u during July-December 2022
Kīlauea is the southeastern-most volcano in Hawaii and overlaps the E flank of the Mauna Loa volcano. Its East Rift Zone (ERZ) has been intermittently active for at least 2,000 years. An extended eruption period began in January 1983 and was characterized by open lava lakes and lava flows from the summit caldera and the East Rift Zone. During May 2018 magma migrated into the Lower East Rift Zone (LERZ) and opened 24 fissures along a 6-km-long NE-trending fracture zone that produced lava flows traveling in multiple directions. As lava emerged from the fissures, the lava lake at Halema'uma'u drained and explosions sent ash plumes to several kilometers altitude (BGVN 43:10).
The current eruption period started during September 2021 and has recently been characterized by lava effusions, spatter, and sulfur dioxide emissions in the active Halema’uma’u lava lake (BGVN 47:08). Lava effusions, some spatter, and sulfur dioxide emissions have continued during this reporting period of July through December 2022 using daily reports, volcanic activity notices, and abundant photo, map, and video data from the US Geological Survey's (USGS) Hawaiian Volcano Observatory (HVO).
Summary of activity during July-December 2022. Low-level effusions have continued at the western vent of the Halema’uma’u crater during July through early December 2022. Occasional weak ooze-outs (also called lava break outs) would occur along the margins of the crater floor. The overall level of the active lava lake throughout the reporting period gradually increased due to infilling, however it stagnated in mid-September (table 13). During September through November, activity began to decline, though lava effusions persisted at the western vent. By 9 December, the active part of the lava lake had completely crusted over, and incandescence was no longer visible.
Table 13. Summary of measurements taken during overflights at Kīlauea that show a gradual increase in the active lava lake level and the volume of lava effused since 29 September 2021. Lower activity was reported during September-October. Data collected during July-December 2022. Courtesy of HVO.
| Date: |
Level of the active lava lake (m): |
Cumulative volume of lava effused (million cubic meters): |
| 7 Jul 2022 |
130 |
95 |
| 19 Jul 2022 |
133 |
98 |
| 4 Aug 2022 |
136 |
102 |
| 16 Aug 2022 |
137 |
104 |
| 12 Sep 2022 |
143 |
111 |
| 5 Oct 2022 |
143 |
111 |
| 28 Oct 2022 |
143 |
111 |
Activity during July 2022. Lava effusions were reported from the western vent in the Halema’uma’u crater, along with occasional weak ooze-outs along the margins of the crater floor. The height of the lava lake was variable due to deflation-inflation tilt events; for example, the lake level dropped approximately 3-4 m during a summit deflation-inflation event reported on 1 July. Webcam images taken during the night of 6-12 July showed intermittent low-level spattering at the western vent that rose less than 10 m above the vent (figure 519). Measurements made during an overflight on 7 July indicated that the crater floor was infilled about 130 m and that 95 million cubic meters of lava had been effused since 29 September 2021. A single, relatively small lava ooze-out was active to the S of the lava lake. Around midnight on 8 July there were two brief periods of lava overflow onto the lake margins. On 9 July lava ooze-outs were reported near the SE and NE edges of the crater floor and during 10-11 July they occurred near the E, NE, and NW edges. On 16 July crater incandescence was reported, though the ooze-outs and spattering were not visible. On 18 July overnight webcam images showed incandescence in the western vent complex and two ooze-outs were reported around 0000 and 0200 on 19 July. By 0900 there were active ooze-outs along the SW edge of the crater floor. Measurements made from an overflight on 19 July indicated that the crater floor was infilled about 133 m and 98 million cubic meters of lava had erupted since 29 September 2021 (figure 520). On 20 July around 1600 active ooze-outs were visible along the N edge of the crater, which continued through the next day. Extensive ooze-outs occurred along the W margin during 24 July until 1900; on 26 July minor ooze-outs were noted along the N margin. Minor spattering was visible on 29 July along the E margin of the lake. The sulfur dioxide emission rates ranged 650-2,800 tons per day (t/d), the higher of which was measured on 8 July (figure 519).
Activity during August 2022. The eruption continued in the Halema’uma’u crater at the western vent. According to HVO the lava in the active lake remained at the level of the bounding levees. Occasional minor ooze-outs were observed along the margins of the crater floor. Strong nighttime crater incandescence was visible after midnight on 6 August over the western vent cone. During 6-7 August scattered small lava lobes were active along the crater floor and incandescence persisted above the western vent through 9 August. During 7-9 August HVO reported a single lava effusion source was active along the NW margin of the crater floor. Measurements from an overflight on 4 August indicated that the crater floor was infilled about 136 m total and that 102 million cubic meters of lava had been erupted since the start of the eruption. Lava breakouts were reported along the N, NE, E, S, and W margins of the crater during 10-16 August. Another overflight survey conducted on 16 August indicated that the crater floor infilled about 137 m and 104 million cubic meters of lava had been erupted since September 2021. Measured sulfur dioxide emissions rates ranged 1,150-2,450 t/d, the higher of which occurred on 8 August.
Activity during September 2022. During September, lava effusion continued from the western vent into the active lava lake and onto the crater floor. Intermittent minor ooze-outs were reported through the month. A small ooze-out was visible on the W crater floor margin at 0220 on 2 September, which showed decreasing surface activity throughout the day, but remained active through 3 September. On 3 September around 1900 a lava outbreak occurred along the NW margin of the crater floor but had stopped by the evening of 4 September. Field crews monitoring the summit lava lake on 9 September observed spattering on the NE margin of the lake that rose no higher than 10 m, before falling back onto the lava lake crust (figure 521). Overflight measurements on 12 September indicated that the crater floor was infilled a total of 143 m and 111 million cubic meters of lava had been erupted since September 2021. Extensive breakouts in the W and N part of the crater floor were reported at 1600 on 20 September and continued into 26 September. The active part of the lava lake dropped by 10 m while other parts of the crater floor dropped by several meters. Summit tiltmeters recorded a summit seismic swarm of more than 80 earthquakes during 1500-1800 on 21 September, which occurred about 1.5 km below Halema’uma’u; a majority of these were less than Mw 2. By 22 September the active part of the lava lake was infilled about 2 m. On 23 September the western vent areas exhibited several small spatter cones with incandescent openings, along with weak, sporadic spattering (figure 522). The sulfur dioxide emission rate ranged from 930 t/d to 2,000 t/d, the higher of which was measured on 6 September.
Activity during October 2022. Activity during October declined slightly compared to previous months, though lava effusions persisted from the western vent into the active lava lake and onto the crater floor during October (figure 523). Slight variations in the lava lake were noted throughout the month. HVO reported that around 0600 on 3 October the level of the lava lake has lowered slightly. Overflight measurements taken on 5 October indicated that the crater floor was infilled a total of about 143 m and that 111 million cubic meters of lava had been effused since September 2021. During 6-7 October the lake gradually rose 0.5 m. Sulfur dioxide measurements made on 22 October had an emission rate of 700 t/d. Another overflight taken on 28 October showed that there was little to no change in the elevation of the crater floor: the crater floor was infilled a total of 143 m and 111 million cubic meters of lava had erupted since the start of the eruption.
Activity during November 2022. Activity remained low during November, though HVO reported that lava from the western vent continued to effuse into the active lava lake and onto the crater floor throughout the month. The rate of sulfur dioxide emissions during November ranged from 300-600 t/d, the higher amount of which occurred on 9 November.
Activity during December 2022. Similar low activity was reported during December, with lava effusing from the western vent into the active lava lake and onto the crater floor. During 4-5 December the active part of the lava lake was slightly variable in elevation and fluctuated within 1 m. On 9 December HVO reported that lava was no longer erupting from the western vent in the Halema’uma’u crater and that sulfur dioxide emissions had returned to near pre-eruption background levels; during 10-11 December, the lava lake had completely crusted over, and no incandescence was visible (figure 524). Time lapse camera images covering the 4-10 December showed that the crater floor showed weak deflation and no inflation. Some passive events of crustal overturning were reported during 14-15 December, which brought fresh incandescent lava to the lake surface. The sulfur dioxide emission rate was approximately 200 t/d on 14 December. A smaller overturn event on 17 December and another that occurred around 0000 and into the morning of 20 December were also detected. A small seismic swarm was later detected on 30 December.
Geologic Background. Kilauea overlaps the E flank of the massive Mauna Loa shield volcano in the island of Hawaii. Eruptions are prominent in Polynesian legends; written documentation since 1820 records frequent summit and flank lava flow eruptions interspersed with periods of long-term lava lake activity at Halemaumau crater in the summit caldera until 1924. The 3 x 5 km caldera was formed in several stages about 1,500 years ago and during the 18th century; eruptions have also originated from the lengthy East and Southwest rift zones, which extend to the ocean in both directions. About 90% of the surface of the basaltic shield volcano is formed of lava flows less than about 1,100 years old; 70% of the surface is younger than 600 years. The long-term eruption from the East rift zone between 1983 and 2018 produced lava flows covering more than 100 km2, destroyed hundreds of houses, and added new coastline.
Information Contacts: Hawaiian Volcano Observatory (HVO), U.S. Geological Survey, PO Box 51, Hawai'i National Park, HI 96718, USA (URL: http://hvo.wr.usgs.gov/).
Nyamulagira (DR Congo) — November 2023 Cite this Report
Nyamulagira
DR Congo
1.408°S, 29.2°E; summit elev. 3058 m
All times are local (unless otherwise noted)
Lava flows and thermal activity during May-October 2023
Nyamulagira (also known as Nyamuragira) is a shield volcano in the Democratic Republic of Congo with the summit truncated by a small 2 x 2.3 km caldera with walls up to about 100 m high. Documented eruptions have occurred within the summit caldera, as well as from numerous flank fissures and cinder cones. The current eruption period began in April 2018 and has more recently been characterized by summit crater lava flows and thermal activity (BGVN 48:05). This report describes lava flows and variable thermal activity during May through October 2023, based on information from the Observatoire Volcanologique de Goma (OVG) and various satellite data.
Lava lake activity continued during May. The MIROVA (Middle InfraRed Observation of Volcanic Activity) system recorded moderate-to-strong thermal activity throughout the reporting period; activity was more intense during May and October and relatively weaker from June through September (figure 95). The MODVOLC thermal algorithm, detected a total of 209 thermal alerts. There were 143 hotspots detected during May, eight during June, nine during September, and 49 during October. This activity was also reflected in infrared satellite images, where a lava flow was visible in the NW part of the crater on 7 May and strong activity was seen in the center of the crater on 4 October (figure 96). Another infrared satellite image taken on 12 May showed still active lava flows along the NW margin of the crater. According to OVG lava effusions were active during 7-29 May and moved to the N and NW parts of the crater beginning on 9 May. Strong summit crater incandescence was visible from Goma (27 km S) during the nights of 17, 19, and 20 May (figure 97). On 17 May there was an increase in eruptive activity, which peaked at 0100 on 20 May. Notable sulfur dioxide plumes drifted NW and W during 19-20 May (figure 98). Drone footage acquired in partnership with the USGS (United States Geological Survey) on 20 May captured images of narrow lava flows that traveled about 100 m down the W flank (figure 99). Data from the Rumangabo seismic station indicated a decreasing trend in activity during 17-21 May. Although weather clouds prevented clear views of the summit, a strong thermal signature on the NW flank was visible in an infrared satellite image on 22 May, based on an infrared satellite image. On 28 May the lava flows on the upper W flank began to cool and solidify. By 29 May seismicity returned to levels similar to those recorded before the 17 May increase. Lava effusion continued but was confined to the summit crater; periodic crater incandescence was observed.
Low-level activity was noted during June through October. On 1 June OVG reported that seismicity remained at lower levels and that crater incandescence had been absent for three days, though infrared satellite imagery showed continued lava effusion in the summit crater. The lava flows on the flanks covered an estimated 0.6 km2. Satellite imagery continued to show thermal activity confined to the lava lake through October (figure 96), although no lava flows or significant sulfur dioxide emissions were reported.
Geologic Background. Africa's most active volcano, Nyamulagira (also known as Nyamuragira), is a massive high-potassium basaltic shield about 25 km N of Lake Kivu and 13 km NNW of the steep-sided Nyiragongo volcano. The summit is truncated by a small 2 x 2.3 km caldera that has walls up to about 100 m high. Documented eruptions have occurred within the summit caldera, as well as from the numerous flank fissures and cinder cones. A lava lake in the summit crater, active since at least 1921, drained in 1938, at the time of a major flank eruption. Recent lava flows extend down the flanks more than 30 km from the summit as far as Lake Kivu; extensive lava flows from this volcano have covered 1,500 km2 of the western branch of the East African Rift.
Information Contacts: Observatoire Volcanologique de Goma (OVG), Departement de Geophysique, Centre de Recherche en Sciences Naturelles, Lwiro, D.S. Bukavu, DR Congo; Hawai'i Institute of Geophysics and Planetology (HIGP) - MODVOLC Thermal Alerts System, School of Ocean and Earth Science and Technology (SOEST), Univ. of Hawai'i, 2525 Correa Road, Honolulu, HI 96822, USA (URL: http://modis.higp.hawaii.edu/); MIROVA (Middle InfraRed Observation of Volcanic Activity), a collaborative project between the Universities of Turin and Florence (Italy) supported by the Centre for Volcanic Risk of the Italian Civil Protection Department (URL: http://www.mirovaweb.it/); NASA Global Sulfur Dioxide Monitoring Page, Atmospheric Chemistry and Dynamics Laboratory, NASA Goddard Space Flight Center (NASA/GSFC), 8800 Greenbelt Road, Goddard, Maryland, USA (URL: https://so2.gsfc.nasa.gov/); Copernicus Browser, Copernicus Data Space Ecosystem, European Space Agency (URL: https://dataspace.copernicus.eu/browser/); Charles Balagizi, Goma Volcano Observatory, Departement de Geophysique, Centre de Recherche en Sciences Naturelles, Lwiro, D.S. Bukavu, DR Congo.
Bagana (Papua New Guinea) — October 2023 Cite this Report
Bagana
Papua New Guinea
6.137°S, 155.196°E; summit elev. 1855 m
All times are local (unless otherwise noted)
Explosions, ash plumes, ashfall, and lava flows during April-September 2023
The remote volcano of Bagana is located in central Bougainville Island, Papua New Guinea. Recorded eruptions date back to 1842 and activity has consisted of effusive activity that has built a small lava dome in the summit crater and occasional explosions that produced pyroclastic flows. The most recent eruption has been ongoing since February 2000 and has produced occasional explosions, ash plumes, and lava flows. More recently, activity has been characterized by ongoing effusive activity and ash emissions (BGVN 48:04). This report updates activity from April through September 2023 that has consisted of explosions, ash plumes, ashfall, and lava flows, using information from the Darwin Volcanic Ash Advisory Center (VAAC) and satellite data.
An explosive eruption was reported on 7 July that generated a large gas-and-ash plume to high altitudes and caused significant ashfall in local communities; the eruption plume had reached upper tropospheric (16-18 km altitude) altitudes by 2200, according to satellite images. Sulfur dioxide plumes were detected in satellite images on 8 July and indicated that the plume was likely a mixture of gas, ice, and ash. A report issued by the Autonomous Bougainville Government (ABG) (Torokina District, Education Section) on 10 July noted that significant ash began falling during 2000-2100 on 7 July and covered most areas in the Vuakovi, Gotana (9 km SW), Koromaketo, Laruma (25 km W) and Atsilima (27 km NW) villages. Pyroclastic flows also occurred, according to ground-based reports; small deposits confined to one drainage were inspected by RVO during an overflight on 17 July and were confirmed to be from the 7 July event. Ashfall continued until 10 July and covered vegetation, which destroyed bushes and gardens and contaminated rivers and streams.
RVO reported another eruption on 14 July. The Darwin VAAC stated that an explosive event started around 0830 on 15 July and produced an ash plume that rose to 16.5 km altitude by 1000 and drifted N, according to satellite images. The plume continued to drift N and remained visible through 1900, and by 2150 it had dissipated.
Ashfall likely from both the 7 and 15 July events impacted about 8,111 people in Torokina (20 km SW), including Tsito/Vuakovi, Gotana, Koromaketo, Kenaia, Longkogari, Kenbaki, Piva (13 km SW), and Atsinima, and in the Tsitovi district, according to ABG. Significant ashfall was also reported in Ruruvu (22 km N) in the Wakunai District of Central Bougainville, though the thickness of these deposits could not be confirmed. An evacuation was called for the villages in Wakunai, where heavy ashfall had contaminated water sources; the communities of Ruruvu, Togarau, Kakarapaia, Karauturi, Atao, and Kuritaturi were asked to evacuate to a disaster center at the Wakunai District Station, and communities in Torokina were asked to evacuate to the Piva District station. According to a news article, more than 7,000 people needed temporary accommodations, with about 1,000 people in evacuation shelters. Ashfall had deposited over a broad area, contaminating water supplies, affecting crops, and collapsing some roofs and houses in rural areas. Schools were temporarily shut down. Intermittent ash emissions continued through the end of July and drifted NNW, NW, and SW. Fine ashfall was reported on the coast of Torokina, and ash plumes also drifted toward Laruma and Atsilima.
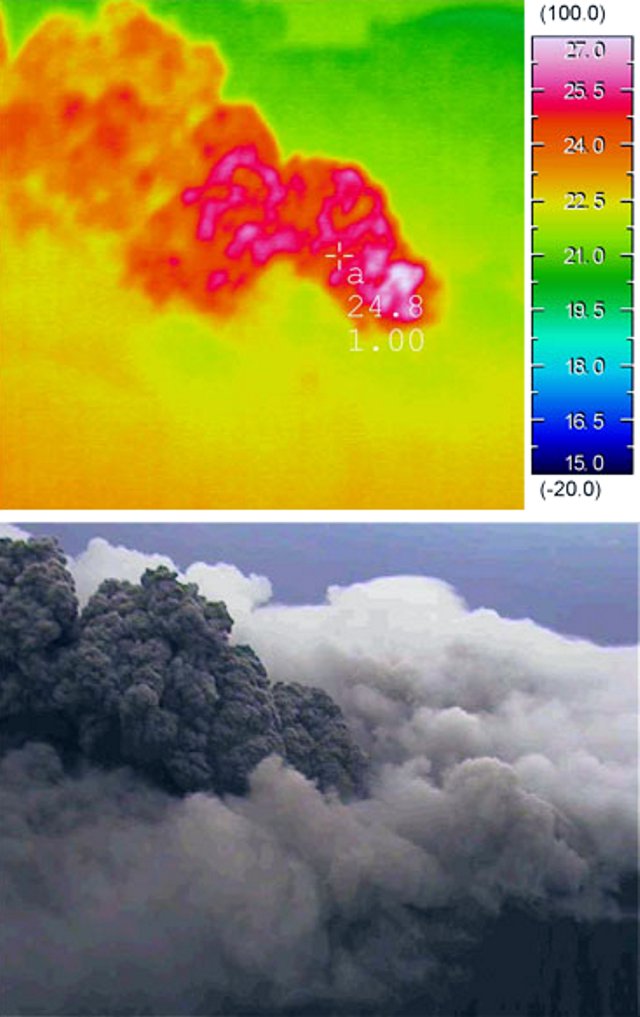
A small explosive eruption occurred at 2130 on 28 July that ejected material from the crater vents, according to reports from Torokina, in addition to a lava flow that contained two lobes. A second explosion was detected at 2157. Incandescence from the lava flow was visible from Piva as it descended the W flank around 2000 on 29 July (figure 47). The Darwin VAAC reported that a strong thermal anomaly was visible in satellite images during 30-31 July and that ash emissions rose to 2.4 km altitude and drifted WSW on 30 July. A ground report from RVO described localized emissions at 0900 on 31 July.
The Darwin VAAC reported that ash plumes were identified in satellite imagery at 0800 and 1220 on 12 August and rose to 2.1 km and 3 km altitude and drifted NW and W, respectively. A news report stated that aid was sent to more than 6,300 people that were adversely affected by the eruption. Photos taken during 17-19 August showed ash emissions rising no higher than 1 km above the summit and drifting SE. A small explosion generated an ash plume during the morning of 19 August. Deposits from small pyroclastic flows were also captured in the photos. Satellite images captured lava flows and pyroclastic flow deposits. Two temporary seismic stations were installed near Bagana on 17 August at distances of 7 km WSW (Vakovi station) and 11 km SW (Kepox station). The Kepox station immediately started to record continuous, low-frequency background seismicity.
Satellite data. Little to no thermal activity was detected during April through mid-July 2023; only one anomaly was recorded during early April and one during early June, according to MIROVA (Middle InfraRed Observation of Volcanic Activity) data (figure 48). Thermal activity increased in both power and frequency during mid-July through September, although there were still some short gaps in detected activity. MODVOLC also detected increased thermal activity during August; thermal hotspots were detected a total of five times on 19, 20, and 27 August. Weak thermal anomalies were also captured in infrared satellite images on clear weather days throughout the reporting period on 7, 12, and 17 April, 27 May, 1, 6, 16, and 31 July, and 19 September (figure 48); a strong thermal anomaly was visible on 31 July. Distinct sulfur dioxide plumes that drifted generally NW were intermittently captured by the TROPOMI instrument on the Sentinel-5P satellite and sometimes exceeded two Dobson Units (DUs) (figure 49).
Geologic Background. Bagana volcano, in a remote portion of central Bougainville Island, is frequently active. This massive symmetrical cone was largely constructed by an accumulation of viscous andesitic lava flows. The entire edifice could have been constructed in about 300 years at its present rate of lava production. Eruptive activity is characterized by non-explosive effusion of viscous lava that maintains a small lava dome in the summit crater, although occasional explosive activity produces pyroclastic flows. Lava flows with tongue-shaped lobes up to 50 m thick and prominent levees descend the flanks on all sides.
Information Contacts: Rabaul Volcano Observatory (RVO), Geohazards Management Division, Department of Mineral Policy and Geohazards Management (DMPGM), PO Box 3386, Kokopo, East New Britain Province, Papua New Guinea; Darwin Volcanic Ash Advisory Centre (VAAC), Bureau of Meteorology, Northern Territory Regional Office, PO Box 40050, Casuarina, NT 0811, Australia (URL: http://www.bom.gov.au/info/vaac/); MIROVA (Middle InfraRed Observation of Volcanic Activity), a collaborative project between the Universities of Turin and Florence (Italy) supported by the Centre for Volcanic Risk of the Italian Civil Protection Department (URL: http://www.mirovaweb.it/); Hawai'i Institute of Geophysics and Planetology (HIGP) - MODVOLC Thermal Alerts System, School of Ocean and Earth Science and Technology (SOEST), Univ. of Hawai'i, 2525 Correa Road, Honolulu, HI 96822, USA (URL: http://modis.higp.hawaii.edu/); NASA Global Sulfur Dioxide Monitoring Page, Atmospheric Chemistry and Dynamics Laboratory, NASA Goddard Space Flight Center (NASA/GSFC), 8800 Greenbelt Road, Goddard, Maryland, USA (URL: https://so2.gsfc.nasa.gov/); Copernicus Browser, Copernicus Data Space Ecosystem, European Space Agency (URL: https://dataspace.copernicus.eu/browser/); Autonomous Bougainville Government, P.O Box 322, Buka, AROB, PNG (URL: https://abg.gov.pg/); Andrew Tupper (Twitter: @andrewcraigtupp); Simon Carn, Geological and Mining Engineering and Sciences, Michigan Technological University, 1400 Townsend Drive, Houghton, MI 49931, USA (URL: http://www.volcarno.com/, Twitter: @simoncarn); Radio NZ (URL: https://www.rnz.co.nz/news/pacific/494464/more-than-7-000-people-in-bougainville-need-temporary-accommodation-after-eruption); USAID, 1300 Pennsylvania Ave, NW, Washington DC 20004, USA (URL: https://www.usaid.gov/pacific-islands/press-releases/aug-08-2023-united-states-provides-immediate-emergency-assistance-support-communities-affected-mount-bagana-volcanic-eruptions).
Mayon (Philippines) — October 2023 Cite this Report
Mayon
Philippines
13.257°N, 123.685°E; summit elev. 2462 m
All times are local (unless otherwise noted)
Lava flows, pyroclastic flows, ash emissions, and seismicity during April-September 2023
Mayon is located in the Philippines and has steep upper slopes capped by a small summit crater. Historical eruptions date back to 1616 CE that have been characterized by Strombolian eruptions, lava flows, pyroclastic flows, and mudflows. Eruptions mostly originated from a central conduit. Pyroclastic flows and mudflows have commonly descended many of the approximately 40 drainages that surround the volcano. The most recent eruption occurred during June through October 2022 and consisted of lava dome growth and gas-and-steam emissions (BGVN 47:12). A new eruption was reported during late April 2023 and has included lava flows, pyroclastic density currents, ash emissions, and seismicity. This report covers activity during April through September 2023 based on daily bulletins from the Philippine Institute of Volcanology and Seismology (PHIVOLCS).
During April through September 2023, PHIVOLCS reported near-daily rockfall events, frequent volcanic earthquakes, and sulfur dioxide measurements. Gas-and-steam emissions rose 100-900 m above the crater and drifted in different directions. Nighttime crater incandescence was often visible during clear weather and was accompanied by incandescent avalanches of material. Activity notably increased during June when lava flows were reported on the S, SE, and E flanks (figure 52). The MIROVA graph (Middle InfraRed Observation of Volcanic Activity) showed strong thermal activity coincident with these lava flows, which remained active through September (figure 53). According to the MODVOLC thermal algorithm, a total of 110 thermal alerts were detected during the reporting period: 17 during June, 40 during July, 27 during August, and 26 during September. During early June, pyroclastic density currents (PDCs) started to occur more frequently.
Low activity was reported during much of April and May; gas-and-steam emissions rose 100-900 m above the crater and generally drifted in different directions. A total of 52 rockfall events and 18 volcanic earthquakes were detected during April and 147 rockfall events and 13 volcanic events during May. Sulfur dioxide flux measurements ranged between 400-576 tons per day (t/d) during April, the latter of which was measured on 29 April and between 162-343 t/d during May, the latter of which was measured on 13 May.
Activity during June increased, characterized by lava flows, pyroclastic density currents (PDCs), crater incandescence and incandescent rockfall events, gas-and-steam emissions, and continued seismicity. Weather clouds often prevented clear views of the summit, but during clear days, moderate gas-and-steam emissions rose 100-2,500 m above the crater and drifted in multiple directions. A total of 6,237 rockfall events and 288 volcanic earthquakes were detected. The rockfall events often deposited material on the S and SE flanks within 700-1,500 m of the summit crater and ash from the events drifted SW, S, SE, NE, and E. Sulfur dioxide emissions ranged between 149-1,205 t/d, the latter of which was measured on 10 June. Short-term observations from EDM and electronic tiltmeter monitoring indicated that the upper slopes were inflating since February 2023. Longer-term ground deformation parameters based on EDM, precise leveling, continuous GPS, and electronic tilt monitoring indicated that the volcano remained inflated, especially on the NW and SE flanks. At 1000 on 5 June the Volcano Alert Level (VAL) was raised to 2 (on a 0-5 scale). PHIVOLCS noted that although low-level volcanic earthquakes, ground deformation, and volcanic gas emissions indicated unrest, the steep increase in rockfall frequency may indicate increased dome activity.
A total of 151 dome-collapse PDCs occurred during 8-9 and 11-30 June, traveled 500-2,000 m, and deposited material on the S flank within 2 km of the summit crater. During 8-9 June the VAL was raised to 3. At approximately 1947 on 11 June lava flow activity was reported; two lobes traveled within 500 m from the crater and deposited material on the S (Mi-isi), SE (Bonga), and E (Basud) flanks. Weak seismicity accompanied the lava flow and slight inflation on the upper flanks. This lava flow remained active through 30 June, moving down the S and SE flank as far as 2.5 km and 1.8 km, respectively and depositing material up to 3.3 km from the crater. During 15-16 June traces of ashfall from the PDCs were reported in Sitio Buga, Nabonton, City of Ligao and Purok, and San Francisco, Municipality of Guinobatan. During 28-29 June there were two PDCs generated by the collapse of the lava flow front, which generated a light-brown ash plume 1 km high. Satellite monitors detected significant concentrations of sulfur dioxide beginning on 29 June. On 30 June PDCs primarily affected the Basud Gully on the E flank, the largest of which occurred at 1301 and lasted eight minutes, based on the seismic record. Four PDCs generated between 1800 and 2000 that lasted approximately four minutes each traveled 3-4 km on the E flank and generated an ash plume that rose 1 km above the crater and drifted N and NW. Ashfall was recorded in Tabaco City.
Similar strong activity continued during July; slow lava effusion remained active on the S and SE flanks and traveled as far as 2.8 km and 2.8 km, respectively and material was deposited as far as 4 km from the crater. There was a total of 6,983 rockfall events and 189 PDCs that affected the S, SE, and E flanks. The volcano network detected a total of 2,124 volcanic earthquakes. Continuous gas-and-steam emissions rose 200-2,000 m above the crater and drifted in multiple directions. Sulfur dioxide emissions averaged 792-4,113 t/d, the latter of which was measured on 28 July. During 2-4 July three PDCs were generated from the collapse of the lava flow and resulting light brown plumes rose 200-300 m above the crater. Continuous tremor pulses were reported beginning at 1547 on 3 July through 7 July at 1200, at 2300 on 8 July and going through 0300 on 10 July, and at 2300 on 16 July, as recorded by the seismic network. During 6-9 July there were 10 lava flow-collapse-related PDCs that generated light brown plumes 300-500 m above the crater. During 10-11 July light ashfall was reported in some areas of Mabinit, Legazpi City, Budiao and Salvacion, Daraga, and Camalig, Albay. By 18 July the lava flow advanced 600 m on the E flank as well.
During 1733 on 18 July and 0434 on 19 July PHIVOLCS reported 30 “ashing” events, which are degassing events accompanied by audible thunder-like sounds and entrained ash at the crater, which produced short, dark plumes that drifted SW. These events each lasted 20-40 seconds, and plume heights ranged from 150-300 m above the crater, as recorded by seismic, infrasound, visual, and thermal monitors. Three more ashing events occurred during 19-20 July. Short-term observations from electronic tilt and GPS monitoring indicate deflation on the E lower flanks in early July and inflation on the NW middle flanks during the third week of July. Longer-term ground deformation parameters from EDM, precise leveling, continuous GPS, and electronic tilt monitoring indicated that the volcano was still generally inflated relative to baseline levels. A short-lived lava pulse lasted 28 seconds at 1956 on 21 July, which was accompanied by seismic and infrasound signals. By 22 July, the only lava flow that remained active was on the SE flank, and continued to extend 3.4 km, while those on the S and E flanks weakened markedly. One ashing event was detected during 30-31 July, whereas there were 57 detected during 31 July-1 August; according to PHIVOLCS beginning at approximately 1800 on 31 July eruptive activity was dominated by phases of intermittent ashing, as well as increased in the apparent rates of lava effusion from the summit crater. The ashing phases consisted of discrete events recorded as low-frequency volcanic earthquakes (LFVQ) typically 30 seconds in duration, based on seismic and infrasound signals. Gray ash plume rose 100 m above the crater and generally drifted NE. Shortly after these ashing events began, new lava began to effuse rapidly from the crater, feeding the established flowed on the SE, E, and E flanks and generating frequent rockfall events.
Intensified unrest persisted during August. There was a total of 4,141 rockfall events, 2,881 volcanic earthquakes, which included volcanic tremor events, 32 ashing events, and 101 PDCs detected throughout the month. On clear weather days, gas-and-steam emissions rose 300-1,500 m above the crater and drifted in different directions (figure 54). Sulfur dioxide emissions averaged 735-4,756 t/d, the higher value of which was measured on 16 August. During 1-2 August the rate of lava effusion decreased, but continued to feed the flows on the SE, S, and E flanks, maintaining their advances to 3.4 km, 2.8 km, and 1.1 km from the crater, respectively (figure 55). Rockfall and PDCs generated by collapses at the lava flow margins and from the summit dome deposited material within 4 km of the crater. During 3-4 August there were 10 tremor events detected that lasted 1-4 minutes. Short-lived lava pulse lasted 35 seconds and was accompanied by seismic and infrasound signals at 0442 on 6 August. Seven collapses were recorded at the front of the lava flow during 12-14 August.
During September, similar activity of slow lava effusion, PDCs, gas-and-steam emissions, and seismicity continued. There was a total of 4,452 rockfall events, 329 volcanic earthquakes, which included volcanic tremor events, two ashing events, and 85 PDCs recorded throughout the month. On clear weather days, gas-and-steam emissions rose 100-1,500 m above the crater and drifted in multiple directions. Sulfur dioxide emissions averaged 609-2,252 t/d, the higher average of which was measured on 6 September. Slow lava effusion continued advancing on the SE, S, and E flanks, maintaining lengths of 3.4 km, 2.8 km, and 1.1 km, respectively. Rockfall and PDC events generated by collapses along the lava flow margins and at the summit dome deposited material within 4 km of the crater.
Geologic Background. Symmetrical Mayon, which rises above the Albay Gulf NW of Legazpi City, is the most active volcano of the Philippines. The steep upper slopes are capped by a small summit crater. Recorded eruptions since 1616 CE range from Strombolian to basaltic Plinian, with cyclical activity beginning with basaltic eruptions, followed by longer periods of andesitic lava flows. Eruptions occur predominately from the central conduit and have also produced lava flows that travel far down the flanks. Pyroclastic density currents and mudflows have commonly swept down many of the approximately 40 ravines that radiate from the summit and have often damaged populated lowland areas. A violent eruption in 1814 killed more than 1,200 people and devastated several towns.
Information Contacts: Philippine Institute of Volcanology and Seismology (PHIVOLCS), Department of Science and Technology, University of the Philippines Campus, Diliman, Quezon City, Philippines (URL: http://www.phivolcs.dost.gov.ph/); MIROVA (Middle InfraRed Observation of Volcanic Activity), a collaborative project between the Universities of Turin and Florence (Italy) supported by the Centre for Volcanic Risk of the Italian Civil Protection Department (URL: http://www.mirovaweb.it/); Hawai'i Institute of Geophysics and Planetology (HIGP) - MODVOLC Thermal Alerts System, School of Ocean and Earth Science and Technology (SOEST), Univ. of Hawai'i, 2525 Correa Road, Honolulu, HI 96822, USA (URL: http://modis.higp.hawaii.edu/); Copernicus Browser, Copernicus Data Space Ecosystem, European Space Agency (URL: https://dataspace.copernicus.eu/browser/); William Rogers, Legazpi City, Albay Province, Philippines.
Nishinoshima (Japan) — October 2023 Cite this Report
Nishinoshima
Japan
27.247°N, 140.874°E; summit elev. 100 m
All times are local (unless otherwise noted)
Eruption plumes and gas-and-steam plumes during May-August 2023
Nishinoshima, located about 1,000 km S of Tokyo, is a small island in the Ogasawara Arc in Japan. The island is the summit of a massive submarine volcano that has prominent submarine peaks to the S, W, and NE. Eruptions date back to 1973 and the current eruption period began in October 2022. Recent activity has consisted of small ash plumes and fumarolic activity (BGVN 48:07). This report covers activity during May through August 2023, using information from monthly reports of the Japan Meteorological Agency (JMA) monthly reports and satellite data.
Activity during May through June was relatively low. The Japan Coast Guard (JCG) did overflights on 14 and 22 June and reported white gas-and-steam emissions rising 600 m and 1,200 m from the central crater of the pyroclastic cone, respectively (figure 125). In addition, multiple white gas-and-steam emissions rose from the inner rim of the W side of the crater and from the SE flank of the pyroclastic cone. Discolored brown-to-green water was observed around almost the entire perimeter of the island; on 22 June light green discolored water was observed off the S coast of the island.
Observations from the Himawari meteorological satellite confirmed an eruption on 9 and 10 July. An eruption plume rose 1.6 km above the crater and drifted N around 1300 on 9 July. Satellite images acquired at 1420 and 2020 on 9 July and at 0220 on 10 July showed continuing emissions that rose 1.3-1.6 km above the crater and drifted NE and N. The Tokyo VAAC reported that an ash plume seen by a pilot and identified in a satellite image at 0630 on 21 July rose to 3 km altitude and drifted S.
Aerial observations conducted by JCG on 8 August showed a white-and-gray plume rising from the central crater of the pyroclastic cone, and multiple white gas-and-steam emissions were rising from the inner edge of the western crater and along the NW-SE flanks of the island (figure 126). Brown-to-green discolored water was also noted around the perimeter of the island.
Intermittent low-to-moderate power thermal anomalies were recorded in the MIROVA graph (Middle InfraRed Observation of Volcanic Activity), showing an increase in both frequency and power beginning in July (figure 127). This increase in activity coincides with eruptive activity on 9 and 10 July, characterized by eruption plumes. According to the MODVOLC thermal alert algorithm, one thermal hotspot was recorded on 20 July. Weak thermal anomalies were also detected in infrared satellite imagery, accompanied by strong gas-and-steam plumes (figure 128).
Geologic Background. The small island of Nishinoshima was enlarged when several new islands coalesced during an eruption in 1973-74. Multiple eruptions that began in 2013 completely covered the previous exposed surface and continued to enlarge the island. The island is the summit of a massive submarine volcano that has prominent peaks to the S, W, and NE. The summit of the southern cone rises to within 214 m of the ocean surface 9 km SSE.
Information Contacts: Japan Meteorological Agency (JMA), 1-3-4 Otemachi, Chiyoda-ku, Tokyo 100-8122, Japan (URL: http://www.jma.go.jp/jma/indexe.html); Tokyo Volcanic Ash Advisory Center (VAAC), 1-3-4 Otemachi, Chiyoda-ku, Tokyo 100-8122, Japan (URL: http://ds.data.jma.go.jp/svd/vaac/data/); MIROVA (Middle InfraRed Observation of Volcanic Activity), a collaborative project between the Universities of Turin and Florence (Italy) supported by the Centre for Volcanic Risk of the Italian Civil Protection Department (URL: http://www.mirovaweb.it/); Copernicus Browser, Copernicus Data Space Ecosystem, European Space Agency (URL: https://dataspace.copernicus.eu/browser/).
Krakatau (Indonesia) — October 2023 Cite this Report
Krakatau
Indonesia
6.1009°S, 105.4233°E; summit elev. 285 m
All times are local (unless otherwise noted)
White gas-and-steam plumes and occasional ash plumes during May-August 2023
Krakatau is located in the Sunda Strait between Java and Sumatra, Indonesia. Caldera collapse during the catastrophic 1883 eruption destroyed Danan and Perbuwatan cones and left only a remnant of Rakata. The post-collapse cone of Anak Krakatau (Child of Krakatau) was constructed within the 1883 caldera at a point between the former Danan and Perbuwatan cones; it has been the site of frequent eruptions since 1927. The current eruption period began in May 2021 and has recently consisted of Strombolian eruptions and ash plumes (BGVN 48:07). This report describes lower levels of activity consisting of ash and white gas-and-steam plumes during May through August 2023, based on information provided by the Indonesian Center for Volcanology and Geological Hazard Mitigation, referred to as Pusat Vulkanologi dan Mitigasi Bencana Geologi (PVMBG), MAGMA Indonesia, and satellite data.
Activity was relatively low during May and June. Daily white gas-and-steam emissions rose 25-200 m above the crater and drifted in different directions. Five ash plumes were detected at 0519 on 10 May, 1241 on 11 May, 0920 on 12 May, 2320 on 12 May, and at 0710 on 13 May, and rose 1-2.5 km above the crater and drifted SW. A webcam image taken on 12 May showed ejection of incandescent material above the vent. A total of nine ash plumes were detected during 6-11 June: at 1434 and 00220 on 6 and 7 June the ash plumes rose 500 m above the crater and drifted NW, at 1537 on 8 June the ash plume rose 1 km above the crater and drifted SW, at 0746 and at 0846 on 9 June the ash plumes rose 800 m and 3 km above the crater and drifted SW, respectively, at 0423, 1431, and 1750 on 10 June the ash plumes rose 2 km, 1.5 km, and 3.5 km above the crater and drifted NW, respectively, and at 0030 on 11 June an ash plume rose 2 km above the crater and drifted NW. Webcam images taken on 10 and 11 June at 0455 and 0102, respectively, showed incandescent material ejected above the vent. On 19 June an ash plume at 0822 rose 1.5 km above the crater and drifted SE.
Similar low activity of white gas-and-steam emissions and few ash plumes were reported during July and August. Daily white gas-and-steam emissions rose 25-300 m above the crater and drifted in multiple directions. Three ash plumes were reported at 0843, 0851, and 0852 on 20 July that rose 500-2,000 m above the crater and drifted NW.
The MIROVA (Middle InfraRed Observation of Volcanic Activity) graph of MODIS thermal anomaly data showed intermittent low-to-moderate power thermal anomalies during May through August 2023 (figure 140). Although activity was often obscured by weather clouds, a thermal anomaly was visible in an infrared satellite image of the crater on 12 May, accompanied by an eruption plume that drifted SW (figure 141).
Geologic Background. The renowned Krakatau (frequently mis-named as Krakatoa) volcano lies in the Sunda Strait between Java and Sumatra. Collapse of an older edifice, perhaps in 416 or 535 CE, formed a 7-km-wide caldera. Remnants of that volcano are preserved in Verlaten and Lang Islands; subsequently the Rakata, Danan, and Perbuwatan cones were formed, coalescing to create the pre-1883 Krakatau Island. Caldera collapse during the catastrophic 1883 eruption destroyed Danan and Perbuwatan, and left only a remnant of Rakata. This eruption caused more than 36,000 fatalities, most as a result of tsunamis that swept the adjacent coastlines of Sumatra and Java. Pyroclastic surges traveled 40 km across the Sunda Strait and reached the Sumatra coast. After a quiescence of less than a half century, the post-collapse cone of Anak Krakatau (Child of Krakatau) was constructed within the 1883 caldera at a point between the former Danan and Perbuwatan cones. Anak Krakatau has been the site of frequent eruptions since 1927.
Information Contacts: Pusat Vulkanologi dan Mitigasi Bencana Geologi (PVMBG, also known as Indonesian Center for Volcanology and Geological Hazard Mitigation, CVGHM), Jalan Diponegoro 57, Bandung 40122, Indonesia (URL: http://www.vsi.esdm.go.id/); MAGMA Indonesia, Kementerian Energi dan Sumber Daya Mineral (URL: https://magma.esdm.go.id/v1); MIROVA (Middle InfraRed Observation of Volcanic Activity), a collaborative project between the Universities of Turin and Florence (Italy) supported by the Centre for Volcanic Risk of the Italian Civil Protection Department (URL: http://www.mirovaweb.it/); Copernicus Browser, Copernicus Data Space Ecosystem, European Space Agency (URL: https://dataspace.copernicus.eu/browser/).
Villarrica (Chile) — October 2023 Cite this Report
Villarrica
Chile
39.42°S, 71.93°W; summit elev. 2847 m
All times are local (unless otherwise noted)
Strombolian activity, gas-and-ash emissions, and crater incandescence during April-September 2023
Villarrica, in central Chile, consists of a 2-km-wide caldera that formed about 3,500 years ago and is located at the base of the presently active cone at the NW margin of a 6-km-wide caldera. Historical eruptions eruptions date back to 1558 and have been characterized by mild-to-moderate explosive activity with occasional lava effusions. The current eruption period began in December 2014 and has recently consisted of nighttime crater incandescence, ash emissions, and seismicity (BGVN 48:04). This report covers activity during April through September 2023 and describes occasional Strombolian activity, gas-and-ash emissions, and nighttime crater incandescence. Information for this report primarily comes from the Southern Andes Volcano Observatory (Observatorio Volcanológico de Los Andes del Sur, OVDAS), part of Chile's National Service of Geology and Mining (Servicio Nacional de Geología y Minería, SERNAGEOMIN) and satellite data.
Seismicity during April consisted of long period (LP) events and tremor (TRE); a total of 9,413 LP-type events and 759 TR-type events were detected throughout the month. Nighttime crater incandescence persisted and was visible in the degassing column. Sulfur dioxide data was obtained using Differential Absorption Optical Spectroscopy Equipment (DOAS) that showed an average value of 1,450 ± 198 tons per day (t/d) during 1-15 April and 1,129 ± 201 t/d during 16-30 April, with a maximum daily value of 2,784 t/d on 9 April. Gas-and-steam emissions of variable intensities rose above the active crater as high as 1.3 km above the crater on 13 April. Strombolian explosions were not observed and there was a slight decrease in the lava lake level.
There were 14,123 LP-type events and 727 TR-type events detected during May. According to sulfur dioxide measurements taken with DOAS equipment, the active crater emitted an average value of 1,826 ± 482 t/d during 1-15 May and 912 ± 41 t/d during 16-30 May, with a daily maximum value of 5,155 t/d on 13 May. Surveillance cameras showed continuous white gas-and-steam emissions that rose as high as 430 m above the crater on 27 May. Nighttime incandescence illuminated the gas column less than 300 m above the crater rim was and no pyroclastic emissions were reported. A landslide was identified on 13 May on the E flank of the volcano 50 m from the crater rim and extending 300 m away; SERNAGEOMIN noted that this event may have occurred on 12 May. During the morning of 27 and 28 May minor Strombolian explosions characterized by incandescent ejecta were recorded at the crater rim; the last reported Strombolian explosions had occurred at the end of March.
Seismic activity during June consisted of five volcano-tectonic (VT)-type events, 21,606 LP-type events, and 2,085 TR-type events. The average value of sulfur dioxide flux obtained by DOAS equipment was 1,420 ± 217 t/d during 1-15 June and 2,562 ± 804 t/d, with a maximum daily value of 4,810 t/d on 17 June. White gas-and-steam emissions rose less than 480 m above the crater; frequent nighttime crater incandescence was reflected in the degassing plume. On 12 June an emission rose 100 m above the crater and drifted NNW. On 15 June one or several emissions resulted in ashfall to the NE as far as 5.5 km from the crater, based on a Skysat satellite image. Several Strombolian explosions occurred within the crater; activity on 15 June was higher energy and ejected blocks 200-300 m on the NE slope. Surveillance cameras showed white gas-and-steam emissions rising 480 m above the crater on 16 June. On 19 and 24 June low-intensity Strombolian activity was observed, ejecting material as far as 200 m from the center of the crater to the E.
During July, seismicity included 29,319 LP-type events, 3,736 TR-type events, and two VT-type events. DOAS equipment recorded two days of sulfur dioxide emissions of 4,220 t/d and 1,009 t/d on 1 and 13 July, respectively. Constant nighttime incandescence was also recorded and was particularly noticeable when accompanied by eruptive columns on 12 and 16 July. Minor explosive events were detected in the crater. According to Skysat satellite images taken on 12, 13, and 16 July, ashfall deposits were identified 155 m S of the crater. According to POVI, incandescence was visible from two vents on the crater floor around 0336 on 12 July. Gas-and-ash emissions rose as high as 1.2 km above the crater on 13 July and drifted E and NW. A series of gas-and-steam pulses containing some ash deposited material on the upper E flank around 1551 on 13 July. During 16-31 July, average sulfur dioxide emissions of 1,679 ± 406 t/d were recorded, with a maximum daily value of 2,343 t/d on 28 July. Fine ash emissions were also reported on 16, 17, and 23 July.
Seismicity persisted during August, characterized by 27,011 LP-type events, 3,323 TR-type events, and three VT-type events. The average value of sulfur dioxide measurements taken during 1-15 August was 1,642 ± 270 t/d and 2,207 ± 4,549 t/d during 16-31 August, with a maximum daily value of 3,294 t/d on 27 August. Nighttime crater incandescence remained visible in degassing columns. White gas-and-steam emissions rose 480 m above the crater on 6 August. According to a Skysat satellite image from 6 August, ash accumulation was observed proximal to the crater and was mainly distributed toward the E slope. White gas-and-steam emissions rose 320 m above the crater on 26 August. Nighttime incandescence and Strombolian activity that generated ash emissions were reported on 27 August.
Seismicity during September was characterized by five VT-type events, 12,057 LP-type events, and 2,058 TR-type events. Nighttime incandescence persisted. On 2 September an ash emission rose 180 m above the crater and drifted SE at 1643 (figure 125) and a white gas-and-steam plume rose 320 m above the crater. According to the Buenos Aires VAAC, periods of continuous gas-and-ash emissions were visible in webcam images from 1830 on 2 September to 0110 on 3 September. Strombolian activity was observed on 2 September and during the early morning of 3 September, the latter event of which generated an ash emission that rose 60 m above the crater and drifted 100 m from the center of the crater to the NE and SW. Ashfall was reported to the SE and S as far as 750 m from the crater. The lava lake was active during 3-4 September and lava fountaining was visible for the first time since 26 March 2023, according to POVI. Fountains captured in webcam images at 2133 on 3 September and at 0054 on 4 September rose as high as 60 m above the crater rim and ejected material onto the upper W flank. Sulfur dioxide flux of 1,730 t/d and 1,281 t/d was measured on 3 and 4 September, respectively, according to data obtained by DOAS equipment.
Strong Strombolian activity and larger gas-and-ash plumes were reported during 18-20 September. On 18 September activity was also associated with energetic LP-type events and notable sulfur dioxide fluxes (as high as 4,277 t/d). On 19 September Strombolian activity and incandescence were observed. On 20 September at 0914 ash emissions rose 50 m above the crater and drifted SSE, accompanied by Strombolian activity that ejected material less than 100 m SSE, causing fall deposits on that respective flank. SERNAGEOMIN reported that a Planet Scope satellite image taken on 20 September showed the lava lake in the crater, measuring 32 m x 35 m and an area of 0.001 km2. Several ash emissions were recorded at 0841, 0910, 1251, 1306, 1312, 1315, and 1324 on 23 September and rose less than 150 m above the crater. The sulfur dioxide flux value was 698 t/d on 23 September and 1,097 t/d on 24 September. On 24 September the Volcanic Alert Level (VAL) was raised to Orange (the third level on a four-color scale). SENAPRED maintained the Alert Level at Yellow (the middle level on a three-color scale) for the communities of Villarrica, Pucón (16 km N), Curarrehue, and Panguipulli.
During 24-25 September there was an increase in seismic energy (observed at TR-events) and acoustic signals, characterized by 1 VT-type event, 213 LP-type events, and 124 TR-type events. Mainly white gas-and-steam emissions, in addition to occasional fine ash emissions were recorded. During the early morning of 25 September Strombolian explosions were reported and ejected material 250 m in all directions, though dominantly toward the NW. On 25 September the average value of sulfur dioxide flux was 760 t/d. Seismicity during 25-30 September consisted of five VT-type events, 1,937 LP-type events, and 456 TR-type events.
During 25-29 September moderate Strombolian activity was observed and ejected material as far as the crater rim. In addition, ash pulses lasting roughly 50 minutes were observed around 0700 and dispersed ENE. During 26-27 September a TR episode lasted 6.5 hours and was accompanied by discrete acoustic signals. Satellite images from 26 September showed a spatter cone on the crater floor with one vent that measured 10 x 14 m and a smaller vent about 35 m NE of the cone. SERNAGEOMIN reported an abundant number of bomb-sized blocks up to 150 m from the crater, as well as impact marks on the snow, which indicated explosive activity. A low-altitude ash emission was observed drifting NW around 1140 on 28 September, based on webcam images. Between 0620 and 0850 on 29 September an ash emission rose 60 m above the crater and drifted NW. During an overflight taken around 1000 on 29 September scientists observed molten material in the vent, a large accumulation of pyroclasts inside the crater, and energetic degassing, some of which contained a small amount of ash. Block-sized pyroclasts were deposited on the internal walls and near the crater, and a distal ash deposit was also visible. The average sulfur dioxide flux measured on 28 September was 344 t/d. Satellite images taken on 29 September ashfall was deposited roughly 3 km WNW from the crater and nighttime crater incandescence remained visible. The average sulfur dioxide flux value from 29 September was 199 t/d. On 30 September at 0740 a pulsating ash emission rose 1.1 km above the crater and drifted NNW (figure 126). Deposits on the S flank extended as far as 4.5 km from the crater rim, based on satellite images from 30 September.
Infrared MODIS satellite data processed by MIROVA (Middle InfraRed Observation of Volcanic Activity) showed intermittent thermal activity during April through September, with slightly stronger activity detected during late September (figure 127). Small clusters of thermal activity were detected during mid-June, early July, early August, and late September. According to the MODVOLC thermal alert system, a total of four thermal hotspots were detected on 7 July and 3 and 23 September. This activity was also intermittently captured in infrared satellite imagery on clear weather days (figure 128).
Geologic Background. The glacier-covered Villarrica stratovolcano, in the northern Lakes District of central Chile, is ~15 km south of the city of Pucon. A 2-km-wide caldera that formed about 3,500 years ago is located at the base of the presently active, dominantly basaltic to basaltic andesite cone at the NW margin of a 6-km-wide Pleistocene caldera. More than 30 scoria cones and fissure vents are present on the flanks. Plinian eruptions and pyroclastic flows that have extended up to 20 km from the volcano were produced during the Holocene. Lava flows up to 18 km long have issued from summit and flank vents. Eruptions documented since 1558 CE have consisted largely of mild-to-moderate explosive activity with occasional lava effusion. Glaciers cover 40 km2 of the volcano, and lahars have damaged towns on its flanks.
Information Contacts: Servicio Nacional de Geología y Minería (SERNAGEOMIN), Observatorio Volcanológico de Los Andes del Sur (OVDAS), Avda Sta María No. 0104, Santiago, Chile (URL: http://www.sernageomin.cl/); Proyecto Observación Villarrica Internet (POVI) (URL: http://www.povi.cl/); Sistema y Servicio Nacional de Prevención y Repuesta Ante Desastres (SENAPRED), Av. Beauchef 1671, Santiago, Chile (URL: https://web.senapred.cl/); Buenos Aires Volcanic Ash Advisory Center (VAAC), Servicio Meteorológico Nacional-Fuerza Aérea Argentina, 25 de mayo 658, Buenos Aires, Argentina (URL: http://www.smn.gov.ar/vaac/buenosaires/inicio.php); MIROVA (Middle InfraRed Observation of Volcanic Activity), a collaborative project between the Universities of Turin and Florence (Italy) supported by the Centre for Volcanic Risk of the Italian Civil Protection Department (URL: http://www.mirovaweb.it/); Hawai'i Institute of Geophysics and Planetology (HIGP) - MODVOLC Thermal Alerts System, School of Ocean and Earth Science and Technology (SOEST), Univ. of Hawai'i, 2525 Correa Road, Honolulu, HI 96822, USA (URL: http://modis.higp.hawaii.edu/); Copernicus Browser, Copernicus Data Space Ecosystem, European Space Agency (URL: https://dataspace.copernicus.eu/browser/).
Merapi (Indonesia) — October 2023 Cite this Report
Merapi
Indonesia
7.54°S, 110.446°E; summit elev. 2910 m
All times are local (unless otherwise noted)
Frequent incandescent avalanches during April-September 2023
Merapi, located just north of the major city of Yogyakarta in central Java, Indonesia, has had activity within the last 20 years characterized by pyroclastic flows and lahars accompanying growth and collapse of the steep-sided active summit lava dome. The current eruption period began in late December 2020 and has more recently consisted of ash plumes, intermittent incandescent avalanches of material, and pyroclastic flows (BGVN 48:04). This report covers activity during April through September 2023, based on information from Balai Penyelidikan dan Pengembangan Teknologi Kebencanaan Geologi (BPPTKG), the Center for Research and Development of Geological Disaster Technology, a branch of PVMBG which specifically monitors Merapi. Additional information comes from the Pusat Vulkanologi dan Mitigasi Bencana Geologi (PVMBG, also known as Indonesian Center for Volcanology and Geological Hazard Mitigation, CVGHM), MAGMA Indonesia, the Darwin Volcanic Ash Advisory Centre (VAAC), and various satellite data.
Activity during April through September 2023 primarily consisted of incandescent avalanches of material that mainly affected the SW and W flanks and traveled as far as 2.3 km from the summit (table 25) and white gas-and-steam emissions that rose 10-1,000 m above the crater.
Table 25. Monthly summary of avalanches and avalanche distances recorded at Merapi during April through September 2023. The number of reported avalanches does not include instances where possible avalanches were heard but could not be visually confirmed as a result of inclement weather. Data courtesy of BPPTKG (April-September 2023 daily reports).
| Month |
Average number of avalanches per day |
Distance avalanches traveled (m) |
| Apr 2023 |
19 |
1,200-2,000 |
| May 2023 |
22 |
500-2,000 |
| Jun 2023 |
18 |
1,200-2,000 |
| Jul 2023 |
30 |
300-2,000 |
| Aug 2023 |
25 |
400-2,300 |
| Sep 2023 |
23 |
600-2,000 |
BPPTKG reported that during April and May white gas-and-steam emissions rose 10-750 m above the crater, incandescent avalanches descended 500-2,000 m on the SW and W flanks (figure 135). Cloudy weather often prevented clear views of the summit, and sometimes avalanches could not be confirmed. According to a webcam image, a pyroclastic flow was visible on 17 April at 0531. During the week of 28 April and 4 May a pyroclastic flow was reported on the SW flank, traveling up to 2.5 km. According to a drone overflight taken on 17 May the SW lava dome volume was an estimated 2,372,800 cubic meters and the dome in the main crater was an estimated 2,337,300 cubic meters.
During June and July similar activity persisted with white gas-and-steam emissions rising 10-350 m above the crater and frequent incandescent avalanches that traveled 300-2,000 m down the SW, W, and S flanks (figure 136). Based on an analysis of aerial photos taken on 24 June the volume of the SW lava dome was approximately 2.5 million cubic meters. A pyroclastic flow was observed on 5 July that traveled 2.7 km on the SW flank. According to the Darwin VAAC multiple minor ash plumes were identified in satellite images on 19 July that rose to 3.7 km altitude and drifted S and SW. During 22, 25, and 26 July a total of 17 avalanches descended as far as 1.8 km on the S flank.
Frequent white gas-and-steam emissions continued during August and September, rising 10-450 m above the crater. Incandescent avalanches mainly affected the SW and W flanks and traveled 400-2,300 m from the vent (figure 137). An aerial survey conducted on 10 August was analyzed and reported that estimates of the SW dome volume was 2,764,300 cubic meters and the dome in the main crater was 2,369,800 cubic meters.
Frequent and moderate-power thermal activity continued throughout the reporting period, according to a MIROVA (Middle InfraRed Observation of Volcanic Activity) analysis of MODIS satellite data (figure 138). There was an increase in the number of detected anomalies during mid-May. The MODVOLC thermal algorithm recorded a total of 47 thermal hotspots: six during April, nine during May, eight during June, 15 during July, four during August, and five during September. Some of this activity was captured in infrared satellite imagery on clear weather days, sometimes accompanied by incandescent material on the SW flank (figure 139).
Geologic Background. Merapi, one of Indonesia's most active volcanoes, lies in one of the world's most densely populated areas and dominates the landscape immediately north of the major city of Yogyakarta. It is the youngest and southernmost of a volcanic chain extending NNW to Ungaran volcano. Growth of Old Merapi during the Pleistocene ended with major edifice collapse perhaps about 2,000 years ago, leaving a large arcuate scarp cutting the eroded older Batulawang volcano. Subsequent growth of the steep-sided Young Merapi edifice, its upper part unvegetated due to frequent activity, began SW of the earlier collapse scarp. Pyroclastic flows and lahars accompanying growth and collapse of the steep-sided active summit lava dome have devastated cultivated lands on the western-to-southern flanks and caused many fatalities.
Information Contacts: Balai Penyelidikan dan Pengembangan Teknologi Kebencanaan Geologi (BPPTKG), Center for Research and Development of Geological Disaster Technology (URL: http://merapi.bgl.esdm.go.id/, Twitter: @BPPTKG); MAGMA Indonesia, Kementerian Energi dan Sumber Daya Mineral (URL: https://magma.esdm.go.id/v1); Pusat Vulkanologi dan Mitigasi Bencana Geologi (PVMBG, also known as Indonesian Center for Volcanology and Geological Hazard Mitigation, CVGHM), Jalan Diponegoro 57, Bandung 40122, Indonesia (URL: http://www.vsi.esdm.go.id/); Darwin Volcanic Ash Advisory Centre (VAAC), Bureau of Meteorology, Northern Territory Regional Office, PO Box 40050, Casuarina, NT 0811, Australia (URL: http://www.bom.gov.au/info/vaac/); MIROVA (Middle InfraRed Observation of Volcanic Activity), a collaborative project between the Universities of Turin and Florence (Italy) supported by the Centre for Volcanic Risk of the Italian Civil Protection Department (URL: http://www.mirovaweb.it/); Hawai'i Institute of Geophysics and Planetology (HIGP) - MODVOLC Thermal Alerts System, School of Ocean and Earth Science and Technology (SOEST), Univ. of Hawai'i, 2525 Correa Road, Honolulu, HI 96822, USA (URL: http://modis.higp.hawaii.edu/); Copernicus Browser, Copernicus Data Space Ecosystem, European Space Agency (URL: https://dataspace.copernicus.eu/browser/); Øystein Lund Andersen (URL: https://www.oysteinlundandersen.com/, https://twitter.com/oysteinvolcano).
Ebeko
Russia
50.686°N, 156.014°E; summit elev. 1103 m
All times are local (unless otherwise noted)
Moderate explosive activity with ash plumes continued during June-November 2023
Ebeko, located on the N end of Paramushir Island in Russia’s Kuril Islands just S of the Kamchatka Peninsula, consists of three summit craters along a SSW-NNE line at the northern end of a complex of five volcanic cones. Observed eruptions date back to the late 18th century and have been characterized as small-to-moderate explosions from the summit crater, accompanied by intense fumarolic activity. The current eruptive period began in June 2022, consisting of frequent explosions, ash plumes, and thermal activity (BGVN 47:10, 48:06). This report covers similar activity during June-November 2023, based on information from the Kamchatka Volcanic Eruptions Response Team (KVERT) and satellite data.
Moderate explosive activity continued during June-November 2023 (figures 50 and 51). According to visual data from Severo-Kurilsk, explosions sent ash 2-3.5 km above the summit (3-4.5 km altitude) during most days during June through mid-September. Activity after mid-September was slightly weaker, with ash usually reaching less than 2 km above the summit. According to KVERT the volcano in October and November was, with a few exceptions, either quiet or obscured by clouds that prevented satellite observations. KVERT issued Volcano Observatory Notices for Aviation (VONA) on 8 and 12 June, 13 and 22 July, 3 and 21 August, and 31 October warning of potential aviation hazards from ash plumes drifting 3-15 km from the volcano. Based on satellite data, KVERT reported a persistent thermal anomaly whenever weather clouds permitted viewing.
Geologic Background. The flat-topped summit of the central cone of Ebeko volcano, one of the most active in the Kuril Islands, occupies the northern end of Paramushir Island. Three summit craters located along a SSW-NNE line form Ebeko volcano proper, at the northern end of a complex of five volcanic cones. Blocky lava flows extend west from Ebeko and SE from the neighboring Nezametnyi cone. The eastern part of the southern crater contains strong solfataras and a large boiling spring. The central crater is filled by a lake about 20 m deep whose shores are lined with steaming solfataras; the northern crater lies across a narrow, low barrier from the central crater and contains a small, cold crescentic lake. Historical activity, recorded since the late-18th century, has been restricted to small-to-moderate explosive eruptions from the summit craters. Intense fumarolic activity occurs in the summit craters, on the outer flanks of the cone, and in lateral explosion craters.
Information Contacts: Kamchatka Volcanic Eruptions Response Team (KVERT), Far Eastern Branch, Russian Academy of Sciences, 9 Piip Blvd., Petropavlovsk-Kamchatsky, 683006, Russia (URL: http://www.kscnet.ru/ivs/kvert/).
Search Bulletin Archive by Publication Date
Select a month and year from the drop-downs and click "Show Issue" to have that issue displayed in this tab.
The default month and year is the latest issue available.
Bulletin of the Global Volcanism Network - Volume 30, Number 08 (August 2005)
Managing Editor: Richard Wunderman
Anatahan (United States)
Surge photographed on 24 August; eruption halts on 3 September
Bagana (Papua New Guinea)
Lava flows and occasional ash plumes during April-September 2005
Fuego (Guatemala)
Ongoing ash emissions, lava flows, and associated hazards into 2005
Langila (Papua New Guinea)
Increased eruptive vigor leads to ashfall damage in mid-2005
Manam (Papua New Guinea)
Comparatively mild eruptions with rare minor local ashfall
Rabaul (Papua New Guinea)
Minor ash plumes reach Rabaul Town
Reventador (Ecuador)
Generally, activity shifting from effusive towards explosive
Sheveluch (Russia)
22 September eruption generated a substantial pyroclastic flow
Soputan (Indonesia)
Sporadic explosions into mid-2005; photo of 18 July pyroclastic flow
Soufriere Hills (United Kingdom)
Through at least 5 September 2005, the lava dome continued to grow
Anatahan (United States) — August 2005 Cite this Report
Anatahan
United States
16.35°N, 145.67°E; summit elev. 790 m
All times are local (unless otherwise noted)
Surge photographed on 24 August; eruption halts on 3 September
Anatahan has erupted almost continuously since 5 January 2005, when it started a new episode of vigorous discharges. A summary of satellite images during 16 June-20 July 2005 (BGVN 30:07) showed that it was one of the most conspicuous eruptions on the planet in 2005.
Eruptions somewhat abruptly ceased on about 3 September. Significant discharges remained absent through as late as 29 September. Activity described below through early September is based on an array of material from numerous sources, including the US Geological Survey (USGS), the Washington VAAC, the U.S. Air Force Weather Agency (AFWA), the press, and the Emergency Management Office of the Commonwealth of the Northern Mariana Islands (EMO-CNMI).
Following the general discussions of activity, a report is included contributed by Setsuya Nakada from the Earthquake Research Institute (ERI), University of Tokyo, whose team of scientists made close-range observations of a distinctive eruptive phase called an ash-cloud surge from a helicopter on 24 August. On that day they documented the surge as a robust sub-horizontal plume slowly traveling over, and in contact with, the ocean surface.
Activity during August 2005. Throughout August eruptive activity continued, with plumes rising several thousand meters above the volcano. On 1 August and during 3-9 August the National Weather Service at Tiyan, Guam, issued numerous reports for the islands of Saipan and Tinian.
On 1 August a strong sulfur odor was reported by numerous residents, and ash was observed on aircraft at Saipan International Airport. According to a news article, flights leaving the airport were delayed.
A 4 August article published in the Saipan Tribune by John Ravelo was entitled "Engine trouble forces aircraft's emergency landing." What follows comes from the opening paragraphs of that article, describing events attributed to 3 August.
"An aircraft suffered engine trouble in mid-air early last night shortly after taking off from the Saipan International Airport, prompting it to return to the tarmac for emergency landing. The Ports Police said no one was injured in the incident. This happened as Saipan, Tinian and Rota remained under volcanic haze from Anatahan until last night . . ..
"The aircraft reportedly left the Saipan airport at approximately 6 pm. Minutes later, at about 6:15 pm, Ports Police on-duty airport supervisor Sgt. Greg Arriola said his office received a call that the aircraft was coming back due to 'problems with its left engine.'
"'The aircraft landed safely. Everybody was safe,' Arriola said. He refused to elaborate and name the aircraft, saying, 'we're still checking [on] the matter.'
"Arriola did not disclose the number of passengers aboard the distressed aircraft and where the plane was supposedly bound. The haze over Saipan has resulted in flight interruptions since Monday [1 August], temporarily stranding hundreds of passengers.
"According to the U.S. Geological Survey, volcanic ash threatens jets ... as it forms deposit in engines, restricts airflow, and clogs fuel nozzles. Minute particles of volcanic ash also contaminate aircraft's ventilation, lubrication, hydraulic and electronic systems. They cause erosion and pitting of leading edges of windshields and landing lights, as well as erosion of compressor blades."
The USGS and EMO noted that a seismic station on Sarigan, Anatahan's neighboring island 6.5 km to the W, recorded more than 40 earthquakes on 9 August, three of which had magnitudes of around 4. The seismic swarm began at around 0152 and occurred over the next eight hours. At around 0539, an M 4.2 earthquake occurred, and the National Earthquake Information Center traced the event to ~ 65 km NW of Anatahan.
Tremor and long-period earthquakes were recorded through 8 August. Later, an ash plume was detected on satellite imagery by the AFWA and Washington VAAC; it was at 5-5.5 km altitude extending approximately 220-400 km NW from the summit on 9 August. A Washington VAAC report that day was the 650th Anatahan report they had issued in 2005.
During the remainder of August 2005, eruptive activity continued and ash plumes rose to 6-8 km altitude. Volcanic tremor levels ranged between 20 and 65 percent of peak levels, and long-period earthquakes occurred sporadically. But, after around 0205 on 27 August, the seismic station went off-line. During 1-3 September activity continued, with ash plumes rising to a maximum of ~ 3 km altitude.
Eruptions halt on 3 September 2005. The USGS reported that based on remote-sensing data Anatahan appeared to have stopped erupting on 3 September (UTC), and initial data documenting that circumstance represented observations between 0901 and 2308 UTC. The earlier time corresponded to when AFWA last noted visible ash on a GOES 9 image. Ash could not be detected in satellite imagery through 1825 UTC due to cloud cover. A pilot report at 2308 UTC on 3 September indicated "no activity was occurring at the volcano." The Washington VAAC reported that no ash was detected in satellite imagery through 0025 UTC on 4 September under mostly clear skies. MODIS imagery at 0040 and 0345 UTC on 4 September also show no discernible ash being erupted under clear skies.
This was the first time that the USGS and the EMO reported an absence of volcanism on Anatahan since ash-bearing discharges started in early January 2005. Since then, tremor levels have been fluctuating, with occasional Strombolian explosions.
During an overflight the week of 7 September, USGS and EMO personnel did not see any ash emissions, only low-level steam-and-gas emissions. They noted that the crater floor was covered by sediment-laden water. In East Crater they saw an active geothermal system, consisting of mud pots, mini-geysers, and steam jetting from the crater walls.
Although volcanic seismicity was at low levels through at least 16 September, according to the World Data Center for Seismology (Denver, Colorado) a M 4.4 earthquake struck the Saipan region of the Northern Mariana Islands on 9 September 2005. It occurred at about 1301 local time, with the epicenter 80 km SSW of Anatahan.
Eruption observations, 24 and 26 August 2005. The following describes a 24 August helicopter visit to the vicinity of Anatahan, which included witnessing and documenting eruptive phenomena, but not landing. Photos were also taken on 26 August while passing well to windward of the island on a commercial airliner. The report was submitted by Setsuya Nakada, who was accompanied from Japan by colleagues Takeshi Matsushima (Institute of Seismology and Volcanology, Kyushu University), and Mitsuhiro Yoshimoto (Volcano Research Center, Earthquake Reserch Institute, University of Tokyo).
They had hoped to recover GPS and tiltmeter data from stations on Anatahan, and to find, exhume, inspect, and repair any ash-covered instruments. These instrumental data span the important period starting from last year, an interval that could shed light on the behavior of the volcano and the magma system during the eruption. Geological inspection and petrological sampling were also planned.
Anatahan's seismicity changed from continuous, strong signals to undergoing intermittent pulsations around the morning of 23 August, and a large (M 4.8?) LP earthquake occurred at 2045 on 23 August. Judging from this sudden seismological change and the LP event, the USGS scientists monitoring the seismicity (Andy Lockhart, Randy White, and others) suggested suspending landing on the island for at least a few weeks.
The team decided to fly over the island without landing to assess the state of burial of their geodetic observation site. They spent about an hour in the air there (about 1000 to 1100 on the 24th) viewing and photographing the scene. Besides the pilot, the helicopter carried Nakada, Matsushima, Yoshimoto, and Juan Camacho (EMO-CMI).
During the 24 August visit, dense ash clouds issued very vigorously from the active E crater. The cloud and hung over the summit calderas, their SW rims, and swept out over the sea to the SW and W of the island.
The photographs and the impressions of Camacho and his pilot from visits in July and May 2005 suggested that the activity level was higher on 24 August. The flight disclosed an island completely covered with thick layers of both wet (dark and probably very fine) ash deposits, and fresh dry ones on the island's S slopes. The dry ones lay under the ash cloud. Green areas were restricted to spots on the outer slopes. Many gullies had begun to develop on the surface of the thick ash deposit.
The observers saw a dark eruption cloud (densely ash-laden) vigorously blasting out of the active crater. A heavy ash cloud hung over the island (figures 21 and 22). The eruption cloud rose to ~ 800 m directly above the crater, and it increased up to ~ 2,000 m over the W part of the island, where it became lighter in color. Darker, vigorous emissions also came from the east crater's W side or NW side, and less frequently from its E side. Though this may have reflected the complex circulation of air within the east crater, another possibility was that the active crater had widened recently, especially to the E. Two ash emission points may have developed inside the large active crater.
Seismic amplitudes during the flight were weaker than recorded the afternoon of 23 August. Seismic signals consisted of intermittent pulses with duration intervals from 5 to 20 minutes. Such signals could presumably have corresponded with a series of Strombolian explosions, but on the flight these were not seen. No projectiles were observed—even near the base of the eruption cloud—although the vent was obscured by a profusion of drifting clouds (figures 1 and 2). Abundant ash-laden clouds passed vigorously and continuously from the active crater, escaping in cycles of five's to ten's of minutes in duration, intervals seemingly similar to the seismicity during the flight.
Abundant ash fell from the dark ash cloud that drifted to the SW of the crater. Around 1000 a ring of ash-cloud surge expanded on the crater's southern rim. It advanced comparatively slowly, traveling SW (figures 21 to 24). Along the sea surface, many small lobes of ash cloud developed, moving slowly. These were reminiscent of lobes seen in surges observed at the Tar River Valley delta during the Soufrière Hills eruption. These eruptive scenes also appeared very similar to those observed on 29 August 2000 at Miyake-jima (Nakada and others, 2005a), where a low-temperature ash-cloud surge moved slowly from the summit crater. In the case of the ash-cloud surge seen at Anatahan, it may be that the passage across sea water had a profound influence, triggering behavior more closely phreatomagmatic than purely magmatic in character. The ash-cloud surge took place mainly as the observers approached the island. The surge was thought to correlate to an interval of elevated seismicity.
Tephra buried portions of the village ~ 7 km W of the active crater and reached 1.5 m thick. A photograph revealed that the GPS antenna, within a 50-cm-high pillar, remained distinct even though under considerable ash. The cable to the computer was also partly visible inside a collapsed hut, suggesting the prospect of still retrieving the data. The GPS end-point station ~ 1.5 km E of the crater was under a ~ 1-m-thick blanket of ash, but again the GPS antenna was seen on the edge of a small pond.
A thermal imaging camera system took an essentially simultaneous thermal (infrared) image and a visible-light photograph (figure 25). The eruption cloud was too dense to capture the temperature distribution near the floor of the crater area. Instead, the images represented only the temperature distribution of the cooler, outer portions of the clouds, where temperatures ranged from 19.5 to 27°C (figure 25).
As Nakada and colleagues departed from the Mariana Islands, Anatahan's eruption was seen again (figure 26), this time from a commercial air flight (Northwest Airlines' flight NW0078) traveling from Saipan to Nagoya and departing at 0930 on 26 August 2005. The plume was directed SW. In addition to the very different plume morphology seen that day, the eruptive intensity was judged to have been higher than on 24 August (figure 26).
References. Hilton and others, 2005, Introduction to the special issue on the 2003 eruption of Anatahan Volcano, Commonwealth of the Northern Marianas Islands (CNMI): Jour. Volcanol. Geotherm. Res., v. 146, p. 1-7.
Nakada and others, 2005a, Chronology and products of the 2000 eruption of Miyakejima Volcano, Japan: Bull. Volcanol., v. 67, p. 205-218.
Nakada and others, 2005b, Geological aspects of the 2003-2004 eruption of Anatahan Volcano, Northern Mariana Islands: Jour. Volcanol. Geothermal. Res. 146, p. 226-240.
Watanabe and others, 2005, Geodetic constraints for the mechanism of Anatahan eruption of May 2003: Jour. Volcanol. Geothermal. Res., v. 146, p. 77-85.
Geologic Background. The elongate, 9-km-long island of Anatahan in the central Mariana Islands consists of a large stratovolcano with a 2.3 x 5 km compound summit caldera. The larger western portion of the caldera is 2.3 x 3 km wide, and its western rim forms the island's high point. Ponded lava flows overlain by pyroclastic deposits fill the floor of the western caldera, whose SW side is cut by a fresh-looking smaller crater. The 2-km-wide eastern portion of the caldera contained a steep-walled inner crater whose floor prior to the 2003 eruption was only 68 m above sea level. A submarine cone, named NE Anatahan, rises to within 460 m of the sea surface on the NE flank, and numerous other submarine vents are found on the NE-to-SE flanks. Sparseness of vegetation on the most recent lava flows had indicated that they were of Holocene age, but the first historical eruption did not occur until May 2003, when a large explosive eruption took place forming a new crater inside the eastern caldera.
Information Contacts: Juan Takai Camacho and Ramon Chong, Emergency Management Office of the Commonwealth of the Northern Mariana Islands (EMO-CNMI), PO Box 100007, Saipan, MP 96950, USA (URL: http://www.cnmihsem.gov.mp/); Charles Holliday and Jenifer E. Piatt, U.S. Air Force Weather Agency (AFWA)/XOGM, Offutt Air Force Base, NE 68113, USA; Randy White and Frank Trusdell, U.S. Geological Survey, 345 Middlefield Road, Menlo Park, CA 94025-3591, USA (URL: https://volcanoes.usgs.gov/nmi/activity/); Andrew B. Lockhart, USGS, Cascades Volcano Observatory, 1300 SE Cardinal Court, Bldg. 10, Suite 100, Vancouver, WA 98683, USA; Saipan Tribune, PMB 34, Box 10001, Saipan, MP 96950, USA (URL: http://www.saipantribune.com/); Setsuya Nakada and Mitsuhiro Yoshimoto, Volcano Research Center, Earthquake Research Institute (ERI), University of Tokyo, Tokyo, Japan (URL: http://www.eri.u-tokyo.ac.jp/nakada/anat_hp/anat_200508/, http://www.eri.u-tokyo.ac.jp/VRC/index_E.html); Takeshi Matsushima, Institute of Seismology and Volcanology (SEVO), Graduate School of Science, Kyushu University, 2-5643-29 Shin'yama, Shimabara, Nagasaki 855-0843, Japan (URL: http://www.sevo.kyushu-u.ac.jp/).
Bagana (Papua New Guinea) — August 2005 Cite this Report
Bagana
Papua New Guinea
6.137°S, 155.196°E; summit elev. 1855 m
All times are local (unless otherwise noted)
Lava flows and occasional ash plumes during April-September 2005
Bagana was last reported on in June 2004 (BGVN 29:06) summarizing MODIS thermal alerts during 1 January 2001-31 May 2004. Lava flows, which had erupted at an unknown time, were described in BGVN 29:05. Bagana has been in long-term eruption since 1972, but the volcano's remote location and intervals of separatist conflict on the island had restricted access by observatory staff, and subsequent reports remained infrequent. Several Rabaul Volcano Observatory (RVO) reports addressed Bagana volcanism during March-September 2005, revealing conditions seen on the ground. There were numerous MODVOLC thermal alerts posted for Bagana during the reporting interval. The rest of the reports relied on satellite-based observations of plumes produced for the purpose of aircraft safety.
RVO noted that during April 2005 Bagana continued its effusive eruption of lava. The summit crater released weak to moderate volumes of thick white vapor on most days. Occasional gray to brown ash plumes were reported. White vapor was visible in some areas of the SW flank. Summit glow was visible on most nights when it was clear, associated with the active lava flow on the upper S flanks. White vapor visible on the upper SW flank during daytime was also associated with a lava flow. Occasional loud roaring noises like jet engines and booming noises were heard on 17, 19, and 30 April. Some of the noises accompanied emission of thick, dark gray ash clouds.
According to the Darwin Volcanic Ash Advisory Centre (VAAC), on 17 March 2005 at 0726 a very small plume to ~ 2.4 km altitude and hot spot were visible on satellite imagery. Satellite imagery at 0551 on 13 May revealed a thin plume extending 28 km ESE below 3 km altitude. Similar plumes, blowing W, were identified at 0537 on 14 May and at 0634 on 15 May.
A plume from Bagana was observed in satellite imagery for 8 June. Darwin VAAC stated that the plume initially extended 65 km WSW, then W later in the day. The height of the plume was not stated. US Air Force Weather Agency analysts indicated that at 0955 local time on 8 June (2355 UTC on 7 June) the plume extended at least ~ 38 km W, rising up to ~ 3 km, and the MODIS image they provided showed four volcanoes in the region all emitting plumes (figure 7).
During 13-19 June, Bagana was relatively quiet with variable amounts of white vapor emitted from the crater. Weak projections of incandescent lava were visible until 17 June. During 8-10 June, several low-level plumes emitted from Bagana were visible on satellite imagery extending mainly to the WSW. A plume from Bagana visible on satellite imagery on 21 June extended W. The height of the plume was not reported. A thin plume emitted from Bagana was visible on satellite imagery on 30 June. The height of the plume was not reported.
During 10-16 August, the Darwin VAAC reported that satellite observations showed an ash plume from Bagana visible at a height of ~ 3 km, extending ~ 40 km SW of the summit. Ash was not visible on the image.
During 15-21 August, volcanic activity at Bagana remained at low levels. Variable amounts of thick white vapor were emitted from the summit crater. During several nights, dull-to-moderately bright incandescence was visible. Occasional low roaring noises were heard on 15 and 20 August. At night dull to moderately bright glow was visible on 16, 18, 20, and 21 August. On 20 August, lava flowed from the main crater. Incandescent lava avalanches occasionally originated from unstable areas of the lava flow.
Between 22 and 28 August 2005, Bagana was quiet. The summit crater released variable amounts of white vapor throughout. Continuous roaring noises were heard during a 30-minute period on 23 August, and bright glow was visible the nights of 23 and 24 August. There was a single expulsion of a thick dark ash plume on 24 August.
During 12-18 September 2005, occasional small volumes of ash escaped, and emissions consisted chiefly of weak to moderate volumes of white vapor. Beginning on 17 September occasional sub-continuous booming noises commenced. Some of the booming noises were accompanied by forceful emissions of whitish-brown ash clouds. This activity continued on 18 September. Ash plumes from the activity drifted to W and NW resulting in fine ashfall in downwind areas. Occasional sub-continuous jet-like noises began to occur on 18 September along with a reported lava flow. Glow was observed at night on 14 and 18 September. This could have been associated with cascading lava detached from steep portions of an active lava flow.
The seismograph remained off from 15 August onward through the reporting period due to technical problems.
Geologic Background. Bagana volcano, in a remote portion of central Bougainville Island, is frequently active. This massive symmetrical cone was largely constructed by an accumulation of viscous andesitic lava flows. The entire edifice could have been constructed in about 300 years at its present rate of lava production. Eruptive activity is characterized by non-explosive effusion of viscous lava that maintains a small lava dome in the summit crater, although occasional explosive activity produces pyroclastic flows. Lava flows with tongue-shaped lobes up to 50 m thick and prominent levees descend the flanks on all sides.
Information Contacts: Rabaul Volcano Observatory (RVO), P.O. Box 386, Rabaul, Papua New Guinea ; Darwin Volcanic Ash Advisory Centre (VAAC), Bureau of Meteorology, Northern Territory Regional Office, PO Box 40050, Casuarina, Northern Territory 0811, Australia (URL: http://www.bom.gov.au/info/vaac/).
Fuego
Guatemala
14.4748°N, 90.8806°W; summit elev. 3799 m
All times are local (unless otherwise noted)
Ongoing ash emissions, lava flows, and associated hazards into 2005
Fuego remained active into 2005, although this report focuses on the interval 31 December 2003 through 11 May 2004. A previous report discussed activity through the end of 2003 (BGVN 29:11); this report, based mainly on information from INSIVUMEH (Instituto Nacional de Sismologia, Vulcanologia, Meterologia y Hidrologia) covers the interval from end of 2003 to 11 May 2004.
Figure 7 is a map of the Fuego-Acatenango region, emphasizing drainages and settlements frequently mentioned in activity and hazard reports. Fuego is moderately close to the centers of some of Guatemala's largest cities, including the Capital (2-3.5 million inhabitants, ~ 40 km NNE of Fuego's summit) and Antigua (~ 32,000 inhabitants, ~ 18 km NNE).
CONRED, the Guatemalan hazards agency (Cordinadora Nacional para la Reducción de Desastres) posted hazard information on their website, in part using a map format noting conditions seen from various perspectives. For example, the map issued for 9 January 2004 (during the largest crisis of the interval), included a title, a legend, a summary of critical hazards-oriented observations. One portion of the 9 January map reported a local wind velocity, N-NW at 12-18 km/hr, and the occurrence of fine and very fine ash falling within 5 to 15 km of the crater. The map also included key radio base stations and for each, a summary of the day's message content.
Many early 2005 observations were hampered by rainfall. Table 4 summarizes numerous INSIVUMEH daily reports during February, but for the bulk of the entries, it chiefly presents Smithsonian/USGS Weekly Reports to portray longer time spans.
Table 4. Samples of Fuego activity during 31 December 2003 through 11 May 2004. Summaries based largely on Smithsonian/USGS Weekly Reports are shown as multi-day intervals (marked with an asterisk, "*"). Most of the reported eruptions in column 3 were ash bearing. Courtesy of INSIVUMEH.
| Date |
Maximum plume height (above summit) and bearing |
Activity Description |
| 31 Dec-06 Jan 2004* |
-- |
During 1-5 January, lava emitted from Fuego flowed 70-100 m from the crater. Avalanches from the lava-flow fronts traveled W toward Santa Teresa ravine and toward Trinidad ravine. Seismic stations on the volcano recorded almost continuous harmonic tremor. |
| 07 Jan-13 Jan 2004* |
~3 km |
Ash emission starting around 1500-1600 on 8 January (see text). |
| 21 Jan-27 Jan 2004* |
~1.5 km, SSW (22 Jan) |
Smaller explosions to ~700 m above the crater. Incandescent avalanches traveled a maximum distance of 1 km toward Zanjon Barranca Seca, La Trinidad, and Rio Ceniza ravines. Not ashfall in populated areas. ~1.5 km from two strong explosions (evening of 22 January); blown SSW. During the rest of the week, smaller explosions sent plumes to ~700 m above the crater. |
| 28 Jan-03 Feb 2004* |
~1.1 km |
Small-to-moderate explosions. The highest rising ash plume was produced from an explosion on 29 January. The plume reached above the crater and was accompanied by avalanches of volcanic material down Barranca Seca. A small amount of ash fell in Panimache village and possibly in Santa Sofia. On 31 January two small collapses in the S edge of the central crater produced small avalanches of lava blocks. |
| 16 Feb 2004 |
0.3-1 km, SW |
Audible acoustic shock waves. Ashfall on upper edifice. |
| 17 Feb 2004 |
-- |
Incandescent avalanches rose 200 m at night, but some traveled into the drainages of the Taniluya, Ceniza, and Zanjon Barranca Seca. A mudflow descended the Quebrada Santa Teresa (on Fuego's W-SW sides) carrying blocks up to 2 m in diameter. During 0855 to 1140 Fuego produced 10 explosions characterized as strong, resulting in warnings to civil aviation authorities. Ashfall on W- and SW-flank communities. |
| 18 Feb 2004 |
1.5-1.7 km |
A rapid succession of 15 early morning explosions at 10- to 30-second intervals were heard up to 8 km distant from the summit. Incandescent material landed on many of the upper slopes. Judging by the quantity and weight of ash fall, INSIVUMEH inferred that the eruption caused substantial changes in the summit area. Finer ash fell for 10 to 15 minutes on Finca Sangre de Cristo and environs. Besides aviation safety, concerns included drinking-water contamination. Ashfall up to 8 km from summit. |
| 20 Feb 2004 |
1.5-2 km; light to moderate S winds |
Loud outbursts and incandescent avalanches down the W-flank valleys of the Seca, Taniluya, and Trinidad rivers, and to lesser extent down SE-flank valleys of the Las Lajas-El Jute rivers. Ash-bearing emissions came from the central crater at 4- to 9-minute intervals. Some traces of ash noted to the N, in the Capital. |
| 25 Feb-02 Mar 2004* |
~1.7 km |
Weak-to-moderate explosions continued at Fuego, producing plumes above the crater. Avalanches of volcanic material traveled down several ravines, including Trinidad, Ceniza, Santa Teresa, and Taniluya (to the W). Explosions on 28 February deposited small amounts of fine ash in the village of Sangre de Cristo, and explosions on 29 February deposited ash W and SW of the volcano in the villages of Yepocapa and La Cruz. |
| 04 Mar-08 Mar* |
~1.5 km |
On 5, 7, and 8 March avalanches of incandescent volcanic material traveled as far as 1.5 km down several ravines, including Seca, Taniluya, Ceniza, and Trinidad. Explosions on the 7th and 8th deposited ash 6-10 km from Fuego, including in the villages of Sangre de Cristo and Panimache. |
| 10 Mar-16 Mar 2004* |
~1.7 km |
Explosions; incandescent avalanches as far as 600 m down ravines on the volcano's W, SW, and S flanks; ash fell in W- to SW-flank settlements from Sangre de Cristo to Panimache and Finca Morelia. |
| 17 Mar-23 Mar 2004* |
~1.3 km |
Volcanic material traveled down the Seca ravine; ash fell in the village of Sangre de Cristo. |
| 24 Mar-30 Mar 2004* |
~1 km |
Three strong explosions were recorded on 26 March; they caused incandescent avalanches in the Zanjon Barranca Seca and Trinidad ravines. On 29 March two explosions within 7 minutes produced ash plumes. A lahar occurred on 29 March in the Zanjon Barranca Seca ravine. |
| 31 Mar-06 Apr* 2004 |
~1.2 km (5 April, drifting SSE) |
Lahars flowed down Seca Ravine on 30 March, and passed near the village of Sangre de Cristo on 3 April. Incandescent avalanches descended several ravines, including Santa Teresa, Ceniza, and Taniluya. |
| 07 Apr-13 Apr 2004* |
~1 km |
Lava flowed 75-100 m from the central crater and avalanches of volcanic material traveled as far as 400 m towards Santa Teresa and Taniluya ravines. |
| 14 Apr-20 Apr 2004* |
~2.3 km (16 April, drifting S) |
During 18-19 April, small eruptions hurled incandescent material up to 50 m above the vent. |
| 21 Apr-27 Apr 2004* |
~1 km (steam) |
Weak explosions produced steam clouds above the volcano. In addition, small avalanches of volcanic material occasionally traveled W toward Santa Teresa Ravine. |
| 28 Apr-04 May 2004* |
~1.5 km |
Ash-bearing explosions. On 28 April, an explosion produced an ash plume above the volcano, and ash was deposited ~4 km SW of the volcano in the villages of Panimache I and Panimache II. In addition, a small volcanic avalanche traveled W toward the Santa Teresa ravine. |
| 05 May-11 May 2004* |
-- |
Explosions chiefly produced gas-and-ash clouds. On 5 May a small lahar traveled to the W down Seca ravine. |
From the table, the pattern emerges of ongoing emissions with frequent plumes to 1 km and occasional higher plumes (several to ~2 km and one to ~3 km). Similar to previous months, the reports frequently mention dislodged lava blocks and mass wasting of volcanic materials.
The highest plume found in available reports of the interval occurred on 8 January 2004, when an ash plume rose ~3 km over the summit. Traces of ash fell in the Capital during this episode.
Fuego began its 8 January eruption around 1500 to 1600, expelling thick, broad columns of gases and ash to ~3 km above the crater. There were 25-30 explosions a minute accompanied by loud rumbling noises and acoustical shock waves felt 12 km away. Although no evacuations were ordered, settlements on the upper flanks were considered at risk, including San Andrés Iztapa, Chimaltenango, Comalapa, San Martín Jilotepeque, San José Poaquil, and Yepocapa.
The Washington VAAC added these observations: "[GOES 12] satellite imagery shows two plumes moving away from the volcano. The higher plume extends approximately 75 nm [~140 km] to the [N] and is estimated to be around FL250 [shorthand for 25,000 feet altitude, ~8 km]. A lower plume extends approximately 70 nm [126 km] to the [W] and is estimated to be up to FL190 (19,000 feet altitude, ~6 km). Hot spot activity has been fairly strong and constant over the past several hours."
A 20 February report described continued vigorous activity; ash emissions from the central crater rose to heights of 1.5-2 km above the summit (table 1). Light to moderate winds again blew the ash N and some traces fell in the Capital.
Geologic Background. Volcán Fuego, one of Central America's most active volcanoes, is also one of three large stratovolcanoes overlooking Guatemala's former capital, Antigua. The scarp of an older edifice, Meseta, lies between Fuego and Acatenango to the north. Construction of Meseta dates back to about 230,000 years and continued until the late Pleistocene or early Holocene. Collapse of Meseta may have produced the massive Escuintla debris-avalanche deposit, which extends about 50 km onto the Pacific coastal plain. Growth of the modern Fuego volcano followed, continuing the southward migration of volcanism that began at the mostly andesitic Acatenango. Eruptions at Fuego have become more mafic with time, and most historical activity has produced basaltic rocks. Frequent vigorous eruptions have been recorded since the onset of the Spanish era in 1524, and have produced major ashfalls, along with occasional pyroclastic flows and lava flows.
Information Contacts: Instituto Nacional de Sismologia, Vulcanología, Meteorología e Hidrologia (INSIVUMEH), Ministero de Communicaciones, Transporto, Obras Públicas y Vivienda, 7a. Av. 14-57, zona 13, Guatemala City 01013, Guatemala (URL: http://www.insivumeh.gob.gt/); Coordinadora Nacional para la Reducción de Desastres (CONRED), Av. Hincapié 21-72, Zona 13, Guatemala City, Guatemala; Washington Volcanic Ash Advisory Center (VAAC), Satellite Analysis Branch (NOAA/NESDIS), 4700 Silver Hill Road, Stop 9910, Washington, DC 20233-9910, USA (URL: http://www.ssd.noaa.gov/).
Langila (Papua New Guinea) — August 2005 Cite this Report
Langila
Papua New Guinea
5.525°S, 148.42°E; summit elev. 1330 m
All times are local (unless otherwise noted)
Increased eruptive vigor leads to ashfall damage in mid-2005
The Darwin VAAC issued an activity report stating that the Rabaul Volcano Observatory (RVO) had noted elevated activity since 24 April 2005. Between 28 April 2005 and 4 May 2005 Langila emitted more ash than normal, and the International Federation of Red Cross And Red Crescent Societies (IFRC) determined that ~ 3,490 people had been affected by the eruption when ashfall damaged small food gardens and contaminated some water sources.
VAAC reports on 4 May and 6-7 May noted thin plumes extending NW 110 km and 75 km, respectively. Later, on 7-8 May, the identifiable plume was half as long and diminishing. Plumes and other diagnostics eventually became obscured by weather clouds. On 8 June analysts at the Darwin VAAC saw a low-altitude plume and a hot spot. The plume moved westward and remained visible into 9 June when it ceased being detectible.
During 13-19 June 2005, Langila's Crater 2 continued to erupt. At times the eruption was marked by moderate to strong emissions of thick gray-brown ash clouds occurring at irregular intervals. Ash clouds from the eruption rose variably to 700-1000 m before they were blown to the W and NW. At other times weak to moderate emissions of light gray ash clouds were observed. Considerable ash fell near the volcano and extended to the W and NW, between Warimo and Aimola. Crater 3 was quiet. Low and high frequency earthquakes and volcanic tremor were recorded.
The Darwin VAAC reported a Langila plume on 13 June to 3-4 km altitude, but cloud cover later obscured the plume. Another plume became visible on imagery on 16 June moving W at 30 km/hour at an estimated altitude of ~ 3 km; ongoing plumes became hard to see about mid-day on 17 June. Several other episodes of plume image detection were seen. One was identified by the VAAC on 21 June, with an observation of altitude to ~ 3 km and plume length reaching 300 km to the NW. The evidence of eruption only continued until the next day, when cloud cover obscured the area. A further, brief episode of plume detection occurred beginning early on 25 June but detection ended before noon. On 30 June, the Darwin VAAC repeated a US Air Force Weather Agency (AFWA) report on a Langila plume seen on imagery, blowing SW at 20 km/hr and reaching ~ 3 km altitude. By about 6 hours later that plume ceased to be visible.
Moderate levels of volcanic activity occurred at Langila's Crater 2 during 15-21 August. The activity was marked by occasional sub-continuous forceful emissions of ash clouds. The ash clouds rose as high as 1 km before drifting N and NW. Fine ash fell in villages along the coast. On the evening of 18 August projections of incandescent lava fragments were seen. Based on a pilot report, the Darwin VAAC reported that ash from Langila was visible in the vicinity of the volcano on 23 August, at 3-4.6 km altitude. A plume was seen a bit later on MODIS imagery extending 110 km to the NNW but ash was not visible in satellite imagery.
Geologic Background. Langila, one of the most active volcanoes of New Britain, consists of a group of four small overlapping composite basaltic-andesitic cones on the lower E flank of the extinct Talawe volcano in the Cape Gloucester area of NW New Britain. A rectangular, 2.5-km-long crater is breached widely to the SE; Langila was constructed NE of the breached crater of Talawe. An extensive lava field reaches the coast on the N and NE sides of Langila. Frequent mild-to-moderate explosive eruptions, sometimes accompanied by lava flows, have been recorded since the 19th century from three active craters at the summit. The youngest and smallest crater (no. 3 crater) was formed in 1960 and has a diameter of 150 m.
Information Contacts: Rabaul Volcano Observatory (RVO), P.O. Box 386, Rabaul, Papua New Guinea; International Federation of Red Cross And Red Crescent Societies (IFRC) (URL: https://reliefweb.int/); U.S. Air Force Weather Agency (AFWA)/XOGM, Offutt Air Force Base, NE 68113, USA; Darwin Volcanic Ash Advisory Centre (VAAC), Bureau of Meteorology, Northern Territory Regional Office, PO Box 40050, Casuarina, Northern Territory 0811, Australia (URL: http://www.bom.gov.au/info/vaac/).
Manam (Papua New Guinea) — August 2005 Cite this Report
Manam
Papua New Guinea
4.08°S, 145.037°E; summit elev. 1807 m
All times are local (unless otherwise noted)
Comparatively mild eruptions with rare minor local ashfall
Manam erupted several times during October-December 2004 and January 2005 (BGVN 29:10, 29:11). The eruption on the evening of 27 January 2005 (BGVN 30:02) was more severe than the previous ones during the current eruption period; there were 14 people injured and one person killed at Warisi village. During April and May 2005, mild eruptive activity continued. Manam remained at Alert Level 2 from February 2005 through late May.
Throughout April 2005, both summit craters released occasional pale gray to brown ash clouds to a few hundred meters above the summit before being blown SW, W, and NW, resulting in fine ashfall. Occasional low rumbling and roaring noises from Southern Crater were heard on 23 April and 29 April. A weak to moderate glow accompanied by projections of incandescent lava fragments was visible on 28 April and 30 April. There were no audible noises and no night-time glow from the Main Crater.
April seismicity was at low-moderate level. Occasional weak volcanic tremors were recorded during the month. The daily number of low frequency earthquakes range between 700 and 1350.
A pilot reported an eruption on 13 June at 0445 UTC. The Darwin Volcanic Ash Advisory Centre (VAAC) reported that ash plumes from Manam were visible on satellite imagery on 16-17 June, 30 June, and 1-2 July. On 19 July ash from Manam was visible extending SW on satellite imagery. Ash was also visible on satellite imagery on 20 July. In all instances, the heights of the plumes were not reported.
According to the Rabaul Volcanological Observatory (RVO), during 15-21 August low-level volcanic activity continued at Manam, and the alert level was reduced to level 1. On 15 August, ash was emitted from Southern Crater. The Darwin VAAC reported that a low-level plume from Manam was visible on satellite imagery on 22 August. Mild eruptive activity continued during 22-28 August, with occasional emissions of weak-to-moderate ash plumes on several days. Ash clouds emitted on 22 and 26 August rose several hundred meters above the volcano's crater and drifted NW, depositing ash in areas between the towns of Jogari and Kuluguma, and beyond to Boisa Island.
During September, the Main Crater continued to release weak emissions of thin white-gray ash clouds. On 17 September, the ash clouds increased slightly in volume and were blown to the NW part of the island. No glow was observed at night and technical problems thwarted seismic recording. Manam remained at Alert Level 1, indicating low levels of activity, through 19 September.
Geologic Background. The 10-km-wide island of Manam, lying 13 km off the northern coast of mainland Papua New Guinea, is one of the country's most active volcanoes. Four large radial valleys extend from the unvegetated summit of the conical basaltic-andesitic stratovolcano to its lower flanks. These valleys channel lava flows and pyroclastic avalanches that have sometimes reached the coast. Five small satellitic centers are located near the island's shoreline on the northern, southern, and western sides. Two summit craters are present; both are active, although most observed eruptions have originated from the southern crater, concentrating eruptive products during much of the past century into the SE valley. Frequent eruptions, typically of mild-to-moderate scale, have been recorded since 1616. Occasional larger eruptions have produced pyroclastic flows and lava flows that reached flat-lying coastal areas and entered the sea, sometimes impacting populated areas.
Information Contacts: Ima Itikarai, Rabaul Volcano Observatory (RVO), P.O. Box 386, Rabaul, Papua New Guinea; Andrew Tupper, Darwin Volcanic Ash Advisory Centre (VAAC), Bureau of Meteorology, Northern Territory Regional Office, PO Box 40050, Casuarina, Northern Territory 0811, Australia (URL: http://www.bom.gov.au/info/vaac/).
Rabaul (Papua New Guinea) — August 2005 Cite this Report
Rabaul
Papua New Guinea
4.2459°S, 152.1937°E; summit elev. 688 m
All times are local (unless otherwise noted)
Minor ash plumes reach Rabaul Town
The February 2005 eruption from the Tarvurvur cone at Rabaul and its aftermath were previously described (BGVN 30:07). In late August and September 2005 Tavurvur continued to produce discrete light to pale gray ash emissions. Emissions occurred at irregular intervals and with varying frequency. Discrete explosions also occurred. Ash plumes rose between 800 and 1500 m before they were blown to the N and NW, resulting in some ashfall on the eastern half of Rabaul Town. Areas further downwind were also affected. Roaring and rumbling noises accompanied the activity. Projections of incandescent lava fragments were visible at night but were less conspicuous compared to previous weeks.
Seismicity was at moderate to high levels, with most earthquakes associated with ash emissions and explosions. Small low frequency earthquakes not associated with ash emissions were also recorded. Ground deformation measurements from global positioning system (GPS) and tide gauge instruments fluctuated but the general trend showed a very slow rate of uplift.
One high frequency earthquake occurred on 12 September NE of Tavurvur. Prevailing SE winds during the last several months caused the ash plumes to drift to the N and NW. During 12-18 September there were some brief periods of NW winds that could mark the beginning of gradual wind transition from SE to NW winds, directions that would blow ash plumes away from Rabaul Town.
Geologic Background. The low-lying Rabaul caldera on the tip of the Gazelle Peninsula at the NE end of New Britain forms a broad sheltered harbor utilized by what was the island's largest city prior to a major eruption in 1994. The outer flanks of the asymmetrical shield volcano are formed by thick pyroclastic-flow deposits. The 8 x 14 km caldera is widely breached on the east, where its floor is flooded by Blanche Bay and was formed about 1,400 years ago. An earlier caldera-forming eruption about 7,100 years ago is thought to have originated from Tavui caldera, offshore to the north. Three small stratovolcanoes lie outside the N and NE caldera rims. Post-caldera eruptions built basaltic-to-dacitic pyroclastic cones on the caldera floor near the NE and W caldera walls. Several of these, including Vulcan cone, which was formed during a large eruption in 1878, have produced major explosive activity during historical time. A powerful explosive eruption in 1994 occurred simultaneously from Vulcan and Tavurvur volcanoes and forced the temporary abandonment of Rabaul city.
Information Contacts: Rabaul Volcano Observatory (RVO), P.O. Box 386, Rabaul, Papua New Guinea.
Reventador (Ecuador) — August 2005 Cite this Report
Reventador
Ecuador
0.077°S, 77.656°W; summit elev. 3562 m
All times are local (unless otherwise noted)
Generally, activity shifting from effusive towards explosive
Reventador ceased extruding significant new lava flows in early July 2005. Subsequent activity through this report interval, late September, was manifested as intermittent explosive eruptions. These were characterized alternately as Strombolian activity and short-duration Vulcanian events.
After the post-effusive phase and during the explosive phase a significant Vulcanian event took place at 2058 on 12 September, producing an ash column more than 5 km above the summit. Large bombs were ejected more than 2 km from the vent and small pyroclastic flows were evident in gullies descending from the cone. This event was preceded by more than a week of relative quiescence, indicating that future Vulcanian eruptions may occur with little warning.
This report was submitted by Jeffrey B. Johnson (University of New Hampshire), who collaborated with colleagues including Patricio Ramón, Liliana Troncoso, Guillermo Viracucha, Jaime Lozada, Daniel Andrade, David Rivero, Gorky Ruiz, Pete Hall, and Wilson Enriquez (Geophysical Institute, Escuela Politécnica Nacional, IG-EPN). They adhered to the practice of numerically naming lava flows, for example Lava ##5.
End of significant lava effusions. BGVN 30:05 provided a detailed overview of recent active lavas erupted by Reventador between April 2005 and the end of June 2005. Visits to the caldera on 1 July revealed dramatic diminution in the advance rate of Lava ##5 along the southern caldera margin. Within the first few days of July, Lava ##5 had stagnated. Its furthest extent was ~ 4.5 km from the vent and about 50 m short of the furthest extent of Lava ##4 (erupted in May 2005), which it was overriding.
Since the first few days in July, major lava extrusion had terminated. Despite intermittent MODIS thermal alerts (~ 1 per week from University of Hawaii (HIGP)), no significant lava flows have been directly observed by IG-EPN personnel or reported by the local populace. During July, it is likely that small lava flow(s) (under 1 km in length) were extruded from the southern breach of the cone during short-lived events lasting a few days or less. For instance, a photo taken on 1 August (figure 23) indicates a short, fresh lobe (named Lava ##6), which was no longer incandescent during a night-time visit on 3 August.
Explosive activity. Pyroclastic explosions, which first occurred in early June 2005, continued intermittently until 25 September 2005. Significant Strombolian activity was noted at night by the local populace in the first few days of July, coincident with the decline of Lava ##5 extrusion. In mid-July, explosive activity was minimal, but increased towards the end of the month and during August. Between explosions, voluminous vapor plumes were often observed and loud degassing sounds were often audible, but at times the volcano was also completely silent. Incandescence was also often visible in the cone, suggesting an open-vent configuration. Periods of quiescence separated explosive activity and generally lasted hours to days. Typical eruptive events, which occurred as many as 26 times a day (i.e., on 15 September), are identified clearly by seismic records. These emissions tend to alternate between discrete pyroclastic-laden, ash-rich explosions and extended-duration Strombolian-type fountaining (figure 24). Both types of events were capable of erupting large blocks up and over the crater rim (~ 200 m above the vent), which were often sufficiently massive to be visible from the highway ~ 7.5 km distant.
A period of relative quiescence, marked by an absence of large ash-generating plumes, was evident at the end of August and during first days of September. Vent incandescence was also notably absent during several days up until the large explosion at ~ 2058 on 12 September.
Preceded by a swarm of small volcano-tectonic events, the explosion was manifested by very short-duration transient signals, with arriving infrasonic and seismic waves lasting less than ~ 1 minute. However, peak-to-peak amplitudes the respective signals (~ 211 Pa and 4.9 mm/s) were substantially greater than other explosive events occurring at the volcano during recent months.
As previously mentioned, this short-duration explosion generated a more than 5 km-high ash-cloud and ejected large bombs aerially to more than 2 km. Small pyroclastic flows were confined to gullies on the cone and reached at least 1.5 km from the vent (figure 25).
Since this large event, incandescence has been routinely present in the crater and explosions have occurred with greater frequency (figure 26). Further large explosions occurring in the morning of 24 September were likely responsible for more pyroclastic deposits evident on the upper cone and in upper-flank gullies (figure 25, right-hand photo).
Monitoring. Reventador continues to be closely monitored by the IG-EPN (figure 27). A telemetered seismic network, consisting of three local short-period seismometers, is used to quantify the eruptive chronology of the volcano, including the quantities of volcano-tectonic events (VT), long-period events (LP), hybrid events, and harmonic and spasmodic tremor, and explosion events. Three temporary stand-alone dataloggers with broad-band seismometers and infrasonic microphones, installed with collaboration from the University of New Hampshire and the University of North Carolina, have supplemented this network throughout the summer.
Additionally, field visits by IG-EPN personnel have been conducted regularly. During an expedition on August 28, Differential Optical Absorption Spectroscopy (DOAS) and Forward Looking Infrared (FLIR) measurements were made to assess gas and thermal flux, respectively. DOAS measurements revealed a continuing flux of SO2 estimated at ~ 850 tons/day. The FLIR measurements confirmed near-magmatic temperatures at the vent. It also confirmed stagnation of all lava flows on the volcano since their maximum surface temperatures had cooled into the range of ~ 50°C.
Geologic Background. Volcán El Reventador is the most frequently active of a chain of Ecuadorian volcanoes in the Cordillera Real, well east of the principal volcanic axis. The forested, dominantly andesitic stratovolcano has 4-km-wide avalanche scarp open to the E formed by edifice collapse. A young, unvegetated, cone rises from the amphitheater floor to a height comparable to the rim. It has been the source of numerous lava flows as well as explosive eruptions visible from Quito, about 90 km ESE. Frequent lahars in this region of heavy rainfall have left extensive deposits on the scarp slope. The largest recorded eruption took place in 2002, producing a 17-km-high eruption column, pyroclastic flows that traveled up to 8 km, and lava flows from summit and flank vents.
Information Contacts: Jeffrey B. Johnson, Dept. of Earth Sciences, University of New Hampshire, Durham, NH 03824, USA; Patricio Ramón, Liliana Troncoso, Guillermo Viracucha, Jaime Lozada, Daniel Andrade, David Rivero, Gorky Ruiz, Pete Hall, and Wilson Enriquez, Geophysical Institute (IG), Escuela Politécnica Nacional, Apartado 17-01-2759, Quito, Ecuador (URL: http://www.igepn.edu.ec/).
Sheveluch (Russia) — August 2005 Cite this Report
Sheveluch
Russia
56.653°N, 161.36°E; summit elev. 3283 m
All times are local (unless otherwise noted)
22 September eruption generated a substantial pyroclastic flow
From March 2005 until July 2005, the lava dome at Shiveluch continued to grow and ash-and-gas plumes and gas-and-steam plumes were frequent (BGVN 30:06). The alert level was at Orange.
On 7 July, the Russian News and Information Agency (RIA Novosti) reported that Shiveluch was producing pyroclastic flows and ash plumes rising to 5 km altitude. On 8 July, Kamchatka Volcanic Eruptions Response Team (KVERT) raised the alert level from Orange to Red, the highest level. Video footage taken the same day showed weak gas-and-steam plumes rising to ~ 5 km altitude. On 9 July, ash-and-gas plumes rose to 3 km altitude and the alert level was reduced to Orange. Ash plumes extended 27 km SW of the volcano during July 11-12.
Through July and August, the lava dome continued to grow and Shiveluch remained at alert level Orange. On 15 July, RIA Novosti reported that "[m]assive ash emissions from Shiveluch...are posing danger to nearby towns and villages. The Federal Earthquake Prediction Center's Kamchatka branch said ash storms, as well as mudflows from Shiveluch's slopes, could be dangerous for nearby settlements . . .. [T]he volcano began emitting massive ash clouds. Gas, ash, and magmatic material . . . are barreling down the slope . . .. The ash cloud has spread more than 700 kilometers to the [W] of the volcano, covering the peninsula and the nearby Sea of Okhotsk with a nearly 150-kilometer-wide strip."
On 19 July KVERT reported that a gas-steam plume extended 30 km SW from the volcano on 18 July and a gas-steam plume up to 3.5 km altitude was observed on 19 July. On 19 July, 23 July, and during 5-12 August, satellite data from the USA and Russia indicated a persistent 1 to 7 pixel thermal anomaly at the dome. On 23 July and 6 August, incandescence was observed at the lava dome. Fumarolic activity was visible on 6 August.
During 19-26 August, about ten shallow earthquakes were recorded, and a larger thermal anomaly was visible on satellite imagery. On 19 August a new viscous lava flow was emitted from the lava dome and continued to flow during 26 August to 9 September. Several ash plumes reached ~ 5.5 km altitude.
On 5 September, an ash plume rose to ~ 4 km altitude. On 8 September, a hot avalanche was accompanied by an ash plume that rose to a height of ~ 3.5 km altitude. The large thermal anomaly continued during the first week of September. On 7 September RIA Novosti reported that Shiveluch "is spewing gas and ash to heights of up to 5,000 feet [1.5 km]". On 16 September KVERT reported that the dome was continuing to grow and that viscous lava continued to flow from the dome. Incandescence at the lava dome was observed on 13 September. Gas-steam plumes up to 3.5 km altitude and a large thermal anomaly were registered all week.
On 22 September KVERT raised the alert level to Red, the highest level, and reported that according to seismic data, at 05:15 UTC on 22 September, a paroxysmal eruption began. Ash plumes reached a height about 7.5 km altitude, and ash fall was noted from 06:00 until 08:00 UTC on 22 September by seismologists working about 9 km SW of the volcano.
KVERT reported, based on US and Russian satellite data, an ash cloud with a diameter of ~ 20 km located ~ 90 km to the NW of the volcano and, based on Russian satellite data, an ash cloud with a diameter of ~ 15 km located ~ 20 km to the SSE at about 3 km altitude. Ash fall was observed in Klyuchi on the night of 22 September. According to visual data, a new pyroclastic flow extended 10-15 km.
Geologic Background. The high, isolated massif of Sheveluch volcano (also spelled Shiveluch) rises above the lowlands NNE of the Kliuchevskaya volcano group. The 1,300 km3 andesitic volcano is one of Kamchatka's largest and most active volcanic structures, with at least 60 large eruptions during the Holocene. The summit of roughly 65,000-year-old Stary Shiveluch is truncated by a broad 9-km-wide late-Pleistocene caldera breached to the south. Many lava domes occur on its outer flanks. The Molodoy Shiveluch lava dome complex was constructed during the Holocene within the large open caldera; Holocene lava dome extrusion also took place on the flanks of Stary Shiveluch. Widespread tephra layers from these eruptions have provided valuable time markers for dating volcanic events in Kamchatka. Frequent collapses of dome complexes, most recently in 1964, have produced debris avalanches whose deposits cover much of the floor of the breached caldera.
Information Contacts: Olga A. Girina, Kamchatka Volcanic Eruptions Response Team (KVERT), a cooperative program of the Institute of Volcanic Geology and Geochemistry, Far East Division, Russian Academy of Sciences, Piip Ave. 9, Petropavlovsk-Kamchatsky, 683006, Russia, the Kamchatka Experimental and Methodical Seismological Department (KEMSD), GS RAS (Russia), and the Alaska Volcano Observatory (USA); Alaska Volcano Observatory (AVO), a cooperative program of the U.S. Geological Survey, 4200 University Drive, Anchorage, AK 99508-4667, USA (URL: http://www.avo.alaska.edu/), the Geophysical Institute, University of Alaska, PO Box 757320, Fairbanks, AK 99775-7320, USA, and the Alaska Division of Geological and Geophysical Surveys, 794 University Ave., Suite 200, Fairbanks, AK 99709, USA.
Soputan (Indonesia) — August 2005 Cite this Report
Soputan
Indonesia
1.112°N, 124.737°E; summit elev. 1785 m
All times are local (unless otherwise noted)
Sporadic explosions into mid-2005; photo of 18 July pyroclastic flow
On 18 October 2004 Soputan exploded, releasing a column of white-to-gray ash floating as high as 600 m above the crater rim and drifting E (BGVN 29:12).
On 12 December an eruption around 0050 produced an E-drifting ash cloud to ~ 1 km above the volcano. It was followed by a "hot cloud" that traveled about 200 m E towards Aeseput and a lava flow that traveled SW. The eruption was preceded by increased tremor on 11 December and visible incandescence in the crater. The Directorate of Volcanology and Geological Hazard Mitigation increased the Alert Level to 2 (on a scale of 1-4). According to the Darwin Volcanic Ash Advisory Centre an eruption cloud was visible on satellite imagery on 12 December at 0925 at an altitude of ~ 10.7 km.
On 1 February 2005 white vapor rose 50-75 m above the summit. Soputan began to erupt again at 0630 on 20 April, with a plume reaching ~ 1 km above the summit and drifting SE. In addition, lava fountains rose ~ 200 m above the volcano. From 1720 on 20 April until 0900 on 21 April, lava fountains rose 75-100 m. Rapid dome growth occurred and by 21 April the lava dome had spread about 250 m E and 200 m SW. On 22 April a "white ash plume" rose ~ 100 m, and on 23 April a dark gray ash plume rose to ~ 150 m and drifted NE. Ash eruptions through 24 April produced plumes to ~ 300 m above the volcano.
On 9 May a plume of white vapor rose 75 m above the summit. Soputan remained at Alert Level 2 through 9 May.
Further activities came to light as a result of a photograph taken during a violent eruption (figure 2). According to Syamsul Rizal, the photo was taken from Soputan volcano observatory, Maliku, ~ 12 km NW, on 18 July 2005. The eruption initially vented at the usual source on the NE flank. The pyroclastic flow that resulted was described from visible observations as less dense than those from collapses at Merapi and similar to those from Karangetang.
Geologic Background. The Soputan stratovolcano on the southern rim of the Quaternary Tondano caldera on the northern arm of Sulawesi Island is one of Sulawesi's most active volcanoes. The youthful, largely unvegetated volcano is the only active cone in the Sempu-Soputan volcanic complex, which includes the Soputan caldera, Rindengan, and Manimporok (3.5 km ESE). Kawah Masem maar was formed in the W part of the caldera and contains a crater lake; sulfur has been extracted from fumarolic areas in the maar since 1938. Recent eruptions have originated at both the summit crater and Aeseput, a prominent NE-flank vent that formed in 1906 and was the source of intermittent major lava flows until 1924.
Information Contacts: Directorate of Volcanology and Geological Hazard Mitigation (DVGHM), Jalan Diponegoro 57, Bandung 40122, Indonesia (URL: http://www.vsi.esdm.go.id/); Andrew Tupper, Darwin Volcanic Ash Advisory Centre (VAAC), Bureau of Meteorology, Northern Territory Regional Office, PO Box 40050, Casuarina, Northern Territory 0811, Australia (URL: http://www.bom.gov.au/info/vaac/soputan.shtml).
Soufriere Hills (United Kingdom) — August 2005 Cite this Report
Soufriere Hills
United Kingdom
16.72°N, 62.18°W; summit elev. 915 m
All times are local (unless otherwise noted)
Through at least 5 September 2005, the lava dome continued to grow
Soufrière Hills was relatively quiet through April and early May 2005, with activity increasing somewhat through June and several explosive events in late June and in July (BGVN 30:06). Table 61 summarizes activity during 8 July thorough 26 August 2005. Further text brings this report through 5 September, with the comment that slow dome growth continued.
Table 61. A summary of the weekly number of earthquakes (EQs), rockfalls, and averaged spot measurements of SO2 flux at Soufriere Hills during July and August 2005. Cases of "mixed earthquakes" were unreported during the reporting interval. Date ranges go from noon on the starting day to noon on the end day. Courtesy of MVO.
| Date |
Hybrid EQ's |
Volcano-tectonic EQ's |
Long-period EQ's |
Rockfalls |
SO2 Flux (metric tons/day) |
| 08 Jul-15 Jul 2005 |
10 |
2 |
-- |
-- |
660 |
| 15 Jul-22 Jul 2005 |
16 |
19 |
13 |
11 |
608 |
| 22 Jul-29 Jul 2005 |
4 |
29 |
5 |
23 |
510 |
| 29 Jul-05 Aug 2005 |
4 |
8 |
9 |
33 |
986 |
| 05 Aug-12 Aug 2005 |
3 |
3 |
5 |
14 |
770 |
| 12 Aug-19 Aug 2005 |
8 |
5 |
13 |
12 |
570 |
| 19 Aug-26 Aug 2005 |
6 |
5 |
13 |
15 |
900 |
On 6 August a vigorous eruption sent a plume to ~ 1.8 km above the volcano. Evidence of uplift and fracturing were observed on the crater floor, and an area of blocky lava resembling a small lava dome was observed. Due to poor visibility further observations will be necessary to determine if the feature is a new dome or was caused by the collapse, or uplift, of old dome rock.
Volcanic and seismic activity remained at elevated levels at Soufrière Hills during 12-19 August. Periodic ash venting continued, with a vigorous episode occurring on 18 August at 1800. On 16 August, the presence of a small blocky lava dome with talus slopes was confirmed. There was some ash venting from the dome, but no significant rockfalls were seen. Activity at Soufrière Hills remained at elevated levels during 2-9 September, the end of this reporting period. Observations made on 5 September suggested that slow lava-dome growth continued.
Geologic Background. The complex, dominantly andesitic Soufrière Hills volcano occupies the southern half of the island of Montserrat. The summit area consists primarily of a series of lava domes emplaced along an ESE-trending zone. The volcano is flanked by Pleistocene complexes to the north and south. English's Crater, a 1-km-wide crater breached widely to the east by edifice collapse, was formed about 2000 years ago as a result of the youngest of several collapse events producing submarine debris-avalanche deposits. Block-and-ash flow and surge deposits associated with dome growth predominate in flank deposits, including those from an eruption that likely preceded the 1632 CE settlement of the island, allowing cultivation on recently devegetated land to near the summit. Non-eruptive seismic swarms occurred at 30-year intervals in the 20th century, but no historical eruptions were recorded until 1995. Long-term small-to-moderate ash eruptions beginning in that year were later accompanied by lava-dome growth and pyroclastic flows that forced evacuation of the southern half of the island and ultimately destroyed the capital city of Plymouth, causing major social and economic disruption.
Information Contacts: Montserrat Volcano Observatory (MVO), Fleming, Montserrat, West Indies (URL: http://www.mvo.ms/).