Recently Published Bulletin Reports
Erebus (Antarctica) Lava lake remains active; most thermal alerts recorded since 2019
Rincon de la Vieja (Costa Rica) Frequent phreatic explosions during July-December 2023
Bezymianny (Russia) Explosion on 18 October 2023 sends ash plume 8 km high; lava flows and incandescent avalanches
Kilauea (United States) Low-level lava effusions in the lava lake at Halema’uma’u during July-December 2022
Nyamulagira (DR Congo) Lava flows and thermal activity during May-October 2023
Bagana (Papua New Guinea) Explosions, ash plumes, ashfall, and lava flows during April-September 2023
Mayon (Philippines) Lava flows, pyroclastic flows, ash emissions, and seismicity during April-September 2023
Nishinoshima (Japan) Eruption plumes and gas-and-steam plumes during May-August 2023
Krakatau (Indonesia) White gas-and-steam plumes and occasional ash plumes during May-August 2023
Villarrica (Chile) Strombolian activity, gas-and-ash emissions, and crater incandescence during April-September 2023
Merapi (Indonesia) Frequent incandescent avalanches during April-September 2023
Ebeko (Russia) Moderate explosive activity with ash plumes continued during June-November 2023
Erebus (Antarctica) — January 2024  Cite this Report
Erebus
Antarctica
77.53°S, 167.17°E; summit elev. 3794 m
All times are local (unless otherwise noted)
Lava lake remains active; most thermal alerts recorded since 2019
The lava lake in the summit crater of Erebus has been active since at least 1972. Located in Antarctica overlooking the McMurdo Station on Ross Island, it is the southernmost active volcano on the planet. Because of the remote location, activity is primarily monitored by satellites. This report covers activity during 2023.
The number of thermal alerts recorded by the Hawai'i Institute of Geophysics and Planetology’s MODVOLC Thermal Alerts System increased considerably in 2023 compared to the years 2020-2022 (table 9). In contrast to previous years, the MODIS instruments aboard the Aqua and Terra satellites captured data from Erebus every month during 2023. Consistent with previous years, the lowest number of anomalous pixels were recorded in January, November, and December.
Table 9. Number of monthly MODIS-MODVOLC thermal alert pixels recorded at Erebus during 2017-2023. See BGVN 42:06 for data from 2000 through 2016. The table was compiled using data provided by the HIGP – MODVOLC Thermal Alerts System.
| Year |
Jan |
Feb |
Mar |
Apr |
May |
Jun |
Jul |
Aug |
Sep |
Oct |
Nov |
Dec |
SUM |
| 2017 |
0 |
21 |
9 |
0 |
0 |
1 |
11 |
61 |
76 |
52 |
0 |
3 |
234 |
| 2018 |
0 |
21 |
58 |
182 |
55 |
17 |
137 |
172 |
103 |
29 |
0 |
0 |
774 |
| 2019 |
2 |
21 |
162 |
151 |
55 |
56 |
75 |
53 |
29 |
19 |
1 |
0 |
624 |
| 2020 |
0 |
2 |
16 |
18 |
4 |
4 |
1 |
3 |
18 |
3 |
1 |
6 |
76 |
| 2021 |
0 |
9 |
1 |
0 |
2 |
56 |
46 |
47 |
35 |
52 |
5 |
3 |
256 |
| 2022 |
1 |
13 |
55 |
22 |
15 |
32 |
39 |
19 |
31 |
11 |
0 |
0 |
238 |
| 2023 |
2 |
33 |
49 |
82 |
41 |
32 |
70 |
64 |
42 |
17 |
5 |
11 |
448 |
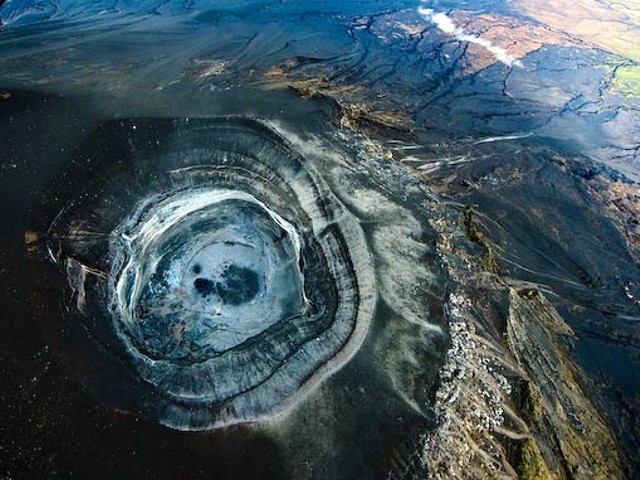
Sentinel-2 infrared images showed one or two prominent heat sources within the summit crater, accompanied by adjacent smaller sources, similar to recent years (see BGVN 46:01, 47:02, and 48:01). A unique image was obtained on 25 November 2023 by the OLI-2 (Operational Land Imager-2) on Landsat 9, showing the upper part of the volcano surrounded by clouds (figure 32).
Geologic Background. Mount Erebus, the world's southernmost historically active volcano, overlooks the McMurdo research station on Ross Island. It is the largest of three major volcanoes forming the crudely triangular Ross Island. The summit of the dominantly phonolitic volcano has been modified by one or two generations of caldera formation. A summit plateau at about 3,200 m elevation marks the rim of the youngest caldera, which formed during the late-Pleistocene and within which the modern cone was constructed. An elliptical 500 x 600 m wide, 110-m-deep crater truncates the summit and contains an active lava lake within a 250-m-wide, 100-m-deep inner crater; other lava lakes are sometimes present. The glacier-covered volcano was erupting when first sighted by Captain James Ross in 1841. Continuous lava-lake activity with minor explosions, punctuated by occasional larger Strombolian explosions that eject bombs onto the crater rim, has been documented since 1972, but has probably been occurring for much of the volcano's recent history.
Information Contacts: Hawai'i Institute of Geophysics and Planetology (HIGP) - MODVOLC Thermal Alerts System, School of Ocean and Earth Science and Technology (SOEST), Univ. of Hawai'i, 2525 Correa Road, Honolulu, HI 96822, USA (URL: http://modis.higp.hawaii.edu/); Copernicus Browser, Copernicus Data Space Ecosystem, European Space Agency (URL: https://dataspace.copernicus.eu/browser/); NASA Earth Observatory, EOS Project Science Office, NASA Goddard Space Flight Center, Goddard, Maryland, USA (URL: https://earthobservatory.nasa.gov/images/152134/erebus-breaks-through).
Rincon de la Vieja (Costa Rica) — January 2024 Cite this Report
Rincon de la Vieja
Costa Rica
10.83°N, 85.324°W; summit elev. 1916 m
All times are local (unless otherwise noted)
Frequent phreatic explosions during July-December 2023
Rincón de la Vieja is a volcanic complex in Costa Rica with a hot convecting acid lake that exhibits frequent weak phreatic explosions, gas-and-steam emissions, and occasional elevated sulfur dioxide levels (BGVN 45:10, 46:03, 46:11). The current eruption period began June 2021. This report covers activity during July-December 2023 and is based on weekly bulletins and occasional daily reports from the Observatorio Vulcanologico Sismologica de Costa Rica-Universidad Nacional (OVSICORI-UNA).
Numerous weak phreatic explosions continued during July-December 2023, along with gas-and-steam emissions and plumes that rose as high as 3 km above the crater rim. Many weekly OVSICORI-UNA bulletins included the previous week's number of explosions and emissions (table 9). For many explosions, the time of explosion was given (table 10). Frequent seismic activity (long-period earthquakes, volcano-tectonic earthquakes, and tremor) accompanied the phreatic activity.
Table 9. Number of reported weekly phreatic explosions and gas-and-steam emissions at Rincón de la Vieja, July-December 2023. Counts are reported for the week before the Weekly Bulletin date; not all reports included these data. Courtesy of OVSICORI-UNA.
| OVSICORI Weekly Bulletin |
Number of explosions |
Number of emissions |
| 28 Jul 2023 |
6 |
14 |
| 4 Aug 2023 |
10 |
12 |
| 1 Sep 2023 |
13 |
11 |
| 22 Sep 2023 |
12 |
13 |
| 29 Sep 2023 |
6 |
11 |
| 6 Oct 2023 |
12 |
5 |
| 13 Oct 2023 |
7 |
9 |
| 20 Oct 2023 |
1 |
15 |
| 27 Oct 2023 |
3 |
23 |
| 3 Nov 2023 |
3 |
10 |
| 17 Nov 2023 |
0 |
Some |
| 24 Nov 2023 |
0 |
14 |
| 8 Dec 2023 |
4 |
16 |
| 22 Dec 2023 |
8 |
18 |
Table 10. Summary of activity at Rincón de la Vieja during July-December 2023. Weak phreatic explosions and gas emissions are noted where the time of explosion was indicated in the weekly or daily bulletins. Height of plumes or emissions are distance above the crater rim. Courtesy of OVSICORI-UNA.
| Date |
Time |
Description of Activity |
| 1 Jul 2023 |
0156 |
Explosion. |
| 2 Jul 2023 |
0305 |
Explosion. |
| 4 Jul 2023 |
0229, 0635 |
Event at 0635 produced a gas-and-steam plume that rose 700 m and drifted W; seen by residents in Liberia (21 km SW). |
| 9 Jul 2023 |
1843 |
Explosion. |
| 21 Jul 2023 |
0705 |
Explosion. |
| 26 Jul 2023 |
1807 |
Explosion. |
| 28 Jul 2023 |
0802 |
Explosion generated a gas-and-steam plume that rose 500 m. |
| 30 Jul 2023 |
1250 |
Explosion. |
| 31 Jul 2023 |
2136 |
Explosion. |
| 11 Aug 2023 |
0828 |
Explosion. |
| 18 Aug 2023 |
1304 |
Explosion. |
| 21 Aug 2023 |
1224 |
Explosion generated gas-and-steam plumes rose 500-600 m. |
| 22 Aug 2023 |
0749 |
Explosion generated gas-and-steam plumes rose 500-600 m. |
| 24 Aug 2023 |
1900 |
Explosion. |
| 25 Aug 2023 |
0828 |
Event produced a steam-and-gas plume that rose 3 km and drifted NW. |
| 27-28 Aug 2023 |
0813 |
Four small events; the event at 0813 on 28 August lasted two minutes and generated a steam-and-gas plume that rose 2.5 km. |
| 1 Sep 2023 |
1526 |
Explosion generated plume that rose 2 km and ejected material onto the flanks. |
| 2-3 Sep 2023 |
- |
Small explosions detected in infrasound data. |
| 4 Sep 2023 |
1251 |
Gas-and-steam plume rose 1 km and drifted W. |
| 7 Nov 2023 |
1113 |
Explosion. |
| 8 Nov 2023 |
0722 |
Explosion. |
| 12 Nov 2023 |
0136 |
Small gas emissions. |
| 14 Nov 2023 |
0415 |
Small gas emissions. |
According to OVSICORI-UNA, during July-October the average weekly sulfur dioxide (SO2) flux ranged from 68 to 240 tonnes/day. However, in mid-November the flux increased to as high as 334 tonnes/day, the highest value measured in recent years. The high SO2 flux in mid-November was also detected by the TROPOMI instrument on the Sentinel-5P satellite (figure 43).
Geologic Background. Rincón de la Vieja, the largest volcano in NW Costa Rica, is a remote volcanic complex in the Guanacaste Range. The volcano consists of an elongated, arcuate NW-SE-trending ridge constructed within the 15-km-wide early Pleistocene Guachipelín caldera, whose rim is exposed on the south side. Sometimes known as the "Colossus of Guanacaste," it has an estimated volume of 130 km3 and contains at least nine major eruptive centers. Activity has migrated to the SE, where the youngest-looking craters are located. The twin cone of Santa María volcano, the highest peak of the complex, is located at the eastern end of a smaller, 5-km-wide caldera and has a 500-m-wide crater. A Plinian eruption producing the 0.25 km3 Río Blanca tephra about 3,500 years ago was the last major magmatic eruption. All subsequent eruptions, including numerous historical eruptions possibly dating back to the 16th century, have been from the prominent active crater containing a 500-m-wide acid lake located ENE of Von Seebach crater.
Information Contacts: Observatorio Vulcanológico Sismológica de Costa Rica-Universidad Nacional (OVSICORI-UNA), Apartado 86-3000, Heredia, Costa Rica (URL: http://www.ovsicori.una.ac.cr/); NASA Global Sulfur Dioxide Monitoring Page, Atmospheric Chemistry and Dynamics Laboratory, NASA Goddard Space Flight Center (NASA/GSFC), 8800 Greenbelt Road, Goddard MD 20771, USA (URL: https://so2.gsfc.nasa.gov/).
Bezymianny (Russia) — November 2023 Cite this Report
Bezymianny
Russia
55.972°N, 160.595°E; summit elev. 2882 m
All times are local (unless otherwise noted)
Explosion on 18 October 2023 sends ash plume 8 km high; lava flows and incandescent avalanches
Bezymianny, located on Russia’s Kamchatka Peninsula, has had eruptions since 1955 characterized by dome growth, explosions, pyroclastic flows, ash plumes, and ashfall. Activity during November 2022-April 2023 included gas-and-steam emissions, lava dome collapses generating avalanches, and persistent thermal activity. Similar eruptive activity continued from May through October 2023, described here based on information from weekly and daily reports of the Kamchatka Volcano Eruptions Response Team (KVERT), notices from Tokyo VAAC (Volcanic Ash Advisory Center), and from satellite data.
Overall activity decreased after the strong period of activity in late March through April 2023, which included ash explosions during 29 March and 7-8 April 2023 that sent plumes as high as 10-12 km altitude, along with dome growth and lava flows (BGVN 48:05). This reduced activity can be seen in the MIROVA thermal detection system graph (figure 56), which was consistent with data from the MODVOLC thermal detection system and with Sentinel-2 satellite images that showed persistent hotspots in the summit crater when conditions allowed observations. A renewed period of strong activity began in mid-October 2023.
Activity increased significantly on 17 October 2023 when large collapses began during 0700-0830 on the E flanks of the lava dome and continued to after 0930 the next day (figure 57). Ash plumes rose to an altitude of 4.5-5 km, extending 220 km NNE by 18 October. A large explosion at 1630 on 18 October produced an ash plume that rose to an altitude of 11 km (8 km above the summit) and drifted NNE and then NW, extending 900 km NW within two days at an altitude of 8 km. Minor ashfall was noted in Kozyrevsk (45 km WNW). At 0820 on 20 October an ash plume was identified in satellite images drifting 100 km ENE at altitudes of 4-4.5 km.
Lava flows and hot avalanches from the dome down the SE flank continued over the next few days, including 23 October when clear conditions allowed good observations (figures 58 and 59). A large thermal anomaly was observed over the volcano through 24 October, and in the summit crater on 30 October (figure 60). Strong fumarolic activity continued, with numerous avalanches and occasional incandescence. By the last week of October, volcanic activity had decreased to a level consistent with that earlier in the reporting period.
Aviation warnings were frequently updated during 17-20 October. KVERT issued a Volcano Observatory Notice for Aviation (VONA) on 17 October at 1419 and 1727 (0219 and 0527 UTC) raising the Aviation Color Code (ACC) from Yellow to Orange (second highest level). The next day, KVERT issued a VONA at 1705 (0505 UTC) raising the ACC to Red (highest level) but lowered it back to Orange at 2117 (0917 UTC). After another decrease to Yellow and back to Orange, the ACC was reduced to Yellow on 20 October at 1204 (0004 UTC). In addition, the Tokyo VAAC issued a series of Volcanic Ash Advisories beginning on 16 October and continuing through 30 October.
Geologic Background. The modern Bezymianny, much smaller than its massive neighbors Kamen and Kliuchevskoi on the Kamchatka Peninsula, was formed about 4,700 years ago over a late-Pleistocene lava-dome complex and an edifice built about 11,000-7,000 years ago. Three periods of intensified activity have occurred during the past 3,000 years. The latest period, which was preceded by a 1,000-year quiescence, began with the dramatic 1955-56 eruption. This eruption, similar to that of St. Helens in 1980, produced a large open crater that was formed by collapse of the summit and an associated lateral blast. Subsequent episodic but ongoing lava-dome growth, accompanied by intermittent explosive activity and pyroclastic flows, has largely filled the 1956 crater.
Information Contacts: Kamchatka Volcanic Eruptions Response Team (KVERT), Far Eastern Branch, Russian Academy of Sciences, 9 Piip Blvd., Petropavlovsk-Kamchatsky, 683006, Russia (URL: http://www.kscnet.ru/ivs/kvert/); Kamchatka Volcanological Station, Kamchatka Branch of Geophysical Survey, (KB GS RAS), Klyuchi, Kamchatka Krai, Russia (URL: http://volkstat.ru/); Tokyo Volcanic Ash Advisory Center (VAAC), 1-3-4 Otemachi, Chiyoda-ku, Tokyo 100-8122, Japan (URL: http://ds.data.jma.go.jp/svd/vaac/data/); Hawai'i Institute of Geophysics and Planetology (HIGP) - MODVOLC Thermal Alerts System, School of Ocean and Earth Science and Technology (SOEST), Univ. of Hawai'i, 2525 Correa Road, Honolulu, HI 96822, USA (URL: http://modis.higp.hawaii.edu/); MIROVA (Middle InfraRed Observation of Volcanic Activity), a collaborative project between the Universities of Turin and Florence (Italy) supported by the Centre for Volcanic Risk of the Italian Civil Protection Department (URL: http://www.mirovaweb.it/); Copernicus Browser, Copernicus Data Space Ecosystem, European Space Agency (URL: https://dataspace.copernicus.eu/browser/).chr
Kilauea (United States) — January 2023 Cite this Report
Kilauea
United States
19.421°N, 155.287°W; summit elev. 1222 m
All times are local (unless otherwise noted)
Low-level lava effusions in the lava lake at Halema’uma’u during July-December 2022
Kīlauea is the southeastern-most volcano in Hawaii and overlaps the E flank of the Mauna Loa volcano. Its East Rift Zone (ERZ) has been intermittently active for at least 2,000 years. An extended eruption period began in January 1983 and was characterized by open lava lakes and lava flows from the summit caldera and the East Rift Zone. During May 2018 magma migrated into the Lower East Rift Zone (LERZ) and opened 24 fissures along a 6-km-long NE-trending fracture zone that produced lava flows traveling in multiple directions. As lava emerged from the fissures, the lava lake at Halema'uma'u drained and explosions sent ash plumes to several kilometers altitude (BGVN 43:10).
The current eruption period started during September 2021 and has recently been characterized by lava effusions, spatter, and sulfur dioxide emissions in the active Halema’uma’u lava lake (BGVN 47:08). Lava effusions, some spatter, and sulfur dioxide emissions have continued during this reporting period of July through December 2022 using daily reports, volcanic activity notices, and abundant photo, map, and video data from the US Geological Survey's (USGS) Hawaiian Volcano Observatory (HVO).
Summary of activity during July-December 2022. Low-level effusions have continued at the western vent of the Halema’uma’u crater during July through early December 2022. Occasional weak ooze-outs (also called lava break outs) would occur along the margins of the crater floor. The overall level of the active lava lake throughout the reporting period gradually increased due to infilling, however it stagnated in mid-September (table 13). During September through November, activity began to decline, though lava effusions persisted at the western vent. By 9 December, the active part of the lava lake had completely crusted over, and incandescence was no longer visible.
Table 13. Summary of measurements taken during overflights at Kīlauea that show a gradual increase in the active lava lake level and the volume of lava effused since 29 September 2021. Lower activity was reported during September-October. Data collected during July-December 2022. Courtesy of HVO.
| Date: |
Level of the active lava lake (m): |
Cumulative volume of lava effused (million cubic meters): |
| 7 Jul 2022 |
130 |
95 |
| 19 Jul 2022 |
133 |
98 |
| 4 Aug 2022 |
136 |
102 |
| 16 Aug 2022 |
137 |
104 |
| 12 Sep 2022 |
143 |
111 |
| 5 Oct 2022 |
143 |
111 |
| 28 Oct 2022 |
143 |
111 |
Activity during July 2022. Lava effusions were reported from the western vent in the Halema’uma’u crater, along with occasional weak ooze-outs along the margins of the crater floor. The height of the lava lake was variable due to deflation-inflation tilt events; for example, the lake level dropped approximately 3-4 m during a summit deflation-inflation event reported on 1 July. Webcam images taken during the night of 6-12 July showed intermittent low-level spattering at the western vent that rose less than 10 m above the vent (figure 519). Measurements made during an overflight on 7 July indicated that the crater floor was infilled about 130 m and that 95 million cubic meters of lava had been effused since 29 September 2021. A single, relatively small lava ooze-out was active to the S of the lava lake. Around midnight on 8 July there were two brief periods of lava overflow onto the lake margins. On 9 July lava ooze-outs were reported near the SE and NE edges of the crater floor and during 10-11 July they occurred near the E, NE, and NW edges. On 16 July crater incandescence was reported, though the ooze-outs and spattering were not visible. On 18 July overnight webcam images showed incandescence in the western vent complex and two ooze-outs were reported around 0000 and 0200 on 19 July. By 0900 there were active ooze-outs along the SW edge of the crater floor. Measurements made from an overflight on 19 July indicated that the crater floor was infilled about 133 m and 98 million cubic meters of lava had erupted since 29 September 2021 (figure 520). On 20 July around 1600 active ooze-outs were visible along the N edge of the crater, which continued through the next day. Extensive ooze-outs occurred along the W margin during 24 July until 1900; on 26 July minor ooze-outs were noted along the N margin. Minor spattering was visible on 29 July along the E margin of the lake. The sulfur dioxide emission rates ranged 650-2,800 tons per day (t/d), the higher of which was measured on 8 July (figure 519).
Activity during August 2022. The eruption continued in the Halema’uma’u crater at the western vent. According to HVO the lava in the active lake remained at the level of the bounding levees. Occasional minor ooze-outs were observed along the margins of the crater floor. Strong nighttime crater incandescence was visible after midnight on 6 August over the western vent cone. During 6-7 August scattered small lava lobes were active along the crater floor and incandescence persisted above the western vent through 9 August. During 7-9 August HVO reported a single lava effusion source was active along the NW margin of the crater floor. Measurements from an overflight on 4 August indicated that the crater floor was infilled about 136 m total and that 102 million cubic meters of lava had been erupted since the start of the eruption. Lava breakouts were reported along the N, NE, E, S, and W margins of the crater during 10-16 August. Another overflight survey conducted on 16 August indicated that the crater floor infilled about 137 m and 104 million cubic meters of lava had been erupted since September 2021. Measured sulfur dioxide emissions rates ranged 1,150-2,450 t/d, the higher of which occurred on 8 August.
Activity during September 2022. During September, lava effusion continued from the western vent into the active lava lake and onto the crater floor. Intermittent minor ooze-outs were reported through the month. A small ooze-out was visible on the W crater floor margin at 0220 on 2 September, which showed decreasing surface activity throughout the day, but remained active through 3 September. On 3 September around 1900 a lava outbreak occurred along the NW margin of the crater floor but had stopped by the evening of 4 September. Field crews monitoring the summit lava lake on 9 September observed spattering on the NE margin of the lake that rose no higher than 10 m, before falling back onto the lava lake crust (figure 521). Overflight measurements on 12 September indicated that the crater floor was infilled a total of 143 m and 111 million cubic meters of lava had been erupted since September 2021. Extensive breakouts in the W and N part of the crater floor were reported at 1600 on 20 September and continued into 26 September. The active part of the lava lake dropped by 10 m while other parts of the crater floor dropped by several meters. Summit tiltmeters recorded a summit seismic swarm of more than 80 earthquakes during 1500-1800 on 21 September, which occurred about 1.5 km below Halema’uma’u; a majority of these were less than Mw 2. By 22 September the active part of the lava lake was infilled about 2 m. On 23 September the western vent areas exhibited several small spatter cones with incandescent openings, along with weak, sporadic spattering (figure 522). The sulfur dioxide emission rate ranged from 930 t/d to 2,000 t/d, the higher of which was measured on 6 September.
Activity during October 2022. Activity during October declined slightly compared to previous months, though lava effusions persisted from the western vent into the active lava lake and onto the crater floor during October (figure 523). Slight variations in the lava lake were noted throughout the month. HVO reported that around 0600 on 3 October the level of the lava lake has lowered slightly. Overflight measurements taken on 5 October indicated that the crater floor was infilled a total of about 143 m and that 111 million cubic meters of lava had been effused since September 2021. During 6-7 October the lake gradually rose 0.5 m. Sulfur dioxide measurements made on 22 October had an emission rate of 700 t/d. Another overflight taken on 28 October showed that there was little to no change in the elevation of the crater floor: the crater floor was infilled a total of 143 m and 111 million cubic meters of lava had erupted since the start of the eruption.
Activity during November 2022. Activity remained low during November, though HVO reported that lava from the western vent continued to effuse into the active lava lake and onto the crater floor throughout the month. The rate of sulfur dioxide emissions during November ranged from 300-600 t/d, the higher amount of which occurred on 9 November.
Activity during December 2022. Similar low activity was reported during December, with lava effusing from the western vent into the active lava lake and onto the crater floor. During 4-5 December the active part of the lava lake was slightly variable in elevation and fluctuated within 1 m. On 9 December HVO reported that lava was no longer erupting from the western vent in the Halema’uma’u crater and that sulfur dioxide emissions had returned to near pre-eruption background levels; during 10-11 December, the lava lake had completely crusted over, and no incandescence was visible (figure 524). Time lapse camera images covering the 4-10 December showed that the crater floor showed weak deflation and no inflation. Some passive events of crustal overturning were reported during 14-15 December, which brought fresh incandescent lava to the lake surface. The sulfur dioxide emission rate was approximately 200 t/d on 14 December. A smaller overturn event on 17 December and another that occurred around 0000 and into the morning of 20 December were also detected. A small seismic swarm was later detected on 30 December.
Geologic Background. Kilauea overlaps the E flank of the massive Mauna Loa shield volcano in the island of Hawaii. Eruptions are prominent in Polynesian legends; written documentation since 1820 records frequent summit and flank lava flow eruptions interspersed with periods of long-term lava lake activity at Halemaumau crater in the summit caldera until 1924. The 3 x 5 km caldera was formed in several stages about 1,500 years ago and during the 18th century; eruptions have also originated from the lengthy East and Southwest rift zones, which extend to the ocean in both directions. About 90% of the surface of the basaltic shield volcano is formed of lava flows less than about 1,100 years old; 70% of the surface is younger than 600 years. The long-term eruption from the East rift zone between 1983 and 2018 produced lava flows covering more than 100 km2, destroyed hundreds of houses, and added new coastline.
Information Contacts: Hawaiian Volcano Observatory (HVO), U.S. Geological Survey, PO Box 51, Hawai'i National Park, HI 96718, USA (URL: http://hvo.wr.usgs.gov/).
Nyamulagira (DR Congo) — November 2023 Cite this Report
Nyamulagira
DR Congo
1.408°S, 29.2°E; summit elev. 3058 m
All times are local (unless otherwise noted)
Lava flows and thermal activity during May-October 2023
Nyamulagira (also known as Nyamuragira) is a shield volcano in the Democratic Republic of Congo with the summit truncated by a small 2 x 2.3 km caldera with walls up to about 100 m high. Documented eruptions have occurred within the summit caldera, as well as from numerous flank fissures and cinder cones. The current eruption period began in April 2018 and has more recently been characterized by summit crater lava flows and thermal activity (BGVN 48:05). This report describes lava flows and variable thermal activity during May through October 2023, based on information from the Observatoire Volcanologique de Goma (OVG) and various satellite data.
Lava lake activity continued during May. The MIROVA (Middle InfraRed Observation of Volcanic Activity) system recorded moderate-to-strong thermal activity throughout the reporting period; activity was more intense during May and October and relatively weaker from June through September (figure 95). The MODVOLC thermal algorithm, detected a total of 209 thermal alerts. There were 143 hotspots detected during May, eight during June, nine during September, and 49 during October. This activity was also reflected in infrared satellite images, where a lava flow was visible in the NW part of the crater on 7 May and strong activity was seen in the center of the crater on 4 October (figure 96). Another infrared satellite image taken on 12 May showed still active lava flows along the NW margin of the crater. According to OVG lava effusions were active during 7-29 May and moved to the N and NW parts of the crater beginning on 9 May. Strong summit crater incandescence was visible from Goma (27 km S) during the nights of 17, 19, and 20 May (figure 97). On 17 May there was an increase in eruptive activity, which peaked at 0100 on 20 May. Notable sulfur dioxide plumes drifted NW and W during 19-20 May (figure 98). Drone footage acquired in partnership with the USGS (United States Geological Survey) on 20 May captured images of narrow lava flows that traveled about 100 m down the W flank (figure 99). Data from the Rumangabo seismic station indicated a decreasing trend in activity during 17-21 May. Although weather clouds prevented clear views of the summit, a strong thermal signature on the NW flank was visible in an infrared satellite image on 22 May, based on an infrared satellite image. On 28 May the lava flows on the upper W flank began to cool and solidify. By 29 May seismicity returned to levels similar to those recorded before the 17 May increase. Lava effusion continued but was confined to the summit crater; periodic crater incandescence was observed.
Low-level activity was noted during June through October. On 1 June OVG reported that seismicity remained at lower levels and that crater incandescence had been absent for three days, though infrared satellite imagery showed continued lava effusion in the summit crater. The lava flows on the flanks covered an estimated 0.6 km2. Satellite imagery continued to show thermal activity confined to the lava lake through October (figure 96), although no lava flows or significant sulfur dioxide emissions were reported.
Geologic Background. Africa's most active volcano, Nyamulagira (also known as Nyamuragira), is a massive high-potassium basaltic shield about 25 km N of Lake Kivu and 13 km NNW of the steep-sided Nyiragongo volcano. The summit is truncated by a small 2 x 2.3 km caldera that has walls up to about 100 m high. Documented eruptions have occurred within the summit caldera, as well as from the numerous flank fissures and cinder cones. A lava lake in the summit crater, active since at least 1921, drained in 1938, at the time of a major flank eruption. Recent lava flows extend down the flanks more than 30 km from the summit as far as Lake Kivu; extensive lava flows from this volcano have covered 1,500 km2 of the western branch of the East African Rift.
Information Contacts: Observatoire Volcanologique de Goma (OVG), Departement de Geophysique, Centre de Recherche en Sciences Naturelles, Lwiro, D.S. Bukavu, DR Congo; Hawai'i Institute of Geophysics and Planetology (HIGP) - MODVOLC Thermal Alerts System, School of Ocean and Earth Science and Technology (SOEST), Univ. of Hawai'i, 2525 Correa Road, Honolulu, HI 96822, USA (URL: http://modis.higp.hawaii.edu/); MIROVA (Middle InfraRed Observation of Volcanic Activity), a collaborative project between the Universities of Turin and Florence (Italy) supported by the Centre for Volcanic Risk of the Italian Civil Protection Department (URL: http://www.mirovaweb.it/); NASA Global Sulfur Dioxide Monitoring Page, Atmospheric Chemistry and Dynamics Laboratory, NASA Goddard Space Flight Center (NASA/GSFC), 8800 Greenbelt Road, Goddard, Maryland, USA (URL: https://so2.gsfc.nasa.gov/); Copernicus Browser, Copernicus Data Space Ecosystem, European Space Agency (URL: https://dataspace.copernicus.eu/browser/); Charles Balagizi, Goma Volcano Observatory, Departement de Geophysique, Centre de Recherche en Sciences Naturelles, Lwiro, D.S. Bukavu, DR Congo.
Bagana (Papua New Guinea) — October 2023 Cite this Report
Bagana
Papua New Guinea
6.137°S, 155.196°E; summit elev. 1855 m
All times are local (unless otherwise noted)
Explosions, ash plumes, ashfall, and lava flows during April-September 2023
The remote volcano of Bagana is located in central Bougainville Island, Papua New Guinea. Recorded eruptions date back to 1842 and activity has consisted of effusive activity that has built a small lava dome in the summit crater and occasional explosions that produced pyroclastic flows. The most recent eruption has been ongoing since February 2000 and has produced occasional explosions, ash plumes, and lava flows. More recently, activity has been characterized by ongoing effusive activity and ash emissions (BGVN 48:04). This report updates activity from April through September 2023 that has consisted of explosions, ash plumes, ashfall, and lava flows, using information from the Darwin Volcanic Ash Advisory Center (VAAC) and satellite data.
An explosive eruption was reported on 7 July that generated a large gas-and-ash plume to high altitudes and caused significant ashfall in local communities; the eruption plume had reached upper tropospheric (16-18 km altitude) altitudes by 2200, according to satellite images. Sulfur dioxide plumes were detected in satellite images on 8 July and indicated that the plume was likely a mixture of gas, ice, and ash. A report issued by the Autonomous Bougainville Government (ABG) (Torokina District, Education Section) on 10 July noted that significant ash began falling during 2000-2100 on 7 July and covered most areas in the Vuakovi, Gotana (9 km SW), Koromaketo, Laruma (25 km W) and Atsilima (27 km NW) villages. Pyroclastic flows also occurred, according to ground-based reports; small deposits confined to one drainage were inspected by RVO during an overflight on 17 July and were confirmed to be from the 7 July event. Ashfall continued until 10 July and covered vegetation, which destroyed bushes and gardens and contaminated rivers and streams.
RVO reported another eruption on 14 July. The Darwin VAAC stated that an explosive event started around 0830 on 15 July and produced an ash plume that rose to 16.5 km altitude by 1000 and drifted N, according to satellite images. The plume continued to drift N and remained visible through 1900, and by 2150 it had dissipated.
Ashfall likely from both the 7 and 15 July events impacted about 8,111 people in Torokina (20 km SW), including Tsito/Vuakovi, Gotana, Koromaketo, Kenaia, Longkogari, Kenbaki, Piva (13 km SW), and Atsinima, and in the Tsitovi district, according to ABG. Significant ashfall was also reported in Ruruvu (22 km N) in the Wakunai District of Central Bougainville, though the thickness of these deposits could not be confirmed. An evacuation was called for the villages in Wakunai, where heavy ashfall had contaminated water sources; the communities of Ruruvu, Togarau, Kakarapaia, Karauturi, Atao, and Kuritaturi were asked to evacuate to a disaster center at the Wakunai District Station, and communities in Torokina were asked to evacuate to the Piva District station. According to a news article, more than 7,000 people needed temporary accommodations, with about 1,000 people in evacuation shelters. Ashfall had deposited over a broad area, contaminating water supplies, affecting crops, and collapsing some roofs and houses in rural areas. Schools were temporarily shut down. Intermittent ash emissions continued through the end of July and drifted NNW, NW, and SW. Fine ashfall was reported on the coast of Torokina, and ash plumes also drifted toward Laruma and Atsilima.
A small explosive eruption occurred at 2130 on 28 July that ejected material from the crater vents, according to reports from Torokina, in addition to a lava flow that contained two lobes. A second explosion was detected at 2157. Incandescence from the lava flow was visible from Piva as it descended the W flank around 2000 on 29 July (figure 47). The Darwin VAAC reported that a strong thermal anomaly was visible in satellite images during 30-31 July and that ash emissions rose to 2.4 km altitude and drifted WSW on 30 July. A ground report from RVO described localized emissions at 0900 on 31 July.
The Darwin VAAC reported that ash plumes were identified in satellite imagery at 0800 and 1220 on 12 August and rose to 2.1 km and 3 km altitude and drifted NW and W, respectively. A news report stated that aid was sent to more than 6,300 people that were adversely affected by the eruption. Photos taken during 17-19 August showed ash emissions rising no higher than 1 km above the summit and drifting SE. A small explosion generated an ash plume during the morning of 19 August. Deposits from small pyroclastic flows were also captured in the photos. Satellite images captured lava flows and pyroclastic flow deposits. Two temporary seismic stations were installed near Bagana on 17 August at distances of 7 km WSW (Vakovi station) and 11 km SW (Kepox station). The Kepox station immediately started to record continuous, low-frequency background seismicity.
Satellite data. Little to no thermal activity was detected during April through mid-July 2023; only one anomaly was recorded during early April and one during early June, according to MIROVA (Middle InfraRed Observation of Volcanic Activity) data (figure 48). Thermal activity increased in both power and frequency during mid-July through September, although there were still some short gaps in detected activity. MODVOLC also detected increased thermal activity during August; thermal hotspots were detected a total of five times on 19, 20, and 27 August. Weak thermal anomalies were also captured in infrared satellite images on clear weather days throughout the reporting period on 7, 12, and 17 April, 27 May, 1, 6, 16, and 31 July, and 19 September (figure 48); a strong thermal anomaly was visible on 31 July. Distinct sulfur dioxide plumes that drifted generally NW were intermittently captured by the TROPOMI instrument on the Sentinel-5P satellite and sometimes exceeded two Dobson Units (DUs) (figure 49).
Geologic Background. Bagana volcano, in a remote portion of central Bougainville Island, is frequently active. This massive symmetrical cone was largely constructed by an accumulation of viscous andesitic lava flows. The entire edifice could have been constructed in about 300 years at its present rate of lava production. Eruptive activity is characterized by non-explosive effusion of viscous lava that maintains a small lava dome in the summit crater, although occasional explosive activity produces pyroclastic flows. Lava flows with tongue-shaped lobes up to 50 m thick and prominent levees descend the flanks on all sides.
Information Contacts: Rabaul Volcano Observatory (RVO), Geohazards Management Division, Department of Mineral Policy and Geohazards Management (DMPGM), PO Box 3386, Kokopo, East New Britain Province, Papua New Guinea; Darwin Volcanic Ash Advisory Centre (VAAC), Bureau of Meteorology, Northern Territory Regional Office, PO Box 40050, Casuarina, NT 0811, Australia (URL: http://www.bom.gov.au/info/vaac/); MIROVA (Middle InfraRed Observation of Volcanic Activity), a collaborative project between the Universities of Turin and Florence (Italy) supported by the Centre for Volcanic Risk of the Italian Civil Protection Department (URL: http://www.mirovaweb.it/); Hawai'i Institute of Geophysics and Planetology (HIGP) - MODVOLC Thermal Alerts System, School of Ocean and Earth Science and Technology (SOEST), Univ. of Hawai'i, 2525 Correa Road, Honolulu, HI 96822, USA (URL: http://modis.higp.hawaii.edu/); NASA Global Sulfur Dioxide Monitoring Page, Atmospheric Chemistry and Dynamics Laboratory, NASA Goddard Space Flight Center (NASA/GSFC), 8800 Greenbelt Road, Goddard, Maryland, USA (URL: https://so2.gsfc.nasa.gov/); Copernicus Browser, Copernicus Data Space Ecosystem, European Space Agency (URL: https://dataspace.copernicus.eu/browser/); Autonomous Bougainville Government, P.O Box 322, Buka, AROB, PNG (URL: https://abg.gov.pg/); Andrew Tupper (Twitter: @andrewcraigtupp); Simon Carn, Geological and Mining Engineering and Sciences, Michigan Technological University, 1400 Townsend Drive, Houghton, MI 49931, USA (URL: http://www.volcarno.com/, Twitter: @simoncarn); Radio NZ (URL: https://www.rnz.co.nz/news/pacific/494464/more-than-7-000-people-in-bougainville-need-temporary-accommodation-after-eruption); USAID, 1300 Pennsylvania Ave, NW, Washington DC 20004, USA (URL: https://www.usaid.gov/pacific-islands/press-releases/aug-08-2023-united-states-provides-immediate-emergency-assistance-support-communities-affected-mount-bagana-volcanic-eruptions).
Mayon (Philippines) — October 2023 Cite this Report
Mayon
Philippines
13.257°N, 123.685°E; summit elev. 2462 m
All times are local (unless otherwise noted)
Lava flows, pyroclastic flows, ash emissions, and seismicity during April-September 2023
Mayon is located in the Philippines and has steep upper slopes capped by a small summit crater. Historical eruptions date back to 1616 CE that have been characterized by Strombolian eruptions, lava flows, pyroclastic flows, and mudflows. Eruptions mostly originated from a central conduit. Pyroclastic flows and mudflows have commonly descended many of the approximately 40 drainages that surround the volcano. The most recent eruption occurred during June through October 2022 and consisted of lava dome growth and gas-and-steam emissions (BGVN 47:12). A new eruption was reported during late April 2023 and has included lava flows, pyroclastic density currents, ash emissions, and seismicity. This report covers activity during April through September 2023 based on daily bulletins from the Philippine Institute of Volcanology and Seismology (PHIVOLCS).
During April through September 2023, PHIVOLCS reported near-daily rockfall events, frequent volcanic earthquakes, and sulfur dioxide measurements. Gas-and-steam emissions rose 100-900 m above the crater and drifted in different directions. Nighttime crater incandescence was often visible during clear weather and was accompanied by incandescent avalanches of material. Activity notably increased during June when lava flows were reported on the S, SE, and E flanks (figure 52). The MIROVA graph (Middle InfraRed Observation of Volcanic Activity) showed strong thermal activity coincident with these lava flows, which remained active through September (figure 53). According to the MODVOLC thermal algorithm, a total of 110 thermal alerts were detected during the reporting period: 17 during June, 40 during July, 27 during August, and 26 during September. During early June, pyroclastic density currents (PDCs) started to occur more frequently.
Low activity was reported during much of April and May; gas-and-steam emissions rose 100-900 m above the crater and generally drifted in different directions. A total of 52 rockfall events and 18 volcanic earthquakes were detected during April and 147 rockfall events and 13 volcanic events during May. Sulfur dioxide flux measurements ranged between 400-576 tons per day (t/d) during April, the latter of which was measured on 29 April and between 162-343 t/d during May, the latter of which was measured on 13 May.
Activity during June increased, characterized by lava flows, pyroclastic density currents (PDCs), crater incandescence and incandescent rockfall events, gas-and-steam emissions, and continued seismicity. Weather clouds often prevented clear views of the summit, but during clear days, moderate gas-and-steam emissions rose 100-2,500 m above the crater and drifted in multiple directions. A total of 6,237 rockfall events and 288 volcanic earthquakes were detected. The rockfall events often deposited material on the S and SE flanks within 700-1,500 m of the summit crater and ash from the events drifted SW, S, SE, NE, and E. Sulfur dioxide emissions ranged between 149-1,205 t/d, the latter of which was measured on 10 June. Short-term observations from EDM and electronic tiltmeter monitoring indicated that the upper slopes were inflating since February 2023. Longer-term ground deformation parameters based on EDM, precise leveling, continuous GPS, and electronic tilt monitoring indicated that the volcano remained inflated, especially on the NW and SE flanks. At 1000 on 5 June the Volcano Alert Level (VAL) was raised to 2 (on a 0-5 scale). PHIVOLCS noted that although low-level volcanic earthquakes, ground deformation, and volcanic gas emissions indicated unrest, the steep increase in rockfall frequency may indicate increased dome activity.
A total of 151 dome-collapse PDCs occurred during 8-9 and 11-30 June, traveled 500-2,000 m, and deposited material on the S flank within 2 km of the summit crater. During 8-9 June the VAL was raised to 3. At approximately 1947 on 11 June lava flow activity was reported; two lobes traveled within 500 m from the crater and deposited material on the S (Mi-isi), SE (Bonga), and E (Basud) flanks. Weak seismicity accompanied the lava flow and slight inflation on the upper flanks. This lava flow remained active through 30 June, moving down the S and SE flank as far as 2.5 km and 1.8 km, respectively and depositing material up to 3.3 km from the crater. During 15-16 June traces of ashfall from the PDCs were reported in Sitio Buga, Nabonton, City of Ligao and Purok, and San Francisco, Municipality of Guinobatan. During 28-29 June there were two PDCs generated by the collapse of the lava flow front, which generated a light-brown ash plume 1 km high. Satellite monitors detected significant concentrations of sulfur dioxide beginning on 29 June. On 30 June PDCs primarily affected the Basud Gully on the E flank, the largest of which occurred at 1301 and lasted eight minutes, based on the seismic record. Four PDCs generated between 1800 and 2000 that lasted approximately four minutes each traveled 3-4 km on the E flank and generated an ash plume that rose 1 km above the crater and drifted N and NW. Ashfall was recorded in Tabaco City.
Similar strong activity continued during July; slow lava effusion remained active on the S and SE flanks and traveled as far as 2.8 km and 2.8 km, respectively and material was deposited as far as 4 km from the crater. There was a total of 6,983 rockfall events and 189 PDCs that affected the S, SE, and E flanks. The volcano network detected a total of 2,124 volcanic earthquakes. Continuous gas-and-steam emissions rose 200-2,000 m above the crater and drifted in multiple directions. Sulfur dioxide emissions averaged 792-4,113 t/d, the latter of which was measured on 28 July. During 2-4 July three PDCs were generated from the collapse of the lava flow and resulting light brown plumes rose 200-300 m above the crater. Continuous tremor pulses were reported beginning at 1547 on 3 July through 7 July at 1200, at 2300 on 8 July and going through 0300 on 10 July, and at 2300 on 16 July, as recorded by the seismic network. During 6-9 July there were 10 lava flow-collapse-related PDCs that generated light brown plumes 300-500 m above the crater. During 10-11 July light ashfall was reported in some areas of Mabinit, Legazpi City, Budiao and Salvacion, Daraga, and Camalig, Albay. By 18 July the lava flow advanced 600 m on the E flank as well.
During 1733 on 18 July and 0434 on 19 July PHIVOLCS reported 30 “ashing” events, which are degassing events accompanied by audible thunder-like sounds and entrained ash at the crater, which produced short, dark plumes that drifted SW. These events each lasted 20-40 seconds, and plume heights ranged from 150-300 m above the crater, as recorded by seismic, infrasound, visual, and thermal monitors. Three more ashing events occurred during 19-20 July. Short-term observations from electronic tilt and GPS monitoring indicate deflation on the E lower flanks in early July and inflation on the NW middle flanks during the third week of July. Longer-term ground deformation parameters from EDM, precise leveling, continuous GPS, and electronic tilt monitoring indicated that the volcano was still generally inflated relative to baseline levels. A short-lived lava pulse lasted 28 seconds at 1956 on 21 July, which was accompanied by seismic and infrasound signals. By 22 July, the only lava flow that remained active was on the SE flank, and continued to extend 3.4 km, while those on the S and E flanks weakened markedly. One ashing event was detected during 30-31 July, whereas there were 57 detected during 31 July-1 August; according to PHIVOLCS beginning at approximately 1800 on 31 July eruptive activity was dominated by phases of intermittent ashing, as well as increased in the apparent rates of lava effusion from the summit crater. The ashing phases consisted of discrete events recorded as low-frequency volcanic earthquakes (LFVQ) typically 30 seconds in duration, based on seismic and infrasound signals. Gray ash plume rose 100 m above the crater and generally drifted NE. Shortly after these ashing events began, new lava began to effuse rapidly from the crater, feeding the established flowed on the SE, E, and E flanks and generating frequent rockfall events.
Intensified unrest persisted during August. There was a total of 4,141 rockfall events, 2,881 volcanic earthquakes, which included volcanic tremor events, 32 ashing events, and 101 PDCs detected throughout the month. On clear weather days, gas-and-steam emissions rose 300-1,500 m above the crater and drifted in different directions (figure 54). Sulfur dioxide emissions averaged 735-4,756 t/d, the higher value of which was measured on 16 August. During 1-2 August the rate of lava effusion decreased, but continued to feed the flows on the SE, S, and E flanks, maintaining their advances to 3.4 km, 2.8 km, and 1.1 km from the crater, respectively (figure 55). Rockfall and PDCs generated by collapses at the lava flow margins and from the summit dome deposited material within 4 km of the crater. During 3-4 August there were 10 tremor events detected that lasted 1-4 minutes. Short-lived lava pulse lasted 35 seconds and was accompanied by seismic and infrasound signals at 0442 on 6 August. Seven collapses were recorded at the front of the lava flow during 12-14 August.
During September, similar activity of slow lava effusion, PDCs, gas-and-steam emissions, and seismicity continued. There was a total of 4,452 rockfall events, 329 volcanic earthquakes, which included volcanic tremor events, two ashing events, and 85 PDCs recorded throughout the month. On clear weather days, gas-and-steam emissions rose 100-1,500 m above the crater and drifted in multiple directions. Sulfur dioxide emissions averaged 609-2,252 t/d, the higher average of which was measured on 6 September. Slow lava effusion continued advancing on the SE, S, and E flanks, maintaining lengths of 3.4 km, 2.8 km, and 1.1 km, respectively. Rockfall and PDC events generated by collapses along the lava flow margins and at the summit dome deposited material within 4 km of the crater.
Geologic Background. Symmetrical Mayon, which rises above the Albay Gulf NW of Legazpi City, is the most active volcano of the Philippines. The steep upper slopes are capped by a small summit crater. Recorded eruptions since 1616 CE range from Strombolian to basaltic Plinian, with cyclical activity beginning with basaltic eruptions, followed by longer periods of andesitic lava flows. Eruptions occur predominately from the central conduit and have also produced lava flows that travel far down the flanks. Pyroclastic density currents and mudflows have commonly swept down many of the approximately 40 ravines that radiate from the summit and have often damaged populated lowland areas. A violent eruption in 1814 killed more than 1,200 people and devastated several towns.
Information Contacts: Philippine Institute of Volcanology and Seismology (PHIVOLCS), Department of Science and Technology, University of the Philippines Campus, Diliman, Quezon City, Philippines (URL: http://www.phivolcs.dost.gov.ph/); MIROVA (Middle InfraRed Observation of Volcanic Activity), a collaborative project between the Universities of Turin and Florence (Italy) supported by the Centre for Volcanic Risk of the Italian Civil Protection Department (URL: http://www.mirovaweb.it/); Hawai'i Institute of Geophysics and Planetology (HIGP) - MODVOLC Thermal Alerts System, School of Ocean and Earth Science and Technology (SOEST), Univ. of Hawai'i, 2525 Correa Road, Honolulu, HI 96822, USA (URL: http://modis.higp.hawaii.edu/); Copernicus Browser, Copernicus Data Space Ecosystem, European Space Agency (URL: https://dataspace.copernicus.eu/browser/); William Rogers, Legazpi City, Albay Province, Philippines.
Nishinoshima (Japan) — October 2023 Cite this Report
Nishinoshima
Japan
27.247°N, 140.874°E; summit elev. 100 m
All times are local (unless otherwise noted)
Eruption plumes and gas-and-steam plumes during May-August 2023
Nishinoshima, located about 1,000 km S of Tokyo, is a small island in the Ogasawara Arc in Japan. The island is the summit of a massive submarine volcano that has prominent submarine peaks to the S, W, and NE. Eruptions date back to 1973 and the current eruption period began in October 2022. Recent activity has consisted of small ash plumes and fumarolic activity (BGVN 48:07). This report covers activity during May through August 2023, using information from monthly reports of the Japan Meteorological Agency (JMA) monthly reports and satellite data.
Activity during May through June was relatively low. The Japan Coast Guard (JCG) did overflights on 14 and 22 June and reported white gas-and-steam emissions rising 600 m and 1,200 m from the central crater of the pyroclastic cone, respectively (figure 125). In addition, multiple white gas-and-steam emissions rose from the inner rim of the W side of the crater and from the SE flank of the pyroclastic cone. Discolored brown-to-green water was observed around almost the entire perimeter of the island; on 22 June light green discolored water was observed off the S coast of the island.
Observations from the Himawari meteorological satellite confirmed an eruption on 9 and 10 July. An eruption plume rose 1.6 km above the crater and drifted N around 1300 on 9 July. Satellite images acquired at 1420 and 2020 on 9 July and at 0220 on 10 July showed continuing emissions that rose 1.3-1.6 km above the crater and drifted NE and N. The Tokyo VAAC reported that an ash plume seen by a pilot and identified in a satellite image at 0630 on 21 July rose to 3 km altitude and drifted S.
Aerial observations conducted by JCG on 8 August showed a white-and-gray plume rising from the central crater of the pyroclastic cone, and multiple white gas-and-steam emissions were rising from the inner edge of the western crater and along the NW-SE flanks of the island (figure 126). Brown-to-green discolored water was also noted around the perimeter of the island.
Intermittent low-to-moderate power thermal anomalies were recorded in the MIROVA graph (Middle InfraRed Observation of Volcanic Activity), showing an increase in both frequency and power beginning in July (figure 127). This increase in activity coincides with eruptive activity on 9 and 10 July, characterized by eruption plumes. According to the MODVOLC thermal alert algorithm, one thermal hotspot was recorded on 20 July. Weak thermal anomalies were also detected in infrared satellite imagery, accompanied by strong gas-and-steam plumes (figure 128).
Geologic Background. The small island of Nishinoshima was enlarged when several new islands coalesced during an eruption in 1973-74. Multiple eruptions that began in 2013 completely covered the previous exposed surface and continued to enlarge the island. The island is the summit of a massive submarine volcano that has prominent peaks to the S, W, and NE. The summit of the southern cone rises to within 214 m of the ocean surface 9 km SSE.
Information Contacts: Japan Meteorological Agency (JMA), 1-3-4 Otemachi, Chiyoda-ku, Tokyo 100-8122, Japan (URL: http://www.jma.go.jp/jma/indexe.html); Tokyo Volcanic Ash Advisory Center (VAAC), 1-3-4 Otemachi, Chiyoda-ku, Tokyo 100-8122, Japan (URL: http://ds.data.jma.go.jp/svd/vaac/data/); MIROVA (Middle InfraRed Observation of Volcanic Activity), a collaborative project between the Universities of Turin and Florence (Italy) supported by the Centre for Volcanic Risk of the Italian Civil Protection Department (URL: http://www.mirovaweb.it/); Copernicus Browser, Copernicus Data Space Ecosystem, European Space Agency (URL: https://dataspace.copernicus.eu/browser/).
Krakatau (Indonesia) — October 2023 Cite this Report
Krakatau
Indonesia
6.1009°S, 105.4233°E; summit elev. 285 m
All times are local (unless otherwise noted)
White gas-and-steam plumes and occasional ash plumes during May-August 2023
Krakatau is located in the Sunda Strait between Java and Sumatra, Indonesia. Caldera collapse during the catastrophic 1883 eruption destroyed Danan and Perbuwatan cones and left only a remnant of Rakata. The post-collapse cone of Anak Krakatau (Child of Krakatau) was constructed within the 1883 caldera at a point between the former Danan and Perbuwatan cones; it has been the site of frequent eruptions since 1927. The current eruption period began in May 2021 and has recently consisted of Strombolian eruptions and ash plumes (BGVN 48:07). This report describes lower levels of activity consisting of ash and white gas-and-steam plumes during May through August 2023, based on information provided by the Indonesian Center for Volcanology and Geological Hazard Mitigation, referred to as Pusat Vulkanologi dan Mitigasi Bencana Geologi (PVMBG), MAGMA Indonesia, and satellite data.
Activity was relatively low during May and June. Daily white gas-and-steam emissions rose 25-200 m above the crater and drifted in different directions. Five ash plumes were detected at 0519 on 10 May, 1241 on 11 May, 0920 on 12 May, 2320 on 12 May, and at 0710 on 13 May, and rose 1-2.5 km above the crater and drifted SW. A webcam image taken on 12 May showed ejection of incandescent material above the vent. A total of nine ash plumes were detected during 6-11 June: at 1434 and 00220 on 6 and 7 June the ash plumes rose 500 m above the crater and drifted NW, at 1537 on 8 June the ash plume rose 1 km above the crater and drifted SW, at 0746 and at 0846 on 9 June the ash plumes rose 800 m and 3 km above the crater and drifted SW, respectively, at 0423, 1431, and 1750 on 10 June the ash plumes rose 2 km, 1.5 km, and 3.5 km above the crater and drifted NW, respectively, and at 0030 on 11 June an ash plume rose 2 km above the crater and drifted NW. Webcam images taken on 10 and 11 June at 0455 and 0102, respectively, showed incandescent material ejected above the vent. On 19 June an ash plume at 0822 rose 1.5 km above the crater and drifted SE.
Similar low activity of white gas-and-steam emissions and few ash plumes were reported during July and August. Daily white gas-and-steam emissions rose 25-300 m above the crater and drifted in multiple directions. Three ash plumes were reported at 0843, 0851, and 0852 on 20 July that rose 500-2,000 m above the crater and drifted NW.
The MIROVA (Middle InfraRed Observation of Volcanic Activity) graph of MODIS thermal anomaly data showed intermittent low-to-moderate power thermal anomalies during May through August 2023 (figure 140). Although activity was often obscured by weather clouds, a thermal anomaly was visible in an infrared satellite image of the crater on 12 May, accompanied by an eruption plume that drifted SW (figure 141).
Geologic Background. The renowned Krakatau (frequently mis-named as Krakatoa) volcano lies in the Sunda Strait between Java and Sumatra. Collapse of an older edifice, perhaps in 416 or 535 CE, formed a 7-km-wide caldera. Remnants of that volcano are preserved in Verlaten and Lang Islands; subsequently the Rakata, Danan, and Perbuwatan cones were formed, coalescing to create the pre-1883 Krakatau Island. Caldera collapse during the catastrophic 1883 eruption destroyed Danan and Perbuwatan, and left only a remnant of Rakata. This eruption caused more than 36,000 fatalities, most as a result of tsunamis that swept the adjacent coastlines of Sumatra and Java. Pyroclastic surges traveled 40 km across the Sunda Strait and reached the Sumatra coast. After a quiescence of less than a half century, the post-collapse cone of Anak Krakatau (Child of Krakatau) was constructed within the 1883 caldera at a point between the former Danan and Perbuwatan cones. Anak Krakatau has been the site of frequent eruptions since 1927.
Information Contacts: Pusat Vulkanologi dan Mitigasi Bencana Geologi (PVMBG, also known as Indonesian Center for Volcanology and Geological Hazard Mitigation, CVGHM), Jalan Diponegoro 57, Bandung 40122, Indonesia (URL: http://www.vsi.esdm.go.id/); MAGMA Indonesia, Kementerian Energi dan Sumber Daya Mineral (URL: https://magma.esdm.go.id/v1); MIROVA (Middle InfraRed Observation of Volcanic Activity), a collaborative project between the Universities of Turin and Florence (Italy) supported by the Centre for Volcanic Risk of the Italian Civil Protection Department (URL: http://www.mirovaweb.it/); Copernicus Browser, Copernicus Data Space Ecosystem, European Space Agency (URL: https://dataspace.copernicus.eu/browser/).
Villarrica (Chile) — October 2023 Cite this Report
Villarrica
Chile
39.42°S, 71.93°W; summit elev. 2847 m
All times are local (unless otherwise noted)
Strombolian activity, gas-and-ash emissions, and crater incandescence during April-September 2023
Villarrica, in central Chile, consists of a 2-km-wide caldera that formed about 3,500 years ago and is located at the base of the presently active cone at the NW margin of a 6-km-wide caldera. Historical eruptions eruptions date back to 1558 and have been characterized by mild-to-moderate explosive activity with occasional lava effusions. The current eruption period began in December 2014 and has recently consisted of nighttime crater incandescence, ash emissions, and seismicity (BGVN 48:04). This report covers activity during April through September 2023 and describes occasional Strombolian activity, gas-and-ash emissions, and nighttime crater incandescence. Information for this report primarily comes from the Southern Andes Volcano Observatory (Observatorio Volcanológico de Los Andes del Sur, OVDAS), part of Chile's National Service of Geology and Mining (Servicio Nacional de Geología y Minería, SERNAGEOMIN) and satellite data.
Seismicity during April consisted of long period (LP) events and tremor (TRE); a total of 9,413 LP-type events and 759 TR-type events were detected throughout the month. Nighttime crater incandescence persisted and was visible in the degassing column. Sulfur dioxide data was obtained using Differential Absorption Optical Spectroscopy Equipment (DOAS) that showed an average value of 1,450 ± 198 tons per day (t/d) during 1-15 April and 1,129 ± 201 t/d during 16-30 April, with a maximum daily value of 2,784 t/d on 9 April. Gas-and-steam emissions of variable intensities rose above the active crater as high as 1.3 km above the crater on 13 April. Strombolian explosions were not observed and there was a slight decrease in the lava lake level.
There were 14,123 LP-type events and 727 TR-type events detected during May. According to sulfur dioxide measurements taken with DOAS equipment, the active crater emitted an average value of 1,826 ± 482 t/d during 1-15 May and 912 ± 41 t/d during 16-30 May, with a daily maximum value of 5,155 t/d on 13 May. Surveillance cameras showed continuous white gas-and-steam emissions that rose as high as 430 m above the crater on 27 May. Nighttime incandescence illuminated the gas column less than 300 m above the crater rim was and no pyroclastic emissions were reported. A landslide was identified on 13 May on the E flank of the volcano 50 m from the crater rim and extending 300 m away; SERNAGEOMIN noted that this event may have occurred on 12 May. During the morning of 27 and 28 May minor Strombolian explosions characterized by incandescent ejecta were recorded at the crater rim; the last reported Strombolian explosions had occurred at the end of March.
Seismic activity during June consisted of five volcano-tectonic (VT)-type events, 21,606 LP-type events, and 2,085 TR-type events. The average value of sulfur dioxide flux obtained by DOAS equipment was 1,420 ± 217 t/d during 1-15 June and 2,562 ± 804 t/d, with a maximum daily value of 4,810 t/d on 17 June. White gas-and-steam emissions rose less than 480 m above the crater; frequent nighttime crater incandescence was reflected in the degassing plume. On 12 June an emission rose 100 m above the crater and drifted NNW. On 15 June one or several emissions resulted in ashfall to the NE as far as 5.5 km from the crater, based on a Skysat satellite image. Several Strombolian explosions occurred within the crater; activity on 15 June was higher energy and ejected blocks 200-300 m on the NE slope. Surveillance cameras showed white gas-and-steam emissions rising 480 m above the crater on 16 June. On 19 and 24 June low-intensity Strombolian activity was observed, ejecting material as far as 200 m from the center of the crater to the E.
During July, seismicity included 29,319 LP-type events, 3,736 TR-type events, and two VT-type events. DOAS equipment recorded two days of sulfur dioxide emissions of 4,220 t/d and 1,009 t/d on 1 and 13 July, respectively. Constant nighttime incandescence was also recorded and was particularly noticeable when accompanied by eruptive columns on 12 and 16 July. Minor explosive events were detected in the crater. According to Skysat satellite images taken on 12, 13, and 16 July, ashfall deposits were identified 155 m S of the crater. According to POVI, incandescence was visible from two vents on the crater floor around 0336 on 12 July. Gas-and-ash emissions rose as high as 1.2 km above the crater on 13 July and drifted E and NW. A series of gas-and-steam pulses containing some ash deposited material on the upper E flank around 1551 on 13 July. During 16-31 July, average sulfur dioxide emissions of 1,679 ± 406 t/d were recorded, with a maximum daily value of 2,343 t/d on 28 July. Fine ash emissions were also reported on 16, 17, and 23 July.
Seismicity persisted during August, characterized by 27,011 LP-type events, 3,323 TR-type events, and three VT-type events. The average value of sulfur dioxide measurements taken during 1-15 August was 1,642 ± 270 t/d and 2,207 ± 4,549 t/d during 16-31 August, with a maximum daily value of 3,294 t/d on 27 August. Nighttime crater incandescence remained visible in degassing columns. White gas-and-steam emissions rose 480 m above the crater on 6 August. According to a Skysat satellite image from 6 August, ash accumulation was observed proximal to the crater and was mainly distributed toward the E slope. White gas-and-steam emissions rose 320 m above the crater on 26 August. Nighttime incandescence and Strombolian activity that generated ash emissions were reported on 27 August.
Seismicity during September was characterized by five VT-type events, 12,057 LP-type events, and 2,058 TR-type events. Nighttime incandescence persisted. On 2 September an ash emission rose 180 m above the crater and drifted SE at 1643 (figure 125) and a white gas-and-steam plume rose 320 m above the crater. According to the Buenos Aires VAAC, periods of continuous gas-and-ash emissions were visible in webcam images from 1830 on 2 September to 0110 on 3 September. Strombolian activity was observed on 2 September and during the early morning of 3 September, the latter event of which generated an ash emission that rose 60 m above the crater and drifted 100 m from the center of the crater to the NE and SW. Ashfall was reported to the SE and S as far as 750 m from the crater. The lava lake was active during 3-4 September and lava fountaining was visible for the first time since 26 March 2023, according to POVI. Fountains captured in webcam images at 2133 on 3 September and at 0054 on 4 September rose as high as 60 m above the crater rim and ejected material onto the upper W flank. Sulfur dioxide flux of 1,730 t/d and 1,281 t/d was measured on 3 and 4 September, respectively, according to data obtained by DOAS equipment.
Strong Strombolian activity and larger gas-and-ash plumes were reported during 18-20 September. On 18 September activity was also associated with energetic LP-type events and notable sulfur dioxide fluxes (as high as 4,277 t/d). On 19 September Strombolian activity and incandescence were observed. On 20 September at 0914 ash emissions rose 50 m above the crater and drifted SSE, accompanied by Strombolian activity that ejected material less than 100 m SSE, causing fall deposits on that respective flank. SERNAGEOMIN reported that a Planet Scope satellite image taken on 20 September showed the lava lake in the crater, measuring 32 m x 35 m and an area of 0.001 km2. Several ash emissions were recorded at 0841, 0910, 1251, 1306, 1312, 1315, and 1324 on 23 September and rose less than 150 m above the crater. The sulfur dioxide flux value was 698 t/d on 23 September and 1,097 t/d on 24 September. On 24 September the Volcanic Alert Level (VAL) was raised to Orange (the third level on a four-color scale). SENAPRED maintained the Alert Level at Yellow (the middle level on a three-color scale) for the communities of Villarrica, Pucón (16 km N), Curarrehue, and Panguipulli.
During 24-25 September there was an increase in seismic energy (observed at TR-events) and acoustic signals, characterized by 1 VT-type event, 213 LP-type events, and 124 TR-type events. Mainly white gas-and-steam emissions, in addition to occasional fine ash emissions were recorded. During the early morning of 25 September Strombolian explosions were reported and ejected material 250 m in all directions, though dominantly toward the NW. On 25 September the average value of sulfur dioxide flux was 760 t/d. Seismicity during 25-30 September consisted of five VT-type events, 1,937 LP-type events, and 456 TR-type events.
During 25-29 September moderate Strombolian activity was observed and ejected material as far as the crater rim. In addition, ash pulses lasting roughly 50 minutes were observed around 0700 and dispersed ENE. During 26-27 September a TR episode lasted 6.5 hours and was accompanied by discrete acoustic signals. Satellite images from 26 September showed a spatter cone on the crater floor with one vent that measured 10 x 14 m and a smaller vent about 35 m NE of the cone. SERNAGEOMIN reported an abundant number of bomb-sized blocks up to 150 m from the crater, as well as impact marks on the snow, which indicated explosive activity. A low-altitude ash emission was observed drifting NW around 1140 on 28 September, based on webcam images. Between 0620 and 0850 on 29 September an ash emission rose 60 m above the crater and drifted NW. During an overflight taken around 1000 on 29 September scientists observed molten material in the vent, a large accumulation of pyroclasts inside the crater, and energetic degassing, some of which contained a small amount of ash. Block-sized pyroclasts were deposited on the internal walls and near the crater, and a distal ash deposit was also visible. The average sulfur dioxide flux measured on 28 September was 344 t/d. Satellite images taken on 29 September ashfall was deposited roughly 3 km WNW from the crater and nighttime crater incandescence remained visible. The average sulfur dioxide flux value from 29 September was 199 t/d. On 30 September at 0740 a pulsating ash emission rose 1.1 km above the crater and drifted NNW (figure 126). Deposits on the S flank extended as far as 4.5 km from the crater rim, based on satellite images from 30 September.
Infrared MODIS satellite data processed by MIROVA (Middle InfraRed Observation of Volcanic Activity) showed intermittent thermal activity during April through September, with slightly stronger activity detected during late September (figure 127). Small clusters of thermal activity were detected during mid-June, early July, early August, and late September. According to the MODVOLC thermal alert system, a total of four thermal hotspots were detected on 7 July and 3 and 23 September. This activity was also intermittently captured in infrared satellite imagery on clear weather days (figure 128).
Geologic Background. The glacier-covered Villarrica stratovolcano, in the northern Lakes District of central Chile, is ~15 km south of the city of Pucon. A 2-km-wide caldera that formed about 3,500 years ago is located at the base of the presently active, dominantly basaltic to basaltic andesite cone at the NW margin of a 6-km-wide Pleistocene caldera. More than 30 scoria cones and fissure vents are present on the flanks. Plinian eruptions and pyroclastic flows that have extended up to 20 km from the volcano were produced during the Holocene. Lava flows up to 18 km long have issued from summit and flank vents. Eruptions documented since 1558 CE have consisted largely of mild-to-moderate explosive activity with occasional lava effusion. Glaciers cover 40 km2 of the volcano, and lahars have damaged towns on its flanks.
Information Contacts: Servicio Nacional de Geología y Minería (SERNAGEOMIN), Observatorio Volcanológico de Los Andes del Sur (OVDAS), Avda Sta María No. 0104, Santiago, Chile (URL: http://www.sernageomin.cl/); Proyecto Observación Villarrica Internet (POVI) (URL: http://www.povi.cl/); Sistema y Servicio Nacional de Prevención y Repuesta Ante Desastres (SENAPRED), Av. Beauchef 1671, Santiago, Chile (URL: https://web.senapred.cl/); Buenos Aires Volcanic Ash Advisory Center (VAAC), Servicio Meteorológico Nacional-Fuerza Aérea Argentina, 25 de mayo 658, Buenos Aires, Argentina (URL: http://www.smn.gov.ar/vaac/buenosaires/inicio.php); MIROVA (Middle InfraRed Observation of Volcanic Activity), a collaborative project between the Universities of Turin and Florence (Italy) supported by the Centre for Volcanic Risk of the Italian Civil Protection Department (URL: http://www.mirovaweb.it/); Hawai'i Institute of Geophysics and Planetology (HIGP) - MODVOLC Thermal Alerts System, School of Ocean and Earth Science and Technology (SOEST), Univ. of Hawai'i, 2525 Correa Road, Honolulu, HI 96822, USA (URL: http://modis.higp.hawaii.edu/); Copernicus Browser, Copernicus Data Space Ecosystem, European Space Agency (URL: https://dataspace.copernicus.eu/browser/).
Merapi (Indonesia) — October 2023 Cite this Report
Merapi
Indonesia
7.54°S, 110.446°E; summit elev. 2910 m
All times are local (unless otherwise noted)
Frequent incandescent avalanches during April-September 2023
Merapi, located just north of the major city of Yogyakarta in central Java, Indonesia, has had activity within the last 20 years characterized by pyroclastic flows and lahars accompanying growth and collapse of the steep-sided active summit lava dome. The current eruption period began in late December 2020 and has more recently consisted of ash plumes, intermittent incandescent avalanches of material, and pyroclastic flows (BGVN 48:04). This report covers activity during April through September 2023, based on information from Balai Penyelidikan dan Pengembangan Teknologi Kebencanaan Geologi (BPPTKG), the Center for Research and Development of Geological Disaster Technology, a branch of PVMBG which specifically monitors Merapi. Additional information comes from the Pusat Vulkanologi dan Mitigasi Bencana Geologi (PVMBG, also known as Indonesian Center for Volcanology and Geological Hazard Mitigation, CVGHM), MAGMA Indonesia, the Darwin Volcanic Ash Advisory Centre (VAAC), and various satellite data.
Activity during April through September 2023 primarily consisted of incandescent avalanches of material that mainly affected the SW and W flanks and traveled as far as 2.3 km from the summit (table 25) and white gas-and-steam emissions that rose 10-1,000 m above the crater.
Table 25. Monthly summary of avalanches and avalanche distances recorded at Merapi during April through September 2023. The number of reported avalanches does not include instances where possible avalanches were heard but could not be visually confirmed as a result of inclement weather. Data courtesy of BPPTKG (April-September 2023 daily reports).
| Month |
Average number of avalanches per day |
Distance avalanches traveled (m) |
| Apr 2023 |
19 |
1,200-2,000 |
| May 2023 |
22 |
500-2,000 |
| Jun 2023 |
18 |
1,200-2,000 |
| Jul 2023 |
30 |
300-2,000 |
| Aug 2023 |
25 |
400-2,300 |
| Sep 2023 |
23 |
600-2,000 |
BPPTKG reported that during April and May white gas-and-steam emissions rose 10-750 m above the crater, incandescent avalanches descended 500-2,000 m on the SW and W flanks (figure 135). Cloudy weather often prevented clear views of the summit, and sometimes avalanches could not be confirmed. According to a webcam image, a pyroclastic flow was visible on 17 April at 0531. During the week of 28 April and 4 May a pyroclastic flow was reported on the SW flank, traveling up to 2.5 km. According to a drone overflight taken on 17 May the SW lava dome volume was an estimated 2,372,800 cubic meters and the dome in the main crater was an estimated 2,337,300 cubic meters.
During June and July similar activity persisted with white gas-and-steam emissions rising 10-350 m above the crater and frequent incandescent avalanches that traveled 300-2,000 m down the SW, W, and S flanks (figure 136). Based on an analysis of aerial photos taken on 24 June the volume of the SW lava dome was approximately 2.5 million cubic meters. A pyroclastic flow was observed on 5 July that traveled 2.7 km on the SW flank. According to the Darwin VAAC multiple minor ash plumes were identified in satellite images on 19 July that rose to 3.7 km altitude and drifted S and SW. During 22, 25, and 26 July a total of 17 avalanches descended as far as 1.8 km on the S flank.
Frequent white gas-and-steam emissions continued during August and September, rising 10-450 m above the crater. Incandescent avalanches mainly affected the SW and W flanks and traveled 400-2,300 m from the vent (figure 137). An aerial survey conducted on 10 August was analyzed and reported that estimates of the SW dome volume was 2,764,300 cubic meters and the dome in the main crater was 2,369,800 cubic meters.
Frequent and moderate-power thermal activity continued throughout the reporting period, according to a MIROVA (Middle InfraRed Observation of Volcanic Activity) analysis of MODIS satellite data (figure 138). There was an increase in the number of detected anomalies during mid-May. The MODVOLC thermal algorithm recorded a total of 47 thermal hotspots: six during April, nine during May, eight during June, 15 during July, four during August, and five during September. Some of this activity was captured in infrared satellite imagery on clear weather days, sometimes accompanied by incandescent material on the SW flank (figure 139).
Geologic Background. Merapi, one of Indonesia's most active volcanoes, lies in one of the world's most densely populated areas and dominates the landscape immediately north of the major city of Yogyakarta. It is the youngest and southernmost of a volcanic chain extending NNW to Ungaran volcano. Growth of Old Merapi during the Pleistocene ended with major edifice collapse perhaps about 2,000 years ago, leaving a large arcuate scarp cutting the eroded older Batulawang volcano. Subsequent growth of the steep-sided Young Merapi edifice, its upper part unvegetated due to frequent activity, began SW of the earlier collapse scarp. Pyroclastic flows and lahars accompanying growth and collapse of the steep-sided active summit lava dome have devastated cultivated lands on the western-to-southern flanks and caused many fatalities.
Information Contacts: Balai Penyelidikan dan Pengembangan Teknologi Kebencanaan Geologi (BPPTKG), Center for Research and Development of Geological Disaster Technology (URL: http://merapi.bgl.esdm.go.id/, Twitter: @BPPTKG); MAGMA Indonesia, Kementerian Energi dan Sumber Daya Mineral (URL: https://magma.esdm.go.id/v1); Pusat Vulkanologi dan Mitigasi Bencana Geologi (PVMBG, also known as Indonesian Center for Volcanology and Geological Hazard Mitigation, CVGHM), Jalan Diponegoro 57, Bandung 40122, Indonesia (URL: http://www.vsi.esdm.go.id/); Darwin Volcanic Ash Advisory Centre (VAAC), Bureau of Meteorology, Northern Territory Regional Office, PO Box 40050, Casuarina, NT 0811, Australia (URL: http://www.bom.gov.au/info/vaac/); MIROVA (Middle InfraRed Observation of Volcanic Activity), a collaborative project between the Universities of Turin and Florence (Italy) supported by the Centre for Volcanic Risk of the Italian Civil Protection Department (URL: http://www.mirovaweb.it/); Hawai'i Institute of Geophysics and Planetology (HIGP) - MODVOLC Thermal Alerts System, School of Ocean and Earth Science and Technology (SOEST), Univ. of Hawai'i, 2525 Correa Road, Honolulu, HI 96822, USA (URL: http://modis.higp.hawaii.edu/); Copernicus Browser, Copernicus Data Space Ecosystem, European Space Agency (URL: https://dataspace.copernicus.eu/browser/); Øystein Lund Andersen (URL: https://www.oysteinlundandersen.com/, https://twitter.com/oysteinvolcano).
Ebeko
Russia
50.686°N, 156.014°E; summit elev. 1103 m
All times are local (unless otherwise noted)
Moderate explosive activity with ash plumes continued during June-November 2023
Ebeko, located on the N end of Paramushir Island in Russia’s Kuril Islands just S of the Kamchatka Peninsula, consists of three summit craters along a SSW-NNE line at the northern end of a complex of five volcanic cones. Observed eruptions date back to the late 18th century and have been characterized as small-to-moderate explosions from the summit crater, accompanied by intense fumarolic activity. The current eruptive period began in June 2022, consisting of frequent explosions, ash plumes, and thermal activity (BGVN 47:10, 48:06). This report covers similar activity during June-November 2023, based on information from the Kamchatka Volcanic Eruptions Response Team (KVERT) and satellite data.
Moderate explosive activity continued during June-November 2023 (figures 50 and 51). According to visual data from Severo-Kurilsk, explosions sent ash 2-3.5 km above the summit (3-4.5 km altitude) during most days during June through mid-September. Activity after mid-September was slightly weaker, with ash usually reaching less than 2 km above the summit. According to KVERT the volcano in October and November was, with a few exceptions, either quiet or obscured by clouds that prevented satellite observations. KVERT issued Volcano Observatory Notices for Aviation (VONA) on 8 and 12 June, 13 and 22 July, 3 and 21 August, and 31 October warning of potential aviation hazards from ash plumes drifting 3-15 km from the volcano. Based on satellite data, KVERT reported a persistent thermal anomaly whenever weather clouds permitted viewing.
Geologic Background. The flat-topped summit of the central cone of Ebeko volcano, one of the most active in the Kuril Islands, occupies the northern end of Paramushir Island. Three summit craters located along a SSW-NNE line form Ebeko volcano proper, at the northern end of a complex of five volcanic cones. Blocky lava flows extend west from Ebeko and SE from the neighboring Nezametnyi cone. The eastern part of the southern crater contains strong solfataras and a large boiling spring. The central crater is filled by a lake about 20 m deep whose shores are lined with steaming solfataras; the northern crater lies across a narrow, low barrier from the central crater and contains a small, cold crescentic lake. Historical activity, recorded since the late-18th century, has been restricted to small-to-moderate explosive eruptions from the summit craters. Intense fumarolic activity occurs in the summit craters, on the outer flanks of the cone, and in lateral explosion craters.
Information Contacts: Kamchatka Volcanic Eruptions Response Team (KVERT), Far Eastern Branch, Russian Academy of Sciences, 9 Piip Blvd., Petropavlovsk-Kamchatsky, 683006, Russia (URL: http://www.kscnet.ru/ivs/kvert/).
Search Bulletin Archive by Publication Date
Select a month and year from the drop-downs and click "Show Issue" to have that issue displayed in this tab.
The default month and year is the latest issue available.
Bulletin of the Global Volcanism Network - Volume 33, Number 02 (February 2008)
Managing Editor: Richard Wunderman
Barren Island (India)
Satellite imagery of ash plume, 23 December 2007
Bulusan (Philippines)
Ash ejections continued to at least late 2007
Cleveland (United States)
Thermal anomalies and minor explosions continue through February 2008
Krummel-Garbuna-Welcker (Papua New Guinea)
Ash emissions during March 2008
Langila (Papua New Guinea)
Intermittent ash emissions in May and August 2007
Lengai, Ol Doinyo (Tanzania)
Explosive eruptions of December 2007-March 2008; hazard warnings
Lokon-Empung (Indonesia)
June 2007-March 2008, variable seismicity and minor white plumes
NW Rota-1 (United States)
Visit on 24 February 2008 found eruption plume and acoustic signals
Suwanosejima (Japan)
Small (~1 km) plumes noted during late 2007-early 2008
Talang (Indonesia)
Ash emissions in March, June, and November 2007
Tara, Batu (Indonesia)
Satellite thermal anomalies indicate that near-daily eruptions continue
Barren Island (India) — February 2008 Cite this Report
Barren Island
India
12.278°N, 93.858°E; summit elev. 354 m
All times are local (unless otherwise noted)
Satellite imagery of ash plume, 23 December 2007
Thermal anomalies associated with the eruption that began in May 2005 were noted at Barren Island through 1 September 2007 (BGVN 32:07). Anomalies detected on 4 and 5 October 2007 again generated MODIS thermal alerts. On 23 December 2007 the Darwin Volcanic Ash Advisory Centre reported that an ash plume seen on satellite imagery rose to an altitude of 1.5 km and drifted S.
Geologic Background. Barren Island, a possession of India in the Andaman Sea about 135 km NE of Port Blair in the Andaman Islands, is the only historically active volcano along the N-S volcanic arc extending between Sumatra and Burma (Myanmar). It is the emergent summit of a volcano that rises from a depth of about 2250 m. The small, uninhabited 3-km-wide island contains a roughly 2-km-wide caldera with walls 250-350 m high. The caldera, which is open to the sea on the west, was created during a major explosive eruption in the late Pleistocene that produced pyroclastic-flow and -surge deposits. Historical eruptions have changed the morphology of the pyroclastic cone in the center of the caldera, and lava flows that fill much of the caldera floor have reached the sea along the western coast.
Information Contacts: HIGP MODIS Thermal Alert System, Hawai'i Institute of Geophysics and Planetology (HIGP), University of Hawaii and Manoa, 168 East-West Road, Post 602, Honolulu, HI 96822, USA (URL: http://modis.higp.hawaii.edu/); Darwin Volcanic Ash Advisory Centre, Bureau of Meteorology, Northern Territory Regional Office, PO Box 40050, Casuarina, Northern Territory 0811, Australia (URL: http://www.bom.gov.au/info/vaac/).
Bulusan (Philippines) — February 2008 Cite this Report
Bulusan
Philippines
12.769°N, 124.056°E; summit elev. 1535 m
All times are local (unless otherwise noted)
Ash ejections continued to at least late 2007
Our last report on Bulusan described explosive eruptions and ashfall during 10 October 2006 to 12 May 2007 (BGVN 32:04). This current report will cover the events from late May 2007 to January 2008. There were ash-bearing eruptions on 31 July and 4 October 2007. Hazard concerns also included steam-driven explosions, lahars, and related flooding.
The Philippine Institute of Volcanology and Seismology (PHIVOLCS) reported on 20 May 2007 that seismicity remained high following an explosion on 12 May (BGVN 32:04). The seismic network detected 673 volcanic earthquakes during five days. The epicenters were located along a NW-SE trend. Ground deformation measurements conducted on 17 May on the NE flank revealed 4 mm of inflation since 7 April, measurements in a series which have shown continued inflation since June 2006. Sulfur dioxide flux measurements were 165-315 tons per day (t/d), below a baseline level of 500 t/d. The Alert Level was raised in mid-May from 1 to 2 (out of 5) due to the increased seismicity and inflation. On 22 May, heavy rain triggered lahars, but they were confined and did not affect populated areas. On 25 May 2007 sulfur emission reached 500 t/d.
During mid-2007, scientists from PHIVOLCS conducting an aerial investigation discovered lahar deposits and three steaming fissures. Scientists also observed steam plumes that rose to altitudes of 1.6-1.7 km and drifted NW and NE. The S flank had inflated by 3 mm. Residents near the base of the volcano noted the odor of sulfur dioxide.
No significant activity was reported during June 2007. Steaming from the active vents and fissures generally consisted of weak to moderate emissions of steam. On 13 July 2007, PHIVOLCS lowered the Alert Level to 1 due to a decline in activity including decreased seismicity, and lower than baseline sulfur dioxide emissions. On 19-21 June the NE and SE flanks were deflated when compared to previous surveys. Sulfur dioxide emission rates were 50-400 t/d.
On the morning of 31 July 2007 an explosion produced an ash plume that rose to an altitude of 6.6 km and drifted WSW and WNW. Initial field reports indicated that light ashfalls were experienced in Cogon, Gulang-gulang, Puting Sapa, Bolos, Monbon and Gabao in Irosin, and Sangkayon and Buraburan in Juban. Small to moderate sized earthquakes and ash explosions continued. On 2 August, white steam plumes rose from active craters and fissures.
On 28 September 2007 the number of volcanic earthquakes increased and PHIVOLCS noted a possible eruption. Explosions at 0134 and 0139 on 4 October 2007 caused a blanket of thick ashfall in sixteen villages that resulted in minor injuries and damage. Instruments recorded 40 volcanic earthquakes and eight short harmonic tremors during a 24 hour interval ending at 0526 that day. Moderate steaming from fissures were found on the SW flank.
According to the news source Southen Luzon Bureau, on 15 October 2007 PHIVOLCS found an additional six points of emission around the volcano, three each on the NW and SE slopes. Several other emission points had stopped on the N, SSW, and SW slopes. Overall, nine emission points were active. News reports also mentioned that residents in the village of San Rogue noted bulging of the ground. A deformation survey was allegedly conducted, but results were not available in PHIVOLCS reports.
In the 24 hours from 0800 on 6 January 2008, at least seven minor earthquakes were recorded, but no steaming was noted. Although the Alert Level remained at 1, authorities began to enforce a no-entry policy in a 4-km radius.
Geologic Background. Luzon's southernmost volcano, Bulusan, was constructed along the rim of the 11-km-diameter dacitic-to-rhyolitic Irosin caldera, which was formed about 36,000 years ago. It lies at the SE end of the Bicol volcanic arc occupying the peninsula of the same name that forms the elongated SE tip of Luzon. A broad, flat moat is located below the topographically prominent SW rim of Irosin caldera; the NE rim is buried by the andesitic complex. Bulusan is flanked by several other large intracaldera lava domes and cones, including the prominent Mount Jormajan lava dome on the SW flank and Sharp Peak to the NE. The summit is unvegetated and contains a 300-m-wide, 50-m-deep crater. Three small craters are located on the SE flank. Many moderate explosive eruptions have been recorded since the mid-19th century.
Information Contacts: Philippine Institute of Volcanology and Seismology (PHIVOLCS), University of the Philippines Campus, Diliman, Quezon City, Philippines (URL: http://www.phivolcs.dost.gov.ph); Southern Luzon Bureau, Philippine Daily Inquirer, PO Box 2353, Makati Central Post Office, 1263 Makati City, Philippines (URL: http://newsinfo.inquirer.net/).
Cleveland (United States) — February 2008 Cite this Report
Cleveland
United States
52.825°N, 169.944°W; summit elev. 1730 m
All times are local (unless otherwise noted)
Thermal anomalies and minor explosions continue through February 2008
Our previous reports on Cleveland discussed short duration explosions on 6 February 2006 (BGVN 31:01), 23 May 2006 (BGVN 31:07), and on 24 August and 28 October 2006 (BGVN 31:09).
We received no further reports on Cleveland until June 2007. On 12 June, steam emissions were observed. The plume rose to an altitude of 3.7 km and drifted SE for 200 km. On 17 June, satellite imagery showed a significant thermal anomaly. Low level eruptive activity was suggested. No ash plume was detected. On 26 June, satellite imagery showed another thermal anomaly. On 20 July, the Alaska Volcano Observatory (AVO) raised the Alert Level from Advisory to Watch and the Aviation Color Code from Yellow to Orange, based upon an intense thermal anomaly in the crater and an associated steam-and-gas plume observed on satellite imagery. Three small SO2 clouds produced by small explosions on 20 July were detected in OMI satellite data. Weak thermal activity was observed by satellite imagery throughout the month.
On 27 July AVO noted that low-level eruptive activity continued. Photographs from 27 July and a pilot report from 2 August indicated fresh volcanic ejecta on the slopes and summit. The E portion of Chuginadak Island was dusted with ash on 3 August. AVO lacks a local seismic system at the volcano was thus unable to track local volcanic earthquakes.
Thermal anomalies continued to be detected on satellite imagery, although clouds obscured satellite and web camera views of the volcano on most days during August through 11 September. A few clear views of the crater during this time revealed multiple thermal anomalies at the summit, indicating that low-level eruptive activity continued.
On 6 September, AVO lowered the Volcanic Alert Level for Cleveland from Watch to Advisory and the Aviation Color Code from Orange to Yellow, based on the observation that since late July, ash and gas plumes had been absent in satellite imagery and no reports of activity had been received. On 20 November the last weak thermal anomaly was observed for the year.
At 1200 on 17 January 2008, minor ash emission was detected, which drifted N. The plume height could not be determined. Thermal anomalies were found in the satellite imagery later that day. According to the AVO, on 8 February, during a break in the cloud cover, satellite imagery detected a diffuse ash plume extending about 12 km SE at an altitude below 1.5 km. Later that day AVO received pilot reports of a diffuse ash plume that rose to an altitude of 6.1 km and, according to satellite imagery, drifted NW. Due to the increased activity, the Volcanic Alert Level was raised to Watch and the Aviation Color Code was raised to Orange. During 10-11 February, a feeble thermal anomaly was marginally visible on satellite imagery.
On 12 February, the Volcanic Alert Level was lowered back to Advisory and the Aviation Color Code was lowered to Yellow. This occurred in response to the observation that minor eruptive activity appeared to have subsided and no further evidence of ash emission had been reported.
On 15 February, a minor explosion from Cleveland produced a small, diffuse ash plume that rose to an altitude of below 3 km and drifted NW. On 16 February, a brief explosion occurred. On 22 February, satellite imagery detected a low-level ash plume that drifted about 300 km SE. On 23 February, satellite imagery revealed a thermal anomaly. On 29 February, satellite imagery detected a weak thermal anomaly and a small ash plume that rose to an altitude of below 3 km. On 15, 27, and 30 March, weak thermal anomalies were detected. As of 4 April 2008, Cleveland remains at Advisory and the Aviation code Yellow.
Geologic Background. The beautifully symmetrical Mount Cleveland stratovolcano is situated at the western end of the uninhabited Chuginadak Island. It lies SE across Carlisle Pass strait from Carlisle volcano and NE across Chuginadak Pass strait from Herbert volcano. Joined to the rest of Chuginadak Island by a low isthmus, Cleveland is the highest of the Islands of the Four Mountains group and is one of the most active of the Aleutian Islands. The native name, Chuginadak, refers to the Aleut goddess of fire, who was thought to reside on the volcano. Numerous large lava flows descend the steep-sided flanks. It is possible that some 18th-to-19th century eruptions attributed to Carlisle should be ascribed to Cleveland (Miller et al., 1998). In 1944 it produced the only known fatality from an Aleutian eruption. Recent eruptions have been characterized by short-lived explosive ash emissions, at times accompanied by lava fountaining and lava flows down the flanks.
Information Contacts: Alaska Volcano Observatory (AVO), a cooperative program of the U.S. Geological Survey, 4200 University Drive, Anchorage, AK 99508-4667, USA, the Geophysical Institute, University of Alaska, PO Box 757320, Fairbanks, AK 99775-7320, USA, and the Alaska Division of Geological & Geophysical Surveys, 794 University Ave., Suite 200, Fairbanks, AK 99709, USA (URL: http://www.avo.alaska.edu/); Volcanic Emissions Group, Ozone Monitoring Instrument (OMI)-Total Ozone Monitoring Spectrometer (TOMS), Joint Center for Earth Systems Technology, University of Maryland Baltimore County (UMBC), and NASA Goddard Space Flight Center (URL: http://toms.unbc.edu/).
Krummel-Garbuna-Welcker (Papua New Guinea) — February 2008 Cite this Report
Krummel-Garbuna-Welcker
Papua New Guinea
5.416°S, 150.027°E; summit elev. 564 m
All times are local (unless otherwise noted)
Ash emissions during March 2008
Garbuna again began to erupt in March 2008. Prior to that, during late June 2007, the summit continued to release variable volumes of white vapor. Occasional increases in volume caused concern in local communities, although noises and night-time glow were absent. An investigation by the West New Britain Disaster Office indicated no other increased activity or emission of solid material. Vapor emissions from the active vent continued through October 2007. Through the end of 2007 and into January and February 2008 activity was characteristically uneventful, with no indication of an eruption.
A new eruption began on 11 March 2008. Gray ash clouds rose less than a kilometer above the summit before being blown SW, causing fine ashfall. Occasional booming noises were heard accompanying the ash emissions. Ash emissions continued on 12-13 March, and reports indicated most of the ash fell in the summit area. On 14-15 March the odor of sulfur was reported downwind. No glow was visible at night. Around this time, observations from the Kulingai Volcano Observatory (15 km SE) noted white vapor emissions from numerous vents at the summit area. During 17-18 March activity increased slightly with forceful and continuous emission of white vapor. Emissions rose vertically less than a kilometer before dissipating. There were no noises heard and no glow visible at night. A strong smell of sulfur was again noted to the E.
All of the monitoring equipment installed during 2005 and 2006 was destroyed. The two GPS stations at the summit and at the base remained out of service, and for most of the reporting interval there was no functioning seismometer. Seismicity began to be monitored using a KD1 recorder, along with a portable seismometer to the E, at SiSi village. Seismicity fluctuated between low and moderate levels. On 17 March, seismicity increased to a moderate level characterized by non-overlapping tremor. Only three high-frequency volcano-tectonic earthquakes were noted during the first day of recording; no low-frequency events were recorded. Seismicity declined on 18 March but rose to a moderate level on 19 March.
Geologic Background. The basaltic-to-dacitic Krummel-Garbuna-Welcker Volcanic Complex consists of three volcanic peaks located along a 7-km N-S line above a shield-like foundation at the southern end of the Willaumez Peninsula. The central and lower peaks of the centrally located Garbuna contain a large vegetation-free area that is probably the most extensive thermal field in Papua New Guinea. A prominent lava dome and blocky lava flow in the center of thermal area have resisted destruction by thermal activity, and may be of Holocene age. Krummel volcano at the south end of the group contains a summit crater, breached to the NW. The highest peak of the group is Welcker volcano, which has fed blocky lava flows that extend to the eastern coast of the peninsula. The last major eruption from both it and Garbuna volcanoes took place about 1800 years ago. The first historical eruption took place at Garbuna in October 2005.
Information Contacts: Herman Patia, Steve Saunders, and Felix Taranu, Rabaul Volcano Observatory (RVO), PO Box 3386, Rabaul, E.N.B.P, Papua New Guinea.
Langila (Papua New Guinea) — February 2008 Cite this Report
Langila
Papua New Guinea
5.525°S, 148.42°E; summit elev. 1330 m
All times are local (unless otherwise noted)
Intermittent ash emissions in May and August 2007
Satellite thermal anomalies occurred at or near Langila on three different days in early 2007 (BGVN 32:02). Although erupting regularly, only one other anomaly (on 2 April 2007) was detected after that time through 6 March 2008. Langila is noted for its ongoing fluctuating eruptions and occasional ash clouds that rise to more than 5 km altitude and pose a threat to aviation. Throughout this reporting period, April 2007 to January 2008, ash emissions were usually accompanied by weak to moderately loud roaring.
During May 2007, the Rabaul Volcanic Observatory (RVO) reported the emission of ash clouds from Langila's Crater 2. Ash plumes rose to an altitude of 3.3-4.3 km and drifted NW. Weak roaring noises were heard on 11-12 May and a weak glow was visible on 7-8, 11-12, and 15 May. Weak roaring noises were again heard on 20 May, and an increased phase of eruptive activity that began on 22 May continued until end of the month. The increased activity was characterized by forceful emission of thick pale-gray to dark gray-brown ash clouds from 22-27 May. The emission changed to subcontinuous thick dark gray-brown ash clouds on 28-29 May before changing back to occasional thick, pale-gray clouds on 30-31 May. Two large explosions on 30 May accompanied the ash emission. The ash clouds from these two explosions rose 4 km above the summit before being blown NW. On the other days, the ash clouds rose 2-3 km above the summit before drifting NW of the volcano. Continuous fine ashfall occurred at Kilenge Catholic Mission (~10 km NW) and surrounding areas during 22-31 May. The ash emissions were accompanied by occasional weak to loud roaring noises from the 22 to 28 May before turning subcontinuous during 29-31 May. On 30 May two large explosions produced ash plumes that rose to ~5.3 km and drifted NW. A weak glow was visible on 7-8, 11-12, 15, and 20 May and again on 29 and 31 May. Incandescence was visible on 29 May. On 26 May, the seismograph deployed at Kilenge became operational.
During June RVO reported a slight decrease in eruptive activity that began on 22 May, however, the emissions of ash plumes from Crater 2 were occasionally forceful. The emissions were continuous on 6, 7, and 10 June and accompanied by roaring noises; booming noises were heard on 1 and 10 June. Ash plumes rose to ~ 2.3-4.3 km and drifted NNW. Based on observations of satellite imagery and information from RVO, the Darwin VAAC reported that on 3 June, an ash plume rose to an altitude of 3 km and drifted W. Ashfall was again reported at Kilenge Catholic Mission and surrounding areas. Seismic activity in June was at a high level, dominated by continuous tremor and occasional explosion signals. During the latter part of the month, seismic activity decreased to a low-moderate level. It was dominated by continuous irregular tremors and occasional harmonic tremors. Low-frequency earthquakes ranged from 1 to 7 events per day.
During July 2007, eruptive activity continued at a low level but included thin-to-thick, pale-gray ash clouds. Weak roaring noises were heard on 1 July, but glow was absent at night. On 2 July ash clouds were ejected forcefully and rose ~2 km, drifted NW, and resulted in a fine ashfall downwind. On 6-7, and 9-13 July, ash clouds rose less than 1 km above the summit before drifting NNW. Except for 1 July when weak roaring noises were heard, the volcano was quiet and without appreciable night glow. Seismicity registered at low-moderate levels, dominated by non-harmonic and harmonic tremor of continuous, irregular, or banded character. During July, the daily number of low-frequency earthquakes ranged between 1 and 12 events per day. The one high-frequency earthquake occurred on 27 July.
RVO reports noted mild but continuous ash and white vapor plumes from Crater 2 during 1 August-30 September. Ash plumes generally rose to altitudes of ~1.8-3.3 km and drifted WNW. On 8 August, a large explosion produced an ash plume that rose to an altitude of 5.3 km and drifted SW. Ashfall was reported downwind. Incandescent fragments were ejected from the summit on 21-22 September.
During 1-7 October 2007, RVO reported low-to-moderate eruptive activity consisting of continuous emission of pale gray ash clouds which rose to ~1.8-3.3 km and were blown W to NW. During the second week, the white vapor accompanied by pale gray ash clouds continued; these rose less than 1 km before being blown to the NW of the volcano. On 19, 16, and 27 October, the ash clouds rose less than 2 km before being blown WNW. Consistently, the ash emissions were accompanied by occasional weak-to-loud roaring or booming noises.
On most occasions, there was no glow observed at night, however, a weak-to-bright glow accompanied by projection of incandescent lava fragments was visible on 12 and 22 October. Crater 3 remained quiet. Seismic activity was at low-to- moderate level dominated by low frequency earthquakes and bands of harmonic and non-harmonic tremors. The daily number of low-frequency earthquakes ranged from 2-15. Less than 10 high-frequency events were recorded during October.
In January 2008, activity generally remained low. Some ash fell on 6-7, and 9 January with fluctuating glow visible. On 10, 13, and 25 January the incandescent glow was bright. More direct observations through late February 2008 by RVO staff and affiliates confirmed ongoing eruptions. During February, Crater 2 continued to erupt. Most days, these eruptions generated ash plumes typically rising a few hundred meters. Observers noted incandescent glow or noises on 7, 9, 11, and 21-23 February.
Geologic Background. Langila, one of the most active volcanoes of New Britain, consists of a group of four small overlapping composite basaltic-andesitic cones on the lower E flank of the extinct Talawe volcano in the Cape Gloucester area of NW New Britain. A rectangular, 2.5-km-long crater is breached widely to the SE; Langila was constructed NE of the breached crater of Talawe. An extensive lava field reaches the coast on the N and NE sides of Langila. Frequent mild-to-moderate explosive eruptions, sometimes accompanied by lava flows, have been recorded since the 19th century from three active craters at the summit. The youngest and smallest crater (no. 3 crater) was formed in 1960 and has a diameter of 150 m.
Information Contacts: Herman Patia, Rabaul Volcano Observatory (RVO), PO Box 386, Rabaul, Papua New Guinea; Darwin Volcanic Ash Advisory Centre (VAAC), Bureau of Meteorology, Northern Territory Regional Office, PO Box 40050, Casuarina, Northern Territory 0811, Australia (URL: http://www.bom.gov.au/info/vaac/); Hawai'i Institute of Geophysics and Planetology (HIGP) Thermal Alerts System, School of Ocean and Earth Science and Technology (SOEST), Univ. of Hawai'i, 2525 Correa Road, Honolulu, HI 96822, USA (URL: http://modis.higp.hawaii.edu/).
Ol Doinyo Lengai (Tanzania) — February 2008 Cite this Report
Ol Doinyo Lengai
Tanzania
2.764°S, 35.914°E; summit elev. 2962 m
All times are local (unless otherwise noted)
Explosive eruptions of December 2007-March 2008; hazard warnings
The previous report on Ol Doinyo Lengai (BGVN 32:11), often simply called Lengai, summarized seismicity and energetic ash emissions during 2007. The development of a single large cone with a prominent venting crater significantly changed the crater morphology.
This report discusses field observations by various individuals during December 2007 through March 2008. The reports and photos from visitors provided by Frederick Belton on his website form the source for much of which follows. Table 16 summarizes the observations from December 2007 through March 2008.
Table 16. Summary of visitors to Ol Doinyo Lengai and their brief observations (from a climb, aerial overflight, or flank) from December 2007 through 26 March 2008. Observations for 2007 were reported in BGVN 32:11. Most of this list is courtesy of Frederick Belton.
| Date |
Observer |
Observation Location |
Brief Observations |
| 07 Dec 2007 |
Joerg Keller, Jurgis Klaudius |
Climb |
Geological samples collected; ash eruption with plumes rising to several thousand meters above volcano (see text). |
| 25 Dec 2007 |
Jens Fissenebert, Paul Johns |
Aerial/Climb |
Observations of crater from helicopter and ground (see text). |
| 31 Dec 2007 |
Raphael Wolf |
Climb |
Volcano "shook 3 times as my guide and I were climbing;" vent of new cinder cone steaming. |
| 06 Jan 2008 |
Paul Johns |
Aerial/Climb |
Helicopter landed in S crater, group walked to summit; eruption during flight to crater and 15 minutes after they left; large rocks (bombs?) had been thrown into the S crater. |
| 14 Jan 2008 |
Vegard Laukhammer |
Climb |
Experienced eruption (see text). |
| 17 Jan-21 Jan 2008 |
Tom Pfeiffer, group from Volcano Discovery |
Climb |
See text. |
| 18 Jan 2008 |
Thomas Holden |
Climb |
New climbing route on the SE described. |
| 19 Jan 2008 |
Bernhard Donth, Thomas Schulmeister, William (Maasai) |
Climb |
Occasional rain of fine gray ash and small white pebbles during ascent; small ash jets from the active crater. |
| 04 Feb 2008 |
Michael Dalton-Smith |
Flank |
See text. |
| 12 Feb 2008 |
Michel Picard |
Aerial |
Photographed a dark ash cloud. |
| 13 Feb 2008 |
Walt Bilofsky |
Aerial |
Ash rising from summit crater. |
| 15 Feb 2008 |
Gerrit Jan Plaisier, Rob Alakaposa |
Aerial |
Plume over Lengai to altitude of 11 km. |
| 15 Feb 2008 |
Benoit Wangermez (pilot) |
Aerial |
Summit crater heavily cloaked in fresh ash; ash cloud rising from crater; movie of eruption on Celia Nyamweru's website. |
| 20 Feb 2008 |
Nigel D'Aubrey |
Aerial |
Plume over Lengai. |
| 21 Feb 2008 |
KLM pilot |
Aerial |
Eruption. |
| 24 Feb 2008 |
Claude Humbert |
Climb |
Party of 11 people attempted to climb the S side, but terminated the climb about half-way up due to eruption. |
| 27 Feb 2008 |
Reported to Michael Dalton-Smith |
Flank |
Eruptions getting stronger; observed from Gol, massive cloud. |
| 27-28 Feb 2008 |
Flight crew |
Aerial |
Ash emissions at 1030 and 1200 on 27 Feb and 0530 on 28 Feb; ash cloud moved SW and dissipated. |
| 27-28 Feb 2008 |
Dave Rhys |
Flank |
Eruptions observed from the Serengeti Plain and Ngorongoro Crater 3; single ash plumes rose rapidly following each eruption (none continuous) and dispersed S (thin ash coating on leaves around the rim of Ngorongoro crater). |
| 01 Mar 2008 |
Max Voight |
Aerial |
Photo of ash plume rising. |
| late Feb 2008, 1-2 Mar 2008 |
Benoit Wilhelmi (pilot) |
Aerial |
Photos of ash plumes. |
| 03 Mar-05 Mar 2008 |
Tony Drummond-Murray |
Flank |
Massive eruptions (see text). |
| 05 Mar 2008 |
Benoit Wilhelmi (pilot) |
Aerial |
Plume to altitude of ~15.2 km. |
| 11 Mar-12 Mar 2008 |
Benoit Wilhelmi (pilot) |
Aerial |
Strong ash eruption (see text). |
| 18 Mar 2008 |
Benoit Wilhelmi (pilot) |
Aerial |
Photos of crater (see text). |
| 22 Mar 2008 |
Benoit Wilhelmi (pilot) |
Aerial |
Photos of new crater (see text). |
| 25 Mar 2008 |
Paul Westerman, friend, and Maasai guide |
Climb |
Walked to the top of the ash cone and heard the tremendous roar; no sulfur smell but some heat. |
| 26 Mar 2008 |
Paul Westerman |
Flank |
From shore of Lake Natron observed some smoke and ashfall (on the downwind side) starting around 0930. |
An accident last August highlights the hazards of summit access. On his 21 August 2007 ascent, Chris Weber's group evacuated a local Maasai porter who had fallen into an active lava flow (around 500°C) in the crater. The porter had managed to get out of the lava, but with both legs and one arm seriously burned. Initial treatment at an Arusha hospital was financed by Weber's tour company. As of January 2008 he was bedridden in his home near Engare Sero, experiencing pain and muscle wasting. Celia Nyamweru (see web address below) has appealed for financial support to assist the young man during his recovery.
Keller and Klaudius fieldwork, December 2007. Subsequent to publication of BGVN 32:11, we received an unpublished report by Joerg Keller and Jurgis Klaudius on their fieldwork during 5-11 December 2007. According to them, the 4 September eruption ended a period of about 25 years of activity dominated by the effusion of highly fluid natrocarbonatite lavas within the summit crater. The deep pit crater from the 1966/67 eruption period had gradually filled by about 1999/2000. According to the report, the last days of August 2007 were characterized by Weber as displaying seemingly increased lava output. A natrocarbonatite lava, collected by Weber during his ascent on 23 August, was analyzed by Keller at Freiburg University and was close to the average or standard composition for natrocarbonatite from the last 20 years.
During their field work on 5-11 December 2007, Keller and Klaudius observed intermittent but impressive explosions with ash plumes rising to several thousand meters above the volcano. This activity alternated with periods dominated by either minor puffing or degassing, or with seemingly dormant phases up to several days long. This pattern seemed to be representative of the period following the 4 September 2007 paroxysm, which Keller and Klaudius had also studied.
Keller and Klaudius reported that an impressive bomb field with impacted blocks of up to 1 m in diameter extended along the crater rim, on the E ridge to the summit, and on the flank down into the S crater. They noted that, given the observed sudden onset of explosions from the intra-crater vent, the summit area was potentially dangerous. They found that fumarolic activity in the N crater was strong, especially along the N rim. It was also observed within the upper part of the N flank.
According to Keller and Klaudius, the 4 September paroxysm complicated access to the summit. With the help of Maasai guides, they used a newly opened route on 7 December that follows a prominent steep ridge and ends at the SE edge of the S crater. They reported that the track was quite strenuous and, while being rather direct, took much longer (7 hours) than the old trail from the W. They found that, with ongoing explosive activity, the S crater was the only safe arrival place. An attempt to use the old W route during their descent was unsuccessful because the very cemented surface of the lapilli beds provided no grip on the steep entrance from above to the ascent chasm.
While at the crater, Keller and Klaudius collected fresh samples of black lapilli, ash, and bombs from the active cone. The large intra-crater cinder-and-ash cone (figure 102) occupied more than half of the former crater platform, with a crater diameter of ~200 m. Its location coincided with the large collapse structure formed during the March/April 2006 natrocarbonatite effusive activity (BGVN 32:02) (Kervyn and others, 2008), which has also been the area of strong lava emission before the explosive eruption of 4 September 2007. It had a slightly N-S elongation, oval shape and, despite the heavy fumes filling the crater, it appeared that two vents, a more northerly one and a more southerly one, were erupting.
The cone was formed by and covered by ash, black-to-brown lapilli, cinders, angular blocks, and cored oval bombs. The magmatic lapilli contained macroscopic phenocrysts of nepheline, garnet, and wollastonite. With time, the black lapilli and bombs on the slopes of the cone and in the ring plain around it turned white by weathering of their components. Products of the active cone have covered almost all the old natrocarbonatite structures. Only the spiny remnant of the T49B hornito still stands out at the northern crater rim of the cone. The surface of a blocky flow was also still recognizable at the foot of the N wall.
Analyses of the magmatic material were in harmony with the recent observations of Roger Mitchell and Barry Dawson (reported in BGVN 32:11), who analyzed the mineralogy after the 24 September 2007 eruption, and their suggestion that at the onset of the explosive eruptive period on 4 September 2007 a silicate component became involved in the eruptive activity. Mitchell and Dawson concluded that "in lacking clinopyroxene, the mantling ash is not nephelinite or melilitite and is unlike any other magma type previously recorded from the volcano."
During the December fieldwork, Keller and Klaudius collected samples and examined cross-sections of the 4 September 2007 ash. Proximal (near-source) accumulations of tephra in the S crater occurred to a thickness of ~ 20 cm in the depression and on the upper slopes of the S flank, decreasing to a thickness of 1 cm at the E starting point of the new trail. This compared with a thickness of ~ 5 cm at the upper parking site of the old W trail and the abandoned Maasai home closest to the volcano, 4.2 km away (figure 103). Towards Engare Sero village, relics of the ashfall were still locally preserved and indicated an original thickness of ~ 1 cm, consistent with eyewitness reports of ashfall over the village during 4 September.
Other observations. Jens Fissenebert's visit on 25 December 2007 to the summit by helicopter again confirmed that the ash cone had grown. He estimated that it covered nearly the northern two-thirds of the crater floor. The N and W parts of the crater rim were indistinct, having been mostly covered by the growing flank of the new cone. Newly erupted ash and lapilli had filled in the flank area below the former crater rim and down through the "Pearly Gates" through which the former W climbing route passed.
Several eruptions were noted by Paul Johns when landing by helicopter on 6 January 2008. During early 2008, there were also occasional thermal anomalies measured by MODIS (table 17).
Table 17. MODIS/MODVOLC thermal anomalies measured at Ol Doinyo Lengai during January through early April 2008. Anomalies measured during 2007 were reported in BGVN 32:11. Courtesy of the Hawai'i Institute of Geophysics and Planetology (HIGP) Thermal Alerts System.
| Date |
Time (UTC) |
Number of pixels |
Satellite |
| 08 Jan 2008 |
2030 |
2 |
Terra |
| 17 Jan 2008 |
2025 |
2 |
Terra |
| 17 Feb 2008 |
2240 |
3 |
Aqua |
| 22 Feb 2008 |
2300 |
1 |
Aqua |
| 28 Feb 2008 |
1135 |
1 |
Aqua |
| 29 Feb 2008 |
2305 |
1 |
Aqua |
| 07 Mar 2008 |
2310 |
1 |
Aqua |
| 10 Mar 2008 |
2045 |
4 |
Terra |
| 03 Apr 2008 |
1955 |
1 |
Terra |
Vegard Laukhammer climbed the volcano with several others on 14 January 2008. Laukhammer reported arriving at the summit at 0652 (local time). "The visibility was so poor and there was so much smoke that we decided to try to climb down again after 10 minutes. . . . About 10 minutes later (0715), when we had been able to climb about 50 meters down from the summit, a thundering, ear-breaking sound came from the volcano. A large shower of rocks (many the size of a football) were thrown out from the volcano directly towards us 4 on the top" (translation from Norwegian by Sven Dahlgren, found on Belton's website). The climbers managed to descend without serious injury.
Tom Pfeiffer and a VolcanoDiscovery group stayed near and on Ol Doinyo Lengai during 17-21 January 2008. During this period episodic ash eruptions lasted several hours. These phases alternated with quiet intervals when there was only a weak plume of very fine gray ash and gas. After sunset on 17 January, strong ash eruptions started with plumes reaching about 500-1,000 m high, accompanied by strong lightning. After around 2130, Randle Robertson observed a fountain that appeared as a bright red-orange "blow-torch" rising from the summit crater to an estimated height of 500 m above the crater. The light was steady in appearance and lasted for at least 5 minutes. When the fountain died, a dark ash cloud emerged from the crater, which did not reach a great height. The volcano was more or less quiet during most of 18 January (figure 104).
At around 1600 on 19 January, weak explosions set in, increasing in intensity until the ash plumes reached about 500 m above the crater at around 1730 (figure 105). Blocks were ejected 300-400 m above the crater, and all explosions were near-vertical jets from two vents in the crater's W and central portions. Activity decreased after sunset. No incandescence was observed during the night. Activity intensified during the night, with loud-explosion sounds, and the hissing sound of gas-and-ash jets. During their descent on 20 January, ash eruptions continued until early afternoon.
Michael Dalton-Smith observed a fairly large eruption at 1200 on 3 February 2008 from the Gol mountains just E of Sanjan gorge. He saw a cloud that rose about ~1 km above the summit. Activity was present all day, ceasing around 1600, followed by renewed activity with ash rising 0.3-0.5 km above the crater.
At about 0600 on 4 February there was a larger eruption with the ash rising about 1.4 km. It was a fairly dense cloud that flattened out at the top. The camp manger of Asilia (where Dalton-Smith was staying) also said that there had been several large explosive eruptions three days before (on 1 February). Two explosions were heard, one in the morning and one in the evening.
On 6 February, Dalton-Smith opted to not climb because of strong eruptions. When he drove past the volcano he reported that "it was having some of the biggest eruptions in a long time" with continuous activity from sunrise to about 1400.
During 3-5 March 2008, Tony Drummond-Murray and his wife observed very strong eruptions (figure 106). Figure 107 shows pyroclastic flows from what appeared to be a collapsing ash column. The valley between Lengai and the escarpment itself was covered with a highly visible layer of light ash after the eruption on 4 March. On 5 March the plume appeared even larger than the one seen on 4 March.
At 1010 on 5 March 2008, pilot Benoît Wilhelmi observed a plume rising to ~15 km altitude. On 12 March, he also saw a strong ash eruption; weaker activity was also seen that day (figure 108). That photo indicates that the powerful eruptions of 3-5 March did not significantly alter the ash cone or crater rim. Large amounts of ash and cinders had piled up against the northward facing ridge below the summit. The S crater was covered in ash and cinder layers so deep that previously prominent erosion gullies were becoming indistinct. It appeared that all vegetation had either died or been buried.
Wilhelmi photographed the summit cone on 18 March at 1530 (figure 109). On 22 March, Wilhelmi photographed directly into the crater (figure 110). At that time there had been no reports of activity for three days, but the smell of hydrogen sulfide returned after being gone for days.
Table 18 lists a number of volcanic ash advisories (VAAs) issued in March 2008 by the Toulouse Volcanic Ash Advisory Center (VAAC).
Table 18. March 2008 Volcanic Ash Advisories (VAAs) relating to Ol Doinyo Lengai issued by Toulouse Volcanic Ash Advisory Center (VAAC).
| Date |
Time (UTC) |
Information Source |
Observed Details |
| 04 Mar 2008 |
0900 |
Satellite |
Eruption occurred at 0630 (UTC), cloud rising to 12.2 km may contain some ash; stopped by 0900. |
| 05 Mar 2008 |
0854 |
Meterological watch office (MWO) Dar-Es-Salaam |
Eruption of very short duration; "simple puff", ash cloud to 10.7 km altitude. |
| 06 Mar 2008 |
1730 |
MWO Dar-Es-Salaam |
Eruption occurred at 0830 (UTC); cloud top at 9.1 km altitude, ash not identified from satellite. |
| 09 Mar 2008 |
0845 |
MartinAir |
Current eruption; ash plume to 8.8 km altitude, ash not identified from satellite. |
| 10 Mar 2008 |
0711 |
Satellite |
Cloud to 7.3 km altitude. |
| 11 Mar 2008 |
1800 |
Infrared satellite |
Possible brief eruption at about 1700 (UTC); cloud up to 12.2 km altitude, moving S. |
| 13 Mar 2008 |
1800 |
KLM pilot, MartinAir |
Volcanism with ash cloud rising to 12.2 km altitude. |
| 16 Mar 2008 |
0450 |
Satellite |
Short eruption at ~0330 (UTC); plume reached 13.7 km altitude. |
| 16 Mar 2008 |
2148 |
Satellite |
Ash cloud to 12.2 km altitude. |
Thomas Holden reported that as of 29 March 2008 there had been no activity at Lengai for 10 days. Chris Daborn (Tropical Veterinary Services Ltd.) reported on 2 April 2008 the following: "Lengai has of late quieted down significantly-first in changing ash colour from a 'salty' white to a more inert black and now with much smaller eruptions that barely extend above the mountain. We have heavy rains on at present which makes movement in the area difficult-but are also washing ash residue away." Jurgis Klaudius reported that he checked MODIS data and found a thermal anomaly in the N crater on 3 April 2008, indicating on-going eruptions then (table 17).
Warnings of hazards. Celia Nyamweru posted the following warning on her web site: "A team of Tanzanian, US, and French scientists visited the region around the volcano in January 2008, and interviewed local porters who routinely climb Ol Doinyo Lengai with tourists. Our observations and photos indicate continuing eruptive activity, and a growing threat to the region, as outlined below.
"Almost daily eruptions from the central caldera have filled the crater, and produced a steep lapilli-ash cone around the crater rim. A film clip of the crater made by a Medecins Sans Frontieres pilot confirms that the loose lapilli is near collapse. These conditions mean that there are very high risks of one or more of the following: 1) a debris flow or lahar (mix of hot ash, water/mud) down the existing channels around the volcano; 2) burns from hot lapilli and ash; and 3) catastrophic collapse of the steep lapilli cones around the crater. The risks increase with increasing rainfall during the March-May rains.
"We also urge extreme caution to anyone driving in the river channels on the eastern and northern slopes of Lengai between Engaruka and Ngare Sero. There are scars of immense debris flows on the flanks of Kerimasi, and smaller scars on Ol Doinyo Lengai. These scars attest to catastrophic flows in the past, some of which carried rock fragments up to 50 cm in diameter for distances extending up to 10 km from Ol Doinyo Lengai. Even smaller debris flows could do great damage to vehicles and people moving along the eastern and northern slopes of the volcano."
Reference. Kervyn, M., Ernst, G.G.J., Klaudius, J., Keller, J., Kervyn, F., Mattsson, H.B., Belton, F., Mbede, E., and Jacobs, P., 2008, Voluminous lava flows at Ol Doinyo Lengai in 2006: chronology of events and insights into the shallow magmatic system: Bulletin of Volcanology, DOI 10.1007/s00445-007-0190-x.
Geologic Background. The symmetrical Ol Doinyo Lengai is the only volcano known to have erupted carbonatite tephras and lavas in historical time. The prominent stratovolcano, known to the Maasai as "The Mountain of God," rises abruptly above the broad plain south of Lake Natron in the Gregory Rift Valley. The cone-building stage ended about 15,000 years ago and was followed by periodic ejection of natrocarbonatitic and nephelinite tephra during the Holocene. Historical eruptions have consisted of smaller tephra ejections and emission of numerous natrocarbonatitic lava flows on the floor of the summit crater and occasionally down the upper flanks. The depth and morphology of the northern crater have changed dramatically during the course of historical eruptions, ranging from steep crater walls about 200 m deep in the mid-20th century to shallow platforms mostly filling the crater. Long-term lava effusion in the summit crater beginning in 1983 had by the turn of the century mostly filled the northern crater; by late 1998 lava had begun overflowing the crater rim.
Information Contacts: Joerg Keller and Jurgis Klaudius, Mineralogisch-geochemisches Institut, Albertstr. 23B D-79104 Freiburg, Germany; Jens Fissenebert, Molvaro-Lake Natron Tented Camp and Campsite; Vegard Laukhammer, Norway; Frederick Belton, Developmental Studies Department, PO Box 16, Middle Tennessee State University, Murfreesboro, TN 37132, USA (URL: http://oldoinyolengai.pbworks.com/); J. Barry Dawson, Grant Institute of Earth Science, University of Edinburgh, King's Building, Edinburgh EH9 3JW, U.K.; Roger Mitchell, Lakehead University, 955 Oliver Road, Thunder Bay, Ontario, Canada P7B 5EI; Hawai'i Institute of Geophysics and Planetology (HIGP) Thermal Alerts System, School of Ocean and Earth Science and Technology (SOEST), Univ. of Hawai'i, 2525 Correa Road, Honolulu, HI 96822, USA (URL: http://modis.higp.hawaii.edu/); Celia Nyamweru, Department of Anthropology, St. Lawrence University, Canton, NY 13617 USA (URL: http://blogs.stlawu.edu/lengai/); Toulouse Volcanic Ash Advisory Center (VAAC) (URL: http://www.meteo.fr/vaac/); Michael Dalton-Smith (URL: http://digitalcrossing.ca/); Lake Natron Camp (URL: http://www.ngare-sero-lodge.com/); Chris Weber, Volcano Expeditions International (VEI) (URL: http://www.v-e-i.de/).
Lokon-Empung (Indonesia) — February 2008 Cite this Report
Lokon-Empung
Indonesia
1.3644°N, 124.7992°E; summit elev. 1580 m
All times are local (unless otherwise noted)
June 2007-March 2008, variable seismicity and minor white plumes
Our most recent report on Lokon-Empung discussed low seismicity and plume emissions between January-October 2005 (BGVN 31:03). Since then, available reports from the Center of Volcanology and Geological Hazard Mitigation (CVGHM) discussed seismic events in June and December 2007, and January 2008. Plumes mentioned in these reports were small, white in color, and only rose 15-40 m, occasionally up to 125 m, above the rim of the active vent area (Tompaluan crater), in the saddle between the peaks of Lokon and Empung.
During 11-24 June 2007 CVGHM reported 52 A-type and 156 B-type earthquakes, but no tremor. Only one earthquake was felt by residents. The Alert Level remained at 2 (on a scale of 1-4).
On 9 December 2007, CVGHM raised the Alert Level from 2 to 3 based on visual observations, inflation detected by deformation instruments, and an increase in seismicity. The water in the Tompaluan crater changed color from green to gray and noises from degassing became stronger. Visitors were advised not to go within 2 km of the crater.
After a short period of decline, seismicity began to increase again on 22 January 2008, peaking on 3 February. Visitors were prohibited from going within 1 km of the crater.
Geologic Background. The Lokong-Empung volcanic complex, rising above the plain of Tondano in North Sulawesi, includes four peaks and an active crater. Lokon, the highest peak, has a flat craterless top. The morphologically younger Empung cone 2 km NE has a 400-m-wide, 150-m-deep crater that erupted last in the 18th century. A ridge extending 3 km WNW from Lokon includes the Tatawiran and Tetempangan peaks. All eruptions since 1829 have originated from Tompaluan, a 150 x 250 m crater in the saddle between Lokon and Empung. These eruptions have primarily produced small-to-moderate ash plumes that sometimes damaged croplands and houses, but lava-dome growth and pyroclastic flows have also occurred.
Information Contacts: Dali Ahmad, Hetty Triastuty, Nia Haerani and Suswati, Center of Volcanology and Geological Hazard Mitigation (CVGHM), Jalan Diponegoro 57, Bandung 40122, Indonesia (URL: http://www.vsi.esdm.go.id/).
NW Rota-1 (United States) — February 2008 Cite this Report
NW Rota-1
United States
14.601°N, 144.775°E; summit elev. -517 m
All times are local (unless otherwise noted)
Visit on 24 February 2008 found eruption plume and acoustic signals
During an April 2006 expedition (BGVN 31:05), scientists from the National Oceanic and Atmospheric Agency (NOAA) and Oregon State University aboard the research vessel Melville witnessed the volcano ejecting lava, bombs, and sulfur-rich (SO2 and H2S) plumes. This is the first site where explosive submarine eruptions have been directly observed from a submersible (see Videos, below).
According to William Chadwick, a brief visit to NW Rota-1 was made on 24 February 2008. With support from the NOAA Ocean Exploration Program and the U.S. Coast Guard, the scientists deployed a hydrophone and plume sensor. While on site, scientists found that the volcano was still erupting. There were no instruments left after the April 2006 visit, so the observational record was discontinuous. On the other hand, scientists visited the site four times in four years and consistently found that it was active. Moreover, Chadwick and colleagues had collected multibeam bathymetry in 2003 and 2006 (Walker and others, in press). Depth changes between those surveys were up to +40 m and extended from the eruptive vent at 550 m directly downslope to at least 2,000 m. They were consistent with volcaniclastic deposits from ongoing eruptions. The suggestion is that NW Rota-1 has been very active, if not continuously active.
On 24 February 2008 the Melville crew made a vertical cast over the eruptive vent with a light-scattering sensor and detected an eruption plume below 500 m depth. Hydrophone data also indicated eruptions with cyclic bursts about once a minute. These appear very similar to the explosions observed by ROV and hydrophone in 2006 (Chadwick and others, 2008). The explosion sounds were louder and more frequent in 2008 than in 2006. During the 2008 visit, explosion signals filled the 24-hour acoustic record. Before departure, the crew installed a hydrophone and plume sensor to record activity over the next year.
Resing and others (2007) described two types of venting at NW Rota-1. The first was a focused plume rich in Al, S, Si, CO2, Fe, Mn, and 3He. The second was a plume with diffuse flow, rich in Fe, Mn, CO2, and 3He, but without Al, S, and Si. Data suggested that the pH of these plumes were less than 1.0, primarily due to SO2 and possibly HCl. The authors claimed that the volcano is producing some of the greatest chemical anomalies ever observed in non-buoyant hydrothermal plumes and greatly different from that observed in any other hydrothermal setting.
Videos. Eruption videos taken from an unmanned submersible on 29 April 2006 can be found at http://www.oceanexplorer.noaa.gov/explorations/06fire/logs/april29/april29.html website. The five videos are titled as follows: (1) The extremely dynamic Brimstone Pit, (2) Brimstone Pit erupting with glowing red lava jetting out of the vent, (3) Brimstone Pit erupting with glowing red lava and gas bubbles, (4) Brimstone Pit sulfur plume envelopes the Jason ROV [remotely operated vehicle], and (5) The pulse and shake of the Brimstone Pit during another eruption.
References. Chadwick, W.W., Jr., Cashman, K.V., Embley, R.W., Matsumoto, H., Dziak, R.P., de Ronde, C.E.J., Lau, T.-K., Deardorff, N., and Merle, S.G., 2008, Direct video and hydrophone observations of submarine explosive eruptions at NW Rota-1 volcano, Mariana Arc: J. Geophys. Res.-Solid Earth, doi:10.1029/2007JB005215 (in press).
Resing, J.A., Lebon, G., Baker, E.T., Lupton, J.E., Embley, R.W., Massoth, G.J., Chadwick, Jr., W.W., and de Ronde, C.E.J., 2007, Venting of acid-sulfate fluids in a high-sulfidation setting at NW Rota-1 submarine volcano on the Mariana Arc: Economic Geology, v. 102, no. 6, p. 1047-1061.
Walker, S.L., Baker, E.T., Chadwick, Jr., W.W., Resing, J.A., Lebon, G.T., Lupton, J.E., and Merle S.G., (in press), Eruption-fed particle plumes and volcaniclastic deposits at a submarine volcano: NW-Rota-1, Mariana Arc: J. Geophys. Res.
Geologic Background. A submarine volcano detected during a 2003 NOAA bathymetric survey of the Mariana Island arc was found to be hydrothermally active and named NW Rota-1. The basaltic to basaltic andesite seamount rises to within 517 m of the ocean surface SW of Esmeralda Bank, 64 km NW of Rota Island and ~100 km N of Guam. When Northwest Rota-1 was revisited in 2004, a minor submarine eruption from a vent named Brimstone Pit on the upper south flank about 40 m below the summit intermittently ejected a plume several hundred meters high containing ash, rock particles, and molten sulfur droplets that adhered to the surface of the remotely operated submersible vehicle. The active vent was funnel-shaped, about 20 m wide and 12 m deep. Prominent structural lineaments about a kilometer apart cut across the summit of the edifice and down the NE and SW flanks.
Information Contacts: William Chadwick and Robert Dziak, Oregon State University and NOAA Vents Program, Newport, Oregon; 2115 SE OSU Drive, Newport, OR 97365 USA (URL: http://oceanexplorer.noaa.gov/explorations/06fire/welcome.html).
Suwanosejima (Japan) — February 2008 Cite this Report
Suwanosejima
Japan
29.638°N, 129.714°E; summit elev. 796 m
All times are local (unless otherwise noted)
Small (~1 km) plumes noted during late 2007-early 2008
Our last Bulletin (BGVN 3211) covered eruptive activity during July 2005 to December 2007. This issue covers eruptions recorded by the Tokyo Volcanic Ash Advisory Center (VAAC) from December 2007 to March 2008. Kinoshita and others (2003) noted that Sakura-jima "has been the most eruptive in Japan, with the eruption columns a few kilometers above the crater occasionally."
Table 5 summarizes information gathered by the Tokyo VAAC from observers between 9 December 2007 and 21 March 2008. In all cases the VAAC could not detect plumes using satellite data. An overview of satellite and image monitoring of Suwanose-jima appears in an article by Kinoshita and others (2003).
Table 5. A summary of Tokyo VAAC reports on ash plumes from Suwanose-jima during 9 December 2007 to 21 March 2008. Cases with only dashes in the data fields were when observers detected an explosion but they were unable to say more about a resulting plume. In many of the examples given, there were multiple Volcanic Ash Advisories issued, but no new data came to light. Courtesy of the Tokyo VAAC.
| Date |
Time (UTC) |
Plume Altitude (km) |
Drift Direction |
| 09 Dec 2007 |
2340 |
1.5 |
W |
| 10 Dec 2007 |
0734 |
1.8 |
W |
| 14 Dec 2007 |
0914 |
-- |
-- |
| 15 Dec 2007 |
0016 |
1.8 |
E |
| 16 Dec 2007 |
0353 |
1.5 |
E |
| 16 Dec 2007 |
2310 |
1.5 |
E |
| 08 Feb 2008 |
0248 |
1.8 |
E |
| 13 Feb 2008 |
0208 |
-- |
-- |
| 21 Mar 2008 |
1622 |
-- |
-- |
Reference. Kinoshita, K., Kanagaki, C., Minaka, A., Tsuchida, S., Matsui, T., Tupper, A., Yakiwara, H., and Iino, N., 2003, Ground and Satellite Monitoring of Volcanic Aerosols in Visible and Infrared Bands: The CEReS International Symposium on Remote Sensing - Monitoring of Environmental Change in Asia, Chiba, Japan, 16-17 December 2003, 10 p.
Geologic Background. The 8-km-long island of Suwanosejima in the northern Ryukyu Islands consists of an andesitic stratovolcano with two active summit craters. The summit is truncated by a large breached crater extending to the sea on the E flank that was formed by edifice collapse. One of Japan's most frequently active volcanoes, it was in a state of intermittent Strombolian activity from Otake, the NE summit crater, between 1949 and 1996, after which periods of inactivity lengthened. The largest recorded eruption took place in 1813-14, when thick scoria deposits covered residential areas, and the SW crater produced two lava flows that reached the western coast. At the end of the eruption the summit of Otake collapsed, forming a large debris avalanche and creating an open collapse scarp extending to the eastern coast. The island remained uninhabited for about 70 years after the 1813-1814 eruption. Lava flows reached the eastern coast of the island in 1884. Only about 50 people live on the island.
Information Contacts: Tokyo Volcanic Ash Advisory Center (VAAC), Tokyo, Japan (URL: https://ds.data.jma.go.jp/svd/vaac/data/).
Talang (Indonesia) — February 2008 Cite this Report
Talang
Indonesia
0.979°S, 100.681°E; summit elev. 2575 m
All times are local (unless otherwise noted)
Ash emissions in March, June, and November 2007
The Center of Volcanology and Geological Hazard Mitigation (CVGHM) lowered the Alert Level of Talang to 2 (on a scale of 1-4) on 27 January 2007 due to a reduced seismicity between 23 November 2006 and 24 January 2007, although gas plumes originated from South and Main craters. There had been eruptive episodes in April 2005 and elevated activity during late 2006 (BGVN 32:01).
On 17 March 2007, CVGHM raised the Alert Level based on increased "smoke" and tremors to 3 (on a scale of 1-4). The Darwin Volcanic Ash Advisory Centre (VAAC) reported that, based on information from CVGHM, ash plumes rose to altitudes of 3.4-3.9 km on 19-20 March. Local authorities and residents were advised to prepare for a possible evacuation. On 23 April 2007 the Alert Level was reduced to 2. During 18-25 June, thick brown ash plumes rose from Main crater to an altitude of 3.1 km. Diffuse "white ash" plumes rose from South crater to an altitude of 3 km.
On 29 November CVGHM raised the Alert Level to 3 (on a scale of 1-4) based on visual observations and seismicity. During 27-29 November, ash and steam plumes from multiple craters rose to altitudes of 3.1-4.1 km. A strong smell of sulfur dioxide gas was reported. Visitors were advised not to go within 3 km of the summit.
During 7-10 December, observations were limited by inclement weather. On 11 December, "smoke" rose from the Main crater to a maximum altitude of 3.3 km. Plumes were also observed from the South crater and Gabuo Atas solfatara field. On 14 December visual observations and a decrease in the number of earthquakes prompted a lowering of the Alert Level back to 2.
Geologic Background. Talang, which forms a twin volcano with the extinct Pasar Arbaa volcano, lies ESE of the major city of Padang and rises NW of Dibawah Lake. Talang has two crater lakes on its flanks; the largest of these is 1 x 2 km wide Danau Talang. The summit exhibits fumarolic activity, but which lacks a crater. Historical eruptions have mostly involved small-to-moderate explosive activity first documented in the 19th century that originated from a series of small craters in a valley on the upper NE flank.
Information Contacts: Darwin Volcanic Ash Advisory Centre, Bureau of Meteorology, Commonwealth of Australia (URL: http://www.bom.gov.au/info/vaac); Center of Volcanology and Geological Hazard Mitigation (CVGHM), Jalan Diponegoro 57, Bandung 40122, Indonesia (URL: http://www.vsi.esdm.go.id/).
Batu Tara (Indonesia) — February 2008 Cite this Report
Batu Tara
Indonesia
7.791°S, 123.585°E; summit elev. 633 m
All times are local (unless otherwise noted)
Satellite thermal anomalies indicate that near-daily eruptions continue
Our last report (the first ever for this volcano) covered eruptive activity through 13 October 2007 (BGVN 32:12). This report continues coverage through early April 2008.
Thermal anomalies were first measured by the MODIS satellites on 17 January 2007 (1420 UTC). According to the Hawai'i Institute of Geophysics and Planetology (HIGP) Thermal Alerts System, through the end of 2007 anomalies were measured every 1 to 7 days. This trend of nearly daily anomalies continued up to 9 April 2008, with the following exceptions: a 10-day gap beginning 21 December 2007, a 10-day gap beginning 8 January 2008, and a 21-day gap beginning 2 February 2008.
The regularity and repeating character of the thermal anomalies suggest ongoing venting of hot fragmental material or lava flows, similar to March and April 2007 (BGVN 32:12). However, the late 2007 and early 2008 behavior and deposits have not been observed.
On 4 February 2008, the Center of Volcanology and Geological Hazard Mitigation (CVGHM) reported that since 9 October 2007, white plumes were a daily occurrence. On 8 January 2008, gray plumes rose to 1.5 km altitude and drifted E. On 26 January, white plumes rose to altitudes of 1.7 km and drifted E. On 30 January, white plumes rose to altitudes of 1.5 km. and drifted E. The Darwin VAAC reported that eruption plumes were observed from a ship on 31 January, but ash was not seen in satellite imagery. The Alert level remained at 1 (on a scale of 1-4).
On 11 March the Darwin VAAC reported that satellite imagery that day revealed an ash-and-steam plume from Batu Tara that rose to an altitude of 3 km and drifted SW. On 12 March satellite imagery revealed an ash-and-steam plume at an altitude of 2.1 km moving SE.
Geologic Background. The small isolated island of Batu Tara in the Flores Sea ~50 km N of Lembata (fomerly Lomblen) Island and the main volcanic arc. A scarp on the eastern side reaches the sea, and vegetation covers the other flanks to within 50 m of the summit. This volcano is noted for its potassic leucite-bearing basanitic and tephritic rocks. The first recorded eruption, during 1847-52, produced explosions and a lava flow.
Information Contacts: Darwin Volcanic Ash Advisory Centre, Bureau of Meteorology, Commonwealth of Australia (URL: http://www.bom.gov.au/info/vaac); Center of Volcanology and Geological Hazard Mitigation (CVGHM), Jalan Diponegoro 57, Bandung 40122, Indonesia (URL: http://www.vsi.esdm.go.id/); Hawai'i Institute of Geophysics and Planetology (HIGP) Thermal Alerts System, School of Ocean and Earth Science and Technology (SOEST), Univ. of Hawai'i, 2525 Correa Road, Honolulu, HI 96822, USA (URL: http://modis.higp.hawaii.edu/).