Recently Published Bulletin Reports
Erebus (Antarctica) Lava lake remains active; most thermal alerts recorded since 2019
Rincon de la Vieja (Costa Rica) Frequent phreatic explosions during July-December 2023
Bezymianny (Russia) Explosion on 18 October 2023 sends ash plume 8 km high; lava flows and incandescent avalanches
Kilauea (United States) Low-level lava effusions in the lava lake at Halema’uma’u during July-December 2022
Nyamulagira (DR Congo) Lava flows and thermal activity during May-October 2023
Bagana (Papua New Guinea) Explosions, ash plumes, ashfall, and lava flows during April-September 2023
Mayon (Philippines) Lava flows, pyroclastic flows, ash emissions, and seismicity during April-September 2023
Nishinoshima (Japan) Eruption plumes and gas-and-steam plumes during May-August 2023
Krakatau (Indonesia) White gas-and-steam plumes and occasional ash plumes during May-August 2023
Villarrica (Chile) Strombolian activity, gas-and-ash emissions, and crater incandescence during April-September 2023
Merapi (Indonesia) Frequent incandescent avalanches during April-September 2023
Ebeko (Russia) Moderate explosive activity with ash plumes continued during June-November 2023
Erebus (Antarctica) — January 2024  Cite this Report
Erebus
Antarctica
77.53°S, 167.17°E; summit elev. 3794 m
All times are local (unless otherwise noted)
Lava lake remains active; most thermal alerts recorded since 2019
The lava lake in the summit crater of Erebus has been active since at least 1972. Located in Antarctica overlooking the McMurdo Station on Ross Island, it is the southernmost active volcano on the planet. Because of the remote location, activity is primarily monitored by satellites. This report covers activity during 2023.
The number of thermal alerts recorded by the Hawai'i Institute of Geophysics and Planetology’s MODVOLC Thermal Alerts System increased considerably in 2023 compared to the years 2020-2022 (table 9). In contrast to previous years, the MODIS instruments aboard the Aqua and Terra satellites captured data from Erebus every month during 2023. Consistent with previous years, the lowest number of anomalous pixels were recorded in January, November, and December.
Table 9. Number of monthly MODIS-MODVOLC thermal alert pixels recorded at Erebus during 2017-2023. See BGVN 42:06 for data from 2000 through 2016. The table was compiled using data provided by the HIGP – MODVOLC Thermal Alerts System.
| Year |
Jan |
Feb |
Mar |
Apr |
May |
Jun |
Jul |
Aug |
Sep |
Oct |
Nov |
Dec |
SUM |
| 2017 |
0 |
21 |
9 |
0 |
0 |
1 |
11 |
61 |
76 |
52 |
0 |
3 |
234 |
| 2018 |
0 |
21 |
58 |
182 |
55 |
17 |
137 |
172 |
103 |
29 |
0 |
0 |
774 |
| 2019 |
2 |
21 |
162 |
151 |
55 |
56 |
75 |
53 |
29 |
19 |
1 |
0 |
624 |
| 2020 |
0 |
2 |
16 |
18 |
4 |
4 |
1 |
3 |
18 |
3 |
1 |
6 |
76 |
| 2021 |
0 |
9 |
1 |
0 |
2 |
56 |
46 |
47 |
35 |
52 |
5 |
3 |
256 |
| 2022 |
1 |
13 |
55 |
22 |
15 |
32 |
39 |
19 |
31 |
11 |
0 |
0 |
238 |
| 2023 |
2 |
33 |
49 |
82 |
41 |
32 |
70 |
64 |
42 |
17 |
5 |
11 |
448 |
Sentinel-2 infrared images showed one or two prominent heat sources within the summit crater, accompanied by adjacent smaller sources, similar to recent years (see BGVN 46:01, 47:02, and 48:01). A unique image was obtained on 25 November 2023 by the OLI-2 (Operational Land Imager-2) on Landsat 9, showing the upper part of the volcano surrounded by clouds (figure 32).
Geologic Background. Mount Erebus, the world's southernmost historically active volcano, overlooks the McMurdo research station on Ross Island. It is the largest of three major volcanoes forming the crudely triangular Ross Island. The summit of the dominantly phonolitic volcano has been modified by one or two generations of caldera formation. A summit plateau at about 3,200 m elevation marks the rim of the youngest caldera, which formed during the late-Pleistocene and within which the modern cone was constructed. An elliptical 500 x 600 m wide, 110-m-deep crater truncates the summit and contains an active lava lake within a 250-m-wide, 100-m-deep inner crater; other lava lakes are sometimes present. The glacier-covered volcano was erupting when first sighted by Captain James Ross in 1841. Continuous lava-lake activity with minor explosions, punctuated by occasional larger Strombolian explosions that eject bombs onto the crater rim, has been documented since 1972, but has probably been occurring for much of the volcano's recent history.
Information Contacts: Hawai'i Institute of Geophysics and Planetology (HIGP) - MODVOLC Thermal Alerts System, School of Ocean and Earth Science and Technology (SOEST), Univ. of Hawai'i, 2525 Correa Road, Honolulu, HI 96822, USA (URL: http://modis.higp.hawaii.edu/); Copernicus Browser, Copernicus Data Space Ecosystem, European Space Agency (URL: https://dataspace.copernicus.eu/browser/); NASA Earth Observatory, EOS Project Science Office, NASA Goddard Space Flight Center, Goddard, Maryland, USA (URL: https://earthobservatory.nasa.gov/images/152134/erebus-breaks-through).
Rincon de la Vieja (Costa Rica) — January 2024 Cite this Report
Rincon de la Vieja
Costa Rica
10.83°N, 85.324°W; summit elev. 1916 m
All times are local (unless otherwise noted)
Frequent phreatic explosions during July-December 2023
Rincón de la Vieja is a volcanic complex in Costa Rica with a hot convecting acid lake that exhibits frequent weak phreatic explosions, gas-and-steam emissions, and occasional elevated sulfur dioxide levels (BGVN 45:10, 46:03, 46:11). The current eruption period began June 2021. This report covers activity during July-December 2023 and is based on weekly bulletins and occasional daily reports from the Observatorio Vulcanologico Sismologica de Costa Rica-Universidad Nacional (OVSICORI-UNA).
Numerous weak phreatic explosions continued during July-December 2023, along with gas-and-steam emissions and plumes that rose as high as 3 km above the crater rim. Many weekly OVSICORI-UNA bulletins included the previous week's number of explosions and emissions (table 9). For many explosions, the time of explosion was given (table 10). Frequent seismic activity (long-period earthquakes, volcano-tectonic earthquakes, and tremor) accompanied the phreatic activity.
Table 9. Number of reported weekly phreatic explosions and gas-and-steam emissions at Rincón de la Vieja, July-December 2023. Counts are reported for the week before the Weekly Bulletin date; not all reports included these data. Courtesy of OVSICORI-UNA.
| OVSICORI Weekly Bulletin |
Number of explosions |
Number of emissions |
| 28 Jul 2023 |
6 |
14 |
| 4 Aug 2023 |
10 |
12 |
| 1 Sep 2023 |
13 |
11 |
| 22 Sep 2023 |
12 |
13 |
| 29 Sep 2023 |
6 |
11 |
| 6 Oct 2023 |
12 |
5 |
| 13 Oct 2023 |
7 |
9 |
| 20 Oct 2023 |
1 |
15 |
| 27 Oct 2023 |
3 |
23 |
| 3 Nov 2023 |
3 |
10 |
| 17 Nov 2023 |
0 |
Some |
| 24 Nov 2023 |
0 |
14 |
| 8 Dec 2023 |
4 |
16 |
| 22 Dec 2023 |
8 |
18 |
Table 10. Summary of activity at Rincón de la Vieja during July-December 2023. Weak phreatic explosions and gas emissions are noted where the time of explosion was indicated in the weekly or daily bulletins. Height of plumes or emissions are distance above the crater rim. Courtesy of OVSICORI-UNA.
| Date |
Time |
Description of Activity |
| 1 Jul 2023 |
0156 |
Explosion. |
| 2 Jul 2023 |
0305 |
Explosion. |
| 4 Jul 2023 |
0229, 0635 |
Event at 0635 produced a gas-and-steam plume that rose 700 m and drifted W; seen by residents in Liberia (21 km SW). |
| 9 Jul 2023 |
1843 |
Explosion. |
| 21 Jul 2023 |
0705 |
Explosion. |
| 26 Jul 2023 |
1807 |
Explosion. |
| 28 Jul 2023 |
0802 |
Explosion generated a gas-and-steam plume that rose 500 m. |
| 30 Jul 2023 |
1250 |
Explosion. |
| 31 Jul 2023 |
2136 |
Explosion. |
| 11 Aug 2023 |
0828 |
Explosion. |
| 18 Aug 2023 |
1304 |
Explosion. |
| 21 Aug 2023 |
1224 |
Explosion generated gas-and-steam plumes rose 500-600 m. |
| 22 Aug 2023 |
0749 |
Explosion generated gas-and-steam plumes rose 500-600 m. |
| 24 Aug 2023 |
1900 |
Explosion. |
| 25 Aug 2023 |
0828 |
Event produced a steam-and-gas plume that rose 3 km and drifted NW. |
| 27-28 Aug 2023 |
0813 |
Four small events; the event at 0813 on 28 August lasted two minutes and generated a steam-and-gas plume that rose 2.5 km. |
| 1 Sep 2023 |
1526 |
Explosion generated plume that rose 2 km and ejected material onto the flanks. |
| 2-3 Sep 2023 |
- |
Small explosions detected in infrasound data. |
| 4 Sep 2023 |
1251 |
Gas-and-steam plume rose 1 km and drifted W. |
| 7 Nov 2023 |
1113 |
Explosion. |
| 8 Nov 2023 |
0722 |
Explosion. |
| 12 Nov 2023 |
0136 |
Small gas emissions. |
| 14 Nov 2023 |
0415 |
Small gas emissions. |
According to OVSICORI-UNA, during July-October the average weekly sulfur dioxide (SO2) flux ranged from 68 to 240 tonnes/day. However, in mid-November the flux increased to as high as 334 tonnes/day, the highest value measured in recent years. The high SO2 flux in mid-November was also detected by the TROPOMI instrument on the Sentinel-5P satellite (figure 43).
Geologic Background. Rincón de la Vieja, the largest volcano in NW Costa Rica, is a remote volcanic complex in the Guanacaste Range. The volcano consists of an elongated, arcuate NW-SE-trending ridge constructed within the 15-km-wide early Pleistocene Guachipelín caldera, whose rim is exposed on the south side. Sometimes known as the "Colossus of Guanacaste," it has an estimated volume of 130 km3 and contains at least nine major eruptive centers. Activity has migrated to the SE, where the youngest-looking craters are located. The twin cone of Santa María volcano, the highest peak of the complex, is located at the eastern end of a smaller, 5-km-wide caldera and has a 500-m-wide crater. A Plinian eruption producing the 0.25 km3 Río Blanca tephra about 3,500 years ago was the last major magmatic eruption. All subsequent eruptions, including numerous historical eruptions possibly dating back to the 16th century, have been from the prominent active crater containing a 500-m-wide acid lake located ENE of Von Seebach crater.
Information Contacts: Observatorio Vulcanológico Sismológica de Costa Rica-Universidad Nacional (OVSICORI-UNA), Apartado 86-3000, Heredia, Costa Rica (URL: http://www.ovsicori.una.ac.cr/); NASA Global Sulfur Dioxide Monitoring Page, Atmospheric Chemistry and Dynamics Laboratory, NASA Goddard Space Flight Center (NASA/GSFC), 8800 Greenbelt Road, Goddard MD 20771, USA (URL: https://so2.gsfc.nasa.gov/).
Bezymianny (Russia) — November 2023 Cite this Report
Bezymianny
Russia
55.972°N, 160.595°E; summit elev. 2882 m
All times are local (unless otherwise noted)
Explosion on 18 October 2023 sends ash plume 8 km high; lava flows and incandescent avalanches
Bezymianny, located on Russia’s Kamchatka Peninsula, has had eruptions since 1955 characterized by dome growth, explosions, pyroclastic flows, ash plumes, and ashfall. Activity during November 2022-April 2023 included gas-and-steam emissions, lava dome collapses generating avalanches, and persistent thermal activity. Similar eruptive activity continued from May through October 2023, described here based on information from weekly and daily reports of the Kamchatka Volcano Eruptions Response Team (KVERT), notices from Tokyo VAAC (Volcanic Ash Advisory Center), and from satellite data.
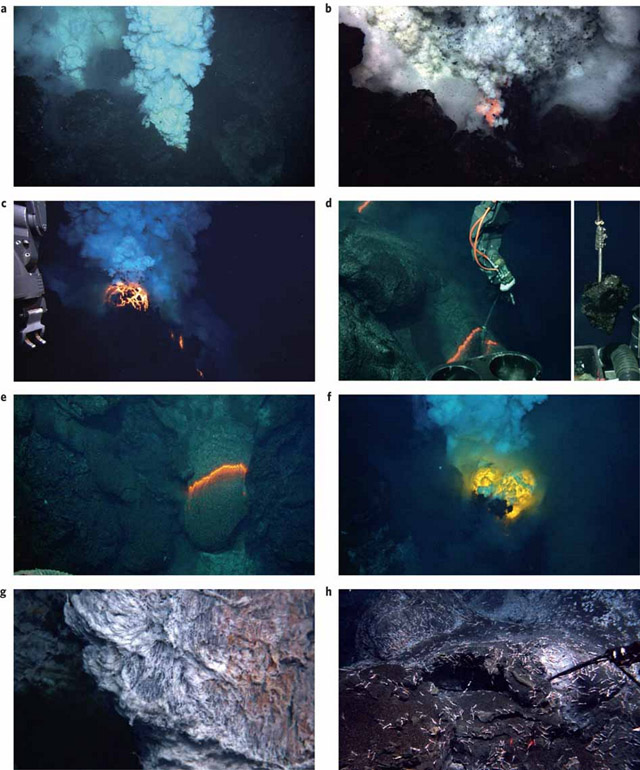
Overall activity decreased after the strong period of activity in late March through April 2023, which included ash explosions during 29 March and 7-8 April 2023 that sent plumes as high as 10-12 km altitude, along with dome growth and lava flows (BGVN 48:05). This reduced activity can be seen in the MIROVA thermal detection system graph (figure 56), which was consistent with data from the MODVOLC thermal detection system and with Sentinel-2 satellite images that showed persistent hotspots in the summit crater when conditions allowed observations. A renewed period of strong activity began in mid-October 2023.
Activity increased significantly on 17 October 2023 when large collapses began during 0700-0830 on the E flanks of the lava dome and continued to after 0930 the next day (figure 57). Ash plumes rose to an altitude of 4.5-5 km, extending 220 km NNE by 18 October. A large explosion at 1630 on 18 October produced an ash plume that rose to an altitude of 11 km (8 km above the summit) and drifted NNE and then NW, extending 900 km NW within two days at an altitude of 8 km. Minor ashfall was noted in Kozyrevsk (45 km WNW). At 0820 on 20 October an ash plume was identified in satellite images drifting 100 km ENE at altitudes of 4-4.5 km.
Lava flows and hot avalanches from the dome down the SE flank continued over the next few days, including 23 October when clear conditions allowed good observations (figures 58 and 59). A large thermal anomaly was observed over the volcano through 24 October, and in the summit crater on 30 October (figure 60). Strong fumarolic activity continued, with numerous avalanches and occasional incandescence. By the last week of October, volcanic activity had decreased to a level consistent with that earlier in the reporting period.
Aviation warnings were frequently updated during 17-20 October. KVERT issued a Volcano Observatory Notice for Aviation (VONA) on 17 October at 1419 and 1727 (0219 and 0527 UTC) raising the Aviation Color Code (ACC) from Yellow to Orange (second highest level). The next day, KVERT issued a VONA at 1705 (0505 UTC) raising the ACC to Red (highest level) but lowered it back to Orange at 2117 (0917 UTC). After another decrease to Yellow and back to Orange, the ACC was reduced to Yellow on 20 October at 1204 (0004 UTC). In addition, the Tokyo VAAC issued a series of Volcanic Ash Advisories beginning on 16 October and continuing through 30 October.
Geologic Background. The modern Bezymianny, much smaller than its massive neighbors Kamen and Kliuchevskoi on the Kamchatka Peninsula, was formed about 4,700 years ago over a late-Pleistocene lava-dome complex and an edifice built about 11,000-7,000 years ago. Three periods of intensified activity have occurred during the past 3,000 years. The latest period, which was preceded by a 1,000-year quiescence, began with the dramatic 1955-56 eruption. This eruption, similar to that of St. Helens in 1980, produced a large open crater that was formed by collapse of the summit and an associated lateral blast. Subsequent episodic but ongoing lava-dome growth, accompanied by intermittent explosive activity and pyroclastic flows, has largely filled the 1956 crater.
Information Contacts: Kamchatka Volcanic Eruptions Response Team (KVERT), Far Eastern Branch, Russian Academy of Sciences, 9 Piip Blvd., Petropavlovsk-Kamchatsky, 683006, Russia (URL: http://www.kscnet.ru/ivs/kvert/); Kamchatka Volcanological Station, Kamchatka Branch of Geophysical Survey, (KB GS RAS), Klyuchi, Kamchatka Krai, Russia (URL: http://volkstat.ru/); Tokyo Volcanic Ash Advisory Center (VAAC), 1-3-4 Otemachi, Chiyoda-ku, Tokyo 100-8122, Japan (URL: http://ds.data.jma.go.jp/svd/vaac/data/); Hawai'i Institute of Geophysics and Planetology (HIGP) - MODVOLC Thermal Alerts System, School of Ocean and Earth Science and Technology (SOEST), Univ. of Hawai'i, 2525 Correa Road, Honolulu, HI 96822, USA (URL: http://modis.higp.hawaii.edu/); MIROVA (Middle InfraRed Observation of Volcanic Activity), a collaborative project between the Universities of Turin and Florence (Italy) supported by the Centre for Volcanic Risk of the Italian Civil Protection Department (URL: http://www.mirovaweb.it/); Copernicus Browser, Copernicus Data Space Ecosystem, European Space Agency (URL: https://dataspace.copernicus.eu/browser/).chr
Kilauea (United States) — January 2023 Cite this Report
Kilauea
United States
19.421°N, 155.287°W; summit elev. 1222 m
All times are local (unless otherwise noted)
Low-level lava effusions in the lava lake at Halema’uma’u during July-December 2022
Kīlauea is the southeastern-most volcano in Hawaii and overlaps the E flank of the Mauna Loa volcano. Its East Rift Zone (ERZ) has been intermittently active for at least 2,000 years. An extended eruption period began in January 1983 and was characterized by open lava lakes and lava flows from the summit caldera and the East Rift Zone. During May 2018 magma migrated into the Lower East Rift Zone (LERZ) and opened 24 fissures along a 6-km-long NE-trending fracture zone that produced lava flows traveling in multiple directions. As lava emerged from the fissures, the lava lake at Halema'uma'u drained and explosions sent ash plumes to several kilometers altitude (BGVN 43:10).
The current eruption period started during September 2021 and has recently been characterized by lava effusions, spatter, and sulfur dioxide emissions in the active Halema’uma’u lava lake (BGVN 47:08). Lava effusions, some spatter, and sulfur dioxide emissions have continued during this reporting period of July through December 2022 using daily reports, volcanic activity notices, and abundant photo, map, and video data from the US Geological Survey's (USGS) Hawaiian Volcano Observatory (HVO).
Summary of activity during July-December 2022. Low-level effusions have continued at the western vent of the Halema’uma’u crater during July through early December 2022. Occasional weak ooze-outs (also called lava break outs) would occur along the margins of the crater floor. The overall level of the active lava lake throughout the reporting period gradually increased due to infilling, however it stagnated in mid-September (table 13). During September through November, activity began to decline, though lava effusions persisted at the western vent. By 9 December, the active part of the lava lake had completely crusted over, and incandescence was no longer visible.
Table 13. Summary of measurements taken during overflights at Kīlauea that show a gradual increase in the active lava lake level and the volume of lava effused since 29 September 2021. Lower activity was reported during September-October. Data collected during July-December 2022. Courtesy of HVO.
| Date: |
Level of the active lava lake (m): |
Cumulative volume of lava effused (million cubic meters): |
| 7 Jul 2022 |
130 |
95 |
| 19 Jul 2022 |
133 |
98 |
| 4 Aug 2022 |
136 |
102 |
| 16 Aug 2022 |
137 |
104 |
| 12 Sep 2022 |
143 |
111 |
| 5 Oct 2022 |
143 |
111 |
| 28 Oct 2022 |
143 |
111 |
Activity during July 2022. Lava effusions were reported from the western vent in the Halema’uma’u crater, along with occasional weak ooze-outs along the margins of the crater floor. The height of the lava lake was variable due to deflation-inflation tilt events; for example, the lake level dropped approximately 3-4 m during a summit deflation-inflation event reported on 1 July. Webcam images taken during the night of 6-12 July showed intermittent low-level spattering at the western vent that rose less than 10 m above the vent (figure 519). Measurements made during an overflight on 7 July indicated that the crater floor was infilled about 130 m and that 95 million cubic meters of lava had been effused since 29 September 2021. A single, relatively small lava ooze-out was active to the S of the lava lake. Around midnight on 8 July there were two brief periods of lava overflow onto the lake margins. On 9 July lava ooze-outs were reported near the SE and NE edges of the crater floor and during 10-11 July they occurred near the E, NE, and NW edges. On 16 July crater incandescence was reported, though the ooze-outs and spattering were not visible. On 18 July overnight webcam images showed incandescence in the western vent complex and two ooze-outs were reported around 0000 and 0200 on 19 July. By 0900 there were active ooze-outs along the SW edge of the crater floor. Measurements made from an overflight on 19 July indicated that the crater floor was infilled about 133 m and 98 million cubic meters of lava had erupted since 29 September 2021 (figure 520). On 20 July around 1600 active ooze-outs were visible along the N edge of the crater, which continued through the next day. Extensive ooze-outs occurred along the W margin during 24 July until 1900; on 26 July minor ooze-outs were noted along the N margin. Minor spattering was visible on 29 July along the E margin of the lake. The sulfur dioxide emission rates ranged 650-2,800 tons per day (t/d), the higher of which was measured on 8 July (figure 519).
Activity during August 2022. The eruption continued in the Halema’uma’u crater at the western vent. According to HVO the lava in the active lake remained at the level of the bounding levees. Occasional minor ooze-outs were observed along the margins of the crater floor. Strong nighttime crater incandescence was visible after midnight on 6 August over the western vent cone. During 6-7 August scattered small lava lobes were active along the crater floor and incandescence persisted above the western vent through 9 August. During 7-9 August HVO reported a single lava effusion source was active along the NW margin of the crater floor. Measurements from an overflight on 4 August indicated that the crater floor was infilled about 136 m total and that 102 million cubic meters of lava had been erupted since the start of the eruption. Lava breakouts were reported along the N, NE, E, S, and W margins of the crater during 10-16 August. Another overflight survey conducted on 16 August indicated that the crater floor infilled about 137 m and 104 million cubic meters of lava had been erupted since September 2021. Measured sulfur dioxide emissions rates ranged 1,150-2,450 t/d, the higher of which occurred on 8 August.
Activity during September 2022. During September, lava effusion continued from the western vent into the active lava lake and onto the crater floor. Intermittent minor ooze-outs were reported through the month. A small ooze-out was visible on the W crater floor margin at 0220 on 2 September, which showed decreasing surface activity throughout the day, but remained active through 3 September. On 3 September around 1900 a lava outbreak occurred along the NW margin of the crater floor but had stopped by the evening of 4 September. Field crews monitoring the summit lava lake on 9 September observed spattering on the NE margin of the lake that rose no higher than 10 m, before falling back onto the lava lake crust (figure 521). Overflight measurements on 12 September indicated that the crater floor was infilled a total of 143 m and 111 million cubic meters of lava had been erupted since September 2021. Extensive breakouts in the W and N part of the crater floor were reported at 1600 on 20 September and continued into 26 September. The active part of the lava lake dropped by 10 m while other parts of the crater floor dropped by several meters. Summit tiltmeters recorded a summit seismic swarm of more than 80 earthquakes during 1500-1800 on 21 September, which occurred about 1.5 km below Halema’uma’u; a majority of these were less than Mw 2. By 22 September the active part of the lava lake was infilled about 2 m. On 23 September the western vent areas exhibited several small spatter cones with incandescent openings, along with weak, sporadic spattering (figure 522). The sulfur dioxide emission rate ranged from 930 t/d to 2,000 t/d, the higher of which was measured on 6 September.
Activity during October 2022. Activity during October declined slightly compared to previous months, though lava effusions persisted from the western vent into the active lava lake and onto the crater floor during October (figure 523). Slight variations in the lava lake were noted throughout the month. HVO reported that around 0600 on 3 October the level of the lava lake has lowered slightly. Overflight measurements taken on 5 October indicated that the crater floor was infilled a total of about 143 m and that 111 million cubic meters of lava had been effused since September 2021. During 6-7 October the lake gradually rose 0.5 m. Sulfur dioxide measurements made on 22 October had an emission rate of 700 t/d. Another overflight taken on 28 October showed that there was little to no change in the elevation of the crater floor: the crater floor was infilled a total of 143 m and 111 million cubic meters of lava had erupted since the start of the eruption.
Activity during November 2022. Activity remained low during November, though HVO reported that lava from the western vent continued to effuse into the active lava lake and onto the crater floor throughout the month. The rate of sulfur dioxide emissions during November ranged from 300-600 t/d, the higher amount of which occurred on 9 November.
Activity during December 2022. Similar low activity was reported during December, with lava effusing from the western vent into the active lava lake and onto the crater floor. During 4-5 December the active part of the lava lake was slightly variable in elevation and fluctuated within 1 m. On 9 December HVO reported that lava was no longer erupting from the western vent in the Halema’uma’u crater and that sulfur dioxide emissions had returned to near pre-eruption background levels; during 10-11 December, the lava lake had completely crusted over, and no incandescence was visible (figure 524). Time lapse camera images covering the 4-10 December showed that the crater floor showed weak deflation and no inflation. Some passive events of crustal overturning were reported during 14-15 December, which brought fresh incandescent lava to the lake surface. The sulfur dioxide emission rate was approximately 200 t/d on 14 December. A smaller overturn event on 17 December and another that occurred around 0000 and into the morning of 20 December were also detected. A small seismic swarm was later detected on 30 December.
Geologic Background. Kilauea overlaps the E flank of the massive Mauna Loa shield volcano in the island of Hawaii. Eruptions are prominent in Polynesian legends; written documentation since 1820 records frequent summit and flank lava flow eruptions interspersed with periods of long-term lava lake activity at Halemaumau crater in the summit caldera until 1924. The 3 x 5 km caldera was formed in several stages about 1,500 years ago and during the 18th century; eruptions have also originated from the lengthy East and Southwest rift zones, which extend to the ocean in both directions. About 90% of the surface of the basaltic shield volcano is formed of lava flows less than about 1,100 years old; 70% of the surface is younger than 600 years. The long-term eruption from the East rift zone between 1983 and 2018 produced lava flows covering more than 100 km2, destroyed hundreds of houses, and added new coastline.
Information Contacts: Hawaiian Volcano Observatory (HVO), U.S. Geological Survey, PO Box 51, Hawai'i National Park, HI 96718, USA (URL: http://hvo.wr.usgs.gov/).
Nyamulagira (DR Congo) — November 2023 Cite this Report
Nyamulagira
DR Congo
1.408°S, 29.2°E; summit elev. 3058 m
All times are local (unless otherwise noted)
Lava flows and thermal activity during May-October 2023
Nyamulagira (also known as Nyamuragira) is a shield volcano in the Democratic Republic of Congo with the summit truncated by a small 2 x 2.3 km caldera with walls up to about 100 m high. Documented eruptions have occurred within the summit caldera, as well as from numerous flank fissures and cinder cones. The current eruption period began in April 2018 and has more recently been characterized by summit crater lava flows and thermal activity (BGVN 48:05). This report describes lava flows and variable thermal activity during May through October 2023, based on information from the Observatoire Volcanologique de Goma (OVG) and various satellite data.
Lava lake activity continued during May. The MIROVA (Middle InfraRed Observation of Volcanic Activity) system recorded moderate-to-strong thermal activity throughout the reporting period; activity was more intense during May and October and relatively weaker from June through September (figure 95). The MODVOLC thermal algorithm, detected a total of 209 thermal alerts. There were 143 hotspots detected during May, eight during June, nine during September, and 49 during October. This activity was also reflected in infrared satellite images, where a lava flow was visible in the NW part of the crater on 7 May and strong activity was seen in the center of the crater on 4 October (figure 96). Another infrared satellite image taken on 12 May showed still active lava flows along the NW margin of the crater. According to OVG lava effusions were active during 7-29 May and moved to the N and NW parts of the crater beginning on 9 May. Strong summit crater incandescence was visible from Goma (27 km S) during the nights of 17, 19, and 20 May (figure 97). On 17 May there was an increase in eruptive activity, which peaked at 0100 on 20 May. Notable sulfur dioxide plumes drifted NW and W during 19-20 May (figure 98). Drone footage acquired in partnership with the USGS (United States Geological Survey) on 20 May captured images of narrow lava flows that traveled about 100 m down the W flank (figure 99). Data from the Rumangabo seismic station indicated a decreasing trend in activity during 17-21 May. Although weather clouds prevented clear views of the summit, a strong thermal signature on the NW flank was visible in an infrared satellite image on 22 May, based on an infrared satellite image. On 28 May the lava flows on the upper W flank began to cool and solidify. By 29 May seismicity returned to levels similar to those recorded before the 17 May increase. Lava effusion continued but was confined to the summit crater; periodic crater incandescence was observed.
Low-level activity was noted during June through October. On 1 June OVG reported that seismicity remained at lower levels and that crater incandescence had been absent for three days, though infrared satellite imagery showed continued lava effusion in the summit crater. The lava flows on the flanks covered an estimated 0.6 km2. Satellite imagery continued to show thermal activity confined to the lava lake through October (figure 96), although no lava flows or significant sulfur dioxide emissions were reported.
Geologic Background. Africa's most active volcano, Nyamulagira (also known as Nyamuragira), is a massive high-potassium basaltic shield about 25 km N of Lake Kivu and 13 km NNW of the steep-sided Nyiragongo volcano. The summit is truncated by a small 2 x 2.3 km caldera that has walls up to about 100 m high. Documented eruptions have occurred within the summit caldera, as well as from the numerous flank fissures and cinder cones. A lava lake in the summit crater, active since at least 1921, drained in 1938, at the time of a major flank eruption. Recent lava flows extend down the flanks more than 30 km from the summit as far as Lake Kivu; extensive lava flows from this volcano have covered 1,500 km2 of the western branch of the East African Rift.
Information Contacts: Observatoire Volcanologique de Goma (OVG), Departement de Geophysique, Centre de Recherche en Sciences Naturelles, Lwiro, D.S. Bukavu, DR Congo; Hawai'i Institute of Geophysics and Planetology (HIGP) - MODVOLC Thermal Alerts System, School of Ocean and Earth Science and Technology (SOEST), Univ. of Hawai'i, 2525 Correa Road, Honolulu, HI 96822, USA (URL: http://modis.higp.hawaii.edu/); MIROVA (Middle InfraRed Observation of Volcanic Activity), a collaborative project between the Universities of Turin and Florence (Italy) supported by the Centre for Volcanic Risk of the Italian Civil Protection Department (URL: http://www.mirovaweb.it/); NASA Global Sulfur Dioxide Monitoring Page, Atmospheric Chemistry and Dynamics Laboratory, NASA Goddard Space Flight Center (NASA/GSFC), 8800 Greenbelt Road, Goddard, Maryland, USA (URL: https://so2.gsfc.nasa.gov/); Copernicus Browser, Copernicus Data Space Ecosystem, European Space Agency (URL: https://dataspace.copernicus.eu/browser/); Charles Balagizi, Goma Volcano Observatory, Departement de Geophysique, Centre de Recherche en Sciences Naturelles, Lwiro, D.S. Bukavu, DR Congo.
Bagana (Papua New Guinea) — October 2023 Cite this Report
Bagana
Papua New Guinea
6.137°S, 155.196°E; summit elev. 1855 m
All times are local (unless otherwise noted)
Explosions, ash plumes, ashfall, and lava flows during April-September 2023
The remote volcano of Bagana is located in central Bougainville Island, Papua New Guinea. Recorded eruptions date back to 1842 and activity has consisted of effusive activity that has built a small lava dome in the summit crater and occasional explosions that produced pyroclastic flows. The most recent eruption has been ongoing since February 2000 and has produced occasional explosions, ash plumes, and lava flows. More recently, activity has been characterized by ongoing effusive activity and ash emissions (BGVN 48:04). This report updates activity from April through September 2023 that has consisted of explosions, ash plumes, ashfall, and lava flows, using information from the Darwin Volcanic Ash Advisory Center (VAAC) and satellite data.
An explosive eruption was reported on 7 July that generated a large gas-and-ash plume to high altitudes and caused significant ashfall in local communities; the eruption plume had reached upper tropospheric (16-18 km altitude) altitudes by 2200, according to satellite images. Sulfur dioxide plumes were detected in satellite images on 8 July and indicated that the plume was likely a mixture of gas, ice, and ash. A report issued by the Autonomous Bougainville Government (ABG) (Torokina District, Education Section) on 10 July noted that significant ash began falling during 2000-2100 on 7 July and covered most areas in the Vuakovi, Gotana (9 km SW), Koromaketo, Laruma (25 km W) and Atsilima (27 km NW) villages. Pyroclastic flows also occurred, according to ground-based reports; small deposits confined to one drainage were inspected by RVO during an overflight on 17 July and were confirmed to be from the 7 July event. Ashfall continued until 10 July and covered vegetation, which destroyed bushes and gardens and contaminated rivers and streams.
RVO reported another eruption on 14 July. The Darwin VAAC stated that an explosive event started around 0830 on 15 July and produced an ash plume that rose to 16.5 km altitude by 1000 and drifted N, according to satellite images. The plume continued to drift N and remained visible through 1900, and by 2150 it had dissipated.
Ashfall likely from both the 7 and 15 July events impacted about 8,111 people in Torokina (20 km SW), including Tsito/Vuakovi, Gotana, Koromaketo, Kenaia, Longkogari, Kenbaki, Piva (13 km SW), and Atsinima, and in the Tsitovi district, according to ABG. Significant ashfall was also reported in Ruruvu (22 km N) in the Wakunai District of Central Bougainville, though the thickness of these deposits could not be confirmed. An evacuation was called for the villages in Wakunai, where heavy ashfall had contaminated water sources; the communities of Ruruvu, Togarau, Kakarapaia, Karauturi, Atao, and Kuritaturi were asked to evacuate to a disaster center at the Wakunai District Station, and communities in Torokina were asked to evacuate to the Piva District station. According to a news article, more than 7,000 people needed temporary accommodations, with about 1,000 people in evacuation shelters. Ashfall had deposited over a broad area, contaminating water supplies, affecting crops, and collapsing some roofs and houses in rural areas. Schools were temporarily shut down. Intermittent ash emissions continued through the end of July and drifted NNW, NW, and SW. Fine ashfall was reported on the coast of Torokina, and ash plumes also drifted toward Laruma and Atsilima.
A small explosive eruption occurred at 2130 on 28 July that ejected material from the crater vents, according to reports from Torokina, in addition to a lava flow that contained two lobes. A second explosion was detected at 2157. Incandescence from the lava flow was visible from Piva as it descended the W flank around 2000 on 29 July (figure 47). The Darwin VAAC reported that a strong thermal anomaly was visible in satellite images during 30-31 July and that ash emissions rose to 2.4 km altitude and drifted WSW on 30 July. A ground report from RVO described localized emissions at 0900 on 31 July.
The Darwin VAAC reported that ash plumes were identified in satellite imagery at 0800 and 1220 on 12 August and rose to 2.1 km and 3 km altitude and drifted NW and W, respectively. A news report stated that aid was sent to more than 6,300 people that were adversely affected by the eruption. Photos taken during 17-19 August showed ash emissions rising no higher than 1 km above the summit and drifting SE. A small explosion generated an ash plume during the morning of 19 August. Deposits from small pyroclastic flows were also captured in the photos. Satellite images captured lava flows and pyroclastic flow deposits. Two temporary seismic stations were installed near Bagana on 17 August at distances of 7 km WSW (Vakovi station) and 11 km SW (Kepox station). The Kepox station immediately started to record continuous, low-frequency background seismicity.
Satellite data. Little to no thermal activity was detected during April through mid-July 2023; only one anomaly was recorded during early April and one during early June, according to MIROVA (Middle InfraRed Observation of Volcanic Activity) data (figure 48). Thermal activity increased in both power and frequency during mid-July through September, although there were still some short gaps in detected activity. MODVOLC also detected increased thermal activity during August; thermal hotspots were detected a total of five times on 19, 20, and 27 August. Weak thermal anomalies were also captured in infrared satellite images on clear weather days throughout the reporting period on 7, 12, and 17 April, 27 May, 1, 6, 16, and 31 July, and 19 September (figure 48); a strong thermal anomaly was visible on 31 July. Distinct sulfur dioxide plumes that drifted generally NW were intermittently captured by the TROPOMI instrument on the Sentinel-5P satellite and sometimes exceeded two Dobson Units (DUs) (figure 49).
Geologic Background. Bagana volcano, in a remote portion of central Bougainville Island, is frequently active. This massive symmetrical cone was largely constructed by an accumulation of viscous andesitic lava flows. The entire edifice could have been constructed in about 300 years at its present rate of lava production. Eruptive activity is characterized by non-explosive effusion of viscous lava that maintains a small lava dome in the summit crater, although occasional explosive activity produces pyroclastic flows. Lava flows with tongue-shaped lobes up to 50 m thick and prominent levees descend the flanks on all sides.
Information Contacts: Rabaul Volcano Observatory (RVO), Geohazards Management Division, Department of Mineral Policy and Geohazards Management (DMPGM), PO Box 3386, Kokopo, East New Britain Province, Papua New Guinea; Darwin Volcanic Ash Advisory Centre (VAAC), Bureau of Meteorology, Northern Territory Regional Office, PO Box 40050, Casuarina, NT 0811, Australia (URL: http://www.bom.gov.au/info/vaac/); MIROVA (Middle InfraRed Observation of Volcanic Activity), a collaborative project between the Universities of Turin and Florence (Italy) supported by the Centre for Volcanic Risk of the Italian Civil Protection Department (URL: http://www.mirovaweb.it/); Hawai'i Institute of Geophysics and Planetology (HIGP) - MODVOLC Thermal Alerts System, School of Ocean and Earth Science and Technology (SOEST), Univ. of Hawai'i, 2525 Correa Road, Honolulu, HI 96822, USA (URL: http://modis.higp.hawaii.edu/); NASA Global Sulfur Dioxide Monitoring Page, Atmospheric Chemistry and Dynamics Laboratory, NASA Goddard Space Flight Center (NASA/GSFC), 8800 Greenbelt Road, Goddard, Maryland, USA (URL: https://so2.gsfc.nasa.gov/); Copernicus Browser, Copernicus Data Space Ecosystem, European Space Agency (URL: https://dataspace.copernicus.eu/browser/); Autonomous Bougainville Government, P.O Box 322, Buka, AROB, PNG (URL: https://abg.gov.pg/); Andrew Tupper (Twitter: @andrewcraigtupp); Simon Carn, Geological and Mining Engineering and Sciences, Michigan Technological University, 1400 Townsend Drive, Houghton, MI 49931, USA (URL: http://www.volcarno.com/, Twitter: @simoncarn); Radio NZ (URL: https://www.rnz.co.nz/news/pacific/494464/more-than-7-000-people-in-bougainville-need-temporary-accommodation-after-eruption); USAID, 1300 Pennsylvania Ave, NW, Washington DC 20004, USA (URL: https://www.usaid.gov/pacific-islands/press-releases/aug-08-2023-united-states-provides-immediate-emergency-assistance-support-communities-affected-mount-bagana-volcanic-eruptions).
Mayon (Philippines) — October 2023 Cite this Report
Mayon
Philippines
13.257°N, 123.685°E; summit elev. 2462 m
All times are local (unless otherwise noted)
Lava flows, pyroclastic flows, ash emissions, and seismicity during April-September 2023
Mayon is located in the Philippines and has steep upper slopes capped by a small summit crater. Historical eruptions date back to 1616 CE that have been characterized by Strombolian eruptions, lava flows, pyroclastic flows, and mudflows. Eruptions mostly originated from a central conduit. Pyroclastic flows and mudflows have commonly descended many of the approximately 40 drainages that surround the volcano. The most recent eruption occurred during June through October 2022 and consisted of lava dome growth and gas-and-steam emissions (BGVN 47:12). A new eruption was reported during late April 2023 and has included lava flows, pyroclastic density currents, ash emissions, and seismicity. This report covers activity during April through September 2023 based on daily bulletins from the Philippine Institute of Volcanology and Seismology (PHIVOLCS).
During April through September 2023, PHIVOLCS reported near-daily rockfall events, frequent volcanic earthquakes, and sulfur dioxide measurements. Gas-and-steam emissions rose 100-900 m above the crater and drifted in different directions. Nighttime crater incandescence was often visible during clear weather and was accompanied by incandescent avalanches of material. Activity notably increased during June when lava flows were reported on the S, SE, and E flanks (figure 52). The MIROVA graph (Middle InfraRed Observation of Volcanic Activity) showed strong thermal activity coincident with these lava flows, which remained active through September (figure 53). According to the MODVOLC thermal algorithm, a total of 110 thermal alerts were detected during the reporting period: 17 during June, 40 during July, 27 during August, and 26 during September. During early June, pyroclastic density currents (PDCs) started to occur more frequently.
Low activity was reported during much of April and May; gas-and-steam emissions rose 100-900 m above the crater and generally drifted in different directions. A total of 52 rockfall events and 18 volcanic earthquakes were detected during April and 147 rockfall events and 13 volcanic events during May. Sulfur dioxide flux measurements ranged between 400-576 tons per day (t/d) during April, the latter of which was measured on 29 April and between 162-343 t/d during May, the latter of which was measured on 13 May.
Activity during June increased, characterized by lava flows, pyroclastic density currents (PDCs), crater incandescence and incandescent rockfall events, gas-and-steam emissions, and continued seismicity. Weather clouds often prevented clear views of the summit, but during clear days, moderate gas-and-steam emissions rose 100-2,500 m above the crater and drifted in multiple directions. A total of 6,237 rockfall events and 288 volcanic earthquakes were detected. The rockfall events often deposited material on the S and SE flanks within 700-1,500 m of the summit crater and ash from the events drifted SW, S, SE, NE, and E. Sulfur dioxide emissions ranged between 149-1,205 t/d, the latter of which was measured on 10 June. Short-term observations from EDM and electronic tiltmeter monitoring indicated that the upper slopes were inflating since February 2023. Longer-term ground deformation parameters based on EDM, precise leveling, continuous GPS, and electronic tilt monitoring indicated that the volcano remained inflated, especially on the NW and SE flanks. At 1000 on 5 June the Volcano Alert Level (VAL) was raised to 2 (on a 0-5 scale). PHIVOLCS noted that although low-level volcanic earthquakes, ground deformation, and volcanic gas emissions indicated unrest, the steep increase in rockfall frequency may indicate increased dome activity.
A total of 151 dome-collapse PDCs occurred during 8-9 and 11-30 June, traveled 500-2,000 m, and deposited material on the S flank within 2 km of the summit crater. During 8-9 June the VAL was raised to 3. At approximately 1947 on 11 June lava flow activity was reported; two lobes traveled within 500 m from the crater and deposited material on the S (Mi-isi), SE (Bonga), and E (Basud) flanks. Weak seismicity accompanied the lava flow and slight inflation on the upper flanks. This lava flow remained active through 30 June, moving down the S and SE flank as far as 2.5 km and 1.8 km, respectively and depositing material up to 3.3 km from the crater. During 15-16 June traces of ashfall from the PDCs were reported in Sitio Buga, Nabonton, City of Ligao and Purok, and San Francisco, Municipality of Guinobatan. During 28-29 June there were two PDCs generated by the collapse of the lava flow front, which generated a light-brown ash plume 1 km high. Satellite monitors detected significant concentrations of sulfur dioxide beginning on 29 June. On 30 June PDCs primarily affected the Basud Gully on the E flank, the largest of which occurred at 1301 and lasted eight minutes, based on the seismic record. Four PDCs generated between 1800 and 2000 that lasted approximately four minutes each traveled 3-4 km on the E flank and generated an ash plume that rose 1 km above the crater and drifted N and NW. Ashfall was recorded in Tabaco City.
Similar strong activity continued during July; slow lava effusion remained active on the S and SE flanks and traveled as far as 2.8 km and 2.8 km, respectively and material was deposited as far as 4 km from the crater. There was a total of 6,983 rockfall events and 189 PDCs that affected the S, SE, and E flanks. The volcano network detected a total of 2,124 volcanic earthquakes. Continuous gas-and-steam emissions rose 200-2,000 m above the crater and drifted in multiple directions. Sulfur dioxide emissions averaged 792-4,113 t/d, the latter of which was measured on 28 July. During 2-4 July three PDCs were generated from the collapse of the lava flow and resulting light brown plumes rose 200-300 m above the crater. Continuous tremor pulses were reported beginning at 1547 on 3 July through 7 July at 1200, at 2300 on 8 July and going through 0300 on 10 July, and at 2300 on 16 July, as recorded by the seismic network. During 6-9 July there were 10 lava flow-collapse-related PDCs that generated light brown plumes 300-500 m above the crater. During 10-11 July light ashfall was reported in some areas of Mabinit, Legazpi City, Budiao and Salvacion, Daraga, and Camalig, Albay. By 18 July the lava flow advanced 600 m on the E flank as well.
During 1733 on 18 July and 0434 on 19 July PHIVOLCS reported 30 “ashing” events, which are degassing events accompanied by audible thunder-like sounds and entrained ash at the crater, which produced short, dark plumes that drifted SW. These events each lasted 20-40 seconds, and plume heights ranged from 150-300 m above the crater, as recorded by seismic, infrasound, visual, and thermal monitors. Three more ashing events occurred during 19-20 July. Short-term observations from electronic tilt and GPS monitoring indicate deflation on the E lower flanks in early July and inflation on the NW middle flanks during the third week of July. Longer-term ground deformation parameters from EDM, precise leveling, continuous GPS, and electronic tilt monitoring indicated that the volcano was still generally inflated relative to baseline levels. A short-lived lava pulse lasted 28 seconds at 1956 on 21 July, which was accompanied by seismic and infrasound signals. By 22 July, the only lava flow that remained active was on the SE flank, and continued to extend 3.4 km, while those on the S and E flanks weakened markedly. One ashing event was detected during 30-31 July, whereas there were 57 detected during 31 July-1 August; according to PHIVOLCS beginning at approximately 1800 on 31 July eruptive activity was dominated by phases of intermittent ashing, as well as increased in the apparent rates of lava effusion from the summit crater. The ashing phases consisted of discrete events recorded as low-frequency volcanic earthquakes (LFVQ) typically 30 seconds in duration, based on seismic and infrasound signals. Gray ash plume rose 100 m above the crater and generally drifted NE. Shortly after these ashing events began, new lava began to effuse rapidly from the crater, feeding the established flowed on the SE, E, and E flanks and generating frequent rockfall events.
Intensified unrest persisted during August. There was a total of 4,141 rockfall events, 2,881 volcanic earthquakes, which included volcanic tremor events, 32 ashing events, and 101 PDCs detected throughout the month. On clear weather days, gas-and-steam emissions rose 300-1,500 m above the crater and drifted in different directions (figure 54). Sulfur dioxide emissions averaged 735-4,756 t/d, the higher value of which was measured on 16 August. During 1-2 August the rate of lava effusion decreased, but continued to feed the flows on the SE, S, and E flanks, maintaining their advances to 3.4 km, 2.8 km, and 1.1 km from the crater, respectively (figure 55). Rockfall and PDCs generated by collapses at the lava flow margins and from the summit dome deposited material within 4 km of the crater. During 3-4 August there were 10 tremor events detected that lasted 1-4 minutes. Short-lived lava pulse lasted 35 seconds and was accompanied by seismic and infrasound signals at 0442 on 6 August. Seven collapses were recorded at the front of the lava flow during 12-14 August.
During September, similar activity of slow lava effusion, PDCs, gas-and-steam emissions, and seismicity continued. There was a total of 4,452 rockfall events, 329 volcanic earthquakes, which included volcanic tremor events, two ashing events, and 85 PDCs recorded throughout the month. On clear weather days, gas-and-steam emissions rose 100-1,500 m above the crater and drifted in multiple directions. Sulfur dioxide emissions averaged 609-2,252 t/d, the higher average of which was measured on 6 September. Slow lava effusion continued advancing on the SE, S, and E flanks, maintaining lengths of 3.4 km, 2.8 km, and 1.1 km, respectively. Rockfall and PDC events generated by collapses along the lava flow margins and at the summit dome deposited material within 4 km of the crater.
Geologic Background. Symmetrical Mayon, which rises above the Albay Gulf NW of Legazpi City, is the most active volcano of the Philippines. The steep upper slopes are capped by a small summit crater. Recorded eruptions since 1616 CE range from Strombolian to basaltic Plinian, with cyclical activity beginning with basaltic eruptions, followed by longer periods of andesitic lava flows. Eruptions occur predominately from the central conduit and have also produced lava flows that travel far down the flanks. Pyroclastic density currents and mudflows have commonly swept down many of the approximately 40 ravines that radiate from the summit and have often damaged populated lowland areas. A violent eruption in 1814 killed more than 1,200 people and devastated several towns.
Information Contacts: Philippine Institute of Volcanology and Seismology (PHIVOLCS), Department of Science and Technology, University of the Philippines Campus, Diliman, Quezon City, Philippines (URL: http://www.phivolcs.dost.gov.ph/); MIROVA (Middle InfraRed Observation of Volcanic Activity), a collaborative project between the Universities of Turin and Florence (Italy) supported by the Centre for Volcanic Risk of the Italian Civil Protection Department (URL: http://www.mirovaweb.it/); Hawai'i Institute of Geophysics and Planetology (HIGP) - MODVOLC Thermal Alerts System, School of Ocean and Earth Science and Technology (SOEST), Univ. of Hawai'i, 2525 Correa Road, Honolulu, HI 96822, USA (URL: http://modis.higp.hawaii.edu/); Copernicus Browser, Copernicus Data Space Ecosystem, European Space Agency (URL: https://dataspace.copernicus.eu/browser/); William Rogers, Legazpi City, Albay Province, Philippines.
Nishinoshima (Japan) — October 2023 Cite this Report
Nishinoshima
Japan
27.247°N, 140.874°E; summit elev. 100 m
All times are local (unless otherwise noted)
Eruption plumes and gas-and-steam plumes during May-August 2023
Nishinoshima, located about 1,000 km S of Tokyo, is a small island in the Ogasawara Arc in Japan. The island is the summit of a massive submarine volcano that has prominent submarine peaks to the S, W, and NE. Eruptions date back to 1973 and the current eruption period began in October 2022. Recent activity has consisted of small ash plumes and fumarolic activity (BGVN 48:07). This report covers activity during May through August 2023, using information from monthly reports of the Japan Meteorological Agency (JMA) monthly reports and satellite data.
Activity during May through June was relatively low. The Japan Coast Guard (JCG) did overflights on 14 and 22 June and reported white gas-and-steam emissions rising 600 m and 1,200 m from the central crater of the pyroclastic cone, respectively (figure 125). In addition, multiple white gas-and-steam emissions rose from the inner rim of the W side of the crater and from the SE flank of the pyroclastic cone. Discolored brown-to-green water was observed around almost the entire perimeter of the island; on 22 June light green discolored water was observed off the S coast of the island.
Observations from the Himawari meteorological satellite confirmed an eruption on 9 and 10 July. An eruption plume rose 1.6 km above the crater and drifted N around 1300 on 9 July. Satellite images acquired at 1420 and 2020 on 9 July and at 0220 on 10 July showed continuing emissions that rose 1.3-1.6 km above the crater and drifted NE and N. The Tokyo VAAC reported that an ash plume seen by a pilot and identified in a satellite image at 0630 on 21 July rose to 3 km altitude and drifted S.
Aerial observations conducted by JCG on 8 August showed a white-and-gray plume rising from the central crater of the pyroclastic cone, and multiple white gas-and-steam emissions were rising from the inner edge of the western crater and along the NW-SE flanks of the island (figure 126). Brown-to-green discolored water was also noted around the perimeter of the island.
Intermittent low-to-moderate power thermal anomalies were recorded in the MIROVA graph (Middle InfraRed Observation of Volcanic Activity), showing an increase in both frequency and power beginning in July (figure 127). This increase in activity coincides with eruptive activity on 9 and 10 July, characterized by eruption plumes. According to the MODVOLC thermal alert algorithm, one thermal hotspot was recorded on 20 July. Weak thermal anomalies were also detected in infrared satellite imagery, accompanied by strong gas-and-steam plumes (figure 128).
Geologic Background. The small island of Nishinoshima was enlarged when several new islands coalesced during an eruption in 1973-74. Multiple eruptions that began in 2013 completely covered the previous exposed surface and continued to enlarge the island. The island is the summit of a massive submarine volcano that has prominent peaks to the S, W, and NE. The summit of the southern cone rises to within 214 m of the ocean surface 9 km SSE.
Information Contacts: Japan Meteorological Agency (JMA), 1-3-4 Otemachi, Chiyoda-ku, Tokyo 100-8122, Japan (URL: http://www.jma.go.jp/jma/indexe.html); Tokyo Volcanic Ash Advisory Center (VAAC), 1-3-4 Otemachi, Chiyoda-ku, Tokyo 100-8122, Japan (URL: http://ds.data.jma.go.jp/svd/vaac/data/); MIROVA (Middle InfraRed Observation of Volcanic Activity), a collaborative project between the Universities of Turin and Florence (Italy) supported by the Centre for Volcanic Risk of the Italian Civil Protection Department (URL: http://www.mirovaweb.it/); Copernicus Browser, Copernicus Data Space Ecosystem, European Space Agency (URL: https://dataspace.copernicus.eu/browser/).
Krakatau (Indonesia) — October 2023 Cite this Report
Krakatau
Indonesia
6.1009°S, 105.4233°E; summit elev. 285 m
All times are local (unless otherwise noted)
White gas-and-steam plumes and occasional ash plumes during May-August 2023
Krakatau is located in the Sunda Strait between Java and Sumatra, Indonesia. Caldera collapse during the catastrophic 1883 eruption destroyed Danan and Perbuwatan cones and left only a remnant of Rakata. The post-collapse cone of Anak Krakatau (Child of Krakatau) was constructed within the 1883 caldera at a point between the former Danan and Perbuwatan cones; it has been the site of frequent eruptions since 1927. The current eruption period began in May 2021 and has recently consisted of Strombolian eruptions and ash plumes (BGVN 48:07). This report describes lower levels of activity consisting of ash and white gas-and-steam plumes during May through August 2023, based on information provided by the Indonesian Center for Volcanology and Geological Hazard Mitigation, referred to as Pusat Vulkanologi dan Mitigasi Bencana Geologi (PVMBG), MAGMA Indonesia, and satellite data.
Activity was relatively low during May and June. Daily white gas-and-steam emissions rose 25-200 m above the crater and drifted in different directions. Five ash plumes were detected at 0519 on 10 May, 1241 on 11 May, 0920 on 12 May, 2320 on 12 May, and at 0710 on 13 May, and rose 1-2.5 km above the crater and drifted SW. A webcam image taken on 12 May showed ejection of incandescent material above the vent. A total of nine ash plumes were detected during 6-11 June: at 1434 and 00220 on 6 and 7 June the ash plumes rose 500 m above the crater and drifted NW, at 1537 on 8 June the ash plume rose 1 km above the crater and drifted SW, at 0746 and at 0846 on 9 June the ash plumes rose 800 m and 3 km above the crater and drifted SW, respectively, at 0423, 1431, and 1750 on 10 June the ash plumes rose 2 km, 1.5 km, and 3.5 km above the crater and drifted NW, respectively, and at 0030 on 11 June an ash plume rose 2 km above the crater and drifted NW. Webcam images taken on 10 and 11 June at 0455 and 0102, respectively, showed incandescent material ejected above the vent. On 19 June an ash plume at 0822 rose 1.5 km above the crater and drifted SE.
Similar low activity of white gas-and-steam emissions and few ash plumes were reported during July and August. Daily white gas-and-steam emissions rose 25-300 m above the crater and drifted in multiple directions. Three ash plumes were reported at 0843, 0851, and 0852 on 20 July that rose 500-2,000 m above the crater and drifted NW.
The MIROVA (Middle InfraRed Observation of Volcanic Activity) graph of MODIS thermal anomaly data showed intermittent low-to-moderate power thermal anomalies during May through August 2023 (figure 140). Although activity was often obscured by weather clouds, a thermal anomaly was visible in an infrared satellite image of the crater on 12 May, accompanied by an eruption plume that drifted SW (figure 141).
Geologic Background. The renowned Krakatau (frequently mis-named as Krakatoa) volcano lies in the Sunda Strait between Java and Sumatra. Collapse of an older edifice, perhaps in 416 or 535 CE, formed a 7-km-wide caldera. Remnants of that volcano are preserved in Verlaten and Lang Islands; subsequently the Rakata, Danan, and Perbuwatan cones were formed, coalescing to create the pre-1883 Krakatau Island. Caldera collapse during the catastrophic 1883 eruption destroyed Danan and Perbuwatan, and left only a remnant of Rakata. This eruption caused more than 36,000 fatalities, most as a result of tsunamis that swept the adjacent coastlines of Sumatra and Java. Pyroclastic surges traveled 40 km across the Sunda Strait and reached the Sumatra coast. After a quiescence of less than a half century, the post-collapse cone of Anak Krakatau (Child of Krakatau) was constructed within the 1883 caldera at a point between the former Danan and Perbuwatan cones. Anak Krakatau has been the site of frequent eruptions since 1927.
Information Contacts: Pusat Vulkanologi dan Mitigasi Bencana Geologi (PVMBG, also known as Indonesian Center for Volcanology and Geological Hazard Mitigation, CVGHM), Jalan Diponegoro 57, Bandung 40122, Indonesia (URL: http://www.vsi.esdm.go.id/); MAGMA Indonesia, Kementerian Energi dan Sumber Daya Mineral (URL: https://magma.esdm.go.id/v1); MIROVA (Middle InfraRed Observation of Volcanic Activity), a collaborative project between the Universities of Turin and Florence (Italy) supported by the Centre for Volcanic Risk of the Italian Civil Protection Department (URL: http://www.mirovaweb.it/); Copernicus Browser, Copernicus Data Space Ecosystem, European Space Agency (URL: https://dataspace.copernicus.eu/browser/).
Villarrica (Chile) — October 2023 Cite this Report
Villarrica
Chile
39.42°S, 71.93°W; summit elev. 2847 m
All times are local (unless otherwise noted)
Strombolian activity, gas-and-ash emissions, and crater incandescence during April-September 2023
Villarrica, in central Chile, consists of a 2-km-wide caldera that formed about 3,500 years ago and is located at the base of the presently active cone at the NW margin of a 6-km-wide caldera. Historical eruptions eruptions date back to 1558 and have been characterized by mild-to-moderate explosive activity with occasional lava effusions. The current eruption period began in December 2014 and has recently consisted of nighttime crater incandescence, ash emissions, and seismicity (BGVN 48:04). This report covers activity during April through September 2023 and describes occasional Strombolian activity, gas-and-ash emissions, and nighttime crater incandescence. Information for this report primarily comes from the Southern Andes Volcano Observatory (Observatorio Volcanológico de Los Andes del Sur, OVDAS), part of Chile's National Service of Geology and Mining (Servicio Nacional de Geología y Minería, SERNAGEOMIN) and satellite data.
Seismicity during April consisted of long period (LP) events and tremor (TRE); a total of 9,413 LP-type events and 759 TR-type events were detected throughout the month. Nighttime crater incandescence persisted and was visible in the degassing column. Sulfur dioxide data was obtained using Differential Absorption Optical Spectroscopy Equipment (DOAS) that showed an average value of 1,450 ± 198 tons per day (t/d) during 1-15 April and 1,129 ± 201 t/d during 16-30 April, with a maximum daily value of 2,784 t/d on 9 April. Gas-and-steam emissions of variable intensities rose above the active crater as high as 1.3 km above the crater on 13 April. Strombolian explosions were not observed and there was a slight decrease in the lava lake level.
There were 14,123 LP-type events and 727 TR-type events detected during May. According to sulfur dioxide measurements taken with DOAS equipment, the active crater emitted an average value of 1,826 ± 482 t/d during 1-15 May and 912 ± 41 t/d during 16-30 May, with a daily maximum value of 5,155 t/d on 13 May. Surveillance cameras showed continuous white gas-and-steam emissions that rose as high as 430 m above the crater on 27 May. Nighttime incandescence illuminated the gas column less than 300 m above the crater rim was and no pyroclastic emissions were reported. A landslide was identified on 13 May on the E flank of the volcano 50 m from the crater rim and extending 300 m away; SERNAGEOMIN noted that this event may have occurred on 12 May. During the morning of 27 and 28 May minor Strombolian explosions characterized by incandescent ejecta were recorded at the crater rim; the last reported Strombolian explosions had occurred at the end of March.
Seismic activity during June consisted of five volcano-tectonic (VT)-type events, 21,606 LP-type events, and 2,085 TR-type events. The average value of sulfur dioxide flux obtained by DOAS equipment was 1,420 ± 217 t/d during 1-15 June and 2,562 ± 804 t/d, with a maximum daily value of 4,810 t/d on 17 June. White gas-and-steam emissions rose less than 480 m above the crater; frequent nighttime crater incandescence was reflected in the degassing plume. On 12 June an emission rose 100 m above the crater and drifted NNW. On 15 June one or several emissions resulted in ashfall to the NE as far as 5.5 km from the crater, based on a Skysat satellite image. Several Strombolian explosions occurred within the crater; activity on 15 June was higher energy and ejected blocks 200-300 m on the NE slope. Surveillance cameras showed white gas-and-steam emissions rising 480 m above the crater on 16 June. On 19 and 24 June low-intensity Strombolian activity was observed, ejecting material as far as 200 m from the center of the crater to the E.
During July, seismicity included 29,319 LP-type events, 3,736 TR-type events, and two VT-type events. DOAS equipment recorded two days of sulfur dioxide emissions of 4,220 t/d and 1,009 t/d on 1 and 13 July, respectively. Constant nighttime incandescence was also recorded and was particularly noticeable when accompanied by eruptive columns on 12 and 16 July. Minor explosive events were detected in the crater. According to Skysat satellite images taken on 12, 13, and 16 July, ashfall deposits were identified 155 m S of the crater. According to POVI, incandescence was visible from two vents on the crater floor around 0336 on 12 July. Gas-and-ash emissions rose as high as 1.2 km above the crater on 13 July and drifted E and NW. A series of gas-and-steam pulses containing some ash deposited material on the upper E flank around 1551 on 13 July. During 16-31 July, average sulfur dioxide emissions of 1,679 ± 406 t/d were recorded, with a maximum daily value of 2,343 t/d on 28 July. Fine ash emissions were also reported on 16, 17, and 23 July.
Seismicity persisted during August, characterized by 27,011 LP-type events, 3,323 TR-type events, and three VT-type events. The average value of sulfur dioxide measurements taken during 1-15 August was 1,642 ± 270 t/d and 2,207 ± 4,549 t/d during 16-31 August, with a maximum daily value of 3,294 t/d on 27 August. Nighttime crater incandescence remained visible in degassing columns. White gas-and-steam emissions rose 480 m above the crater on 6 August. According to a Skysat satellite image from 6 August, ash accumulation was observed proximal to the crater and was mainly distributed toward the E slope. White gas-and-steam emissions rose 320 m above the crater on 26 August. Nighttime incandescence and Strombolian activity that generated ash emissions were reported on 27 August.
Seismicity during September was characterized by five VT-type events, 12,057 LP-type events, and 2,058 TR-type events. Nighttime incandescence persisted. On 2 September an ash emission rose 180 m above the crater and drifted SE at 1643 (figure 125) and a white gas-and-steam plume rose 320 m above the crater. According to the Buenos Aires VAAC, periods of continuous gas-and-ash emissions were visible in webcam images from 1830 on 2 September to 0110 on 3 September. Strombolian activity was observed on 2 September and during the early morning of 3 September, the latter event of which generated an ash emission that rose 60 m above the crater and drifted 100 m from the center of the crater to the NE and SW. Ashfall was reported to the SE and S as far as 750 m from the crater. The lava lake was active during 3-4 September and lava fountaining was visible for the first time since 26 March 2023, according to POVI. Fountains captured in webcam images at 2133 on 3 September and at 0054 on 4 September rose as high as 60 m above the crater rim and ejected material onto the upper W flank. Sulfur dioxide flux of 1,730 t/d and 1,281 t/d was measured on 3 and 4 September, respectively, according to data obtained by DOAS equipment.
Strong Strombolian activity and larger gas-and-ash plumes were reported during 18-20 September. On 18 September activity was also associated with energetic LP-type events and notable sulfur dioxide fluxes (as high as 4,277 t/d). On 19 September Strombolian activity and incandescence were observed. On 20 September at 0914 ash emissions rose 50 m above the crater and drifted SSE, accompanied by Strombolian activity that ejected material less than 100 m SSE, causing fall deposits on that respective flank. SERNAGEOMIN reported that a Planet Scope satellite image taken on 20 September showed the lava lake in the crater, measuring 32 m x 35 m and an area of 0.001 km2. Several ash emissions were recorded at 0841, 0910, 1251, 1306, 1312, 1315, and 1324 on 23 September and rose less than 150 m above the crater. The sulfur dioxide flux value was 698 t/d on 23 September and 1,097 t/d on 24 September. On 24 September the Volcanic Alert Level (VAL) was raised to Orange (the third level on a four-color scale). SENAPRED maintained the Alert Level at Yellow (the middle level on a three-color scale) for the communities of Villarrica, Pucón (16 km N), Curarrehue, and Panguipulli.
During 24-25 September there was an increase in seismic energy (observed at TR-events) and acoustic signals, characterized by 1 VT-type event, 213 LP-type events, and 124 TR-type events. Mainly white gas-and-steam emissions, in addition to occasional fine ash emissions were recorded. During the early morning of 25 September Strombolian explosions were reported and ejected material 250 m in all directions, though dominantly toward the NW. On 25 September the average value of sulfur dioxide flux was 760 t/d. Seismicity during 25-30 September consisted of five VT-type events, 1,937 LP-type events, and 456 TR-type events.
During 25-29 September moderate Strombolian activity was observed and ejected material as far as the crater rim. In addition, ash pulses lasting roughly 50 minutes were observed around 0700 and dispersed ENE. During 26-27 September a TR episode lasted 6.5 hours and was accompanied by discrete acoustic signals. Satellite images from 26 September showed a spatter cone on the crater floor with one vent that measured 10 x 14 m and a smaller vent about 35 m NE of the cone. SERNAGEOMIN reported an abundant number of bomb-sized blocks up to 150 m from the crater, as well as impact marks on the snow, which indicated explosive activity. A low-altitude ash emission was observed drifting NW around 1140 on 28 September, based on webcam images. Between 0620 and 0850 on 29 September an ash emission rose 60 m above the crater and drifted NW. During an overflight taken around 1000 on 29 September scientists observed molten material in the vent, a large accumulation of pyroclasts inside the crater, and energetic degassing, some of which contained a small amount of ash. Block-sized pyroclasts were deposited on the internal walls and near the crater, and a distal ash deposit was also visible. The average sulfur dioxide flux measured on 28 September was 344 t/d. Satellite images taken on 29 September ashfall was deposited roughly 3 km WNW from the crater and nighttime crater incandescence remained visible. The average sulfur dioxide flux value from 29 September was 199 t/d. On 30 September at 0740 a pulsating ash emission rose 1.1 km above the crater and drifted NNW (figure 126). Deposits on the S flank extended as far as 4.5 km from the crater rim, based on satellite images from 30 September.
Infrared MODIS satellite data processed by MIROVA (Middle InfraRed Observation of Volcanic Activity) showed intermittent thermal activity during April through September, with slightly stronger activity detected during late September (figure 127). Small clusters of thermal activity were detected during mid-June, early July, early August, and late September. According to the MODVOLC thermal alert system, a total of four thermal hotspots were detected on 7 July and 3 and 23 September. This activity was also intermittently captured in infrared satellite imagery on clear weather days (figure 128).
Geologic Background. The glacier-covered Villarrica stratovolcano, in the northern Lakes District of central Chile, is ~15 km south of the city of Pucon. A 2-km-wide caldera that formed about 3,500 years ago is located at the base of the presently active, dominantly basaltic to basaltic andesite cone at the NW margin of a 6-km-wide Pleistocene caldera. More than 30 scoria cones and fissure vents are present on the flanks. Plinian eruptions and pyroclastic flows that have extended up to 20 km from the volcano were produced during the Holocene. Lava flows up to 18 km long have issued from summit and flank vents. Eruptions documented since 1558 CE have consisted largely of mild-to-moderate explosive activity with occasional lava effusion. Glaciers cover 40 km2 of the volcano, and lahars have damaged towns on its flanks.
Information Contacts: Servicio Nacional de Geología y Minería (SERNAGEOMIN), Observatorio Volcanológico de Los Andes del Sur (OVDAS), Avda Sta María No. 0104, Santiago, Chile (URL: http://www.sernageomin.cl/); Proyecto Observación Villarrica Internet (POVI) (URL: http://www.povi.cl/); Sistema y Servicio Nacional de Prevención y Repuesta Ante Desastres (SENAPRED), Av. Beauchef 1671, Santiago, Chile (URL: https://web.senapred.cl/); Buenos Aires Volcanic Ash Advisory Center (VAAC), Servicio Meteorológico Nacional-Fuerza Aérea Argentina, 25 de mayo 658, Buenos Aires, Argentina (URL: http://www.smn.gov.ar/vaac/buenosaires/inicio.php); MIROVA (Middle InfraRed Observation of Volcanic Activity), a collaborative project between the Universities of Turin and Florence (Italy) supported by the Centre for Volcanic Risk of the Italian Civil Protection Department (URL: http://www.mirovaweb.it/); Hawai'i Institute of Geophysics and Planetology (HIGP) - MODVOLC Thermal Alerts System, School of Ocean and Earth Science and Technology (SOEST), Univ. of Hawai'i, 2525 Correa Road, Honolulu, HI 96822, USA (URL: http://modis.higp.hawaii.edu/); Copernicus Browser, Copernicus Data Space Ecosystem, European Space Agency (URL: https://dataspace.copernicus.eu/browser/).
Merapi (Indonesia) — October 2023 Cite this Report
Merapi
Indonesia
7.54°S, 110.446°E; summit elev. 2910 m
All times are local (unless otherwise noted)
Frequent incandescent avalanches during April-September 2023
Merapi, located just north of the major city of Yogyakarta in central Java, Indonesia, has had activity within the last 20 years characterized by pyroclastic flows and lahars accompanying growth and collapse of the steep-sided active summit lava dome. The current eruption period began in late December 2020 and has more recently consisted of ash plumes, intermittent incandescent avalanches of material, and pyroclastic flows (BGVN 48:04). This report covers activity during April through September 2023, based on information from Balai Penyelidikan dan Pengembangan Teknologi Kebencanaan Geologi (BPPTKG), the Center for Research and Development of Geological Disaster Technology, a branch of PVMBG which specifically monitors Merapi. Additional information comes from the Pusat Vulkanologi dan Mitigasi Bencana Geologi (PVMBG, also known as Indonesian Center for Volcanology and Geological Hazard Mitigation, CVGHM), MAGMA Indonesia, the Darwin Volcanic Ash Advisory Centre (VAAC), and various satellite data.
Activity during April through September 2023 primarily consisted of incandescent avalanches of material that mainly affected the SW and W flanks and traveled as far as 2.3 km from the summit (table 25) and white gas-and-steam emissions that rose 10-1,000 m above the crater.
Table 25. Monthly summary of avalanches and avalanche distances recorded at Merapi during April through September 2023. The number of reported avalanches does not include instances where possible avalanches were heard but could not be visually confirmed as a result of inclement weather. Data courtesy of BPPTKG (April-September 2023 daily reports).
| Month |
Average number of avalanches per day |
Distance avalanches traveled (m) |
| Apr 2023 |
19 |
1,200-2,000 |
| May 2023 |
22 |
500-2,000 |
| Jun 2023 |
18 |
1,200-2,000 |
| Jul 2023 |
30 |
300-2,000 |
| Aug 2023 |
25 |
400-2,300 |
| Sep 2023 |
23 |
600-2,000 |
BPPTKG reported that during April and May white gas-and-steam emissions rose 10-750 m above the crater, incandescent avalanches descended 500-2,000 m on the SW and W flanks (figure 135). Cloudy weather often prevented clear views of the summit, and sometimes avalanches could not be confirmed. According to a webcam image, a pyroclastic flow was visible on 17 April at 0531. During the week of 28 April and 4 May a pyroclastic flow was reported on the SW flank, traveling up to 2.5 km. According to a drone overflight taken on 17 May the SW lava dome volume was an estimated 2,372,800 cubic meters and the dome in the main crater was an estimated 2,337,300 cubic meters.
During June and July similar activity persisted with white gas-and-steam emissions rising 10-350 m above the crater and frequent incandescent avalanches that traveled 300-2,000 m down the SW, W, and S flanks (figure 136). Based on an analysis of aerial photos taken on 24 June the volume of the SW lava dome was approximately 2.5 million cubic meters. A pyroclastic flow was observed on 5 July that traveled 2.7 km on the SW flank. According to the Darwin VAAC multiple minor ash plumes were identified in satellite images on 19 July that rose to 3.7 km altitude and drifted S and SW. During 22, 25, and 26 July a total of 17 avalanches descended as far as 1.8 km on the S flank.
Frequent white gas-and-steam emissions continued during August and September, rising 10-450 m above the crater. Incandescent avalanches mainly affected the SW and W flanks and traveled 400-2,300 m from the vent (figure 137). An aerial survey conducted on 10 August was analyzed and reported that estimates of the SW dome volume was 2,764,300 cubic meters and the dome in the main crater was 2,369,800 cubic meters.
Frequent and moderate-power thermal activity continued throughout the reporting period, according to a MIROVA (Middle InfraRed Observation of Volcanic Activity) analysis of MODIS satellite data (figure 138). There was an increase in the number of detected anomalies during mid-May. The MODVOLC thermal algorithm recorded a total of 47 thermal hotspots: six during April, nine during May, eight during June, 15 during July, four during August, and five during September. Some of this activity was captured in infrared satellite imagery on clear weather days, sometimes accompanied by incandescent material on the SW flank (figure 139).
Geologic Background. Merapi, one of Indonesia's most active volcanoes, lies in one of the world's most densely populated areas and dominates the landscape immediately north of the major city of Yogyakarta. It is the youngest and southernmost of a volcanic chain extending NNW to Ungaran volcano. Growth of Old Merapi during the Pleistocene ended with major edifice collapse perhaps about 2,000 years ago, leaving a large arcuate scarp cutting the eroded older Batulawang volcano. Subsequent growth of the steep-sided Young Merapi edifice, its upper part unvegetated due to frequent activity, began SW of the earlier collapse scarp. Pyroclastic flows and lahars accompanying growth and collapse of the steep-sided active summit lava dome have devastated cultivated lands on the western-to-southern flanks and caused many fatalities.
Information Contacts: Balai Penyelidikan dan Pengembangan Teknologi Kebencanaan Geologi (BPPTKG), Center for Research and Development of Geological Disaster Technology (URL: http://merapi.bgl.esdm.go.id/, Twitter: @BPPTKG); MAGMA Indonesia, Kementerian Energi dan Sumber Daya Mineral (URL: https://magma.esdm.go.id/v1); Pusat Vulkanologi dan Mitigasi Bencana Geologi (PVMBG, also known as Indonesian Center for Volcanology and Geological Hazard Mitigation, CVGHM), Jalan Diponegoro 57, Bandung 40122, Indonesia (URL: http://www.vsi.esdm.go.id/); Darwin Volcanic Ash Advisory Centre (VAAC), Bureau of Meteorology, Northern Territory Regional Office, PO Box 40050, Casuarina, NT 0811, Australia (URL: http://www.bom.gov.au/info/vaac/); MIROVA (Middle InfraRed Observation of Volcanic Activity), a collaborative project between the Universities of Turin and Florence (Italy) supported by the Centre for Volcanic Risk of the Italian Civil Protection Department (URL: http://www.mirovaweb.it/); Hawai'i Institute of Geophysics and Planetology (HIGP) - MODVOLC Thermal Alerts System, School of Ocean and Earth Science and Technology (SOEST), Univ. of Hawai'i, 2525 Correa Road, Honolulu, HI 96822, USA (URL: http://modis.higp.hawaii.edu/); Copernicus Browser, Copernicus Data Space Ecosystem, European Space Agency (URL: https://dataspace.copernicus.eu/browser/); Øystein Lund Andersen (URL: https://www.oysteinlundandersen.com/, https://twitter.com/oysteinvolcano).
Ebeko
Russia
50.686°N, 156.014°E; summit elev. 1103 m
All times are local (unless otherwise noted)
Moderate explosive activity with ash plumes continued during June-November 2023
Ebeko, located on the N end of Paramushir Island in Russia’s Kuril Islands just S of the Kamchatka Peninsula, consists of three summit craters along a SSW-NNE line at the northern end of a complex of five volcanic cones. Observed eruptions date back to the late 18th century and have been characterized as small-to-moderate explosions from the summit crater, accompanied by intense fumarolic activity. The current eruptive period began in June 2022, consisting of frequent explosions, ash plumes, and thermal activity (BGVN 47:10, 48:06). This report covers similar activity during June-November 2023, based on information from the Kamchatka Volcanic Eruptions Response Team (KVERT) and satellite data.
Moderate explosive activity continued during June-November 2023 (figures 50 and 51). According to visual data from Severo-Kurilsk, explosions sent ash 2-3.5 km above the summit (3-4.5 km altitude) during most days during June through mid-September. Activity after mid-September was slightly weaker, with ash usually reaching less than 2 km above the summit. According to KVERT the volcano in October and November was, with a few exceptions, either quiet or obscured by clouds that prevented satellite observations. KVERT issued Volcano Observatory Notices for Aviation (VONA) on 8 and 12 June, 13 and 22 July, 3 and 21 August, and 31 October warning of potential aviation hazards from ash plumes drifting 3-15 km from the volcano. Based on satellite data, KVERT reported a persistent thermal anomaly whenever weather clouds permitted viewing.
Geologic Background. The flat-topped summit of the central cone of Ebeko volcano, one of the most active in the Kuril Islands, occupies the northern end of Paramushir Island. Three summit craters located along a SSW-NNE line form Ebeko volcano proper, at the northern end of a complex of five volcanic cones. Blocky lava flows extend west from Ebeko and SE from the neighboring Nezametnyi cone. The eastern part of the southern crater contains strong solfataras and a large boiling spring. The central crater is filled by a lake about 20 m deep whose shores are lined with steaming solfataras; the northern crater lies across a narrow, low barrier from the central crater and contains a small, cold crescentic lake. Historical activity, recorded since the late-18th century, has been restricted to small-to-moderate explosive eruptions from the summit craters. Intense fumarolic activity occurs in the summit craters, on the outer flanks of the cone, and in lateral explosion craters.
Information Contacts: Kamchatka Volcanic Eruptions Response Team (KVERT), Far Eastern Branch, Russian Academy of Sciences, 9 Piip Blvd., Petropavlovsk-Kamchatsky, 683006, Russia (URL: http://www.kscnet.ru/ivs/kvert/).
Search Bulletin Archive by Publication Date
Select a month and year from the drop-downs and click "Show Issue" to have that issue displayed in this tab.
The default month and year is the latest issue available.
Bulletin of the Global Volcanism Network - Volume 36, Number 12 (December 2011)
Managing Editor: Richard Wunderman
Additional Reports (Unknown)
South Sandwich Islands, East Scotia Ridge: Study describes submarine venting and eruption in back-arc setting
Gamalama (Indonesia)
Eruption on 4 December 2011; lahars kill four and displace thousands
Guagua Pichincha (Ecuador)
During 2008-2010 the lava dome was stable, occasional phreatic explosions
Ijen (Indonesia)
Sharp increase in seismicity in December 2011 spurs evacuation preparations
Lewotolok (Indonesia)
December 2011-January 2012 seismicity, incandescence, and evacuations
San Cristobal (Nicaragua)
Multiple ash plumes in 2010; several summit explosions without precursors
Seulawah Agam (Indonesia)
172-year repose continues despite seismic crisis of September 2010-July 2011
West Mata (Tonga)
More details on the seamount and witnessed boninite eruptions
Additional Reports (Unknown) — December 2011 Cite this Report
Additional Reports
Unknown
Unknown, Unknown; summit elev. m
All times are local (unless otherwise noted)
South Sandwich Islands, East Scotia Ridge: Study describes submarine venting and eruption in back-arc setting
Rogers and others (2012) reported on the presence of black smokers, diffuse venting, and associated chemosynthetically-driven ecosystems along the East Scotia Ridge (ESR), a geographically isolated back-arc spreading center in the Atlantic sector of the Southern Ocean, near Antarctica (figure 1). To their best knowledge, this was the first time that these features were observed at this location. Rogers and others (2012) noted that, since the discovery of hydrothermal vents along the Galápagos Ridge in 1977 (Corliss and others, 1979), scientists have detected “numerous vent sites and faunal assemblages at many mid-ocean ridges and back-arc basins...an apparent global biogeography of vent organisms with separate provinces.”
Vent sites E2 and E9. The vent site E2 lies just S of the segment axial high (called the Mermaid’s Purse), between 56°5.2’ and 56°5.4’S and between 30°19’ and 30°19.35’W at ~2,600 m depth (figures 2A and 2B). Prominent N-trending structural fabric seen on the seafloor defines a series of staircased, terraced features that are divided by W-facing scarps (figures 2B and 2C). A major steep-sided fissure runs N-S through the center of the site, between longitude 30°19.10’W and 30°19.15’W (figure 2C). The main hydrothermal vents are located at the intersection between this main fissure and a W-striking fault or scarp, consistent with the expected location of active venting on back-arc spreading ridges such as the case at hand.
Relict (extinct) and actively venting chimneys were both resolvable in the high-resolution multibeam bathymetry obtained by the ROV (remotely operated vehicle) Isis, clustered in a band running approximately NW-SE. Numerous volcanic cones and small volcanic craters are also apparent around the vent field. Chimneys of variable morphology were up to 15 m tall and venting clear fluid with a maximum measured temperature of 352.6°C. These formed focused black smokers on contact with cold seawater (figure 3A).
Some of the chimneys have expanded tops with hot (above 300°C) vent fluid emanating from the underside (figure 3B), similar to the flanges found at North East Pacific vents. Diffuse vent flow was observed at a variety of locations, with temperatures varying from 3.5 to 19.9°C, compared with a background temperature of ~0.0°C. Around the periphery of the active high-temperature vents and diffuse flow sites are microbial mats that form a halo around the venting area at E2 (figure 3C).
Site E9 is situated between 60°02.5’ and 60°03.00’S and between 29°59’ and 29°58.6’W, at ~2,400 m depth, amongst relatively flat sheet lavas to the N of a major collapse crater named the Devil’s Punchbowl (figure 2D). The ridge axis is heavily crevassed and fissured, with numerous collapse features, lava drain-back features, and broken pillow lava ridges. Major fissures run NNW-SSE through the site, breaking up an otherwise flat and unvaried terrain (figure 2E).
Topographic highs in the center of the study site lack hydrothermal activity and thus are possibly inactive magma domes. Most active venting appears to lie along one of the smaller fissures, W of a main N-trending feature. Diffuse flow and black smokers line the feature intermittently, but activity becomes reduced and dies away farther S, towards the “Punchbowl.” The chimneys were either emitting high-temperature fluids with a maximum temperature of 382.8°C (Ivory Tower; figure 3E) or had lower temperature diffuse flow, between 5 and 19.9°C (Car Wash vent; figure 3E). Low-temperature diffuse flow was associated with fissures and fine cracks in the sheet lava; the background temperature at E9 varied from -0.11 to -1.3°C.
Deep-sea hydrothermal vents. The ESR vents can be seen in the broader context of deep-sea hydrothermal vents. Hydrothermal vents are essentially hot springs on the ocean floor.
Figure 4 shows the locations of many of the Earth’s known deep-sea hydrothermal vent systems. International Cooperation in Ridge-Crest Studies (InterRidge - a non-profit international organization promoting mid-ocean ridge research) created this map for the International Seabed Authority to show locations of vents that should be protected from exploitation.
References. Bachraty C., Legendre, P., and Desbruyères, D., 2009, Biogeographic relationships among deep-sea hydrothermal vent faunas at global scale, Deep Sea Research, Part I, v. 56, no. 8, p. 1371-1378.
Chown, S.L., 2012, Antarctic marine biodiversity and deep-sea hydrothermal vents, PLoS Biology, v. 10, no. 1, e1001232. doi:10.1371/journal.pbio.1001232 (URL: http://www.plosbiology.org/article).
Corliss, J.B.. Dymond, J., Gordon, L.I., Edmond, J.M., von Herzen, R.P., Ballard, R.D., Green, K., Williams, D., Bainbridge, A., Crane, K., and van Andel, T.H., 1979, Submarine thermal springs on the Galapagos Rift, Science, v. 203, no. 4385, p. 1073-1083. doi: 10.1126/science.203.4385.1073.
InterRidge, 2012, InterRidge Vents Database (URL: http://www.interridge.org/irvents).
Rogers, A.D., Tyler, P.A., Connelly, D.P., Copley, J.T., James, R., Larter, R.D., Linse, K., Mills, R.A., Garabato, A.N., Pancost, R.D., Pearce, D.A., Polunin, N.V.C., German, C.R., Shank, T., Boersch-Supan, P.H., Alker, B.J., Aquilina, A., Bennett, S.A., Clarke, A., Dinley, R.J.J., Graham, A.G.C., Green, D.R.H., Hawkes, J.A., Hepburn, L., Hilario, A., Huvenne, V.A.I., Marsh, L., Ramirez-Llodra, E., Reid, W.D.K., Roterman, C.N., Sweeting, C.J., Thatje, S., and Zwirglmaier, K., 2012, The discovery of new deep-sea hydrothermal vent communities in the Southern Ocean and implications for biogeography, PloS Biology, v. 10, no. 1, e1001234. doi: 10.1371/journal.pbio.1001234 (URL: http://www.plosbiology.org/article).
Geologic Background. Reports of floating pumice from an unknown source, hydroacoustic signals, or possible eruption plumes seen in satellite imagery.
Information Contacts: International Cooperation in Ridge-Crest Studies (InterRidge) (URLs: http://www.interridge.org; http://www.interridge.org/irvents); VENTS Program, Pacific Marine Environmental Laboratory (PMEL), National Oceanographic and Atmospheric Administration (NOAA) (URL: http://www.pmel.noaa.gov/vents/).
Gamalama (Indonesia) — December 2011 Cite this Report
Gamalama
Indonesia
0.81°N, 127.3322°E; summit elev. 1714 m
All times are local (unless otherwise noted)
Eruption on 4 December 2011; lahars kill four and displace thousands
Gamalama volcano, Indonesia, erupted on 4 December 2011, following precursory gas emissions and an increase in seismicity. Lahars killed at least four people, injured dozens, and thousands evacuated. Gamalama had remained at Alert Level 2 (on a scale from 1-4) since 11 May 2008 (BGVN 33:10). Coincident with the beginning of the eruption at 2300 on 4 December, CVGHM raised the Alert Level from 2 to 3, prohibiting access to areas within 2.5 km of the summit. In late January seismicity stabilized and the hazard status fell.
Precursory activity. The Center for Volcanology and Geological Hazard Mitigation (CVGHM) reported white plumes reaching 25 and 150 m above the summit of Gamalama on 1 and 4 December, respectively (figure 1). Clouds obscured the view on 2-3 December. Seismicity also increased during 1-4 December, with a sharp increase in the occurrence of shallow volcanic earthquakes, from one on 3 December to 47 on 4 December (table 2). Tremor was recorded continuously after 2258 on 4 December. At 2300, the Alert Level was raised to 3, and access to Hazard Zone II (areas within 2.5 km of the summit) was prohibited.
Table 2. Precursory seismicity during 1-4 December 2011 at Gamalama. Note the sharp increase of shallow volcanic earthquakes on 4 December 2011; that day, tremor amplitude also increased by at least an order of magnitude. The symbol '--' indicates data not reported. Data courtesy of CVGHM.
| Dates |
Shallow volcanic |
Deep volcanic |
Hot air blasts |
Tremor amplitude |
Teleseismic |
| 01 Dec 2011 |
-- |
-- |
2 |
0.5-1.5 mm |
-- |
| 02 Dec 2011 |
-- |
1 |
5 |
-- |
-- |
| 03 Dec 2011 |
1 |
-- |
3 |
-- |
2 |
| 04 Dec 2011 |
47 |
5 |
5 |
up to 35 mm |
-- |
Eruption. According to the Jakarta Post, most residents living on Gamalama's slopes evacuated, although some insisted on staying in their homes. Most of Ternate and its surrounding villages were covered in ash (figure 2), and ash fall caused the loss of electricity in some areas around the slopes of the volcano. No fatalities were reported.
Over the next 10 days (into mid-December) the Darwin Volcanic Ash Advisory Centre (VAAC) reported ash plumes that rose to 2.1-6.1 km altitude (figures 1 and 4). Some plumes drifted up to 140 km to the S, SE, and E. Three photos of plumes on 12 December appear in figure 3.
Fatal lahar. The Jakarta Post reported that heavy rainfall mobilized fresh ash deposits, spawning a lahar on 27 December 2011 that killed at least four people and injured dozens; many homes were destroyed in the Tubo and Tofure districts, and in locations along the Togorara and Marikurubu rivers (figure 4). On 1 January 2012, the Jakarta Post reported that up to 3,490 people were still being housed in ten different emergency shelters. It also reported that the National Disaster Mitigation Agency (Badan Nasional Penanggulangan Bencana, BNPB) had allocated 1.1 billion Indonesian Rupiah (US$121,000) in emergency funds for the residents affected by the eruption. The Jakarta Globe reported that thousands of farmers had their crops destroyed by ash erupted during December 2011. Agricultural losses are especially devastating, as the island has historically been a major producer of spices such as cloves.
Eruption wanes. Following a month of decreasing activity, CVGHM decreased the Alert Level from 3 to 2 on 24 January 2012. The Alert Level notification cited that, since 23 December 2011, seismicity was dominated by tremor with relatively stable amplitude (0.5-2 mm) and hot air blasts that tended to decrease in occurrence (table 3). During the same period, observed plumes from Gamalama reached 25-100 m above the summit, none of which contained observable ash. In consequence of the lowered Alert Level, access to the summit craters of Gamalama was prohibited, and residents living along rivers descending the flanks of the volcano were advised to be aware of the dangers of lahars. In addition, the North Maluku Province Local Government was asked to prepare evacuation procedures in the case of an increase in activity.
Table 3. Seismicity at Gamalama from 24 December 2011 through 23 January 2012. CVGHM lowered the Alert Level from 3-2 on 24 January. Data courtesy of CVGHM.
| Dates |
Shallow volcanic |
Deep volcanic |
Hot air blasts (per day) |
Tremor amplitude |
| 24-31 Dec 2011 |
9 |
5 |
50 |
0.5-2 mm |
| 01-08 Jan 2012 |
2 |
8 |
73 |
0.5-1.5 mm |
| 08-17 Jan 2012 |
6 |
1 |
28 |
0.5-1 mm |
| 18-23 Jan 2012 |
5 |
5 |
30 |
0.5-1 mm |
Geologic Background. Gamalama is a near-conical stratovolcano that comprises the entire island of Ternate off the western coast of Halmahera, and is one of Indonesia's most active volcanoes. The island was a major regional center in the Portuguese and Dutch spice trade for several centuries, which contributed to the extensive documentation of activity. Three cones, progressively younger to the north, form the summit. Several maars and vents define a rift zone, parallel to the Halmahera island arc, that cuts the volcano; the S-flank Ngade maar formed after about 14,500–13,000 cal. BP (Faral et al., 2022). Eruptions, recorded frequently since the 16th century, typically originated from the summit craters, although flank eruptions have occurred in 1763, 1770, 1775, and 1962-63.
Information Contacts: Center for Volcanology and Geological Hazard Mitigation (CVGHM), Jl. Diponegoro 57, Bandung, West Java, Indonesia, 40 122 (URL: http://www.vsi.esdm.go.id/); Darwin Volcanic Ash Advisory Centre (VAAC), Bureau of Meteorology, Northern Territory Regional Office, PO Box 40050, Casuarina, NT 0811, Australia (URL: http://www.bom.gov.au/info/vaac/); The Jakarta Post, Jl. Palmerah Barat 142-143, Jakarta 10270, Indonesia (URL: http://www.thejakartapost.com/); Associated Press (AP) (URL: http://www.apimages.com/); Andi Rosadi, Volcano Discovery (URL: http://www.volcanodiscovery.com/); Erik Klemetti/Wired (URL: http://www.wired.com/wiredscience/eruptions); Geological Survey of Japan (URL: http://www.gsj.jp/); MapsOf.net (URL: http://mapsof.net/); The Jarkarta Globe, Citra Graha Building, 11th Floor, Suite 1102, Jl. Jend. Gatot Subroto Kav 35-36, Jakarta 12950, Indonesia (URL: http://www.thejakartaglobe.com/).
Guagua Pichincha (Ecuador) — December 2011 Cite this Report
Guagua Pichincha
Ecuador
0.171°S, 78.598°W; summit elev. 4784 m
All times are local (unless otherwise noted)
During 2008-2010 the lava dome was stable, occasional phreatic explosions
This report mainly summarizes information on Guagua Pichincha conveyed in 2008 to 2010 yearly reports by the IG-EPN (Instituto Geofísico Escuela Politécnica Nacional). In broad terms, and with the exceptions of an anomalously high number of emission and explosion signals in 2009, Guagua Pichincha volcanic activity continued to decline since the eruptions during September 1999 to June 2001. Further, the volcano has cooled and crater morphology, as stated in IG-EPN yearly reports, has remained relatively unchanged since 2002 (Samaniego,P, 2006, and 2007-2010 yearly reports). Nevertheless, it is possible for further emissions and explosions to occur as potential hazards to life and property. Especially since Guagua Pichincha (figures 22 and 23) is 11 km from the capital, Quito, a city with a population of over 2.5 million (as estimated by the Metropolitan District of Quito population projection, Directorate of Territorial Planning and Public Services). Our previous report on the volcano (BGVN 32:12) discussed phreatic explosions that occurred in early 2008. This report includes seismic data plots, locations of events on topographic maps and a multi-year seismic table beginning in the year 2005.
During the 2008-2010 reporting interval, the IG yearly reports cited fumarolic emissions, surfurous odors, and noise at various locations within the crater, including the 1660 dome, and the 1981 and 2002 craters. As discussed below, rainfall often correlated with phreatic eruptions during 2008 and 2009.
Seismicity is monitored using five short-period (1 Hz) seismic stations, of which three are single-component stations (GGP, JUA2, YANA) and two are three-components stations (PINE, TERV).
Low seismicity generally prevailed during 2003-2010, with few long-period (LP) and hybrid (hb) earthquake occurrences (figure 24). Compared to 2003 to 2005 the number of volcano-tectonic (VT) earthquakes increased during 2006 to 2010 (figure 24).
During the period from 2005 to 2010 (table 11) the annual number of total seismic events generally remained in the range of several hundred to over 1,700. Seismically detected emission signals (phreatic outbursts) were recorded less than 25 times per year. The number of emissions in 2008 and 2009 were the largest in the years in discussion, 20 and 24 events respectively. At most, several explosions (producing non-juvenile ash found in vicinity of the crater) were recognized each year but three years had zero. More details on the 2008, 2009, and 2010 reports follows.
Table 11. Seismic data for Guagua Pichincha from IG-EPN 2005 to 2010 yearly summaries. Note the explosion column, which was often low, under three per year. IG-EPN attributed the emission cases to phreatic eruptions, in the explosion cases they recognized non-juvenile ash at the crater. The value for emissions in 2009 corrects those in the 2009 IG-EPN report. Data courtesy of IG-EPN.
| Year |
Volcano-tectonic |
Long-period |
Hybrid |
Rockfalls |
Emissions |
Explosions |
Earthquakes in Quito |
| 2005 |
325 |
39 |
8 |
115 |
13 |
2 |
311 |
| 2006 |
811 |
84 |
28 |
174 |
4 |
3 |
162 |
| 2007 |
1274 |
84 |
30 |
83 |
8 |
0 |
84 |
| 2008 |
1531 |
105 |
190 |
107 |
20 |
3 |
62 |
| 2009 |
553 |
195 |
32 |
26 |
24 |
0 |
137 |
| 2010 |
1113 |
196 |
1 |
38 |
3 |
0 |
95 |
2008 seismicity. The three explosion events in 2008 took place on 27 January (two events) and on 5 May (one event). 2008 seismicity remained at a similar level as in 2007, with increased earthquakes in January and May, 326 and 299, respectively (figure 24). These two months had appreciable numbers of located events compared to other months. The locations of events tended to fall along trends to the WNW and NE. The WNW group is distributed in a line that runs from the N of the caldera to the foothills of Pichincha, following the Rumipamba gorge (figure 25a), which deepens towards the E. Epicenters of the NE group fall in a line on and near the caldera (figure 25a).
2009 seismicity. The first half of the year was the most seismically active and ~77% of the total earthquakes occurred then (figure 24). Of the hundreds of events recorded for 2009, only 63 could be located. Their foci occurred below the crater around 7 km depth. Vapor-associated emissions mainly occurred during the first several months of the year (figure 24), coinciding with the rainy season. The highest number of emission events were on 16 February, 7 March, and 11 March.
2010 seismicity. No explosions occurred in 2010. Of the events recorded, 161 were localized near the crater (figure 25c). These recorded events were mainly grouped under the crater and to the NE with a majority of near depths of 7 km. Another group, fewer in number, was located and aligned E of the caldera (figure 25c). IG related emission events to existing heat inside the volcano interacting with groundwater.
Correlation of phreatic explosions and the rainy season. The occurrence of phreatic explosions and emissions appears to be related to the rainy season at the beginning of the year (SEAN 07:06, BGVN 18:02, 24:02, 24:11, 29:06, and 32:12). This behavior was most-recently reported on by the IG in 2008 and 2009. A possible model for the interaction of rain water with the volcanic system can be found in BGVN 24:11.
2008-2010 cooling and morphologic stability. Continued cooling of the dome was indicated by the temperatures recorded in situ from November 2000 to 2005 in the IG 2005 report. It was concluded the dome shows no thermal anomalies. IG 2010 ASTER TIR images are consistent with information from previous years and show continued cooling. In addition to undergoing continual cooling, the crater morphology has remained relatively unchanged since the formation of an additional crater in 2002. The IG concluded that Guagua Pichincha was generally becoming less active over time. However, they noted that it is possible for further emissions and explosions to occur that could possibly threaten Quito.
Reference. Samaniego, P; Robin, C; Monzier, M; Mothes,P; Beate; B; Garcia, 2006, Guagua Pichincha Volcano Holocene and Late Pleistocine Activity, Cities on Volcanoes, Fourth Conference; IAVCEI, Quito Equador, (URL: http://www.igepn.edu.ec/images/collector/collection/biblioteca/guaguapichincha_ field_guide.pdf).
Geologic Background. Guagua Pichincha and the older Pleistocene Rucu Pichincha stratovolcanoes form a broad volcanic massif that rises immediately W of Ecuador's capital city, Quito. A lava dome grew at the head of a 6-km-wide scarp formed during a late-Pleistocene slope failure ~50,000 years ago. Subsequent late-Pleistocene and Holocene eruptions from the central vent consisted of explosive activity with pyroclastic flows accompanied by periodic growth and destruction of the lava dome. Many minor eruptions have been recorded since the mid-1500's; the largest took place in 1660, when ash fell over a 1,000 km radius and accumulated to 30 cm depth in Quito. Pyroclastic flows and surges also occurred, primarily to then W, and affected agricultural activity.
Information Contacts: Instituto Geofísico Escuela Politécnica Nacional (IG-EPN), Apartado 17-01-2759, Quito, Ecuador (URL: http://www.igepn.edu.ec/); Observatorio Vulcanológico Pichincha (OVGGP) (URL: http://www.igepn.edu.ec/index.php/nuestro-blog/item/158).
Ijen (Indonesia) — December 2011 Cite this Report
Ijen
Indonesia
8.058°S, 114.242°E; summit elev. 2769 m
All times are local (unless otherwise noted)
Sharp increase in seismicity in December 2011 spurs evacuation preparations
Ijen, which hosts both the world's largest highly acidic lake and intensive sulfur mining operations, showed increased seismicity and SO2 emissions during October-December 2011. The increased activity caused the Center for Volcanology and Geological Hazard Mitigation (CVGHM) to raise the Alert Level from 1-2 (on a scale from 1-4) on 15 December. The Alert Level was then raised from 2-3 on 18 December following further increases in activity.
1 October-15 December 2011 activity. CVGHM reported increased seismicity beginning in October 2011. Seismicity remained increased, yet more-or-less constant, through 15 December (figure 12a). Shallow volcanic earthquakes showed the greatest increase. The onset of harmonic tremor was reported during the first week of December, and increased tremor amplitude was reported beginning on 5 December.
Measured temperatures of the crater lake waters were mostly stable during October (ranging from 30.6-31.2°C), but showed significant variation and increased maximum temperatures during November and December 2011 (figure 12b). The measured pH of the crater lake waters also showed an increase during October-November, rising from 0.7±0.1 in October to 0.83±0.04 in November.
CVGHM also reported blasts of hot air and smoke that generated small plumes rising to 50-100 m above the peak in October, 50-150 m above the peak in November, and 50-200 m above the peak in December, outlining an increasing trend in the energy of the blasts. Plumes in October and November were reported to be sparse to medium white, while those in December were reported to be white to brown, indicating possible ash content in plumes generated during December.
During 1 October-15 December 2011, the color of the crater lake water remained whitish light green, and bubbling water was observed in the center of the lake. The area of bubbling water measured approximately 5 m in diameter. Clumps of sulphur were reported to coalesce in the center and on the shores of the crater lake. Vegetation in areas around the crater remained healthy.
On 15 December, CVGHM raised the Alert Level to 2, citing increased shallow and deep volcanic seismicity, the onset and increased amplitude of harmonic tremor 10 days prior, and visual observations as cause for concern. The CVGHM report expressed concern about possible phreatic, mud, or ash eruptions, and prohibited access to within 1 km of the crater lake.
Increased SO2 emissions. During the next few days, a sharp increase in shallow and deep volcanic seismicity (figure 12a) was accompanied by increased SO2 emissions. Observation on 17 December revealed the strong smell of sulphurous gases in the vicinity of the crater; so strong, in fact, that the CVGHM reported that measurements of lake water temperatures had become difficult without wearing a mask. The lake waters had changed color from whitish light green to completely white. All observations indicated an increased concentration of SO2 in the crater lake.
On 18 December, CVGHM raised the Alert Level to 3, and prohibited access to within 1.5 km of the crater lake. The Jakarta Post reported that the National Disaster Mitigation Agency (Badan Nasional Penanggulangan Bencana, BNPB) had prepared 466 million Indonesian Rupiah (US$51,260) in disaster-relief funds for the basic needs of evacuees for a two week period in the case that an evacuation occurred.
Geologic Background. The Ijen volcano complex at the eastern end of Java consists of a group of small stratovolcanoes constructed within the 20-km-wide Ijen (Kendeng) caldera. The north caldera wall forms a prominent arcuate ridge, but elsewhere the rim was buried by post-caldera volcanoes, including Gunung Merapi, which forms the high point of the complex. Immediately west of the Gunung Merapi stratovolcano is the historically active Kawah Ijen crater, which contains a nearly 1-km-wide, turquoise-colored, acid lake. Kawah Ijen is the site of a labor-intensive mining operation in which baskets of sulfur are hand-carried from the crater floor. Many other post-caldera cones and craters are located within the caldera or along its rim. The largest concentration of cones forms an E-W zone across the southern side of the caldera. Coffee plantations cover much of the caldera floor; nearby waterfalls and hot springs are tourist destinations.
Information Contacts: Center for Volcanology and Geological Hazard Mitigation (CVGHM), Jl. Diponegoro 57, Bandung, West Java, Indonesia, 40 122 (URL: http://www.vsi.esdm.go.id/); The Jakarta Post, Jl. Palmerah Barat 142-143, Jakarta 10270 (URL: http://www.thejakartapost.com/).
Lewotolok (Indonesia) — December 2011 Cite this Report
Lewotolok
Indonesia
8.274°S, 123.508°E; summit elev. 1431 m
All times are local (unless otherwise noted)
December 2011-January 2012 seismicity, incandescence, and evacuations
Plumes and seismic activity at Lewotolo volcano, Indonesia, increased during December 2011 and early January 2012. Lewotolo has erupted potassic calc-alkaline lavas containing as an accessary phase in vessicle fillings, the rare, complex zirconium-titanium-oxide mineral zirconolite (Ca0.8 Ce0.2 Zr Ti1.5 Fe2+0.3 Nb0.1 Al0.1 O7; de Hoog and van Bergen, 2000). Lewotolo last erupted in 1951. All historical eruptions were small (Volcanic Explosivity Index, VEI 2) with the exception of the first recorded eruption, which took place in 1660 and was as large as VEI 3. According to de Hoog and van Bergen (2000), strong fumarolic activity at the summit of Lewotolo indicates the presence and degassing of a shallow magma chamber.
December 2011-January 2012 activity increase. According to the Center of Volcanology and Geological Hazard Mitigation (CVGHM), Lewotolo produced thick white plumes reaching 50-250 m above the summit during December 2011. Seismicity increased on 31 December, and intensified on 2 January 2012 with tremor commencing at 1400. Accordingly, CVGHM raised the Alert Level from 1 to 2 (on a scale from 1-4) at 1800 on 2 January. Between 1800 and 2300 the same day, the maximum amplitude of recorded seismicity increased, and at 2000, incandescence was noticed at the summit.
At 2330 on 2 January, CVGHM increased the Alert Level to 3. Under the recommendation of CVGHM, access was prohibited within 2 km of Lewotolo (Hazard Zone III, figure 1), and residents in villages SE of the volcano were advised to keep vigilant and secure a safe place to flee to one of the towns to the N, W, or S in the event of an eruption.
Residents decide to evacuate. According to Antara News, evacuations began on 4 January spurred by increased activity of the previous few days, as well as minor ash falling in the villages. Antara News stated that most of the residents went to Lewoleba, the closest city to the volcano (~15 km to the SW of the summit). Of the evacuees in Lewoleba, all but about 50 people were reported to have found temporary housing with other residents of the city.
On 5 January, Channel 6 News reported that around 500 residents had evacuated leaving their homes in villages surrounding Lewotolo. They noted that residents who evacuated did so on their own accord, as the government had not yet called for evacuation. The Deputy District Chief of Lembata, Viktor Mado Watun, said "Black smoke columns are coming out of the mountain's crater, the air is filled with the smell of sulfur while rumbling sounds are heard around the mountain."
According to UCA News on 9 January, the health of the evacuees was cause for concern. Father Philipus da Gomez stated that "there are many refugees who have started suffering from acute respiratory infections."
Alert Level lowered. On 25 January 2012, CVGHM lowered the Alert Level of Lewotolo from 3 to 2 following decreased activity after 2 January. The lowered Alert Level restricted access to the summit craters only. CVGHM stated that the observed seismicity (table 1) showed a declining trend, tending towards normal conditions after 23 January. Visual observation revealed thick, white plumes reaching 400 m above the summit during 2-14 January (and a dim crater glow), and thin white plumes reaching no more than 50 m above the summit during 16-24 January (with no accompanying crater glow).
Table 1. Seismicity at Lewotolo during 3-24 January 2012, showing a declining trend in seismicity prior to CVGHM's lowering of the Alert Level from 3-2 on 25 January. Data courtesy of CVGHM.
| Dates |
Hot-air blasts (avg./day) |
Shallow volcanic |
Deep volcanic |
Local tectonic |
Distant tectonic |
| 03-07 Jan 2012 |
368 |
107 |
28 |
14 |
7 |
| 08-12 Jan 2012 |
349 |
4 |
5 |
2 |
2 |
| 13-17 Jan 2012 |
346 |
3 |
-- |
3 |
-- |
| 18-22 Jan 2012 |
314 |
-- |
1 |
7 |
3 |
| 23-24 Jan 2012 |
308 |
-- |
-- |
4 |
1 |
On 15 January, direct observation of the crater was made, and revealed incandescence in solfataras, a weak sulfur smell, and hissing sounds in both the N and S side of the crater. CVGHM especially noted that the N side of the crater was quite different than when it was last observed in June 2010, when no solfataras were present. Differential Optical Absorption Spectroscopy (DOAS) measurements revealed fluctuating and increasing SO2 flux between 11-90 tons/day during 8-16 January.
References. de Hoog, J.C.M. and van Bergen, M.J., 2000, Volatile-induced transport of HFSE, REE, Th, and U in arc magmas: evidence from zirconolite-bearing vesicles in potassic lavas of Lewotolo volcano (Indonesia), Contributions to Mineralogy and Petrology, v. 139, no. 4, p. 485-502 (DOI: 10.1007/s004100000146).
Geologic Background. The Lewotolok (or Lewotolo) stratovolcano occupies the eastern end of an elongated peninsula extending north into the Flores Sea, connected to Lembata (formerly Lomblen) Island by a narrow isthmus. It is symmetrical when viewed from the north and east. A small cone with a 130-m-wide crater constructed at the SE side of a larger crater forms the volcano's high point. Many lava flows have reached the coastline. Eruptions recorded since 1660 have consisted of explosive activity from the summit crater.
Information Contacts: Center for Volcanology and Geological Hazard Mitigation (CVGHM), Jl. Diponegoro 57, Bandung, West Java, Indonesia, 40 122 (URL: http://www.vsi.esdm.go.id/); Channel 6 News (URL: http://channel6newsonline.com/); Antara News, Wisma ANTARA 19th Floor, Jalan Merdeka Selatan No. 17, Jakarta Pusat (URL: http://www.antaranews.com/); UCA News, Yayasan UCINDO, Gedung Usayana Holding, Lt.3, Jl. Matraman Raya No.87, Jakarta Timur 13140 (URL: http://www.ucanews.com/).
San Cristobal (Nicaragua) — December 2011 Cite this Report
San Cristobal
Nicaragua
12.702°N, 87.004°W; summit elev. 1745 m
All times are local (unless otherwise noted)
Multiple ash plumes in 2010; several summit explosions without precursors
Previously reported activity at San Cristóbal, from April 2006 to June 2010, included ash plumes and degassing (BGVN 35:04). Here we describe several substantial explosions during 2010, in addition to ash plumes that occurred without precursory activity (in 2010 and 2011). Based on Instituto Nicaragüense de Estudios Territoriales (INETER) reports, we compiled significant located seismic events for January 2010 through October 2011 and also present gas monitoring results for May 2010 through September 2011.
INETER prepared an additional report along with their monthly review of volcanic activity in December 2010. They highlighted five distinct explosive episodes at San Cristóbal's summit in April, July, September, and December 2010 and also characterized long-term unrest. During the last few decades, activity at San Cristóbal had been dominated by constant gas emissions, small ash and gas explosions, high seismicity, and specifically tremor. Prior to activity in 2010, large explosions and elevated seismicity had occurred in November 1999 (BGVN 25:02) and more recently in April 2006 (BGVN 31:09 and 35:04). Since that time, there have been smaller explosions and regular degassing.
Earthquake followed by explosion signals in April 2010. In early 2010, San Cristóbal produced increasing amounts of gas. From January through March, temperatures measured from fumaroles within the crater generally increased (figure 18). In April, seismicity was similar to the previous months: frequent tremor episodes, occasional volcanic-tectonic events with low amplitudes, and rare long-period events. On 8 April two earthquakes, ML 3.1 and 2.9, suddenly occurred beneath the S side of the volcano and local residents reported shaking in nearby towns (table 3). Following the largest, shallow earthquake a small explosion was recorded. Another explosion occurred on 18 April but the seismic record was incomplete due to problems with the station. By 27 April, reports from field investigators described quiescence within the crater (BGVN 35:04).
Table 3. The date, local magnitude (ML), and depth to epicenters are listed for significant earthquakes located near San Cristóbal. No locations were determined for January and February 2010 or November and December 2011. Courtesy of INETER.
| Date |
ML |
Depth (km) |
| 09 Mar 2010 |
4.4 |
1 |
| 08 Apr 2010 |
3.1 |
0 |
| 08 Apr 2010 |
2.9 |
23 |
| 09 Apr 2010 |
2.5 |
3 |
| 29 Apr 2010 |
3.7 |
169 |
| 30 May 2010 |
2.6 |
1 |
| 04 Jun 2010 |
2.7 |
2 |
| 18 Sep 2010 |
2.0 |
0 |
| 18 Oct 2010 |
2.1 |
0 |
| 02 Jan 2011 |
2.3 |
2 |
| 10 Jan 2011 |
3.5 |
61 |
| 11 Feb 2011 |
2.2 |
5 |
| 19 Feb 2011 |
2.6 |
2 |
| 01 Apr 2011 |
1.3 |
2 |
| 02 Apr 2011 |
3.2 |
5 |
| 02 Apr 2011 |
3.1 |
5 |
| 02 Apr 2011 |
2.8 |
4 |
| 17 Apr 2011 |
2.8 |
1 |
| 11 Jun 2011 |
2.1 |
2 |
| 24 Jun 2011 |
2.2 |
4 |
| 24 Jul 2011 |
1.7 |
1 |
| 14 Aug 2011 |
2.0 |
2 |
| 02 Oct 2011 |
2.3 |
1 |
| 14 Oct 2011 |
2.5 |
2 |
| 15 Oct 2011 |
2.9 |
2 |
In May and June 2010 San Cristóbal was relatively quiet. Field measurements determined that fumarole temperatures were variable. The 3-station Mini-DOAS array detected relatively low levels of sulfur dioxide; INETER reported 274 tons/day (table 4). Visual observations determined that degassing was more vigorous in June and, while banded tremor had been recorded in May, seismicity was also higher in June. On 15 June, more than 12 hours of tremor were recorded.
Table 4. The average SO2 flux per sampling period in metric tons per day from San Cristóbal measured with Mini-DOAS from May 2010 to September 2011. Courtesy of INETER.
| Month |
Metric Tons/day SO2 |
| May 2010 |
274 |
| Jul 2010 |
1248 |
| Dec 2010 |
460 |
| Jan 2011 |
659 |
| Sep 2011 |
1532 |
Significant ashfall from 2 July explosions. Elevated seismicity continued into July 2010 and was dominated by low-amplitude events. On 2 July an explosion from the summit crater released a low-altitude plume of ash (described as a "mushroom cloud" in news reports) that drifted over villages located W of the volcano. Local residents heard explosions and observed a dense ash plume sustained for ~20 minutes. Ash was accompanied by ejected incandescent blocks (reporters noted that block sizes were up to 10 meters in diameter) that scattered across the summit area and started grass fires. Field investigations by INETER on 24 July found that light ash had remained on foliage and grass and there were charred trees below the summit area. Civil Protection noted that ashfall had reached these towns and districts within a 10 km radius of the crater: Las Grecias, El Piloto, El Chonco, Mokorón, and Villa. Comarca Las Grecias is located WSW of San Cristóbal (figure 19).
Plumes and advisories. On 20 August 2010, a volcanic ash advisory was released for the N sector of San Cristóbal (table 5). The GOES-13 satellite detected a plume of gas and potentially light ash drifting from the summit over 35 km N. No associated activity was detected by local instrumentation that day although 10 minutes of tremor and several volcanic-tectonic (VT) events were recorded on 6 August. INETER field investigators visiting the summit on 22 August 2010 reported strong degassing and frequent rockfalls from the crater rim.
Table 5. Ash plumes from San Cristóbal reported by the Washington Volcanic Ash Advisory Center (VAAC) for June 2010 through August 2011. The 9 June event was the first to occur in 2010 and no additional reports were issued in 2011 after 21 August.
| Date |
Altitude (km) |
Drift |
| 09 Jun 2010 |
3.0 |
WNW |
| 20 Aug 2010 |
3.0 |
N |
| 15 Dec 2010 |
2.1 |
-- |
| 17 Dec 2010 |
3.0 |
N |
| 23 Dec 2010 |
1.8 |
SW |
| 06 Jan 2011 |
2.1 |
SW |
| 13 Jan 2011 |
2.1 |
SW |
| 21 Aug 2011 |
6.1 |
WNW |
Late 2010-early 2011 observations. Seismic activity in September 2010 was sparsely recorded due to intermittent equipment errors (local GPS malfunctioned) but seismicity from 21 September corroborated observations of activity from San Cristóbal. A series of small explosions occurred, beginning early on 21 September. Reports from Civil Defense based in Chinandega described rumbling sounds from the crater (lasting up to 20 minutes). Ashfall reached the regional capital as well as the town of El Viejo to the NW (figure 19).
INETER teams visited San Cristóbal in October and November 2010 and measured fumarole temperatures (figure 18). The team also observed strong gas emissions from the summit. Numerous rockfalls from the crater walls had occurred in October. Some tremor was recorded in October and sporadic seismicity continued into November. On 6 November, one hour of tremor was recorded. Earthquakes occurred more frequently toward the end of the month. Interesting sequences of VT events were recorded that lasted 15-20 minutes with frequencies of 3-5 Hz.
In early December 2010, seismicity gradually increased. Long-period events (LP) dominated the record and some VTs were recorded with frequencies of 1-3 Hz. Without any apparent precursory activity, a small explosion was recorded on 13 December at 0638 (figure 20).
An ash plume was reported by a local pilot at the time of the seismic signature. Elevated seismicity did not occur until after the explosion, when low-frequency tremor appeared in the records. Three subsequent volcanic ash advisories were issued by the Washington VAAC for the area on 15, 17, and 23 December (table 5).
Dense plumes of gas were emitted in early January 2011 and reported by Washington VAAC (table 5). Low-altitude plumes (2.1 km) and cloudless days provided excellent conditions for INETER scientists to detect SO2 flux on 21 January 2011. Traverses under the plume with a mobile Mini-DOAS collected data along points between Chinandega (SW of San Cristóbal) and Las Grecias (to the NW). INETER discussed the slight increase (~200 tons/day since December 2010, table 4) in SO2 in their monthly report and attributed elevated emissions to the general increase in seismicity during the last few months (table 3) and to changes in the volcano's structure.
Throughout 2011, field investigations by INETER included monitoring fumarole temperatures within the summit crater (figure 21). During 2011, temperatures from five separate fumaroles ranged between 50 and 90°C. Similar to measurements taken in 2010, intermittent values were recorded for Fumarole 5 (Fumarole 4 was also intermittent, no measurable value in June). Data collection was not possible in November and measurements in December clustered at comparatively elevated temperatures of 80 and 90°C.
Within the summit crater during 2011, investigators found evidence of rockfalls as well as ground cracks at the crater rim. INETER described gradual accumulation of debris on the crater floor from February through April. During a field visit in May, two small pools of water had appeared within the crater. These features persisted from May through July.
Ash event without unrest. A sudden ash explosion was reported by Chinandega Civil Defense at 1900 on 23 October 2011. Ash fell over Chinandega (the regional capital) as well as El Viejo, El Realejo, and the district of Las Grecias (figure 19). Minor tremor events occurred during the day but signals suggesting explosions were absent. Tremor continued to appear in the seismic record during November through the end of December.
Geologic Background. The San Cristóbal volcanic complex, consisting of five principal volcanic edifices, forms the NW end of the Marrabios Range. The symmetrical 1745-m-high youngest cone, named San Cristóbal (also known as El Viejo), is Nicaragua's highest volcano and is capped by a 500 x 600 m wide crater. El Chonco, with several flank lava domes, is located 4 km W of San Cristóbal; it and the eroded Moyotepe volcano, 4 km NE of San Cristóbal, are of Pleistocene age. Volcán Casita, containing an elongated summit crater, lies immediately east of San Cristóbal and was the site of a catastrophic landslide and lahar in 1998. The Plio-Pleistocene La Pelona caldera is located at the eastern end of the complex. Historical eruptions from San Cristóbal, consisting of small-to-moderate explosive activity, have been reported since the 16th century. Some other 16th-century eruptions attributed to Casita volcano are uncertain and may pertain to other Marrabios Range volcanoes.
Information Contacts: Instituto Nicaragüense de Estudios Territoriales (INETER), Apartado Postal 2110, Managua, Nicaragua (URL: http://www.ineter.gob.ni/); Washington Volcanic Ash Advisory Center (VAAC), Satellite Analysis Branch (SAB), NOAA/NESDIS E/SP23, NOAA Science Center Room 401, 5200 Auth Rd, Camp Springs, MD 20746, USA (URL: http://www.ospo.noaa.gov/Products/atmosphere/vaac/); La Prensa (URL: http://www.laprensa.com.ni/2010/07/04/nacionales/30240); El Nuevo Diario (URL: http://www.elnuevodiario.com.ni/nacionales/78105).
Seulawah Agam (Indonesia) — December 2011 Cite this Report
Seulawah Agam
Indonesia
5.4472°N, 95.6555°E; summit elev. 1309 m
All times are local (unless otherwise noted)
172-year repose continues despite seismic crisis of September 2010-July 2011
Seismicity at Seulawah Agam volcano, Indonesia, caused the Center for Volcanology and Geological Hazard Mitigation (CVGHM) to raise the Alert Level from 1 to 2 (on a scale from 1-4) from 1 September 2010 through 11 July 2011. According to historical records, Seulawah Agam last erupted in 1839, although the likelihood and character of that eruption is in debate.
The summit of Seulawah Agam hosts a forested crater ~400 m wide (figure 1). The volcano also hosts several active fumarole fields, such as those in the van Heutsz crater, which sits on the NNE flank at ~650 m elevation (figure 2).
The hazard zones, as with all other monitored Indonesian volcanoes, concern airborne ejected/explosive material (circular zones delineating areas prone to ash fall and/or pyroclastic bombs) and ground-traveling, topographically controlled processes (irregular shaped zones delineating areas prone to lava flows, pyroclastic flows, and/or lahars); each Hazard Zone level (I-III) thus delineates a circular and an irregular area. At Seulawah Agam, the hazard zones are centered at the summit of the volcano. The van Heutsz crater, however, is located outside of the 2 km radius of Hazard Zone III, but within the topographically prone area of Hazard Zone III.
Seismicity increase. Beginning in April through September 2010 seismicity fluctuated at Seulawah Agam, although increased overall, indicating increased activity of the volcano. The Jakarta Post reported that CVGHM recorded 80 volcanic earthquakes during August 2010, the equivalent of nearly 3 volcanic earthquakes per day. On 1 September, CVGHM raised the Alert Level to 2, and restricted access to areas within 3 km of the summit crater (figure 2).
According to CVGHM, seismicity fluctuated at elevated levels from October 2010 through June 2011. In July, seismicity was still elevated above the baseline during October 2010-June 2011. However, the occurrence of shallow volcanic earthquakes was reduced compared to recent trends (table 2).
Table 2. Seismicity at Seulawah Agam during 1 October 2010-10 July 2011. The Alert Level was lowered from 2 to 1 (on a scale from 1-4) on 11 July 2011. Data courtesy of the Center for Volcanology and Geological Hazard Mitigation (CVGHM).
| Date |
Shallow volcanic |
Deep volcanic |
Local tectonic |
Distant tectonic |
| Oct 2010-May 2011 |
12-65 / month |
28-116 / month |
14-30 / month |
55-138 / month |
| Jun 2011 |
77 / month |
74 / month |
15 / month |
74 / month |
| 01-10 Jul 2011 |
12 / 10 days |
20 / 10 days |
15 / 10 days |
20 / 10 days |
CVGHM also reported that comparison of data from October 2010 and February 2011 indicated a decline in the emission of volcanic gases, a stabilization of the pH of crater waters, and a decrease in the measured temperature of fumaroles. On 11 July 2011, CVGHM lowered the Alert Level to 1, restricting access only to the summit crater.
Geologic Background. Seulawah Agam, near the NW tip of Sumatra, is an extensively forested volcano with a small summit crater. It was constructed within the large Pleistocene Lam Teuba caldera, which also contains a smaller 6 x 8 caldera. The van Heutsz crater is an active fumarolic area on the NNE flank extending about 200 m downslope around 700 m elevation; it does not have the appearance of a volcanic crater. Additional geothermal areas are noted by Marwan et al. (2021). Sapper (1927) and Neumann van Padang (1951 CAVW) listed an explosive eruption in the early 16th century, and the CAVW also listed an eruption from the van Heutsz crater in 1839. However, Rock et al. (1982) found no evidence for historical eruptions. The Volcanological Survey of Indonesia also noted that although no reported eruptions have occurred from the main cone, the NNE-flank activity may have only been hydrothermal.
Information Contacts: Center for Volcanology and Geological Hazard Mitigation (CVGHM), Jl. Diponegoro 57, Bandung, West Java, Indonesia, 40 122 (URL: http://www.vsi.esdm.go.id/); TheJakarta Post, Jl. Palmerah Barat 142-143, Jakarta 10270 (URL: http://www.thejakartapost.com/); Michael Thirnbeck (URL: http://www.flickr.com/photos/thirnbeck/); MapsOf.net (URL: http://mapsof.net/).
West Mata (Tonga) — December 2011 Cite this Report
West Mata
Tonga
15.1°S, 173.75°W; summit elev. -1174 m
All times are local (unless otherwise noted)
More details on the seamount and witnessed boninite eruptions
Scientists first detected signs of eruptions at West Mata, a small active seamount ~200 km SW of Samoa, in 2008 when a particle-rich plume was identified ~175 m above the volcano's summit (BGVN 34:06). An eruption site was located in May 2009 (Resing and others, 2011; BGVN 34:12), and found to be still active in March 2010 (Clague and others, 2011). Thus, as of the beginning of 2012, the W Mata eruption has been ongoing for at least 3 years (since November 2008). This report provides an updated version of the one that first appeared in BGVN 36:12 about West Mata volcano (figure 6).
Baker and others (2012) noted that W Mata volcano, a low effusion rate eruption, was the deepest active submarine eruption ever observed [as of 2011] and had both explosive and effusive phases. Hydrophones moored for two 5-month deployment periods before and after the 2009 seafloor observations recorded variable but continuous explosions, proof that W Mata, like Northwest Rota-1 (in the Mariana islands), is undergoing a lengthy eruption episode. Rubin and others (2012) reported that W Mata represented the deepest witnessed violent submarine eruption to this time (~700 m deeper than currently-erupting NW Rota-1 in the Mariana Islands, BGVN 29:03, 31:05, 33:12, 34:06, and 35:07).
It was previously thought that explosive eruptions, which involve expanding bubbles, shouldn't occur below a depth of ~1 km. Basically, as water pressure increases with depth in the ocean, the ability of gas to come out of solution in the magma and cause eruption is diminished. The suppression of bubbles thus limits explosions, but the depth at which this occurs is called into question. Clague and others (2011) suggest that pyroclastic activity at West Mata occurred to at least 2.2 km depth.
Presenting a list of ocean depths and locations where explosive processes have been documented, Clague and others (2011) gave the following information (presented here omitting their cited references): "...fine clastic debris formed during pyroclastic eruptions along [West Mata's] rift zones, and coarser talus shed from the lava flows, plateaus, and cones, can be traced upslope perpendicular to contours to the rift zones at depths as great as 2,350 m, suggesting that explosive pyroclastic activity on West Mata is common at least this deep, and much deeper than most theoretical models suggest without extraordinary initial volatile contents or accumulation of volatiles. Previous studies suggest that strombolian bubble-burst basalt eruptions occur along the mid-ocean ridge system for volatile-poor mid-ocean ridge basalt at least as deep as 1,600 m deep on Axial Seamount on the Juan de Fuca Ridge, 1,750 m on the mid-Atlantic Ridge near the Azores platform, 3,800 m on the Gorda Ridge, and 4,000-4,116 m deep on the Gakkel Ridge. Deep water strombolian activity of more volatile rich lavas has also been observed at 550-560 m depth on NW Rota-1 in the Marianas arc for basaltic-andesitic lava, and inferred at least as deep as 590 m depth off shore Oahu, 1,300 m at Lōʻihi Seamount, and 4,300 m for volatile-rich strongly alkalic lavas in the North Arch volcanic field. The distribution of clastic debris on West Mata suggests that boninite eruptions can also be pyroclastic much deeper than the activity observed at the active vents near the summit at 1,175-1,200 m depth."
Resing and others (2011) made the following introductory comments (quoted here without most of the references they cited): "Submarine eruptions account for ~75% of Earth's volcanism [White and others, 2006], but the overlying ocean makes their detection and observation difficult. The scientific community has made a concerted effort to study active submarine eruptions since the mid-1980s. Despite these efforts only two active submarine eruptions have been witnessed and studied: NW-1, a much shallower submarine volcano in the Mariana arc, and now West Mata, at 1,200 m depth. Here we describe sampling and video observations of an explosive eruption driven by the release of slab-derived gaseous H2O, CO2 and SO2. The generation of fine-sized clastic materials provides direct evidence for eruptive styles that produce similar materials deeper in the ocean."
Boninites. Resing and others (2011) and Rubin and others (2009) noted that among the first lavas to erupt at the surface from a nascent subduction zone are a type classified as boninites. A boninite sample was collected at W Mata by the ROV Jason during the 2009 cruise (see figures 10 and 11, BGVN 34:12). Boninite is a mafic extrusive rock, an olivine- and bronzite-bearing andesite with little to no feldspar, containing high levels of both magnesium and silica. The rock is typically composed of large crystals of bronzite (pyroxenes) and olivine in a crystallite-rich glassy matrix. These lavas are considered diagnostic of the early stages of subduction, yet, because most preserved and observable subduction systems on continents are old and well-established, boninite lavas had previously only been observed in the ancient geological record.
Resing and others (2011) found that large volumes of gaseous H2O, CO2, and SO2 were emitted, which they suggested are derived from the subducting slab. The volatiles drive explosive eruptions that fragment rocks and generate abundant incandescent magma-skinned bubbles and pillow lavas. Some examples of various eruptive modes observed in West Mata are shown in figure 7. As at other submarine volcanoes, the volatile-rich fluids found at West Mata fuel chemosynthetic biological activity (figures 7g and 7h).
In May 2009, scientists using ROV Jason 2 discovered two sites of active explosive eruption (vents) on the summit of W Mata (Resing and others, 2011). The first vent, Hades, was located on the S end of the summit ridge at ~1,200 m depth, and the second vent, Prometheus, was found ~100 m NE of Hades at 1,174 m depth (located in figure 6b). Figure 7 shows some newly published images from these vents. During a one-week study in 2009, explosive eruptions at both vents were almost continuous with only occasional quiet episodes. Several modes of magmatic gas-driven eruptions were identified and some may have contained significant trapped water. They produced pyroclasts (i.e., spatter, ash and tephra) and abundant fine-grained particulate material composed predominantly of sulfur.
The most spectacular eruptive mode observed during the week occurred when erupting gases stretched molten lava to create incandescent bubbles of ~0.2? to 1-m diameter (figure 7c and 7f ). As the lava bubbles burst they produced fine-grained particle clouds devoid of visible gas bubbles. A hydrophone placed nearby recorded distinctive low-frequency sounds.
In a less explosive eruptive mode, pulses of gas emitted pebble- and sand-size clastics (figure 7b). These formed mounds of debris through which magmatic gases escaped. Observers also saw pyroclasts and fine-grained sulfur (figures 7a-c and 7f).
Another eruptive mode occurred following quiet episodes, when cap rock was pushed aside and incandescent, degassing, molten lava emerged accompanied by low-frequency sound. At other times, the gas passing through the incandescent lava was flame-like in appearance. In both these cases, escaping hot volatiles insulated the incandescent lava from surrounding seawater for prolonged intervals.
The general absence of free gas bubbles at West Mata markedly contrasts with the abundance of bubbles observed at the much shallower (520 m) eruption at NW-Rota. This fits with the diminished ability to form bubbles at depth.
Clague and others (2011) reported that the autonomous underwater vehicle (AUV) D. Allan B conducted high-resolution (1.5-m scale) mapping during the May 2009 expedition to W Mata that helped identify the processes that construct and modify the volcano. In addition, ship-based multibeam sonar bathymetry had been collected over West Mata during expeditions in 1996, 2008, 2009, and 2010, with the results enabling comparisons over a 14-year period.
According to Baker and others (2012), a significant drawback to existing moored arrays is the absence of realtime information, precluding a prompt response to a detected event. This deficiency led to the addition of hydrophones to profiling floats and underwater ocean acoustic gliders. The QUEphone, or Quasi-Eulerian hydrophone, is a new-generation free-floating autonomous hydrophone with a built-in satellite modem and a GPS receiver (Matsumoto and others, 2006). Because it does not have station-holding capability, its main value to response efforts is its potential for rapid deployment by aircraft. Underwater ocean gliders offer a more structured monitoring strategy, as they can be preprogrammed to follow, and repeat, a horizontal and vertical course. Low instrument noise and buoyancy-based drive systems make gliders ideal acoustic monitoring tools, able to navigate around seafloor obstacles and resurface every few hours to transmit data. Matsumoto and others (2011) demonstrated this capability by driving a glider around W Mata volcano and recording the broadband volcanic explosion sounds.
References. Baker, E.T., Chadwick Jr., W.W., Cowen, J.P., Dziak, R.P., Rubin, K.H., and Fornari, D.J., 2012, Hydrothermal discharge during submarine eruptions: The importance of detection, response, and new technology, Oceanography, v. 25, no. 1, pp.128?141 [http://dx.doi.org/10.5670/oceanog.2012.11].
Clague, D.A., Paduan, J.B., Caress, D.W., Thomas, H., Chadwick Jr., W.W., and Merle, S.G., 2011, Volcanic morphology of West Mata Volcano, NE Lau Basin, based on high-resolution bathymetry and depth changes, Geochemistry, Geophysics, Geosystems (G3), v. 12, QOAF03, 21 pp, doi:10.1029/2011GC003791.
Matsumoto, H., Dziak,, R.P., Mellinger, D.K., Fowler, M., Lau, A., Meinig, C., Bumgardner, J., and W. Hannah, 2006, Autonomous hydrophones at NOAA/OSU and a new seafloor sentry system for real-time detection of acoustic events, Oceans 2006, MTS/IEEE?Boston, September 18?21, 2006, IEEE Oceanic Engineering Society, pp. 1-4, doi:.10.1109/OCEANS.2006.307041.
Matsumoto, H., Bohnenstiehl, D.R., Haxel, J.H., Dziak, R.P., and Embley, R.W., 2011, Mapping the sound field of an erupting submarine volcano using an acoustic glider, Journal of the Acoustical Society of America, v. 129, no. 3, pp. EL94?EL99, doi: 10.1121/1.3547720.
Resing, J.A., Rubin, K.H., Embley, R.W., Lupton, J.E., Baker, E.T., Dziak, R.P., Baumberger, T., Lilley, M.D., Huber, J.A., Shank, T.M., Butterfield, D.A., Clague, D.A., Keller, N.S., Merle, S.G., Buck, N.J., Michael, P.J., Soule, A., Caress, D.W., Walker, S.L., Davis, R., Cowen, J.P., Reysenbach, A-L., and Thomas, T., 2011, Active submarine eruption of boninite in the northeastern Lau Basin, Nature Geoscience, v. 4, 9 October 2011, pp. 799?806, doi:10.1038/ngeo1275.
Rubin, K.H., Soule, S.A., Chadwick Jr., W.W., Fornari, D.J., Clague, D.A., Embley, R.W., Baker, E.T., Perfit, M.R., Caress, D.W., and Dziak, R.P., 2012, Volcanic eruptions in the deep sea, Oceanography, v. 25, no. 1.p. 142?157 [http://dx.doi.org/10.5670/oceanog.2012.12].
Geologic Background. West Mata, a submarine volcano rising to within 1,174 m of the ocean surface, is located in the northeastern Lau Basin at the northern end of the Tofua arc, about 200 km SW of Samoa and north of the Curacoa submarine volcano. Discovered during a November 2008 NOAA Vents Program expedition it was found to be producing submarine hydrothermal plumes consistent with recent lava effusion. A return visit in May 2009 documented explosive and effusive activity from two closely spaced vents, one at the summit, and the other on the SW rift zone.
Information Contacts: Joseph A. Resing, NOAA PMEL and Joint Institute for the Study of the Atmosphere and Ocean (JISAO), The University of Washington, 7600 Sand Point Way, NE, Seattle, WA, USA (URL: http://www.pmel.noaa.gov and http://jisao.washington.edu); David A. Clague, Jennifer B. Paduan, David W. Caress, and Hans Thomas, Monterey Bay Aquarium Research Institute (MBARI), Moss Landing, California, USA (URL: http://www.mbari.org); William W. Chadwick Jr., Robert W. Embley, and Susan G. Merle, Hatfield Marine Science Center, Oregon State University and NOAA, Newport, OR, USA (URL: http://www.pmel.noaa.gov); K.H. Rubin, Department of Geology and Geophysics, School of Ocean and Earth Science and Technology (SOEST), University of Hawaii at Monoa, HI, USA (URL: http://www.soest.hawaii.edu/).