Recently Published Bulletin Reports
Erebus (Antarctica) Lava lake remains active; most thermal alerts recorded since 2019
Rincon de la Vieja (Costa Rica) Frequent phreatic explosions during July-December 2023
Bezymianny (Russia) Explosion on 18 October 2023 sends ash plume 8 km high; lava flows and incandescent avalanches
Kilauea (United States) Low-level lava effusions in the lava lake at Halema’uma’u during July-December 2022
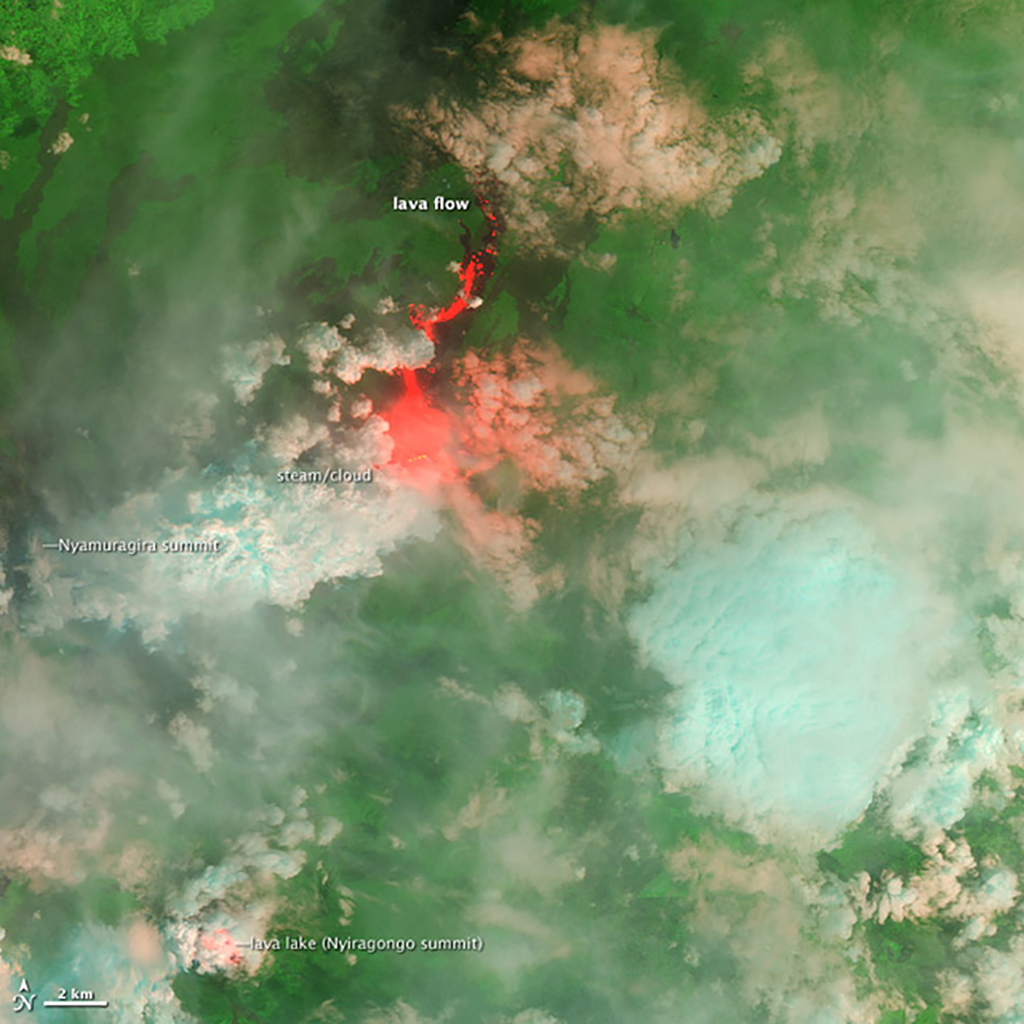
Nyamulagira (DR Congo) Lava flows and thermal activity during May-October 2023
Bagana (Papua New Guinea) Explosions, ash plumes, ashfall, and lava flows during April-September 2023
Mayon (Philippines) Lava flows, pyroclastic flows, ash emissions, and seismicity during April-September 2023
Nishinoshima (Japan) Eruption plumes and gas-and-steam plumes during May-August 2023
Krakatau (Indonesia) White gas-and-steam plumes and occasional ash plumes during May-August 2023
Villarrica (Chile) Strombolian activity, gas-and-ash emissions, and crater incandescence during April-September 2023
Merapi (Indonesia) Frequent incandescent avalanches during April-September 2023
Ebeko (Russia) Moderate explosive activity with ash plumes continued during June-November 2023
Erebus (Antarctica) — January 2024  Cite this Report
Erebus
Antarctica
77.53°S, 167.17°E; summit elev. 3794 m
All times are local (unless otherwise noted)
Lava lake remains active; most thermal alerts recorded since 2019
The lava lake in the summit crater of Erebus has been active since at least 1972. Located in Antarctica overlooking the McMurdo Station on Ross Island, it is the southernmost active volcano on the planet. Because of the remote location, activity is primarily monitored by satellites. This report covers activity during 2023.
The number of thermal alerts recorded by the Hawai'i Institute of Geophysics and Planetology’s MODVOLC Thermal Alerts System increased considerably in 2023 compared to the years 2020-2022 (table 9). In contrast to previous years, the MODIS instruments aboard the Aqua and Terra satellites captured data from Erebus every month during 2023. Consistent with previous years, the lowest number of anomalous pixels were recorded in January, November, and December.
Table 9. Number of monthly MODIS-MODVOLC thermal alert pixels recorded at Erebus during 2017-2023. See BGVN 42:06 for data from 2000 through 2016. The table was compiled using data provided by the HIGP – MODVOLC Thermal Alerts System.
| Year |
Jan |
Feb |
Mar |
Apr |
May |
Jun |
Jul |
Aug |
Sep |
Oct |
Nov |
Dec |
SUM |
| 2017 |
0 |
21 |
9 |
0 |
0 |
1 |
11 |
61 |
76 |
52 |
0 |
3 |
234 |
| 2018 |
0 |
21 |
58 |
182 |
55 |
17 |
137 |
172 |
103 |
29 |
0 |
0 |
774 |
| 2019 |
2 |
21 |
162 |
151 |
55 |
56 |
75 |
53 |
29 |
19 |
1 |
0 |
624 |
| 2020 |
0 |
2 |
16 |
18 |
4 |
4 |
1 |
3 |
18 |
3 |
1 |
6 |
76 |
| 2021 |
0 |
9 |
1 |
0 |
2 |
56 |
46 |
47 |
35 |
52 |
5 |
3 |
256 |
| 2022 |
1 |
13 |
55 |
22 |
15 |
32 |
39 |
19 |
31 |
11 |
0 |
0 |
238 |
| 2023 |
2 |
33 |
49 |
82 |
41 |
32 |
70 |
64 |
42 |
17 |
5 |
11 |
448 |
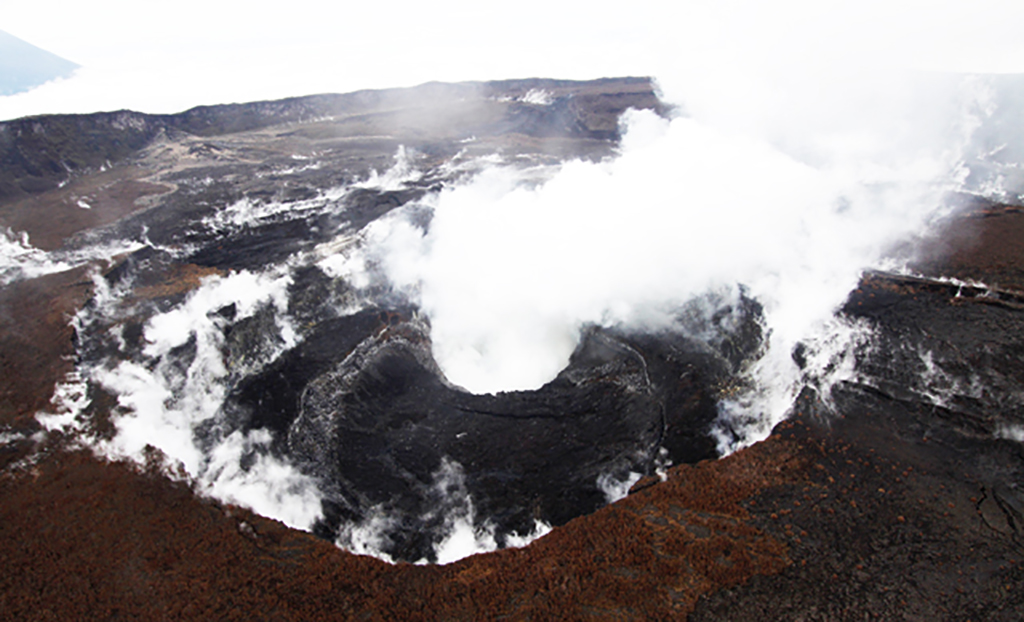
Sentinel-2 infrared images showed one or two prominent heat sources within the summit crater, accompanied by adjacent smaller sources, similar to recent years (see BGVN 46:01, 47:02, and 48:01). A unique image was obtained on 25 November 2023 by the OLI-2 (Operational Land Imager-2) on Landsat 9, showing the upper part of the volcano surrounded by clouds (figure 32).
Geologic Background. Mount Erebus, the world's southernmost historically active volcano, overlooks the McMurdo research station on Ross Island. It is the largest of three major volcanoes forming the crudely triangular Ross Island. The summit of the dominantly phonolitic volcano has been modified by one or two generations of caldera formation. A summit plateau at about 3,200 m elevation marks the rim of the youngest caldera, which formed during the late-Pleistocene and within which the modern cone was constructed. An elliptical 500 x 600 m wide, 110-m-deep crater truncates the summit and contains an active lava lake within a 250-m-wide, 100-m-deep inner crater; other lava lakes are sometimes present. The glacier-covered volcano was erupting when first sighted by Captain James Ross in 1841. Continuous lava-lake activity with minor explosions, punctuated by occasional larger Strombolian explosions that eject bombs onto the crater rim, has been documented since 1972, but has probably been occurring for much of the volcano's recent history.
Information Contacts: Hawai'i Institute of Geophysics and Planetology (HIGP) - MODVOLC Thermal Alerts System, School of Ocean and Earth Science and Technology (SOEST), Univ. of Hawai'i, 2525 Correa Road, Honolulu, HI 96822, USA (URL: http://modis.higp.hawaii.edu/); Copernicus Browser, Copernicus Data Space Ecosystem, European Space Agency (URL: https://dataspace.copernicus.eu/browser/); NASA Earth Observatory, EOS Project Science Office, NASA Goddard Space Flight Center, Goddard, Maryland, USA (URL: https://earthobservatory.nasa.gov/images/152134/erebus-breaks-through).
Rincon de la Vieja (Costa Rica) — January 2024 Cite this Report
Rincon de la Vieja
Costa Rica
10.83°N, 85.324°W; summit elev. 1916 m
All times are local (unless otherwise noted)
Frequent phreatic explosions during July-December 2023
Rincón de la Vieja is a volcanic complex in Costa Rica with a hot convecting acid lake that exhibits frequent weak phreatic explosions, gas-and-steam emissions, and occasional elevated sulfur dioxide levels (BGVN 45:10, 46:03, 46:11). The current eruption period began June 2021. This report covers activity during July-December 2023 and is based on weekly bulletins and occasional daily reports from the Observatorio Vulcanologico Sismologica de Costa Rica-Universidad Nacional (OVSICORI-UNA).
Numerous weak phreatic explosions continued during July-December 2023, along with gas-and-steam emissions and plumes that rose as high as 3 km above the crater rim. Many weekly OVSICORI-UNA bulletins included the previous week's number of explosions and emissions (table 9). For many explosions, the time of explosion was given (table 10). Frequent seismic activity (long-period earthquakes, volcano-tectonic earthquakes, and tremor) accompanied the phreatic activity.
Table 9. Number of reported weekly phreatic explosions and gas-and-steam emissions at Rincón de la Vieja, July-December 2023. Counts are reported for the week before the Weekly Bulletin date; not all reports included these data. Courtesy of OVSICORI-UNA.
| OVSICORI Weekly Bulletin |
Number of explosions |
Number of emissions |
| 28 Jul 2023 |
6 |
14 |
| 4 Aug 2023 |
10 |
12 |
| 1 Sep 2023 |
13 |
11 |
| 22 Sep 2023 |
12 |
13 |
| 29 Sep 2023 |
6 |
11 |
| 6 Oct 2023 |
12 |
5 |
| 13 Oct 2023 |
7 |
9 |
| 20 Oct 2023 |
1 |
15 |
| 27 Oct 2023 |
3 |
23 |
| 3 Nov 2023 |
3 |
10 |
| 17 Nov 2023 |
0 |
Some |
| 24 Nov 2023 |
0 |
14 |
| 8 Dec 2023 |
4 |
16 |
| 22 Dec 2023 |
8 |
18 |
Table 10. Summary of activity at Rincón de la Vieja during July-December 2023. Weak phreatic explosions and gas emissions are noted where the time of explosion was indicated in the weekly or daily bulletins. Height of plumes or emissions are distance above the crater rim. Courtesy of OVSICORI-UNA.
| Date |
Time |
Description of Activity |
| 1 Jul 2023 |
0156 |
Explosion. |
| 2 Jul 2023 |
0305 |
Explosion. |
| 4 Jul 2023 |
0229, 0635 |
Event at 0635 produced a gas-and-steam plume that rose 700 m and drifted W; seen by residents in Liberia (21 km SW). |
| 9 Jul 2023 |
1843 |
Explosion. |
| 21 Jul 2023 |
0705 |
Explosion. |
| 26 Jul 2023 |
1807 |
Explosion. |
| 28 Jul 2023 |
0802 |
Explosion generated a gas-and-steam plume that rose 500 m. |
| 30 Jul 2023 |
1250 |
Explosion. |
| 31 Jul 2023 |
2136 |
Explosion. |
| 11 Aug 2023 |
0828 |
Explosion. |
| 18 Aug 2023 |
1304 |
Explosion. |
| 21 Aug 2023 |
1224 |
Explosion generated gas-and-steam plumes rose 500-600 m. |
| 22 Aug 2023 |
0749 |
Explosion generated gas-and-steam plumes rose 500-600 m. |
| 24 Aug 2023 |
1900 |
Explosion. |
| 25 Aug 2023 |
0828 |
Event produced a steam-and-gas plume that rose 3 km and drifted NW. |
| 27-28 Aug 2023 |
0813 |
Four small events; the event at 0813 on 28 August lasted two minutes and generated a steam-and-gas plume that rose 2.5 km. |
| 1 Sep 2023 |
1526 |
Explosion generated plume that rose 2 km and ejected material onto the flanks. |
| 2-3 Sep 2023 |
- |
Small explosions detected in infrasound data. |
| 4 Sep 2023 |
1251 |
Gas-and-steam plume rose 1 km and drifted W. |
| 7 Nov 2023 |
1113 |
Explosion. |
| 8 Nov 2023 |
0722 |
Explosion. |
| 12 Nov 2023 |
0136 |
Small gas emissions. |
| 14 Nov 2023 |
0415 |
Small gas emissions. |
According to OVSICORI-UNA, during July-October the average weekly sulfur dioxide (SO2) flux ranged from 68 to 240 tonnes/day. However, in mid-November the flux increased to as high as 334 tonnes/day, the highest value measured in recent years. The high SO2 flux in mid-November was also detected by the TROPOMI instrument on the Sentinel-5P satellite (figure 43).
Geologic Background. Rincón de la Vieja, the largest volcano in NW Costa Rica, is a remote volcanic complex in the Guanacaste Range. The volcano consists of an elongated, arcuate NW-SE-trending ridge constructed within the 15-km-wide early Pleistocene Guachipelín caldera, whose rim is exposed on the south side. Sometimes known as the "Colossus of Guanacaste," it has an estimated volume of 130 km3 and contains at least nine major eruptive centers. Activity has migrated to the SE, where the youngest-looking craters are located. The twin cone of Santa María volcano, the highest peak of the complex, is located at the eastern end of a smaller, 5-km-wide caldera and has a 500-m-wide crater. A Plinian eruption producing the 0.25 km3 Río Blanca tephra about 3,500 years ago was the last major magmatic eruption. All subsequent eruptions, including numerous historical eruptions possibly dating back to the 16th century, have been from the prominent active crater containing a 500-m-wide acid lake located ENE of Von Seebach crater.
Information Contacts: Observatorio Vulcanológico Sismológica de Costa Rica-Universidad Nacional (OVSICORI-UNA), Apartado 86-3000, Heredia, Costa Rica (URL: http://www.ovsicori.una.ac.cr/); NASA Global Sulfur Dioxide Monitoring Page, Atmospheric Chemistry and Dynamics Laboratory, NASA Goddard Space Flight Center (NASA/GSFC), 8800 Greenbelt Road, Goddard MD 20771, USA (URL: https://so2.gsfc.nasa.gov/).
Bezymianny (Russia) — November 2023 Cite this Report
Bezymianny
Russia
55.972°N, 160.595°E; summit elev. 2882 m
All times are local (unless otherwise noted)
Explosion on 18 October 2023 sends ash plume 8 km high; lava flows and incandescent avalanches
Bezymianny, located on Russia’s Kamchatka Peninsula, has had eruptions since 1955 characterized by dome growth, explosions, pyroclastic flows, ash plumes, and ashfall. Activity during November 2022-April 2023 included gas-and-steam emissions, lava dome collapses generating avalanches, and persistent thermal activity. Similar eruptive activity continued from May through October 2023, described here based on information from weekly and daily reports of the Kamchatka Volcano Eruptions Response Team (KVERT), notices from Tokyo VAAC (Volcanic Ash Advisory Center), and from satellite data.
Overall activity decreased after the strong period of activity in late March through April 2023, which included ash explosions during 29 March and 7-8 April 2023 that sent plumes as high as 10-12 km altitude, along with dome growth and lava flows (BGVN 48:05). This reduced activity can be seen in the MIROVA thermal detection system graph (figure 56), which was consistent with data from the MODVOLC thermal detection system and with Sentinel-2 satellite images that showed persistent hotspots in the summit crater when conditions allowed observations. A renewed period of strong activity began in mid-October 2023.
Activity increased significantly on 17 October 2023 when large collapses began during 0700-0830 on the E flanks of the lava dome and continued to after 0930 the next day (figure 57). Ash plumes rose to an altitude of 4.5-5 km, extending 220 km NNE by 18 October. A large explosion at 1630 on 18 October produced an ash plume that rose to an altitude of 11 km (8 km above the summit) and drifted NNE and then NW, extending 900 km NW within two days at an altitude of 8 km. Minor ashfall was noted in Kozyrevsk (45 km WNW). At 0820 on 20 October an ash plume was identified in satellite images drifting 100 km ENE at altitudes of 4-4.5 km.
Lava flows and hot avalanches from the dome down the SE flank continued over the next few days, including 23 October when clear conditions allowed good observations (figures 58 and 59). A large thermal anomaly was observed over the volcano through 24 October, and in the summit crater on 30 October (figure 60). Strong fumarolic activity continued, with numerous avalanches and occasional incandescence. By the last week of October, volcanic activity had decreased to a level consistent with that earlier in the reporting period.
Aviation warnings were frequently updated during 17-20 October. KVERT issued a Volcano Observatory Notice for Aviation (VONA) on 17 October at 1419 and 1727 (0219 and 0527 UTC) raising the Aviation Color Code (ACC) from Yellow to Orange (second highest level). The next day, KVERT issued a VONA at 1705 (0505 UTC) raising the ACC to Red (highest level) but lowered it back to Orange at 2117 (0917 UTC). After another decrease to Yellow and back to Orange, the ACC was reduced to Yellow on 20 October at 1204 (0004 UTC). In addition, the Tokyo VAAC issued a series of Volcanic Ash Advisories beginning on 16 October and continuing through 30 October.
Geologic Background. The modern Bezymianny, much smaller than its massive neighbors Kamen and Kliuchevskoi on the Kamchatka Peninsula, was formed about 4,700 years ago over a late-Pleistocene lava-dome complex and an edifice built about 11,000-7,000 years ago. Three periods of intensified activity have occurred during the past 3,000 years. The latest period, which was preceded by a 1,000-year quiescence, began with the dramatic 1955-56 eruption. This eruption, similar to that of St. Helens in 1980, produced a large open crater that was formed by collapse of the summit and an associated lateral blast. Subsequent episodic but ongoing lava-dome growth, accompanied by intermittent explosive activity and pyroclastic flows, has largely filled the 1956 crater.
Information Contacts: Kamchatka Volcanic Eruptions Response Team (KVERT), Far Eastern Branch, Russian Academy of Sciences, 9 Piip Blvd., Petropavlovsk-Kamchatsky, 683006, Russia (URL: http://www.kscnet.ru/ivs/kvert/); Kamchatka Volcanological Station, Kamchatka Branch of Geophysical Survey, (KB GS RAS), Klyuchi, Kamchatka Krai, Russia (URL: http://volkstat.ru/); Tokyo Volcanic Ash Advisory Center (VAAC), 1-3-4 Otemachi, Chiyoda-ku, Tokyo 100-8122, Japan (URL: http://ds.data.jma.go.jp/svd/vaac/data/); Hawai'i Institute of Geophysics and Planetology (HIGP) - MODVOLC Thermal Alerts System, School of Ocean and Earth Science and Technology (SOEST), Univ. of Hawai'i, 2525 Correa Road, Honolulu, HI 96822, USA (URL: http://modis.higp.hawaii.edu/); MIROVA (Middle InfraRed Observation of Volcanic Activity), a collaborative project between the Universities of Turin and Florence (Italy) supported by the Centre for Volcanic Risk of the Italian Civil Protection Department (URL: http://www.mirovaweb.it/); Copernicus Browser, Copernicus Data Space Ecosystem, European Space Agency (URL: https://dataspace.copernicus.eu/browser/).chr
Kilauea (United States) — January 2023 Cite this Report
Kilauea
United States
19.421°N, 155.287°W; summit elev. 1222 m
All times are local (unless otherwise noted)
Low-level lava effusions in the lava lake at Halema’uma’u during July-December 2022
Kīlauea is the southeastern-most volcano in Hawaii and overlaps the E flank of the Mauna Loa volcano. Its East Rift Zone (ERZ) has been intermittently active for at least 2,000 years. An extended eruption period began in January 1983 and was characterized by open lava lakes and lava flows from the summit caldera and the East Rift Zone. During May 2018 magma migrated into the Lower East Rift Zone (LERZ) and opened 24 fissures along a 6-km-long NE-trending fracture zone that produced lava flows traveling in multiple directions. As lava emerged from the fissures, the lava lake at Halema'uma'u drained and explosions sent ash plumes to several kilometers altitude (BGVN 43:10).
The current eruption period started during September 2021 and has recently been characterized by lava effusions, spatter, and sulfur dioxide emissions in the active Halema’uma’u lava lake (BGVN 47:08). Lava effusions, some spatter, and sulfur dioxide emissions have continued during this reporting period of July through December 2022 using daily reports, volcanic activity notices, and abundant photo, map, and video data from the US Geological Survey's (USGS) Hawaiian Volcano Observatory (HVO).
Summary of activity during July-December 2022. Low-level effusions have continued at the western vent of the Halema’uma’u crater during July through early December 2022. Occasional weak ooze-outs (also called lava break outs) would occur along the margins of the crater floor. The overall level of the active lava lake throughout the reporting period gradually increased due to infilling, however it stagnated in mid-September (table 13). During September through November, activity began to decline, though lava effusions persisted at the western vent. By 9 December, the active part of the lava lake had completely crusted over, and incandescence was no longer visible.
Table 13. Summary of measurements taken during overflights at Kīlauea that show a gradual increase in the active lava lake level and the volume of lava effused since 29 September 2021. Lower activity was reported during September-October. Data collected during July-December 2022. Courtesy of HVO.
| Date: |
Level of the active lava lake (m): |
Cumulative volume of lava effused (million cubic meters): |
| 7 Jul 2022 |
130 |
95 |
| 19 Jul 2022 |
133 |
98 |
| 4 Aug 2022 |
136 |
102 |
| 16 Aug 2022 |
137 |
104 |
| 12 Sep 2022 |
143 |
111 |
| 5 Oct 2022 |
143 |
111 |
| 28 Oct 2022 |
143 |
111 |
Activity during July 2022. Lava effusions were reported from the western vent in the Halema’uma’u crater, along with occasional weak ooze-outs along the margins of the crater floor. The height of the lava lake was variable due to deflation-inflation tilt events; for example, the lake level dropped approximately 3-4 m during a summit deflation-inflation event reported on 1 July. Webcam images taken during the night of 6-12 July showed intermittent low-level spattering at the western vent that rose less than 10 m above the vent (figure 519). Measurements made during an overflight on 7 July indicated that the crater floor was infilled about 130 m and that 95 million cubic meters of lava had been effused since 29 September 2021. A single, relatively small lava ooze-out was active to the S of the lava lake. Around midnight on 8 July there were two brief periods of lava overflow onto the lake margins. On 9 July lava ooze-outs were reported near the SE and NE edges of the crater floor and during 10-11 July they occurred near the E, NE, and NW edges. On 16 July crater incandescence was reported, though the ooze-outs and spattering were not visible. On 18 July overnight webcam images showed incandescence in the western vent complex and two ooze-outs were reported around 0000 and 0200 on 19 July. By 0900 there were active ooze-outs along the SW edge of the crater floor. Measurements made from an overflight on 19 July indicated that the crater floor was infilled about 133 m and 98 million cubic meters of lava had erupted since 29 September 2021 (figure 520). On 20 July around 1600 active ooze-outs were visible along the N edge of the crater, which continued through the next day. Extensive ooze-outs occurred along the W margin during 24 July until 1900; on 26 July minor ooze-outs were noted along the N margin. Minor spattering was visible on 29 July along the E margin of the lake. The sulfur dioxide emission rates ranged 650-2,800 tons per day (t/d), the higher of which was measured on 8 July (figure 519).
Activity during August 2022. The eruption continued in the Halema’uma’u crater at the western vent. According to HVO the lava in the active lake remained at the level of the bounding levees. Occasional minor ooze-outs were observed along the margins of the crater floor. Strong nighttime crater incandescence was visible after midnight on 6 August over the western vent cone. During 6-7 August scattered small lava lobes were active along the crater floor and incandescence persisted above the western vent through 9 August. During 7-9 August HVO reported a single lava effusion source was active along the NW margin of the crater floor. Measurements from an overflight on 4 August indicated that the crater floor was infilled about 136 m total and that 102 million cubic meters of lava had been erupted since the start of the eruption. Lava breakouts were reported along the N, NE, E, S, and W margins of the crater during 10-16 August. Another overflight survey conducted on 16 August indicated that the crater floor infilled about 137 m and 104 million cubic meters of lava had been erupted since September 2021. Measured sulfur dioxide emissions rates ranged 1,150-2,450 t/d, the higher of which occurred on 8 August.
Activity during September 2022. During September, lava effusion continued from the western vent into the active lava lake and onto the crater floor. Intermittent minor ooze-outs were reported through the month. A small ooze-out was visible on the W crater floor margin at 0220 on 2 September, which showed decreasing surface activity throughout the day, but remained active through 3 September. On 3 September around 1900 a lava outbreak occurred along the NW margin of the crater floor but had stopped by the evening of 4 September. Field crews monitoring the summit lava lake on 9 September observed spattering on the NE margin of the lake that rose no higher than 10 m, before falling back onto the lava lake crust (figure 521). Overflight measurements on 12 September indicated that the crater floor was infilled a total of 143 m and 111 million cubic meters of lava had been erupted since September 2021. Extensive breakouts in the W and N part of the crater floor were reported at 1600 on 20 September and continued into 26 September. The active part of the lava lake dropped by 10 m while other parts of the crater floor dropped by several meters. Summit tiltmeters recorded a summit seismic swarm of more than 80 earthquakes during 1500-1800 on 21 September, which occurred about 1.5 km below Halema’uma’u; a majority of these were less than Mw 2. By 22 September the active part of the lava lake was infilled about 2 m. On 23 September the western vent areas exhibited several small spatter cones with incandescent openings, along with weak, sporadic spattering (figure 522). The sulfur dioxide emission rate ranged from 930 t/d to 2,000 t/d, the higher of which was measured on 6 September.
Activity during October 2022. Activity during October declined slightly compared to previous months, though lava effusions persisted from the western vent into the active lava lake and onto the crater floor during October (figure 523). Slight variations in the lava lake were noted throughout the month. HVO reported that around 0600 on 3 October the level of the lava lake has lowered slightly. Overflight measurements taken on 5 October indicated that the crater floor was infilled a total of about 143 m and that 111 million cubic meters of lava had been effused since September 2021. During 6-7 October the lake gradually rose 0.5 m. Sulfur dioxide measurements made on 22 October had an emission rate of 700 t/d. Another overflight taken on 28 October showed that there was little to no change in the elevation of the crater floor: the crater floor was infilled a total of 143 m and 111 million cubic meters of lava had erupted since the start of the eruption.
Activity during November 2022. Activity remained low during November, though HVO reported that lava from the western vent continued to effuse into the active lava lake and onto the crater floor throughout the month. The rate of sulfur dioxide emissions during November ranged from 300-600 t/d, the higher amount of which occurred on 9 November.
Activity during December 2022. Similar low activity was reported during December, with lava effusing from the western vent into the active lava lake and onto the crater floor. During 4-5 December the active part of the lava lake was slightly variable in elevation and fluctuated within 1 m. On 9 December HVO reported that lava was no longer erupting from the western vent in the Halema’uma’u crater and that sulfur dioxide emissions had returned to near pre-eruption background levels; during 10-11 December, the lava lake had completely crusted over, and no incandescence was visible (figure 524). Time lapse camera images covering the 4-10 December showed that the crater floor showed weak deflation and no inflation. Some passive events of crustal overturning were reported during 14-15 December, which brought fresh incandescent lava to the lake surface. The sulfur dioxide emission rate was approximately 200 t/d on 14 December. A smaller overturn event on 17 December and another that occurred around 0000 and into the morning of 20 December were also detected. A small seismic swarm was later detected on 30 December.
Geologic Background. Kilauea overlaps the E flank of the massive Mauna Loa shield volcano in the island of Hawaii. Eruptions are prominent in Polynesian legends; written documentation since 1820 records frequent summit and flank lava flow eruptions interspersed with periods of long-term lava lake activity at Halemaumau crater in the summit caldera until 1924. The 3 x 5 km caldera was formed in several stages about 1,500 years ago and during the 18th century; eruptions have also originated from the lengthy East and Southwest rift zones, which extend to the ocean in both directions. About 90% of the surface of the basaltic shield volcano is formed of lava flows less than about 1,100 years old; 70% of the surface is younger than 600 years. The long-term eruption from the East rift zone between 1983 and 2018 produced lava flows covering more than 100 km2, destroyed hundreds of houses, and added new coastline.
Information Contacts: Hawaiian Volcano Observatory (HVO), U.S. Geological Survey, PO Box 51, Hawai'i National Park, HI 96718, USA (URL: http://hvo.wr.usgs.gov/).
Nyamulagira (DR Congo) — November 2023 Cite this Report
Nyamulagira
DR Congo
1.408°S, 29.2°E; summit elev. 3058 m
All times are local (unless otherwise noted)
Lava flows and thermal activity during May-October 2023
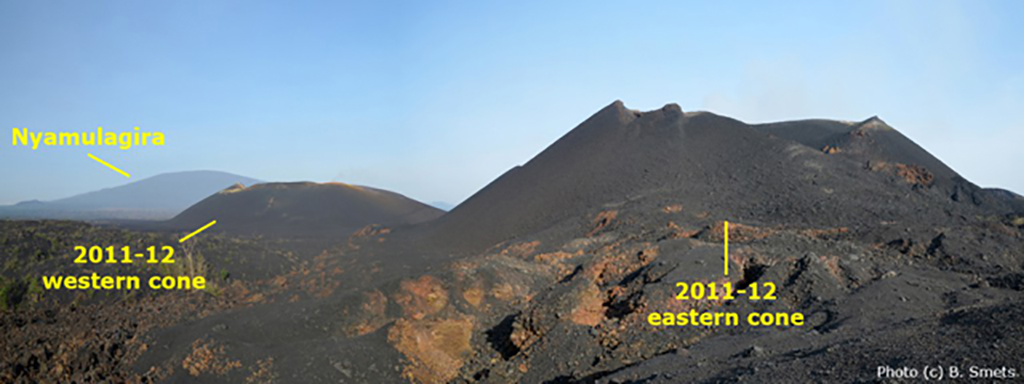
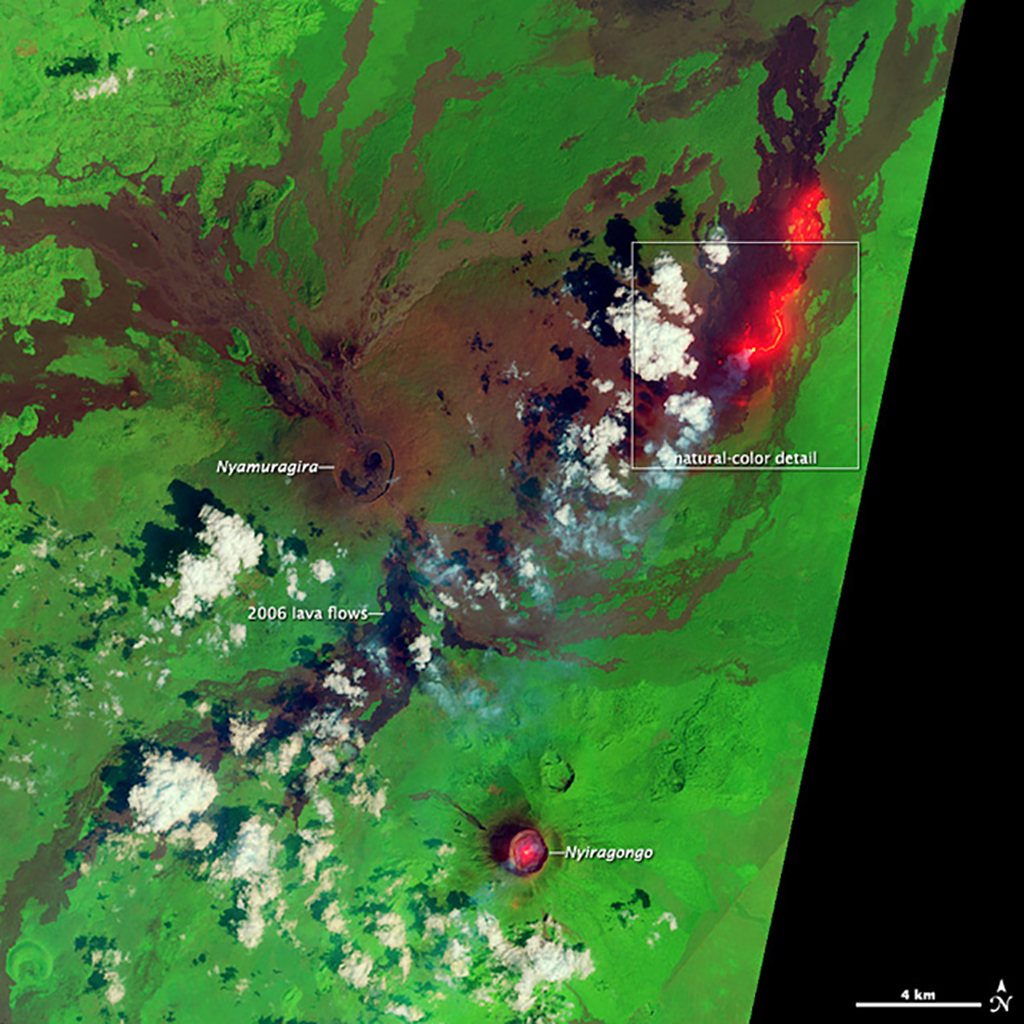
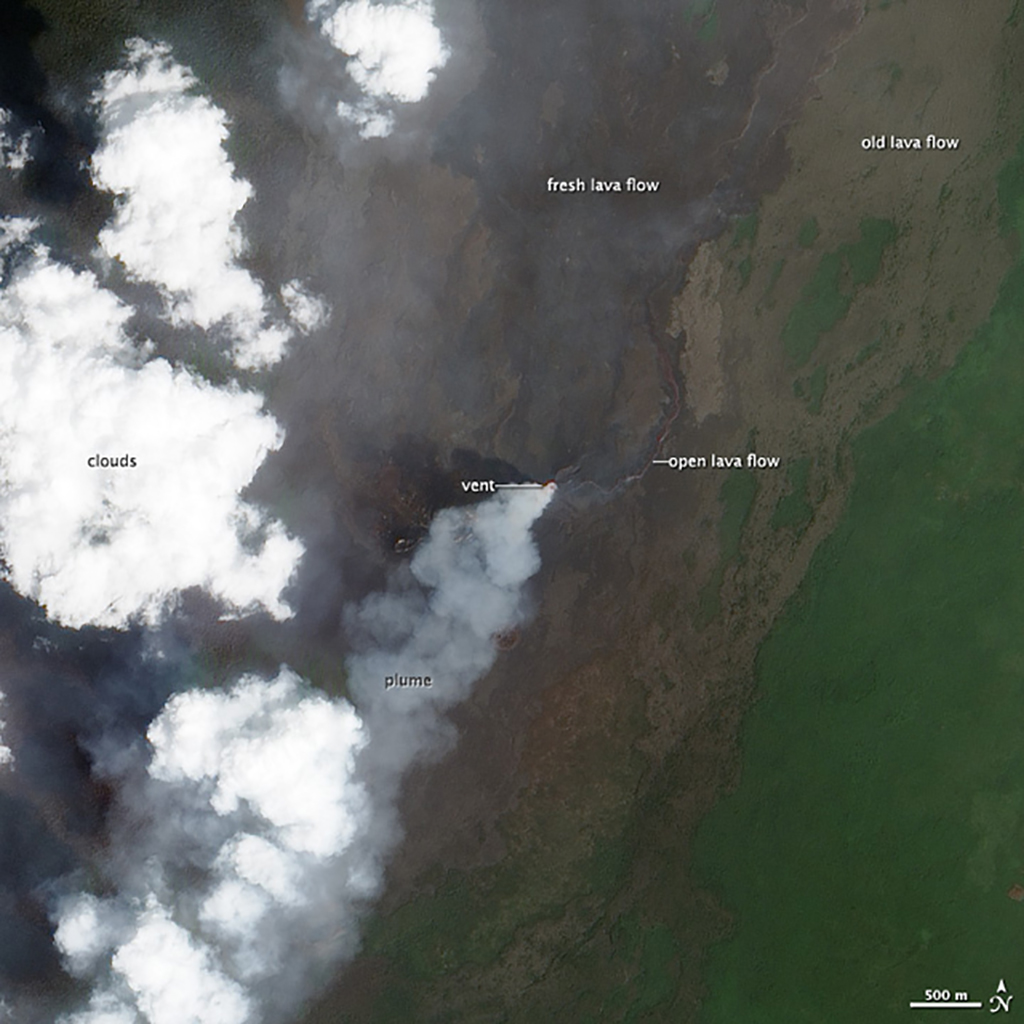
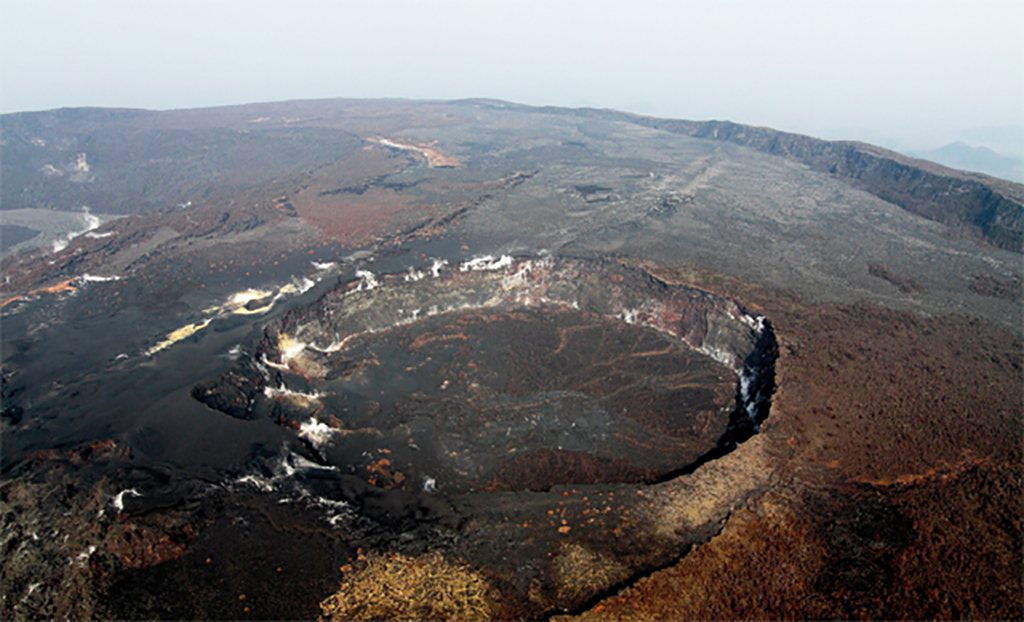
Nyamulagira (also known as Nyamuragira) is a shield volcano in the Democratic Republic of Congo with the summit truncated by a small 2 x 2.3 km caldera with walls up to about 100 m high. Documented eruptions have occurred within the summit caldera, as well as from numerous flank fissures and cinder cones. The current eruption period began in April 2018 and has more recently been characterized by summit crater lava flows and thermal activity (BGVN 48:05). This report describes lava flows and variable thermal activity during May through October 2023, based on information from the Observatoire Volcanologique de Goma (OVG) and various satellite data.
Lava lake activity continued during May. The MIROVA (Middle InfraRed Observation of Volcanic Activity) system recorded moderate-to-strong thermal activity throughout the reporting period; activity was more intense during May and October and relatively weaker from June through September (figure 95). The MODVOLC thermal algorithm, detected a total of 209 thermal alerts. There were 143 hotspots detected during May, eight during June, nine during September, and 49 during October. This activity was also reflected in infrared satellite images, where a lava flow was visible in the NW part of the crater on 7 May and strong activity was seen in the center of the crater on 4 October (figure 96). Another infrared satellite image taken on 12 May showed still active lava flows along the NW margin of the crater. According to OVG lava effusions were active during 7-29 May and moved to the N and NW parts of the crater beginning on 9 May. Strong summit crater incandescence was visible from Goma (27 km S) during the nights of 17, 19, and 20 May (figure 97). On 17 May there was an increase in eruptive activity, which peaked at 0100 on 20 May. Notable sulfur dioxide plumes drifted NW and W during 19-20 May (figure 98). Drone footage acquired in partnership with the USGS (United States Geological Survey) on 20 May captured images of narrow lava flows that traveled about 100 m down the W flank (figure 99). Data from the Rumangabo seismic station indicated a decreasing trend in activity during 17-21 May. Although weather clouds prevented clear views of the summit, a strong thermal signature on the NW flank was visible in an infrared satellite image on 22 May, based on an infrared satellite image. On 28 May the lava flows on the upper W flank began to cool and solidify. By 29 May seismicity returned to levels similar to those recorded before the 17 May increase. Lava effusion continued but was confined to the summit crater; periodic crater incandescence was observed.
Low-level activity was noted during June through October. On 1 June OVG reported that seismicity remained at lower levels and that crater incandescence had been absent for three days, though infrared satellite imagery showed continued lava effusion in the summit crater. The lava flows on the flanks covered an estimated 0.6 km2. Satellite imagery continued to show thermal activity confined to the lava lake through October (figure 96), although no lava flows or significant sulfur dioxide emissions were reported.
Geologic Background. Africa's most active volcano, Nyamulagira (also known as Nyamuragira), is a massive high-potassium basaltic shield about 25 km N of Lake Kivu and 13 km NNW of the steep-sided Nyiragongo volcano. The summit is truncated by a small 2 x 2.3 km caldera that has walls up to about 100 m high. Documented eruptions have occurred within the summit caldera, as well as from the numerous flank fissures and cinder cones. A lava lake in the summit crater, active since at least 1921, drained in 1938, at the time of a major flank eruption. Recent lava flows extend down the flanks more than 30 km from the summit as far as Lake Kivu; extensive lava flows from this volcano have covered 1,500 km2 of the western branch of the East African Rift.
Information Contacts: Observatoire Volcanologique de Goma (OVG), Departement de Geophysique, Centre de Recherche en Sciences Naturelles, Lwiro, D.S. Bukavu, DR Congo; Hawai'i Institute of Geophysics and Planetology (HIGP) - MODVOLC Thermal Alerts System, School of Ocean and Earth Science and Technology (SOEST), Univ. of Hawai'i, 2525 Correa Road, Honolulu, HI 96822, USA (URL: http://modis.higp.hawaii.edu/); MIROVA (Middle InfraRed Observation of Volcanic Activity), a collaborative project between the Universities of Turin and Florence (Italy) supported by the Centre for Volcanic Risk of the Italian Civil Protection Department (URL: http://www.mirovaweb.it/); NASA Global Sulfur Dioxide Monitoring Page, Atmospheric Chemistry and Dynamics Laboratory, NASA Goddard Space Flight Center (NASA/GSFC), 8800 Greenbelt Road, Goddard, Maryland, USA (URL: https://so2.gsfc.nasa.gov/); Copernicus Browser, Copernicus Data Space Ecosystem, European Space Agency (URL: https://dataspace.copernicus.eu/browser/); Charles Balagizi, Goma Volcano Observatory, Departement de Geophysique, Centre de Recherche en Sciences Naturelles, Lwiro, D.S. Bukavu, DR Congo.
Bagana (Papua New Guinea) — October 2023 Cite this Report
Bagana
Papua New Guinea
6.137°S, 155.196°E; summit elev. 1855 m
All times are local (unless otherwise noted)
Explosions, ash plumes, ashfall, and lava flows during April-September 2023
The remote volcano of Bagana is located in central Bougainville Island, Papua New Guinea. Recorded eruptions date back to 1842 and activity has consisted of effusive activity that has built a small lava dome in the summit crater and occasional explosions that produced pyroclastic flows. The most recent eruption has been ongoing since February 2000 and has produced occasional explosions, ash plumes, and lava flows. More recently, activity has been characterized by ongoing effusive activity and ash emissions (BGVN 48:04). This report updates activity from April through September 2023 that has consisted of explosions, ash plumes, ashfall, and lava flows, using information from the Darwin Volcanic Ash Advisory Center (VAAC) and satellite data.
An explosive eruption was reported on 7 July that generated a large gas-and-ash plume to high altitudes and caused significant ashfall in local communities; the eruption plume had reached upper tropospheric (16-18 km altitude) altitudes by 2200, according to satellite images. Sulfur dioxide plumes were detected in satellite images on 8 July and indicated that the plume was likely a mixture of gas, ice, and ash. A report issued by the Autonomous Bougainville Government (ABG) (Torokina District, Education Section) on 10 July noted that significant ash began falling during 2000-2100 on 7 July and covered most areas in the Vuakovi, Gotana (9 km SW), Koromaketo, Laruma (25 km W) and Atsilima (27 km NW) villages. Pyroclastic flows also occurred, according to ground-based reports; small deposits confined to one drainage were inspected by RVO during an overflight on 17 July and were confirmed to be from the 7 July event. Ashfall continued until 10 July and covered vegetation, which destroyed bushes and gardens and contaminated rivers and streams.
RVO reported another eruption on 14 July. The Darwin VAAC stated that an explosive event started around 0830 on 15 July and produced an ash plume that rose to 16.5 km altitude by 1000 and drifted N, according to satellite images. The plume continued to drift N and remained visible through 1900, and by 2150 it had dissipated.
Ashfall likely from both the 7 and 15 July events impacted about 8,111 people in Torokina (20 km SW), including Tsito/Vuakovi, Gotana, Koromaketo, Kenaia, Longkogari, Kenbaki, Piva (13 km SW), and Atsinima, and in the Tsitovi district, according to ABG. Significant ashfall was also reported in Ruruvu (22 km N) in the Wakunai District of Central Bougainville, though the thickness of these deposits could not be confirmed. An evacuation was called for the villages in Wakunai, where heavy ashfall had contaminated water sources; the communities of Ruruvu, Togarau, Kakarapaia, Karauturi, Atao, and Kuritaturi were asked to evacuate to a disaster center at the Wakunai District Station, and communities in Torokina were asked to evacuate to the Piva District station. According to a news article, more than 7,000 people needed temporary accommodations, with about 1,000 people in evacuation shelters. Ashfall had deposited over a broad area, contaminating water supplies, affecting crops, and collapsing some roofs and houses in rural areas. Schools were temporarily shut down. Intermittent ash emissions continued through the end of July and drifted NNW, NW, and SW. Fine ashfall was reported on the coast of Torokina, and ash plumes also drifted toward Laruma and Atsilima.
A small explosive eruption occurred at 2130 on 28 July that ejected material from the crater vents, according to reports from Torokina, in addition to a lava flow that contained two lobes. A second explosion was detected at 2157. Incandescence from the lava flow was visible from Piva as it descended the W flank around 2000 on 29 July (figure 47). The Darwin VAAC reported that a strong thermal anomaly was visible in satellite images during 30-31 July and that ash emissions rose to 2.4 km altitude and drifted WSW on 30 July. A ground report from RVO described localized emissions at 0900 on 31 July.
The Darwin VAAC reported that ash plumes were identified in satellite imagery at 0800 and 1220 on 12 August and rose to 2.1 km and 3 km altitude and drifted NW and W, respectively. A news report stated that aid was sent to more than 6,300 people that were adversely affected by the eruption. Photos taken during 17-19 August showed ash emissions rising no higher than 1 km above the summit and drifting SE. A small explosion generated an ash plume during the morning of 19 August. Deposits from small pyroclastic flows were also captured in the photos. Satellite images captured lava flows and pyroclastic flow deposits. Two temporary seismic stations were installed near Bagana on 17 August at distances of 7 km WSW (Vakovi station) and 11 km SW (Kepox station). The Kepox station immediately started to record continuous, low-frequency background seismicity.
Satellite data. Little to no thermal activity was detected during April through mid-July 2023; only one anomaly was recorded during early April and one during early June, according to MIROVA (Middle InfraRed Observation of Volcanic Activity) data (figure 48). Thermal activity increased in both power and frequency during mid-July through September, although there were still some short gaps in detected activity. MODVOLC also detected increased thermal activity during August; thermal hotspots were detected a total of five times on 19, 20, and 27 August. Weak thermal anomalies were also captured in infrared satellite images on clear weather days throughout the reporting period on 7, 12, and 17 April, 27 May, 1, 6, 16, and 31 July, and 19 September (figure 48); a strong thermal anomaly was visible on 31 July. Distinct sulfur dioxide plumes that drifted generally NW were intermittently captured by the TROPOMI instrument on the Sentinel-5P satellite and sometimes exceeded two Dobson Units (DUs) (figure 49).
Geologic Background. Bagana volcano, in a remote portion of central Bougainville Island, is frequently active. This massive symmetrical cone was largely constructed by an accumulation of viscous andesitic lava flows. The entire edifice could have been constructed in about 300 years at its present rate of lava production. Eruptive activity is characterized by non-explosive effusion of viscous lava that maintains a small lava dome in the summit crater, although occasional explosive activity produces pyroclastic flows. Lava flows with tongue-shaped lobes up to 50 m thick and prominent levees descend the flanks on all sides.
Information Contacts: Rabaul Volcano Observatory (RVO), Geohazards Management Division, Department of Mineral Policy and Geohazards Management (DMPGM), PO Box 3386, Kokopo, East New Britain Province, Papua New Guinea; Darwin Volcanic Ash Advisory Centre (VAAC), Bureau of Meteorology, Northern Territory Regional Office, PO Box 40050, Casuarina, NT 0811, Australia (URL: http://www.bom.gov.au/info/vaac/); MIROVA (Middle InfraRed Observation of Volcanic Activity), a collaborative project between the Universities of Turin and Florence (Italy) supported by the Centre for Volcanic Risk of the Italian Civil Protection Department (URL: http://www.mirovaweb.it/); Hawai'i Institute of Geophysics and Planetology (HIGP) - MODVOLC Thermal Alerts System, School of Ocean and Earth Science and Technology (SOEST), Univ. of Hawai'i, 2525 Correa Road, Honolulu, HI 96822, USA (URL: http://modis.higp.hawaii.edu/); NASA Global Sulfur Dioxide Monitoring Page, Atmospheric Chemistry and Dynamics Laboratory, NASA Goddard Space Flight Center (NASA/GSFC), 8800 Greenbelt Road, Goddard, Maryland, USA (URL: https://so2.gsfc.nasa.gov/); Copernicus Browser, Copernicus Data Space Ecosystem, European Space Agency (URL: https://dataspace.copernicus.eu/browser/); Autonomous Bougainville Government, P.O Box 322, Buka, AROB, PNG (URL: https://abg.gov.pg/); Andrew Tupper (Twitter: @andrewcraigtupp); Simon Carn, Geological and Mining Engineering and Sciences, Michigan Technological University, 1400 Townsend Drive, Houghton, MI 49931, USA (URL: http://www.volcarno.com/, Twitter: @simoncarn); Radio NZ (URL: https://www.rnz.co.nz/news/pacific/494464/more-than-7-000-people-in-bougainville-need-temporary-accommodation-after-eruption); USAID, 1300 Pennsylvania Ave, NW, Washington DC 20004, USA (URL: https://www.usaid.gov/pacific-islands/press-releases/aug-08-2023-united-states-provides-immediate-emergency-assistance-support-communities-affected-mount-bagana-volcanic-eruptions).
Mayon (Philippines) — October 2023 Cite this Report
Mayon
Philippines
13.257°N, 123.685°E; summit elev. 2462 m
All times are local (unless otherwise noted)
Lava flows, pyroclastic flows, ash emissions, and seismicity during April-September 2023
Mayon is located in the Philippines and has steep upper slopes capped by a small summit crater. Historical eruptions date back to 1616 CE that have been characterized by Strombolian eruptions, lava flows, pyroclastic flows, and mudflows. Eruptions mostly originated from a central conduit. Pyroclastic flows and mudflows have commonly descended many of the approximately 40 drainages that surround the volcano. The most recent eruption occurred during June through October 2022 and consisted of lava dome growth and gas-and-steam emissions (BGVN 47:12). A new eruption was reported during late April 2023 and has included lava flows, pyroclastic density currents, ash emissions, and seismicity. This report covers activity during April through September 2023 based on daily bulletins from the Philippine Institute of Volcanology and Seismology (PHIVOLCS).
During April through September 2023, PHIVOLCS reported near-daily rockfall events, frequent volcanic earthquakes, and sulfur dioxide measurements. Gas-and-steam emissions rose 100-900 m above the crater and drifted in different directions. Nighttime crater incandescence was often visible during clear weather and was accompanied by incandescent avalanches of material. Activity notably increased during June when lava flows were reported on the S, SE, and E flanks (figure 52). The MIROVA graph (Middle InfraRed Observation of Volcanic Activity) showed strong thermal activity coincident with these lava flows, which remained active through September (figure 53). According to the MODVOLC thermal algorithm, a total of 110 thermal alerts were detected during the reporting period: 17 during June, 40 during July, 27 during August, and 26 during September. During early June, pyroclastic density currents (PDCs) started to occur more frequently.
Low activity was reported during much of April and May; gas-and-steam emissions rose 100-900 m above the crater and generally drifted in different directions. A total of 52 rockfall events and 18 volcanic earthquakes were detected during April and 147 rockfall events and 13 volcanic events during May. Sulfur dioxide flux measurements ranged between 400-576 tons per day (t/d) during April, the latter of which was measured on 29 April and between 162-343 t/d during May, the latter of which was measured on 13 May.
Activity during June increased, characterized by lava flows, pyroclastic density currents (PDCs), crater incandescence and incandescent rockfall events, gas-and-steam emissions, and continued seismicity. Weather clouds often prevented clear views of the summit, but during clear days, moderate gas-and-steam emissions rose 100-2,500 m above the crater and drifted in multiple directions. A total of 6,237 rockfall events and 288 volcanic earthquakes were detected. The rockfall events often deposited material on the S and SE flanks within 700-1,500 m of the summit crater and ash from the events drifted SW, S, SE, NE, and E. Sulfur dioxide emissions ranged between 149-1,205 t/d, the latter of which was measured on 10 June. Short-term observations from EDM and electronic tiltmeter monitoring indicated that the upper slopes were inflating since February 2023. Longer-term ground deformation parameters based on EDM, precise leveling, continuous GPS, and electronic tilt monitoring indicated that the volcano remained inflated, especially on the NW and SE flanks. At 1000 on 5 June the Volcano Alert Level (VAL) was raised to 2 (on a 0-5 scale). PHIVOLCS noted that although low-level volcanic earthquakes, ground deformation, and volcanic gas emissions indicated unrest, the steep increase in rockfall frequency may indicate increased dome activity.
A total of 151 dome-collapse PDCs occurred during 8-9 and 11-30 June, traveled 500-2,000 m, and deposited material on the S flank within 2 km of the summit crater. During 8-9 June the VAL was raised to 3. At approximately 1947 on 11 June lava flow activity was reported; two lobes traveled within 500 m from the crater and deposited material on the S (Mi-isi), SE (Bonga), and E (Basud) flanks. Weak seismicity accompanied the lava flow and slight inflation on the upper flanks. This lava flow remained active through 30 June, moving down the S and SE flank as far as 2.5 km and 1.8 km, respectively and depositing material up to 3.3 km from the crater. During 15-16 June traces of ashfall from the PDCs were reported in Sitio Buga, Nabonton, City of Ligao and Purok, and San Francisco, Municipality of Guinobatan. During 28-29 June there were two PDCs generated by the collapse of the lava flow front, which generated a light-brown ash plume 1 km high. Satellite monitors detected significant concentrations of sulfur dioxide beginning on 29 June. On 30 June PDCs primarily affected the Basud Gully on the E flank, the largest of which occurred at 1301 and lasted eight minutes, based on the seismic record. Four PDCs generated between 1800 and 2000 that lasted approximately four minutes each traveled 3-4 km on the E flank and generated an ash plume that rose 1 km above the crater and drifted N and NW. Ashfall was recorded in Tabaco City.
Similar strong activity continued during July; slow lava effusion remained active on the S and SE flanks and traveled as far as 2.8 km and 2.8 km, respectively and material was deposited as far as 4 km from the crater. There was a total of 6,983 rockfall events and 189 PDCs that affected the S, SE, and E flanks. The volcano network detected a total of 2,124 volcanic earthquakes. Continuous gas-and-steam emissions rose 200-2,000 m above the crater and drifted in multiple directions. Sulfur dioxide emissions averaged 792-4,113 t/d, the latter of which was measured on 28 July. During 2-4 July three PDCs were generated from the collapse of the lava flow and resulting light brown plumes rose 200-300 m above the crater. Continuous tremor pulses were reported beginning at 1547 on 3 July through 7 July at 1200, at 2300 on 8 July and going through 0300 on 10 July, and at 2300 on 16 July, as recorded by the seismic network. During 6-9 July there were 10 lava flow-collapse-related PDCs that generated light brown plumes 300-500 m above the crater. During 10-11 July light ashfall was reported in some areas of Mabinit, Legazpi City, Budiao and Salvacion, Daraga, and Camalig, Albay. By 18 July the lava flow advanced 600 m on the E flank as well.
During 1733 on 18 July and 0434 on 19 July PHIVOLCS reported 30 “ashing” events, which are degassing events accompanied by audible thunder-like sounds and entrained ash at the crater, which produced short, dark plumes that drifted SW. These events each lasted 20-40 seconds, and plume heights ranged from 150-300 m above the crater, as recorded by seismic, infrasound, visual, and thermal monitors. Three more ashing events occurred during 19-20 July. Short-term observations from electronic tilt and GPS monitoring indicate deflation on the E lower flanks in early July and inflation on the NW middle flanks during the third week of July. Longer-term ground deformation parameters from EDM, precise leveling, continuous GPS, and electronic tilt monitoring indicated that the volcano was still generally inflated relative to baseline levels. A short-lived lava pulse lasted 28 seconds at 1956 on 21 July, which was accompanied by seismic and infrasound signals. By 22 July, the only lava flow that remained active was on the SE flank, and continued to extend 3.4 km, while those on the S and E flanks weakened markedly. One ashing event was detected during 30-31 July, whereas there were 57 detected during 31 July-1 August; according to PHIVOLCS beginning at approximately 1800 on 31 July eruptive activity was dominated by phases of intermittent ashing, as well as increased in the apparent rates of lava effusion from the summit crater. The ashing phases consisted of discrete events recorded as low-frequency volcanic earthquakes (LFVQ) typically 30 seconds in duration, based on seismic and infrasound signals. Gray ash plume rose 100 m above the crater and generally drifted NE. Shortly after these ashing events began, new lava began to effuse rapidly from the crater, feeding the established flowed on the SE, E, and E flanks and generating frequent rockfall events.
Intensified unrest persisted during August. There was a total of 4,141 rockfall events, 2,881 volcanic earthquakes, which included volcanic tremor events, 32 ashing events, and 101 PDCs detected throughout the month. On clear weather days, gas-and-steam emissions rose 300-1,500 m above the crater and drifted in different directions (figure 54). Sulfur dioxide emissions averaged 735-4,756 t/d, the higher value of which was measured on 16 August. During 1-2 August the rate of lava effusion decreased, but continued to feed the flows on the SE, S, and E flanks, maintaining their advances to 3.4 km, 2.8 km, and 1.1 km from the crater, respectively (figure 55). Rockfall and PDCs generated by collapses at the lava flow margins and from the summit dome deposited material within 4 km of the crater. During 3-4 August there were 10 tremor events detected that lasted 1-4 minutes. Short-lived lava pulse lasted 35 seconds and was accompanied by seismic and infrasound signals at 0442 on 6 August. Seven collapses were recorded at the front of the lava flow during 12-14 August.
During September, similar activity of slow lava effusion, PDCs, gas-and-steam emissions, and seismicity continued. There was a total of 4,452 rockfall events, 329 volcanic earthquakes, which included volcanic tremor events, two ashing events, and 85 PDCs recorded throughout the month. On clear weather days, gas-and-steam emissions rose 100-1,500 m above the crater and drifted in multiple directions. Sulfur dioxide emissions averaged 609-2,252 t/d, the higher average of which was measured on 6 September. Slow lava effusion continued advancing on the SE, S, and E flanks, maintaining lengths of 3.4 km, 2.8 km, and 1.1 km, respectively. Rockfall and PDC events generated by collapses along the lava flow margins and at the summit dome deposited material within 4 km of the crater.
Geologic Background. Symmetrical Mayon, which rises above the Albay Gulf NW of Legazpi City, is the most active volcano of the Philippines. The steep upper slopes are capped by a small summit crater. Recorded eruptions since 1616 CE range from Strombolian to basaltic Plinian, with cyclical activity beginning with basaltic eruptions, followed by longer periods of andesitic lava flows. Eruptions occur predominately from the central conduit and have also produced lava flows that travel far down the flanks. Pyroclastic density currents and mudflows have commonly swept down many of the approximately 40 ravines that radiate from the summit and have often damaged populated lowland areas. A violent eruption in 1814 killed more than 1,200 people and devastated several towns.
Information Contacts: Philippine Institute of Volcanology and Seismology (PHIVOLCS), Department of Science and Technology, University of the Philippines Campus, Diliman, Quezon City, Philippines (URL: http://www.phivolcs.dost.gov.ph/); MIROVA (Middle InfraRed Observation of Volcanic Activity), a collaborative project between the Universities of Turin and Florence (Italy) supported by the Centre for Volcanic Risk of the Italian Civil Protection Department (URL: http://www.mirovaweb.it/); Hawai'i Institute of Geophysics and Planetology (HIGP) - MODVOLC Thermal Alerts System, School of Ocean and Earth Science and Technology (SOEST), Univ. of Hawai'i, 2525 Correa Road, Honolulu, HI 96822, USA (URL: http://modis.higp.hawaii.edu/); Copernicus Browser, Copernicus Data Space Ecosystem, European Space Agency (URL: https://dataspace.copernicus.eu/browser/); William Rogers, Legazpi City, Albay Province, Philippines.
Nishinoshima (Japan) — October 2023 Cite this Report
Nishinoshima
Japan
27.247°N, 140.874°E; summit elev. 100 m
All times are local (unless otherwise noted)
Eruption plumes and gas-and-steam plumes during May-August 2023
Nishinoshima, located about 1,000 km S of Tokyo, is a small island in the Ogasawara Arc in Japan. The island is the summit of a massive submarine volcano that has prominent submarine peaks to the S, W, and NE. Eruptions date back to 1973 and the current eruption period began in October 2022. Recent activity has consisted of small ash plumes and fumarolic activity (BGVN 48:07). This report covers activity during May through August 2023, using information from monthly reports of the Japan Meteorological Agency (JMA) monthly reports and satellite data.
Activity during May through June was relatively low. The Japan Coast Guard (JCG) did overflights on 14 and 22 June and reported white gas-and-steam emissions rising 600 m and 1,200 m from the central crater of the pyroclastic cone, respectively (figure 125). In addition, multiple white gas-and-steam emissions rose from the inner rim of the W side of the crater and from the SE flank of the pyroclastic cone. Discolored brown-to-green water was observed around almost the entire perimeter of the island; on 22 June light green discolored water was observed off the S coast of the island.
Observations from the Himawari meteorological satellite confirmed an eruption on 9 and 10 July. An eruption plume rose 1.6 km above the crater and drifted N around 1300 on 9 July. Satellite images acquired at 1420 and 2020 on 9 July and at 0220 on 10 July showed continuing emissions that rose 1.3-1.6 km above the crater and drifted NE and N. The Tokyo VAAC reported that an ash plume seen by a pilot and identified in a satellite image at 0630 on 21 July rose to 3 km altitude and drifted S.
Aerial observations conducted by JCG on 8 August showed a white-and-gray plume rising from the central crater of the pyroclastic cone, and multiple white gas-and-steam emissions were rising from the inner edge of the western crater and along the NW-SE flanks of the island (figure 126). Brown-to-green discolored water was also noted around the perimeter of the island.
Intermittent low-to-moderate power thermal anomalies were recorded in the MIROVA graph (Middle InfraRed Observation of Volcanic Activity), showing an increase in both frequency and power beginning in July (figure 127). This increase in activity coincides with eruptive activity on 9 and 10 July, characterized by eruption plumes. According to the MODVOLC thermal alert algorithm, one thermal hotspot was recorded on 20 July. Weak thermal anomalies were also detected in infrared satellite imagery, accompanied by strong gas-and-steam plumes (figure 128).
Geologic Background. The small island of Nishinoshima was enlarged when several new islands coalesced during an eruption in 1973-74. Multiple eruptions that began in 2013 completely covered the previous exposed surface and continued to enlarge the island. The island is the summit of a massive submarine volcano that has prominent peaks to the S, W, and NE. The summit of the southern cone rises to within 214 m of the ocean surface 9 km SSE.
Information Contacts: Japan Meteorological Agency (JMA), 1-3-4 Otemachi, Chiyoda-ku, Tokyo 100-8122, Japan (URL: http://www.jma.go.jp/jma/indexe.html); Tokyo Volcanic Ash Advisory Center (VAAC), 1-3-4 Otemachi, Chiyoda-ku, Tokyo 100-8122, Japan (URL: http://ds.data.jma.go.jp/svd/vaac/data/); MIROVA (Middle InfraRed Observation of Volcanic Activity), a collaborative project between the Universities of Turin and Florence (Italy) supported by the Centre for Volcanic Risk of the Italian Civil Protection Department (URL: http://www.mirovaweb.it/); Copernicus Browser, Copernicus Data Space Ecosystem, European Space Agency (URL: https://dataspace.copernicus.eu/browser/).
Krakatau (Indonesia) — October 2023 Cite this Report
Krakatau
Indonesia
6.1009°S, 105.4233°E; summit elev. 285 m
All times are local (unless otherwise noted)
White gas-and-steam plumes and occasional ash plumes during May-August 2023
Krakatau is located in the Sunda Strait between Java and Sumatra, Indonesia. Caldera collapse during the catastrophic 1883 eruption destroyed Danan and Perbuwatan cones and left only a remnant of Rakata. The post-collapse cone of Anak Krakatau (Child of Krakatau) was constructed within the 1883 caldera at a point between the former Danan and Perbuwatan cones; it has been the site of frequent eruptions since 1927. The current eruption period began in May 2021 and has recently consisted of Strombolian eruptions and ash plumes (BGVN 48:07). This report describes lower levels of activity consisting of ash and white gas-and-steam plumes during May through August 2023, based on information provided by the Indonesian Center for Volcanology and Geological Hazard Mitigation, referred to as Pusat Vulkanologi dan Mitigasi Bencana Geologi (PVMBG), MAGMA Indonesia, and satellite data.
Activity was relatively low during May and June. Daily white gas-and-steam emissions rose 25-200 m above the crater and drifted in different directions. Five ash plumes were detected at 0519 on 10 May, 1241 on 11 May, 0920 on 12 May, 2320 on 12 May, and at 0710 on 13 May, and rose 1-2.5 km above the crater and drifted SW. A webcam image taken on 12 May showed ejection of incandescent material above the vent. A total of nine ash plumes were detected during 6-11 June: at 1434 and 00220 on 6 and 7 June the ash plumes rose 500 m above the crater and drifted NW, at 1537 on 8 June the ash plume rose 1 km above the crater and drifted SW, at 0746 and at 0846 on 9 June the ash plumes rose 800 m and 3 km above the crater and drifted SW, respectively, at 0423, 1431, and 1750 on 10 June the ash plumes rose 2 km, 1.5 km, and 3.5 km above the crater and drifted NW, respectively, and at 0030 on 11 June an ash plume rose 2 km above the crater and drifted NW. Webcam images taken on 10 and 11 June at 0455 and 0102, respectively, showed incandescent material ejected above the vent. On 19 June an ash plume at 0822 rose 1.5 km above the crater and drifted SE.
Similar low activity of white gas-and-steam emissions and few ash plumes were reported during July and August. Daily white gas-and-steam emissions rose 25-300 m above the crater and drifted in multiple directions. Three ash plumes were reported at 0843, 0851, and 0852 on 20 July that rose 500-2,000 m above the crater and drifted NW.
The MIROVA (Middle InfraRed Observation of Volcanic Activity) graph of MODIS thermal anomaly data showed intermittent low-to-moderate power thermal anomalies during May through August 2023 (figure 140). Although activity was often obscured by weather clouds, a thermal anomaly was visible in an infrared satellite image of the crater on 12 May, accompanied by an eruption plume that drifted SW (figure 141).
Geologic Background. The renowned Krakatau (frequently mis-named as Krakatoa) volcano lies in the Sunda Strait between Java and Sumatra. Collapse of an older edifice, perhaps in 416 or 535 CE, formed a 7-km-wide caldera. Remnants of that volcano are preserved in Verlaten and Lang Islands; subsequently the Rakata, Danan, and Perbuwatan cones were formed, coalescing to create the pre-1883 Krakatau Island. Caldera collapse during the catastrophic 1883 eruption destroyed Danan and Perbuwatan, and left only a remnant of Rakata. This eruption caused more than 36,000 fatalities, most as a result of tsunamis that swept the adjacent coastlines of Sumatra and Java. Pyroclastic surges traveled 40 km across the Sunda Strait and reached the Sumatra coast. After a quiescence of less than a half century, the post-collapse cone of Anak Krakatau (Child of Krakatau) was constructed within the 1883 caldera at a point between the former Danan and Perbuwatan cones. Anak Krakatau has been the site of frequent eruptions since 1927.
Information Contacts: Pusat Vulkanologi dan Mitigasi Bencana Geologi (PVMBG, also known as Indonesian Center for Volcanology and Geological Hazard Mitigation, CVGHM), Jalan Diponegoro 57, Bandung 40122, Indonesia (URL: http://www.vsi.esdm.go.id/); MAGMA Indonesia, Kementerian Energi dan Sumber Daya Mineral (URL: https://magma.esdm.go.id/v1); MIROVA (Middle InfraRed Observation of Volcanic Activity), a collaborative project between the Universities of Turin and Florence (Italy) supported by the Centre for Volcanic Risk of the Italian Civil Protection Department (URL: http://www.mirovaweb.it/); Copernicus Browser, Copernicus Data Space Ecosystem, European Space Agency (URL: https://dataspace.copernicus.eu/browser/).
Villarrica (Chile) — October 2023 Cite this Report
Villarrica
Chile
39.42°S, 71.93°W; summit elev. 2847 m
All times are local (unless otherwise noted)
Strombolian activity, gas-and-ash emissions, and crater incandescence during April-September 2023
Villarrica, in central Chile, consists of a 2-km-wide caldera that formed about 3,500 years ago and is located at the base of the presently active cone at the NW margin of a 6-km-wide caldera. Historical eruptions eruptions date back to 1558 and have been characterized by mild-to-moderate explosive activity with occasional lava effusions. The current eruption period began in December 2014 and has recently consisted of nighttime crater incandescence, ash emissions, and seismicity (BGVN 48:04). This report covers activity during April through September 2023 and describes occasional Strombolian activity, gas-and-ash emissions, and nighttime crater incandescence. Information for this report primarily comes from the Southern Andes Volcano Observatory (Observatorio Volcanológico de Los Andes del Sur, OVDAS), part of Chile's National Service of Geology and Mining (Servicio Nacional de Geología y Minería, SERNAGEOMIN) and satellite data.
Seismicity during April consisted of long period (LP) events and tremor (TRE); a total of 9,413 LP-type events and 759 TR-type events were detected throughout the month. Nighttime crater incandescence persisted and was visible in the degassing column. Sulfur dioxide data was obtained using Differential Absorption Optical Spectroscopy Equipment (DOAS) that showed an average value of 1,450 ± 198 tons per day (t/d) during 1-15 April and 1,129 ± 201 t/d during 16-30 April, with a maximum daily value of 2,784 t/d on 9 April. Gas-and-steam emissions of variable intensities rose above the active crater as high as 1.3 km above the crater on 13 April. Strombolian explosions were not observed and there was a slight decrease in the lava lake level.
There were 14,123 LP-type events and 727 TR-type events detected during May. According to sulfur dioxide measurements taken with DOAS equipment, the active crater emitted an average value of 1,826 ± 482 t/d during 1-15 May and 912 ± 41 t/d during 16-30 May, with a daily maximum value of 5,155 t/d on 13 May. Surveillance cameras showed continuous white gas-and-steam emissions that rose as high as 430 m above the crater on 27 May. Nighttime incandescence illuminated the gas column less than 300 m above the crater rim was and no pyroclastic emissions were reported. A landslide was identified on 13 May on the E flank of the volcano 50 m from the crater rim and extending 300 m away; SERNAGEOMIN noted that this event may have occurred on 12 May. During the morning of 27 and 28 May minor Strombolian explosions characterized by incandescent ejecta were recorded at the crater rim; the last reported Strombolian explosions had occurred at the end of March.
Seismic activity during June consisted of five volcano-tectonic (VT)-type events, 21,606 LP-type events, and 2,085 TR-type events. The average value of sulfur dioxide flux obtained by DOAS equipment was 1,420 ± 217 t/d during 1-15 June and 2,562 ± 804 t/d, with a maximum daily value of 4,810 t/d on 17 June. White gas-and-steam emissions rose less than 480 m above the crater; frequent nighttime crater incandescence was reflected in the degassing plume. On 12 June an emission rose 100 m above the crater and drifted NNW. On 15 June one or several emissions resulted in ashfall to the NE as far as 5.5 km from the crater, based on a Skysat satellite image. Several Strombolian explosions occurred within the crater; activity on 15 June was higher energy and ejected blocks 200-300 m on the NE slope. Surveillance cameras showed white gas-and-steam emissions rising 480 m above the crater on 16 June. On 19 and 24 June low-intensity Strombolian activity was observed, ejecting material as far as 200 m from the center of the crater to the E.
During July, seismicity included 29,319 LP-type events, 3,736 TR-type events, and two VT-type events. DOAS equipment recorded two days of sulfur dioxide emissions of 4,220 t/d and 1,009 t/d on 1 and 13 July, respectively. Constant nighttime incandescence was also recorded and was particularly noticeable when accompanied by eruptive columns on 12 and 16 July. Minor explosive events were detected in the crater. According to Skysat satellite images taken on 12, 13, and 16 July, ashfall deposits were identified 155 m S of the crater. According to POVI, incandescence was visible from two vents on the crater floor around 0336 on 12 July. Gas-and-ash emissions rose as high as 1.2 km above the crater on 13 July and drifted E and NW. A series of gas-and-steam pulses containing some ash deposited material on the upper E flank around 1551 on 13 July. During 16-31 July, average sulfur dioxide emissions of 1,679 ± 406 t/d were recorded, with a maximum daily value of 2,343 t/d on 28 July. Fine ash emissions were also reported on 16, 17, and 23 July.
Seismicity persisted during August, characterized by 27,011 LP-type events, 3,323 TR-type events, and three VT-type events. The average value of sulfur dioxide measurements taken during 1-15 August was 1,642 ± 270 t/d and 2,207 ± 4,549 t/d during 16-31 August, with a maximum daily value of 3,294 t/d on 27 August. Nighttime crater incandescence remained visible in degassing columns. White gas-and-steam emissions rose 480 m above the crater on 6 August. According to a Skysat satellite image from 6 August, ash accumulation was observed proximal to the crater and was mainly distributed toward the E slope. White gas-and-steam emissions rose 320 m above the crater on 26 August. Nighttime incandescence and Strombolian activity that generated ash emissions were reported on 27 August.
Seismicity during September was characterized by five VT-type events, 12,057 LP-type events, and 2,058 TR-type events. Nighttime incandescence persisted. On 2 September an ash emission rose 180 m above the crater and drifted SE at 1643 (figure 125) and a white gas-and-steam plume rose 320 m above the crater. According to the Buenos Aires VAAC, periods of continuous gas-and-ash emissions were visible in webcam images from 1830 on 2 September to 0110 on 3 September. Strombolian activity was observed on 2 September and during the early morning of 3 September, the latter event of which generated an ash emission that rose 60 m above the crater and drifted 100 m from the center of the crater to the NE and SW. Ashfall was reported to the SE and S as far as 750 m from the crater. The lava lake was active during 3-4 September and lava fountaining was visible for the first time since 26 March 2023, according to POVI. Fountains captured in webcam images at 2133 on 3 September and at 0054 on 4 September rose as high as 60 m above the crater rim and ejected material onto the upper W flank. Sulfur dioxide flux of 1,730 t/d and 1,281 t/d was measured on 3 and 4 September, respectively, according to data obtained by DOAS equipment.
Strong Strombolian activity and larger gas-and-ash plumes were reported during 18-20 September. On 18 September activity was also associated with energetic LP-type events and notable sulfur dioxide fluxes (as high as 4,277 t/d). On 19 September Strombolian activity and incandescence were observed. On 20 September at 0914 ash emissions rose 50 m above the crater and drifted SSE, accompanied by Strombolian activity that ejected material less than 100 m SSE, causing fall deposits on that respective flank. SERNAGEOMIN reported that a Planet Scope satellite image taken on 20 September showed the lava lake in the crater, measuring 32 m x 35 m and an area of 0.001 km2. Several ash emissions were recorded at 0841, 0910, 1251, 1306, 1312, 1315, and 1324 on 23 September and rose less than 150 m above the crater. The sulfur dioxide flux value was 698 t/d on 23 September and 1,097 t/d on 24 September. On 24 September the Volcanic Alert Level (VAL) was raised to Orange (the third level on a four-color scale). SENAPRED maintained the Alert Level at Yellow (the middle level on a three-color scale) for the communities of Villarrica, Pucón (16 km N), Curarrehue, and Panguipulli.
During 24-25 September there was an increase in seismic energy (observed at TR-events) and acoustic signals, characterized by 1 VT-type event, 213 LP-type events, and 124 TR-type events. Mainly white gas-and-steam emissions, in addition to occasional fine ash emissions were recorded. During the early morning of 25 September Strombolian explosions were reported and ejected material 250 m in all directions, though dominantly toward the NW. On 25 September the average value of sulfur dioxide flux was 760 t/d. Seismicity during 25-30 September consisted of five VT-type events, 1,937 LP-type events, and 456 TR-type events.
During 25-29 September moderate Strombolian activity was observed and ejected material as far as the crater rim. In addition, ash pulses lasting roughly 50 minutes were observed around 0700 and dispersed ENE. During 26-27 September a TR episode lasted 6.5 hours and was accompanied by discrete acoustic signals. Satellite images from 26 September showed a spatter cone on the crater floor with one vent that measured 10 x 14 m and a smaller vent about 35 m NE of the cone. SERNAGEOMIN reported an abundant number of bomb-sized blocks up to 150 m from the crater, as well as impact marks on the snow, which indicated explosive activity. A low-altitude ash emission was observed drifting NW around 1140 on 28 September, based on webcam images. Between 0620 and 0850 on 29 September an ash emission rose 60 m above the crater and drifted NW. During an overflight taken around 1000 on 29 September scientists observed molten material in the vent, a large accumulation of pyroclasts inside the crater, and energetic degassing, some of which contained a small amount of ash. Block-sized pyroclasts were deposited on the internal walls and near the crater, and a distal ash deposit was also visible. The average sulfur dioxide flux measured on 28 September was 344 t/d. Satellite images taken on 29 September ashfall was deposited roughly 3 km WNW from the crater and nighttime crater incandescence remained visible. The average sulfur dioxide flux value from 29 September was 199 t/d. On 30 September at 0740 a pulsating ash emission rose 1.1 km above the crater and drifted NNW (figure 126). Deposits on the S flank extended as far as 4.5 km from the crater rim, based on satellite images from 30 September.
Infrared MODIS satellite data processed by MIROVA (Middle InfraRed Observation of Volcanic Activity) showed intermittent thermal activity during April through September, with slightly stronger activity detected during late September (figure 127). Small clusters of thermal activity were detected during mid-June, early July, early August, and late September. According to the MODVOLC thermal alert system, a total of four thermal hotspots were detected on 7 July and 3 and 23 September. This activity was also intermittently captured in infrared satellite imagery on clear weather days (figure 128).
Geologic Background. The glacier-covered Villarrica stratovolcano, in the northern Lakes District of central Chile, is ~15 km south of the city of Pucon. A 2-km-wide caldera that formed about 3,500 years ago is located at the base of the presently active, dominantly basaltic to basaltic andesite cone at the NW margin of a 6-km-wide Pleistocene caldera. More than 30 scoria cones and fissure vents are present on the flanks. Plinian eruptions and pyroclastic flows that have extended up to 20 km from the volcano were produced during the Holocene. Lava flows up to 18 km long have issued from summit and flank vents. Eruptions documented since 1558 CE have consisted largely of mild-to-moderate explosive activity with occasional lava effusion. Glaciers cover 40 km2 of the volcano, and lahars have damaged towns on its flanks.
Information Contacts: Servicio Nacional de Geología y Minería (SERNAGEOMIN), Observatorio Volcanológico de Los Andes del Sur (OVDAS), Avda Sta María No. 0104, Santiago, Chile (URL: http://www.sernageomin.cl/); Proyecto Observación Villarrica Internet (POVI) (URL: http://www.povi.cl/); Sistema y Servicio Nacional de Prevención y Repuesta Ante Desastres (SENAPRED), Av. Beauchef 1671, Santiago, Chile (URL: https://web.senapred.cl/); Buenos Aires Volcanic Ash Advisory Center (VAAC), Servicio Meteorológico Nacional-Fuerza Aérea Argentina, 25 de mayo 658, Buenos Aires, Argentina (URL: http://www.smn.gov.ar/vaac/buenosaires/inicio.php); MIROVA (Middle InfraRed Observation of Volcanic Activity), a collaborative project between the Universities of Turin and Florence (Italy) supported by the Centre for Volcanic Risk of the Italian Civil Protection Department (URL: http://www.mirovaweb.it/); Hawai'i Institute of Geophysics and Planetology (HIGP) - MODVOLC Thermal Alerts System, School of Ocean and Earth Science and Technology (SOEST), Univ. of Hawai'i, 2525 Correa Road, Honolulu, HI 96822, USA (URL: http://modis.higp.hawaii.edu/); Copernicus Browser, Copernicus Data Space Ecosystem, European Space Agency (URL: https://dataspace.copernicus.eu/browser/).
Merapi (Indonesia) — October 2023 Cite this Report
Merapi
Indonesia
7.54°S, 110.446°E; summit elev. 2910 m
All times are local (unless otherwise noted)
Frequent incandescent avalanches during April-September 2023
Merapi, located just north of the major city of Yogyakarta in central Java, Indonesia, has had activity within the last 20 years characterized by pyroclastic flows and lahars accompanying growth and collapse of the steep-sided active summit lava dome. The current eruption period began in late December 2020 and has more recently consisted of ash plumes, intermittent incandescent avalanches of material, and pyroclastic flows (BGVN 48:04). This report covers activity during April through September 2023, based on information from Balai Penyelidikan dan Pengembangan Teknologi Kebencanaan Geologi (BPPTKG), the Center for Research and Development of Geological Disaster Technology, a branch of PVMBG which specifically monitors Merapi. Additional information comes from the Pusat Vulkanologi dan Mitigasi Bencana Geologi (PVMBG, also known as Indonesian Center for Volcanology and Geological Hazard Mitigation, CVGHM), MAGMA Indonesia, the Darwin Volcanic Ash Advisory Centre (VAAC), and various satellite data.
Activity during April through September 2023 primarily consisted of incandescent avalanches of material that mainly affected the SW and W flanks and traveled as far as 2.3 km from the summit (table 25) and white gas-and-steam emissions that rose 10-1,000 m above the crater.
Table 25. Monthly summary of avalanches and avalanche distances recorded at Merapi during April through September 2023. The number of reported avalanches does not include instances where possible avalanches were heard but could not be visually confirmed as a result of inclement weather. Data courtesy of BPPTKG (April-September 2023 daily reports).
| Month |
Average number of avalanches per day |
Distance avalanches traveled (m) |
| Apr 2023 |
19 |
1,200-2,000 |
| May 2023 |
22 |
500-2,000 |
| Jun 2023 |
18 |
1,200-2,000 |
| Jul 2023 |
30 |
300-2,000 |
| Aug 2023 |
25 |
400-2,300 |
| Sep 2023 |
23 |
600-2,000 |
BPPTKG reported that during April and May white gas-and-steam emissions rose 10-750 m above the crater, incandescent avalanches descended 500-2,000 m on the SW and W flanks (figure 135). Cloudy weather often prevented clear views of the summit, and sometimes avalanches could not be confirmed. According to a webcam image, a pyroclastic flow was visible on 17 April at 0531. During the week of 28 April and 4 May a pyroclastic flow was reported on the SW flank, traveling up to 2.5 km. According to a drone overflight taken on 17 May the SW lava dome volume was an estimated 2,372,800 cubic meters and the dome in the main crater was an estimated 2,337,300 cubic meters.
During June and July similar activity persisted with white gas-and-steam emissions rising 10-350 m above the crater and frequent incandescent avalanches that traveled 300-2,000 m down the SW, W, and S flanks (figure 136). Based on an analysis of aerial photos taken on 24 June the volume of the SW lava dome was approximately 2.5 million cubic meters. A pyroclastic flow was observed on 5 July that traveled 2.7 km on the SW flank. According to the Darwin VAAC multiple minor ash plumes were identified in satellite images on 19 July that rose to 3.7 km altitude and drifted S and SW. During 22, 25, and 26 July a total of 17 avalanches descended as far as 1.8 km on the S flank.
Frequent white gas-and-steam emissions continued during August and September, rising 10-450 m above the crater. Incandescent avalanches mainly affected the SW and W flanks and traveled 400-2,300 m from the vent (figure 137). An aerial survey conducted on 10 August was analyzed and reported that estimates of the SW dome volume was 2,764,300 cubic meters and the dome in the main crater was 2,369,800 cubic meters.
Frequent and moderate-power thermal activity continued throughout the reporting period, according to a MIROVA (Middle InfraRed Observation of Volcanic Activity) analysis of MODIS satellite data (figure 138). There was an increase in the number of detected anomalies during mid-May. The MODVOLC thermal algorithm recorded a total of 47 thermal hotspots: six during April, nine during May, eight during June, 15 during July, four during August, and five during September. Some of this activity was captured in infrared satellite imagery on clear weather days, sometimes accompanied by incandescent material on the SW flank (figure 139).
Geologic Background. Merapi, one of Indonesia's most active volcanoes, lies in one of the world's most densely populated areas and dominates the landscape immediately north of the major city of Yogyakarta. It is the youngest and southernmost of a volcanic chain extending NNW to Ungaran volcano. Growth of Old Merapi during the Pleistocene ended with major edifice collapse perhaps about 2,000 years ago, leaving a large arcuate scarp cutting the eroded older Batulawang volcano. Subsequent growth of the steep-sided Young Merapi edifice, its upper part unvegetated due to frequent activity, began SW of the earlier collapse scarp. Pyroclastic flows and lahars accompanying growth and collapse of the steep-sided active summit lava dome have devastated cultivated lands on the western-to-southern flanks and caused many fatalities.
Information Contacts: Balai Penyelidikan dan Pengembangan Teknologi Kebencanaan Geologi (BPPTKG), Center for Research and Development of Geological Disaster Technology (URL: http://merapi.bgl.esdm.go.id/, Twitter: @BPPTKG); MAGMA Indonesia, Kementerian Energi dan Sumber Daya Mineral (URL: https://magma.esdm.go.id/v1); Pusat Vulkanologi dan Mitigasi Bencana Geologi (PVMBG, also known as Indonesian Center for Volcanology and Geological Hazard Mitigation, CVGHM), Jalan Diponegoro 57, Bandung 40122, Indonesia (URL: http://www.vsi.esdm.go.id/); Darwin Volcanic Ash Advisory Centre (VAAC), Bureau of Meteorology, Northern Territory Regional Office, PO Box 40050, Casuarina, NT 0811, Australia (URL: http://www.bom.gov.au/info/vaac/); MIROVA (Middle InfraRed Observation of Volcanic Activity), a collaborative project between the Universities of Turin and Florence (Italy) supported by the Centre for Volcanic Risk of the Italian Civil Protection Department (URL: http://www.mirovaweb.it/); Hawai'i Institute of Geophysics and Planetology (HIGP) - MODVOLC Thermal Alerts System, School of Ocean and Earth Science and Technology (SOEST), Univ. of Hawai'i, 2525 Correa Road, Honolulu, HI 96822, USA (URL: http://modis.higp.hawaii.edu/); Copernicus Browser, Copernicus Data Space Ecosystem, European Space Agency (URL: https://dataspace.copernicus.eu/browser/); Øystein Lund Andersen (URL: https://www.oysteinlundandersen.com/, https://twitter.com/oysteinvolcano).
Ebeko
Russia
50.686°N, 156.014°E; summit elev. 1103 m
All times are local (unless otherwise noted)
Moderate explosive activity with ash plumes continued during June-November 2023
Ebeko, located on the N end of Paramushir Island in Russia’s Kuril Islands just S of the Kamchatka Peninsula, consists of three summit craters along a SSW-NNE line at the northern end of a complex of five volcanic cones. Observed eruptions date back to the late 18th century and have been characterized as small-to-moderate explosions from the summit crater, accompanied by intense fumarolic activity. The current eruptive period began in June 2022, consisting of frequent explosions, ash plumes, and thermal activity (BGVN 47:10, 48:06). This report covers similar activity during June-November 2023, based on information from the Kamchatka Volcanic Eruptions Response Team (KVERT) and satellite data.
Moderate explosive activity continued during June-November 2023 (figures 50 and 51). According to visual data from Severo-Kurilsk, explosions sent ash 2-3.5 km above the summit (3-4.5 km altitude) during most days during June through mid-September. Activity after mid-September was slightly weaker, with ash usually reaching less than 2 km above the summit. According to KVERT the volcano in October and November was, with a few exceptions, either quiet or obscured by clouds that prevented satellite observations. KVERT issued Volcano Observatory Notices for Aviation (VONA) on 8 and 12 June, 13 and 22 July, 3 and 21 August, and 31 October warning of potential aviation hazards from ash plumes drifting 3-15 km from the volcano. Based on satellite data, KVERT reported a persistent thermal anomaly whenever weather clouds permitted viewing.
Geologic Background. The flat-topped summit of the central cone of Ebeko volcano, one of the most active in the Kuril Islands, occupies the northern end of Paramushir Island. Three summit craters located along a SSW-NNE line form Ebeko volcano proper, at the northern end of a complex of five volcanic cones. Blocky lava flows extend west from Ebeko and SE from the neighboring Nezametnyi cone. The eastern part of the southern crater contains strong solfataras and a large boiling spring. The central crater is filled by a lake about 20 m deep whose shores are lined with steaming solfataras; the northern crater lies across a narrow, low barrier from the central crater and contains a small, cold crescentic lake. Historical activity, recorded since the late-18th century, has been restricted to small-to-moderate explosive eruptions from the summit craters. Intense fumarolic activity occurs in the summit craters, on the outer flanks of the cone, and in lateral explosion craters.
Information Contacts: Kamchatka Volcanic Eruptions Response Team (KVERT), Far Eastern Branch, Russian Academy of Sciences, 9 Piip Blvd., Petropavlovsk-Kamchatsky, 683006, Russia (URL: http://www.kscnet.ru/ivs/kvert/).
Search Bulletin Archive by Publication Date
Select a month and year from the drop-downs and click "Show Issue" to have that issue displayed in this tab.
The default month and year is the latest issue available.
Bulletin of the Global Volcanism Network - Volume 39, Number 03 (March 2014)
Managing Editor: Richard Wunderman
Cameroon (Cameroon)
Brief 2012 explosion; follow up on earlier activity and studies
Nyamulagira (DR Congo)
Eruption during 6 November 2011 into early 2012; pit crater morphology changes
Salton Buttes (United States)
Instrument-aided IR detection of 5 steaming vents at Red Island in 2013
Santa Maria (Guatemala)
Large May 2014 eruption with ashfall, pyroclastic flow, and lava flow; activity during October 2011-June 2014
Villarrica (Chile)
During November 2010 to December 2013, lava lake persists but few explosions
Cameroon (Cameroon) — March 2014 Cite this Report
Cameroon
Cameroon
4.203°N, 9.17°E; summit elev. 4095 m
All times are local (unless otherwise noted)
Brief 2012 explosion; follow up on earlier activity and studies
Introduction. The Associated Press reported a sudden explosion had occurred at Mount Cameroon on 3 February 2012 (see subsection below). A review of MODVOLC thermal alerts based on satellite infrared data during 2001 to mid-2014 found few if any of the highest-level alerts. In contrast, there were numerous stronger alerts during 3 March to 17 July 2000 (activity described in BGVN 24:09, 25:06).
In (BGVN 26:11) we reported that during 26-27 June 2001, Limbe, an economically important coastal town with ~85,000 residents located on the S foot of the steep sided stratovolcano Mt. Cameroon (figure 4), was struck by a series of heavy rains leading to deadly floods and landslides. Figure 5 shows a photo taken in Limbe during the flood. Although many would classify the flood as a meteorological disaster and not a volcanological one, Mt. Cameroon is the tallest peak in Western Africa and orogenic uplift of warm most air over the massive edifice is a factor affecting the amount of rainfall. Limbe sits at the mouth of drainages coming down this side of the edifice. During July 2014, heavy rains again resulted in floods in Limbe (Ndaley, 2014). In strict eruptive-hazard terms, Mount Cameroon is the only volcanic peak in Western Africa with recent ongoing eruptions.
This report discusses recent research on the 2000 eruption of Mount Cameroon and then summarizes news articles on a smaller 2012 explosion. After that, this report discusses vulnerability studies, including a United Nations project that examined and attempted to mitigate the risk to local communities.
The 2000 eruption. On the basis of first-hand knowledge of some of their co-authors, Wantim and others (2011) stated that the eruption occurred during 28 May and 20 July 2000. MODVOLC satellite-based thermal alerts were found during the interval 3 March 2000 to 17 July 2000. The seismic activity for this eruption lasted 3 months, up to September 2000 (Ateba and others, 2009). Multiple fissure segments produced lava that built four different lava flow fields at three sites they specify in their paper (Wantim and others, 2011).
Eruptions at site 1 (~ 3,930 m a.s.l) began in the night of 28 May 2000 with an explosive phase that produced only tephra and ballistic blocks (Suh and others, 2003 and Wantim and others, 2011). A ~850 m-long ′a′a flow field was emplaced at this site a month later, an observation supported by data from MODVOLC and multispectral images (Landsat ETM + and ASTER) analyzed in this study. The upper 2000 flow is one of the shortest (850 m) recorded for historical lava flows here despite having descended steep slopes (10-25°). Late emission of the lava and field observations of cone breach at the lava source suggest that the lava flow was fed by the drainage of a transient lava lake. That lake was presumably formed by lava fountaining in the eruptive cone (Wantim and others., 2011). The lava flow field covers a total surface area of (8 ± 2) × 104 m2 with a total volume of (3.4 ± 0.8) × 105 m3. There were two lobes, ~4.5 m and ~8.7 m thick (Wantim and others., 2011).
Brief explosion--2012 news reports. Cameroon state radio and television reports stated that Mount Cameroon sent "ashes and flames" into the air in a brief explosion on 3 February 2012. A violent explosion lasted a couple of seconds and lightly injured two of the porters and guides on the mountain, according to a 6 February 2012 Associated Press report.
Lava flow hazard and risk, and weathering studies. According to Favalli and others (2010), Mt. Cameroon is one of the most active effusive volcanoes in Africa. About 500,000 people living or working around its fertile flanks are subject to significant threat from lava flow inundation. Therefore, this group initiated a scientific project to assess the hazards/risks associated with the volcano by simulating probable lava flow paths using the DOWNFLOW code, a routine that for lava-flow-hazard mapping that defines areas susceptible to inundation.
According to Wantim and others (2013), as for many other effusive volcanoes, only limited information exists on the relevant lava flow properties and emplacement dynamics for recent eruptions. This study provides new quantitative constraints for rheological and dynamic characteristics of lava flow effusion at Mount Cameroon during the 1982 and 2000 eruptions. These constraints were used to calibrate the FLOWGO thermo-rheological model for these lava flows. FLOWGO (Harris and Rowland, 2001) was the only model that enables full inversion of the thermo-rheological properties of lava flows. It can be constrained from channel morphology and down-flow evolution of crystal content.
Lava flow hazard and risk were assessed by simulating probable lava flow paths using the DOWNFLOW code (Tarquini and Favalli, 2011). That code incorporates digital elevation data and allows the definition of areas that are susceptible to inundation by lava flows originating from each vent; it has been used extensively to simulate lava flows at Mt. Etna and Nyiragongo volcanoes ( Favalli and others, 2005, 2006, 2009; Chirico and others 2009). The details of the modeling and the resulting maps they produced can be found in the cited references. Simulated lava flows from about 80,000 possible vents were used to produce a detailed lava flow hazard map. The lava flow risk in the area was mapped by combining the hazard map with digitized infrastructures (i.e., human settlements and roads).
Results show that the risk of lava flow inundation is greatest in the most inhabited coastal areas, specifically the town of Limbe (which constitutes the center of Cameroon's oil industry and an important commercial port). Buea, the second most important town in the area, has a much lower risk although it is significantly closer to the summit of the volcano. Non-negligible risk characterizes many villages and most roads in the area surrounding the volcano. In addition to the conventional risk mapping described above, the authors also present (1) two reversed risk maps (one for buildings and one for roads), where each point on the volcano is classified according to the total damage expected as a consequence of vent opening at that point; (2) maps of the lava catchments for the two main towns of Limbe and Buea, illustrating the expected damage upon venting at any point in the catchment basin. The hazard and risk maps provided here represent valuable tools for both medium/long-term land-use planning and real-time volcanic risk management and decision making.
The largely geochemical study of Che and others (2012), analyses the behavior and mobility of major and some trace elements during the physical and chemical development of landslide-prone soil profiles in Limbe, SW Cameroon. The soils result from in situ weathering of Tertiary basaltic and picrobasaltic rocks. Textural and chemical characterizations, together with two mass balance models are applied to understand the mobility and redistribution of elements during the weathering of pyroclastic cones and lava flows in the setting of Mt. Cameroon. This weathering is a major factor in the cohesion of steep slopes, and thus these studies address slope stability, another kind of volcano-related hazard that could occur even in times of volcanic quiescence.
Socio-economic vulnerability study. A United Nations project, MIA-VITA (Mitigate and Assess risk from Volcanic Impact on Terrain and human Activities) was started in Cameroon during 2011 (Apa and others, 2007; Bosi and others, 2011; European Commission, 2010). (The phrase 'Mia Vita' comes from the Italian, "My Life"). The project was based on the UN International Strategy for Disaster Reduction and a key expected outcome was to finding the best means to help local populations and authorities better perceive risks and thus reduce community vulnerability.
The program in Cameroon, as well in three other developing countries with active volcanoes, had several goals: (1) to assess the natural risk to local communities from the selected volcano, based on risk mapping and damage scenarios; (2) to improve crisis management, based on early warning systems and improved communications between government officials and the local populations, and (3) to reduce the vulnerability of populations in the wake of an eruption.
Besides Mount Cameroon, MIA-VITA also contributed to similar goals at Mount Merapi in Indonesia, Mount Kanlaon in Philippines, and Mount Fogo in Cape Verde. In the service of local citizens facing volcanic hazards, the MIA-VITA study also aimed to improve civil-defence, planning, and coordination and to reduce rumors and alarmist information.
MIA-VITA also integrates GIS capability with an analytic hierarchy method that yields volcanic risk maps. The approach is designed to solve complex multiple criteria problems using relative pairwise comparisons (Saaty, 1996; Wikipedia, 2014). To apply this approach, it is necessary to break down a complex unstructured problem into its component factors. The method incorporates both qualitative and quantitative criteria in the evaluation.
References. Apa, M.I., Kouokam, E:, Akoko, R.M, Thierry, P., and Buongiorno, M.F., 2007, Mt. Cameroon Socio-Economic Vulnerability and Resilience Assessment Through Traditional Survey Methods[FP7-ENV-2007-1] (URL: http://meetingorganizer.copernicus.org/EGU2011/EGU2011-3402.pdf http://meetingorganizer.copernicus.org/EGU2011/EGU2011-3402.pdf )
Bosi, V., Cristiani C. and Costantini, L., 2011, 3rd MIA-VITA Newsletter (Sept. 2011), MIA-VITA (URL: www.spinics.net/lists/volcano/msg02475.html )
Che, V.B., Fontijin, K., Ernst, G.G.J., Kervyn, M., Elburg, M, Van Ranst, E., Suh, C.E., 2012, Evaluating the degree of weathering in landslide-prone soils in the humid tropics: The case of Limbe, SW Cameroon; Geoderma, Vol. 170, pp. 378-389
Chirico G.D., Favalli, M., Papale, P., Pareschi, M.T., Boschi, E., 2009, Lava flow hazard at Nyiragongo volcano, D.R.C. 2. Hazard reduction in urban areas. Bull Volcanol 71:375-387. doi:10.1007/s00445-008-0232-z
European Commission, 2010 (31 March 2010), MIA-VITA--1st newsletter (URL: http://images.nationmaster.com/images/motw/africa/calabar_tpc_1996.jpg )
Favalli, M., Chirico, G.D., Papale, P., Pareschi, M.T., Boschi, E. (2009a) Lava flow hazard at Nyiragongo volcano, D.R.C. 1. Model calibration and hazard mapping. Bull Volcanol 71:363-374. doi:10.1007/s00445-008-0233-y
Favalli, M., Tarquini, S., Papale, P, Fomacai, A, and Boschi, E., 2011, Lava flow hazard and risk at Mt. Cameroon volcano, _Journal of Volcanology 2012 74:433-439. adsabs.harvard.edu/abs/2012BVol...74..423F
Favalli, M., Mazzarini, F., Pareschi, M.T., Boschi E (2009b) Topographic control on lava flow paths at Mount Etna, Italy: Implications for hazard assessment. J Geophys Res 114:F01019. doi:10.1029/2007JF000918
Favalli, M., Tarquini, S., Fornaciai, A., Boschi, E., 2009c, A new approach to risk assessment of lava flow at Mount Etna, Geology, 37(12):1111-1114. doi:10.1130/G30187A
Harris, AJL and Rowland, SK, 2001, FLOWGO: A kinematic thermorheological model for lava flowing in a channel. Bull Volcanol., . 63:20-44. doi:10.1007/s004450000120
Ndaley, Yannick Fonki, 2014, Heavy Rains Beat Limbe, Floods Put Residents In Distress. Eden Newspaper, 12 July 2014, (URL: http://edennewspaper.net/)
Saaty, T. L. (1996). Multicriteria decision making: The analytic hierarchy process. Pittsburgh, PA: RWS Publications, 479 pp. (ISBN 0962031712, 9780962031717)
Suh, C.E., Luhr, J.F., and Njome, M.S., 2008, Olivine-hosted glass inclusions from Scoriae erupted in 1954-2000 at Mount Cameroon volcano, West Africa, Journal of Volcanology and Geothermal Research, Volume 169, Issues 1-2, 1 January 2008, pp. 1-33, ISSN 0377-0273, http://dx.doi.org/10.1016/j.jvolgeores.2007.07.004.
Tarquini, S and Favalli, M, 2011, Mapping and DOWNFLOW simulation of recent lava flow fields at Mount Etna. Journal of Volcanology and Geothermal Research, 204:27-39. doi:10.1016/j.jvolgeores.2011.05.001
Wantim, M.N. , Kervyn, M., Ernst, G.G.J, del Marmol, M.A., Suh, C.E.. and Jacobs, P., 2013, Numerical experiments on the dynamics of channelised lava flows at Mount Cameroon volcano with the FLOWGO thermo-rheological model, Journal of Volcanology and Geothermal Research, Volume 253, pp. 35-53, ISSN 0377-0273
Wikipedia, 2014, Multi-criteria decision analysis (URL: http://en.wikipedia.org/wiki/Multi-criteria_decision_analysis ).
Geologic Background. Mount Cameroon, one of Africa's largest volcanoes, rises above the coast of west Cameroon. The massive steep-sided volcano of dominantly basaltic-to-trachybasaltic composition forms a volcanic horst constructed above a basement of Precambrian metamorphic rocks covered with Cretaceous to Quaternary sediments. More than 100 small cinder cones, often fissure-controlled parallel to the long axis of the 1400 km3 edifice, occur on the flanks and surrounding lowlands. A large satellitic peak, Etinde (also known as Little Cameroon), is located on the S flank near the coast. Historical activity was first observed in the 5th century BCE by the Carthaginian navigator Hannon. During historical time, moderate explosive and effusive eruptions have occurred from both summit and flank vents. A 1922 SW-flank eruption produced a lava flow that reached the Atlantic coast, and a lava flow from a 1999 south-flank eruption stopped only 200 m from the sea. Explosive activity from two vents on the upper SE flank was reported in May 2000.
Information Contacts: MODVOLC Thermal Alert System, Hawai'i Instiute of Geophysics and Planetology (HIGP), (Univ. of Hawai'i, 2525 Corrrea Road, Honolulu, HI 96822 USA (URL: http://modis.higp.hawaii.edu/); Mary-Ann del Marmol, Department of Geology and Soil Science, Ghent University, Krijgslaan 281 S8, 9000 Gent, Belgium; Associated Press, and Cameroon Radio Television, CRTV Siège, CRTV Mballa II B.P. 1634, Yaounde, Cameroon (URL: http://crtv.cm/).
Nyamulagira (DR Congo) — March 2014 Cite this Report
Nyamulagira
DR Congo
1.408°S, 29.2°E; summit elev. 3058 m
All times are local (unless otherwise noted)
Eruption during 6 November 2011 into early 2012; pit crater morphology changes
Our last report (BGVN 35:08) described a flank eruption at Nyamuragira during 2-27 January 2010 that produced a new cone and 12-km-long lava flows. The final report of the GORISK Scientific Network (Kervyn and others, 2010) stated that this eruption ended by 27 January 2010. MODVOLC thermal alerts occurred regularly at Nyamuragira through 2 February 2010 and then ceased until early November 2011.
Nyamuragira began to erupt again on its flanks at 1755 on 6 November 2011, according to GORISK, after two days of unspecified "intense seismic activity." This report conveys information from a variety of sources credited below, but largely from Dario Tedesco and the GORISK Scientific Network. GORISK was an initiative of both the National Museum of Natural History (Luxembourg) and the Royal Museum for Central Africa (Belgium). GORISK inferred that the eruption lasted through April 2012 [but only noted degassing from a vent inside the pit crater after late February in their June 2012 eruption summary].
An early synopsis of the eruption that began on 6 November 2011 came from the Virunga National Park. The eruption was visible at Park headquarters. Park staff described the 6 November eruption as coming from a fissure on the volcano's NE flank. It produced slow-moving lava flows that advanced into unpopulated areas to the N. Park staff also took a video of fountaining at night. On 7 November the Park uploaded 39 seconds of their footage on Youtube. During the first week of the eruption the Park staff hiked through the bush, in places having to cut vegetation, crossing young forest and irregular lichen-covered volcanic topography on a 4 hour hike that enabled them to take a closer view.
The hikers described airfall scoria covering the landscape as they approached closer. Their log said that the "...eruption finally came into view, along with the roar of intensely spewing fire and lava, as well as lightning and thunder." The vent area was located 12 km ENE of the crater, close to one of the 1989 eruptive sites. The first fissure was oriented E-W, perpendicular to the rift, and emitted lava fountains up to 300 m high. The eruption site was described as a flat area cut by a 500- to 1,000-m-long fissure. Figure 40 shows a photo from around this time but a topographic high of new material had already grown. NASA Earth Observatory reported that lava flows had advanced as far as 11.5 km by 12 November 2011 (figure 41). On 12 November, the lava flow front was located 5 km from the Kelengera-Tongo road.
For about a month, the park allowed overnight treks to the eruption site. A video featured on Youtube by Piet Schutter contains footage taken on 12 November; some scenes are at close range (looking up towards the eruption). That video shows both daylight and night scenes, features sound, and has people in the foreground, which helps establish scale.
The GORISK Scientific Team reported that satellite radar (InSAR) images acquired on 11 November 2011 revealed major ground deformation features associated with the eruption. Preliminary estimation of the observed deformation signal suggested an affected area spreading over 250 km2. Pressure from the ascending magma caused the ground to rise more than 50 cm at the eruptive site where a spatter cone developed. Another 15 cm deformation was detected within the caldera, which was accompanied by deflation observed on the flanks.
An elongated spatter-and-scoria cone, referred to by scientists as the western cone and by locals as "Umoja," formed along the first fissure (figure 42). In early December 2011, a new cone formed on a new eruptive fracture to the E; this cone was referred to by scientists as the eastern cone and by locals as "Tuungane" (figure 42). During the next few days, the eruptive activity migrated to this new edifice. Satellite images acquired on 3 January 2012 showed fresh lava flowing to the NNE (figures 43 and 44).
According to visiting scientists from the Afar Consortium Project, activity continued on 8 January 2012. The initial scoria cone appeared inactive and a second formed to the N of the first; both cones were about 300 m high. The second cone was extremely active for the duration of the observations (about 15 hours) with fountains over twice the height of the cone; lava flowed N. The observers, about 1.5 km away, felt the heat from the eruption and noted lapilli fall.
A group from Volcano Discovery observed the ongoing fissure eruption during 22-25 January 2012 from the newly formed cinder cones near the fissure. They reported three coalescent cones, the largest containing a small lava lake. The lake ejected spatter every few seconds, rising as high as 200 m above the summit. Some bombs reached the base of the cone. Lava flows from the vent extended several kilometers N. Numerous small breakouts formed secondary flows, and a large breakout ~2 km N of the cone fed a large lava flow ~20 m wide. Burning forests were reported to the NNE.
Preliminary estimates by GORISK for the 2011-2012 eruption indicated a volume of emitted lavas of at least 81.5 x 10⁶ m3. The lava flows did not reach inhabited areas and only affected vegetation in Virunga National Park. The 2011-2012 eruption was the biggest event at Nyamuragira since the 1991-1993 eruption, which lasted nearly 1.5 years and emitted an estimated ~131 x 106 m3 of lava (Smets and others, 2010).
A report by Dario Tedesco stated that in March 2012, a series of explosion earthquakes were recorded by the seismic network of the Goma Volcano Observatory. Following this activity, the fissure eruptions suddenly stopped. Also in March the morphology of the pit crater began to change (figures 45 and 46). Beginning in late February 2012 through at least June 2012, degassing occurred in the caldera. The emission site was located inside the pit crater, but degassing occurred from all fractures inside the caldera. On several occasions, meteorological conditions caused sulfur odors to reach the city of Goma (~30 km S from Nyamuragira's crater).
MODVOLC thermal alerts had waned at the fissure area by late March 2012, suggesting the end of the fissure eruption in that time frame. The last alerts around the summit area had occurred on 2 February 2010.
References. Kervyn, F, d'Oreye, N, van Overbeke, A-C, 2010, GORISK: The combined use of Ground-Based and Remote Sensing techniques as a tool for volcanic risk and health impact assessment for the Goma region (North Kivu, Democratic Republic of Congo). Final Report. [Project SR/00/113] (URL: http://www.ecgs.lu/gorisk/wp-content/uploads/2010/11/GORISK_Final_Report_DISSEMINATION.pdf )
Smets, B., Wauthier, C., d'Oreye, N. (2010). A new map of the lava flow field of Nyamulagira (D.R. Congo) from satellite imagery. Journal of African Earth Sciences, 58 (5), 778-786. DOI:10.1016/j.jafrearsci.2010.07.005
Geologic Background. Africa's most active volcano, Nyamulagira (also known as Nyamuragira), is a massive high-potassium basaltic shield about 25 km N of Lake Kivu and 13 km NNW of the steep-sided Nyiragongo volcano. The summit is truncated by a small 2 x 2.3 km caldera that has walls up to about 100 m high. Documented eruptions have occurred within the summit caldera, as well as from the numerous flank fissures and cinder cones. A lava lake in the summit crater, active since at least 1921, drained in 1938, at the time of a major flank eruption. Recent lava flows extend down the flanks more than 30 km from the summit as far as Lake Kivu; extensive lava flows from this volcano have covered 1,500 km2 of the western branch of the East African Rift.
Information Contacts: Dario Tedesco, International Organization of Migrants (I.O.M.), Goma, DRC, and Second University of Naples, DISTABIF, Caserta, Italy; GORISK Scientific Team [an International scientific team for the study and monitoring of active volcanoes and their corresponding hazards in the Virunga Volcanic Province] (URL: http://terra.ecgs.lu/rnvt/); Virunga National Park, Democratic Republic of Congo (URL: http://virunga.org/); Jesse Allen and Robert Simmon, NASA Earth Observatory (URL: http://earthobservatory.nasa.gov); Volcano Discovery (URL: http://www.volcanodiscovery.com/); and Afar Consortium Project (URL: http://www.see.leeds.ac.uk/afar/).
Salton Buttes (United States) — March 2014 Cite this Report
Salton Buttes
United States
33.197°N, 115.616°W; summit elev. -40 m
All times are local (unless otherwise noted)
Instrument-aided IR detection of 5 steaming vents at Red Island in 2013
A recent partial survey conducted by David K. Lynch and Paul M. Adams of Red Island, previously known as Red Hill, in Southern California, USA, has resulted in the discovery of five steaming hot vents on the SW flank of the northern Salton Buttes volcanic field. Lynch and Adams sent us a report, which follows. We also include some remarks from related literature and note geothermal power plants in the region.
Background. Red Island is part of the Salton Buttes, a collection of five late Quaternary rhyolitic volcanic necks in the Salton Sea Geothermal Field (SSGF) (figure 1). The SSGF rests within a topographic low, and has a geothermal gradient that averages ~0.3°C/m, reaching a maximum of 4.3°C/m (Lynch and others, 2013). This high geothermal gradient results from the shallow magma body of the spreading center between the San Andreas and Imperial faults. As shown in figure 2, the SSGF lies at the head of the Gulf of California, on the boundary of the Pacific and North American plates (Elders and Sass, 1988). Consequently, the SSGF's unique geology creates the perfect setting for hot geothermal fluids to seep to the surface, and has been slated as a site for geothermal electricity-generating plants. There are no previous Bulletin reports on the Salton Buttes.
The Salton Buttes reside near the SE end of the Salton Sea. The Sea resides on the floor of the Salton Trough, chiefly in Imperial County, California. This briny water body is about 56 x 10 km. The Buttes lie along a NNE trending line spanning a distance of 7 km. The Salton Trough was filled, in part, by sediments carried by the Colorado River, which eventually built up and blocked the river's flow. The river was diverted away from the Salton Trough, yet, in 1905, heavy rainfall caused nearby levees to collapse, creating the Salton Sea (Morris, 2008).
Until recent work by Lynch and others (2011) and Schmidt and others (2013), the Salton Buttes were thought to have been formed by extruded magma during the late Pleistocene, ~16,000 BP. Age dates for some lavas are now dated to closer to 2,000 BP, much younger than originally understood, bringing closer scrutiny of the Buttes by the U.S. Geological Survey (USGS) California Volcano Observatory and other agencies concerned with geological threats in California (Lynch and Adams, unpublished draft).
Red Island consists of two conjoined volcanoes of related, yet distinctly different, geology. They are 2.5 km SSW of the Mullet Island fumaroles, an area discussed further by Lynch and others (2013).
Mullet Island fumaroles: As the briny water level of the Salton Sea began dropping in 1983, a number of fumarole fields were exposed subaerially for the first time since 1945. The Salton Sea overlaps the SSGF and, as a result, an interaction of rising gas and hot water with sediments has produced a number of hot, fumarolic gryphons (mud volcanoes) and salses (bubbling water in calderas of gryphons) (Lynch and others, 2013). Over-pressured subsurface gas cause the upward migration of fluidized sediment, creating these gryphons, as seen in figure 3.
The NW trending alingment of these geothermal features is suggestive of a fault, most likely the Calipatria fault. Other fumarole fields are still below water level or are being exposed as the lake recedes.
Red Island vents. Before the work on Mullet Island fumaroles was published, Michael McKibben, while on a 2008 Desert Symposium field trip (Reynolds and others, 2008), mentioned a 'volcanic hotspot' on the SW flank of the N volcano at Red Island in a private communication to Lynch and Adams. However, a swift search of the area during the field trip did not reveal its location. As a result of this observation, Lynch and Adams performed a partial survey of the SW flank of the N volcano on 6, 7, and 29 November 2013, which resulted in the discovery of the five hot steaming vents on the summit of the south-facing slope. Lynch and Adams found that the vents were distributed along an ~80 m long line trending N65E, which they recognized as a possible fault.
All attempts at identifying vents were made before sunrise, when the air temperature was at its lowest diurnal value (~8°C). This provided a recognizable thermal contrast between cold and hot rocks. Lynch and Adams noted that it was unlikely that warm air coming from the vents could have been felt on a hot or windy day, as the vents appeared unremarkable from a relatively close distance (a few meters), "among the uneven field of loose, jutting volcanic rocks." To locate the vents, Lynch and Adams employed the following three tactics:
1. An Agena ThermoVision 470 infrared camera was used to look for areas that were warmer than the background (e.g., figure 4, lower). Absolute temperatures from the camera may have been off by 3-4°C due to systematic errors, but the image records relative temperatures between different parts of scene. were preserved. The vent seen in figure 4 may have been deliberately covered with a pile of rocks.
2. They reached into holes and crevasses to check for heat.
3. They measured rock temperatures using a Martin P. Jones & Associates, Inc., Model 9910 TE Infrared Thermometer. Because it was small enough to be placed deeper in the vents, the temperatures from this thermometer were higher than the IR camera temperatures.
Lynch and Adams found one vent "by feeling hot air coming from it," one "by noticing wet rock," one "by seeing its steam cloud," and two by locating them with the IR camera. Once located, all vents were found to be steaming (figure 5) and surrounded by rocks wet from condensation.
No surface deposits (e.g., sulfur) were seen, aside from water and greenish algae. The temperatures 1-2 m within the vents were 35-38°C. According to Lynch and Adams, these hotspots may "represent heat from original volcanism, or recent magma intrusions that have not reached the surface." The distribution of these vents, distinguished as H1, H2, H3, H4, H5, is shown in figure 6.
The team was relatively confident that no additional vents were located within the area extending 225 m to the S and W, although a more complete survey must be undertaken to investigate seismicity and movement/deformation of the area from GPS networks. However, other "warm spots" not associated with venting or outgassing were found on the SW flank of the N volcano. They were ~5-10°C warmer than ambient temperatures and may represent weak signals from the warm interior of the volcano. More likely, however, the warmer temperatures are due to emissivity variations in rock layers, or normal temperature distributions that occur in crevasses where rocks are not able to radiate heat into the cold night sky.
Geothermal electricity-generating plants. According to the Geothermal Energy Association, currently there are three major geothermal production sites in the Imperial Valley, totaling in 16 plants. Figure 7 shows one of these sites, which hosts seven geothermal plants with running capacities ranging from 5-45 MW (Geothermal Energy Association). Despite the fact that this site alone has contributed enough electricity to power ~100,000 homes, geothermal energy only accounts for 4.4% of all system power in California (Matek and Gawell, 2014). The SSGF is considered the best opportunity for increasing the production of geothermal energy in California. The unique geology of the Salton Sea area allows geothermal fluids to seep to the surface, allowing a range of capacity from 1,700 to 2,900 MW.
References. Elders, W and Sass, J, 10 November 1988, The Salton Sea Scientific Drilling Project; Journal of Geophysical Research, v. 03, no. B11, pp. 12,953-12,968.
Lynch, D., Hudnut, K., and Adams, P., 2013, Development and growth of recently-exposed fumarole fields near Mullet Island, Imperial County, California; Geomorphology, v. 195, pp. 27-44.
Lynch, D.K., Schmitt, A.K.., Rood, D., and Akciz, S, 2011, Radiometric Dating of the Salton Buttes, Proposal to the Southern California Earthquake Center.
Matek, B., and Gawell, K., February 2014, Report on the State of Geothermal Energy in California; Geothermal Energy Association, 2014.
Morris, R., 2008, Welcome to the Salton Trough, California State University Long Beach Geology.
Reynolds, R., Jefferson, G., Lynch, D., 2008, Trough to Trough: The Colorado River and the Salton Sea, Proceedings of the 2008 Desert Symposium, Robert E. Reynolds (ed.), California State University, Desert Studies Consortium and LSA Associates, Inc.
Schmitt, A, Martin, A, Stockli, D, Farley, K, Lovera, O, 2013, (U--Th)/He zircon and archaeological ages for a late prehistoric eruption in the Salton Trough (California, USA), Geology, January 2013, v. 41, pp. 7-10.
Geologic Background. The Salton Buttes consist of five small rhyolitic lava domes extruded onto Quaternary sediments of the Colorado River delta at the SE margin of the Salton Sea. Their age has variously been considered to be late Pleistocene or early Holocene based on different dating techniques. Recent paleomagnetic dating calibrated by radiocarbon ages suggests that the domes were erupted during an interval of about 500 years between about 2,300 and 1,800 years ago, with the possible exception of Mullet Island at the northern end of the field, which could be as much as 5,000 years older. The present-day saline Salton Sea was formed in the early 20th century by unintended flooding into the basin formerly occupied by Pleistocene Lake Cahuilla Lake during diversion of the Colorado River for irrigation purposes. The Salton Sea geothermal field produces saline brines.
Information Contacts: David Lynch, Earthquake Science Center, USGS- Pasadena; Paul Adams, Thule Scientific, Topanga, CA (URL: http://thulescientific.com/Research.html); The Center for Land Use Interpretation, Culver City, CA (URL: http://clui.org/); and Geothermal Energy Association, Washington, D.C. (URL: http://geo-energy.org/).
Santa Maria (Guatemala) — March 2014 Cite this Report
Santa Maria
Guatemala
14.757°N, 91.552°W; summit elev. 3745 m
All times are local (unless otherwise noted)
Large May 2014 eruption with ashfall, pyroclastic flow, and lava flow; activity during October 2011-June 2014
This report summarizes activity from Santa María's active cone, Santiaguito, during October 2011-June 2014. Ash explosions, ashfall, and incandescent avalanches were observed throughout this time period. During the rainy season (April-September), lahars were frequently reported within the major drainages in the southern sector of the volcano. The sources for this report were Guatemala's Instituto Nacional de Sismologia, Vulcanologia, Meteorologia e Hidrologia (INSIVUMEH), Washington Volcanic Ash Advisory Center (VAAC), and Coordinadora Nacional para la Reducción de Desastres (CONRED).
Recurrent ash explosions. INSIVUMEH and the Washington VAAC reported frequent ash explosions from Santiaguito's active dome, Caliente, during October 2011-June 2014 (figure 35). Ash plumes were typically in the range of 500 m above the dome with exceptional cases in the range of 4,000 m, such as the explosive event on 9 May 2014. Significant ash plumes were known to drift as far as the Guatemala-Mexico border (such as activity during 5-6 November 2011 when ash extended 18-28 km SE of the summit). Degassing from the Caliente dome also generated frequent, diffuse, white plumes that rose to heights around 200 m above the summit.
Ashfall from explosions and rumbling noises from explosions and avalanches were frequently reported in communities nearby (table 5). Following activity on 9 May 2014, ashfall triggered evacuations affecting ~130 people. CONRED and INSIVUMEH reported that ash had extended up to 20 km from the summit reaching the communities of Las Marías, San Marcos (10 km SW), Palajunoj (18 km SSW), El Faro (SW flank), La Florida (5 km S), Patzulín, and Quetzaltenango (18 km WNW).
Table 5. Ashfall from explosions at Santa María's active dome, Santiaguito, was reported in numerous communities during November 2011-June 2014. Courtesy of INSIVUMEH.
| Year |
Date |
Town reporting ashfall |
| 2011 |
2 Nov. |
Las Marías, El Rosario (45 km SW), San Marcos (46 km NW), Palajunoj (SW), and San Felipe Retalhuleu (25 km SSE of the volcano) |
| 2012 |
19 Jan. |
La Florida (5 km S), Palajunoj (SW flank), and San Marcos (46 km NW) |
| 27 Jan. |
Monte Claro (S) and Palajunoj (SW) |
| 1 Feb. |
Monte Claro (S) and Palajunoj (SW) |
| 2-3 Feb. |
La Florida (5 km S), San Marcos (46 km NW), and Palajunoj (W) |
| 23 Feb. |
El Rosario (45 km SW), Monte Bello (S), Palajunoj (SW), and Quetzaltenango (18 km WNW) |
| 27-28 Feb. |
Monte Claro (S), San Marcos (46 km NW), Buena Vista (49 km NW), El Rosario, Monte Bello, and Palajunoj |
| 11-12 Mar. |
Observatory Vulcanológico de Santiaguito (OVSAN), the El Faro and Patzulín ranches, and in the village of Las Marías (SW) |
| 8-9 Mar. |
Loma Linda (W), San Marcos (10 km SW), and Palajunoj (W) |
| 25-27 Mar. |
Observatory Vulcanológico de Santiaguito (OVSAN), at the El Faro, La Florida, and Patzulín ranches (SW), and in the village of Santa María de Jesús (SE) |
| 30 Apr.-1 May |
Quetzaltenango (18 km WNW) |
| 22 May |
San Felipe (15 km SSW), El Nuevo Palmar (12 km SSW) |
| 22 Jun. |
Santa María de Jesús (SE) |
| 1-3 Jul. |
Ashfall was reported in La Florida (5 km S) and Monte Claro (S) |
| 4-6 & 9-10 Jul. |
La Florida (5 km S), Monte Claro (S), and Palajunoj (SW |
| 18-20 Aug. |
Monte Claro (S), El Rosario (45 km SW), Palajunoj (S), |
| 25-26 Aug. |
Monte Claro (S) |
| 27 Aug. |
San José (SE) |
| 21 Nov. |
Las Marías, Calaguaché (9 km S), and Nuevo Palmar (12 km S) |
| 13-14 Dec. |
La Florida (5 km S) and El Faro (SW flank) |
| 2013 |
30 Jan. |
Esperanza and San Mateo in Quetzaltenango |
| 7-8 & 10-11 Feb. |
La Florida (5 km S) |
| 23 Feb. |
Quetzaltenango (18 km WNW) |
| 22 Feb. |
Monte Claro (S) |
| 20-21 Feb. |
Palajunoj (SW) and La Florida (5 km S) |
| 6-11 Mar. |
Calahuaché, El Faro (SW flank), and San José Patzulín (SW flank) |
| 19 Mar. |
San José (SE) |
| 17-18 Mar. |
Quetzaltenango (18 km WNW) |
| 13-14 & 25-26 Mar. |
El Faro (SW flank) and La Florida (5 km S) |
| 29-30 Mar. |
El Faro (SW flank) and La Florida (5 km S) |
| 1-2 Apr. |
San José (SE) |
| 29 Apr. |
San Jose, La Quina, and areas near Calahuaché (SE) |
| 16 May |
La Florida and Monte Claro (S) |
| 30 May |
Calahuaché village (SE) |
| 9 Jun. |
Monte Claro (S) |
| 23 Jun. |
Monte Claro (S) |
| 27-28 Jun. |
Monte Claro (S) and Finca La Florida (5 km S) |
| 1 Aug. |
Monte Claro (S) and La Florida (5 km S) |
| 6 Aug. |
Palajunoj area (S) |
| 10 Aug. |
Monte Claro (S) |
| 27 Aug. |
Palajunoj (S) |
| 23 Aug. |
Palajunoj region (S) |
| 24 Sept. |
Monte Claro (S) |
| 2014 |
27-28 Jan. |
Santa María de Jesús (SE) and the El Rosario Palajunoj finca |
| 13-14 Mar. |
La Florida and Monte Claro (S) |
| 14-15 Apr. |
San Marcos (10 km SW), La Florida (5 km S), Rosario, and other areas in Palajunoj (18 km SSW) |
| 9 May |
Las Marías, San Marcos (10 km SW), Palajunoj (18 km SSW), El Faro (SW flank), La Florida (5 km S), Patzulín, and Quetzaltenango (18 km WNW) |
| 11 May |
San Marcos and the El Rosario Palajunoj finca |
| 19-20 May |
Monte Claro (S) |
| 23 May |
parts of Monte Claro (S) |
| 2 Jun. |
Monte Bello and Loma Linda (W) |
| 19 Jun. |
Parcelamiento Monte Claro (S of the summit) |
Avalanches and pyroclastic flows originating from Caliente dome were reported throughout late 2011 through June 2014 (table 6). A pyroclastic flow observed on 9 May 2014 traveled ~7 km from the active lava dome (figure 35). Approximately 1 million cubic meters of tephra was deposited within the Nimá I drainage. Secondary explosions occurred along the flowpath associated with hot deposits in contact with river water.
Table 6. A summary of significant pyroclastic flows from Santa María's Santiaguito occurred during February 2012-May 2014. Courtesy of INSIVUMEH.
| Year |
Date |
Direction |
| 2012 |
22-23 Feb. |
upper flanks |
| 26 Mar. |
W flank |
| 29-31 Jul. |
S flank |
| 27-30 Nov. |
upper flanks |
| 2013 |
11-12 Mar. |
SW,S,SE and E flanks |
| 27 Jun. |
S flank |
| 6 Aug. |
S and SW flanks |
| 7 Aug. |
E, S, SW flanks |
| 27 Aug. |
extended down the SW flank |
| 22 & 24 Aug. |
portions of the SE rim collapsed and flows were directed S and SE |
| 21 Sept. |
restricted to the upper flanks |
| 2014 |
23 Jan. |
restricted to the upper flanks |
| 11 Feb. |
directed NE |
| 9 May |
E and SE flanks and also channelized by the notch on the E flank |
Lahars. During 2012-2014, lahars began flowing down Santa María's SE drainages during the onset of the rainy season (table 7). INSIVUMEH reported that many of these events were triggered by heavy rainfall and were frequently contained within the Nimá I drainage (figure 37). Lahars following the nearby rivers Nimá II, San Isidro, and Tambor and merged with the larger river, Samalá. These primary drainages are located S and SW of the active dome (see map in figure 28 of BGVN 24:03; note that Río San Isidro is an intermittent stream located between the Tambor and Nimá II rivers), three of which were included in a hazard map prepared by INSIVUMEH in collaboration with Japan International Cooperation Agency (JICA) in 2003 (figure 38). INSIVUMEH and CONRED released public announcements when Río Samalá was threatened by lahars (for example: 21 May 2012, 23 June 2012, and 6 June 2014) that included specific warnings for the Castillo de Armas bridge; the bridge supports the Interamerican Highway where it passes through the town of San Sebastián.
Table 7. During April 2012- June 2014, weak-to-strong flowing lahars were frequently triggered by heavy rainfall, mainly during April-September each year. Courtesy of INSIVUMEH.
| Year |
Date |
Drainages |
Dimensions |
Load |
Notes |
Damage/At risk |
| 2012 |
25 Apr. |
Nimá II |
na |
1.5 m diameter blocks; branches and tree trunks; sulfur odor |
na |
na |
| 21 May |
Nimá II |
na |
0.4 m diameter blocks; branches and tree trunks |
moderate flow |
threatened the Castillo Armas bridge and the river bend of El Niño |
| 29 May |
Nimá I & San Isidro |
na |
1.5 m diameter blocks; branches and tree trunks; sulfur odor |
hot material; moderate strength in Río Nimá I and weak in Río San Isidro; seismic station recorded the event |
na |
| 23 Jun. |
Nimá I & San Isidro |
na |
0.8 m diameter blocks; branches and tree trunks |
moderate strength |
threatened the Castillo Armas bridge and the river bend of El Niño |
| 25 Jun. |
Nimá I |
na |
na |
weak strength |
na |
| 27 Jun. |
Nimá I |
16 m wide; .9 m high |
0.8 m diameter blocks; sulfur odor |
hot material; weak strength; seismic station recorded the event |
na |
| 4 Sept. |
Nimá I & San Isidro |
30 m wide; 2 m high |
0.5 m diameter blocks; branches and tree trunks; sulfur odor |
hot material; moderate strength; seismic station recorded the event |
na |
| 2013 |
1 Jun. |
Nimá I |
na |
na |
weak strength |
na |
| 4 Jun. |
Nimá I |
40 m wide; 2.5 m high |
blocks |
moderate flow |
na |
| 8 Jun. |
Nimá I, Tambor, & Samalá |
na |
blocks |
moderate flow |
na |
| 20 Jun. |
Nimá I and Tambor |
30 m wide; 3 m high |
3 m diameter blocks; branches and tree trunks |
moderate flow |
na |
| 11 Aug. |
San Isidro, Tambor, & Samalá |
30 m wide; 1.5 m high |
1.5 m in diameter blocks; sulfur odor; branches and tree trunks and plants |
hot material |
vibrations were felt as the flow passed observers |
| 31 Aug. |
Nimá I |
na |
2 m diameter blocks; branches and tree trunks |
moderate flow |
vibrations were felt as the flow passed observers; river banks were weakened after the flow and small avalanches occurred |
| 5 Sept. |
Nimá I |
na |
1-2 m diameter blocks |
na |
river banks were weakened after the flow and small avalanches occurred |
| 10 Sept. |
Nimá I |
15 m wide; 6 m high |
3 m diameter blocks; sulfur odor |
hot material; moderate flow |
na |
| 7 Oct. |
Nimá I |
10 m wide; 1 m high |
na |
weak flow |
na |
| 2014 |
14 May |
Nimá I |
na |
2 m diameter blocks; branches and tree trunks |
na |
na |
| 18 May |
Nimá I, San Isidro, & Tambor |
15 m wide; 2 m high |
1.5 m in diameter blocks; sulfur odor; branches of tree trunks and plants |
hot material; moderate flow |
vibrations were felt as the flow passed observers |
| 22 May |
Nimá I |
15 m wide; 2 m high |
1 m diameter blocks; sulfur odor; branches and tree trunks |
hot material; moderate flow |
na |
| 24 May |
Nimá I, San Isidro, & Tambor |
25 m wide; 2 m high |
sulfur odor; branches and tree trunks |
hot material; moderate flow |
vibrations were felt as the flow passed observers |
| 29 May |
Nimá I, San Isidro, Tambor, & Samalá |
25 m wide; 3 m high |
0.5 and 2 m diameter blocks; sulfur odor; branches and tree trunks |
hot material; strong flow |
vibrations were felt as the flow passed observers |
| 30 May |
Nimá I & San Isidro |
na |
na |
weak and moderate flow |
in the afternoon and evening |
| 1 Jun. |
Nimá I, San Isidro, & Samalá |
na |
sulfur odor |
hot material; strong flow |
in the afternoon and evening |
| 2 Jun. |
Nimá I & San Isidro |
na |
na |
moderate and strong flow |
na |
| 6 Jun. |
Nimá I |
80 m wide; 5 and 9 m high in series |
5 m diameter |
strong flow |
emergency evacuation of Observatory staff; lost scientific equipment; damage to the Castillo Armas bridge |
| 7 Jun. |
Nimá I |
35 m wide |
1 m diameter blocks; sulfur odor |
hot material; strong flow |
na |
| 8 Jun. |
Nimá I |
na |
na |
weak and moderate flow |
na |
The most damaging lahar during this reporting period occurred on 6 June 2014. The lahar flowed in pulses down the Nimá I drainage with crests 5-9 m high reaching a maximum width of 80 m. The Santiaguito Observatory (OVSAN) was forced to evacuate when the lahar overflowed the banks and spread across the facility grounds; important scientific equipment was damaged and also washed away. The lahar also flowed into a nearby farm.
Reference. Ball, J.L., Calder, E.S., Hubbard, B.E., and Bernstein, M.L., 2013, An assessment of hydrothermal alteration in the Santiaguito lava dome complex, Guatemala: implications for dome collapse hazards, Bulletin of Volcanology, 75:676.
Geologic Background. Symmetrical, forest-covered Santa María volcano is part of a chain of large stratovolcanoes that rise above the Pacific coastal plain of Guatemala. The sharp-topped, conical profile is cut on the SW flank by a 1.5-km-wide crater. The oval-shaped crater extends from just below the summit to the lower flank, and was formed during a catastrophic eruption in 1902. The renowned Plinian eruption of 1902 that devastated much of SW Guatemala followed a long repose period after construction of the large basaltic andesite stratovolcano. The massive dacitic Santiaguito lava-dome complex has been growing at the base of the 1902 crater since 1922. Compound dome growth at Santiaguito has occurred episodically from four vents, with activity progressing E towards the most recent, Caliente. Dome growth has been accompanied by almost continuous minor explosions, with periodic lava extrusion, larger explosions, pyroclastic flows, and lahars.
Information Contacts: Instituto Nacional de Sismologia, Vulcanologia, Meteorologia e Hydrologia (INSIVUMEH), Unit of Volcanology, Geologic Department of Investigation and Services, 7a Av. 14-57, Zona 13, Guatemala City, Guatemala (URL: http://www.insivumeh.gob.gt/inicio.html); Coordinadora Nacional para la Reducción de Desastres (CONRED), Av. Hincapié; 21-72, Zona 13, Guatemala City, Guatemala (URL: http://www.conred.org/); and Washington Volcanic Ash Advisory Center (VAAC), Satellite Analysis Branch (SAB), NOAA/NESDIS E/SP23, NOAA Science Center Room 401, 5200 Auth Rd, Camp Springs, MD 20748, USA (URL: http://www.ospo.noaa.gov/Products/atmosphere/vaac/).
Villarrica
Chile
39.42°S, 71.93°W; summit elev. 2847 m
All times are local (unless otherwise noted)
During November 2010 to December 2013, lava lake persists but few explosions
The year 2014 marks the 3rd decade of largely non-explosive activity at Villarrica, historically one of the most active volcanoes in the Andes. Villarrica has been relatively quiet since our last report, which discussed events from April 2010 to October 2010 (BGVN 35:10). This report covers the time period from November 2010 to December 2013.
During this reporting period, comparative quiet prevailed. There were occasional cases reported of spattering lava, small white plumes, minor ash emissions (up to 50 m above the crater rim), and nighttime incandescence reflected off of the plumes according to Proyecto Observación Villarrica Internet (POVI) and Observatorio Volcanológico de los Andes del Sur (OVDAS-SERNAGEOMIN). Satellite thermal radiance during the reporting interval suggested often low radiance, with rare cases of high incandescence consistent with turbulence and fountaining in the deep, 40 m wide lava lake.
On 17 September 2011 remobilized tephra rose ~500 m above the crater, which according to POVI, was likely caused by a sudden impact when a snow cornice detached and fell into the crater. On 19 September 2011, a rapid rise in the level of the lava lake caused much of the snow and ice to melt, especially on the southern inner wall. Strombolian explosions from the crater were observed on 26 September 2011, and tephra deposits on the E edge of the crater were noted. On 27 September 2011 incandescence from the lava lake was reflected in the cloud cover above.
The period from November 2011 to March 2012 saw very little explosive activity. Two small ash emissions occurred on 7 March. Incandescence from the crater was observed from the town of Pucon (16 km N) during 7-8 March. During 7-9 March, lava spattering from the lava lake was observed for the first time that year. Four small ash emissions were observed during 13-14 March. On 20 March a large, white plume was visible above the crater. The observer postulated that due to the humid atmospheric conditions that day, the steam condensate in the visible plume remained conspicuous both to a height of 1,500 m above the crater as well as 20 km SW of the crater.
According to POVI, an ash plume rose 50 m above Villarrica on 19 April 2012. Incandescence from Villarrica's crater subsided in mid-April and was undetected by satellite and ground observations at least through 10 November 2012.
On 30 January 2013, weak incandescence was observed in the near-infrared spectrum from the ASTER (Advanced Spaceborne Thermal Emission and Reflection Radiometer) instrument on the Terra satellite. POVI reported that satellite images of Villarrica acquired on 25 July revealed a weak thermal anomaly. On 29 July 2013 observers photographed the crater and described a thermal anomaly on the S edge of the crater rim, in the same area from which a lava flow originated on 29 December 1971. They also heard deep degassing sounds. A second photograph showed a diffuse gas plume rising from the bottom of the crater, and ash and lapilli on the snow on the inner crater walls.
Analysis of MODIS (Moderate Resolution Imaging Spectroradiometer) band 21 (3.929-3.989 μm) satellite images from 2003 to 2013 highlights three main cycles of activity. These were characterized by convective lava fountains and Strombolian explosions from the lava pit, located ~ 40-150 m below the rim of the crater, according to POVI. The last time MODIS infrared sensors detected elevated thermal radiance was in early 2012 (figure 8).
In accord with the thermal radiance data seen in figure 28, OVDAS-SERNAGEOMIN maintained an Alert Level of Green for Villarrica from the period of 5 March 2012 to 30 December 2013, characterizing Villarrica as active but stable with no immediate threat. The seismicity reports from OVDAS-SERNAGEOMIN during the period of July 2013 to December 2013 showed the monthly number of earthquakes recorded ranged from 439 to 1,433. The reduced displacement of the tremors recorded fluctuated throughout July 2013- December 2013 from 0.6 cm² to 9.9 cm². During this period of time, the amount of SO2 emissions recorded by a scanning DOAS spectrometer OVDAS-SERNAGEOMIN varied from 156 tons/day to 888 tons/day. The height above the crater rim of the steam-gas plumes ranged from 150 m to 1,500 m. MODIS did not record any thermal anomalies during this period of time.
Geologic Background. The glacier-covered Villarrica stratovolcano, in the northern Lakes District of central Chile, is ~15 km south of the city of Pucon. A 2-km-wide caldera that formed about 3,500 years ago is located at the base of the presently active, dominantly basaltic to basaltic andesite cone at the NW margin of a 6-km-wide Pleistocene caldera. More than 30 scoria cones and fissure vents are present on the flanks. Plinian eruptions and pyroclastic flows that have extended up to 20 km from the volcano were produced during the Holocene. Lava flows up to 18 km long have issued from summit and flank vents. Eruptions documented since 1558 CE have consisted largely of mild-to-moderate explosive activity with occasional lava effusion. Glaciers cover 40 km2 of the volcano, and lahars have damaged towns on its flanks.
Information Contacts: Proyecto Observación Villarrica Internet (POVI) (URL: http://www.povi.cl/); and Observatorio Volcanológico de los Andes del Sur Servicio Nacional de Geologia y Mineria (OVDAS SERNAGEOMIN), Santiago, Chile (URL: http://www2.sernageomin.cl/ovdas).