Recently Published Bulletin Reports
Erebus (Antarctica) Lava lake remains active; most thermal alerts recorded since 2019
Rincon de la Vieja (Costa Rica) Frequent phreatic explosions during July-December 2023
Bezymianny (Russia) Explosion on 18 October 2023 sends ash plume 8 km high; lava flows and incandescent avalanches
Kilauea (United States) Low-level lava effusions in the lava lake at Halema’uma’u during July-December 2022
Nyamulagira (DR Congo) Lava flows and thermal activity during May-October 2023
Bagana (Papua New Guinea) Explosions, ash plumes, ashfall, and lava flows during April-September 2023
Mayon (Philippines) Lava flows, pyroclastic flows, ash emissions, and seismicity during April-September 2023
Nishinoshima (Japan) Eruption plumes and gas-and-steam plumes during May-August 2023
Krakatau (Indonesia) White gas-and-steam plumes and occasional ash plumes during May-August 2023
Villarrica (Chile) Strombolian activity, gas-and-ash emissions, and crater incandescence during April-September 2023
Merapi (Indonesia) Frequent incandescent avalanches during April-September 2023
Ebeko (Russia) Moderate explosive activity with ash plumes continued during June-November 2023
Erebus (Antarctica) — January 2024  Cite this Report
Erebus
Antarctica
77.53°S, 167.17°E; summit elev. 3794 m
All times are local (unless otherwise noted)
Lava lake remains active; most thermal alerts recorded since 2019
The lava lake in the summit crater of Erebus has been active since at least 1972. Located in Antarctica overlooking the McMurdo Station on Ross Island, it is the southernmost active volcano on the planet. Because of the remote location, activity is primarily monitored by satellites. This report covers activity during 2023.
The number of thermal alerts recorded by the Hawai'i Institute of Geophysics and Planetology’s MODVOLC Thermal Alerts System increased considerably in 2023 compared to the years 2020-2022 (table 9). In contrast to previous years, the MODIS instruments aboard the Aqua and Terra satellites captured data from Erebus every month during 2023. Consistent with previous years, the lowest number of anomalous pixels were recorded in January, November, and December.
Table 9. Number of monthly MODIS-MODVOLC thermal alert pixels recorded at Erebus during 2017-2023. See BGVN 42:06 for data from 2000 through 2016. The table was compiled using data provided by the HIGP – MODVOLC Thermal Alerts System.
| Year |
Jan |
Feb |
Mar |
Apr |
May |
Jun |
Jul |
Aug |
Sep |
Oct |
Nov |
Dec |
SUM |
| 2017 |
0 |
21 |
9 |
0 |
0 |
1 |
11 |
61 |
76 |
52 |
0 |
3 |
234 |
| 2018 |
0 |
21 |
58 |
182 |
55 |
17 |
137 |
172 |
103 |
29 |
0 |
0 |
774 |
| 2019 |
2 |
21 |
162 |
151 |
55 |
56 |
75 |
53 |
29 |
19 |
1 |
0 |
624 |
| 2020 |
0 |
2 |
16 |
18 |
4 |
4 |
1 |
3 |
18 |
3 |
1 |
6 |
76 |
| 2021 |
0 |
9 |
1 |
0 |
2 |
56 |
46 |
47 |
35 |
52 |
5 |
3 |
256 |
| 2022 |
1 |
13 |
55 |
22 |
15 |
32 |
39 |
19 |
31 |
11 |
0 |
0 |
238 |
| 2023 |
2 |
33 |
49 |
82 |
41 |
32 |
70 |
64 |
42 |
17 |
5 |
11 |
448 |
Sentinel-2 infrared images showed one or two prominent heat sources within the summit crater, accompanied by adjacent smaller sources, similar to recent years (see BGVN 46:01, 47:02, and 48:01). A unique image was obtained on 25 November 2023 by the OLI-2 (Operational Land Imager-2) on Landsat 9, showing the upper part of the volcano surrounded by clouds (figure 32).
Geologic Background. Mount Erebus, the world's southernmost historically active volcano, overlooks the McMurdo research station on Ross Island. It is the largest of three major volcanoes forming the crudely triangular Ross Island. The summit of the dominantly phonolitic volcano has been modified by one or two generations of caldera formation. A summit plateau at about 3,200 m elevation marks the rim of the youngest caldera, which formed during the late-Pleistocene and within which the modern cone was constructed. An elliptical 500 x 600 m wide, 110-m-deep crater truncates the summit and contains an active lava lake within a 250-m-wide, 100-m-deep inner crater; other lava lakes are sometimes present. The glacier-covered volcano was erupting when first sighted by Captain James Ross in 1841. Continuous lava-lake activity with minor explosions, punctuated by occasional larger Strombolian explosions that eject bombs onto the crater rim, has been documented since 1972, but has probably been occurring for much of the volcano's recent history.
Information Contacts: Hawai'i Institute of Geophysics and Planetology (HIGP) - MODVOLC Thermal Alerts System, School of Ocean and Earth Science and Technology (SOEST), Univ. of Hawai'i, 2525 Correa Road, Honolulu, HI 96822, USA (URL: http://modis.higp.hawaii.edu/); Copernicus Browser, Copernicus Data Space Ecosystem, European Space Agency (URL: https://dataspace.copernicus.eu/browser/); NASA Earth Observatory, EOS Project Science Office, NASA Goddard Space Flight Center, Goddard, Maryland, USA (URL: https://earthobservatory.nasa.gov/images/152134/erebus-breaks-through).
Rincon de la Vieja (Costa Rica) — January 2024 Cite this Report
Rincon de la Vieja
Costa Rica
10.83°N, 85.324°W; summit elev. 1916 m
All times are local (unless otherwise noted)
Frequent phreatic explosions during July-December 2023
Rincón de la Vieja is a volcanic complex in Costa Rica with a hot convecting acid lake that exhibits frequent weak phreatic explosions, gas-and-steam emissions, and occasional elevated sulfur dioxide levels (BGVN 45:10, 46:03, 46:11). The current eruption period began June 2021. This report covers activity during July-December 2023 and is based on weekly bulletins and occasional daily reports from the Observatorio Vulcanologico Sismologica de Costa Rica-Universidad Nacional (OVSICORI-UNA).
Numerous weak phreatic explosions continued during July-December 2023, along with gas-and-steam emissions and plumes that rose as high as 3 km above the crater rim. Many weekly OVSICORI-UNA bulletins included the previous week's number of explosions and emissions (table 9). For many explosions, the time of explosion was given (table 10). Frequent seismic activity (long-period earthquakes, volcano-tectonic earthquakes, and tremor) accompanied the phreatic activity.
Table 9. Number of reported weekly phreatic explosions and gas-and-steam emissions at Rincón de la Vieja, July-December 2023. Counts are reported for the week before the Weekly Bulletin date; not all reports included these data. Courtesy of OVSICORI-UNA.
| OVSICORI Weekly Bulletin |
Number of explosions |
Number of emissions |
| 28 Jul 2023 |
6 |
14 |
| 4 Aug 2023 |
10 |
12 |
| 1 Sep 2023 |
13 |
11 |
| 22 Sep 2023 |
12 |
13 |
| 29 Sep 2023 |
6 |
11 |
| 6 Oct 2023 |
12 |
5 |
| 13 Oct 2023 |
7 |
9 |
| 20 Oct 2023 |
1 |
15 |
| 27 Oct 2023 |
3 |
23 |
| 3 Nov 2023 |
3 |
10 |
| 17 Nov 2023 |
0 |
Some |
| 24 Nov 2023 |
0 |
14 |
| 8 Dec 2023 |
4 |
16 |
| 22 Dec 2023 |
8 |
18 |
Table 10. Summary of activity at Rincón de la Vieja during July-December 2023. Weak phreatic explosions and gas emissions are noted where the time of explosion was indicated in the weekly or daily bulletins. Height of plumes or emissions are distance above the crater rim. Courtesy of OVSICORI-UNA.
| Date |
Time |
Description of Activity |
| 1 Jul 2023 |
0156 |
Explosion. |
| 2 Jul 2023 |
0305 |
Explosion. |
| 4 Jul 2023 |
0229, 0635 |
Event at 0635 produced a gas-and-steam plume that rose 700 m and drifted W; seen by residents in Liberia (21 km SW). |
| 9 Jul 2023 |
1843 |
Explosion. |
| 21 Jul 2023 |
0705 |
Explosion. |
| 26 Jul 2023 |
1807 |
Explosion. |
| 28 Jul 2023 |
0802 |
Explosion generated a gas-and-steam plume that rose 500 m. |
| 30 Jul 2023 |
1250 |
Explosion. |
| 31 Jul 2023 |
2136 |
Explosion. |
| 11 Aug 2023 |
0828 |
Explosion. |
| 18 Aug 2023 |
1304 |
Explosion. |
| 21 Aug 2023 |
1224 |
Explosion generated gas-and-steam plumes rose 500-600 m. |
| 22 Aug 2023 |
0749 |
Explosion generated gas-and-steam plumes rose 500-600 m. |
| 24 Aug 2023 |
1900 |
Explosion. |
| 25 Aug 2023 |
0828 |
Event produced a steam-and-gas plume that rose 3 km and drifted NW. |
| 27-28 Aug 2023 |
0813 |
Four small events; the event at 0813 on 28 August lasted two minutes and generated a steam-and-gas plume that rose 2.5 km. |
| 1 Sep 2023 |
1526 |
Explosion generated plume that rose 2 km and ejected material onto the flanks. |
| 2-3 Sep 2023 |
- |
Small explosions detected in infrasound data. |
| 4 Sep 2023 |
1251 |
Gas-and-steam plume rose 1 km and drifted W. |
| 7 Nov 2023 |
1113 |
Explosion. |
| 8 Nov 2023 |
0722 |
Explosion. |
| 12 Nov 2023 |
0136 |
Small gas emissions. |
| 14 Nov 2023 |
0415 |
Small gas emissions. |
According to OVSICORI-UNA, during July-October the average weekly sulfur dioxide (SO2) flux ranged from 68 to 240 tonnes/day. However, in mid-November the flux increased to as high as 334 tonnes/day, the highest value measured in recent years. The high SO2 flux in mid-November was also detected by the TROPOMI instrument on the Sentinel-5P satellite (figure 43).
Geologic Background. Rincón de la Vieja, the largest volcano in NW Costa Rica, is a remote volcanic complex in the Guanacaste Range. The volcano consists of an elongated, arcuate NW-SE-trending ridge constructed within the 15-km-wide early Pleistocene Guachipelín caldera, whose rim is exposed on the south side. Sometimes known as the "Colossus of Guanacaste," it has an estimated volume of 130 km3 and contains at least nine major eruptive centers. Activity has migrated to the SE, where the youngest-looking craters are located. The twin cone of Santa María volcano, the highest peak of the complex, is located at the eastern end of a smaller, 5-km-wide caldera and has a 500-m-wide crater. A Plinian eruption producing the 0.25 km3 Río Blanca tephra about 3,500 years ago was the last major magmatic eruption. All subsequent eruptions, including numerous historical eruptions possibly dating back to the 16th century, have been from the prominent active crater containing a 500-m-wide acid lake located ENE of Von Seebach crater.
Information Contacts: Observatorio Vulcanológico Sismológica de Costa Rica-Universidad Nacional (OVSICORI-UNA), Apartado 86-3000, Heredia, Costa Rica (URL: http://www.ovsicori.una.ac.cr/); NASA Global Sulfur Dioxide Monitoring Page, Atmospheric Chemistry and Dynamics Laboratory, NASA Goddard Space Flight Center (NASA/GSFC), 8800 Greenbelt Road, Goddard MD 20771, USA (URL: https://so2.gsfc.nasa.gov/).
Bezymianny (Russia) — November 2023 Cite this Report
Bezymianny
Russia
55.972°N, 160.595°E; summit elev. 2882 m
All times are local (unless otherwise noted)
Explosion on 18 October 2023 sends ash plume 8 km high; lava flows and incandescent avalanches
Bezymianny, located on Russia’s Kamchatka Peninsula, has had eruptions since 1955 characterized by dome growth, explosions, pyroclastic flows, ash plumes, and ashfall. Activity during November 2022-April 2023 included gas-and-steam emissions, lava dome collapses generating avalanches, and persistent thermal activity. Similar eruptive activity continued from May through October 2023, described here based on information from weekly and daily reports of the Kamchatka Volcano Eruptions Response Team (KVERT), notices from Tokyo VAAC (Volcanic Ash Advisory Center), and from satellite data.
Overall activity decreased after the strong period of activity in late March through April 2023, which included ash explosions during 29 March and 7-8 April 2023 that sent plumes as high as 10-12 km altitude, along with dome growth and lava flows (BGVN 48:05). This reduced activity can be seen in the MIROVA thermal detection system graph (figure 56), which was consistent with data from the MODVOLC thermal detection system and with Sentinel-2 satellite images that showed persistent hotspots in the summit crater when conditions allowed observations. A renewed period of strong activity began in mid-October 2023.
Activity increased significantly on 17 October 2023 when large collapses began during 0700-0830 on the E flanks of the lava dome and continued to after 0930 the next day (figure 57). Ash plumes rose to an altitude of 4.5-5 km, extending 220 km NNE by 18 October. A large explosion at 1630 on 18 October produced an ash plume that rose to an altitude of 11 km (8 km above the summit) and drifted NNE and then NW, extending 900 km NW within two days at an altitude of 8 km. Minor ashfall was noted in Kozyrevsk (45 km WNW). At 0820 on 20 October an ash plume was identified in satellite images drifting 100 km ENE at altitudes of 4-4.5 km.
Lava flows and hot avalanches from the dome down the SE flank continued over the next few days, including 23 October when clear conditions allowed good observations (figures 58 and 59). A large thermal anomaly was observed over the volcano through 24 October, and in the summit crater on 30 October (figure 60). Strong fumarolic activity continued, with numerous avalanches and occasional incandescence. By the last week of October, volcanic activity had decreased to a level consistent with that earlier in the reporting period.
Aviation warnings were frequently updated during 17-20 October. KVERT issued a Volcano Observatory Notice for Aviation (VONA) on 17 October at 1419 and 1727 (0219 and 0527 UTC) raising the Aviation Color Code (ACC) from Yellow to Orange (second highest level). The next day, KVERT issued a VONA at 1705 (0505 UTC) raising the ACC to Red (highest level) but lowered it back to Orange at 2117 (0917 UTC). After another decrease to Yellow and back to Orange, the ACC was reduced to Yellow on 20 October at 1204 (0004 UTC). In addition, the Tokyo VAAC issued a series of Volcanic Ash Advisories beginning on 16 October and continuing through 30 October.
Geologic Background. The modern Bezymianny, much smaller than its massive neighbors Kamen and Kliuchevskoi on the Kamchatka Peninsula, was formed about 4,700 years ago over a late-Pleistocene lava-dome complex and an edifice built about 11,000-7,000 years ago. Three periods of intensified activity have occurred during the past 3,000 years. The latest period, which was preceded by a 1,000-year quiescence, began with the dramatic 1955-56 eruption. This eruption, similar to that of St. Helens in 1980, produced a large open crater that was formed by collapse of the summit and an associated lateral blast. Subsequent episodic but ongoing lava-dome growth, accompanied by intermittent explosive activity and pyroclastic flows, has largely filled the 1956 crater.
Information Contacts: Kamchatka Volcanic Eruptions Response Team (KVERT), Far Eastern Branch, Russian Academy of Sciences, 9 Piip Blvd., Petropavlovsk-Kamchatsky, 683006, Russia (URL: http://www.kscnet.ru/ivs/kvert/); Kamchatka Volcanological Station, Kamchatka Branch of Geophysical Survey, (KB GS RAS), Klyuchi, Kamchatka Krai, Russia (URL: http://volkstat.ru/); Tokyo Volcanic Ash Advisory Center (VAAC), 1-3-4 Otemachi, Chiyoda-ku, Tokyo 100-8122, Japan (URL: http://ds.data.jma.go.jp/svd/vaac/data/); Hawai'i Institute of Geophysics and Planetology (HIGP) - MODVOLC Thermal Alerts System, School of Ocean and Earth Science and Technology (SOEST), Univ. of Hawai'i, 2525 Correa Road, Honolulu, HI 96822, USA (URL: http://modis.higp.hawaii.edu/); MIROVA (Middle InfraRed Observation of Volcanic Activity), a collaborative project between the Universities of Turin and Florence (Italy) supported by the Centre for Volcanic Risk of the Italian Civil Protection Department (URL: http://www.mirovaweb.it/); Copernicus Browser, Copernicus Data Space Ecosystem, European Space Agency (URL: https://dataspace.copernicus.eu/browser/).chr
Kilauea (United States) — January 2023 Cite this Report
Kilauea
United States
19.421°N, 155.287°W; summit elev. 1222 m
All times are local (unless otherwise noted)
Low-level lava effusions in the lava lake at Halema’uma’u during July-December 2022
Kīlauea is the southeastern-most volcano in Hawaii and overlaps the E flank of the Mauna Loa volcano. Its East Rift Zone (ERZ) has been intermittently active for at least 2,000 years. An extended eruption period began in January 1983 and was characterized by open lava lakes and lava flows from the summit caldera and the East Rift Zone. During May 2018 magma migrated into the Lower East Rift Zone (LERZ) and opened 24 fissures along a 6-km-long NE-trending fracture zone that produced lava flows traveling in multiple directions. As lava emerged from the fissures, the lava lake at Halema'uma'u drained and explosions sent ash plumes to several kilometers altitude (BGVN 43:10).
The current eruption period started during September 2021 and has recently been characterized by lava effusions, spatter, and sulfur dioxide emissions in the active Halema’uma’u lava lake (BGVN 47:08). Lava effusions, some spatter, and sulfur dioxide emissions have continued during this reporting period of July through December 2022 using daily reports, volcanic activity notices, and abundant photo, map, and video data from the US Geological Survey's (USGS) Hawaiian Volcano Observatory (HVO).
Summary of activity during July-December 2022. Low-level effusions have continued at the western vent of the Halema’uma’u crater during July through early December 2022. Occasional weak ooze-outs (also called lava break outs) would occur along the margins of the crater floor. The overall level of the active lava lake throughout the reporting period gradually increased due to infilling, however it stagnated in mid-September (table 13). During September through November, activity began to decline, though lava effusions persisted at the western vent. By 9 December, the active part of the lava lake had completely crusted over, and incandescence was no longer visible.
Table 13. Summary of measurements taken during overflights at Kīlauea that show a gradual increase in the active lava lake level and the volume of lava effused since 29 September 2021. Lower activity was reported during September-October. Data collected during July-December 2022. Courtesy of HVO.
| Date: |
Level of the active lava lake (m): |
Cumulative volume of lava effused (million cubic meters): |
| 7 Jul 2022 |
130 |
95 |
| 19 Jul 2022 |
133 |
98 |
| 4 Aug 2022 |
136 |
102 |
| 16 Aug 2022 |
137 |
104 |
| 12 Sep 2022 |
143 |
111 |
| 5 Oct 2022 |
143 |
111 |
| 28 Oct 2022 |
143 |
111 |
Activity during July 2022. Lava effusions were reported from the western vent in the Halema’uma’u crater, along with occasional weak ooze-outs along the margins of the crater floor. The height of the lava lake was variable due to deflation-inflation tilt events; for example, the lake level dropped approximately 3-4 m during a summit deflation-inflation event reported on 1 July. Webcam images taken during the night of 6-12 July showed intermittent low-level spattering at the western vent that rose less than 10 m above the vent (figure 519). Measurements made during an overflight on 7 July indicated that the crater floor was infilled about 130 m and that 95 million cubic meters of lava had been effused since 29 September 2021. A single, relatively small lava ooze-out was active to the S of the lava lake. Around midnight on 8 July there were two brief periods of lava overflow onto the lake margins. On 9 July lava ooze-outs were reported near the SE and NE edges of the crater floor and during 10-11 July they occurred near the E, NE, and NW edges. On 16 July crater incandescence was reported, though the ooze-outs and spattering were not visible. On 18 July overnight webcam images showed incandescence in the western vent complex and two ooze-outs were reported around 0000 and 0200 on 19 July. By 0900 there were active ooze-outs along the SW edge of the crater floor. Measurements made from an overflight on 19 July indicated that the crater floor was infilled about 133 m and 98 million cubic meters of lava had erupted since 29 September 2021 (figure 520). On 20 July around 1600 active ooze-outs were visible along the N edge of the crater, which continued through the next day. Extensive ooze-outs occurred along the W margin during 24 July until 1900; on 26 July minor ooze-outs were noted along the N margin. Minor spattering was visible on 29 July along the E margin of the lake. The sulfur dioxide emission rates ranged 650-2,800 tons per day (t/d), the higher of which was measured on 8 July (figure 519).
Activity during August 2022. The eruption continued in the Halema’uma’u crater at the western vent. According to HVO the lava in the active lake remained at the level of the bounding levees. Occasional minor ooze-outs were observed along the margins of the crater floor. Strong nighttime crater incandescence was visible after midnight on 6 August over the western vent cone. During 6-7 August scattered small lava lobes were active along the crater floor and incandescence persisted above the western vent through 9 August. During 7-9 August HVO reported a single lava effusion source was active along the NW margin of the crater floor. Measurements from an overflight on 4 August indicated that the crater floor was infilled about 136 m total and that 102 million cubic meters of lava had been erupted since the start of the eruption. Lava breakouts were reported along the N, NE, E, S, and W margins of the crater during 10-16 August. Another overflight survey conducted on 16 August indicated that the crater floor infilled about 137 m and 104 million cubic meters of lava had been erupted since September 2021. Measured sulfur dioxide emissions rates ranged 1,150-2,450 t/d, the higher of which occurred on 8 August.
Activity during September 2022. During September, lava effusion continued from the western vent into the active lava lake and onto the crater floor. Intermittent minor ooze-outs were reported through the month. A small ooze-out was visible on the W crater floor margin at 0220 on 2 September, which showed decreasing surface activity throughout the day, but remained active through 3 September. On 3 September around 1900 a lava outbreak occurred along the NW margin of the crater floor but had stopped by the evening of 4 September. Field crews monitoring the summit lava lake on 9 September observed spattering on the NE margin of the lake that rose no higher than 10 m, before falling back onto the lava lake crust (figure 521). Overflight measurements on 12 September indicated that the crater floor was infilled a total of 143 m and 111 million cubic meters of lava had been erupted since September 2021. Extensive breakouts in the W and N part of the crater floor were reported at 1600 on 20 September and continued into 26 September. The active part of the lava lake dropped by 10 m while other parts of the crater floor dropped by several meters. Summit tiltmeters recorded a summit seismic swarm of more than 80 earthquakes during 1500-1800 on 21 September, which occurred about 1.5 km below Halema’uma’u; a majority of these were less than Mw 2. By 22 September the active part of the lava lake was infilled about 2 m. On 23 September the western vent areas exhibited several small spatter cones with incandescent openings, along with weak, sporadic spattering (figure 522). The sulfur dioxide emission rate ranged from 930 t/d to 2,000 t/d, the higher of which was measured on 6 September.
Activity during October 2022. Activity during October declined slightly compared to previous months, though lava effusions persisted from the western vent into the active lava lake and onto the crater floor during October (figure 523). Slight variations in the lava lake were noted throughout the month. HVO reported that around 0600 on 3 October the level of the lava lake has lowered slightly. Overflight measurements taken on 5 October indicated that the crater floor was infilled a total of about 143 m and that 111 million cubic meters of lava had been effused since September 2021. During 6-7 October the lake gradually rose 0.5 m. Sulfur dioxide measurements made on 22 October had an emission rate of 700 t/d. Another overflight taken on 28 October showed that there was little to no change in the elevation of the crater floor: the crater floor was infilled a total of 143 m and 111 million cubic meters of lava had erupted since the start of the eruption.
Activity during November 2022. Activity remained low during November, though HVO reported that lava from the western vent continued to effuse into the active lava lake and onto the crater floor throughout the month. The rate of sulfur dioxide emissions during November ranged from 300-600 t/d, the higher amount of which occurred on 9 November.
Activity during December 2022. Similar low activity was reported during December, with lava effusing from the western vent into the active lava lake and onto the crater floor. During 4-5 December the active part of the lava lake was slightly variable in elevation and fluctuated within 1 m. On 9 December HVO reported that lava was no longer erupting from the western vent in the Halema’uma’u crater and that sulfur dioxide emissions had returned to near pre-eruption background levels; during 10-11 December, the lava lake had completely crusted over, and no incandescence was visible (figure 524). Time lapse camera images covering the 4-10 December showed that the crater floor showed weak deflation and no inflation. Some passive events of crustal overturning were reported during 14-15 December, which brought fresh incandescent lava to the lake surface. The sulfur dioxide emission rate was approximately 200 t/d on 14 December. A smaller overturn event on 17 December and another that occurred around 0000 and into the morning of 20 December were also detected. A small seismic swarm was later detected on 30 December.
Geologic Background. Kilauea overlaps the E flank of the massive Mauna Loa shield volcano in the island of Hawaii. Eruptions are prominent in Polynesian legends; written documentation since 1820 records frequent summit and flank lava flow eruptions interspersed with periods of long-term lava lake activity at Halemaumau crater in the summit caldera until 1924. The 3 x 5 km caldera was formed in several stages about 1,500 years ago and during the 18th century; eruptions have also originated from the lengthy East and Southwest rift zones, which extend to the ocean in both directions. About 90% of the surface of the basaltic shield volcano is formed of lava flows less than about 1,100 years old; 70% of the surface is younger than 600 years. The long-term eruption from the East rift zone between 1983 and 2018 produced lava flows covering more than 100 km2, destroyed hundreds of houses, and added new coastline.
Information Contacts: Hawaiian Volcano Observatory (HVO), U.S. Geological Survey, PO Box 51, Hawai'i National Park, HI 96718, USA (URL: http://hvo.wr.usgs.gov/).
Nyamulagira (DR Congo) — November 2023 Cite this Report
Nyamulagira
DR Congo
1.408°S, 29.2°E; summit elev. 3058 m
All times are local (unless otherwise noted)
Lava flows and thermal activity during May-October 2023
Nyamulagira (also known as Nyamuragira) is a shield volcano in the Democratic Republic of Congo with the summit truncated by a small 2 x 2.3 km caldera with walls up to about 100 m high. Documented eruptions have occurred within the summit caldera, as well as from numerous flank fissures and cinder cones. The current eruption period began in April 2018 and has more recently been characterized by summit crater lava flows and thermal activity (BGVN 48:05). This report describes lava flows and variable thermal activity during May through October 2023, based on information from the Observatoire Volcanologique de Goma (OVG) and various satellite data.
Lava lake activity continued during May. The MIROVA (Middle InfraRed Observation of Volcanic Activity) system recorded moderate-to-strong thermal activity throughout the reporting period; activity was more intense during May and October and relatively weaker from June through September (figure 95). The MODVOLC thermal algorithm, detected a total of 209 thermal alerts. There were 143 hotspots detected during May, eight during June, nine during September, and 49 during October. This activity was also reflected in infrared satellite images, where a lava flow was visible in the NW part of the crater on 7 May and strong activity was seen in the center of the crater on 4 October (figure 96). Another infrared satellite image taken on 12 May showed still active lava flows along the NW margin of the crater. According to OVG lava effusions were active during 7-29 May and moved to the N and NW parts of the crater beginning on 9 May. Strong summit crater incandescence was visible from Goma (27 km S) during the nights of 17, 19, and 20 May (figure 97). On 17 May there was an increase in eruptive activity, which peaked at 0100 on 20 May. Notable sulfur dioxide plumes drifted NW and W during 19-20 May (figure 98). Drone footage acquired in partnership with the USGS (United States Geological Survey) on 20 May captured images of narrow lava flows that traveled about 100 m down the W flank (figure 99). Data from the Rumangabo seismic station indicated a decreasing trend in activity during 17-21 May. Although weather clouds prevented clear views of the summit, a strong thermal signature on the NW flank was visible in an infrared satellite image on 22 May, based on an infrared satellite image. On 28 May the lava flows on the upper W flank began to cool and solidify. By 29 May seismicity returned to levels similar to those recorded before the 17 May increase. Lava effusion continued but was confined to the summit crater; periodic crater incandescence was observed.
Low-level activity was noted during June through October. On 1 June OVG reported that seismicity remained at lower levels and that crater incandescence had been absent for three days, though infrared satellite imagery showed continued lava effusion in the summit crater. The lava flows on the flanks covered an estimated 0.6 km2. Satellite imagery continued to show thermal activity confined to the lava lake through October (figure 96), although no lava flows or significant sulfur dioxide emissions were reported.
Geologic Background. Africa's most active volcano, Nyamulagira (also known as Nyamuragira), is a massive high-potassium basaltic shield about 25 km N of Lake Kivu and 13 km NNW of the steep-sided Nyiragongo volcano. The summit is truncated by a small 2 x 2.3 km caldera that has walls up to about 100 m high. Documented eruptions have occurred within the summit caldera, as well as from the numerous flank fissures and cinder cones. A lava lake in the summit crater, active since at least 1921, drained in 1938, at the time of a major flank eruption. Recent lava flows extend down the flanks more than 30 km from the summit as far as Lake Kivu; extensive lava flows from this volcano have covered 1,500 km2 of the western branch of the East African Rift.
Information Contacts: Observatoire Volcanologique de Goma (OVG), Departement de Geophysique, Centre de Recherche en Sciences Naturelles, Lwiro, D.S. Bukavu, DR Congo; Hawai'i Institute of Geophysics and Planetology (HIGP) - MODVOLC Thermal Alerts System, School of Ocean and Earth Science and Technology (SOEST), Univ. of Hawai'i, 2525 Correa Road, Honolulu, HI 96822, USA (URL: http://modis.higp.hawaii.edu/); MIROVA (Middle InfraRed Observation of Volcanic Activity), a collaborative project between the Universities of Turin and Florence (Italy) supported by the Centre for Volcanic Risk of the Italian Civil Protection Department (URL: http://www.mirovaweb.it/); NASA Global Sulfur Dioxide Monitoring Page, Atmospheric Chemistry and Dynamics Laboratory, NASA Goddard Space Flight Center (NASA/GSFC), 8800 Greenbelt Road, Goddard, Maryland, USA (URL: https://so2.gsfc.nasa.gov/); Copernicus Browser, Copernicus Data Space Ecosystem, European Space Agency (URL: https://dataspace.copernicus.eu/browser/); Charles Balagizi, Goma Volcano Observatory, Departement de Geophysique, Centre de Recherche en Sciences Naturelles, Lwiro, D.S. Bukavu, DR Congo.
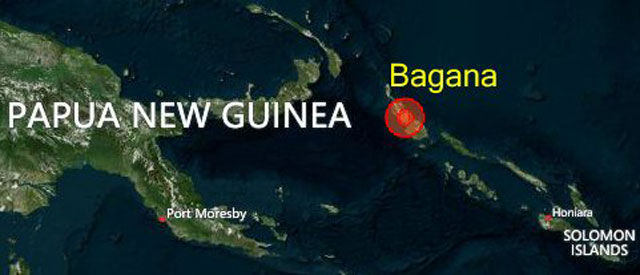
Bagana (Papua New Guinea) — October 2023 Cite this Report
Bagana
Papua New Guinea
6.137°S, 155.196°E; summit elev. 1855 m
All times are local (unless otherwise noted)
Explosions, ash plumes, ashfall, and lava flows during April-September 2023
The remote volcano of Bagana is located in central Bougainville Island, Papua New Guinea. Recorded eruptions date back to 1842 and activity has consisted of effusive activity that has built a small lava dome in the summit crater and occasional explosions that produced pyroclastic flows. The most recent eruption has been ongoing since February 2000 and has produced occasional explosions, ash plumes, and lava flows. More recently, activity has been characterized by ongoing effusive activity and ash emissions (BGVN 48:04). This report updates activity from April through September 2023 that has consisted of explosions, ash plumes, ashfall, and lava flows, using information from the Darwin Volcanic Ash Advisory Center (VAAC) and satellite data.
An explosive eruption was reported on 7 July that generated a large gas-and-ash plume to high altitudes and caused significant ashfall in local communities; the eruption plume had reached upper tropospheric (16-18 km altitude) altitudes by 2200, according to satellite images. Sulfur dioxide plumes were detected in satellite images on 8 July and indicated that the plume was likely a mixture of gas, ice, and ash. A report issued by the Autonomous Bougainville Government (ABG) (Torokina District, Education Section) on 10 July noted that significant ash began falling during 2000-2100 on 7 July and covered most areas in the Vuakovi, Gotana (9 km SW), Koromaketo, Laruma (25 km W) and Atsilima (27 km NW) villages. Pyroclastic flows also occurred, according to ground-based reports; small deposits confined to one drainage were inspected by RVO during an overflight on 17 July and were confirmed to be from the 7 July event. Ashfall continued until 10 July and covered vegetation, which destroyed bushes and gardens and contaminated rivers and streams.
RVO reported another eruption on 14 July. The Darwin VAAC stated that an explosive event started around 0830 on 15 July and produced an ash plume that rose to 16.5 km altitude by 1000 and drifted N, according to satellite images. The plume continued to drift N and remained visible through 1900, and by 2150 it had dissipated.
Ashfall likely from both the 7 and 15 July events impacted about 8,111 people in Torokina (20 km SW), including Tsito/Vuakovi, Gotana, Koromaketo, Kenaia, Longkogari, Kenbaki, Piva (13 km SW), and Atsinima, and in the Tsitovi district, according to ABG. Significant ashfall was also reported in Ruruvu (22 km N) in the Wakunai District of Central Bougainville, though the thickness of these deposits could not be confirmed. An evacuation was called for the villages in Wakunai, where heavy ashfall had contaminated water sources; the communities of Ruruvu, Togarau, Kakarapaia, Karauturi, Atao, and Kuritaturi were asked to evacuate to a disaster center at the Wakunai District Station, and communities in Torokina were asked to evacuate to the Piva District station. According to a news article, more than 7,000 people needed temporary accommodations, with about 1,000 people in evacuation shelters. Ashfall had deposited over a broad area, contaminating water supplies, affecting crops, and collapsing some roofs and houses in rural areas. Schools were temporarily shut down. Intermittent ash emissions continued through the end of July and drifted NNW, NW, and SW. Fine ashfall was reported on the coast of Torokina, and ash plumes also drifted toward Laruma and Atsilima.
A small explosive eruption occurred at 2130 on 28 July that ejected material from the crater vents, according to reports from Torokina, in addition to a lava flow that contained two lobes. A second explosion was detected at 2157. Incandescence from the lava flow was visible from Piva as it descended the W flank around 2000 on 29 July (figure 47). The Darwin VAAC reported that a strong thermal anomaly was visible in satellite images during 30-31 July and that ash emissions rose to 2.4 km altitude and drifted WSW on 30 July. A ground report from RVO described localized emissions at 0900 on 31 July.
The Darwin VAAC reported that ash plumes were identified in satellite imagery at 0800 and 1220 on 12 August and rose to 2.1 km and 3 km altitude and drifted NW and W, respectively. A news report stated that aid was sent to more than 6,300 people that were adversely affected by the eruption. Photos taken during 17-19 August showed ash emissions rising no higher than 1 km above the summit and drifting SE. A small explosion generated an ash plume during the morning of 19 August. Deposits from small pyroclastic flows were also captured in the photos. Satellite images captured lava flows and pyroclastic flow deposits. Two temporary seismic stations were installed near Bagana on 17 August at distances of 7 km WSW (Vakovi station) and 11 km SW (Kepox station). The Kepox station immediately started to record continuous, low-frequency background seismicity.
Satellite data. Little to no thermal activity was detected during April through mid-July 2023; only one anomaly was recorded during early April and one during early June, according to MIROVA (Middle InfraRed Observation of Volcanic Activity) data (figure 48). Thermal activity increased in both power and frequency during mid-July through September, although there were still some short gaps in detected activity. MODVOLC also detected increased thermal activity during August; thermal hotspots were detected a total of five times on 19, 20, and 27 August. Weak thermal anomalies were also captured in infrared satellite images on clear weather days throughout the reporting period on 7, 12, and 17 April, 27 May, 1, 6, 16, and 31 July, and 19 September (figure 48); a strong thermal anomaly was visible on 31 July. Distinct sulfur dioxide plumes that drifted generally NW were intermittently captured by the TROPOMI instrument on the Sentinel-5P satellite and sometimes exceeded two Dobson Units (DUs) (figure 49).
Geologic Background. Bagana volcano, in a remote portion of central Bougainville Island, is frequently active. This massive symmetrical cone was largely constructed by an accumulation of viscous andesitic lava flows. The entire edifice could have been constructed in about 300 years at its present rate of lava production. Eruptive activity is characterized by non-explosive effusion of viscous lava that maintains a small lava dome in the summit crater, although occasional explosive activity produces pyroclastic flows. Lava flows with tongue-shaped lobes up to 50 m thick and prominent levees descend the flanks on all sides.
Information Contacts: Rabaul Volcano Observatory (RVO), Geohazards Management Division, Department of Mineral Policy and Geohazards Management (DMPGM), PO Box 3386, Kokopo, East New Britain Province, Papua New Guinea; Darwin Volcanic Ash Advisory Centre (VAAC), Bureau of Meteorology, Northern Territory Regional Office, PO Box 40050, Casuarina, NT 0811, Australia (URL: http://www.bom.gov.au/info/vaac/); MIROVA (Middle InfraRed Observation of Volcanic Activity), a collaborative project between the Universities of Turin and Florence (Italy) supported by the Centre for Volcanic Risk of the Italian Civil Protection Department (URL: http://www.mirovaweb.it/); Hawai'i Institute of Geophysics and Planetology (HIGP) - MODVOLC Thermal Alerts System, School of Ocean and Earth Science and Technology (SOEST), Univ. of Hawai'i, 2525 Correa Road, Honolulu, HI 96822, USA (URL: http://modis.higp.hawaii.edu/); NASA Global Sulfur Dioxide Monitoring Page, Atmospheric Chemistry and Dynamics Laboratory, NASA Goddard Space Flight Center (NASA/GSFC), 8800 Greenbelt Road, Goddard, Maryland, USA (URL: https://so2.gsfc.nasa.gov/); Copernicus Browser, Copernicus Data Space Ecosystem, European Space Agency (URL: https://dataspace.copernicus.eu/browser/); Autonomous Bougainville Government, P.O Box 322, Buka, AROB, PNG (URL: https://abg.gov.pg/); Andrew Tupper (Twitter: @andrewcraigtupp); Simon Carn, Geological and Mining Engineering and Sciences, Michigan Technological University, 1400 Townsend Drive, Houghton, MI 49931, USA (URL: http://www.volcarno.com/, Twitter: @simoncarn); Radio NZ (URL: https://www.rnz.co.nz/news/pacific/494464/more-than-7-000-people-in-bougainville-need-temporary-accommodation-after-eruption); USAID, 1300 Pennsylvania Ave, NW, Washington DC 20004, USA (URL: https://www.usaid.gov/pacific-islands/press-releases/aug-08-2023-united-states-provides-immediate-emergency-assistance-support-communities-affected-mount-bagana-volcanic-eruptions).
Mayon (Philippines) — October 2023 Cite this Report
Mayon
Philippines
13.257°N, 123.685°E; summit elev. 2462 m
All times are local (unless otherwise noted)
Lava flows, pyroclastic flows, ash emissions, and seismicity during April-September 2023
Mayon is located in the Philippines and has steep upper slopes capped by a small summit crater. Historical eruptions date back to 1616 CE that have been characterized by Strombolian eruptions, lava flows, pyroclastic flows, and mudflows. Eruptions mostly originated from a central conduit. Pyroclastic flows and mudflows have commonly descended many of the approximately 40 drainages that surround the volcano. The most recent eruption occurred during June through October 2022 and consisted of lava dome growth and gas-and-steam emissions (BGVN 47:12). A new eruption was reported during late April 2023 and has included lava flows, pyroclastic density currents, ash emissions, and seismicity. This report covers activity during April through September 2023 based on daily bulletins from the Philippine Institute of Volcanology and Seismology (PHIVOLCS).
During April through September 2023, PHIVOLCS reported near-daily rockfall events, frequent volcanic earthquakes, and sulfur dioxide measurements. Gas-and-steam emissions rose 100-900 m above the crater and drifted in different directions. Nighttime crater incandescence was often visible during clear weather and was accompanied by incandescent avalanches of material. Activity notably increased during June when lava flows were reported on the S, SE, and E flanks (figure 52). The MIROVA graph (Middle InfraRed Observation of Volcanic Activity) showed strong thermal activity coincident with these lava flows, which remained active through September (figure 53). According to the MODVOLC thermal algorithm, a total of 110 thermal alerts were detected during the reporting period: 17 during June, 40 during July, 27 during August, and 26 during September. During early June, pyroclastic density currents (PDCs) started to occur more frequently.
Low activity was reported during much of April and May; gas-and-steam emissions rose 100-900 m above the crater and generally drifted in different directions. A total of 52 rockfall events and 18 volcanic earthquakes were detected during April and 147 rockfall events and 13 volcanic events during May. Sulfur dioxide flux measurements ranged between 400-576 tons per day (t/d) during April, the latter of which was measured on 29 April and between 162-343 t/d during May, the latter of which was measured on 13 May.
Activity during June increased, characterized by lava flows, pyroclastic density currents (PDCs), crater incandescence and incandescent rockfall events, gas-and-steam emissions, and continued seismicity. Weather clouds often prevented clear views of the summit, but during clear days, moderate gas-and-steam emissions rose 100-2,500 m above the crater and drifted in multiple directions. A total of 6,237 rockfall events and 288 volcanic earthquakes were detected. The rockfall events often deposited material on the S and SE flanks within 700-1,500 m of the summit crater and ash from the events drifted SW, S, SE, NE, and E. Sulfur dioxide emissions ranged between 149-1,205 t/d, the latter of which was measured on 10 June. Short-term observations from EDM and electronic tiltmeter monitoring indicated that the upper slopes were inflating since February 2023. Longer-term ground deformation parameters based on EDM, precise leveling, continuous GPS, and electronic tilt monitoring indicated that the volcano remained inflated, especially on the NW and SE flanks. At 1000 on 5 June the Volcano Alert Level (VAL) was raised to 2 (on a 0-5 scale). PHIVOLCS noted that although low-level volcanic earthquakes, ground deformation, and volcanic gas emissions indicated unrest, the steep increase in rockfall frequency may indicate increased dome activity.
A total of 151 dome-collapse PDCs occurred during 8-9 and 11-30 June, traveled 500-2,000 m, and deposited material on the S flank within 2 km of the summit crater. During 8-9 June the VAL was raised to 3. At approximately 1947 on 11 June lava flow activity was reported; two lobes traveled within 500 m from the crater and deposited material on the S (Mi-isi), SE (Bonga), and E (Basud) flanks. Weak seismicity accompanied the lava flow and slight inflation on the upper flanks. This lava flow remained active through 30 June, moving down the S and SE flank as far as 2.5 km and 1.8 km, respectively and depositing material up to 3.3 km from the crater. During 15-16 June traces of ashfall from the PDCs were reported in Sitio Buga, Nabonton, City of Ligao and Purok, and San Francisco, Municipality of Guinobatan. During 28-29 June there were two PDCs generated by the collapse of the lava flow front, which generated a light-brown ash plume 1 km high. Satellite monitors detected significant concentrations of sulfur dioxide beginning on 29 June. On 30 June PDCs primarily affected the Basud Gully on the E flank, the largest of which occurred at 1301 and lasted eight minutes, based on the seismic record. Four PDCs generated between 1800 and 2000 that lasted approximately four minutes each traveled 3-4 km on the E flank and generated an ash plume that rose 1 km above the crater and drifted N and NW. Ashfall was recorded in Tabaco City.
Similar strong activity continued during July; slow lava effusion remained active on the S and SE flanks and traveled as far as 2.8 km and 2.8 km, respectively and material was deposited as far as 4 km from the crater. There was a total of 6,983 rockfall events and 189 PDCs that affected the S, SE, and E flanks. The volcano network detected a total of 2,124 volcanic earthquakes. Continuous gas-and-steam emissions rose 200-2,000 m above the crater and drifted in multiple directions. Sulfur dioxide emissions averaged 792-4,113 t/d, the latter of which was measured on 28 July. During 2-4 July three PDCs were generated from the collapse of the lava flow and resulting light brown plumes rose 200-300 m above the crater. Continuous tremor pulses were reported beginning at 1547 on 3 July through 7 July at 1200, at 2300 on 8 July and going through 0300 on 10 July, and at 2300 on 16 July, as recorded by the seismic network. During 6-9 July there were 10 lava flow-collapse-related PDCs that generated light brown plumes 300-500 m above the crater. During 10-11 July light ashfall was reported in some areas of Mabinit, Legazpi City, Budiao and Salvacion, Daraga, and Camalig, Albay. By 18 July the lava flow advanced 600 m on the E flank as well.
During 1733 on 18 July and 0434 on 19 July PHIVOLCS reported 30 “ashing” events, which are degassing events accompanied by audible thunder-like sounds and entrained ash at the crater, which produced short, dark plumes that drifted SW. These events each lasted 20-40 seconds, and plume heights ranged from 150-300 m above the crater, as recorded by seismic, infrasound, visual, and thermal monitors. Three more ashing events occurred during 19-20 July. Short-term observations from electronic tilt and GPS monitoring indicate deflation on the E lower flanks in early July and inflation on the NW middle flanks during the third week of July. Longer-term ground deformation parameters from EDM, precise leveling, continuous GPS, and electronic tilt monitoring indicated that the volcano was still generally inflated relative to baseline levels. A short-lived lava pulse lasted 28 seconds at 1956 on 21 July, which was accompanied by seismic and infrasound signals. By 22 July, the only lava flow that remained active was on the SE flank, and continued to extend 3.4 km, while those on the S and E flanks weakened markedly. One ashing event was detected during 30-31 July, whereas there were 57 detected during 31 July-1 August; according to PHIVOLCS beginning at approximately 1800 on 31 July eruptive activity was dominated by phases of intermittent ashing, as well as increased in the apparent rates of lava effusion from the summit crater. The ashing phases consisted of discrete events recorded as low-frequency volcanic earthquakes (LFVQ) typically 30 seconds in duration, based on seismic and infrasound signals. Gray ash plume rose 100 m above the crater and generally drifted NE. Shortly after these ashing events began, new lava began to effuse rapidly from the crater, feeding the established flowed on the SE, E, and E flanks and generating frequent rockfall events.
Intensified unrest persisted during August. There was a total of 4,141 rockfall events, 2,881 volcanic earthquakes, which included volcanic tremor events, 32 ashing events, and 101 PDCs detected throughout the month. On clear weather days, gas-and-steam emissions rose 300-1,500 m above the crater and drifted in different directions (figure 54). Sulfur dioxide emissions averaged 735-4,756 t/d, the higher value of which was measured on 16 August. During 1-2 August the rate of lava effusion decreased, but continued to feed the flows on the SE, S, and E flanks, maintaining their advances to 3.4 km, 2.8 km, and 1.1 km from the crater, respectively (figure 55). Rockfall and PDCs generated by collapses at the lava flow margins and from the summit dome deposited material within 4 km of the crater. During 3-4 August there were 10 tremor events detected that lasted 1-4 minutes. Short-lived lava pulse lasted 35 seconds and was accompanied by seismic and infrasound signals at 0442 on 6 August. Seven collapses were recorded at the front of the lava flow during 12-14 August.
During September, similar activity of slow lava effusion, PDCs, gas-and-steam emissions, and seismicity continued. There was a total of 4,452 rockfall events, 329 volcanic earthquakes, which included volcanic tremor events, two ashing events, and 85 PDCs recorded throughout the month. On clear weather days, gas-and-steam emissions rose 100-1,500 m above the crater and drifted in multiple directions. Sulfur dioxide emissions averaged 609-2,252 t/d, the higher average of which was measured on 6 September. Slow lava effusion continued advancing on the SE, S, and E flanks, maintaining lengths of 3.4 km, 2.8 km, and 1.1 km, respectively. Rockfall and PDC events generated by collapses along the lava flow margins and at the summit dome deposited material within 4 km of the crater.
Geologic Background. Symmetrical Mayon, which rises above the Albay Gulf NW of Legazpi City, is the most active volcano of the Philippines. The steep upper slopes are capped by a small summit crater. Recorded eruptions since 1616 CE range from Strombolian to basaltic Plinian, with cyclical activity beginning with basaltic eruptions, followed by longer periods of andesitic lava flows. Eruptions occur predominately from the central conduit and have also produced lava flows that travel far down the flanks. Pyroclastic density currents and mudflows have commonly swept down many of the approximately 40 ravines that radiate from the summit and have often damaged populated lowland areas. A violent eruption in 1814 killed more than 1,200 people and devastated several towns.
Information Contacts: Philippine Institute of Volcanology and Seismology (PHIVOLCS), Department of Science and Technology, University of the Philippines Campus, Diliman, Quezon City, Philippines (URL: http://www.phivolcs.dost.gov.ph/); MIROVA (Middle InfraRed Observation of Volcanic Activity), a collaborative project between the Universities of Turin and Florence (Italy) supported by the Centre for Volcanic Risk of the Italian Civil Protection Department (URL: http://www.mirovaweb.it/); Hawai'i Institute of Geophysics and Planetology (HIGP) - MODVOLC Thermal Alerts System, School of Ocean and Earth Science and Technology (SOEST), Univ. of Hawai'i, 2525 Correa Road, Honolulu, HI 96822, USA (URL: http://modis.higp.hawaii.edu/); Copernicus Browser, Copernicus Data Space Ecosystem, European Space Agency (URL: https://dataspace.copernicus.eu/browser/); William Rogers, Legazpi City, Albay Province, Philippines.
Nishinoshima (Japan) — October 2023 Cite this Report
Nishinoshima
Japan
27.247°N, 140.874°E; summit elev. 100 m
All times are local (unless otherwise noted)
Eruption plumes and gas-and-steam plumes during May-August 2023
Nishinoshima, located about 1,000 km S of Tokyo, is a small island in the Ogasawara Arc in Japan. The island is the summit of a massive submarine volcano that has prominent submarine peaks to the S, W, and NE. Eruptions date back to 1973 and the current eruption period began in October 2022. Recent activity has consisted of small ash plumes and fumarolic activity (BGVN 48:07). This report covers activity during May through August 2023, using information from monthly reports of the Japan Meteorological Agency (JMA) monthly reports and satellite data.
Activity during May through June was relatively low. The Japan Coast Guard (JCG) did overflights on 14 and 22 June and reported white gas-and-steam emissions rising 600 m and 1,200 m from the central crater of the pyroclastic cone, respectively (figure 125). In addition, multiple white gas-and-steam emissions rose from the inner rim of the W side of the crater and from the SE flank of the pyroclastic cone. Discolored brown-to-green water was observed around almost the entire perimeter of the island; on 22 June light green discolored water was observed off the S coast of the island.
Observations from the Himawari meteorological satellite confirmed an eruption on 9 and 10 July. An eruption plume rose 1.6 km above the crater and drifted N around 1300 on 9 July. Satellite images acquired at 1420 and 2020 on 9 July and at 0220 on 10 July showed continuing emissions that rose 1.3-1.6 km above the crater and drifted NE and N. The Tokyo VAAC reported that an ash plume seen by a pilot and identified in a satellite image at 0630 on 21 July rose to 3 km altitude and drifted S.
Aerial observations conducted by JCG on 8 August showed a white-and-gray plume rising from the central crater of the pyroclastic cone, and multiple white gas-and-steam emissions were rising from the inner edge of the western crater and along the NW-SE flanks of the island (figure 126). Brown-to-green discolored water was also noted around the perimeter of the island.
Intermittent low-to-moderate power thermal anomalies were recorded in the MIROVA graph (Middle InfraRed Observation of Volcanic Activity), showing an increase in both frequency and power beginning in July (figure 127). This increase in activity coincides with eruptive activity on 9 and 10 July, characterized by eruption plumes. According to the MODVOLC thermal alert algorithm, one thermal hotspot was recorded on 20 July. Weak thermal anomalies were also detected in infrared satellite imagery, accompanied by strong gas-and-steam plumes (figure 128).
Geologic Background. The small island of Nishinoshima was enlarged when several new islands coalesced during an eruption in 1973-74. Multiple eruptions that began in 2013 completely covered the previous exposed surface and continued to enlarge the island. The island is the summit of a massive submarine volcano that has prominent peaks to the S, W, and NE. The summit of the southern cone rises to within 214 m of the ocean surface 9 km SSE.
Information Contacts: Japan Meteorological Agency (JMA), 1-3-4 Otemachi, Chiyoda-ku, Tokyo 100-8122, Japan (URL: http://www.jma.go.jp/jma/indexe.html); Tokyo Volcanic Ash Advisory Center (VAAC), 1-3-4 Otemachi, Chiyoda-ku, Tokyo 100-8122, Japan (URL: http://ds.data.jma.go.jp/svd/vaac/data/); MIROVA (Middle InfraRed Observation of Volcanic Activity), a collaborative project between the Universities of Turin and Florence (Italy) supported by the Centre for Volcanic Risk of the Italian Civil Protection Department (URL: http://www.mirovaweb.it/); Copernicus Browser, Copernicus Data Space Ecosystem, European Space Agency (URL: https://dataspace.copernicus.eu/browser/).
Krakatau (Indonesia) — October 2023 Cite this Report
Krakatau
Indonesia
6.1009°S, 105.4233°E; summit elev. 285 m
All times are local (unless otherwise noted)
White gas-and-steam plumes and occasional ash plumes during May-August 2023
Krakatau is located in the Sunda Strait between Java and Sumatra, Indonesia. Caldera collapse during the catastrophic 1883 eruption destroyed Danan and Perbuwatan cones and left only a remnant of Rakata. The post-collapse cone of Anak Krakatau (Child of Krakatau) was constructed within the 1883 caldera at a point between the former Danan and Perbuwatan cones; it has been the site of frequent eruptions since 1927. The current eruption period began in May 2021 and has recently consisted of Strombolian eruptions and ash plumes (BGVN 48:07). This report describes lower levels of activity consisting of ash and white gas-and-steam plumes during May through August 2023, based on information provided by the Indonesian Center for Volcanology and Geological Hazard Mitigation, referred to as Pusat Vulkanologi dan Mitigasi Bencana Geologi (PVMBG), MAGMA Indonesia, and satellite data.
Activity was relatively low during May and June. Daily white gas-and-steam emissions rose 25-200 m above the crater and drifted in different directions. Five ash plumes were detected at 0519 on 10 May, 1241 on 11 May, 0920 on 12 May, 2320 on 12 May, and at 0710 on 13 May, and rose 1-2.5 km above the crater and drifted SW. A webcam image taken on 12 May showed ejection of incandescent material above the vent. A total of nine ash plumes were detected during 6-11 June: at 1434 and 00220 on 6 and 7 June the ash plumes rose 500 m above the crater and drifted NW, at 1537 on 8 June the ash plume rose 1 km above the crater and drifted SW, at 0746 and at 0846 on 9 June the ash plumes rose 800 m and 3 km above the crater and drifted SW, respectively, at 0423, 1431, and 1750 on 10 June the ash plumes rose 2 km, 1.5 km, and 3.5 km above the crater and drifted NW, respectively, and at 0030 on 11 June an ash plume rose 2 km above the crater and drifted NW. Webcam images taken on 10 and 11 June at 0455 and 0102, respectively, showed incandescent material ejected above the vent. On 19 June an ash plume at 0822 rose 1.5 km above the crater and drifted SE.
Similar low activity of white gas-and-steam emissions and few ash plumes were reported during July and August. Daily white gas-and-steam emissions rose 25-300 m above the crater and drifted in multiple directions. Three ash plumes were reported at 0843, 0851, and 0852 on 20 July that rose 500-2,000 m above the crater and drifted NW.
The MIROVA (Middle InfraRed Observation of Volcanic Activity) graph of MODIS thermal anomaly data showed intermittent low-to-moderate power thermal anomalies during May through August 2023 (figure 140). Although activity was often obscured by weather clouds, a thermal anomaly was visible in an infrared satellite image of the crater on 12 May, accompanied by an eruption plume that drifted SW (figure 141).
Geologic Background. The renowned Krakatau (frequently mis-named as Krakatoa) volcano lies in the Sunda Strait between Java and Sumatra. Collapse of an older edifice, perhaps in 416 or 535 CE, formed a 7-km-wide caldera. Remnants of that volcano are preserved in Verlaten and Lang Islands; subsequently the Rakata, Danan, and Perbuwatan cones were formed, coalescing to create the pre-1883 Krakatau Island. Caldera collapse during the catastrophic 1883 eruption destroyed Danan and Perbuwatan, and left only a remnant of Rakata. This eruption caused more than 36,000 fatalities, most as a result of tsunamis that swept the adjacent coastlines of Sumatra and Java. Pyroclastic surges traveled 40 km across the Sunda Strait and reached the Sumatra coast. After a quiescence of less than a half century, the post-collapse cone of Anak Krakatau (Child of Krakatau) was constructed within the 1883 caldera at a point between the former Danan and Perbuwatan cones. Anak Krakatau has been the site of frequent eruptions since 1927.
Information Contacts: Pusat Vulkanologi dan Mitigasi Bencana Geologi (PVMBG, also known as Indonesian Center for Volcanology and Geological Hazard Mitigation, CVGHM), Jalan Diponegoro 57, Bandung 40122, Indonesia (URL: http://www.vsi.esdm.go.id/); MAGMA Indonesia, Kementerian Energi dan Sumber Daya Mineral (URL: https://magma.esdm.go.id/v1); MIROVA (Middle InfraRed Observation of Volcanic Activity), a collaborative project between the Universities of Turin and Florence (Italy) supported by the Centre for Volcanic Risk of the Italian Civil Protection Department (URL: http://www.mirovaweb.it/); Copernicus Browser, Copernicus Data Space Ecosystem, European Space Agency (URL: https://dataspace.copernicus.eu/browser/).
Villarrica (Chile) — October 2023 Cite this Report
Villarrica
Chile
39.42°S, 71.93°W; summit elev. 2847 m
All times are local (unless otherwise noted)
Strombolian activity, gas-and-ash emissions, and crater incandescence during April-September 2023
Villarrica, in central Chile, consists of a 2-km-wide caldera that formed about 3,500 years ago and is located at the base of the presently active cone at the NW margin of a 6-km-wide caldera. Historical eruptions eruptions date back to 1558 and have been characterized by mild-to-moderate explosive activity with occasional lava effusions. The current eruption period began in December 2014 and has recently consisted of nighttime crater incandescence, ash emissions, and seismicity (BGVN 48:04). This report covers activity during April through September 2023 and describes occasional Strombolian activity, gas-and-ash emissions, and nighttime crater incandescence. Information for this report primarily comes from the Southern Andes Volcano Observatory (Observatorio Volcanológico de Los Andes del Sur, OVDAS), part of Chile's National Service of Geology and Mining (Servicio Nacional de Geología y Minería, SERNAGEOMIN) and satellite data.
Seismicity during April consisted of long period (LP) events and tremor (TRE); a total of 9,413 LP-type events and 759 TR-type events were detected throughout the month. Nighttime crater incandescence persisted and was visible in the degassing column. Sulfur dioxide data was obtained using Differential Absorption Optical Spectroscopy Equipment (DOAS) that showed an average value of 1,450 ± 198 tons per day (t/d) during 1-15 April and 1,129 ± 201 t/d during 16-30 April, with a maximum daily value of 2,784 t/d on 9 April. Gas-and-steam emissions of variable intensities rose above the active crater as high as 1.3 km above the crater on 13 April. Strombolian explosions were not observed and there was a slight decrease in the lava lake level.
There were 14,123 LP-type events and 727 TR-type events detected during May. According to sulfur dioxide measurements taken with DOAS equipment, the active crater emitted an average value of 1,826 ± 482 t/d during 1-15 May and 912 ± 41 t/d during 16-30 May, with a daily maximum value of 5,155 t/d on 13 May. Surveillance cameras showed continuous white gas-and-steam emissions that rose as high as 430 m above the crater on 27 May. Nighttime incandescence illuminated the gas column less than 300 m above the crater rim was and no pyroclastic emissions were reported. A landslide was identified on 13 May on the E flank of the volcano 50 m from the crater rim and extending 300 m away; SERNAGEOMIN noted that this event may have occurred on 12 May. During the morning of 27 and 28 May minor Strombolian explosions characterized by incandescent ejecta were recorded at the crater rim; the last reported Strombolian explosions had occurred at the end of March.
Seismic activity during June consisted of five volcano-tectonic (VT)-type events, 21,606 LP-type events, and 2,085 TR-type events. The average value of sulfur dioxide flux obtained by DOAS equipment was 1,420 ± 217 t/d during 1-15 June and 2,562 ± 804 t/d, with a maximum daily value of 4,810 t/d on 17 June. White gas-and-steam emissions rose less than 480 m above the crater; frequent nighttime crater incandescence was reflected in the degassing plume. On 12 June an emission rose 100 m above the crater and drifted NNW. On 15 June one or several emissions resulted in ashfall to the NE as far as 5.5 km from the crater, based on a Skysat satellite image. Several Strombolian explosions occurred within the crater; activity on 15 June was higher energy and ejected blocks 200-300 m on the NE slope. Surveillance cameras showed white gas-and-steam emissions rising 480 m above the crater on 16 June. On 19 and 24 June low-intensity Strombolian activity was observed, ejecting material as far as 200 m from the center of the crater to the E.
During July, seismicity included 29,319 LP-type events, 3,736 TR-type events, and two VT-type events. DOAS equipment recorded two days of sulfur dioxide emissions of 4,220 t/d and 1,009 t/d on 1 and 13 July, respectively. Constant nighttime incandescence was also recorded and was particularly noticeable when accompanied by eruptive columns on 12 and 16 July. Minor explosive events were detected in the crater. According to Skysat satellite images taken on 12, 13, and 16 July, ashfall deposits were identified 155 m S of the crater. According to POVI, incandescence was visible from two vents on the crater floor around 0336 on 12 July. Gas-and-ash emissions rose as high as 1.2 km above the crater on 13 July and drifted E and NW. A series of gas-and-steam pulses containing some ash deposited material on the upper E flank around 1551 on 13 July. During 16-31 July, average sulfur dioxide emissions of 1,679 ± 406 t/d were recorded, with a maximum daily value of 2,343 t/d on 28 July. Fine ash emissions were also reported on 16, 17, and 23 July.
Seismicity persisted during August, characterized by 27,011 LP-type events, 3,323 TR-type events, and three VT-type events. The average value of sulfur dioxide measurements taken during 1-15 August was 1,642 ± 270 t/d and 2,207 ± 4,549 t/d during 16-31 August, with a maximum daily value of 3,294 t/d on 27 August. Nighttime crater incandescence remained visible in degassing columns. White gas-and-steam emissions rose 480 m above the crater on 6 August. According to a Skysat satellite image from 6 August, ash accumulation was observed proximal to the crater and was mainly distributed toward the E slope. White gas-and-steam emissions rose 320 m above the crater on 26 August. Nighttime incandescence and Strombolian activity that generated ash emissions were reported on 27 August.
Seismicity during September was characterized by five VT-type events, 12,057 LP-type events, and 2,058 TR-type events. Nighttime incandescence persisted. On 2 September an ash emission rose 180 m above the crater and drifted SE at 1643 (figure 125) and a white gas-and-steam plume rose 320 m above the crater. According to the Buenos Aires VAAC, periods of continuous gas-and-ash emissions were visible in webcam images from 1830 on 2 September to 0110 on 3 September. Strombolian activity was observed on 2 September and during the early morning of 3 September, the latter event of which generated an ash emission that rose 60 m above the crater and drifted 100 m from the center of the crater to the NE and SW. Ashfall was reported to the SE and S as far as 750 m from the crater. The lava lake was active during 3-4 September and lava fountaining was visible for the first time since 26 March 2023, according to POVI. Fountains captured in webcam images at 2133 on 3 September and at 0054 on 4 September rose as high as 60 m above the crater rim and ejected material onto the upper W flank. Sulfur dioxide flux of 1,730 t/d and 1,281 t/d was measured on 3 and 4 September, respectively, according to data obtained by DOAS equipment.
Strong Strombolian activity and larger gas-and-ash plumes were reported during 18-20 September. On 18 September activity was also associated with energetic LP-type events and notable sulfur dioxide fluxes (as high as 4,277 t/d). On 19 September Strombolian activity and incandescence were observed. On 20 September at 0914 ash emissions rose 50 m above the crater and drifted SSE, accompanied by Strombolian activity that ejected material less than 100 m SSE, causing fall deposits on that respective flank. SERNAGEOMIN reported that a Planet Scope satellite image taken on 20 September showed the lava lake in the crater, measuring 32 m x 35 m and an area of 0.001 km2. Several ash emissions were recorded at 0841, 0910, 1251, 1306, 1312, 1315, and 1324 on 23 September and rose less than 150 m above the crater. The sulfur dioxide flux value was 698 t/d on 23 September and 1,097 t/d on 24 September. On 24 September the Volcanic Alert Level (VAL) was raised to Orange (the third level on a four-color scale). SENAPRED maintained the Alert Level at Yellow (the middle level on a three-color scale) for the communities of Villarrica, Pucón (16 km N), Curarrehue, and Panguipulli.
During 24-25 September there was an increase in seismic energy (observed at TR-events) and acoustic signals, characterized by 1 VT-type event, 213 LP-type events, and 124 TR-type events. Mainly white gas-and-steam emissions, in addition to occasional fine ash emissions were recorded. During the early morning of 25 September Strombolian explosions were reported and ejected material 250 m in all directions, though dominantly toward the NW. On 25 September the average value of sulfur dioxide flux was 760 t/d. Seismicity during 25-30 September consisted of five VT-type events, 1,937 LP-type events, and 456 TR-type events.
During 25-29 September moderate Strombolian activity was observed and ejected material as far as the crater rim. In addition, ash pulses lasting roughly 50 minutes were observed around 0700 and dispersed ENE. During 26-27 September a TR episode lasted 6.5 hours and was accompanied by discrete acoustic signals. Satellite images from 26 September showed a spatter cone on the crater floor with one vent that measured 10 x 14 m and a smaller vent about 35 m NE of the cone. SERNAGEOMIN reported an abundant number of bomb-sized blocks up to 150 m from the crater, as well as impact marks on the snow, which indicated explosive activity. A low-altitude ash emission was observed drifting NW around 1140 on 28 September, based on webcam images. Between 0620 and 0850 on 29 September an ash emission rose 60 m above the crater and drifted NW. During an overflight taken around 1000 on 29 September scientists observed molten material in the vent, a large accumulation of pyroclasts inside the crater, and energetic degassing, some of which contained a small amount of ash. Block-sized pyroclasts were deposited on the internal walls and near the crater, and a distal ash deposit was also visible. The average sulfur dioxide flux measured on 28 September was 344 t/d. Satellite images taken on 29 September ashfall was deposited roughly 3 km WNW from the crater and nighttime crater incandescence remained visible. The average sulfur dioxide flux value from 29 September was 199 t/d. On 30 September at 0740 a pulsating ash emission rose 1.1 km above the crater and drifted NNW (figure 126). Deposits on the S flank extended as far as 4.5 km from the crater rim, based on satellite images from 30 September.
Infrared MODIS satellite data processed by MIROVA (Middle InfraRed Observation of Volcanic Activity) showed intermittent thermal activity during April through September, with slightly stronger activity detected during late September (figure 127). Small clusters of thermal activity were detected during mid-June, early July, early August, and late September. According to the MODVOLC thermal alert system, a total of four thermal hotspots were detected on 7 July and 3 and 23 September. This activity was also intermittently captured in infrared satellite imagery on clear weather days (figure 128).
Geologic Background. The glacier-covered Villarrica stratovolcano, in the northern Lakes District of central Chile, is ~15 km south of the city of Pucon. A 2-km-wide caldera that formed about 3,500 years ago is located at the base of the presently active, dominantly basaltic to basaltic andesite cone at the NW margin of a 6-km-wide Pleistocene caldera. More than 30 scoria cones and fissure vents are present on the flanks. Plinian eruptions and pyroclastic flows that have extended up to 20 km from the volcano were produced during the Holocene. Lava flows up to 18 km long have issued from summit and flank vents. Eruptions documented since 1558 CE have consisted largely of mild-to-moderate explosive activity with occasional lava effusion. Glaciers cover 40 km2 of the volcano, and lahars have damaged towns on its flanks.
Information Contacts: Servicio Nacional de Geología y Minería (SERNAGEOMIN), Observatorio Volcanológico de Los Andes del Sur (OVDAS), Avda Sta María No. 0104, Santiago, Chile (URL: http://www.sernageomin.cl/); Proyecto Observación Villarrica Internet (POVI) (URL: http://www.povi.cl/); Sistema y Servicio Nacional de Prevención y Repuesta Ante Desastres (SENAPRED), Av. Beauchef 1671, Santiago, Chile (URL: https://web.senapred.cl/); Buenos Aires Volcanic Ash Advisory Center (VAAC), Servicio Meteorológico Nacional-Fuerza Aérea Argentina, 25 de mayo 658, Buenos Aires, Argentina (URL: http://www.smn.gov.ar/vaac/buenosaires/inicio.php); MIROVA (Middle InfraRed Observation of Volcanic Activity), a collaborative project between the Universities of Turin and Florence (Italy) supported by the Centre for Volcanic Risk of the Italian Civil Protection Department (URL: http://www.mirovaweb.it/); Hawai'i Institute of Geophysics and Planetology (HIGP) - MODVOLC Thermal Alerts System, School of Ocean and Earth Science and Technology (SOEST), Univ. of Hawai'i, 2525 Correa Road, Honolulu, HI 96822, USA (URL: http://modis.higp.hawaii.edu/); Copernicus Browser, Copernicus Data Space Ecosystem, European Space Agency (URL: https://dataspace.copernicus.eu/browser/).
Merapi (Indonesia) — October 2023 Cite this Report
Merapi
Indonesia
7.54°S, 110.446°E; summit elev. 2910 m
All times are local (unless otherwise noted)
Frequent incandescent avalanches during April-September 2023
Merapi, located just north of the major city of Yogyakarta in central Java, Indonesia, has had activity within the last 20 years characterized by pyroclastic flows and lahars accompanying growth and collapse of the steep-sided active summit lava dome. The current eruption period began in late December 2020 and has more recently consisted of ash plumes, intermittent incandescent avalanches of material, and pyroclastic flows (BGVN 48:04). This report covers activity during April through September 2023, based on information from Balai Penyelidikan dan Pengembangan Teknologi Kebencanaan Geologi (BPPTKG), the Center for Research and Development of Geological Disaster Technology, a branch of PVMBG which specifically monitors Merapi. Additional information comes from the Pusat Vulkanologi dan Mitigasi Bencana Geologi (PVMBG, also known as Indonesian Center for Volcanology and Geological Hazard Mitigation, CVGHM), MAGMA Indonesia, the Darwin Volcanic Ash Advisory Centre (VAAC), and various satellite data.
Activity during April through September 2023 primarily consisted of incandescent avalanches of material that mainly affected the SW and W flanks and traveled as far as 2.3 km from the summit (table 25) and white gas-and-steam emissions that rose 10-1,000 m above the crater.
Table 25. Monthly summary of avalanches and avalanche distances recorded at Merapi during April through September 2023. The number of reported avalanches does not include instances where possible avalanches were heard but could not be visually confirmed as a result of inclement weather. Data courtesy of BPPTKG (April-September 2023 daily reports).
| Month |
Average number of avalanches per day |
Distance avalanches traveled (m) |
| Apr 2023 |
19 |
1,200-2,000 |
| May 2023 |
22 |
500-2,000 |
| Jun 2023 |
18 |
1,200-2,000 |
| Jul 2023 |
30 |
300-2,000 |
| Aug 2023 |
25 |
400-2,300 |
| Sep 2023 |
23 |
600-2,000 |
BPPTKG reported that during April and May white gas-and-steam emissions rose 10-750 m above the crater, incandescent avalanches descended 500-2,000 m on the SW and W flanks (figure 135). Cloudy weather often prevented clear views of the summit, and sometimes avalanches could not be confirmed. According to a webcam image, a pyroclastic flow was visible on 17 April at 0531. During the week of 28 April and 4 May a pyroclastic flow was reported on the SW flank, traveling up to 2.5 km. According to a drone overflight taken on 17 May the SW lava dome volume was an estimated 2,372,800 cubic meters and the dome in the main crater was an estimated 2,337,300 cubic meters.
During June and July similar activity persisted with white gas-and-steam emissions rising 10-350 m above the crater and frequent incandescent avalanches that traveled 300-2,000 m down the SW, W, and S flanks (figure 136). Based on an analysis of aerial photos taken on 24 June the volume of the SW lava dome was approximately 2.5 million cubic meters. A pyroclastic flow was observed on 5 July that traveled 2.7 km on the SW flank. According to the Darwin VAAC multiple minor ash plumes were identified in satellite images on 19 July that rose to 3.7 km altitude and drifted S and SW. During 22, 25, and 26 July a total of 17 avalanches descended as far as 1.8 km on the S flank.
Frequent white gas-and-steam emissions continued during August and September, rising 10-450 m above the crater. Incandescent avalanches mainly affected the SW and W flanks and traveled 400-2,300 m from the vent (figure 137). An aerial survey conducted on 10 August was analyzed and reported that estimates of the SW dome volume was 2,764,300 cubic meters and the dome in the main crater was 2,369,800 cubic meters.
Frequent and moderate-power thermal activity continued throughout the reporting period, according to a MIROVA (Middle InfraRed Observation of Volcanic Activity) analysis of MODIS satellite data (figure 138). There was an increase in the number of detected anomalies during mid-May. The MODVOLC thermal algorithm recorded a total of 47 thermal hotspots: six during April, nine during May, eight during June, 15 during July, four during August, and five during September. Some of this activity was captured in infrared satellite imagery on clear weather days, sometimes accompanied by incandescent material on the SW flank (figure 139).
Geologic Background. Merapi, one of Indonesia's most active volcanoes, lies in one of the world's most densely populated areas and dominates the landscape immediately north of the major city of Yogyakarta. It is the youngest and southernmost of a volcanic chain extending NNW to Ungaran volcano. Growth of Old Merapi during the Pleistocene ended with major edifice collapse perhaps about 2,000 years ago, leaving a large arcuate scarp cutting the eroded older Batulawang volcano. Subsequent growth of the steep-sided Young Merapi edifice, its upper part unvegetated due to frequent activity, began SW of the earlier collapse scarp. Pyroclastic flows and lahars accompanying growth and collapse of the steep-sided active summit lava dome have devastated cultivated lands on the western-to-southern flanks and caused many fatalities.
Information Contacts: Balai Penyelidikan dan Pengembangan Teknologi Kebencanaan Geologi (BPPTKG), Center for Research and Development of Geological Disaster Technology (URL: http://merapi.bgl.esdm.go.id/, Twitter: @BPPTKG); MAGMA Indonesia, Kementerian Energi dan Sumber Daya Mineral (URL: https://magma.esdm.go.id/v1); Pusat Vulkanologi dan Mitigasi Bencana Geologi (PVMBG, also known as Indonesian Center for Volcanology and Geological Hazard Mitigation, CVGHM), Jalan Diponegoro 57, Bandung 40122, Indonesia (URL: http://www.vsi.esdm.go.id/); Darwin Volcanic Ash Advisory Centre (VAAC), Bureau of Meteorology, Northern Territory Regional Office, PO Box 40050, Casuarina, NT 0811, Australia (URL: http://www.bom.gov.au/info/vaac/); MIROVA (Middle InfraRed Observation of Volcanic Activity), a collaborative project between the Universities of Turin and Florence (Italy) supported by the Centre for Volcanic Risk of the Italian Civil Protection Department (URL: http://www.mirovaweb.it/); Hawai'i Institute of Geophysics and Planetology (HIGP) - MODVOLC Thermal Alerts System, School of Ocean and Earth Science and Technology (SOEST), Univ. of Hawai'i, 2525 Correa Road, Honolulu, HI 96822, USA (URL: http://modis.higp.hawaii.edu/); Copernicus Browser, Copernicus Data Space Ecosystem, European Space Agency (URL: https://dataspace.copernicus.eu/browser/); Øystein Lund Andersen (URL: https://www.oysteinlundandersen.com/, https://twitter.com/oysteinvolcano).
Ebeko
Russia
50.686°N, 156.014°E; summit elev. 1103 m
All times are local (unless otherwise noted)
Moderate explosive activity with ash plumes continued during June-November 2023
Ebeko, located on the N end of Paramushir Island in Russia’s Kuril Islands just S of the Kamchatka Peninsula, consists of three summit craters along a SSW-NNE line at the northern end of a complex of five volcanic cones. Observed eruptions date back to the late 18th century and have been characterized as small-to-moderate explosions from the summit crater, accompanied by intense fumarolic activity. The current eruptive period began in June 2022, consisting of frequent explosions, ash plumes, and thermal activity (BGVN 47:10, 48:06). This report covers similar activity during June-November 2023, based on information from the Kamchatka Volcanic Eruptions Response Team (KVERT) and satellite data.
Moderate explosive activity continued during June-November 2023 (figures 50 and 51). According to visual data from Severo-Kurilsk, explosions sent ash 2-3.5 km above the summit (3-4.5 km altitude) during most days during June through mid-September. Activity after mid-September was slightly weaker, with ash usually reaching less than 2 km above the summit. According to KVERT the volcano in October and November was, with a few exceptions, either quiet or obscured by clouds that prevented satellite observations. KVERT issued Volcano Observatory Notices for Aviation (VONA) on 8 and 12 June, 13 and 22 July, 3 and 21 August, and 31 October warning of potential aviation hazards from ash plumes drifting 3-15 km from the volcano. Based on satellite data, KVERT reported a persistent thermal anomaly whenever weather clouds permitted viewing.
Geologic Background. The flat-topped summit of the central cone of Ebeko volcano, one of the most active in the Kuril Islands, occupies the northern end of Paramushir Island. Three summit craters located along a SSW-NNE line form Ebeko volcano proper, at the northern end of a complex of five volcanic cones. Blocky lava flows extend west from Ebeko and SE from the neighboring Nezametnyi cone. The eastern part of the southern crater contains strong solfataras and a large boiling spring. The central crater is filled by a lake about 20 m deep whose shores are lined with steaming solfataras; the northern crater lies across a narrow, low barrier from the central crater and contains a small, cold crescentic lake. Historical activity, recorded since the late-18th century, has been restricted to small-to-moderate explosive eruptions from the summit craters. Intense fumarolic activity occurs in the summit craters, on the outer flanks of the cone, and in lateral explosion craters.
Information Contacts: Kamchatka Volcanic Eruptions Response Team (KVERT), Far Eastern Branch, Russian Academy of Sciences, 9 Piip Blvd., Petropavlovsk-Kamchatsky, 683006, Russia (URL: http://www.kscnet.ru/ivs/kvert/).
Search Bulletin Archive by Publication Date
Select a month and year from the drop-downs and click "Show Issue" to have that issue displayed in this tab.
The default month and year is the latest issue available.
Bulletin of the Global Volcanism Network - Volume 39, Number 12 (December 2014)
Managing Editor: Richard Wunderman
Bagana (Papua New Guinea)
August 2014 to mid-April 2015, numerous ash plumes emitted
Chirinkotan (Russia)
Through April 2015, thermal anomalies & gas-steam plumes continue
Kilauea (United States)
27 June-30 December 2014: Birth and rapid advance of the June 27th lava flow
Bagana (Papua New Guinea) — December 2014 Cite this Report
Bagana
Papua New Guinea
6.137°S, 155.196°E; summit elev. 1855 m
All times are local (unless otherwise noted)
August 2014 to mid-April 2015, numerous ash plumes emitted
Bagana is one of Melanesia's youngest and most active volcanoes; it is located on Bougainville Island, Papua New Guinea (figure 14). [This report includes] a short summary of activity... from January 2013 through July 2014 (partly described in BGVN 39:06) [with more details for] August 2014-April 2015. The information included in this report primarily was found in material published by the Darwin Volcanic Ash Advisory Center (VAAC). Rabaul Volcano Observatory (RVO) [reports described] activity from August 2014.... [Local time (UTC + 11 hours) is used] for cases and observations reported by observers on the ground (two cases, on 10 and 12 August 2014); [UTC is used in other cases]....
Activity during January 2013-July 2014. During this interval, Bagana's activity was mainly characterized by the emission of ash plumes. Based on information in Volcanic Ash Advisories (VAAs) published by the Darwin VAAC, in 2013 ash plumes from Bagana ranged from 1.8-4 km in altitude above sea level (a.s.l.) and drifted between 35 and 130 km. These plumes drifted towards the SW-N-E.
Through July 2014, ash plumes from Bagana ranged from 2.1-3 km in altitude a.s.l. and drifted 25-110 km according to the Darwin VAAC's VAAs. Ash plumes again drifted to the SW-N-E, and also to the SSE.
August-December 2014. This section documents activity at Bagana from August to December 2014. Information on Bagana's activity was scarce during October and December. From August through December, Bagana's Aviation Color Code (ACC) was mainly Orange; however, as noted below, on 12 August 2014, Bagana's ACC was upgraded to Red, the highest of the four colors in the Code. During this interval, ash plumes ranged from 2.1-7.6 km in altitude a.s.l. and drifted as much as 167 km. The plumes drifted to the SW-NE.
At the beginning of August 2014, variable amounts of thin to thick white vapor were seen being emitted from Bagana. During the second week of August, activity at Bagana increased. On 6 and 8 August, noises associated with rock falls were reported. According to the RVO, these rockfalls "may have been triggered by breakaway of large blocky lava from the front lobe of ongoing effusive lava flows which are [well known] for Bagana activity."
According to a 10 August 2014 RVO report, around 0500 local time on 10 August 2014, an eruption began at Bagana that emitted an ash plume with a height estimated at several hundred meters above the crater. Personnel at the government station at Piva in Torokina (figure 13, BGVN 39:06), reported that Bagana continued to emit variable thick dark ash clouds throughout the day. Ash clouds were blown to the SW and W, and possibly to the NW. In Wakovi, 6 km W of Bagana, ashfall was reported to have destroyed small tree branches, banana trees, and potato gardens. Ashfall was also reported in Laruma and at the Piva government station. RVO further stated, "Conditions at Gotana, located about 9 km southwest from the volcano, are slightly better and people from Wakovi have been urged to move there if ashfall continues and conditions deteriorates."
Whether any Wakovi residents did evacuate is uncertain.
From 2332 UTC on 10 August to 2132 UTC on 11 August, a volcanic ash plume was seen in satellite imagery (figure 15). The plume rose to an altitude of 3.1 km a.s.l. and eventually extended 167 km SW. On 12 August 2014, the Darwin VAAC observed ash clouds rising to an altitude of 7.6 km a.s.l., resulting in Bagana's ACC to be increased to Red. The plumes eventually extended 167 km SW. In their VAAs from 12 August UTC, the Darwin VAAC remarked that an ongoing eruption (described as low-level in VAAs from 0700-~1000 UTC) was observed on satellite. In some of those VAAs, they also stated, "Ash from [the] initial explosive eruption [was] partially obscured by thunderstorm activity and [was] becoming detached from [the] volcano."
According to a 13 August 2014 RVO report, at 1810 local time on 12 August, an earthquake was felt with an intensity of II on the Modified Mercalli Scale. The report stated that the earthquake was tectonic in origin. That RVO report also stated that areas in the W and SW were affected by ashfall. They described the level of exposure from ash as moderate in Wakovi and low around Kawai, Gotana and Piva government station (figure 13, BGVN 39:06).
According to the 13-19 August 2014 Darwin VAAC Weekly Activity report, Bagana's ACC was downgraded to Orange; the specific date when the downgrade occurred was not stated. Bagana's ACC remained Orange through the end of the year. RVO reported that since 10 August, there were ash emissions, but Bagana's level of activity had decreased.
From 25-28 August 2014, ash plumes, identified on satellite images, ranged from altitudes of 2.1-2.4 km a.s.l. and extended from 35-120 km, mainly to the W and WNW and some to the SW. From 19-31 August, RVO reported that Bagana's activity was characterized by weak to moderate white vapor. They reported light gray ash plumes blowing SW on 19 and 27 August and a dull glow emanating from the summit on 19, 27, 29, and 31 August. Low roaring noises were also briefly heard on 27 August according to the RVO.
During September 2014, the Darwin VAAC reported a narrow ash plume on satellite imagery at 2132 UTC on 13 September. The plume was observed at an altitude of 2.4 km a.s.l and extended 139 km to the W. Then at 2332 UTC on 20 September, another ash plume was observed at 2.4 km a.s.l. This plume extended 56 km W. In the available Darwin VAAC Weekly Activity reports, only Bagana's ACC was reported during the month of October.
In November 2014, an ash plume that extended 65 km S was observed at 2132 UTC on 8 November. In a VAA released at 0232 UTC on 9 November, the Darwin VAAC reported that ash from Bagana had dissipated in the satellite imagery. At the end of December 2014, Darwin VAAC reported an ash plume from Bagana on 29 December. The plume rose to an altitude of 2.4 km a.s.l. and extended ~95 km NE.
January through 14 April 2015. This section discusses Bagana activity from January to mid-April 2015. During this interval, Bagana's ACC was reported as Orange by the Darwin VAAC. During much of February and March 2015, Bagana's ACC was the only information reported in the available Darwin VAAC Weekly Activity reports. In this interval, ash plumes rose up to3.7 km in altitude a.s.l. and drifted to the N-NE-SE and to the SW.
At 2232 UTC on 20 January 2015, an ash plume was identified on satellite images. Darwin VAAC considered the plume to be low-level and it extended 37 km NE at an altitude of 3.7 km a.s.l. At 0032 UTC on 21 January, Darwin VAAC identified the ash plume again on satellite imagery. In that satellite image, the plume extended 22 km NE at an altitude of 3.7 km a.s.l. After that, the Darwin VAAC reported a meteorological cloud that covered the area. Later at 2232 UTC on 21 January, the plume was seen drifting 18 km SW at an altitude of 2.7 km a.s.l (figure 16).
On 25 March 2015, an ash plume was identified on satellite imagery at 2132 UTC. The plume was observed at 2.1 km and drifted 37 km N-NE. At 2132 UTC on 26 March, another volcanic plume was observed at 3.1 km and extended 56 km NE. The Darwin VAAC reported observing a consistent plume until 0108 UTC on 30 March, when ash had dissipated. When the consistent plume was first observed was not stated in the 25-31 March 2015 Darwin VAAC Weekly Activity report. Darwin VAAC also reported a plume on satellite images at 2132 UTC on 31 March. The plume drifted 74 km SE at an altitude of 2.1 km. The plume then shifted to the NE before a VAA at 0438 UTC on 2 April reported that the ash had dissipated. In the 8-14 April 2015 Weekly Activity report, the ACC remained at Orange.
Geologic Background. Bagana volcano, in a remote portion of central Bougainville Island, is frequently active. This massive symmetrical cone was largely constructed by an accumulation of viscous andesitic lava flows. The entire edifice could have been constructed in about 300 years at its present rate of lava production. Eruptive activity is characterized by non-explosive effusion of viscous lava that maintains a small lava dome in the summit crater, although occasional explosive activity produces pyroclastic flows. Lava flows with tongue-shaped lobes up to 50 m thick and prominent levees descend the flanks on all sides.
Information Contacts: Darwin Volcanic Ash Advisory Centre (VAAC), Bureau of Meteorology, Northern Territory Regional Office, PO Box 40050, Casuarina, NT 0811, Australia (URL: http://www.bom.gov.au/info/vaac/); and Rabaul Volcano Observatory, Department of Mineral Policy and Geohazards Management, Volcanological Observatory Geohazards Management Division, P.O. Box 386, Kokopo, East New Britain Province, Papua New Guinea.
Chirinkotan (Russia) — December 2014 Cite this Report
Chirinkotan
Russia
48.98°N, 153.48°E; summit elev. 724 m
All times are local (unless otherwise noted)
Through April 2015, thermal anomalies & gas-steam plumes continue
This Bulletin report discusses activity at Chirinkotan from May 2014 to late-April 2015. The information presented here was primarily sourced from the Sakhalin Volcanic Eruptions Response Team (SVERT). SVERT is in charge of monitoring volcanic activity within the Kuril Islands from Onekotan in the N to Kunashir in the S (figure 2). The volcano also forms an island of the same name. Figure 1 in BGVN 38:12 provides a view of Chirinkotan's location within the Kuril Islands.
Our last Bulletin report (BGVN 38:12) recorded Chirinkotan activity that occurred from May 2013 to April 2014. During that interval, gas-and-steam emissions and thermal alerts were frequently observed and reported (table 1 in BGVN 38:12).
May 2014 to late-April 2015. Due to similarities between Chirinkotan's activity from May 2014 through late-April 2015 and May 2013-April 2014 (BGVN 38:12), we once again use a table to summarize Chirinkotan's activity.
Due to their inaccessibility, SVERT relies on satellite monitoring to monitor volcanic activity within the Kuril Islands. On the basis of those observations, SVERT often reported thermal anomalies and gas-and-steam emissions at Chirinkotan during this reporting interval (May 2014 to late April 2015). SVERT frequently reported that clouds obscured views of Chirinkotan, which halted collection of satellite data.
SVERT also reports Chirinkotan's Aviation Color Code (ACC). The ACC is a four color scale used by some volcano observatories and the aviation community to communicate volcanic-ash hazards of a volcano. The colors in order of increasing volcanic activity are Green, Yellow, Orange and Red.
In an overview, the ACC stood at Yellow during the following periods: May 2014 to the beginning of June 2014; late November 2014 to late February 2015; and from mid-March to late April 2015. SVERT reported Chirinkotan's ACC as Green during June to late November 2014 and early March 2015.
Table 2 summarizes available SVERT data on Chirinkotan's activity. The table is divided into two columns labeled Date and Comments. The Date column refers to the week during which Chirinkotan activity was observed or reported by SVERT. The Comments column details Chirinkotan's ACC and what activity occurred at Chirinkotan on a particular day or during a particular week.
Table 2. Table condensing Chirinkotan's activity and cases where cloud cover hindered observations between May 2014 and late April 2015. The information in the table was observed in satellite data by SVERT personnel. Bulletin editors gathered this information from available SVERT material (generally published on the end date of the date ranges in the left column).
| Date |
Comments |
| 29 Apr-5 May 2014 |
ACC: Yellow
29 April: Weak thermal anomaly
Cloud cover often obscured view of Chirinkotan
|
| 06-12 May 2014 |
ACC: Yellow
7 May: Gas-and-steam emission
Cloud cover often obscured view
|
| 13-19 May 2014 |
ACC: Yellow
Chirinkotan covered by clouds during this entire week
|
|
03-09 Jun 2014
|
ACC: Green (according to 6 June 2014 SVERT report)
24 May: Eruption began. Clear thermal anomalies and gas-and-steam emissions. Ash sometimes observed in gas-and-steam emissions
4-5 June: Weak thermal anomalies
5 June: Thermal anomalies possibly due to lava flow
Cloud cover not mentioned in available SVERT material
|
|
25 Nov-01 Dec 2014
|
ACC: Yellow (according to 27 November 2014 SVERT report)
Since 21 November: Thermal anomaly and increased steam-gas
25 November: Thermal anomaly
27 November: Gas-and-steam emission extended 40 km SE
28 and 30 November: Weak gas-and-steam emissions
On other days, obscured by clouds
|
| 02-08 Dec 2014 |
ACC: Yellow
2-5 and 7 December: Thermal anomaly
3 December: Weak gas-and-steam emission
Chirinkotan sometimes hidden by clouds
|
| 09-15 Dec 2014 |
ACC: Yellow
10-11 and 13-14 December: Thermal anomaly
On other days, Chirinkotan hidden by clouds
|
| 16-22 Dec 2014 |
ACC: Yellow
15 and 21 December: Thermal anomaly
Clouds often obscured views of Chirinkotan
|
| 30 Dec 2014-
05 Jan 2015
|
ACC: Yellow
30 December 2014: Thermal anomaly
5 January 2015: Gas-and-steam emissions to an altitude of 3 km drifting SE
Clouds often obscured views
|
| 06-12 Jan 2015 |
ACC: Yellow
8 and 10-11 January: Thermal anomaly
Clouds obscured Chirinkotan on other days
|
| 13-19 Jan 2015 |
ACC: Yellow
13-14 January: Weak gas-and-steam emissions
13 and 15 January: Thermal anomaly
Clouds obscured Chirinkotan on other days
|
|
27 Jan-02 Feb 2015
|
ACC: Yellow
31 January: Weak gas-and-steam emissions
Clouds obscured Chirinkotan on other days
|
| 03-09 Feb 2015 |
ACC: Yellow
6 and 8 February: Weak gas-and-steam emissions
Chirinkotan obscured by clouds on other days
|
| 04 Mar 2015 |
ACC: Green (according to 4 March 2015 SVERT report) |
| 17-23 Mar 2015 |
ACC: Yellow (according to 20 March 2015 issued SVERT report)
19-20 March: Thermal anomaly
20 March 2015 SVERT report noted activation due to observed thermal anomalies
Chirinkotan often obscured by clouds
|
| 24-30 Mar 2015 |
ACC: Yellow
27 March: Thermal anomaly
Clouds obscured Chirinkotan on other days
|
| 31 Mar-06 Apr 2015 |
ACC: Yellow
5 April: Thermal anomaly
Chirinkotan often obscured by clouds
|
| 07-13 Apr 2015 |
ACC: Yellow
6 April: Thermal anomaly
8 April: Weak gas-and-steam emissions
11 April: Satellite observations indicated volcanic activity was occurring
Chirinkotan often obscured by clouds
|
| 14-20 Apr 2015 |
ACC: Yellow
17-18 April: Thermal anomaly
Clouds obscured Chirinkotan on other days
|
| 21-27 Apr 2015 |
ACC: Yellow
During 20-26 April, obscured by clouds
|
References. Belousov, A., Belousova, M., and Miller, T., 2009, Kurile Islands, pp 520-525 in: Encyclopedia of Islands, Gillespie, R. and Clague D., eds., University of California Press, 1111 pp., accessed on 29 April 2015, (URL: http://www.kscnet.ru/ivs/lavdi/staff/belousov/kuriles-2009.pdf).
Geologic Background. The small, mostly unvegetated 3-km-wide island of Chirinkotan occupies the far end of an E-W volcanic chain that extends nearly 50 km W of the central part of the main Kuril Islands arc. It is the emergent summit of a volcano that rises 3000 m from the floor of the Kuril Basin. A small 1-km-wide caldera about 300-400 m deep is open to the SW. Lava flows from a cone within the breached crater reached the shore of the island. Historical eruptions have been recorded since the 18th century. Lava flows were observed by the English fur trader Captain Snow in the 1880s.
Information Contacts: Sakhalin Volcanic Eruptions Response Team (SVERT), Institute of Marine Geology and Geophysics (IMG&G) Far East Division Russian Academy of Sciences (FED RAS), 1B Science St., Yuzhno-Sakhalinsk, 693022, Russia (URL: http://www.imgg.ru/).
Kilauea (United States) — December 2014 Cite this Report
Kilauea
United States
19.421°N, 155.287°W; summit elev. 1222 m
All times are local (unless otherwise noted)
27 June-30 December 2014: Birth and rapid advance of the June 27th lava flow
This report, taken largely from Hawaiian Volcano Observatory (HVO) reports and online photo galleries, nominally covers 27 June to 30 December 2014 but adds a few details from earlier and later intervals. The lava flow just before this interval, called the Kahauale'a 2 flow, had started in May 2013 (BGVN 39:05). That flow had, during April-June 2014, advanced erratically (BGVN 39:09) and HVO Daily Updates declared it inactive ("cutoff and dead") by 30 June.
Prior to that, on 27 June, a new flow had emerged adjacent to the Kahauale'a 2 flow; it became informally named the June 27th breakout and then the June 27th lava flow. The June 27th lava flow made it to the outskirts of Pahoa, stopping at the end of 2014 with two lobes as close as about 0.7-0.8 km W of the major arterial road that passes through the town (HI-130).
The 27 June to 30 December 2014 interval was characterized by unusual developments shown here chiefly by a series of maps. The June 27th lava flow did not follow the usual pattern of flow from the summit or E rift zone to the sea. Rather, this June 27th lava flow, like the Kahauale?a 2 flow, generally progressed E to NE.
The HVO reporting during this reporting interval included a number of commonly seen processes in the over 3-decade-long eruption, which we largely omit here for brevity. We presented a summary of many of those processes in the introduction to our previous report (BGVN 39:09). They include, for example, glow, spatter, minor ash, pelee's hair, and similar emissions at either the summit vent's lava lake or along the E rift zone at Pu'u O'o crater. We have done little to track the details of breakouts on a daily or hourly basis, particularly in the near-vent area. It is also worth noting that monitoring was disrupted by Hurricane Iselle on and around 7 August 2014.
Subsections below are as follows: "Events at Pu'u O'o and Halema'ama'u"; "June 27th lava flow advance towards Pahoa"; "Graphical approaches to hazards and scientific communication"; "Lava lake heights in Overlook crater"; "Geophysical monitoring"; and "SO2 flux data." For readers seeking a deeper understanding a recent book delves into the characteristics of Hawaiian volcanoes (Poland and others, 2014).
Events at Pu'u O'o and Halema'ama'u. On 27 June the new breakout on the NE flank of Pu'u O'o erupted through fissures. HVO's online reporting in their Photo and Video section stated that the breakout reached 1.5 km long by 1100 local time. Several fissures on the upper NE flank of Pu'u O'o cone sent out flows to the NE, HVO noted. These flows partially overlapped with the existing Kahauale?a 2 flow, which had scattered surface flows that morning. Breakouts caused minor subsidence in the Pu'u O'o crater floor. This led to collapses of several spatter cones on the crater floor. Small lava ponds were revealed and the NE lava pond enlarged due to the collapse. HVO reporting at the time (27 June) described the Kahauale?a 2 flow as still active.
By 30 June HVO declared the Kahauale?a 2 flow inactive. The lava tube feeding the Kahauale?a 2 lost hydraulic connection to the NE lava pond when the level of that lake dropped. The entry to the tube could be seen stranded meters above the lava in the vent wall (figure 231).
More details follow on the June 27th flow's early phases, as reported in the 27 June 2014 Daily Update. "Seismic tremor levels were low with a few dropouts (periods when spattering is absent in the lava lake and gas emissions are relatively low). Sixteen earthquakes were strong enough to be located beneath Kīlauea Volcano in the past 24 hours: 1 [centered on a fault system passing NNW of Kīlauea's summit] in the Ka'oiki Pali area, 1 beneath Halema`uma`u Crater, 4 beneath the area south of Halema`uma`u Crater, 6 on south flank faults, 3 within the upper East Rift Zone, and one within the middle East Rift Zone. GPS receivers spanning the summit caldera recorded almost +4 cm of extension since May 24; the long-term, cross-caldera measurements indicate continued extension at a rate averaging 10 cm/yr (4 in/yr) since March, 2010.
"Recent Observations at the middle East Rift Zone vents: The tiltmeter at Pu'u O'o cone recorded an abrupt drop, that is slowing, of more than 7 microradians. The lava flow from the northeast spatter cone continued to be active until midnight; early this morning, coincident with the rapid deflation, the crater floor started to slowly subside and new lava was erupted on the north flank of Pu'u O'o cone; in addition, the upper part of the south cone collapsed around 7 am. GPS receivers recorded 5 cm of contraction across the cone following this morning's deflation."
"Recent Observations of the Kahauale'a 2 flow: PNcam views yesterday showed active breakouts at the north base of Pu'u O'o cone and distant broad smoke plumes, with multiple glowing points visible at night from both near and distant breakouts. A satellite image from June 20 showed multiple active breakouts in the interior of the Kahauale'a 2 flow extending 7.1 km (4.4 mi) northeast from the Pu'u O'o vent (see map for June 17 flow details).
"In general, this slow-moving [Kahauale'a 2 ] lava flow has made erratic progress over the past few months and appears to be slowly weakening. Disruption of the flow front has occurred during strong DI deflation events when the lava supply abruptly decreased causing the flow front to stagnate. DI inflation and resumption of lava supply usually follow a few days later. Breakouts reappear well behind the stalled flow front and take some time to reach the front again. In this way, the flow front has not advanced more than 1.8 km (1.1 mi) since the first time it stalled in early November, 2013."
The 27 June breakout formed a lava shield high on the Pu'u O'o cone during 28-29 June. A set of HVO photos taken on 26 June and 6 July documented before and after shots of a broad prominent shield. Associated text said the shield made a "dramatic change to the skyline" at Pu'u O'o. The text attributed the growth to the process of successive flows stacked on top of each other in the near vent area. The caption also said that the shield hosted a lava pond.
Photos of Pu'u O'o taken on 18 July addressed a new crater at Pu'u O'o. Since the onset of the "June 27 breakout" flow, the central part of Pu'u O'o's crater had slowly collapsed within a bounding ring fracture. One photo showed the pit formed on the southern side of the crater floor, which contained a small lava pond roughly 10 m across. This pit sporadically overflowed sending lava toward the deeper central part of the crater.
During 16-22 July the lava flow followed an incipient lava tube from the vent to the gentle break in slope at the base of Pu'u O'o, and continued slowly moving in two main lobes that extended about 2 km NE. Two small lava ponds within cones were present within two southeastern pits in the crater floor, and glow above two other pits indicated lava near the surface.
On 23 July the SE wall of Overlook crater fell into the lava lake and triggered an explosive event that threw spatter bombs onto the rim of Halema'ama'u. Ejected material ranged from dust-sized particles to spatter bombs ~70 cm across. The HVO Photos and Video portion of their website featured some dramatic web camera videos of the event. This process repeated again in this middle to late2014 time frame with cases noted on 6 and 23 August, and on 24 September.
A photo of the Pu'u O'o vent area on 26 September appears in figure 232.
At 0115 on 19 October another explosion of spatter took place at the lava lake at Halema'ama'u from the lava lake in crater. . A collapse of wall rock fell into the lake, triggering a small explosion. The scar left by this collapse was visible as a light-colored area. The spatter fell around Halema'ama'u crater, which is within an area closed to the public due to hazards like this.
The summit lava lake has shown the usual fluctuations associated with changes in spattering behavior, which are also manifested as variations in tremor amplitudes and gas release. Small amounts of particulate material were carried aloft by the plume.
June 27th lava flow advance towards Pahoa. During the rest of this report, the advancing flow of note was the June 27th lava flow. As noted above, that flow ceased to advance rapidly but remained active near the distal end through the rest of 2014 (and months into 2015). That point is critical because the distal end began to encroach on the W margin of the town of Pahoa.
We present a series of HVO maps in this section, starting with one created to describe the June 27th lava flow (figure 233>).
All of the following maps have several features in common. The yellow line depicts the approximate location of the feeding lava tube (dashed where less certain). When time is referred to, the times are in local (Hawaii Standard) time. Some of the maps contain more details than others on background information such as the age ranges of lava flows going back to the start of this eruption (1983). Figure 234 and its caption explain the color scheme, although some later maps generalize all the older lava flows as one color. A critical detail on figure 234 is that by 30 June, the Kahauale'a 2 lava flow had been declared inactive.
Figures 235 to 237 portray the June 27th lava flow advance from 29 July to 6 September. HVO attributed the surprisingly narrow character of the flow as likely related to the numerous linear cracks and down-dropped structures (grabens) found in this area. In this regard, HVO noted that lava within a linear crack remained hidden for several days but over the day of 25 August lava returned to the surface at a point slightly farther along the crack. The emerging lava created a small island surrounded by thick forest. The farthest tip of the flow that day reached 11.4 km from Pu'u O'o, and 3.1 km from the eastern boundary of the Wao Kele o Puna forest reserve. On 28 August plumes of smoke from burning vegetation marked the farthest active lava on the surface (small, scattered lobes of pahoehoe). In addition, a pad of lava had emerged from the long ground crack that funneled it NE earlier this week. The lava was inactive at its surface but thermal imagery indicated it was still quite warm. East of this pad of lava, steaming appeared on 28 August, suggesting continuing lava advance below the surface along a ground crack. Direct views into the crack were not possible due to thick vegetation, but close views of the steaming areas with a thermal camera revealed temperatures up to 190°C, temperatures interpreted by HVO as evidence of lava moving along a crack. That was confirmed on the 29th when lava again emerged out of a steaming crack. On 1 September lava plunged into another ground crack. On 10 September, the most distal flow front had reached 14.5 km (straight-line distance) from its vent at Pu'u O'o.
Kauahikaua (2007) discussed the use of an appropriate digital elevation model (DEM) to calculate the steepest path of descent along the East rift zone (blue lines in figure 237 and subsequent figures). The basis of that report was a 1983 digital elevation model (DEM). For the case at hand, Bulletin editors are uncertain about the exact dataset used to make the model. Whatever their source, the blue lines on the subsequent maps (below) can be used to infer the approximate directions of the flow's potential advance. These models are imperfect since, for example, the maps have only a finite resolution, and they may lack the updated distribution of lava flows, which themselves change the topography. Kauahikaua (2007) points out that seemingly subtle differences between actual topography and the model may lead to divergence from the modeled lines of steepest descent.
In early September the flow changed its direction of advance. The flow, initially headed almost N along one of the modeled paths of greatest descent (blue lines). By 10 September the direction of advance curved, shifting again more to the E (figure 238). On 3 September, HVO raised the Volcano Alert Level from Watch to Warning, where they both remained during the rest of 2014.
On 15 September, HVO noted that the flow entered a subdivision called the Kaohe Homesteads (figure 239). They said that at this stage the flow was still within the vacant, forested NW portion of subdivision.
By 19 September the flow still progressed NE through Kaohe Homesteads, HVO noted. For the previous several weeks, the flow had been moving through thick forest but around this time the flow front reached the forest boundary (figure 240) and more open ground.
The flow advanced at an increased rate during 22-23 October, and at 1400 on 24 October the flow front pushed ahead as a narrow lobe reaching ~19 km from the Pu'u O'o vent. The front was 135 m from Cemetery Rd./Apa?a Street, two roads on the W outskirts of town. On 26 October the flow's leading tip advanced through Pahoa cemetery.
During 22-28 October HVO reported that the lava flow remained active. On 22 October a narrow lava flow (less than 50 m wide) that had overtaken the flow front during the previous few days moved into a small gully. It sometimes moved as fast as 300 m/day (many times faster than the typical). Another breakout upslope continued to advance at a slower rate. On 24 October, HVO scientists aboard an overflight measured the cross-sectional area of the lava tube feeding the flow at the vent. Their measurement suggested a slight increase in the lava supplied to the flow.
At approximately 0350 on 25 October lava crossed Apa'a Street and continued to advance towards the town of Pahoa. Throughout the morning the flow moved down the Pahoa cemetery driveway and then turned SE into adjoining pasture. The Aviation Color Code remained at Orange and the Volcano Alert Level remained at Warning. At 0900 on 26 October the flow was an estimated 140 m wide. The next day it had narrowed to 100 m wide and was about 570 m from Pahoa Village Road. At about 0200 on 28 October the flow had reached the first occupied residential property. The leading edge of the flow was less than 50 m wide but increased to 150 m upslope. At 1730 the lava flow was 310 m in a straight-line distance from Pahoa Village Road and about 900 meters in a straight-line distance from Highway 130. The Aviation Color Code remained at Orange and the Volcano Alert Level remained at Warning.
According to news articles, Pahoa is a town with 800-900 residents, and besides homes, contains small shops. A school and a few roads were closed. Crews were building temporary access roads and trying to build berms to divert lava away from the heavily traveled Highway 130, which passes through the town.
On 2 November, the lava flow front stalled, but scattered breakouts occurred upslope of the flow front. HVO documented in their online Photo and Video section that over the past several days leading up to 7 November, the flow had undergone inflation (thickening).
Although an earlier flow lobe had crossed Apa?a Street / Cemetery Road during October, on 9 November witnesses watched as fresh lava crossed asphalt pavement there, causing combustion with yellow flames and black sooty plumes. HVO cautioned that burning roads creates toxic fumes that can cause eye and respiratory tract irritation, as well as headaches, rashes, cough, and possibly cancer. On 25 October just a few hours after the flow crossed the road, the lava was only about 1 m thick. Ten days later, the flow grew to ~4 m thick.
The next map (figure 241) shows the lava's position as of 10 November 2014 with some earlier dated points of farthest advance indicated. On 10 November a breakout moved along Apa?a Street and onto private property setting an unoccupied home there on fire. According to news sources, this was the first home to be set on fire by the June 27th lava flow. Residents had long ago moved out of the wood frame structure, and had cleared out their belongings. The demise of the structure was widely seen in the news.
Around mid-November a solid-waste transfer station near that portion of the lava flow was the subject of numerous photos, including those documenting flow inflation, burning asphalt pavement, and how a strong cyclone (wire mesh) fence provided a an effective but short-lived barrier. HVO posted a photo disclosing how lava encroached close to the station on 13 November, crossing a fence and most of an access road that loops around the station.
During an overflight on 1 December volcanologists measured a cross-sectional area of the lava stream within a tube near Pu'u 'O'o. They found a 25% reduction in area compared to the previous week. The result was consistent with less lava flowing through the tube due to summit deflation, which had been ongoing since 29 November.
A 21 December satellite image showed the flow moving towards Pahoa. The image came from the Advanced Land Imager instrument onboard NASA's Earth Observing 1 satellite. The image provided a view of active breakouts on this downslope (E) portion of the flow. Surface lava was active around the leading tip of the flow, but a short distance upslope (W) of the leading tip there was an absence of surface breakouts. About 1.5-2 km W and upslope of the leading tip of the flow, many scattered breakouts were indicated. Thus, HVO concluded, the image emphasizes that lava-flow movement was not limited to the flow front.
Figure 242 shows the lava flow one day before the end of 2014.
At the end of 2014, Kīlauea continued to erupt both at its summit and at Pu'u O'o along the East rift zone. An overflight on 1 January 2015 confirmed that the front of the 27 June lava flow remained stalled. However, HVO's Daily Update (issued at 0913 on 1 January) also noted a breakout along the S margin of the flow and 150 m up slope of the flow front, which had advanced ~20 m since the afternoon on the 31st. In addition to the aerial observations, farther back (upslope and W) from the flow front HVO noted that satellite data acquired on 31 December showed areas of activity 3 and 6 km W of the flow front .
Graphical approaches to scientific and hazards communication. The HVO website features a hazard map for Kīlauea (HVO, 1997). It shows the relative degree of hazard from lava flows for different areas of the volcano. The E rift zone is within Zone 1, which HVO (1997) states "is the most hazardous; it consists of the summit area and rift zones because Kīlauea's frequent eruptions originate in these areas."
As a result of the June 27th lava flow showing no signs of halting, on 3 December 2014, William P. Kenoi, the mayor of the County of Hawaii signed a proclamation that continued the state of emergency in the Puna district. This followed earlier proclamations signed on 4 September and 16 October 2014.
Figure 243 illustrates the advance of the June 27th lava flow from Pu'u O'o towards infrastructure such as Pahoa and the road through it (HI-130). The W-looking view has the advancing lava heading towards the reader. Figure 243 contains both a plot and an image of the June 27th lava flow, with four lobes identified by color coding (as defined on the right side of the figure). The illustration was posted on social media and serves to educate residents (it is not from a peer-reviewed publication). The same author has generated numerous other graphics associated with the advancing lavas and the geography of the Puna district, including relevant census and economic data, in what are often called infographics. Another example, focusing on roads, is figure 244.
Work began on 24 October 2014 on the emergency access route between Hawai'i Volcanoes National Park and Kalapana along the historic portion of Chain of Craters Road-Kalapana alignment (yellow and red dashed line, figure 244). The lava-covered portion of that road is ~13-km long. According the National Park Service, the emergency route will assist residents of lower Puna district, whose access to the rest of the island would otherwise be cut off if E-flowing lava were to reach the ocean. According to a news article by Damon Tucker, bulldozers working inward from the E and W ends met in the middle on 6 November. The article noted that the roadbed was still considered 'rough grade' and when opened it will be ~6-m wide, 2 lane, and gravel surfaced. The road was intended chiefly for residents (and their agents and service provders) and, as planned, will not be open to the general public or park visitors. On the basis of several reports Bulletin editors found, the road's projected eventual cost varied within the range of 7-15.5 million dollars.
Lava lake heights in Overlook crater. At the summit, a lava lake resides in Overlook crater (see map of the Kīlauea summit caldera area in the previous report, figure 229). Overlook crater is a source of ash, spatter, pelee's hair, and this area also vents the bulk of the SO2; emissions (discussed in a subsection below). HVO Daily Updates describe Overlook crater as a pit or crater in the floor of the larger Halema`uma`u Crater. That crater resides, in turn, on the floor of the larger Kīlauea caldera or crater. The pit is about 160 m in diameter at the ground surface on the Halema`uma`u crater floor. At a depth of 200 m below the Halema`uma`u crater floor (the deepest point visible when the lake drains to those depths) the pit is ~50 m in diameter. HVO Daily Updates also said that a lava pond or lake in the pit has been in evidence since November 2009 and through 2014. The surface of the lake moved up and down and measurements reflect the depth below the crater floor.
Overall, from available data during 27 June to 31 December the lake surface ranged between 30 and 70 m below the pit's rim at the Halema'ama'u crater floor. During 27 June to 9 July 2014 the lake remained fairly stable at near 30 m depth below the floor. Starting a few days after that and until 19 September the lake was in the approximate range 30-60 m deep. On 20 September it reached ~65 m deep. During 21-24 September daily distances to the lake surface descended with attendant fluctuations to ~70 m deep. During 25 September to 3 November the lake remained in the range of 40-70 m through the end of the year, although the depths were not specifically given during much of November and December.
HVO Daily Updates contain the following general background explaining more about the lava lake. Overlook crater has been more-or-less continuously active since it opened during a small explosive event on 19 March 2008. Small collapses in the Overlook crater are common, and over time have resulted in a gradual enlargement of the Overlook crater. During 2013 and early 2014, the lava level has been typically between 30 m and 60 m below the floor of Halema`uma`u Crater. The lake level responds to summit tilt changes with the lake generally receding during deflation and rising during inflation.
Geophysical monitoring. Geophysical monitoring, including seismicity at the summit was summarized in HVO Daily Updates during 27 June to 30 December. Located earthquakes in the summit area were most reliably reported only during 27 June through 7 August, an interval when they were often in the range 5 to 36 events per day. After that, the number of events was seldom reported although some comments noted an occasional number or a larger event (e.g., on 14 November, an M ~3.5 earthquake on Kīlauea's S flank) and many cases mentioned 'several' located earthquakes or commented on a lack of changes in seismicity without further quantification. Tremor and small seismic swarms were noted often. For example, a swarm of long-period earthquakes occurred during 20-21 August centered beneath the summit caldera at ~8 km depth. Epicenters were reported elsewhere (besides the summit), for example on the S flank and various parts of the E rift zone.
In multiple entries during the reporting interval, episodes of tremor were interpreted by HVO as linked to spatter on the surface of the lava lake.
The 19 October Daily Update made these comments about seismicity, tilt, and summit deformation measured by GPS. "A cluster of small seismic events occurred at a shallow level beneath Kīlauea's upper East Rift Zone at about the time that ground tilt switched from inflation to deflation. Such behavior is fairly common. Seismic tremor beneath the summit remained low and varied with changes in spattering on the surface of the lava lake. GPS receivers spanning the summit caldera recorded about 5 cm (2 in) of extension between early May and early July [2014]. Since then, little significant extension or contraction has occurred."
SO2 flux data. Table 12 contains SO2 flux data extracted from HVO Daily Updates for the interval 11 June 2014 through 13 January 2015. Near the start of that interval, during 25 June-1 July 2014, SO2 fluxes at Halema'uma'u yielded the highest values of the interval, 8,400 metric tons per day (t/d). This was about 10% higher than the largest value reported in the first half of 2014 (BGVN 39:09). Overall, SO2 fluxes for Pu'u 'O'o and associated E rift zone sources of degassing yielded somewhat elevated values. During the week of 25 June to 1 July 2014 scientists recorded fluxes of 900 t/d, about double the higher values HVO typically reported since July 2012.
Table 12. An overview of approximate and preliminary S02fluxes reported for Kīlauea and some associated comments during 11 June 2014 to 13 January 2015. The majority of these measurements were averages or ranges for a week-long interval recording plumes from gases vented at the summit caldera. "Minor ash" represents cases for summit measurements where HVO noted "a tiny amount of particulate material carried aloft by the plume." Note comment in text below table about the shift in measurement methodology, which resulted in higher values. The measurements in brackets, [ ], record flux estimates on the stated dates from all sources vented on the East Rift Zone (ERZ). For brevity, ERZ measurements during mid-July to mid-September were omitted from the table. All data and quoted text came from HVO Daily Updates (see link in the Information Contacts section).
| Date (or range) |
SO2 flux (metric tons/day, t/d) at summit [East Rift Zone, ERZ]; Comments |
| 11 Jun-17 Jun 2014 |
2,400-6,400 t/d |
| 18 Jun-24 Jun 2014 |
2,800-5,200 t/d. [ERZ on 24th: 250 t/d (". . . emission rates typically ranged between 150 and 450 t/d since July 2012.") |
| 25 Jun-01 Jul 2014 |
3,800-8,400 t/d. Highest value in table. [ERZ on 27th: 900 t/d; ". . . measured shortly after the new breakout started; emission rates have typically ranged between 150 and 450 t/d since July 2012."] |
| 02 Jul-08 Jul 2014 |
5,800-6,900 t/d (minor ash) [ERZ on 3rd: 500 t/d] |
| 09 Jul-15 Jul 2014 |
4,200-6,300 t/d (minor ash) |
| 16 Jul-22 Jul 2014 |
4,500-5,700 t/d (minor ash) |
| 23 Jul-29 Jul 2014 |
3,700-7,100 t/d (minor ash) |
| 30 Jul-05 Aug 2014 |
3,600-6,100 t/d (minor ash) |
| 06 Aug-12 Aug 2014 |
5,100 t/d (minor ash) |
| 03 Aug-19 Aug 2014 |
2,400-5,000 t/d (minor ash) |
| 20 Aug-26 Aug 2014 |
4,100-5,900 t/d (minor ash) |
| 27 Aug-02 Sep 2014 |
3,300-6,700 t/d (minor ash) |
| 03 Sep-09 Sep 2014 |
3,300-7,600 t/d (minor ash) |
| 10 Sep-16 Sep 2014 |
4,300-6,800 t/d (minor ash) |
| 17 Sep-23 Sep 2014 |
4,400-6,300 t/d (minor ash) [ERZ on 24th: 375 t/d] |
| 24 Sep-30 Sep 2014 |
3,600-5,200 t/d (minor ash) [ERZ on 25th: 550 t/d] |
| 08 Oct-14 Oct 2014 |
2,900-6,500 t/d [ERZ on 9th: 450 t/d] |
| 15 Oct-21 Oct 2014 |
2,700-3,600 t/d |
| 22 Oct-28 Oct 2014 |
4,250-7,000 t/d [ERZ on 23rd: 340 t/d] |
| 29 Oct-04 Nov 2014 |
3,400-6,400 t/d [ERZ on 31st: 320 t/d] |
| 05 Nov 2014 |
6,200 t/d (but winds thwarted later repeat measurements during week ending on 11th) |
| 18 Nov 2014 |
4,400 t/d (another 1-day measurement like that above) |
| 19 Nov-25 Nov 2014 |
6,900 t/d |
| 27 Nov-02 Dec 2014 |
4,300 t/d [ERZ on 26th: 250 t/d] |
| 03 Dec-09 Dec 2014 |
4,100 t/d |
| 10 Dec-16 Dec 2014 |
3,100-6,500 t/d [ERZ on 11th: 300 t/d] |
| 17 Dec-23 Dec 2014 |
5,500-7,700 t/d [ERZ on 19th: 250 t/d] |
| 25 Dec-31 Dec 2014 |
6,000 t/d |
| 31 Dec 2014-06 Jan 2015 |
5,400 t/d |
| 07 Jan-13 Jan 2015 |
4,500 to 7,600 t/d [ERZ on 7th: ~200 t/d] |
HVO emphasized the following caveat described in more detail in (BGVN 39:09). "Starting in 2014, [HVO began reporting] the emission rate estimated by a new, more accurate method. The numbers increase by a factor of 2-4 but the actual emission rate has not changed."
The gas plume from the summit area (Kīlauea caldera), sometimes included minor amounts of ash-sized tephra (sometimes noted in table 12). These included fresh spatter bits and Pele's hair from the circulating lava lake in Overlook crater. In general, the heaviest tephra deposited near the source; the finer tephra, several kilometers downwind.
References. Kauahikaua, J., 2007, Lava flow hazard assessment, as of August 2007, for Kīlauea East Rift Zone eruptions, Hawai'i Island: U.S. Geological Survey Open-File Report 2007-1264, 9 p., ( http://pubs.usgs.gov/of/2007/1264/ )
Kimura, Mark, 23 March 2015, Lower Puna infographics (https://www.facebook.com/lowerpuna) [Accessed in March 2015].
Poland, M.P., Takahashi, T.J., and Landowski, C.M., eds., 2014, Characteristics of Hawaiian volcanoes:
U.S. Geological Survey Professional Paper 1801, 428 p., http://dx.doi.org/10.3133/pp1801.
University of Hawaii at Hilo, 2015, UH Hilo Stories: Puna lava flow in graphics & maps, updated Feb. 22 (http://hilo.hawaii.edu/news/stories/2014/09/22/puna-lava-flow-in-graphics-maps/).
Geologic Background. Kilauea overlaps the E flank of the massive Mauna Loa shield volcano in the island of Hawaii. Eruptions are prominent in Polynesian legends; written documentation since 1820 records frequent summit and flank lava flow eruptions interspersed with periods of long-term lava lake activity at Halemaumau crater in the summit caldera until 1924. The 3 x 5 km caldera was formed in several stages about 1,500 years ago and during the 18th century; eruptions have also originated from the lengthy East and Southwest rift zones, which extend to the ocean in both directions. About 90% of the surface of the basaltic shield volcano is formed of lava flows less than about 1,100 years old; 70% of the surface is younger than 600 years. The long-term eruption from the East rift zone between 1983 and 2018 produced lava flows covering more than 100 km2, destroyed hundreds of houses, and added new coastline.
Information Contacts: Hawaiian Volcano Observatory (HVO), U.S. Geological Survey, PO Box 51, Hawai`i National Park, HI 96718, USA (URL: https://volcanoes.usgs.gov/observatories/hvo/, Daily Updates, https://volcanoes.usgs.gov/observatories/hvo/activity/Kilaueastatus.php, and (weekly) Volcano Watch, https://volcanoes.usgs.gov/observatories/hvo/volcanowatch/); Recent maps, https://volcanoes.usgs.gov/observatories/hvo/maps); and Mark Kimura, Department of Geography and Environmental Sciences, University of Hawaii at Hilo, Geography Department, 200 W. Kawili St., Hilo, HI 96720-4091.