Recently Published Bulletin Reports
Erebus (Antarctica) Lava lake remains active; most thermal alerts recorded since 2019
Rincon de la Vieja (Costa Rica) Frequent phreatic explosions during July-December 2023
Bezymianny (Russia) Explosion on 18 October 2023 sends ash plume 8 km high; lava flows and incandescent avalanches
Kilauea (United States) Low-level lava effusions in the lava lake at Halema’uma’u during July-December 2022
Nyamulagira (DR Congo) Lava flows and thermal activity during May-October 2023
Bagana (Papua New Guinea) Explosions, ash plumes, ashfall, and lava flows during April-September 2023
Mayon (Philippines) Lava flows, pyroclastic flows, ash emissions, and seismicity during April-September 2023
Nishinoshima (Japan) Eruption plumes and gas-and-steam plumes during May-August 2023
Krakatau (Indonesia) White gas-and-steam plumes and occasional ash plumes during May-August 2023
Villarrica (Chile) Strombolian activity, gas-and-ash emissions, and crater incandescence during April-September 2023
Merapi (Indonesia) Frequent incandescent avalanches during April-September 2023
Ebeko (Russia) Moderate explosive activity with ash plumes continued during June-November 2023
Erebus (Antarctica) — January 2024  Cite this Report
Erebus
Antarctica
77.53°S, 167.17°E; summit elev. 3794 m
All times are local (unless otherwise noted)
Lava lake remains active; most thermal alerts recorded since 2019
The lava lake in the summit crater of Erebus has been active since at least 1972. Located in Antarctica overlooking the McMurdo Station on Ross Island, it is the southernmost active volcano on the planet. Because of the remote location, activity is primarily monitored by satellites. This report covers activity during 2023.
The number of thermal alerts recorded by the Hawai'i Institute of Geophysics and Planetology’s MODVOLC Thermal Alerts System increased considerably in 2023 compared to the years 2020-2022 (table 9). In contrast to previous years, the MODIS instruments aboard the Aqua and Terra satellites captured data from Erebus every month during 2023. Consistent with previous years, the lowest number of anomalous pixels were recorded in January, November, and December.
Table 9. Number of monthly MODIS-MODVOLC thermal alert pixels recorded at Erebus during 2017-2023. See BGVN 42:06 for data from 2000 through 2016. The table was compiled using data provided by the HIGP – MODVOLC Thermal Alerts System.
| Year |
Jan |
Feb |
Mar |
Apr |
May |
Jun |
Jul |
Aug |
Sep |
Oct |
Nov |
Dec |
SUM |
| 2017 |
0 |
21 |
9 |
0 |
0 |
1 |
11 |
61 |
76 |
52 |
0 |
3 |
234 |
| 2018 |
0 |
21 |
58 |
182 |
55 |
17 |
137 |
172 |
103 |
29 |
0 |
0 |
774 |
| 2019 |
2 |
21 |
162 |
151 |
55 |
56 |
75 |
53 |
29 |
19 |
1 |
0 |
624 |
| 2020 |
0 |
2 |
16 |
18 |
4 |
4 |
1 |
3 |
18 |
3 |
1 |
6 |
76 |
| 2021 |
0 |
9 |
1 |
0 |
2 |
56 |
46 |
47 |
35 |
52 |
5 |
3 |
256 |
| 2022 |
1 |
13 |
55 |
22 |
15 |
32 |
39 |
19 |
31 |
11 |
0 |
0 |
238 |
| 2023 |
2 |
33 |
49 |
82 |
41 |
32 |
70 |
64 |
42 |
17 |
5 |
11 |
448 |
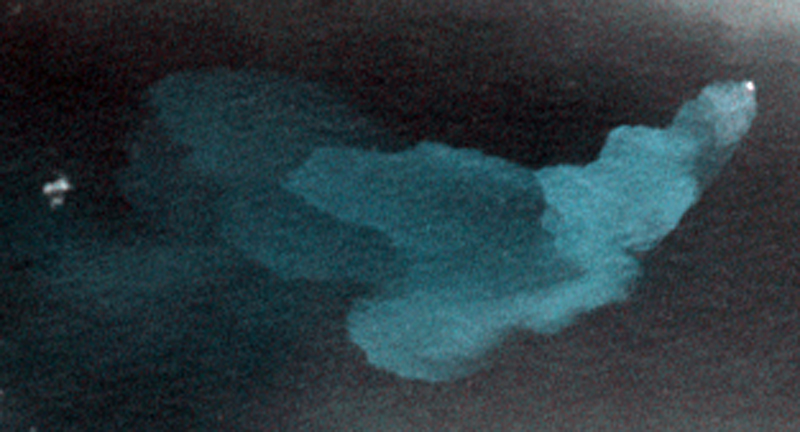
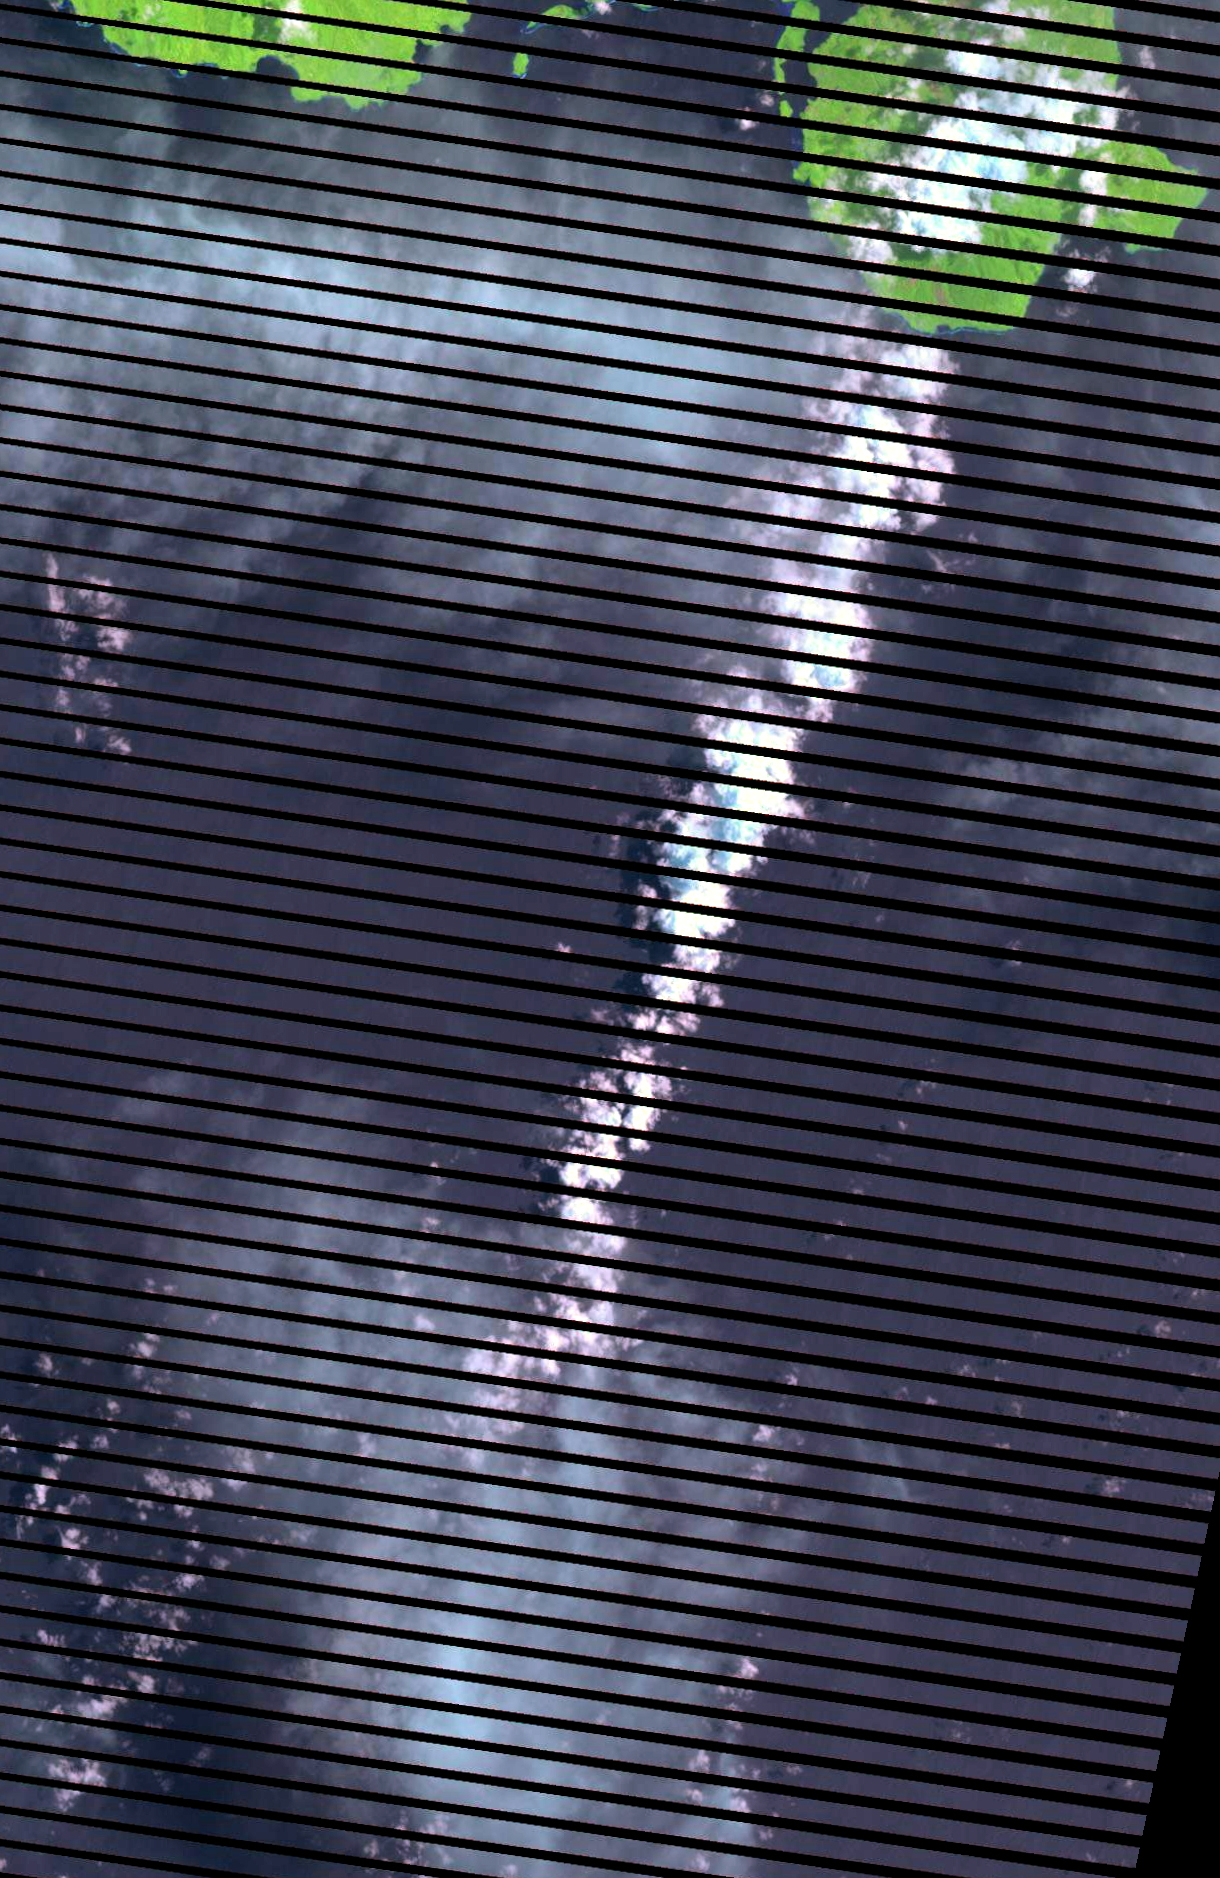
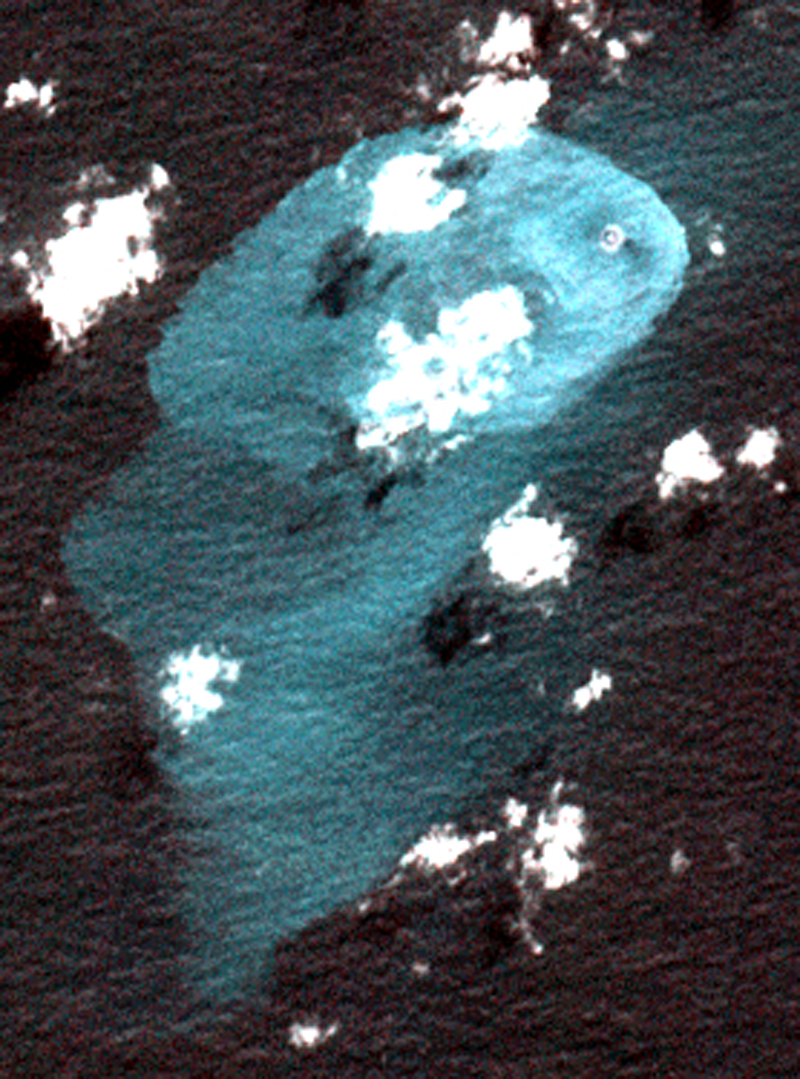
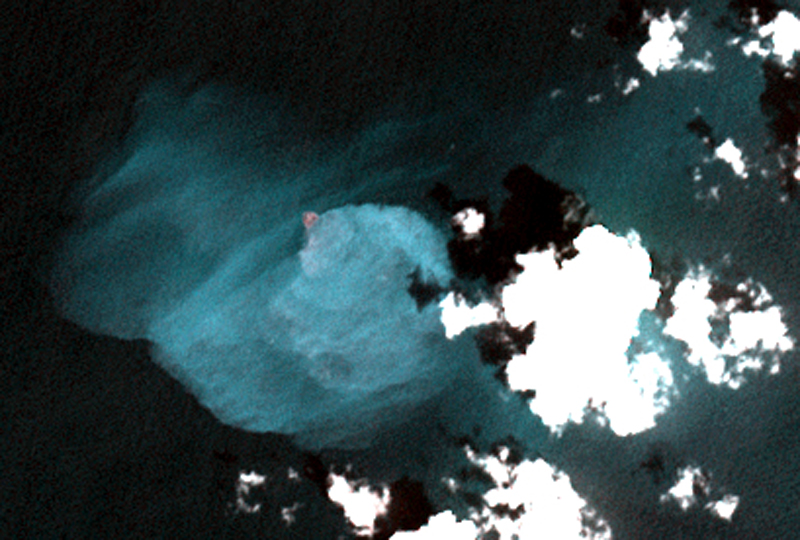
Sentinel-2 infrared images showed one or two prominent heat sources within the summit crater, accompanied by adjacent smaller sources, similar to recent years (see BGVN 46:01, 47:02, and 48:01). A unique image was obtained on 25 November 2023 by the OLI-2 (Operational Land Imager-2) on Landsat 9, showing the upper part of the volcano surrounded by clouds (figure 32).
Geologic Background. Mount Erebus, the world's southernmost historically active volcano, overlooks the McMurdo research station on Ross Island. It is the largest of three major volcanoes forming the crudely triangular Ross Island. The summit of the dominantly phonolitic volcano has been modified by one or two generations of caldera formation. A summit plateau at about 3,200 m elevation marks the rim of the youngest caldera, which formed during the late-Pleistocene and within which the modern cone was constructed. An elliptical 500 x 600 m wide, 110-m-deep crater truncates the summit and contains an active lava lake within a 250-m-wide, 100-m-deep inner crater; other lava lakes are sometimes present. The glacier-covered volcano was erupting when first sighted by Captain James Ross in 1841. Continuous lava-lake activity with minor explosions, punctuated by occasional larger Strombolian explosions that eject bombs onto the crater rim, has been documented since 1972, but has probably been occurring for much of the volcano's recent history.
Information Contacts: Hawai'i Institute of Geophysics and Planetology (HIGP) - MODVOLC Thermal Alerts System, School of Ocean and Earth Science and Technology (SOEST), Univ. of Hawai'i, 2525 Correa Road, Honolulu, HI 96822, USA (URL: http://modis.higp.hawaii.edu/); Copernicus Browser, Copernicus Data Space Ecosystem, European Space Agency (URL: https://dataspace.copernicus.eu/browser/); NASA Earth Observatory, EOS Project Science Office, NASA Goddard Space Flight Center, Goddard, Maryland, USA (URL: https://earthobservatory.nasa.gov/images/152134/erebus-breaks-through).
Rincon de la Vieja (Costa Rica) — January 2024 Cite this Report
Rincon de la Vieja
Costa Rica
10.83°N, 85.324°W; summit elev. 1916 m
All times are local (unless otherwise noted)
Frequent phreatic explosions during July-December 2023
Rincón de la Vieja is a volcanic complex in Costa Rica with a hot convecting acid lake that exhibits frequent weak phreatic explosions, gas-and-steam emissions, and occasional elevated sulfur dioxide levels (BGVN 45:10, 46:03, 46:11). The current eruption period began June 2021. This report covers activity during July-December 2023 and is based on weekly bulletins and occasional daily reports from the Observatorio Vulcanologico Sismologica de Costa Rica-Universidad Nacional (OVSICORI-UNA).
Numerous weak phreatic explosions continued during July-December 2023, along with gas-and-steam emissions and plumes that rose as high as 3 km above the crater rim. Many weekly OVSICORI-UNA bulletins included the previous week's number of explosions and emissions (table 9). For many explosions, the time of explosion was given (table 10). Frequent seismic activity (long-period earthquakes, volcano-tectonic earthquakes, and tremor) accompanied the phreatic activity.
Table 9. Number of reported weekly phreatic explosions and gas-and-steam emissions at Rincón de la Vieja, July-December 2023. Counts are reported for the week before the Weekly Bulletin date; not all reports included these data. Courtesy of OVSICORI-UNA.
| OVSICORI Weekly Bulletin |
Number of explosions |
Number of emissions |
| 28 Jul 2023 |
6 |
14 |
| 4 Aug 2023 |
10 |
12 |
| 1 Sep 2023 |
13 |
11 |
| 22 Sep 2023 |
12 |
13 |
| 29 Sep 2023 |
6 |
11 |
| 6 Oct 2023 |
12 |
5 |
| 13 Oct 2023 |
7 |
9 |
| 20 Oct 2023 |
1 |
15 |
| 27 Oct 2023 |
3 |
23 |
| 3 Nov 2023 |
3 |
10 |
| 17 Nov 2023 |
0 |
Some |
| 24 Nov 2023 |
0 |
14 |
| 8 Dec 2023 |
4 |
16 |
| 22 Dec 2023 |
8 |
18 |
Table 10. Summary of activity at Rincón de la Vieja during July-December 2023. Weak phreatic explosions and gas emissions are noted where the time of explosion was indicated in the weekly or daily bulletins. Height of plumes or emissions are distance above the crater rim. Courtesy of OVSICORI-UNA.
| Date |
Time |
Description of Activity |
| 1 Jul 2023 |
0156 |
Explosion. |
| 2 Jul 2023 |
0305 |
Explosion. |
| 4 Jul 2023 |
0229, 0635 |
Event at 0635 produced a gas-and-steam plume that rose 700 m and drifted W; seen by residents in Liberia (21 km SW). |
| 9 Jul 2023 |
1843 |
Explosion. |
| 21 Jul 2023 |
0705 |
Explosion. |
| 26 Jul 2023 |
1807 |
Explosion. |
| 28 Jul 2023 |
0802 |
Explosion generated a gas-and-steam plume that rose 500 m. |
| 30 Jul 2023 |
1250 |
Explosion. |
| 31 Jul 2023 |
2136 |
Explosion. |
| 11 Aug 2023 |
0828 |
Explosion. |
| 18 Aug 2023 |
1304 |
Explosion. |
| 21 Aug 2023 |
1224 |
Explosion generated gas-and-steam plumes rose 500-600 m. |
| 22 Aug 2023 |
0749 |
Explosion generated gas-and-steam plumes rose 500-600 m. |
| 24 Aug 2023 |
1900 |
Explosion. |
| 25 Aug 2023 |
0828 |
Event produced a steam-and-gas plume that rose 3 km and drifted NW. |
| 27-28 Aug 2023 |
0813 |
Four small events; the event at 0813 on 28 August lasted two minutes and generated a steam-and-gas plume that rose 2.5 km. |
| 1 Sep 2023 |
1526 |
Explosion generated plume that rose 2 km and ejected material onto the flanks. |
| 2-3 Sep 2023 |
- |
Small explosions detected in infrasound data. |
| 4 Sep 2023 |
1251 |
Gas-and-steam plume rose 1 km and drifted W. |
| 7 Nov 2023 |
1113 |
Explosion. |
| 8 Nov 2023 |
0722 |
Explosion. |
| 12 Nov 2023 |
0136 |
Small gas emissions. |
| 14 Nov 2023 |
0415 |
Small gas emissions. |
According to OVSICORI-UNA, during July-October the average weekly sulfur dioxide (SO2) flux ranged from 68 to 240 tonnes/day. However, in mid-November the flux increased to as high as 334 tonnes/day, the highest value measured in recent years. The high SO2 flux in mid-November was also detected by the TROPOMI instrument on the Sentinel-5P satellite (figure 43).
Geologic Background. Rincón de la Vieja, the largest volcano in NW Costa Rica, is a remote volcanic complex in the Guanacaste Range. The volcano consists of an elongated, arcuate NW-SE-trending ridge constructed within the 15-km-wide early Pleistocene Guachipelín caldera, whose rim is exposed on the south side. Sometimes known as the "Colossus of Guanacaste," it has an estimated volume of 130 km3 and contains at least nine major eruptive centers. Activity has migrated to the SE, where the youngest-looking craters are located. The twin cone of Santa María volcano, the highest peak of the complex, is located at the eastern end of a smaller, 5-km-wide caldera and has a 500-m-wide crater. A Plinian eruption producing the 0.25 km3 Río Blanca tephra about 3,500 years ago was the last major magmatic eruption. All subsequent eruptions, including numerous historical eruptions possibly dating back to the 16th century, have been from the prominent active crater containing a 500-m-wide acid lake located ENE of Von Seebach crater.
Information Contacts: Observatorio Vulcanológico Sismológica de Costa Rica-Universidad Nacional (OVSICORI-UNA), Apartado 86-3000, Heredia, Costa Rica (URL: http://www.ovsicori.una.ac.cr/); NASA Global Sulfur Dioxide Monitoring Page, Atmospheric Chemistry and Dynamics Laboratory, NASA Goddard Space Flight Center (NASA/GSFC), 8800 Greenbelt Road, Goddard MD 20771, USA (URL: https://so2.gsfc.nasa.gov/).
Bezymianny (Russia) — November 2023 Cite this Report
Bezymianny
Russia
55.972°N, 160.595°E; summit elev. 2882 m
All times are local (unless otherwise noted)
Explosion on 18 October 2023 sends ash plume 8 km high; lava flows and incandescent avalanches
Bezymianny, located on Russia’s Kamchatka Peninsula, has had eruptions since 1955 characterized by dome growth, explosions, pyroclastic flows, ash plumes, and ashfall. Activity during November 2022-April 2023 included gas-and-steam emissions, lava dome collapses generating avalanches, and persistent thermal activity. Similar eruptive activity continued from May through October 2023, described here based on information from weekly and daily reports of the Kamchatka Volcano Eruptions Response Team (KVERT), notices from Tokyo VAAC (Volcanic Ash Advisory Center), and from satellite data.
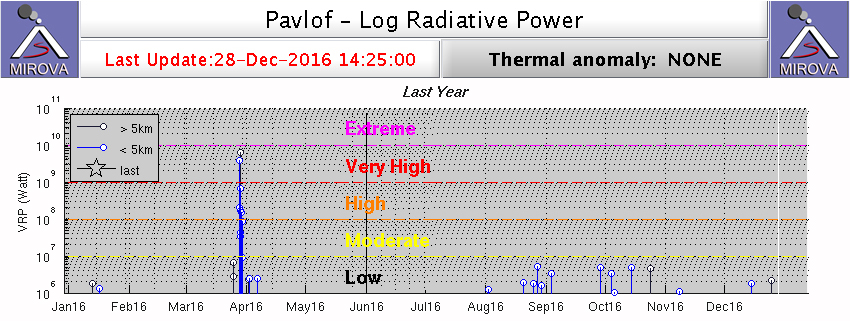
Overall activity decreased after the strong period of activity in late March through April 2023, which included ash explosions during 29 March and 7-8 April 2023 that sent plumes as high as 10-12 km altitude, along with dome growth and lava flows (BGVN 48:05). This reduced activity can be seen in the MIROVA thermal detection system graph (figure 56), which was consistent with data from the MODVOLC thermal detection system and with Sentinel-2 satellite images that showed persistent hotspots in the summit crater when conditions allowed observations. A renewed period of strong activity began in mid-October 2023.
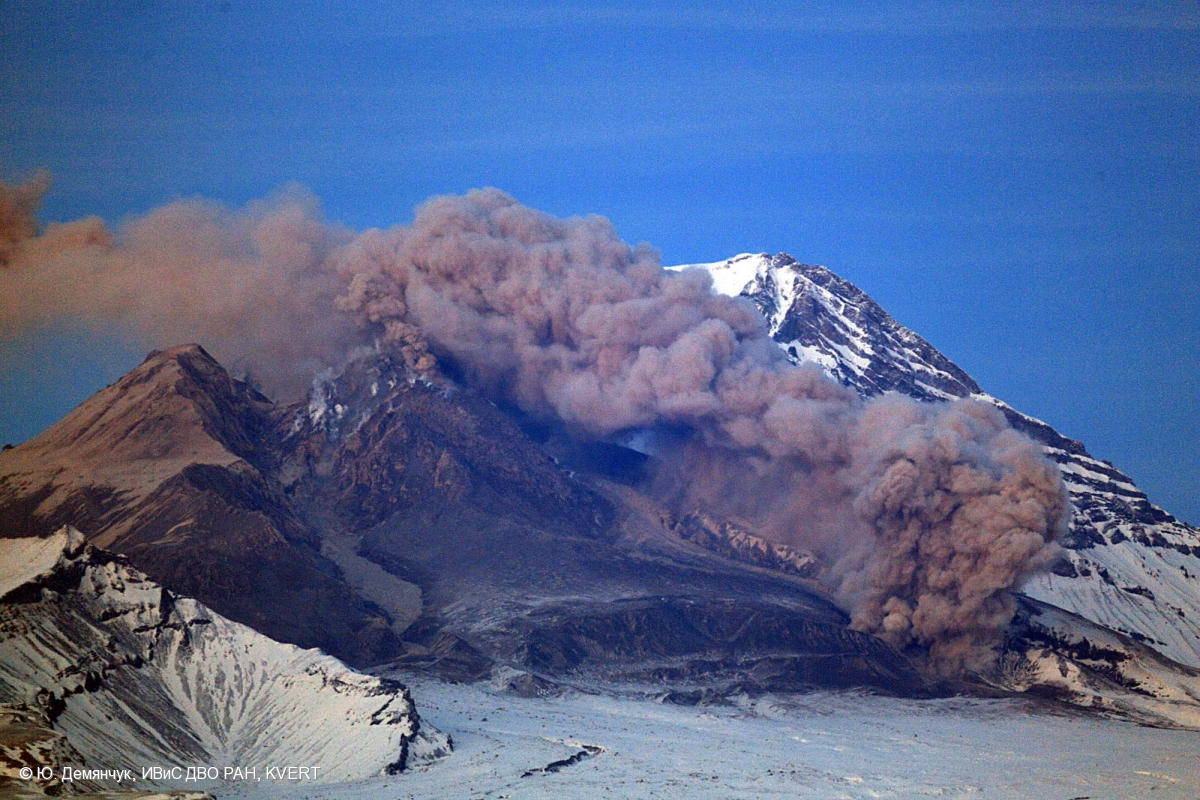
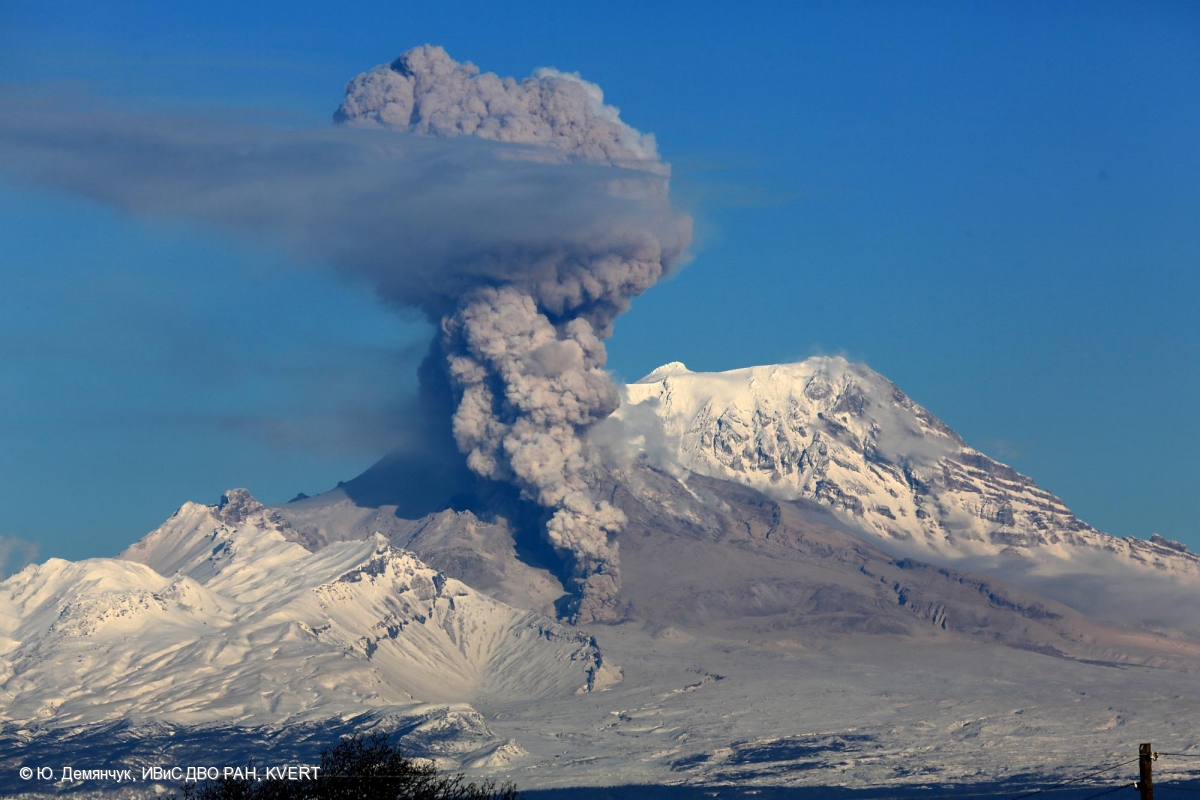
Activity increased significantly on 17 October 2023 when large collapses began during 0700-0830 on the E flanks of the lava dome and continued to after 0930 the next day (figure 57). Ash plumes rose to an altitude of 4.5-5 km, extending 220 km NNE by 18 October. A large explosion at 1630 on 18 October produced an ash plume that rose to an altitude of 11 km (8 km above the summit) and drifted NNE and then NW, extending 900 km NW within two days at an altitude of 8 km. Minor ashfall was noted in Kozyrevsk (45 km WNW). At 0820 on 20 October an ash plume was identified in satellite images drifting 100 km ENE at altitudes of 4-4.5 km.
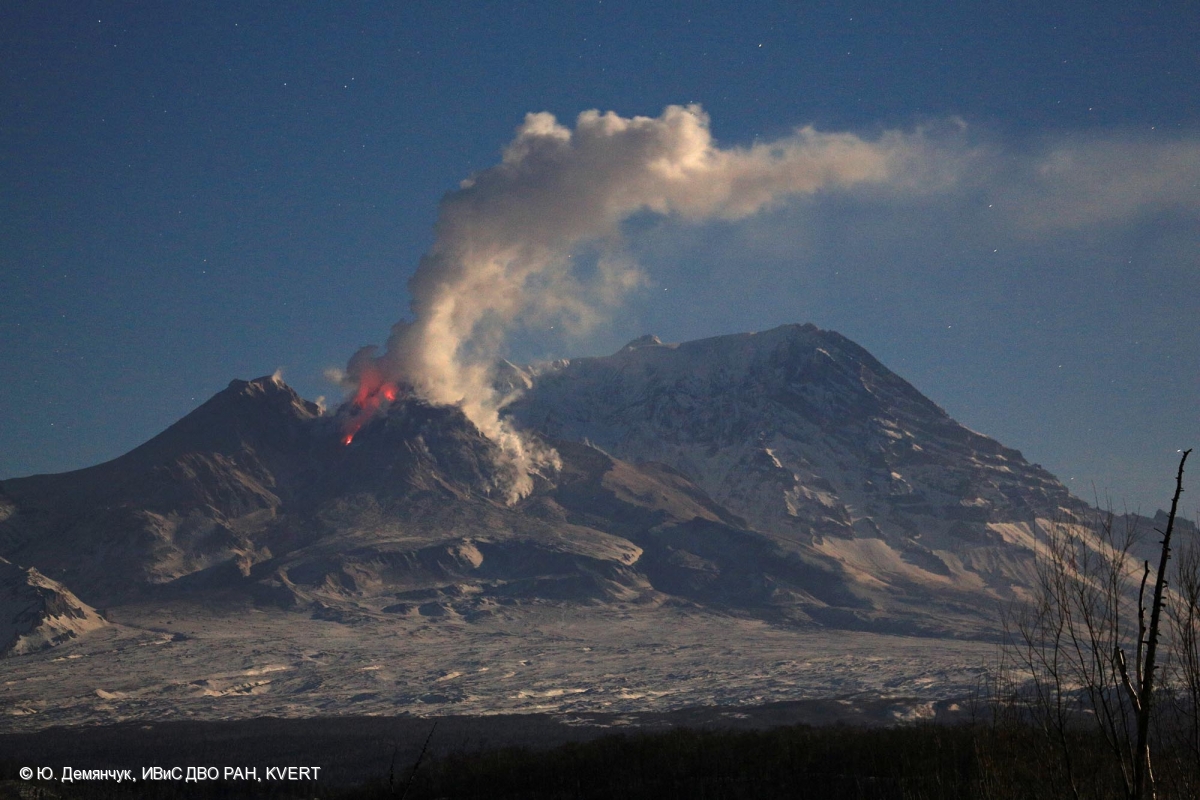
Lava flows and hot avalanches from the dome down the SE flank continued over the next few days, including 23 October when clear conditions allowed good observations (figures 58 and 59). A large thermal anomaly was observed over the volcano through 24 October, and in the summit crater on 30 October (figure 60). Strong fumarolic activity continued, with numerous avalanches and occasional incandescence. By the last week of October, volcanic activity had decreased to a level consistent with that earlier in the reporting period.
Aviation warnings were frequently updated during 17-20 October. KVERT issued a Volcano Observatory Notice for Aviation (VONA) on 17 October at 1419 and 1727 (0219 and 0527 UTC) raising the Aviation Color Code (ACC) from Yellow to Orange (second highest level). The next day, KVERT issued a VONA at 1705 (0505 UTC) raising the ACC to Red (highest level) but lowered it back to Orange at 2117 (0917 UTC). After another decrease to Yellow and back to Orange, the ACC was reduced to Yellow on 20 October at 1204 (0004 UTC). In addition, the Tokyo VAAC issued a series of Volcanic Ash Advisories beginning on 16 October and continuing through 30 October.
Geologic Background. The modern Bezymianny, much smaller than its massive neighbors Kamen and Kliuchevskoi on the Kamchatka Peninsula, was formed about 4,700 years ago over a late-Pleistocene lava-dome complex and an edifice built about 11,000-7,000 years ago. Three periods of intensified activity have occurred during the past 3,000 years. The latest period, which was preceded by a 1,000-year quiescence, began with the dramatic 1955-56 eruption. This eruption, similar to that of St. Helens in 1980, produced a large open crater that was formed by collapse of the summit and an associated lateral blast. Subsequent episodic but ongoing lava-dome growth, accompanied by intermittent explosive activity and pyroclastic flows, has largely filled the 1956 crater.
Information Contacts: Kamchatka Volcanic Eruptions Response Team (KVERT), Far Eastern Branch, Russian Academy of Sciences, 9 Piip Blvd., Petropavlovsk-Kamchatsky, 683006, Russia (URL: http://www.kscnet.ru/ivs/kvert/); Kamchatka Volcanological Station, Kamchatka Branch of Geophysical Survey, (KB GS RAS), Klyuchi, Kamchatka Krai, Russia (URL: http://volkstat.ru/); Tokyo Volcanic Ash Advisory Center (VAAC), 1-3-4 Otemachi, Chiyoda-ku, Tokyo 100-8122, Japan (URL: http://ds.data.jma.go.jp/svd/vaac/data/); Hawai'i Institute of Geophysics and Planetology (HIGP) - MODVOLC Thermal Alerts System, School of Ocean and Earth Science and Technology (SOEST), Univ. of Hawai'i, 2525 Correa Road, Honolulu, HI 96822, USA (URL: http://modis.higp.hawaii.edu/); MIROVA (Middle InfraRed Observation of Volcanic Activity), a collaborative project between the Universities of Turin and Florence (Italy) supported by the Centre for Volcanic Risk of the Italian Civil Protection Department (URL: http://www.mirovaweb.it/); Copernicus Browser, Copernicus Data Space Ecosystem, European Space Agency (URL: https://dataspace.copernicus.eu/browser/).chr
Kilauea (United States) — January 2023 Cite this Report
Kilauea
United States
19.421°N, 155.287°W; summit elev. 1222 m
All times are local (unless otherwise noted)
Low-level lava effusions in the lava lake at Halema’uma’u during July-December 2022
Kīlauea is the southeastern-most volcano in Hawaii and overlaps the E flank of the Mauna Loa volcano. Its East Rift Zone (ERZ) has been intermittently active for at least 2,000 years. An extended eruption period began in January 1983 and was characterized by open lava lakes and lava flows from the summit caldera and the East Rift Zone. During May 2018 magma migrated into the Lower East Rift Zone (LERZ) and opened 24 fissures along a 6-km-long NE-trending fracture zone that produced lava flows traveling in multiple directions. As lava emerged from the fissures, the lava lake at Halema'uma'u drained and explosions sent ash plumes to several kilometers altitude (BGVN 43:10).
The current eruption period started during September 2021 and has recently been characterized by lava effusions, spatter, and sulfur dioxide emissions in the active Halema’uma’u lava lake (BGVN 47:08). Lava effusions, some spatter, and sulfur dioxide emissions have continued during this reporting period of July through December 2022 using daily reports, volcanic activity notices, and abundant photo, map, and video data from the US Geological Survey's (USGS) Hawaiian Volcano Observatory (HVO).
Summary of activity during July-December 2022. Low-level effusions have continued at the western vent of the Halema’uma’u crater during July through early December 2022. Occasional weak ooze-outs (also called lava break outs) would occur along the margins of the crater floor. The overall level of the active lava lake throughout the reporting period gradually increased due to infilling, however it stagnated in mid-September (table 13). During September through November, activity began to decline, though lava effusions persisted at the western vent. By 9 December, the active part of the lava lake had completely crusted over, and incandescence was no longer visible.
Table 13. Summary of measurements taken during overflights at Kīlauea that show a gradual increase in the active lava lake level and the volume of lava effused since 29 September 2021. Lower activity was reported during September-October. Data collected during July-December 2022. Courtesy of HVO.
| Date: |
Level of the active lava lake (m): |
Cumulative volume of lava effused (million cubic meters): |
| 7 Jul 2022 |
130 |
95 |
| 19 Jul 2022 |
133 |
98 |
| 4 Aug 2022 |
136 |
102 |
| 16 Aug 2022 |
137 |
104 |
| 12 Sep 2022 |
143 |
111 |
| 5 Oct 2022 |
143 |
111 |
| 28 Oct 2022 |
143 |
111 |
Activity during July 2022. Lava effusions were reported from the western vent in the Halema’uma’u crater, along with occasional weak ooze-outs along the margins of the crater floor. The height of the lava lake was variable due to deflation-inflation tilt events; for example, the lake level dropped approximately 3-4 m during a summit deflation-inflation event reported on 1 July. Webcam images taken during the night of 6-12 July showed intermittent low-level spattering at the western vent that rose less than 10 m above the vent (figure 519). Measurements made during an overflight on 7 July indicated that the crater floor was infilled about 130 m and that 95 million cubic meters of lava had been effused since 29 September 2021. A single, relatively small lava ooze-out was active to the S of the lava lake. Around midnight on 8 July there were two brief periods of lava overflow onto the lake margins. On 9 July lava ooze-outs were reported near the SE and NE edges of the crater floor and during 10-11 July they occurred near the E, NE, and NW edges. On 16 July crater incandescence was reported, though the ooze-outs and spattering were not visible. On 18 July overnight webcam images showed incandescence in the western vent complex and two ooze-outs were reported around 0000 and 0200 on 19 July. By 0900 there were active ooze-outs along the SW edge of the crater floor. Measurements made from an overflight on 19 July indicated that the crater floor was infilled about 133 m and 98 million cubic meters of lava had erupted since 29 September 2021 (figure 520). On 20 July around 1600 active ooze-outs were visible along the N edge of the crater, which continued through the next day. Extensive ooze-outs occurred along the W margin during 24 July until 1900; on 26 July minor ooze-outs were noted along the N margin. Minor spattering was visible on 29 July along the E margin of the lake. The sulfur dioxide emission rates ranged 650-2,800 tons per day (t/d), the higher of which was measured on 8 July (figure 519).
Activity during August 2022. The eruption continued in the Halema’uma’u crater at the western vent. According to HVO the lava in the active lake remained at the level of the bounding levees. Occasional minor ooze-outs were observed along the margins of the crater floor. Strong nighttime crater incandescence was visible after midnight on 6 August over the western vent cone. During 6-7 August scattered small lava lobes were active along the crater floor and incandescence persisted above the western vent through 9 August. During 7-9 August HVO reported a single lava effusion source was active along the NW margin of the crater floor. Measurements from an overflight on 4 August indicated that the crater floor was infilled about 136 m total and that 102 million cubic meters of lava had been erupted since the start of the eruption. Lava breakouts were reported along the N, NE, E, S, and W margins of the crater during 10-16 August. Another overflight survey conducted on 16 August indicated that the crater floor infilled about 137 m and 104 million cubic meters of lava had been erupted since September 2021. Measured sulfur dioxide emissions rates ranged 1,150-2,450 t/d, the higher of which occurred on 8 August.
Activity during September 2022. During September, lava effusion continued from the western vent into the active lava lake and onto the crater floor. Intermittent minor ooze-outs were reported through the month. A small ooze-out was visible on the W crater floor margin at 0220 on 2 September, which showed decreasing surface activity throughout the day, but remained active through 3 September. On 3 September around 1900 a lava outbreak occurred along the NW margin of the crater floor but had stopped by the evening of 4 September. Field crews monitoring the summit lava lake on 9 September observed spattering on the NE margin of the lake that rose no higher than 10 m, before falling back onto the lava lake crust (figure 521). Overflight measurements on 12 September indicated that the crater floor was infilled a total of 143 m and 111 million cubic meters of lava had been erupted since September 2021. Extensive breakouts in the W and N part of the crater floor were reported at 1600 on 20 September and continued into 26 September. The active part of the lava lake dropped by 10 m while other parts of the crater floor dropped by several meters. Summit tiltmeters recorded a summit seismic swarm of more than 80 earthquakes during 1500-1800 on 21 September, which occurred about 1.5 km below Halema’uma’u; a majority of these were less than Mw 2. By 22 September the active part of the lava lake was infilled about 2 m. On 23 September the western vent areas exhibited several small spatter cones with incandescent openings, along with weak, sporadic spattering (figure 522). The sulfur dioxide emission rate ranged from 930 t/d to 2,000 t/d, the higher of which was measured on 6 September.
Activity during October 2022. Activity during October declined slightly compared to previous months, though lava effusions persisted from the western vent into the active lava lake and onto the crater floor during October (figure 523). Slight variations in the lava lake were noted throughout the month. HVO reported that around 0600 on 3 October the level of the lava lake has lowered slightly. Overflight measurements taken on 5 October indicated that the crater floor was infilled a total of about 143 m and that 111 million cubic meters of lava had been effused since September 2021. During 6-7 October the lake gradually rose 0.5 m. Sulfur dioxide measurements made on 22 October had an emission rate of 700 t/d. Another overflight taken on 28 October showed that there was little to no change in the elevation of the crater floor: the crater floor was infilled a total of 143 m and 111 million cubic meters of lava had erupted since the start of the eruption.
Activity during November 2022. Activity remained low during November, though HVO reported that lava from the western vent continued to effuse into the active lava lake and onto the crater floor throughout the month. The rate of sulfur dioxide emissions during November ranged from 300-600 t/d, the higher amount of which occurred on 9 November.
Activity during December 2022. Similar low activity was reported during December, with lava effusing from the western vent into the active lava lake and onto the crater floor. During 4-5 December the active part of the lava lake was slightly variable in elevation and fluctuated within 1 m. On 9 December HVO reported that lava was no longer erupting from the western vent in the Halema’uma’u crater and that sulfur dioxide emissions had returned to near pre-eruption background levels; during 10-11 December, the lava lake had completely crusted over, and no incandescence was visible (figure 524). Time lapse camera images covering the 4-10 December showed that the crater floor showed weak deflation and no inflation. Some passive events of crustal overturning were reported during 14-15 December, which brought fresh incandescent lava to the lake surface. The sulfur dioxide emission rate was approximately 200 t/d on 14 December. A smaller overturn event on 17 December and another that occurred around 0000 and into the morning of 20 December were also detected. A small seismic swarm was later detected on 30 December.
Geologic Background. Kilauea overlaps the E flank of the massive Mauna Loa shield volcano in the island of Hawaii. Eruptions are prominent in Polynesian legends; written documentation since 1820 records frequent summit and flank lava flow eruptions interspersed with periods of long-term lava lake activity at Halemaumau crater in the summit caldera until 1924. The 3 x 5 km caldera was formed in several stages about 1,500 years ago and during the 18th century; eruptions have also originated from the lengthy East and Southwest rift zones, which extend to the ocean in both directions. About 90% of the surface of the basaltic shield volcano is formed of lava flows less than about 1,100 years old; 70% of the surface is younger than 600 years. The long-term eruption from the East rift zone between 1983 and 2018 produced lava flows covering more than 100 km2, destroyed hundreds of houses, and added new coastline.
Information Contacts: Hawaiian Volcano Observatory (HVO), U.S. Geological Survey, PO Box 51, Hawai'i National Park, HI 96718, USA (URL: http://hvo.wr.usgs.gov/).
Nyamulagira (DR Congo) — November 2023 Cite this Report
Nyamulagira
DR Congo
1.408°S, 29.2°E; summit elev. 3058 m
All times are local (unless otherwise noted)
Lava flows and thermal activity during May-October 2023
Nyamulagira (also known as Nyamuragira) is a shield volcano in the Democratic Republic of Congo with the summit truncated by a small 2 x 2.3 km caldera with walls up to about 100 m high. Documented eruptions have occurred within the summit caldera, as well as from numerous flank fissures and cinder cones. The current eruption period began in April 2018 and has more recently been characterized by summit crater lava flows and thermal activity (BGVN 48:05). This report describes lava flows and variable thermal activity during May through October 2023, based on information from the Observatoire Volcanologique de Goma (OVG) and various satellite data.
Lava lake activity continued during May. The MIROVA (Middle InfraRed Observation of Volcanic Activity) system recorded moderate-to-strong thermal activity throughout the reporting period; activity was more intense during May and October and relatively weaker from June through September (figure 95). The MODVOLC thermal algorithm, detected a total of 209 thermal alerts. There were 143 hotspots detected during May, eight during June, nine during September, and 49 during October. This activity was also reflected in infrared satellite images, where a lava flow was visible in the NW part of the crater on 7 May and strong activity was seen in the center of the crater on 4 October (figure 96). Another infrared satellite image taken on 12 May showed still active lava flows along the NW margin of the crater. According to OVG lava effusions were active during 7-29 May and moved to the N and NW parts of the crater beginning on 9 May. Strong summit crater incandescence was visible from Goma (27 km S) during the nights of 17, 19, and 20 May (figure 97). On 17 May there was an increase in eruptive activity, which peaked at 0100 on 20 May. Notable sulfur dioxide plumes drifted NW and W during 19-20 May (figure 98). Drone footage acquired in partnership with the USGS (United States Geological Survey) on 20 May captured images of narrow lava flows that traveled about 100 m down the W flank (figure 99). Data from the Rumangabo seismic station indicated a decreasing trend in activity during 17-21 May. Although weather clouds prevented clear views of the summit, a strong thermal signature on the NW flank was visible in an infrared satellite image on 22 May, based on an infrared satellite image. On 28 May the lava flows on the upper W flank began to cool and solidify. By 29 May seismicity returned to levels similar to those recorded before the 17 May increase. Lava effusion continued but was confined to the summit crater; periodic crater incandescence was observed.
Low-level activity was noted during June through October. On 1 June OVG reported that seismicity remained at lower levels and that crater incandescence had been absent for three days, though infrared satellite imagery showed continued lava effusion in the summit crater. The lava flows on the flanks covered an estimated 0.6 km2. Satellite imagery continued to show thermal activity confined to the lava lake through October (figure 96), although no lava flows or significant sulfur dioxide emissions were reported.
Geologic Background. Africa's most active volcano, Nyamulagira (also known as Nyamuragira), is a massive high-potassium basaltic shield about 25 km N of Lake Kivu and 13 km NNW of the steep-sided Nyiragongo volcano. The summit is truncated by a small 2 x 2.3 km caldera that has walls up to about 100 m high. Documented eruptions have occurred within the summit caldera, as well as from the numerous flank fissures and cinder cones. A lava lake in the summit crater, active since at least 1921, drained in 1938, at the time of a major flank eruption. Recent lava flows extend down the flanks more than 30 km from the summit as far as Lake Kivu; extensive lava flows from this volcano have covered 1,500 km2 of the western branch of the East African Rift.
Information Contacts: Observatoire Volcanologique de Goma (OVG), Departement de Geophysique, Centre de Recherche en Sciences Naturelles, Lwiro, D.S. Bukavu, DR Congo; Hawai'i Institute of Geophysics and Planetology (HIGP) - MODVOLC Thermal Alerts System, School of Ocean and Earth Science and Technology (SOEST), Univ. of Hawai'i, 2525 Correa Road, Honolulu, HI 96822, USA (URL: http://modis.higp.hawaii.edu/); MIROVA (Middle InfraRed Observation of Volcanic Activity), a collaborative project between the Universities of Turin and Florence (Italy) supported by the Centre for Volcanic Risk of the Italian Civil Protection Department (URL: http://www.mirovaweb.it/); NASA Global Sulfur Dioxide Monitoring Page, Atmospheric Chemistry and Dynamics Laboratory, NASA Goddard Space Flight Center (NASA/GSFC), 8800 Greenbelt Road, Goddard, Maryland, USA (URL: https://so2.gsfc.nasa.gov/); Copernicus Browser, Copernicus Data Space Ecosystem, European Space Agency (URL: https://dataspace.copernicus.eu/browser/); Charles Balagizi, Goma Volcano Observatory, Departement de Geophysique, Centre de Recherche en Sciences Naturelles, Lwiro, D.S. Bukavu, DR Congo.
Bagana (Papua New Guinea) — October 2023 Cite this Report
Bagana
Papua New Guinea
6.137°S, 155.196°E; summit elev. 1855 m
All times are local (unless otherwise noted)
Explosions, ash plumes, ashfall, and lava flows during April-September 2023
The remote volcano of Bagana is located in central Bougainville Island, Papua New Guinea. Recorded eruptions date back to 1842 and activity has consisted of effusive activity that has built a small lava dome in the summit crater and occasional explosions that produced pyroclastic flows. The most recent eruption has been ongoing since February 2000 and has produced occasional explosions, ash plumes, and lava flows. More recently, activity has been characterized by ongoing effusive activity and ash emissions (BGVN 48:04). This report updates activity from April through September 2023 that has consisted of explosions, ash plumes, ashfall, and lava flows, using information from the Darwin Volcanic Ash Advisory Center (VAAC) and satellite data.
An explosive eruption was reported on 7 July that generated a large gas-and-ash plume to high altitudes and caused significant ashfall in local communities; the eruption plume had reached upper tropospheric (16-18 km altitude) altitudes by 2200, according to satellite images. Sulfur dioxide plumes were detected in satellite images on 8 July and indicated that the plume was likely a mixture of gas, ice, and ash. A report issued by the Autonomous Bougainville Government (ABG) (Torokina District, Education Section) on 10 July noted that significant ash began falling during 2000-2100 on 7 July and covered most areas in the Vuakovi, Gotana (9 km SW), Koromaketo, Laruma (25 km W) and Atsilima (27 km NW) villages. Pyroclastic flows also occurred, according to ground-based reports; small deposits confined to one drainage were inspected by RVO during an overflight on 17 July and were confirmed to be from the 7 July event. Ashfall continued until 10 July and covered vegetation, which destroyed bushes and gardens and contaminated rivers and streams.
RVO reported another eruption on 14 July. The Darwin VAAC stated that an explosive event started around 0830 on 15 July and produced an ash plume that rose to 16.5 km altitude by 1000 and drifted N, according to satellite images. The plume continued to drift N and remained visible through 1900, and by 2150 it had dissipated.
Ashfall likely from both the 7 and 15 July events impacted about 8,111 people in Torokina (20 km SW), including Tsito/Vuakovi, Gotana, Koromaketo, Kenaia, Longkogari, Kenbaki, Piva (13 km SW), and Atsinima, and in the Tsitovi district, according to ABG. Significant ashfall was also reported in Ruruvu (22 km N) in the Wakunai District of Central Bougainville, though the thickness of these deposits could not be confirmed. An evacuation was called for the villages in Wakunai, where heavy ashfall had contaminated water sources; the communities of Ruruvu, Togarau, Kakarapaia, Karauturi, Atao, and Kuritaturi were asked to evacuate to a disaster center at the Wakunai District Station, and communities in Torokina were asked to evacuate to the Piva District station. According to a news article, more than 7,000 people needed temporary accommodations, with about 1,000 people in evacuation shelters. Ashfall had deposited over a broad area, contaminating water supplies, affecting crops, and collapsing some roofs and houses in rural areas. Schools were temporarily shut down. Intermittent ash emissions continued through the end of July and drifted NNW, NW, and SW. Fine ashfall was reported on the coast of Torokina, and ash plumes also drifted toward Laruma and Atsilima.
A small explosive eruption occurred at 2130 on 28 July that ejected material from the crater vents, according to reports from Torokina, in addition to a lava flow that contained two lobes. A second explosion was detected at 2157. Incandescence from the lava flow was visible from Piva as it descended the W flank around 2000 on 29 July (figure 47). The Darwin VAAC reported that a strong thermal anomaly was visible in satellite images during 30-31 July and that ash emissions rose to 2.4 km altitude and drifted WSW on 30 July. A ground report from RVO described localized emissions at 0900 on 31 July.
The Darwin VAAC reported that ash plumes were identified in satellite imagery at 0800 and 1220 on 12 August and rose to 2.1 km and 3 km altitude and drifted NW and W, respectively. A news report stated that aid was sent to more than 6,300 people that were adversely affected by the eruption. Photos taken during 17-19 August showed ash emissions rising no higher than 1 km above the summit and drifting SE. A small explosion generated an ash plume during the morning of 19 August. Deposits from small pyroclastic flows were also captured in the photos. Satellite images captured lava flows and pyroclastic flow deposits. Two temporary seismic stations were installed near Bagana on 17 August at distances of 7 km WSW (Vakovi station) and 11 km SW (Kepox station). The Kepox station immediately started to record continuous, low-frequency background seismicity.
Satellite data. Little to no thermal activity was detected during April through mid-July 2023; only one anomaly was recorded during early April and one during early June, according to MIROVA (Middle InfraRed Observation of Volcanic Activity) data (figure 48). Thermal activity increased in both power and frequency during mid-July through September, although there were still some short gaps in detected activity. MODVOLC also detected increased thermal activity during August; thermal hotspots were detected a total of five times on 19, 20, and 27 August. Weak thermal anomalies were also captured in infrared satellite images on clear weather days throughout the reporting period on 7, 12, and 17 April, 27 May, 1, 6, 16, and 31 July, and 19 September (figure 48); a strong thermal anomaly was visible on 31 July. Distinct sulfur dioxide plumes that drifted generally NW were intermittently captured by the TROPOMI instrument on the Sentinel-5P satellite and sometimes exceeded two Dobson Units (DUs) (figure 49).
Geologic Background. Bagana volcano, in a remote portion of central Bougainville Island, is frequently active. This massive symmetrical cone was largely constructed by an accumulation of viscous andesitic lava flows. The entire edifice could have been constructed in about 300 years at its present rate of lava production. Eruptive activity is characterized by non-explosive effusion of viscous lava that maintains a small lava dome in the summit crater, although occasional explosive activity produces pyroclastic flows. Lava flows with tongue-shaped lobes up to 50 m thick and prominent levees descend the flanks on all sides.
Information Contacts: Rabaul Volcano Observatory (RVO), Geohazards Management Division, Department of Mineral Policy and Geohazards Management (DMPGM), PO Box 3386, Kokopo, East New Britain Province, Papua New Guinea; Darwin Volcanic Ash Advisory Centre (VAAC), Bureau of Meteorology, Northern Territory Regional Office, PO Box 40050, Casuarina, NT 0811, Australia (URL: http://www.bom.gov.au/info/vaac/); MIROVA (Middle InfraRed Observation of Volcanic Activity), a collaborative project between the Universities of Turin and Florence (Italy) supported by the Centre for Volcanic Risk of the Italian Civil Protection Department (URL: http://www.mirovaweb.it/); Hawai'i Institute of Geophysics and Planetology (HIGP) - MODVOLC Thermal Alerts System, School of Ocean and Earth Science and Technology (SOEST), Univ. of Hawai'i, 2525 Correa Road, Honolulu, HI 96822, USA (URL: http://modis.higp.hawaii.edu/); NASA Global Sulfur Dioxide Monitoring Page, Atmospheric Chemistry and Dynamics Laboratory, NASA Goddard Space Flight Center (NASA/GSFC), 8800 Greenbelt Road, Goddard, Maryland, USA (URL: https://so2.gsfc.nasa.gov/); Copernicus Browser, Copernicus Data Space Ecosystem, European Space Agency (URL: https://dataspace.copernicus.eu/browser/); Autonomous Bougainville Government, P.O Box 322, Buka, AROB, PNG (URL: https://abg.gov.pg/); Andrew Tupper (Twitter: @andrewcraigtupp); Simon Carn, Geological and Mining Engineering and Sciences, Michigan Technological University, 1400 Townsend Drive, Houghton, MI 49931, USA (URL: http://www.volcarno.com/, Twitter: @simoncarn); Radio NZ (URL: https://www.rnz.co.nz/news/pacific/494464/more-than-7-000-people-in-bougainville-need-temporary-accommodation-after-eruption); USAID, 1300 Pennsylvania Ave, NW, Washington DC 20004, USA (URL: https://www.usaid.gov/pacific-islands/press-releases/aug-08-2023-united-states-provides-immediate-emergency-assistance-support-communities-affected-mount-bagana-volcanic-eruptions).
Mayon (Philippines) — October 2023 Cite this Report
Mayon
Philippines
13.257°N, 123.685°E; summit elev. 2462 m
All times are local (unless otherwise noted)
Lava flows, pyroclastic flows, ash emissions, and seismicity during April-September 2023
Mayon is located in the Philippines and has steep upper slopes capped by a small summit crater. Historical eruptions date back to 1616 CE that have been characterized by Strombolian eruptions, lava flows, pyroclastic flows, and mudflows. Eruptions mostly originated from a central conduit. Pyroclastic flows and mudflows have commonly descended many of the approximately 40 drainages that surround the volcano. The most recent eruption occurred during June through October 2022 and consisted of lava dome growth and gas-and-steam emissions (BGVN 47:12). A new eruption was reported during late April 2023 and has included lava flows, pyroclastic density currents, ash emissions, and seismicity. This report covers activity during April through September 2023 based on daily bulletins from the Philippine Institute of Volcanology and Seismology (PHIVOLCS).
During April through September 2023, PHIVOLCS reported near-daily rockfall events, frequent volcanic earthquakes, and sulfur dioxide measurements. Gas-and-steam emissions rose 100-900 m above the crater and drifted in different directions. Nighttime crater incandescence was often visible during clear weather and was accompanied by incandescent avalanches of material. Activity notably increased during June when lava flows were reported on the S, SE, and E flanks (figure 52). The MIROVA graph (Middle InfraRed Observation of Volcanic Activity) showed strong thermal activity coincident with these lava flows, which remained active through September (figure 53). According to the MODVOLC thermal algorithm, a total of 110 thermal alerts were detected during the reporting period: 17 during June, 40 during July, 27 during August, and 26 during September. During early June, pyroclastic density currents (PDCs) started to occur more frequently.
Low activity was reported during much of April and May; gas-and-steam emissions rose 100-900 m above the crater and generally drifted in different directions. A total of 52 rockfall events and 18 volcanic earthquakes were detected during April and 147 rockfall events and 13 volcanic events during May. Sulfur dioxide flux measurements ranged between 400-576 tons per day (t/d) during April, the latter of which was measured on 29 April and between 162-343 t/d during May, the latter of which was measured on 13 May.
Activity during June increased, characterized by lava flows, pyroclastic density currents (PDCs), crater incandescence and incandescent rockfall events, gas-and-steam emissions, and continued seismicity. Weather clouds often prevented clear views of the summit, but during clear days, moderate gas-and-steam emissions rose 100-2,500 m above the crater and drifted in multiple directions. A total of 6,237 rockfall events and 288 volcanic earthquakes were detected. The rockfall events often deposited material on the S and SE flanks within 700-1,500 m of the summit crater and ash from the events drifted SW, S, SE, NE, and E. Sulfur dioxide emissions ranged between 149-1,205 t/d, the latter of which was measured on 10 June. Short-term observations from EDM and electronic tiltmeter monitoring indicated that the upper slopes were inflating since February 2023. Longer-term ground deformation parameters based on EDM, precise leveling, continuous GPS, and electronic tilt monitoring indicated that the volcano remained inflated, especially on the NW and SE flanks. At 1000 on 5 June the Volcano Alert Level (VAL) was raised to 2 (on a 0-5 scale). PHIVOLCS noted that although low-level volcanic earthquakes, ground deformation, and volcanic gas emissions indicated unrest, the steep increase in rockfall frequency may indicate increased dome activity.
A total of 151 dome-collapse PDCs occurred during 8-9 and 11-30 June, traveled 500-2,000 m, and deposited material on the S flank within 2 km of the summit crater. During 8-9 June the VAL was raised to 3. At approximately 1947 on 11 June lava flow activity was reported; two lobes traveled within 500 m from the crater and deposited material on the S (Mi-isi), SE (Bonga), and E (Basud) flanks. Weak seismicity accompanied the lava flow and slight inflation on the upper flanks. This lava flow remained active through 30 June, moving down the S and SE flank as far as 2.5 km and 1.8 km, respectively and depositing material up to 3.3 km from the crater. During 15-16 June traces of ashfall from the PDCs were reported in Sitio Buga, Nabonton, City of Ligao and Purok, and San Francisco, Municipality of Guinobatan. During 28-29 June there were two PDCs generated by the collapse of the lava flow front, which generated a light-brown ash plume 1 km high. Satellite monitors detected significant concentrations of sulfur dioxide beginning on 29 June. On 30 June PDCs primarily affected the Basud Gully on the E flank, the largest of which occurred at 1301 and lasted eight minutes, based on the seismic record. Four PDCs generated between 1800 and 2000 that lasted approximately four minutes each traveled 3-4 km on the E flank and generated an ash plume that rose 1 km above the crater and drifted N and NW. Ashfall was recorded in Tabaco City.
Similar strong activity continued during July; slow lava effusion remained active on the S and SE flanks and traveled as far as 2.8 km and 2.8 km, respectively and material was deposited as far as 4 km from the crater. There was a total of 6,983 rockfall events and 189 PDCs that affected the S, SE, and E flanks. The volcano network detected a total of 2,124 volcanic earthquakes. Continuous gas-and-steam emissions rose 200-2,000 m above the crater and drifted in multiple directions. Sulfur dioxide emissions averaged 792-4,113 t/d, the latter of which was measured on 28 July. During 2-4 July three PDCs were generated from the collapse of the lava flow and resulting light brown plumes rose 200-300 m above the crater. Continuous tremor pulses were reported beginning at 1547 on 3 July through 7 July at 1200, at 2300 on 8 July and going through 0300 on 10 July, and at 2300 on 16 July, as recorded by the seismic network. During 6-9 July there were 10 lava flow-collapse-related PDCs that generated light brown plumes 300-500 m above the crater. During 10-11 July light ashfall was reported in some areas of Mabinit, Legazpi City, Budiao and Salvacion, Daraga, and Camalig, Albay. By 18 July the lava flow advanced 600 m on the E flank as well.
During 1733 on 18 July and 0434 on 19 July PHIVOLCS reported 30 “ashing” events, which are degassing events accompanied by audible thunder-like sounds and entrained ash at the crater, which produced short, dark plumes that drifted SW. These events each lasted 20-40 seconds, and plume heights ranged from 150-300 m above the crater, as recorded by seismic, infrasound, visual, and thermal monitors. Three more ashing events occurred during 19-20 July. Short-term observations from electronic tilt and GPS monitoring indicate deflation on the E lower flanks in early July and inflation on the NW middle flanks during the third week of July. Longer-term ground deformation parameters from EDM, precise leveling, continuous GPS, and electronic tilt monitoring indicated that the volcano was still generally inflated relative to baseline levels. A short-lived lava pulse lasted 28 seconds at 1956 on 21 July, which was accompanied by seismic and infrasound signals. By 22 July, the only lava flow that remained active was on the SE flank, and continued to extend 3.4 km, while those on the S and E flanks weakened markedly. One ashing event was detected during 30-31 July, whereas there were 57 detected during 31 July-1 August; according to PHIVOLCS beginning at approximately 1800 on 31 July eruptive activity was dominated by phases of intermittent ashing, as well as increased in the apparent rates of lava effusion from the summit crater. The ashing phases consisted of discrete events recorded as low-frequency volcanic earthquakes (LFVQ) typically 30 seconds in duration, based on seismic and infrasound signals. Gray ash plume rose 100 m above the crater and generally drifted NE. Shortly after these ashing events began, new lava began to effuse rapidly from the crater, feeding the established flowed on the SE, E, and E flanks and generating frequent rockfall events.
Intensified unrest persisted during August. There was a total of 4,141 rockfall events, 2,881 volcanic earthquakes, which included volcanic tremor events, 32 ashing events, and 101 PDCs detected throughout the month. On clear weather days, gas-and-steam emissions rose 300-1,500 m above the crater and drifted in different directions (figure 54). Sulfur dioxide emissions averaged 735-4,756 t/d, the higher value of which was measured on 16 August. During 1-2 August the rate of lava effusion decreased, but continued to feed the flows on the SE, S, and E flanks, maintaining their advances to 3.4 km, 2.8 km, and 1.1 km from the crater, respectively (figure 55). Rockfall and PDCs generated by collapses at the lava flow margins and from the summit dome deposited material within 4 km of the crater. During 3-4 August there were 10 tremor events detected that lasted 1-4 minutes. Short-lived lava pulse lasted 35 seconds and was accompanied by seismic and infrasound signals at 0442 on 6 August. Seven collapses were recorded at the front of the lava flow during 12-14 August.
During September, similar activity of slow lava effusion, PDCs, gas-and-steam emissions, and seismicity continued. There was a total of 4,452 rockfall events, 329 volcanic earthquakes, which included volcanic tremor events, two ashing events, and 85 PDCs recorded throughout the month. On clear weather days, gas-and-steam emissions rose 100-1,500 m above the crater and drifted in multiple directions. Sulfur dioxide emissions averaged 609-2,252 t/d, the higher average of which was measured on 6 September. Slow lava effusion continued advancing on the SE, S, and E flanks, maintaining lengths of 3.4 km, 2.8 km, and 1.1 km, respectively. Rockfall and PDC events generated by collapses along the lava flow margins and at the summit dome deposited material within 4 km of the crater.
Geologic Background. Symmetrical Mayon, which rises above the Albay Gulf NW of Legazpi City, is the most active volcano of the Philippines. The steep upper slopes are capped by a small summit crater. Recorded eruptions since 1616 CE range from Strombolian to basaltic Plinian, with cyclical activity beginning with basaltic eruptions, followed by longer periods of andesitic lava flows. Eruptions occur predominately from the central conduit and have also produced lava flows that travel far down the flanks. Pyroclastic density currents and mudflows have commonly swept down many of the approximately 40 ravines that radiate from the summit and have often damaged populated lowland areas. A violent eruption in 1814 killed more than 1,200 people and devastated several towns.
Information Contacts: Philippine Institute of Volcanology and Seismology (PHIVOLCS), Department of Science and Technology, University of the Philippines Campus, Diliman, Quezon City, Philippines (URL: http://www.phivolcs.dost.gov.ph/); MIROVA (Middle InfraRed Observation of Volcanic Activity), a collaborative project between the Universities of Turin and Florence (Italy) supported by the Centre for Volcanic Risk of the Italian Civil Protection Department (URL: http://www.mirovaweb.it/); Hawai'i Institute of Geophysics and Planetology (HIGP) - MODVOLC Thermal Alerts System, School of Ocean and Earth Science and Technology (SOEST), Univ. of Hawai'i, 2525 Correa Road, Honolulu, HI 96822, USA (URL: http://modis.higp.hawaii.edu/); Copernicus Browser, Copernicus Data Space Ecosystem, European Space Agency (URL: https://dataspace.copernicus.eu/browser/); William Rogers, Legazpi City, Albay Province, Philippines.
Nishinoshima (Japan) — October 2023 Cite this Report
Nishinoshima
Japan
27.247°N, 140.874°E; summit elev. 100 m
All times are local (unless otherwise noted)
Eruption plumes and gas-and-steam plumes during May-August 2023
Nishinoshima, located about 1,000 km S of Tokyo, is a small island in the Ogasawara Arc in Japan. The island is the summit of a massive submarine volcano that has prominent submarine peaks to the S, W, and NE. Eruptions date back to 1973 and the current eruption period began in October 2022. Recent activity has consisted of small ash plumes and fumarolic activity (BGVN 48:07). This report covers activity during May through August 2023, using information from monthly reports of the Japan Meteorological Agency (JMA) monthly reports and satellite data.
Activity during May through June was relatively low. The Japan Coast Guard (JCG) did overflights on 14 and 22 June and reported white gas-and-steam emissions rising 600 m and 1,200 m from the central crater of the pyroclastic cone, respectively (figure 125). In addition, multiple white gas-and-steam emissions rose from the inner rim of the W side of the crater and from the SE flank of the pyroclastic cone. Discolored brown-to-green water was observed around almost the entire perimeter of the island; on 22 June light green discolored water was observed off the S coast of the island.
Observations from the Himawari meteorological satellite confirmed an eruption on 9 and 10 July. An eruption plume rose 1.6 km above the crater and drifted N around 1300 on 9 July. Satellite images acquired at 1420 and 2020 on 9 July and at 0220 on 10 July showed continuing emissions that rose 1.3-1.6 km above the crater and drifted NE and N. The Tokyo VAAC reported that an ash plume seen by a pilot and identified in a satellite image at 0630 on 21 July rose to 3 km altitude and drifted S.
Aerial observations conducted by JCG on 8 August showed a white-and-gray plume rising from the central crater of the pyroclastic cone, and multiple white gas-and-steam emissions were rising from the inner edge of the western crater and along the NW-SE flanks of the island (figure 126). Brown-to-green discolored water was also noted around the perimeter of the island.
Intermittent low-to-moderate power thermal anomalies were recorded in the MIROVA graph (Middle InfraRed Observation of Volcanic Activity), showing an increase in both frequency and power beginning in July (figure 127). This increase in activity coincides with eruptive activity on 9 and 10 July, characterized by eruption plumes. According to the MODVOLC thermal alert algorithm, one thermal hotspot was recorded on 20 July. Weak thermal anomalies were also detected in infrared satellite imagery, accompanied by strong gas-and-steam plumes (figure 128).
Geologic Background. The small island of Nishinoshima was enlarged when several new islands coalesced during an eruption in 1973-74. Multiple eruptions that began in 2013 completely covered the previous exposed surface and continued to enlarge the island. The island is the summit of a massive submarine volcano that has prominent peaks to the S, W, and NE. The summit of the southern cone rises to within 214 m of the ocean surface 9 km SSE.
Information Contacts: Japan Meteorological Agency (JMA), 1-3-4 Otemachi, Chiyoda-ku, Tokyo 100-8122, Japan (URL: http://www.jma.go.jp/jma/indexe.html); Tokyo Volcanic Ash Advisory Center (VAAC), 1-3-4 Otemachi, Chiyoda-ku, Tokyo 100-8122, Japan (URL: http://ds.data.jma.go.jp/svd/vaac/data/); MIROVA (Middle InfraRed Observation of Volcanic Activity), a collaborative project between the Universities of Turin and Florence (Italy) supported by the Centre for Volcanic Risk of the Italian Civil Protection Department (URL: http://www.mirovaweb.it/); Copernicus Browser, Copernicus Data Space Ecosystem, European Space Agency (URL: https://dataspace.copernicus.eu/browser/).
Krakatau (Indonesia) — October 2023 Cite this Report
Krakatau
Indonesia
6.1009°S, 105.4233°E; summit elev. 285 m
All times are local (unless otherwise noted)
White gas-and-steam plumes and occasional ash plumes during May-August 2023
Krakatau is located in the Sunda Strait between Java and Sumatra, Indonesia. Caldera collapse during the catastrophic 1883 eruption destroyed Danan and Perbuwatan cones and left only a remnant of Rakata. The post-collapse cone of Anak Krakatau (Child of Krakatau) was constructed within the 1883 caldera at a point between the former Danan and Perbuwatan cones; it has been the site of frequent eruptions since 1927. The current eruption period began in May 2021 and has recently consisted of Strombolian eruptions and ash plumes (BGVN 48:07). This report describes lower levels of activity consisting of ash and white gas-and-steam plumes during May through August 2023, based on information provided by the Indonesian Center for Volcanology and Geological Hazard Mitigation, referred to as Pusat Vulkanologi dan Mitigasi Bencana Geologi (PVMBG), MAGMA Indonesia, and satellite data.
Activity was relatively low during May and June. Daily white gas-and-steam emissions rose 25-200 m above the crater and drifted in different directions. Five ash plumes were detected at 0519 on 10 May, 1241 on 11 May, 0920 on 12 May, 2320 on 12 May, and at 0710 on 13 May, and rose 1-2.5 km above the crater and drifted SW. A webcam image taken on 12 May showed ejection of incandescent material above the vent. A total of nine ash plumes were detected during 6-11 June: at 1434 and 00220 on 6 and 7 June the ash plumes rose 500 m above the crater and drifted NW, at 1537 on 8 June the ash plume rose 1 km above the crater and drifted SW, at 0746 and at 0846 on 9 June the ash plumes rose 800 m and 3 km above the crater and drifted SW, respectively, at 0423, 1431, and 1750 on 10 June the ash plumes rose 2 km, 1.5 km, and 3.5 km above the crater and drifted NW, respectively, and at 0030 on 11 June an ash plume rose 2 km above the crater and drifted NW. Webcam images taken on 10 and 11 June at 0455 and 0102, respectively, showed incandescent material ejected above the vent. On 19 June an ash plume at 0822 rose 1.5 km above the crater and drifted SE.
Similar low activity of white gas-and-steam emissions and few ash plumes were reported during July and August. Daily white gas-and-steam emissions rose 25-300 m above the crater and drifted in multiple directions. Three ash plumes were reported at 0843, 0851, and 0852 on 20 July that rose 500-2,000 m above the crater and drifted NW.
The MIROVA (Middle InfraRed Observation of Volcanic Activity) graph of MODIS thermal anomaly data showed intermittent low-to-moderate power thermal anomalies during May through August 2023 (figure 140). Although activity was often obscured by weather clouds, a thermal anomaly was visible in an infrared satellite image of the crater on 12 May, accompanied by an eruption plume that drifted SW (figure 141).
Geologic Background. The renowned Krakatau (frequently mis-named as Krakatoa) volcano lies in the Sunda Strait between Java and Sumatra. Collapse of an older edifice, perhaps in 416 or 535 CE, formed a 7-km-wide caldera. Remnants of that volcano are preserved in Verlaten and Lang Islands; subsequently the Rakata, Danan, and Perbuwatan cones were formed, coalescing to create the pre-1883 Krakatau Island. Caldera collapse during the catastrophic 1883 eruption destroyed Danan and Perbuwatan, and left only a remnant of Rakata. This eruption caused more than 36,000 fatalities, most as a result of tsunamis that swept the adjacent coastlines of Sumatra and Java. Pyroclastic surges traveled 40 km across the Sunda Strait and reached the Sumatra coast. After a quiescence of less than a half century, the post-collapse cone of Anak Krakatau (Child of Krakatau) was constructed within the 1883 caldera at a point between the former Danan and Perbuwatan cones. Anak Krakatau has been the site of frequent eruptions since 1927.
Information Contacts: Pusat Vulkanologi dan Mitigasi Bencana Geologi (PVMBG, also known as Indonesian Center for Volcanology and Geological Hazard Mitigation, CVGHM), Jalan Diponegoro 57, Bandung 40122, Indonesia (URL: http://www.vsi.esdm.go.id/); MAGMA Indonesia, Kementerian Energi dan Sumber Daya Mineral (URL: https://magma.esdm.go.id/v1); MIROVA (Middle InfraRed Observation of Volcanic Activity), a collaborative project between the Universities of Turin and Florence (Italy) supported by the Centre for Volcanic Risk of the Italian Civil Protection Department (URL: http://www.mirovaweb.it/); Copernicus Browser, Copernicus Data Space Ecosystem, European Space Agency (URL: https://dataspace.copernicus.eu/browser/).
Villarrica (Chile) — October 2023 Cite this Report
Villarrica
Chile
39.42°S, 71.93°W; summit elev. 2847 m
All times are local (unless otherwise noted)
Strombolian activity, gas-and-ash emissions, and crater incandescence during April-September 2023
Villarrica, in central Chile, consists of a 2-km-wide caldera that formed about 3,500 years ago and is located at the base of the presently active cone at the NW margin of a 6-km-wide caldera. Historical eruptions eruptions date back to 1558 and have been characterized by mild-to-moderate explosive activity with occasional lava effusions. The current eruption period began in December 2014 and has recently consisted of nighttime crater incandescence, ash emissions, and seismicity (BGVN 48:04). This report covers activity during April through September 2023 and describes occasional Strombolian activity, gas-and-ash emissions, and nighttime crater incandescence. Information for this report primarily comes from the Southern Andes Volcano Observatory (Observatorio Volcanológico de Los Andes del Sur, OVDAS), part of Chile's National Service of Geology and Mining (Servicio Nacional de Geología y Minería, SERNAGEOMIN) and satellite data.
Seismicity during April consisted of long period (LP) events and tremor (TRE); a total of 9,413 LP-type events and 759 TR-type events were detected throughout the month. Nighttime crater incandescence persisted and was visible in the degassing column. Sulfur dioxide data was obtained using Differential Absorption Optical Spectroscopy Equipment (DOAS) that showed an average value of 1,450 ± 198 tons per day (t/d) during 1-15 April and 1,129 ± 201 t/d during 16-30 April, with a maximum daily value of 2,784 t/d on 9 April. Gas-and-steam emissions of variable intensities rose above the active crater as high as 1.3 km above the crater on 13 April. Strombolian explosions were not observed and there was a slight decrease in the lava lake level.
There were 14,123 LP-type events and 727 TR-type events detected during May. According to sulfur dioxide measurements taken with DOAS equipment, the active crater emitted an average value of 1,826 ± 482 t/d during 1-15 May and 912 ± 41 t/d during 16-30 May, with a daily maximum value of 5,155 t/d on 13 May. Surveillance cameras showed continuous white gas-and-steam emissions that rose as high as 430 m above the crater on 27 May. Nighttime incandescence illuminated the gas column less than 300 m above the crater rim was and no pyroclastic emissions were reported. A landslide was identified on 13 May on the E flank of the volcano 50 m from the crater rim and extending 300 m away; SERNAGEOMIN noted that this event may have occurred on 12 May. During the morning of 27 and 28 May minor Strombolian explosions characterized by incandescent ejecta were recorded at the crater rim; the last reported Strombolian explosions had occurred at the end of March.
Seismic activity during June consisted of five volcano-tectonic (VT)-type events, 21,606 LP-type events, and 2,085 TR-type events. The average value of sulfur dioxide flux obtained by DOAS equipment was 1,420 ± 217 t/d during 1-15 June and 2,562 ± 804 t/d, with a maximum daily value of 4,810 t/d on 17 June. White gas-and-steam emissions rose less than 480 m above the crater; frequent nighttime crater incandescence was reflected in the degassing plume. On 12 June an emission rose 100 m above the crater and drifted NNW. On 15 June one or several emissions resulted in ashfall to the NE as far as 5.5 km from the crater, based on a Skysat satellite image. Several Strombolian explosions occurred within the crater; activity on 15 June was higher energy and ejected blocks 200-300 m on the NE slope. Surveillance cameras showed white gas-and-steam emissions rising 480 m above the crater on 16 June. On 19 and 24 June low-intensity Strombolian activity was observed, ejecting material as far as 200 m from the center of the crater to the E.
During July, seismicity included 29,319 LP-type events, 3,736 TR-type events, and two VT-type events. DOAS equipment recorded two days of sulfur dioxide emissions of 4,220 t/d and 1,009 t/d on 1 and 13 July, respectively. Constant nighttime incandescence was also recorded and was particularly noticeable when accompanied by eruptive columns on 12 and 16 July. Minor explosive events were detected in the crater. According to Skysat satellite images taken on 12, 13, and 16 July, ashfall deposits were identified 155 m S of the crater. According to POVI, incandescence was visible from two vents on the crater floor around 0336 on 12 July. Gas-and-ash emissions rose as high as 1.2 km above the crater on 13 July and drifted E and NW. A series of gas-and-steam pulses containing some ash deposited material on the upper E flank around 1551 on 13 July. During 16-31 July, average sulfur dioxide emissions of 1,679 ± 406 t/d were recorded, with a maximum daily value of 2,343 t/d on 28 July. Fine ash emissions were also reported on 16, 17, and 23 July.
Seismicity persisted during August, characterized by 27,011 LP-type events, 3,323 TR-type events, and three VT-type events. The average value of sulfur dioxide measurements taken during 1-15 August was 1,642 ± 270 t/d and 2,207 ± 4,549 t/d during 16-31 August, with a maximum daily value of 3,294 t/d on 27 August. Nighttime crater incandescence remained visible in degassing columns. White gas-and-steam emissions rose 480 m above the crater on 6 August. According to a Skysat satellite image from 6 August, ash accumulation was observed proximal to the crater and was mainly distributed toward the E slope. White gas-and-steam emissions rose 320 m above the crater on 26 August. Nighttime incandescence and Strombolian activity that generated ash emissions were reported on 27 August.
Seismicity during September was characterized by five VT-type events, 12,057 LP-type events, and 2,058 TR-type events. Nighttime incandescence persisted. On 2 September an ash emission rose 180 m above the crater and drifted SE at 1643 (figure 125) and a white gas-and-steam plume rose 320 m above the crater. According to the Buenos Aires VAAC, periods of continuous gas-and-ash emissions were visible in webcam images from 1830 on 2 September to 0110 on 3 September. Strombolian activity was observed on 2 September and during the early morning of 3 September, the latter event of which generated an ash emission that rose 60 m above the crater and drifted 100 m from the center of the crater to the NE and SW. Ashfall was reported to the SE and S as far as 750 m from the crater. The lava lake was active during 3-4 September and lava fountaining was visible for the first time since 26 March 2023, according to POVI. Fountains captured in webcam images at 2133 on 3 September and at 0054 on 4 September rose as high as 60 m above the crater rim and ejected material onto the upper W flank. Sulfur dioxide flux of 1,730 t/d and 1,281 t/d was measured on 3 and 4 September, respectively, according to data obtained by DOAS equipment.
Strong Strombolian activity and larger gas-and-ash plumes were reported during 18-20 September. On 18 September activity was also associated with energetic LP-type events and notable sulfur dioxide fluxes (as high as 4,277 t/d). On 19 September Strombolian activity and incandescence were observed. On 20 September at 0914 ash emissions rose 50 m above the crater and drifted SSE, accompanied by Strombolian activity that ejected material less than 100 m SSE, causing fall deposits on that respective flank. SERNAGEOMIN reported that a Planet Scope satellite image taken on 20 September showed the lava lake in the crater, measuring 32 m x 35 m and an area of 0.001 km2. Several ash emissions were recorded at 0841, 0910, 1251, 1306, 1312, 1315, and 1324 on 23 September and rose less than 150 m above the crater. The sulfur dioxide flux value was 698 t/d on 23 September and 1,097 t/d on 24 September. On 24 September the Volcanic Alert Level (VAL) was raised to Orange (the third level on a four-color scale). SENAPRED maintained the Alert Level at Yellow (the middle level on a three-color scale) for the communities of Villarrica, Pucón (16 km N), Curarrehue, and Panguipulli.
During 24-25 September there was an increase in seismic energy (observed at TR-events) and acoustic signals, characterized by 1 VT-type event, 213 LP-type events, and 124 TR-type events. Mainly white gas-and-steam emissions, in addition to occasional fine ash emissions were recorded. During the early morning of 25 September Strombolian explosions were reported and ejected material 250 m in all directions, though dominantly toward the NW. On 25 September the average value of sulfur dioxide flux was 760 t/d. Seismicity during 25-30 September consisted of five VT-type events, 1,937 LP-type events, and 456 TR-type events.
During 25-29 September moderate Strombolian activity was observed and ejected material as far as the crater rim. In addition, ash pulses lasting roughly 50 minutes were observed around 0700 and dispersed ENE. During 26-27 September a TR episode lasted 6.5 hours and was accompanied by discrete acoustic signals. Satellite images from 26 September showed a spatter cone on the crater floor with one vent that measured 10 x 14 m and a smaller vent about 35 m NE of the cone. SERNAGEOMIN reported an abundant number of bomb-sized blocks up to 150 m from the crater, as well as impact marks on the snow, which indicated explosive activity. A low-altitude ash emission was observed drifting NW around 1140 on 28 September, based on webcam images. Between 0620 and 0850 on 29 September an ash emission rose 60 m above the crater and drifted NW. During an overflight taken around 1000 on 29 September scientists observed molten material in the vent, a large accumulation of pyroclasts inside the crater, and energetic degassing, some of which contained a small amount of ash. Block-sized pyroclasts were deposited on the internal walls and near the crater, and a distal ash deposit was also visible. The average sulfur dioxide flux measured on 28 September was 344 t/d. Satellite images taken on 29 September ashfall was deposited roughly 3 km WNW from the crater and nighttime crater incandescence remained visible. The average sulfur dioxide flux value from 29 September was 199 t/d. On 30 September at 0740 a pulsating ash emission rose 1.1 km above the crater and drifted NNW (figure 126). Deposits on the S flank extended as far as 4.5 km from the crater rim, based on satellite images from 30 September.
Infrared MODIS satellite data processed by MIROVA (Middle InfraRed Observation of Volcanic Activity) showed intermittent thermal activity during April through September, with slightly stronger activity detected during late September (figure 127). Small clusters of thermal activity were detected during mid-June, early July, early August, and late September. According to the MODVOLC thermal alert system, a total of four thermal hotspots were detected on 7 July and 3 and 23 September. This activity was also intermittently captured in infrared satellite imagery on clear weather days (figure 128).
Geologic Background. The glacier-covered Villarrica stratovolcano, in the northern Lakes District of central Chile, is ~15 km south of the city of Pucon. A 2-km-wide caldera that formed about 3,500 years ago is located at the base of the presently active, dominantly basaltic to basaltic andesite cone at the NW margin of a 6-km-wide Pleistocene caldera. More than 30 scoria cones and fissure vents are present on the flanks. Plinian eruptions and pyroclastic flows that have extended up to 20 km from the volcano were produced during the Holocene. Lava flows up to 18 km long have issued from summit and flank vents. Eruptions documented since 1558 CE have consisted largely of mild-to-moderate explosive activity with occasional lava effusion. Glaciers cover 40 km2 of the volcano, and lahars have damaged towns on its flanks.
Information Contacts: Servicio Nacional de Geología y Minería (SERNAGEOMIN), Observatorio Volcanológico de Los Andes del Sur (OVDAS), Avda Sta María No. 0104, Santiago, Chile (URL: http://www.sernageomin.cl/); Proyecto Observación Villarrica Internet (POVI) (URL: http://www.povi.cl/); Sistema y Servicio Nacional de Prevención y Repuesta Ante Desastres (SENAPRED), Av. Beauchef 1671, Santiago, Chile (URL: https://web.senapred.cl/); Buenos Aires Volcanic Ash Advisory Center (VAAC), Servicio Meteorológico Nacional-Fuerza Aérea Argentina, 25 de mayo 658, Buenos Aires, Argentina (URL: http://www.smn.gov.ar/vaac/buenosaires/inicio.php); MIROVA (Middle InfraRed Observation of Volcanic Activity), a collaborative project between the Universities of Turin and Florence (Italy) supported by the Centre for Volcanic Risk of the Italian Civil Protection Department (URL: http://www.mirovaweb.it/); Hawai'i Institute of Geophysics and Planetology (HIGP) - MODVOLC Thermal Alerts System, School of Ocean and Earth Science and Technology (SOEST), Univ. of Hawai'i, 2525 Correa Road, Honolulu, HI 96822, USA (URL: http://modis.higp.hawaii.edu/); Copernicus Browser, Copernicus Data Space Ecosystem, European Space Agency (URL: https://dataspace.copernicus.eu/browser/).
Merapi (Indonesia) — October 2023 Cite this Report
Merapi
Indonesia
7.54°S, 110.446°E; summit elev. 2910 m
All times are local (unless otherwise noted)
Frequent incandescent avalanches during April-September 2023
Merapi, located just north of the major city of Yogyakarta in central Java, Indonesia, has had activity within the last 20 years characterized by pyroclastic flows and lahars accompanying growth and collapse of the steep-sided active summit lava dome. The current eruption period began in late December 2020 and has more recently consisted of ash plumes, intermittent incandescent avalanches of material, and pyroclastic flows (BGVN 48:04). This report covers activity during April through September 2023, based on information from Balai Penyelidikan dan Pengembangan Teknologi Kebencanaan Geologi (BPPTKG), the Center for Research and Development of Geological Disaster Technology, a branch of PVMBG which specifically monitors Merapi. Additional information comes from the Pusat Vulkanologi dan Mitigasi Bencana Geologi (PVMBG, also known as Indonesian Center for Volcanology and Geological Hazard Mitigation, CVGHM), MAGMA Indonesia, the Darwin Volcanic Ash Advisory Centre (VAAC), and various satellite data.
Activity during April through September 2023 primarily consisted of incandescent avalanches of material that mainly affected the SW and W flanks and traveled as far as 2.3 km from the summit (table 25) and white gas-and-steam emissions that rose 10-1,000 m above the crater.
Table 25. Monthly summary of avalanches and avalanche distances recorded at Merapi during April through September 2023. The number of reported avalanches does not include instances where possible avalanches were heard but could not be visually confirmed as a result of inclement weather. Data courtesy of BPPTKG (April-September 2023 daily reports).
| Month |
Average number of avalanches per day |
Distance avalanches traveled (m) |
| Apr 2023 |
19 |
1,200-2,000 |
| May 2023 |
22 |
500-2,000 |
| Jun 2023 |
18 |
1,200-2,000 |
| Jul 2023 |
30 |
300-2,000 |
| Aug 2023 |
25 |
400-2,300 |
| Sep 2023 |
23 |
600-2,000 |
BPPTKG reported that during April and May white gas-and-steam emissions rose 10-750 m above the crater, incandescent avalanches descended 500-2,000 m on the SW and W flanks (figure 135). Cloudy weather often prevented clear views of the summit, and sometimes avalanches could not be confirmed. According to a webcam image, a pyroclastic flow was visible on 17 April at 0531. During the week of 28 April and 4 May a pyroclastic flow was reported on the SW flank, traveling up to 2.5 km. According to a drone overflight taken on 17 May the SW lava dome volume was an estimated 2,372,800 cubic meters and the dome in the main crater was an estimated 2,337,300 cubic meters.
During June and July similar activity persisted with white gas-and-steam emissions rising 10-350 m above the crater and frequent incandescent avalanches that traveled 300-2,000 m down the SW, W, and S flanks (figure 136). Based on an analysis of aerial photos taken on 24 June the volume of the SW lava dome was approximately 2.5 million cubic meters. A pyroclastic flow was observed on 5 July that traveled 2.7 km on the SW flank. According to the Darwin VAAC multiple minor ash plumes were identified in satellite images on 19 July that rose to 3.7 km altitude and drifted S and SW. During 22, 25, and 26 July a total of 17 avalanches descended as far as 1.8 km on the S flank.
Frequent white gas-and-steam emissions continued during August and September, rising 10-450 m above the crater. Incandescent avalanches mainly affected the SW and W flanks and traveled 400-2,300 m from the vent (figure 137). An aerial survey conducted on 10 August was analyzed and reported that estimates of the SW dome volume was 2,764,300 cubic meters and the dome in the main crater was 2,369,800 cubic meters.
Frequent and moderate-power thermal activity continued throughout the reporting period, according to a MIROVA (Middle InfraRed Observation of Volcanic Activity) analysis of MODIS satellite data (figure 138). There was an increase in the number of detected anomalies during mid-May. The MODVOLC thermal algorithm recorded a total of 47 thermal hotspots: six during April, nine during May, eight during June, 15 during July, four during August, and five during September. Some of this activity was captured in infrared satellite imagery on clear weather days, sometimes accompanied by incandescent material on the SW flank (figure 139).
Geologic Background. Merapi, one of Indonesia's most active volcanoes, lies in one of the world's most densely populated areas and dominates the landscape immediately north of the major city of Yogyakarta. It is the youngest and southernmost of a volcanic chain extending NNW to Ungaran volcano. Growth of Old Merapi during the Pleistocene ended with major edifice collapse perhaps about 2,000 years ago, leaving a large arcuate scarp cutting the eroded older Batulawang volcano. Subsequent growth of the steep-sided Young Merapi edifice, its upper part unvegetated due to frequent activity, began SW of the earlier collapse scarp. Pyroclastic flows and lahars accompanying growth and collapse of the steep-sided active summit lava dome have devastated cultivated lands on the western-to-southern flanks and caused many fatalities.
Information Contacts: Balai Penyelidikan dan Pengembangan Teknologi Kebencanaan Geologi (BPPTKG), Center for Research and Development of Geological Disaster Technology (URL: http://merapi.bgl.esdm.go.id/, Twitter: @BPPTKG); MAGMA Indonesia, Kementerian Energi dan Sumber Daya Mineral (URL: https://magma.esdm.go.id/v1); Pusat Vulkanologi dan Mitigasi Bencana Geologi (PVMBG, also known as Indonesian Center for Volcanology and Geological Hazard Mitigation, CVGHM), Jalan Diponegoro 57, Bandung 40122, Indonesia (URL: http://www.vsi.esdm.go.id/); Darwin Volcanic Ash Advisory Centre (VAAC), Bureau of Meteorology, Northern Territory Regional Office, PO Box 40050, Casuarina, NT 0811, Australia (URL: http://www.bom.gov.au/info/vaac/); MIROVA (Middle InfraRed Observation of Volcanic Activity), a collaborative project between the Universities of Turin and Florence (Italy) supported by the Centre for Volcanic Risk of the Italian Civil Protection Department (URL: http://www.mirovaweb.it/); Hawai'i Institute of Geophysics and Planetology (HIGP) - MODVOLC Thermal Alerts System, School of Ocean and Earth Science and Technology (SOEST), Univ. of Hawai'i, 2525 Correa Road, Honolulu, HI 96822, USA (URL: http://modis.higp.hawaii.edu/); Copernicus Browser, Copernicus Data Space Ecosystem, European Space Agency (URL: https://dataspace.copernicus.eu/browser/); Øystein Lund Andersen (URL: https://www.oysteinlundandersen.com/, https://twitter.com/oysteinvolcano).
Ebeko
Russia
50.686°N, 156.014°E; summit elev. 1103 m
All times are local (unless otherwise noted)
Moderate explosive activity with ash plumes continued during June-November 2023
Ebeko, located on the N end of Paramushir Island in Russia’s Kuril Islands just S of the Kamchatka Peninsula, consists of three summit craters along a SSW-NNE line at the northern end of a complex of five volcanic cones. Observed eruptions date back to the late 18th century and have been characterized as small-to-moderate explosions from the summit crater, accompanied by intense fumarolic activity. The current eruptive period began in June 2022, consisting of frequent explosions, ash plumes, and thermal activity (BGVN 47:10, 48:06). This report covers similar activity during June-November 2023, based on information from the Kamchatka Volcanic Eruptions Response Team (KVERT) and satellite data.
Moderate explosive activity continued during June-November 2023 (figures 50 and 51). According to visual data from Severo-Kurilsk, explosions sent ash 2-3.5 km above the summit (3-4.5 km altitude) during most days during June through mid-September. Activity after mid-September was slightly weaker, with ash usually reaching less than 2 km above the summit. According to KVERT the volcano in October and November was, with a few exceptions, either quiet or obscured by clouds that prevented satellite observations. KVERT issued Volcano Observatory Notices for Aviation (VONA) on 8 and 12 June, 13 and 22 July, 3 and 21 August, and 31 October warning of potential aviation hazards from ash plumes drifting 3-15 km from the volcano. Based on satellite data, KVERT reported a persistent thermal anomaly whenever weather clouds permitted viewing.
Geologic Background. The flat-topped summit of the central cone of Ebeko volcano, one of the most active in the Kuril Islands, occupies the northern end of Paramushir Island. Three summit craters located along a SSW-NNE line form Ebeko volcano proper, at the northern end of a complex of five volcanic cones. Blocky lava flows extend west from Ebeko and SE from the neighboring Nezametnyi cone. The eastern part of the southern crater contains strong solfataras and a large boiling spring. The central crater is filled by a lake about 20 m deep whose shores are lined with steaming solfataras; the northern crater lies across a narrow, low barrier from the central crater and contains a small, cold crescentic lake. Historical activity, recorded since the late-18th century, has been restricted to small-to-moderate explosive eruptions from the summit craters. Intense fumarolic activity occurs in the summit craters, on the outer flanks of the cone, and in lateral explosion craters.
Information Contacts: Kamchatka Volcanic Eruptions Response Team (KVERT), Far Eastern Branch, Russian Academy of Sciences, 9 Piip Blvd., Petropavlovsk-Kamchatsky, 683006, Russia (URL: http://www.kscnet.ru/ivs/kvert/).
Search Bulletin Archive by Publication Date
Select a month and year from the drop-downs and click "Show Issue" to have that issue displayed in this tab.
The default month and year is the latest issue available.
Bulletin of the Global Volcanism Network - Volume 42, Number 03 (March 2017)
Managing Editor: Edward Venzke
Axial Seamount (Undersea Features)
Research cruise and new bathymetry reveals lava flows from the 2015 eruption
Barren Island (India)
Intermittent ash plumes and thermal anomalies continue from July 2014 through February 2017
Gamalama (Indonesia)
Weak explosion generates ash plumes during 3-4 August 2016
Kavachi (Solomon Islands)
Evidence of regular explosive activity during 2006-2016 from satellite and direct observations
Kuchinoerabujima (Japan)
Explosions on 3 August 2014, 29-30 May 2015 (with pyroclastic flow), and 18-19 June 2015
Manam (Papua New Guinea)
Large ash plume to 19.8 km on 31 July 2015; persistent thermal anomalies during 2014-2016
Pavlof (United States)
Ash plume to 11 km on 27 March 2016 that drifted 1,200 km NE; multiple smaller ash events through July 2016
Poas (Costa Rica)
Phreatic explosions from the crater lake in June-August 2016
Sheveluch (Russia)
Lava dome extrusion continues with occasional explosions and ash plumes through February 2016
Soputan (Indonesia)
Ash plumes to over 12 km altitude, lava flows, pyroclastic flows, and Strombolian activity during January-February 2016
Axial Seamount (Undersea Features) — March 2017 Cite this Report
Axial Seamount
Undersea Features
45.95°N, 130°W; summit elev. -1410 m
All times are local (unless otherwise noted)
Research cruise and new bathymetry reveals lava flows from the 2015 eruption
The submarine Axial Seamount volcano is located about 470 km offshore of the Oregon coast. An eruption inferred to have started at 2230 on 23 April 2015 with an earthquake swarm (BGVN 40:03) was confirmed during a 14-29 August 2015 research cruise by the R/V Thompson. According to a personal communication on 23 June 2015 from Bill Chadwick (Oregon State University and NOAA), the length of the eruption is unknown, but it was "very likely days to weeks since the deflation lasted for about 10 days and the temperature signals lasted about a month."
The research cruise revealed new lava flows observed from bathymetric data and observations made during a remotely operated underwater vehicle ROV Jason dive. This eruption "produced the largest volume of erupted lava since monitoring and mapping began in the mid-1980's" (Chadwick and others, 2016). Two large lava flows from the N rift zone (8-16 km N of the summit caldera) were at most 127 m thick; some of the thicker areas had drained collapse features indicating molten interiors when emplaced. The ROV traversed the flows for about 2 km. New, thinner lava flows (figure 13) were also identified in the NE summit caldera and on the NE rim.
Three recently published papers, Chadwick and others (2016), Nooner and Chadwick (2016), and Wilcock and others (2016), detail the results of eruptive activity in 1998, 2011, and 2015, based on new data from a research cruise conducted after the 2015 eruption (figures 14 and 15). Scientists from the Monterey Bay Aquarium Research Institute (MBARI) issued a new seafloor map (figure 16) of the area of Axial north of the one shown in figure 14, based on underwater surveys conducted in August 2016, uncovering a number of previously undocumented flows from the 2015 eruption (Phys.org, 2016). MBARI ran identical sets of autonomous underwater vehicles (AUV) survey lines across the entire Axial caldera in 2011, 2014, 2015, and 2016, and during the 2016 survey the AUV collected seafloor samples (figure 13).
According to Wilcock and others (2016), the earthquake rates increases from less than 500 per day to as many as about 2000 per day prior to the eruption on 24 April 2015, then decreased rapidly over the next month following the seismic crisis to a background level of 20 per day. During the eruption there were 600 earthquakes measured every hour, and the seafloor at Axial dropped suddenly by about 2.4 m.
Precise pressure sensors measure vertical movements of the seafloor that take place as the volcano gradually inflates (see figure 14). Deformation of the Axial volcano seafloor as measured by pressure sensors (figure 17) indicated gradual inflation followed by rapid deflation during the three most recent eruptions in 1998, 2011, and 2015.
References: Chadwick, W.W., Jr., Paduan, J.B., Clague, D.A., Dreyer, B.M., Merle, S.G., Bobbitt, A.M., Caress, D.W., Philip, B.T., Kelley, D.S., and Nooner, S.L., 2016 (15 December), Voluminous eruption from a zoned magma body after an increase in supply rate at Axial Seamount, Geophysical Research Letters, v. 43, issue 23, pp. 12,063-12,070; DOI: 10.1002/2016GL071327.
Nooner, S.L., and Chadwick, W.W., Jr., 2016 (16 December), Inflation-predictable behavior and co-eruption deformation at Axial Seamount, Science, v. 354, issue 6318, pp. 1399-1403; DOI: 10.1126/science.aah4666.
Phys.org, 2016 (15 Dec), MBARI's seafloor maps provide new information about 2015 eruption at Axial Seamount (URL: https://phys.org/news/2016-12-mbari-seafloor-eruption-axial-seamount.html).
Wilcock, W.S.D., Tolstoy, M., Waldhauser, F., Garcia, C., Tan, Y.J., Bohnenstiehl, D.R., Caplan-Auerbach, J., Dziak, R.P., Arnulf, A.F., and Mann, M.E., 2016 (16 Dec), Seismic constraints on caldera dynamics from the 2015 Axial Seamount eruption, Science, v. 354, issue 6318, pp. 1395-1399; DOI: 10.1126/science.aah5563.
Geologic Background. Axial Seamount rises 700 m above the mean level of the central Juan de Fuca Ridge crest about 480 km W of Cannon Beach, Oregon, to within about 1,400 m of the ocean surface. It is the most magmatically and seismically active site on the Juan de Fuca Ridge between the Blanco Fracture Zone and the Cobb offset. The summit is marked by an unusual rectangular-shaped caldera (3 x 8 km) that lies between two rift zones and is estimated to have formed about 31,000 years ago. The caldera is breached to the SE and is defined on three sides by boundary faults of up to 150 m relief. Hydrothermal vents with biological communities are located near the caldera fault and along the rift zones. Hydrothermal venting was discovered north of the caldera in 1983. Detailed mapping and sampling efforts have identified more than 50 lava flows emplaced since about 410 CE (Clague et al., 2013). Eruptions producing fissure-fed lava flows that buried previously installed seafloor instrumentation were detected seismically and geodetically in 1998 and 2011, and confirmed shortly after each eruption during submersible dives.
Information Contacts: William Chadwick, Cooperative Institute for Marine Resources Studies (CIMRS), Oregon State University, and NOAA/PMEL Earth-Ocean Interactions Program, Hatfield Marine Science Center, 2115 S.E. OSU Dr., Newport, OR 97365, USA (URL: http://www.pmel.noaa.gov/eoi/).
Barren Island (India) — March 2017 Cite this Report
Barren Island
India
12.278°N, 93.858°E; summit elev. 354 m
All times are local (unless otherwise noted)
Intermittent ash plumes and thermal anomalies continue from July 2014 through February 2017
The eruptive activity at Barren Island that began in October 2013 continued through at least mid-June 2014 (BGVN 39:07). Another eruptive cycle began in March 2015 and continued through 28 February 2016, based on MODIS/MODVOLC thermal anomalies. However, MIROVA hotspots were regular through mid-May 2016, and then sporadic throughout the rest of 2016. The next clear episode began on 15 January 2017 and continued through at least February 2017. Scientists aboard a research ship observed explosions, fire fountains, and lava flows in January 2017.
Activity during October 2013-June 2014. Evidence of renewed activity in the form of lava flows was seen in MODVOLC thermal anomaly data beginning on 12 October 2013. Thermal alert pixels were frequent through 12 February 2014, followed by single anomalies on 12 March and 20 April 2014. Ash plumes were also observed during January-April 2014. Thermal infrared MODIS data processed by the MIROVA system revealed frequent anomalies in April through early May 2014, and in late May to early June; another anomaly was seen in mid-June 2014.
Activity during July 2014-June 2015. No thermal anomalies were seen in MIROVA data for at least five weeks (figure 24), between early June and late July 2014, and then continuing intermittently through the first half of March 2015. The only reported plumes during this time were in the week of 3-9 September 2014 and 22-28 April 2015, but in each case as could not be identified in satellite imagery.
A strong thermal signature resumed on 17 March 2015 (figure 24) and continued for about three weeks before decreasing in intensity. Lower-level thermal activity continued through the first half of June. Thermal anomalies seen in MODVOLC data also resumed on 17 March, and were frequent through 12 June. Eruptions of ash were observed during 5-7 and 12-13 June 2015, with plumes rising to an altitude of 2-3 km and drifting up to 55 km downwind (table 5).
Table 5. Ash plumes at Barren Island, June 2015-February 2016. Legend: Satellite=analysis of satellite images, wind=wind data. Data provided by the Darwin Volcanic Ash Advisory Centre.
| Date |
Max. Altitude (km) |
Drift |
Basis of report |
| 2015 Jun 5-7 |
2.4-3 |
35-45 km NE, E |
Satellite, wind |
| 2015 Jun 12-13 |
2.1 |
25-55 km NE |
Pilot, satellite, wind |
| 2015 Aug 19 |
1.5 |
55 km E |
Satellite, wind |
| 2015 Sep 22 |
1.8 |
45 km E |
Satellite, wind |
| 2015 Oct 8-9 |
1.5-2.1 |
75-100 km NE |
Satellite, wind |
| 2016 Jan 3-4 |
1.5 |
85 km SW |
Satellite, wind |
| 2016 Jan 31-Feb 2 |
1.5 |
165 km SW |
Satellite, wind |
| 2016 Feb 14-15 |
1.5 |
Over 45 km W |
Satellite, wind |
Activity during July 2015-May 2016. Thermal activity paused again for approximately a month in the second half of June and first half of July 2015. Regular thermal anomalies in MODVOLC data stopped after 12 June and resumed on 16 July. Episodic clusters of anomalies with gaps of 1-3 weeks continued until 28 February 2016. Although MODVOLC data did not show thermal anomalies after February 2016, MIROVA data showed ongoing activity until approximately 17 May (figure 25).
A few ash plumes were seen during this period, on 19 August, 22 September, and 8-9 October 2015 (table 5). There were no reported plumes in November or December 2015, but were seen once again in January and February 2016. Plumes typically rose to an altitude of 1.5-2 km and drifted 45-100 km downwind; the longest plume extended 1665 km SW.
Activity during June 2016-February 2017. Eruptive activity apparently stopped around 16-17 May 2016 for at least seven weeks. MODIS thermal data captured by MIROVA showed a few anomalies (less than 20) from the second half of July through the first half of December 2016 (figure 25). Considering the remote location and rare direct observations at this island volcano, it is possible that the anomalies represent intermittent lava emissions. Regular thermal anomalies were recorded by both MIROVA and MODVOLC beginning on 15 January that were continuing at the end of February 2017.
The National Institute of Oceanography (NIO), part of the Indian Council of Scientific and Industrial Research (CSIR), reported activity on 23 January 2017. Scientists aboard a research vessel were collecting sea floor samples when they observed a sudden ash emission. The team moved closer, about 1.6 km from the volcano, and noted small eruptive episodes lasting 5-10 minutes. Ash emissions were visible in the daytime, and lava fountains feeding lava flows on the flanks were visible at night. The team revisited the volcano on 26 January and observed similar activity over four hours. They sampled sediments and water in the vicinity of the eruption and recovered volcanic ejecta.
Geologic Background. Barren Island, a possession of India in the Andaman Sea about 135 km NE of Port Blair in the Andaman Islands, is the only historically active volcano along the N-S volcanic arc extending between Sumatra and Burma (Myanmar). It is the emergent summit of a volcano that rises from a depth of about 2250 m. The small, uninhabited 3-km-wide island contains a roughly 2-km-wide caldera with walls 250-350 m high. The caldera, which is open to the sea on the west, was created during a major explosive eruption in the late Pleistocene that produced pyroclastic-flow and -surge deposits. Historical eruptions have changed the morphology of the pyroclastic cone in the center of the caldera, and lava flows that fill much of the caldera floor have reached the sea along the western coast.
Information Contacts: Darwin Volcanic Ash Advisory Centre (VAAC), Bureau of Meteorology, Northern Territory Regional Office, PO Box 40050, Casuarina, NT 0811, Australia (URL: http://www.bom.gov.au/info/vaac/); The National Institute of Oceanography (NIO), Council of Scientific and Industrial Research (CSIR), New Delhi, India (URL: http://www.nio.org/); Hawai'i Institute of Geophysics and Planetology (HIGP), MODVOLC Thermal Alerts System, School of Ocean and Earth Science and Technology (SOEST), Univ. of Hawai'i, 2525 Correa Road, Honolulu, HI 96822, USA (URL: http://modis.higp.hawaii.edu/); MIROVA (Middle InfraRed Observation of Volcanic Activity), a collaborative project between the Universities of Turin and Florence (Italy) supported by the Centre for Volcanic Risk of the Italian Civil Protection Department (URL: http://www.mirovaweb.it/).
Gamalama (Indonesia) — March 2017 Cite this Report
Gamalama
Indonesia
0.81°N, 127.3322°E; summit elev. 1714 m
All times are local (unless otherwise noted)
Weak explosion generates ash plumes during 3-4 August 2016
Intermittent weak explosions at Gamalama resulting in ash plumes have occurred for many decades, most recently in September 2012, December 2014, and July-September 2015 (BGVN 40:12). This report covers activity between 1 December 2015 and February 2017. Data were primarily drawn from reports issued by the Pusat Vulkanologi dan Mitigasi Bencana Geologi (PVMBG, also known as Center for Volcanology and Geological Hazard Mitigation) and the Darwin Volcanic Ash Advisory Centre (VAAC).
During 1 January-6 March 2016, PVMBG noted that seismicity fluctuated but decreased overall; shallow volcanic earthquakes and signals indicating emissions appeared on 3 March and a series of deep volcanic earthquakes were detected on 6 March. The Alert Level remained at 2 (on a scale of 1-4), and visitors and residents were warned not to approach the crater within a 1.5-km radius.
PVMBG reported that, at 0628 on 3 August 2016, a weak explosion generated an ash plume that rose 500-600 m above the crater and drifted SE and S. Ash emissions decreased at 0655. Consistent with this, the Darwin VAAC, based on analyses of satellite imagery and wind model data, and information from PVMBG, reported that ash plumes reached a maximum altitude of 2.7 km (summit elevation is 1.7 km) and drifted S, SE, E, and NE. Ashfall was reported in areas on the SSE flank, including the Ake Huda area.
A news account (Jakarta Globe) stated that the Babullah Airport in Ternate, North Maluku, was closed for a day while volcanic ash was cleared from the runway (about 6 km ENE of the volcano). On 5 August PVMBG noted that seismicity continued to be elevated, although inclement weather prevented visual observations.
Geologic Background. Gamalama is a near-conical stratovolcano that comprises the entire island of Ternate off the western coast of Halmahera, and is one of Indonesia's most active volcanoes. The island was a major regional center in the Portuguese and Dutch spice trade for several centuries, which contributed to the extensive documentation of activity. Three cones, progressively younger to the north, form the summit. Several maars and vents define a rift zone, parallel to the Halmahera island arc, that cuts the volcano; the S-flank Ngade maar formed after about 14,500–13,000 cal. BP (Faral et al., 2022). Eruptions, recorded frequently since the 16th century, typically originated from the summit craters, although flank eruptions have occurred in 1763, 1770, 1775, and 1962-63.
Information Contacts: Pusat Vulkanologi dan Mitigasi Bencana Geologi (PVMBG, also known as Center of Volcanology and Geological Hazard Mitigation (CVGHM), Jalan Diponegoro 57, Bandung 40122, Indonesia (URL: http://www.vsi.esdm.go.id/); Darwin Volcanic Ash Advisory Centre (VAAC), Bureau of Meteorology, Northern Territory Regional Office, PO Box 40050, Casuarina, NT 0811, Australia (URL: http://www.bom.gov.au/info/vaac/); Jakarta Globe (URL: http://jakartaglobe.id/).
Kavachi (Solomon Islands) — March 2017 Cite this Report
Kavachi
Solomon Islands
8.991°S, 157.979°E; summit elev. -20 m
All times are local (unless otherwise noted)
Evidence of regular explosive activity during 2006-2016 from satellite and direct observations
The submarine Kavachi volcano in the Solomon Islands south of Gatokae and Vangunu islands is frequently active but rarely observed. Consistent activity was reported for more than 4 years between November 1999 and August 2003. An 8-month period of quiet was broken with another explosive eruption above the ocean surface on 15 March 2004 (BGVN 30:03). No observations of ongoing activity are known over the next two years, though eruptions may have continued. Satellite imagery using the Advanced Spaceborne Thermal Emission and Reflection Radiometer (ASTER) during 2006-2016 frequently revealed evidence of activity, on at least 35 days, using the Visible Near Infrared (VNIR) bands. Very little ASTER imagery is available for Kavachi during 2001-2005.
ASTER images on 27 February and 24 March 2006 (figure 13) show renewed activity. Vigorous upwelling along with turbulent ash-laden water and a sulfur odor was witnessed on 6 April 2007 (BGVN 32:07). An ASTER image on 15 June 2007 (figure 14) showed pulses of discolored water originating from the vent, confirming ongoing activity. A small area of discolored water was next seen in satellite imagery on 12 December 2007. A small plume of discolored water appeared in ASTER imagery again on 26 February 2008. On 20 March 2008 the Landsat 7 Enhanced Thematic Mapper captured an image of an ash-and-steam eruption plume extending about 25 km NNE towards Gatokae (figure 15). The next satellite evidence of discolored water plumes were on 7 October 2008.
An image on 11 November 2009 showed a larger very bright spot above the summit, possibly indicating turbulent activity at the ocean surface. Evidence of activity became more frequent in 2010, with imagery showing plumes on 15 February, 19 March, 23 June, 11 September, and 30 November. Submarine plumes continued to be visible often in ASTER images the following year, on 1 January, 13 March, 9 May, and 16 October 2011. The next available satellite image with a discolored submarine plume from Kavachi was on 9 April 2012. Additional plumes were seen on 16 April, 3 June (figure 16), 31 August, and 26 November 2012.
Intermittent satellite evidence of ongoing activity continued in 2013 with a discolored water plumes on 28 April, 15 June, 8 July, 25 August, 10 September, and 8 December. On 24 September 2013, Brennan Phillips of the University of Rhode Island passed within 2 km of the main peak onboard the M/Y Alucia but "did not see any visual eruptive activity on the surface."
Although the imagery is not conclusive, many of the ASTER images after 3 June 2012 appeared to show a small island. On 9 January 2014 the ASTER imagery was much clearer, providing greater visual evidence that eruptive activity had built a small island from which discolored water plumes were emanating (figure 17). A few weeks later, on 29 January, the Earth Observing 1 (EO1) Advanced Land Imager (ALI) obtained an image of a submarine plume (BGVN 39:07) and turbulent source area similar to those seen in ASTER imagery. Additional activity was in evidence on 21 March and 8 May.
A cruise ship operated by EYOS Expeditions reported an eruption "at least four times" on 10 June 2014 (figure 18). The Expeditions' website noted that a staff member "spotted on the horizon discolored water and disturbances on the surface. As the vessel approached closer a few large plumes of water broke the surface about once every 10 minutes. Just before the ship left, however, [the] sea seemed to erupt and a massive plume of water and ash shot high into the air…." The island, or possibly an eruption exhibiting turbulence with abundant ash at the surface, appeared again on a 9 November 2014 image, and submarine plumes were evident in an 11 December 2014 image.
An expedition for National Geographic in January 2015 took place during a rare lull in volcanic activity that enabled access to the volcano for mapping and sampling. B. Phillips reported that no eruptive activity was seen while at the summit location on 12-14 and 18 January 2015, but there was a large surface plume and lots of off-gassing from the crater rim; ASTER imagery confirmed a plume of discolored water on 12 January. Autonomous cameras deployed directly into the crater observed sharks, reef fish, and what appear to larvaceans (National Geographic, 2015).
Satellite imagery showed discolored submarine plumes on 18 October 2015, but then not again until 26 August 2016. Eruptions were witnessed on a second visit by B. Phillips for National Geographic during 31 October-1 November 2016 (see National Geographic, 2017). Activity consisted of phreato-magmatic explosions approximately every 7 minutes that sent steam, ash, and incandescent tephra up to 50 m above the ocean surface. There was an occasional larger eruption roughly every hour. A remotely operated surface "drone" with a GoPro camera was right at the edge of the explosion but remained functional. Small lava particles stuck to the PVC hull of the vehicle itself were recovered and given to the Marine Geological Samples Laboratory (MGSL) of the Graduate School of Oceanography (GSO), University of Rhode Island."
Bathymetric survey. A paper by Phillips and others (2016) following the January 2015 visit included medium-resolution bathymetry of the main peak (figure 19), along with benthic imagery, biological observations, petrological and geochemical analysis of samples from the crater rim, measurement of water temperature and gas flux over the summit, and descriptions of the hydrothermal plume structure. Based on the bathymetry, the summit was described by Phillips and others (2016) as being oblong with a pockmarked crater measuring approximately 75 x 120 m, and a rim rising to an average of 24 m depth. The deepest soundings on the peak were about 70 m and indicated asymmetrical terrain surrounded by almost uniform flanks with 18° slopes that descend to depths greater than 1,000 m. They confirmed the existence of a "southwest extension," or secondary summit rising to 260 m depth 1.3 km SW of the main summit.
References: National Geographic, 2015, Sharks discovered inside underwater volcano (exclusive video) (URL: http://video.nationalgeographic.com/video/expedition-raw/150708-sciex-exraw-sharks-underwater-volcano; https://www.youtube.com/watch?v=0e3t18rrjOA).
National Geographic, 2017, Robot vs. Volcano: "Sometimes It's Just Fun to Blow Stuff Up" (exclusive) (URL: http://video.nationalgeographic.com/video/expedition-raw/170419-sciex-exraw-robot-vs-volcano-sometimes-just-fun-to-blow-stuff-up; https://www.youtube.com/watch?v=Ca0zAAIVK3E).
Phillips, B.T., Dunbabin, M., Henning, B., Howell, C., DeCiccio, A., Flinders, A., Kelley, K.A., Scott, J.J., Albert, S., Carey, S., Tsadok, R., and Grinham, A., 2016. Exploring the "Sharkcano": Biogeochemical observations of the Kavachi submarine volcano (Solomon Islands), Oceanography v. 29(4), p. 160-169 (https://doi.org/10.5670/oceanog.2016.85).
Geologic Background. Named for a sea-god of the Gatokae and Vangunu peoples, Kavachi is located in the Solomon Islands south of Vangunu Island. Sometimes referred to as Rejo te Kvachi ("Kavachi's Oven"), this shallow submarine basaltic-to-andesitic volcano has produced ephemeral islands up to 1 km long many times since its first recorded eruption during 1939. Residents of the nearby islands of Vanguna and Nggatokae (Gatokae) reported "fire on the water" prior to 1939, a possible reference to earlier eruptions. The roughly conical edifice rises from water depths of 1.1-1.2 km on the north and greater depths to the SE. Frequent shallow submarine and occasional subaerial eruptions produce phreatomagmatic explosions that eject steam, ash, and incandescent bombs. On a number of occasions lava flows were observed on the ephemeral islands.
Information Contacts: EYOS Expeditions, Knox House, 16-18 Finch Rd, Douglas, Isle of Man, IM1 2PT (URL: http://www.eyos-expeditions.com/2014/07/kavachi-volcano/, https://my.yb.tl/eyosexpeditions/1604/); Brennan Phillips, Harvard University, Wyss Institute for Biologically Inspired Engineering, Wood Lab, 60 Oxford St., Cambridge, MA 02138 USA; Image Database for Volcanoes, Geological Survey of Japan, National Institute of Advanced Industrial Science and Technology (AIST) (URL: https://gbank.gsj.jp/vsidb/image/index-E.html, https://gbank.gsj.jp/vsidb/image/Kavachi/aster_p1.html); USGS LandsatLook Viewer (URL: https://landsatlook.usgs.gov/).
Kuchinoerabujima (Japan) — March 2017 Cite this Report
Kuchinoerabujima
Japan
30.443°N, 130.217°E; summit elev. 657 m
All times are local (unless otherwise noted)
Explosions on 3 August 2014, 29-30 May 2015 (with pyroclastic flow), and 18-19 June 2015
Intermittent ash explosions during the last century have characterized activity at Japan's Kuchinoerabujima volcano, located at the northern end of the Ryukyu Islands approximately 260 km S of Nagasaki, Japan. Brief periods of higher seismicity had been detected in the last approximately 30 years, although no explosions had been recorded since 1980 (BGVN 35:11 and 38:01). A new explosion occurred on 3 August 2014, and activity remained elevated through June 2015. Information on the latest activity is provided by the Japan Meteorological Agency (JMA) monthly reports and aviation alerts are from the Tokyo Volcanic Ash Advisory Center (VAAC).
A modest explosion from Shindake crater on 3 August 2014 caused JMA to increase the Alert Level at the volcano. Activity decreased shortly after the explosion, and only steam plumes, fumarolic activity, and occasional incandescence were observed for the next nine months. A large explosion on 29 May 2015 generated a gray-black ash plume that rose to over 9 km altitude and sent pyroclastic flows down the flanks; JMA increased the Alert Level and ordered evacuation of local residents. Activity declined after a few days, and Shindake remained quiet until a smaller explosion on 18 June 2015. The ash plume did not exceed 1 km, but ashfall was reported in towns on neighboring islands and in areas up to 80 km E. Two additional smaller explosions were reported on 18 and 19 June. Seismicity decreased significantly after the 19 June explosion, but SO2 emissions remained elevated until October 2015. The JMA did not lower the Alert Level until June 2016.
Activity during August 2014-February 2015. JMA reported an eruption from the vicinity of Shindake crater around noon local time on 3 August 2014, with a gray plume rising more than 800 m above the crater rim. This led to an increase in the Alert Level from 1 (Normal) to 3 (Do not approach the volcano) on a 5-level scale. An overflight confirmed traces of ash on the W flank. The Tokyo VAAC reported that the plume rose to an altitude greater than 1.5 km and drifted N. On 5 August, seismicity decreased, and views from a remote web camera showed a white plume rising 50 m above the crater rim. For the rest of August, seismicity remained low and steam plumes rose 50 to 800 m above the crater.
During September 2014, white plumes were generally observed 200-800 m above the crater when visibility was not obscured by weather; seismicity remained low. Scientists conducting a field survey on 12 September found SO2 emissions at 300 metric tons per day (t/d), higher than the background value of 60 t/d measured on 21 May 2014. Occasional earthquakes were recorded in October 2014, and the volume of gas emissions remained relatively high compared with before the August eruption; steam-and-gas plumes rose to 600 m above the crater rim. During field surveys on 7 and 8 October scientists measured SO2 emissions of 500 t/d. Gas emissions rose from within the Shindake crater, around a thermally anomalous fissure at the W edge of the crater, as well as from a new fumarole on the SW flank of the crater. In November, plumes continued to rise as high as 1,000 m above the crater. In another survey on 9 December 2014, scientists found that SO2 levels had increased to 1,700 t/d.
Emissions of SO2 remained high during the second half of January 2015, ranging from 1,100 to 3,100 t/d. A M 2.2 seismic event located 5 km beneath the island was recorded on 24 January. Observations made during field surveys in February confirmed continued steam emissions, and thermal anomalies from the W crater rim fissure and the new fissure on the SW flank. SO2 emissions decreased slightly from January levels to a range of 400 to 2,700 t/d in February, and steam plumes continued to rise 400-700 m above the crater.
Activity during March-June 2015. Incandescence at night was first recorded at the Shindake Crater from 24 to 31 March 2015 with a high-sensitivity camera. Aerial observation on 25 March by JMA and JCG (Japan Coast Guard) indicated a temperature rise and continued fumarolic activity around the thermal anomaly W of the crater rim. SO2 emissions remained high in March (1,000 to 3,700 t/d) and April (900 to 2,600 t/d), and steam plumes rose to 1 km above the crater. Incandescence was occasionally observed at night during April and again during 18-22 May; fumarolic activity continued along with a rise in temperature at the W and SW fissures. Steam plumes were observed rising to 600 m above the crater in May.
According to JMA, at 0959 local time on 29 May 2015, a large explosive phreatomagmatic eruption generated a gray-black ash plume that rose to over 9 km altitude and drifted ESE (figure 5). The plume was reported by the Tokyo VAAC to be at 10.9 km altitude about an hour after the eruption. The largest of several pyroclastic flows descended NW from the SW side of the crater in the Mukaehama district and reached the coast. Based on these events, JMA raised the Volcanic Alert Level to 5 (Evacuate). Aerial observation conducted on the same day (in collaboration with the Kyushu Regional Bureau of the Ministry of Land, Infrastructure, Transport and Tourism) revealed additional pyroclastic flows moving in nearly all directions from the Shindake crater (figure 6) including flows reaching halfway down the mountain to the SW and SE of the crater. Seismicity increased immediately after the eruption, but had decreased by midday.
According to a news article (The Japan Times), all residents and visitors (141 people) were safely evacuated by a ferry, coast guard ship, and helicopter to neighboring Yakushima Island (25 km SE). A resident of Yakushima reported that ash reached the island. Later that day, ash plumes rose 200 m and drifted SW.
Ash plumes continued the next day, 30 May, rising only 1.2 km. A field team observed discolored trees on the SE and SW flanks, and fallen trees near the coast on the NW flank. Cloud cover prevented views of the eruption area, but the team was able to confirm continued fumarolic activity and incandescence in the W part of the crater. Seismicity continued at low levels, and during the first week of June white plumes rose 100-400 m above the crater rim.
Another smaller eruption on 18 June 2015 caused lapilli and ash to fall on the E side of the island. Ash was reported in Yakushima Town (44 km ESE on Yakushima Island), Nishinoomote City (80 km NE on Tanegashima Island), and Nakatane Town (72 km E on Tanegashima). Small eruptions also occurred at 1631 on 18 June and at 0943 on 19 June. Tokyo VAAC reported the larger 18 June eruption, but plume heights were below 1 km, and not observed on satellite. Aerial observations on 20 June by JMA revealed no traces of new pyroclastic-flow deposits around the crater or on the flanks.
Post-eruption observations through June 2016. Emissions of SO2 remained elevated during June 2015 (800-1,700 t/d), and decreased somewhat in July to 500-700 t/d. They decreased further to 200-300 t/d in August. Increased seismicity was recorded briefly from 1-3 and 6-11 August. SO2 emissions continued to decline in September, except for a spike of 700 t/d on 10 September. Thermal infrared observations taken during a field survey in October 2015 indicated a decrease in temperature around the fissure W of the crater rim since the 29 May eruption. Emissions of SO2 remained below 300 t/d for the remainder of 2015 and no further activity was reported, although the Alert Level remained at 5. On 14 June 2016, JMA lowered the Alert Level to 3; seismic activity and SO2 flux values were below levels detected prior to the May-June 2015 eruption.
Geologic Background. A group of young stratovolcanoes forms the eastern end of the irregularly shaped island of Kuchinoerabujima in the northern Ryukyu Islands, 15 km W of Yakushima. The Furudake, Shindake, and Noikeyama cones were erupted from south to north, respectively, forming a composite cone with multiple craters. All historical eruptions have occurred from Shindake, although a lava flow from the S flank of Furudake that reached the coast has a very fresh morphology. Frequent explosive eruptions have taken place from Shindake since 1840; the largest of these was in December 1933. Several villages on the 4 x 12 km island are located within a few kilometers of the active crater and have suffered damage from eruptions.
Information Contacts: Japan Meteorological Agency (JMA), Otemachi, 1-3-4, Chiyoda-ku Tokyo 100-8122, Japan (URL: http://www.jma.go.jp/); Tokyo Volcanic Ash Advisory Center (VAAC), 1-3-4 Otemachi, Chiyoda-ku, Tokyo, Japan (URL: http://ds.data.jma.go.jp/svd/vaac/data/); Google Earth (URL: https://www.google.com/earth/); The Japan Times (URL: http://www.japantimes.co.jp/news/2015/05/29/national/volcano-erupts-isle-kagoshima-prompting-evacuation-order/).
Manam (Papua New Guinea) — March 2017 Cite this Report
Manam
Papua New Guinea
4.08°S, 145.037°E; summit elev. 1807 m
All times are local (unless otherwise noted)
Large ash plume to 19.8 km on 31 July 2015; persistent thermal anomalies during 2014-2016
The remote island of Manam, 13 km off the northern coast of mainland Papua New Guinea is a basaltic-andesitic stratovolcano that has a 400-year history of recorded evidence for recurring low-level ash plumes and occasional Strombolian emissions, lava flows, pyroclastic avalanches, and large ash plumes. Pyroclastic flows and Strombolian activity during much of 2012 and 2013 were accompanied by numerous ash plumes rising a few kilometers above the summit (BGVN 38:06, 39:08). Activity between January 2014 and January 2017, described below, includes persistent thermal anomalies during most of this time, and a major ash plume rising to nearly 20 km altitude on 31 July 2015.
Monitoring is done by Papua New Guinea's Rabaul Volcano Observatory (RVO), part of the Department of Mineral Policy and Geohazards Management (DMPGM). This information is supplemented with aviation alerts from the Darwin Volcanic Ash Advisory Center (VAAC). MODIS thermal anomaly satellite data is recorded by the University of Hawai'i's MODVOLC thermal alert recording system, and the Italian MIROVA system.
MIROVA thermal anomaly data suggests Manam was intermittently active from at least late June 2014 through the end of the year. A single ash plume was reported on 6 September and two more were observed on 21 and 22 December. The appearance of MODVOLC thermal anomalies in late January 2015 that grew more frequent through April indicated increasing activity along with sporadic low-level ash plumes in late February and late April. Persistent levels of thermal anomalies and ash plume reports continued in May through early July.
On 31 July 2015 at about 1130 local time a large explosion sent an ash plume to nearly 20 km altitude, spreading volcanic blocks and ash over a wide area, and injuring two people. A second substantial ash plume rose to 6.4 km on 8 August. This was followed by three more small plumes in August, one in September, and two in October 2015 (on 8 and 29) before the volcano quieted down for a few months.
Thermal anomalies were present at the end of January 2016, and an ash plume was observed on 4 March 2016. New thermal anomalies intensified until June and then tapered off in early July. Persistent but more intermittent thermal anomalies continued throughout the year and were ongoing as of early January 2017.
Activity during 2014. Numerous explosions during 2013 tapered off at the end of the year, with the last ash emissions reported on 15 December 2013. In January 2014, RSAM values were lower but still fluctuating above background levels. A report from RVO in early April noted that both summit craters remained quiet through March 2014, with no audible noises or incandescence visible at night. The seismicity remained within background levels of 160-180 RSAM and daily volcanic event counts ranged from 830 to 920. Tiltmeter data showed no significant short-term changes, but over the previous three months there was a gradual inflationary trend towards the summit area. The Alert Level was lowered to Stage 1.
A thermal anomaly appears at the very end of June 2014 in the first available MIROVA LRP data (figure 30). This is followed by additional thermal anomalies in August, October, and November. The Darwin VAAC reported a small ash plume on 6 September 2014 that rose to 2.1 km altitude (300 m above the summit) and drifted 37 km NW. It was visible on infrared satellite imagery for a few hours before dissipating. In their report for October 2014, RVO noted that Manam remained quiet for the month with no audible noises or incandescence; seismicity remained at low to moderate levels, and daily volcanic-event counts ranged between 860 and 920. They also observed that the long-term inflationary trend at the summit observed since the beginning of 2014 continued. Small amounts of white-gray ash drifting SE were reported by RVO on 21 and 22 December from the Southern Crater, with a plume height of only 200 m. They also noted continued E-W inflation.
Activity during 2015. RVO noted incandescence from the Main Crater beginning on 19 January 2015, growing stronger during the last week of the month, matching observations in the MIROVA data (figure 30). A MODVOLC thermal alert pixel appeared on 23 January. Seismicity also changed after the middle of the month when RSAM values rose above 200 on 16 January and went as high as 500 on 31 January, after which they declined rapidly and remained low during February.
In February 2015, seismicity was characterized by small to moderate sub-continuous and continuous volcanic tremors. Increased incandescence was also evident from the Main Crater during February. RVO reported weak-to-bright steady incandescence during 7-10, 21, and 26 February. MODVOLC captured two thermal alert pixels on 8 February, and MIROVA reported an anomaly at the end of the first week and during the last week of the month. An ash plume was observed in satellite data by the Darwin VAAC on 24 February; the plume rose to 3 km altitude (1.2 km above the summit) and drifted 37 km W. RSAM values rising to 500 by 18 March led RVO to raise the Alert Level that day to Stage 2. Visual observations were difficult due to weather during much of the month, but MODVOLC reported thermal alert pixels on 19 and 26 March, and MIROVA captured several anomalies at the beginning of a period of increased frequency and intensity of thermal anomalies that lasted through mid-June (figure 30).
RVO reported that during April 2015 both craters released variable amounts of white vapor. Clearer skies revealed incandescence from the Southern Crater during nine nights of the month and seven times from the Main Crater. This is consistent with satellite thermal anomaly observations by MODVOLC on six different days, with four of them being multiple pixel alerts, and numerous anomalies captured by MIROVA. Two ash eruptions were reported by the Darwin VAAC on 27 and 30 April. The first low-level plume rose to 2.4 km and was observed in satellite imagery extending over 100 km to the W before dissipating on 28 April. The second plume was observed at the same altitude drifting 150 km NW. Seismicity remained high during April, still characterized by discreet small to moderate low-frequency earthquakes, and RSAM values ranged between 300 and 650, increasing during the month. Ground deformation GPS measurements at the end of April confirmed the continuing inflationary trend recorded by the electronic tiltmeters since the last measurements taken in May 2013 (figure 31).
Multiple sources of satellite data confirmed that Manam was active during May 2015. MODVOLC thermal alert pixels were reported from MODIS data captured on 6 and 22 May; MIROVA thermal anomalies were frequent. Ash plumes were reported from visible satellite imagery by the Darwin VAAC on 13 May at 3 km altitude drifting 37 km NE; SO2 plumes were captured by NASA's OMI instrument on the Aura satellite on 2, 12, 13, and 20 May (figure 32).
During June and early July 2015 there were four series of Volcanic Ash advisory reports from the Darwin VAAC. The first, on 21 and 22 June, reported a 3-km-altitude ash plume that extended over 35 km N and NW. The second, from 28 to 30 June, had altitudes that started at 2.4 and rose to 3 km, and drifted 75 km NE. A third plume emerged late on 30 June and lasted through 1 July, drifting 130 km E at 2.4 km altitude. A fourth plume reported on 2 July was confirmed by RVO as only a steam plume with no ash, and was seen in satellite imagery drifting 45 km E at 2.4 km altitude. A single MODVOLC thermal alert pixel was recorded on 7 July.
RVO reported a significant eruption on 31 July 2015 from the Southern Crater beginning about 1130 local time. They observed that low roaring noises marked the onset of the explosion followed by continuous ejection of scoria until about 1330. Fist-sized volcanic debris was reported at Warisi village on the E side of the island. At Baliau on the N side, clasts were about 10-20 cm in diameter. Two people were reportedly knocked unconscious from the falling scoria. Strong emissions of dark gray ash clouds followed the ejection of scoria and continued into the early afternoon. By 1740 emissions consisted of light gray ash clouds. The news source One Papua New Guinea reported that fine ash began to fall over Bogia (25 km SW on the mainland) around 1245 local time.
The ash plume was initially observed in satellite imagery by the Darwin VAAC at 19.8 km altitude spreading out in all direction for 100 km. It was captured by the Japanese Himawari-8 satellite (figure 33); an animation of the imagery showing the eruption was provided by Miller et al. (2016). Four hours later, the plume was visible 370 km to the SW. A lower-altitude ash plume at 6.7 km was observed the next day extending over 100 km SW. A significant SO2 plume was partially captured by the Aura instrument on the OMI satellite the next day, and measured an SO2 mass of 3.206 kilotons.
The Darwin VAAC reported a new small ash plume on 6 August 2015 rising to 2.7 km drifting around 40 km to the NW, and another large ash plume on 8 August that initially rose to 6.4 km and drifted SSW. Pilots reported the ash at 5.8 km altitude about 90 km W of Kiunga Airport which is located 475 km SW of Manam. About 24 hours later, pilots reported another ash plume at 6 km altitude 150 km SE of the volcano. A hot spot was observed at the summit on 9 August; two MODVOLC thermal alert pixels appeared that day, and another one appeared on 15 August. A small plume was reported on 21 August, only rising to 2.1 km and drifting about 8 km ESE. This was followed two hours later by an ash plume observed 16 km NW at the same altitude, which continued to drift NW to 75 km before dissipating. Additional ash plumes were reported from 26-28 August rising to 2.4 km and drifting from 35 to 75 km, first NE, then N and NW; a small plume was reported on 31 August at 2.1 km drifting 75 km N before dissipating that day.
A single MODVOLC thermal alert pixel on 4 September was the last recorded in 2015. The next plume on 7 September was small, rising only to 2.1 km and drifting 75 km NW, briefly observed in one satellite before dissipating. It was a month until the next ash plume on 8 October 2015, when Darwin VAAC made a satellite observation of a plume at 1.8 km drifting 45 km NW. The last ash plume of 2015 was captured in satellite images on 29 October between 2.1 and 2.4 km altitude around 35 km NW.
Activity during 2016. The MIROVA data recorded thermal activity on about 29 January 2016 that increased in intensity and frequency in early March (figure 34). A small ash plume on 4 March rose to 3 km altitude and drifted about 90 km SE according to the Darwin VAAC. Increased thermal activity was recorded in MODVOLC thermal alert pixels and MIROVA data from early March through mid-July. There were no reports from the RVO during this time. The first MODVOLC alert was recorded on 7 March and they were persistent, almost every week, through the second week of July. On 13 July, an ash plume was observed by the Darwin VAAC in satellite imagery at 3 km altitude drifting 55 km W for a few hours before dissipating. After that, single-pixel MODVOLC thermal alerts were recorded on 20 September and 6 October. The MIROVA analysis of the MODIS data records a similar picture with a clear increase in the frequency and intensity of anomalies between early March and mid-July (figure 34); continuing pulses of thermal anomalies are present every month into January 2017.
Reference: Miller S D, Schmit T L, Seaman C J, Lindsey D T, Gunshor M M, Kohrs R A, Sumida Y, Hillger D, 2016, A Sight for Sore Eyes: The Return of True Color to Geostationary Satellites, Bulletin of the American Meteorological Society, vol. 97, no. 10. DOI: http://dx.doi.org/10.1175/BAMS-D-15-00154.1. Animated imagery of the 31 July 2015 eruption can be viewed at http://journals.ametsoc.org/doi/suppl/10.1175/BAMS-D-15-00154.1/suppl_file/10.1175_BAMS-D-15-00154.2.html .
Geologic Background. The 10-km-wide island of Manam, lying 13 km off the northern coast of mainland Papua New Guinea, is one of the country's most active volcanoes. Four large radial valleys extend from the unvegetated summit of the conical basaltic-andesitic stratovolcano to its lower flanks. These valleys channel lava flows and pyroclastic avalanches that have sometimes reached the coast. Five small satellitic centers are located near the island's shoreline on the northern, southern, and western sides. Two summit craters are present; both are active, although most observed eruptions have originated from the southern crater, concentrating eruptive products during much of the past century into the SE valley. Frequent eruptions, typically of mild-to-moderate scale, have been recorded since 1616. Occasional larger eruptions have produced pyroclastic flows and lava flows that reached flat-lying coastal areas and entered the sea, sometimes impacting populated areas.
Information Contacts: Rabaul Volcano Observatory (RVO), Geohazards Management Division, Department of Mineral Policy and Geohazards Management (DMPGM), PO Box 3386, Kokopo, East New Britain Province, Papua New Guinea;
Darwin Volcanic Ash Advisory Centre (VAAC), Bureau of Meteorology, Northern Territory Regional Office, PO Box 40050, Casuarina, NT 0811, Australia (URL: http://www.bom.gov.au/info/vaac/);
Hawai'i Institute of Geophysics and Planetology (HIGP), MODVOLC Thermal Alerts System, School of Ocean and Earth Science and Technology (SOEST), Univ. of Hawai'i, 2525 Correa Road, Honolulu, HI 96822, USA (URL: http://modis.higp.hawaii.edu/, http://modis.higp.hawaii.edu/);
MIROVA (Middle InfraRed Observation of Volcanic Activity), a collaborative project between the Universities of Turin and Florence (Italy) supported by the Centre for Volcanic Risk of the Italian Civil Protection Department (URL: http://www.mirovaweb.it/);
NASA Goddard Space Flight Center (NASA/GSFC), Global Sulfur Dioxide Monitoring Page, Atmospheric Chemistry and Dynamics Laboratory, Goddard, Maryland, USA (URL: https://so2.gsfc.nasa.gov/);
Regional and Mesoscale Meteorology Branch (RAMMB) / Cooperative Institute for Research in the Atmosphere (CIRA), NOAA/NESDIS, Colorado State University, Fort Collins, CO 80523-1375, USA (URL: http://rammb.cira.colostate.edu/);
One Papua New Guinea (URL: http://www.onepng.com/2015/07/manam-volcano-erupts.html).
Pavlof (United States) — March 2017 Cite this Report
Pavlof
United States
55.417°N, 161.894°W; summit elev. 2493 m
All times are local (unless otherwise noted)
Ash plume to 11 km on 27 March 2016 that drifted 1,200 km NE; multiple smaller ash events through July 2016
Pavlof volcano, near the end of the Alaska Peninsula 970 km SW of Anchorage, frequently produces explosive eruptions from the summit vents and occasional lava flows. The largest confirmed historical eruption took place in 1911 when a fissure opened on the N flank; it has erupted more than 25 times since then. The last reported eruption in mid-November 2014 included lava fountaining from a vent just N of the summit, and flows of rock debris and ash descending the N flank, along with an ash plume that rose to around 9 km altitude and drifted 300 km NW. Pavlof was quiet in 2015, but then abruptly renewed activity in late March 2016. It is monitored primarily by the Alaska Volcano Observatory (AVO) and the Anchorage Volcanic Ash Advisory Center (VAAC).
A sudden vigorous eruption that began on 27 March 2016 lasted for about 20 hours, sending ash to 11 km altitude, producing a plume dispersed NE for 1,200 km, and a similarly large SO2 plume. The volcano was then quiet until a short-lived, smaller ash emission occurred in mid-May for eight days. Intermittent low-level ctivity picked up again from late June through late July 2016, characterized by minor emissions of dark-colored ash and steam rising to 4.5 km altitude. Fallout of ash was limited to the flanks of the volcano and the immediate area around Pavlof. The last report of ash emissions was on 30 July, although low-amplitude tremors and steam plumes persisted through August, and intermittent thermal anomalies from the summit continued through the end of 2016.
After a short and intense eruption between 12 and 15 November 2014 (BGVN 40:04), activity decreased quickly to background levels. The AVO had reduced the Aviation Color Code (ACC) from Red (highest) to Orange on 16 November, and from Orange to Yellow on 25 November. Seismicity remained slightly above background levels until early January. On 15 January 2015 the AVO reduced the ACC to the lowest level of Green where it remained for over a year until it was changed abruptly to Red on 28 March 2016 at the start of a new eruption.
AVO reported that seismicity began to increase at 1553 on 27 March 2016, characterized by a quick onset of continuous tremor. An ash plume rose to an altitude of 6.1 km, and by 1618 was drifting N (figure 13). During the night, lava fountaining from the summit crater was observed by mariners, pilots, and residents of nearby Cold Bay (60 km SW).
On 28 March, tremor levels remained high; lightning in the ash plume was detected in the morning, and infrasound data from a sensor network in Dillingham (470 km NE) indicated sustained ash emissions. At 0700 a continuous ash plume was evident in satellite images drifting more than 650 km NE, and a MODIS image captured at midday revealed the extent and substantial thickness of the cloud (figure 14). A SIGMET (significant meteorological information notice) issued by the National Weather Service (NWS) Alaska Aviation Weather Unit indicated that the maximum ash-cloud altitude was approaching 11 km. Strongly elevated surface temperatures also suggested the presence of lava flows.
The energetic ash-producing phase of the eruption lasted from 1600 AKDT (00:00 UTC) on 27 March until about 1230 AKDT (20:30 UTC) on 28 March, and produced an ash cloud that stretched NE over Bristol Bay and interior Alaska for over 1,200 km. As a result, over 40 Alaska Airlines flights to and from Fairbanks, Alaska, were cancelled according to NBC News. Minor ashfall (0.8 to 6.3 mm or 1/32 to 1/4 in) was reported in the nearby community of Nelson Lagoon (80 km NW) and trace ashfall (less than 0.8 mm) was confirmed near Dillingham (470 km NE). A large SO2 plume also drifted NE from the volcano extending all the way across Alaska to Yukon Territory and British Columbia in Canada (figure 15).
Seismicity and infrasound signals had decreased to low enough levels by 1230 on 28 March that the AVO lowered the Aviation Color Code to Orange and the Volcano Alert Level to Watch. However, seismic tremor remained above background levels. Ash emissions decreased through the night and were barely visible in a satellite image acquired at 0625 AKDT on 29 March. Remnant ash continued to drift over Bristol Bay and areas of interior Alaska. The webcam at Cold Bay recorded intermittent, low-level ash plumes rising as high as 4.6 km.
Thermal anomalies, measured by MODIS satellite sensors and analyzed by MODVOLC, appeared from 28 March (0025 UTC) through 29 March 2016 (1360 UTC), with 20 pixels recorded on 28 March. The MIROVA system also recorded an abrupt spike to 'Very High' thermal anomaly levels on 28 March, dropping slightly in the next two days (figure 16) and then disappearing a few days later. Low-power anomalies were detected on 2 and 6 April, and then ceased for several months.
The AVO reported that the intensity of the eruption greatly decreased during 29-30 March, although The Canadian Press reported that ash from the eruption had caused flights in and out of Yellowknife and Regina, Canada, to be cancelled on those dates. Elevated surface temperatures identified in satellite data and visual observations of low-level, intermittent ash plumes were noted during brief breaks in poor weather conditions during these days. Airwave signals, indicative of small explosions at the summit, were recorded on 3 April, but tremors had ceased by the next day. On 6 April AVO noted no signs of ash emissions or lava effusion during the previous week, and seismicity was at low levels. Thermal anomalies at the summit were occasionally visible, though likely indicating cooling processes of previously erupted lava. AVO lowered the Aviation Color Code to Yellow and Volcano Alert Level to Advisory on 6 April. After two more weeks of no activity, the ACC was lowered to Green/Normal on 22 April 2016.
On 13 May 2016 the AVO raised the Aviation Color Code back to Orange as a result of increased seismicity typically associated with minor eruptive activity. Four minor ash eruptive episodes were inferred from seismic data between 13 and 16 May. On 14 May, local observers in Cold Bay reported ash emissions below 5 km in the vicinity of the volcano. According to the Anchorage VAAC, on 15 May a minor eruption was noted on the Cold Bay web camera, but volcanic ash was not visible in satellite data. Elevated surface temperatures were detected in satellite data on 15 May. Periods of elevated volcanic tremor and a small explosion associated with minor ash emissions was noted on 17 May; observers in Cold Bay and Sand Point (90 km E) reported ash emissions interspersed with steam emissions. The Anchorage VAAC noted that strong winds caused resuspension of volcanic ash on the lee side of Pavlof on 17 and 18 May. The AVO lowered the ACC to Yellow on 20 May and noted that all volcanic ash clouds produced during the 13-17 May event were below 4.5 km altitude, and that no lava effusion or fountaining was detected. Weak seismic tremor and small explosions were observed on 21 May, after which activity ceased. The AVO lowered the ACC to Green on 17 June.
Seismic activity increased again on 30 June for about a week, prompting the AVO to raise the ACC to Yellow on 1 July 2016; minor steam emissions were also observed in the web camera. AVO technicians installed a new web camera in the Black Hills area north of the volcano near the Bering Sea coast in early July. On 11 July, weakly elevated surface temperatures were observed at the summit in satellite imagery and a steam and gas cloud extended SW for about 80 km. Minor ash emissions reaching a few tens of meters above the summit were observed that afternoon extending a few kilometers to the SW. Small ash emissions were again observed on 18 July along with an increase in seismic tremor for about 48 hours.
On 28 July a low-intensity eruption with vigorous degassing produced a steam-rich plume and minor ash emissions. As a result, the AVO raised the ACC to Orange. The drifting steam and ash cloud was below 4.6 km above sea level and dissipated rapidly. The Anchorage VAAC reported steam and minor ash emissions continuing through 30 July.
A decline in activity led AVO to lower the ACC to Yellow on 4 August. Periods of low-amplitude tremor continued, but no plumes or thermal signals at the summit were detected. Elevated surface temperatures at the summit were observed in satellite data on 8 August, and a low-level but persistent steam plume was visible in web camera images on 11 August. A large steam plume was noted by observers in Sand Point on 15 August. Elevated surface temperatures were detected through cloud cover in satellite data on 20 and 25 August. Low-level unrest continued through the fall with persistent degassing from the summit and elevated surface temperatures detected in satellite data. A robust steam plume on 31 August reached 4.6 km, but there was no evidence of ash and it dissipated rapidly.
Several times during late September during clear views, webcam images showed a persistent steam plume from the summit crater. Elevated surface temperatures in the summit crater were observed in satellite images on 25, 28, and 29 September, and again during 4-6, 13-14, and 16 October. In early November, the AVO determined that the summit crater was larger and more centrally located than before, as a result of the March 2016 explosion. The new crater geometry possibly allowed satellite sensors to more easily detect emissions of hot gases from the vent. Ongoing observations of moderately elevated surface temperatures (figure 16) likely reflect this change in the crater, and do not indicate new eruptive activity or rising magma. Seismicity remained slightly above background levels through the end of 2016, and the ACC remained at Yellow.
Geologic Background. The most active volcano of the Aleutian arc, Pavlof is a Holocene stratovolcano that was constructed along a line of vents extending NE from the Emmons Lake caldera. Pavlof and Pavlof Sister to the NE form a dramatic pair of symmetrical, glacier-covered stratovolcanoes that overlook Pavlof and Volcano bays. Little Pavlof is a smaller cone on the SW flank of Pavlof volcano, near the rim of Emmons Lake caldera. Unlike Pavlof Sister, eruptions have frequently been reported from Pavlof, typically Strombolian to Vulcanian explosive eruptions from the summit vents and occasional lava flows. The active vents lie near the summit on the north and east sides. The largest recorded eruption took place in 1911, at the end of a 5-year-long eruptive episode, when a fissure opened on the N flank, ejecting large blocks and issuing lava flows.
Information Contacts: Alaska Volcano Observatory (AVO), a cooperative program of a) U.S. Geological Survey, 4200 University Drive, Anchorage, AK 99508-4667 USA (URL: http://www.avo.alaska.edu/), b) Geophysical Institute, University of Alaska, PO Box 757320, Fairbanks, AK 99775-7320, USA, and c) Alaska Division of Geological & Geophysical Surveys, 794 University Ave., Suite 200, Fairbanks, AK 99709, USA (URL: http://www.dggs.alaska.gov/); Anchorage Volcanic Ash Advisory Center (VAAC), Alaska Aviation Weather Unit, NWS NOAA US Dept of Commerce, 6930 Sand Lake Road, Anchorage, AK 99502-1845(URL: http://www.ssd.noaa.gov/); Hawai'i Institute of Geophysics and Planetology (HIGP), MODVOLC Thermal Alerts System, School of Ocean and Earth Science and Technology (SOEST), Univ. of Hawai'i, 2525 Correa Road, Honolulu, HI 96822, USA (URL: http://modis.higp.hawaii.edu/); MIROVA (Middle InfraRed Observation of Volcanic Activity), a collaborative project between the Universities of Turin and Florence (Italy) supported by the Centre for Volcanic Risk of the Italian Civil Protection Department (URL: http://www.mirovaweb.it/); NASA Goddard Space Flight Center (NASA/GSFC), Global Sulfur Dioxide Monitoring Page, Atmospheric Chemistry and Dynamics Laboratory, Goddard, Maryland, USA (URL: https://so2.gsfc.nasa.gov/); NASA Earth Observatory, EOS Project Science Office, NASA Goddard Space Flight Center, Goddard, Maryland, USA (URL: http://earthobservatory.nasa.gov/); Colt Snapp (URL: https://twitter.com/colt_snapp/status/714345047173369856); The Canadian Press, via Vancouver Observer (URL: http://www.vancouverobserver.com/news/environment/flights-cancelled-and-out-regina-yellowknife-after-volcano-alaska); NBC News (URL: http://www.nbcnews.com/news/weather/pavlof-volcano-erupts-covering-400-miles-alaska-ash-n546956).
Poas
Costa Rica
10.2°N, 84.233°W; summit elev. 2697 m
All times are local (unless otherwise noted)
Phreatic explosions from the crater lake in June-August 2016
Poás is characterized by intermittent explosions from its hot crater lake. Several occurred in 2014 (BGVN 40:11). This report covers activity from 1 January 2015 through February 2017. There were no reports of activity during 2015 through May 2016. Phreatic eruptions were recorded between 5 June and 16 August 2016.
According to news articles (La Prensa Libre, Prensa Latina), phreatic explosions from the hot crater lake occurred multiple times in June 2016. Explosions at 0900 on 5 June, at 1854 on 13 June, and at 1952 on 14 June ejected water and steam many meters above the lake's surface. Three small explosions, lasting about five seconds each based on the seismic signals, occurred during 0600-0603 on 18 June and ejected water, steam, and debris no more than 50 m above the lake's surface. Phreatic explosions were also registered on 19 June.
According to the Observatorio Vulcanologico y Sismologico de Costa Rica-Universidad Nacional (OVSICORI-UNA), a small phreatic explosion from the lake was recorded at 0819 on 25 July 2016. The explosion ejected material 50 m above the lake surface.
News accounts (Q Costa Rica, La Prensa Libre) reported that at 1409 local time on 16 August 2016 an explosion sent a column of gas to a height of 100 m above the crater; the activity lasted 2 minutes. An OVSICORI-UNA video of this explosion was posted in the news articles.
Geologic Background. The broad vegetated edifice of Poás, one of the most active volcanoes of Costa Rica, contains three craters along a N-S line. The frequently visited multi-hued summit crater lakes of the basaltic-to-dacitic volcano are easily accessible by vehicle from the nearby capital city of San José. A N-S-trending fissure cutting the complex stratovolcano extends to the lower N flank, where it has produced the Congo stratovolcano and several lake-filled maars. The southernmost of the two summit crater lakes, Botos, last erupted about 7,500 years ago. The more prominent geothermally heated northern lake, Laguna Caliente, is one of the world's most acidic natural lakes, with a pH of near zero. It has been the site of frequent phreatic and phreatomagmatic eruptions since an eruption was reported in 1828. Eruptions often include geyser-like ejections of crater-lake water.
Information Contacts: Observatorio Vulcanologico Sismologica de Costa Rica-Universidad Nacional (OVSICORI-UNA), Apartado 86-3000, Heredia, Costa Rica (URL: http://www.ovsicori.una.ac.cr/); La Prensa Libre (URL: https://www.laprensalibre.cr/); Prensa Latina (URL: http://www.plenglish.com/); Q Costa Rica News (URL: http://qcostarica.com/).
Sheveluch
Russia
56.653°N, 161.36°E; summit elev. 3283 m
All times are local (unless otherwise noted)
Lava dome extrusion continues with occasional explosions and ash plumes through February 2016
An eruption at Sheveluch has been ongoing since 1999, and recent activity there was previously described through August 2015 (BGVN 42:02). During September 2015-February 2016, the same type of activity prevailed, with lava dome extrusion, incandescence, hot block avalanches, fumarolic activity, and occasional strong explosions that generated ash plumes. The following data comes from Kamchatka Volcanic Eruption Response Team (KVERT) reports. During this period the Aviation Color Code remained at Orange (the second highest level on a four-color scale).
KVERT reported that during 1 September 2015-28 February 2016, lava-dome extrusion onto the N flank was accompanied by fumarolic activity, dome incandescence, hot avalanches, and ash explosions. Satellite images detected an almost daily, and sometimes intense, thermal anomaly over the dome. Ash plumes generated by occasional explosions, hot avalanches, and sometimes strong winds rose to altitudes of 2.5-7 km and drifted primarily SE during September-December 2015 (up to 185 km) and in more variable directions (up to 200 km) during January-March 2016. A series of photos taken in late 2015 shows characteristic types of activity, including small explosions and hot avalanches on 28 October (figure 39), an explosion and pyroclastic flow on 22 November (figure 40), and incandescence on 25 November (figure 41).
Thermal anomalies based on MODIS satellite instruments analyzed using the MODVOLC algorithm were frequent during the current reporting period, in contrast to March-August 2015 (BGVN 42:02). From September 2015-February 2016, thermal anomalies were detected 10-15 days each month. On 22 November, seven pixels were recorded.
Geologic Background. The high, isolated massif of Sheveluch volcano (also spelled Shiveluch) rises above the lowlands NNE of the Kliuchevskaya volcano group. The 1,300 km3 andesitic volcano is one of Kamchatka's largest and most active volcanic structures, with at least 60 large eruptions during the Holocene. The summit of roughly 65,000-year-old Stary Shiveluch is truncated by a broad 9-km-wide late-Pleistocene caldera breached to the south. Many lava domes occur on its outer flanks. The Molodoy Shiveluch lava dome complex was constructed during the Holocene within the large open caldera; Holocene lava dome extrusion also took place on the flanks of Stary Shiveluch. Widespread tephra layers from these eruptions have provided valuable time markers for dating volcanic events in Kamchatka. Frequent collapses of dome complexes, most recently in 1964, have produced debris avalanches whose deposits cover much of the floor of the breached caldera.
Information Contacts: Kamchatka Volcanic Eruptions Response Team (KVERT), Far East Division, Russian Academy of Sciences, 9 Piip Blvd., Petropavlovsk-Kamchatsky, 683006, Russia (URL: http://www.kscnet.ru/ivs/kvert/); Institute of Volcanology and Seismology, Far Eastern Branch, Russian Academy of Sciences (IVS FEB RAS), 9 Piip Blvd., Petropavlovsk-Kamchatsky 683006, Russia (URL: http://www.kscnet.ru/ivs/eng/); Hawai'i Institute of Geophysics and Planetology (HIGP), MODVOLC Thermal Alerts System, School of Ocean and Earth Science and Technology (SOEST), Univ. of Hawai'i, 2525 Correa Road, Honolulu, HI 96822, USA (URL: http://modis.higp.hawaii.edu/).
Soputan (Indonesia) — March 2017 Cite this Report
Soputan
Indonesia
1.112°N, 124.737°E; summit elev. 1785 m
All times are local (unless otherwise noted)
Ash plumes to over 12 km altitude, lava flows, pyroclastic flows, and Strombolian activity during January-February 2016
Soputan stratovolcano on the northern tip of Indonesia's island of Sulawesi has had historically observed eruptions since the 18th century, possibly earlier. The locus of eruptions has included both the summit crater and a NE-flank vent that was active during 1906-1924. Since the 1980's, continuing lava-dome growth has been punctuated by ash explosions, lava flows, and Strombolian eruptions every few years. When these events last occurred between January and March 2015, they were accompanied by strong thermal anomalies and elevated seismicity which continued into early July 2015 (BGVN 41:05). This report covers the period from July 2015 through September 2016.
Increased seismicity in November 2015 signaled the beginning of a new eruptive episode, with explosions in January and February 2016. Soputan is monitored by PVMBG (Pusat Vulkanologi dan Mitigasi Bencana Geologi), Badan Nasional Penanggulangan Bencana (BNPB) which is the Indonesian National Disaster Management Agency, and aviation alerts are managed by the Darwin VAAC (Volcanic Ash Advisory Center). Information is also provided by the University of Hawaii's MODVOLC Thermal Alert System and the MIROVA project, an Italian collaboration; both groups analyze the MODIS satellite data for thermal anomalies related to volcanoes.
Soputan erupted a significant ash plume to over 12 km altitude on 4 January 2016 after a few months of increasing seismicity. Lava flows, Strombolian eruptions, and a pyroclastic flow were observed the next day. Another large ash plume to 13 km altitude occurred on 14 January. A series of explosions beginning on 6 February resulted in more ash plumes, lava flows, and Strombolian eruptions for about 24 hours, after which activity decreased significantly. Several villages within 20 km reported ashfall from these events. The last reported activity was on 7 February 2016, although thermal anomaly data extended well into April. Seismicity had declined significantly by mid-April when the Alert Level was lowered.
Activity during July-November 2015. PVMBG lowered the Alert Level to II (second lowest on a four-level scale) on 3 July 2015, citing reduced harmonic tremor and stable RSAM (Real-time Seismic amplitude measurements) at background levels compared with the eruptive activity between January and March 2015. They did not issue another update until 3 November 2015.
MODVOLC thermal alert information from MODIS (Moderate Resolution Imaging Spectroradiometer) satellite data indicated anomalies in the vicinity of Soputan twice in September and four times in October 2015, but the locations were far enough from the volcano to suggest that they were not related to volcanic activity. This is corroborated with the MIROVA (Middle InfraRed Observation of Volcanic Activity) data from this same period which also recorded increases in Volcanic Radiative Power (VRP) in September and October. The locations indicated by MIROVA are mostly greater than 5 km from the summit, also suggesting a non-volcanic source (figure 12).
Additional thermal anomaly signals in the MIROVA data from mid-September through early December 2015 appear to be sourced within 5 km of the summit (figure 12), but their origin is unknown. PVMBG makes no mention of active eruptions or ash plumes during this time. PVMBG maintained the Level II alert status and documented clear skies with diffuse white steam plumes rising between 20 and 200 m from the summit crater during the last half of October and November, unchanged since July. They noted, however, that the frequency of several types of earthquakes began a gradual increase in the middle of October.
Activity during January-September 2016. Elevated seismicity continued until 4 January 2016. Photos taken on 3 and 4 January showed an increase in the density of the white-to-light-gray emissions rising to 300 m above the summit (figure 13).
Dense reddish-white emissions rose 300 m above the summit early in the day on 4 January. A thermal image taken that day indicated that lava was present at the summit; PVMBG raised the Alert Level to III. Seismic amplitude (RSAM) values had also increased sharply in the preceding 12 hours, and tilt measurement data indicated significant inflation of the volcano. BNPB reported an ash eruption at 2053 local time, with a plume rising 2 km from the summit and drifting SE, and incandescent lava flowing down the E flank. Minor ashfall was reported in Langowan (12 km NE) in the Minahasa District. The Darwin VAAC raised the Aviation Color Code (ACC) to Red at 2230 local time and reported an ash plume at 12.8 km altitude drifting west 30 minutes later. This was followed in the next 24 hours by two more plumes that rose to 10.6 km and drifted NW to NE (figure 14). Continuous emissions rising to about 3.7 km were observed until early 7 January.
A Strombolian phase early on 5 January lasted about 40 minutes and sent incandescent material 250 m high, according to BNPB. Sounds resembling thunder followed, and then a pyroclastic flow traveled 2.5 km down the ENE flank. An ash cloud rose 6.5 km above the summit crater rim (8.3 km altitude) and drifted W. Several villages in the districts of West Langowan (8 km E), Tompaso (11 km NE), and East Ratahan (14 km SE) reported ashfall.
MODVOLC thermal alert pixels likely associated with the eruption were reported during 6-8 January. A small cluster on 10 January located on the NE flank possibly indicated flowing or cooling lava. The Darwin VAAC reported another large ash plume on 14 January that rose to 13.7 km and drifted 45 km NE before dissipating.
A new series of explosions began on 6 February 2016. Ash plumes rose to 7 km altitude, later dropping to the range of 4.3-6 km, with continuous emissions drifting up to 75 km WSW through the next day. PVMBG reported lava flows on the N and E flanks; Strombolian explosions witnessed from the observation post in the village of Silian (about 10 km from the volcano) ejected material 300 m high. BNPB reported Strombolian activity on 7 February with ejected material as high as 1,000 m above the summit crater. Pyroclastic flows were also observed moving up to 2 km down the E flank. Seismic amplitudes remained high, indicating the active movement of magma within the volcano. Ashfall was reported in multiple districts including Pasan (5 km SSE), Tombatu (16 km SSW), Belang (17 km SSE), and Ratatotok (20 km S). The MODIS thermal anomaly data resulted in a very strong (32 pixel) MODVOLC thermal alert on 6 February. This corresponded with the Volcanic Radiative Power (VRP) spike presented in the MIROVA information for the same period (figure 12).
For the rest of February, only diffuse white steam plumes rose 75 m, except for a 700-m-high plume reported on 12 February by PVMBG; three MODVOLC thermal alert pixels were recorded on 11 and one on 13 February. Minor steam emissions rose to 100 m at the end of March, but the frequency of earthquakes associated with avalanches and low-frequency earthquakes were still elevated above background levels. The intensity of the avalanche-related earthquakes began to decline in the second week in April according to PVMBG. No incandescence was observed at the summit by the third week of April, and the decreasing frequency and amplitude of the earthquakes led PVMBG to lower the Alert Level to II on 21 April 2016. Between May and mid-September 2016, emissions from the volcano were characterized by white plumes of variable density ranging from 20 to 300 m above the crater and seismicity remained low (figure 15). The Alert Level remained at II.
Geologic Background. The Soputan stratovolcano on the southern rim of the Quaternary Tondano caldera on the northern arm of Sulawesi Island is one of Sulawesi's most active volcanoes. The youthful, largely unvegetated volcano is the only active cone in the Sempu-Soputan volcanic complex, which includes the Soputan caldera, Rindengan, and Manimporok (3.5 km ESE). Kawah Masem maar was formed in the W part of the caldera and contains a crater lake; sulfur has been extracted from fumarolic areas in the maar since 1938. Recent eruptions have originated at both the summit crater and Aeseput, a prominent NE-flank vent that formed in 1906 and was the source of intermittent major lava flows until 1924.
Information Contacts: Pusat Vulkanologi dan Mitigasi Bencana Geologi (PVMBG, also known as Indonesian Center for Volcanology and Geological Hazard Mitigation, CVGHM), Jalan Diponegoro 57, Bandung 40122, Indonesia (URL: http://www.vsi.esdm.go.id/); Badan Nasional Penanggulangan Bencana (BNPB), National Disaster Management Agency, Graha BNPB - Jl. Scout Kav.38 East Jakarta 13120 (URL: http://www.bnpb.go.id/); Darwin Volcanic Ash Advisory Centre (VAAC), Bureau of Meteorology, Northern Territory Regional Office, PO Box 40050, Casuarina, NT 0811, Australia (URL: http://www.bom.gov.au/info/vaac/); Hawai'i Institute of Geophysics and Planetology (HIGP), MODVOLC Thermal Alerts System, School of Ocean and Earth Science and Technology (SOEST), Univ. of Hawai'i, 2525 Correa Road, Honolulu, HI 96822, USA (URL: http://modis.higp.hawaii.edu/); MIROVA (Middle InfraRed Observation of Volcanic Activity), a collaborative project between the Universities of Turin and Florence (Italy) supported by the Centre for Volcanic Risk of the Italian Civil Protection Department (URL: http://www.mirovaweb.it/).